00015776702020FYFALSEus-gaap:AccountingStandardsUpdate201613MemberP4Yus-gaap:AccountingStandardsUpdate201613MemberP3Y1,7751,7751,7751,7751,7751,775us-gaap:OtherLiabilities0001577670srt:MaximumMemberus-gaap:FairValueInputsLevel3Memberus-gaap:CommercialMortgageBackedSecuritiesMemberus-gaap:MeasurementInputDiscountRateMember2020-12-31
UNITED STATES
SECURITIES AND EXCHANGE COMMISSION
Washington, D.C. 20549
Form 10-K
(Mark One)
☒ ANNUAL REPORT PURSUANT TO SECTION 13 OR 15(d) OF THE SECURITIES EXCHANGE ACT OF 1934
For the fiscal year ended December 31, 20202023
Or
☐ TRANSITION REPORT PURSUANT TO SECTION 13 OR 15(d) OF THE SECURITIES EXCHANGE ACT OF 1934
For the transition period from to
Commission file number:
001-36299
Ladder Capital Corp
(Exact name of registrant as specified in its charter)
| | | | | | | | | | | | | | |
| Delaware | | 80-0925494 |
(State or other jurisdiction of
incorporation or organization) | | (IRS Employer
Identification No.) |
| | | | |
345320 Park Avenue, | New York, | NY | | 1015410022 |
| (Address of principal executive offices) | | (Zip Code) |
(212) 715-3170
(Registrant’s telephone number, including area code)
Securities registered pursuant to Section 12(b) of the Act:
| | | | | | | | |
| Title of Each Class | Trading Symbol(s) | Name of Each Exchange on Which Registered |
| Class A common stock, $0.001 par value | LADR | New York Stock Exchange |
Indicate by check mark if the registrant is a well-known seasoned issuer, as defined in Rule 405 of the Securities Act. Yes ☒ No ☐
Indicate by check mark if the registrant is not required to file reports pursuant to Section 13 or Section 15(d) of the Act. Yes ☐ No ☒
Indicate by check mark whether the registrant (1) has filed all reports required to be filed by Section 13 or 15(d) of the Securities Exchange Act of 1934 during the preceding 12 months (or for such shorter period that the registrant was required to file such reports), and (2) has been subject to such filing requirements for the past 90 days. Yes ☒ No ☐
Indicate by check mark whether the registrant has submitted electronically every Interactive Data File required to be submitted pursuant to Rule 405 of Regulation S-T (§ 232.405 of this chapter) during the preceding 12 months (or for such shorter period that the registrant was required to submit such files). Yes ☒ No ☐
Indicate by check mark whether the registrant is a large accelerated filer, an accelerated filer, a non-accelerated filer, a smaller reporting company, or an emerging growth company. See the definitions of “large accelerated filer,” “accelerated filer,” “smaller reporting company” and “emerging growth company” in Rule 12b-2 of the Exchange Act:
| | | | | | | | | | | |
| Large accelerated filer | ☒ | Accelerated filer | ☐ |
| | | |
| Non-accelerated filer | ☐ | Smaller reporting company | ☐ |
| | | |
| | Emerging growth company | ☐ |
If an emerging growth company, indicate by check mark if the registrant has elected not to use the extended transition period for complying with any new or revised financial accounting standards provided pursuant to Section 13(a) of the Exchange Act. ☐
Indicate by check mark whether the registrant has filed a report on and attestation to its management’s assessment of the effectiveness of its internal control over financial reporting under Section 404(b) of the Sarbanes-Oxley Act (15 U.S.C. 7262(b)) by the registered public accounting firm that prepared or issued its audit report. ☒
Indicate by check mark whether the registrant is a shell company (as defined in Rule 12b-2 of the Exchange Act):
Yes ☐ No ☒
If securities are registered pursuant to Section 12(b) of the Act, indicate by check mark whether the financial statements of the registrant included in the filing reflect the correction of an error to previously issued financial statements. ☐
Indicate by check mark whether any of those error corrections are restatements that required a recovery analysis of incentive-based compensation received by any of the registrant’s executive officers during the relevant recovery period pursuant to §240.10D-1(b). ☐
The aggregate market value of the Class A common stock held by non-affiliates of the registrant was $855,736,869$1,222,489,920 as of June 30, 2020,2023, based on the closing price of the registrant’s Class A common stock reported on the New York Stock Exchange on such date of $8.10$10.85 per share. The registrant has no non-voting common stock.
Indicate the number of shares outstanding of each of the registrant’s classes of common stock, as of the latest practicable date.
| | | | | | | | |
| Class | | Outstanding at February 19, 20212, 2024 |
| Class A common stock, $0.001 par value | | 126,825,760126,617,221 |
| Class B common stock, $0.001 par value | | 0— |
DOCUMENTS INCORPORATED BY REFERENCE
Portions of the definitive proxy statement for the Company’s 20212023 Annual Meeting of ShareholdersStockholders have been incorporated by reference into Part III of this Report.
LADDER CAPITAL CORP
FORM 10-K
December 31, 20202023
CAUTIONARY STATEMENT REGARDING FORWARD-LOOKING STATEMENTS
This Annual Report on Form 10-K (this “Annual Report”) includes forward-looking statements within the meaning of Section 27A of the Securities Act of 1933, as amended (the “Securities Act”), and Section 21E of the Securities Exchange Act of 1934, as amended (the “Exchange Act”). All statements other than statements of historical fact contained in this Annual Report, including statements regarding our future results of operations and financial position, strategy and plans, and our expectations for future operations, are forward-looking statements. The words “anticipate,” “estimate,” “expect,” “project,” “plan,” “intend,” “believe,” “may,” “might,” “will,” “should,” “can have,” “likely,” “continue,” “design,” and other words and terms of similar expressions are intended to identify forward-looking statements.
We have based these forward-looking statements largely on our current expectations and projections about future events and trends that we believe may affect our financial condition, results of operations, strategy, short-term and long-term business operations and objectives and financial needs. Although we believe that the expectations reflected in our forward-looking statements are reasonable, actual results could differ from those expressed in our forward-looking statements. Our future financial position and results of operations, as well as any forward-looking statements are subject to change and inherent risks and uncertainties. You should consider our forward-looking statements in light of a number of factors that may cause actual results to vary from our forward-looking statements including, but not limited to:
•risks discussed under the heading “Risk Factors” in this Annual Report,herein, as well as our consolidated financial statements, related notes, and the other financial information appearing elsewhere in this Annual Report and our other filings with the United States Securities and Exchange Commission (“SEC”(the “SEC”);
•labor shortages, supply chain imbalances, inflation, and the ongoing impact of the COVID-19 pandemic and of responsive measures implemented by various governmental authorities, businesses and other third parties;potential for a global economic recession;
•increasing geopolitical uncertainty, including the impactbroader impacts of the newUkraine-Russia and Hamas-Israel conflicts and escalating tension between the U.S. presidential administration and congressional majority on the regulatory landscape, capital markets, and the response to, and management of, the COVID-19 pandemic;China;
•changes in general economic conditions in our industry and in the commercial finance and the real estate markets;
•changes to our business and investment strategy;
•our ability to obtain and maintain financing arrangements;
•the financing and advance rates for our assets, including the potential effects of LIBOR replacement rates;assets;
•our actual and expected leverage and liquidity;
•the adequacy of collateral securing our loan portfolio and a decline in the fair value of our assets;
•interest rate mismatches between our assets and our borrowings used to fund such investments;
•changes in interest rates andaffecting the market value of our assets;assets and the related impacts on our borrowers, including any unforeseen impacts of the transition to Term Secured Overnight Financing Rate (“SOFR”);
•changes in prepayment rates on our mortgages and the loans underlying our commercial mortgage-backed and other asset-backed securities;
•the effects of hedging instruments and the degree to which our hedging strategies may or may not protect us from interest rate and credit risk volatility;
•the increased rate of default or decreased recovery rates on our assets;
•the adequacy of our policies, procedures and systems for managing risk effectively;
•a potential downgrade in the credit ratings assigned to subsidiaries of Ladder Capital Corp (“Ladder,” “Ladder Capital,” and the “Company”) or our investments;investments or corporate debt;
•our compliance with, and the impact of, and changes in laws, governmental regulations, tax laws and rates, accounting guidance and similar matters;
•our ability to maintain our qualification as a real estate investment trust (“REIT”) for U.S. federal income tax purposes and our ability and the ability of our subsidiaries to operate in compliance with REIT requirements;
•our ability and the ability of our subsidiaries to maintain our and their exemptions from registration under the Investment Company Act of 1940, as amended (the “Investment Company Act”);
•the effects of climate change or the potential liability relating to environmental matters that impact the value of properties we may acquire or the properties underlying our investments;
•the inability of insurance covering real estate underlying our loans and investments to cover all losses;
•the availability of investment opportunities in mortgage-related and real estate-related instruments and other securities;
•fraud by potential borrowers;
•the availability ofour ability to attract and retain qualified personnel;employees;
•the impact of any tax legislation or IRS guidance;
•volatility in the equity capital markets and the impact on our Class A common stock;
•the degree and nature of our competition; and
•the market trends in our industry, interest rates, real estate values and the debt securities markets.
You should not rely upon forward-looking statements as predictions of future events. In addition, neither we nor any other person assumes responsibility for the accuracy and completeness of any of these forward-looking statements. The forward-looking statements contained in this Annual Report are made as of the date hereof, and the Company assumes no obligation to update or supplement any forward-looking statements.
REFERENCES TO LADDER CAPITAL CORP
Ladder Capital Corp is a holding company, and its primary assets are a controlling equity interest in Ladder Capital Finance Holdings LLLP (“LCFH” or the “Operating Partnership”) and in each series thereof, directly or indirectly. Unless the context suggests otherwise, references in this report to “Ladder,” “Ladder Capital,” the “Company,” “we,” “us” and “our” refer (1) prior to the February 2014 initial public offering (“IPO”) of the Class A common stock of Ladder Capital Corp and related transactions, to LCFH (“Predecessor”) and its consolidated subsidiaries and (2) after our IPO and related transactions, to Ladder Capital Corp and its consolidated subsidiaries.
Part I
Item 1. Business
Overview
We areLadder is an internally-managed real estate investment trust (“REIT”) that is a leader in commercial real estate finance. We originate and invest in a diverse portfolio of commercial real estate and real estate-related assets, focusing on senior secured assets. Our investment activities include: (i) our primary business of originating senior first mortgage fixed and floating rate loans collateralized by commercial real estate with flexible loan structures; (ii) owning and operating commercial real estate, including net leased commercial properties; and (iii) investing in investment grade securities secured by first mortgage loans on commercial real estate; and (iii) owning and operating commercial real estate, including net leased commercial properties.estate. We believe that our in-house origination platform, ability to flexibly allocate capital among complementary product lines, credit-centric underwriting approach, access to diversified financing sources, and experienced management team position us well to deliver attractive returns on equity to our shareholders through economic and credit cycles.
Our businesses, including balance sheet lending, conduit lending, securities investments, and real estate investments, provide for a stable base of net interest and rental income. We have originated $25.8$29.7 billion of commercial real estate loans from our inception in October 2008 through December 31, 2020.2023. During this timeframe, we also acquired $12.7$13.2 billion of predominantly investment grade-rated securities secured by first mortgage loans on commercial real estate and $1.8$2.0 billion of selected net leased and other real estate assets.
As part of our commercial mortgage lending operations, we originate conduit loans, which are first mortgage loans on stabilized, income producing commercial real estate properties that we intend to make available for sale in commercial mortgage-backed securities (“CMBS”) securitizations. From our inception in October 2008 through December 31, 2020,2023, we originated $16.6$16.9 billion of conduit loans, of which $16.8 billion were sold into 6971 CMBS securitizations, making us, by volume, the second largest non-bank contributor of loans to CMBS securitizations in the United States in such period. Our sales of loans into securitizations are generally accounted for as true sales, not financings, and we generally retain no ongoing interest in loans which we securitize unless we are required to do so as issuer pursuant to the risk retention requirements of the Dodd-Frank Wall Street Reform and Consumer Protection Act of 2010, as amended, (the “Dodd-Frank Act”). The securitization of conduit loans enables us to reinvest our equity capital into new loan originations or allocate it to other investments.
As of December 31, 2020, we had $5.9 billion in total assets and $1.5 billion of total equity. Our assets primarily consist of $2.3 billion of loans, $1.1 billion of securities, $1.0 billion of real estate, and $1.3 billion of unrestricted cash.
We maintain a diversified and flexible financing strategy supporting our investment strategy and overall business operations, including the use of unsecured corporate bonds, non-recourse, non-mark-to-market Collateralized Loan Obligations (“CLO”) debt issuances and significant committed term financing from leading financial institutions. Refer to “Our Financing Strategies” and “Liquidity and Capital Resources” for further information.
Ladder was founded in October 2008 and we completed our IPO in February 2014. We are led by a disciplined and highly aligned management team. As of December 31, 2020,2023, our management team and directors held interests in our Company comprising 10.8%over 11% of our total equity. On average, our management team members have 2728 years of experience in the industry. Our management team includes Brian Harris, Chief Executive Officer; Pamela McCormack, President; Marc Fox,Paul J. Miceli, Chief Financial Officer; Robert Perelman, Head of Asset Management; and Kelly Porcella, Chief Administrative Officer & General Counsel. Kevin Moclair,Anthony V. Esposito, Chief Accounting Officer, is an additional officer of Ladder. Additionally, effective March 1, 2021, Paul J. Miceli, the Company’s Director of Finance, will succeed Marc Fox as Chief Financial Officer (refer to “Management’s Discussion and Analysis of Financial Condition and Results of Operations - Business Developments - Recent Developments”). As of December 31, 2020, we employed 58 full-time industry professionals.
COVID-19 Impact on the Organization
On March 11, 2020, the World Health Organization declared the novel strain of coronavirus (“COVID-19”) a global pandemic and recommended containment and mitigation measures worldwide. As of the date of this filing, the majority of our employees continue to work remotely in compliance with state guidelines. We continue to actively manage the liquidity and operations of the Company in light of the market conditions, including the current interest rate environment, and overall financial impact caused by the COVID-19 pandemic across most industries in the United States.potential recessionary conditions. The Company has disclosed the impact of the COVID-19 global pandemiccurrent market conditions on our business throughout this Annual Report. However, given the ongoing uncertainty related to the severity and duration
Our Businesses
We invest primarily in loans, securities and other interests in U.S. commercial real estate, with a focus on senior secured assets. Our complementary business segments are designed to provide us with the flexibility to opportunistically allocate capital in order to generate attractive risk-adjusted returns under varying market conditions. The following tablechart summarizes the carrying value of our investment portfolio as reported in our consolidated financial statements as of the dates indicated belowDecember 31, 2023 ($ in thousands):
| | | | | | | | | | | | | | | | | | | | | | | |
| | December 31, 2020 | | December 31, 2019 |
| Loans | | | | | | | |
| Balance sheet loans: | | | | | | | |
| Balance sheet first mortgage loans | $ | 2,232,749 | | | 37.9 | % | | $ | 3,127,173 | | | 46.9 | % |
| Other commercial real estate-related loans | 121,310 | | | 2.1 | % | | 129,863 | | | 1.9 | % |
| | | | | | | |
| Allowance for credit losses | (41,507) | | | (0.7) | % | | (20,500) | | | (0.3) | % |
| Total balance sheet loans | 2,312,552 | | | 39.3 | % | | 3,236,536 | | | 48.5 | % |
| Conduit first mortgage loans | 30,518 | | | 0.5 | % | | 122,325 | | | 1.8 | % |
| Total loans | 2,343,070 | | | 39.8 | % | | 3,358,861 | | | 50.3 | % |
| Securities | | | | | | | |
| CMBS investments | 1,025,514 | | | 17.4 | % | | 1,673,468 | | | 25.3 | % |
| U.S. Agency Securities investments | 32,804 | | | 0.6 | % | | 34,857 | | | 0.5 | % |
| | | | | | | |
| Equity securities | — | | | — | % | | 12,980 | | | 0.2 | % |
| Allowance for current expected credit losses | (20) | | | — | % | | — | | | — | % |
| Total securities | 1,058,298 | | | 18.0 | % | | 1,721,305 | | | 26.0 | % |
| Real Estate | | | | | | | |
| Real estate and related lease intangibles, net | 985,304 | | | 16.8 | % | | 1,048,081 | | | 15.7 | % |
| | | | | | | |
| Total real estate | 985,304 | | | 16.8 | % | | 1,048,081 | | | 15.7 | % |
| Other Investments | | | | | | | |
| Investments in and advances to unconsolidated joint ventures | 46,253 | | | 0.8 | % | | 48,433 | | | 0.7 | % |
| Federal Home Loan Bank (“FHLB”) stock | 31,000 | | | 0.5 | % | | 61,619 | | | 0.9 | % |
| Total other investments | 77,253 | | | 1.3 | % | | 110,052 | | | 1.6 | % |
| Total investments | 4,463,925 | | | 75.9 | % | | 6,238,299 | | | 93.6 | % |
| Cash, cash equivalents and restricted cash | 1,284,284 | | | 21.8 | % | | 355,746 | | | 5.3 | % |
| Other assets | 133,020 | | | 2.3 | % | | 75,107 | | | 1.1 | % |
| Total assets | $ | 5,881,229 | | | 100.0 | % | | $ | 6,669,152 | | | 100.0 | % |

The unique nature
(1)CRE equity asset amounts represent undepreciated asset values.
There are a number of COVID-19 has had a broad impactfactors that influence our operating results. Some of these factors include: (1) our competition; (2) market and economic conditions, including inflation; (3) loan origination and repayment volume; (4) profitability of securitizations; (5) avoidance of credit losses; (6) availability of debt and equity funding and the costs of that funding; (7) the net interest margin on commercialour investments; (8) effectiveness of our hedging and other risk management practices; (9) real estate specificallytransaction volumes; (10) occupancy rates; and (11) expense management. Refer to Part II, Item 7 “Management’s Discussion and Analysis of Financial Condition and Results of Operations” under the hotel and retail sectors. Loans on hotel and retail properties comprised approximately 12.5% and 11.3%, respectively,heading “Results of our loan portfolio at December 31, 2020. Hotel and retail properties comprised approximately 6.0% and 47.0%, respectively, of our real estate portfolio at December 31, 2020; however, the majority of our retail properties are necessity-based businesses and have remained open and stable during the COVID-19 pandemic. We are in regular communication with our borrowers and tenants and are closely monitoring property performance.
Loans
Balance Sheet First Mortgage Loans. We originate and invest in balance sheet first mortgage loans secured by commercial real estate properties that are typically undergoing transition, including lease-up, sell-out, and renovation or repositioning. These mortgage loans are structured to fit the needs and business plans of the property owners, and generally have LIBOR basedTerm SOFR-based floating rates and terms (including extension options) ranging from one to five years. Our loans are directly originated by an internal team that has longstanding and strong relationships with borrowers and mortgage brokers throughout the United States. We follow a rigorous investment process, which begins with an initial due diligence review; continues through a comprehensive legal and underwriting process incorporating multiple internal and external checks and balances; and culminates in approval or disapproval of each prospective investment by our Investment Committee. Balance sheet first mortgage loans in excess of $50.0 million also require the approval of our board of directors’ Risk and Underwriting Committee.
We generally seek to hold our balance sheet first mortgage loans for investment although we also maintain the flexibility to contribute such loans into a collateralized loan obligation (“CLO”)CLO or similar structure, sell participation interests or “b-notes” in our mortgage loans or sell such mortgage loans as whole loans. Our balance sheet first mortgage loans have been typically repaid at or prior to maturity (including by beingmay be refinanced by us into a new conduit first
mortgage loan upon property stabilization).stabilization. As of December 31, 2020,2023, we held a portfolio of 99107 balance sheet first mortgage loans with an aggregate book value of $2.2$3.1 billion. Based on the loan balances and the “as-is” third-party Financial Institutions Reform, Recovery and Enforcement Act of 1989 (“FIRREA”) appraised values at origination, the weighted average loan-to-value ratio of this portfolio was 67.4%65.5% at December 31, 2020.
We continue to actively manage and monitor the credit and liquidity risk associated with the balance sheet first mortgage loan portfolio. Due to the nationwide limitations placed on many businesses in response to the COVID-19 pandemic, significant cash flow disruptions have occurred across the economy, which have impacted and likely will continue to impact certain of our borrowers. We have used, and continue to use, a variety of legal and structural options to manage that risk effectively, including forbearance and default provisions, as is generally being utilized throughout the credit lending industries.2023.
Other Commercial Real Estate-Related Loans. We selectively invest in note purchase financings, subordinated debt, mezzanine debt and other structured finance products related to commercial real estate that are generally held for investment. As of December 31, 2020,2023, we held a portfolio of 23 other commercial real estate-related9 mezzanine loans with an aggregate book value of $121.3$32.4 million. Based on the loan balance and the “as-is” third-party FIRREA appraised values at origination, the weighted average loan-to-value ratio of the portfolio was 66.6%82.0% at December 31, 2020.2023.
Conduit First Mortgage Loans. We also originate conduit loans, which are first mortgage loans that are secured by cash-flowing commercial real estate and are available for sale to securitizations. These first mortgage loans are typically structured with fixed interest rates and generally have five- to ten-year terms. Conduit first mortgage loans are originated, underwritten, approved and funded using the same comprehensive legal and underwriting approach, process and personnel used to originate our balance sheet first mortgage loans. Conduit first mortgage loans in excess of $50.0 million also require approval of our board of directors’ Risk and Underwriting Committee. We held one conduit loan with an aggregate carrying value of $26.9 million at December 31, 2023.
Although our primary intent is to sell our conduit first mortgage loans to CMBS trusts, we generally seek to maintain the flexibility to keep them on our balance sheet, sell participation interests or “b-notes” in such loans or sell the loans as whole loans. As of December 31, 2020, we held four first mortgage loans that were available for contribution into a securitization with an aggregate book value of $30.5 million. Based on the loan balances and the “as-is” third-party FIRREA appraised values at origination, the weighted average loan- to-value ratio of this portfolio was 66.7% at December 31, 2020. The Company holds these conduit loans in its taxable REIT subsidiary (“TRS”). upon origination. As of December 31, 2023, we held one conduit first mortgage loan that was available for contribution into securitizations. Based on the loan balance and the “as-is” third-party FIRREA appraised values at origination, loan-to-value ratio of this loan was 59.4% at December 31, 2023.
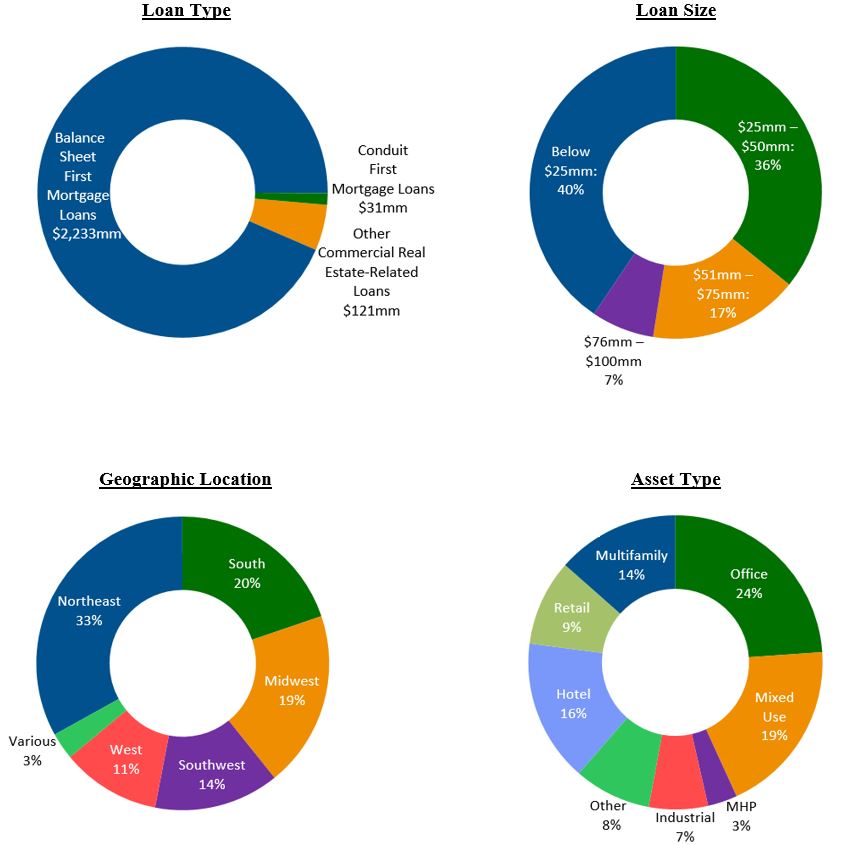
The following charts set forth our total outstanding balance sheet first mortgage loans, other commercial real estate-related loans, and conduit first mortgage loans as of December 31, 20202023, and a breakdown of our loan portfolio by loan size and geographic location and asset type of the underlying real estate.estate by loan balance.
Securities

CMBS Investments. We invest in CMBS, including CRE CLOs, secured by first mortgage loans on commercial real estate and own predominantly AAA-rated securities. These investments provide a stable and attractive base of net interest income and help us manage our liquidity. We have significant in-house expertise in the evaluation and trading of these securities, due in part to our experience in originating and underwriting mortgage loans that comprise assets within CMBS trusts, as well as our experience in structuring CMBS transactions. AAA-rated CMBS or U.S. Agency securities investments in excess of $76.0 million and all other investment grade CMBS or U.S. Agency securities investments in excess of $51.0 million, each in any single class of any single issuance, require the approval of our board of directors’ Risk and Underwriting Committee. The Risk and Underwriting Committee also must approve any investments in non-rated or sub-investment grade CMBS or U.S. Agency Securities in any single class of any single issuance in excess of the lesser of (x) $21.0 million and (y) 10% of the total net asset value of the respective Ladder investment company.
The Company invests in primarily AAA-rated real estate securities, typically front pay securities, with relatively short duration and significant subordination. The hyperamortization features included in many of the securities positions we own help mitigate potential credit losses even in the current market conditions. At the onset of the COVID-19 pandemic in March 2020, there was a significant decrease in liquidity and trading activity for the real estate securities we own. During the three months ended December 31, 2020, liquidity and trading activity continued to return to the market and the value of our securities portfolio as of December 31, 2020 had an unrealized mark-to-market gain of $18.1 million.
As of December 31, 2020, the estimated fair value of our portfolio of CMBS investments totaled $1.0 billion in 105 CUSIPs ($9.8 million average investment per CUSIP). As of December 31, 2020, included in the $1.0 billion of CMBS securities are $11.7 million of CMBS securities designated as risk retention securities under the Dodd-Frank Act which are subject to transfer restrictions over the term of the securitization trust. The following chart summarizes our securities investments, 94.4% of which were rated investment grade by Standard & Poor’s Ratings Group, Moody’s Investors Service, Inc. or Fitch Ratings Inc. as of December 31, 2020:
In the future, we may invest in CMBS securities or other securities that are unrated. As of December 31, 2020, our CMBS investments had a weighted average duration of 2.0 years. The commercial real estate collateral underlying our CMBS investment portfolio is located throughout the United States. As of December 31, 2020, by property count and market value, respectively, 53.2% and 74.2% of the collateral underlying our CMBS investment portfolio was distributed throughout the top 25 metropolitan statistical areas (“MSAs”) in the United States, with 7.9% and 37.6%, by property count and market value, respectively, of the collateral located in the New York-Newark-Edison MSA, and the concentrations in each of the remaining top 24 MSAs ranging from 0.2% to 4.5% by property count and 0.1% to 10.6% by market value.
Real Estate
Net Leased Commercial Real Estate Properties. As of December 31, 2020,2023, we owned 164156 single tenant net leased properties with an aggregateundepreciated book value of $639.6$653.5 million. These properties are fully leased on a net basis where the tenant is generally responsible for payment of real estate taxes, property, building and general liability insurance and property and building maintenance expenses. As of December 31, 2020,2023, our net leased properties comprised a total of 5.33.8 million square feet, 100% leased with an average age since construction of 15.718.6 years and a weighted average remaining lease term of 11.48.5 years. Commercial real estate investments in excess of $20.0 million require the approval of our board of directors’ Risk and Underwriting Committee. The majority of the tenants in our net leased properties in our real estate portfolio are necessity-based businesses and have remained open and stable during the COVID-19 pandemic.businesses. During the three monthsyear ended December 31, 2020,2023, we collected 100% of rent on these properties.
Diversified Commercial Real Estate Properties. As of December 31, 2020,2023, we owned 6253 diversified commercial real estate properties throughout the U.S.U.S with an undepreciated book value of $293.7 million. During the three monthsyear ended December 31, 2020,2023, we collected approximately 96.4%99% of rent on these properties.
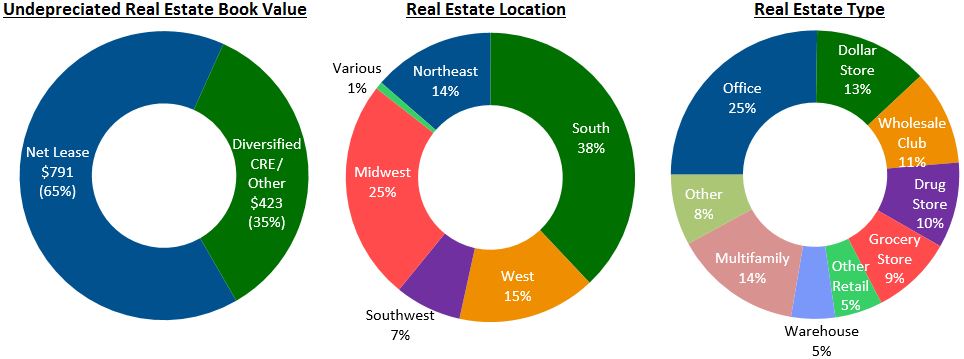
The following charts summarize the composition of our real estate investments as atof December 31, 2020:2023 ($ in millions):
Residential Real Estate.Securities
The Company from time to time, has made investmentsinvests in residentialprimarily AAA-rated real estate securities, typically front pay securities, with relatively short duration and significant subordination. We invest primarily in CMBS, including condominium developments. DuringCLOs, secured by first mortgage loans on commercial real estate. These investments provide a stable and attractive base of net interest income and help us manage our liquidity and hyper-amortization features included in many of these securities positions help mitigate potential credit losses in the year ended December 31, 2020,event of adverse market conditions. We have significant in-house expertise in the Company sold its remaining investmentevaluation and trading of these securities, due in such investments for immaterial gains.part to our experience in originating and underwriting mortgage loans that comprise assets within CMBS trusts, as well as our experience in structuring CMBS transactions.
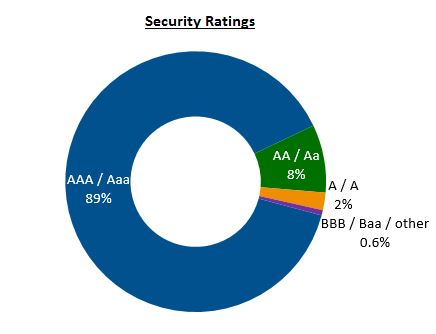
As of December 31, 2023, the estimated fair value of our portfolio of CMBS investments totaled $431.5 million in 73 CUSIPs ($5.9 million average investment per CUSIP). Included in the $431.5 million of CMBS securities are $9.3 million of CMBS securities designated as risk retention securities under the Dodd-Frank Act, which are subject to transfer restrictions over the term of the securitization trust. The following chart summarizes our securities investments by market conditions due tovalue, 98.9% of which were rated investment grade by Standard & Poor’s Ratings Group, Moody’s Investors Service, Inc. or Fitch Ratings Inc. as of December 31, 2023:

In the COVID-19 pandemic and the resulting economic disruption have broadly impacted thefuture, we may invest in CMBS securities or other securities that are unrated. As of December 31, 2023, our CMBS investments had a weighted average duration of 2.0 years. The commercial real estate sector.collateral underlying our CMBS investment portfolio is located throughout the United States. As expected,of December 31, 2023, by property count and market value, respectively, 65.2% and 66.3% of the net leased commercial real estate properties, which comprisecollateral underlying our CMBS investment portfolio was distributed throughout the majoritytop 25 metropolitan statistical areas (“MSAs”) in the United States, with 7.9% and 20.2%, by property count and market value, respectively, of the collateral located in the New York-Newark-Jersey City MSA, and the concentrations in each of the remaining top 24 MSAs ranging from 0.1% to 7.6% by property count and 0.1% to 8.5% by market value.
AAA-rated CMBS or U.S. Agency securities investments in excess of $76.0 million and all other investment grade CMBS or U.S. Agency securities investments in excess of $51.0 million, each in any single class of any single issuance, require the approval of our portfolio, have remained minimally impacted as the majorityboard of directors’ Risk and Underwriting Committee. The Risk and Underwriting Committee also must approve any investments in non-rated or sub-investment grade CMBS or U.S. Agency securities in any single class of any single issuance in excess of the lesser of (x) $21.0 million and (y) 10% of the total net leased properties in our real estate portfolio are necessity-based businesses and have remained open and stable duringasset value of the COVID-19 pandemic. We continuerespective Ladder subsidiary or other entity for which Ladder has authority to actively monitor our diversified commercial real estate properties as well to determine the immediate and long term impacts on the buildings, tenants, business plans and the ability to execute those business plans.make investment decisions.
Other Investments
Unconsolidated Joint Venture. In connection with the origination of a loanFrom time to time we invest in April 2012, we received a 25% equity interest with the right to convert upon a capital event. On March 22, 2013, we refinanced the loan, and we converted our equity interest into a 19% limited liability company membership interest in Grace Lake JV, LLC (“Grace Lake LLC”).real estate related ventures. As of December 31, 2020, Grace Lake LLC owned an office building campus with a2023, the carrying value of $50.9 million, which is net of accumulated depreciation of $36.5 million, that is financed by $61.6 million of long-term debt. Debt of Grace Lake LLC is non-recourse to the limited liability company members, except for customary non-recourse carve-outs for certain actions and environmental liability. As of December 31, 2020, the book value of our investment in Grace Lake LLCunconsolidated ventures was $4.0 million.
Unconsolidated Joint Venture. On August 7, 2015, the Company entered into a joint venture, 24 Second Avenue Holdings LLC (“24 Second Avenue”), with an operating partner (the “Operating Partner”) to invest in a ground-up residential/retail condominium development and construction project located at 24 Second Avenue, New York, NY. 24 Second Avenue consists of residential condominium units and one commercial condominium unit. As of December 31, 2020, 24 Second Avenue had sold 20 residential condominium units for $53.0 million in sales proceeds. As of December 31, 2020, the Company had no remaining additional capital commitment to 24 Second Avenue and the book value of the Company’s investment in 24 Second Avenue was $42.2$6.9 million.
FHLB Stock.United States Treasury Securities. Tuebor Captive Insurance Company LLC (“Tuebor”) is a member of the FHLB. Each member of the FHLB must purchaseWe invest in short-term and hold FHLB stocklong-term U.S. Treasury securities. Short-term U.S. Treasury securities are classified as a condition of initialcash and continuing membership, in proportion to their borrowings from the FHLB and levels of certain assets. The Company earns dividend incomecash equivalents on FHLB stock and it is redeemable by Tuebor upon five years’ prior written notice, subject to certain restrictions and limitations. Under certain conditions, the FHLB may also, at its sole discretion, repurchase FHLB stock from its members.our consolidated balance sheet. As of December 31, 2020, the book value2023, we held $1.0 billion of U.S. Treasury securities classified as cash and cash equivalents and held $53.7 million of U.S. Treasury securities classified as securities on our investment in FHLB Stock was $31.0 million.consolidated balance sheet.
Investment Process
Origination
Our team of originators is responsible for sourcing and directly originating new commercial first mortgage loans from the brokerage community and directly from real estate owners, operators, developers and investors. The extensive industry experience of our management team and origination team has enabled us to build a strong network of mortgage brokers and direct borrowers throughout the commercial real estate community in the United States.
Credit and Underwriting
Our underwriting and credit process commences upon receipt of a potential borrower’s executed loan application and non-refundable deposit.
Our underwriters conduct a thorough due diligence process for each prospective investment. The team coordinates in-house and third-party due diligence for each prospective loan as part of a checklist-based process that is designed to ensure that each loan receives a systematic evaluation. Elements of the underwriting process generally include:
Cash Flow Analysis. We create an estimated cash flow analysis and underwriting model for each prospective investment. Creation of the cash flow analysis generally draws on an assessment of current and historical data related to the property’s rent roll, operating expenses, net operating income, leasing cost, and capital expenditures. Underwriting evaluates and factors in assumptions regarding current market rents, vacancy rates, operating expenses, tenant improvements, leasing commissions, replacement reserves, renewal probabilities and concession packages based on observable conditions in the subject property’s sub-market at the time of underwriting. The cash flow analysis may also rely upon third-party environmental and engineering reports to estimate the cost to repair or remediate any identified environmental and/or property-level deficiencies. The final underwritten cash flow analysis is used to estimate the property’s overall value and its ability to produce cash flow to service the proposed loan.
Borrower Analysis. Careful attention is also paid to the proposed borrower, including an analysis based on available information of its credit history, financial standing, existing portfolio and sponsor exposure to leverage and contingent liabilities, capacity and capability to manage and lease the collateral, depth of organization, knowledge of the local market, and understanding of the proposed product type. We also generally commission and review a third-party background check of our prospective borrower and sponsor.
Site Inspection. A Ladder underwriter typically conducts a physical site inspection of each property. The site inspection gives the underwriter insights into the local market and the property’s positioning within it, confirms that tenants are in-place, and generally helps to ensure that the property has the characteristics, qualities, and potential value represented by the borrower.
Legal Due Diligence. Our in-house transaction management team includes experienced attorneys that manage, negotiate, structure and close all transactions and complete legal due diligence on each property, borrower, and sponsor, including evaluating documents such as leases, title, title insurance, opinion letters, tenant estoppels, organizational documents, and other agreements and documents related to the property or the loan.
Third-party Appraisal. We generally commission an appraisal from a member of the Appraisal Institute to provide an independent opinion of value as well as additional supporting property and market data. Appraisals generally include detailed data on recent property sales, local rents, vacancy rates, supply, absorption, demographics and employment, as well as a detailed projected cash flow and valuation analysis. We typically use the independent appraiser’s valuation to calculate ratios such as loan-to-value and loan-to-stabilized-value ratio, as well as to serve as an independent source to which the in-house cash flow and valuation model can be compared.
Third-party Engineering Report. We generally engage an approved licensed engineer to complete property condition/engineering reports and a seismic report for applicable properties. The engineering report is intended to identify any issues with respect to the safety and soundness of a property that may warrant further investigation, and provide estimates of ongoing replacement reserves, overall replacement cost, and the cost to bring a property into good repair.
Third-party Environmental Report. We also generally engage an approved environmental consulting firm to complete a Phase I Environmental Assessment to identify and evaluate potential environmental issues at the property and may also order and review Phase II Environmental Assessments and/or Operations & Maintenance plans, if applicable. Environmental reports and supporting documentation are typically reviewed in-house as well as by our dedicated outside environmental counsel who prepares a summary report on each property.
Third-party Insurance Review. A third-party insurance specialist reviews each prospective borrower’s existing insurance program to analyze the specific risk exposure of each property and to ensure that coverage is in compliance with our standard insurance requirements. Our transaction management team oversees this third-party review and makes the conclusions of their analysis available to the underwriting team.
A credit memorandum is prepared to summarize the results of the underwriting and due diligence process for the consideration of the Investment Committee. We thoroughly document the due diligence process up to, and including, the credit memorandum and maintain an organized digital archive of our work.
Transaction Management
The transaction management team is generally responsible for coordinating and managing outside counsel, working directly with originators, underwriters and borrowers to manage, structure, negotiate and close all transactions, including the securitization of our loans. The transaction management team plays an integral role in the legal underwriting of each property, consults with outside counsel on significant business, credit and/or legal issues, and facilitates the funding and closing of all investments and dispositions. The transaction management team also supports asset management and investment realization activities, including coordination of post-closing issues and assistance with loan sales, financings, refinancing and repayments.
Investment Committee Approval
All loan and real estate investments require approval from our Investment Committee, comprised of Brian Harris, CEO; Pamela McCormack, President; and Michael Scarola, Chief Credit Officer.Officer; and Craig Robertson, Head of Underwriting. The Investment Committee generally requires each investment to be fully described in a comprehensive Investment Committee memorandum that identifies the investment, the due diligence conducted and the findings, as well as all identified related risks and mitigants. The Investment Committee meets regularly to ensure that all investments are fully vetted prior to issuance of Investment Committee approval.
In addition to Investment Committee approval, the Risk and Underwriting Committee of our board of directors approves all loan and real estate investments above certain thresholds, which are currently set at $50.0 million for loans and $20.0 million for real estate investments. Additional investment opportunities, which include but are not limited to land, residential, or non-U.S. loans are also approved.
Financing
Prior to securitization or other disposition, or in the case of balance sheet loans, maturity, we evaluate most of the loans we originate for secured financing usingvia the CLO market or our multiple committed term facilities from leading financial institutions. Our finance team endeavors to match the characteristics and expected holding periods of the assets being financed with the characteristics of the financing options available and our short and long term cash needs in determining the appropriate financing approaches to be applied. The approaches we apply to financing our assets are a key component of our asset/liability risk management strategy with respect to managing liquidity risk. These approaches, supplemented by the use of hedging
primarily via the use of standard derivative instruments, facilitate the prudent management of our interest rate and credit spread exposures. Refer to “Our Financing Strategies” for further information.
Asset Management
Our in-house asset management team pro-actively manages the Company’s loan and real estate portfolios, demonstrating our Company-wide focus and emphasis on principal preservation and maximizing asset performance. The asset management team, together with our underwriting and transaction management teams, monitors the credit performance of our investment portfolio in concert with our third-party servicers and property managers, working closely with borrowers and/or joint-venture partners to manage all of our positions and monitor financial performance of our collateral assets, including execution of business plans and daily activities within our real estate portfolio. We focus on asset-specific issues and market surveillance, active enforcement of loan and security rights, and regular review of potential disposition strategies. Ladder performs detailed asset reviews, endeavors to perform periodic site inspections on every investment and provides comprehensive internal asset-level performance reporting. As applicable, we evaluateour asset management team evaluates loan modifications, debt and/or equity recapitalizations and other changes or variations to a borrower’s or joint venture partner’s business plan or budget and recommend a course of action to the Investment Committee.
Disposition and Distribution
Our securitization team works with our transaction management and underwriting teams to realize our disposition strategy of selling certain first mortgage loans into CMBS securitization trusts. We typically partner with other leading financial institutions to contribute loans to multi-asset securitizations. We have also led single asset securitizations on single loans we have originated.
In addition to contributing first mortgage loans into CMBS securitization trusts, we also maintain the flexibility to keep such loans on our balance sheet, contribute loans into a CLO or similar structure, sell participation interests or “b-notes” in our first mortgage loans or sell first mortgage loans as whole loans. Balance sheet loans that are refinanced by us into a new conduit first mortgage loan upon property stabilization and intended for securitization are re-underwritten and structured by our origination, underwriting and transaction management teams and approved by our Investment Committee.
Our asset management team also manages sales of our real property.
Factors Impacting Operating Results
There are a number of factors that influence our operating results in a meaningful way. The most significant factors include: (1) our competition; (2) market and economic conditions, including the continuing impact from COVID-19 on the economy; (3) loan origination and repayment volume; (4) profitability of securitizations; (5) avoidance of credit losses; (6) availability of debt and equity funding and the costs of that funding; (7) the net interest margin on our investments; (8) effectiveness of our hedging and other risk management practices; (9) real estate transaction volumes; (10) occupancy rates; and (11) expense management.
Our Financing Strategies
Our financing strategies are critical to the success and growth of our business. We manage our financing to complement our asset composition and to diversify our exposure across multiple capital markets and counterparties. In addition to cash flow from operations, we fund our operations and investment strategy through a diverse array of funding sources, including:
•Unsecured corporate bonds
•CLO transactions
•Secured loan and securities repurchase facilities
•Loan sales and securitizations
•Secured financing facility
•CLO transactions
•Non-recourse mortgage debt
•FHLB financingRevolving credit facility
•Revolving credit facilityLoan sales and securitizations
•Unencumbered assets available for financing
•Equity
From time to time, we may add financing counterparties that we believe will complement our business, although the agreements governing our indebtedness may limit our ability and the ability of our present and future subsidiaries to incur additional indebtedness. Our amended and restated charter and by-laws do not impose any threshold limits on our ability to use leverage. Refer to our discussion below and Part II, Item 7 “Management’s Discussion and Analysis of Financial Condition and Results of Operations—LiquidityOperations” under the heading “Liquidity and
Capital Resources” and Note 76, Debt Obligations, Net, into our consolidated financial statements included elsewhere in this Annual Report, for moreadditional information about our financing arrangements.
Unsecured Corporate Bonds
As of December 31, 2020,2023, we had $1.6 billion of unsecured corporate bonds outstanding. These unsecured financings were comprised of $146.7 million in aggregate principal amount of 5.875% senior notes due 2021 (the “2021 Notes”), $465.9 million in aggregate principal amount of 5.25% senior notes due 2022 (the “2022 Notes”), $348.0$327.8 million in aggregate principal amount of 5.25% senior notes due 2025 (the “2025 Notes”) and $651.8, $611.9 million in aggregate principal amount of 4.25% senior notes due 2027 (the “2027 Notes”) and $635.9 million in aggregate principal amount of 4.75% senior notes due 2029 (the “2029 Notes,” and collectively with the 2021 Notes, the 20222025 Notes and the 20252027 Notes, the “Notes”). During the year ended December 31, 2020, we repurchased an aggregate principal of the Notes of $303.9 million, recognizing an aggregate gain on extinguishment of debt of $20.1 million. Refer to Note 7 to the Consolidated Financial Statements for further detail.
Due in large part to devoting such a large portion of the Company’s capital structure to equity and unsecured corporate bond debt, Ladder maintains a $2.8$3.0 billion pool of unencumbered assets, comprised primarily of first mortgage loans and unrestricted cash as of December 31, 2020.2023.
CLO Debt
As of December 31, 2023, the Company had $1.1 billion of matched term, non-mark-to-market and non-recourse CLO debt included in debt obligations on its consolidated balance sheets.
On July 13, 2021, a consolidated subsidiary of the Company completed a privately-marketed CLO transaction, which generated $498.2 million of gross proceeds to Ladder, financing $607.5 million of loans (“Contributed July 2021 Loans”) at an 82% advance rate on a matched term, non-mark-to-market and non-recourse basis. A consolidated subsidiary of the Company retained an 18% subordinate and controlling interest in the CLO. The Company retained control over major decisions made with respect to the administration of the Contributed July 2021 Loans, including broad discretion in managing these loans, and has the ability to appoint the special servicer under the CLO.
On December 2, 2021, a consolidated subsidiary of the Company completed a privately-marketed CLO transaction, which generated $566.2 million of gross proceeds to Ladder, financing $729.4 million of loans (“Contributed December 2021 Loans”) at a 77.6% advance rate on a matched term, non-mark-to-market and non-recourse basis. A consolidated subsidiary of the Company retained an 15.6% subordinate and controlling interest in the CLO. The Company also held two additional tranches as investments totaling 6.8% interest in the CLO. The Company retained control over major decisions made with respect to the administration of the Contributed December 2021 Loans, including broad discretion in managing these loans, and has the ability to appoint the special servicer under the CLO.
Committed Loan Financing Facilities
We are parties to multiple committed loan repurchase agreement facilities, totaling $1.6$1.2 billion of credit capacity. As of December 31, 2020,2023, the Company had $255.4$605.0 million of borrowings outstanding, with an additional $1.3 billion$637.0 million of committed financing available. Assets pledged as collateral under these facilities are generally limited to first mortgage whole mortgage loans, mezzanine loans and certain interests in such first mortgage and mezzanine loans. Our repurchase facilities include covenants covering net worth requirements, minimum liquidity levels, and maximum debt/equity ratios.
We have the option to extend some of our existing facilities subject to a number of customary conditions. The lenders have sole discretion to include collateral in these facilities and to determine the market value of the collateral on a daily basis, and, if the estimated market value of the included collateral declines, the lenders have the right to require additional collateral or a full and/or partial repayment of the facilities (margin call) sufficient to rebalance the facilities. Typically, the lender establishes a maximum percentage of the collateral asset’s market value that can be borrowed. We often borrow at a lower percentage of the collateral asset’s value than the maximum, leaving us with excess borrowing capacity that can be drawn upon at a later date and/or applied against future margin calls so that they can be satisfied on a cashless basis.
Securities Repurchase Facilities
We are a party to a committed term master repurchase agreement with a major U.S. banking institution for CMBS, totaling $400.0$100.0 million of credit capacity, or more depending on our utilization of a loan repurchase facility with the same lender.capacity. As we do in the case of borrowings under committed loan facilities, we often borrow at a lower percentage of the collateral asset’s value than the maximum, leaving us with excess borrowing capacity that can be drawn upon at a later date and/or applied against future margin calls so that they can be satisfied on a cashless basis. As of December 31, 2020,2023, the Company had $149.6 millionno borrowings outstanding, with an additional $638.4$100.0 million of committed financing available.
Additionally, we are a party to multiple uncommitted master repurchase agreements with several counterparties to finance our investments in CMBS and U.S. Agency Securities.securities. The securities that servedserve as collateral for these borrowings are typically
AAA-rated CMBS with relatively short duration and significant subordination. The lenders have sole discretion to determine the market value of the collateral on a daily basis, and, if the estimated market value of the collateral declines, the lenders have the right to require additional cash collateral. If the estimated market value of the collateral subsequently increases, we have the right to call back excess cash collateral.
Mortgage Loan Financing
We generally finance our real estate using long-term non-recourse mortgage financing. During the year ended December 31, 2023, we did not execute any long term debt agreement to finance real estate. Our mortgage loan financings have primarily fixed rates ranging from 4.39% to 9.03%, mature between 2024 - 2031 and total $437.8 million as of December 31, 2023. These long-term non-recourse mortgages include net unamortized premiums of $1.8 million at December 31, 2023, representing proceeds received upon financing greater than the contractual amounts due under the agreements. The premiums are being amortized over the remaining life of the respective debt instruments using the effective interest method. We recorded $0.6 million of premium amortization, which decreased interest expense, for the year ended December 31, 2023. The loans are collateralized by real estate and related lease intangibles, net, of $474.7 million as of December 31, 2023.
Revolving Credit Facility
The Company’s revolving credit facility (the “Revolving Credit Facility”) provides for an aggregate maximum borrowing amount of $266.4$323.9 million, including a $25.0 million sublimit for the issuance of letters of credit. The Revolving Credit Facility is available on a revolving basis to finance the Company’s working capital needs and for general corporate purposes. TheBorrowings under the Revolving Credit Facility hasincur interest at a fixed margin of 2.50% over the index rate, with reductions in the fixed margin upon the achievement of investment grade credit ratings. On January 25, 2024, the Company amended its Revolving Credit Facility to extend the final maturity date assuming all extensions options are exercised,to January 25, 2029. As of February 2025. The amendment also provided for a reduction inDecember 31, 2023, the interest rateCompany had no outstanding borrowings on the Revolving Credit Facility, but still maintains the ability to one-month LIBOR plus 3.00% on Eurodollar advances upon the upgrade of the Company’s credit ratings, which occurred in January 2020.draw $323.9 million.
The obligations under the Revolving Credit Facility are guaranteed by the Company and certain of its subsidiaries. The Revolving Credit Facility is secured by a pledge of the shares of (or other ownership or equity interests in) certain subsidiaries to the extent the pledge is not restricted under existing regulations, law or contractual obligations.
LCFH is subject to customary affirmative covenants and negative covenants, including limitations on the incurrence of additional debt, liens, restricted payments, sales of assets and affiliate transactions under the Revolving Credit Facility. In addition, under the Revolving Credit Facility, LCFH is required to comply with financial covenants relating to minimum net worth, maximum leverage, minimum liquidity, and minimum fixed charge coverage, consistent with our other credit facilities.
FHLB Financing
We have maintained membership in the FHLB since 2012 through our subsidiary, Tuebor Captive Insurance Company LLC (“Tuebor”). As of December 31, 2020, Tuebor had $288.0 million of borrowings outstanding from the FHLB (with an additional $1.2 billion of committed term financing available), with terms of overnight to 3.75 years, interest rates of 0.41% to 2.74%, and advance rates of 45.0% to 95.7% on eligible collateral, including cash collateral. As of December 31, 2020, collateral for the borrowings was comprised of $280.1 million of CMBS and U.S. Agency Securities, and $108.3 million of first mortgage commercial real estate loans. The weighted-average borrowings outstanding were $578.6 million for the year ended December 31, 2020. FHLB advances amounted to 6.8% of the Company’s outstanding debt obligations as of December 31, 2020.
Mortgage Loan Financing
We generally finance our real estate using long-term non-recourse mortgage financing. During the year ended December 31, 2020, we executed ten term debt agreements to finance real estate. All of our mortgage loan financings have fixed rates ranging from 3.75% to 6.16%, mature between 2021- 2030 and total $766.1 million at December 31, 2020. These long-term non-recourse mortgages include net unamortized premiums of $4.6 million at December 31, 2020, representing proceeds received upon financing greater than the contractual amounts due under the agreements. The premiums are being amortized over the remaining life of the respective debt instruments using the effective interest method. We recorded $1.2 million of premium amortization, which decreased interest expense, for the year ended December 31, 2020. The loans are collateralized by real estate and related lease intangibles, net, of $909.4 million as of December 31, 2020.
Secured Financing Facility
On April 30, 2020, the Company entered into a strategic financing arrangement (the “Agreement”) with an American multinational corporation (the “Lender”), under which the Lender provided the Company with approximately $206.4 million in senior secured financing (the “Secured Financing Facility”) to fund transitional and land loans. The Secured Financing Facility is secured on a first lien basis on a portfolio of certain of the Company’s loans and will mature on May 6, 2023, and borrowings thereunder bear interest at LIBOR (or a minimum of 0.75% if greater) plus 10.0%, with a minimum interest premium of approximately $39.2 million minus the aggregate sum of all interest payments made under the Secured Financing Facility prior to the date of payment of the minimum interest premium, which is payable upon the earlier of maturity or repayment in full of the loan. The Senior Financing Facility is non-recourse, subject to limited exceptions, and does not contain mark-to-market provisions. Additionally, the Senior Financing Facility provides the Company optionality to modify or restructure loans or forbear in exercising remedies, which maximizes the Company’s financial flexibility.
As part of the strategic financing, the Lender also had the ability to make an equity investment in the Company of up to 4.0 million Class A common shares at $8.00 per share, subject to certain adjustments (the “Purchase Right”). The Purchase Right was exercised in full at $8.00 per share on December 27, 2020.
The Lender has agreed not to sell, transfer, assign, pledge, hypothecate, mortgage, dispose of or in any way encumber the shares acquired as a result of exercising the Purchase Right for a period of time following the exercise date. In connection with the issuance of the Purchase Right, the Company and the Lender entered into a registration rights agreement, pursuant to which the Company has agreed to provide customary demand and piggyback registration rights to the Lender.
As of December 31, 2020, the Company had $192.6 million of borrowings outstanding under the Secured Financing Facility included in debt obligations on its consolidated balance sheets. Unamortized debt issuance costs of $7.2 million were included in secured financing facility as of December 31, 2020.
Collateralized Loan Obligation (“CLO”) Debt
On April 27, 2020, a consolidated subsidiary of the Company completed a private CLO transaction with a major U.S. bank which generated $310.2 million of gross proceeds to Ladder, financing $481.3 million of loans (“Contributed Loans”) at a 64.5% advance rate on a matched term, non-mark-to-market and non-recourse basis. A consolidated subsidiary of the Company will retained a 35.5% subordinate and controlling interest in the CLO. The Company retained control over major decisions made with respect to the administration of the Contributed Loans, including broad discretion in managing these loans in light of the COVID-19 pandemic, and has the ability to appoint the special servicer under the CLO. The CLO is a Variable Interest Entity (“VIE”) and the Company was the primary beneficiary and, therefore, consolidated the VIE - See Note 10, Consolidated Variable Interest Entities. Proceeds from the transaction were used to pay off other secured debt including bank and FHLB financing that was subject to mark-to-market provisions.
As of December 31, 2020, the Company had $276.5 million of matched term, non-mark-to-market and non-recourse basis CLO debt included in debt obligations on its consolidated balance sheets. Unamortized debt issuance costs of $2.6 million were included in CLO debt as of December 31, 2020.
Hedging Strategies
We may enter into interest rate and credit spread derivative contracts to mitigate our exposure to changes in interest rates and credit spreads. We generally seek to hedge the interest rate risk on the financing of assets that have a duration longer than five years, including newly-originated conduit first mortgage loans, securities in our CMBS portfolio if long enough in duration, and most of our U.S. Agency Securitiessecurities portfolio. We monitor our asset profile and our hedge positions to manage our interest rate and credit spread exposures, and we seek to match fund our assets according to the liquidity characteristics and expected holding periods of our assets.
Financing Strategy in Current Market Conditions
In March 2020, as the COVID-19 health crisis rapidly transformed into a financial crisis, management took swift action to increase liquidity resources and actively manage its financing arrangements with its bank partners. In an abundance of caution, the Company first drew down on its $266.4 million unsecured revolving credit facility, which continues to be fully-drawn, and the proceeds continue to be held as unrestricted cash on the Company’s balance sheet as of February 19, 2021.
Securities Repurchase Facilities: The Company invests in AAA-rated CRE CLO securities, typically front pay securities, with relatively short duration and significant subordination. These securities have historically been financed with short-term maturity, repurchase agreements with various bank counterparties. The Company has been able to continue to access securities repurchase funding and the pricing of such borrowings has improved during the three months ended December 31, 2020 as liquidity continued to return to the market and pricing for the securities that serve as collateral improved. Furthermore, during the year ended December 31, 2020, the Company paid down $548.2 million of securities repurchase financing, primarily through sales of securities.
FHLB Financing: In 2016, the FHFA adopted a final rule that limited our captive insurance subsidiary’s membership in the FHLB, requiring us to significantly reduce the amounts of FHLB borrowings outstanding by February of 2021. The Company has complied with such targeted paydowns. Refer to “Management’s Discussion and Analysis of Financial Condition and Results of Operations - Liquidity and Capital Resources - FHLB financing” for further information.
Total paydowns on FHLB financing for the year ended December 31, 2020 were $785.5 million. As a part of paydowns in the second quarter, the Company incurred $6.5 million in prepayment penalties. The remaining FHLB debt maturities are staggered out through 2024. Funding for future advance paydowns is expected be obtained from the natural amortization of securities over time and/or sales of securities collateral.
Loan Repurchase Financing: The Company has maintained a consistent dialogue with its loan financing counterparties since the COVID-19 crisis began to unfold in late March 2020. In addition to using proceeds from the Company’s 2027 Notes offering in January to reduce secured debt, for the year ended December 31, 2020, the Company paid down over $446.9 million on such loan repurchase financing through loan collateral pay offs and loans securitized through a CLO financing transaction. (refer to below). Loan repurchase debt outstanding as of December 31, 2020 was $255.4 million. The Company continues to maintain an active dialogue with its bank counterparties as it expects loan collateral on each of their lines to experience some measure of forbearance.
Secured Financing Facility: On April 30, 2020, the Company entered into a strategic financing arrangement with an American multinational corporation, under which the lender will provide the Company with approximately $206.4 million in senior secured financing to fund transitional and land loans. (refer to above).
Completion of Private CLO: On April 27, 2020, the Company completed a private CLO financing transaction with a major U.S. bank which generated $310.2 million of gross proceeds, financing $481.3 million of loans at a 64.5% advance rate on a matched term, non-mark-to-market and non-recourse basis.
Based on the financing actions described above, the Company has significantly decreased its exposure to mark-to-market financing in 2020. As of February 19, 2021, the Company is holding over $1.3 billion of unrestricted cash.
Financial Covenants
We generally seek to maintain a debt-to-equity ratio of approximately 3.0:1.0 or below. We expect this ratio to fluctuate during the course of a fiscal year due to the normal course of business inbusiness. This ratio may also fluctuate as a result of our conduit lending operations, in which we generally securitize our inventory of conduit loans at intervals, and also because of changes in our asset mix, due in part to such securitizations. We generally seek to match fund our assets according to their liquidity characteristics and expected hold period. We believe that the defensive positioning of our predominantly senior secured assets and our financing strategy has allowed us to maintain financial flexibility to capitalize on an attractive range of market opportunities as they have arisen.
We and our subsidiaries may incur substantial additional debt in the future. However, we are subject to certain restrictions on our ability to incur additional debt in the indentures governing the Notes (the “Indentures”) and our other debt agreements. Under the Indentures, we may not incur certain types of indebtedness unless our consolidated non-funding debt to equity ratio (as defined in the Indentures) is less than or equal to 1.75 to 1.75:1.00 or if the unencumbered assets of the Company and its
subsidiaries is less than 120% of their unsecured indebtedness, although our subsidiaries are permitted to incur indebtedness where recourse is limited to the assets and/or the general credit of such subsidiary.
Our borrowings under certain financing agreements and our committed repurchase facilities are subject to maximum consolidated leverage ratio limits (either a fixed ratio ranging from 3.503.5:1.0 to 1.00 to 4.00 to 1.00,4.0:1.0, or a maximum ratio based on our asset composition at the time of determination), minimum net worth requirements (ranging from $400.0 million to $871.4 million), maximum reductions in net worth over stated time periods, minimum liquidity levels (typically $30.0 million of cash or a higher standard that often allows for the inclusion of different percentages of liquid securities in the determination of compliance with the requirement), and a fixed charge coverage ratio of 1.25x, and, in the instance of one lender, an interest coverage ratio of 1.50x, in each case, if certain liquidity thresholds are not satisfied. Leverage ratio limits exclude CLO financing for purposes of this covenant calculation. These restrictions, which would permit us to incur substantial additional debt, are subject to significant qualifications and exceptions.
Further, certain of our financing arrangements and loans on our real property are secured by the assets of the Company, including pledges of the equity of certain subsidiaries or the assets of certain subsidiaries. From time to time, certain of these financing arrangements and loans may prohibit certain of our subsidiaries from paying dividends to the Company, from making distributions on such subsidiary’s capital stock, from repaying to the Company any loans or advances to such subsidiary from the Company or from transferring any of such subsidiary’s property or other assets to the Company or other subsidiaries of the Company.
We are in compliance with all covenants as described elsewhere in this Annual Report as of December 31, 2020.2023.
Net of the $1.3 billion of unrestricted cash held as of December 31, 2020, our adjusted leverage ratio would be significantly below 3.0x. In late March 2020, as the COVID-19 crisis evolved, management began executing on a plan to mitigate uncertainty in financial markets by increasing liquidity and obtaining additional non-recourse and non-mark-to-market financing. Partly as a result of maintaining conservative cash levels as of March 31, 2020, the Company was not in compliance with its 3.5x maximum leverage covenant with certain of its lenders but had the benefit of a contractually provided 30-day cure period during which the Company cured such non-compliance by paying down debt (as defined in the relevant borrowing agreements). Refer to “Financing Strategy in Current Market Conditions” for further disclosures surrounding deleveraging actions completed during 2020.
Competition
The commercial real estate finance markets are highly competitive. We face competition for lending and investment opportunities from a variety of institutional lenders and investors and many other market participants, including specialty finance companies, other REITs, commercial banks and thrift institutions, investment banks, insurance companies, hedge funds and other financial institutions. These competitors may enjoy competitive advantages over us, including greater name recognition, established lending relationships with certain borrowers and brokers, financial resources, and access to capital, including through a corporate parent.
We compete on the basis of relationships, product offering, loan structure, terms, pricing and customer service. Our success depends on our ability to maintain and capitalize on relationships with borrowers and brokers, offer attractive loan products, remain competitive in pricing and terms, and provide superior service.
Taxation
We have elected to be subject to tax as a REIT under Sections 856 through 860 of the Internal Revenue Code (the “Code”), commencing with the taxable year ending December 31, 2015. Additionally, onecertain of our subsidiary entities hashave also elected to be subject to tax as a REIT commencing with taxable year ending December 31, 2016.REITs. To qualify as a REIT, we must make qualifying distributions to shareholders and satisfy, on a continuing basis, through actual investment and operating results, certain asset, income, organizational, distribution, stock ownership and other REIT requirements. If we fail to qualify as a REIT, and do not qualify for certain statutory relief provisions, we will be subject to U.S. federal, state and local income taxes and may be precluded from qualifying as a REIT for the subsequent four taxable years following the year in which we lost our REIT qualification. The failure to qualify as a REIT could have a material adverse impact on our results of operations and amounts available for distribution to shareholders.
We utilize TRSs to reduce the impact of the prohibited transaction tax and to avoid penalty for the holding of assets not qualifying as real estate assets for purposes of the REIT asset tests. Any income associated with a TRS is fully taxable because a TRS is subject to federal and state income taxes as a domestic C corporation based upon its net income. Refer to “Risk factors—Risks related to our taxation as a REIT.”
Regulation
Our operations are subject, in certain instances, to supervision and regulation by U.S. federal and state governmental authorities and may be subject to various laws and judicial and administrative decisions imposing various requirements and restrictions. In addition, certain of our subsidiaries’ businesses may rely on exemptions from various requirements of the Securities Act, the Exchange Act, the Investment Company Act, and the U.S. Employee Retirement Income Security Act of 1974, as amended (“ERISA”). These exemptions are sometimes highly complex and may in certain circumstances depend on compliance by third-parties who we do not control.
Regulation of Commercial Real Estate Lending Activities
Although most states do not regulate commercial finance, certain states impose limitations on interest rates and other charges and on certain collection practices and creditor remedies, and require licensing of lenders and financiers and adequate disclosure of certain contract terms. We also are required to comply with certain provisions of, among other statutes and regulations, certain provisions of the Equal Credit Opportunity Act that are applicable to commercial loans, the USA PATRIOT Act, regulations promulgated by the Office of Foreign Asset Control and U.S. federal and state securities laws and regulations.
Regulation as a Captive Insurance Companyan Investment Adviser
We maintainEffective as of July 16, 2021, Ladder Capital Asset Management LLC (“LCAM”) is a captive insurance company, Tuebor,registered investment adviser under the Investment Advisers Act of 1940, as amended (the “Advisers Act”) and currently provides investment advisory services solely to provide coverage previously self insuredLadder-sponsored collateralized loan obligation trusts (“CLO Issuers”). The CLO Issuers invest primarily in first mortgage loans secured by us, including nuclear, biologicalcommercial real estate originated or chemical coverage, excess property coverageacquired by Ladder and excess errorsin participation interests in such loans. LCAM is entitled to receive a management fee connection with the advisory, administrative and omissions coverage. It is regulated bymonitoring services it performs for the stateCLO Issuer as the collateral manager; however, LCAM has waived this fee for so long as it or any of Michigan andits affiliates serves as collateral manager for the CLO Issuers.
A registered investment adviser is subject to U.S. federal and state laws and regulations primarily intended to benefit its clients. These laws and regulations include requirements relating to, among other things, fiduciary duties to clients, maintaining an effective compliance program, solicitation agreements, conflicts of interest, record keeping and reporting requirements, disclosure requirements, custody arrangements, limitations on agency cross and principal transactions between an investment adviser and its advisory clients and general anti-fraud prohibitions. In addition, these laws and regulations generally grant supervisory agencies and bodies broad administrative powers, including the power to limit or restrict us from conducting our advisory activities in the event we fail to comply with those laws and regulations. Sanctions that cover all aspectsmay be imposed for a failure to comply with applicable legal requirements include the suspension of its business. Violationsindividual employees, limitations on our engaging in various advisory activities for specified periods of these regulations can result intime, disgorgement, the revocation of its authorization to do business as a captive insurer or result inregistrations, and other censures orand fines. The subsidiary is also
We may become subject to insurance laws of states other than Michigan (i.e., states where the insureds are located). See “Management’s Discussionadditional regulatory and Analysis of Financial Conditioncompliance burdens if our investment adviser subsidiary expands its product offerings and Results of Operations—Liquidity and capital resources.”investment platform.
Investment Company Act Exemption
We intend to conduct our operations so that neither we nor any of our subsidiaries (including any series thereof) are required to register as an investment company under the Investment Company Act.
If we or any of our subsidiaries (including any series thereof) fail to qualify for, and maintain an exemption from, registration under the Investment Company Act, or an exclusion from the definition of an investment company, we could, among other things, be required either to (a) substantially change the manner in which we conduct our operations to avoid being required to register as an investment company, (b) effect sales of our assets in a manner that, or at a time when, we would not otherwise choose to do so, or (c) register as an investment company under the Investment Company Act, any of which could have an adverse effect on us, our financial results, the sustainability of our business model or the value of our securities.
If we or any of our subsidiaries (including any series thereof) were required to register as an investment company under the Investment Company Act, the registered entity would become subject to substantial regulation with respect to capital structure (including the ability to use leverage), management, operations, transactions with affiliated persons (as defined in the Investment Company Act), portfolio composition, including restrictions with respect to diversification and industry concentration, compliance with reporting, record keeping, voting, proxy disclosure and other rules and regulations that would significantly change its operation and we would not be able to conduct our business as described in this Annual Report. For example, because affiliate transactions are generally prohibited under the Investment Company Act, we would not be able to enter into certain transactions with any of our affiliates if we are required to register as an investment company, which could have a material adverse effect on our ability to operate our business.
If we were required to register as an investment company but failed to do so, we would be prohibited from engaging in our business, and criminal and civil actions could be brought against us. In addition, our contracts would be unenforceable unless a court required enforcement, and a court could appoint a receiver to take control of us and liquidate our business.
Section 3(a)(1)(A) of the Investment Company Act defines an investment company as any issuer that is or holds itself out as being engaged primarily, or proposes to engage primarily, in the business of investing, reinvesting or trading in securities. Section 3(a)(1)(C) of the Investment Company Act defines an investment company as any issuer which is engaged or proposes to engage in the business of investing, reinvesting, owning, holding or trading in securities, and owns or proposes to acquire investment securities having a value exceeding 40% of the value of such issuer’s total assets (exclusive of U.S. government securities and cash items) on an unconsolidated basis. Excluded from the term “investment securities,” among other things, are U.S. government securities and securities issued by majority-owned subsidiaries that are not themselves investment companies and are not relying on the exception from the definition of investment company for certain privately-offered investment vehicles set forth in Section 3(c)(1) or 3(c)(7) of the Investment Company Act.
We are organized as a holding company and conduct our businesses primarily through our majority-owned subsidiaries (including any series thereof). We intend to conduct our operations so that we do not come within the definition of an investment company under Section 3(a)(1)(C) of the Investment Company Act because less than 40% of the value of our total assets (exclusive of U.S. government securities and cash items) on an unconsolidated basis will consist of “investment securities.” We will monitor our holdings to ensure continuing and ongoing compliance with this test. In addition, we believe that we will not be considered an investment company under Section 3(a)(1)(A) of the Investment Company Act because we will not engage primarily, hold ourselves out as being engaged primarily, or propose to engage primarily, in the business of investing, reinvesting or trading in securities. Rather, we will be engaged primarily in the business of holding securities of our majority-owned subsidiaries (including any series thereof).
We expect that certain of our subsidiaries (including any series thereof) may rely on the exclusion from the definition of an “investment company” under the Investment Company Act pursuant to Section 3(c)(5)(C) of the Investment Company Act, which is available for entities “primarily engaged” in the business of “purchasing or otherwise acquiring mortgages and other liens on and interests in real estate.” This exclusion, as interpreted by the staff of the SEC, requires that an entity invest at least 55% of its assets in “qualifying real estate assets” and at least 80% of its assets in qualifying real estate assets and “real estate-related assets.”
Although we reserve the right to modify our business methods at any time, as of December 31, 2020,2023, we expect each of our subsidiaries (including any series thereof) relying on Section 3(c)(5)(C) to primarily hold assets in one or more of the following categories, which are comprised primarily of “qualifying real estate assets”: commercial mortgage loans, investments in securities secured by first mortgage loans, and investments in selected net leased and other real estate assets. We expect each of our subsidiaries (including any series thereof) relying on Section 3(c)(5)(C) to rely on guidance published by the SECSecurities and Exchange Commission (“SEC”) or its staff or on our analyses of such guidance to determine which assets are qualifying real estate assets and real estate-related
assets. To the extent that the SEC or its staff publishes new or different guidance with respect to these matters, we may be required to adjust our strategies accordingly. In addition, we may be limited in our ability to make certain investments and these limitations could result in a subsidiary holding assets we might wish to sell or selling assets we might wish to hold.
Any of the Company or our subsidiaries (including any series thereof) may rely on the exemption provided by Section 3(c)(6) of the Investment Company Act to the extent that they primarily engage, directly or through majority-owned subsidiaries (including any series thereof), in the businesses described in Sections 3(c)(3), 3(c)(4) and 3(c)(5) of the Investment Company Act. The SEC staff has issued little interpretive guidance with respect to Section 3(c)(6) and any guidance published by the staff could require us to adjust our strategies accordingly.
In 2011, the SEC solicited public comment on a wide range of issues relating to Section 3(c)(5)(C) of the Investment Company Act, including the nature of the assets that qualify for purposes of the exemption and whether companies that are engaged in the business of acquiring mortgages and mortgage-related instruments should be regulated in a manner similar to investment companies. There can be no assurance that the laws and regulations governing the Investment Company Act status of such companies, including the SEC or its staff providing more specific or different guidance regarding Section 3(c)(5)(C), will not change in a manner that adversely affects our operations.
Qualification for exclusion from the definition of an investment company under the Investment Company Act may limit our ability to make certain investments. In addition, complying with the tests for such exclusion may restrict the time at which we can acquire and sell assets. To the extent that the SEC or its staff provides more specific guidance regarding any of the matters bearing upon such exclusions, we may be required to adjust our strategies accordingly. Any additional guidance from the SEC or its staff could provide additional flexibility to us, or it could further inhibit our ability to pursue the strategies we have chosen. See “Risk factors—Risks related to our Investment Company Act exemption—Maintenance of our exemption from registration under the Investment Company Act imposes significant limits on our operations.”
Regulation as a Captive Insurance Company
We maintain a captive insurance subsidiary to provide coverage previously self insured by us, including nuclear, biological or chemical coverage, excess property coverage and excess errors and omissions coverage. It is regulated by the state of Michigan and is subject to regulations that cover all aspects of its business. Violations of these regulations can result in revocation of its authorization to do business as a captive insurer or result in censures or fines. The subsidiary is also subject to insurance laws of states other than Michigan (i.e., states where the insureds are located). Refer to Part II, Item 7 “Management’s Discussion and Analysis of Financial Condition and Results of Operations” under the heading “Liquidity and Capital Resources.”
Employees
As of December 31, 2020,2023, we employed 5859 full-time persons. All employees are employed by our operating subsidiary, Ladder Capital Finance LLC. None of our employees are represented by a union or subject to a collective bargaining agreement and we have never experienced a work stoppage. We believe that our employee relations are good.
Human Capital Management and Corporate Culture
Ladder is a dynamic company that is distinguished by the talent and dedication of our team and is committed to building and developing a diverse, interconnected and engaged workforce who work collaboratively to advance the Company’s goals. Our tone at the top promotes a culture of transparency, accountability, and ethical behavior. As a firm with just 59 employees as of December 31, 2023, Ladder’s flat management structure and open-door policy provide all employees with daily access to our senior management. The board maintains oversight of human capital management and corporate culture and gains insight at regular Boardboard and committee meetings about specific Company human resources initiatives, including talent engagement, attraction, and retention.
Ladder is a dynamic company that is distinguished by the talentDiversity, Equity and dedication of our team. The Company is committed to building and developing a diverse, interconnected and engaged workforce, as further described below. Ladder continues to monitor the COVID-19 pandemic and its impacts on all of its constituents. For the safety of our employees, Ladder was proactive in its efforts to create and maintain a seamless transition from office to home. Currently the majority of our employees remain working remotely. The continued engagement and dedication of our employees in light of these difficult circumstances are greatly appreciated, and we believe it is due in part to our strong corporate culture.Inclusion
The Company isWith two female co-founders, gender diversity and equality have always been important to Ladder. We are committed to maintainingcreating a productive work environment in whichdiverse and inclusive workspace that ensures that all individuals are treated with mutual respect and dignity. All levels of personnel are expected to contribute to a professional atmosphere that promotes equal opportunity and nondiscriminatory practices. In keeping with this commitment, the Company has reviewed, and actively reviews, itsWe maintain an anti-discrimination, harassment, and retaliation policy. Further, in addition to annual diversity and inclusion training for all employees, the Company maintains an open-door policy that is alignedreviewed and updated at least annually, along with its dedicationrequired annual employee training. We assess workforce diversity information, hiring practices, and talent development programs as part of a broader effort to integrityidentify areas of continuous improvement to ensure that we are building and transparency.retaining a diverse workforce.
The Company invests in
Talent Recruitment, Development and Retention
We believe our employeesstrong corporate culture, opportunities for advancement, and demonstrates this through competitive compensation and benefits make Ladder a desirable place to work. We offer competitive pay at all levels, including base salaries, annual incentive awards, and stock awards, and frequently evaluate industry pay practices, including through the use of the Board’s compensation consultant.
We seek to promote from within, developing a deep bench of experienced professionals ready to grow into more senior roles. We reimburse employees for professional licenses, memberships, and subscriptions, as well as training programs, conferences, and classes. Employees are encouraged to participate in cross-functional team projects to develop comprehensive business knowledge. Our “Ladder Climbers” program enables our junior staff to bond together and develop leadership skills.
We use anonymous employee experience surveys to solicit feedback on topics such as job satisfaction and employee activities. We use the information from these surveys to guide management engagement, decision-making, and strategy.
Health, Safety and Wellness
The Company offers comprehensive healthcare benefits, paid time off, and a business continuity plan that places our employees’ health and safety at its core. Our benefits program include, among other programs, mental health, fertility services, and family leave. We also support our employees’ wellness and aim to create an environment that provides for work-life balance, including opportunities for a hybrid work schedule.
Ladder has also implemented various programs to develop and build field expertise and leadership skills, including its Company-wide, interdepartmental mentoring program, “Ladder Climbers” program and annual employee reviews. Ladder’s mentoring program pairs junior employees with senior employees in other departments to foster cross-departmental connections and to allow junior employees to expand their knowledge beyond their respective departments. Human Resources actively monitors the program and encourages feedback from both mentees and mentors to ensure that it is a valuable experience for all participants. Unique to the Company is our “Ladder Climbers” program, which is managed by the junior employees themselves and enables our junior staff to bond and develop leadership skills. In addition, our corporate culture encourages
contemporaneous feedback to enable employees to refine their skills and expertise with each project and annual employee reviews also provide a road-map for continued development.
Our Corporate Information
Our principal executive offices are located at 345320 Park Avenue, 8th15th Floor, New York, New York 10154,10022, and our telephone number is (212) 715-3170. We maintain a website on the Internet at http://www.laddercapital.com. The information contained in our website is not incorporated by reference into this Annual Report. We make available on or through our website certain reports and amendments to those reports that we file with, or furnish to the SEC, in accordance with the Exchange Act. These include our annual reports on Form 10-K, our quarterly reports on Form 10-Q and our current reports on Form 8-K. We make this information available on our website free of charge as soon as reasonably practicable after we electronically file the information with, or furnish it to, the SEC.
Item 1A. Risk Factors
The following risk factors and other information included in this Annual Report on Form 10-K should be carefully considered. The risks and uncertainties described below are not the only ones we face. Additional risks and uncertainties not presently known to us or that we currently deem immaterial also may adversely impact our business. If any of the following risks occur, our business, financial condition, operating results, cash flows and liquidity could be materially adversely affected. The market price of our Class A common stock could decline if one or more of these risks or uncertainties actually occur, causing you to lose all or part of your investment in our Class A common stock. Certain statements in “Risk Factors” are forward-looking statements. See “Cautionary Statement Regarding Forward-Looking Statements” included elsewhere in this Annual Report.
Summary of Principal Risk Factors
Our business is subject to change, risks, and uncertainties, as described herein. The risks factors that the Company considers material include, but are not limited to, the following:
Risks Related to COVID-19
•The novel coronavirus (COVID-19) pandemic has had, and will continue to have for the foreseeable future, an adverse effect on our business, financial condition and results of operations, and we are unable to predict the full extent or nature of these impacts at this time.
Risks Related to Our Operations
•TheOur success of our business depends upon the retention ofhiring and retaining qualified loan originators the allocation of capital among our business lines, and maintaining strategic business alliances.
•The allocation of capital among our business lines may vary, which may adversely affect our financial performance.
•We operate using financial models and according to specificproprietary underwriting criteria in a highly competitive market for lending and other investment opportunities, both of which may limit our ability to originate or acquire desirable loans and other investments in our target assets and/or our ability to yield a certain return on our investments.
Market Risks Related to Our Investments
•We cannot predict the effect that government policies, laws, and interventions adopted in response to the current inflationary environment or the impact of future changes in the U.S. political environment, including as a result of 2024 elections, on our business and the markets in which we operate.
•We have a concentration of investments in the real estate sector, and may have further concentrations from time to time in certain property types, locations, tenants and borrowers, which may increase our exposure to the risks of certain economic downturns, and whosethe value of which may be adversely affected by many factors beyond our control, including prevailing interest rates, prepayment rates on mortgage loans, increased competition,dislocations, illiquidity and volatility in the market for commercial real estate, commercial real estate finance and the broader financial markets, shifts in consumer patterns and advances in communication and information technology, fluctuations in prevailing interest rates and credit spreads, prepayment rates on mortgage loans, civil unrest, acts of war and terrorism and outbreaks of communicable diseases, including COVID-19.severe weather patterns and climate change.
Risks Related to Our Portfolio
•The repayment of mortgage loans may be limited by the application of federal, state and local law, including state, bankruptcy, provisionsinsolvency and COVID-19 restrictions,other debtor and tenant relief laws, the non-recourse and potentially illiquid nature of mortgage loans, our ability to evaluate the credit-worthiness of borrowers and to diligence the underlying property, including environmental issues and the property’s ability to generate sufficient cash flow,net income, our ability to manage credit risk and modify or restructure non-performing loans, the sufficiency of appropriate reserves, subordination, the lack of full control due to a participation or co-lender arrangement, and proper insurance coverage.
•Certain balance sheet investments, such as transitional loans, mezzanine loans, B-Notes and other subordinate positions, participations and preferred equity may be more illiquid and involve a greater risk of loss.
•Provisions for loan losses are difficult to estimate. If we are required to materially increase our level of allowanceOur reserves for loan losses for any reason, such increase could adversely affect our business, financial condition and results of operations.may prove inadequate.
•WeInflation has and may continue to stress property performance and value certain investments quarterly at fair value, a subjective measure. Our resultsand thus mortgage loan performance.
•Our participation in the market for mortgage loan securitizations may expose us to risks that could result in losses to us and our access to the CMBS securitization market and the timing of our securitization activities and other factorsreal estate sales may greatly affect our quarterly financial results.
•We may be subject to risks associated with unfunded conditional loan commitments.
•Mortgages on facilities that are subject to ground leases risk the collateral reverting to the ground lessor unexpectedly during the term of the loan due to such borrower’s default under, and the resulting termination of, the ground lease.
•The market valueexpense of operating and owning real property, including net leased real estate assets, may impact our cash flow and our investments in net leased properties could be adversely affected by our reliance on the net leased tenants.
•The leases at the properties underlying commercial real estate loans or securities or the properties held by us may not be relet or renewed on favorable terms, or at all.
•Current and future venture investments could be adversely affected by our lack of sole decision-making authority, our reliance on venture partners’ financial condition and liquidity and disputes between us and our venture partners.
•Our investments in CMBS and CLOs may fluctuate as a result of various market risks thatother real estate-related securities are out of our control and we may sponsor or purchase junior tranches of CMBS or CLO securitizations or of a mortgage loan, which would experience the first loss in the event of a borrower default.
•Any investments in real-estate related equity or debt securities, including but not limited to those issued by REITs and real estate companies, aregenerally subject to the specific risks relating to the particular companies and to the general risks of investing in real estate-related securities.losses.
•Any credit ratings assigned to our investments could be downgraded, and we could incur losses from investments in non-conforming and non-investment grade-rated loans or securities, which could have a material impact on our financial condition, liquidity and results of operations.
•The expenseOur determinations of operatingfair value may have a material impact on our financial condition and owning real property, including net leased real estate investments, may impact our cash flow from operations and our investments in net leased properties and in joint ventures could be adversely affected by our reliance on the net leased tenants and our joint venture partners, respectively.results of operations.
Risks Related to Our Liquidity and Indebtedness
•Our business is leveraged, which could lead to greater losses than if we were not as leveraged.
•There can be no assurance that we will be able to obtain or utilizeaccess financing arrangements in the future on favorable terms, or at all, and such financing agreements provide lendersour compliance with greater rights inassociated restrictive covenants and the event of a lender or borrower bankruptcy, thepotential need for additional collateral may limit our ability to foreclose upon collateral in an eventfully pursue our business strategies.
•Any credit ratings assigned to our debt securities could be downgraded, which could have a material impact on our financial condition, liquidity and results of defaultoperations.
•We are subject to counterparty risk associated with our debt obligations and cross-default provisions to other financing agreements.cash balances.
•Our use of leverage may create a mismatch between the duration of financing, and the life of, the investments made using the proceeds of such financing.financing, as well as between the index of our investments and the index of our leverage.
•Our unsecured corporate bonds contain restrictive covenants thatWe have financed, and may limit our abilityin the future seek to expand or fully pursue our business strategies and the unsecured corporate bonds are subordinate to allfinance, certain of our secured indebtedness, which may affect our abilityshorter-term loans via CLOs and such transactions involve significant risks, including that the sponsor of such transactions will receive distributions from the CLO only if the CLO generates enough income to repayfirst pay all the bonds.investors in senior tranches and all CLO expenses.
•We cannot predict the effects of changes to, or the transition away from LIBOR on Ladder’s assets and liabilities.
Market Risks Related to Regulatory and Compliance MattersOur Investments
•Our subsidiaryWe cannot predict the effect that operatesgovernment policies, laws, and interventions adopted in response to the current inflationary environment or the impact of future changes in the U.S. political environment, including as a captive insurance company is subject to insurance lawsresult of 2024 elections, on our business and its outstanding borrowings are subject to the lending policies of the FHLB.markets in which we operate.
•MaintenanceWe have a concentration of investments in the real estate sector, and may have further concentrations from time to time in certain property types, locations, tenants and borrowers, which may increase our exemption from registration underexposure to the Investment Company Act imposes significant limits on our operations. Therisks of certain economic downturns, and the value of our securities, including our Class A common stock,which may be adversely affected if we are required to register as an investment company underby many factors beyond our control, including dislocations, illiquidity and volatility in the Investment Company Act.
•Certain of our entities may make loans to other of our entities on other-than-arms’-length terms.
•Certain of our officers and directors may be involved in other businesses related to themarket for commercial real estate, industry and potential conflicts of interests may arise if we invest in commercial real estate instruments or properties affiliated with such businesses.
Risks Related to Hedging
•We may enter into hedging transactions that could expose us to contingent liabilitiesfinance and the broader financial markets, shifts in the future, adversely impact our financial condition, be subject to mandatory clearing and/or margin requirementsconsumer patterns and not have a liquid secondary market.advances in communication and information technology, fluctuations in prevailing interest rates and credit spreads, prepayment rates on mortgage loans, civil unrest, acts of war and terrorism and outbreaks of communicable diseases, severe weather patterns and climate change.
Risks Related to Our Class A Common Stock
•Anti-takeover provisions in our charter documents and Delaware law could delay or prevent a change in control.
•Our charter contains REIT-related restrictions on the ownership of, and ability to transfer our Class A common stock.Portfolio
•The market price and trading volumerepayment of our Class A common stockmortgage loans may be volatilelimited by the application of federal, state and current stockholders may be diluted by future equity issuances.
Risks Relatedlocal law, including state, bankruptcy, insolvency and other debtor and tenant relief laws, the non-recourse and potentially illiquid nature of mortgage loans, our ability to Our Taxation asevaluate the credit-worthiness of borrowers and to diligence the underlying property, including environmental issues and the property’s ability to generate sufficient net income, our ability to manage credit risk and modify or restructure non-performing loans, the sufficiency of appropriate reserves, subordination, the lack of full control due to a REIT
•If we fail to qualify as a REIT, we will be subject to tax as a regular corporationparticipation or co-lender arrangement, and could face a substantial tax liability, which would reduce the amount of cash available for distribution to our shareholders.proper insurance coverage.
•Complying with REIT requirementsCertain balance sheet investments, such as transitional loans, mezzanine loans, B-Notes and other subordinate positions, participations and preferred equity may cause us to forgo otherwise attractive opportunities or liquidate otherwise attractive investments.be more illiquid and involve a greater risk of loss.
•REIT distribution requirements could adversely affect our abilityProvisions for loan losses are difficult to execute our business plan and we cannot assure you of our ability to pay distributions in the future.estimate. Our reserves for loan losses may prove inadequate.
•Even if we qualify as a REIT, we may face other tax liabilities that reduce our cash flow.
The risks described above should be read together with the text of the full risk factors below, in the section entitled “Risk Factors” in Part II, Item 1.A. and the other information set forth in this Annual Report, including the consolidated financial statements and the related notes, as well as in other documents that are filed with the SEC. The risks summarized above or described in full below are not the only risks that we face. Additional risks and uncertainties not precisely known to us, or that are currently determined to be immaterial, may also materially adversely affect our business, financial condition, results of operations and future growth prospects.
Risks Related to COVID-19
The novel coronavirus (COVID-19) pandemicInflation has had, and will continue to have for the foreseeable future, an adverse effect on our business, financial condition and results of operations, and we are unable to predict the full extent or nature of these impacts at this time.
As of the date hereof, there is an ongoing outbreak of a novel coronavirus, or COVID-19, which has spread to over 200 countries and territories, including the U.S., and to every state in the U.S. The World Health Organization has designated COVID-19 as a pandemic, and numerous countries, including the U.S., have declared national emergencies with respect to COVID-19. Public health officials have recommended and mandated precautions to mitigate the spread of COVID-19, including the closing of non-essential businesses, prohibitions on congregating in heavily populated areas and shelter-in-place orders or similar measures. As the COVID-19 pandemic continues, governments, businesses and other third parties will likely continue to implement or maintain restrictions or policies that adversely impact consumer spending, global capital markets, the global economy and stock prices.
The continued spread of COVID-19 globally has had, and is likely to continue to have for the foreseeable future, a material adverse effect on the global and U.S. economies as a whole, as well as on the states and cities where we own properties or have properties as collateral. A prolonged economic downturn could adversely and materially affect our business, results of operations and financial condition.
The COVID-19 pandemic is negatively impacting almost every industry, whether directly or indirectly. Businesses have been, continue to be or may periodically be, required by the local, state or federal authorities to cease or reduce operations, thereby preventing them from generating revenue. The extent of the effects will depend, in part, upon the breadth and duration of these economic shutdowns. The effects on commercial real estate have varied by sector and market. Some properties securing our loans to borrowers or owned by us, including hotels and certain retail properties, have experienced, or are likely to experience, material disruptions to their businesses from the end consumer and underlying property tenants. These disruptions could lead to or continue to cause a material decline in operating cash flows from these assets, and could impact our borrowers’ ability to pay debt service or property expenses or repay our loans to them at maturity or affect our ability to service our own borrowings secured by these loans or properties. Further, long-term structural changes may affect the value of certain businesses and properties. For example, restaurants have been required to reduce capacity and other businesses have moved to, and may continue remote work arrangements, which may reduce the demand for certain types of office space. Without the requirement to be close to the office, many cities have experienced a flight to local suburbs that has led to reduced multifamily rental occupancy.
In addition, it is possible that there could be a return of volatility to the credit markets, which may impact our ability to access capital on favorable terms, or at all. Our ability to execute on one or more of our business models, such as the origination of loans for securitization, may be adversely affected by the underlying economicstress property performance and credit market disruptions. In addition, the prolonged effects of the pandemic on credit markets, tenantsvalue and borrowers negatively affected, and may in the future negatively affect, the prices of securities that we hold, which resulted in, and may in the future result in, margin calls under our repurchase agreements. To the extent we are not able to satisfy such margin calls, it would result in a default under such repurchase agreements and could result in a default under our other debt instruments, including our senior secured credit agreement or the indentures governing our notes.
The COVID-19 crisis continues to create uncertainty regarding the valuation of commercial properties. Ongoing uncertainty or a significant drop in prices may affect the ability of our borrowers to refinance loans we have extended to them and/or may impact the value of real estate we own. In addition, if loans we have extended become impaired, we may be required to establish reserves against losses, which can impact our earnings and/or our liquidity. Further, lenders and landlords face challenges in enforcing contracts and instituting proceedings such as foreclosures and evictions as a result of moratoriums or restrictions imposed by federal, state or local laws and as a result of backlogs in, or closures of, courts as a result of COVID-19.
The ultimate extent of the COVID-19 pandemic and its impact on our business, global markets and overall economic activity still remain unknown and impossible to predict with certainty at this time.
Risks Related to Our Operations
We may not be able to hire and retain qualifiedthus mortgage loan originators or grow and maintain our relationships with key loan brokers, and if we are unable to do so, our ability to implement our business and growth strategies could be limited.
We depend on our loan originators to generate borrower clients by, among other things, developing relationships with commercial property owners, real estate agents and brokers, developers and others, which we believe leads to repeat and referral business. Accordingly, we must be able to attract, motivate and retain skilled loan originators. The market for loan
originators is highly competitive•Our participation in the market for mortgage loan securitizations may expose us to risks that could result in losses to us and our access to the CMBS securitization market and the timing of our securitization activities and real estate sales may leadgreatly affect our quarterly financial results.
•We may be subject to increased costsrisks associated with unfunded conditional loan commitments.
•Mortgages on facilities that are subject to hireground leases risk the collateral reverting to the ground lessor unexpectedly during the term of the loan due to such borrower’s default under, and retain them. We cannot guarantee that we will be able to attract or retain qualified loan originators. If we cannot attract, motivate or retain a sufficient numberthe resulting termination of, skilled loan originators, at a reasonable cost or at all,the ground lease.
•The expense of operating and owning real property, including net leased real estate assets, may impact our businesscash flow and our investments in net leased properties could be materially and adversely affected. We also dependaffected by our reliance on our network of loan brokers, who generate a significant portion of our loan originations. While we strive to cultivate long-standing relationships that generate repeat business for us, brokers are free to transact business with other lenders and have done so in the past and will do so in the future. Our competitors also have relationships with some of our brokers and actively compete with us in bidding on loans shopped by these brokers. We also cannot guarantee that we will be able to maintain or develop new relationships with additional brokers.
The allocation of capital among our business lines may vary, which may adversely affect our financial performance.
In executing our business plan, we regularly consider the allocation of capital to our various commercial real estate business lines, including commercial mortgage lending, investments in securities secured by first mortgage loans, and investments in selected net leased and diversified commercial real estate properties. tenants.
•The allocation of capital among such business lines may vary due to market conditions,leases at the expected relative return on equity of each activity, the judgment of our management team, the demand in the marketplace forproperties underlying commercial real estate loans or securities or the properties held by us may not be relet or renewed on favorable terms, or at all.
•Current and future venture investments could be adversely affected by our lack of sole decision-making authority, our reliance on venture partners’ financial condition and liquidity and disputes between us and our venture partners.
•Our investments in CMBS and other real estate-related securities and the availability of specific investment opportunities. We also consider the availability and cost ofare generally subject to losses.
•Any credit ratings assigned to our likely sources of capital. If we fail to appropriately allocate capital and resources across our business lines or fail to optimize our investment and capital raising opportunities,investments could be downgraded, which could have a material impact on our financial performancecondition, liquidity and results of operations.
•Our determinations of fair value may be adversely affected.have a material impact on our financial condition and results of operations.
We mayRisks Related to Our Indebtedness
•Our business is leveraged, which could lead to greater losses than if we were not be able to maintain our strategic business alliances.as leveraged.
We often rely on other third-party companies for assistance in origination, warehousing, distribution, servicing, securitization and other finance-related and loan-related activities. There can be no assurance that any of these strategic partners will continue their relationships with us in the future. Our ability to influence our partners may be limited and non-alignment of interests on various strategic decisions may adversely impact our business. Furthermore, strategic alliance partners may: (i) have economic or business interests or goals that are inconsistent with ours; (ii) take actions contrary to our policies or objectives; (iii) undergo a change of control; (iv) experience financial and other difficulties; or (v) be unable or unwilling to fulfill their obligations, which may affect our financial conditions or results of operations.
We operate according to specific underwriting criteria in a highly competitive market for lending and investment opportunities, both of which may limit our ability to originate or acquire desirable loans and investments in our target assets and/or our ability to yield a certain return on our investments.
Our management team uses financial models and underwriting criteria, the effectiveness of which cannot be guaranteed. We operate in a highly competitive market for lending and investment opportunities. A number of entities compete with us to make the types of loans and investments that we seek to make. Our profitability depends, in large part, on our ability to originate or acquire target assets at attractive prices. In originating or acquiring target assets, we compete with a variety of institutional lenders and investors and many other market participants, including specialty finance companies, REITs, commercial banks and thrift institutions, investment banks, insurance companies, hedge funds and other financial institutions. Many competitors are substantially larger and have considerably greater financial, technical, marketing and other resources than we do. Some competitors may have a lower cost of funds and access to funding sources that may not be available to us. Under our credit facilities, the lenders have the right to review the assets which we are seeking to finance and approve the purchase and financing of such assets in their sole discretion. Our underwriting criteria and lender approvals may restrict us from being able to compete with others for commercial mortgage loan origination and acquisition opportunities and these criteria may be stricter than those employed by our competitors. In addition, these underwriting criteria and approvals impose conditions and limitations on our ability to originate certain of our target assets, including, in particular, restrictions on our ability to originate junior mortgage loans, mezzanine loans and preferred equity investments.
Unlike Ladder, many of our competitors are not subject to the maintenance of an exemption from the Investment Company Act. Furthermore, competition for originations of, and investments in, our target assets may lead to the yield of such assets decreasing, which may further limit our ability to generate desired returns. Also, as a result of this competition, desirable loans and investments in specific types of target assets may be limited in the future and we may not be able to take advantage of attractive lending and investment opportunities from time to time. We can offer no assurance that we will be able to identifyaccess financing arrangements in the future on favorable terms, or at all, and originate loans or make any or allour compliance with associated restrictive covenants and the potential need for additional collateral may limit our ability to fully pursue our business strategies.
•Any credit ratings assigned to our debt securities could be downgraded, which could have a material impact on our financial condition, liquidity and results of operations.
•We are subject to counterparty risk associated with our debt obligations and cash balances.
•Our use of leverage may create a mismatch between the duration of financing, and the life of, the typesinvestments made using the proceeds of such financing, as well as between the index of our investments and the index of our leverage.
•We have financed, and may in the future seek to finance, certain of our shorter-term loans via CLOs and such transactions involve significant risks, including that are describedthe sponsor of such transactions will receive distributions from the CLO only if the CLO generates enough income to first pay all the investors in this Annual Report.senior tranches and all CLO expenses.
•We cannot predict the effects of the transition away from LIBOR on Ladder’s assets and liabilities.
Market Risks Related to Our Investments
We have a concentration of investments in the real estate sector, and may have further concentrations from time to time in certain property types, locations, tenants and borrowers, which may increase our exposure to the risks of certain economic downturns.
Wedownturns, and our borrowers operate in the commercial real estate sector. Such concentration in one economic sector may increase the volatility of our returns and may also expose us to the risk of economic downturns in this sector to a greater extent than if our portfolio also included other sectors of the economy. Declining real estate values may reduce the level of new mortgage and other real estate-related loan originations since borrowers often use appreciation in the value of their existing properties to support the purchase of or investment in additional properties. Borrowers may also be less able to pay principal and interest on our loans if the value of real estate weakens and/or the interest rates at which loans can be profitably made increases. Further, declining real estate values significantly increase the likelihood that we will incur losses on our loans in the event of default because the value of our collateral may be insufficient to cover our cost on the loan. Any sustained period of increased payment delinquencies, forbearance, foreclosures or losses could adversely affect both our net interest income from loans in our portfolio as well as our ability to originate/acquire/sell loans, which would materially and adversely affect our results of operations, financial condition, liquidity and business.
In addition, we are not required to observe specific diversification criteria relating to property types, locations, tenants or borrowers. A limited degree of diversification increases risk because the aggregate return of our business may be adversely affected by the unfavorable performance of a single property type, single tenant, single market or even a single investment. To the extent that our portfolio is concentrated in any one region or type of asset, downturns relating generally to such region or type of asset may result in defaults on a number of our assets within a short time period. Additionally, borrower concentration, in which a particular borrower is, or a group of related borrowers are, associated with multiple real properties securing mortgage loans or securities held by us, magnifies the risks presented by the possible poor performance of such borrower(s). Moreover, borrowers may be concentrated in individual asset classes that could impact their liquidity.
The value of our investments may be adversely affected by many factors that are beyond our control.
Income from, and the value of, our investments may be adversely affected by many factors that are beyond our control, including:
•volatilityincluding dislocations, illiquidity and adverse changes in international, national and local economic and market conditions, including contractions in market liquidity for mortgage loans and mortgage-related assets and tenant bankruptcies;
•changes in interest rates, credit spreads, prepayment rates andvolatility in the availability, costs and terms of financing;
•changes in rates of default or recovery rates;
•changes in generally accepted accounting principles;
•changes in governmental laws and regulations, fiscal policies and zoning and other ordinances and costs of compliance with laws and regulations;
•the impact of the Tax Cuts and Jobs Act of 2017 (“Tax Cuts and Jobs Act”) and/or estimates concerning the impact of the Tax Cuts and Jobs Act, which are subject to change based on further analysis and/or IRS guidance;
•downturns in the marketsmarket for mortgage-backed securities and other asset-backed and structured products, and commercial real estate;estate, commercial real estate finance and
•civil unrest, terrorism, acts of war, outbreaks of communicable diseases (including COVID-19), nuclear or radiological disasters and natural disasters, including earthquakes, hurricanes, tornadoes, tsunamis, floods, and other extreme weather and permanent climate changes, which may result in uninsured and underinsured losses.
Shifts the broader financial markets, shifts in consumer patterns and advances in communication and information technology, that affect the use of traditional retail, hotel and office space may have an adverse impact on the value of our debt and equity investments.
In recent periods, and accelerated by the restrictions and lockdowns associated with the COVID-19 pandemic, sales by online retailers such as Amazon have increased, and many retailers operating brick and mortar stores have made online sales a vital piece of their businesses. Some of our debt and equity investments involve exposure to the ongoing operations of brick and mortar retailers. Although many of the retailers operating in the properties underlying our debt and/or equity investments include pharmacies and/or sell groceries and other necessity-based soft goods or provide services, including entertainment and dining options, the shift to online shopping may cause declines in brick and mortar sales generated by certain of tenants at these properties and/or may cause certain of our tenants to reduce the size or number of their retail locations in the future.
Technology has also impacted the use of office space and the adaption of such technology has also been accelerated by the restrictions and lockdowns associated with the COVID-19 pandemic. The office market has seen a shift in the use of space due to the availability of practices such as telecommuting, videoconferencing and, prior to the pandemic, renting shared work spaces through platforms such as WeWork. These trends have led to more efficient workspace layouts and a decrease in square feet leased per employee. While the social distancing required as a result of COVID-19 may lead some tenants to require more space, at least in the short term, the continuing impact of technology could result in tenant downsizings upon renewal, or in tenants seeking office space outside of the typical central business district (“CBD”). These trends could continue to cause an increase in vacancy rates and a decrease in demand for new supply, and could impact the value of our debt and equity investments.
Technology platforms such as AirBnB and VRBO have provided leisure and business travelers with lodging options outside of the hotel industry. These services effectively have increased the supply of rooms available in many major markets. This additional supply could impact the occupancy rates and ADRs at more traditional hotels.
As a result of the foregoing, the value of our debt and equity investments, and results of operations could be adversely affected.
Our earnings may decrease because of changesfluctuations in prevailing interest rates or associated borrowing costs.
Our primary interest rate exposures relate to the yield on our assets and the financing cost of our debt, as well as the interest rate swaps that we utilize for hedging purposes. Interest rates are highly sensitive to many factors beyond our control, including but not limited to, governmental monetary and tax policies, and domestic and international economic and political considerations. Interest rate fluctuations present a variety of risks, including the risk of a mismatch between asset yields and borrowing rates, variances in the yield curve and fluctuatingcredit spreads, prepayment rates, and such fluctuations may adversely affect our income and may generate losses.
Demand for mortgages could be negatively impacted by rising interest rates and increases in the level of interest rates may (x) increase the credit risk of our assets by negatively impacting the ability of our borrowers to pay debt service on our floating rate loan assets or our ability to refinance our assets upon maturity and (y) negatively impact the value of the real estate supporting our investments (or that we own directly) through the impact such increases can have on property valuation capitalization rates. Continuing low interest rates could increase the vulnerability of the financial sector by lowering profits of financial intermediaries and potentially encouraging riskier investments and excess debt as these firms reach for yield.
For the risks regarding the transition away from LIBOR on our assets and liabilities, refer to “Risks Related to Our Indebtedness—We cannot predict the effect of changes to, or the transition away from, LIBOR on Ladder’s assets and liabilities,” below.
Prepayment rates on mortgage loans, cannot be predicted with certaintycivil unrest, acts of war and prepayments may result in losses to the valueterrorism and outbreaks of our assets.
The frequency at which prepayments (including voluntary prepayments by the borrowerscommunicable diseases, severe weather patterns and liquidations due to defaults and foreclosures) occur on our investments can adversely impact our business, and prepayment rates cannot be predicted with certainty, making it impossible to completely insulate us from prepayment or other such risks. Any adverse effects of prepayments may impact our portfolio in that particular investments, which may experience outright losses in an environment of faster actual or anticipated prepayments or may underperform relative to hedges that the management team may have constructed for such investments (resulting in a loss to our overall portfolio). Additionally, borrowers are more likely to prepay when the prevailing level of interest rates falls, thereby exposing us to the risk that the prepayment proceeds may be reinvested only at a lower interest rate than that borne by the prepaid obligation.
We are exposed to the risk of increased prepayments or defaults by any mortgage or security that we own at a premium. Any principal paydown diminishes the amount outstanding in these securities and reduces the yield to us. Before purchasing a security, we judge the likelihood of prepayment based on certain prepayment and default parameters and our own experience. Different estimates, judgments and assumptions reasonably could be used that would have a material effect on our judgment and, accordingly, result in losses to our business.
Risks Related to Our Portfolio
The vast majorityrepayment of the mortgage loans that we originate or purchase,may be limited by the application of federal, state and thoselocal law, including state, bankruptcy, insolvency and other debtor and tenant relief laws, the non-recourse and potentially illiquid nature of mortgage loans, our ability to evaluate the credit-worthiness of borrowers and to diligence the underlying the CMBS in which we invest, are non-recourse loansproperty, including environmental issues and the assets securingproperty’s ability to generate sufficient net income, our ability to manage credit risk and modify or restructure non-performing loans, the loans may not be sufficient to protect us from a partial or complete loss ifsufficiency of appropriate reserves, subordination, the borrower defaults on the loan.
Except for customary non-recourse carve-outs for certain actions and environmental liability, most commercial mortgage loans, including those underlying the CMBS in which we invest, are effectively non-recourse obligationslack of the sponsor and borrower, meaning that there is no recourse against the assets of the borrower or sponsor other than the underlying collateral. In the event of any default under a mortgage loan held directly by us, we will bear a risk of loss to the extent of any deficiency between the value of the collateral and the principal and accrued interest of the mortgage loan, which could have a material adverse effect on our cash flow from operations. Even if a mortgage loan is recourse to the borrower (or if a non-recourse carve-out to the borrower applies), in many cases, the borrower’s assets are limited primarily to its interest in the related mortgaged property. Further, although a mortgage loan may provide for limited recoursefull control due to a principalparticipation or affiliate of the related borrower, there is no assurance of any recovery from such principal or affiliate will be made or that such principal’s or affiliate’s assets would be sufficient to pay any otherwise recoverable claim. In the event of the bankruptcy of a borrower, the loan to such borrower is deemed to be secured only to the extent of the value of the underlying collateral at the time of bankruptcy (as determined by the bankruptcy court),co-lender arrangement, and the lien securing the loan will be subject to the avoidance powers of the bankruptcy trustee or debtor-in-possession to the extent the lien is unenforceable under state law.
The commercial mortgages and other commercial real estate-related loans, the commercial mortgage loans underlying the CMBS in which we may invest, and the real estate that we own are subject to the ability of the commercial property to generate net income (and not the independent income or assets of the borrower in the case of mortgage loans). The volatility of real property could have a material adverse effect on our business, financial position and results of operations.
The commercial mortgage loans and other commercial real estate-related loans, the commercial mortgage loans underlying the securities in which we may invest, and the real estate that we own are subject to the ability of the commercial property to generate net income (and not the independent income or assets of the borrower in the case of mortgage loans). Any reductions in net operating income (“NOI”) increase the risks of delinquency, foreclosure and default, which could result in losses to us. NOI of an income-producing property can be affected by many factors, including, but not limited to:
•the ongoing need for capital improvements, particularly in older structures;
•changes in operating expenses;
•changes in general or local market conditions;
•changes in tenant mix and performance, the occupancy or rental rates of the property or, for a property that requires new leasing activity, a failure to lease the property in accordance with the projected leasing schedule;
•competition from comparable property types or properties;
•unskilled or inexperienced property management;
•limited availability of mortgage funds or fluctuations in interest rates which may render the sale and refinancing of a property difficult;
•development projects that experience cost overruns or otherwise fail to perform as projected including, without limitation, failure to complete planned renovations, repairs, or construction;
•unanticipated increases in real estate taxes and other operating expenses;
•challenges to the borrower’s claim of title to the real property;
•environmental considerations, including liability for testing, monitoring and remediation;
•changes in zoning laws, rent control laws and other similar legal restrictions on property ownership and operation;
•other governmental rules and policies, including shut down orders related to COVID-19;
•community health issues, including, without limitation, epidemics and pandemics;
•unanticipated structural defects or costliness of maintaining the property;
•uninsured losses, such as possible acts of terrorism, social unrest or civil disturbances;
•a decline in the operational performance of a facility on the real property (such facilities may include multifamily rental facilities, office properties, retail facilities, hospitality facilities, healthcare-related facilities, industrial facilities, warehouse facilities, restaurants, mobile home facilities, recreational or resort facilities, arenas or stadiums, religious facilities, parking lot facilities or other facilities); and
•large-scale fire, earthquake or severe weather-related damage to the property and/or its operations.
Additional risks may be presented by the type and use of a particular commercial property, including specialized use as a nursing home or hospitality property.
In instances where the borrower is acting as a landlord on the underlying property, as we do for our selected net leased and other commercial real estate assets, the ability of such borrower to satisfy the debt obligation we hold will depend on the performance and financial health of the underlying tenants, which may be difficult for us to assess or predict. In addition, as the number of tenants with respect to a commercial property decreases or as tenant spaces on a property must be relet, the nonperformance risk of the loan related to such commercial property may increase. Any one or more of the preceding factors could materially impair our ability to recover principal in a foreclosure on the related loan as lender and repay the principal as borrower. A substantial portion of our portfolio may be committed to the origination or purchasing of commercial loans to small and medium-sized, privately owned businesses. Compared to larger, publicly owned firms, such companies generally have limited access to capital and higher funding costs, may be in a weaker financial position and may need more capital to expand or compete. The above financial challenges may make it difficult for such borrowers to make scheduled payments of interest or principal on their loans. Accordingly, advances made to such types of borrowers entail higher risks than advances made to companies who are able to access traditional credit sources.
A portion of our portfolio also may be committed to the origination or purchasing of commercial loans where the borrower is a business with a history of poor operating performance, based on our belief that we can realize value from a loan on the property despite such borrower’s performance history. However, if such borrower were to continue to perform poorly after the origination or purchase of such loan, including due to the above financial challenges, we could be adversely affected.
Our access to the CMBS securitization market and the timing of our securitization activities and other factors may greatly affect our quarterly financial results.
We expect to distribute certain of the first mortgage loans that we originate through securitizations and, in many circumstances, upon completion of a securitization, we will recognize certain non-interest revenues which will be included in total other income (loss) on our consolidated statements of income and cease to earn net interest income on the securitized loans. Our quarterly revenue, operating results and profitability have varied substantially from quarter to quarter based on the frequency, pricing, volume and timing of our securitizations. Our securitization activities will be affected by a number of factors, including our loan origination volumes, changes in loan values, quality and performance during the period such loans are on our books and conditions in the securitization and credit markets generally and at the time we seek to launch and complete our securitizations. Although due to changes resulting from the risk retention rules required by the Dodd-Frank Act described elsewhere in this Annual Report, Ladder may potentially be required to defer income over the life of the securitization, thereby reducing such volatility in earnings, as a result of these quarterly variations, quarter-to-quarter comparisons of our operating results may not provide an accurate comparison of our current period results of operations. If securities analysts or investors focus on such comparative quarter-to-quarter performance, our stock price performance may be more volatile than if such persons compared a wider period of results of operations.
Certain balance sheet investments, such as transitional loans, mezzanine loans, B-Notes and other subordinate positions, participations and preferred equity may be more illiquid and involve a greater risk of loss than long-term mortgage loans.loss.
We originate and acquire balance sheet loans that provide interim financing to borrowers seeking short-term capital for the acquisition or transition (for example, lease up and/or rehabilitation) of commercial real estate. Such a borrower under an interim loan often has identified a transitional asset that has been under-managed, is located in a recovering market and/or requires rehabilitation or capital improvements in order to improve the value of the asset. If the market in which the asset is located fails to recover according to the borrower’s projections, or if the borrower fails to improve the quality of the asset’s management and/or the value of the asset or fails to execute its business plan, the borrower may not receive a sufficient return on the asset to satisfy the interim loan, and we bear the risk that we may not recover some or all of our initial expenditure. In addition, borrowers often use the proceeds of a long-term mortgage loan to repay an interim loan. We may, therefore, be dependent on a borrower’s ability to obtain permanent financing to repay our interim loan, which could depend on the borrower’s ability to execute its business plan, market conditions and other factors.
Further, interim loans may be relatively less liquid than loans against stabilized properties due to their short life, their potential unsuitability for securitization, any unstabilized nature of the underlying real estate and the difficulty of recovery in the event of a borrower’s default. This lack of liquidity may significantly impede our ability to respond to adverse changes in the performance of our interim loan portfolio and may adversely affect the value of the portfolio.
Such “liquidity risk” may be difficult or impossible to hedge against and may also make it difficult to effect a sale of such assets as we may need or desire. As a result, if we are required to liquidate all or a portion of our interim loan portfolio quickly, we may realize significantly less than the value at which such investments were previously recorded, which may fail to maximize the value of the investments or result in a loss.
Our ability to collect upon mortgage loans may be limited by the application of state laws or as a result of moratoriums or restrictions imposed by federal, state or local laws or as a result of backlogs in, or closures of, courts due to COVID-19.
Each of our mortgage loans permits us to accelerate the debt upon default by the borrower. The courts of all states will enforce acceleration clauses in the event of a material payment default, subject in some cases to a right of the court to revoke such acceleration and reinstate the mortgage loan if a payment default is cured. The equity courts of any state, however, may refuse to allow the foreclosure of a mortgage, deed of trust, or other security instrument or to permit the acceleration of the indebtedness if the exercise of those remedies would be inequitable or unjust or if the circumstances would render the acceleration unconscionable. Thus, a court may refuse to permit foreclosure or acceleration if a default is deemed immaterial or the exercise of those remedies would be unjust or unconscionable or if a material default is cured. In addition, lenders and landlords face challenges in enforcing contracts and instituting proceedings such as foreclosures and evictions as a result of moratoriums or restrictions imposed by federal, state or local laws and as a result of backlogs in, or closures of, courts due to COVID-19. Further, our ability to collect the debt may be limited by bankruptcy, insolvency or other debtor relief laws, as described below.
The ability to collect upon mortgage loans may be limited by the application of U.S. federal and state laws. Several states (including California) have laws that prohibit more than one “judicial action” to enforce a mortgage obligation. Some courts have construed the term “judicial action” broadly. Jurisdictions with “one action,” “security first” and/or “antideficiency rules” may limit our ability or the ability of a special servicer of a CMBS issuance to foreclose on a real property or to realize on obligations secured by a real property. Further, payments on one or more of our loans, particularly a loan to a borrower in which we also hold equity interests, may be subject to claims of equitable subordination that would place our entitlement to repayment of the loan on an equal basis with holders of the borrower’s common equity only after all of the borrower’s obligations relating to its other debt and preferred securities has been satisfied.
The borrowers under the loans underlying our investments may be unable to repay their remaining principal balances on their stated maturity dates, which could negatively impact our business results.
Our mortgage loans may be non-amortizing or partially amortizing balloon loans that provide for substantial payments of principal due at their stated maturities. Balloon loans involve a greater risk to the lender than amortizing loans because a borrower’s ability to repay a balloon mortgage loan on its stated maturity date typically will depend upon its ability either to refinance the mortgage loan (although some loans such as those on condominium projects, may be at least partially self- liquidating) or to sell the mortgaged property at a price sufficient to permit repayment. A borrower’s ability to effect a refinancing or sale will be affected by a number of factors. We are not obligated to refinance any of these mortgage loans.
We may be required to make determinations of a borrower’s creditworthiness based on incomplete information or information that we cannot verify, which may cause us to purchase or originate loans that we otherwise would not have purchased or originated and, as a result, may negatively impact our business or reputation.
The commercial real estate lending business depends on the creditworthiness of borrowers and, to some extent, the sponsors thereof, which we must judge. In making such judgment, we will depend on information obtained from non-public sources and the borrowers in making many decisions related to our portfolio, and such information may be difficult to obtain or may be inaccurate. As a result, we may be required to make decisions based on incomplete information or information that is impossible or impracticable to verify. A determination as to the creditworthiness of a prospective borrower is based on a wide-range of information. Even if we are provided with full and accurate disclosure of all material information concerning a borrower, we may misinterpret or incorrectly analyze this information, which may cause us to purchase or originate loans that we otherwise would not have purchased or originated and, as a result, may negatively impact our business or the borrower could still defraud us after origination leading to a loss and negative publicity.
Third-party diligence reports on mortgaged properties and the properties we own are made as of a point in time and are therefore limited in scope.
Appraisals and engineering and environmental reports, as well as a variety of other third-party reports, are generally obtained with respect to each of the properties we acquire and the mortgaged properties underlying our investments at or about the time of origination. Appraisals are not guarantees of present or future value. One appraiser may reach a different conclusion than the conclusion that would be reached if a different appraiser were appraising that property. Moreover, the values of the properties may have fluctuated significantly since the appraisals were performed. In addition, any third-party report, including any engineering report, environmental report, site inspection or appraisal represents only the analysis of the individual consultant, engineer or inspector preparing such report at the time of such report, and may not reveal all necessary or desirable repairs, maintenance, remediation and capital improvement items.
The owners of, borrowers on, and tenants occupying, the properties which secure our investments may seek the protection afforded by bankruptcy, insolvency and other debtor relief laws, which may create potential for risk of loss to us.
Although commercial real estate lenders typically seek to reduce the risk of borrower bankruptcy through such items as non-recourse carveouts for bankruptcy and special purpose entity/separateness covenants and/or non-consolidation opinions for borrowing entities, the owners of, borrowers on, and tenants occupying, the properties which secure our investments may still seek the protection afforded by bankruptcy, insolvency and other debtor relief laws. One of the protections offered in such proceedings to each of these parties is a stay of legal proceedings, and a stay of enforcement proceedings against collateral for such loans or underlying such securities (including the properties and cash collateral). A stay of foreclosure proceedings could adversely affect our ability to realize on our loan collateral, and could adversely affect the value of those assets. Other protections in such proceedings to borrowers, owners and tenants include the restructuring or forgiveness of debt, the ability to create super priority liens in favor of certain creditors of the debtor, the potential loss of cash collateral held by the lender if the lender is over-collateralized, and certain well defined claims procedures. Additionally, the numerous risks inherent in the bankruptcy process create a potential risk of loss of our entire investment in any particular investment.
Insurance on the real estate underlying our loans and investments may not cover all losses, and this shortfall could result in both loss of cash flow from and a decrease in the asset value of the affected property.
The borrower, or we as property owner and/or originating lender, as the case may be, might not purchase enough or the proper types of insurance coverage to cover all losses. Further, there are certain types of losses, generally of a catastrophic nature, such as earthquakes, floods, hurricanes, pandemics, terrorism or acts of war or civil unrest that may be uninsurable or not economically insurable. Inflation, changes in building codes and ordinances, environmental considerations and other factors, including terrorism or acts of war, also might make the insurance proceeds insufficient to repair or replace a property if it is damaged or destroyed. Under such circumstances, the insurance proceeds received might not be adequate to restore our economic position with respect to the affected real property. Any uninsured loss could result in both loss of cash flow from and a decrease in the asset value of the affected property.
Provisions for loan losses are difficult to estimate. Our reserves for loan losses may prove inadequate, which could have a material adverse effect on us.
We maintain and regularly evaluate financial reserves to protect against potential future losses. Our reserves reflect management’s judgment of the probability and severity of losses. We cannot be certain that our judgment will prove to be correct and that reserves will be adequate over time to protect against potential future losses because of unanticipated adverse changes in the economy or events adversely affecting specific assets, borrowers, industries in which our borrowers operate or markets in which our borrowers or their properties are located. We must evaluate existing conditions on our debt investments to make determinations to record loan loss reserves on these specific investments. If our reserves for credit losses prove inadequate, we could suffer losses which would have a material adverse effect on our financial performance.
In June 2016, the Financial Accounting Standards Board (“FASB”) issued Accounting Standards Update (“ASU”) 2016-13 •Financial Instruments - Credit Losses - Measurement of Credit Losses on Financial Instruments (Topic 326) (“ASU 2016-13”)Inflation has and in April 2019, the FASB issued ASU 2019-04 Codification Improvementsmay continue to Topic 326, Financial Instruments-Credit Losses, Topic 815, Derivativesstress property performance and Hedging,value and Topic 825, Financial Instruments (“ASU 2019-04”) (collectively, the “CECL Standard”). These updates change how entities measure potential credit losses for most financial assets and certain other instruments that are not measured at fair value. The CECL Standard replaces the “incurred loss” approach under existing guidance with an “expected loss” model for instruments measured at amortized cost. The net carrying value of an asset under the CECL Standard is intended to represent the amount expected to be collected on such asset and requires entities to deduct allowances for potential losses onthus mortgage loan receivables held for investment, net and held-to-maturity debt securities. All assets subject to the CECL Standard, with few exceptions, are subject to these allowances rather than only those assets where a loss is deemed probable under the other-than-temporary impairment model. Accordingly, the adoption of the CECL Standard materially affected how we determine our allowance for credit losses and required us to increase our allowance and recognize provisions for loan losses earlier in the lending cycle. While ASU 2016-13 does not require any particular method for determining the CECL allowance, it does specify the allowance should be based on relevant information about past events, including historical loss experience, current portfolio and market conditions, and reasonable and supportable forecasts for the duration of each respective loan. Because our methodology for determining CECL allowances may differ from the methodologies employed by other companies, our CECL allowances may not be comparable with the CECL allowances reported by other companies.performance.
We continue to record asset-specific reserves consistent with our existing accounting policy. Our provision for asset-specific reserves are evaluated on a quarterly basis. The determination of our provision for asset-specific reserves requires us to make
certain estimates and judgments, which may be difficult to determine. Our estimates and judgments are based on a number of factors, including (1) whether cash from operations is sufficient to cover the debt service requirements currently and into the future, (2) the ability of the borrower to refinance the loan and (3) the property’s liquidation value, all of which remain uncertain and are subjective. In addition, we will now record a general reserve in accordance with the CECL Standard on the remainder of the loan portfolio (“CECL Reserve”). The CECL Standard is effective for fiscal years beginning after December 15, 2019 and was adopted through a cumulative-effect adjustment to retained earnings as of January 1, 2020. The CECL Standard may create more volatility in the level of our allowance for credit losses. If we are required to materially increase our level of allowance for credit losses for any reason, such increase could adversely affect our business, financial condition and results of operations.
Our investments in subordinate loans, subordinate participation interests in loans and subordinate CMBS rank junior to other senior debt and we may be unable to recover our investment in these interests.
We may originate or acquire subordinate loans (including mezzanine loans), subordinate participation interests in loans and subordinate rated and/or unrated CMBS (including, without limitation, certain “risk retention” interests required to be retained by certain participants in securitization transactions under rules which took effect in December 2016). In the event a borrower defaults on a loan and lacks sufficient assets to satisfy our loan, we may suffer a loss of principal or interest. In the event a borrower declares bankruptcy, we may not have full recourse to the assets of the borrower or a non-recourse carve-out guarantor, or the assets of the borrower or non-recourse carve-out guarantors may not be sufficient to satisfy the loan and our legal costs. In addition, certain of our loans may be subordinate to other debt of the borrower. If a borrower defaults on a subordinate loan to us or on debt senior to our loan, or in the event of a borrower bankruptcy, our loan will be satisfied only after the senior debt is paid in full. Where debt senior to our loan exists, the presence of intercreditor arrangements may limit our ability to amend loan documents, assign our loans, accept prepayments, exercise remedies and control decisions made in bankruptcy proceedings relating to borrowers.
If a borrower defaults on our mezzanine loan, subordinate loan or debt senior to any loan, or in the event of a borrower bankruptcy, our loan will be satisfied only after the senior debt is paid in full. As a result, we may not recover some or all of our initial expenditure. In addition, mezzanine and subordinate loans may have higher loan-to-value ratios than first mortgage loans, resulting in less equity in the property and increasing the risk of loss of principal. Significant losses related to our mezzanine loans or subordinate loans would result in operating losses for us.
In general, losses on a mortgaged property securing a mortgage loan included in a securitization will be borne first by the equity holder of the property, then by a cash reserve fund or letter of credit, if any, then by the holder of a mezzanine loan or B-Note, if any, then by the “first loss” subordinated security holder (generally, the “B-Piece” buyer and in some cases by the holder of a risk retention interest) and then by the holder of a higher-rated security. Even when we purchase very senior interests in loans and/or securitizations, in the event of default and the exhaustion of any equity support, reserve fund, letter of credit, mezzanine loans or B-Notes, and any classes of securities junior to those in which we may invest, we may not be able to recover all of our investment in the debt instruments or securities we purchased. In addition, if the underlying mortgage portfolio has been overvalued by the originator, or if the values subsequently decline and, as a result, less collateral is available to satisfy interest and principal payments due on the related mortgage-backed securities, the securities in which we may invest may effectively become the “first loss” position behind the more senior securities, which may result in significant losses to us. The prices of lower credit quality securities are generally less sensitive to interest rate changes than more highly rated investments, but more sensitive to adverse economic downturns or individual issuer developments. A projection of an economic downturn, for example, could cause a decline in the price of lower credit quality securities because the ability of obligors of mortgage loans underlying the mortgage-backed securities to make principal and interest payments may be impaired. In such event, existing credit support in the securitization structure may be insufficient to protect us against loss of our principal in these securities.
Our participation in the market for mortgage loan securitizations may expose us to risks that could result in losses to us.
We have generally participated inus and our access to the market for mortgage loan securitizations by contributing loans to securitizations led by various large financial institutions, leading single-asset securitizations on single mortgage loans we originated or leading multi-asset CLO transactions. We have completed one multi-asset CMBS securitization and three multi-asset CLO transactions where a Ladder affiliate served as issuer. To date, when we have primarily acted as a mortgage loan seller into, and occasionally as an issuer of, securitizations, we have been obligated to assume certain customary liabilities. Specifically, in connection with any particular securitization, we: (i) make certain representations and warranties regarding ourselvesmarket and the characteristics of, and origination process for, the mortgage loans that we contribute to the securitization; (ii) undertake to cure a defect of, repurchase or replace any mortgage loan that we contribute to the securitization that is affected by a material breach of any such representation or warranty or a material loan document deficiency; (iii) assume, either directly or through the indemnification of third-parties, potential securities law liabilities for disclosure to investors regarding ourselves and the mortgage loans that we
contribute to the securitization; and (iv) may, depending upon our role in the securitization, (a) retain some or all of the risk retention interests in the securitization and/or (b) retain responsibility for ensuring compliance with risk retention rules (and may be required to indemnify other participants in the securitization for any violation of such rules, including in circumstances where some or all of the risk retention interests are retained by and/or sold to other parties). When we lead a single-asset or multi-asset securitization as an issuer, we assume, either directly or through indemnification agreements, additional potential securities law liabilities and third-party liabilities beyond the liabilities we would assume when we act only as a mortgage loan seller into a securitization.
When we participate in a public securitization, certain Risk Retention Rules apply. The Risk Retention Rules generally require that either (i) a securitization’s sponsor retain, until the unpaid balance of the bonds or the loans is reduced by a certain amount, a 5% vertical interest in each class of securities issued, (ii) the sponsor or certain Third Party Purchasers retain, until the unpaid balance of the bonds or the loans is reduced by a certain amount (or for Third Party Purchasers, for at least five years), securities in an amount equal to 5% of the credit risk associated with the issued securities in the form of one or more subordinate tranches or (iii) a combination of (i) and (ii). The risk (with respect to CMBS) must be retained by the sponsor, certain mortgage loan originators and/or, upon satisfaction of certain requirements, a Third Party Purchaser. Significant restrictions exist, and additional restrictions may be added in the future, regarding who may hold risk retention interests, the structure of the entities that hold risk retention interests and when and how such risk retention interests may be transferred or financed. Therefore such risk retention interests will be generally illiquid and may not be easily financed. As a result of the Risk Retention Rules, we may be required to purchase and retain certain interests in a securitization into which we sell mortgage loans and/or when we act as issuer, may be required to sell certain interests in a securitization at prices below levels that such interests have historically yielded and/or may be required to enter into certain arrangements related to risk retention that we have not historically been required to enter into and, accordingly, the Risk Retention Rules may increase our potential liabilities and/or reduce our potential profits in connection with securitization of mortgage loans.
In addition, for public securitizations, there are requirements that the CEO of an issuer file with the SEC an individual certificate attesting to certain matters. The requirement that the CEO of an issuer of public securities file an individual certificate with the SEC may introduce additional potential liabilities whether we serve as issuer in a securitization or solely as a loan seller or loan originator. The CEO certification includes statements as to the absence of any untrue or omitted material information relating to the mortgage loans and the ability of the mortgage loans to support the payments required to be made under the bonds issued in connection with the securitization in accordance with their terms. The full extent of liability that the CEO may have to the SEC and/or investors on account of the certified statements is difficult to determine at this time. If we serve as issuer in a securitization, we would likely to be obligated to indemnify the CEOtiming of our issuer entity against any liabilities that such individualsecuritization activities and real estate sales may incur in connection with such certification. In addition, in securitization transactions in which we serve as only loan seller or an originator that sells loans to a loan seller (and not as an issuer), we would likely be obligated to provide a back-up officer’s certificate from a senior officer as togreatly affect our mortgage loans as support for the issuer’s CEO certification, and similarly be obligated to indemnify that senior officer against any liabilities that individual may incur in connection with his/her back-up officer’s certification.
The Risk Retention Rules, CEO certification and other rules and regulations that have been adopted or may be adopted in the future may alter the structure of securitizations and could pose additional risks to or reduce or eliminate the economic benefits of our participation in the securitization market.
We may sponsor, or purchase the most junior securities of collateralized loan obligations, or CLOs, and such instruments involve significant risks, including that these securities receive distributions from the CLO only if the CLO generates enough income to first pay all the investors holding senior tranches and all CLO expenses.
We have contributed shorter-term loans into CLO transactions in which we retained securities rated below-investment grade. In CLOs, investors purchase specific tranches, or slices, of debt instruments that are secured or backed by a pool of loans. The CLO debt classes have a specific seniority structure and priority of payments. The most junior securities of a CLO are generally retained by the sponsor of the CLO and are usually entitled to all of the income generated by the pool of loans after the payment of debt service on all the more senior classes of debt and the payment of all expenses. Defaults on the pool of loans therefore first affect the most junior tranches. The subordinate tranches of CLO debt may also experience a lower recovery and greater risk of loss, including risk of deferral or non-payment of interest than more senior tranches of the CLO debt because they bear the bulk of defaults from the loans held in the CLO and serve to protect the other, more senior tranches from default in all but the most severe circumstances. Often CLOs contain loans that are more transitional than loans contributed to conduit securitizations. Despite the protection provided by the subordinate tranches, even more senior CLO tranches can experience substantial losses due to actual defaults, increased sensitivity to defaults due to collateral default and disappearance of protecting tranches, decline in market value due to market anticipation of defaults and aversion to CLO securities as a class. Further, the transaction documents relating to the issuance of CLO securities may impose eligibility criteria on the assets of the CLO, restrict the ability of the CLO’s sponsor to trade investments and impose certain portfolio-wide asset quality requirements. Finally, the Risk Retention Rule imposes a retention requirement of 5% of the issued debt classes by the sponsor of the CLO (as described above). These criteria, restrictions and requirements may limit the ability of the CLO’s sponsor (or collateral manager) to maximize returns on the CLO securities.
In addition, CLOs are not actively traded and are relatively illiquid investments and volatility in CLO trading market may cause the value of these investments to decline. The market value of CLO securities may be affected by, among other things, changes in the market value of the underlying loans held by the CLO, changes in the distributions on the underlying loans, defaults and recoveries on the underlying loans, capital gains and losses on the underlying losses (or foreclosure assets), prepayments on underlying loan and the availability, prices and interest rate of underlying loans. Furthermore, the leveraged nature of each subordinated tranche may magnify the adverse impact on such class of changes in the value of the loans, changes in the distributions on the loans, defaults and recoveries on the loans, capital gains and losses on the loans (or foreclosure assets), prepayment on loans and availability, price and interest rates of the loans.
Because of the requirements of the Risk Retention Rule, if we purchase a horizontal subordinate strip of a CLO to satisfy the Risk Retention Rule, we would not be able to dispose of those subordinate interests during the required risk retention period, which may increase our risk of loss.
A CLO may include certain interest coverage tests, overcollateralization coverage tests or other tests that, if not met, may result in a change in the priority of distributions, which may result in the reduction or elimination of distributions to the subordinate debt and equity tranches until the tests have been met or certain senior classes of securities have been paid in full. Accordingly, if we hold subordinate debt interests in a CLO that contains such tests and such tests are not satisfied, we may experience a significant reduction in our cash flow from those interests.
Furthermore, if any CLO that we sponsor or hold interests in fails to meet certain tests relevant to the most senior debt issued and outstanding by the CLO issuer, an event of default may occur under that CLO. If that occurs, (i) if we were serving as manager of the CLO, our ability to manage the CLO may be terminated and (ii) our ability to attempt to cure any defaults in the CLO may be limited, which would increase the likelihood of a reduction or elimination of cash flow and returns to us in the CLOs for an indefinite time.
We may be subject to repurchases of loans or indemnification on loans and real estate that we have sold if certain representations or warranties in those sales are breached.risks associated with unfunded conditional loan commitments.
If loans that we sell or securitize do not comply with representations and warranties that we make about the loans, the borrowers, or the underlying properties, we may be required to repurchase such loans (including from a trust vehicle used to facilitate a structured financing of the assets through a securitization) or replace them with substitute loans. Additionally, in the case of loans and real estate that we have sold, we may be required to indemnify persons for losses or expenses incurred as a result of a breach of a representation or warranty. Repurchased loans typically will require a significant allocation of working capital to be carried on our books, and our ability to borrow against such assets may be limited. Any significant repurchases or indemnification payments could adversely affect our business and reputation.
If we purchase or originate loans secured by liensMortgages on facilities that are subject to a ground lease and suchleases risk the collateral reverting to the ground lease is terminatedlessor unexpectedly our interests could be adversely affected.
A ground lease is a lease of land, usually on a long-term basis, that does not include buildings or other improvements on the land. Normally any real property improvements made by the lessee during the term of the lease will revertloan due to such borrower’s default under, and the owner at the endresulting termination of, the lease term. We may purchase or originate loans secured by liens on facilities that are subject to a ground lease, and, if the ground lease were to terminate unexpectedly, due to the borrower’s default on such ground lease or otherwise, our business could be adversely affected.lease.
We are subject to additional risks associated with loan participations.
Some of our loans may be participation interests or co-lender arrangements in which we share the rights, obligations and benefits of the loan with other lenders. We may need the consent of these parties to exercise our rights under such loans, including rights with respect to amendment of loan documentation, enforcement proceedings in the event of default and the institution of, and control over, foreclosure proceedings. Similarly, a majority of the participants may be able to take actions to which we object but will be bound if our participation interest represents a minority interest. We may be adversely affected by such actions.
We have acquired and, in the future, may acquire net leased real estate assets, or make loans to owners of net leased real estate assets (including ourselves), which carry particular risks of loss that may have a material impact on our financial condition, liquidity and results of operations.
A substantial portion of our real estate investments we own are subject to net leases. A net lease requires the tenant to pay, in addition to the fixed rent, some or all of the property expenses that normally would be paid by the property owner. The value of our investments and the income from our investments in net leased properties, if any, will depend upon the ability of the applicable tenant to meet its obligations to maintain the property under the terms of the net lease. If a tenant fails or becomes unable to so maintain a property, the cash flow and/or the value of the property would be adversely affected. In addition, under many net leases the owner of the property retains certain obligations with respect to the property, including among other things, the responsibility for maintenance and repair of the property, to provide adequate parking, maintenance of common areas and compliance with other affirmative covenants in the lease. If we, as the owner, or the borrower, were to fail to meet these obligations, the applicable tenant could abate rent or terminate the applicable lease, which may result in a loss of capital invested in, and anticipated profits from, the property. In addition, we, as the owner, or the borrower may find it difficult to lease certain property to new tenants if that property had been suited to the particular needs of a former tenant.
The expense of operating and owning real property, including net leased real estate assets, may impact our cash flow from operations.and our investments in net leased properties could be adversely affected by our reliance on the net leased tenants.
We have inThe leases at the past and may in the future purchase or acquire via foreclosure real property. Costs associated withproperties underlying commercial real estate such as real estate taxes, insurance and maintenance costs, generally areloans or securities or the properties held by us may not reduced even when a property is not fully occupied, rental rates decreasebe relet or other circumstances cause a reduction in income from the property. Additionally, federal, state or local laws or regulations enacted due to COVID-19 may preclude property owners from enforcing certain contracts, such as lease guaranties, to some extent, or from instituting eviction proceedings with respect to certain tenants. As a result, cash flow from the operations of our properties may be reduced if a tenant does not pay its rent or we are unable to rent out propertiesrenewed on favorable terms. Under those circumstances, we might not be able to enforce our rights as landlord without delays and may incur substantial legal costs. Additionally, new properties that we may acquireterms, or redevelop may not produce significant revenue immediately, and the cash flow from existing operations may be insufficient to pay the operating expenses and principal and interest on debt associated with such properties until they are fully leased.
We invest in commercial properties subject to net leases, which could subject us to losses.
We invest in commercial properties subject to net leases. Typically, net leases require the tenants to pay substantially all of the operating costs associated with the properties. As a result, the value of, and income from, investments in commercial properties subject to net leases will depend, in part, upon the ability of the applicable tenant to meet its obligations to maintain the property under the terms of the net lease. If a tenant fails or becomes unable to so maintain a property, we will be subject to all risks associated with owning the underlying real estate. Under many net leases, however, the owner of the property retains certain obligations with respect to the property, including, among other things, the responsibility for maintenance and repair of the property, to provide adequate parking, maintenance of common areas and compliance with other affirmative covenants in the lease. If we were to fail to meet any such obligations, the applicable tenant could abate rent or terminate the applicable lease, which could result in a loss of our capital invested in, and anticipated profits from, the property.
The commercial properties subject to net leases in which we invest generally will be occupied by a single tenant and, therefore, the success of these investments will be materially dependent on the financial stability of each such tenant. A default of any such tenant on its lease payments to us would cause us to lose the revenue from the property and force us to find an alternative source of revenue to meet any mortgage payment and prevent a foreclosure if the property is subject to a mortgage. In the event of a default, we may experience delays in enforcing our rights as landlord and may incur substantial costs in protecting our investment and re-letting our property. If a lease is terminated, we may also incur significant losses to make the leased premises ready for another tenant and experience difficulty or a significant delay in re-leasing such property.
In addition, net leases typically have longer lease terms and, thus, there is an increased risk that contractual rental increases in future years will fail to result in fair market rental rates during those years.
Current and future joint venture investments could be adversely affected by our lack of sole decision-making authority, our reliance on joint venture partners’ financial condition and liquidity and disputes between us and our joint venture partners.
We have made and may in the future make investments through joint ventures. Such joint venture investments may involve risks not otherwise present when we originate or acquire investments without partners, including the following:
•we may not have exclusive control over the investment or the joint venture, which may prevent us from taking actions thatOur investments in CMBS and other real estate-related securities are in our best interest;generally subject to losses.
•joint venture agreements often restrict the transfer of a partner’s interest or may otherwise restrict our ability to sell the interest when we desire and/or on advantageous terms;
•any future joint venture agreements may contain buy-sell provisions pursuant to which one partner may initiate procedures requiring the other partner to choose between buying the other partner’s interest or selling its interest to that partner;
•we may not be in a position to exercise sole decision-making authority regarding the investment or joint venture, which could create the potential risk of creating impasses on decisions, such as with respect to acquisitions or dispositions;
•a partner may, at any time, have economic or business interests or goals that are, or that may become, inconsistent with our business interests or goals;
•a partner may be in a position to take action contrary to our instructions, requests, policies or objectives, including our policy with respect to maintaining our qualification as a REIT and our exclusion from registration under the Investment Company Act;
•a partner may fail to fund its share of required capital contributions or may become bankrupt, which may mean that we and any other remaining partners generally would remain liable for the joint venture’s liabilities;
•our relationships with our partners are contractual in nature and may be terminated or dissolved under the terms of the applicable joint venture agreements and, in such event, we may not continue to own or operate the interests or investments underlying such relationship or may need to purchase such interests or investments at a premium to the market price to continue ownership;
•disputes between us and a partner may result in litigation or arbitration that could increase our expenses and prevent our officers and directors from focusing their time and efforts on our business and could result in subjecting the investments owned by the joint venture to additional risk; or
•we may, in certain circumstances, be liable for the actions of a partner, and the activities of a partner could adversely affect our ability to continue to qualify as a REIT or maintain our exclusion from registration under the Investment Company Act, even though we do not control the joint venture.
Any of the above may subject us to liabilities in excess of those contemplated and adversely affect the value of our future joint venture investments.
The market value of our investments in CMBS could fluctuate materially as a result of various risks that are out of our control and may result in significant losses.
We currently invest in and may continue to invest in CMBS, a specific type of structured finance security. CMBS are securities backed by obligations (including certificates of participation in obligations) that are principally secured by commercial mortgage loans or interests therein having a multi-family or commercial use, such as retail space, office buildings, industrial or warehouse properties, hotels, nursing homes and senior living centers. Accordingly, investments in CMBS are subject to the various risks described herein which relate to the pool of underlying assets in which the CMBS represents an interest. The exercise of remedies and successful realization of liquidation proceeds relating to commercial mortgage loans underlying CMBS may be highly dependent on the performance of the servicer or special servicer. There may be a limited number of special servicers available, particularly those which do not have conflicts of interest. We will bear the risk of loss on any CMBS we purchase. Further, the insurance coverage for various types of losses is limited in amount and we would bear losses in excess of the applicable limitations.
We may attempt to underwrite our investments on a “loss-adjusted” basis, which projects a certain level of performance. However, there can be no assurance that this underwriting will accurately predict the timing or magnitude of such losses. To the extent that this underwriting has incorrectly anticipated the timing or magnitude of losses, our business may be adversely affected. Some mortgage loans underlying CMBS may default. Under such circumstances, cash flows of CMBS investments held by us may be adversely affected as any reduction in the mortgage payments or principal losses on liquidation of any mortgage loan may be applied to the class of CMBS relating to such defaulted loans that we hold.
The market value of our CMBS investments could fluctuate materially over time as the result of changes in mortgage spreads, treasury bond interest rates, capital market supply and demand factors, and many other factors that affect high-yield fixed income products. These factors are out of our control, and could influence our ability to obtain short-term financing on the CMBS. The CMBS in which we may invest may have no, or only a limited, trading market. In addition, we may invest in CMBS investments that are not rated by any credit rating agency, and such investments may be less liquid than CMBS that are rated. The financial markets in the past have experienced and could in the future experience a period of volatility and reduced liquidity which may reoccur or continue and reduce the market value of CMBS. Some or all of the CMBS that we hold may be subject to restrictions on transfer and may be considered illiquid.
Any credit ratings assigned to our investments could be downgraded, which could have a material impact on our financial condition, liquidity and results of operations.
Some of our investments may be rated by one or more of Moody’s, Fitch, Standard & Poor’s, Realpoint, Dominion Bond Rating Service, Morningstar Credit Ratings, Kroll Bond Ratings or other credit rating agencies. Any credit ratings on our investments are subject to ongoing evaluation by credit rating agencies, and we cannot be assured that any such ratings will not be changed or withdrawn by a credit rating agency in the future if, in its judgment, circumstances warrant. If credit rating agencies assign a lower-than-expected rating or reduce or withdraw, or indicate that they may reduce or withdraw, their ratings of our investments in the future, the value of these investments could significantly decline, which would adversely affect the value of our portfolio and could result in losses upon disposition or the failure of borrowers to satisfy their debt service obligations to us.
We could incur losses from investments in non-conforming and non-investment grade-rated loans or securities, which could have a material impact on our financial condition, liquidity and results of operations.
Some of our investments may not conform to conventional loan standards applied by traditional lenders and either may not be rated or may be rated as non-investment grade by the credit rating agencies. The non-investment grade ratings for these assets typically result from the overall leverage of the underlying loans, the lack of a strong operating history for the properties underlying the loans, the borrowers’ credit history, the properties’ underlying cash flow or other factors. As a result, these investments will have a higher risk of default and loss than investment grade-rated assets. Any loss that we incur may be significant. There may be no limits on the percentage of unrated or non-investment grade rated assets that we may hold in our portfolio.
Any investments in real-estate related equity or debt securities, including but not limited to those issued by REITs and real estate companies, are subject to the specific risks relating to the particular companies and to the general risks of investing in real estate-related securities, which may result in significant losses.
Subject to certain limits, we may make investments in real-estate related equity or debt securities, including but not limited to those issued by REITs and real estate companies. These investments involve special risks relating to the particular company, including its financial condition, liquidity, results of operations, financial obligations, business and prospects.
Some of our portfolio investments will be recorded at fair value and there is uncertainty as to the value of these investments. Furthermore, ourOur determinations of fair value may have a material impact on our financial condition and results of operations.
The value of some of our investments may not be readily determinable or may be unreliable. We will value these investments quarterly at fair value, as determined in accordance with Financial Accounting Standards Board (“FASB”) Accounting Standards Codification (Topic 820): Fair Value Measurement, or ASC 820. Because such valuations are subjective, the fair value of certain of our assets may fluctuate over short periods of time and our determinations of fair value may differ materially from the values that would have been used if a ready market for these assets existed. Our determinations of fair value may have a material impact on our earnings, in the case of impaired loans and other assets, trading securities and available-for-sale securities that are subject to other than temporary impairment (“OTTI”), or our accumulated other comprehensive income/(loss) in our shareholders’ equity, in the case of available-for-sale securities that are subject only to temporary impairments.
We utilize an internal model as our primary pricing source to develop prices for our CMBS and U.S. Agency Securities. To confirm our own valuations, we request prices for each of our CMBS and U.S. Agency Securities investments from third-party dealers and pricing services. Third parties that provide pricing services develop estimates of fair value for CMBS and U.S. Agency Securities employ various techniques, including discussion with their internal trading desks and the use of proprietary models and matrix pricing. We do not have access to, and are therefore not able to review in detail, the inputs used by these third parties in developing their fair value estimates. Furthermore, in general, dealers and pricing services heavily disclaim their valuations. Dealers may claim to furnish valuations only as an accommodation and without special compensation, and so they may disclaim any and all liability for any direct, incidental or consequential damages arising out of any inaccuracy or incompleteness in valuations, including any act of negligence or breach of any warranty. Depending on the complexity and illiquidity of an asset, valuations of the same asset can vary substantially from one dealer or pricing service to another. Additionally, our results of operations for a given period could be adversely affected if our determinations regarding the fair value of these investments were materially higher than the values that we ultimately realize upon their disposal.
Risks Related to Our Indebtedness
Our business is leveraged, which could lead to greater losses than if we were not as leveraged.
We do and, in the future, intend to use financial leverage in executing our business plan. Such borrowings may take the form of unsecured corporate debt, “financing facilities” such as bank credit facilities, credit facilities from government agencies (including the FHLB), repurchase agreements and warehouse lines of credit, which are secured revolving lines of credit that we utilize to warehouse portfolios or real estate instruments until we exit them through securitization. We do and, in the future, intend to enter into securitization and other long-term financing transactions to use the proceeds from such transactions to reduce the outstanding balances under these financing facilities. However, such agreements may include a recourse component. Further, any financing facilities that we currently have or may use in the future to finance our assets may require us to provide additional collateral or pay down debt if the market value of our assets pledged or sold to the provider of the credit facility or the repurchase agreement counterparty decline in value. In addition, a significant portion of our borrowings are based on floating interest rates, the fluctuation of which could adversely affect our business and results of operations. Our use of leverage in a market that moves adversely to our business interests could result in a substantial loss to us, which would be greater than if we were not leveraged.
Incurring debt subjects us to many risks that, if realized, would materially and adversely affect us, including the risk that:
•our cash flow from operations may be insufficient to make required payments of principal of and interest on the debt or we may fail to comply with all of the other covenants contained in the debt, which is likely to result in (i) acceleration of such debt (and any other debt containing a cross-default or cross-acceleration provision) that we may be unable to repay from internal funds or to refinance on favorable terms, or at all, (ii) our inability to borrow unused amounts under our financing arrangements, even if we are current in payments on borrowings under those arrangements and/or (iii) the loss of some or all of our assets to foreclosure or sale;
•our debt may increase our vulnerability to adverse economic and industry conditions, and investment yields may not increase with higher financing costs;
•we may be required to dedicate a substantial portion of our cash flow from operations to payments on our debt, thereby reducing funds available for operations, future business opportunities, stockholder distributions or other purposes; and
•we may not be able to refinance debt that matures prior to the investment it was used to finance on favorable terms, or at all.
We may incur substantial additional indebtedness in the future. Although the agreements governing our indebtedness do limit our ability to incur additional indebtedness, these restrictions are subject to a number of qualifications and exceptions and, under certain circumstances, debt incurred in compliance with these restrictions could be substantial. To the extent that we incur substantial additional indebtedness in the future, the risks associated with our substantial leverage described herein, including our inability to meet all of our debt service obligations, would be exacerbated.
There can be no assurance that we will be able to utilizeaccess financing arrangements in the future on favorable terms, or at all.
There is no assurance that we will be able to obtain, maintain or renewall, and our financing facilities on terms or advance rates favorable to us or at all. In order to borrow funds under a repurchase or warehouse agreement or other financing arrangement, the lender has the right to reviewcompliance with associated restrictive covenants and the potential assetsneed for which we are seeking financing and approve such asset in its sole discretion. Accordingly, we may be unable to obtain the consent of a lender to finance an investment and alternate sources of financing for such asset may not exist, especially during times of distress. In addition, even if we are able to obtain financing, any such borrowings may limit the length of time during which any given asset may be used as eligible collateral. Furthermore, any financing facility that we enter into will be subject to conditions and restrictive covenants relating to our operations, which may inhibit our ability to grow our business and increase revenues. To the extent we breach a covenant or cannot satisfy a condition, such facility may not be available to us, or may be required to be repaid in full or in part, which could limit our ability to pursue our business strategies. Further, lender consent may be required for the modification or restructuring of our loanadditional collateral which, if not obtained, may require us to repay our associated borrowing.
Additionally, if we are unable to securitize our loans to replenish a warehouse line of credit, we may be required to seek other forms of potentially less attractive financing or otherwise to liquidate our assets. Furthermore, some of our warehouse lines of credit contain cross-default provisions. If a default occurs under one of these warehouse lines of credit and the lenders terminate one or more of these agreements, we may need to enter into replacement agreements with different lenders. There can be no assurance that we will be successful in entering into such replacement agreements on the same terms as the terminated warehouse line of credit.
We may issue more unsecured corporate bonds in the future depending on the financing requirements of our business and market conditions. Our failure to maintain the credit ratings on our debt securities could negatively affect our ability to access capital and could increase our interest expense. The credit rating agencies periodically review our capital structure and the quality and stability of our earnings. Deterioration in our capital structure or the quality and stability of our earnings could result in a downgrade of the credit ratings on our Notes and other debt securities. Any negative ratings actions could constrain the capital available to us and could limit our access to funding for our operations. We are dependent upon our ability to access capital at rates and on terms we determine to be attractive. If our ability to access capital becomes constrained, our interest costs could increase, which could have material adverse effect on our results of operations, financial condition and cash flows.
The effective subordination of our Notes, or other similar debt securities that we may issue in the future, may limit our ability to meet all of our debt service obligations.
Our Notes are unsecured and unsubordinated obligations and rank equally in right of payment with each other and with all of our unsecured and unsubordinated indebtedness. However, our Notes are effectively subordinated in right of payment to all of our secured indebtedness to the extent of the value of the collateral securing such indebtedness. As of December 31, 2020, we had $2.3 billion of secured consolidated indebtedness outstanding. While the indentures governing our Notes limit our ability to incur secured indebtedness in the future, they do not prohibit us from incurring such indebtedness if we and our subsidiaries are in compliance with certain financial ratios and other requirements at the time of incurrence. In the event of a bankruptcy, liquidation, dissolution, reorganization, or similar proceeding with respect to us, the holders of any secured indebtedness will be entitled to proceed directly against the collateral that secures such indebtedness. Therefore, the collateral will not be available for satisfaction of any amounts owed under our unsecured indebtedness, including our Notes or similar debt securities that we may issue in the future, until such secured indebtedness is satisfied in full.
Our Notes are also effectively subordinated to all liabilities, whether secured or unsecured. In the event of a bankruptcy, liquidation, dissolution, reorganization, or similar proceeding with respect to any of our subsidiaries, we (as a common equity owner of such subsidiary), and therefore holders of our debt (including our Notes or similar debt securities that we may issue in the future), will be subject to the prior claims of such subsidiary’s creditors, including trade creditors and preferred equity holders. As of December 31, 2020, our subsidiaries had approximately $4.3 billion of indebtedness and other liabilities outstanding and no preferred equity.
The indentures governing our Notes contains restrictive covenants that may limit our ability to expand or fully pursue our business strategies.
The indentures governing our Notes contain financial and operating covenants that may limit our ability•Any credit ratings assigned to take specific actions, even if we believe them to be in our best interest and require us to, among other things, maintain at all times a specified ratio of indebtedness to equity and a certain level of unencumbered assets. These covenants may restrict our ability to expand or fully pursue our business strategies. Our ability to comply with these and other provisions of our debt agreements maysecurities could be affected by changes indowngraded, which could have a material impact on our operatingfinancial condition, liquidity and financial performance, changes in general businessresults of operations.
•We are subject to counterparty risk associated with our debt obligations and economic conditions, adverse regulatory developments, or other events.cash balances.
Our use of leverage may create a mismatch between the duration of financing, and the life of, the investments made using the proceeds of such financing.
We generally intend to structure our leverage such that we minimize the differences between the term of our investments and the leverage we use to finance such an investment. However, under certain circumstances, we may determine not to do so or we may be unable to do so. In the event that our leverage is for a shorter term than the financed investment, we may not be able to extend or find appropriate replacement leverage, which would have an adverse impact on our liquidity and our returns. In the event that our leverage is for a longer term than the financed investment, we may not be able to repay such leverage or replace the financed investment with an optimal substitute or at all, which would negatively impact our desired leveraged returns.
We generally attempt to structure our leverage such that we minimize the differencesfinancing, as well as between the index of our investments and the index of our leverage (i.e., financing floating rate investments with floating rate leverageleverage.
•We have financed, and fixed rate investments with fixed rate leverage). If such a product is not available to us from our lenders on reasonable terms, we may use hedging instruments to effectively create such a match. For example, in the case of future fixed rate investments, we mayseek to finance, such an investment with floating rate leverage, but effectively convert all or a portion of the attendant leverage to fixed rate using hedging strategies.
Our attempts to mitigate such risk are subject to factors outside our control, such as the availability of favorable financing and hedging options, which is subject to a variety of factors, of which duration and term-matching are only two. The risks of a duration mismatch are magnified by the potential for the extension of loans in order to maximize the likelihood and magnitude of their recovery value in the event the loans experience credit or performance challenges. Employment of this asset management practice would effectively extend the durationcertain of our investments, while our liabilities have set maturity dates.
Our useshorter-term loans via CLOs and such transactions involve significant risks, including that the sponsor of repurchase agreements to finance our securities and/or loans may give our lenders greater rights insuch transactions will receive distributions from the event that either we or a lender files for bankruptcy, including the right to repudiate our repurchase agreements, which could limit or delay our claims.
In the event of our insolvency or bankruptcy, certain repurchase agreements may qualify for special treatment under the U.S. Bankruptcy Code, the effect of which, among other things, would be to allow the lender under the applicable repurchase agreement to avoid the automatic stay provisions of the U.S. Bankruptcy Code, to foreclose on the collateral agreement without delay and to pursue claims for recourse against us. In the event of the insolvency or bankruptcy of a lender during the term of a repurchase agreement, the lender may be permitted under applicable insolvency laws to repudiate the contract, and our claim against the lender for damages may be treated simply as an unsecured claim. In addition,CLO only if the lender is a broker or dealer subjectCLO generates enough income to first pay all the Securities Investor Protection Act of 1970, or an insured depository institution subject to the Federal Deposit Insurance Act, our ability to exercise our rights to recover our securities under a repurchase agreement or to be compensated for any damages resulting from the lender’s insolvency may be further limited by those statutes. These claims would be subject to significant delayinvestors in senior tranches and if and when received, may be substantially less than the damages we actually incur. Therefore, our use of repurchase agreements to finance our portfolio assets exposes our pledged assets to risk in the event of a bankruptcy filing by either a lender or ourselves.all CLO expenses.
If a counterparty to our repurchase transactions defaults on its obligation to resell the underlying security and/or loans to us at the end of the transaction term, or if the value of the underlying security and/or loans has declined as of the end of that term, or if we default on our obligations under the repurchase agreement, we will lose money on our repurchase transactions.
When we engage in repurchase transactions, we generally sell securities and/or loans to lenders (i.e., repurchase agreement counterparties) in return for cash from the lenders. The lenders then are obligated to resell the same securities and/or loans to us at the end of the term of the transaction. In a repurchase agreement, the cash we receive from a lender when we initially sell the securities and/or loans to such lender is less than the value of the securities and/or loans sold. If the lender defaults on its obligation to resell the same securities and/or loans to us under the terms of a repurchase agreement, we will incur a loss on the transaction equal to the difference between the value of the securities and/or loans sold and the cash we received from the lender (assuming there was no change in the value of the securities and/or loans). We also would lose money on a repurchase transaction if the value of the underlying securities and/or loans has declined as of the end of the transaction term, as we would have to repurchase the securities and/or loans for their initial value but would receive securities and/or loans worth less than that amount. Further, if we default on one of our obligations under a repurchase transaction, the lender will be able to terminate the transaction and cease entering into any other repurchase transactions with us. Our repurchase agreements generally contain cross-default provisions, so that if a default occurs under any one agreement, the lenders under our other agreements also could declare a default. If a default occurs under any of our repurchase agreements and the lenders terminate one or more of their repurchase agreements, we may need to enter into replacement repurchase agreements with different lenders. There can be no assurance that we will be successful in entering into such replacement repurchase agreements on the same terms as the repurchase agreements that were terminated or at all. Any losses that we incur on our repurchase transactions could adversely affect our earnings.
We cannot predict the effecteffects of changes to, or the transition away from LIBOR on Ladder’s assets liabilities and results of operationsliabilities..
In a speech on July 27, 2017, Andrew Bailey, the Chief Executive of the Financial Conduct Authority for the United Kingdom (the “FCA”), which regulates LIBOR’s administrator, ICE Benchmark Administration Limited (the “IBA”), announced the FCA’s intention to cease sustaining LIBOR after 2021. On December 4, 2020, the IBA published a consultation on its intention to cease the publication of LIBOR settings. For the most commonly used tenors of U.S. dollar LIBOR (overnight and one, three, six and 12 months), the IBA is proposing to cease publication immediately after June 30, 2023, anticipating continued rate submissions from panel banks for these tenors of U.S. dollar LIBOR, and is proposing to cease publication of all other U.S. dollar LIBOR tenors, and of all non-U.S. dollar LIBOR rates, immediately after December 31, 2021. Although the foregoing may provide some sense of timing, there is no assurance that LIBOR, of any particular currency and tenor, will continue to be published or be representative of the market until any particular date.
The U.S. Federal Reserve, in conjunction with the Alternative Reference Rates Committee (“ARRC”), a steering committee comprised of large U.S. financial institutions, has identified the Secured Overnight Financing Rate, or SOFR, as its preferred alternative rate for LIBOR. Additionally, the Federal Reserve Board and U.S. bank regulators are encouraging banks to stop entering into contracts that use LIBOR as a reference rate as soon as practicable and in any event by December 31, 2021. At this time, there is considerable uncertainty regarding how markets will respond to SOFR or other replacement reference rates in connection with any transition away from LIBOR.
As of December 31, 2020, our assets included $1.9 billion of floating rate loans and $960.4 million of floating rate securities with interest rates tied to LIBOR. Additionally, we had $1.8 billion of floating rate debt with interest rates tied to LIBOR. We also use derivative instruments that reference LIBOR. Many of these assets and liabilities are likely to extend beyond the time that LIBOR may no longer be published or be representative of the market.
While our loan documents generally allow us, and our debt arrangements generally allow our lenders, to substitute a new index if the current index is no longer available and there has been recent guidance on the recommended timing and form of the transition away from LIBOR from regulators, agencies and industry working groups, there is still considerable uncertainty in the market regarding such transition. The uncertainty as to the nature of, and methodology for calculating and administering, any replacement reference rate, the uncertainty regarding interest rate calculations prior to the establishment of such replacement rate, whether the replacement rate will gain widespread market acceptance, whether any legislation and/or market conventions will develop to standardize fallback provisions or other contractual provisions in legacy contacts and whether these will conform to existing guidance and the potential need to amend existing documentation present additional risks. As such, the potential effect of any such event on our cost of capital and net investment income cannot yet be determined and any changes to benchmark interest rates could increase our financing costs or reduce our interest income, which could impact our results of operations, cash flows and the market value and liquidity of our investments. There could be a mismatch between the timing of the transition from LIBOR to a replacement rate between our investments and our financing, or a mismatch between the replacement rate used by our investments and our financing. Furthermore, the transition away from LIBOR may adversely impact our ability to manage and hedge exposures to changes in interest rates using derivative instruments. Changes or uncertainty resulting from the transition from LIBOR to a replacement rate could cause significant market dislocations and
disruptions that could adversely affect our business, increase the risk of litigation or other disputes, and increase transition-related expenses, among other adverse consequences.
While we can provide no assurances regarding the impact of the discontinuation of LIBOR, we continue to develop and implement plans to appropriately mitigate the risks associated with the expected discontinuation of LIBOR. Specifically, we (i) have implemented or are in the process of implementing fallback language for our LIBOR-based mortgage loans, bi-lateral committed repurchase facilities and revolving credit facility, including adjustments as applicable to maintain the anticipated economic terms of the existing contracts, (ii) continue to monitor the transition guidance provided by the ARRC, the International Swaps and Derivatives Association, Inc., the Financial Accounting Standards Board and other relevant regulators, agencies and industry working groups, and (iii) continue to engage with clients, lenders, market participants and other industry leaders as the transition from LIBOR progresses.
Risks Related to Regulatory and Compliance Matters
Anti-takeover provisions in our charter documents and Delaware law could delay or prevent a change in control.
Our amended and restated certificate of incorporation and amended and restated by-laws may delay or prevent a merger or acquisition that a shareholder may consider favorable by permitting our board of directors to issue one or more series of preferred stock, requiring advance notice for shareholder proposals and nominations, and placing limitations on convening shareholder meetings. In addition, we are subject to provisions of the Delaware General Corporate Law (the “DGCL”) that restrict certain business combinations with interested shareholders. These provisions may also discourage acquisition proposals or delay or prevent a change in control, which could harm our stock price.
Our subsidiary that operates as a captive insurance companysubsidiary is subject to insurance laws and its outstanding borrowings are subject to the lending policies of the FHLB.FHLB policies.
We maintain a captive insurance company to provide coverage previously self-insured by us, including nuclear, biological or chemical coverage, excess property coverage and excess errors and omissions coverage. The captive is regulated by the State of Michigan and is subject to regulations that cover all aspects of its business, including a requirement to maintain a certain minimum net capital. Violation of these regulations can result in revocation of its authorization to do business as a captive insurer or result in censures or fines. The captive could also be found to be in violation of the insurance laws of states other than Michigan (i.e., states where insureds are located), in which case, fines and penalties could apply from those states. Under certain circumstances, regulatory actions (such as new rulemakings) impacting the captive could result in limitations on the ability of the captive to borrow from the FHLB and thereby impact the FHLB’s availability as a source of financing for our operations.
Effective February 19, 2021, the captive is no longer permitted to initiate any new funding advances pursuant to the Federal Housing Finance Agency’s (“FHFA”) January 20, 2016 final rule amending its regulation of FHLB membership. Existing advances that mature after February 19, 2021 are permitted to remain in place until maturity of such advances. As a member, the captive is required to continue to hold shares of FHLB stock based on the amount of funds borrowed until its outstanding debt is repaid. Like any other investment, the captive’s participation in the FHLB involves some risk of loss and/or access to assets of the captive, both with respect to the shares of FHLB stock and the assets provided by the captive as collateral for its borrowings.
Tuebor’s outstanding advances from the FHLB as of December 31, 2020 were $288 million. FHLB advances amounted to 6.8% of the Company’s outstanding debt obligations as of December 31, 2020. The Company does not anticipate that the FHFA’s final regulation will materially impact its operations as it has multiple, diverse funding sources for financing its portfolio. Future moves to alternative funding sources could result in higher or lower advance rates from secured funding sources but also the incurrence of higher funding and operating costs than would have been incurred had FHLB funding continued to be available. In addition, the Company may find it more difficult to obtain committed secured funding for multiple year terms as it has been able to obtain from the FHLB. See “Management’s Discussion and Analysis of Financial Condition and Results of Operations-Liquidity and capital resources.”
Our officers and directors may be involved in other businesses related to the commercial real estate industry and potential conflicts of interests may arise if we invest in commercial real estate instruments or properties affiliated with such businesses.
Our officers or directors may be involved in other businesses related to the commercial real estate industry, and we may wish to invest in commercial real estate instruments or properties affiliated with such persons. Potential conflicts of interest may exist in such situations, and as a result, the benefits to our business of such investments may be limited. Although we do have a policy governing approval of certain related party transactions by the board of directors, we do not expressly prohibit our directors, officers, security holders or affiliates from having a direct or indirect pecuniary interest in any transaction in which we have an interest or engaging for their own account in business activities of the types that we conduct.
Certain of our entities may make loans to other of our entities on other-than-arms’-length terms.
Certain of our entities have in the past and may in the future make loans to other of our entities. Such loans may be madeentities on other-than-arms’-length terms, and as a result, we could be deemed to be subject to an inherent conflict of interest in the event that the interest rates and related fees of such loans differ from those rates and fees then available in the marketplace. We expect that such loans will not give rise to a conflict of interest because such loans generally will be made at rates, and subject to fees, lower than those available in the marketplace; however, we will attempt to resolve any conflicts of interest that arise in a fair and equitable manner.
Risks Related to Our Investment Company Act Exemption
Maintenance of our exemption from registration under the Investment Company Act imposes significant limits on our operations. The value of our securities, including our Class A common stock,
•Actual or perceived environmental, social and governance matters may be adversely affected if we are requiredcause additional costs, reputational harm or investors to register as an investment company under the Investment Company Act.
We intendcease allocating capital to conduct our operations so that neither we nor any of our subsidiaries (including any series thereof) are required to register as an investment company under the Investment Company Act.
If we or any of our subsidiaries (including any series thereof) fail to qualify for, and maintain an exemption from, registration under the Investment Company Act, or an exclusion from the definition of an investment company, we could, among other things, be required either to: (i) substantially change the manner in which we conduct our operations to avoid being required to register as an investment company; (ii) effect sales of our assets in a manner that, or at a time when, we would not otherwise choose to do so; or (iii) register as an investment company under the Investment Company Act, anyus, all of which could have an adverse effect on us, our financial results, the sustainability of our business model, the value of our securities (including the Notes) or our ability to satisfy our obligations in respect of the Notes.
If we or any of our subsidiaries (including any series thereof) were required to register as an investment company under the Investment Company Act, the registered entity would become subject to substantial regulation with respect to capital structure (including the ability to use leverage), management, operations, transactions with affiliated persons (as defined in the Investment Company Act), portfolio composition, including restrictions with respect to diversification and industry concentration, compliance with reporting, record keeping, voting, proxy disclosure and other rules and regulations that would significantly change its operations and we would not be able to conduct our business as described herein. For example, because affiliate transactions are generally prohibited under the Investment Company Act, we would not be able to enter into certain transactions with any of our affiliates if we are required to register as an investment company, which could have a material adverse effect on our ability to operate our business.
If we were required to register ourselves as an investment company but failed to do so, we would be prohibited from engaging inadversely affect our business and criminal and civil actions could be brought against us. In addition, our contracts would be unenforceable unless a court required enforcement, and a court could appoint a receiver to take controlresults of us and liquidate our business.
We believe we are not an investment company under Section 3(a)(1)(A) of the Investment Company Act because we do not engage primarily, or hold ourselves out as being engaged primarily, and do not propose to engage primarily, in the business of investing, reinvesting or trading in securities. However, under Section 3(a)(1)(C) of the Investment Company Act, because we are a holding company that will conduct its businesses primarily through majority-owned subsidiaries (including any series thereof), the securities issued by these subsidiaries (including any series thereof) that are excepted from the definition of “investment company” under Section 3(c)(1) or 3(c)(7) of the Investment Company Act, together with any other investment securities we may own, may not have a combined value in excess of 40% of the value of our adjusted total assets (exclusive of
government securities and cash items) on an unconsolidated basis (the “40% test”). This requirement limits the types of businesses in which we may engage through our subsidiaries (including any series thereof). In addition, the assets we and our subsidiaries (including any series thereof) may originate or acquire are limited by the provisions of the Investment Company Act and the rules and regulations promulgated thereunder, which may adversely affect our business.
We expect that certain of our subsidiaries (including any series thereof) may rely on the exclusion from the definition of “investment company” under the Investment Company Act pursuant to Section 3(c)(5)(C) of the Investment Company Act, which is available for entities “primarily engaged” in the business of “purchasing or otherwise acquiring mortgages and other liens on and interests in real estate.” This exclusion, as interpreted by the staff of the SEC, requires that an entity invest at least 55% of its assets in qualifying real estate assets and at least 80% of its assets in qualifying real estate assets and real estate-related assets. We expect each of our subsidiaries (including any series thereof) relying on Section 3(c)(5)(C) to rely on guidance published by the SEC staff or on our analyses of such guidance to determine which assets are qualifying real estate assets and real estate-related assets. However, the SEC’s guidance was issued in accordance with factual situations that may be substantially different from the factual situations we may face. We have not received, nor have we sought, a no-action letter from the SEC regarding how our investment strategy fits within the exclusions from the definition of an “investment company” under the Investment Company Act that we and our subsidiaries (including any series thereof) are relying on. No assurance can be given that the SEC staff will occur with the classification of each of our subsidiaries’ assets. The SEC staff may, in the future, issue further guidance that may require us to re-classify our assets for purposes of qualifying for an exclusion from the definition of an “investment company” under the Investment Company Act. If we are required to re-classify our assets, certain of our subsidiaries (including any series thereof) may no longer be in compliance with the exclusion from the definition of an “investment company” provided by Section 3(c)(5)(C) of the Investment Company Act, and, in turn, we may not satisfy the requirements to avoid falling within the definition of an “investment company” provided by Section 3(a)(1)(C). To the extent that the SEC staff publishes new or different guidance or disagrees with our analysis with respect to any assets of our subsidiaries we have determined to be qualifying real estate assets or real estate-related assets, we may be required to adjust our strategy accordingly. In addition, we may be limited in our ability to make certain investments and these limitations could result in a subsidiary holding assets we might wish to sell or selling assets we might wish to hold.
Any of the Company or our subsidiaries (including any series thereof) may rely on the exemption provided by Section 3(c)(6) of the Investment Company Act to the extent that they primarily engage, directly or through majority-owned subsidiaries (including any series thereof), in the businesses described in Sections 3(c)(3), 3(c)(4) and 3(c)(5) of the Investment Company Act. The SEC staff has issued little interpretive guidance with respect to Section 3(c)(6) and any guidance published by the staff could require us to adjust our strategy accordingly.
We determine whether an entity (including any series thereof) is one of our majority-owned subsidiaries. The Investment Company Act defines a majority-owned subsidiary of a person as a company 50% or more of the outstanding voting securities of which are owned by such person, or by another company which is a majority-owned subsidiary of such person. The Investment Company Act further defines voting securities as any security presently entitling the owner or holder thereof to vote for the election of directors of a company. We treat companies in which we own at least a majority of the outstanding voting securities as majority-owned subsidiaries for purposes of the 40% test. We have not requested the SEC to approve our treatment of any company as a majority-owned subsidiary and the SEC has not done so. If the SEC were to disagree with our treatment of one or more companies as majority-owned subsidiaries, we would need to adjust our strategy and our assets in order to continue to pass the 40% test. Any such adjustment in our strategy could have a material adverse effect on us.
There can be no assurance that the laws and regulations governing the Investment Company Act exemptions and exclusions described above will not change in a manner that adversely affects our operations, including the SEC or its staff providing more specific or different guidance regarding Section 3(c)(5)(C), including the nature of the assets that qualify for purposes of the exclusion and whether companies that are engaged in the business of acquiring mortgages and mortgage-related instruments should be regulated in a manner similar to investment companies. If we or our subsidiaries (including any series thereof) fail to maintain an exemption from registration under the Investment Company Act, we could, among other things, be required to: (i) change the manner in which we conduct our operations to avoid being required to register as an investment company; (ii) effect sales of our assets in a manner that, or at a time when, we would not otherwise choose to do so; or (iii) register as an investment company, any of which could negatively affect our financial results, the sustainability of our business model, or the value of our securities. In addition, if we or any of our subsidiaries were required to register as an investment company under the Investment Company Act, the registered entity would become subject to substantial regulation with respect to capital structure (including the ability to use leverage), management, operations, transactions with affiliated persons (as defined in the Investment Company Act), portfolio composition, including restrictions with respect to diversification and industry concentration, compliance with reporting, record keeping, voting, proxy disclosure and other rules and regulations that would significantly change our operations.
Risks Related to Hedging
We may enter into hedging transactions thatchoose to hedge our risks or not, and both choices could expose us to contingent liabilities in the future and adversely impact our financial condition.
Part of our strategy will involve entering into hedging transactions that could require us to fund cash payments in certain circumstances (such as the early termination of the hedging instrument caused by an event of default or other early termination event, or the decision by a counterparty to request margin transfers it is contractually owed under the terms of the hedging agreement). These potential payments will be contingent liabilities and therefore may not appear in our financial statements. The amount due would be equal to the unrealized loss of the open positions with the respective counterparty and could also include other fees and charges. These economic losses will be reflected in our results of operations, and our ability to fund these obligations will depend on the liquidity of our assets and access to capital at the time, and the need to fund these obligations could adversely impact our financial condition.
Our hedging activity will vary in scope based on the level and volatility of interest rates, the type of assets held, compliance with REIT rules, and other changing market conditions. Interest rate hedging may fail to protect or could adversely affect our business because, among other things:
•interest rate hedging can be expensive, particularly during periods of rising and volatile interest rates;
•available interest rate hedges may not correspond directly with the interest rate risk for which protection is sought;
•due to a credit loss or other factors, the duration of the hedge may not match the duration of the related liability;
•applicable law may require mandatory margining or clearing of certain interest rate hedges we may wish to use, which may raise costs;
•the credit quality of the hedging counterparty owing money on the hedgeHedging transactions may be downgraded to such an extent that it impairs our ability to sell or assign the hedging transaction;
•we may have to limit our use of hedging techniques that might otherwise be advantageous or to implement those hedges through a TRS to comply with REIT requirements, increasing the cost of our hedging activities because our TRSs would be subject to tax on gains and hedging-related losses in our TRSs will generally not provide any tax benefit, except for losses carried forward against future taxable income in the TRSs; and
•the hedging counterparty owing money in the hedging transaction may default on its obligation to pay.
In addition, we may fail to recalculate, readjust and execute hedges in an efficient manner.
Any hedging activity in which we engage may materially and adversely affect our results of operations and cash flows. Therefore, while we may enter into such transactions seeking to reduce interest rate risks, unanticipated changes in interest rates may result in poorer overall investment performance than if we had not engaged in any such hedging transactions. In addition, the degree of correlation between price movements of the instruments used in a hedging strategy and price movements in the portfolio positions or liabilities being hedged may vary materially. For a variety of reasons, we may not seek to establish a perfect correlation between such hedging instruments and the portfolio positions or liabilities being hedged. Any such imperfect correlation may prevent us from achieving the intended hedge and expose us to risk of loss.
A liquid secondary market may not exist for certain hedging instruments and they therefore may involve risks and costs that could result in material losses.
The enforceability of certain rights under agreements underlying certain hedging transactions may depend on compliance with applicable statutory and regulatory requirements under U.S. law and, depending on the identity of the counterparty, applicable international requirements. The business failure of a hedging counterparty will most likely result in its default, potentially resulting in the loss of (or delay in obtaining) unrealized profits and forcing us to cover our commitments, if any, at the then current market price. A liquid secondary market may not exist for these hedging instruments, and we may be required to maintain a position until exercise or expiration, which could result in material losses.
We may enter into hedging transactions that are subject to mandatory clearing and/or margin requirements.requirements and not have a liquid secondary market.
Part of our strategy will involve entering into hedging transactions that may be subject to mandatory clearing under the Dodd-Frank Act and relevant Commodity Futures Trading Commission (“CFTC”) regulations and therefore subject to associated margin requirements imposed by the applicable clearinghouse. The amount of margin we may be required to post on cleared transactions is subject to the rules of the relevant clearinghouse, which may provide the clearinghouse with discretion to increase those requirements. In addition, clearing intermediaries (e.g., futures commission merchants) who clear our trades with a clearinghouse may have contractual rights to increase the margin requirements above clearinghouse minimums.
With respect to uncleared swaps that could be needed to execute our hedging strategy, regulations that have been adopted in the U.S. (under the Dodd-Frank Act) impose mandatory margin requirements. Similar rules have been adopted in Europe and other jurisdictions where our dealer counterparties may be located. These rules impose obligations on many derivatives market participants to collect and post “variation margin” in connection with over-the-counter derivatives and, on a smaller group of market participants, to also collect and post “initial margin.” The overall impact on us depends on the impact on prices in the interdealer derivatives market (which may affect the pricing we can obtain from dealers) and whether one or both of these margin requirements apply to our derivatives counterparties when transacting with us. The rules began to go into effect in the interdealer market in September 2016 and variation margin requirements in the broader market went into effect in the U.S. in March 2017. Initial margin requirements are phasing in over several years. The rules are intended to provide that the margin requirements for parties subject to “initial margin” requirements are higher than the margin requirements for similar cleared derivatives. It is possible that, if and when these initial margin requirements are fully phased in, we could be subject to a requirement to post significantly more initial margin on uncleared swaps. If we become subject to these requirements, it could significantly increase the costs of engaging in uncleared swaps as part of our heading strategies.
Our ability to fund these obligations will depend on the liquidity of our assets and access to capital at the time, and the need to fund these obligations could adversely impact our financial condition. In addition, the failure to satisfy a margin call may result in the liquidation of all or a portion of the relevant hedge transactions.
Risks Related to Our Class A Common Stock
The market price and trading volume of our Class A common stock may be volatile, which could result in rapid and substantial losses for our shareholders.
The market price of our Class A common stock may be highly volatile and could be subject to wide fluctuations. In addition, the trading volume in our Class A common stock may fluctuate and cause significant price variations to occur. If the market price of our Class A common stock declines significantly, you may be unable to sell your Class A common stock at or above your purchase price, if at all. We cannot assure you that the market price of our Class A common stock will not fluctuate or decline significantly in the future. Some of the factors that could negatively affect the price of our Class A common stock or result in fluctuations in the price or trading volume of our Class A common stock include: variations in our quarterly operating results; failure to meet our earnings estimates; publication of research reports about us or the investment management industry or the failure of securities analysts to cover our Class A common stock after the offering; additions or departures of our executive officers and other key management personnel; adverse market reaction to any indebtedness we may incur or securities we may issue in the future; actions by shareholders; changes in market valuations of similar companies; speculation in the press or investment community; changes or proposed changes in laws or regulations or differing interpretations thereof affecting our business or enforcement of these laws and regulations, or announcements relating to these matters; adverse publicity; a credit rating downgrade; and general market, economic and world health conditions. In addition, our Board Authorization Policy, adopted by the board of directors on October 30, 2014, authorizes the Company to make up to $50.0 million in repurchases of our Class A common stock from time to time without further approval. The existence of this authorization and any repurchases pursuant thereto could affect our stock price and increase stock price volatility and could potentially reduce the market liquidity for our Class A common stock. Additionally, we are permitted to and could discontinue Class A common stock repurchases at any time and any such discontinuation could cause the market price of our Class A common stock to decline.
Our Class A common stock price may decline due to the large number of shares eligible for future sale and for exchange into Class A common stock, and current stockholders may be diluted by future equity issuances.
The market price of our Class A common stock could decline as a result of sales of a large number of shares of our Class A common stock, or the perception that such sales could occur. These sales, or the possibility that these sales may occur, also might make it more difficult for us to sell equity securities in the future at a time and price that we deem appropriate.
Our amended and restated certificate of incorporation authorizes us to issue additional shares of Class A common stock and options, rights, warrants and appreciation rights relating to Class A common stock for the consideration and on the terms and conditions established by our board of directors in its sole discretion. Future issuances of Class A common stock, including under our 2014 Omnibus Incentive Plan or other equity incentive plans that we may adopt in the future, will dilute existing stockholders. In accordance with the DGCL and the provisions of our certificate of incorporation, we may also issue preferred stock that has designations, preferences, rights, powers and duties that are different from, and may be senior to, those applicable to shares of Class A common stock. Similarly, the LLLP Agreement permits Series REIT and Series TRS to issue an unlimited number of additional Series Units with designations, preferences, rights, powers and duties that are different from, and may be senior to, those applicable to the Series Units, and which may be exchangeable for shares of our Class A common stock.
Our charter contains REIT-related restrictions on the ownership of, and ability to, transfer our Class A common stock.
•Anti-takeover provisions in our charter documents and Delaware law could delay or prevent a change in control.
Among other things, our charter provides that, subject to the exceptions and the constructive ownership rules described herein, no person may own, or be deemed to own, in excess
In addition, the charter prohibits (i) any person from transferring shares of Ladder Capital stock if such transfer would result in shares of Ladder capital stock being beneficially owned by fewer than 100 persons, and (ii) any person from beneficially or constructively owning shares of Ladder capital stock if such ownership would result in Ladder failing to qualify as a REIT.
These ownership limitations and transfer restrictions could have the effect of delaying, deferring or preventing a takeover or other transaction in which shareholders might receive a premium for their shares of Ladder Capital stock over the then prevailing market price or which shareholders might believe to be otherwise in their best interest.
Risks Related to Our Taxation as a REIT
We have limited experience operating a REIT and we cannot assure you that our past experience will be sufficient to successfully manage our business as a REIT.
We have limited experience operating a REIT. The REIT provisions of •the Code are complex, and any failure to comply with those provisions in a timely manner could prevent us or certain of our subsidiaries from qualifying as REITs or could force us to pay unexpected taxes and penalties. As a result, we cannot assure you that we will be able to successfully manage our business as a REIT, which would substantially reduce our earnings. In the event of a failure to qualify as a REIT, our net income could be reduced.
If we fail to qualify as a REIT, we will be subject to tax as a regular corporation and could face aincur substantial tax liability, which would reduce the amount of cash available for distribution to our shareholders.
We operate and intend to continue operating in a manner that will allow us to qualify asliability. As a REIT, for U.S. federal incomewe and our investors may still face other tax purposes commencing with our taxable year ending December 31, 2015. Although we have not requested and we do not intend to request a ruling from the IRS as to ourliabilities.
•Our REIT qualification in connection with various corporate initiatives we have received opinions from Skadden, Arps, Slate, Meagher & Flom LLP and Kirkland & Ellis LLP with respect to our qualification as a REIT. Investors should be aware, however, that opinions of counsel are not bindingdepends on the IRS or any court. The opinions of Skadden, Arps, Slate, Meagher & Flom LLP and Kirkland & Ellis LLP represent only the view of our counsel based on our counsel’s review and analysis of existing law and on certain representations as to factual matters and covenants made by us, including representations relating to the values of our assets and the sources of our income. The opinions were expressed as of the date issued and does not cover subsequent periods. Skadden, Arps, Slate, Meagher & Flom LLP and Kirkland & Ellis LLP have no obligation to advise us or the holders of our common stock of any subsequent change in the matters stated, represented or assumed, or of any subsequent change in applicable law. Furthermore, both the validity of the opinions of Skadden, Arps, Slate, Meagher & Flom LLP and Kirkland & Ellis LLP, and our qualification as a REIT depend on our satisfaction of certainmeeting asset, income, organizational, distribution, shareholder ownership and other requirements on a continuing basis, the results of which are not monitored by Skadden, Arps, Slate, Meagher & Flom LLPrequirements. Such compliance entails judgment and Kirkland & Ellis LLP. Our abilitymay cause us to satisfy the asset tests depends upon our analysis of the characterization and fair market values of our assets, some of which are not susceptible to a precise determination, and for which we will not obtain independent appraisals. Our compliance with the annual REIT income and quarterly asset requirements also depends upon our ability to successfully manage the composition of our income and assets on an ongoing basis. Moreover, the proper classification of an instrument as debtforgo or equity for U.S. federal income tax purposes may be uncertain in some circumstances, which could affect the application of the REIT qualification requirements as described below. Accordingly, there can be no assurance that the IRS will not contend that our interests in subsidiaries or in securities of other issuers will not cause a violation of the REIT requirements.liquidate attractive investments.
If we were to fail to qualify as a REIT in any taxable year, and we do not qualify for certain statutory relief provisions, we would be subject to U.S. federal income tax, including any applicable alternative minimum tax, on our taxable income at regular corporate rates, and dividends paid to our shareholders would not be deductible by us in computing our taxable income. Any resulting corporate tax liability could be substantial and would reduce the amount of cash available for distribution to our shareholders, which in turn could have an adverse impact on the value of our common stock. Unless we were entitled to relief under certain provisions of the Code, we also would be disqualified from taxation as a REIT for the four taxable years following the year in which we failed to qualify as a REIT.
Certain of our subsidiaries have also elected to be taxed as a REIT under the Code and are, therefore, subject to the same risks in the event that they fail to qualify as a REIT in any taxable year. If any of these subsidiaries were to fail to qualify as a REIT, then we might also fail to qualify as a REIT.
Our ownership of and relationship with TRSs is limited, and a failure to comply with the limits would jeopardize our REIT qualification, and our transactions with our TRSs may result in the application of a 100% excise tax if such transactions are not conducted on arm’s-length terms.
A REIT may own up to 100% of the stock of one or more TRSs. A TRS may earn income that would not be REIT-qualifying income if earned directly by a REIT. Both the subsidiary and the REIT must jointly elect to treat the subsidiary as a TRS. Overall, no more than 20% of the value of a REIT’s assets may consist of stock and securities of one or more TRSs. A domestic TRS will pay U.S. federal, state and local income tax at regular corporate rates on any income that it earns. In addition, the TRS rules impose a 100% excise tax on certain transactions between a TRS and its parent REIT that are not conducted on an arm’s-length basis.
We elected for certain of our subsidiaries to be treated as TRSs. Our TRSs will pay U.S. federal, state and local income tax on their consolidated taxable income, and their after-tax income will be available for distribution to us but will not be required to be distributed to us. We have structured the formation transactions such that the aggregate value of the TRS stock and securities owned by us will be less than 20% of the value of our total assets (including the TRS stock and securities). Furthermore, we will monitor the value of our investments in our TRSs to ensure compliance with the rule that no more than 20% of the value of our assets may consist of TRS stock and securities (which is applied at the end of each calendar quarter). In addition, we will scrutinize all of our transactions with TRSs to ensure that they are entered into on arm’s-length terms to avoid incurring the 100% excise tax described above. There can be no assurance, however, that we will be able to comply with the TRS limitations or to avoid application of the 100% excise tax discussed above.
REIT distribution requirements could adversely affect our ability to execute our business plan.
We generally must distribute annually at least 90% of our taxable income, subject to certain adjustments and excluding any net capital gain, in order for U.S. federal corporate income tax not to apply to earnings that we distribute. To the extent that we satisfy this distribution requirement, but distribute less than 100% of our taxable income, we will be subject to U.S. federal corporate income tax on our undistributed taxable income. In addition, we will be subject to a non-deductible 4% excise tax if the actual amount distributed to our shareholders in a calendar year is less than a minimum amount specified under U.S. federal tax laws. We intend to make distributions to our shareholders to comply with the REIT qualification requirements of the Code.
From time to time, we may generate taxable income greater than our income for financial reporting purposes prepared in accordance with GAAP, or differences in timing between the recognition of taxable income and the actual receipt of cash may occur. For example, if we purchase agency securities at a discount, we are generally required to include the discount in taxable income prior to receiving the cash proceeds of the accrued discount at maturity. Additionally, if we incur capital losses in excess of capital gains, such net capital losses are not allowed to reduce our taxable income for purposes of determining our distribution requirement. Such net capital losses may be carried forward for a period of up to five years and applied against future capital gains subject to the limitation of our ability to generate sufficient capital gains, which cannot be assured. If we do not have other funds available in these situations we could be required to borrow funds on unfavorable terms, sell investments at disadvantageous prices or distribute amounts that would otherwise be invested in future acquisitions to make distributions sufficient to maintain our qualification as a REIT, or avoid corporate income tax and the non-deductible 4% excise tax in a particular year. These alternatives could increase our costs or reduce our shareholders’ equity. Thus, compliance with the REIT requirements may hinder our ability to grow, which could adversely affect the value of our common stock.
We have not establishedguarantee a minimum distribution paymentpayout level, and we cannot assure you of our ability to pay distributions inspecify the future.
To maintain our qualification as a REIT and generally not be subject to U.S. federal income and excisedistribution method, or predict the resulting tax we intend to make regular quarterly cash distributions to our shareholders out of legally available funds therefor. Our intended dividend policy as a REIT will be to pay quarterly distributions either in cash or stock which, on an annual basis, will equal all or substantially all of our net taxable income. We have not, however, established a minimum distribution payment level and our ability to pay distributions may be adversely affected by a number of factors, including the risk factors described in this Annual Report. All distributions will be made at the discretion of our board of directors and will depend on our earnings, our financial condition, any debt covenants, maintenance of our REIT qualification, restrictions on making distributions under Delaware law and other factors as our board of directors may deem relevant from time to time. We may not be able to make distributions in the future and our board of directors may change our distribution policy in the future. We believe that a change in any one of the following factors, among others, could adversely affect our results of operations and impair our ability to pay distributions to our shareholders:
• the profitability of the assets we hold or acquire;
• the allocation of assets between our REIT-qualified and non-REIT-qualified subsidiaries.
• our ability to make profitable investments and to realize profit therefrom;
• margin calls or other expenses that may reduce our cash flow; and
• defaults in our asset portfolio or decreases in the value of our portfolio.
We cannot assure you that we will achieve results that will allow us to make a specified level of cash distributions or any increase in the level of such distributions in the future.
If we were to make a taxable distribution of shares of our stock, shareholders may be required to sell such shares or sell other assets owned by them in order to pay any tax imposed on such distribution.
We may distribute taxable dividends that are payable in shares of our common stock. If we were to make such a taxable distribution of shares of our stock, shareholders would be required to include the full amount of such distribution as income. As a result, a shareholder may be required to pay tax with respect to such dividends in excess of cash received. Accordingly, shareholders receiving a distribution of our shares may be required to sell shares received in such distribution or may be required to sell other stock or assets owned by them, at a time that may be disadvantageous, in order to satisfy any tax imposed on such distribution. If a shareholder sells the shares it receives as a dividend in order to pay such tax, the sale proceeds may be less than the amount included in income with respect to the dividend. Moreover, in the case of a taxable distribution of shares of our stock with respect to which any withholding tax is imposed on a non-U.S. shareholder, we may have to withhold or dispose of part of the shares in such distribution and use such withheld shares or the proceeds of such disposition to satisfy the withholding tax imposed. In addition, if a significant number of our shareholders determine to sell shares of our Class A common stock in order to pay taxes owed on dividends, it may put downward pressure on the trading price of our Class A common stock.
There are uncertainties relating to the estimate of our E&P Distribution paid on January 21, 2016.
To qualify for taxation as a REIT effective for the year ended December 31, 2015, we were required to distribute to our shareholders our undistributed accumulated earnings and profits attributable to taxable periods ending prior to January 1, 2015 (the “E&P Distribution”). To satisfy this requirement, on November 30, 2015, our board of directors approved the fourth quarter 2015 dividend of $0.46 per share of our Class A common stock.
We believe that the total value of the E&P Distribution was sufficient to fully distribute our accumulated earnings and profits. However, the amount of our undistributed accumulated earnings and profits is a complex factual and legal determination. We may have had less than complete information at the time we estimated our earnings and profits or may have interpreted the applicable law differently from the IRS. Substantial uncertainties exist relating to the computation of our undistributed accumulated earnings and profits, including the possibility that the IRS could, in auditing tax years through 2015, successfully assert that our taxable income should be increased, which could increase our pre-REIT accumulated earnings and profits. Thus, we may fail to satisfy the requirement that we distribute all of our pre-REIT accumulated earnings and profits by the close of our first taxable year as a REIT. Moreover, although there are procedures available to cure a failure to distribute all of our pre-REIT accumulated earnings and profits, we cannot now determine whether we will be able to take advantage of them or the economic impact to us of doing so.
Distributions payable by REITs do not qualify for the reduced tax rates available for some dividends.
The maximum tax rate applicable to income from “qualified dividends” payable to domestic shareholders that are individuals, trusts and estates is currently 20%. Distributions of ordinary income payable by REITs, however, generally are not eligible for these reduced rates. The more favorable rates applicable to regular corporate qualified dividends could cause investors who are individuals, trusts and estates to perceive investments in REITs to be relatively less attractive than investments in the stocks of non-REIT corporations that pay qualified dividends, which could adversely affect the value of the stock of REITs, including our common stock.
Even if we qualify as a REIT, we may face other tax liabilities that reduce our cash flow.
Even if we qualify for taxation as a REIT, we may be subject to certain U.S. federal, state and local taxes on our income and assets, including taxes on any undistributed income, taxes on income from some activities conducted as a result of a foreclosure, excise taxes, state or local income, property and transfer taxes, such as mortgage recording taxes, and other taxes. In addition, in order to meet the REIT qualification requirements, prevent the recognition of certain types of non-cash income, or to avert the imposition of a 100% tax that applies to certain gains derived by a REIT from dealer property or inventory, we intend to hold some of our assets through our TRSs or other subsidiary corporations that will be subject to corporate level income tax at regular corporate rates. In addition, if we lend money to a TRS, the TRS may be unable to deduct all or a portion of the interest paid to us, which could result in an even higher corporate level tax liability. Furthermore, the Code imposes a 100% excise tax on certain transactions between a TRS and a REIT that are not conducted on an arm’s length basis. We intend to structure any transaction with a TRS on terms that we believe are arm’s length to avoid incurring this 100% excise tax. There can be no assurances, however, that we will be able to avoid application of the 100% excise tax. The payment of any of these taxes would decrease cash available for distribution to our shareholders.
Moreover, the Company owns appreciated assets at the REIT level that it held before the effective date of its REIT election, January 1, 2015. If the Company disposes of any such appreciated assets during the five-year period following the Company’s qualification as a REIT, the Company will be subject to tax at the highest corporate tax rates on any gain from such assets to the extent of the excess of the fair market value of the assets at the time that the Company became a REIT over the adjusted tax basis of such assets on such date, which are referred to as built-in gains. The Company would be subject to this tax liability even if it qualifies and maintains its status as a REIT. Any recognized built-in gain will retain its character as ordinary income or capital gain and will be taken into account in determining REIT taxable income and the Company’s distribution requirement. Any tax on the recognized built-in gain will reduce REIT taxable income. The Company may choose not to sell in a taxable transaction appreciated assets it might otherwise sell during the five-year period in which the built-in gain tax applies in order to avoid the built-in gain tax. However, if the Company sells such assets in a taxable transaction, the amount of corporate tax that the Company will pay will vary depending on the actual amount of net built-in gain or loss present in those assets as of the time the Company became a REIT. The amount of tax could be significant.
Complying with REIT requirements may cause us to forgo otherwise attractive opportunities or liquidate otherwise attractive investments.
To qualify as REITs for U.S. federal income tax purposes, we and certain of our subsidiaries must continually satisfy tests concerning, among other things, the sources of our income, the nature and diversification of our assets, the amounts that we distribute to our shareholders and the ownership of our stock. We may be required to make distributions to shareholders at disadvantageous times or when we do not have funds readily available for distribution and may be unable to pursue investments that would be otherwise advantageous to us in order to satisfy the source-of-income or asset-diversification requirements for qualifying as a REIT. Thus, compliance with the REIT requirements may hinder our ability to make and, in certain cases, to maintain ownership of, certain attractive investments.
Further, to qualify as REITs, we must ensure that at the end of each calendar quarter, at least 75% of the value of our assets consists of cash, cash items, government securities and qualified real estate assets. The remainder of our investments in securities (other than government securities and qualified real estate assets) generally cannot include more than 10% of the outstanding voting securities of any one issuer or more than 10% of the total value of the outstanding securities of any one issuer. In addition, in general, no more than 5% of the value of our assets (other than government securities and qualified real estate assets) can consist of the securities of any one issuer, and no more than 20% of the value of our total assets can be represented by securities of one or more TRSs. If we fail to comply with these requirements at the end of any calendar quarter, we must correct the failure within 30 days after the end of the calendar quarter or qualify for certain statutory relief provisions to avoid losing our REIT qualification and suffering adverse tax consequences. As a result, we may be required to liquidate otherwise attractive investments from our investment portfolio. These actions could have the effect of reducing our income and amounts available for distribution to our shareholders.
The failure of assets subject to repurchase agreements to qualify as real estate assets could adversely affect our ability to qualify as a REIT.
We enter into certain financing arrangements that are structured as sale and repurchase agreements pursuant to which we nominally sell certain of our assets to a counterparty and simultaneously enter into an agreement to repurchase these assets at a later date in exchange for a purchase price. Economically, these agreements are financings that are secured by the assets sold pursuant thereto. We believe that we will be treated for REIT asset and income test purposes as the owner of the assets that are the subject of any such sale and repurchase agreement notwithstanding that such agreement may transfer record ownership of the assets to the counterparty during the term of the agreement. It is possible, however, that the IRS could assert that we did not own the assets during the term of the sale and repurchase agreement, in which case we could fail to qualify as a REIT.
Distributions to tax-exempt investors may be classified as unrelated business taxable income.
Neither ordinary nor capital gain distributions with respect to our Class A common stock nor gain from the sale of Class A common stock should generally constitute unrelated business taxable income to a tax-exempt investor. However, there are certain exceptions to this rule. In particular:
•part of the income and gain recognized by certain qualified employee pension trusts with respect to our common stock may be treated as unrelated business taxable income if shares of our Class A common stock are predominantly held by qualified employee pension trusts, and we are required to rely on a special look-through rule for purposes of meeting one of the REIT ownership tests, and we are not operated in a manner to avoid treatment of such income or gain as unrelated business taxable income;
•part of the income and gain recognized by a tax-exempt investor with respect to our Class A common stock would constitute unrelated business taxable income if the investor incurs debt in order to acquire the common stock;
•part or all of the income or gain recognized with respect to our Class A common stock by social clubs, voluntary employee benefit associations, supplemental unemployment benefit trusts and qualified group legal services plans which are exempt from U.S. federal income taxation under the Code may be treated as unrelated business taxable income; and
•to the extent that we have “excess inclusion income,” e.g., from: (i) us (or a part of us, or a disregarded subsidiary of ours) being treated as a “taxable mortgage pool”; (ii) us holding residual interests in a REMIC securitization; or (iii) us receiving income from another REIT that is treated as excess inclusion income, a portion of the distributions paid to a tax-exempt shareholder that is allocable to such excess inclusion income may be treated as unrelated business taxable income.
Liquidation of assets may jeopardize our REIT qualification or create additional tax liability for us.
To qualify as a REIT, we must comply with requirements regarding the composition of our assets and our sources of income. If we are compelled to liquidate our investments to repay obligations to our lenders, we may be unable to comply with these requirements, ultimately jeopardizing our qualification as a REIT, or we may be subject to a 100% tax on any resultant gain if we sell assets that are treated as dealer property or inventory.
We may be required to report taxable income for certain investments in excess of the economic income we ultimately realize from them.
We may acquire mortgage-backed securities in the secondary market for less than their face amount. In addition, pursuant to our ownership of certain mortgage-backed securities, we may be treated as holding certain debt instruments acquired in the secondary market for less than their face amount. The discount at which such securities or debt instruments are acquired may reflect doubts about their ultimate collectability rather than current market interest rates. The amount of such discount will nevertheless generally be treated as “market discount” for U.S. federal income tax purposes. Accrued market discount is reported as income when, and to the extent that, any payment of principal of the mortgage-backed security or debt instrument is made. If we collect less on the mortgage-backed security or debt instrument than our purchase price plus the market discount we had previously reported as income, we may not be able to benefit from any offsetting loss deductions. In addition, pursuant to our ownership of certain mortgage-backed securities, we may be treated as holding distressed debt investments that are subsequently modified by agreement with the borrower. If the amendments to the outstanding debt are “significant modifications” under applicable Treasury regulations, the modified debt may be considered to have been reissued to us at a gain in a debt-for-debt exchange with the borrower. In that event, we may be required to recognize taxable gain to the extent the principal amount of the modified debt exceeds our adjusted tax basis in the unmodified debt, even if the value of the debt or the payment expectations have not changed.
Moreover, some of the mortgage-backed securities that we acquire may have been issued with original issue discount. We are required to report such original issue discount based on a constant yield method and will be taxed based on the assumption that all future projected payments due on such mortgage-backed securities will be made. If such mortgage-backed securities turn out not to be fully collectible, an offsetting loss deduction will become available only in the later year that uncollectibility is provable.
Under the Tax Cuts and Jobs Act of 2017, we generally will be required to take certain amounts into income not later than the time such amounts are reflected on certain financial statements. The application of this rule may require the accrual of income with respect to certain debt instruments or mortgage-backed securities, such as original issue discount, earlier than would be the case under the previous tax rules, although the precise application of this rule is unclear at this time. This rule generally is effective for tax years beginning after December 31, 2017 or, for debt instruments or mortgage-backed securities issued with original issue discount, for tax years beginning after December 31, 2018.
Finally, in the event that mortgage-backed securities or any debt instruments we are treated as holding pursuant to our investments in mortgage-backed securities are delinquent as to mandatory principal and interest payments, we may nonetheless be required to continue to recognize the unpaid interest as taxable income as it accrues, despite doubt as to its ultimate collectability. Similarly, we may be required to accrue interest income with respect to subordinate mortgage-backed securities at the stated rate regardless of whether corresponding cash payments are received or are ultimately collectible. In each case, while we would in general ultimately have an offsetting loss deduction available to us when such interest was determined to be uncollectible, the utility of that deduction could depend on our having taxable income in that later year or thereafter.
Qualifying as a REIT involves highly technical and complex provisions of the Code.
Qualification as a REIT involves the application of highly technical and complex Code provisions for which only limited judicial and administrative authorities exist. Even a technical or inadvertent violation could jeopardize our REIT qualification. Our qualification as a REIT depends on our satisfaction of certain asset, income, organizational, distribution, shareholder ownership and other requirements on a continuing basis. In addition, our ability to satisfy the requirements to qualify as a REIT depends in part on the actions of third parties over which we have no control or only limited influence, including in cases where we own an equity interest in an entity that is classified as a partnership for U.S. federal income tax purposes.
The tax on prohibited transactions will limit our ability to engage in transactions, including certain methods of structuring mortgage-backed securities transactions (“MBS Transactions”), which would be treated as prohibited transactions for U.S. federal income tax purposes.
Net income that we derive from a prohibited transaction is subject to a 100% tax. The term “prohibited transaction” generally includes a sale or other disposition of property (including agency securities, but other than foreclosure property) that is held primarily for sale to customers in the ordinary course of a trade or business by us or by a borrower that has issued a shared appreciation mortgage or similar debt instrument to us. We could be subject to this tax if we were to dispose of or structure MBS Transactions in a manner that was treated as a prohibited transaction for U.S. federal income tax purposes. The 100% tax does not apply to gains from the sale of foreclosure property or property that is held through a TRS or other taxable corporation, as is the case with our securitization business, although such income will be subject to tax in the hands of the corporation at regular corporate rates.
We intend to conduct our operations at the REIT level so that no asset that we own (or are treated as owning) will be treated as, or as having been, held for sale to customers, and that a sale of any such asset will not be treated as having been in the ordinary course of our business. As a result, we may choose not to engage in certain transactions at the REIT level, and may limit the structures we utilize for our MBS Transactions, even though the sales or structures might otherwise be beneficial to us. In addition, whether property is held “primarily for sale to customers in the ordinary course of a trade or business” depends on the particular facts and circumstances. We intend to structure our activities to avoid prohibited transaction characterization but no assurance can be given that any property that we sell will not be treated as property held for sale to customers, or that we can comply with certain safe-harbor provisions of the Code that would prevent such treatment.
Our taxable income is calculated differently than net income based on U.S. GAAP.
Our taxable income may substantially differ from our net income based on U.S. GAAP. For example, interest income on our mortgage related securities does not necessarily accrue under an identical schedule for U.S. federal income tax purposes as for accounting purposes. Please see Note 16 to our consolidated financial statements for the year ended December 31, 2020 included elsewhere in this Annual Report.
Rapid changes in the values of our target assets may make it more difficult for us to maintain our qualification as a REIT.
If the fair market value or income potential of our assets declines as a result of increased interest rates, prepayment rates, general market conditions, government actions or other factors, we may need to increase our real estate assets and income or liquidate our non-REIT-qualifying assets to maintain our REIT qualification. If the decline in real estate asset values or income occurs quickly, this may be especially difficult to accomplish. We may have to make decisions that we otherwise would not make absent the REIT election.
The Company’s qualification as a REIT and exemption from U.S. federal income tax with respect to certain assets may be dependent on the accuracy of legal opinions or advice rendered or given or statements by the issuers of assets that the Company acquires, and the inaccuracy of any such opinions, advice or statements may adversely affect the Company’s REIT qualification and result in significant corporate-level tax.
When purchasing securities, the Company may rely on opinions or advice of counsel for the issuer of such securities, or statements made in related offering documents, for purposes of determining whether such securities represent debt or equity securities for U.S. federal income tax purposes, and also to what extent those securities constitute real estate assets for purposes of the REIT asset tests and produce income which qualifies for purposes of the REIT income tests. In addition, when purchasing the equity tranche of a securitization, the Company may rely on opinions or advice of counsel regarding the qualification of the securitization for exemption from U.S. corporate income tax and the qualification of interests in such securitization as debt for U.S. federal income tax purposes. The inaccuracy of any such opinions, advice or statements may adversely affect the Company’s REIT qualification and result in significant corporate-level tax.
Changes to U.S. federal income tax laws could materially and adversely affect us and our stockholders.
The present U.S. federal income tax treatment of REITs may be modified, possibly with retroactive effect, by legislative, judicial or administrative action at any time, which could affect the U.S. federal income tax treatment of an investment in our common equity. The U.S. federal income tax rules dealing with REITs constantly are under review by persons involved in the legislative process, the IRS and the U.S. Treasury Department, which results in statutory changes as well as frequent revisions to regulations and interpretations. The Tax Cuts and Jobs Act made substantial changes to the Code. Among those changes are a significant permanent reduction in the generally applicable corporate tax rate, changes in the taxation of individuals and other non-corporate taxpayers that generally but not universally reduce their taxes on a temporary basis subject to “sunset” provisions, the elimination or modification of various currently allowed deductions (including substantial limitations on the deductibility of interest and, in the case of individuals, the deduction for personal state and local taxes), certain additional limitations on the deduction of net operating losses, and preferential rates of taxation on most ordinary REIT dividends in comparison to other income recognized by such taxpayers. The effect of these, and the many other, changes made in the Tax Cuts and Jobs Act is highly uncertain, both in terms of their direct effect on the taxation of an investment in our common equity and their indirect effect on the value of our assets or market conditions generally. Furthermore, many of the provisions of the Tax Cuts and Jobs Act will require guidance through the issuance of Treasury regulations in order to assess their effect. There may be a substantial delay before such regulations are promulgated, increasing the uncertainty as to the ultimate effect of the statutory amendments on us. There may also be technical corrections legislation proposed with respect to the Tax Cuts and Jobs Act, the effect and timing of which cannot be predicted and may be adverse to us or our stockholders.shareholders.
General Risk Factors
•Our business model and changes to our investment, asset allocation and financing policies, may not be successful.
•Failure to maintain effective internal controls and the complexity of accounting and tax rules, characterized by significant judgment and assumptions, could materially affect the accuracy of our financial statements.
•Cybersecurity threats, security breaches and artificial intelligence (“AI”) could cause significant business disruption and possibly compromise sensitive information, damage our reputation, and subject us to regulatory scrutiny.
•Litigation and the inability to secure required business authorizations or licenses may adversely affect our business.
The risks described above should be read together with the text of the full risk factors below, in the section entitled “Risk Factors” in Part II, Item 1A. and the other information set forth in this Annual Report, including the consolidated financial statements and the related notes, as well as in other documents that are filed with the SEC. The risks summarized above or described in full below are not the only risks that we face. Additional risks and uncertainties not precisely known to us, or that are currently determined to be immaterial, may also materially adversely affect our business, financial condition, results of operations and future growth prospects.
Risks Related to Our Operations
We may not be able to hire and retain qualified loan originators or grow and maintain our relationships with key loan brokers, and if we are unable to do so, our ability to implement our business and growth strategies could be limited.
We depend on our loan originators to generate borrower clients by, among other things, developing relationships with commercial property owners, real estate agents and brokers, developers and others, which we believe leads to repeat and referral business. Accordingly, we must be able to attract, motivate and retain skilled loan originators. The market for loan originators is highly competitive and may lead to increased costs to hire and retain them. We cannot guarantee that we will be able to attract or retain qualified loan originators. If we cannot attract, motivate or retain a sufficient number of skilled loan originators, at a reasonable cost or at all, our business could be materially and adversely affected. We also depend on our network of loan brokers, who generate a significant portion of our loan originations. While we strive to cultivate long-standing relationships that generate repeat business for us, brokers are free to transact business with other lenders and have done so in the past and will do so in the future. Our competitors also have relationships with some of our brokers and actively compete with us in bidding on loans shopped by these brokers. We also cannot guarantee that we will be able to maintain or develop new relationships with additional brokers.
The allocation of capital among our business lines may vary, which may adversely affect our financial performance.
In executing our business plan, we regularly consider the allocation of capital to our various commercial real estate business lines, including commercial mortgage lending, investments in securities secured by first mortgage loans, and investments in selected net leased and diversified commercial real estate properties. The allocation of capital among such business lines may vary due to market conditions, the expected relative return on equity of each activity, the judgment of our management team, the demand in the marketplace for commercial real estate loans and securities and the availability of specific investment opportunities. We also consider the availability and cost of our likely sources of capital. If we fail to appropriately allocate capital and resources across our business lines or fail to optimize our investment and capital raising opportunities, our financial performance may be adversely affected.
We may not be able to maintain our strategic business alliances.
We often rely on other third-party companies for assistance in origination, warehousing, distribution, servicing, securitization and other finance-related and loan-related activities. There can be no assurance that any of these strategic partners will continue their relationships with us in the future. Our ability to influence our partners may be limited and non-alignment of interests on
various strategic decisions may adversely impact our business. Furthermore, strategic alliance partners may: (i) have economic or business interests or goals that are inconsistent with ours; (ii) take actions contrary to our policies or objectives; (iii) undergo a change of control; (iv) experience financial and other difficulties; or (v) be unable or unwilling to fulfill their obligations, which may affect our financial conditions or results of operations.
We operate using financial models and according to proprietary underwriting criteria in a highly competitive market for lending and other investment opportunities, which may limit our ability to originate or acquire desirable loans and other investments in our target assets and/or our ability to yield a certain return on our investments.
To evaluate our target assets, our management team uses financial models and underwriting criteria, the effectiveness of which cannot be guaranteed. Our profitability depends, in large part, on our ability to originate loans or acquire target assets at attractive prices that, in our judgment, meet our criteria according to the results of our modeling. However, we operate in a highly competitive market for lending and other investment opportunities. In originating or acquiring target assets, we compete with a variety of institutional lenders and investors and many other market participants, including specialty finance companies, REITs, commercial banks and thrift institutions, investment banks, insurance companies, hedge funds and other financial institutions. Many competitors are substantially larger and have considerably greater financial, technical, marketing and other resources than we do. Unlike Ladder, certain of our competitors may not be subject to the operating constraints associated with REIT tax compliance or maintenance of an exemption from registration under the Investment Company Act. Some competitors may have a lower cost of funds and access to funding sources that may not be available to us. Under our credit facilities, the lenders have the right to review the assets which we are seeking to finance and approve the purchase and financing of such assets in their sole discretion. Our underwriting criteria and lender approvals may restrict us from being able to compete with others for commercial mortgage loan origination and acquisition opportunities and these criteria may be stricter than those employed by our competitors. In addition, these underwriting criteria and approvals impose conditions and limitations on our ability to originate certain of our target assets, including, in particular, restrictions on our ability to originate junior mortgage loans, mezzanine loans and preferred equity investments. Furthermore, competition for originations of, and investments in, our target assets may lead to the yield of such assets decreasing, which may further limit our ability to generate desired returns.
Market Risks Related to Our Investments
We cannot predict the effect that government policies, laws, and interventions adopted in response to the current inflationary environment or the impact of future changes in the U.S. political environment, including as a result of 2024 elections, on our business and the markets in which we operate.
The U.S. Government and the Federal Reserve have taken significant actions in response to the inflationary environment in the U.S., creating a great deal of volatility in financial and mortgage markets. For example, the tightening of monetary policy to address inflationary concerns drove a rapid and significant increase in interest rates, which resulted in a decline in commercial real estate transactions and an increased risk of economic distress for commercial property owners. There can be no assurance as to how actions taken by the U.S. Government or the Federal Reserve will affect the long-term efficiency, liquidity and stability of the financial and mortgage markets or whether they will be successful in reducing inflation to acceptable levels without creating an economic recession.
Moreover, uncertainty with respect to the actions discussed above combined with uncertainty surrounding legislation, regulation and government policy at the federal, state and local levels, including as a result of 2024 elections, have introduced new and difficult-to-quantify macroeconomic and geopolitical risks with potentially far-reaching implications. There has been a corresponding increase in uncertainty with respect to interest rates, inflation, foreign exchange rates, trade volumes and trade, fiscal and monetary policy. New legislative, regulatory or policy changes could significantly impact our business and the markets in which we operate. To the extent changes in the political environment have a negative impact on the financial and mortgage markets, our business, results of operations, financial condition and ability to make distributions to our shareholders could be materially and adversely impacted.
Any further downgrade, or perceived potential downgrade, of the credit ratings of the U.S. and the failure to resolve issues related to U.S. fiscal and debt policies may materially adversely affect our business, liquidity, financial condition and results of operations. In August 2023, Fitch Ratings lowered its long-term sovereign credit rating of the U.S. from “AAA” to “AA+” due to concerns regarding the level and trajectory of federal debt and the erosion of governance, including on fiscal and debt matters and in November 2023, Moody’s Investors Service lowered its outlook on the U.S. government’s debt to “negative” from “stable” due to concerns regarding rising interest rates and political polarization in Congress. The impact of any further downgrades to the U.S. Government's sovereign credit rating or its perceived creditworthiness could adversely affect the U.S. and global financial markets and economic conditions and would likely impact the credit risk associated with some of the assets in our portfolio or those we may seek to acquire, including U.S. Treasury securities. A downgrade of the U.S. Government's
credit rating or a default by the U.S. Government to satisfy its debt obligations likely would create broader financial turmoil and uncertainty, which would weigh heavily on the global banking system and these developments could cause interest rates and borrowing costs to rise and a reduction in the availability of credit, which may negatively impact the value of the assets in our portfolio, our net income, liquidity and our ability to finance our assets on favorable terms.
We have a concentration of investments in the real estate sector and may have further concentrations from time to time in certain property types, locations, tenants and borrowers, which may increase our exposure to the risks of certain economic downturns.
We and our borrowers operate in the commercial real estate sector. Such concentration in one economic sector may increase the volatility of our returns and may also expose us to the risk of economic downturns in this sector to a greater extent than if our portfolio also included other sectors of the economy. Declining real estate values may reduce the level of new mortgage and other real estate-related loan originations since borrowers often use appreciation in the value of their existing properties to support the purchase of or investment in additional properties. Borrowers may also be less able to pay principal and interest on our loans if the value of real estate weakens and/or the interest rates at which loans can be profitably made increases. Further, declining real estate values significantly increase the likelihood that we will incur losses on our loans in the event of default because the value of our collateral may be insufficient to cover our basis in the related loan. Any sustained period of increased payment delinquencies, forbearance, foreclosures or losses could adversely affect both our net interest income from loans in our portfolio as well as our ability to originate/acquire/sell loans, which would materially and adversely affect our results of operations, financial condition, liquidity and business.
In addition, we are not required to observe specific diversification criteria relating to property types, locations, tenants or borrowers. A limited degree of diversification increases risk because the aggregate investment return of our business may be adversely affected by the unfavorable performance of a single property type, single tenant, single market or even a single investment. To the extent that our portfolio is concentrated in any one region or type of asset, downturns or weather events relating generally to such region or type of asset may result in defaults on a number of our assets within a short time period. Additionally, borrower concentration, in which a particular borrower is, or a group of related borrowers are, associated with multiple real properties securing mortgage loans or securities held by us, magnifies the risks presented by the possible poor performance of such borrower(s). Moreover, borrowers may be concentrated in individual asset classes that could impact their liquidity.
The value of our investments may be adversely affected by many factors that are beyond our control, including dislocations, illiquidity and volatility in the market for commercial real estate, commercial real estate finance and the broader financial markets.
Income from, and the value of, our investments may be adversely affected by many factors that are beyond our control, including:
•volatility and adverse changes in international, national and local economic and market conditions, including contractions in market liquidity for mortgage loans and mortgage-related assets and tenant bankruptcies;
•changes in interest rates, inflation, credit spreads, prepayment rates and in the availability, costs and terms of financing;
•changes in rates of default or recovery rates;
•changes in generally accepted accounting principles;
•changes in governmental laws and regulations, fiscal policies and zoning and other ordinances and costs of compliance with laws and regulations;
•downturns in the markets for mortgage-backed securities and other asset-backed and structured products, and commercial real estate;
•the broader impacts of the Ukraine-Russia and Hamas-Israel conflicts;
•civil unrest, terrorism, acts of war, outbreaks of communicable diseases, nuclear or radiological disasters and natural disasters, including earthquakes, hurricanes, tornadoes, tsunamis, floods, and other extreme weather and permanent climate changes, which may result in uninsured and underinsured losses; and
•in addition to the physical risks of climate change, transition risks such as changes in consumer preferences or additional legislative or regulatory requirements, including those associated with the transition to a low-carbon economy.
Any significant dislocations, illiquidity or volatility in the real estate and securitization markets, including the markets for CMBS and CLOs, as well as global financial markets and the economy generally, could adversely affect our business and financial results. We cannot assure you that dislocations in the commercial mortgage loan market will not occur in the future.
Challenging economic conditions affect the financial strength of many commercial, multifamily and other tenants and result in increased rent delinquencies and decreased occupancy. Economic challenges have in the past and may in the future lead to decreased occupancy, decreased rents or other declines in income from, or the value of, commercial, multifamily and manufactured housing community real estate.
Declining commercial real estate values, coupled with tighter underwriting standards for commercial real estate loans, may prevent commercial borrowers from refinancing their mortgages, which may result in increased delinquencies and defaults on commercial, multifamily and other mortgage loans. Declines in commercial real estate values also tend to result in reduced borrower equity, further hindering borrowers’ ability to refinance in an environment of increasingly restrictive lending standards and giving them less incentive to cure delinquencies and avoid foreclosure. The lack of refinancing opportunities has impacted and could impact in the future, in particular, mortgage loans that do not fully amortize and on which there is a substantial balloon payment due at maturity, because borrowers generally expect to refinance these types of loans on or prior to their maturity date. Finally, declining commercial real estate values would result in lower recoveries on foreclosure and an increase in losses above those that would have been realized had commercial property values remained the same or increased. Continuing defaults, delinquencies and losses would further decrease property values, thereby resulting in additional defaults by commercial mortgage borrowers, further credit constraints and further declines in property values.
We have only a limited ability to change our portfolio promptly in response to economic or other conditions. Certain significant expenditures, such as our debt service costs, real estate taxes, and operating and maintenance costs, are generally not reduced in unfavorable market conditions. These factors impede us from responding quickly to changes in the performance of our investments and could adversely impact our business, financial condition and results of operations.
Shifts in consumer patterns, remote work policies and advances in communication and information technology that affect the use of traditional retail, hotel and office space may have an adverse impact on the value of certain of our debt and equity investments.
In recent periods, sales by online retailers have increased, and many retailers operating brick and mortar stores have made online sales a vital piece of their business. Some of our debt and equity investments involve exposure to the ongoing operations of brick-and-mortar retailers. Although many of the retailers operating in the properties underlying our debt and/or equity investments include pharmacies and/or sell groceries and other necessity-based soft goods or provide services, including entertainment and dining options, the shift to online shopping may cause declines in brick-and-mortar sales generated by certain of tenants at these properties and/or may cause certain of our tenants to reduce the size or number of their retail locations in the future.
Technology and remote work policies, including hybrid schedules, have and will continue to impact the use of office space. The office market has seen a shift in the use of space due to the availability of practices such as telecommuting, videoconferencing and renting shared workspaces. These trends have led to more efficient workspace layouts and higher percentages of employees working remotely at least part of the week and, therefore, a decrease in leased office space. The continuing impact of technology and remote work policies could result in tenants utilizing less office space (including downsizing upon renewal), or in tenants seeking office space outside of the typical central business district. These trends could continue to cause an increase in vacancy rates and a decrease in demand for new supply, negatively impacting the value of our debt and equity investments.
Vacation rental platforms have provided leisure and business travelers with lodging options outside of the hotel industry. These services effectively have increased the supply of rooms available in many major markets. This additional supply could negatively impact the occupancy rates and pricing at more traditional hotels.
As a result of the foregoing, the value of certain of our debt and equity investments, and results of operations could be adversely affected.
Our earnings may decrease because of fluctuations in prevailing interest rates and credit spreads and associated borrowing costs.
During 2022 and 2023, the U.S. Federal Reserve raised its benchmark interest rates at the fastest pace since the 1980s. Our primary interest rate exposures relate to the yield on our floating rate assets and the financing cost of our floating rate debt, as well as the Treasury futures that we utilize for hedging purposes. Interest rates are highly sensitive to many factors beyond our control, including but not limited to, governmental monetary and tax policies, and domestic and international economic and political considerations. Interest rate fluctuations present a variety of risks and may adversely affect our income or generate losses. Such risks include a mismatch between asset yields and borrowing rates and variances in the yield curve and prepayment rates. Increased interest rates also impact borrowers’ ability to refinance their loans at maturity and while the interest payable on
the existing fixed rate debt on our real estate portfolio and corporate bonds becomes relatively cheaper with higher market interest rates, we may have to refinance this debt at higher rates at maturity.
Demand for mortgages has been negatively impacted by rising interest rates and increases in the level of interest rates: (i) increase the credit risk of our assets by negatively impacting the ability of our borrowers to pay debt service on our floating rate loan assets or our ability to refinance our assets upon maturity; (ii) negatively impact the value of the real estate supporting our investments (or that we own directly) through the impact such increases can have on property valuation capitalization rates; and/or (iii) cause our targeted assets that were issued, originated or acquired prior to an interest rate increase to experience a decline in their fair value or provide yields that are below prevailing market interest rates.
Prepayment rates on mortgage loans cannot be predicted with certainty and prepayments may result in losses to the value of our assets.
Prepayment rates on mortgage loans may be affected by a number of factors including, but not limited to, the then-current level of interest rates and credit spreads, fluctuations in asset values, the availability of mortgage credit, the relative economic vitality of the area in which the related properties are located, possible changes in tax laws, other opportunities for investment, and other economic, social, geographic, demographic, legal and other factors beyond our control. The frequency at which prepayments (including voluntary prepayments by the borrowers and liquidations due to defaults and foreclosures) occur on our investments can adversely impact our business, and prepayment rates cannot be predicted with certainty, making it impossible to completely insulate us from prepayment or other such risks. Any adverse effects of prepayments may impact our portfolio in those particular investments, which may experience outright losses in an environment of faster actual or anticipated prepayments, may underperform relative to hedges that the management team may have constructed for such investments (resulting in a loss to our overall portfolio). Additionally, in the event of declining interest rates, borrowers are more likely to prepay, thereby exposing us to the risk that the prepayment proceeds may be reinvested only at a lower interest rate than that borne by the prepaid obligation. In periods of increasing interest rates and/or credit spreads, prepayment rates on loans will generally decrease, which could impact our liquidity, or increase our potential exposure to loan non-performance.
We are exposed to the risk of increased prepayments or defaults by any mortgage or security that we own at a premium. Any principal paydown diminishes the amount outstanding in these securities and reduces the yield to us. Conversely, if we purchase assets at a discount to par value, when borrowers prepay their loans slower than expected, the decrease in corresponding prepayments on the mortgage-related securities may reduce the expected yield on such securities because we will not be able to accrete the related discount as quickly as originally anticipated. In addition, as a result of the risk of prepayment, the market value of the prepaid assets may benefit from declining interest rates less than other fixed income securities. Because our portfolio is comprised of both discount assets and premium assets, our portfolio may be adversely affected by changes in prepayments in any interest rate environment. Before purchasing a security, we judge the likelihood of prepayment based on certain prepayment and default parameters and our own experience. Different estimates, judgments and assumptions reasonably could be used that would have a material effect on our judgment and, accordingly, result in losses to our business.
Difficulty in redeploying the proceeds from repayments of our existing loans and securities investments may also cause our financial performance and returns to investors to suffer. As our loans and securities investments are repaid, we will have to redeploy the proceeds we receive into new loans and investments, repay borrowings under our credit facilities, pay dividends to our shareholders or repurchase outstanding shares of our class A common stock. It is possible that we will fail to identify reinvestment options that would provide returns or a risk profile that is comparable to the asset that was repaid. If we fail to redeploy the proceeds we receive from repayment of a loan or security in equivalent or better alternatives, our financial performance and returns to investors could suffer.
Risks Related to Our Portfolio
The vast majority of the mortgage loans that we originate or purchase, and those underlying the CMBS in which we invest, are non-recourse loans and our credit management and the assets securing the loans may not be sufficient to protect us from a partial or complete loss if the borrower defaults on the loan.
Despite our efforts to manage credit risk, there are many aspects of credit risk that we cannot control. Our credit policies and procedures may not be successful in limiting future delinquencies, defaults, foreclosures or losses, particularly in relation to declining economic conditions or significant market disruptions, or they may not be cost effective. Our underwriting process, due diligence efforts or hedging strategies, if any, may not be effective or sufficient. Loan servicing companies or our operating partners may not cooperate with our loss mitigation efforts, or those efforts may be ineffective. Service providers to securitizations, such as trustees, loan servicers, bond insurance providers, and custodians, as well as our operating partners and
their property managers, may not perform in a manner that promotes our interests. Delay of foreclosures could delay resolution and increase ultimate loss severities, as a result.
Except for customary non-recourse carve-outs for certain actions and environmental liability, most commercial mortgage loans, including those underlying the CMBS in which we invest, are effectively non-recourse obligations of the sponsor and borrower, meaning that there is no recourse against the assets of the borrower or sponsor other than the underlying collateral. In the event of any default under a mortgage loan held directly by us, we will bear a risk of loss to the extent of any deficiency between the value of the collateral and the principal and accrued interest of the mortgage loan, which could have a material adverse effect on our cash flow from operations. Even if a mortgage loan is recourse to the borrower (or if a non-recourse carve-out to the borrower applies), in many cases, the borrower’s assets are limited primarily to its interest in the related mortgaged property. Further, although a mortgage loan may provide for limited recourse to a principal or affiliate of the related borrower (e.g., a specific guaranty relating to completion, carry, interest rate caps, reserve replenishments or payment), there is no assurance that any recovery from such principal or affiliate will be made or that such principal’s or affiliate’s assets would be sufficient to pay any otherwise recoverable claim. In the event of the bankruptcy of a borrower, the loan to such borrower is deemed to be secured only to the extent of the value of the underlying collateral at the time of bankruptcy (as determined by the bankruptcy court), and the lien securing the loan will be subject to the avoidance powers of the bankruptcy trustee or debtor-in-possession to the extent the lien is unenforceable under state law.
The commercial real estate mortgages and other commercial real estate-related loans we provide, the commercial mortgage loans underlying the CMBS in which we may invest, and the real estate that we own are subject to the ability of the commercial property to generate net income.
The commercial real estate mortgage loans and other commercial real estate-related loans we provide, the commercial mortgage loans underlying the securities in which we may invest, and the real estate that we own are subject to the ability of the commercial property to generate net income (and not the independent income or assets of the borrower in the case of mortgage loans). Any reductions in net operating income (“NOI”) increase the risks of delinquency, foreclosure and default, which could result in losses to us. NOI of an income-producing property can be affected by many factors, including, but not limited to:
•the ongoing need for capital improvements, particularly in older structures;
•changes in operating expenses;
•changes in general or local market conditions;
•changes in tenant mix and performance, the occupancy or rental rates of the property or, for a property that requires new leasing activity, a failure to lease the property in accordance with the projected leasing schedule;
•competition from comparable property types or properties;
•unskilled or inexperienced property management;
•limited availability of mortgage funds or fluctuations in interest rates which may render the sale and refinancing of a property difficult;
•development projects that experience cost overruns or otherwise fail to perform as projected including, without limitation, failure to complete planned renovations, repairs, or construction;
•unanticipated increases in real estate taxes and other operating expenses;
•challenges to the borrower’s claim of title to the real property;
•environmental considerations, including liability for testing, monitoring and remediation;
•changes in zoning laws, rent control laws and other similar legal restrictions on property ownership and operation;
•other governmental rules and policies including those associated with a transition to a low-carbon economy;
•community health issues, including, without limitation, epidemics and pandemics;
•unanticipated structural defects or costliness of maintaining the property;
•uninsured or underinsured losses, such as possible acts of theft, terrorism, social unrest or civil disturbances;
•a decline in the operational performance of a facility on the real property (such facilities may include multifamily rental facilities, office properties, retail facilities, hospitality facilities, healthcare-related facilities, industrial facilities, warehouse facilities, restaurants, mobile home facilities, recreational or resort facilities, arenas or stadiums, religious facilities, parking lot facilities or other facilities); and
•large-scale fire, earthquake or severe weather-related damage to, or the effect of climate change on, the property and/or its operations.
Additional risks may be presented by the type and use of a particular commercial property, including specialized use as a nursing home or hospitality property.
The ability of a property owner, whether one of our borrowers or ourselves with respect to commercial properties we own, and our own financial performance with respect to commercial properties we own, will depend on the performance and financial
health of the underlying tenants, which may be difficult to assess or predict. In addition, as the number of tenants with respect to a commercial property decreases or as tenant spaces on a property must be relet, the nonperformance risk of the loan related to such commercial property may increase. Any one or more of the preceding factors could materially impair our ability to recover principal in a foreclosure on the related loan as lender and repay the principal as borrower. A substantial portion of our portfolio may be committed to the origination or purchasing of commercial real estate loans to small and medium-sized, privately owned businesses. Compared to larger, publicly owned firms, such companies generally have limited access to capital and higher funding costs, may be in a weaker financial position and may need more capital to expand or compete. The above financial challenges may make it difficult for such borrowers to make scheduled payments of interest or principal on their loans. Accordingly, advances made to such types of borrowers entail higher risks than advances made to companies who are able to access traditional credit sources.
A portion of our portfolio also may be committed to the origination or purchasing of commercial real estate loans where the borrower has a history of poor operating performance, based on our belief that we can realize value from a loan on the property despite such borrower’s performance history. However, if such borrower were to continue to perform poorly after the origination or purchase of such loan, including due to the above financial challenges, we could be adversely affected.
Consumer demand, combined with tight labor markets and supply chain imbalances have created inflationary pressure on the economy. Increased operating costs could stress property performance and thus mortgage loan performance.
Consumer demand, combined with tight labor markets, increased government spending and supply chain imbalances have created inflationary pressure on the U.S. economy. Inflation, along with governmental measures to control inflation, including significant increases to interest rates, coupled with public speculation about possible future governmental measures to be adopted, has had significant negative effects on national, regional and local economies.
Increased costs, such as increased energy costs and wages, stress property performance and thus mortgage loan performance. In addition, investments with long-term leases that have flat rental rates or longer-term loans, such as existing conduit loans, with a fixed coupon may decrease in relative value.
Finally, certain assets or markets may be more negatively affected by inflation. For example, when inflation increases, consumers may cut back on expenses, including travel, which may impact markets driven by tourism, and also non-essential goods and services, which may impact the retail sector.
Loan modifications or restructurings of non-performing loans may be unsuccessful. The process for collecting or foreclosing mortgage liens or equity pledges may be expensive, lengthy and limited by the application of state, bankruptcy, insolvency and other debtor and tenant relief laws.
Loans may be or become non-performing for a variety of reasons, including, without limitation, because the underlying property is too highly leveraged or the borrower falls upon financial distress, in either case, resulting in the borrower being unable to meet its debt service obligations. Such loans may require anything from minor modifications to a substantial amount of workout negotiations and/or restructuring, which may divert attention from other activities and may entail, among other things, a substantial reduction in the interest rate and a substantial write-down of the principal of the loan. Moreover, the ability to implement a successful modification or restructuring entails a high degree of uncertainty, and we may not be able to implement any such modification or restructuring on favorable terms or at all. The financial or operating difficulties relating to the distressed or non-performing loan may never be overcome.
Each of our mortgage loans permits us to accelerate the debt upon default by the borrower. The courts of all states will enforce acceleration clauses in the event of a material payment default, subject in some cases to a right of the court to revoke such acceleration and reinstate the mortgage loan if a payment default is cured. The courts of any state, however, may exercise equitable powers and refuse to allow the foreclosure of a mortgage, deed of trust, or other security instrument or to permit the acceleration of the indebtedness if a default is deemed immaterial or the exercise of those remedies would be unjust or unconscionable or if a material default is cured. Several states (including California) have laws that prohibit more than one “judicial action” to enforce a payment obligation. Some courts have construed the term “judicial action” broadly. Jurisdictions with “one action,” “security first,” and/or “anti-deficiency” rules may limit our ability or the ability of a special servicer of a CMBS issuance to foreclose on a real property or to realize on obligations secured by a real property. Further, payments on one or more of our loans, particularly a loan to a borrower in which, through an affiliate, we also hold equity interests, may be subject to claims of equitable subordination that, if successful, would place our entitlement to repayment of the loan on an equal basis with holders of the borrower’s common equity only after all of the borrower’s obligations relating to its other debt and preferred securities has been satisfied.
Borrowers or junior lenders may resist foreclosure actions by asserting numerous claims, counterclaims and defenses against us, including, without limitation, lender liability claims and defenses, even when the assertions may have no basis in fact or law, in an effort to prolong the foreclosure action and seek to force the lender into a modification of the loan or a discounted buy-out of the borrower’s or lender’s position in the loan. Foreclosure of a loan can be an expensive and lengthy process, which could have a substantial negative effect on our anticipated return on the foreclosed loan. Foreclosure may create a negative public perception of the related property, resulting in a diminution of its value, and also may subject us to environmental and other liabilities associated with owning real estate, adversely affecting our ability to sell the property and potentially causing us to incur substantial remediation costs. Even if we are successful in foreclosing on a loan, the liquidation proceeds upon sale of the underlying real estate may not be sufficient to recover our cost basis in the loan, resulting in a loss to us. Furthermore, any costs or delays involved in the foreclosure of the loan or a liquidation of the underlying property would further reduce the net sale proceeds and, therefore, increase any such losses to us.
At any time prior to or during the foreclosure proceedings, the borrower may file for bankruptcy, which would further delay the foreclosure process, and could potentially result in a reduction or discharge of a borrower’s debt. Although commercial real estate lenders typically seek to reduce the risk of, or disincentivize, borrower bankruptcy through such items as non-recourse carveouts for bankruptcy and special purpose entity/separateness covenants and/or non-consolidation opinions for borrowing entities, the borrower may still seek the protection afforded by bankruptcy, insolvency and other debtor and tenant relief laws. In the event of the bankruptcy of a mortgage loan borrower, the mortgage loan to such borrower would be deemed to be secured only to the extent of the value of the underlying collateral at the time of bankruptcy (as determined by the bankruptcy court). The lien securing the mortgage loan would be subject to the avoidance powers of the bankruptcy trustee or debtor-in-possession to the extent the lien is unenforceable under state law. One of the protections offered in such proceedings to each of these parties is a stay of legal proceedings, and a stay of enforcement proceedings against collateral for such loans or underlying such securities (including the properties and cash collateral). A stay of foreclosure proceedings could adversely affect our ability to realize on our loan collateral and could adversely affect the value of those assets. Other results of such proceedings include the restructuring or forgiveness of debt, the ability to create super priority liens in favor of certain creditors of the debtor, the potential loss of cash collateral held by the lender if the lender is over-collateralized, and certain well-defined claims procedures. Additionally, the numerous risks inherent in the bankruptcy process create a potential risk of loss of our entire investment in any particular investment.
The due diligence process that we undertake in regard to investment opportunities may not reveal all facts and risks that may be relevant in connection with an investment and if we incorrectly evaluate the risks of our investments, we may experience losses.
The commercial real estate lending business depends on the creditworthiness and skills of borrowers and the sponsors thereof, which we must judge. In making such judgment, we will depend on information obtained from non-public sources and the borrowers in making many decisions related to our portfolio, and such information may be difficult to obtain or may be inaccurate. As a result, we may be required to make decisions based on incomplete information or information that is impossible or impracticable to verify. A determination as to the creditworthiness of a prospective borrower is based on a wide range of information. Even if we are provided with full and accurate disclosure of all material information concerning a borrower, we may misinterpret or incorrectly analyze this information, which may cause us to originate or purchase loans that we otherwise would not have originated or purchased and, as a result, may negatively impact our business or the borrower could still defraud us after origination leading to a loss and negative publicity.
Further, third-party diligence reports on mortgaged properties and the properties we own are made as of a point in time and are therefore limited in scope. Appraisals and engineering and environmental reports, as well as a variety of other third-party reports, are generally obtained with respect to each of the properties we acquire and the mortgaged properties underlying our investments at or about the time of origination. These reports are not guarantees of present or future value. One appraiser may reach a different conclusion than the conclusion that would be reached if a different appraiser were appraising that property. Moreover, the values of the properties may have fluctuated significantly since the appraisals were performed. In addition, any third-party report, including any engineering report, environmental report, site inspection or appraisal represents only the analysis of the individual consultant, engineer or inspector preparing such report at the time of such report, and may not reveal all necessary or desirable repairs, maintenance, remediation and capital improvement items.
The success of our origination or acquisition of investments significantly depends on the financial stability of the borrowers and tenants underlying such investments. Before making a loan to a borrower, we assess the strength and skills of that entity’s management and other factors that we believe are material to the performance of the investment. In making the assessment and otherwise conducting customary due diligence, we rely on the resources available to us and, in some cases, an investigation by third parties.
There can be no assurance that our due diligence processes will uncover all relevant facts or that any investment will be successful.
Insurance on the real estate underlying our loans and investments may not cover all losses, and this shortfall could result in both loss of cash flow from and a decrease in the asset value of the affected property.
The borrower, or we as property owner and/or originating lender, might not purchase enough or the proper types of insurance coverage to cover all losses.
In addition, there are certain types of losses, generally of a catastrophic nature, such as earthquakes, floods, hurricanes, pandemics, terrorism or acts of war or civil unrest that may be uninsurable or not economically insurable. A carrier can determine they will no longer take on these risks and not offer them at renewal or on new policies. Furthermore, inflation, frequency and intensity of natural catastrophes, changes in the reinsurance market, changes in building codes and ordinances and other factors are impacting the availability and cost of insurance. Certain locations (especially those in specialty hazard areas) are seeing changes in availability of coverages or limited availability for stated limits (e.g., named storm, flood and other specialty coverages) and shifts to higher premiums and deductibles on all coverages, especially special form coverages like earthquake and named storm.
If insurance required by our loan documents is or becomes commercially unavailable or only available at prohibitive rates prior to origination or at any point during the term of a loan or investment, Ladder may issue a waiver, force-place coverage (even at our cost) or seek to mitigate the risk of loss by obtaining recourse, but these actions may not eliminate all losses. In addition, servicers responsible for monitoring insurance coverage may also fail to notify us promptly if a borrower fails to maintain adequate coverage, resulting in a loss and limiting our remedies.
The factors outlined above might make insurance proceeds insufficient to repair or replace a given property if it is damaged or destroyed. Under such circumstances, the insurance proceeds received might not be adequate to restore our economic position with respect to the affected real property. Any uninsured or underinsured loss could result in both loss of cash flow from and a decrease in the asset value of the affected property. Additionally, higher insurance costs will reduce the net operating income of the properties underling our debt and equity investments, increasing the risks of delinquency, foreclosure and default, which could adversely affect our return on investment and result in losses to us.
Provisions for loan losses are difficult to estimate. Our reserves for loan losses may prove inadequate, which could have a material adverse effect on us.
We maintain and regularly evaluate financial reserves to protect against potential future losses. Our reserves reflect management’s judgment of the probability and severity of losses. We cannot be certain that our judgment will prove to be correct and that reserves will be adequate over time to protect against potential future losses because of unanticipated adverse changes in the economy or events adversely affecting specific assets, borrowers, industries in which our borrowers operate or markets in which our borrowers or their properties are located. We must evaluate existing conditions on our debt investments to make determinations to record loan loss reserves on these specific investments. If our reserves for credit losses prove inadequate, we could suffer losses which would have a material adverse effect on our financial performance.
The Company estimates its current expected credit losses (“CECL”) using U.S. GAAP (collectively, the “CECL Standard”). Under the CECL model, we are required to provide allowances for credit losses on certain financial assets carried at amortized cost, such as loans held-for-investment, held-to-maturity debt securities, and available for sale debt securities, including related future funding commitments. This measurement also takes place at the time the financial asset is first added to the balance sheet and updated quarterly thereafter. While the CECL Standard does not require any particular method for determining the CECL allowance, it does specify that the allowance should be based on relevant information about past events, including historical loss experience, current portfolio and market conditions, and reasonable and supportable forecasts for the duration of each respective loan. Because our methodology for determining CECL allowances may differ from the methodologies employed by other companies, our CECL allowances may not be comparable with the CECL allowances reported by other companies. The CECL Standard may create more volatility in the level of our allowance for credit losses. If we are required to materially increase our level of allowance for credit losses, such increase could adversely affect our business, financial condition and results of operations.
Certain balance sheet investments may be more illiquid and involve a greater risk of loss.
We originate and acquire balance sheet loans that provide interim financing to borrowers seeking short-term capital for the acquisition or transition (for example, lease up and/or rehabilitation) of commercial real estate. Such a borrower under an
interim loan often has identified a transitional asset that has been under-managed, is located in a recovering market and/or requires rehabilitation or capital improvements in order to improve the value of the asset. If the market in which the asset is located fails to recover according to the borrower’s projections, or if the borrower fails to improve the quality of the asset’s management and/or the value of the asset or fails to execute its business plan, the borrower may not receive a sufficient return on the asset to satisfy the interim loan, and we bear the risk that we may not recover some or all of our investment. In addition, borrowers often use the proceeds of a long-term mortgage loan to repay an interim loan. We may, therefore, be dependent on a borrower’s ability to obtain permanent financing to repay our interim loan, which could depend on the borrower’s ability to execute its business plan, the sponsor’s financial wherewithal, market conditions and other factors. Properties undergoing rehabilitation or capital improvements are subject to the additional risks of unanticipated delays, cost over-runs, contractor non-performance or borrower disputes with contractors resulting in mechanic’s or materialmen’s liens on the property, and the failure of borrower’s sponsors to contribute sufficient equity funds in order to keep the loan “in balance.”
Further, interim loans may be relatively less liquid than loans against stabilized properties due to their short life, their potential unsuitability for securitization, any un-stabilized nature of the underlying real estate and the difficulty of recovery in the event of a borrower’s default. This lack of liquidity may significantly impede our ability to respond to adverse changes in the performance of our interim loan portfolio and may adversely affect the value of the portfolio. Such “liquidity risk” may be difficult or impossible to hedge against and may also make it difficult to effect a sale of such assets as we may need or desire. As a result, if we are required to liquidate all or a portion of our interim loan portfolio quickly, we may realize significantly less than the value at which such investments were previously recorded, which may fail to maximize the value of the investments or result in a loss.
In the case of real property, we cannot predict whether we will be able to sell any property for the price or on the terms set by us or whether any price or other terms offered by a prospective purchaser would be acceptable to us. We also cannot predict the length of time needed to find a willing purchaser and to close the sale of a property. We may be required to expend cash to correct defects or to make improvements before a property can be sold, and we cannot provide assurance that we will have cash available to correct those defects or to make those improvements. The Code also places limits on our ability as a REIT to sell certain properties held for fewer than two years.
Our investments in subordinate loans, subordinate participation interests in loans, preferred equity and subordinate CMBS rank junior to other senior debt and we may be unable to recover our investment in these interests.
We may originate or acquire subordinate loans (including mezzanine loans), subordinate participation interests in loans and subordinate rated and/or unrated CMBS (including, without limitation, certain “risk retention” interests required to be retained by certain participants in securitization transactions). In the event a borrower defaults on a loan and lacks sufficient assets to satisfy our loan, we may suffer a loss of principal or interest. In the event a borrower declares bankruptcy, we may not have full recourse to the assets of the borrower or a non-recourse carve-out guarantor, or the assets of the borrower or non-recourse carve-out guarantors may not be sufficient to satisfy the loan and our legal costs. In addition, certain of our loans may be subordinate to other debt of the borrower. If a borrower defaults on a subordinate loan from us or on debt senior to our loan, or in the event of a borrower bankruptcy, our loan would be satisfied only after the senior debt is paid in full. Where debt senior to our loan exists, the presence of intercreditor arrangements may limit our ability to amend loan documents, assign our loans, accept prepayments, exercise remedies and control decisions made in bankruptcy proceedings relating to borrowers.
If a borrower defaults on our mezzanine loan, subordinate loan or debt senior to any loan, or in the event of a borrower bankruptcy, our mezzanine loan or preferred equity investment would be satisfied only after the senior debt, in the case of a mezzanine loan, or all senior and subordinated debt, in the case of a preferred equity investment, is paid in full. As a result, we may not recover some or all of our initial expenditure. In addition, mezzanine and subordinate loans may have higher loan-to-value ratios than first mortgage loans, resulting in less equity in the property and increasing the risk of loss of principal. Significant losses related to our mezzanine loans or subordinate loans would result in operating losses for us.
In general, losses on a mortgaged property securing a mortgage loan included in a securitization would be borne first by the equity holder of the property, then by a cash reserve fund or letter of credit, if any, then by the holder of a mezzanine loan or B-Note, if any, then by the “first loss” subordinated security holder (generally, the “B-Piece” buyer and in some cases by the holder of a risk retention interest) and then by the holder of a higher-rated security. Even when we purchase very senior interests in loans and/or securitizations, in the event of default and the exhaustion of any equity support, reserve fund, letter of credit, mezzanine loans or B-Notes, and any classes of securities junior to those in which we may invest, we may not be able to recover all of our investment in the debt instruments or securities we purchased. In addition, if the underlying mortgage portfolio has been overvalued by the originating lender, or if the values subsequently decline and, as a result, less collateral is available to satisfy interest and principal payments due on the related mortgage-backed securities, the securities in which we may invest may effectively become the “first loss” position behind the more senior securities, which may result in significant
losses to us. The prices of lower credit quality securities are generally less sensitive to interest rate changes than more highly rated investments, but more sensitive to adverse economic downturns or individual issuer developments. A projection of an economic downturn, for example, could cause a decline in the price of lower credit quality securities because the ability of obligors of mortgage loans underlying the mortgage-backed securities to make principal and interest payments may be impaired. In such event, existing credit support in the securitization structure may be insufficient to protect us against loss of our principal in these securities.
Finally, subordinated interests are also generally not actively traded and may not provide holders thereof with a liquid investment, particularly during periods of market disruption.
Our participation in the market for mortgage loan securitizations may expose us to risks that could result in losses to us.
We have generally participated in the market for mortgage loan securitizations by contributing loans to securitizations led by various large financial institutions. To date, when we have primarily acted as a mortgage loan seller into, and occasionally as an issuer of, securitizations, we have been obligated to assume certain customary liabilities. Specifically, in connection with any particular securitization, we: (i) make certain representations and warranties regarding ourselves and the characteristics of, and origination process for, the mortgage loans that we contribute to the securitization; (ii) undertake to cure a defect of, repurchase or replace any mortgage loan that we contribute to the securitization that is affected by a material breach of any such representation or warranty or a material loan document deficiency; (iii) assume, either directly or through the indemnification of third-parties, potential securities law liabilities for disclosure to investors regarding ourselves and the mortgage loans that we contribute to the securitization; and (iv) may, depending upon our role in the securitization, (a) retain some or all of the risk retention interests in the securitization and/or (b) retain responsibility for ensuring compliance with risk retention rules (and may be required to indemnify other participants in the securitization for any violation of such rules, including in circumstances where some or all of the risk retention interests are retained by and/or sold to other parties). When we lead a single-asset or multi-asset securitization as an issuer, we assume, either directly or through indemnification agreements, additional potential securities law liabilities and third-party liabilities beyond the liabilities we would assume when we act only as a mortgage loan seller into a securitization.
If loans that we sell or securitize do not comply with representations and warranties that we make about the loans, the borrowers, or the underlying properties, we may be required to repurchase such loans (including from a trust vehicle used to facilitate a structured financing of the assets through a securitization) or replace them with substitute loans. Repurchased loans typically would require a significant allocation of working capital to be carried on our books, and our ability to borrow against such assets may be limited. Any significant repurchases could adversely affect our business and reputation.
When we participate in a public securitization, certain Risk Retention Rules apply. The Risk Retention Rules generally require that either: (i) a securitization’s sponsor retain, until the unpaid balance of the bonds or the loans is reduced by a certain amount, a 5% vertical interest in each class of securities issued; (ii) the sponsor or certain Third Party Purchasers retain, until the unpaid balance of the bonds or the loans is reduced by a certain amount (or for Third Party Purchasers, for at least five years), securities in an amount equal to 5% of the credit risk associated with the issued securities in the form of one or more subordinate tranches, or (iii) a combination of (i) and (ii). The risk (with respect to CMBS) must be retained by the sponsor, certain mortgage loan originators and/or, upon satisfaction of certain requirements, a Third-Party Purchaser. Significant restrictions exist, and additional restrictions may be added in the future, regarding who may hold risk retention interests, the structure of the entities that hold risk retention interests and when and how such risk retention interests may be transferred or financed. Therefore, such risk retention interests would be generally illiquid and may not be easily financed. As a result of the Risk Retention Rules, we may be required to purchase and retain certain interests in a securitization into which we sell mortgage loans and/or when we act as issuer, may be required to sell certain interests in a securitization at prices below levels that such interests have historically yielded and/or may be required to enter into certain arrangements related to risk retention that we have not historically been required to enter into and, accordingly, the Risk Retention Rules may increase our potential liabilities and/or reduce our potential profits in connection with securitization of mortgage loans.
The Risk Retention Rules and other rules and regulations that have been adopted or may be adopted in the future may alter the structure of securitizations and could pose additional risks to or reduce or eliminate the economic benefits of our participation in the securitization market.
Our access to the CMBS securitization market and the timing of our securitization and real estate sale activities may greatly affect our quarterly financial results.
We have historically expected to distribute certain of the first mortgage loans that we originate through securitizations and, in many circumstances, upon completion of a securitization, we recognize certain non-interest revenues which is included in total
other income (loss) on our consolidated statements of income and cease to earn net interest income on the securitized loans. Our quarterly revenue, operating results and profitability have varied and may in the future vary substantially from quarter to quarter based on the frequency, pricing, volume and timing of our securitizations and real estate sales. Our securitization activities are affected by a number of factors, including our loan origination volumes, changes in loan values, quality and performance during the period such loans are on our books and conditions in the securitization and credit markets generally and at the time we seek to launch and complete our securitizations. Although due to changes resulting from the Risk Retention Rules required by the Dodd-Frank Act described elsewhere in this Annual Report, Ladder may potentially be required to defer income over the life of the securitization, thereby reducing such volatility in earnings, as a result of these quarterly variations, quarter-to-quarter comparisons of our operating results may not provide an accurate comparison of our current period results of operations. If securities analysts or investors focus on such comparative quarter-to-quarter performance, our stock price performance may be more volatile than if such persons compared a wider period of results of operations.
We may be subject to risks associated with unfunded conditional loan commitments or other future advances, such as declining real estate values and operating performance.
Our mortgage loan investments may require us to advance additional loan funds in the future. We may also need to fund capital expenditures and other significant expenses for our real estate property investments. The majority of additional funds to loan borrowers require the occurrence of certain “good news” events, such as the owner executing a lease agreement or completing a major component of their business plan. Future funding commitments are subject to our loan borrowers’ satisfaction of certain conditions and may or may not be funded depending on a variety of circumstances including timing, credit metric hurdles, leasing parameters and other nonfinancial events occurring.
The Company carefully monitors the progress of work at properties that serve as collateral underlying its commercial mortgage loans, including the progress of capital expenditures, construction, leasing and business plans in light of current market conditions. However, future funding obligations subject us to significant risks, such as a decline in value of the property, cost overruns and required reserve re-balancings and the borrower or tenant being unable to generate enough cash flow and execute its business plan, or sell or refinance the property, in order to repay its obligations to us. Where a borrower has failed to meet its obligations, we could determine that we need to modify the loan or advance funds to protect the collateral, which could result in our funding more money than we originally anticipated in order to maximize the value of our investment, even though there is no assurance additional funding would be the best course of action. Further, future funding obligations may require us to maintain higher liquidity than we might otherwise maintain and this could reduce the overall return on our investments. We could also find ourselves in a position with insufficient liquidity to fund future obligations.
If we purchase or originate loans secured by liens on facilities that are subject to a ground lease and such ground lease is terminated unexpectedly, our interests could be adversely affected.
A ground lease is a lease of land, usually on a long-term basis, that does not include buildings or other improvements on the land. Normally any real property improvements made by the lessee during the term of the lease revert to the owner at the end of the lease term. We may purchase or originate loans secured by liens on facilities that are subject to a ground lease, and, if the ground lease were to terminate unexpectedly, due to the borrower’s default on such ground lease or otherwise, our business could be adversely affected.
We have acquired and, in the future, may acquire net leased real estate assets, or make loans to owners of net leased real estate assets (including ourselves), which carry particular risks of loss that may have a material impact on our financial condition, liquidity and results of operations.
A substantial portion of our real estate investments are subject to net leases. A net lease requires the tenant to pay, in addition to the fixed rent, some or all of the property expenses that normally would be paid by the property owner. These properties subject to net leases will generally be occupied by a single tenant and, therefore, the success of these investments will be materially dependent on the financial stability of each such tenant (or, sometimes, its parent entity) and the ability of the applicable tenant to meet its obligations to maintain the property under the terms of the net lease. A default of any such tenant on its lease payments would cause a loss the revenue from the property and force the owner, whether it be us or the borrower, to find an alternative source of revenue to meet any mortgage payment and prevent a foreclosure if the property is subject to a mortgage. In the event of a default, the owner may experience delays in enforcing its rights as landlord and may incur substantial costs in protecting its investment and re-letting the property. If a lease is terminated, the owner may also incur significant losses to make the leased premises ready for another tenant and experience difficulty or a significant delay in re-leasing such property.
Under many net leases the owner of the property retains certain obligations with respect to the property, including, among other things, the responsibility for maintenance and repair of the property, to provide adequate parking, maintenance of common
areas and compliance with other affirmative covenants in the lease. If we, as the owner, or the borrower, were to fail to meet these obligations, the applicable tenant could abate rent or terminate the applicable lease, which may result in a loss of capital invested in, and anticipated profits from, the property. In addition, we, as the owner, or the borrower, may find it difficult to lease certain property to new tenants if that property had been suited to the particular needs of a former tenant.
In addition, net leases typically have longer lease terms and, thus, there is an increased risk that contractual rental increases in future years will fail to result in fair market rental rates during those years.
The leases at the properties underlying commercial real estate loans or securities or the properties held by us may not be relet or renewed on favorable terms, or at all, which may result in a reduction in our net income, and as a result we may be required to reduce or eliminate cash distributions to shareholders.
Our investments in real estate may be pressured when economic conditions and rental markets are challenging. For instance, upon expiration or early termination of leases for space located at our properties, the space may not be relet or, if relet, the terms of the renewal or reletting (including the cost of required renovations or concessions to tenants) may be less favorable than current lease terms. We may be receiving above market rental rates which will decrease upon renewal, which would adversely impact our income and could harm our ability to service our debt and operate successfully. Weak economic conditions would likely reduce tenants’ ability to make rent payments in accordance with the contractual terms of their leases and lead to early termination of leases. Furthermore, commercial space needs may contract, resulting in lower lease renewal rates and longer releasing periods when leases are not renewed. Any of these situations may result in extended periods where there is a significant decline in revenues or no revenues generated by a property. Additionally, to the extent that market rental rates are reduced, property-level cash flow would likely be negatively affected as existing leases renew at lower rates. If we are unable to relet or renew leases for all or substantially all of the space at these properties, if the rental rates upon such renewal or reletting are significantly lower than expected, or if our reserves for these purposes prove inadequate, we may experience a reduction in net income and may be required to reduce or eliminate cash distributions to shareholders.
Current and future venture investments could be adversely affected by our lack of sole decision-making authority, our reliance on venture partners’ financial condition and liquidity and disputes between us and our venture partners.
We have made, and may in the future make, investments through ventures with another party or parties. Such venture investments may involve risks not otherwise present when we originate or acquire investments without partners, including the following:
•we may not have exclusive control over the investment or the venture, which may prevent us from taking actions that are in our best interest;
•fraud or other misconduct by our venture partners;
•venture agreements often restrict the transfer of a partner’s interest or may otherwise restrict our ability to sell the interest when we desire and/or on advantageous terms;
•we may rely upon our venture partners to manage the day-to-day operations of the venture and underlying loans or assets, as well as to prepare financial information for the venture and any failure to perform these obligations may have a negative impact our performance and results of operations;
•our venture partner may experience a change of control, which could result in new management of our venture partner with less experience or conflicting interests to ours and be disruptive to our business;
•venture agreements often restrict the transfer of a partner’s interest or may otherwise restrict our ability to sell the interest when we desire and/or on advantageous terms;
•any future venture agreements may contain buy-sell provisions pursuant to which one partner may initiate procedures requiring the other partner to choose between buying the other partner’s interest or selling its interest to that partner;
•we may not be in a position to exercise sole decision-making authority regarding the investment or venture, which could create the potential risk of creating impasses on decisions, such as with respect to acquisitions or dispositions;
•a partner may, at any time, have economic or business interests or goals that are, or that may become, inconsistent with our business interests or goals;
•a partner may be in a position to take action contrary to our instructions, requests, policies or objectives, including our policy with respect to maintaining our qualification as a REIT and our exemption from registration under the Investment Company Act;
•a partner may fail to fund its share of required capital contributions or may become bankrupt, which may mean that we and any other remaining partners generally would remain liable for the venture’s liabilities;
•our relationships with our partners are contractual in nature and may be terminated or dissolved under the terms of the applicable venture agreements and, in such event, we may not continue to own or operate the interests or investments
underlying such relationship or may need to purchase such interests or investments at a premium to the market price to continue ownership;
•disputes between us and a partner may result in litigation or arbitration that could increase our expenses and prevent our officers and directors from focusing their time and efforts on our business and could result in subjecting the investments owned by the venture to additional risk; or
•we may, in certain circumstances, be liable for the actions of a partner, and the activities of a partner could adversely affect our ability to continue to qualify as a REIT or maintain our exemption from registration under the Investment Company Act, even though we do not control the venture.
Any of the above may subject us to liabilities in excess of those contemplated and adversely affect the value of our future venture investments.
Our investments in CMBS and other real estate-related securities are generally subject to losses.
We currently invest in, and may continue to invest in, CMBS, a specific type of structured finance security. CMBS, including CLOs, are securities backed by obligations (including certificates of participation in obligations) that are principally secured by commercial mortgage loans or interests therein having a multi-family or commercial use, such as retail space, office buildings, industrial or warehouse properties, hotels, nursing homes and senior living centers. Accordingly, investments in CMBS are subject to the various risks described herein which relate to the pool of underlying assets in which the CMBS represents an interest. The exercise of remedies and successful realization of liquidation proceeds relating to commercial mortgage loans underlying CMBS may be highly dependent on the performance of the servicer or special servicer. We will bear the risk of loss on any CMBS we purchase.
We may attempt to underwrite our investments on a “loss-adjusted” basis, which projects a certain level of performance. However, there can be no assurance that this underwriting will accurately predict the timing or magnitude of such losses. To the extent that this underwriting has incorrectly anticipated the timing or magnitude of losses, our business may be adversely affected. Some mortgage loans underlying CMBS may default. Under such circumstances, cash flows of CMBS investments held by us may be adversely affected as any reduction in the mortgage payments or principal losses on liquidation of any mortgage loan may be applied to the class of CMBS relating to such defaulted loans that we hold.
The market value of our CMBS investments could fluctuate materially over time as the result of changes in mortgage spreads, treasury bond interest rates, capital market supply and demand factors, and many other factors that affect high-yield fixed income products. These factors are out of our control and could influence our ability to obtain short-term financing on the CMBS. In addition, we may invest in CMBS investments that would experience the first loss in the event of a borrower default, including CMBS that are not rated or rated non-investment grade by any credit rating agency and junior tranches of CMBS issuances or of a mortgage loan. Moreover, the CMBS in which we may invest may have no, or only a limited, trading market. The financial markets in the past have experienced and could in the future experience a period of volatility and reduced liquidity which may reoccur or continue and reduce the market value of CMBS. Some or all of the CMBS that we hold may be subject to restrictions on transfer and may be considered illiquid.
Subject to certain limits, we may also make investments in real estate-related equity or debt securities, including, but not limited to, those issued by REITs and real estate companies. These investments involve special risks relating to the particular company, including its financial condition, liquidity, results of operations, financial obligations, business and prospects.
Any credit ratings assigned to our investments could be downgraded, which could have a material impact on our financial condition, liquidity and results of operations.
Some of our investments may be rated by one or more of Moody’s, Fitch, Standard & Poor’s, Realpoint, Dominion Bond Rating Service, Morningstar Credit Ratings, Kroll Bond Ratings or other credit rating agencies. Any credit ratings on our investments are subject to ongoing evaluation by credit rating agencies, and we cannot be assured that any such ratings will not be changed or withdrawn by a credit rating agency in the future if, in its judgment, circumstances warrant. If credit rating agencies assign a lower-than-expected rating or reduce or withdraw, or indicate that they may reduce or withdraw, their ratings of our investments in the future, the value of these investments could significantly decline, which would adversely affect the value of our portfolio and could result in losses upon disposition.
Some of our portfolio investments are recorded at fair value and there is uncertainty as to the value of these investments. Furthermore, our determinations of fair value may have a material impact on our financial condition and results of operations.
The value of some of our investments may not be readily determinable or may be unreliable. We will value these investments quarterly at fair value under U.S. GAAP. Because such valuations are subjective, the fair value of certain of our assets may fluctuate over short periods of time and our determinations of fair value may differ materially from the values that would have been used if a ready market for these assets existed. Our determinations of fair value may have a material impact on our earnings, in the case of impaired loans and other assets, trading securities and available-for-sale securities that are subject to the CECL Standard or impairment review, or our accumulated other comprehensive income/(loss) in our shareholders’ equity, in the case of available-for-sale securities that are subject only to temporary impairments.
We utilize an internal model as our primary pricing source to develop prices for our CMBS and U.S. Agency securities. To confirm our own valuations, we request prices for each of our CMBS and U.S. Agency securities investments from third-party dealers and pricing services that employ various techniques, including discussion with their internal trading desks and the use of proprietary models and matrix pricing. The Company has access to review in detail, the inputs used by these third parties in developing their fair value estimates. On a monthly basis as part of our closing process, the Company evaluates the fair value information provided by the pricing services by comparing this information for reasonableness against its direct observations of market activity for similar securities and anecdotal information obtained from market participants that, in its assessment, is relevant to the determination of fair value. Furthermore, in general, dealers and pricing services heavily disclaim their valuations. Dealers may claim to furnish valuations only as an accommodation and without special compensation, and so they may disclaim any and all liability for any direct, incidental or consequential damages arising out of any inaccuracy or incompleteness in valuations, including any act of negligence or breach of any warranty. Depending on the complexity and illiquidity of an asset, valuations of the same asset can vary substantially from one dealer or pricing service to another. Additionally, our results of operations for a given period could be adversely affected if our determinations regarding the fair value of these investments were materially higher than the values that we ultimately realize upon their disposal.
Risks Related to Our Indebtedness
Our business is leveraged, which could lead to greater losses than if we were not as leveraged.
We do and, in the future, intend to use financial leverage in executing our business plan. Such borrowings may take the form of unsecured corporate debt, bank credit facilities, repurchase agreements and warehouse lines of credit, CLO issuances we sponsor and credit facilities from government agencies (including the FHLB). We may also issue debt or equity securities to fund our growth. The type and percentage of leverage we employ varies depending on our available capital, our ability to obtain and access financing arrangements with lenders, the type of asset we are funding, whether the financing is recourse or non-recourse, debt restrictions contained in those financing arrangements and the lenders’ and rating agencies’ estimates of the stability of our investment portfolio’s cash flow. In addition, a significant portion of our borrowings are based on floating interest rates, the fluctuation of which could adversely affect our business and results of operations. Our use of leverage in a market that moves adversely to our business interests could result in a substantial loss to us, which would be greater than if we were not leveraged.
Incurring debt subjects us to many risks that, if realized, would materially and adversely affect us, including the risk that:
•our cash flow from operations may be insufficient to make required payments of principal, and interest on the debt or we may fail to comply with all of the other covenants contained in the debt, which is likely to result in: (i) acceleration of such debt (and any other debt containing a cross-default or cross-acceleration provision) that we may be unable to repay from internal funds or to refinance on favorable terms, or at all; (ii) our inability to borrow unused amounts under our financing arrangements, even if we are current in payments on borrowings under those arrangements; and/or (iii) the loss of some or all of our assets to foreclosure or sale;
•our debt may increase our vulnerability to adverse economic and industry conditions, and investment yields may not increase with higher financing costs, including as a result of higher interest rates;
•we may be required to dedicate a substantial portion of our cash flow from operations to payments on our debt, thereby reducing funds available for operations, future business opportunities, shareholder distributions or other purposes;
•limit our flexibility in planning for, or reacting to, changes in our business and the industry in which we operate;
•restrict us from capitalizing on business opportunities;
•place us at a competitive disadvantage compared to our competitors that have less debt;
•we may not be able to refinance debt that matures prior to the investment it was used to finance on favorable terms, or at all;
•make it more difficult to satisfy our financial obligations;
•limit our ability to borrow additional funds for working capital, acquisitions, debt service requirements, execution of our business strategy or other general partnership purposes;
•if we are compelled to liquidate our investments to repay obligations to our lenders, we may be unable to comply with REIT requirements regarding the composition of our assets and our sources of income, ultimately jeopardizing our qualification as a REIT, or we may be subject to a 100% tax on any resultant gain if we sell assets that are treated as dealer property or inventory; and
•we will have increased exposure to risks if the counterparties of our debt obligations are impacted by credit market turmoil or exposure to financial, regulatory or other pressures.
We may significantly increase the amount of leverage we utilize at any time without approval of our board of directors. In addition, we may leverage individual assets at substantially higher levels. Although the agreements governing our indebtedness do limit our ability to incur additional indebtedness, these restrictions are subject to a number of qualifications and exceptions and, under certain circumstances, debt incurred in compliance with these restrictions could be substantial. To the extent that we incur substantial additional indebtedness in the future, the risks associated with our substantial leverage described herein, including our inability to meet all of our debt service obligations, would be exacerbated.
The repurchase agreements that we use to finance our investments may require us to provide additional collateral, which could reduce our liquidity and harm our financial condition.
Our master repurchase agreements with various counterparties, our FHLB debt, and any other financing we may enter into in the future, involve the risk that the market value of the assets pledged or sold by us to the provider of the financing may decline in value, in which case the lender or counterparty may require us to provide additional collateral or lead to margin calls that may require us to repay all or a portion of the funds advanced. We may not have the funds available to repay our debt at that time, which could force us to sell assets at significantly depressed prices to meet such margin calls and to maintain adequate liquidity or to otherwise reduce the amount of leverage we use to finance our business, which could cause significant losses. If we cannot meet these margin calls, the lender or counterparty could accelerate our indebtedness, increase the interest rate on advanced funds and terminate our ability to borrow funds from it, which could materially and adversely affect our financial condition and ability to implement our investment strategy. In the case of repurchase transactions, if the value of the underlying security has declined as of the end of that term, or if we default on our obligations under the repurchase agreement, we would likely incur a loss on our repurchase transactions.
There can be no assurance that we will be able to access financing arrangements in the future on favorable terms, or at all, and our compliance with associated restrictive covenants may limit our ability to fully pursue our business strategies.
We are dependent upon our ability to access capital at rates and on terms we determine to be attractive. If our ability to access capital becomes constrained, our interest costs could increase, which could have material adverse effect on our results of operations, financial condition and cash flows.
There is no assurance that we will be able to obtain, maintain or renew our financing on terms or advance rates favorable to us or at all. If we are limited in our ability to leverage our assets to the extent we currently anticipate, the returns on these assets may be negatively impacted. Our access to additional sources of financing depends upon a number of factors, over which we have little or no control, including:
•general market conditions;
•the market’s view of the quality of our assets;
•the market’s perception of our growth potential;
•our current and potential future earnings and cash distributions; and
•the market price of the shares of our Class A common stock.
A dislocation and/or weakness in the capital and credit markets could adversely affect one or more lenders and could cause one or more of our lenders to be unwilling or unable to provide us with financing or to increase the costs of that financing. In addition, if regulatory capital requirements imposed on our lenders change, they may be required to limit, or increase the cost of, financing they provide to us. In general, this could potentially increase our financing costs and reduce our liquidity or require us to sell assets at an inopportune time or price.
In order to borrow funds under a repurchase or warehouse agreement or other financing arrangement, the lender has the right to review the potential assets for which we are seeking financing and approve such asset in its sole discretion. Accordingly, we may be unable to obtain the consent of a lender to finance an investment and alternate sources of financing for such asset may
not exist, especially during times of distress. Further, lender consent may be required for the modification or restructuring of our loan collateral, which, if not obtained, may require us to repay our associated borrowing.
Additionally, if we are unable to securitize our loans, replenish a warehouse line of credit, enter into or meet the managed reinvestment requirements of CLO transactions, we may be required to seek other forms of potentially less attractive financing or otherwise to liquidate our assets.
Furthermore, any financing facility that we enter into or bonds we issue may be subject to conditions and restrictive financial and operating covenants, which may limit our ability to take specific actions, even if we believe them to be in our best interest. For example, the indentures governing our unsecured bonds subject us to, among other things, a maximum ratio of indebtedness to equity and a minimum level of unencumbered assets. Our ability to comply with restrictive covenants and other provisions of our debt agreements may be affected by changes in our operating and financial performance, changes in general business and economic conditions, adverse regulatory developments, or other events. To the extent we breach a covenant or cannot satisfy a condition, such financing may not be available to us, or may be required to be repaid in full or in part, which could limit our ability to pursue our business strategies. We may also be subject to cross-default and acceleration rights and, with respect to collateralized debt, the posting of additional collateral and foreclosure rights upon default. Further, any default could also make it difficult for us to satisfy the distribution requirements necessary to maintain our qualification as a REIT for U.S. federal income tax purposes or to maintain our exemption from registration under the Investment Company Act.
Any credit ratings assigned to our debt securities could be downgraded, which could have a material impact on our financial condition, liquidity and results of operations.
We may issue more unsecured corporate bonds in the future depending on the financing requirements of our business and market conditions. Our failure to maintain the credit ratings on our debt securities could negatively affect our ability to access capital and could increase our interest expense. The credit rating agencies periodically review our capital structure and the quality and stability of our earnings. Deterioration in our capital structure or the quality and stability of our earnings could result in a downgrade of the credit ratings on our Notes and other debt securities. Any negative ratings actions could constrain the capital available to us and could limit our access to funding for our operations.
Our use of leverage may create a mismatch between the duration of financing and the life of the investments made using the proceeds of such financing, as well as between the index of our investments and the index of our leverage.
We generally intend to structure our leverage such that we minimize the differences between the term of our investments and the leverage we use to finance such investments. However, under certain circumstances, we may determine not to do so or we may be unable to do so. In the event that our leverage is for a shorter term than the financed investment, we may not be able to extend or find appropriate replacement leverage, which would have an adverse impact on our liquidity and our returns. In the event that our leverage is for a longer term than the financed investment, we may not be able to repay such leverage or replace the financed investment with an optimal substitute or at all, which would negatively impact our desired leveraged returns.
We generally attempt to structure our leverage such that we minimize the differences between the index of our investments and the index of our leverage (i.e., financing floating rate investments with floating rate leverage and fixed rate investments with fixed rate leverage). If such a product is not available to us from our lenders on reasonable terms, we may use hedging instruments to effectively create such a match. For example, in the case of future fixed rate investments, we may finance such an investment with floating rate leverage, but effectively convert all or a portion of the attendant leverage to fixed rate using hedging strategies.
Our attempts to mitigate such risk are subject to factors outside our control, such as the availability of favorable financing and hedging options, which is subject to a variety of factors, of which duration and term-matching are only two. The risks of a duration mismatch are magnified by the potential for the extension of loans in order to maximize the likelihood and magnitude of their recovery value in the event the loans experience credit or performance challenges. Employment of this asset management practice would effectively extend the duration of our investments, while our liabilities have set maturity dates.
We are subject to counterparty risk associated with our debt obligations and cash balances.
Our counterparties for critical financial relationships, such as our lenders and depository institutions, include both domestic and international financial institutions that could experience financial or other pressures. If any of our counterparties were to limit or cease operation or fail to perform under our agreements, it could lead to financial losses for us.
For example, when we finance assets in a repurchase transaction, we sell securities and/or loans to a lender in return for a cash advance. The lender is obligated to resell those same assets back to us at the end of the term for the advance amount. If the lender defaults on its obligation, we will incur a loss on the transaction equal to the difference between the value of the assets sold and the cash we received from the lender (assuming there was no change in the value of the securities and/or loans).
In addition, if a lender or counterparty files for bankruptcy or becomes insolvent, our borrowings under financing agreements with them may become subject to bankruptcy or insolvency proceedings, thus depriving us, at least temporarily, of the benefit of these assets. Such an event could restrict our access to financing and increase our cost of capital. Under applicable insolvency laws, the lender may also be permitted to repudiate the contract, and our claim against the lender for damages may be treated simply as an unsecured claim.
We, and certain of our vendors may, maintain cash in accounts with banking institutions that exceed the Federal Deposit Insurance Corporation (“FDIC”) insurance limits. If such banking institutions were to fail, we could lose all or a portion of those amounts held in excess of such insurance limitations. In addition, even if account holders are ultimately made whole with respect to a future bank failure, account holders’ access to their accounts and assets held in their accounts may be substantially delayed. Any material loss that we may experience in the future or inability for a material time period to access our cash could have an adverse effect on our liquidity, which could cause significant losses.
We have financed, and may in the future seek to, finance certain of our shorter-term loans via CLOs, and such transactions involve significant risks, including that the sponsor of such transactions will receive distributions from the CLO only if the CLO generates enough income to first pay all the investors holding senior tranches and all CLO expenses.
We have financed certain of our shorter-term loans by contributing them into CLO transactions in which we retained securities rated below-investment grade. In CLOs, investors purchase specific tranches, or slices, of debt instruments that are secured or backed by a pool of loans. The CLO debt classes have a specific seniority structure and priority of payments. The most junior securities of a CLO are generally retained by the sponsor of the CLO and are usually entitled to all of the income generated by the pool of loans after the payment of debt service on all the more senior classes of debt and the payment of all expenses. Defaults on the pool of loans therefore first affect the most junior tranches. The subordinate tranches of CLO debt may also experience a lower recovery and greater risk of loss, including risk of deferral or non-payment of interest than more senior tranches of the CLO debt, because they bear the bulk of defaults from the loans held in the CLO and serve to protect the other, more senior tranches from default in all but the most severe circumstances. Often CLOs contain loans that are more transitional than loans contributed to conduit securitizations. Despite the protection provided by the subordinate tranches, even more senior CLO tranches can experience substantial losses due to actual defaults, increased sensitivity to defaults due to collateral default and disappearance of protecting tranches, decline in market value due to market anticipation of defaults and aversion to CLO securities as a class. Further, the transaction documents relating to the issuance of CLO securities may impose eligibility criteria on the assets of the CLO, restrict the ability of the CLO’s sponsor to trade investments and impose certain portfolio-wide asset quality requirements. For example, reinvestment of loans into a CLO is subject to pre-approval by certain rating agencies. Finally, the Risk Retention Rule imposes a retention requirement of 5% of the issued debt classes by the sponsor of the CLO (as described above). These criteria, restrictions and requirements may limit the ability of the CLO’s sponsor (or collateral manager) to maximize returns on the CLO securities.
Market demand may limit our ability to issue CLOs and access their associated financing capacity. In addition, CLOs may not be actively traded, are relatively illiquid investments, and volatility in CLO trading market may cause the value of these investments to decline. The market value of CLO securities may be affected by, among other things, changes in the market value of the underlying loans held by the CLO, changes in the distributions on the underlying loans, defaults and recoveries on the underlying loans, capital gains and losses on the underlying losses (or foreclosure assets), prepayments on underlying loan and the availability, prices and interest rate of underlying loans. Furthermore, the leveraged nature of each subordinated tranche may magnify the adverse impact on such class of changes in the value of the loans, changes in the distributions on the loans, defaults and recoveries on the loans, capital gains and losses on the loans (or foreclosure assets), prepayment on loans and availability, price and interest rates of the loans.
As a result of the requirements of the Risk Retention Rule, if we purchase a horizontal subordinate strip of a CLO to satisfy the Risk Retention Rule, we would not be able to dispose of those subordinate interests during the required risk retention period, which may increase our risk of loss.
A CLO may include certain interest coverage tests, overcollateralization coverage tests or other tests that, if not met, may result in a change in the priority of distributions, which may result in the reduction or elimination of distributions to the subordinate debt and equity tranches until the tests have been met or certain senior classes of securities have been paid in full. For example, even if no loan in the pool experiences a default, an appraisal reduction of a loan in the pool may cause the pool of loans in the
applicable CLO not to meet certain of these tests. Accordingly, if such tests are not satisfied, we, as holders of the subordinate debt and equity interests in the applicable CLO, may experience a significant reduction in our cash flow from those interests.
Furthermore, if any CLO that we sponsor or in which we hold interests fails to meet certain tests relevant to the most senior debt issued and outstanding by the CLO issuer, an event of default may occur under that CLO. If that occurs, (i) if we were serving as manager of the CLO, our ability to manage the CLO may be terminated and (ii) our ability to attempt to cure any defaults in the CLO may be limited, which would increase the likelihood of a reduction or elimination of cash flow and returns to us in the CLOs for an indefinite time.
We cannot predict the effects of the transition away from the London Interbank Offered Rate (“LIBOR”) on our assets, liabilities and results of operations.
We had both assets and liabilities affected by the transition from LIBOR to SOFR (Secured Overnight Financing Rate). During the transition, we took steps to maintain the anticipated economic terms of the existing contracts. However, there can be no guarantee that our provisions for this transition included adequate methodologies for adjustments or that SOFR will be similar to or produce the economic equivalent of, or be more or less favorable than, LIBOR, particularly during times of economic stress. As such, the effect of the transition to SOFR may adversely impact our cost of capital and net investment income, which could ultimately adversely impact our results of operations, cash flows and the market value and liquidity of our investments.
In addition, we cannot predict potential other unforeseen impacts of the transition away from LIBOR. SOFR has a limited history, having been first published in April 2018. The future performance of SOFR, and SOFR-based reference rates, cannot be predicted based on SOFR’s history or otherwise. Future levels of SOFR may bear little or no relation to historical levels of SOFR, LIBOR or other rates. SOFR-based rates will differ from LIBOR, and the differences may be material. SOFR is intended to be a broad measure of the cost of borrowing funds overnight in transactions that are collateralized by U.S. Treasury securities, which differs fundamentally from LIBOR. LIBOR was intended to be an unsecured rate that represented interbank funding costs for different short-term tenors. It was a forward-looking rate reflecting expectations regarding interest rates for those tenors. Thus, LIBOR was intended to be sensitive to bank credit risk and to short-term interest rate risk. In contrast, SOFR is intended to be insensitive to credit risk and to risks related to interest rates other than overnight rates. SOFR has been more volatile than other benchmark or market rates, including LIBOR, during certain periods. Also, more than one SOFR-based rate is used in the financial markets. Like LIBOR, some SOFR-based rates are forward-looking term rates; other SOFR-based rates are intended to resemble rates for term structures through their use of averaging mechanisms applied to rates from overnight transactions, as in the case of “simple average” or “compounded average” SOFR. Different kinds of SOFR-based rates will result in different interest rates. Mismatches between SOFR-based rates, and between SOFR-based rates and other rates, may cause economic inefficiencies, particularly if market participants seek to hedge one kind of SOFR-based rate by entering into hedge transactions based on another SOFR-based rate or another rate. For these reasons, among others, there is no assurance that SOFR, or rates derived from SOFR, will perform in the same or a similar way as LIBOR would have performed at any time, and there is no assurance that SOFR-based rates will be a suitable substitute for LIBOR.
Risks Related to Regulatory and Compliance Matters
If our subsidiary that is regulated as a registered investment adviser is unable to meet the requirements of the SEC or fails to comply with certain U.S. federal and state securities laws and regulations, it may face termination of its investment adviser registration, fines or other disciplinary action.
Our subsidiary, Ladder Capital Asset Management LLC (“LCAM”), is regulated by the SEC as a registered investment adviser. Registered investment advisers are subject to the requirements and regulations of the Advisers Act. Such requirements relate to, among other things, fiduciary duties to advisory clients, maintaining an effective compliance program, conflicts of interest, recordkeeping and reporting requirements, disclosure requirements, limitations on agency cross and principal transactions between an advisor and advisory clients and general anti-fraud prohibitions. LCAM currently provides investment advisory services solely to Ladder-sponsored CLO Issuers. The CLO Issuers invest primarily in first mortgage loans secured by commercial real estate originated or acquired by Ladder and in participation interests in such loans. Non-compliance with the Advisers Act or other U.S. federal and state securities laws and regulations could result in investigations, sanctions, disgorgement, fines and reputational damage.
Our subsidiary that operates as a captive insurance company is subject to insurance laws and its outstanding borrowings are subject to the lending policies of the FHLB.
We have organized a captive insurance company, Tuebor (the “captive”), to provide coverage previously self-insured by us, including nuclear, biological or chemical coverage, excess property coverage and excess errors and omissions coverage. The
captive is regulated by the State of Michigan and is subject to regulations that cover all aspects of its business, including a requirement to maintain a certain minimum net capital. Violation of these regulations can result in revocation of its authorization to do business as a captive insurer or result in censures or fines. The captive could also be found to be in violation of the insurance laws of states other than Michigan (i.e., states where insureds are located), in which case, fines and penalties could apply from those states. Under certain circumstances, regulatory actions (such as new rulemakings) impacting the captive could result in limitations on the ability of the captive to borrow from the FHLB and thereby impact the FHLB’s availability as a source of financing for our operations.
Effective February 19, 2021, the captive is no longer permitted to initiate any new funding advances pursuant to the Federal Housing Finance Agency’s (“FHFA”) January 20, 2016 final rule amending its regulation of FHLB membership. Existing advances that mature after February 19, 2021 are permitted to remain in place until maturity of such advances. The captive is required to continue to hold shares of FHLB stock based on the amount of funds borrowed until its outstanding debt is repaid. Like any other investment, the captive’s participation in the FHLB involves some risk of loss and/or access to assets of the captive, both with respect to the shares of FHLB stock and the assets provided by the captive as collateral for its borrowings.
Tuebor’s outstanding advances from the FHLB as of December 31, 2023 were $115 million. FHLB advances amounted to 3.0% of the Company’s outstanding debt obligations as of December 31, 2023.
Certain of our entities have in the past and may in the future make loans to other of our entities on other-than-arms’-length terms.
Certain of our entities have in the past and may in the future make loans to other of our entities. Such loans may be made on other-than-arms’-length terms, and as a result, we could be deemed to be subject to an inherent conflict of interest in the event that the interest rates and related fees of such loans differ from those rates and fees then available in the marketplace. We expect that such loans will not give rise to a conflict of interest because such loans generally will be made at rates, and subject to fees, lower than those available in the marketplace; however, we will attempt to resolve any conflicts of interest that arise in a fair and equitable manner.
Maintenance of our exemption from registration under the Investment Company Act imposes significant limits on our operations. The value of our securities, including our Class A common stock, may be adversely affected if we are required to register as an investment company under the Investment Company Act.
We intend to conduct our operations so that neither we nor any of our subsidiaries (including any series thereof) are required to register as an investment company under the Investment Company Act.
If we or any of our subsidiaries (including any series thereof) fail to qualify for, and maintain an exemption from, registration under the Investment Company Act, or an exclusion from the definition of an investment company, we could, among other things, be required either to: (i) substantially change the manner in which we conduct our operations to avoid being required to register as an investment company; (ii) effect sales of our assets in a manner that, or at a time when, we would not otherwise choose to do so; or (iii) register as an investment company under the Investment Company Act, any of which could have an adverse effect on us, our financial results, the sustainability of our business model, the value of our securities (including the Notes) or our ability to satisfy our obligations in respect of the Notes.
If we or any of our subsidiaries (including any series thereof) were required to register as an investment company under the Investment Company Act, the registered entity would become subject to substantial regulation with respect to capital structure (including the ability to use leverage), management, operations, transactions with affiliated persons (as defined in the Investment Company Act), portfolio composition, including restrictions with respect to diversification and industry concentration, compliance with reporting, record keeping, voting, proxy disclosure and other rules and regulations that would significantly change its operations and we would not be able to conduct our business as described herein. For example, because affiliate transactions are generally prohibited under the Investment Company Act, we would not be able to enter into certain transactions with any of our affiliates if we are required to register as an investment company, which could have a material adverse effect on our ability to operate our business.
If we were required to register ourselves as an investment company but failed to do so, we would be prohibited from engaging in our business, and criminal and civil actions could be brought against us. In addition, our contracts would be unenforceable unless a court required enforcement, and a court could appoint a receiver to take control of us and liquidate our business.
We believe we are not an investment company under Section 3(a)(1)(A) of the Investment Company Act because we do not engage primarily, or hold ourselves out as being engaged primarily, and do not propose to engage primarily, in the business of investing, reinvesting or trading in securities. However, under Section 3(a)(1)(C) of the Investment Company Act, because we
are a holding company that will conduct its businesses primarily through majority-owned subsidiaries (including any series thereof), the securities issued by these subsidiaries (including any series thereof) that are excepted from the definition of “investment company” under Section 3(c)(1) or 3(c)(7) of the Investment Company Act, together with any other investment securities we may own, may not have a combined value in excess of 40% of the value of adjusted total assets (exclusive of government securities and cash items) on an unconsolidated basis (the “40% test”). This requirement limits the types of businesses in which we may engage through our subsidiaries (including any series thereof). In addition, the assets we and our subsidiaries (including any series thereof) may originate or acquire are limited by the provisions of the Investment Company Act and the rules and regulations promulgated thereunder, which may adversely affect our business.
We expect that certain of our subsidiaries (including any series thereof) may rely on the exclusion from the definition of “investment company” under the Investment Company Act pursuant to Section 3(c)(5)(C) of the Investment Company Act, which is available for entities “primarily engaged” in the business of “purchasing or otherwise acquiring mortgages and other liens on and interests in real estate.” This exclusion, as interpreted by the staff of the SEC, requires that an entity invest at least 55% of its assets in qualifying real estate assets and at least 80% of its assets in qualifying real estate assets and real estate-related assets. We expect each of our subsidiaries (including any series thereof) relying on Section 3(c)(5)(C) to rely on guidance published by the SEC staff or on our analyses of such guidance to determine which assets are qualifying real estate assets and real estate-related assets. However, the SEC’s guidance was issued in accordance with factual situations that may be substantially different from the factual situations we may face. We have not received, nor have we sought, a no-action letter from the SEC regarding how our investment strategy fits within the exclusions from the definition of an “investment company” under the Investment Company Act that we and our subsidiaries (including any series thereof) are relying on. No assurance can be given that the SEC staff will concur with the classification of each of our subsidiaries’ assets. The SEC staff may, in the future, issue further guidance that may require us to re-classify our assets for purposes of qualifying for an exclusion from the definition of an “investment company” under the Investment Company Act. If we are required to re-classify our assets, certain of our subsidiaries (including any series thereof) may no longer be in compliance with the exclusion from the definition of an “investment company” provided by Section 3(c)(5)(C) of the Investment Company Act, and, in turn, we may not satisfy the requirements to avoid falling within the definition of an “investment company” provided by Section 3(a)(1)(C). To the extent that the SEC staff publishes new or different guidance or disagrees with our analysis with respect to any assets of our subsidiaries we have determined to be qualifying real estate assets or real estate-related assets, we may be required to adjust our strategy accordingly. In addition, we may be limited in our ability to make certain investments and these limitations could result in a subsidiary holding assets we might wish to sell or selling assets we might wish to hold.
Any of the Company or our subsidiaries (including any series thereof) may rely on the exemption provided by Section 3(c)(6) of the Investment Company Act to the extent that they primarily engage, directly or through majority-owned subsidiaries (including any series thereof), in the businesses described in Sections 3(c)(3), 3(c)(4) and 3(c)(5) of the Investment Company Act. The SEC staff has issued little interpretive guidance with respect to Section 3(c)(6) and any guidance published by the staff could require us to adjust our strategy accordingly.
We determine whether an entity (including any series thereof) is one of our majority-owned subsidiaries. The Investment Company Act defines a majority-owned subsidiary of a person as a company 50% or more of the outstanding voting securities of which are owned by such person, or by another company which is a majority-owned subsidiary of such person. The Investment Company Act further defines voting securities as any security presently entitling the owner or holder thereof to vote for the election of directors of a company. We treat companies in which we own at least a majority of the outstanding voting securities as majority-owned subsidiaries for purposes of the 40% test. We have not requested that the SEC approve our treatment of any company as a majority-owned subsidiary and the SEC has not done so. If the SEC were to disagree with our treatment of one or more companies as majority-owned subsidiaries, we would need to adjust our strategy and our assets in order to continue to pass the 40% test. Any such adjustment in our strategy could have a material adverse effect on us.
There can be no assurance that the laws and regulations governing the Investment Company Act exemptions and exclusions described above will not change in a manner that adversely affects our operations, including the SEC or its staff providing more specific or different guidance regarding Section 3(c)(5)(C), including the nature of the assets that qualify for purposes of the exclusion and whether companies that are engaged in the business of acquiring mortgages and mortgage-related instruments should be regulated in a manner similar to investment companies. If we or our subsidiaries (including any series thereof) fail to maintain an exemption from registration under the Investment Company Act, we could, among other things, be required to: (i) change the manner in which we conduct our operations to avoid being required to register as an investment company; (ii) effect sales of our assets in a manner that, or at a time when, we would not otherwise choose to do so; or (iii) register as an investment company, any of which could negatively affect our financial results, the sustainability of our business model, or the value of our securities. In addition, if we or any of our subsidiaries were required to register as an investment company under the Investment Company Act, the registered entity would become subject to substantial regulation with respect to capital structure (including the ability to use leverage), management, operations, transactions with affiliated persons (as defined in the Investment Company
Act), portfolio composition, including restrictions with respect to diversification and industry concentration, compliance with reporting, record keeping, voting, proxy disclosure and other rules and regulations that would significantly change our operations.
See also “Rapid changes in the values of our assets may make it more difficult for us to maintain our qualification as a REIT or exemption from registration under the Investment Company Act.”
Actual or perceived environmental, social and governance matters may cause us to incur additional costs or reputational harm or result in investors ceasing to allocate their capital to us, all of which could adversely affect our business and results of operations.
There has been increasing scrutiny and political pushback on companies from investors, regulators and other stakeholders related to environmental, social and governance (“ESG”) matters that has and may continue to result in inconsistent federal and state regulations and enforcement. For example, regulators are focused on companies that do not fulfill their claims of environmental sustainability and a variety of organizations, such as ESG ratings agencies, have developed and published rating systems and other scoring and reporting mechanisms to promote or accommodate the consideration of ESG factors by investors. However, certain state governors, legislatures, and attorneys general have passed laws or otherwise discouraged companies from considering ESG factors when making investment decisions, particularly with respect to public funds. Companies must balance these competing interests in determining how to best address ESG.
ESG ratings agencies evaluate and compare our ESG performance with that of others in our industry. We do not participate in all such systems and may not score as well in all of the available ratings systems, as the proliferation of third-party providers of ESG ratings and reports has resulted in varied standards. These ratings systems may, for example, not be correlated to each other, depend on estimates, and continue to evolve. Further, the extent to which such rating agencies accept company feedback and the timing for reflecting such feedback in their reports varies, and scores are often based on a relative ranking, which may cause our scores to deteriorate if peer rankings improve. Still, current shareholders and prospective investors may use these ratings, and/or their own internal ESG benchmarks, to determine whether, and to what extent, they may choose to invest in our securities, engage with us to advocate for improved ESG performance or disclosure, make voting decisions as shareholders, or take other actions to hold us and our board of directors accountable with respect to ESG matters.
Regardless of the industry, investors’ increased focus related to ESG and similar matters may hinder access to capital, as investors may decide to reallocate capital or to not commit capital as a result of a company’s ESG practices or ratings. If we do not adapt to or comply with ESG rating agency, investor or other stakeholder expectations and standards, which are evolving, or if we are perceived to have not responded appropriately to the growing concern for ESG issues, we may suffer from reputational damage and our business, financial condition, and/or stock price could be materially and adversely affected. ESG rating agencies and our stakeholders may look to us to implement more or different ESG policies, procedures, standards or goals in order to improve our ratings, continue engaging with us, remain invested in us, or before they make further investments in us. In addition, the standards for tracking and reporting on ESG matters are relatively new, have not been harmonized, and continue to evolve. As a result, our selection of ESG disclosure frameworks and topics may change from time to time, may result in a lack of comparative data from period to period, or differ from the expectations of our shareholders and other stakeholders. To the extent investors focused on ESG ratings or matters are not satisfied with our ESG ratings or progress, we may not be able to raise sufficient capital, which may adversely affect our revenues. Relatedly, collecting, measuring, and reporting ESG information and metrics can be costly, difficult and time consuming, and can present numerous operational, reputational, financial, legal and other risks, any of which could have negative impact on our business, reputation and stock price. Additionally, adverse incidents with respect to ESG activities could impact our reputation or the cost of our operations and relationships with investors, all of which could adversely affect our business and results of operations. If we do not successfully manage expectations across these varied stakeholder interests, it could erode stakeholder trust, impact our reputation, and constrain our investment opportunities.
There is also a growing regulatory interest across jurisdictions in improving transparency regarding the definition, measurement and disclosure of ESG factors. Any new rules or regulations may result in increased legal, accounting and financial compliance costs, make some activities more difficult, time-consuming and costly, and place strain on our personnel, systems and resources.
Risks Related to Hedging
We may choose to hedge our risks or not, and both choices could expose us to potential losses.
Part of our strategy involves entering into hedging transactions that could require us to fund cash payments in certain circumstances (such as the early termination of the hedging instrument caused by an event of default or other early termination
event, or the decision by a counterparty to request margin transfers it is contractually owed under the terms of the hedging agreement). These potential payments would be contingent liabilities and, therefore, may not appear in our financial statements. The amount due would be equal to the unrealized loss of the open positions with the respective counterparty and could also include other fees and charges. These economic losses would be reflected in our results of operations, and our ability to fund these obligations depends on the liquidity of our assets and access to capital at the time, and the need to fund these obligations could adversely impact our financial condition.
Our hedging activity varies in scope based on the level and volatility of interest rates, the type of assets held, compliance with REIT rules, and other changing market conditions. Hedging against interest rate, credit and market value changes may fail to protect or could adversely affect our business because, among other things:
•hedging can be expensive, particularly during periods of rising and volatile interest rates;
•available hedges may not correspond directly with the risk for which protection is sought;
•due to a credit loss or other factors, the duration of the hedge may not match the duration of the related liability;
•applicable law may require mandatory margining or clearing of certain hedges we may wish to use, which may raise costs;
•the counterparties with which we engage in hedging transactions may cease making markets and quoting prices in such instruments, which may render us unable to enter into an offsetting transaction with respect to an open position;
•the credit quality of the hedging counterparty owing money on the hedge may be downgraded to such an extent that it impairs our ability to sell or assign the hedging transaction;
•the hedging counterparty may default on its obligations to us (including payment or delivery obligations);
•we may have to limit our use of hedging techniques that might otherwise be advantageous or to implement those hedges through a TRS to comply with REIT requirements, increasing the cost of our hedging activities because our TRSs would be subject to tax on gains and hedging-related losses in our TRSs will generally not provide any tax benefit, except for losses carried forward against future taxable income in the TRSs; and
•we may purchase a hedge that turns out not to be necessary (i.e., a hedge that is out of the money).
In addition, we may fail to recalculate, readjust and execute hedges in an efficient manner. We may also decide not to engage in one or more hedging transactions or refrain from using hedging to mitigate some or all of a specific risk, potentially resulting in losses.
Any hedging activity in which we engage may materially and adversely affect our results of operations and cash flows. Therefore, while we may enter into such transactions seeking to reduce interest rate risks, unanticipated changes in interest rates may result in poorer overall investment performance than if we had not engaged in any such hedging transactions. In addition, the degree of correlation between price movements of the instruments used in a hedging strategy and price movements in the portfolio positions or liabilities being hedged may vary materially. For a variety of reasons, we may not seek to establish a perfect correlation between such hedging instruments and the portfolio positions or liabilities being hedged. Any such imperfect correlation may prevent us from achieving the intended hedge and expose us to risk of loss. We may also decide from time to time to close out, or terminate a portion of, our outstanding hedges upon the determination that they are no longer effective, which may result in incurring realized losses and increased exposure to the previously hedged risks.
A liquid secondary market may not exist for certain hedging instruments and they, therefore, may involve risks and costs that could result in material losses.
We cannot assure you that a liquid secondary market exists or will exist for our hedging transactions, and we may be required to maintain a position for a longer period than desired, which could result in misalignment with the risk being hedged and significant losses. Hedging instruments are not traded on regulated exchanges, guaranteed by an exchange or its clearing house, or regulated by any governmental authorities. The use of derivative instruments is, however, subject to an increasing number of potentially applicable laws and regulations. These laws and regulations are complex, compliance with them may be costly and time consuming, and our failure to comply with any of these laws and regulations could subject us to lawsuits or government actions and damage our reputation.
The enforceability of certain rights under agreements underlying certain hedging transactions may depend on compliance with applicable statutory and regulatory requirements under U.S. law and, depending on the identity of the counterparty, applicable international requirements. The business failure of a hedging counterparty will most likely result in its default, potentially resulting in the loss of (or delay in obtaining) unrealized profits and forcing us to cover our commitments, if any, at the then current market price. A liquid secondary market may not exist for these hedging instruments, and we may be required to maintain a position until exercise or expiration, which could result in material losses.
We may enter into hedging transactions that are subject to mandatory clearing and/or margin requirements.
Part of our strategy will involve entering into hedging transactions that may be required to be cleared under relevant Commodity Futures Trading Commission (“CFTC”) regulations and therefore subject to associated margin requirements
imposed by the applicable clearinghouse. The amount of margin we may be required to post on cleared transactions is subject to the rules of the relevant clearinghouse, which may provide the clearinghouse with discretion to increase those requirements. In addition, clearing intermediaries (e.g., futures commission merchants) who clear our trades with a clearinghouse may have contractual rights to increase the margin requirements above clearinghouse minimums.
With respect to uncleared swaps that could be needed to execute our hedging strategy, U.S. regulations may require our intermediaries to collect margin from us. Similar rules have been adopted in Europe and other jurisdictions where our dealer counterparties may be located. These rules impose obligations on many derivatives market participants to collect and post “variation margin” in connection with over-the-counter derivatives and, on a smaller group of market participants, to also collect and post “initial margin.” The overall impact on us depends on the impact on prices in the interdealer derivatives market (which may affect the pricing we can obtain from dealers) and whether one or both of these margin requirements apply to our derivatives counterparties when transacting with us. In general, initial margin requirements apply only if both counterparties have derivatives activities over regulatory thresholds. When they apply, the initial margin rules for uncleared derivatives are generally intended to impose higher margin requirements than those applicable for similar cleared derivatives. We could be subject to a requirement to post significantly more initial margin on uncleared swaps, which could significantly increase the costs of engaging in uncleared swaps as part of our heading strategies.
Our ability to fund these obligations will depend on the liquidity of our assets and access to capital at the time and our failure to comply with any of these obligations could adversely affect our business, financial condition, results of operations, and our ability to make distributions to our shareholders.
In addition, we may transact in derivative instruments that are neither presently contemplated nor currently available, but which may be developed in the future, to the extent such opportunities are both consistent with our investment objectives and legally permissible. Any such transactions may expose us to unique and presently indeterminate risks, the impact of which may not be capable of determination until such instruments are developed and/or we determine to make such an investment.
For these and other reasons, our hedging activity may materially adversely affect our business, financial condition and results of operations and our ability to make distributions to our shareholders.
Risks Related to Our Class A Common Stock
The market price and trading volume of our Class A common stock may be volatile, which could result in rapid and substantial losses for our shareholders.
The market price of our Class A common stock may be highly volatile and could be subject to wide fluctuations. In addition, the trading volume in our Class A common stock may fluctuate and cause significant price variations to occur. If the market price of our Class A common stock declines significantly, you may be unable to sell your Class A common stock at or above your purchase price, if at all. We cannot assure you that the market price of our Class A common stock will not fluctuate or decline significantly in the future. Some of the factors that could negatively affect the price of our Class A common stock or result in fluctuations in the price or trading volume of our Class A common stock include:
•our actual or projected operating results, financial condition, cash flows and liquidity, or changes in business strategy or prospects;
•variations in our quarterly operating results;
•a compression of the yield on our investments and an increase in the cost of our liabilities;
•changes in the value of our portfolio;
•failure to meet our earnings estimates;
•publication of research reports about us or the commercial real estate industry or the failure of securities analysts to cover our Class A common stock;
•additions or departures of our executive officers and other key management personnel;
•adverse market reaction to any indebtedness we may incur or loss of a major funding source or securities we may issue in the future;
•dilutive equity issuances by us, including additional shares of Class A common stock and options, rights, warrants and appreciation rights relating to Class A common stock or securities convertible into Class A common stock, as authorized by our board of directors or pursuant to an equity incentive plan, or significant share resales by our shareholders, or the perception that such issuances or resales may occur;
•issuance of securities at a price less than our then-current book value per share;
•the timing, amount, pricing and any potential discontinuance of Class A common stock repurchases by the Company;
•the issuance of any debt or equity securities that rank senior to our Class A common stock or which may have rights, preferences and privileges more favorable than those of our Class A common stock;
•actions by shareholders;
•changes in market valuations or operating performance of similar companies;
•speculation in the press or investment community;
•changes or proposed changes in laws or regulations or differing interpretations thereof affecting our business or enforcement of these laws and regulations, or announcements relating to these matters;
•adverse publicity;
•actual or anticipated changes in our current or future dividend yield, including as a result of increases in market interest rates, which may lead investors to demand a higher dividend yield for our Class A common stock and would result in increased interest expenses on our debt that lowers our income available for distribution;
•failure to maintain our REIT qualification or exemption from registration under the Investment Company Act;
•a credit rating downgrade;
•significant volatility in the market price and trading volume of securities of publicly traded REITs or other companies in our sector, including us, which is not necessarily related to the operating performance of these companies;
•short-selling pressure with respect to shares of our Class A common stock or REITs generally;
•price and volume fluctuations in the overall stock market from time to time; and
•general market, economic, geopolitical and world health conditions or events, and trends including inflationary concerns.
In the past, securities class action litigation has often been instituted against companies following periods of volatility in their share price. This type of litigation could result in substantial costs and divert our attention and resources.
Our charter contains REIT-related restrictions on the ownership of, and ability to transfer, our Class A common stock.
Among other things, our charter provides that, subject to the exceptions and the constructive ownership rules described therein, no person may own, or be deemed to own, in excess of: (i) 9.8% in value of the outstanding shares of all classes or series of Ladder capital stock, or (ii) 9.8% in value or number (whichever is more restrictive) of the outstanding shares of any class of Ladder common stock.
In addition, the charter prohibits: (i) any person from transferring shares of Ladder Capital stock if such transfer would result in shares of Ladder capital stock being beneficially owned by fewer than 100 persons; and (ii) any person from beneficially or constructively owning shares of Ladder capital stock if such ownership would result in Ladder failing to qualify as a REIT.
There can be no assurance that our board of directors, as permitted in the charter, will increase, or will not decrease, this ownership limitation in the future. Any attempt to own or transfer shares of our Class A common stock in excess of the ownership limitation without the consent of our board of directors would result in either the shares being transferred by operation of our charter to a charitable trust, and the person who attempted to acquire such excess shares not having any rights in such excess shares, or in the transfer being void.
These ownership limitations and transfer restrictions could have the effect of delaying, deferring or preventing a takeover or other transaction in which shareholders might receive a premium for their shares of Ladder Capital stock over the then prevailing market price or which shareholders might believe to be otherwise in their best interest.
Anti-takeover provisions in our charter documents and Delaware law could delay or prevent a change in control.
Our amended and restated certificate of incorporation and amended and restated by-laws may delay or prevent a merger or acquisition that a shareholder may consider favorable by permitting our board of directors to issue one or more series of preferred stock, requiring advance notice for shareholder proposals and nominations, and placing limitations on convening shareholder meetings. Our charter also contains provisions that make removal of our directors difficult, which makes it more difficult for our shareholders to effect changes to our management and may prevent a change in control of the Company. In addition, we are subject to provisions of the Delaware General Corporate Law (the “DGCL”) that restrict certain business combinations with interested shareholders. These provisions may also discourage acquisition proposals or delay or prevent a change in control, which could harm our stock price.
Risks Related to Our Taxation as a REIT
If we fail to qualify as a REIT, we will be subject to tax as a regular corporation and could face a substantial tax liability, which would reduce the amount of cash available for distribution to our shareholders.
We operate and intend to continue operating in a manner that will allow us to qualify as a REIT for U.S. federal income tax purposes. Qualification as a REIT involves the application of highly technical and complex Code provisions for which only limited judicial and administrative authorities exist. Even a technical or inadvertent violation could jeopardize our REIT qualification. New legislation, court decisions or administrative guidance, in each case possibly with retroactive effect, may make it more difficult or impossible for us to qualify as a REIT.
Although we have not requested and we do not intend to request a ruling from the IRS as to our REIT qualification, in connection with various corporate initiatives we have received opinions from Skadden, Arps, Slate, Meagher & Flom LLP
(“Skadden”) and Kirkland & Ellis LLP (“Kirkland”) with respect to our qualification as a REIT. Investors should be aware, however, that opinions of counsel are not binding on the IRS or any court, are based on our counsel’s review and analysis of existing law and on certain representations as to factual matters and covenants made by us, were expressed as of the date issued and do not cover subsequent periods. Skadden and Kirkland have no obligation to advise us or the holders of our Class A common stock of any subsequent change in the matters stated, represented or assumed, or of any subsequent change in applicable law.
Our qualification as a REIT depends on our satisfaction of certain asset, income, organizational, distribution, shareholder ownership and other requirements on a continuing basis that require the significant use of judgment. Our ability to satisfy the gross income and asset tests depends upon our analysis of the characterization and fair market values of our assets, some of which are not susceptible to a precise determination, and for which we will not obtain independent appraisals. Moreover, we invest in certain assets with respect to which the rules applicable to REITs are particularly difficult to interpret or to apply. If the IRS challenged our treatment of these assets as real estate assets for purposes of the REIT asset tests, and if such a challenge were sustained, we could fail to meet the asset tests applicable to REITs and thus fail to qualify as a REIT. Our compliance with the annual REIT income and quarterly asset requirements also depends upon our ability to successfully manage the composition of our income and assets on an ongoing basis.
Our ability to satisfy the requirements to qualify as a REIT depends in part on the actions of third parties over which we have no control or only limited influence, including in cases where we own an equity interest in an entity that is classified as a partnership for U.S. federal income tax purposes. The Company’s exemption from U.S. federal income tax with respect to certain assets may be dependent on the accuracy of legal opinions or advice rendered or given or statements by the issuers of assets that the Company acquires, and the inaccuracy of any such opinions, advice or statements may adversely affect the Company’s REIT qualification and result in significant corporate-level tax. Our compliance with the annual REIT income and quarterly asset requirements also depends upon our ability to successfully manage the composition of our income and assets on an ongoing basis.
If we were to fail to qualify as a REIT in any taxable year, and we do not qualify for certain statutory relief provisions, we would be subject to U.S. federal income tax on our taxable income at regular corporate rates, and dividends paid to our shareholders would not be deductible by us in computing our taxable income. Any resulting corporate tax liability could be substantial and we might be required to borrow funds or liquidate some investments in order to pay the applicable tax. The tax would reduce the amount of cash available for distribution to our shareholders, which in turn could have an adverse impact on the value of our Class A common stock. Unless we were entitled to relief under certain provisions of the Code, we also would be disqualified from taxation as a REIT for the four taxable years following the year in which we failed to qualify as a REIT and we would no longer be required to make distributions to shareholders. Additionally, for tax years beginning after December 31, 2022, we would possibly also be subject to certain taxes enacted by the Inflation Reduction Act of 2022 that are applicable to non-REIT corporations, including a corporate alternative minimum tax.
Certain of our subsidiaries have also elected to be taxed as REITs under the Code and are, therefore, subject to the same risks in the event that they fail to qualify as REITs in any taxable year. If any of these subsidiaries were to fail to qualify as a REIT, then we might also fail to qualify as a REIT.
Our ownership of, and relationship with, TRSs is limited, and a failure to comply with the limits would jeopardize our REIT qualification, and our transactions with our TRSs may result in the application of a 100% excise tax if such transactions are not conducted on arm’s-length terms.
A REIT may own up to 100% of the stock of one or more TRSs. A TRS may earn income that would not be REIT-qualifying income if earned directly by a REIT. Both the subsidiary and the REIT must jointly elect to treat the subsidiary as a TRS. Overall, no more than 20% of the value of a REIT’s assets may consist of stock and securities of one or more TRSs. The value of our interests in and, therefore, the amount of assets held in a TRS may also be restricted by our need to qualify for an exemption from registration as an investment company under the Investment Company Act. A domestic TRS will pay U.S. federal, state and local income tax at regular corporate rates on any income that it earns and the TRS rules limit the deductibility of interest paid or accrued by a TRS to its parent REIT to assure that the TRS is subject to an appropriate level of corporate taxation. In addition, the TRS rules impose a 100% excise tax on certain transactions between a TRS and its parent REIT that are not conducted on an arm’s-length basis.
We elected for certain of our subsidiaries to be treated as TRSs. Their after-tax income is available for distribution to us but is not required to be distributed to us. We monitor the value of our investments in our TRSs to ensure compliance with the 20% rule at the end of each calendar quarter. In addition, we scrutinize all of our transactions with TRSs to ensure that they are entered into on arm’s-length terms to avoid incurring the 100% excise tax described above. There can be no assurance, however, that we will be able to comply with the TRS limitations or to avoid application of the 100% excise tax.
REIT distribution requirements could adversely affect our ability to execute our business plan.
We generally must distribute annually at least 90% of our REIT taxable income, subject to certain adjustments and excluding any net capital gain, in order to qualify as a REIT and for U.S. federal corporate income tax not to apply to earnings that we distribute. To the extent that we satisfy this distribution requirement, but distribute less than 100% of our REIT taxable income, we would be subject to U.S. federal corporate income tax on our undistributed taxable income. In addition, we would be subject to a non-deductible 4% excise tax if the actual amount distributed to our shareholders in a calendar year is less than a minimum amount specified under U.S. federal tax laws. We intend to make distributions to our shareholders to comply with the REIT qualification requirements of the Code.
From time to time, we may generate taxable income greater than our income for financial reporting purposes prepared in accordance with GAAP, or differences in timing between the recognition of taxable income and the actual receipt of cash may occur. For example, if we purchase CMBS at a discount, we are generally required to include the discount in taxable income prior to receiving the cash proceeds of the accrued discount at maturity. Additionally, if we incur capital losses in excess of capital gains, such net capital losses are not allowed to reduce our taxable income for purposes of determining our distribution requirement. Such net capital losses may be carried forward for a period of up to five years and applied against future capital gains subject to the limitation of our ability to generate sufficient capital gains, which cannot be assured. We may be required to make distributions to shareholders at disadvantageous times or when we do not have funds readily available for distribution. If we do not have other funds available in these situations, we could be required to borrow funds on unfavorable terms, sell investments at disadvantageous prices, make a taxable distribution of our shares, or distribute amounts that would otherwise be invested in future acquisitions to make distributions sufficient to maintain our qualification as a REIT, or avoid corporate income tax and the non-deductible 4% excise tax in a particular year. These alternatives could increase our costs or reduce our shareholders’ equity. Thus, compliance with the REIT requirements may hinder our ability to grow, which could adversely affect the value of our Class A common stock.
We have not established a minimum distribution payment level and we cannot assure you of our ability to pay distributions in the future.
To maintain our qualification as a REIT and generally not be subject to U.S. federal income and excise tax, we intend to make regular quarterly cash distributions to our shareholders out of legally available funds therefor. Our dividend policy as a REIT generally is to pay quarterly distributions either in cash or stock to comply with the REIT distribution requirements of the Code. We have not, however, established a minimum distribution payment level and our ability to pay distributions may be adversely affected by a number of factors, including the risk factors described in this Annual Report. All distributions are made at the discretion of our board of directors and depend on our earnings, our financial condition, any debt covenants, maintenance of our REIT qualification, restrictions on making distributions under Delaware law and other factors as our board of directors may deem relevant from time to time. We may not be able to make distributions in the future and our board of directors may change our distribution policy in the future. We believe that a change in any one of the following factors, among others, could adversely affect our results of operations and impair our ability to pay distributions to our shareholders:
•the profitability of the assets we hold or acquire;
•the allocation of assets between our REIT-qualified and non-REIT-qualified subsidiaries;
•the impact of changes in interest rates on our net interest income;
•the fact that anticipated operating expense levels may not prove accurate, as actual results may vary from estimates;
•our ability to make profitable investments and to realize profit therefrom;
•margin calls or other expenses that may reduce our cash flow; and
•defaults in our asset portfolio or decreases in the value of our portfolio.
We cannot assure you that we will achieve results that will allow us to make a specified level of cash distributions or any increase in the level of such distributions in the future or that the level of any distributions we do make to our shareholders will achieve a market yield or increase or even be maintained over time, any of which could materially and adversely affect us.
If we were to make a taxable distribution of shares of our stock, shareholders may be required to sell such shares or sell other assets owned by them in order to pay any tax imposed on such distribution.
We may distribute taxable dividends that are payable incash and shares of our Class A common stock. Taxable shareholders receiving such distributions would be required to include the full amount of such distribution as income to the extent of our current and accumulated earnings and profits for U.S. federal income tax purposes. As a result, a shareholder may be required to pay tax with respect to such dividends in excess of cash received. Accordingly, shareholders receiving a distribution of our shares may be required to sell shares received in such distribution or may be required to sell other stock or assets owned by them, at a time that may be disadvantageous, in order to satisfy any tax imposed on such distribution. If a shareholder sells the shares it receives as a dividend in order to pay such tax, the sale proceeds may be less than the amount included in income with respect to the dividend. Moreover, in the case of a taxable distribution of shares of our stock with respect to which any withholding tax is imposed on a non-U.S. shareholder, we may have to withhold or dispose of part of the shares in such
distribution and use such withheld shares or the proceeds of such disposition to satisfy the withholding tax imposed. In addition, if a significant number of our shareholders determine to sell shares of our Class A common stock in order to pay taxes owed on dividends, it may put downward pressure on the trading price of our Class A common stock.
Distributions payable by REITs do not qualify for the reduced tax rates available for some dividends.
Distributions out of our current earnings and profits that we make to our shareholders are generally taxable to our shareholders as ordinary income. However, a portion of our distributions may be designated by us as: (i) “capital gain dividends” subject to capital gains tax rates to the extent that they are attributable to capital gain income recognized by us; (ii) “qualified dividend income;” or (iii) to the extent that they exceed our current earnings and profits as determined for U.S. federal income tax purposes, a “return of capital,” which is not taxable, but has the effect of reducing the basis of a shareholder’s investment in our Class A common stock.
While a reduced tax rate of up to 20% currently applies to “qualified dividend income” paid by non-REIT “C” corporations to domestic shareholders that are individuals, trusts and estates. Distributions of ordinary income payable by REITs, however, generally are not eligible for these reduced rates. However, pursuant to the 2017 Tax Cuts and Jobs Act, such domestic shareholders may generally be allowed to deduct from their taxable income one-fifth of the ordinary dividends payable to them by REITs for taxable years beginning before January 1, 2026. This would amount to a reduction in the effective tax rate on REIT dividends as compared to prior law. Prospective investors should consult their own tax advisors regarding the effect of this rule on their effective tax rate with respect to REIT dividends.
Still, the more favorable rates applicable to regular corporate qualified dividends could cause investors who are individuals, trusts and estates to perceive investments in REITs to be relatively less attractive than investments in the stocks of non-REIT corporations that pay qualified dividends, which could adversely affect the value of the stock of REITs, including our Class A common stock.
Even if we qualify as a REIT, we may face other tax liabilities that reduce our cash flow.
Even if we qualify for taxation as a REIT, we may be subject to certain U.S. federal, state and local taxes on our income and assets, including taxes on any undistributed income, taxes on income from some activities conducted as a result of a foreclosure, excise taxes, state or local income, property and transfer taxes, mortgage recording taxes, and other taxes. In addition, in order to meet the REIT qualification requirements, prevent the recognition of certain types of non-cash income, or to avert the imposition of a 100% prohibited transaction tax that applies to certain gains derived by a REIT from dealer property or inventory, we intend to hold some of our assets through our TRSs or other subsidiary corporations that will be subject to corporate level income tax at regular corporate rates. In addition, if we lend money to a TRS, the TRS may be unable to deduct all or a portion of the interest paid to us, which could result in an even higher corporate level tax liability. Furthermore, the Code imposes a 100% excise tax on certain transactions between a TRS and a REIT that are not conducted on an arm’s length basis. There can be no assurances, however, that we will be able to avoid application of the 100% excise tax. The payment of any of these taxes would decrease cash available for distribution to our shareholders.
Complying with REIT requirements may cause us to forgo attractive opportunities or liquidate attractive investments.
To qualify as REITs for U.S. federal income tax purposes, we and certain of our subsidiaries must continually satisfy tests concerning, among other things, the sources of our income, the nature and diversification of our assets, the amounts that we distribute to our shareholders and the ownership of our stock. We may be required to make distributions to shareholders at disadvantageous times or when we do not have funds readily available for distribution and may be unable to pursue or be required to liquidate investments that would be otherwise advantageous to us in order to satisfy the source-of-income or asset-diversification requirements for qualifying as a REIT. Thus, compliance with the REIT requirements may hinder our ability to make and, in certain cases, to maintain ownership of, certain attractive investments.
Further, to qualify as REITs, at the end of each calendar quarter, at least 75% of the value of our assets must consist of cash, cash items, government securities and qualified real estate assets. The remainder of our investments in securities (other than government securities and qualified real estate assets) generally cannot include more than 10% of the outstanding voting securities of any one issuer or more than 10% of the total value of the outstanding securities of any one issuer. In addition, in general, no more than 5% of the value of our assets (other than government securities and qualified real estate assets) can consist of the securities of any one issuer, and no more than 20% of the value of our total assets can be represented by securities of one or more TRSs. If we fail to comply with these requirements at the end of any calendar quarter, we must correct the failure within 30 days after the end of the calendar quarter or qualify for certain statutory relief provisions to avoid losing our REIT qualification and suffering adverse tax consequences. As a result, we may be required to liquidate otherwise attractive investments from our investment portfolio. These actions could have the effect of reducing our income and amounts available for distribution to our shareholders.
The failure of assets subject to repurchase agreements to qualify as real estate assets could adversely affect our ability to qualify as a REIT.
We enter into certain financing arrangements that are structured as sale and repurchase agreements pursuant to which we nominally sell certain of our assets to a counterparty and simultaneously enter into an agreement to repurchase these assets at a later date in exchange for a purchase price. Economically, these agreements are financings that are secured by the assets sold pursuant thereto. We believe that we will be treated for REIT asset and income test purposes as the owner of the assets that are the subject of any such sale and repurchase agreement notwithstanding that such agreement may transfer record ownership of the assets to the counterparty during the term of the agreement. It is possible, however, that the IRS could assert that we did not own the assets during the term of the sale and repurchase agreement, in which case we could fail to qualify as a REIT.
Distributions to tax-exempt investors may be classified as unrelated business taxable income.
Neither ordinary nor capital gain distributions with respect to our Class A common stock nor gain from the sale of Class A common stock should generally constitute unrelated business taxable income to a tax-exempt investor. However, there are certain exceptions to this rule. In particular:
•part of the income and gain recognized by certain qualified employee pension trusts with respect to our Class A common stock may be treated as unrelated business taxable income if shares of our Class A common stock are predominantly held by qualified employee pension trusts, and we are required to rely on a special look-through rule for purposes of meeting one of the REIT ownership tests, and we are not operated in a manner to avoid treatment of such income or gain as unrelated business taxable income;
•part of the income and gain recognized by a tax-exempt investor with respect to our Class A common stock would constitute unrelated business taxable income if the investor incurs debt in order to acquire the Class A common stock;
•part or all of the income or gain recognized with respect to our Class A common stock by social clubs, voluntary employee benefit associations, supplemental unemployment benefit trusts and qualified group legal services plans which are exempt from U.S. federal income taxation under the Code may be treated as unrelated business taxable income; and
•to the extent that we have “excess inclusion income,” e.g., from: (i) us (or a part of us, or a disregarded subsidiary of ours) being treated as a “taxable mortgage pool;” (ii) us holding residual interests in a REMIC securitization; or (iii) us receiving income from another REIT that is treated as excess inclusion income, a portion of the distributions paid to a tax-exempt shareholder that is allocable to such excess inclusion income may be treated as unrelated business taxable income.
The “taxable mortgage pool” rules may increase the taxes that we or our shareholders may incur and may limit the manner in which we effect future securitizations.
Securitizations could result in the creation of taxable mortgage pools for U.S. federal income tax purposes. As a REIT, so long as we own 100% of the equity interests in a taxable mortgage pool, we generally would not be adversely affected by the characterization of the securitization as a taxable mortgage pool. However, we would be precluded from selling equity interests in these securitizations to outside investors, or selling any debt securities issued in connection with these securitizations that might be considered to be equity interests for tax purposes. Certain categories of shareholders such as foreign shareholders eligible for treaty or other benefits, shareholders with net operating losses, and certain tax-exempt shareholders that are subject to unrelated business income tax, could be subject to increased taxes on a portion of their dividend income from us that is attributable to “excess inclusion income.” In addition, to the extent that our stock is owned by tax-exempt “disqualified organizations,” such as certain government-related entities and charitable remainder trusts that are not subject to tax on unrelated business income, we may incur a corporate level tax on a portion of our income from the taxable mortgage pool. In that case, we may reduce the amount of our distributions to pay the tax on any “excess inclusion income” ourselves. These limitations may prevent us from using certain techniques to maximize our returns from securitization transactions.
Our subsidiary REIT currently owns 100% of the equity interests in each taxable mortgage pool created by our securitizations. While we believe that we have structured our securitizations such that the above taxes would not apply to our shareholders with respect to taxable mortgage pools held by our subsidiary REIT, our subsidiary REIT is in part owned by our TRS, which will pay corporate level tax on any income that it may be allocated from the subsidiary REIT. In addition, our subsidiary REIT is required to satisfy, on a stand-alone basis, the REIT asset, income, organizational, distribution, shareholder ownership and other requirements described above, and if it were to fail to qualify as a REIT, then (i) our subsidiary REIT would face adverse tax consequences similar to those described above with respect to our qualification as a REIT and (ii) such failure could have an adverse effect on our ability to comply with the REIT income and asset tests and thus could impair our ability to qualify as a REIT unless we could avail ourselves of certain relief provisions.
We may be required to report taxable income for certain investments in excess of the economic income we ultimately realize from them.
We may acquire mortgage-backed securities in the secondary market for less than their face amount. In addition, pursuant to our ownership of certain mortgage-backed securities, we may be treated as holding certain debt instruments acquired in the secondary market for less than their face amount. The discount at which such securities or debt instruments are acquired may reflect doubts about their ultimate collectability rather than current market interest rates. The amount of such discount will nevertheless generally be treated as “market discount” for U.S. federal income tax purposes. Accrued market discount is reported as income when, and to the extent that, any payment of principal of the mortgage-backed security or debt instrument is made. If we collect less on the mortgage-backed security or debt instrument than our purchase price plus the market discount we had previously reported as income, we may not be able to benefit from any offsetting loss deductions. In addition, pursuant to our ownership of certain mortgage-backed securities, we may be treated as holding distressed debt investments that are subsequently modified by agreement with the borrower. If the amendments to the outstanding debt are “significant modifications” under applicable Treasury regulations, the modified debt may be considered to have been reissued to us at a gain in a debt-for-debt exchange with the borrower. In that event, we may be required to recognize taxable gain to the extent the principal amount of the modified debt exceeds our adjusted tax basis in the unmodified debt, even if the value of the debt or the payment expectations have not changed.
Moreover, some of the mortgage-backed securities that we acquire may have been issued with original issue discount. We are required to report such original issue discount based on a constant yield method and are taxed based on the assumption that all future projected payments due on such mortgage-backed securities will be made. If such mortgage-backed securities turn out not to be fully collectible, an offsetting loss deduction would become available only in the later year that uncollectability is provable.
Finally, in the event that mortgage-backed securities or any debt instruments we are treated as holding pursuant to our investments in mortgage-backed securities are delinquent as to mandatory principal and interest payments, we may nonetheless be required to continue to recognize the unpaid interest as taxable income as it accrues, despite doubt as to its ultimate collectability. Similarly, we may be required to accrue interest income with respect to subordinate mortgage-backed securities at the stated rate regardless of whether corresponding cash payments are received or are ultimately collectible. In each case, while we would in general ultimately have an offsetting loss deduction available to us when such interest was determined to be uncollectible, the utility of that deduction could depend on our having taxable income in that later year or thereafter.
The tax on prohibited transactions will limit our ability to engage in transactions, including certain methods of structuring CMBS transactions, which would be treated as prohibited transactions for U.S. federal income tax purposes.
Net income that we derive from a prohibited transaction is subject to a 100% tax. The term “prohibited transaction” generally includes a sale or other disposition of property (including mortgage loans and U.S. Agency securities, but other than foreclosure property) that is held primarily for sale to customers in the ordinary course of a trade or business by us. We could be subject to this tax if we were to dispose of, modify or securitize loans in a manner that was treated as a prohibited transaction for U.S. federal income tax purposes. The 100% tax does not apply to gains from the sale of foreclosure property or property that is held through a TRS or other taxable corporation, as is the case with our securitization business, although such income will be subject to tax in the hands of the corporation at regular corporate rates.
We intend to structure our activities to avoid prohibited transaction characterization. As a result, we may choose not to engage in certain transactions at the REIT level and may limit the structures we utilize for our CMBS transactions, even though the sales or structures might otherwise be beneficial to us. We may also contribute those assets to one of our TRSs and conduct the marketing and sale of those assets through that TRS. No assurance can be given that the IRS will agree with the treatment of the transaction by which those assets are contributed to our TRS. Even if the IRS does not dispute our treatment of such transaction, our TRS will be subject to U.S. federal, state and local corporate income tax and may incur a significant tax liability as a result of those sales. Ultimately, whether property is held “primarily for sale to customers in the ordinary course of a trade or business” depends on the particular facts and circumstances. No assurance can be given that any property that we sell will not be treated as property held for sale to customers in the ordinary course of business, or that we can comply with certain safe-harbor provisions of the Code that would prevent such treatment.
Rapid changes in the values of our assets may make it more difficult for us to maintain our qualification as a REIT or exemption from registration under the Investment Company Act.
If the fair market value or income potential of our assets declines as a result of increased interest rates, general market conditions, government actions or other factors, including changes in the carrying value of certain assets, we may need to increase our real estate assets and income and/or liquidate our non-REIT-qualifying assets to maintain our REIT qualification or exemption from registration under the Investment Company Act. If the decline in real estate asset values or income occurs quickly, this may be especially difficult to accomplish. This difficulty may be exacerbated by the illiquid nature of any non-qualifying assets that we may own. We may have to make decisions that we otherwise would not make absent the REIT election and Investment Company Act considerations.
Changes to U.S. federal income tax laws could materially and adversely affect us and our shareholders.
The present U.S. federal income tax treatment of REITs may be modified, possibly with retroactive effect, by legislative, judicial or administrative action at any time, which could affect the U.S. federal income tax treatment of an investment in our common equity. The U.S. federal income tax rules dealing with REITs constantly are under review by persons involved in the legislative process, the IRS and the U.S. Treasury Department, which results in statutory changes as well as frequent revisions to regulations and interpretations. Revisions in U.S. federal tax laws and interpretations thereof could affect or cause us to change our investments and commitments and affect the tax considerations of an investment in us.
We urge you to consult with your tax advisor with respect to the status of legislative, regulatory or administrative developments and proposals and their potential effect on an investment in our shares. Although REITs generally receive certain tax advantages compared to entities taxed as “C” corporations, it is possible that future legislation would result in a REIT having fewer tax advantages, and it could become more advantageous for a company that invests in real estate to elect to be treated for U.S. federal income tax purposes as a “C” corporation.
Our taxable income is calculated differently than net income based on U.S. GAAP.
Our taxable income may substantially differ from our net income based on U.S. GAAP. For example, interest income on our mortgage-related securities does not necessarily accrue under an identical schedule for U.S. federal income tax purposes as for accounting purposes. Refer to Note 15, Income Taxes, to our consolidated financial statements for the year ended December 31, 2023 included elsewhere in this Annual Report, for additional information.
General Risk Factors
Our business model may not be successful. We may change our investment strategy, asset allocation and financing policy in the future without stockholdershareholder consent and any such changes may not be successful.
Our management team is authorized to follow broad investment guidelines that have been approved by our board of directors and has great latitude within those guidelines to determine which assets make proper investments for us. Those investment guidelines, as well as our financing strategy, asset allocation or hedging policies with respect to hedging, investments, originations, acquisitions, growth, operations, indebtedness, capitalization and distributions, may be changed at any time without the consent of our stockholders.shareholders. There can be no assurance that any business model or business plan of ours will prove accurate, that our management team will be able to implement such business model or business plan successfully in the future or that we will achieve our performance objectives. Any business model of ours, including any underlying assumptions and predictions, merely reflect our assessment of the short- and long-term prospects of the business, finance and real estate markets in which we operate and should not be relied upon in determining whether to invest in our Class A common stock.
We may face difficulties Any change in obtaining and maintaining required authorizations or licenses to do business.
In order to implement our business strategies,model could result in our purchasing assets or entering into financing or hedging transactions in which we may be required to obtain, maintainhave no or renew certain licenseslimited experience with or that are different from, and authorizations (including “doing business” authorizationspossibly riskier than the assets, financing and licenses with respect to loan origination) from certain governmental entities. While we do not anticipate any delays or other complications relating to such licenseshedging transactions described in this Annual Report. Changes in our investment strategy, financing strategy, hedging strategy and authorizations, there is no assurance that any particular license or authorization will be obtained, maintained or renewed quickly or at all. Any failure of ours to obtain, maintain or renew such authorizations or licenses mayasset allocation and operational and management policies could materially adversely affect our business. Any material failure, alone or in aggregate, could leadbusiness, financial condition and results of operations and ability to a default under certain ofmake distributions to our financing arrangements and/or result in the unenforceability of our loan documents.
The accuracy of our financial statements may be materially affected if our estimates, including loan loss reserves, prove to be inaccurate.
Financial statements prepared in accordance with accounting principles generally accepted in the United States (“GAAP”) require the use of estimates, judgments and assumptions that affect the reported amounts. Different estimates, judgments and assumptions reasonably could be used that would have a material effect on the financial statements, and changes in these estimates, judgments and assumptions are likely to occur from period to period in the future. Significant areas of accounting requiring the application of management’s judgment include, but are not limited to: (i) assessing the adequacy of the allowance for credit losses; (ii) determining the fair value of investment securities; (iii) assessing other than temporary impairments on securities; (iv) allocation of purchase price for acquired real estate; and (v) assessing impairments on real estate held for use or held for sale. These estimates, judgments and assumptions are inherently uncertain, especially in turbulent economic times, and, if they prove to be wrong, then we face the risk that charges to income will be required.shareholders.
If we fail to maintain an effective system of integrated internal controls, we may not be able to accurately report our financial results.
As a public company, we are subject to the reporting requirements of the Exchange Act and Section 404 of the Sarbanes-Oxley Act of 2002 (the “Sarbanes-Oxley Act”) and the New York Stock Exchange (“NYSE”) rules. The requirements of these rules and regulations can be onerous and expensive and make some activities more difficult, time-consuming or costly and increase demand on our systems and resources. The Exchange Act requires, among other things, that we file annual, quarterly and current reports with respect to our business and financial condition. The Sarbanes-Oxley Act requires, among other things, that we maintain effective disclosure controls and procedures and internal controls for financial reporting.
We depend on our ability to produce accurate and timely financial statements in order to run our business. If we fail to do so, our business could be negatively affected, and our independent registered public accounting firm may be unable to attest to the accuracy of our financial statements.
A deficiency in internal control exists when the design or operation of a control does not allow management or employees, in the normal course of performing their assigned functions, to prevent, or detect and correct, misstatements on a timely basis by the Company’s internal controls. A significant deficiency is defined as a deficiency, or a combination of deficiencies, in internal control over financial reporting that is less severe than a material weakness, yet important enough to merit attention by those responsible for oversight of a registrant’s financial reporting. A material weakness is a deficiency, or a combination of deficiencies, in internal control, such that there is a reasonable possibility that a material misstatement of the entity’s financial statements will not be prevented or detected and corrected, on a timely basis by the Company’s internal controls.
Although we continuously monitor the design, implementation and operating effectiveness of our internal controls over financial reporting, there can be no assurance that significant deficiencies or material weaknesses will not occur in the future.future or will not be discovered with respect to a prior period for which we believe that internal controls were effective. If we fail to maintain effective internal controls, in the future, it could result in a material misstatement of our financial statements that may not be prevented or detected on a timely basis, which could cause stakeholders to lose confidence in our reported financial information.
We incur significant expenses and devote substantial management effort toward ensuring compliance with the auditor attestation requirements of Section 404 of the Sarbanes-Oxley Act of 2002 (the “Sarbanes-Oxley Act”).Act. If we are not able to comply with the requirements of Section 404 applicable to us in a timely manner, or if significant deficienciesmaterial weaknesses in our internal control over financial reporting are identified, the market price of our Class A common stock could decline and we could be subject to sanctions or investigations by the SEC or other regulatory authorities, which would require additional financial and management resources.
Accounting and tax rules for certain of our transactions are highly complex and involve significant judgment and assumptions. ChangesThe accuracy of our financial statements may be materially affected if our estimates, including loan loss reserves, prove to be inaccurate.
Financial statements prepared in accordance with generally accepted accounting principles in the United States (“GAAP”) require the use of estimates, judgments and assumptions that affect the reported amounts. Different estimates, judgments and assumptions reasonably could be used that would have a material effect on the financial statements, and changes in these estimates, judgments and assumptions are likely to occur from period to period in the future. Significant areas of accounting requiring the application of management’s judgment include but are not limited to: (i) assessing the adequacy of the allowance for loan loss reserves; (ii) determining the fair value of investment securities; (iii) assessing other than temporary impairments on securities; (iv) allocation of purchase price for acquired or foreclosed real estate; (v) determining the fair value of collateral acquired through foreclosure; (vi) assessing impairments on real estate held for use or held for sale; (vii) transfers of financial assets; (viii) securitization transactions; and (ix) consolidation of variable interest entities.
These estimates, judgments and assumptions are inherently uncertain, especially in turbulent economic times, and, if they prove to be wrong, then we face the risk that charges to income could be required. These complexities, along with changes in accounting interpretations or assumptions, could impact our consolidated financial statements.
Accounting and tax rules for transfers of financial assets, securitization transactions, consolidation of variable interest entities, or (“VIEs”), and other aspects of our anticipated operations are highly complex and involve significant judgment and assumptions. These complexities could lead to a delay in preparation of financial information and the delivery of this information to our shareholders. Changes in accounting interpretations or assumptions could impact our consolidated financial statements, result in a need to restate our financial results and affect our ability to timely prepare our consolidated financial statements.statements, and would likely have a significant adverse effect on our stock price.
Cybersecurity threats or other security breaches could cause significant business disruption and could possibly compromise sensitive information belonging to us or our employees, borrowers, clients and other counterparties, and along with the emerging use of artificial intelligence ("AI"), could harm our business and our reputation and subject us to regulatory scrutiny.
We rely on the efficacy of our cybersecurity policies, systems and processes developed and managed by our Cybersecurity Team in order to protect our technology assets from cybersecurity incidents and intrusions. The secure operation of our information technology (“IT”) networks and systems and the proper processing and maintenance of this information are critical to our business operations. The rise of high-profile security breaches by hackers, foreign governments, and other malicious actors has resulted in an increased risk of a security breach or IT disruption. Simultaneously, the state, federal and international regulatory environment related to information security, data collection and use, and privacy has become increasingly rigorous, with new and constantly changing requirements potentially applicable to our business.
We do not offer consumer products and therefore do not generally collect or maintain consumer personal data. We do, however, have access to financial and other potentially sensitive information of our borrowers, guarantors and other counterparties, in addition to confidential employee information, which we store in our IT systems. Our inabilityinformation technology and infrastructure has been and likely will continue to timely prepare our consolidated financial statementsbe subject to security incidents or breaches as a result of internal or external accidents, errors, or malfeasance. Furthermore, in the future would likelyoperation of our business we also use third-party vendors that store certain sensitive data, including confidential information about our employees, and while we conduct due diligence on these vendors, these third parties are subject to their own cybersecurity threats. Such incidents may include unauthorized access to our data assets, phishing attacks, account takeovers, business email compromise, social engineering, denial of service, malicious software, ransomware that encrypts critical data as part of a scheme to extort payment, and other electronic or cybersecurity breaches. The results of a significant security incident could include, but are not limited to, disrupted operations, misstated or misappropriated financial data, financial theft, theft of personal information, intellectual property or other sensitive or confidential data, increased cybersecurity protection costs, liability for notification of, and losses suffered by, individuals whose data is accessed or stolen as a result of a breach, regulatory fines and penalties, and reputational damage adversely affecting customer or investor confidence. Because the techniques used to obtain unauthorized access to networks, or to sabotage systems, change frequently and generally are not recognized until launched against a target, we may be unable to anticipate these techniques or to implement adequate preventative measures against all forms of attack. Any insurance we maintain against the risk of this type of loss may not be sufficient to cover actual losses or may not apply to the circumstances relating to any particular breach.
Like others in the commercial real estate industry, we are exploring how artificial intelligence, or AI, may impact our business. Being slower than peers to adopt potentially useful technology could put us at a competitive disadvantage. This new and emerging technology, however, is in its early stages of commercial use and presents a number of inherent risks that, if not addressed, could affect its further development and adoption. For example, issues such as flawed algorithms, insufficient or poor-quality data sets, or AI hallucinatory behavior can generate irrelevant, nonsensical, misleading, biased or factually incorrect results. If we integrate AI into our security prices significantly.business and the recommendations, forecasts, or analyses with which AI assists in producing are deficient or inaccurate, our reputation, business or customers could be harmed. In addition, regulatory and legal uncertainty, including regarding privacy, confidentiality and intellectual property, could subject companies that use AI to liability.
Litigation may adversely affect our business, financial condition and results of operations.
We are,may, from time to time, subject to legal and regulatory requirements applicable to our business and industry. We may be subject to various legal proceedings and these proceedings may range from actions involving a single plaintiff to class action lawsuits. Litigation can be lengthy, expensive and disruptive to our operations and results cannot be predicted with certainty. There may also be adverse publicity associated with litigation, regardless of whether the allegations are valid or whether we are ultimately found not liable. As a result, litigation may adversely affect our business, financial condition and results of operations.
ThereNot all litigation expenses are covered by insurance. In addition, there can be no assurance that our corporate insurance policies will mitigate all insurable losses, costs or damages to our business.
Based on our history and type of business, we believe that we maintain adequate insurance coverage to cover probable and reasonably estimable liabilities should they arise. However, there can be no assurance that these estimates will prove to be sufficient, nor can there be any assurance that the ultimate outcome of any claim or event will not have a material negative impact on our business prospects, financial position, results of operations or cash flows.
We may face difficulties in obtaining and maintaining required authorizations or licenses to do business.
In order to implement our business strategies, we are required to obtain, maintain or renew certain licenses and authorizations (including “doing business” authorizations and licenses with respect to loan origination) from certain governmental entities, government-sponsored entities and similar bodies. There is no assurance that any particular license or authorization will be obtained, maintained or renewed quickly or at all. Any failure of ours to obtain, maintain or renew such authorizations or licenses may adversely affect our business. Any material failure, alone or in aggregate, could subject us to penalties, lead to a default under certain of our financing arrangements and/or result in the unenforceability of our loan documents.
Item 1B. Unresolved Staff Comments
None.
Item 1C. Cybersecurity
Ladder has a cybersecurity risk management program that is designed to assess, identify, manage, and govern material risks from cybersecurity threats. Our cybersecurity risk management program is also a key component of our overall risk management program.
To date, cybersecurity threats, including as a result of any previous cybersecurity incidents, have not materially affected and are not reasonably likely to materially affect the Company, including its business strategy, results of operations or financial condition. Refer to the risk factor captioned “Cybersecurity threats or other security breaches could cause significant business disruption and could possibly compromise sensitive information belonging to us or our employees, borrowers, clients and other counterparties, and along with the emerging use of artificial intelligence (“AI”), could harm our business and our reputation and subject us to regulatory scrutiny.scrutiny” in Part I, Item 1A. “Risk Factors” for additional information.
We rely onLadder leverages a senior cybersecurity team (the “Cybersecurity Team”) comprised of the efficacy of ourChief Technology Officer (“CTO”), Chief Administrative Officer and General Counsel, Chief Compliance Officer and Senior Regulatory Counsel, as well as senior representatives from Ladder’s outsourced technology firm. The Cybersecurity Team maintains Ladder’s cybersecurity policiesprogram, which is designed to identify, detect and processes in ordermanage cybersecurity risks. The Cybersecurity Team monitors technology trends and developments to protect its data assets from cyberattacksinform improvements and intrusions, including computer viruses, adware, phishing/social engineering, wire fraud, ransomwareadjustments to Ladder's information technology (“IT”) infrastructure and unauthorized persons accessing our data assets internally or externally. The secure operation of our IT networks and systems andoversees the proper processing and maintenance of this information are critical to our business operations. The rise of high profile security breaches by hackers, foreign governments, and other malicious actors indicates an increased risk of a security breach or IT disruption. Simultaneously, the state, federal and international regulatory environment related to information security, data collection and use, and privacy has become increasingly rigorous, with new and constantly changing requirements potentially applicable to our business.Company's various cybersecurity training initiatives.
We store sensitive data, including our proprietary business informationThe members of the Cybersecurity Team have extensive on-the-job experience in cybersecurity matters, sharing responsibility for cybersecurity, as well as for regulatory, compliance and/or IT. Ladder’s CTO has over 20 years of experience in the design, engineering, implementation, and thatmanagement of our borrowers and other counterparties, and confidential employee information, in our data centers and on our networks. Despite our security measures, like most companies, our information technology, including as the founder of an IT managed servicer provider for professional and infrastructure has been and likely will continue to be subject to attacks by hackers, or may be breached due to employee error, malfeasance, system or network failures or other disruptions that could result in unauthorized disclosure or loss of sensitive information. Because the techniques used to obtain unauthorized access to networks, or to sabotage systems, change frequently and generally are not recognized until launched against a target, we may be unable to anticipate these techniques or to implement adequate preventative measures against all forms of attack. Furthermore, in the operation of our business we also use third-party vendors that store certain sensitive data, including confidential information about our employees, and these third parties are subject to their own cybersecurity threats. While we conduct due diligence on our vendors, no due diligence is infallible and any security breach of our own or a third-party vendor’s systems could cause us to be non-compliant with applicable laws or regulations, subject us to legal claims, regulatory investigations or other proceedings, and/or fines, disrupt our operations, damage our reputation, subject us to considerable remediation expenses and cause a loss of confidence in our products andfinancial services any of which could adversely affect our business.
Item 1B. Unresolved Staff Comments
None.companies.
Ladder conducts routine risk assessments to identify cyber threats and vulnerabilities and assess the likelihood of occurrence and severity of the impact of such threats and vulnerabilities on the Company. Ladder regularly updates the risk assessment in order to inform Ladder’s cybersecurity program and controls and to prioritize risk mitigation and remediation in an evolving threat landscape. Ladder maintains cybersecurity policies and procedures designed to manage these risks and ensure that the Cybersecurity Team and other relevant employees are informed of cybersecurity incidents in a timely manner. These policies include incident response, data classification, physical and network security polices, remote access, record retention and secure destruction policies. The Cybersecurity Team conducts a formal evaluation of Ladder’s applicable policies and cyber risks and mitigants on at least an annual basis. Ladder’s outsourced technology firm, as well as internal auditors, participate in this evaluation.
Ladder also maintains processes designed to oversee and identify material risks from cybersecurity threats associated with our use of third-party service providers based on the service provider’s risk profile. Ladder does not generally maintain consumer data, and does not extensively leverage third parties to manage or process sensitive data. Most of the third parties that have access to sensitive information belonging to us or our borrowers, clients or other counterparties are lenders, law firms and other third parties that require such access in connection with Ladder’s commercial lending activities. These third parties tend to be highly regulated and generally maintain mature cybersecurity programs and data security controls. When Ladder leverages third-party service providers that collect or maintain sensitive information, Ladder conducts initial diligence on such third parties and conducts ongoing monitoring that includes annual due diligence questionnaires and contractual data security protections.
In addition to the policies and procedures discussed above, Ladder leverages industry standard third-party technology, tools and services to assist in monitoring, detecting and managing cyber threats, including managed security service monitoring, endpoint detection and response tools. Ladder also maintains other appropriate cybersecurity controls, including:
•Annual penetration testing by rotating third-party vendors;
•Vulnerability scans;
•Company-wide cybersecurity training, including quarterly phishing exercises;
•Tabletop exercises;
•Vendor cybersecurity diligence; and
•Cyber insurance.
The Audit Committee, on behalf of the board of directors, is responsible for oversight of the Company’s strategies to assess and mitigate cybersecurity risks, as set forth in the Audit Committee’s charter. The Audit Committee receives quarterly or as needed updates from the CTO regarding the cybersecurity risks the Company faces based on the current cybersecurity threat landscape, as well as the status of the measures undertaken by the Company to manage those risks.
Item 2. Properties
We lease our corporate headquarters office at 345320 Park Avenue, 8th15th Floor, New York, New York, 10154.10022. The Company also leases regional offices in Los Angeles, California and Miami, Florida. Refer to Schedule III included in Item 8 of this Annual Report on Form 10-K for a listing of investment properties owned as of December 31, 2020.
Item 3. Legal Proceedings
From time to time, we may be involved in litigation and claims incidental to the conduct of our business in the ordinary course. Further, certain of our subsidiaries, such as our registered investment adviser and captive insurance company, are subject to scrutiny by government regulators, which could result in enforcement proceedings or litigation related to regulatory compliance matters. We are not presently a party to any material enforcement proceedings, litigation related to regulatory compliance matters or any other type of material litigation matters. We maintain insurance policies in amounts and with the coverage and deductibles we believe are adequate, based on the nature and risks of our business, historical experience and industry standards.
Item 4. Mine Safety Disclosures
Not applicable.
Part II
Item 5. Market for Registrant’s Common Equity, Related Stockholder Matters and Issuer Purchases of Equity Securities
Market Information
Our Class A common stock trades on the NYSE under the symbol “LADR.”
Holders
On February 19, 2021,2, 2024, the Company had 3625 Class A common shareholders of record. This does not include the beneficial ownership of shares held in nominee name. The closing price per share of Class A common stock on February 19, 20212, 2024 was $10.84.$10.79. On February 19, 2021,2, 2024, the Company had no Class B common shareholders of record and no Class B common stock outstanding.
Stock Repurchases
On October 30, 2014, ourJuly 27, 2022, the board of directors authorized the Company to make up torepurchase of $50.0 million in repurchases of the Company’s Class A common stock from time to time without further approval. This authorization voided the remaining unused buyback capacity per the August 4, 2021 authorization, and increased the remaining authorization at the time from $39.5 million to $50.0 million. Stock repurchases by the Company are generally made for cash in open market transactions at prevailing market prices but may also be made in privately negotiated transactions or otherwise. The timing and amount of purchases are determined based upon prevailing market conditions, our liquidity requirements, contractual restrictions and other factors. During the year ended December 31, 2020,2023, the Company repurchased 384,251269,000 shares of Class A common stock at an average of $7.89$9.22 per share for a total aggregate purchase price of $3.0$2.5 million. All repurchased shares are recorded in treasury stock at cost. As of December 31, 2020, there were $38.12023, the Company has a remaining amount available for repurchase of $44.3 million, which represents 3.0% in the aggregate of its outstanding Class A common stock, available for repurchase.based on the closing price of $11.51 per share on such date.
The following table presents information with respect to repurchases of Class A common stock of the Company made during the three months ended December 31, 20202023 ($ in thousands, except per share data and average price paid per share):
| | | | | | | | | | | | | | | | | | | | | | | | | | |
|
| | | | | | | | |
| Period | | Total Number of Shares Purchased | | Average Price Paid per Share | | Total Number of Shares Purchased as Part of Publicly Announced Plans or Programs(1) | | Approximate Dollar Value of Shares that May Yet Be Purchased Under the Plans or Programs |
| | | | | | | | |
| | | | | | | | |
| | | | | | | | |
| | | | | | | | |
| | | | | | | | |
| | | | | | | | |
| | | | | | | | |
| | | | | | | | |
| | | | | | | | |
| | | | | | | | |
| | | | | | | | |
| | | | | | | | |
| | | | | | | | |
| | | | | | | | |
| | | | | | | | |
| | | | | | | | |
| | | | | | | | |
| | | | | | | | |
| | | | | | | | |
| | | | | | | | |
| | | | | | | | |
| | | | | | | | |
| October 1, 2020 - October 31, 2020 | | — | | | — | | | — | | | 38,555 | |
| November 1, 2020 - November 30, 2020 | | 15,000 | | | 7.93 | | | 15,000 | | | 38,436 | |
| December 1, 2020 - December 31, 2020 | | 35,000 | | | 9.52 | | | 35,000 | | | 38,103 | |
| Total | | 50,000 | | | $ | 9.05 | | | 50,000 | | | $ | 38,103 | |
| | | | | | | | | | | | | | | | | | | | | | | | | | |
|
| | | | | | | | |
| Period | | Total Number of Shares Purchased | | Average Price Paid per Share | | Total Number of Shares Purchased as Part of Publicly Announced Plans or Programs(1) | | Approximate Dollar Value of Shares that May Yet Be Purchased Under the Plans or Programs(2) |
| | | | | | | | |
| | | | | | | | |
| | | | | | | | |
| | | | | | | | |
| | | | | | | | |
| | | | | | | | |
| | | | | | | | |
| | | | | | | | |
| | | | | | | | |
| | | | | | | | |
| | | | | | | | |
| | | | | | | | |
| | | | | | | | |
| | | | | | | | |
| | | | | | | | |
| | | | | | | | |
| | | | | | | | |
| | | | | | | | |
| | | | | | | | |
| | | | | | | | |
| | | | | | | | |
| | | | | | | | |
| October 1, 2023 - October 31, 2023 | | — | | | $ | — | | | — | | | $ | 44,255,768 | |
| November 1, 2023 - November 30, 2023 | | — | | | — | | | — | | | 44,255,768 |
| December 1, 2023 - December 31, 2023 | | — | | | — | | | — | | | 44,255,768 |
| Total | | — | | | $ | — | | | — | | | $ | 44,255,768 | |
| | | | | | | | |
| | | | | | | | |
| | | | | | | | |
| | | | | | | | |
| | | | | | | | |
| | | | | | | | |
| | | | | | | | |
| | | | | | | | |
| | | | | | | | |
| | | | | | | | |
| | | | | | | | |
| | | | | | | | |
| | | | | | | | |
| | | | | | | | |
| | | | | | | | |
| | | | | | | | |
| | | | | | | | |
| | | | | | | | |
| | | | | | | | |
| | | | | | | | |
| | | | | | | | |
| | | | | | | | |
(1) In August 2015, we publicly disclosed thatJuly 2022, our board of directors had authorizedrenewed the CompanyCompany’s ability to repurchase up to $50.0 million of the Company’s Class A common stock from time to time.
Recent Sales of Unregistered Securities
Pursuant to the LLLP Agreement, the Continuing LCFH Limited Partners may from time to time (subject to the terms of the LLLP Agreement as in effect at the time) cause LCFH to exchange Series REIT LP Units and LC TRS I Shares (or Series TRS LP Units in lieu of such LC TRS I Shares)(2) Amount excludes commissions paid associated with an equal number of shares of our Class B common stock, for shares of our Class A common stock on a one-for-one basis, subject to equitable adjustments for stock splits, stock dividends and reclassifications. During the year ended December 31, 2020, 12,158,933 Series REIT LP Units and 12,158,933 Series TRS LP Units were collectively exchanged for 12,158,933 shares of Class A common stock and 12,158,933 shares of Class B common stock were canceled. We received no other consideration in connection with these exchanges, which were effected in reliance on Section 4(a)(2) of the Securities Act. As of December 31, 2020, all shares of Class B common stock had been exchanged for shares of Class A common stock and the Company held a 100.0% interest in LCFH.share repurchases.
Securities Authorized for Issuance Under Equity Compensation Plans
The following table summarizes information, as of December 31, 2020,2023, relating to the 2014 Ladder Capital Corp Omnibus Incentive Equity Plan (the “2014 Omnibus Incentive Plan”) pursuant to which equity securities of the Company arewere authorized for issuance. New awards will be issued under the 2023 Ladder Capital Corp Omnibus Incentive Equity Plan (the “2023 Omnibus Incentive Plan”).
| | Number of Securities to be Issued Upon Exercise of Outstanding Options, Warrants and Rights | | Weighted-Average Exercise Price of Outstanding Options, Warrants and Rights | | Number of Securities Remaining Available for Future Issuance Under Equity Compensation Plans (excluding securities reflected in column (a)) |
| | Number of Securities to be Issued Upon Exercise of Outstanding Options, Warrants and Rights | | | | Number of Securities to be Issued Upon Exercise of Outstanding Options, Warrants and Rights | | Weighted-Average Exercise Price of Outstanding Options, Warrants and Rights | | Number of Securities Remaining Available for Future Issuance Under Equity Compensation Plans (excluding securities reflected in column (a)) |
| Plan Category | Plan Category | | (a) | | (b) | | (c) | Plan Category | | (a) | | (b) | | (c) |
| | Equity compensation plans approved by shareholders | Equity compensation plans approved by shareholders | | 681,102 | | | $ | 14.84 | | | 6,194,763 | |
| Equity compensation plans approved by shareholders | |
| Equity compensation plans approved by shareholders | |
| Equity compensation plans not approved by shareholders | Equity compensation plans not approved by shareholders | | N/A | | N/A | | N/A | Equity compensation plans not approved by shareholders | | N/A |
| Total | Total | | 681,102 | | | $ | 14.84 | | | 6,194,763 | |
Performance Graph
Our Class A common stock began trading on the NYSE under the symbol “LADR” on February 6, 2014. Prior to that time, there was no public market for our Class A common stock.
The following graph compares total shareholder returns, assuming reinvestment of dividends, for the period December 31, 20152018 through December 31, 20202023 to the Wells Fargo Commercial Mortgage REIT Index (“Commercial Mortgage REIT Index”), Bloomberg REIT Mortgage Index and the Standard & Poor’s Index (“S&P 500 Index”). For this Annual Report, the Company has changed its comparable REIT from the Commercial Mortgage REIT Index to the Bloomberg REIT Mortgage Index in order to be in line with other commercial REITs that use the latter. We retained the Commercial Mortgage REIT Index for this year for comparison purposes but will not include that index in our stock performance graph going forward. The closing price of the Company’s Class A common stock on December 31, 20152018 (on which the graph is based) was $12.42.$15.47. The past shareholder return shown on the following graph is not necessarily indicative of future performance.
Total Shareholder Returns
Based upon initial investment of $100 on December 31, 20152018 (1)
| | | | | | | | | | | | | | | | | | | | | | | |
| Ladder Capital Corp | | Commercial Mortgage REIT Index | | Bloomberg REIT Mortgage Index | | S&P 500 Index |
| December 31, 2015 | $ | 100.00 | | | $ | 100.00 | | | $ | 100.00 | | | $ | 100.00 | |
| December 31, 2016 | $ | 120.81 | | | $ | 116.69 | | | $ | 121.19 | | | $ | 109.54 | |
| December 31, 2017 | $ | 129.87 | | | $ | 114.62 | | | $ | 142.89 | | | $ | 130.81 | |
| December 31, 2018 | $ | 157.05 | | | $ | 119.74 | | | $ | 139.70 | | | $ | 122.65 | |
| December 31, 2019 | $ | 188.69 | | | $ | 151.36 | | | $ | 163.10 | | | $ | 158.07 | |
| December 31, 2020 | $ | 129.75 | | | $ | 155.16 | | | $ | 135.55 | | | $ | 183.77 | |

| | | | | | | | | | | | | | | | | | | |
| Ladder Capital Corp | | | | Bloomberg REIT Mortgage Index | | S&P 500 Index |
| December 31, 2018 | $ | 100.00 | | | | | $ | 100.00 | | | $ | 100.00 | |
| December 31, 2019 | $ | 125.40 | | | | | $ | 122.05 | | | $ | 128.88 | |
| December 31, 2020 | $ | 78.09 | | | | | $ | 96.09 | | | $ | 149.83 | |
| December 31, 2021 | $ | 97.54 | | | | | $ | 109.48 | | | $ | 190.13 | |
| December 31, 2022 | $ | 90.63 | | | | | $ | 90.04 | | | $ | 153.16 | |
| December 31, 2023 | $ | 106.08 | | | | | $ | 97.32 | | | $ | 190.27 | |
(1) Dividend reinvestment is assumed at quarter end.
Item 6. Selected Financial Data[Reserved]
The information below should be read in conjunction with “Cautionary Statement Regarding Forward-Looking Statements,” “Risk Factors,” “Management’s Discussion and Analysis of Financial Condition and Results of Operations” and our consolidated financial statements and the related notes thereto included in this Annual Report.
The following table sets forth selected financial data on a consolidated basis for the Company ($ in thousands, except per share and dividend data):
| | | | | | | | | | | | | | | | | | | | | | | | | | | | | | | | | | | | | | | | |
| | Year Ended December 31, |
| | 2020 | | 2019 | | 2018 | | 2017 | | 2016 | | | | | | | | |
| | | | | | | | | | | | | | | | | | |
| Operating Data: | | | | | | | | | | | | | | | | | | |
| Interest income | | $ | 239,849 | | | $ | 330,235 | | | $ | 344,816 | | | $ | 263,667 | | | $ | 236,372 | | | | | | | | | |
| Interest expense | | 227,474 | | | 204,353 | | | 194,291 | | | 146,118 | | | 120,826 | | | | | | | | | |
| Net interest income | | 12,375 | | | 125,882 | | | 150,525 | | | 117,549 | | | 115,546 | | | | | | | | | |
| Provision for (release of) loan loss reserves | | 18,275 | | | 2,600 | | | 13,900 | | | — | | | 300 | | | | | | | | | |
| Net interest income (expense) after provision for (release of) loan losses | | (5,900) | | | 123,282 | | | 136,625 | | | 117,549 | | | 115,246 | | | | | | | | | |
| Total other income (loss) | | 139,955 | | | 174,652 | | | 250,320 | | | 186,470 | | | 163,312 | | | | | | | | | |
| Total costs and expenses | | 153,302 | | | 158,287 | | | 158,626 | | | 170,428 | | | 158,517 | | | | | | | | | |
| Income (loss) before taxes | | (19,247) | | | 139,647 | | | 228,319 | | | 133,591 | | | 120,041 | | | | | | | | | |
| Income tax expense (benefit) | | (9,789) | | | 2,646 | | | 6,643 | | | 7,712 | | | 6,320 | | | | | | | | | |
| Net income (loss) | | (9,458) | | | 137,001 | | | 221,676 | | | 125,879 | | | 113,721 | | | | | | | | | |
| Net (income) loss attributable to noncontrolling interest in consolidated joint ventures | | (5,544) | | | 694 | | | (15,864) | | | (226) | | | 137 | | | | | | | | | |
| | | | | | | | | | | | | | | | | | |
| | | | | | | | | | | | | | | | | | |
| Net (income) loss attributed to noncontrolling interest in operating partnership | | 557 | | | (15,050) | | | (25,797) | | | (30,377) | | | (47,131) | | | | | | | | | |
| Net income (loss) attributed to Class A common shareholders | | $ | (14,445) | | | $ | 122,645 | | | $ | 180,015 | | | $ | 95,276 | | | $ | 66,727 | | | | | | | | | |
| | | | | | | | | | | | | | | | | | |
| Earnings per share: | | | | | | | | | | | | | | | | | | |
| Basic | | $ | (0.13) | | | $ | 1.16 | | | $ | 1.85 | | | $ | 1.16 | | | $ | 1.08 | | | | | | | | | |
| Diluted | | $ | (0.13) | | | $ | 1.15 | | | $ | 1.84 | | | $ | 1.13 | | | $ | 1.06 | | | | | | | | | |
| Weighted average shares outstanding: | | | | | | | | | | | | | | | | | | |
| Basic | | 112,409,615 | | | 105,455,849 | | | 97,226,027 | | | 81,902,524 | | | 61,998,089 | | | | | | | | | |
| Diluted | | 112,409,615 | | | 106,399,783 | | | 97,652,065 | | | 109,704,880 | | | 107,638,788 | | | | | | | | | |
| | | | | | | | | | | | | | | | | | |
| Dividends per share of Class A common stock(1) | | $ | 0.940 | | | $ | 1.360 | | | $ | 1.535 | | | $ | 1.215 | | | $ | 1.285 | | | | | | | | | |
| | | | | | | | | | | | | | | | | | |
| | | | | | | | | | | | | | | | | | | | | | | | | | | | | | | | | | | | | | | | |
| | Year Ended December 31, |
| | 2020 | | 2019 | | 2018 | | 2017 | | 2016 | | | | | | | | |
| | | | | | | | | | | | | | | | | | |
| Cash Flow Data: | | | | | | | | | | | | | | | | | | |
| Net cash provided by (used in): | | | | | | | | | | | | | | | | | | |
| Operating activities | | $ | 111,943 | | | $ | 183,207 | | | $ | 200,433 | | | $ | 11,985 | | | $ | 338,427 | | | | | | | | | |
| Investing activities | | 1,542,265 | | | (126,587) | | | (342,865) | | | (306,635) | | | 36,285 | | | | | | | | | |
| Financing activities | | (725,670) | | | 200,676 | | | 58,199 | | | 387,905 | | | (448,077) | | | | | | | | | |
| | | | | | | | | | | | | | | | | | |
| Balance Sheet Data (at end of period): | | | | | | | | | | | | | | | | | | |
| Cash and cash equivalents | | $ | 1,254,432 | | | $ | 58,171 | | | $ | 67,878 | | | $ | 76,674 | | | $ | 44,615 | | | | | | | | | |
| Restricted cash | | 29,852 | | | 297,575 | | | 30,572 | | | 106,009 | | | 44,813 | | | | | | | | | |
| Total cash, cash equivalents and restricted cash | | 1,284,284 | | | 355,746 | | | 98,450 | | | 182,683 | | | 89,428 | | | | | | | | | |
| Mortgage loan receivables | | 2,343,071 | | | 3,358,861 | | | 3,482,928 | | | 3,508,642 | | | 2,353,977 | | | | | | | | | |
| Real estate securities | | 1,058,298 | | | 1,721,305 | | | 1,410,126 | | | 1,106,517 | | | 2,100,947 | | | | | | | | | |
| | | | | | | | | | | | | | | | | | |
| Real estate and related lease intangibles, net | | 985,304 | | | 1,048,081 | | | 998,022 | | | 1,032,041 | | | 822,338 | | | | | | | | | |
| Total assets | | 5,881,229 | | | 6,669,152 | | | 6,272,872 | | | 6,025,615 | | | 5,578,337 | | | | | | | | | |
| Total debt outstanding | | 4,209,864 | | | 4,859,873 | | | 4,452,574 | | | 4,379,826 | | | 3,942,138 | | | | | | | | | |
| Total liabilities | | 4,332,804 | | | 5,030,175 | | | 4,629,237 | | | 4,537,469 | | | 4,068,783 | | | | | | | | | |
| Total shareholders’ equity | | 1,543,162 | | 1,458,277 | | | 1,445,152 | | | 1,234,968 | | | 971,391 | | | | | | | | | |
| Total noncontrolling interest in operating partnership | | — | | | 172,054 | | | 188,427 | | | 240,861 | | | 533,246 | | | | | | | | | |
| Total noncontrolling interest in consolidated joint ventures | | 5,263 | | | 8,646 | | | 10,055 | | | 12,317 | | | 4,918 | | | | | | | | | |
| Total equity (capital) | | 1,548,425 | | | 1,638,977 | | | 1,643,635 | | | 1,488,146 | | | 1,509,555 | | | | | | | | | |
(1)On October 30, 2018, the Company’s board of directors approved the fourth quarter 2018 dividend of $0.570 per share of the Company’s Class A common stock in order to meet its annual REIT taxable income distribution requirement. The dividend was paid as a combination of cash and Class A common stock, subject to shareholder elections. Refer to dividends in Note 11 to our consolidated financial statements.
Item 7. Management’s Discussion and Analysis of Financial Condition and Results of Operations
The following discussion and analysis of financial condition and results of operations should be read in conjunction with the consolidated financial statements and the related notes of Ladder Capital Corp included within this Annual Report. This Management’s Discussion and Analysis of Financial Condition and Results of Operations contains forward-looking statements. See “Cautionary Statement Regarding Forward-Looking Statements” within this Annual Report and “Risk Factors” within this Annual Report for a discussion of the uncertainties, risks and assumptions associated with these statements. Actual results may differ materially from those contained in any forward-looking statements as a result of various factors, including but not limited to, those in “Risk Factors” set forth within this Annual Report.
References to “Ladder,” the “Company,” and “we,” “our” and “us” refer to Ladder Capital Corp, a Delaware corporation incorporated in 2013, and its consolidated subsidiaries.
Ladder Capital Corp is the sole general partner of Ladder Capital Finance Holdings LLLP (“LCFH”) and, as a result of the
serialization of LCFH on December 31, 2014, became the sole general partner of Series REIT of LCFH. LC TRS I LLC, a
wholly-owned subsidiary of Series REIT of LCFH, is the general partner of Series TRS of LCFH. Ladder Capital Corp has a
controlling interest in Series REIT of LCFH, and through such controlling interest, also has a controlling interest in Series TRS
of LCFH. Ladder Capital Corp’s only business is to act as the sole general partner of LCFH and Series REIT of LCFH, and, as
a result of the foregoing, Ladder Capital Corp directly and indirectly operates and controls all of the business and affairs of
LCFH, and each Series thereof, and consolidates the financial results of LCFH, and each Series thereof, into Ladder Capital
Corp’s consolidated financial statements.
Business and DevelopmentsOverview
We areLadder Capital is an internally-managed real estate investment trust (“REIT”) that is a leader in commercial real estate finance. We originate and invest in a diverse portfolio of commercial real estate and real estate-related assets, focusing on senior secured assets. Our investment activities include: (i) our primary business of originating senior first mortgage fixed and floating rate loans collateralized by commercial real estate with flexible loan structures; (ii) owning and operating commercial real estate, including net leased commercial properties; and (iii) investing in investment grade securities secured by first mortgage loans on commercial real estate; and (iii) owning and operating commercial real estate, including net leased commercial properties.estate. We believe that our in-house origination platform, ability to flexibly allocate capital among complementary product lines, credit-centric underwriting approach, access to diversified financing sources, and experienced management team position us well to deliver attractive returns on equity to our shareholders through economic and credit cycles.
COVID-19 Impact on the Organization
On March 11, 2020, the World Health Organization declared the novel strain of coronavirus (“COVID-19”) a global pandemic and recommended containment and mitigation measures worldwide. As of the date of this filing, the majority of our employees continue to work remotely in compliance with state guidelines. We continue to actively manage the liquidity and operations of the Company in light of the market conditions and overall financial impact caused by the COVID-19 pandemic across most industries in the United States. In view of the uncertainty related to the severity and duration of the pandemic, its ultimate impact on our revenues, profitability and financial position remains difficult to assess at this time. The Company has disclosed the impact of the COVID-19 global pandemic on our business throughout this Annual Report.
Since the end of the first quarter of 2020, as the COVID-19 health crisis transformed into significant financial market disruption, management has taken action to increase liquidity resources and deleverage the business:
•Increased unrestricted cash from $358 million to $1.25 billion.
•Limited cash outflows by minimizing new investments, reducing the dividends, and maintaining limited future funding obligations on lightly-transitional loan portfolio.
•Received approximately $1.3 billion from loan payoffs and proceeds from loan sales.
•Received $931 million from securities sales and amortization.
•Reduced adjusted leverage to 2.5x.
•Significantly reduced mark-to-market financing by over $1.6 billion.
•Raised approximately $500 million of non-recourse, non-mark-to-market financing.
•Supported Ladder credit by repurchasing $180 million of corporate bonds.
We believe the commercial real estate finance market is currently encouraged by the progress and dissemination of COVID-19 vaccines and their impact on a full reopening of the economy. However, headwinds still remain, including technology and its broader impact on the utilization of real estate. We believe our current liquidity, coupled with the benefits of our multi-cylinder business and the strength of our capital structure, positions the Company well heading in to the next phase of the real estate market.
Recent Developments
On January 27, 2021, the Company redeemed in full its 5.875% Senior Notes due 2021 (the “2021 Notes”). The 2021 Notes were redeemed at par, plus accrued and unpaid interest to the redemption date, pursuant to the optional redemption provisions of the indenture governing the 2021 Notes. The redemption of a portion of the 2021 Notes that were redeemed was subject to the condition that the Company’s subsidiary issuers of the 2021 Notes complete a notes offering of not less than $400 million. The issuers waived the condition prior to redeeming the 2021 Notes in full.
On February 9, 2021, the Company announced the appointment of Paul J. Miceli as Chief Financial Officer, effective March 1, 2021. Mr. Miceli, Ladder’s Director of Finance, will succeed Marc Fox, who has announced his intention to leave the Company. Mr. Fox will remain at the Company through May 7, 2021, to ensure an orderly transition.
Results of Operations
A discussion regarding our results of operations for the year ended December 31, 20202023 compared to the year ended December 31, 20192022 is presented below. A discussion regarding our results of operations for the year ended December 31, 20192022 compared to the year ended December 31, 20182021 can be found in Part II, Item 7 of Part II, “Management’s Discussion and Analysis of Financial Condition and Results of Operations” in the Company’s Annual Report on Form 10-K for the year ended December 31, 2019.2022.
Year ended December 31, 20202023 compared to the year ended December 31, 20192022
The following table sets forth information regarding our consolidated results of operations ($ in thousands):
| | Year Ended December 31, | | | Year Ended December 31, |
| 2023 | | | 2023 | | 2022 | | Difference |
| | Net interest income | |
| Net interest income | |
| Net interest income | |
| Interest income | |
| Interest income | |
| Interest income | |
| Interest expense | |
| Net interest income (expense) | |
| Provision for (release of) loan loss reserves, net | |
| Net interest income (expense) after provision for (release of) loan loss reserves | |
| Other income (loss) | |
| Real estate operating income | |
| Real estate operating income | |
| Real estate operating income | |
| | | | | Year Ended December 31, | | 2020 vs | |
| Net result from mortgage loan receivables held for sale | |
| | | | 2020 | | 2019 | | 2019 | |
| Net result from mortgage loan receivables held for sale | |
| | Net interest income | | | | | | | |
| Interest income | | $ | 239,849 | | | $ | 330,235 | | | $ | (90,386) | | |
| Interest expense | | 227,474 | | | 204,353 | | | 23,121 | | |
| Net interest income | | 12,375 | | | 125,882 | | | (113,507) | | |
| Provision for (release of) loan loss reserves | | 18,275 | | | 2,600 | | | 15,675 | | |
| Net interest income (expense) after provision for (release of) loan losses | | (5,900) | | | 123,282 | | | (129,182) | | |
| Net result from mortgage loan receivables held for sale | |
| Realized gain (loss) on securities | |
| Unrealized gain (loss) on securities | |
| | Other income (loss) | | | | | | |
| Operating lease income | | 100,248 | | | 106,366 | | | (6,118) | | |
| Realized gain (loss) on sale of real estate, net | |
| Realized gain (loss) on sale of real estate, net | |
| Realized gain (loss) on sale of real estate, net | |
| | Sale of loans, net | | (1,571) | | | 54,758 | | | (56,329) | | |
| Realized gain (loss) on securities | | (12,410) | | | 14,911 | | | (27,321) | | |
| Unrealized gain (loss) on equity securities | | (132) | | | 1,737 | | | (1,869) | | |
| Unrealized gain (loss) on Agency interest-only securities | | 263 | | | 84 | | | 179 | | |
| Realized gain (loss) on sale of real estate, net | | 32,102 | | | 1,392 | | | 30,710 | | |
| Impairment of real estate | | — | | | (1,350) | | | 1,350 | | |
| Fee and other income | |
| Fee and other income | |
| Fee and other income | Fee and other income | | 12,654 | | | 24,403 | | | (11,749) | | |
| Net result from derivative transactions | Net result from derivative transactions | | (15,270) | | | (30,011) | | | 14,741 | | |
| Earnings (loss) from investment in unconsolidated joint ventures | | 1,821 | | | 3,432 | | | (1,611) | | |
| Earnings from investment in unconsolidated ventures | |
| | Gain (loss) on extinguishment/defeasance of debt | | 22,250 | | | (1,070) | | | 23,320 | | |
| Gain on extinguishment of debt | |
| Gain on extinguishment of debt | |
| Gain on extinguishment of debt | |
| Total other income (loss) | Total other income (loss) | | 139,955 | | | 174,652 | | | (34,697) | | |
| Costs and expenses | Costs and expenses | | | | | | | |
| Salaries and employee benefits | | 58,101 | | | 67,768 | | | (9,667) | | |
| Compensation and employee benefits | |
| Compensation and employee benefits | |
| Compensation and employee benefits | |
| Operating expenses | Operating expenses | | 20,294 | | | 22,595 | | | (2,301) | | |
| Real estate operating expenses | Real estate operating expenses | | 28,584 | | | 23,323 | | | 5,261 | | |
| Fee expense | | 7,244 | | | 6,090 | | | 1,154 | | |
| Investment related expenses | |
| Depreciation and amortization | Depreciation and amortization | | 39,079 | | | 38,511 | | | 568 | | |
| Total costs and expenses | Total costs and expenses | | 153,302 | | | 158,287 | | | (4,985) | | |
| Income (loss) before taxes | Income (loss) before taxes | | (19,247) | | | 139,647 | | | (158,894) | | |
| Income tax expense (benefit) | Income tax expense (benefit) | | (9,789) | | | 2,646 | | | (12,435) | | |
| Net income (loss) | Net income (loss) | | $ | (9,458) | | | $ | 137,001 | | | $ | (146,459) | | |
|
Investment Overview
Activity for the year ended December 31, 20202023 included originating and funding $566.5$68.4 million in principal value of commercial mortgage loans and $726.7 million of principal repayments, which contributed to a net decrease in our loan portfolio of $0.8 billion. Activity for the year ended December 31, 2023 included securities purchases of $144.0 million, sales of $17.8 million and $232.1 million of amortization and paydowns, which contributed to a net decrease in our securities portfolio of $102.0 million. We acquired $87.6 million in real estate via foreclosure and received proceeds from the sale of real estate of $43.3 million as a result of the sale of one investment. In addition, we purchased $5.2 billion of short-term U.S. Treasury securities during the year ended December 31, 2023, of which $4.3 billion matured during the year ended December 31, 2023.
Activity for the year ended December 31, 2022 included originating and funding $1.3 billion in principal value of commercial mortgage loans, which was offset by $582.8 million of sales and $961.2 million$0.9 billion of principal repayments in the year ended December 31, 2020.and $29.2 million of proceeds of sales of loans. We acquired $440.4$96.2 million of new securities, which was offset by $931.9$5.8 million of sales and $135.9$184.8 million of amortization in the portfolio, which partially contributed to a net decrease in our securities portfolio of $663.0$115.8 million during the year ended December 31, 2020.2022. We also invested $36.7acquired $24.8 million in real estate which includes $29.3 million of real estate acquired via foreclosure, and received proceeds from the sale of real estate of $98.7$310.5 million as a result of the sale of eight investments.
Net Interest Income
The $113.8 million increase in interest income was primarily attributable to increases in prevailing interest rate benchmarks on our floating rate balance sheet loan and securities portfolios partially offset by net payoffs. There was a $(0.3) billion decrease in average loan investments from $3.9 billion for the year ended December 31, 2022 to $3.6 billion for the year ended December 31, 2023. There was a $(152.6) million decrease in average securities investments from $648.1 million for the year ended December 31, 2022 to $495.5 million for the year ended December 31, 2023.
The $49.5 million increase in interest expense is primarily related to higher prevailing rates on our floating rate debt and higher outstanding balances on our loan repurchase facilities. The increase in interest expense was partially offset by lower interest expense as a result of lower average spreads on secured debt and reductions in the outstanding balances of our long-term mortgage loan debt, securities repurchase financing, and FHLB borrowings as well as a reduction in expense as a result of redemptions of our Notes.
As of December 31, 2023, the weighted average yield on our mortgage loan receivables was 9.6%, compared to 8.8% as of December 31, 2022. The weighted average yield increased as a result of increases in the prevailing interest rates. As of December 31, 2023, the weighted average interest rate on borrowings against our mortgage loan receivables was 7.5%, compared to 4.8% as of December 31, 2022. The increase in the rate on borrowings against our mortgage loan receivables from December 31, 2022 to December 31, 2023 was primarily due to the increase in prevailing interest rates. As of December 31, 2023, we had outstanding borrowings secured by our mortgage loan receivables equal to 53.1% of the carrying value of our mortgage loan receivables, compared to 43.0% as of December 31, 2022.
As of December 31, 2023, the weighted average yield on our securities was 6.1%, compared to 5.2% as of December 31, 2022. The weighted average yield increased as a result of increases in the prevailing interest rates. As of December 31, 2023, the weighted average interest rate on borrowings against our securities was 5.8%, compared to 4.8% as of December 31, 2022. The increase in the rate on borrowings against our securities from December 31, 2022 to December 31, 2023 was primarily due to higher prevailing market borrowing rates as of December 31, 2023 compared to December 31, 2022. As of December 31, 2023, we had outstanding borrowings secured by our securities equal to 24.0% of the carrying value of our real estate securities, compared to 75.6% as of December 31, 2022.
Our real estate is comprised of non-interest bearing assets; however, interest incurred on mortgage financing collateralized by such real estate is included in interest expense. As of December 31, 2023, the weighted average interest rate on mortgage borrowings against our real estate assets was 5.9%, compared to 5.5% as of December 31, 2022. As of December 31, 2023, we had outstanding borrowings secured by our real estate equal to 60.3% of the carrying value of our real estate, compared to 71.1% as of December 31, 2022.
Provision for (release of) Loan Loss Reserves
The provision for the year ended December 31, 2023 of $25.1 million represents an increase in the general reserve of loans held for investment. The increase in the provision associated with the general reserve during the year ended December 31, 2023 was primarily due to adverse changes in macroeconomic conditions affecting commercial real estate, partially offset by a decrease in the size of our balance sheet first mortgage loans as a result of repayments.
The provision for the year ended December 31, 2022 of $3.7 million represents an increase in the general reserve of loans held for investment of $6.5 million and an increase related to unfunded loan commitments of $0.3 million partially offset by a $3.1 million recovery of provision. The increase in provision associated with the general reserve during the year ended December 31, 2022 is primarily due to adverse changes in macroeconomic scenarios and an overall increase in the size of our balance sheet first mortgage portfolio as a result of net originations during that time.
For additional information, refer to “Allowance for Credit Losses and Non-Accrual Status” in Note 3, Mortgage Loan Receivables, to the consolidated financial statements.
Real Estate Operating Income
The decrease of $11.3 million in real estate operating income primarily relates to operating income earned on properties sold during the twelve months ended December 31, 2022 and December 31, 2023 for which there was an immaterial amount or no operating income during the current period.
Net Result from Mortgage Loan Receivables Held for Sale
Net result from mortgage loan receivables held for sale includes unrealized losses on loans held for sale related to lower of cost or market adjustments and realized gains and losses from the sale of loans. During the year ended December 31, 2023, we did not sell any conduit loans and recorded $0.5 million of unrealized losses on loans related to lower of cost or market adjustments on our conduit loans. During the year ended December 31, 2022, we sold two conduit loans for a net gain of $0.2 million and recorded $2.6 million of unrealized losses on loans related to lower of cost or market adjustments on our conduit loans. Income from sales of loans, net is subject to market conditions impacting timing, size and pricing and as such may vary significantly quarter to quarter.
Realized Gain (Loss) on Securities
The realized loss on securities for the year ended December 31, 2023 was $(0.3) million compared to a realized loss of $(0.1) million for December 31, 2022. For the year ended December 31, 2023, we sold $14.9 million of CMBS securities. For the year ended December 31, 2022, we sold $4.3 million of CMBS securities and $1.5 million of equity securities.
Realized Gain (Loss) on Sale of Real Estate, Net
There was a decrease of $107.2 million in realized gain (loss) on the sale of real estate for the year ended December 31, 2023, which was a result of one sale during the year ended December 31, 2023, as compared to eight sales during the year ended December 31, 2022. During the year ended December 31, 2023, there was a sale of one hotel property for a realized gain of $8.8 million. During the year ended December 31, 2022, there were sales of: (i) two office properties for a realized gain of $61.5 million; (ii) one warehouse property for a realized gain of $14.6 million; (iii) three apartment buildings for a combined realized gain of $29.1 million; and (iv) two retail properties for a realized gain of $10.8 million.
Fee and Other Income
We generate fee income on the loans we originate and in which we invest, and dividend income on our FHLB stock. The $5.8 million decrease in fee and other income was primarily due to the timing of loan payoffs for the year ended December 31, 2023 as compared to the year ended December 31, 2022, partially offset by an increase in dividends from FHLB stock.
Net Result from Derivative Transactions
Net result from derivative transactions of $1.5 million is composed of a realized gain of $1.9 million and an unrealized loss of $(0.4) million for the year ended December 31, 2023, compared to a net gain of $12.4 million for the year ended December 31, 2022, which was comprised of a realized gain of $11.8 million and a $0.6 million unrealized gain resulting in a decrease of $10.9 million. The hedge positions primarily relate to fixed rate conduit loans, and securities investments. The derivative positions that generated these results were a combination of five and ten year U.S. treasury rate futures that we employed in an effort to hedge the interest rate risk primarily on the financing of our fixed rate assets and the net interest income we earn against the impact of changes in interest rates. The net gain in 2023 was primarily related to increases in interest rates during the year ended December 31, 2023. The total net result from derivative transactions is comprised of hedging interest expense, realized gains/losses related to hedge terminations and unrealized gains/losses related to changes in the fair value of asset hedges.
Earnings from Investment in Unconsolidated Ventures
Earnings from our investment in unconsolidated ventures totaled $0.8 million and $1.4 million for the year ended December 31, 2023 and 2022, respectively. The $0.6 million decrease in earnings from investments in unconsolidated ventures is attributable to higher interest expense due to a higher debt balance at the property as a result of a refinancing in 2023. Our maximum exposure to loss from these investments is limited to the carrying value of our investment.
Gain on Extinguishment of Debt
Gain on extinguishment of debt totaled $10.7 million for the year ended December 31, 2023. During the year ended December 31, 2023, the Company retired: (1) $16.2 million of principal of the 2025 Notes for a repurchase price of $14.8 million, recognizing a $1.3 million net gain on extinguishment of debt after recognizing $(72) thousand of unamortized debt issuance costs associated with the retired debt; (2) $38.9 million of principal of the 2027 Notes for a repurchase price of $31.8 million, recognizing a $6.8 million net gain on extinguishment of debt after recognizing $(0.3) million of unamortized debt issuance costs associated with the retired debt; and (3) $13.1 million of principal of the 2029 Notes for a repurchase price of $10.3 million, recognizing a $2.6 million net gain on extinguishment of debt after recognizing $(0.2) million of unamortized debt issuance costs associated with the retired debt.
Gain on extinguishment of debt totaled $0.7 million for the year ended December 31, 2022. During the year ended December 31, 2022, the Company retired: (1) $4.0 million of principal of the 2025 Notes for a repurchase price of $3.7 million, recognizing a $0.3 million net gain on extinguishment of debt after recognizing $(23) thousand of unamortized debt issuance costs associated with the retired debt; (2) $1.0 million of principal of the 2027 Notes for a repurchase price of $0.8 million, recognizing a $0.2 million net gain on extinguishment of debt after recognizing $(9) thousand of unamortized debt issuance costs associated with the retired debt; and (3) $1.0 million of principal of the 2029 Notes for a repurchase price of $0.8 million, recognizing a $0.2 million net gain on extinguishment of debt after recognizing $(14) thousand of unamortized debt issuance costs associated with the retired debt.
Compensation and Employee Benefits
Compensation and employee benefits are comprised primarily of salaries, bonuses, equity-based compensation and other employee benefits. The decrease of $12.2 million in compensation expense is primarily due to to the timing of employee stock and bonus compensation in 2021, 2022 and 2023.
Operating Expenses
Operating expenses are primarily comprised of professional fees, lease expense and technology expenses. The decrease during the year ended December 31, 2023 as compared to December 31, 2022 of $1.2 million was primarily related to a decrease in professional and technology expenses.
Real Estate Operating Expenses
The decrease of $1.0 million from year ended December 31, 2023 to December 31, 2022 was primarily due to the absence of operating expenses for properties that were sold during the twelve months ended December 31, 2022 for which there was no operating expense during the current period.
Investment Related Expenses
Investment related expenses are comprised primarily of custodian fees, financing costs, servicing fees related to loans and other loan related expenses. The increase during the year ended December 31, 2023 as compared to December 31, 2022 of $1.6 million was primarily attributable to an increase in loan related expenses.
Depreciation and Amortization
The $2.8 million decrease during the year ended December 31, 2023 as compared to December 31, 2022 in depreciation and amortization is primarily attributable to the timing of one real estate sale and three acquisitions that occurred after December 31, 2022, and the timing of eight sales and two acquisitions during the year ended December 31, 2022.
Income Tax (Benefit) Expense
Most of our consolidated income tax provision related to the business units held in our TRSs. The decrease in expense of $0.7 million during the year ended December 31, 2023 as compared to December 31, 2022 is primarily a result of a tax reserve recognized in 2022 offset by changes in income generated by our TRSs.
Liquidity and Capital Resources
The management of our liquidity and capital diversity and allocation strategies is critical to the success and growth of our business. We manage our sources of liquidity to complement our asset composition and to diversify our exposure across multiple capital markets and counterparties.
We require substantial amounts of capital to support our business. The management team, in consultation with our board of directors, establishes our overall liquidity and capital allocation strategies. A key objective of those strategies is to support the execution of our business strategy while maintaining sufficient ongoing liquidity throughout the business cycle to service our financial obligations as they become due. When making funding and capital allocation decisions, members of our senior management consider: business performance; the availability of, and costs and benefits associated with, different funding sources; current and expected capital markets and general economic conditions; our asset composition and capital structure; and our targeted liquidity profile and risks relating to our funding needs.
To ensure that Ladder can effectively address the funding needs of the Company on a timely basis, we maintain a diverse array of liquidity sources including: (1) cash and cash equivalents; (2) cash generated from operations; (3) proceeds from the issuance of the unsecured bonds; (4) borrowings under repurchase agreements; (5) principal repayments on investments including mortgage loans and securities; (6) borrowings under our Revolving Credit Facility; (7) proceeds from securitizations and sales of loans; (8) proceeds from the sale of securities; (9) proceeds from the sale of real estate; (10) proceeds from the issuance of CLO debt and other non-mark-to-market loan financing; and (11) proceeds from the issuance of equity capital. We use these funding sources to meet our obligations on a timely basis and have the ability to use our significant unencumbered asset base to further finance our business.
Our primary uses of liquidity are for: (1) the funding of loan, real estate-related and securities investments; (2) the repayment of short-term and long-term borrowings and related interest; (3) the funding of our operating expenses; and (4) distributions to our equity investors to comply with the REIT distribution requirements. We require short-term liquidity to fund loans that we originate and hold on our consolidated balance sheet pending sale, including through whole loan sale, participation, or securitization. We generally require longer-term funding to finance the loans and real estate-related investments that we hold for investment. We have historically used the aforementioned funding sources to meet the operating and investment needs as they have arisen and have been able to do so by applying a rigorous approach to long and short-term cash and debt forecasting.
In addition, as a REIT, we are also required to make sufficient dividend payments to our shareholders in amounts at least sufficient to maintain our REIT status. Under IRS guidance, we may elect to pay a portion of our dividends in stock, subject to a cash/stock election by our shareholders, to optimize our level of capital retention. Accordingly, our cash requirement to pay dividends to maintain REIT status could be substantially reduced at the discretion of the board of directors.
Our principal debt financing sources include: (1) long-term senior unsecured notes in the form of corporate bonds; (2) CLO issuances; (3) committed secured funding provided by banks and other lenders; (4) long term non-recourse mortgage financing; (5) uncommitted secured funding sources, including asset repurchase agreements with a number of banks; (6) unsecured Revolving Credit Facility and (7) secured advances from the FHLB through our captive insurance company.
In the future, we may also use other sources of financing to fund the acquisition of our assets, including credit facilities, warehouse facilities, repurchase facilities and other secured and unsecured forms of borrowing. These financings may be collateralized or non-collateralized, may involve one or more lenders and may accrue interest at either fixed or floating rates. We may also seek to raise further equity capital or issue debt securities in order to fund our future investments.
Refer to “Financial Covenants” and “Our Financing Strategies” for further disclosure of our diverse financing sources and, for a summary of our financial obligations, refer to the Contractual Obligations table below. All of our existing financial obligations due within the following year can be extended for one or more additional years at our discretion, refinanced or repaid at maturity or are incurred in the normal course of business (i.e., interest payments/loan funding obligations).
Cash, Cash Equivalents and Restricted Cash
We held cash, cash equivalents and restricted cash of $1.0 billion at December 31, 2023, of which $1.0 billion was unrestricted cash and cash equivalents and $15.4 million was restricted cash. We held cash and cash equivalents of $609.1 million and restricted cash of $50.5 million as of December 31, 2022.
Cash Flows
The following table provides a breakdown of the net change in our cash, cash equivalents, and restricted cash ($ in thousands):
| | | | | | | | | | | | | | | |
| | Year Ended December 31, | | | | |
| | 2023 | | 2022 | | | | |
| Net cash provided by (used in) operating activities | $ | 180,604 | | | $ | 106,710 | | | | | |
| Net cash provided by (used in) investing activities | 793,503 | | | 81,590 | | | | | |
| Net cash provided by (used in) financing activities | (557,766) | | | (150,244) | | | | | |
| Net increase (decrease) in cash, cash equivalents and restricted cash | $ | 416,341 | | | $ | 38,056 | | | | | |
Year ended December 31, 2023
We experienced a net increase in cash, cash equivalents and restricted cash of $416.3 million for the year ended December 31, 2023, reflecting cash provided by operating activities of $180.6 million, cash provided by investing activities of $793.5 million and cash used in financing activities of $(557.8) million.
Net cash provided by operating activities of $180.6 million was primarily driven by net interest income and increases in net operating income on our real estate portfolio.
Net cash provided by investing activities of $793.5 million was driven by $738.5 million of repayment from mortgage loan receivables, $232.1 million in repayments on securities, and $17.8 million of proceeds from sale of securities, partially offset by $(144.0) million in purchases of securities and $(68.4) million of origination of mortgage loans held for investment.
Net cash used in financing activities of $(557.8) million was primarily as a result of net repayments of borrowings of $(427.1) million, $(116.4) million of dividend payments, $(7.9) million of shares acquired to satisfy minimum federal and state tax withholdings on restricted stock, $(2.5) million purchase of treasury stock, and $(3.4) million in deferred financing cost.
Year ended December 31, 2022
We experienced a net increase in cash, cash equivalents and restricted cash of $38.1 million for the year ended December 31, 2022 reflecting cash provided by operating activities of $106.7 million, cash provided by investing activities of $81.6 million and cash used in financing activities of $(150.2) million.
Net cash provided by operating activities of $106.7 million was primarily driven by $29.2 million in proceeds from sale of loans and increases in net interest income and increases in net operating income on our real estate portfolio partially offset by $(61.3) million of originations of mortgage loans held for sale.
Net cash provided by investing activities of $81.6 million was driven by $909.8 million of repayment from mortgage loan receivables, $310.5 million proceeds from the sale of real estate, $184.8 million in repayments on securities, and $5.8 million of proceeds from sale of securities, partially offset by $(1.2) billion of origination of mortgage loans held for investment and $(96.2) million in purchases of securities.
Net cash used in financing activities of $(150.2) million was primarily as a result of $(107.0) million of dividend payments, $(29.5) million of capital distributed to noncontrolling interests in consolidated ventures, $(11.4) million of shares acquired to satisfy minimum federal and state tax withholdings on restricted stock, $(7.9) million purchase of treasury stock, and $(8.3) million in deferred financing cost, partially offset by net repayments of borrowings of $13.7 million.
Unencumbered Assets
As of December 31, 2023, we held unencumbered cash of $1.0 billion, unencumbered loans of $1.1 billion, unencumbered securities of $342.8 million, unencumbered real estate of $160.8 million and $394.2 million of other assets not encumbered by any portion of secured indebtedness. As of December 31, 2022, we held unencumbered cash and cash equivalents of $609.1 million, unencumbered loans of $1.7 billion, unencumbered securities of $97.5 million, unencumbered real estate of $140.3 million and $351.6 million of other assets not encumbered by any portion of secured indebtedness.
Borrowings under various financing arrangements
Our financing strategies are critical to the success and growth of our business. We manage our leverage policies to complement our asset composition and to diversify our exposure across multiple counterparties. Our borrowings under various financing arrangements as of December 31, 2023 are set forth in the table below ($ in thousands):
| | | | | |
| December 31, 2023 |
| |
| Committed loan repurchase facilities | $ | 604,999 | |
| Committed securities repurchase facility | — | |
| Uncommitted securities repurchase facilities | 1,608 | |
| Total repurchase facilities | 606,607 | |
| |
| |
| |
| Mortgage loan financing(1) | 437,759 | |
| |
| |
| CLO debt(2) | 1,060,719 | |
| |
| Borrowings from the FHLB | 115,000 | |
| Senior unsecured notes(3) | 1,563,861 | |
| |
| |
| Total debt obligations, net | $ | 3,783,946 | |
(1)Presented net of unamortized debt issuance costs of $1.4 million and net of premiums of $1.8 million as of December 31, 2023.
(2)Presented net of unamortized debt issuance costs of $2.1 million as of December 31, 2023.
(3)Presented net of unamortized debt issuance costs of $11.8 million as of December 31, 2023.
The Company’s repurchase facilities include covenants covering minimum net worth requirements (ranging from $400.0 million to $871.4 million), maximum reductions in net worth over stated time periods, minimum liquidity levels (typically $30.0 million of cash or a higher standard that often allows for the inclusion of different percentages of liquid securities in the determination of compliance with the requirement), maximum leverage ratios (calculated in various ways based on specified definitions of indebtedness and net worth) and a fixed charge coverage ratio of 1.25x, and, in the instance of one lender, an interest coverage ratio of 1.50x, in each case, if certain liquidity thresholds are not satisfied. We were in compliance with all covenants as of December 31, 2023 and December 31, 2022. Further, certain of our financing arrangements and loans on our real property are secured by the assets of the Company, including pledges of the equity of certain subsidiaries or the assets of certain subsidiaries. From time to time, certain of these financing arrangements and loans may prohibit certain of our subsidiaries from paying dividends to the Company, from making distributions on such subsidiary’s capital stock, from repaying to the Company any loans or advances to such subsidiary from the Company or from transferring any of such subsidiary’s property or other assets to the Company or other subsidiaries of the Company.
Committed Loan Facilities
We are a party to multiple committed loan repurchase agreement facilities, totaling $1.2 billion of credit capacity as of December 31, 2023. As of December 31, 2023, the Company had $605.0 million of borrowings outstanding, with an additional $637.0 million of committed financing available. As of December 31, 2022, the Company had $616.9 million of borrowings outstanding, with an additional $683.1 million of committed financing available. Assets pledged as collateral under these facilities are generally limited to whole mortgage loans collateralized by first liens on commercial real estate, mezzanine loans collateralized by equity interests in entities that own commercial real estate, and certain interests in such first mortgage and mezzanine loans. Our repurchase facilities include covenants covering net worth requirements, minimum liquidity levels, and maximum debt/equity ratios. We believe we were in compliance with all covenants as of December 31, 2023.
We have the option to extend some of our existing facilities subject to a number of customary conditions. The lenders have sole discretion with respect to the inclusion of collateral in these facilities, to determine the market value of the collateral on a daily basis, and, if the estimated market value of the included collateral declines, the lenders have the right to require additional collateral or a full and/or partial repayment of the facilities (margin call), sufficient to rebalance the facilities. Typically, the facilities are established with stated guidelines regarding the maximum percentage of the collateral asset’s market value that can be borrowed. We often borrow at a lower percentage of the collateral asset’s value than the maximum leaving us with excess
borrowing capacity that can be drawn upon at a later date and/or applied against future margin calls so that they can be satisfied on a cashless basis.
Committed Securities Facility
We are a party to a term master repurchase agreement with a major U.S. banking institution for CMBS, totaling $100.0 million of credit capacity. As we do in the case of borrowings under committed loan facilities, we often borrow at a lower percentage of the collateral asset’s value than the maximum, leaving us with excess borrowing capacity that can be drawn upon a later date and/or applied against future margin calls so that they can be satisfied on a cashless basis. As of December 31, 2023, the Company had no borrowings outstanding, with an additional $100.0 million of committed financing available. As of December 31, 2022, the Company had $8.6 million of borrowings outstanding, and an additional $91.4 million of committed financing available.
Uncommitted Securities Facilities
We are a party to multiple master repurchase agreements with several counterparties to finance our investments in CMBS and U.S. Agency securities. The securities that served as collateral for these borrowings are highly liquid and marketable assets that are typically of relatively short duration.
Revolving Credit Facility
The Company’s revolving credit facility (“Revolving Credit Facility”) provides for an aggregate maximum borrowing amount of $323.9 million, including a $25.0 million sublimit for the issuance of letters of credit. The Revolving Credit Facility is available on a revolving basis to finance the Company’s working capital needs and for general corporate purposes. Borrowings under the Revolving Credit Facility incur interest at a fixed margin of 2.50% over the index rate, with reductions in the fixed margin upon the achievement of investment grade credit ratings. On January 25, 2024, the Company amended its Revolving Credit Facility to extend the final maturity date to January 25, 2029. As of December 31, 2023, the Company had no outstanding borrowings on the Revolving Credit Facility, but still maintains the ability to draw $323.9 million.
The obligations under the Revolving Credit Facility are guaranteed by the Company and certain of its subsidiaries. The Revolving Credit Facility is secured by a pledge of the shares of (or other ownership or equity interests in) certain subsidiaries to the extent the pledge is not restricted under existing regulations, law or contractual obligations.
The Company is subject to customary affirmative covenants and negative covenants, including limitations on the incurrence of additional debt, liens, restricted payments, sales of assets and affiliate transactions. In addition, the Company is required to comply with financial covenants relating to minimum net worth, maximum leverage, minimum liquidity, and minimum fixed charge coverage, consistent with our other credit facilities. The Company’s ability to borrow is dependent on, among other things, compliance with the financial covenants. The Revolving Credit Facility contains customary events of default, including non-payment of principal or interest, fees or other amounts, failure to perform or observe covenants, cross-default to other indebtedness, the rendering of judgments against the Company or certain of our subsidiaries to pay certain amounts of money and certain events of bankruptcy or insolvency.
Mortgage Loan Financing
The Company typically finances its real estate investments with long-term, non-recourse mortgage financing. These mortgage loans have carrying amounts of $437.8 million and $498.0 million, net of unamortized premiums of $1.8 million and $2.4 million as of December 31, 2023 and December 31, 2022, respectively, representing proceeds received upon financing greater than the contractual amounts due under these agreements. The premiums are being amortized over the remaining life of the respective debt instruments using the effective interest method. The Company recorded $0.6 million and $0.7 million and $1.4 million of premium amortization, which decreased interest expense for the years ended December 31, 2023, 2022, and 2021 respectively. These non-recourse debt agreements provide for secured financing at rates ranging from 4.39% to 9.03%, and, as of December 31, 2023, have anticipated maturity dates between 2024 - 2031, with an average term of 3.1 years. The mortgage loans are collateralized by real estate and related lease intangibles, net, of $474.7 million and $559.9 million as of December 31, 2023 and December 31, 2022, respectively. During the year ended December 31, 2023 the Company did not execute any new term debt agreements to finance properties in its real estate portfolio. During the year ended December 31, 2022, the Company executed one new term debt agreement to finance properties in its real estate portfolio.
Collateralized Loan Obligations (“CLO”) Debt
On July 13, 2021, a consolidated subsidiary of the Company completed a privately-marketed CLO transaction, which generated $498.2 million of gross proceeds to Ladder, financing $607.5 million of loans (“Contributed July 2021 Loans”) at an 82% advance rate on a matched term, non-mark-to-market and non-recourse basis. A consolidated subsidiary of the Company retained an 18% subordinate and controlling interest in the CLO. The Company retained consent rights over major decisions with respect to the servicing of the Contributed July 2021 Loans, including the right to appoint and replace the special servicer under the CLO. The CLO is a VIE and the Company was the primary beneficiary and, therefore, consolidated the VIE. Refer to Note 9, Consolidated Variable Interest Entities, for additional information.
On December 2, 2021, a consolidated subsidiary of the Company completed a privately-marketed CLO transaction, which generated $566.2 million of gross proceeds to Ladder, financing $729.4 million of loans (“Contributed December 2021 Loans”) at a maximum 77.6% advance rate on a matched term, non-mark-to-market and non-recourse basis. A consolidated subsidiary of the Company retained an 15.6% subordinate and controlling interest in the CLO. The Company also held two additional tranches as investments totaling 6.8% interest in the CLO. The Company retained consent rights over major decisions with respect to the servicing of the Contributed December 2021 Loans, including the right to appoint and replace the special servicer under the CLO. The CLO is a VIE and the Company was the primary beneficiary and, therefore, consolidated the VIE. Refer to Note 9, Consolidated Variable Interest Entities, for additional information.
As of December 31, 2023, the Company had $1.1 billion of matched term, non-mark-to-market and non-recourse CLO debt included in debt obligations on its consolidated balance sheets. Unamortized debt issuance costs of $2.1 million were included in CLO debt as of December 31, 2023.
As of December 31, 2022, the Company had $1.1 billion of matched term, non-mark-to-market and non-recourse CLO debt included in debt obligations on its consolidated balance sheets. Unamortized debt issuance costs of $5.9 million were included in CLO debt as of December 31, 2022.
Borrowings from the Federal Home Loan Bank (“FHLB”)
On July 11, 2012, Tuebor, a consolidated subsidiary of the Company, became a member of the FHLB and subsequently drew its first secured funding advances from the FHLB. As of February 19, 2021, pursuant to a final rule adopted by the Federal Housing Finance Agency (the “FHFA”) regarding the eligibility of captive insurance companies, Tuebor’s membership in the FHLB has been terminated, although outstanding advances may remain outstanding until their scheduled maturity dates. Funding for future advance paydowns is expected to be obtained from the natural amortization and/or sales of securities collateral, or from other financing sources. There is no assurance that the FHFA or the FHLB will not take actions that could adversely impact Tuebor’s existing advances.
As of December 31, 2023, Tuebor had $115.0 million of borrowings outstanding, with terms of 0.3 years to 0.75 years (with a weighted average of 0.57 years), interest rates of 5.76% to 5.88% (with a weighted average of 5.82%), and advance rates of 71.7% to 95.7% on eligible collateral. As of December 31, 2023, collateral for the borrowings was comprised primarily of $140.3 million of CMBS.
As of December 31, 2022, Tuebor had $213.0 million of borrowings outstanding, with terms of 0.6 years to 1.75 years (with a weighted average of 1.25 years), interest rates of 2.74% to 4.70% (with a weighted average of 4.52%), and advance rates of 71.7% to 95.7% on eligible collateral. As of December 31, 2022, collateral for the borrowings was comprised primarily of $248.8 million of CMBS.
Tuebor is subject to state regulations which require that dividends (including dividends to the Company as its parent) may only be made with regulatory approval. However, there can be no assurance that we would obtain such approval if sought. Largely as a result of this restriction, approximately $0.8 billion of Tuebor’s member’s capital was restricted from transfer via dividend to Tuebor’s parent without prior approval of state insurance regulators at December 31, 2023. To facilitate intercompany cash funding of operations and investments, Tuebor and its parent maintain regulator-approved intercompany borrowing/lending agreements.
Senior Unsecured Notes
As of December 31, 2023, the Company had $1.6 billion of unsecured corporate bonds outstanding. These unsecured financings were comprised of $327.8 million in aggregate principal amount of 5.25% senior notes due 2025 (the “2025 Notes”), $611.9 million in aggregate principal amount of 4.25% senior notes due 2027 (the “2027 Notes”) and $635.9 million in aggregate
principal of 4.75% senior notes due 2029 (the “2029 Notes,” and collectively with the 2025 Notes and the 2027 Notes, the “Notes”).
As of December 31, 2022, the Company had $1.6 billion of unsecured corporate bonds outstanding. These unsecured financings were comprised of $344.0 million in aggregate principal amount of 5.25% senior notes due 2025 (the “2025 Notes”), $650.8 million in aggregate principal amount of 4.25% senior notes due 2027 (the “2027 Notes”) and $649.0 million in aggregate principal of 4.75% senior notes due 2029 (the “2029 Notes,” and collectively with the 2025 Notes and the 2027 Notes, the “Notes”).
LCFH issued the Notes with Ladder Capital Finance Corporation (“LCFC”), as co-issuers on a joint and several basis. LCFC is a 100% owned finance subsidiary of LCFH with no assets, operations, revenues or cash flows other than those related to the issuance, administration and repayment of the Notes. The Company and certain subsidiaries of LCFH currently guarantee the obligations under the Notes and the indenture. The Company believes it was in compliance with all covenants of the Notes as of December 31, 2023 and 2022. The Notes are presented net of unamortized debt issuance costs of $11.8 million and $15.4 million as of December 31, 2023 and December 31, 2022, respectively.
The Notes require interest payments semi-annually in cash in arrears, are unsecured, and are subject to an unencumbered assets to unsecured debt covenant. The Company may redeem the Notes, in whole or in part, at any time, or from time to time, prior to their stated maturity upon not less than 10 nor more than 60 days’ notice, at a redemption price as specified in each respective indenture governing the Notes, plus accrued and unpaid interest, if any, to the redemption date. The board of directors has authorized the Company to repurchase any or all of the Notes from time to time without further approval.
During the year ended December 31, 2023, the Company repurchased $16.2 million of the 2025 Notes and recognized a net gain of $1.3 million on extinguishment of debt, $38.9 million of the 2027 Notes and recognized a net gain of $6.8 million on extinguishment of debt, and $13.1 million of the 2029 Notes and recognized a net gain of $2.6 million on extinguishment of debt.
Stock Repurchases
On July 27, 2022, the board of directors authorized the repurchase of $50.0 million of the Company’s Class A common stock from time to time without further approval. This authorization increased the remaining outstanding authorization per the August 4, 2021 authorization from $39.5 million to $50.0 million. Stock repurchases by the Company are generally made for cash in open market transactions at prevailing market prices but may also be made in privately negotiated transactions or otherwise. The timing and amount of purchases are determined based upon prevailing market conditions, our liquidity requirements, contractual restrictions and other factors. As of December 31, 2023, the Company has a remaining amount available for repurchase of $44.3 million, which represents 3.0% in the aggregate of its outstanding Class A common stock, based on the closing price of $11.51 per share on such date. Refer to Note 10, Equity Structure and Accounts, to our consolidated financial statements included elsewhere in this Annual Report, for disclosure of the Company’s repurchase activity.
The following table is a summary of the Company’s repurchase activity of its Class A common stock during the year ended December 31, 2023 ($ in thousands):
| | | | | | | | | | | | | | |
| | Shares | | Amount(1) |
| Authorizations remaining as of December 31, 2022 | | | | $ | 46,737 | |
| | | | |
| Repurchases paid: | | | | |
| March 1 - March 31, 2023 | | 250,000 | | | (2,285) | |
| | | | |
| | | | |
| | | | |
| | | | |
| | | | |
| September 1 - September 30, 2023 | | 19,000 | | | (196) | |
| | | | |
| | | | |
| | | | |
| Authorizations remaining as of December 31, 2023 | | | | $ | 44,256 | |
(1)Amount excludes commissions paid associated with share repurchases.
Dividends
In order for the Company to maintain its qualification as a REIT under the Code, it must annually distribute at least 90% of its taxable income. The Company has paid and in the future intends to declare regular quarterly distributions to its shareholders in aggregating to an amount approximating at least 90% of the REIT’s annual net taxable income.
Activity forAll distributions are made at the year ended December 31, 2019 included originatingdiscretion of our board of directors and funding $2.4 billion in principal valuedepend on our earnings, our financial condition, any debt covenants, maintenance of commercial mortgage loans, which was offset by $1.0 billionour REIT qualification, restrictions on making distributions under Delaware law and other factors as our board of sales and $1.5 billion of principal repayments in the year ended December 31, 2019. We acquired $1.6 billion of new securities, which was partially offset by $855.9 million of sales and $491.9 million of amortization in the portfolio, which partially contributeddirectors may deem relevant from time to a net increase in our securities portfolio of $311.2 million during the year ended December 31, 2019. We also invested $104.6 million in real estate, which included $84.2 million of real estate acquired via foreclosure, and received proceeds from the sale of real estate of $24.2 million.time.
Operating OverviewRefer to Note 10, Equity Structure and Accounts, to our consolidated financial statements included elsewhere in this Annual Report, for disclosure of dividends declared.
Net income (loss) totaled $(9.5)Principal Repayments on Investments
We receive principal amortization on our loans and securities as part of the normal course of our business. Repayment of mortgage loan receivables provided net cash of $738.5 million for the year ended December 31, 2020, compared to $137.02023 and $909.8 million for the year ended December 31, 2019. Net income (loss) for the year ended December 31, 2020 were significantly impacted by management’s actions to generate liquidity and pay down mark-to-market financing in direct response to the COVID-19 pandemic. The most significant drivers of the $146.5 million decrease are as follows:
•a decrease in net interest income after provision for loan losses of $129.2 million, primarily as a result of the $90.4 million decrease in interest income and a $23.1 million increase in interest expense. Also contributing was a $15.7 million increase in provision for loan loss reserves related to the adoption of CECL;
•a decrease in total other income (loss) of $34.7 million, primarily as a result of a decrease of $56.3 million in sales of loans, a decrease of $27.3 million in realized gains (losses) on securities, a decrease of $6.1 million on operating lease income and a decrease of $11.7 million on fee and other income, partially offset by a $14.7 million increase in net results from derivative transactions and $30.7 million increase in profits on sales2022. Repayment of real estate;
•a decrease in total costs and expensesestate securities provided net cash of $5.0 million compared to the prior year, primarily attributable to a $9.7 million decrease in salaries and employee benefit, partially offset by a $5.3 million increase in real estate operating expenses; and
•a ($12.4 million) increase in income tax expense (benefit) compared to the prior year, primarily attributable to a decrease in forecasted GAAP income in our TRSs.
Income (Loss) Before Taxes
Income (loss) before taxes totaled $(19.2)$232.1 million for the year ended December 31, 2020, compared to $139.62023, and $184.8 million for the year ended December 31, 2019. The significant components2022.
Proceeds from Securitizations and Sales of Loans
We sell our conduit mortgage loans to securitization trusts and to other third parties as part of our normal course of business and from time to time will sell balance sheet mortgage loans. There were no proceeds from sales of mortgage loans for the year ended December 31, 2023, and there were $29.2 million of proceeds from sales of mortgage loans for the year ended December 31, 2022.
Proceeds from the Sale of Securities
We sell our investments in CMBS, U.S. Agency securities, corporate bonds, U.S. Treasury securities, and equity securities as a part of our normal course of business. Proceeds from sales of securities provided net cash of $17.8 million for the year ended December 31, 2023, and $5.8 million for the year ended December 31, 2022.
Proceeds from the Sale of Real Estate
There were $13.4 million, net proceeds from sales of real estate for the year ended December 31, 2023, and $310.5 million for the year ended December 31, 2022.
Other Potential Sources of Financing
In the future, we may also use other sources of financing to fund the acquisition of our assets, including credit facilities, warehouse facilities, repurchase facilities and other secured and unsecured forms of borrowing. These financings may be collateralized or non-collateralized, may involve one or more lenders and may accrue interest at either fixed or floating rates. We may also seek to raise further equity capital or issue debt securities in order to fund our future investments.
Contractual Obligations
Contractual obligations as of December 31, 2023 were as follows ($ in thousands):
| | | | | | | | | | | | | | | | | | | | | | | | | | | | | |
| Contractual Obligations (1) |
| Less than 1 Year | | 1-3 Years | | 3-5 Years | | More than 5 Years | | Total |
| Secured financings(2) | $ | 320,900 | | | $ | 481,915 | | | $ | 310,620 | | | $ | 45,555 | | | $ | 1,158,990 | |
| | | | | | | | | |
| Senior unsecured notes | — | | | 327,756 | | | 611,939 | | | 635,919 | | | 1,575,614 | |
| Interest payable(3) | 100,321 | | | 161,693 | | | 83,146 | | | 17,019 | | | 362,179 | |
| Other funding obligations(4) | 75,648 | | | — | | | | | 10,002 | | | 85,650 | |
| | | | | | | | | |
| Operating lease obligations | 2,171 | | | 4,426 | | | 15,575 | | | — | | | 22,172 | |
| Total | $ | 499,040 | | | $ | 975,790 | | | $ | 1,021,280 | | | $ | 708,495 | | | $ | 3,204,605 | |
(1)As more fully disclosed in Note 6, Debt Obligations, Net, to our consolidated financial statements included elsewhere in this Annual Report, the allocation of repayments under our committed loan repurchase facilities is based on the earlier of: (i) the maturity date of each agreement; or (ii) the maximum maturity date of the $158.9collateral loans, assuming all extension options are exercised by the borrower.
(2)Total does not include $1.1 billion of consolidated CLO debt obligations and the related debt issuance costs of $2.1 million, decreaseas the satisfaction of these liabilities will not require cash outlays from us.
(3)Comprised of interest on secured financings and on senior unsecured notes. For borrowings with variable interest rates, we used the rates in effect as of December 31, 2023 to determine the future interest payment obligations.
(4)Comprised primarily of our off-balance sheet unfunded commitment to provide additional first mortgage loan financing as of December 31, 2023. The allocation of our unfunded loan commitments is based on the earlier of the commitment expiration date or the final maturity date, however, we may be obligated to fund these commitments earlier than such date. This amount excludes $128.6 million of future funding commitments that require the occurrence of certain “good news” events, such as the owner concluding a lease agreement with a major tenant in the building or reaching a pre-determined net operating income (loss) before taxeswhich may or may not be achieved.
The table above does not include amounts due under our derivative agreements as those contracts do not have fixed and determinable payments. Our contractual obligations will be refinanced and/or repaid from earnings as well as amortization and sales of our liquid collateral. We have made investments in various unconsolidated ventures of which our maximum exposure to loss from these investments is limited to the carrying value of our investments.
Future Liquidity Needs
In addition to the future contractual obligations above, the Company, in the coming year and beyond, as a part of its normal course of business will require cash to fund unfunded loan commitments and new investments in a combination of balance sheet mortgage loans, conduit loans, real estate investments and securities as it deems appropriate as well as necessary expenses as a part of general corporate purposes. These new investments and general corporate expenses may be funded with existing cash, proceeds from loan and securities payoffs, through financing using our Revolving Credit Facility or loan and security financing facilities, or through additional debt or equity raises. The Company has no known material cash requirements other than its contractual obligations in the above table, unfunded commitments and future general corporate expenses.
Unfunded Loan Commitments
We may be a party to financial instruments with off-balance sheet risk in the normal course of business to meet the financial needs of our borrowers. These commitments are not reflected on the consolidated balance sheets. As of December 31, 2023, our off-balance sheet arrangements consisted of $204.0 million of unfunded commitments of mortgage loan receivables held for investment, 63% of which additional funds relate to the occurrence of certain “good news” events, such as the owner concluding a lease agreement with a major tenant in the building or reaching some pre-determined net operating income. As of December 31, 2022, our off-balance sheet arrangements consisted of $321.8 million of unfunded commitments of mortgage loan receivables held for investment to provide additional first mortgage loan financing. Such commitments are subject to our borrowers’ satisfaction of certain financial and nonfinancial covenants and involve, to varying degrees, elements of credit risk in excess of the amount recognized in the consolidated balance sheets. Commitments are subject to our loan borrowers’ satisfaction of certain financial and nonfinancial covenants and may or may not be funded depending on a variety of circumstances including timing, credit metric hurdles, and other nonfinancial events occurring.
LIBOR Transition to SOFR
As of December 31, 2023, all of our floating rate loans earn interest at a rate indexed to Term SOFR; and all of our floating rate debt obligations bear interest indexed to Term SOFR.
Interest Rate Environment
The nature of the Company’s business exposes it to market risk arising from changes in interest rates. Changes, both increases and decreases, in the rates the Company is able to charge its borrowers, the yields the Company is able to achieve in its securities investments, and the Company’s cost of borrowing directly impacts its net income. The Company’s net interest income includes interest from both fixed and floating rate debt. The percentage of the Company’s assets and liabilities bearing interest at fixed and floating rates may change over time, and asset composition may differ materially from debt composition. Refer to Item 7A “Quantitative and Qualitative Disclosures about Market Risk” for further disclosures surrounding the impact of rising or falling interest rate on our earnings.
Critical Accounting Policies and Estimates
The preparation of financial statements in accordance with GAAP requires management to make estimates and judgments in certain circumstances that affect amounts reported as assets, liabilities, revenues and expenses. We have established detailed policies and control procedures intended to ensure that valuation methods, including any judgments made as part of such methods, are well controlled, reviewed and applied consistently from period to period. We base our estimates on historical corporate and industry experience and various other assumptions that we believe to be appropriate under the circumstances. The Company’s critical accounting policies are those which require assumptions to be made about matters that are highly uncertain. Different estimates could have a material effect on the Company’s financial results. For all of these estimates, we caution that future events rarely develop exactly as forecasted and, therefore, routinely require adjustment.
During 2023, management reviewed and evaluated these critical accounting policies and estimates and believes they are appropriate. Our significant accounting policies are described in the first three bullet points under operating overview above.Note 2, Significant Accounting Policies, to our consolidated financial statements included elsewhere in this Annual Report. The following is a list of accounting policies that require more significant estimates and judgments:
•Allowance for loan losses
•Acquisition of real estate
•Impairment or disposal of long lived assets
•Identified intangible assets and liabilities
•Variable interest entities
•Valuation of financial instruments
The following is a summary of accounting policies that require more significant management estimates and judgments:
Allowance for Loan Losses
The Company uses a current expected credit loss model (“CECL”) for estimating the provision for loan losses on its loan portfolio. The CECL model requires the consideration of possible credit losses over the life of an instrument and includes a portfolio-based component and an asset-specific component. In compliance with the CECL reporting requirements, the Company supplements its existing credit monitoring and management processes with additional processes to support the calculation of the CECL reserves. The Company engages a third-party service provider to provide market data and a credit loss model. The credit loss model is a forward-looking, econometric, commercial real estate (“CRE”) loss forecasting tool. It is comprised of a probability of default (“PD”) model and a loss given default (“LGD”) model that, layered together with the Company’s loan-level data, fair value of collateral, net operating income of collateral, selected forward-looking macroeconomic variables, and pool-level mean loss rates, produces life of loan expected losses (“EL”) at the loan and portfolio level. Where management has determined that the credit loss model does not fully capture certain external factors, including portfolio trends or loan-specific factors, a qualitative adjustment to the reserve is recorded. In addition, interest receivable on loans is not included in the Company’s CECL calculations as the Company performs timely write offs of aged interest receivable. The Company has made a policy election to write off aged receivables through interest income as opposed to through the CECL provision on its statements of income.
Loans for which the borrower or sponsor is experiencing financial difficulty, and where repayment of the loan is expected substantially through the operation or sale of the underlying collateral, are considered collateral dependent loans. For collateral dependent loans, the Company may elect a practical expedient which allows the Company to measure expected losses based on the difference between the collateral’s fair value and the amortized cost basis of the loan. When the repayment or satisfaction of the loan is dependent on a sale, rather than operations of the collateral, the fair value is adjusted for the estimated costs to sell the collateral. If foreclosure is probable, the Company is required to measure for expected losses using this methodology.
The Company generally will use the direct capitalization rate valuation methodology or the sales comparison approach to estimate the fair value of the collateral for loans and in certain cases will obtain external appraisals. Determining fair value of the collateral may take into account a number of assumptions including, but not limited to, cash flow projections, market capitalization rates, discount rates and data regarding recent comparable sales of similar properties. Such assumptions are generally based on current market conditions and are subject to economic and market uncertainties.
The Company’s loans are typically collateralized by real estate directly or indirectly. As a result, the Company regularly evaluates the extent and impact of any credit deterioration associated with the performance and/or value of the underlying collateral property as well as the financial and operating capability of the borrower/sponsor on a loan-by-loan basis. Specifically, a property’s operating results and any cash reserves are analyzed and used to assess: (i) whether cash flow from operations is sufficient to cover the debt service requirements currently and into the future; (ii) the ability of the borrower to refinance the loan at maturity; and/or (iii) the property’s liquidation value. The Company also evaluates the financial wherewithal of any loan guarantors as well as the borrower’s competency in managing and operating the properties. In addition, the Company considers the overall economic environment, real estate sector, and geographic submarket in which the collateral property is located. Such impairment analyses are completed and reviewed by asset management and underwriting personnel, who utilize various data sources, including: (i) periodic financial data such as property occupancy, tenant profile, rental rates, operating expenses, the borrowers’ business plan, and capitalization and discount rates; (ii) site inspections; and (iii) current credit spreads and other market data and ultimately presented to management for approval.
When a debtor is experiencing financial difficulties and a loan is modified, the effect of the modification will be included in the Company’s assessment of the CECL allowance for loan losses. If the Company provides principal forgiveness, the amortized cost basis of the loan is written off against the allowance for loan losses. Generally, when granting concessions, the Company will seek to protect its position by requiring incremental pay downs, additional collateral or guarantees and, in some cases, lookback features or equity interests to offset concessions granted should conditions impacting the loan improve.
The Company designates a loan as a non-accrual loan generally when: (i) the principal or coupon interest components of loan payments become 90-days past due; or (ii) in the opinion of the Company, it is doubtful the Company will be able to collect all principal and coupon interest due according to the contractual terms of the loan. Interest income on non-accrual loans in which the Company reasonably expects a full recovery of the loan’s outstanding principal balance is recognized when received in cash. Otherwise, income recognition will be suspended and any cash received will be applied as a reduction to the amortized cost basis. A non-accrual loan is returned to accrual status at such time as the loan becomes contractually current and future principal and coupon interest are reasonably assured to be received in accordance with the contractual loan terms. A loan will be written off when management has determined principal and coupon interest is no longer realizable and deemed non-recoverable.
The CECL accounting estimate is subject to uncertainty as a result of changing macroeconomic market conditions, as well as the vintage and location of the underlying assets as disclosed in Note 3, Mortgage Loan Receivables, to our consolidated financial statements included elsewhere in this Annual Report. The provision for (release of) loan losses for the year ended December 31, 2023 and December 31, 2022 was $25.1 million and $3.7 million, respectively.
During the year ended December 31, 2023, there was a charge off of reserve of $2.7 million. The allowance for loan losses at December 31, 2023 and December 31, 2022 was $43.9 million and $21.5 million, respectively. The allowance includes $0.7 million of reserves for unfunded commitments at December 31, 2023 and December 31, 2022. The estimate is sensitive to the assumptions used to represent future expected economic conditions.
Acquisition of Real Estate
We generally acquire real estate assets or land and development assets through purchases and may also acquire such assets through foreclosure or deed-in-lieu of foreclosure in full or partial satisfaction of defaulted loans. Purchased properties are classified as real estate, net or land and development, net on our consolidated balance sheets. When we intend to hold, operate or develop the property for a period of at least 12 months, the asset is classified as real estate, net, and if the asset meets the held-for-sale criteria, the asset is classified as real estate held for sale. Upon purchase, the properties are recorded at cost.
Foreclosed assets classified as real estate and land and development are initially recorded at their estimated fair value and assets classified as held for sale are recorded at their estimated fair value less costs to sell. The excess of the carrying value of the loan over these amounts is charged-off against the reserve for loan losses. In both cases, upon acquisition, tangible and intangible assets and liabilities acquired are recorded at their relative fair values.
Identified Intangible Assets and Liabilities
We record intangible assets and liabilities acquired at their relative fair values, and determine whether such intangible assets and liabilities have finite or indefinite lives. As of December 31, 2023 and December 31, 2022, all such acquired intangible assets and liabilities have finite lives. We review finite lived intangible assets for impairment whenever events or changes in circumstances indicate that their carrying amount may not be recoverable. If we determine the carrying value of an intangible asset is not recoverable, we will record an impairment charge to the extent its carrying value exceeds its estimated fair value. Impairments of intangibles are recorded in impairment of assets in our consolidated statements of income.
Impairment or Disposal of Long-lived Assets
Real estate assets to be disposed of are reported at the lower of their carrying amount or estimated fair value less costs to sell and are included in real estate held for sale on our consolidated balance sheets. The difference between the estimated fair value less costs to sell and the carrying value will be recorded as an impairment charge. Impairment for real estate assets are included in impairment of assets in our consolidated statements of operations. Once the asset is classified as held for sale, depreciation expense is no longer recorded.
We periodically review real estate to be held and used, and land and development assets for impairment in value, whenever events or changes in circumstances indicate that the carrying amount of such assets may not be recoverable. The asset’s value is impaired only if management’s estimate of the aggregate future cash flows (undiscounted and without interest charges) to be generated by the asset (taking into account the anticipated holding period of the asset) is less than the carrying value. Such estimate of cash flows considers factors such as expected future operating income, trends and prospects, as well as the effects of demand, competition and other economic factors. To the extent impairment has occurred, the loss will be measured as the excess of the carrying amount of the property over the fair value of the asset and reflected as an adjustment to the basis of the asset. Impairments of real estate and land and development assets are recorded in impairment of assets in our consolidated statements of operations.
There were no properties classified as held for sale as of December 31, 2023 and December 31, 2022. We did not record any impairments of real estate for the years ended December 31, 2023 or December 31, 2022.
Variable Interest Entities
We evaluate our investments and other contractual arrangements to determine if our interests constitute variable interests in a variable interest entity (“VIE”) and if we are the primary beneficiary. There is a significant amount of judgment required to determine if an entity is considered a VIE and if we are the primary beneficiary. We first perform a qualitative analysis, which requires certain subjective decisions regarding our assessment, including, but not limited to, which interests create or absorb variability, the contractual terms, the key decision-making powers, impact on the VIE’s economic performance and related party relationships. An iterative quantitative analysis is required if our qualitative analysis proves inconclusive as to whether the entity is a VIE or we are the primary beneficiary and consolidation is required.
Fair Value of Assets and Liabilities
The degree of management judgment involved in determining the fair value of assets and liabilities is dependent upon the availability of quoted market prices or observable market parameters. For financial and nonfinancial assets and liabilities that trade actively and have quoted market prices or observable market parameters, there is minimal subjectivity involved in measuring fair value. When observable market prices and parameters are not fully available, management judgment is necessary to estimate fair value. In addition, changes in market conditions may reduce the availability of quoted prices or observable data. For example, reduced liquidity in the capital markets or changes in secondary market activities could result in observable market inputs becoming unavailable. Therefore, when market data is not available, we would use valuation techniques requiring more management judgment to estimate the appropriate fair value measurement.
Recently Adopted Accounting Pronouncements and Recent Accounting Pronouncements Pending Adoption
Our recently adopted accounting pronouncements and recent accounting pronouncements pending adoption are described in Note 2, Significant Accounting Policies, to our consolidated financial statements included elsewhere in this Annual Report.
Reconciliation of Non-GAAP Financial Measures
Distributable EarningsNet Result from Derivative Transactions
Distributable earnings,Net result from derivative transactions of $1.5 million is composed of a non-GAAP financial measure, totaled $68.3realized gain of $1.9 million and an unrealized loss of $(0.4) million for the year ended December 31, 2020,2023, compared to $190.6a net gain of $12.4 million for the year ended December 31, 2019. Distributable earnings2022, which was comprised of a realized gain of $11.8 million and a $0.6 million unrealized gain resulting in a decrease of $10.9 million. The hedge positions primarily relate to fixed rate conduit loans, and securities investments. The derivative positions that generated these results were a combination of five and ten year U.S. treasury rate futures that we employed in an effort to hedge the interest rate risk primarily on the financing of our fixed rate assets and the net interest income we earn against the impact of changes in interest rates. The net gain in 2023 was primarily related to increases in interest rates during the year ended December 31, 2023. The total net result from derivative transactions is comprised of hedging interest expense, realized gains/losses related to hedge terminations and unrealized gains/losses related to changes in the fair value of asset hedges.
Earnings from Investment in Unconsolidated Ventures
Earnings from our investment in unconsolidated ventures totaled $0.8 million and $1.4 million for the year ended December 31, 2020 was significantly impacted by management’s actions to generate liquidity2023 and pay down mark-to-market financing in direct response to the COVID-19 pandemic.2022, respectively. The significant components of the $122.3$0.6 million decrease in distributable earnings arefrom investments in unconsolidated ventures is attributable to higher interest expense due to a decrease of $112.0 million in net interest income after provision for loan losses, a decrease in total other income (loss) of $29.2 million, primarilyhigher debt balance at the property as a result of a decreaserefinancing in 2023. Our maximum exposure to loss from these investments is limited to the carrying value of $44.4 million in saleour investment.
Gain on Extinguishment of $11.7 million in fee and other income, a decrease of $6.1 million in operating lease income and a decrease of $12.0 million in gain (loss) on securities, partially offset by an increase of $26.0 million in sale of real estate, net, an increase of $15.0 million in net results from derivative transactions, an increase of $4.3 million in gain (loss)Debt
Gain on extinguishment of debt and a decrease of $28.5totaled $10.7 million in salaries and employee benefits.
Our results of operations were significantly impacted by the actions we took to generate liquidity and pay down mark-to-market debt in direct response to the unfavorable market conditions that occurred near the onset of the COVID-19 pandemic. The actions taken by management had multiple impacts on distributable earnings for the year ended December 31, 2020. Management believes2023. During the actions taken were prompted byyear ended December 31, 2023, the unusual market conditionsCompany retired: (1) $16.2 million of principal of the 2025 Notes for a repurchase price of $14.8 million, recognizing a $1.3 million net gain on extinguishment of debt after recognizing $(72) thousand of unamortized debt issuance costs associated with the retired debt; (2) $38.9 million of principal of the 2027 Notes for a repurchase price of $31.8 million, recognizing a $6.8 million net gain on extinguishment of debt after recognizing $(0.3) million of unamortized debt issuance costs associated with the retired debt; and therefore outside(3) $13.1 million of Ladder’s main operations. Management believes adjusting its performance measuresprincipal of the 2029 Notes for certain transactional chargesa repurchase price of $10.3 million, recognizing a $2.6 million net gain on extinguishment of debt after recognizing $(0.2) million of unamortized debt issuance costs associated with the retired debt.
Gain on extinguishment of debt totaled $0.7 million for the year ended December 31, 2022. During the year ended December 31, 2022, the Company retired: (1) $4.0 million of principal of the 2025 Notes for a repurchase price of $3.7 million, recognizing a $0.3 million net gain on extinguishment of debt after recognizing $(23) thousand of unamortized debt issuance costs associated with the retired debt; (2) $1.0 million of principal of the 2027 Notes for a repurchase price of $0.8 million, recognizing a $0.2 million net gain on extinguishment of debt after recognizing $(9) thousand of unamortized debt issuance costs associated with the retired debt; and gains(3) $1.0 million of principal of the 2029 Notes for a repurchase price of $0.8 million, recognizing a $0.2 million net gain on extinguishment of debt after recognizing $(14) thousand of unamortized debt issuance costs associated with the retired debt.
Compensation and Employee Benefits
Compensation and employee benefits are comprised primarily of salaries, bonuses, equity-based compensation and other employee benefits. The decrease of $12.2 million in compensation expense is primarily due to to the timing of employee stock and bonus compensation in 2021, 2022 and 2023.
Operating Expenses
Operating expenses are primarily comprised of professional fees, lease expense and technology expenses. The decrease during the year ended December 31, 2023 as compared to December 31, 2022 of $1.2 million was primarily related to a decrease in professional and technology expenses.
Real Estate Operating Expenses
The decrease of $1.0 million from year ended December 31, 2023 to December 31, 2022 was primarily due to the absence of operating expenses for properties that were recognizedsold during the threetwelve months ended June 30, 2020December 31, 2022 for which there was no operating expense during the current period.
Investment Related Expenses
Investment related expenses are comprised primarily of custodian fees, financing costs, servicing fees related to loans and other loan related expenses. The increase during the year ended December 31, 2023 as compared to December 31, 2022 of $1.6 million was primarily attributable to an increase in loan related expenses.
Depreciation and Amortization
The $2.8 million decrease during the year ended December 31, 2023 as compared to December 31, 2022 in depreciation and amortization is primarily attributable to the timing of one real estate sale and three acquisitions that occurred after December 31, 2022, and the timing of eight sales and two acquisitions during the year ended December 31, 2022.
Income Tax (Benefit) Expense
Most of our consolidated income tax provision related to the impactbusiness units held in our TRSs. The decrease in expense of COVID-19$0.7 million during the year ended December 31, 2023 as compared to December 31, 2022 is primarily a result of a tax reserve recognized in 2022 offset by changes in income generated by our TRSs.
Liquidity and Capital Resources
The management of our liquidity and capital diversity and allocation strategies is critical to the success and growth of our business. We manage our sources of liquidity to complement our asset composition and to diversify our exposure across multiple capital markets and counterparties.
We require substantial amounts of capital to support our business. The management team, in consultation with our board of directors, establishes our overall liquidity and capital allocation strategies. A key objective of those strategies is to support the execution of our business strategy while maintaining sufficient ongoing liquidity throughout the business cycle to service our financial obligations as they become due. When making funding and capital allocation decisions, members of our senior management consider: business performance; the availability of, and costs and benefits associated with, different funding sources; current and expected capital markets and general economic conditions; our asset composition and capital structure; and our targeted liquidity profile and risks relating to our funding needs.
To ensure that Ladder can effectively address the funding needs of the Company on a timely basis, we maintain a diverse array of liquidity sources including: (1) cash and cash equivalents; (2) cash generated from operations; (3) proceeds from the issuance of the unsecured bonds; (4) borrowings under repurchase agreements; (5) principal repayments on investments including mortgage loans and securities; (6) borrowings under our Revolving Credit Facility; (7) proceeds from securitizations and sales of loans; (8) proceeds from the sale of securities; (9) proceeds from the sale of real estate; (10) proceeds from the issuance of CLO debt and other non-mark-to-market loan financing; and (11) proceeds from the issuance of equity capital. We use these funding sources to meet our obligations on a timely basis and have the ability to use our significant unencumbered asset base to further finance our business.
Our primary uses of liquidity are for: (1) the funding of loan, real estate-related and securities investments; (2) the repayment of short-term and long-term borrowings and related interest; (3) the funding of our operating expenses; and (4) distributions to our equity investors to comply with the REIT distribution requirements. We require short-term liquidity to fund loans that we originate and hold on our consolidated balance sheet pending sale, including through whole loan sale, participation, or securitization. We generally require longer-term funding to finance the loans and real estate-related investments that we hold for investment. We have historically used the aforementioned funding sources to meet the operating and investment needs as they have arisen and have been able to do so by applying a rigorous approach to long and short-term cash and debt forecasting.
In addition, as a REIT, we are also required to make sufficient dividend payments to our shareholders in amounts at least sufficient to maintain our REIT status. Under IRS guidance, we may elect to pay a portion of our dividends in stock, subject to a cash/stock election by our shareholders, to optimize our level of capital retention. Accordingly, our cash requirement to pay dividends to maintain REIT status could be substantially reduced at the discretion of the board of directors.
Our principal debt financing sources include: (1) long-term senior unsecured notes in the form of corporate bonds; (2) CLO issuances; (3) committed secured funding provided by banks and other lenders; (4) long term non-recourse mortgage financing; (5) uncommitted secured funding sources, including asset repurchase agreements with a number of banks; (6) unsecured Revolving Credit Facility and (7) secured advances from the FHLB through our captive insurance company.
In the future, we may also use other sources of financing to fund the acquisition of our assets, including credit facilities, warehouse facilities, repurchase facilities and other secured and unsecured forms of borrowing. These financings may be collateralized or non-collateralized, may involve one or more lenders and may accrue interest at either fixed or floating rates. We may also seek to raise further equity capital or issue debt securities in order to fund our future investments.
Refer to “Financial Covenants” and “Our Financing Strategies” for further disclosure of our diverse financing sources and, for a summary of our financial obligations, refer to the Contractual Obligations table below. All of our existing financial obligations due within the following year can be extended for one or more additional years at our discretion, refinanced or repaid at maturity or are incurred in the normal course of business (i.e., interest payments/loan funding obligations).
Cash, Cash Equivalents and Restricted Cash
We held cash, cash equivalents and restricted cash of $1.0 billion at December 31, 2023, of which $1.0 billion was unrestricted cash and cash equivalents and $15.4 million was restricted cash. We held cash and cash equivalents of $609.1 million and restricted cash of $50.5 million as of December 31, 2022.
Cash Flows
The following table provides a more useful guide to assess the ongoing main operationsbreakdown of the net change in our cash, cash equivalents, and restricted cash ($ in thousands):
| | | | | | | | | | | | | | | |
| | Year Ended December 31, | | | | |
| | 2023 | | 2022 | | | | |
| Net cash provided by (used in) operating activities | $ | 180,604 | | | $ | 106,710 | | | | | |
| Net cash provided by (used in) investing activities | 793,503 | | | 81,590 | | | | | |
| Net cash provided by (used in) financing activities | (557,766) | | | (150,244) | | | | | |
| Net increase (decrease) in cash, cash equivalents and restricted cash | $ | 416,341 | | | $ | 38,056 | | | | | |
Year ended December 31, 2023
We experienced a net increase in cash, cash equivalents and restricted cash of $416.3 million for the year ended December 31, 2023, reflecting cash provided by operating activities of $180.6 million, cash provided by investing activities of $793.5 million and cash used in financing activities of $(557.8) million.
Net cash provided by operating activities of $180.6 million was primarily driven by net interest income and increases in net operating income on our real estate portfolio.
Net cash provided by investing activities of $793.5 million was driven by $738.5 million of repayment from mortgage loan receivables, $232.1 million in repayments on securities, and $17.8 million of proceeds from sale of securities, partially offset by $(144.0) million in purchases of securities and $(68.4) million of origination of mortgage loans held for investment.
Net cash used in financing activities of $(557.8) million was primarily as a result of net repayments of borrowings of $(427.1) million, $(116.4) million of dividend payments, $(7.9) million of shares acquired to satisfy minimum federal and state tax withholdings on restricted stock, $(2.5) million purchase of treasury stock, and $(3.4) million in deferred financing cost.
Year ended December 31, 2022
We experienced a net increase in cash, cash equivalents and restricted cash of $38.1 million for the year ended December 31, 2022 reflecting cash provided by operating activities of $106.7 million, cash provided by investing activities of $81.6 million and cash used in financing activities of $(150.2) million.
Net cash provided by operating activities of $106.7 million was primarily driven by $29.2 million in proceeds from sale of loans and increases in net interest income and increases in net operating income on our real estate portfolio partially offset by $(61.3) million of originations of mortgage loans held for sale.
Net cash provided by investing activities of $81.6 million was driven by $909.8 million of repayment from mortgage loan receivables, $310.5 million proceeds from the sale of real estate, $184.8 million in repayments on securities, and $5.8 million of proceeds from sale of securities, partially offset by $(1.2) billion of origination of mortgage loans held for investment and $(96.2) million in purchases of securities.
Net cash used in financing activities of $(150.2) million was primarily as a result of $(107.0) million of dividend payments, $(29.5) million of capital distributed to noncontrolling interests in consolidated ventures, $(11.4) million of shares acquired to satisfy minimum federal and state tax withholdings on restricted stock, $(7.9) million purchase of treasury stock, and $(8.3) million in deferred financing cost, partially offset by net repayments of borrowings of $13.7 million.
Unencumbered Assets
As of December 31, 2023, we held unencumbered cash of $1.0 billion, unencumbered loans of $1.1 billion, unencumbered securities of $342.8 million, unencumbered real estate of $160.8 million and $394.2 million of other assets not encumbered by any portion of secured indebtedness. As of December 31, 2022, we held unencumbered cash and cash equivalents of $609.1 million, unencumbered loans of $1.7 billion, unencumbered securities of $97.5 million, unencumbered real estate of $140.3 million and $351.6 million of other assets not encumbered by any portion of secured indebtedness.
Borrowings under various financing arrangements
Our financing strategies are critical to the success and growth of our business. We manage our leverage policies to complement our asset composition and to diversify our exposure across multiple counterparties. Our borrowings under various financing arrangements as of December 31, 2023 are set forth in the table below ($ in thousands):
| | | | | |
| December 31, 2023 |
| |
| Committed loan repurchase facilities | $ | 604,999 | |
| Committed securities repurchase facility | — | |
| Uncommitted securities repurchase facilities | 1,608 | |
| Total repurchase facilities | 606,607 | |
| |
| |
| |
| Mortgage loan financing(1) | 437,759 | |
| |
| |
| CLO debt(2) | 1,060,719 | |
| |
| Borrowings from the FHLB | 115,000 | |
| Senior unsecured notes(3) | 1,563,861 | |
| |
| |
| Total debt obligations, net | $ | 3,783,946 | |
(1)Presented net of unamortized debt issuance costs of $1.4 million and net of premiums of $1.8 million as of December 31, 2023.
(2)Presented net of unamortized debt issuance costs of $2.1 million as of December 31, 2023.
(3)Presented net of unamortized debt issuance costs of $11.8 million as of December 31, 2023.
The Company’s repurchase facilities include covenants covering minimum net worth requirements (ranging from $400.0 million to $871.4 million), maximum reductions in net worth over stated time periods, minimum liquidity levels (typically $30.0 million of cash or a higher standard that often allows for the inclusion of different percentages of liquid securities in the determination of compliance with the requirement), maximum leverage ratios (calculated in various ways based on specified definitions of indebtedness and net worth) and a fixed charge coverage ratio of 1.25x, and, in the instance of one lender, an interest coverage ratio of 1.50x, in each case, if certain liquidity thresholds are not satisfied. We were in compliance with all covenants as of December 31, 2023 and December 31, 2022. Further, certain of our financing arrangements and loans on our real property are secured by the assets of the Company, including pledges of the equity of certain subsidiaries or the assets of certain subsidiaries. From time to time, certain of these financing arrangements and loans may prohibit certain of our subsidiaries from paying dividends to the Company, from making distributions on such subsidiary’s capital stock, from repaying to the Company any loans or advances to such subsidiary from the Company or from transferring any of such subsidiary’s property or other assets to the Company or other subsidiaries of the Company.
Committed Loan Facilities
We are a party to multiple committed loan repurchase agreement facilities, totaling $1.2 billion of credit capacity as of December 31, 2023. As of December 31, 2023, the Company had $605.0 million of borrowings outstanding, with an additional $637.0 million of committed financing available. As of December 31, 2022, the Company had $616.9 million of borrowings outstanding, with an additional $683.1 million of committed financing available. Assets pledged as collateral under these facilities are generally limited to whole mortgage loans collateralized by first liens on commercial real estate, mezzanine loans collateralized by equity interests in entities that own commercial real estate, and certain interests in such first mortgage and mezzanine loans. Our repurchase facilities include covenants covering net worth requirements, minimum liquidity levels, and maximum debt/equity ratios. We believe we were in compliance with all covenants as of December 31, 2023.
We have the option to extend some of our existing facilities subject to a number of customary conditions. The lenders have sole discretion with respect to the inclusion of collateral in these facilities, to determine the market value of the collateral on a daily basis, and, if the estimated market value of the included collateral declines, the lenders have the right to require additional collateral or a full and/or partial repayment of the facilities (margin call), sufficient to rebalance the facilities. Typically, the facilities are established with stated guidelines regarding the maximum percentage of the collateral asset’s market value that can be borrowed. We often borrow at a lower percentage of the collateral asset’s value than the maximum leaving us with excess
borrowing capacity that can be drawn upon at a later date and/or applied against future margin calls so that they can be satisfied on a cashless basis.
Committed Securities Facility
We are a party to a term master repurchase agreement with a major U.S. banking institution for CMBS, totaling $100.0 million of credit capacity. As we do in the case of borrowings under committed loan facilities, we often borrow at a lower percentage of the collateral asset’s value than the maximum, leaving us with excess borrowing capacity that can be drawn upon a later date and/or applied against future margin calls so that they can be satisfied on a cashless basis. As of December 31, 2023, the Company had no borrowings outstanding, with an additional $100.0 million of committed financing available. As of December 31, 2022, the Company had $8.6 million of borrowings outstanding, and an additional $91.4 million of committed financing available.
Uncommitted Securities Facilities
We are a party to multiple master repurchase agreements with several counterparties to finance our investments in CMBS and U.S. Agency securities. The securities that served as collateral for these borrowings are highly liquid and marketable assets that are typically of relatively short duration.
Revolving Credit Facility
The Company’s revolving credit facility (“Revolving Credit Facility”) provides for an aggregate maximum borrowing amount of $323.9 million, including a $25.0 million sublimit for the issuance of letters of credit. The Revolving Credit Facility is available on a revolving basis to finance the Company’s working capital needs and for general corporate purposes. Borrowings under the Revolving Credit Facility incur interest at a fixed margin of 2.50% over the index rate, with reductions in the fixed margin upon the achievement of investment grade credit ratings. On January 25, 2024, the Company amended its Revolving Credit Facility to extend the final maturity date to January 25, 2029. As of December 31, 2023, the Company had no outstanding borrowings on the Revolving Credit Facility, but still maintains the ability to draw $323.9 million.
The obligations under the Revolving Credit Facility are guaranteed by the Company and certain of its subsidiaries. The Revolving Credit Facility is secured by a pledge of the shares of (or other ownership or equity interests in) certain subsidiaries to the extent the pledge is not restricted under existing regulations, law or contractual obligations.
The Company is subject to customary affirmative covenants and negative covenants, including limitations on the incurrence of additional debt, liens, restricted payments, sales of assets and affiliate transactions. In addition, the Company is required to comply with financial covenants relating to minimum net worth, maximum leverage, minimum liquidity, and minimum fixed charge coverage, consistent with our other credit facilities. The Company’s ability to borrow is dependent on, among other things, compliance with the financial covenants. The Revolving Credit Facility contains customary events of default, including non-payment of principal or interest, fees or other amounts, failure to perform or observe covenants, cross-default to other indebtedness, the rendering of judgments against the Company or certain of our subsidiaries to pay certain amounts of money and certain events of bankruptcy or insolvency.
Mortgage Loan Financing
The Company typically finances its real estate investments with long-term, non-recourse mortgage financing. These mortgage loans have carrying amounts of $437.8 million and $498.0 million, net of unamortized premiums of $1.8 million and $2.4 million as of December 31, 2023 and December 31, 2022, respectively, representing proceeds received upon financing greater than the contractual amounts due under these agreements. The premiums are being amortized over the remaining life of the respective debt instruments using the effective interest method. The Company recorded $0.6 million and $0.7 million and $1.4 million of premium amortization, which decreased interest expense for the years ended December 31, 2023, 2022, and 2021 respectively. These non-recourse debt agreements provide for secured financing at rates ranging from 4.39% to 9.03%, and, as of December 31, 2023, have anticipated maturity dates between 2024 - 2031, with an average term of 3.1 years. The mortgage loans are collateralized by real estate and related lease intangibles, net, of $474.7 million and $559.9 million as of December 31, 2023 and December 31, 2022, respectively. During the year ended December 31, 2023 the Company did not execute any new term debt agreements to finance properties in its real estate portfolio. During the year ended December 31, 2022, the Company executed one new term debt agreement to finance properties in its real estate portfolio.
Collateralized Loan Obligations (“CLO”) Debt
On July 13, 2021, a consolidated subsidiary of the Company completed a privately-marketed CLO transaction, which generated $498.2 million of gross proceeds to Ladder, financing $607.5 million of loans (“Contributed July 2021 Loans”) at an 82% advance rate on a matched term, non-mark-to-market and non-recourse basis. A consolidated subsidiary of the Company retained an 18% subordinate and controlling interest in the CLO. The Company retained consent rights over major decisions with respect to the servicing of the Contributed July 2021 Loans, including the right to appoint and replace the special servicer under the CLO. The CLO is a VIE and the Company was the primary beneficiary and, therefore, consolidated the VIE. Refer to Note 9, Consolidated Variable Interest Entities, for additional information.
On December 2, 2021, a consolidated subsidiary of the Company completed a privately-marketed CLO transaction, which generated $566.2 million of gross proceeds to Ladder, financing $729.4 million of loans (“Contributed December 2021 Loans”) at a maximum 77.6% advance rate on a matched term, non-mark-to-market and non-recourse basis. A consolidated subsidiary of the Company retained an 15.6% subordinate and controlling interest in the CLO. The Company also held two additional tranches as investments totaling 6.8% interest in the CLO. The Company retained consent rights over major decisions with respect to the servicing of the Contributed December 2021 Loans, including the right to appoint and replace the special servicer under the CLO. The CLO is a VIE and the Company was the primary beneficiary and, therefore, consolidated the VIE. Refer to Note 9, Consolidated Variable Interest Entities, for additional information.
As of December 31, 2023, the Company had $1.1 billion of matched term, non-mark-to-market and non-recourse CLO debt included in debt obligations on its consolidated balance sheets. Unamortized debt issuance costs of $2.1 million were included in CLO debt as of December 31, 2023.
As of December 31, 2022, the Company had $1.1 billion of matched term, non-mark-to-market and non-recourse CLO debt included in debt obligations on its consolidated balance sheets. Unamortized debt issuance costs of $5.9 million were included in CLO debt as of December 31, 2022.
Borrowings from the Federal Home Loan Bank (“FHLB”)
On July 11, 2012, Tuebor, a consolidated subsidiary of the Company, became a member of the FHLB and subsequently drew its first secured funding advances from the FHLB. As of February 19, 2021, pursuant to a final rule adopted by the Federal Housing Finance Agency (the “FHFA”) regarding the eligibility of captive insurance companies, Tuebor’s membership in the FHLB has been terminated, although outstanding advances may remain outstanding until their scheduled maturity dates. Funding for future advance paydowns is expected to be obtained from the natural amortization and/or sales of securities collateral, or from other financing sources. There is no assurance that the FHFA or the FHLB will not take actions that could adversely impact Tuebor’s existing advances.
As of December 31, 2023, Tuebor had $115.0 million of borrowings outstanding, with terms of 0.3 years to 0.75 years (with a weighted average of 0.57 years), interest rates of 5.76% to 5.88% (with a weighted average of 5.82%), and advance rates of 71.7% to 95.7% on eligible collateral. As of December 31, 2023, collateral for the borrowings was comprised primarily of $140.3 million of CMBS.
As of December 31, 2022, Tuebor had $213.0 million of borrowings outstanding, with terms of 0.6 years to 1.75 years (with a weighted average of 1.25 years), interest rates of 2.74% to 4.70% (with a weighted average of 4.52%), and advance rates of 71.7% to 95.7% on eligible collateral. As of December 31, 2022, collateral for the borrowings was comprised primarily of $248.8 million of CMBS.
Tuebor is subject to state regulations which require that dividends (including dividends to the Company as its parent) may only be made with regulatory approval. However, there can be no assurance that we would obtain such approval if sought. Largely as a result of this restriction, approximately $0.8 billion of Tuebor’s member’s capital was restricted from transfer via dividend to Tuebor’s parent without prior approval of state insurance regulators at December 31, 2023. To facilitate intercompany cash funding of operations and investments, Tuebor and its parent maintain regulator-approved intercompany borrowing/lending agreements.
Senior Unsecured Notes
As of December 31, 2023, the Company had $1.6 billion of unsecured corporate bonds outstanding. These unsecured financings were comprised of $327.8 million in aggregate principal amount of 5.25% senior notes due 2025 (the “2025 Notes”), $611.9 million in aggregate principal amount of 4.25% senior notes due 2027 (the “2027 Notes”) and $635.9 million in aggregate
principal of 4.75% senior notes due 2029 (the “2029 Notes,” and collectively with the 2025 Notes and the 2027 Notes, the “Notes”).
As of December 31, 2022, the Company had $1.6 billion of unsecured corporate bonds outstanding. These unsecured financings were comprised of $344.0 million in aggregate principal amount of 5.25% senior notes due 2025 (the “2025 Notes”), $650.8 million in aggregate principal amount of 4.25% senior notes due 2027 (the “2027 Notes”) and $649.0 million in aggregate principal of 4.75% senior notes due 2029 (the “2029 Notes,” and collectively with the 2025 Notes and the 2027 Notes, the “Notes”).
LCFH issued the Notes with Ladder Capital Finance Corporation (“LCFC”), as co-issuers on a joint and several basis. LCFC is a 100% owned finance subsidiary of LCFH with no assets, operations, revenues or cash flows other than those related to the issuance, administration and repayment of the Notes. The Company and certain subsidiaries of LCFH currently guarantee the obligations under the Notes and the indenture. The Company believes it was in compliance with all covenants of the Notes as of December 31, 2023 and 2022. The Notes are presented net of unamortized debt issuance costs of $11.8 million and $15.4 million as of December 31, 2023 and December 31, 2022, respectively.
The Notes require interest payments semi-annually in cash in arrears, are unsecured, and are subject to an unencumbered assets to unsecured debt covenant. The Company may redeem the Notes, in whole or in part, at any time, or from time to time, prior to their stated maturity upon not less than 10 nor more than 60 days’ notice, at a redemption price as specified in each respective indenture governing the Notes, plus accrued and unpaid interest, if any, to the redemption date. The board of directors has authorized the Company to repurchase any or all of the Notes from time to time without further approval.
During the year ended December 31, 2023, the Company repurchased $16.2 million of the 2025 Notes and recognized a net gain of $1.3 million on extinguishment of debt, $38.9 million of the 2027 Notes and recognized a net gain of $6.8 million on extinguishment of debt, and $13.1 million of the 2029 Notes and recognized a net gain of $2.6 million on extinguishment of debt.
Stock Repurchases
On July 27, 2022, the board of directors authorized the repurchase of $50.0 million of the Company’s Class A common stock from time to time without further approval. This authorization increased the remaining outstanding authorization per the August 4, 2021 authorization from $39.5 million to $50.0 million. Stock repurchases by the Company are generally made for cash in open market transactions at prevailing market prices but may also be made in privately negotiated transactions or otherwise. The timing and amount of purchases are determined based upon prevailing market conditions, our liquidity requirements, contractual restrictions and other factors. As of December 31, 2023, the Company has a remaining amount available for repurchase of $44.3 million, which represents 3.0% in the aggregate of its outstanding Class A common stock, based on the closing price of $11.51 per share on such date. Refer to Note 10, Equity Structure and Accounts, to our consolidated financial statements included elsewhere in this Annual Report, for disclosure of the Company’s repurchase activity.
The following table is a summary of the Company’s repurchase activity of its Class A common stock during the year ended December 31, 2023 ($ in thousands):
| | | | | | | | | | | | | | |
| | Shares | | Amount(1) |
| Authorizations remaining as of December 31, 2022 | | | | $ | 46,737 | |
| | | | |
| Repurchases paid: | | | | |
| March 1 - March 31, 2023 | | 250,000 | | | (2,285) | |
| | | | |
| | | | |
| | | | |
| | | | |
| | | | |
| September 1 - September 30, 2023 | | 19,000 | | | (196) | |
| | | | |
| | | | |
| | | | |
| Authorizations remaining as of December 31, 2023 | | | | $ | 44,256 | |
(1)Amount excludes commissions paid associated with share repurchases.
Dividends
In order for the Company to maintain its qualification as a REIT under the Code, it must annually distribute at least 90% of its taxable income. The Company has paid and in the future intends to declare regular quarterly distributions to its shareholders in aggregating to an amount approximating at least 90% of the REIT’s annual net taxable income.
All distributions are made at the discretion of our board of directors and depend on our earnings, our financial condition, any debt covenants, maintenance of our REIT qualification, restrictions on making distributions under Delaware law and other factors as our board of directors may deem relevant from time to time.
Refer to Note 10, Equity Structure and Accounts, to our consolidated financial statements included elsewhere in this Annual Report, for disclosure of dividends declared.
Principal Repayments on Investments
We receive principal amortization on our loans and securities as part of the normal course of our business. Repayment of mortgage loan receivables provided net cash of $738.5 million for the year ended December 31, 2023 and $909.8 million for the year ended December 31, 2022. Repayment of real estate securities provided net cash of $232.1 million for the year ended December 31, 2023, and $184.8 million for the year ended December 31, 2022.
Proceeds from Securitizations and Sales of Loans
We sell our conduit mortgage loans to securitization trusts and to other third parties as part of our normal course of business and from time to time will sell balance sheet mortgage loans. There were no proceeds from sales of mortgage loans for the year ended December 31, 2023, and there were $29.2 million of proceeds from sales of mortgage loans for the year ended December 31, 2022.
Proceeds from the Sale of Securities
We sell our investments in CMBS, U.S. Agency securities, corporate bonds, U.S. Treasury securities, and equity securities as a part of our normal course of business. Proceeds from sales of securities provided net cash of $17.8 million for the year ended December 31, 2023, and $5.8 million for the year ended December 31, 2022.
Proceeds from the Sale of Real Estate
There were $13.4 million, net proceeds from sales of real estate for the year ended December 31, 2023, and $310.5 million for the year ended December 31, 2022.
Other Potential Sources of Financing
In the future, we may also use other sources of financing to fund the acquisition of our assets, including credit facilities, warehouse facilities, repurchase facilities and other secured and unsecured forms of borrowing. These financings may be collateralized or non-collateralized, may involve one or more lenders and may accrue interest at either fixed or floating rates. We may also seek to raise further equity capital or issue debt securities in order to fund our future investments.
Contractual Obligations
Contractual obligations as of December 31, 2023 were as follows ($ in thousands):
| | | | | | | | | | | | | | | | | | | | | | | | | | | | | |
| Contractual Obligations (1) |
| Less than 1 Year | | 1-3 Years | | 3-5 Years | | More than 5 Years | | Total |
| Secured financings(2) | $ | 320,900 | | | $ | 481,915 | | | $ | 310,620 | | | $ | 45,555 | | | $ | 1,158,990 | |
| | | | | | | | | |
| Senior unsecured notes | — | | | 327,756 | | | 611,939 | | | 635,919 | | | 1,575,614 | |
| Interest payable(3) | 100,321 | | | 161,693 | | | 83,146 | | | 17,019 | | | 362,179 | |
| Other funding obligations(4) | 75,648 | | | — | | | | | 10,002 | | | 85,650 | |
| | | | | | | | | |
| Operating lease obligations | 2,171 | | | 4,426 | | | 15,575 | | | — | | | 22,172 | |
| Total | $ | 499,040 | | | $ | 975,790 | | | $ | 1,021,280 | | | $ | 708,495 | | | $ | 3,204,605 | |
(1)As more fully disclosed in Note 6, Debt Obligations, Net, to our consolidated financial statements included elsewhere in this Annual Report, the allocation of repayments under our committed loan repurchase facilities is based on the earlier of: (i) the maturity date of each agreement; or (ii) the maximum maturity date of the collateral loans, assuming all extension options are exercised by the borrower.
(2)Total does not include $1.1 billion of consolidated CLO debt obligations and the related debt issuance costs of $2.1 million, as the satisfaction of these liabilities will not require cash outlays from us.
(3)Comprised of interest on secured financings and on senior unsecured notes. For borrowings with variable interest rates, we used the rates in effect as of December 31, 2023 to determine the future interest payment obligations.
(4)Comprised primarily of our off-balance sheet unfunded commitment to provide additional first mortgage loan financing as of December 31, 2023. The impact from COVID-19 included adjustments relatedallocation of our unfunded loan commitments is based on the earlier of the commitment expiration date or the final maturity date, however, we may be obligated to the unusual market conditions and actions taken by management including: (a) $6.7fund these commitments earlier than such date. This amount excludes $128.6 million of losses from salesfuture funding commitments that require the occurrence of performing first mortgage loans includedcertain “good news” events, such as the owner concluding a lease agreement with a major tenant in sale of loans,the building or reaching a pre-determined net (b) $15.4 million of losses from sales of CMBS, (c) $3.7 million of loss from conduit loan sales, (d) $6.5 million of prepayment penalties related to pay downs of mark-to-market debt included in interest expense, (e) $2.1 million of professional fee expenses included in operating expenses and (f) $0.2 million of severance costs included in salaries and employee benefits. The $34.5 million total of the preceding amounts was partially offset by (g) $19.0 million of gains from the repurchase of and extinguishment of unsecured corporate bond debt at a discount from par, net of (h) $1.5 million of accelerated premium amortization included in interest expense.
See “—Reconciliation of Non-GAAP Financial Measures” for our definition of distributable earnings and a reconciliation to income (loss) before taxes.
Net Interest Income
The $90.4 million decrease in interest income was primarily attributable to a decrease in our security and loan portfolio due to paydowns and sales with lower prevailing LIBOR rates during 2020. For the year ended December 31, 2020, securities investments averaged $1.6 billion and loan investments averaged $3.0 billion. For the year ended December 31, 2019, securities investments averaged $1.8 billion and loan investments averaged $3.4 billion. There was a $390.2 million decrease in average loan investments, and a $200.9 million decrease in average securities investments.
The $23.1 million increasetable above does not include amounts due under our derivative agreements as those contracts do not have fixed and determinable payments. Our contractual obligations will be refinanced and/or repaid from earnings as well as amortization and sales of our liquid collateral. We have made investments in interest expense was primarily attributablevarious unconsolidated ventures of which our maximum exposure to an increase in interest expense on corporate bonds issued in 2020, prepayment penalties on repayment of mark-to-market borrowings and hyper amortization of deferred issuance costs as a result of the retirement of corporate bonds in the year ended December 31, 2020. The increase was also driven by interest expense on the fully drawn revolver and the addition of the CLO and secured financing facility, partially offset by a decrease in interest expense on FHLB debt.
The $129.2 million decrease in net interest income after provision for loan losses was primarily attributableloss from these investments is limited to the decrease in net interest income and the increase in interest expense discussed above.
As of December 31, 2020, the weighted average yield on our mortgage loan receivables was 6.6%, compared to 6.8% as of December 31, 2019 as the weighted average yield on new loans originated was lower than the weighted average yield on loans that were securitized or paid off. As of December 31, 2020, the weighted average interest rate on borrowings against our mortgage loan receivables was 5.4%, compared to 3.1% as of December 31, 2019. The increase in the rate on borrowings against our mortgage loan receivables from December 31, 2019 to December 31, 2020 was primarily due to higher borrowing rates on new sources of financing obtained during the year ended December 31, 2020. As of December 31, 2020, we had outstanding borrowings secured by our mortgage loan receivables equal to 33.4% of the carrying value of our mortgage loan receivables, compared to 38.3% as of December 31, 2019.investments.
Future Liquidity Needs
In addition to the future contractual obligations above, the Company, in the coming year and beyond, as a part of its normal course of business will require cash to fund unfunded loan commitments and new investments in a combination of balance sheet mortgage loans, conduit loans, real estate investments and securities as it deems appropriate as well as necessary expenses as a part of general corporate purposes. These new investments and general corporate expenses may be funded with existing cash, proceeds from loan and securities payoffs, through financing using our Revolving Credit Facility or loan and security financing facilities, or through additional debt or equity raises. The Company has no known material cash requirements other than its contractual obligations in the above table, unfunded commitments and future general corporate expenses.
Unfunded Loan Commitments
We may be a party to financial instruments with off-balance sheet risk in the normal course of business to meet the financial needs of our borrowers. These commitments are not reflected on the consolidated balance sheets. As of December 31, 2020,2023, our off-balance sheet arrangements consisted of $204.0 million of unfunded commitments of mortgage loan receivables held for investment, 63% of which additional funds relate to the weighted average yield on our real estate securities was 1.7%, compared to 3.1%occurrence of certain “good news” events, such as of December 31, 2019, primarily due to lower prevailing market rates as of December 31, 2020 compared to December 31, 2019.the owner concluding a lease agreement with a major tenant in the building or reaching some pre-determined net operating income. As of December 31, 2020,2022, our off-balance sheet arrangements consisted of $321.8 million of unfunded commitments of mortgage loan receivables held for investment to provide additional first mortgage loan financing. Such commitments are subject to our borrowers’ satisfaction of certain financial and nonfinancial covenants and involve, to varying degrees, elements of credit risk in excess of the weighted average interest rate on borrowings against our real estate securities was 1.1%, compared to 2.7% as of December 31, 2019. The decreaseamount recognized in the rateconsolidated balance sheets. Commitments are subject to our loan borrowers’ satisfaction of certain financial and nonfinancial covenants and may or may not be funded depending on borrowings against our real estate securities from December 31, 2019 to December 31, 2020 was primarily due to lower prevailing market borrowing rates asa variety of December 31, 2020 compared to December 31, 2019. As of December 31, 2020, we had outstanding borrowings secured by our real estate securities equal to 75.1% of the carrying value of our real estate securities, compared to 93.1% as of December 31, 2019.
Our real estate is comprised of non-interest bearing assets; however, interest incurred on mortgage financing collateralized by such real estate is included in interest expense. As of December 31, 2020, the weighted average interest rate on mortgage borrowings against our real estate was 5.0%, compared to 4.9% as of December 31, 2019. As of December 31, 2020, we had outstanding borrowings secured by our real estate equal to 77.8% of the carrying value of our real estate, compared to 77.6% as of December 31, 2019.
ProvisionLIBOR Transition to SOFR
As of December 31, 2023, all of our floating rate loans earn interest at a rate indexed to Term SOFR; and all of our floating rate debt obligations bear interest indexed to Term SOFR.
Interest Rate Environment
The nature of the Company’s business exposes it to market risk arising from changes in interest rates. Changes, both increases and decreases, in the rates the Company is able to charge its borrowers, the yields the Company is able to achieve in its securities investments, and the Company’s cost of borrowing directly impacts its net income. The Company’s net interest income includes interest from both fixed and floating rate debt. The percentage of the Company’s assets and liabilities bearing interest at fixed and floating rates may change over time, and asset composition may differ materially from debt composition. Refer to Item 7A “Quantitative and Qualitative Disclosures about Market Risk” for further disclosures surrounding the impact of rising or falling interest rate on our earnings.
Critical Accounting Policies and Estimates
The preparation of financial statements in accordance with GAAP requires management to make estimates and judgments in certain circumstances that affect amounts reported as assets, liabilities, revenues and expenses. We have established detailed policies and control procedures intended to ensure that valuation methods, including any judgments made as part of such methods, are well controlled, reviewed and applied consistently from period to period. We base our estimates on historical corporate and industry experience and various other assumptions that we believe to be appropriate under the circumstances. The Company’s critical accounting policies are those which require assumptions to be made about matters that are highly uncertain. Different estimates could have a material effect on the Company’s financial results. For all of these estimates, we caution that future events rarely develop exactly as forecasted and, therefore, routinely require adjustment.
During 2023, management reviewed and evaluated these critical accounting policies and estimates and believes they are appropriate. Our significant accounting policies are described in Note 2, Significant Accounting Policies, to our consolidated financial statements included elsewhere in this Annual Report. The following is a list of accounting policies that require more significant estimates and judgments:
•Allowance for loan losses
•Acquisition of real estate
•Impairment or disposal of long lived assets
•Identified intangible assets and liabilities
•Variable interest entities
•Valuation of financial instruments
The following is a summary of accounting policies that require more significant management estimates and judgments:
Allowance for Loan Losses
On January 1, 2020,The Company uses a current expected credit loss model (“CECL”) for estimating the Company recorded a CECL Reserve of $11.6 million, which equated to 0.36% of $3.2 billion carrying value of its held for investment loan portfolio. This reserve excluded three loans that previously had an aggregate of $14.7 million of asset-specific reserves and a carrying value of $39.8 million as of January 1, 2020. Upon adoption, the aggregated CECL Reserve reduced total shareholder’s equity by $5.8 million.
The total change in reserve for provision for the year ended December 31, 2020 was $18.3 million which includes $9.1 million in the general reserve on both the loans held for investment and the related unfunded commitments and $9.2 million in asset-specific provision related to three loans. The increases/decreases during the year are primarily due to the update of the macro economic assumptions used instead of the more stable “Baseline” scenario from the Federal Reserve that was utilized in the January 1, 2020 CECL reserve analysis. For additional information, refer to “Allowance for Credit Losses and Non-Accrual Status” in Note 3, Mortgage Loan Receivables to the consolidated financial statements.
We determined that a provision for loan losses on its loan portfolio. The CECL model requires the consideration of $2.6 million was required for the year ended December 31, 2019. The provision consisted of a portfolio-based, general reserve of $0.6 million for the expectedpossible credit losses over the remaining portfoliolife of mortgage loan receivables held for investment,an instrument and twoincludes a portfolio-based component and an asset-specific component. In compliance with the CECL reporting requirements, the Company supplements its existing credit monitoring and management processes with additional processes to support the calculation of the CECL reserves.
Operating Lease Income
The decrease of $6.1 million in operating lease income was primarily attributableCompany engages a third-party service provider to sales ofprovide market data and a credit loss model. The credit loss model is a forward-looking, econometric, commercial real estate in 2019 and 2020, partially offset by income on properties acquired in 2020(“CRE”) loss forecasting tool. It is comprised of a probability of default (“PD”) model and a full periodloss given default (“LGD”) model that, layered together with the Company’s loan-level data, fair value of operationscollateral, net operating income of collateral, selected forward-looking macroeconomic variables, and pool-level mean loss rates, produces life of loan expected losses (“EL”) at the loan and portfolio level. Where management has determined that the credit loss model does not fully capture certain external factors, including portfolio trends or loan-specific factors, a qualitative adjustment to the reserve is recorded. In addition, interest receivable on properties acquired in 2019. Tenant recoveries areloans is not included in operating leasethe Company’s CECL calculations as the Company performs timely write offs of aged interest receivable. The Company has made a policy election to write off aged receivables through interest income as opposed to through the CECL provision on its statements of income.
Sale of Loans, Net
Income (loss) from sale of loans, net, includes all loan sales, whether by securitization, whole loan sales or other means. Income (loss) from sale of loans, net also includes realized losses on loans related to lower of cost or market adjustments. During the year ended December 31, 2020, we sold/transferred 30 loans with an aggregate outstanding principal balance of $313.7 million. During the year ended December 31, 2020, we recorded no realized losses on loans related to lower of cost or market adjustments. We also sold eight mortgage loan receivables held for investment, net, at amortized cost, with an aggregate outstanding principal balance of $280.1 million during the year ended December 31, 2020. During the year ended December 31, 2019, we sold/transferred 80 loans with an aggregate outstanding principal balance of $1.0 billion. During the year ended December 31, 2019, we recorded no realized losses on loans related to lower of cost or market adjustments. Income from sales of loans, net is subject to market conditions impacting timing, size and pricing and as such may vary significantly quarter to quarter. The $56.3 million decrease was predominantly a result of our financing and liquidity measures implemented to date in direct response to the COVID-19 pandemic.
Realized Gain (Loss) on Securities
For the year ended December 31, 2020, we sold $931.9 million of securities, comprised of $913.3 million of CMBS, $4.0 million of corporate bonds and $14.6 million of equity securities. For the year ended December 31, 2019, we sold $855.9 million of securities, comprised of $785.2 million of CMBS, $65.3 million of corporate bonds and $5.3 million of equity securities. The change in unrealized gain (loss) for the year ended December 31, 2019 compared to December 31, 2020 resulted in a decrease of $27.3 million. This decrease is a result of our financing and liquidity measures implemented to date in direct response to the COVID-19 pandemic. Other than temporary impairments on securities of $(0.5) million are included in realized gain (loss) on securities for the year ended December 31, 2020, compared to $(0.1) million for the year ended December 31, 2019, an increase of $(0.4) million.
Unrealized Gain (Loss) on Equity Securities
Unrealized gain (loss) on equity securities represented $(0.1) million for the year ended December 31, 2020, compared to $1.7 million for the year ended December 31, 2019. The Company has elected the fair market value option for accounting for these equity securities and changes in fair value are recorded in current period earnings.
Loans for which the borrower or sponsor is experiencing financial difficulty, and where repayment of the loan is expected substantially through the operation or sale of the underlying collateral, are considered collateral dependent loans. For collateral dependent loans, the Company may elect a practical expedient which allows the Company to measure expected losses based on the difference between the collateral’s fair value and the amortized cost basis of the loan. When the repayment or satisfaction of the loan is dependent on a sale, rather than operations of the collateral, the fair value is adjusted for the estimated costs to sell the collateral. If foreclosure is probable, the Company is required to measure for expected losses using this methodology.
Unrealized Gain (Loss)The Company generally will use the direct capitalization rate valuation methodology or the sales comparison approach to estimate the fair value of the collateral for loans and in certain cases will obtain external appraisals. Determining fair value of the collateral may take into account a number of assumptions including, but not limited to, cash flow projections, market capitalization rates, discount rates and data regarding recent comparable sales of similar properties. Such assumptions are generally based on Agency Interest-Only Securitiescurrent market conditions and are subject to economic and market uncertainties.
The positive changeCompany’s loans are typically collateralized by real estate directly or indirectly. As a result, the Company regularly evaluates the extent and impact of $0.2 millionany credit deterioration associated with the performance and/or value of the underlying collateral property as well as the financial and operating capability of the borrower/sponsor on a loan-by-loan basis. Specifically, a property’s operating results and any cash reserves are analyzed and used to assess: (i) whether cash flow from operations is sufficient to cover the debt service requirements currently and into the future; (ii) the ability of the borrower to refinance the loan at maturity; and/or (iii) the property’s liquidation value. The Company also evaluates the financial wherewithal of any loan guarantors as well as the borrower’s competency in unrealized gain (loss) on Agency interest-only securities wasmanaging and operating the properties. In addition, the Company considers the overall economic environment, real estate sector, and geographic submarket in which the collateral property is located. Such impairment analyses are completed and reviewed by asset management and underwriting personnel, who utilize various data sources, including: (i) periodic financial data such as property occupancy, tenant profile, rental rates, operating expenses, the borrowers’ business plan, and capitalization and discount rates; (ii) site inspections; and (iii) current credit spreads and other market data and ultimately presented to management for approval.
When a debtor is experiencing financial difficulties and a loan is modified, the effect of the modification will be included in the Company’s assessment of the CECL allowance for loan losses. If the Company provides principal forgiveness, the amortized cost basis of the loan is written off against the allowance for loan losses. Generally, when granting concessions, the Company will seek to protect its position by requiring incremental pay downs, additional collateral or guarantees and, in some cases, lookback features or equity interests to offset concessions granted should conditions impacting the loan improve.
The Company designates a loan as a non-accrual loan generally when: (i) the principal or coupon interest components of loan payments become 90-days past due; or (ii) in the opinion of the Company, it is doubtful the Company will be able to collect all principal and coupon interest due according to the mark-to-market adjustmentscontractual terms of the loan. Interest income on our securities portfolio.non-accrual loans in which the Company reasonably expects a full recovery of the loan’s outstanding principal balance is recognized when received in cash. Otherwise, income recognition will be suspended and any cash received will be applied as a reduction to the amortized cost basis. A non-accrual loan is returned to accrual status at such time as the loan becomes contractually current and future principal and coupon interest are reasonably assured to be received in accordance with the contractual loan terms. A loan will be written off when management has determined principal and coupon interest is no longer realizable and deemed non-recoverable.
Realized Gain (Loss) on Sale of Real Estate, Net
The increase of $30.7 million in realized gain (loss) on sale of real estate, net wasCECL accounting estimate is subject to uncertainty as a result of changing macroeconomic market conditions, as well as the commercial real estatevintage and residential condominium sales discussed below.location of the underlying assets as disclosed in Note 3, Mortgage Loan Receivables, to our consolidated financial statements included elsewhere in this Annual Report. The provision for (release of) loan losses for the year ended December 31, 2023 and December 31, 2022 was $25.1 million and $3.7 million, respectively.
During the year ended December 31, 2020, we sold one single-tenant net leased property, resulting in2023, there was a net gain (loss) on salecharge off of $4.4reserve of $2.7 million. During the year endedThe allowance for loan losses at December 31, 2019, we sold no single-tenant net leased properties.2023 and December 31, 2022 was $43.9 million and $21.5 million, respectively. The allowance includes $0.7 million of reserves for unfunded commitments at December 31, 2023 and December 31, 2022. The estimate is sensitive to the assumptions used to represent future expected economic conditions.
During the year ended December 31, 2020, we sold 11 diversified commercial real estate properties, resulting in a net gain (loss) on sale of $27.7 million. During the year ended December 31, 2019, we sold three diversified commercial real estate properties resulting in a net gain (loss) on sale of $0.7 million.
During the year ended December 31, 2020, we sold six residential condominium units from Terrazas River Park Village in Miami, FL, resulting in a net gain on sale of $11 thousand. During the year ended December 31, 2019, income from sales of residential condominiums totaled $0.8 million. We sold our last residential condominium units from Veer Towers in Las Vegas, NV, and sold 16 residential condominium units from Terrazas River Park Village in Miami, FL, resulting in a net gain on sale of $0.4 million.
ImpairmentAcquisition of Real Estate
We generally acquire real estate assets or land and development assets through purchases and may also acquire such assets through foreclosure or deed-in-lieu of foreclosure in full or partial satisfaction of defaulted loans. Purchased properties are classified as real estate, net or land and development, net on our consolidated balance sheets. When we intend to hold, operate or develop the property for a period of at least 12 months, the asset is classified as real estate, net, and if the asset meets the held-for-sale criteria, the asset is classified as real estate held for sale. Upon purchase, the properties are recorded at cost.
Foreclosed assets classified as real estate and land and development are initially recorded at their estimated fair value and assets classified as held for sale are recorded at their estimated fair value less costs to sell. The excess of the carrying value of the loan over these amounts is charged-off against the reserve for loan losses. In both cases, upon acquisition, tangible and intangible assets and liabilities acquired are recorded at their relative fair values.
Identified Intangible Assets and Liabilities
We record intangible assets and liabilities acquired at their relative fair values, and determine whether such intangible assets and liabilities have finite or indefinite lives. As of December 31, 2023 and December 31, 2022, all such acquired intangible assets and liabilities have finite lives. We review finite lived intangible assets for impairment whenever events or changes in circumstances indicate that their carrying amount may not be recoverable. If we determine the carrying value of an intangible asset is not recoverable, we will record an impairment charge to the extent its carrying value exceeds its estimated fair value. Impairments of intangibles are recorded in impairment of assets in our consolidated statements of income.
Impairment or Disposal of Long-lived Assets
Real estate assets to be disposed of are reported at the lower of their carrying amount or estimated fair value less costs to sell and are included in real estate held for sale on our consolidated balance sheets. The difference between the estimated fair value less costs to sell and the carrying value will be recorded as an impairment charge. Impairment for real estate assets are included in impairment of assets in our consolidated statements of operations. Once the asset is classified as held for sale, depreciation expense is no longer recorded.
We periodically review real estate to be held and used, and land and development assets for impairment in value, whenever events or changes in circumstances indicate that the carrying amount of such assets may not be recoverable. The asset’s value is impaired only if management’s estimate of the aggregate future cash flows (undiscounted and without interest charges) to be generated by the asset (taking into account the anticipated holding period of the asset) is less than the carrying value. Such estimate of cash flows considers factors such as expected future operating income, trends and prospects, as well as the effects of demand, competition and other economic factors. To the extent impairment has occurred, the loss will be measured as the excess of the carrying amount of the property over the fair value of the asset and reflected as an adjustment to the basis of the asset. Impairments of real estate and land and development assets are recorded in impairment of assets in our consolidated statements of operations.
There waswere no impairmentproperties classified as held for sale as of December 31, 2023 and December 31, 2022. We did not record any impairments of real estate for the yearyears ended December 31, 2020. Impairment of real estate of $1.4 million was recorded for the year ended2023 or December 31, 2019, attributable to the receipt of a lease termination payment on a single-tenant two-story office building in Wayne, NJ. See Note 5, Real Estate and Related Lease Intangibles, Net for further detail.
Fee and Other Income
We generated fee income from origination fees, exit fees and other fees on the loans we originate and in which we invest, unrealized gains (losses) on our investment in a mutual fund and dividend income on our investment in FHLB stock and equity securities. The $11.7 million decrease in fee and other income year-over-year was primarily due to a decrease in exit fees, origination fees and dividend income. Also contributing was a realized loss on our investment in the Ladder Select Bond Fund, which was liquidated on June 22, 2020.2022.
Variable Interest Entities
We evaluate our investments and other contractual arrangements to determine if our interests constitute variable interests in a variable interest entity (“VIE”) and if we are the primary beneficiary. There is a significant amount of judgment required to determine if an entity is considered a VIE and if we are the primary beneficiary. We first perform a qualitative analysis, which requires certain subjective decisions regarding our assessment, including, but not limited to, which interests create or absorb variability, the contractual terms, the key decision-making powers, impact on the VIE’s economic performance and related party relationships. An iterative quantitative analysis is required if our qualitative analysis proves inconclusive as to whether the entity is a VIE or we are the primary beneficiary and consolidation is required.
Fair Value of Assets and Liabilities
The degree of management judgment involved in determining the fair value of assets and liabilities is dependent upon the availability of quoted market prices or observable market parameters. For financial and nonfinancial assets and liabilities that trade actively and have quoted market prices or observable market parameters, there is minimal subjectivity involved in measuring fair value. When observable market prices and parameters are not fully available, management judgment is necessary to estimate fair value. In addition, changes in market conditions may reduce the availability of quoted prices or observable data. For example, reduced liquidity in the capital markets or changes in secondary market activities could result in observable market inputs becoming unavailable. Therefore, when market data is not available, we would use valuation techniques requiring more management judgment to estimate the appropriate fair value measurement.
Recently Adopted Accounting Pronouncements and Recent Accounting Pronouncements Pending Adoption
Our recently adopted accounting pronouncements and recent accounting pronouncements pending adoption are described in Note 2, Significant Accounting Policies, to our consolidated financial statements included elsewhere in this Annual Report.
Reconciliation of Non-GAAP Financial Measures
Net Result from Derivative Transactions
Net result from derivative transactions representedof $1.5 million is composed of a realized gain of $1.9 million and an unrealized loss of $15.3$(0.4) million for the year ended December 31, 2020, which was comprised of an unrealized loss of $0.3 million and a realized loss of $15.0 million,2023, compared to a lossnet gain of $30.0$12.4 million for the year ended December 31, 2019,2022, which was comprised of an unrealizeda realized gain of $1.5$11.8 million and a realized loss of $31.6$0.6 million unrealized gain resulting in a positive changedecrease of $14.7$10.9 million. The hedge positions were relatedprimarily relate to fixed rate conduit loans, and securities investments. The derivative positions that generated these results were a combination of interestfive and ten year U.S. treasury rate futures that we employed in an effort to hedge the interest rate risk primarily on the financing of our fixed rate assets and the net interest income we earn against the impact of changes in interest rates. The lossnet gain in 20202023 was primarily related to movementincreases in interest rates during the year ended December 31, 2020.2023. The total net result from derivative transactions is comprised of hedging interest expense, realized gains/losses related to hedge terminations and unrealized gains/losses related to changes in the fair value of asset hedges.
Earnings (Loss) from Investment in Unconsolidated Joint Ventures
Earnings from our investment in Grace Lake LLC totaled $1.0 million for the years ended December 31, 2020 and 2019, respectively. Earnings (loss) from our investment in 24 Second Avenueunconsolidated ventures totaled $0.8 million and $2.4$1.4 million for the years ended December 31, 2020 and 2019, respectively. Earnings for the year ended December 31, 2019 included a gain2023 and 2022, respectively. The $0.6 million decrease in earnings from investments in unconsolidated ventures is attributable to higher interest expense due to a recapitalizationhigher debt balance at the property as a result of a refinancing in 2023. Our maximum exposure to loss from these investments is limited to the carrying value of our investment in 24 Second Avenue. See Note 6, Investment in and Advances to Unconsolidated Joint Ventures for further detail. The gain in the year ended December 31, 2020 is attributable to equity and earnings on our investments.investment.
Gain (Loss) on Extinguishment/DefeasanceExtinguishment of Debt
Gain (loss) on extinguishment/defeasanceextinguishment of debt totaled $22.2$10.7 million for the year ended December 31, 2020.2023. During the year ended December 31, 2020,2023, the Company retired: (1) $16.2 million of principal of the 2025 Notes for a repurchase price of $14.8 million, recognizing a $1.3 million net gain on extinguishment of debt after recognizing $(72) thousand of unamortized debt issuance costs associated with the retired (1) $98.2debt; (2) $38.9 million of principal of the 2027 Notes for a repurchase price of $83.9$31.8 million, recognizing a $12.9$6.8 million net gain on extinguishment of debt after recognizing $(1.3)$(0.3) million of unamortized debt issuance costs associated with the retired debt, (2) $52.0debt; and (3) $13.1 million of principal of the 20252029 Notes for a repurchase price of $45.1$10.3 million, recognizing a $6.4$2.6 million net gain on extinguishment of debt after recognizing $(0.5) million of unamortized debt issuance costs associated with the retired debt (3) $34.2 million of principal of the 2022 Notes for a repurchase price of $33.2 million, recognizing a $0.7 million net gain on extinguishment of debt after recognizing $(0.2) million of unamortized debt issuance costs associated with the retired debt and (4) $119.5 million of principal of the 2021 Notes for a repurchase price of $119.3 million, recognizing a $52.4 thousand net gain on extinguishment of debt after recognizing $(0.2) million of unamortized debt issuance costs associated with the retired debt.
Gain (loss) on extinguishment/defeasanceextinguishment of debt totaled $(1.1)$0.7 million for the year ended December 31, 2019.2022. During the year ended December 31, 2019,2022, the Company paid off $6.6retired: (1) $4.0 million of mortgage loan financing,principal of the 2025 Notes for a repurchase price of $3.7 million, recognizing a loss$0.3 million net gain on extinguishment of debt after recognizing $(23) thousand of $(1.1) million.unamortized debt issuance costs associated with the retired debt; (2) $1.0 million of principal of the 2027 Notes for a repurchase price of $0.8 million, recognizing a $0.2 million net gain on extinguishment of debt after recognizing $(9) thousand of unamortized debt issuance costs associated with the retired debt; and (3) $1.0 million of principal of the 2029 Notes for a repurchase price of $0.8 million, recognizing a $0.2 million net gain on extinguishment of debt after recognizing $(14) thousand of unamortized debt issuance costs associated with the retired debt.
SalariesCompensation and Employee Benefits
SalariesCompensation and employee benefits are comprised primarily of salaries, bonuses, equity basedequity-based compensation and other employee benefits. The decrease of $9.7$12.2 million in compensation expense wasis primarily attributabledue to to the reductiontiming of employee stock and bonus compensation in compensation expense related to salaries2021, 2022 and bonuses due to the significant market disruption caused by the COVID-19 pandemic and the substantial economic uncertainty present in the commercial real estate market and overall economy during the year ended December 31, 2020 compared to the year ended December 31, 2019.2023.
Operating Expenses
Operating expenses are primarily composedcomprised of professional fees, lease expense and technology expenses. The decrease during the year ended December 31, 2023 as compared to December 31, 2022 of $2.3$1.2 million was primarily related to a decrease in professional fees.and technology expenses.
Real Estate Operating Expenses
The increasedecrease of $5.3$1.0 million in real estatefrom year ended December 31, 2023 to December 31, 2022 was primarily due to the absence of operating expenses for properties that were sold during the twelve months ended December 31, 2022 for which there was no operating expense primarily relates toduring the acquisition of real estate in 2019 and 2020.current period.
Investment Related Expenses
Fee Expense
Fee expense isInvestment related expenses are comprised primarily of custodian fees, financing costs, and servicing fees related to loans.loans and other loan related expenses. The increase during the year ended December 31, 2023 as compared to December 31, 2022 of $1.2$1.6 million in fee expense was primarily attributable to an increase in legal and other professional fees on mortgage loan receivables and real estate, partially offset by a decrease in financing and dead deal costs.related expenses.
Depreciation and Amortization
The $0.6$2.8 million increasedecrease during the year ended December 31, 2023 as compared to December 31, 2022 in depreciation and amortization is primarily attributable to the timing of theone real estate sale and three acquisitions that occurred after December 31, 2022, and the timing of eight sales orand two acquisitions during each year.the year ended December 31, 2022.
Income Tax (Benefit) Expense
Most of our consolidated income tax provision relatesrelated to the business units held in our TRSs. The increasedecrease in expense of ($12.4 million) in income tax (benefit) expense$0.7 million during the year ended December 31, 2023 as compared to December 31, 2022 is primarily a result of operating lossesa tax reserve recognized in 2022 offset by changes in income generated by our TRSs.
Liquidity and Capital Resources
The management of our liquidity and capital diversity and allocation strategies is critical to the success and growth of our business. We manage our sources of liquidity to complement our asset composition and to diversify our exposure across multiple capital markets and counterparties.
We require substantial amounts of capital to support our business. The management team, in consultation with our board of directors, establishes our overall liquidity and capital allocation strategies. A key objective of those strategies is to support the execution of our business strategy while maintaining sufficient ongoing liquidity throughout the business cycle to service our financial obligations as they become due. When making funding and capital allocation decisions, members of our senior management considerconsider: business performance; the availability of, and costs and benefits associated with, different funding sources; current and expected capital markets and general economic conditions; our asset composition and capital structure; and our targeted liquidity profile and risks relating to our funding needs.
To ensure that Ladder Capital can effectively address the funding needs of the Company on a timely basis, we maintain a diverse array of liquidity sources includingincluding: (1) cash and cash equivalents; (2) cash generated from operations; (3) proceeds from the issuance of the unsecured bonds; (4) borrowings under repurchase agreements; (5) principal repayments on investments including mortgage loans and securities; (6) borrowings under our revolving credit facility;Revolving Credit Facility; (7) proceeds from securitizations and sales of loans; (8) proceeds from the sale of securities; (9) proceeds from the sale of real estate; (10) proceeds from the issuance of CLO debt and other non-mark-to-market loan financing; (11) a significant and financeable unencumbered asset base; and (12)(11) proceeds from the issuance of equity capital. We use these funding sources to meet our obligations on a timely basis.basis and have the ability to use our significant unencumbered asset base to further finance our business.
Our primary uses of liquidity are forfor: (1) the funding of loan, and real estate-related and securities investments; (2) the repayment of short-term and long-term borrowings and related interest; (3) the funding of our operating expenses; and (4) distributions to our equity investors to comply with the REIT distribution requirements. We require short-term liquidity to fund loans that we originate and hold on our consolidated balance sheet pending sale, including through whole loan sale, participation, or securitization. We generally require longer-term funding to finance the loans and real estate-related investments that we hold for investment. We have historically used the aforementioned funding sources to meet the operating and investment needs as they have arisen and have been able to do so by applying a rigorous approach to long and short-term cash and debt forecasting.
In addition, as a REIT, we are also required to make sufficient dividend payments to our shareholders in amounts at least sufficient to maintain our REIT status. Under IRS guidance, we may elect to pay a portion of our dividends in stock, subject to a cash/stock election by our shareholders, to optimize our level of capital retention. Accordingly, our cash requirement to pay dividends to maintain REIT status could be substantially reduced at the discretion of the board.board of directors.
Our principal debt financing sources include: (1) long-term senior unsecured notes in the form of corporate bonds,bonds; (2) borrowings on both a short- and long-term committed basis, made by Tuebor from the FHLB,CLO issuances; (3) long term non-recourse mortgage financing, (4) committed secured funding provided by banks and other lenders, andlenders; (4) long term non-recourse mortgage financing; (5) uncommitted secured funding sources, including asset repurchase agreements with a number of banks.banks; (6) unsecured Revolving Credit Facility and (7) secured advances from the FHLB through our captive insurance company.
In the future, we may also use other sources of financing to fund the acquisition of our assets, including credit facilities, warehouse facilities, repurchase facilities and other secured and unsecured forms of borrowing. These financings may be collateralized or non-collateralized, may involve one or more lenders and may accrue interest at either fixed or floating rates. We may also seek to raise further equity capital or issue debt securities in order to fund our future investments.
Refer to our “Financing Strategy in the Current Market Conditions” and “Financial Covenants” for further disclosure surrounding management’s actions under the current market conditions related to the COVID-19 pandemic. Refer toand “Our Financing Strategies” for further disclosure of our diverse financing sources and, for a summary of our financial obligations, refer to the Contractual Obligations table below. All of our existing financial obligations due within the following year can be extended for one or more additional years at our discretion, refinanced or repaid at maturity or are incurred in the normal course of business (i.e., interest payments/loan funding obligations).
Cash, Cash Equivalents and Restricted Cash
We held cash, cash equivalents and restricted cash of $1.3$1.0 billion at December 31, 2020,2023, of which $1.3$1.0 billion was unrestricted cash and cash equivalents and $29.9$15.4 million was restricted cash. We held cash and cash equivalents of $609.1 million and restricted cash of $355.7$50.5 million atas of December 31, 2019, of which $58.2 million was unrestricted cash and cash equivalents and $297.6 million was restricted cash. As the COVID-19 crisis evolved, management implemented a plan to mitigate the uncertainty in financial markets by increasing liquidity and obtaining additional non-recourse and non-mark-to-market financing. 2022.
Cash Flows
The following table provides a breakdown of the net change in our cash, cash equivalents, and restricted cash ($ in thousands):
| | | |
| | |
| | |
| | | | Year Ended December 31, |
| | | 2020 | | 2019 | |
| Net cash provided by (used in) operating activities | Net cash provided by (used in) operating activities | $ | 111,943 | | | $ | 183,207 | | |
| Net cash provided by (used in) operating activities | |
| Net cash provided by (used in) operating activities | |
| Net cash provided by (used in) investing activities | |
| Net cash provided by (used in) investing activities | |
| Net cash provided by (used in) investing activities | Net cash provided by (used in) investing activities | 1,542,265 | | | (126,587) | | |
| Net cash provided by (used in) financing activities | Net cash provided by (used in) financing activities | (725,670) | | | 200,676 | | |
| Net cash provided by (used in) financing activities | |
| Net cash provided by (used in) financing activities | |
| Net increase (decrease) in cash, cash equivalents and restricted cash | Net increase (decrease) in cash, cash equivalents and restricted cash | $ | 928,538 | | | $ | 257,296 | | |
| Net increase (decrease) in cash, cash equivalents and restricted cash | |
| Net increase (decrease) in cash, cash equivalents and restricted cash | |
Year ended December 31, 2023
We experienced a net increase in cash, cash equivalents and restricted cash of $928.5$416.3 million for the year ended December 31, 20202023, reflecting cash provided by operating activities of $111.9$180.6 million, cash provided by investing activities of $1.5 billion$793.5 million and cash used in financefinancing activities of $(725.7)$(557.8) million.
Net cash provided by operating activities of $111.9$180.6 million was primarily driven by net interest income and increases in net operating income on our real estate portfolio.
Net cash provided by investing activities of $793.5 million was driven by $738.5 million of repayment from mortgage loan receivablereceivables, $232.1 million in repayments on securities, and $17.8 million of proceeds from sale of securities, partially offset by $(144.0) million in purchases of securities and $(68.4) million of origination of mortgage loans held for investment. This included $312.3
Net cash used in financing activities of $(557.8) million was primarily as a result of net repayments of borrowings of $(427.1) million, $(116.4) million of dividend payments, $(7.9) million of shares acquired to satisfy minimum federal and state tax withholdings on restricted stock, $(2.5) million purchase of treasury stock, and $(3.4) million in deferred financing cost.
Year ended December 31, 2022
We experienced a net increase in cash, cash equivalents and restricted cash of $38.1 million for the year ended December 31, 2022 reflecting cash provided by operating activities of $106.7 million, cash provided by investing activities of $81.6 million and cash used in financing activities of $(150.2) million.
Net cash provided by operating activities of $106.7 million was primarily driven by $29.2 million in proceeds from mortgage loan receivables held for sale of loans and increases in net interest income and increases in net operating income on our real estate portfolio partially offset by $(212.8)$(61.3) million of originations of mortgage loans held for sale.
Net cash provided by investing activities of $1.5 billion$81.6 million was driven by $891.7$909.8 million of repayment from mortgage loan receivables, $932.2$310.5 million proceeds from the sale of real estate, $184.8 million in repayments on securities, and $5.8 million of proceeds from sale of real estate securities, $270.5 million of proceeds from the sale of mortgage loan receivables held for investment, partially offset by $(440.6) million in purchases of real estate securities and $(353.7) million$(1.2) billion of origination of mortgage loans held for investment.investment and $(96.2) million in purchases of securities.
Net cash used in financing activities of $(725.7)$(150.2) million was primarily as a result of net borrowings of $(593.4) million, $(118.9)$(107.0) million of dividendsdividend payments, $(17.1)$(29.5) million of capital distributed to noncontrolling interests in consolidated ventures, $(11.4) million of shares acquired to satisfy minimum federal and state tax withholdings on restricted stock, $(7.9) million purchase of treasury stock, and $(18.0)$(8.3) million in deferred financing costs,cost, partially offset by $32.0 millionnet repayments of proceeds from issuanceborrowings of common stock.
We experienced a net increase in cash, cash equivalents and restricted cash of $257.3 million for the year ended December 31, 2019. During the year ended December 31, 2019, we received (i) $1.6 billion of proceeds from repayment of mortgage loans receivable, (ii) $1.0 billion of proceeds from the sales of loans, (iii) $855.6 million of proceeds from the sales of real estate securities, (iv) $491.9 million of repayment of real estate securities and (v) $380.0 million net borrowings under debt obligations. We used the proceeds from these activities to (i) originate $2.4 billion of new loans and (ii) purchase $1.6 billion of real estate securities. The increase in restricted cash at December 31, 2019 was primarily related to cash margin on FHLB borrowings. For discussion surrounding our cash movements for the year ended December 31, 2018, refer to “Management’s Discussion and Analysis of Financial Condition and Results of Operations - Liquidity and Capital Resources - Cash Flows” of our Annual Report on Form 10-K for the year ended December 31, 2019 filed with the SEC.
Unencumbered Assets
As of December 31, 2020,2023, we held unencumbered cash of $1.3$1.0 billion, unencumbered loans of $1.1 billion, unencumbered securities of $49.7$342.8 million, unencumbered real estate of $75.9$160.8 million and $299.6$394.2 million of other assets not encumbered by any portion of secured indebtedness. As of December 31, 2022, we held unencumbered cash and cash equivalents of $609.1 million, unencumbered loans of $1.7 billion, unencumbered securities of $97.5 million, unencumbered real estate of $140.3 million and $351.6 million of other assets not encumbered by any portion of secured indebtedness.
Borrowings under various financing arrangements
Our financing strategies are critical to the success and growth of our business. We manage our leverage policies to complement our asset composition and to diversify our exposure across multiple counterparties. Our borrowings under various financing arrangements as of December 31, 20202023 are set forth in the table below ($ in thousands):
| | | | | | | |
| December 31, 20202023 |
| |
| Committed loan repurchase facilities | $ | 255,368604,999 | | | |
| Committed securities repurchase facility | 149,633— | | | |
| Uncommitted securities repurchase facilities | 415,8361,608 | | | |
| Total repurchase facilities | 820,837606,607 | | | |
| | | |
| | | |
| Revolving credit facility | 266,430 | | |
| Mortgage loan financing(1) | 766,064437,759 | | | |
| Secured financing facility (2) | 192,646
| | |
CLO debt(3)debt(2) | 276,5161,060,719 | | | |
| | | |
| Borrowings from the FHLB | 288,000115,000 | | | |
Senior unsecured notes(4)notes(3) | 1,599,3711,563,861 | | | |
| | | |
| | | |
| Total debt obligations, net | $ | 4,209,8643,783,946 | | | |
(1)Presented net of premium and unamortized debt issuance costs of $4.3$1.4 million and net of premiums of $1.8 million as of December 31, 2020.2023.
(2)Presented net of unamortized debt issuance costs of $7.2$2.1 million and an unamortized discountas of $6.6 million related to the Purchase Right (described in detail under Secured Financing Facility below) at December 31, 2020.2023.
(3)Presented net of unamortized debt issuance costs of $2.6$11.8 million as of December 31, 2020.
(4)Presented net of unamortized debt issuance costs of $12.9 million as of December 31, 2020.
The Company’s financingrepurchase facilities include covenants covering minimum net worth requirements (ranging from $400.0 million to $871.4 million), maximum reductions in net worth over stated time periods, minimum liquidity levels (typically $30.0 million of cash or a higher standard that often allows for the inclusion of different percentages of liquid securities in the determination of compliance with the requirement), maximum leverage ratios (calculated in various ways based on specified definitions of indebtedness and net worth) and a fixed charge coverage ratio of 1.25x, and, in the instance of one lender, an interest coverage ratio of 1.50x, in each case, if certain liquidity thresholds are not satisfied. We were in compliance with all covenants as of December 31, 20202023 and 2019.December 31, 2022. Further, certain of our financing arrangements and loans on our real property are secured by the assets of the Company, including pledges of the equity of certain subsidiaries or the assets of certain subsidiaries. From time to time, certain of these financing arrangements and loans may prohibit certain of our subsidiaries from paying dividends to the Company, from making distributions on such subsidiary’s capital stock, from repaying to the Company any loans or advances to such subsidiary from the Company or from transferring any of such subsidiary’s property or other assets to the Company or other subsidiaries of the Company.
Committed loan facilitiesLoan Facilities
We are a party to multiple committed loan repurchase agreement facilities, totaling $1.6$1.2 billion of credit capacity.capacity as of December 31, 2023. As of December 31, 2020,2023, the Company had $255.4$605.0 million of borrowings outstanding, with an additional $1.3 billion$637.0 million of committed financing available. As of December 31, 2019,2022, the Company had $702.3$616.9 million of borrowings outstanding, with an additional $1.0 billion$683.1 million of committed financing available. Assets pledged as collateral under these facilities are generally limited to whole mortgage loans collateralized by first liens on commercial real estate, mezzanine loans collateralized by equity interests in entities that own commercial real estate, and certain interests in such first mortgage and mezzanine loans. Our repurchase facilities include covenants covering net worth requirements, minimum liquidity levels, and maximum debt/equity ratios. We believe we were in compliance with all covenants as of December 31, 2020.2023.
We have the option to extend some of our existing facilities subject to a number of customary conditions. The lenders have sole discretion with respect to the inclusion of collateral in these facilities, to determine the market value of the collateral on a daily basis, and, if the estimated market value of the included collateral declines, the lenders have the right to require additional collateral or a full and/or partial repayment of the facilities (margin call), sufficient to rebalance the facilities. Typically, the facilities are established with stated guidelines regarding the maximum percentage of the collateral asset’s market value that can be borrowed. We often borrow at a lower percentage of the collateral asset’s value than the maximum leaving us with excess
borrowing capacity that can be drawn upon at a later date and/or applied against future margin calls so that they can be satisfied on a cashless basis.
Committed securities facilitySecurities Facility
We are a party to a term master repurchase agreement with a major U.S. banking institution for CMBS, totaling $788.0$100.0 million of credit capacity. As we do in the case of borrowings under committed loan facilities, we often borrow at a lower percentage of the collateral asset’s value than the maximum, leaving us with excess borrowing capacity that can be drawn upon a later date and/or applied against future margin calls so that they can be satisfied on a cashless basis. As of December 31, 2020,2023, the Company had $149.6 millionno borrowings outstanding, with an additional $638.4$100.0 million of committed financing available. As of December 31, 2022, the Company had $8.6 million of borrowings outstanding, and an additional $91.4 million of committed financing available.
Uncommitted securities facilitiesSecurities Facilities
We are a party to multiple master repurchase agreements with several counterparties to finance our investments in CMBS and U.S. Agency Securities.securities. The securities that served as collateral for these borrowings are highly liquid and marketable assets that are typically of relatively short duration. As we do in the case of other secured borrowings, we often borrow at a lower percentage of the collateral asset’s value than the maximum leaving us with excess borrowing capacity that can be drawn upon a later date and/or applied against future margin calls so that they can be satisfied on a cashless basis.
Revolving credit facilityCredit Facility
The Company’s revolving credit facility (the “Revolving(“Revolving Credit Facility”) provides for an aggregate maximum borrowing amount of $266.4$323.9 million, including a $25.0 million sublimit for the issuance of letters of credit. The Revolving Credit Facility is available on a revolving basis to finance the Company’s working capital needs and for general corporate purposes. TheBorrowings under the Revolving Credit Facility hasincur interest at a currentfixed margin of 2.50% over the index rate, with reductions in the fixed margin upon the achievement of investment grade credit ratings. On January 25, 2024, the Company amended its Revolving Credit Facility to extend the final maturity date to January 25, 2029. As of February 11, 2022, which may be extended by three 12-month periods subject toDecember 31, 2023, the satisfaction of customary conditions, including the absence of default. The InterestCompany had no outstanding borrowings on the Revolving Credit Facility, is one-month LIBOR plus 3.00% per annum payable monthly in arrears. As of December 31, 2020,but still maintains the Company had $266.4 million borrowings outstanding.ability to draw $323.9 million.
The obligations under the Revolving Credit Facility are guaranteed by the Company and certain of its subsidiaries. The Revolving Credit Facility is secured by a pledge of the shares of (or other ownership or equity interests in) certain subsidiaries to the extent the pledge is not restricted under existing regulations, law or contractual obligations.
LCFHThe Company is subject to customary affirmative covenants and negative covenants, including limitations on the incurrence of additional debt, liens, restricted payments, sales of assets and affiliate transactions under the Revolving Credit Facility.transactions. In addition, under the Revolving Credit Facility, LCFHCompany is required to comply with financial covenants relating to minimum net worth, maximum leverage, minimum liquidity, and minimum fixed charge coverage, consistent with our other credit facilities. OurThe Company’s ability to borrow under the Revolving Credit Facility will beis dependent on, among other things, LCFH’s compliance with the financial covenants. The Revolving Credit Facility contains customary events of default, including non-payment of principal or interest, fees or other amounts, failure to perform or observe covenants, cross-default to other indebtedness, the rendering of judgments against the Company or certain of our subsidiaries to pay certain amounts of money and certain events of bankruptcy or insolvency.
Mortgage loan financingLoan Financing
We generally finance ourThe Company typically finances its real estate usinginvestments with long-term, non-recourse mortgage financing. During the year ended December 31, 2020, we executed 10 term debt agreements to finance real estate. These non-recourse debt agreements are fixed rate financing at rates ranging from 3.75% to 6.16%, maturing between 2021-2030 and totaling $766.1mortgage loans have carrying amounts of $437.8 million and $812.6$498.0 million, at December 31, 2020 and 2019, respectively. These long-term non-recourse mortgages include net of unamortized premiums of $4.6$1.8 million and $5.5$2.4 million atas of December 31, 20202023 and 2019,December 31, 2022, respectively, representing proceeds received upon financing greater than the contractual amounts due under thethese agreements. The premiums are being amortized over the remaining life of the respective debt instruments using the effective interest method. WeThe Company recorded $1.2 million, $1.6$0.6 million and $1.0$0.7 million and $1.4 million of premium amortization, which decreased interest expense for the years ended December 31, 2020, 20192023, 2022, and 2018,2021 respectively. These non-recourse debt agreements provide for secured financing at rates ranging from 4.39% to 9.03%, and, as of December 31, 2023, have anticipated maturity dates between 2024 - 2031, with an average term of 3.1 years. The mortgage loans are collateralized by real estate and related lease intangibles, net, of $909.4$474.7 million and $988.9$559.9 million as of December 31, 20202023 and 2019,December 31, 2022, respectively. During the year ended December 31, 2023 the Company did not execute any new term debt agreements to finance properties in its real estate portfolio. During the year ended December 31, 2022, the Company executed one new term debt agreement to finance properties in its real estate portfolio.
Collateralized Loan Obligations (“CLO”) Debt
On April 30, 2020, the Company entered into a strategic financing arrangement (the “Agreement”) with an American multinational corporation (the “Lender”), under which the Lender will provide the Company with approximately $206.4 million in senior secured financing (the “Secured Financing Facility”) to fund transitional and land loans. The Secured Financing Facility is secured on a first lien basis on a portfolio of certain of the Company’s loans and will mature on May 6, 2023, and borrowings thereunder bear interest at LIBOR (or a minimum of 0.75% if greater) plus 10.0%, with a minimum interest premium of approximately $39.2 million minus the aggregate sum of all interest payments made under the Secured Financing Facility prior to the date of payment of the minimum interest premium, which is payable upon the earlier of maturity or repayment in full of the loan. The Senior Financing Facility is non-recourse, subject to limited exceptions, and does not contain mark-to-market provisions. Additionally, the Senior Financing Facility provides the Company optionality to modify or restructure loans or forbear in exercising remedies, which maximizes the Company’s financial flexibility.
As part of the strategic financing, the Lender also had the ability to make an equity investment in the Company of up to 4.0 million Class A common shares at $8.00 per share, subject to certain adjustments (the “Purchase Right”). The Purchase Right was exercised in full at $8.00 per share on December 29, 2020. The Lender has agreed not to sell, transfer, assign, pledge, hypothecate, mortgage, dispose of or in any way encumber the shares acquired as a result of exercising the Purchase Right for a period of time following the exercise date. In connection with the issuance of the Purchase Right, the Company and the Lender entered into a registration rights agreement, pursuant to which the Company has agreed to provide customary demand and piggyback registration rights to the Lender.
The Purchase Right was classified as equity. The $200.9 million of net proceeds from the original issuance were allocated $192.5 million to the originally issued debt obligation and $8.4 million to the Purchase Right using the relative fair value method. The commitment to issue shares will not be subsequently remeasured. The $8.4 million allocated to the Purchase Right is being treated as a discount to the debt and amortized over the life of the Purchase Right to interest expense.
As of December 31, 2020, the Company had $192.6 million of borrowings outstanding under the secured financing facility included in debt obligations on its consolidated balance sheets, net of unamortized debt issuance costs of $7.2 million and an $6.6 million unamortized discount related to the Purchase Right.
CLO debt
On April 27, 2020,July 13, 2021, a consolidated subsidiary of the Company completed a privateprivately-marketed CLO transaction, with a major U.S. bank which generated $310.2$498.2 million of gross proceeds to Ladder, financing $481.3$607.5 million of loans (“Contributed July 2021 Loans”) at a 64.5%an 82% advance rate on a matched term, non-mark-to-market and non-recourse basis. A consolidated subsidiary of the Company retained a 35.5%an 18% subordinate and controlling interest in the CLO. The Company retained controlconsent rights over major decisions made with respect to the administrationservicing of the Contributed July 2021 Loans, including broad discretion in managing these loans in light of the COVID-19 pandemic, and has the abilityright to appoint and replace the special servicer under the CLO. Proceeds from the transaction were used to pay off other secured debt including bank and FHLB financing that was subject to mark-to-market provisions. The CLO is a VIE and the Company was the primary beneficiary and, therefore, consolidated the VIE - SeeVIE. Refer to Note 10,9, Consolidated Variable Interest Entities.Entities, for additional information.
On December 2, 2021, a consolidated subsidiary of the Company completed a privately-marketed CLO transaction, which generated $566.2 million of gross proceeds to Ladder, financing $729.4 million of loans (“Contributed December 2021 Loans”) at a maximum 77.6% advance rate on a matched term, non-mark-to-market and non-recourse basis. A consolidated subsidiary of the Company retained an 15.6% subordinate and controlling interest in the CLO. The Company also held two additional tranches as investments totaling 6.8% interest in the CLO. The Company retained consent rights over major decisions with respect to the servicing of the Contributed December 2021 Loans, including the right to appoint and replace the special servicer under the CLO. The CLO is a VIE and the Company was the primary beneficiary and, therefore, consolidated the VIE. Refer to Note 9, Consolidated Variable Interest Entities, for additional information.
As of December 31, 2020,2023, the Company had $276.5 million$1.1 billion of matched term, non-mark-to-market and non-recourse basis CLO debt included in debt obligations on its consolidated balance sheets. Unamortized debt issuance costs of $2.6$2.1 million were included in CLO debt as of December 31, 2020.
FHLB financing
On July 11, 2012, Tuebor became a member of the FHLB. As of December 31, 2020, Tuebor had $288.0 million of borrowings outstanding (with an additional $1.2 billion of committed term financing available) from the FHLB, with terms of overnight to 3.75 years, interest rates of 0.41% to 2.74%, and advance rates of 45.0% to 95.7% on eligible collateral, including cash collateral. As of December 31, 2020, collateral for the borrowings was comprised of $280.1 million of CMBS and U.S. Agency Securities and $108.3 million of first mortgage commercial real estate loans. The weighted-average borrowings were $578.6 million for the year ended December 31, 2020. On December 6, 2017, Tuebor’s advance limit was updated by the FHLB to the lowest of a Set Dollar Limit ($2.0 billion), 40% of Tuebor’s total assets or 150% of the Company’s total equity. Beginning April 1, 2020 through December 31, 2020, the Set Dollar Limit will be $1.5 billion. Beginning January 1, 2021 through February 19, 2021, the Set Dollar Limit will be $750.0 million. Tuebor is well-positioned to meet its obligations and pay down its advances in accordance with the scheduled reduction in the Set Dollar Limit, which remains subject to revision by the FHLB or as a result of any future changes in applicable regulations. 2023.
As of December 31, 2019, Tuebor2022, the Company had $1.1 billion of borrowings outstanding (with an additional $872.3matched term, non-mark-to-market and non-recourse CLO debt included in debt obligations on its consolidated balance sheets. Unamortized debt issuance costs of $5.9 million of committed term financing available) from the FHLB, with terms of overnight to 4.75 years, interest rates of 1.47% to 2.95%, and advance rates of 60.8% to 100% on eligible collateral, including cash collateral. As of December 31, 2019, collateral for the borrowings was comprised of $432.0 million of CMBS and U.S. Agency Securities and $675.2 million of first mortgage commercial real estate loans. The weighted-average borrowings were $1.2 billion for the year ended December 31, 2019.
FHLB advances amounted to 6.8% of the Company’s outstandingincluded in CLO debt obligations as of December 31, 2020.2022.
Borrowings from the Federal Home Loan Bank (“FHLB”)
On July 11, 2012, Tuebor, a consolidated subsidiary of the Company, became a member of the FHLB and subsequently drew its first secured funding advances from the FHLB. As of February 19, 2021, pursuant to a final rule adopted by the Federal Housing Finance Agency (the “FHFA”) regarding the eligibility of captive insurance companies, Tuebor’s membership in the FHLB has been terminated, although outstanding advances may remain outstanding until their scheduled maturity dates. Funding for future advance paydowns is expected to be obtained from the natural amortization and/or sales of securities collateral, or from other financing sources. There is no assurance that the FHFA or the FHLB will not take actions that could adversely impact Tuebor’s membership inexisting advances.
As of December 31, 2023, Tuebor had $115.0 million of borrowings outstanding, with terms of 0.3 years to 0.75 years (with a weighted average of 0.57 years), interest rates of 5.76% to 5.88% (with a weighted average of 5.82%), and advance rates of 71.7% to 95.7% on eligible collateral. As of December 31, 2023, collateral for the FHLBborrowings was comprised primarily of $140.3 million of CMBS.
As of December 31, 2022, Tuebor had $213.0 million of borrowings outstanding, with terms of 0.6 years to 1.75 years (with a weighted average of 1.25 years), interest rates of 2.74% to 4.70% (with a weighted average of 4.52%), and its existing advances.advance rates of 71.7% to 95.7% on eligible collateral. As of December 31, 2022, collateral for the borrowings was comprised primarily of $248.8 million of CMBS.
Tuebor is subject to state regulations which require that dividends (including dividends to the Company as its parent) may only be made with regulatory approval. However, there can be no assurance that we would obtain such approval if sought. Largely as a result of this restriction, approximately $2.1$0.8 billion of theTuebor’s member’s capital was restricted from transfer via dividend to Tuebor’s parent without prior approval of state insurance regulators at December 31, 2020.2023. To facilitate intercompany cash funding of operations and investments, Tuebor and its parent maintain regulator-approved intercompany borrowing/lending agreements.
Senior Unsecured Notes
Senior unsecured notes
As of December 31, 2020,2023, the Company had $1.6 billion of unsecured corporate bonds outstanding. These unsecured financings were comprised of $146.7 million in aggregate principal amount of 5.875% senior notes due 2021, $465.9 million in aggregate principal amount of 5.25% senior notes due 2022, $348.0$327.8 million in aggregate principal amount of 5.25% senior notes due 2025 and $651.8(the “2025 Notes”), $611.9 million in aggregate principal amount of 4.25% senior notes due 2027. 2027 (the “2027 Notes”) and $635.9 million in aggregate
principal of 4.75% senior notes due 2029 (the “2029 Notes,” and collectively with the 2025 Notes and the 2027 Notes, the “Notes”).
As a result of December 31, 2022, the Company’s financingCompany had $1.6 billion of unsecured corporate bonds outstanding. These unsecured financings were comprised of $344.0 million in aggregate principal amount of 5.25% senior notes due 2025 (the “2025 Notes”), $650.8 million in aggregate principal amount of 4.25% senior notes due 2027 (the “2027 Notes”) and liquidity measures implemented to date as a direct response to the COVID-19 pandemic, Ladder repurchased an$649.0 million in aggregate principal of these4.75% senior notes of $139.1 million, recognizing a gain on extinguishment of debt of $19.0 million, offset by accelerated deferred financing cost amortization of $1.5 million duringdue 2029 (the “2029 Notes,” and collectively with the three months ended June 30, 2020.2025 Notes and the 2027 Notes, the “Notes”).
LCFH issued the Notes with Ladder Capital Finance Corporation (“LCFC”), as co-issuers on a joint and several basis. LCFC is a 100% owned finance subsidiary of Series TRS of LCFH with no assets, operations, revenues or cash flows other than those related to the issuance, administration and repayment of the Notes. The Company and certain subsidiaries of LCFH currently guarantee the obligations under the Notes and the indenture. The Company is the general partner of LCFH and, through LCFH and its subsidiaries, operates the Ladder Capital business. As of December 31, 2020, the Company has a 100.0% economic and voting interest in LCFH and controls the management of LCFH as a result of its ability to appoint board members. Accordingly, the Company consolidates the financial results of LCFH. In addition, the Company, through certain subsidiaries which are treated as TRSs, is indirectly subject to U.S. federal, state and local income taxes. Other than federal, state and local income taxes, there are no material differences between the Company’s consolidated financial statements and LCFH’s consolidated financial statements. The Company believes it was in compliance with all covenants of the Notes as of December 31, 20202023 and 2019.
Unamortized2022. The Notes are presented net of unamortized debt issuance costs of $12.9$11.8 million and $8.4$15.4 million are included in senior unsecured notes as of December 31, 20202023 and 2019, respectively, in accordance with GAAP.December 31, 2022, respectively.
2021 Notes
On August 1, 2014, LCFH issued $300.0 million in aggregate principal amount of 5.875% senior notes due August 1, 2021 (the “2021 Notes”). The 2021 Notes require interest payments semi-annually in cash in arrears, on February 1 and August 1 of each year, beginning on February 1, 2015. The 2021 Notes will mature on August 1, 2021. The 2021 Notes are unsecured and are subject to incurrence-based covenants, including limitations on the incurrence of additional debt, restricted payments, liens, sales of assets, affiliate transactions and other covenants typical for financings of this type. At any time on or after August 1, 2017, the Company may redeem the 2021 Notes in whole or in part, upon not less than 30 nor more than 60 days’ notice, at redemption prices defined in the indenture governing the 2021 Notes, plus accrued and unpaid interest, if any, to the redemption date. On February 24, 2016, the board of directors authorized the Company to make up to $100.0 million in repurchases of the 2021 Notes from time to time without further approval. On May 2, 2018, the board of the directors authorized the Company to repurchase any or all of the 2021 Notes from time to time without further approval. During the year ended December 31, 2020, the Company retired $119.5 million of principal of the 2021 Notes for a repurchase price of $119.3 million, recognizing a $0.1 million net gain on extinguishment of debt after recognizing $(0.2) million of unamortized debt issuance costs associated with the retired debt. As of December 31, 2020, the remaining $146.7 million in aggregate principal amount of the 2021 Notes was due on August 1, 2021; however, subsequent to year end, the Company redeemed in full its 5.875% Senior Notes due 2021. Refer to Note 21 Subsequent Events for further details.
2022 Notes
On March 16, 2017, LCFH issued $500.0 million in aggregate principal amount of 5.250% senior notes due March 15, 2022 (the “2022 Notes”). The 2022 Notes require interest payments semi-annually in cash in arrears on March 15 and September 15 of each year, beginning on September 15, 2017. The 2022 Notes will mature on March 15, 2022. The 2022 Notes are unsecured and are subject to an unencumbered assets to unsecured debt covenant. At any time on or after September 15, 2021, the 2022 Notes are redeemable at the option of the Company, in whole or in part, upon not less than 15 nor more than 60 days’ notice, without penalty. On May 2, 2018, the board of the directors authorized the Company to repurchase any or all of the 2022 Notes from time to time without further approval. During the year ended December 31, 2020, the Company retired $34.2 million of principal of the 2022 Notes for a repurchase price of $33.2 million, recognizing a $0.7 million net gain on extinguishment of debt after recognizing $(0.2) million of unamortized debt issuance costs associated with the retired debt. As of December 31, 2020, the remaining $465.9 million in aggregate principal amount of the 2022 Notes is due March 15, 2022.
2025 Notes
On September 25, 2017, LCFH issued $400.0 million in aggregate principal amount of 5.250% senior notes due October 1, 2025 (the “2025 Notes”). The 2025 Notes require interest payments semi-annually in cash in arrears on April 1 and October 1 of each year, beginning on April 1, 2018. The 2025 Notes will mature on October 1, 2025. The 2025 Notes are unsecured, and are subject to an unencumbered assets to unsecured debt covenant. The Company may redeem the 2025 Notes, in whole or in part, at any time, or from time to time, prior to their stated maturity upon not less than 1510 nor more than 60 days’ notice, at a redemption price as specified in theeach respective indenture governing the 2025 Notes, plus accrued and unpaid interest, if any, to the redemption date. On May 2, 2018, theThe board of the directors has authorized the Company to repurchase any or all of the 2025 Notes from time to time without further approval.
During the year ended December 31, 2020,2023, the Company retired $52.0repurchased $16.2 million of principal of the 2025 Notes forand recognized a repurchase pricenet gain of $45.1$1.3 million recognizing a $6.4 million net gain on extinguishment of debt, after recognizing $(0.5)$38.9 million of unamortized debt issuance costs associated with the retired debt. As of December 31, 2020, the remaining $348.0 million in aggregate principal amount of the 2025 Notes is due October 1, 2025.
2027 Notes
On January 30, 2020, LCFH issued $750.0 million in aggregate principal amount of 4.25% senior notes due February 1, 2027. The 2027 Notes require interest payments semi-annually in cash in arrears on August 1 and February 1 of each year, beginning on August 1, 2020. The 2027 Notes will mature on February 1, 2027. The 2027 Notes are unsecured and are subject to an unencumbered assets to unsecured debt covenant. The Company may redeem the 2027 Notes, in whole, at any time, or from time to time, prior to their stated maturity. At any time on or after February 1, 2023, the Company may redeem the 2027 Notes in whole or in part, upon not less than 15 nor more than 60 days’ notice, at a redemption price defined in the indenture governing the 2027 Notes, plus accrued and unpaid interest, if any, to the redemption date. Net proceeds of the offering were used to repay secured indebtedness. During the year ended December 31, 2020, the Company retired $98.2 million of principal of the 2027 Notes forand recognized a repurchase pricenet gain of $83.9$6.8 million recognizing a $12.9 million net gain on extinguishment of debt, after recognizing $(1.3)and $13.1 million of unamortized debt issuance costs associated with the retired2029 Notes and recognized a net gain of $2.6 million on extinguishment of debt. As of December 31, 2020, the remaining $651.8 million in aggregate principal amount of the 2027 Notes is due February 1, 2027.
Stock Repurchases
On October 30, 2014,July 27, 2022, the board of directors authorized the Company to repurchase up toof $50.0 million of the Company’s Class A common stock from time to time without further approval. This authorization increased the remaining outstanding authorization per the August 4, 2021 authorization from $39.5 million to $50.0 million. Stock repurchases by the Company are generally made for cash in open market transactions at prevailing market prices but may also be made in privately negotiated transactions or otherwise. The timing and amount of purchases are determined based upon prevailing market conditions, our liquidity requirements, contractual restrictions and other factors. As of December 31, 2020,2023, the Company has a remaining amount available for repurchase of $38.1$44.3 million, which represents 3.1%3.0% in the aggregate of its outstanding Class A common stock, based on the closing price of $9.78$11.51 per share on such date. Refer to Note 10, Equity Structure and Accounts, to our consolidated financial statements included elsewhere in this Annual Report, for disclosure of the Company’s repurchase activity.
The following table is a summary of the Company’s repurchase activity of its Class A common stock during the year ended December 31, 20202023 ($ in thousands):
| | | | | | | | | | | | | | |
| | Shares | | Amount(1) |
| Authorizations remaining as of December 31, 2019 | | | | $ | 41,132 | |
| Additional authorizations | | | | — | |
| Repurchases paid | | 384,251 | | | (3,030) | |
| Repurchases unsettled | | | | — | |
| Authorizations remaining as of December 31, 2020 | | | | $ | 38,102 | |
| | | | | | | | | | | | | | |
| | Shares | | Amount(1) |
| Authorizations remaining as of December 31, 2022 | | | | $ | 46,737 | |
| | | | |
| Repurchases paid: | | | | |
| March 1 - March 31, 2023 | | 250,000 | | | (2,285) | |
| | | | |
| | | | |
| | | | |
| | | | |
| | | | |
| September 1 - September 30, 2023 | | 19,000 | | | (196) | |
| | | | |
| | | | |
| | | | |
| Authorizations remaining as of December 31, 2023 | | | | $ | 44,256 | |
(1)Amount excludes commissions paid associated with share repurchases.
Dividends
In order for the Company to maintain its qualification as a REIT under the Code, it must annually distribute at least 90% of its taxable income. The Company has paid and in the future intends to declare regular quarterly distributions to its shareholders in aggregating to an amount approximating at least 90% of the REIT’s annual net taxable income.
All distributions are made at the discretion of our board of directors and depend on our earnings, our financial condition, any debt covenants, maintenance of our REIT qualification, restrictions on making distributions under Delaware law and other factors as our board of directors may deem relevant from time to time.
Refer to Item 8—”Financial Statements and Supplemental Data—Note 11,10, Equity Structure and Accounts”Accounts, to our consolidated financial statements included elsewhere in this Annual Report, for disclosure of dividends declared.
Principal repaymentsRepayments on investmentsInvestments
We receive principal amortization on our loans and securities as part of the normal course of our business. Repayment of mortgage loan receivables provided net cash of $892.1$738.5 million for the year ended December 31, 20202023 and $1.6 billion$909.8 million for the year ended December 31, 2019.2022. Repayment of real estate securities provided net cash of $146.2$232.1 million for the year ended December 31, 20202023, and $491.9$184.8 million for the year ended December 31, 2019.2022.
Proceeds from securitizationsSecuritizations and salesSales of loansLoans
We sell our conduit mortgage loans to securitization trusts and to other third parties as part of our normal course of business.business and from time to time will sell balance sheet mortgage loans. There were $582.8no proceeds from sales of mortgage loans for the year ended December 31, 2023, and there were $29.2 million of proceeds from sales of mortgage loans for the year ended December 31, 2020 and $1.0 billion sales of mortgage loans for the year ended December 31, 2019.2022.
Proceeds from the saleSale of securitiesSecurities
We investsell our investments in CMBS, U.S. Agency Securities,securities, corporate bonds, U.S. Treasury securities, and equity securities.securities as a part of our normal course of business. Proceeds from sales of securities provided net cash of $932.2$17.8 million for the year ended December 31, 20202023, and $855.9$5.8 million for the year ended December 31, 2019.2022.
Proceeds from the saleSale of real estateReal Estate
We own a portfolio of commercial real estate properties as well as residential condominium units. ProceedsThere were $13.4 million, net proceeds from sales of real estate provided net cash of $44.7for the year ended December 31, 2023, and $310.5 million for the year ended December 31, 2020 and $12.1 million for the year ended December 31, 2019.2022.
Proceeds from the issuance of equity
For the year ended December 31, 2020, we raised $32.0 million of proceeds in connection with the issuance of 4.0 million shares of our Class A common stock. For the year ended December 31, 2019, there were no proceeds realized in connection with the issuance of equity. We may issue additional equity in the future.
Other potential sourcesPotential Sources of financingFinancing
In the future, we may also use other sources of financing to fund the acquisition of our assets, including credit facilities, warehouse facilities, repurchase facilities and other secured and unsecured forms of borrowing. These financings may be collateralized or non-collateralized, may involve one or more lenders and may accrue interest at either fixed or floating rates. We may also seek to raise further equity capital or issue debt securities in order to fund our future investments.
Contractual obligationsObligations
Contractual obligations as of December 31, 20202023 were as follows ($ in thousands):
| | | | | | | | | | | | | | | | | | | | | | | | | | | | | |
| Contractual Obligations |
| Less than 1 Year | | 1-3 Years | | 3-5 Years | | More than 5 Years | | Total |
| Secured financings | $ | 1,073,095 | | (1) | $ | 620,240 | | | $ | 696,391 | | | $ | 232,840 | | | $ | 2,622,566 | |
| Unsecured revolving credit facility | 266,430 | | (1) | — | | | — | | | — | | | 266,430 | |
| Senior unsecured notes | 146,655 | | | 465,850 | | | 347,956 | | | 651,838 | | | 1,612,299 | |
| Interest payable(2) | 115,859 | | | 163,269 | | | 130,437 | | | 64,128 | | | 473,693 | |
| Other funding obligations(3) | 149,763 | | | — | | | — | | | — | | | 149,763 | |
| Payments pursuant to tax receivable agreement (4) | 899 | | | — | | | — | | | — | | | 899 | |
| Operating lease obligations | 1,180 | | | 98 | | | — | | | — | | | 1,278 | |
| Total | $ | 1,753,881 | | | $ | 1,249,457 | | | $ | 1,174,784 | | | $ | 948,806 | | | $ | 5,126,928 | |
| | | | | | | | | | | | | | | | | | | | | | | | | | | | | |
| Contractual Obligations (1) |
| Less than 1 Year | | 1-3 Years | | 3-5 Years | | More than 5 Years | | Total |
| Secured financings(2) | $ | 320,900 | | | $ | 481,915 | | | $ | 310,620 | | | $ | 45,555 | | | $ | 1,158,990 | |
| | | | | | | | | |
| Senior unsecured notes | — | | | 327,756 | | | 611,939 | | | 635,919 | | | 1,575,614 | |
| Interest payable(3) | 100,321 | | | 161,693 | | | 83,146 | | | 17,019 | | | 362,179 | |
| Other funding obligations(4) | 75,648 | | | — | | | | | 10,002 | | | 85,650 | |
| | | | | | | | | |
| Operating lease obligations | 2,171 | | | 4,426 | | | 15,575 | | | — | | | 22,172 | |
| Total | $ | 499,040 | | | $ | 975,790 | | | $ | 1,021,280 | | | $ | 708,495 | | | $ | 3,204,605 | |
(1)As more fully disclosed in Note 7,6, Debt Obligations, Net, these obligations are subject to existing Company controlledour consolidated financial statements included elsewhere in this Annual Report, the allocation of repayments under our committed loan repurchase facilities is based on the earlier of: (i) the maturity date of each agreement; or (ii) the maximum maturity date of the collateral loans, assuming all extension options for one or more additional one-year periods or could be refinancedare exercised by other existing facilities.the borrower.
(2) ComposedTotal does not include $1.1 billion of consolidated CLO debt obligations and the related debt issuance costs of $2.1 million, as the satisfaction of these liabilities will not require cash outlays from us.
(3)Comprised of interest on secured financings and on senior unsecured notes. For borrowings with variable interest rates, we used the rates in effect as of December 31, 20202023 to determine the future interest payment obligations.
(3) (4)Comprised primarily of our off-balance sheet unfunded commitment to provide additional first mortgage loan financing as of December 31, 2020.
(4) Refer2023. The allocation of our unfunded loan commitments is based on the earlier of the commitment expiration date or the final maturity date, however, we may be obligated to Note 16, Income Taxes - Tax Receivable Agreement for further details.fund these commitments earlier than such date. This amount excludes $128.6 million of future funding commitments that require the occurrence of certain “good news” events, such as the owner concluding a lease agreement with a major tenant in the building or reaching a pre-determined net operating income which may or may not be achieved.
The table above does not include amounts due under our derivative agreements as those contracts do not have fixed and determinable payments. Our contractual obligations will be refinanced and/or repaid from earnings as well as amortization and sales of our liquid collateral.
Off-Balance Sheet Arrangements
We have made investments in various unconsolidated joint ventures. See Note 6, Investment in and Advances to Unconsolidated Joint Ventures for further detailsventures of which our unconsolidated investments. Our maximum exposure to loss from these investments is limited to the carrying value of our investments.
In addition to the future contractual obligations above, the Company, in the coming year and beyond, as a part of Contentsits normal course of business will require cash to fund unfunded loan commitments and new investments in a combination of balance sheet mortgage loans, conduit loans, real estate investments and securities as it deems appropriate as well as necessary expenses as a part of general corporate purposes. These new investments and general corporate expenses may be funded with existing cash, proceeds from loan and securities payoffs, through financing using our Revolving Credit Facility or loan and security financing facilities, or through additional debt or equity raises. The Company has no known material cash requirements other than its contractual obligations in the above table, unfunded commitments and future general corporate expenses.
Unfunded Loan Commitments
We may be a party to financial instruments with off-balance sheet risk in the normal course of business to meet the financial needs of our borrowers. These commitments are not reflected on the consolidated balance sheets. As of December 31, 2020,2023, our off-balance sheet arrangements consisted of $148.8$204.0 million of unfunded commitments of mortgage loan receivables held for investment, 63% of which additional funds relate to the occurrence of certain “good news” events, such as the owner concluding a lease agreement with a major tenant in the building or reaching some pre-determined net operating income. As of December 31, 2019,2022, our off-balance sheet arrangements consisted of $286.5$321.8 million of unfunded commitments of mortgage loan receivables held for investment to provide additional first mortgage loan financing. Such commitments are subject to our borrowers’ satisfaction of certain financial and nonfinancial covenants and involve, to varying degrees, elements of credit risk in excess of the amount recognized in the consolidated balance sheets. Commitments are subject to our loan borrowers’ satisfaction of certain financial and nonfinancial covenants and may or may not be funded depending on a variety of circumstances including timing, credit metric hurdles, and other nonfinancial events occurring. The COVID-19 pandemic has impacted the progress
LIBOR Transition to remain slower to complete than otherwise expected, and the pace of future funding relating to these capital needs has been, and may continue to be, commensurately slower.SOFR
As of December 31, 2023, all of our floating rate loans earn interest at a rate indexed to Term SOFR; and all of our floating rate debt obligations bear interest indexed to Term SOFR.
Interest Rate Environment
The nature of the Company’s business exposes it to market risk arising from changes in interest rates. Changes, both increases and decreases, in the rates the Company is able to charge its borrowers, the yields the Company is able to achieve in its securities investments, and the Company’s cost of borrowing directly impacts its net income. The Company’s net interest income includes interest from both fixed and floating rate debt. The percentage of the Company’s assets and liabilities bearing interest at fixed and floating rates may change over time, and asset composition may differ materially from debt composition. Refer to Item 7A “Quantitative and Qualitative Disclosures about Market Risk” for further disclosures surrounding the impact of rising or falling interest rate on our earnings.
Critical Accounting Policies and Estimates
The preparation of financial statements in accordance with GAAP requires management to make estimates and judgments in certain circumstances that affect amounts reported as assets, liabilities, revenues and expenses. We have established detailed policies and control procedures intended to ensure that valuation methods, including any judgments made as part of such methods, are well controlled, reviewed and applied consistently from period to period. We base our estimates on historical corporate and industry experience and various other assumptions that we believe to be appropriate under the circumstances. The Company’s critical accounting policies are those which require assumptions to be made about matters that are highly uncertain. Different estimates could have a material effect on the Company’s financial results. For all of these estimates, we caution that future events rarely develop exactly as forecasted and, therefore, routinely require adjustment.
During 2020,2023, management reviewed and evaluated these critical accounting policies and estimates and believes they are appropriate. Our significant accounting policies are described in Item 8—“Financial Statements and Supplemental Data—Note 2.”2, Significant Accounting Policies, to our consolidated financial statements included elsewhere in this Annual Report. The following is a list of accounting policies that require more significant estimates and judgments:
•Current expected creditAllowance for loan losses
•Acquisition of real estate
•Impairment or disposal of long lived assets
•Identified intangible assets and liabilities
•Variable interest entities
•Valuation of financial instruments
The following is a summary of accounting policies that require more significant management estimates and judgments:
Current expected credit lossesAllowance for Loan Losses
The Company uses a current expected credit loss model (“CECL”) for estimating the provision for loan losses on its loan portfolio. The CECL model requires the consideration of possible credit losses over the life of an instrument and includes a portfolio-based component and an asset-specific component. In compliance with the CECL reporting requirements, the Company has supplemented thesupplements its existing credit monitoring and management processes with additional processes to support the calculation of the CECL reserves. As part of that effort, theThe Company has engagedengages a third-party service provider to provide market data and a credit loss model. The credit loss model is a forward-looking, econometric, commercial real estate (“CRE”) loss forecasting tool. It is comprised of a probability of default (“PD”) model and a loss given default (“LGD”) model that, layered together with user’sthe Company’s loan-level data, fair value of collateral, net operating income of collateral, selected forward-looking macroeconomic variables, and pool-level mean loss rates, produces life of loan expected losses (“EL”) at the loan and portfolio level. Where management has determined that the credit loss model does not fully capture certain external factors, including portfolio trends or loan-specific factors, a qualitative adjustment to the reserve is recorded. In addition, interest receivable on loans is not included in the Company’s CECL calculations as the Company performs timely write offs of aged interest receivable. The Company has made a policy election to write off aged receivables through interest income as opposed to through the CECL provision on its statements of income.
The asset-specific reserve component relates to reservesLoans for losses on individually impairedwhich the borrower or sponsor is experiencing financial difficulty, and where repayment of the loan is expected substantially through the operation or sale of the underlying collateral, are considered collateral dependent loans. The Company evaluates each loan for impairment at least quarterly. Impairment occurs when it is deemed probable thatFor collateral dependent loans, the Company will not be ablemay elect a practical expedient which allows the Company to collect all amounts due according tomeasure expected losses based on the contractual termsdifference between the collateral’s fair value and the amortized cost basis of the loan. IfWhen the repayment or satisfaction of the loan is considered to be impaired, an allowance is recorded to reduce the carrying valuedependent on a sale, rather than operations of the loan to the present value of the expected future cash flows discounted at the loan’s effective rate orcollateral, the fair value of the collateral, lessis adjusted for the estimated costs to sell if recovery of the Company’s investment is expected solely from the collateral. If foreclosure is probable, the Company is required to measure for expected losses using this methodology.
The Company generally will use the direct capitalization rate valuation methodology or the sales comparison approach to estimate the fair value of the collateral for such loans and in certain cases will obtain external appraisals. Determining fair value of the collateral may take into account a number of assumptions including, but not limited to, cash flow projections, market capitalization rates, discount rates and data regarding recent comparable sales of similar properties. Such assumptions are generally based on current market conditions and are subject to economic and market uncertainties.
The Company’s loans are typically collateralized by real estate directly or indirectly. As a result, the Company regularly evaluates the extent and impact of any credit deterioration associated with the performance and/or value of the underlying collateral property as well as the financial and operating capability of the borrower/sponsor on a loan-by-loan basis. Specifically, a property’s operating results and any cash reserves are analyzed and used to assessassess: (i) whether cash flow from operations is sufficient to cover the debt service requirements currently and into the future,future; (ii) the ability of the borrower to refinance the loan at maturity,maturity; and/or (iii) the property’s liquidation value. The Company also evaluates the financial wherewithal of any loan guarantors as well as the borrower’s competency in managing and operating the properties. In addition, the Company considers the overall economic environment, real estate sector, and geographic submarket in which the collateral property is located. Such impairment analyses are completed and reviewed by asset management and underwriting personnel, who utilize various data sources, includingincluding: (i) periodic financial data such as property occupancy, tenant profile, rental rates, operating expenses, the borrowers’ business plan, and capitalization and discount rates,rates; (ii) site inspections,inspections; and (iii) current credit spreads and other market data and ultimately presented to management for approval.
A loan is also considered impaired if its terms are modified inWhen a troubled debt restructuring (“TDR”). A TDR occurs when a concession is granted and the debtor is experiencing financial difficulties. Impairments on TDR loans are generally measured based ondifficulties and a loan is modified, the present value of expected future cash flows discounted at the effective interest rateeffect of the original loans.modification will be included in the Company’s assessment of the CECL allowance for loan losses. If the Company provides principal forgiveness, the amortized cost basis of the loan is written off against the allowance for loan losses. Generally, when granting concessions, the Company will seek to protect its position by requiring incremental pay downs, additional collateral or guarantees and, in some cases, lookback features or equity interests to offset concessions granted should conditions impacting the loan improve. The Company’s determination of credit losses is impacted by TDRs whereby loans that have gone through TDRs are considered impaired, assessed for specific reserves, and are not included in the Company’s assessment of the CECL reserve. Loans previously restructured under TDRs that subsequently default are reassessed to incorporate the Company’s current assumptions on expected cash flows and additional provision expense is recorded to the extent necessary.
The Company designates a loan as a non-accrual loansloan generally whenwhen: (i) the principal or coupon interest components of loan payments become 90-days past duedue; or (ii) in the opinion of the Company, it is doubtful the Company will be able to collect all amountsprincipal and coupon interest due according to the contractual terms of the loan. Interest income on non-accrual loans in which the Company reasonably expects a full recovery of the loan’s outstanding principal balance is recognized when received in cash. Otherwise, income recognition will be suspended and any cash received will be applied as a reduction to the amortized cost.cost basis. A non-accrual loan is returned to accrual status at such time as the loan becomes contractually current and future principal and coupon interest are reasonably assured to be received in accordance with the contractual loan terms. A loan will be written off when management has determined itprincipal and coupon interest is no longer realizable and deemed non-recoverable.
The CECL accounting estimate is subject to uncertainty as a result of changing macroeconomic market conditions, as well as the vintage and location of the underlying assets as disclosed in Note 3, Mortgage Loan Receivables, to our consolidated financial statements included elsewhere in this Annual Report. The provision for (release of) loan losses for the yearsyear ended December 31, 20202023 and 2019 were $18.3December 31, 2022 was $25.1 million and $2.6$3.7 million, respectively.
During the year ended December 31, 2023, there was a charge off of reserve of $2.7 million. The allowance for loan losses as ofat December 31, 20202023 and December 31, 2019 were $42.12022 was $43.9 million and $20.5$21.5 million, respectively. The allowance includes $0.7 million of reserves for unfunded commitments at December 31, 2023 and December 31, 2022. The estimate is sensitive to the assumptions used to represent future expected economic conditions.
Acquisition of real estateReal Estate
We generally acquire real estate assets or land and development assets through purchases and may also acquire such assets through foreclosure or deed-in-lieu of foreclosure in full or partial satisfaction of defaulted loans. Purchased properties are classified as real estate, net or land and development, net on our consolidated balance sheets. When we intend to hold, operate or develop the property for a period of at least 12 months, the asset is classified as real estate, net, and when we intend to market a property for sale inif the near term,asset meets the held-for-sale criteria, the asset is classified as real estate held for sale. Upon purchase, the properties are recorded at cost.
Foreclosed assets classified as real estate and land and development are initially recorded at their estimated fair value and assets classified as assets held for sale are recorded at their estimated fair value less costs to sell. The excess of the carrying value of the loan over these amounts is charged-off against the reserve for loan losses. In both cases, upon acquisition, tangible and intangible assets and liabilities acquired are recorded at their estimatedrelative fair values.
81Identified Intangible Assets and Liabilities
We record intangible assets and liabilities acquired at their relative fair values, and determine whether such intangible assets and liabilities have finite or indefinite lives. As of Contents
December 31, 2023 and December 31, 2022, all such acquired intangible assets and liabilities have finite lives. We review finite lived intangible assets for impairment whenever events or changes in circumstances indicate that their carrying amount may not be recoverable. If we determine the carrying value of an intangible asset is not recoverable, we will record an impairment charge to the extent its carrying value exceeds its estimated fair value. Impairments of intangibles are recorded in impairment of assets in our consolidated statements of income.
Impairment or disposalDisposal of long-lived assetsLong-lived Assets
Real estate assets to be disposed of are reported at the lower of their carrying amount or estimated fair value less costs to sell and are included in real estate held for sale on our consolidated balance sheets. The difference between the estimated fair value less costs to sell and the carrying value will be recorded as an impairment charge. Impairment for real estate assets are included in impairment of assets in our consolidated statements of operations. Once the asset is classified as held for sale, depreciation expense is no longer recorded.
We periodically review real estate to be held and used, and land and development assets for impairment in value, whenever events or changes in circumstances indicate that the carrying amount of such assets may not be recoverable. The asset’s value is impaired only if management’s estimate of the aggregate future cash flows (undiscounted and without interest charges) to be generated by the asset (taking into account the anticipated holding period of the asset) is less than the carrying value. Such estimate of cash flows considers factors such as expected future operating income, trends and prospects, as well as the effects of demand, competition and other economic factors. To the extent impairment has occurred, the loss will be measured as the excess of the carrying amount of the property over the fair value of the asset and reflected as an adjustment to the basis of the asset. Impairments of real estate and land and development assets are recorded in impairment of assets in our consolidated statements of operations.
We hadThere were no propertyproperties classified as held for sale atas of December 31, 2020 or 2019.2023 and December 31, 2022. We did not record any impairments of real estate for any of the years ended December 31, 20202023 or 2018. We recorded a $1.4 million impairment of real estate for the year ended December 31, 2019.
Identified intangible assets and liabilities
We record intangible assets and liabilities acquired at their estimated fair values, and determine whether such intangible assets and liabilities have finite or indefinite lives. As of December 31, 2020 and 2019, all such acquired intangible assets and liabilities have finite lives. We amortize finite lived intangible assets and liabilities over the period which the assets and liabilities are expected to contribute directly or indirectly to the future cash flows of the business acquired. We review finite lived intangible assets for impairment whenever events or changes in circumstances indicate that their carrying amount may not be recoverable. If we determine the carrying value of an intangible asset is not recoverable we will record an impairment charge to the extent its carrying value exceeds its estimated fair value. Impairments of intangibles are recorded in impairment of assets in our consolidated statements of income.2022.
Variable interest entitiesInterest Entities
We evaluate our investments and other contractual arrangements to determine if our interests constitute variable interests in a variable interest entity (“VIE”) and if we are the primary beneficiary. There is a significant amount of judgment required to determine if an entity is considered a VIE and if we are the primary beneficiary. We first perform a qualitative analysis, which requires certain subjective decisions regarding our assessment, including, but not limited to, which interests create or absorb variability, the contractual terms, the key decision makingdecision-making powers, impact on the VIE’s economic performance and related party relationships. An iterative quantitative analysis is required if our qualitative analysis proves inconclusive as to whether the entity is a VIE or we are the primary beneficiary and consolidation is required.
Fair valueValue of assetsAssets and liabilitiesLiabilities
The degree of management judgment involved in determining the fair value of assets and liabilities is dependent upon the availability of quoted market prices or observable market parameters. For financial and nonfinancial assets and liabilities that trade actively and have quoted market prices or observable market parameters, there is minimal subjectivity involved in measuring fair value. When observable market prices and parameters are not fully available, management judgment is necessary to estimate fair value. In addition, changes in market conditions may reduce the availability of quoted prices or observable data. For example, reduced liquidity in the capital markets or changes in secondary market activities could result in observable market inputs becoming unavailable. Therefore, when market data is not available, we would use valuation techniques requiring more management judgment to estimate the appropriate fair value measurement.
Recently Adopted Accounting Pronouncements and Recent Accounting Pronouncements Pending Adoption
Our recently adopted accounting pronouncements and recent accounting pronouncements pending adoption are described in Item 8—“Financial Statements and Supplemental Data—Note 2.”
2, Significant Accounting Policies, to our consolidated financial statements included elsewhere in this Annual Report.
Reconciliation of Non-GAAP Financial Measures
Distributable earningsEarnings
For the fourth quarter of 2020, theThe Company began utilizingutilizes distributable earnings, a non-GAAP financial measure, as a supplemental measure of our operating performance. We believe distributable earnings assists investors in comparing our operating performance and our ability to pay dividends across reporting periods on a more relevant and consistent basis by excluding from GAAP earningsmeasures certain non-cash expenses and unrealized results as well as eliminating timing differences related to securitization gains and changes in the values of assets and derivatives. In addition, we use distributable earnings: (i) to evaluate our earnings from operations (ii) because management believes that it may be a useful performance measure for usmeasure; and (iii)(ii) because our board of directors considers distributable earnings in determining the amount of quarterly dividends. Distributable earnings replaced our prior presentation of core earnings, and core earnings presentations from prior reporting periods have been recast as distributable earnings.
We define distributable earnings as income before taxes adjusted for: (i) real estate depreciation and amortization; (ii) the impact of derivative gains and losses related to the hedging of assets on our balance sheet as of the end of the specified accounting period; (iii) unrealized gains/(losses) related to our investments in fair value securities and passive interest in unconsolidated joint ventures; (iv) economic gains on loan sales not recognized under GAAP accounting for which risk has substantially transferred during the period and the exclusion of resultant GAAP recognition of the related economics during the subsequent periods; (v) unrealized provision for loan losses and unrealized real estate impairment; (vi) realized provisions for loan losses and realized real estate impairment; (vii) non-cash stock-based compensation; and (viii) certain transactional items. For the purpose of computing distributable earnings, management recognizes loan and real estate losses as being realized generally in the period in which the asset is sold or the Company determines a decline in value to be non-recoverable and the loss to be nearly certain.
For distributable earnings, we include adjustments for economic gains on loan sales not recognized under GAAP accounting for which risk has substantially transferred during the period and exclusion ofexclude the resultant GAAP recognition of the related economics during the subsequent periods. This adjustment is reflected in distributable earnings when there is a true risk transfer on the mortgage loan transfer and settlement. Historically, this adjustment has represented the impact of economic gains/(discounts) on intercompany loans secured by our own real estate which we had not previously recognized because such gains were eliminated in consolidation. Conversely, if the economic risk was not substantially transferred, no adjustments to net income would be made relating to those transactions for distributable earnings purposes. Management believes recognizing these amounts for distributable earnings purposes in the period of transfer of economic risk is a reasonable supplemental measure of our performance.
As discussed in Note 2, Significant Accounting Policies, to theour consolidated financial statements included elsewhere in this Annual Report, we do not designate derivatives as hedges to qualify for hedge accounting and, therefore, any net payments under, or fluctuations in the fair value of, our derivatives are recognized currently in our GAAP income statement. However, fluctuations in the fair value of the related assets are not included in our income statement. We consider the gain or loss on our hedging positions related to assets that we still own as of the reporting date to be “open hedging positions.” While recognized for GAAP purposes, we exclude the results on the hedges from distributable earnings until the related asset is sold andand/or the hedge position is considered “closed,” whereupon they would then be included in distributable earnings in that period. These are reflected as “Adjustments for unrecognized derivative results” for purposes of computing distributable earnings for the period. We believe that excluding these specifically identified gains and losses associated with the open hedging positions adjusts for timing differences between when we recognize changes in the fair values of our assets and changes in the fair value of the derivatives used to hedge such assets.
As more fully discussed in Note 2, Significant Accounting Policies, to theour consolidated financial statements included elsewhere in this Annual Report, our investments in Agency interest-only securities and equity securities are recorded at fair value with changes in fair value recorded in current period earnings. We believe that excluding these specifically identified gains and losses associated with the fair value securities adjusts for timing differences between when we recognize changes in the fair values of our assets. With regard to securities valuation, distributable earnings includes a decline in fair value deemed to be an other-than-temporary impairment for GAAP purposes only if the decline is determined to be nearly certain to be eventually realized. In those cases, an impairment is included in distributable earnings for the period in which such determination was made.
Our results of operations in the second quarter of 2020 were significantly impacted by the actions we took to generate liquidity and pay down mark-to-market debt in direct response to the unfavorable market conditions that occurred near the onset of the COVID-19 pandemic. The actions taken by management had multiple impacts on distributable earnings for the three months ended June 30, 2020. Management believes the actions taken were prompted by the unusual market conditions and therefore outside of Ladder’s main operations. Management believes adjusting for certain transactional charges/gains related to the impact of COVID-19 on its performance measures provides a more useful guide to assess the ongoing main operations of the Company.
Set forth below is a reconciliation of income (loss) before taxes to distributable earnings ($ in thousands):
| | | Year Ended December 31, |
| | 2020 | | 2019 |
| | | Year Ended | |
| | | Year Ended | |
| | | Year Ended | |
| | | | | December 31 | | | | | | | December 31 | | December 31 |
| | | | | 2023 | | | | | | | 2023 | | 2022 |
| Income (loss) before taxes | Income (loss) before taxes | | $ | (19,247) | | | $ | 139,647 | |
| Net (income) loss attributable to noncontrolling interest in consolidated joint ventures (GAAP)(1) | | (5,559) | | | 663 | |
| Net (income) loss attributable to noncontrolling interests in consolidated ventures (GAAP) | |
Our share of real estate depreciation, amortization and gain adjustments (2)(1) | Our share of real estate depreciation, amortization and gain adjustments (2)(1) | | 22,493 | | | 27,201 | |
| Adjustments for unrecognized derivative results (3) | | 2,738 | | | 2,502 | |
| Adjustments for derivative results (2) | |
| Unrealized (gain) loss on fair value securities | Unrealized (gain) loss on fair value securities | | (225) | | | (1,927) | |
| Adjustment for economic gain on loan sales not recognized under GAAP for which risk has been substantially transferred, net of reversal/amortization | Adjustment for economic gain on loan sales not recognized under GAAP for which risk has been substantially transferred, net of reversal/amortization | | 912 | | | (645) | |
Adjustment for impairment (4)(3) | Adjustment for impairment (4)(3) | | 9,125 | | | — | |
| Non-cash stock-based compensation | Non-cash stock-based compensation | | 41,761 | | | 23,118 | |
| Transactional adjustments (response to COVID-19 and other) (5) | | 16,259 | | | — | |
| | Distributable earnings | Distributable earnings | | $ | 68,257 | | | $ | 190,559 | |
| Distributable earnings | |
| Distributable earnings | |
(1) Prior to the final exchanges of the Continuing LCFH Limited Partners into Class A shares in the third quarter of 2020, we considered the Class A common shareholders of the Company and Continuing LCFH Limited Partners to have had fundamentally equivalent interests in our pre-tax earnings. Accordingly, for purposes of computing distributable earnings we start with pre-tax earnings and adjust for other noncontrolling interest in consolidated joint ventures, but we did not adjust for amounts attributable to noncontrolling interest held by Continuing LCFH Limited Partners. As of December 31, 2020, there are no remaining Continuing LCFH Limited Partners. Amount includes $16 thousand and $31 thousand of net income which are included in net (income) loss attributable to noncontrolling interest in operating partnership on the consolidated statements of income for the years ended December 31, 2020 and 2019, respectively. | | | | | | | | | | | | | | | | | | |
| |
| | | | | | | | |
| (1) | The following is a reconciliation of GAAP depreciation and amortization to our share of real estate depreciation, amortization and gain adjustments ($ in thousands): |
| | | | Year Ended |
| | | | | | December 31, | | December 31, |
| | | | | | 2023 | | 2022 |
| Total GAAP depreciation and amortization | | | | | $ | 29,914 | | | $ | 32,673 | |
| Less: Depreciation and amortization related to non-rental property fixed assets | | | | | (431) | | | (42) | |
| Less: Non-controlling interests in consolidated ventures’ share of depreciation and amortization and adjustment for passive interest in unconsolidated ventures | | | | | (1,068) | | | (1,943) | |
| Our share of real estate depreciation and amortization | | | | | 28,415 | | | 30,688 | |
| Realized gain from accumulated depreciation and amortization on real estate sold | | | | | (8,016) | | | (68,992) | |
| Less: Non-controlling interests in consolidated ventures’ share of accumulated depreciation and amortization on real estate sold | | | | | — | | | 10,879 | |
| Accumulated depreciation and amortization on real estate sold (a) | | | | | (8,016) | | | (58,113) | |
| Less: Our share of operating lease income on above/below market lease intangible amortization | | | | | (1,797) | | | (1,763) | |
| Our share of real estate depreciation, amortization and gain adjustments | | | | | $ | 18,602 | | | $ | (29,188) | |
| | | | | | | | |
| (a) GAAP gains/losses on sales of real estate include the effects of previously recognized real estate depreciation and amortization. For purposes of distributable earnings, our share of real estate depreciation and amortization is eliminated and, accordingly, the resultant gain/losses also must be adjusted. The following is a reconciliation of the related consolidated GAAP amounts to the amounts reflected in distributable earnings ($ in thousands): |
| | | | Year Ended |
| | | | | | December 31, | | December 31, |
| | | | | | 2023 | | 2022 |
| GAAP realized gain (loss) on sale of real estate, net | | | | | $ | 8,808 | | | $ | 115,998 | |
| Adjusted gain/loss on sale of real estate for purposes of distributable earnings | | | | | (792) | | | (57,885) | |
| Accumulated depreciation and amortization on real estate sold | | | | | $ | 8,016 | | | $ | 58,113 | |
| | | | | | | | |
| | | | | | | | |
| | | | | | | | | | | | | | | | | | | |
| (2) | The following is a reconciliation of GAAP depreciation and amortization to our share of real estate depreciation, amortization and gain adjustments presented in the computation of distributable earnings in the preceding table ($ in thousands): | |
| | | | | | | | | |
| | | | Year Ended December 31, | |
| | | | | | 2020 | | 2019 | |
| Total GAAP depreciation and amortization | | | | | $ | 39,079 | | | $ | 38,511 | | |
| Less: Depreciation and amortization related to non-rental property fixed assets | | | | | (99) | | | (99) | | |
| Less: Non-controlling interest in consolidated joint ventures’ share of accumulated depreciation and amortization and unrecognized passive interest in unconsolidated joint ventures | | | | | (2,377) | | | (2,836) | | |
| Our share of real estate depreciation and amortization | | | | | 36,603 | | | 35,576 | | |
| Realized gain from accumulated depreciation and amortization on real estate sold (refer to below) | | | | | (14,677) | | | (6,997) | | |
| Less: Non-controlling interest in consolidated joint ventures’ share of accumulated depreciation and amortization on real estate sold | | | | | 2,667 | | | 84 | | |
| Our share of accumulated depreciation and amortization on real estate sold | | | | | (12,010) | | | (6,913) | | |
| Less: Operating lease income on above/below market lease intangible amortization | | | | | (2,100) | | | (1,462) | | |
| Our share of real estate depreciation, amortization and gain adjustments | | | | | $ | 22,493 | | | $ | 27,201 | | |
| | | | | | | | | |
| GAAP gains/losses on sales of real estate include the effects of previously recognized real estate depreciation and amortization. For purposes of distributable earnings, our share of real estate depreciation and amortization is eliminated and, accordingly, the resultant gain/losses also must be adjusted. Following is a reconciliation of the related consolidated GAAP amounts to the amounts reflected in distributable earnings ($ in thousands): | |
| | | | | | | | | |
| | | | Year Ended December 31, | |
| | | | | | 2020 | | 2019 | |
| GAAP realized gain (loss) on sale of real estate, net | | | | | $ | 32,102 | | | $ | 1,392 | | |
| Adjusted gain/loss on sale of real estate for purposes of distributable earnings | | | | | (20,092) | | | 5,521 | | |
| Our share of accumulated depreciation and amortization on real estate sold | | | | | $ | 12,010 | | | $ | 6,913 | | |
| | | | | | | | | |
| | |
| | | | | | | | | |
| (3) | The following is a reconciliation of GAAP net results from derivative transactions to our unrecognized derivative result presented in the computation of distributable earnings in the preceding table ($ in thousands): | |
| | | | | | | | | |
| | | | Year Ended December 31, | |
| | | | | | 2020 | | 2019 | |
| Net results from derivative transactions | | | | | $ | (15,270) | | | $ | (30,011) | | |
| Hedging interest expense | | | | | 2,309 | | | 2,161 | | |
| Hedging realized result | | | | | 10,223 | | | 25,348 | | |
| Adjustments for unrecognized derivative results | | | | | $ | (2,738) | | | $ | (2,502) | | |
| | | | | | | | | |
| (4) | For the year ended December 31, 2020, the Company recorded a total CECL provision for loan loss of $18.3 million, of which $9.2 million was determined to be non-recoverable. The adjustment reflects the portion of such loan loss provision that management has determined to be recoverable. Prior to the January 1, 2020 implementation of CECL, all GAAP provisions for loan loss had been included in the computation of distributable earnings. | |
| (5) | The impact from COVID-19 included adjustments related to the unusual market conditions and actions taken by management in the second quarter of 2020 including: (a) $6.7 million of losses from sales of performing first mortgage loans included in sale of loans, net, (b) $15.4 million of losses from sales of CMBS, (c) $3.7 million of loss from conduit loan sales, (d) $6.5 million of prepayment penalties related to pay downs of mark-to-market debt included in interest expense, (e) $2.1 million of professional fee expenses included in operating expenses and (f) $0.2 million of severance costs included in salaries and employee benefits. The $34.5 million total of the preceding amounts was partially offset by (g) $19.0 million of gains from the repurchase of, and extinguishment of, unsecured corporate bond debt at a discount from par, net of (h) $1.5 million of accelerated premium amortization included in interest expense. The transactional adjustment includes one non-COVID-19 related item pertaining to $0.7 of income related to a tax settlement recognized in the fourth quarter of 2020. | |
| | |
(b)Set forth below is a reconciliation of the COVID-19 losses from sales of highly rated, relatively short duration CMBS in the second quarter of 2020 as referenced in (5) above ($ in thousands):
| | | | | | | | | | | | | | | | |
| | | Year Ended December 31, | |
| | | | | 2020 | | 2019 | |
| Loss on sale of securities - COVID-19 related | | | | | $ | (14,670) | | | $ | — | | |
| Hedge (loss) related to sale of securities, included in net results from derivative transactions | | | | | (698) | | | — | | |
| Losses from sales of CMBS | | | | | $ | (15,368) | | | $ | — | | |
(c)Set forth below is a reconciliation of the COVID-19 loss from conduit loan sales in the second quarter of 2020 as referenced in (5) above ($ in thousands):
| | | | | | | | | | | | | | | | |
| | | Year Ended December 31, | |
| | | | | 2020 | | 2019 | |
| Income from sales of loans, net - COVID-19 related | | | | | $ | (1,680) | | | $ | — | | |
| Hedge (loss) related to sales of loans, included in net results from derivative transactions | | | | | (1,994) | | | — | | |
| Losses from conduit loan sales | | | | | $ | (3,674) | | | $ | — | | |
| | | | | | | | |
| | | | | | | | | | | | | | | | | | |
| (2) | The following is a reconciliation of GAAP net results from derivative transactions to our derivative result presented in the computation of distributable earnings ($ in thousands): |
| | | | Year Ended |
| | | | | | December 31, | | December 31, |
| | | | | | 2023 | | 2022 |
| Net results from derivative transactions | | | | | $ | (1,481) | | | $ | (12,360) | |
| Hedging interest income (expense) | | | | | 1,220 | | | (1,652) | |
| Other hedging related activity (a) | | | | | 977 | | | 4,631 | |
| Adjustments for derivative results | | | | | $ | 716 | | | $ | (9,381) | |
| | | | | | | | |
| (a) Includes unrealized lower of cost or market adjustments of $0.5 million and $4.8 million for the year ended December 31, 2023 and December 31, 2022, respectively. |
| (3) | The adjustment reflects the portion of the loan loss provision that management determined to be recoverable. Additional provisions and releases of those provisions are excluded from distributable earnings as a result. |
Distributable earnings has limitations as an analytical tool. Some of these limitations are:
•Distributable earnings does not reflect the impact of certain cash charges resulting from matters we consider not to be indicative of our ongoing operations and is not necessarily indicative of cash necessary to fund cash needs; and
•Other companies in our industry may calculate distributable earnings differently than we do, limiting its usefulness as a comparative measure.
Because of these limitations, distributable earnings should not be considered in isolation or as a substitute for net income (loss) attributable to shareholders or any other performance measures calculated in accordance with GAAP, or as an alternative to cash flows from operations as a measure of our liquidity.
In addition, distributable earnings should not be considered to be the equivalent to REIT taxable income calculated to determine the minimum amount of dividends the Company is required to distribute to shareholders to maintain REIT status. In order for the Company to maintain its qualification as a REIT under the Code, we must annually distribute at least 90% of our REIT taxable income. The Company has declared, and intends to continue declaring, regular quarterly distributions to its shareholders in an amount approximating the REIT’s net taxable income.
In the future we may incur gains and losses that are the same as or similar to some of the adjustments in this presentation. Our presentation of distributable earnings should not be construed as an inference that our future results will be unaffected by unusual or non-recurring items.
Adjusted Leverage
We present adjusted leverage, which is a non-GAAP financial measure, as a supplemental measure of our performance. We define adjusted leverage as the ratio of (i) debt obligations, net of deferred financing costs, adjusted for non-recourse indebtedness related to securitizations that is consolidated on our GAAP balance sheet and liability for transfers not considered sales to (ii) GAAP total equity. We believe adjusted leverage assists investors in comparing our leverage across reporting periods on a consistent basis by excluding non-recourse debt related to securitized loans. In addition, adjusted leverage is used to determine compliance with financial covenants. (Refer to “Financing Strategy in Current Market Conditions” and “Financial Covenants” for further discussion about our compliance with covenants.)
Set forth below is an unaudited computation of adjusted leverage ($ in thousands):
| | | | | | | | | | | |
| December 31, 2020 | | December 31, 2019 |
| | | |
| Debt obligations, net | $ | 4,209,864 | | | $ | 4,859,873 | |
| | | |
| Less: CLO debt(1) | (276,516) | | | — | |
| | | |
| | | |
| Adjusted debt obligations | 3,933,348 | | | 4,859,873 | |
| Total equity | 1,548,425 | | | 1,638,977 | |
| Adjusted leverage | 2.5 | | | 3.0 | |
(1)As more fully discussed in Note 7 to our consolidated financial statements, we contributed $481.3 million of balance sheet loans into one CLO securitization that remains on our balance sheet for accounting purposes but should be excluded from debt obligations for adjusted leverage calculation purposes.
Item 7A. Quantitative and Qualitative Disclosures about Market Risk
For a discussion of current market conditions, resulting from the COVID-19 pandemic, refer to Part I,II, Item 2.7 “Management’s Discussion and Analysis of Financial Condition and Results of Operations” and to Part II, Item 1A. “Risk Factors”.
Interest Rate Risk
The nature of the Company’s business exposes it to market risk arising from changes in interest rates. Changes, both increases and decreases, in the rates the Company is able to charge its borrowers, the yields the Company is able to achieve in its securities investments, and the Company’s cost of borrowing directly impacts its net income. The Company’s net interest income includes interest from both fixed and floating-ratefloating rate debt. The percentage of the Company’s assets and liabilities bearing interest at fixed and floating rates may change over time, and asset composition may differ materially from debt composition. Another component of interest rate risk is the effect changes in interest rates will have on the market value of the assets the Company acquires. The Company faces the risk that the market value of its assets will increase or decrease at different rates than that of its liabilities, including its hedging instruments. The Company mitigates interest rate risk through utilization of hedging instruments, primarily interest rate swap and futures agreements. Interest rate swap and futures agreements are utilized to hedge against future interest rate increases on the Company’s borrowings and potential adverse changes in the value of certain assets that result from interest rate changes. The Company generally seeks to hedge assets that have a duration longer than five years, including newly originated conduit first mortgage loans, securities in the Company’s CMBS portfolio if long enough in duration, and most of its U.S. Agency Securitiessecurities portfolio.
The following table summarizes the change in net income for a 12-month period commencing December 31, 20202023 and the change in fair value of our investments and indebtedness assuming an increase or decrease of 100 basis points in the LIBORrelevant benchmark interest raterates on December 31, 2020,2023, both adjusted for the effects of our interest rate hedging activities ($ in thousands):
| | Projected change
in net income(1) | | Projected change
in portfolio
value |
| Projected change
in net income(1) | | | Projected change
in net income(1) | | Projected change
in portfolio
value |
| | Change in interest rate: | Change in interest rate: | | | |
| Change in interest rate: | |
| Change in interest rate: | |
| Decrease by 1.00% | |
| Decrease by 1.00% | |
| Decrease by 1.00% | Decrease by 1.00% | $ | (2,759) | | | $ | 6,466 | |
| Increase by 1.00% | Increase by 1.00% | 14,840 | | | (6,692) | |
(1) Subject to limits for floors on our floating rate investments and indebtedness.
Market Value Risk
As market volatility increases or liquidity decreases, the market value of the Company’s assets may be adversely impacted.
The Company’s securities investments are reflected at their estimated fair value. The change in estimated fair value of securities available-for-sale is reflected in accumulated other comprehensive income. The change in estimated fair value of Agency interest-only securities is recorded in current period earnings. The estimated fair value of these securities fluctuates primarily due to changes in interest rates and other factors. Generally, in a rising interest rate environment, the estimated fair value of these securities would be expected to decrease; conversely, in a decreasing interest rate environment, the estimated fair value of these securities would be expected to increase. As market volatility increases or liquidity decreases, the market value of the Company’s assets may be adversely impacted.
The Company’s fixed rate mortgage loan portfolio is subject to the same risks. However, to the extent those loans are classified as held for sale, they are reflected at the lower of cost or market. Otherwise, held for investment mortgage loans are reflected at values equal to the unpaid principal balances net of certain fees, costs and loan loss allowances.
TableConcentrations of Contentsmarket risk may exist with respect to the Company’s investments. Market risk is a potential loss the Company may incur as a result of change in the fair values of its investments. The Company may also be subject to risk associated with concentrations of investments in geographic regions and industries.Liquidity Risk
Market disruptions may lead to a significant decline in transaction activity in all or a significant portion of the asset classes in which the Company invests and may at the same time lead to a significant contraction in short-term and long-term debt and equity funding sources. A decline in liquidity of real estate and real estate-related investments, as well as a lack of availability
of observable transaction data and inputs, may make it more difficult to sell the Company’s investments or determine their fair values. As a result, the Company may be unable to sell its investments, or only be able to sell its investments at a price that may be materially different from the fair values presented. Also, in such conditions, there is no guarantee that the Company’s borrowing arrangements or other arrangements for obtaining leverage will continue to be available or, if available, will be available on terms and conditions acceptable to the Company. In addition, a decline in market value of the Company’s assets may have particular adverse consequences in instances where it borrowed money based on the fair value of its assets. A decrease in the market value of the Company’s assets may result in the lender requiring it to post additional collateral or otherwise sell assets at a time when it may not be in the Company’s best interest to do so. The Company’s captive insurance company subsidiary, Tuebor, is subject to state regulations which require that dividends may only be made with regulatory approval.approval, limiting the Company’s ability to utilize cash held by Tuebor.
Credit Risk
The COVID-19 pandemic has significantly impactedCompany is subject to varying degrees of credit risk in connection with its investments. The Company seeks to manage credit risk by performing deep credit fundamental analyses of potential assets and through ongoing asset management. The Company’s investment guidelines do not limit the commercial real estate markets, causing reduced occupancy, requests from tenants for rent deferral or abatement,amount of its equity that may be invested in any type of its assets; however, investments greater than a certain size are subject to approval by the Risk and delays in property renovations currently planned or underway. These negative conditions may persist into the future and impair borrowers’ ability to pay principal and interest due under our loan agreements. We maintain robust asset management relationships with our borrowers and have utilized these relationships to address the impactsUnderwriting Committee of the COVID-19 pandemic on our loans secured by properties experiencing cash flow pressure, most significantly hospitality assets. Someboard of our borrowers have indicated that due to the impact of the COVID-19 pandemic, they will be unable to timely execute their business plans, have had to temporarily close their businesses, or have experienced other negative business consequences and have requested temporary interest deferral or forbearance, or other modifications of their loans. Accordingly, we have discussed with our borrowers potential near-term defensive loan modifications, which could include repurposing of reserves, temporary deferrals of interest, or performance test or covenant waivers on loans collateralized by assets directly impacted by the COVID-19 pandemic, and which would typically be coupled with an additional equity commitment and/or guaranty from sponsors.directors.
Based on the limited loan modifications completed to date, we are encouraged by the tone of these conversations and our borrowers’ response to the COVID-19 pandemic’s impacts on their properties. We believe our loan sponsors are generally committed to supporting assets collateralizing our loans through additional equity investments. Our portfolio’s low weighted-average LTVweighted average loan-to-value, based on the loan balances and the “as-is” third-party Financial Institutions Reform, Recovery and Enforcement Act of 67.4%1989 (“FIRREA”) appraised values at origination, of 65.6% as of December 31, 20202023 reflects significant equity value that our sponsors are motivated to protect through periods of cyclical disruption. While we believe the principal amounts of our loans are generally adequately protected by underlying collateral value, there is a risk that we will not realize the entire principal value of certain investments.
Credit Spread Risk
Credit spread risk is the risk that interest rate spreads between two different financial instruments will change. In general, fixed-rate commercial mortgages and CMBS are priced based on a spread to Treasury or interest rate swaps. The Company generally benefits if credit spreads narrow during the time that it holds a portfolio of mortgage loans or CMBS investments, and the Company may experience losses if credit spreads widen during the time that it holds a portfolio of mortgage loans or CMBS investments. The Company actively monitors its exposure to changes in credit spreads and the Company may enter into credit total return swaps or take positions in other credit relatedcredit-related derivative instruments to moderate its exposure against losses associated with a widening of credit spreads.
Risks Related to Real Estate
Real estate and real estate-related assets, including loans and commercial real estate-related securities, are subject to volatility and may be affected adversely by a number of factors, including, but not limited to, national, regional and local economic conditions (which may be adversely affected by industry slowdowns and other factors); local real estate conditions; changes or continued weakness in specific industry segments; construction quality, age and design; demographic factors; environmental conditions; competition from comparable property types or properties; changes in tenant mix or performance and retroactive changes to building or similar codes and rent regulations. In addition, decreases in property values reduce the value of the collateral and the potential proceeds available to a borrower to repay the underlying loans, which could also cause the Company to suffer losses.
Covenant Risk
In the normal course of business, the Company enters into loan and securities repurchase agreements and credit facilities with certain lenders to finance its real estate investment transactions. These agreements contain, among other conditions, events of default and various covenants and representations. If such events are not cured by the Company or waived by the lenders, the lenders may decide to curtail or limit extension of credit, and the Company may be forced to repay its advances or loans. In addition, the Company’s Notes are subject to covenants, including maintenance of unencumbered assets, limitations on the incurrence of additional debt, restricted payments, liens, sales of assets, affiliate transactions and other covenants typical for financings of this type. The Company’s failure to comply with these covenants could result in an event of default, which could result in the Company being required to repay these borrowings before their due date.
We were in compliance with all covenants as described in this Annual Report as of December 31, 2020.2023.
Diversification Risk
The assets of the Company are concentrated in the commercial real estate sector. Accordingly, the investment portfolio of the Company may be subject to more rapid change in value than would be the case if the Company were to maintain a wide diversification among investments or industry sectors. Furthermore, even within the commercial real estate sector, the investment portfolio may be relatively concentrated in terms of geography and type of real estate investment. This lack of diversification may subject the investments of the Company to more rapid change in value than would be the case if the assets of the Company were more widely diversified.
Concentrations of Market Risk
Concentrations of market risk may exist with respect to the Company’s investments. Market risk is a potential loss the Company may incur as a result of change in the fair values of its investments. The Company may also be subject to risk associated with concentrations of investments in geographic regions and industries.
Regulatory Risk
Tuebor is subject to state regulation as a captive insurance company. If Tuebor fails to comply with regulatory requirements, theyit could be subject to loss of theirits licenses and registration and/or economic penalties.
Capital Market RisksEffective as of July 16, 2021, LCAM is a registered investment adviser under the Investment Advisors Act of 1940, as amended and currently provides investment advisory services solely to Ladder-sponsored collateralized loan obligation trusts (“CLO Issuers”). The CLO Issuers invest primarily in first mortgage loans secured by commercial real estate originated or acquired by Ladder and in participation interests in such loans. LCAM is entitled to receive a management fee connection with the advisory, administrative and monitoring services it performs for the CLO Issuer as the collateral manager; however, LCAM has waived this fee for so long as it or any of its affiliates serves as collateral manager for the CLO Issuers.
The COVID-19 pandemic resulted in extreme volatility in a varietyA registered investment adviser is subject to U.S. federal and state laws and regulations primarily intended to benefit its clients. These laws and regulations include requirements relating to, among other things, fiduciary duties to clients, maintaining an effective compliance program, solicitation agreements, conflicts of global markets,interest, record keeping and reporting requirements, disclosure requirements, custody arrangements, limitations on agency cross and principal transactions between an investment adviser and its advisory clients and general anti-fraud prohibitions. In addition, these laws and regulations generally grant supervisory agencies and bodies broad administrative powers, including the real estate-related debt markets. Atpower to limit or restrict us from conducting our advisory activities in the onsetevent we fail to comply with those laws and regulations. Sanctions that may be imposed for a failure to comply with applicable legal requirements include the suspension of individual employees, limitations on our engaging in various advisory activities for specified periods of time, disgorgement, the pandemic, U.S. financial markets, in particular, experienced limited liquidity, and forced selling by certain market participants to meet current obligations, which put further downward pressure on asset prices. In reaction to these volatile and unpredictable market conditions, banksrevocation of registrations, and other lenders restricted lending activitycensures and requested margin posting or repayments where applicable for secured loans collateralized by assets with depressed valuations. Ladder satisfied all margin calls on a timely basisfines.
We may become subject to additional regulatory and has since been rebated all of such margin. Refer to “Financing Strategy in Current Market Conditions“ for further disclosures surrounding liquiditycompliance burdens if our investment adviser subsidiary expands its product offerings and deleveraging actions completed during 2020. investment platform.
Item 8. Financial Statements and Supplementary Data
The consolidated financial statements of Ladder Capital Corp and the notes related to the foregoing consolidated financial statements are included in this Item.
Index to Consolidated Financial Statements
Report of Independent Registered Public Accounting Firm
To the Shareholders and the Board of Directors andShareholders of Ladder Capital Corp
OpinionsOpinion on the Financial Statements and Internal Control over Financial Reporting
We have audited the accompanying consolidated financialbalance sheets of Ladder Capital Corp (the Company) as of December 31, 2023 and 2022, the related consolidated statements includingof income, comprehensive income, changes in equity and cash flows for each of the two years in the period ended December 31, 2023, and the related notes as listed in the index appearing under Item 15(a)(1), and the financial statement schedules listed in the index appearing underIndex at Item 15(a)(2), of Ladder Capital Corp and its subsidiaries (the “Company”) (collectively referred to as the “consolidated financial statements”). We also have audited the Company's internal control over financial reporting as of December 31, 2020, based on criteria established in Internal Control - Integrated Framework (2013) issued by the Committee of Sponsoring Organizations of the Treadway Commission (COSO).
In our opinion, the consolidated financial statements referred to above present fairly, in all material respects, the financial position of the Company as ofat December 31, 20202023 and 2019,2022, and the results of its operations and its cash flows for each of the threetwo years in the period ended December 31, 20202023, in conformity with accounting principlesU.S. generally accepted accounting principles.
We also have audited, in accordance with the United Statesstandards of America. Also in our opinion, the Public Company maintained, in all material respects, effectiveAccounting Oversight Board (United States) (PCAOB), the Company's internal control over financial reporting as of December 31, 2020,2023, based on criteria established in Internal Control - IntegratedControl-Integrated Framework (2013) issued by the COSO.
Change in Accounting Principle
As discussed in Note 2 toCommittee of Sponsoring Organizations of the consolidated financial statements, the Company changed the manner in which it accounts for credit losses in 2020.Treadway Commission (2013 framework), and our report dated February 12, 2024 expressed an unqualified opinion thereon.
Basis for OpinionsOpinion
The Company's management is responsible for these consolidatedThese financial statements for maintaining effective internal control over financial reporting, and for its assessmentare the responsibility of the effectiveness of internal control over financial reporting, included in Management’s annual report on internal control over financial reporting appearing under Item 9A.Company's management. Our responsibility is to express opinionsan opinion on the Company’s consolidated financial statements and on the Company's internal control over financial reporting based on our audits. We are a public accounting firm registered with the Public Company Accounting Oversight Board (United States) (PCAOB)PCAOB and are required to be independent with respect to the Company in accordance with the U.S. federal securities laws and the applicable rules and regulations of the Securities and Exchange Commission and the PCAOB.
We conducted our audits in accordance with the standards of the PCAOB. Those standards require that we plan and perform the auditsaudit to obtain reasonable assurance about whether the consolidated financial statements are free of material misstatement, whether due to error or fraud, and whether effective internal control over financial reporting was maintained in all material respects.
fraud. Our audits of the consolidated financial statements included performing procedures to assess the risks of material misstatement of the consolidated financial statements, whether due to error or fraud, and performing procedures that respond to those risks. Such procedures included examining, on a test basis, evidence regarding the amounts and disclosures in the consolidated financial statements. Our audits also included evaluating the accounting principles used and significant estimates made by management, as well as evaluating the overall presentation of the financial statements. We believe that our audits provide a reasonable basis for our opinion.
Critical Audit Matter
The critical audit matter communicated below is a matter arising from the current period audit of the financial statements that was communicated or required to be communicated to the audit committee and that: (1) relates to accounts or disclosures that are material to the financial statements and (2) involved our especially challenging, subjective or complex judgments. The communication of the critical audit matter does not alter in any way our opinion on the consolidated financial statements. Ourstatements, taken as a whole, and we are not, by communicating the critical audit matter below, providing a separate opinion on the critical audit matter or on the accounts or disclosures to which it relates.
| | | | | |
| Allowance for Credit Losses |
| Description of the Matter | As of December 31, 2023, the Company’s mortgage loan receivables held for investment and the associated allowance for credit losses totaled $3.2 billion and $43.2 million, respectively. As disclosed in Notes 2 and 3 to the consolidated financial statements, the allowance for credit losses reflects the Company’s estimate of current expected credit losses (“CECL”) on the mortgage loan receivables held for investment, including unfunded loan commitments, over the life of the loans. The allowance for credit losses on mortgage loan receivables held for investment includes a portfolio-based and an asset-specific component. The Company uses a third-party probability of default and loss given default model (CECL model) that considers the likelihood of default and loss given default for each individual loan using loan-level data, selected forward-looking macroeconomic variables, fair value of the collateral, net operating income of the collateral and property-type mean loss rates to produce life of loan expected losses at the loan and portfolio level. Additionally, for collateral dependent loans, the Company may measure the expected losses based on the difference between the collateral’s fair value and the amortized cost basis of the loan. When the repayment or satisfaction of the loan is dependent on a sale, rather than operations of the collateral, the fair value is adjusted for the estimated costs to sell the collateral. To estimate the fair value of the collateral, the Company uses the direct capitalization rate valuation methodology, the discounted cashflow methodology or the sales comparison approach. |
| Auditing the allowance for credit losses on mortgage loan receivables held for investment is highly subjective due to the complexity of the models and the judgmental nature of the significant assumptions used in the determination of management’s estimates including certain macro-economic variables, fair value of the collateral, market capitalization rates, market discount rates and sales comparisons. |
| How We Addressed the Matter in Our Audit | We obtained an understanding, evaluated the design and tested the operating effectiveness of controls over the Company’s process to estimate the allowance for credit losses on its mortgage loan receivables held for investment, including management’s evaluation of the appropriateness of the CECL model, review of the significant assumptions described above, and the completeness and accuracy of key inputs used in both the CECL model, discounted cash flow model and direct capitalization model.
To test the allowance for credit losses, we performed audit procedures that included, among others, evaluating the methodology and the significant assumptions described above and testing the completeness and accuracy of the key inputs used. With the assistance of our internal specialists, we evaluated the appropriateness of the probability of default and loss given default methodology used to estimate the allowance and assessed the underlying macroeconomic variables used in the models. We reviewed the sensitivity analyses prepared by management and compared management’s significant assumptions to relevant information from external sources. For a sample of loans, we involved our internal specialists to assist us in reviewing the methodologies and significant assumptions used to derive management’s estimate of fair value of the collateral utilized in developing the allowance for credit losses.
|
/s/ Ernst & Young LLP
We have served as the Company’s auditor since 2022.
New York, New York
February 12, 2024
Report of Independent Registered Public Accounting Firm
To the Shareholders and the Board of Directors of Ladder Capital Corp
Opinion on Internal Control Over Financial Reporting
We have audited Ladder Capital Corp’s internal control over financial reporting as of December 31, 2023, based on criteria established in Internal Control—Integrated Framework issued by the Committee of Sponsoring Organizations of the Treadway Commission (2013 framework), (the COSO criteria). In our opinion, Ladder Capital Corp (the Company) maintained, in all material respects, effective internal control over financial reporting as of December 31, 2023, based on the COSO criteria.
We also have audited, in accordance with the standards of the Public Company Accounting Oversight Board (United States) (PCAOB), the 2023 consolidated financial statements of the Company and our report dated February 12, 2024 expressed an unqualified opinion thereon.
Basis for Opinion
The Company’s management is responsible for maintaining effective internal control over financial reporting and for its assessment of the effectiveness of internal control over financial reporting included in the accompanying Management’s annual report on internal control over financial reporting. Our responsibility is to express an opinion on the Company’s internal control over financial reporting based on our audit. We are a public accounting firm registered with the PCAOB and are required to be independent with respect to the Company in accordance with the U.S. federal securities laws and the applicable rules and regulations of the Securities and Exchange Commission and the PCAOB.
We conducted our audit in accordance with the standards of the PCAOB. Those standards require that we plan and perform the audit to obtain reasonable assurance about whether effective internal control over financial reporting was maintained in all material respects.
Our audit included obtaining an understanding of internal control over financial reporting, assessing the risk that a material weakness exists, and testing and evaluating the design and operating effectiveness of internal control based on the assessed risk. Our audits also includedrisk, and performing such other procedures as we considered necessary in the circumstances. We believe that our audits provideaudit provides a reasonable basis for our opinions.opinion.
Definition and Limitations of Internal Control overOver Financial Reporting
A company’s internal control over financial reporting is a process designed to provide reasonable assurance regarding the reliability of financial reporting and the preparation of financial statements for external purposes in accordance with generally accepted accounting principles. A company’s internal control over financial reporting includes those policies and procedures that (i)(1) pertain to the maintenance of records that, in reasonable detail, accurately and fairly reflect the transactions and dispositions of the assets of the company; (ii)(2) provide reasonable assurance that transactions are recorded as necessary to permit preparation of financial statements in accordance with generally accepted accounting principles, and that receipts and expenditures of the company are being made only in accordance with authorizations of management and directors of the company; and (iii)(3) provide reasonable assurance regarding prevention or timely detection of unauthorized acquisition, use, or disposition of the company’s assets that could have a material effect on the financial statements.
Because of its inherent limitations, internal control over financial reporting may not prevent or detect misstatements. Also, projections of any evaluation of effectiveness to future periods are subject to the risk that controls may become inadequate because of changes in conditions, or that the degree of compliance with the policies or procedures may deteriorate.
Critical Audit Matters/s/ Ernst & Young LLP
The critical audit matters communicated below are matters arising from the current period audit of the consolidated financial statements that were communicated or required to be communicated to the audit committee and that (i) relate to accounts or disclosures that are material to the consolidated financial statements and (ii) involved our especially challenging, subjective, or complex judgments. The communication of critical audit matters does not alter in any way our opinion on the consolidated financial statements, taken as a whole, and we are not, by communicating the critical audit matters below, providing separate opinions on the critical audit matters or on the accounts or disclosures to which they relate.
Valuation of the Asset-Specific Provision for Loan Losses
As described in Notes 2 and 3 to the consolidated financial statements, the Company’s consolidated mortgage loan receivables held for investment, at amortized cost were $2.35 billion, net of allowance for credit losses of $41.5 million, as of December 31, 2020. The provision for loan losses includes a portfolio-based, current expected credit loss (“CECL”) component and an asset-specific component of $20.1 million and $21.4 million, respectively. The portfolio-based component of the provision for loan losses is calculated using a credit loss model, which is a forward-looking, econometric, commercial real estate loss forecasting tool. The model is comprised of a probability of default model and a loss given default model that, layered together with loan-level data, selected forward-looking macroeconomic variables, and pool-level mean loss rates, produces life of loan expected losses at the loan and portfolio level. Where management has determined that the credit loss model does not fully capture certain external factors, including portfolio trends or loan-specific factors, a qualitative reserve is recorded. The asset-specific reserve component relates to reserves for losses on individually impaired loans. Management considers a loan to be impaired when it is deemed probable the Company will be unable to collect all amounts due according to the contractual terms of the loan agreement. If the loan is considered to be impaired, an allowance is recorded to reduce the carrying value of the loan to the present value of the expected future cash flows discounted at the loan’s effective rate, or the fair value of the collateral, less the estimated costs to sell, if recovery of the Company’s investment is expected solely from the collateral. Determining fair value of the collateral may take into account a number of assumptions including, but not limited to, cash flow projections, market capitalization rates, discount rates and recent comparable sales of similar properties. Such assumptions are generally based on current market conditions and are subject to economic and market uncertainties.
The principal considerations for our determination that performing procedures relating to the valuation of the asset-specific provision for loan losses is a critical audit matter are (i) the significant judgment by management in determining the fair value of the collateral of impaired loans for the asset-specific provision for loan losses, which in turn led to (ii) a high degree of auditor judgment, subjectivity, and effort in performing procedures and evaluating audit evidence relating to management’s significant assumptions related to market capitalization rates used to estimate the fair value of the collateral of impaired loans for the asset-specific provision for loan losses. Also, the audit effort involved the use of professionals with specialized skill and knowledge.
Addressing the matter involved performing procedures and evaluating audit evidence in connection with forming our overall opinion on the consolidated financial statements. These procedures included testing the effectiveness of controls relating to the valuation of the asset-specific provision for loan losses, including the significant assumptions related to market capitalization rates used to determine the fair value of the collateral for the asset-specific provision for loan losses. These procedures also included, among others (i) evaluating management’s process relating to the valuation of the asset- specific provision for loan losses, (ii) for a selection of individually impaired loans, evaluating the appropriateness of the methodologies used by management, (iii) testing the completeness and accuracy of the data, and (iv) for a selection of individually impaired loans, evaluating the reasonableness of the significant assumptions related to market capitalization rates by considering external market data. For a selection of individually impaired loans, professionals with specialized skill and knowledge were used to assist in evaluating (i) the appropriateness of methodologies used by management and (ii) the reasonableness of the significant assumptions related to market capitalization rates.February 12, 2024
Valuation
Report of Assets Acquired Through ForeclosureIndependent Registered Public Accounting Firm
As described
To the Board of Directors and Shareholders of Ladder Capital Corp
Opinion on the Financial Statements
We have audited the consolidated statements of income, comprehensive income, changes in Notes 2equity and 5cash flow of Ladder Capital Corp and its subsidiaries (the “Company”) for the year ended December 31, 2021, including the related notes as of December 31, 2021 (collectively referred to as the “consolidated financial statements”). In our opinion, the consolidated financial statements present fairly, in all material respects, the carrying valueresults of operations and cash flows of the Company’s consolidated real estate and related lease intangibles, net was $985.3 million, inclusive of $106.8 million of foreclosed properties, as ofCompany for the year ended December 31, 2020. The Company2021 in conformity with accounting principles generally acquires real estate assets or land and development assets through cash purchases and may also acquire such assets through foreclosure or deed-in-lieuaccepted in the United States of foreclosure in full or partial satisfaction of defaulted loans. The Company records real estate acquired through foreclosure at fair value. In estimating the fair value of the tangible and intangible assets acquired, management considers information obtained about each property as a result of its due diligence and marketing and leasing activities, and utilizes various valuation methods. These methods may include discounted cash flow models, for which assumptions including cash flow projections, discount and capitalization rates are used, or market comparable transactions, which require management judgment in determining the appropriateness of recent comparable sales of similar properties. Management may also use the ground lease approach for land valuation, which requires judgment in determining comparable ground leases and related capitalization rates.
America.
The principal considerations for our determination that performing procedures relating to the valuation of assets acquired through foreclosure is a critical audit matter are (i) the significant judgment by management to estimate the fair value of the assets acquired through foreclosure, which in turn led to (ii) a high degree of auditor judgment, subjectivity, and effort in performing procedures and evaluating audit evidence relating to management’s significant assumptions related to the appropriateness of recent comparable sales of similar properties. Also, the audit effort involved the use of professionals with specialized skill and knowledge.
Addressing
Basis for Opinion
These consolidated financial statements are the matter involvedresponsibility of the Company's management. Our responsibility is to express an opinion on the Company’s consolidated financial statements based on our audit. We are a public accounting firm registered with the Public Company Accounting Oversight Board (United States) (PCAOB) and are required to be independent with respect to the Company in accordance with the U.S. federal securities laws and the applicable rules and regulations of the Securities and Exchange Commission and the PCAOB.
We conducted our audit of these consolidated financial statements in accordance with the standards of the PCAOB. Those standards require that we plan and perform the audit to obtain reasonable assurance about whether the consolidated financial statements are free of material misstatement, whether due to error or fraud.
Our audit included performing procedures to assess the risks of material misstatement of the consolidated financial statements, whether due to error or fraud, and evaluating auditperforming procedures that respond to those risks. Such procedures included examining, on a test basis, evidence regarding the amounts and disclosures in connection with forming our overall opinion on the consolidated financial statements. These procedures included testing the effectiveness of controls relating to the valuation of assets acquired through foreclosure, including the significant assumptions related to the appropriateness of recent comparable sales of similar properties. These proceduresOur audit also included among others (i) evaluating management’s process relating to the valuation of assets acquired through foreclosure, (ii) evaluating the appropriatenessaccounting principles used and significant estimates made by management, as well as evaluating the overall presentation of the valuation methods used by management, (iii) testing the completeness and accuracy of the data, and (iv) evaluating the reasonableness of the comparable sales of similar properties assumptions. Professionals with specialized skill and knowledge were used to assist in evaluating (i) the appropriateness of valuation methods used by management and (ii) the reasonableness of the significant assumptions related to the appropriateness of recent comparable sales of similar properties.
/s/ PricewaterhouseCoopers LLP
New York, New York
February 25, 202111, 2022
We have served as the Company’s or its predecessor’sCompany's auditor since 2009.
Ladder Capital Corp
Consolidated Balance Sheets
(Dollars in Thousands)
| | | | | | | | | | | |
| | December 31, 2020(1) | | December 31, 2019(1) |
| | | |
| Assets | | | |
| Cash and cash equivalents | $ | 1,254,432 | | | $ | 58,171 | |
| Restricted cash | 29,852 | | | 297,575 | |
| Mortgage loan receivables held for investment, net, at amortized cost: | | | |
| Mortgage loans receivable | 2,354,059 | | | 3,257,036 | |
| | | |
| Allowance for credit losses | (41,507) | | | (20,500) | |
| Mortgage loan receivables held for sale | 30,518 | | | 122,325 | |
| Real estate securities | 1,058,298 | | | 1,721,305 | |
| | | |
| Real estate and related lease intangibles, net | 985,304 | | | 1,048,081 | |
| Investments in and advances to unconsolidated joint ventures | 46,253 | | | 48,433 | |
| FHLB stock | 31,000 | | | 61,619 | |
| Derivative instruments | 299 | | | 693 | |
| | | |
| Accrued interest receivable | 16,088 | | | 21,066 | |
| Other assets | 116,633 | | | 53,348 | |
| Total assets | $ | 5,881,229 | | | $ | 6,669,152 | |
| Liabilities and Equity | | | |
| Liabilities | | | |
| | | |
| Debt obligations, net | $ | 4,209,864 | | | $ | 4,859,873 | |
| | | |
| | | |
| | | |
| | | |
| | | |
| Dividends payable | 27,537 | | | 38,696 | |
| Accrued expenses | 43,876 | | | 72,397 | |
| Other liabilities | 51,527 | | | 59,209 | |
| Total liabilities | 4,332,804 | | | 5,030,175 | |
| Commitments and contingencies (Note 18) | 0 | | | — | |
| Equity | | | |
| | | |
| | | |
| | | |
| Class A common stock, par value $0.001 per share, 600,000,000 shares authorized; 126,852,765 and 110,693,832 shares issued and 126,378,715 and 107,509,563 shares outstanding | 127 | | | 108 | |
| Class B common stock, par value $0.001 per share, 100,000,000 shares authorized; 0 and 12,158,933 shares issued and outstanding | 0 | | | 12 | |
| Additional paid-in capital | 1,780,074 | | | 1,532,384 | |
| Treasury stock, 474,050 and 3,184,269 shares, at cost | (62,859) | | | (42,699) | |
| Retained earnings (dividends in excess of earnings) | (163,717) | | | (35,746) | |
| Accumulated other comprehensive income (loss) | (10,463) | | | 4,218 | |
| Total shareholders’ equity | 1,543,162 | | | 1,458,277 | |
| Noncontrolling interest in operating partnership | 0 | | | 172,054 | |
| Noncontrolling interest in consolidated joint ventures | 5,263 | | | 8,646 | |
| Total equity | 1,548,425 | | | 1,638,977 | |
| Total liabilities and equity | $ | 5,881,229 | | | $ | 6,669,152 | |
| | | | | | | | | | | |
| | December 31,
2023(1) | | December 31,
2022(1) |
| | | |
| Assets | | | |
| Cash and cash equivalents | $ | 1,015,678 | | | $ | 609,078 | |
| Restricted cash | 15,450 | | | 50,524 | |
| Mortgage loan receivables held for investment, net, at amortized cost: | | | |
| Mortgage loans receivable | 3,155,089 | | | 3,885,746 | |
| | | |
| Allowance for credit losses | (43,165) | | | (20,755) | |
| Mortgage loan receivables held for sale | 26,868 | | | 27,391 | |
| Securities | 485,533 | | | 587,519 | |
| | | |
| Real estate and related lease intangibles, net | 726,442 | | | 700,136 | |
| | | |
| Investments in and advances to unconsolidated ventures | 6,877 | | | 6,219 | |
| | | |
| Derivative instruments | 1,454 | | | 2,038 | |
| | | |
| Accrued interest receivable | 24,233 | | | 24,938 | |
| Other assets | 98,218 | | | 78,339 | |
| Total assets | $ | 5,512,677 | | | $ | 5,951,173 | |
| Liabilities and Equity | | | |
| Liabilities | | | |
| | | |
| Debt obligations, net | $ | 3,783,946 | | | $ | 4,245,697 | |
| | | |
| | | |
| | | |
| | | |
| | | |
| | | |
| Dividends payable | 32,294 | | | 32,000 | |
| Accrued expenses | 65,144 | | | 68,227 | |
| Other liabilities | 99,095 | | | 71,688 | |
| Total liabilities | 3,980,479 | | | 4,417,612 | |
| Commitments and contingencies (refer to Note 17) | — | | | — | |
| Equity | | | |
| Class A common stock, par value $0.001 per share, 600,000,000 shares authorized; 128,027,478 and 128,027,478 shares issued and 126,911,689 and 126,502,049 shares outstanding as of December 31, 2023 and December 31, 2022, respectively. | 127 | | | 127 | |
| | | |
| Additional paid-in capital | 1,756,750 | | | 1,826,833 | |
| Treasury stock, 1,115,789 and 1,525,429 shares, at cost | (12,001) | | | (95,600) | |
| Retained earnings (dividends in excess of earnings) | (197,875) | | | (177,005) | |
| Accumulated other comprehensive income (loss) | (13,853) | | | (21,009) | |
| Total shareholders’ equity | 1,533,148 | | | 1,533,346 | |
| | | |
| Noncontrolling interests in consolidated ventures | (950) | | | 215 | |
| Total equity | 1,532,198 | | | 1,533,561 | |
| Total liabilities and equity | $ | 5,512,677 | | | $ | 5,951,173 | |
(1)Includes amounts relating to consolidated variable interest entities. SeeRefer to Note 12 and Note 10.9.
TheRefer to the accompanying notes are an integral part of theseto consolidated financial statements.
Ladder Capital Corp
Consolidated Statements of Income
(Dollars in Thousands, Except Per Share and Dividend Data)
| | | | | | | | | | | | | | | | | | | | | |
| | | | Year Ended December 31, |
| | | | | | 2020 | | 2019 | | 2018 |
| | | | | | | | | |
| Net interest income | | | | | | | | | |
| Interest income | | | | | $ | 239,849 | | | $ | 330,235 | | | 344,816 | |
| Interest expense | | | | | 227,474 | | | 204,353 | | | 194,291 | |
| Net interest income | | | | | 12,375 | | | 125,882 | | | 150,525 | |
| Provision for (release of) loan loss reserves | | | | | 18,275 | | | 2,600 | | | 13,900 | |
| Net interest income (expense) after provision for (release of) loan losses | | | | | (5,900) | | | 123,282 | | | 136,625 | |
| | | | | | | | | |
| Other income (loss) | | | | | | | | | |
| Operating lease income | | | | | 100,248 | | | 106,366 | | | 106,177 | |
| | | | | | | | | |
| | | | | | | | | |
| Sale of loans, net | | | | | (1,571) | | | 54,758 | | | 16,511 | |
| Realized gain (loss) on securities | | | | | (12,410) | | | 14,911 | | | (5,808) | |
| Unrealized gain (loss) on equity securities | | | | | (132) | | | 1,737 | | | (1,605) | |
| Unrealized gain (loss) on Agency interest-only securities | | | | | 263 | | | 84 | | | 555 | |
| Realized gain (loss) on sale of real estate, net | | | | | 32,102 | | | 1,392 | | | 95,881 | |
| Impairment of real estate | | | | | 0 | | | (1,350) | | | 0 | |
| Fee and other income | | | | | 12,654 | | | 24,403 | | | 26,285 | |
| Net result from derivative transactions | | | | | (15,270) | | | (30,011) | | | 15,926 | |
| Earnings (loss) from investment in unconsolidated joint ventures | | | | | 1,821 | | | 3,432 | | | 790 | |
| | | | | | | | | |
| Gain (loss) on extinguishment/defeasance of debt | | | | | 22,250 | | | (1,070) | | | (4,392) | |
| Total other income (loss) | | | | | 139,955 | | | 174,652 | | | 250,320 | |
| Costs and expenses | | | | | | | | | |
| Salaries and employee benefits | | | | | 58,101 | | | 67,768 | | | 60,117 | |
| Operating expenses | | | | | 20,294 | | | 22,595 | | | 21,696 | |
| Real estate operating expenses | | | | | 28,584 | | | 23,323 | | | 29,799 | |
| Fee expense | | | | | 7,244 | | | 6,090 | | | 5,055 | |
| Depreciation and amortization | | | | | 39,079 | | | 38,511 | | | 41,959 | |
| Total costs and expenses | | | | | 153,302 | | | 158,287 | | | 158,626 | |
| Income (loss) before taxes | | | | | (19,247) | | | 139,647 | | | 228,319 | |
| Income tax expense (benefit) | | | | | (9,789) | | | 2,646 | | | 6,643 | |
| Net income (loss) | | | | | (9,458) | | | 137,001 | | | 221,676 | |
| Net (income) loss attributable to noncontrolling interest in consolidated joint ventures | | | | | (5,544) | | | 694 | | | (15,864) | |
| | | | | | | | | |
| Net (income) loss attributable to noncontrolling interest in operating partnership | | | | | 557 | | | (15,050) | | | (25,797) | |
| Net income (loss) attributable to Class A common shareholders | | | | | $ | (14,445) | | | $ | 122,645 | | | $ | 180,015 | |
| | | | | | | | | |
| The accompanying notes are an integral part of these consolidated financial statements. | | |
| | | | | | | | | |
| | | |
| | |
| | | | | Year Ended December 31, |
| | | | | | | | 2023 | | 2022 | | 2021 |
| | Net interest income | |
| Net interest income | |
| Net interest income | |
| Interest income | |
| Interest income | |
| Interest income | |
| Interest expense | |
| Net interest income (expense) | |
| Provision for (release of) loan loss reserves, net | |
| Net interest income (expense) after provision for (release of) loan loss reserves | |
| Other income (loss) | | Other income (loss) | | | | | | | |
| Real estate operating income | |
| | Net result from mortgage loan receivables held for sale | |
| | Net result from mortgage loan receivables held for sale | |
| | Net result from mortgage loan receivables held for sale | |
| Realized gain (loss) on securities | |
| Unrealized gain (loss) on securities | |
| | Realized gain (loss) on sale of real estate, net | |
| Realized gain (loss) on sale of real estate, net | |
| Realized gain (loss) on sale of real estate, net | |
| | Fee and other income | |
| Fee and other income | |
| Fee and other income | |
| Net result from derivative transactions | |
| Earnings from investment in unconsolidated ventures | |
| | Gain on extinguishment of debt | |
| Gain on extinguishment of debt | |
| Gain on extinguishment of debt | |
| Total other income (loss) | |
| Costs and expenses | | Costs and expenses | | | | | | | |
| Compensation and employee benefits | |
| Operating expenses | |
| Real estate operating expenses | |
| Investment related expenses | |
| Depreciation and amortization | |
| Total costs and expenses | |
| Income (loss) before taxes | |
| Income tax expense (benefit) | |
| Net income (loss) | |
| Net (income) loss attributable to noncontrolling interests in consolidated ventures | |
| | Net income (loss) attributable to Class A common shareholders | |
| | Net income (loss) attributable to Class A common shareholders | |
| | Net income (loss) attributable to Class A common shareholders | |
| | Earnings per share: | |
| | Earnings per share: | |
| | | | | Year Ended December 31, |
| | | | 2020 | | 2019 | | 2018 |
| | Earnings per share: | Earnings per share: | | | | | |
| Basic | Basic | | $ | (0.13) | | | $ | 1.16 | | | $ | 1.85 | |
| Basic | |
| Basic | |
| Diluted | Diluted | | $ | (0.13) | | | $ | 1.15 | | | $ | 1.84 | |
| | Weighted average shares outstanding: | Weighted average shares outstanding: | | | | | |
| Weighted average shares outstanding: | |
| Weighted average shares outstanding: | |
| Basic | |
| Basic | |
| Basic | Basic | | 112,409,615 | | | 105,455,849 | | | 97,226,027 | |
| Diluted | Diluted | | 112,409,615 | | | 106,399,783 | | | 97,652,065 | |
| | Dividends per share of Class A common stock | | $ | 0.940 | | | $ | 1.360 | | | $ | 1.535 | |
|
TheRefer to the accompanying notes are an integral part of theseto consolidated financial statements.
Ladder Capital Corp
Consolidated Statements of Comprehensive Income
(Dollars in Thousands)
| | | | | | Year Ended December 31, |
| | | | 2020 | | 2019 | | 2018 | | | Year Ended December 31, |
| | | | | | | 2023 | | 2022 | | 2021 |
| Net income (loss) | Net income (loss) | | $ | (9,458) | | | $ | 137,001 | | | $ | 221,676 | |
| | Other comprehensive income (loss) | Other comprehensive income (loss) | | | | | | | Other comprehensive income (loss) | | | | | | | |
| Unrealized gain (loss) on securities, net of tax: | Unrealized gain (loss) on securities, net of tax: | | | | | | | Unrealized gain (loss) on securities, net of tax: | | | | | | | |
| Unrealized gain (loss) on real estate securities, available for sale | | (28,618) | | | 24,678 | | | (8,205) | |
| Unrealized gain (loss) on securities, available for sale | |
| Reclassification adjustment for (gain) loss included in net income (loss) | Reclassification adjustment for (gain) loss included in net income (loss) | | 13,460 | | | (14,748) | | | 3,064 | |
| | Total other comprehensive income (loss) | Total other comprehensive income (loss) | | (15,158) | | | 9,930 | | | (5,141) | |
| Total other comprehensive income (loss) | |
| Total other comprehensive income (loss) | |
| | Comprehensive income (loss) | Comprehensive income (loss) | | (24,616) | | | 146,931 | | | 216,535 | |
| Comprehensive (income) loss attributable to noncontrolling interest in consolidated joint ventures | | (5,544) | | | 694 | | | (15,864) | |
| Comprehensive income (loss) of combined Class A common shareholders and Operating Partnership unitholders | | (30,160) | | | 147,625 | | | $ | 200,671 | |
| Comprehensive income (loss) | |
| Comprehensive income (loss) | |
| Comprehensive (income) loss attributable to noncontrolling interest in consolidated ventures | |
| | Comprehensive (income) loss attributable to noncontrolling interest in operating partnership | | 5,765 | | | (16,195) | | | (24,868) | |
| | Comprehensive income (loss) attributable to Class A common shareholders | Comprehensive income (loss) attributable to Class A common shareholders | | $ | (24,395) | | | $ | 131,430 | | | $ | 175,803 | |
| | Comprehensive income (loss) attributable to Class A common shareholders | |
| | Comprehensive income (loss) attributable to Class A common shareholders | |
TheRefer to the accompanying notes are an integral part of theseto consolidated financial statements.
Ladder Capital Corp
Consolidated Statements of Changes in Equity
(Dollars and Shares in Thousands)
| | Shareholders’ Equity | |
| Shareholders’ Equity | |
| Shareholders’ Equity | |
| Class A Common Stock | |
| | Class A Common Stock | | | Class A Common Stock | | | | Additional Paid- in-Capital | | Treasury Stock | | Retained Earnings (Dividends in Excess of Earnings) | | Accumulated Other Comprehensive Income (Loss) | | Noncontrolling Interests | | Total Equity |
| | Balance, December 31, 2022 | |
| Balance, December 31, 2022 | |
| Balance, December 31, 2022 | |
| | Distributions | |
| Distributions | |
| Distributions | |
| | Amortization of equity based compensation | |
| Amortization of equity based compensation | |
| Amortization of equity based compensation | |
| | Purchase of treasury stock | |
| | Purchase of treasury stock | |
| | Purchase of treasury stock | |
| Re-issuance of treasury stock | |
| Shares acquired to satisfy minimum required federal and state tax withholding on vesting restricted stock | |
| Forfeitures | |
| Dividends declared | |
| | | Shareholders’ Equity | |
| | Class A Common Stock | | Class B Common Stock | | Additional Paid- in-Capital | | Treasury Stock | | Retained Earnings (Dividends in Excess of Earnings) | | Accumulated Other Comprehensive Income (Loss) | | Noncontrolling Interests | | Total Equity |
| Shares | | Par | | Shares | | Par | | Operating Partnership | | Consolidated Joint Ventures | |
| | Balance, December 31, 2019 | 107,509 | | | $ | 108 | | | 12,160 | | | $ | 12 | | | $ | 1,532,384 | | | $ | (42,699) | | | $ | (35,746) | | | $ | 4,218 | | | $ | 172,054 | | | $ | 8,646 | | | $ | 1,638,977 | |
| Contributions | — | | | — | | | — | | | — | | | — | | | — | | | — | | | — | | | — | | | 860 | | | 860 | |
| Distributions | — | | | — | | | — | | | — | | | — | | | — | | | — | | | — | | | (6,698) | | | (9,787) | | | (16,485) | |
| | Amortization of equity based compensation | — | | | — | | | — | | | — | | | 42,728 | | | — | | | — | | | — | | | — | | | — | | | 42,728 | |
| Issuance of common stock | 4,000 | | | 4 | | | — | | | — | | | 31,996 | | | — | | | — | | | — | | | — | | | — | | | 32,000 | |
| | Issuance of Purchase Right | — | | | — | | | — | | | — | | | 8,425 | | | — | | | — | | | — | | | — | | | — | | | 8,425 | |
| Purchase of treasury stock | (384) | | | — | | | — | | | — | | | — | | | (3,035) | | | — | | | — | | | — | | | — | | | (3,035) | |
| Re-issuance of treasury stock | 4,423 | | | 4 | | | — | | | — | | | (4) | | | — | | | — | | | — | | | — | | | — | | | — | |
| Shares acquired to satisfy minimum required federal and state tax withholding on vesting restricted stock and units | (1,301) | | | (1) | | | — | | | — | | | — | | | (17,125) | | | — | | | — | | | — | | | — | | | (17,126) | |
| Forfeitures | (28) | | | — | | | — | | | — | | | — | | | — | | | — | | | — | | | — | | | — | | | — | |
| Dividends declared | — | | | — | | | — | | | — | | | — | | | — | | | (107,729) | | | — | | | — | | | — | | | (107,729) | |
| Net income (loss) | |
| | Exchange of noncontrolling interest for common stock | 12,159 | | | 12 | | | (12,160) | | | (12) | | | 165,788 | | | — | | | — | | | (6,952) | | | (158,613) | | | — | | | 223 | |
| | CECL adoption (refer to Note 3) | — | | | — | | | — | | | — | | | — | | | — | | | (5,797) | | | — | | | — | | | — | | | (5,797) | |
| | Net income (loss) | |
| | Net income (loss) | Net income (loss) | — | | | — | | | — | | | — | | | — | | | — | | | (14,445) | | | — | | | (557) | | | 5,544 | | | (9,458) | |
| Other comprehensive income (loss) | Other comprehensive income (loss) | — | | | — | | | — | | | — | | | — | | | — | | | — | | | (9,950) | | | (5,208) | | | — | | | (15,158) | |
| Rebalancing of ownership percentage between Company and Operating Partnership | — | | | — | | | — | | | — | | | (1,243) | | | — | | | — | | | 2,221 | | | (978) | | | — | | | — | |
| Balance, December 31, 2020 | 126,378 | | | $ | 127 | | | 0 | | | $ | 0 | | | $ | 1,780,074 | | | $ | (62,859) | | | $ | (163,717) | | | $ | (10,463) | | | $ | 0 | | | $ | 5,263 | | | $ | 1,548,425 | |
| Treasury stock cost basis reclassification (refer to Note 2) | |
| Balance, December 31, 2023 | |
TheRefer to the accompanying notes are an integral part of theseto consolidated financial statements.
Ladder Capital Corp
Consolidated Statements of Changes in Equity
(Dollars and Shares in Thousands)
| | Shareholders’ Equity | |
| Shareholders’ Equity | |
| Shareholders’ Equity | |
| Class A Common Stock | |
| | Class A Common Stock | | | Class A Common Stock | | | | Additional Paid- in-Capital | | Treasury Stock | | Retained Earnings (Dividends in Excess of Earnings) | | Accumulated Other Comprehensive Income (Loss) | | Noncontrolling Interests | | Total Equity |
| | | Shareholders’ Equity | |
| Balance, December 31, 2021 | |
| | Class A Common Stock | | Class B Common Stock | | Additional Paid- in-Capital | | Treasury Stock | | Retained Earnings (Dividends in Excess of Earnings) | | Accumulated Other Comprehensive Income (Loss) | | Noncontrolling Interests | | Total Equity |
| | | Shares | | Par | | Shares | | Par | | Additional Paid- in-Capital | | Treasury Stock | | Retained Earnings (Dividends in Excess of Earnings) | | Accumulated Other Comprehensive Income (Loss) | | Operating Partnership | | Consolidated Joint Ventures | | Total Equity |
| | Balance, December 31, 2018 | 103,941 | | | $ | 105 | | | 13,118 | | | $ | 13 | | | $ | 1,471,157 | | | $ | (32,815) | | | $ | 11,342 | | | $ | (4,649) | | | $ | 188,427 | | | $ | 10,055 | | | $ | 1,643,635 | |
| Balance, December 31, 2021 | |
| Contributions | Contributions | — | | | — | | | — | | | — | | | — | | | — | | | — | | | — | | | — | | | 498 | | | 498 | |
| Distributions | Distributions | — | | | — | | | — | | | — | | | — | | | — | | | — | | | — | | | (17,262) | | | (1,213) | | | (18,475) | |
| | Amortization of equity based compensation | Amortization of equity based compensation | — | | | — | | | — | | | — | | | 21,777 | | | — | | | — | | | — | | | — | | | — | | | 21,777 | |
| Amortization of equity based compensation | |
| Amortization of equity based compensation | |
| | Grants of restricted stock | |
| | Grants of restricted stock | |
| | Grants of restricted stock | Grants of restricted stock | 1,478 | | | 1 | | | — | | | — | | | (1) | | | — | | | — | | | — | | | — | | | — | | | — | |
| Purchase of treasury stock | Purchase of treasury stock | (40) | | | — | | | — | | | — | | | — | | | (637) | | | — | | | — | | | — | | | — | | | (637) | |
| Re-issuance of treasury stock | Re-issuance of treasury stock | 92 | | | — | | | — | | | — | | | — | | | — | | | — | | | — | | | — | | | — | | | — | |
| Shares acquired to satisfy minimum required federal and state tax withholding on vesting restricted stock and units | Shares acquired to satisfy minimum required federal and state tax withholding on vesting restricted stock and units | (526) | | | — | | | — | | | — | | | — | | | (9,247) | | | — | | | — | | | — | | | — | | | (9,247) | |
| Forfeitures | Forfeitures | (9) | | | — | | | — | | | — | | | — | | | — | | | — | | | — | | | — | | | — | | | — | |
| Dividends declared | Dividends declared | — | | | — | | | — | | | — | | | — | | | — | | | (145,910) | | | — | | | — | | | — | | | (145,910) | |
| Stock dividends | 1,434 | | | 1 | | | 181 | | | — | | | 23,822 | | | — | | | (23,823) | | | — | | | — | | | — | | | — | |
| | Exchange of noncontrolling interest for common stock | 1,139 | | | 1 | | | (1,139) | | | (1) | | | 16,449 | | | — | | | — | | | 65 | | | (16,109) | | | — | | | 405 | |
| | Net income (loss) | |
| | Net income (loss) | |
| | | Net income (loss) | Net income (loss) | — | | | — | | | — | | | — | | | — | | | — | | | 122,645 | | | — | | | 15,050 | | | (694) | | | 137,001 | |
| Other comprehensive income (loss) | Other comprehensive income (loss) | — | | | — | | | — | | | — | | | — | | | — | | | — | | | 8,785 | | | 1,145 | | | — | | | 9,930 | |
| Rebalancing of ownership percentage between Company and Operating Partnership | — | | | — | | | — | | | — | | | (820) | | | — | | | — | | | 17 | | | 803 | | | — | | | — | |
| Balance, December 31, 2019 | 107,509 | | | $ | 108 | | | 12,160 | | | $ | 12 | | | $ | 1,532,384 | | | $ | (42,699) | | | $ | (35,746) | | | $ | 4,218 | | | $ | 172,054 | | | $ | 8,646 | | | $ | 1,638,977 | |
| | Balance, December 31, 2022 | |
| Balance, December 31, 2022 | |
| Balance, December 31, 2022 | |
TheRefer to the accompanying notes are an integral part of theseto consolidated financial statements.
Ladder Capital Corp
Consolidated Statements of Changes in Equity
(Dollars and Shares in Thousands)
| | Shareholders’ Equity | |
| Shareholders’ Equity | |
| Shareholders’ Equity | |
| Class A Common Stock | |
| | Class A Common Stock | | | Class A Common Stock | | | | Additional Paid- in-Capital | | Treasury Stock | | Retained Earnings (Dividends in Excess of Earnings) | | Accumulated Other Comprehensive Income (Loss) | | Noncontrolling Interests | | Total Equity |
| | Balance, December 31, 2020 | |
| | Balance, December 31, 2020 | |
| | Balance, December 31, 2020 | |
| Contributions | |
| Distributions | |
| | Amortization of equity based compensation | |
| Amortization of equity based compensation | |
| Amortization of equity based compensation | |
| | Purchase of treasury stock | |
| | Purchase of treasury stock | |
| | Purchase of treasury stock | |
| Re-issuance of treasury stock | |
| Shares acquired to satisfy minimum required federal and state tax withholding on vesting restricted stock and units | |
| Forfeitures | |
| Dividends declared | |
| | | Shareholders’ Equity | |
| | Class A Common Stock | | Class B Common Stock | | Additional Paid- in-Capital | | Treasury Stock | | Retained Earnings (Dividends in Excess of Earnings) | | Accumulated Other Comprehensive Income (Loss) | | Noncontrolling Interests | | Total Equity |
| Shares | | Par | | Shares | | Par | | Operating Partnership | | Consolidated Joint Ventures | |
| | Balance, December 31, 2017 | 93,641 | | | $ | 94 | | | 17,668 | | | $ | 18 | | | $ | 1,306,136 | | | $ | (31,956) | | | $ | (39,112) | | | $ | (212) | | | $ | 240,861 | | | $ | 12,317 | | | $ | 1,488,146 | |
| Contributions | — | | | — | | | — | | | — | | | — | | | — | | | — | | | — | | | — | | | 7,604 | | | 7,604 | |
| Distributions | — | | | — | | | — | | | — | | | — | | | — | | | — | | | — | | | (20,353) | | | (25,730) | | | (46,083) | |
| | Amortization of equity based compensation | — | | | — | | | — | | | — | | | 8,831 | | | — | | | — | | | — | | | — | | | — | | | 8,831 | |
| Issuance of common stock | 5,800 | | | 6 | | | — | | | — | | | 99,000 | | | — | | | — | | | — | | | — | | | — | | | 99,006 | |
| Grants of restricted stock | 34 | | | — | | | — | | | — | | | — | | | — | | | — | | | — | | | — | | | — | | | — | |
| Net income (loss) | |
| | Shares acquired to satisfy minimum required federal and state tax withholding on vesting restricted stock and units | (58) | | | — | | | — | | | — | | | — | | | (859) | | | — | | | — | | | — | | | — | | | (859) | |
| Forfeitures | (26) | | | — | | | — | | | — | | | — | | | — | | | — | | | — | | | — | | | — | | | — | |
| Dividends declared | — | | | — | | | — | | | — | | | — | | | — | | | (129,561) | | | — | | | — | | | — | | | (129,561) | |
| | Offering costs | — | | | — | | | — | | | — | | | (499) | | | — | | | — | | | — | | | — | | | — | | | (499) | |
| Exchange of noncontrolling interest for common stock | 4,550 | | | 5 | | | (4,550) | | | (5) | | | 63,109 | | | — | | | — | | | (167) | | | (62,427) | | | — | | | 515 | |
| Net income (loss) | |
| | | Net income (loss) | Net income (loss) | — | | | — | | | — | | | — | | | — | | | — | | | 180,015 | | | — | | | 25,797 | | | 15,864 | | | 221,676 | |
| Other comprehensive income (loss) | Other comprehensive income (loss) | — | | | — | | | — | | | — | | | — | | | — | | | — | | | (4,211) | | | (930) | | | — | | | (5,141) | |
| Rebalancing of ownership percentage between Company and Operating Partnership | — | | | — | | | — | | | — | | | (5,420) | | | — | | | — | | | (59) | | | 5,479 | | | — | | | — | |
| Balance, December 31, 2018 | 103,941 | | | $ | 105 | | | 13,118 | | | $ | 13 | | | $ | 1,471,157 | | | $ | (32,815) | | | $ | 11,342 | | | $ | (4,649) | | | $ | 188,427 | | | $ | 10,055 | | | $ | 1,643,635 | |
| | Balance, December 31, 2021 | |
| Balance, December 31, 2021 | |
| Balance, December 31, 2021 | |
TheRefer to the accompanying notes are an integral part of theseto consolidated financial statements.
Ladder Capital Corp
Consolidated Statements of Cash Flows
(Dollars in Thousands)
| | | | | | | | | | | | | | | | | |
| | Year Ended December 31, |
| | 2020 | | 2019 | | 2018 |
| | | | | |
| Cash flows from operating activities: | | | | | |
| Net income (loss) | $ | (9,458) | | | $ | 137,001 | | | $ | 221,676 | |
| Adjustments to reconcile net income (loss) to net cash provided by (used in) operating activities: | | | | | |
| (Gain) loss on extinguishment/defeasance of debt | (22,250) | | | 1,070 | | | 4,392 | |
| Depreciation and amortization | 39,079 | | | 38,511 | | | 41,959 | |
| Unrealized (gain) loss on derivative instruments | 269 | | | (1,542) | | | (705) | |
| Unrealized (gain) loss on equity securities | 132 | | | (1,737) | | | 1,605 | |
| Unrealized (gain) loss on Agency interest-only securities | (263) | | | (84) | | | (555) | |
| Unrealized (gain) loss on investment in mutual fund | (158) | | | (405) | | | (156) | |
| Provision for (release of) loan loss reserves | 18,275 | | | 2,600 | | | 13,900 | |
| Impairment of real estate | 0 | | | 1,350 | | | 0 | |
| Amortization of equity based compensation | 42,728 | | | 21,777 | | | 8,831 | |
| Amortization of deferred financing costs included in interest expense | 18,730 | | | 10,987 | | | 10,906 | |
| Amortization of premium on mortgage loan financing | (1,160) | | | (1,584) | | | (1,023) | |
| Amortization of above- and below-market lease intangibles | (2,234) | | | (1,359) | | | (1,739) | |
| | | | | |
| Amortization of premium/(accretion) of discount and other fees on loans | (15,530) | | | (17,845) | | | (19,820) | |
| Amortization of premium/(accretion) of discount and other fees on securities | 526 | | | 217 | | | 3,124 | |
| Realized (gain) loss on sale of mortgage loan receivables held for sale | (8,026) | | | (54,758) | | | (16,511) | |
| Realized (gain) loss on sale of mortgage loan receivables held for investment | 9,596 | | | 0 | | | 0 | |
| Realized (gain) loss on disposition of loan | (98) | | | (2,250) | | | 0 | |
| Realized (gain) loss on securities | 13,136 | | | (14,911) | | | 5,808 | |
| Realized (gain) loss on sale of real estate, net | (32,102) | | | (1,392) | | | (95,881) | |
| | | | | |
| Realized gain on sale of derivative instruments | (108) | | | 84 | | | (242) | |
| Origination of mortgage loan receivables held for sale | (212,845) | | | (946,178) | | | (1,297,221) | |
| Purchases of mortgage loan receivables held for sale | 0 | | | (9,934) | | | 0 | |
| Repayment of mortgage loan receivables held for sale | 404 | | | 667 | | | 14,242 | |
| Proceeds from sales of mortgage loan receivables held for sale | 312,273 | | | 1,024,357 | | | 1,292,442 | |
| (Income) loss from investments in unconsolidated joint ventures in excess of distributions received | (1,821) | | | (3,432) | | | (790) | |
| Distributions from operations of investment in unconsolidated joint ventures | 0 | | | 3,317 | | | 1,250 | |
| Deferred tax asset (liability) | 94 | | | 4,814 | | | (7,525) | |
| | | | | |
| Changes in operating assets and liabilities: | | | | | |
| | | | | |
| | | | | |
| Accrued interest receivable | 4,895 | | | 5,556 | | | (1,339) | |
| Other assets | (8,778) | | | 1,502 | | | 3,369 | |
| Accrued expenses and other liabilities | (33,363) | | | (13,192) | | | 20,436 | |
| Net cash provided by (used in) operating activities | 111,943 | | | 183,207 | | | 200,433 | |
| | | | | | | | | | | | | | | | | |
| | Year Ended December 31, |
| | 2023 | | 2022 | | 2021 |
| Cash flows from operating activities: | | | | | |
| Net income (loss) | $ | 100,501 | | | $ | 165,305 | | | $ | 56,893 | |
| Adjustments to reconcile net income (loss) to net cash provided by (used in) operating activities: | | | | | |
| (Gain) loss on extinguishment of debt | (10,718) | | | (685) | | | — | |
| Depreciation and amortization | 29,914 | | | 32,673 | | | 37,801 | |
| Non-cash operating lease expense | 1,522 | | | — | | | — | |
| Unrealized (gain) loss on derivative instruments | 390 | | | (645) | | | (42) | |
| Unrealized (gain) loss on equity securities | (25) | | | 41 | | | — | |
| Unrealized (gain) loss on Agency interest-only securities | (4) | | | 45 | | | 91 | |
| | | | | |
| Provision for (release of) loan loss reserves | 25,096 | | | 3,711 | | | (8,713) | |
| | | | | |
| Amortization of equity based compensation | 18,577 | | | 31,584 | | | 15,300 | |
| Amortization of deferred financing costs included in interest expense | 12,428 | | | 15,565 | | | 21,530 | |
| Amortization of premium/discount on mortgage loan financing included in interest expense | (604) | | | (731) | | | (1,226) | |
| Amortization of above- and below-market lease intangibles | (1,797) | | | (1,763) | | | (1,888) | |
| | | | | |
| (Accretion)/amortization of discount, premium and other fees on loans | (19,046) | | | (20,759) | | | (13,832) | |
| (Accretion)/amortization of discount and premium on securities | (1,352) | | | (827) | | | 236 | |
| Net result from mortgage loan receivables held for sale | 523 | | | 2,511 | | | (8,398) | |
| | | | | |
| Realized (gain) loss on disposition of loan via foreclosure | — | | | — | | | 26 | |
| Realized (gain) loss on securities | 276 | | | 73 | | | (1,594) | |
| Realized (gain) loss on sale of real estate, net | (8,808) | | | (115,998) | | | (55,766) | |
| | | | | |
| Realized (gain) loss on sale of derivative instruments | 291 | | | (64) | | | — | |
| (Earnings) loss from investments in unconsolidated ventures in excess of distributions received | (658) | | | (785) | | | (1,462) | |
| Insurance proceeds for remediation work due to property damage | 473 | | | — | | | 2,092 | |
| Insurance proceeds used for remediation work due to property damage | (462) | | | (27) | | | (1,888) | |
| Origination of mortgage loan receivables held for sale | — | | | (61,318) | | | (220,359) | |
| | | | | |
| Repayment of mortgage loan receivables held for sale | — | | | 68 | | | 183 | |
| Proceeds from sales of mortgage loan receivables held for sale | — | | | 29,151 | | | 259,092 | |
| | | | | |
| | | | | |
| Change in deferred tax asset (liability) | 1,182 | | | (505) | | | 271 | |
| | | | | |
| Changes in operating assets and liabilities: | | | | | |
| | | | | |
| | | | | |
| Accrued interest receivable | 706 | | | (11,294) | | | 649 | |
| Other assets | 7,552 | | | 4,425 | | | 5,758 | |
| Accrued expenses and other liabilities | 24,647 | | | 36,959 | | | (5,015) | |
| Net cash provided by (used in) operating activities | 180,604 | | | 106,710 | | | 79,739 | |
| | | | | |
| Cash flows from investing activities: | | | | | |
| | | | | |
| Origination and funding of mortgage loan receivables held for investment | (68,415) | | | (1,234,765) | | | (2,309,888) | |
| Purchases of mortgage loan receivables held for investment | — | | | — | | | (63,600) | |
| Repayment of mortgage loan receivables held for investment | 738,464 | | | 909,766 | | | 1,103,614 | |
| Proceeds from sale of mortgage loan receivables held for investment | — | | | — | | | 46,557 | |
| Purchases of securities | (143,953) | | | (96,173) | | | (247,022) | |
| Repayment of securities | 232,124 | | | 184,838 | | | 164,494 | |
| Basis recovery of interest-only securities | 4,116 | | | 4,960 | | | 6,589 | |
| Proceeds from sales of securities | 17,838 | | | 5,780 | | | 438,594 | |
| | | | | | | | | | | | | | | | | |
| | Year Ended December 31, |
| | 2020 | | 2019 | | 2018 |
| | | | | |
| | | | | |
| Cash flows from investing activities: | | | | | |
| | | | | |
| Origination of mortgage loan receivables held for investment | (353,662) | | | (1,452,049) | | | (1,478,771) | |
| | | | | |
| Repayment of mortgage loan receivables held for investment | 891,705 | | | 1,639,101 | | | 1,411,862 | |
| Proceeds from sale of mortgage loan receivables held for investment, at amortized cost | 270,491 | | | 0 | | | 0 | |
| Purchases of real estate securities | (440,612) | | | (1,645,640) | | | (770,039) | |
| Repayment of real estate securities | 146,158 | | | 491,880 | | | 109,446 | |
| Basis recovery of Agency interest-only securities | 7,611 | | | 12,086 | | | 18,349 | |
| Proceeds from sales of real estate securities | 932,158 | | | 855,618 | | | 324,798 | |
| Purchases of real estate | (7,440) | | | (20,235) | | | (122,707) | |
| Capital improvements of real estate | (6,103) | | | (7,592) | | | (7,782) | |
| Proceeds from sale of real estate | 67,104 | | | 12,123 | | | 157,008 | |
| Capital contributions and advances to investment in unconsolidated joint ventures | 0 | | | (56,337) | | | (3,865) | |
| Capital distribution from investment in unconsolidated joint ventures | 4,002 | | | 48,514 | | | 0 | |
| | | | | |
| Capitalization of interest on investment in unconsolidated joint ventures | 0 | | | (142) | | | (1,507) | |
| Purchase of FHLB stock | 0 | | | (3,704) | | | 0 | |
| Proceeds from sale of FHLB stock | 30,619 | | | 0 | | | 20,000 | |
| Purchase of derivative instruments | (196) | | | (310) | | | (545) | |
| Sale of derivative instruments | 430 | | | 100 | | | 888 | |
| | | | | |
| | | | | |
| Net cash provided by (used in) investing activities | 1,542,265 | | | (126,587) | | | (342,865) | |
| Cash flows from financing activities: | | | | | |
| Deferred financing costs paid | (18,021) | | | (6,910) | | | (3,509) | |
| Proceeds from borrowings under debt obligations | 10,021,156 | | | 14,402,852 | | | 5,806,914 | |
| Repayment of borrowings under debt obligations | (10,614,556) | | | (14,022,875) | | | (5,681,604) | |
| Cash dividends paid to Class A common shareholders | (118,888) | | | (144,530) | | | (122,772) | |
| | | | | |
| | | | | |
| | | | | |
| | | | | |
| Capital distributed to noncontrolling interests in operating partnership | (6,698) | | | (17,262) | | | (20,353) | |
| Capital contributed by noncontrolling interests in consolidated joint ventures | 860 | | | 498 | | | 7,604 | |
| Capital distributed to noncontrolling interests in consolidated joint ventures | (9,787) | | | (1,213) | | | (25,730) | |
| | | | | |
| Payment of liability assumed in exchange for shares for the minimum withholding taxes on vesting restricted stock | (17,126) | | | (9,247) | | | (858) | |
| Purchase of treasury stock | (3,035) | | | (637) | | | 0 | |
| Issuance of common stock | 32,000 | | | 0 | | | 99,006 | |
| Common stock offering costs | 0 | | | 0 | | | (499) | |
| Issuance of Purchase Right | 8,425 | | | 0 | | | 0 | |
| Net cash provided by (used in) financing activities | (725,670) | | | 200,676 | | | 58,199 | |
| Net increase (decrease) in cash, cash equivalents and restricted cash | 928,538 | | | 257,296 | | | (84,233) | |
| Cash, cash equivalents and restricted cash at beginning of period | 355,746 | | | 98,450 | | | 182,683 | |
| Cash, cash equivalents and restricted cash at end of period | $ | 1,284,284 | | | $ | 355,746 | | | $ | 98,450 | |
| | | | | | | | | | | | | | | | | |
| | Year Ended December 31, |
| | 2023 | | 2022 | | 2021 |
| Purchases of real estate | — | | | — | | | (20,452) | |
| Capital improvements of real estate | (4,374) | | | (6,949) | | | (4,873) | |
| Proceeds from sale of real estate | 13,391 | | | 310,527 | | | 190,870 | |
| | | | | |
| Capital distribution from investment in unconsolidated ventures | — | | | 2,284 | | | 24,561 | |
| | | | | |
| | | | | |
| | | | | |
| Proceeds from FHLB stock | 4,410 | | | 2,250 | | | 19,165 | |
| Purchase of derivative instruments | (223) | | | (1,097) | | | (69) | |
| Sale of derivative instruments | 125 | | | 169 | | | — | |
| | | | | |
| | | | | |
| | | | | |
| Net cash provided by (used in) investing activities | 793,503 | | | 81,590 | | | (651,460) | |
| Cash flows from financing activities: | | | | | |
| Deferred financing costs paid | (3,378) | | | (8,311) | | | (3,221) | |
| Proceeds from borrowings under debt obligations | 921,008 | | | 2,426,666 | | | 4,519,064 | |
| Repayment and repurchase of borrowings under debt obligations | (1,348,093) | | | (2,412,961) | | | (4,493,566) | |
| | | | | |
| | | | | |
| | | | | |
| | | | | |
| | | | | |
| | | | | |
| | | | | |
| | | | | |
| | | | | |
| | | | | |
| | | | | |
| | | | | |
| | | | | |
| | | | | |
| Cash dividends paid to Class A common shareholders | (116,419) | | | (107,011) | | | (100,553) | |
| | | | | |
| | | | | |
| | | | | |
| | | | | |
| | | | | |
| Capital contributed by noncontrolling interests in consolidated ventures | — | | | 186 | | | 1,506 | |
| Capital distributed to noncontrolling interests in consolidated ventures | (541) | | | (29,541) | | | (783) | |
| Re-issuance of treasury stock | — | | | — | | | (1) | |
| Payment of liability assumed in exchange for shares for the minimum withholding taxes on vesting restricted stock | (7,862) | | | (11,356) | | | (4,457) | |
| Purchase of treasury stock | (2,481) | | | (7,916) | | | (9,007) | |
| Issuance of common stock | — | | | — | | | 1 | |
| | | | | |
| | | | | |
| Net cash provided by (used in) financing activities | (557,766) | | | (150,244) | | | (91,017) | |
| Net increase (decrease) in cash, cash equivalents and restricted cash | 416,341 | | | 38,056 | | | (662,738) | |
| Cash, cash equivalents and restricted cash at beginning of period | 659,602 | | | 621,546 | | | 1,284,284 | |
| Cash, cash equivalents and restricted cash at end of period | $ | 1,075,943 | | | $ | 659,602 | | | $ | 621,546 | |
| | | | | |
| Supplemental information: | | | | | |
| Cash paid for interest, net of amounts capitalized | $ | 233,637 | | | $ | 177,977 | | | $ | 173,128 | |
| Cash paid (received) for income taxes | (2,402) | | | (1,169) | | | (2,527) | |
| | | | | |
| Non-cash investing and financing activities: | | | | | |
| Securities and derivatives purchased, not settled | — | | | 2,953 | | | 18 | |
| Securities and derivatives sold, not settled | — | | | 10 | | | 10 | |
| | | | | |
| | | | | |
| | | | | |
| Repayment in transit of mortgage loans receivable held for investment (other assets) | 7,867 | | | 18,928 | | | 26,636 | |
| | | | | |
| Settlement of mortgage loan receivable held for investment by real estate, net | (91,408) | | | — | | | (81,129) | |
| | | | | |
| | | | | |
| | | | | |
| | | | | |
| | | | | |
| | | | | |
| | | | | |
| Real estate acquired in settlement of mortgage loan receivable held for investment, net | 87,526 | | | 9,386 | | | 81,750 | |
| | | | | |
| | | | | |
| Net settlement of sale of real estate, subject to debt - real estate | (31,292) | | | — | | | (29,827) | |
| Net settlement of sale of real estate, subject to debt - debt obligations | 31,292 | | | — | | | 29,827 | |
| Real estate acquired in former unconsolidated venture agreement | — | | | 15,436 | | | — | |
| Transfer of real estate, net into real estate held for sale | — | | | — | | | 25,179 | |
| | | | | |
| | | | | |
| | | | | |
| | | | | |
| | | | | |
| | | | | |
| | | | | |
| | | | | |
| | | | | |
| | | | | |
| | | | | |
| | | | | |
| | | | | |
| Dividends declared, not paid | 32,294 | | | 32,000 | | | 27,591 | |
| | | | | |
| | | | | |
| | | | | | | | | | | | | | | | | |
| | Year Ended December 31, |
| | 2020 | | 2019 | | 2018 |
| | | | | |
| Supplemental information: | | | | | |
| Cash paid for interest, net of amounts capitalized | $ | 202,939 | | | $ | 195,061 | | | $ | 183,215 | |
| Cash paid (received) for income taxes | 2,197 | | | 885 | | | 9,839 | |
| | | | | |
| Non-cash investing and financing activities: | | | | | |
| | | | | |
| | | | | |
| | | | | |
| Repayment in transit of mortgage loans receivable held for investment (other assets) | 69,649 | | | 0 | | | 106,205 | |
| | | | | |
| Settlement of mortgage loan receivable held for investment by real estate, net | (28,903) | | | (44,183) | | | 0 | |
| Transfer from mortgage loans receivable held for sale to mortgage loans receivable held for investment, net, at amortized cost | 0 | | | 45,832 | | | 55,403 | |
| | | | | |
| Proceeds from sale of real estate | 0 | | | 0 | | | 1,421 | |
| | | | | |
| | | | | |
| | | | | |
| | | | | |
| Real estate acquired in settlement of mortgage loan receivable held for investment, net | 29,310 | | | 84,356 | | | 0 | |
| Net settlement of sale of real estate, subject to debt - real estate | (31,768) | | | (11,943) | | | 0 | |
| Net settlement of sale of real estate, subject to debt - debt obligations | 31,768 | | | 11,943 | | | 0 | |
| | | | | |
| | | | | |
| Reduction in proceeds from sales of real estate | 0 | | | 0 | | | 62,417 | |
| Assumption of debt obligations by real estate buyer/defeasance of debt and related costs | 0 | | | 0 | | | (62,417) | |
| | | | | |
| | | | | |
| Exchange of noncontrolling interest for common stock | 158,625 | | | 16,110 | | | 62,433 | |
| Mortgage loan financing acquired in settlement of mortgage loan receivable held for investment, net | 0 | | | (33,904) | | | 0 | |
| Change in deferred tax asset related to exchanges of noncontrolling interest for common stock | 223 | | | 394 | | | 428 | |
| Increase in amount payable pursuant to tax receivable agreement | 0 | | | (11) | | | (86) | |
| Rebalancing of ownership percentage between Company and Operating Partnership | (978) | | | 803 | | | 5,480 | |
| Dividends declared, not paid | 27,537 | | | 38,696 | | | 37,316 | |
| Stock dividends | 0 | | | 23,823 | | | 0 | |
| | | | | |
The following table provides a reconciliation of cash, cash equivalents and restricted cash reported within the consolidated balance sheets that sum to the total of the same such amounts shown in the consolidated statement of cash flows ($ in thousands):
| | December 31, 2020 | | December 31, 2019 | | December 31, 2018 | |
| | December 31, 2023 | | | December 31, 2023 | | December 31, 2022 | | December 31, 2021 |
| Cash and cash equivalents | Cash and cash equivalents | $ | 1,254,432 | | | $ | 58,171 | | | $ | 67,878 | | |
| Restricted cash | Restricted cash | 29,852 | | | 297,575 | | | 30,572 | | |
| Short-term unsettled U.S. Treasury securities classified in other assets on the consolidated balance sheet | |
| Total cash, cash equivalents and restricted cash shown in the consolidated statement of cash flows | Total cash, cash equivalents and restricted cash shown in the consolidated statement of cash flows | $ | 1,284,284 | | | $ | 355,746 | | | $ | 98,450 | | |
Refer to the accompanying notes to consolidated financial statements.
The accompanying notes are an integral part of these consolidated financial statements.
Ladder Capital Corp
Notes to Consolidated Financial Statements
1. ORGANIZATION AND OPERATIONS
We areLadder Capital Corp (“Ladder,” “Ladder Capital,” and the “Company”) is an internally-managed real estate investment trust (“REIT”) that is a leader in commercial real estate finance. We originateThe Company originates and investinvests in a diverse portfolio of commercial real estate and real estate-related assets, focusing on senior secured assets. OurThe Company’s investment activities include: (i) ourthe Company’s primary business of originating senior first mortgage fixed and floating rate loans collateralized by commercial real estate with flexible loan structures; (ii) owning and operating commercial real estate, including net leased commercial properties; and (iii) investing in investment grade securities secured by first mortgage loans on commercial real estate; and (iii) owning and operating commercial real estate, including net leased commercial properties.estate. Ladder Capital Corp, as the general partner of Ladder Capital Finance Holdings LLLP (“LCFH,” “Predecessor”LCFH” or the “Operating Partnership”), operates the Ladder Capital business through LCFH and its subsidiaries. As of December 31, 2020,2023, Ladder Capital Corp has a 100.0%100% economic interest in LCFH and controls the management of LCFH as a result of its ability to appoint its board members. Accordingly, Ladder Capital Corp consolidates the financial results of LCFH and its subsidiaries. In addition, Ladder Capital Corp, through certain subsidiaries which are treated as taxable REIT subsidiaries (each a “TRS”), is indirectly subject to U.S. federal, state and local income taxes. Other than such indirect U.S. federal, state and local income taxes, there are no material differences between Ladder Capital Corp’s consolidated financial statements and LCFH’s consolidated financial statements.
Ladder Capital Corp was formed as a Delaware corporation on May 21, 2013. The Company conducted its initial public offering (“IPO”) which closed on February 11, 2014. The Company used the net proceeds from the IPO to purchase newly issuednewly-issued limited partnership units (“LP Units”) from LCFH. In connection with the IPO, Ladder Capital Corp also became a holding corporation and the general partner of, and obtained a controlling interest in, LCFH. Ladder Capital Corp’s only business is to act as the general partner of LCFH, and, as such, Ladder Capital Corp indirectly operates and controls all of the business and affairs of LCFH and its subsidiaries. The IPO transactions described herein are referred to as the “IPO Transactions.”
COVID-19 Impact on the Organization
On March 11, 2020, the World Health Organization declared the novel strain of coronavirus (“COVID-19”) a global pandemic and recommended containment and mitigation measures worldwide. As of the date of this filing, the majority of our employees continue to work remotely. We continue to actively manage the liquidity and operations of the Company in light of the market conditions and the overall financial impact of the COVID-19 pandemic across most industries in the United States. In view of the uncertainty related to the severity and duration of the pandemic, its ultimate impact on our revenues, profitability and financial position remains difficult to assess at this time. Refer to the Notes to the Consolidated Financial Statements for further disclosure on the current and potential impact of the COVID-19 global pandemic on our business.
2. SIGNIFICANT ACCOUNTING POLICIES
Basis of Presentation
The Company conducted a more extensive going concern analysis as a result of market conditions throughout the year ended December 31, 2020.
As the COVID-19 crisis evolved, management implemented a plan to increase liquidity resources and pay down debt. The Company maintained an unrestricted cash position of $1.3 billion as of December 31, 2020 to mitigate uncertainty in liquidity needs in light of market conditions. The Company was in compliance with all financial covenants as of December 31, 2020 (refer to Note 7, Debt Obligations, Net). As of March 31, 2020, partly as a result of maintaining higher levels of cash, the Company was not in compliance with its 3.5x covenant ratio with certain of its lenders; however, the Company cured such non-compliance through pay downs of debt with various counterparties during the cure period. Management continues to evaluate the Company’s liquidity under the current market conditions and expects that its current cash resources, operating cash flows and ability to obtain financing is sufficient to sustain operations for a period greater than one year from the issuance date of this Annual Report. As part of the Company’s actions implemented in direct response to the COVID-19 pandemic, for the three months ended June 30, 2020, the Company incurred an additional $2.1 million of professional fees, included in operating expenses, and $0.2 million of severance costs, included in salaries and employee benefits.
Basis of Accounting and Principles of Consolidation
The accompanying consolidated financial statements of the Company have been prepared in accordance with accounting principles generally accepted in the United States (“GAAP”).
The consolidated financial statements include the Company’s accounts and those of its subsidiaries whichthat are majority-owned and/or controlled by the Company and variable interest entities for which the Company has determined itself to be the primary beneficiary, if any. All significant intercompany transactions and balances have been eliminated.
Financial Accounting Standards Board (“FASB”) Accounting Standards Codification (“ASC”) Topic 810 — Consolidation (“ASC 810”), provides guidance on the identification of entities for which control is achieved through means other than voting rights (“variable interest entities” or “VIEs”) and the determination of which business enterprise, if any, should consolidate the VIEs. Generally, the consideration of whether an entity is a VIE applies when either: (1) the equity investors (if any) lack one or more of the essential characteristics of a controlling financial interest; (2) the equity investment at risk is insufficient to finance that entity’s activities without additional subordinated financial support; or (3) the equity investors have voting rights that are not proportionate to their economic interests and the activities of the entity involve or are conducted on behalf of an investor with a disproportionately small voting interest. The Company consolidates VIEs in which it is considered to be the primary beneficiary. The primary beneficiary is the entity that has both of the following characteristics: (1) the power to direct the activities that, when taken together, most significantly impact the VIE’s performance; and (2) the obligation to absorb losses and right to receive the returns from the VIE that would be significant to the VIE. SeeRefer to Note 10,9, Consolidated Variable Interest Entities, for further information on the Company’s consolidated variable interest entities. Investments in and advances to unconsolidated ventures represents the Company’s investment in Grace Lake LLC, a VIE. The Company determined that it was not the primary beneficiary of this VIE because the Company has a passive investment and no control of this entity and therefore does not have controlling financial interests in this VIE. The Company’s maximum exposure to loss is limited to its investment in the VIE. The Company has not provided financial support to this unconsolidated VIE that it was not previously contractually required to provide.
Use of Estimates
The preparation of the consolidated financial statements in conformity with accounting principles generally accepted in the United StatesGAAP requires management to make estimates and assumptions that affect the reported amounts of assets and liabilities and disclosure of contingent assets and liabilities at the dates of the balance sheets and the reported amounts of revenues and expenses during the reporting period. Actual results could differ from those estimates. Estimates and assumptions are reviewed periodically, and the effects of resulting changes are reflected in the consolidated financial statements in the period the changes are deemed to be necessary. Significant estimates made in the accompanying consolidated financial statements include, but are not limited to the following:
•valuation of real estate securities;
•valuation of mortgage loan receivables held for sale;
•valuation of real estate;
•allocation of purchase price for acquired real estate;estate, including real estate acquired via foreclosure;
•impairment, and useful lives, of real estate;
•useful lives of intangible assets;
•valuation of derivative instruments;
•valuation of deferred tax asset (liability);
•amounts payable pursuant to the Tax Receivable Agreement;
•determination of effective yield for recognition of interest income;
•adequacy of provision for loancurrent expected credit losses (“CECL”) including the valuation of underlying collateral for collateral-dependent loans;
•determination of other than temporary impairment of real estate securities and investments in and advances to unconsolidated joint ventures;
•certain estimates and assumptions used in the accrual of incentive compensation and calculation of the fair value of equity compensation issued to employees; and
•determination of the effective tax rate for income tax provision; and
•certain estimates and assumptions used in the allocation of revenue and expenses for our segment reporting.provision.
Cash and Cash Equivalents
The Company considers all investments with original maturities of three months or less, at the time of acquisition, to be cash equivalents. The Company maintains cash accounts at several financial institutions, which are insured up to a maximum of $250,000 per account as of December 31, 20202023 and 2019.December 31, 2022. At December 31, 20202023 and 2019,December 31, 2022, and at various times during the years, the balances exceeded the insured limitslimits.
Restricted Cash
Restricted cash primarily consists of deposits related to real estate, which include tenant security deposits. Restricted cash also includes accounts the Company maintains with brokers to facilitate financial derivative and repurchase agreement transactions in support of its loan and securities investments and risk management activities. Based on the value of the positions in these accounts and the associated margin requirements, the Company may be required to deposit additional cash into these broker accounts. The cash collateral held by broker is considered restricted cash. Restricted cash also includes tenant security deposits, deposits related to real estate sales and acquisitions and required escrow balances on credit facilities.
Mortgage Loan Receivables Held for Investment
Loans for which the Company has the intention and ability to hold for the foreseeable future, or until maturity or payoff, are reported at their outstanding principal balances net of any unearned income, unamortized deferred fees or costs, premiums or discounts and an allowance for credit losses. Loan origination fees and direct loan origination costs are deferred and recognized in interest income over the estimated life of the loans using the effective interest method, adjusted for actual prepayments. Upon the decision to sellmarket such loans, the Company will evaluate if the loan meets held for sale criteria and then will transfer the loan from mortgage loan receivables held for investment to mortgage loan receivables held for sale at the lower of carrying value or fair value on the consolidated balance sheets.
ProvisionAllowance for Loan Losses
The Company uses a current expected credit loss model (“CECL”) for estimating the provision for loan losses on its loan portfolio. The CECL model requires the consideration of possible credit losses over the life of an instrument and includes a portfolio-based component and an asset-specific component. In compliance with the CECL reporting requirements, theThe Company supplemented its existing credit monitoring and management processes with additional processes to support the calculation of the CECL reserves. As part of that effort, the Company has engagedengages a third-party service provider to provide market data and a credit loss model. The credit loss model is a forward-looking, econometric, commercial real estate (“CRE”)
loss forecasting tool. It is comprised of a probability of default (“PD”) model and a loss given default (“LGD”) model that, layered together with user’sthe Company’s loan-level data, fair value of collateral, net operating income of collateral, selected forward-looking macroeconomic variables, and pool-levelproperty-type mean loss rates, produces life of loan expected losses (“EL”) at the loan and portfolio level. Where management has determined that the credit loss model does not fully capture certain external factors, including portfolio trends or loan-specific factors, a qualitative adjustment to the reserve, is recorded. In addition, interest receivable on loans is not included in the Company’s CECL calculations as the Company performs timely write off of aged interest receivable. The Company has made a policy election to write off aged receivables through interest income as opposed to through the CECL model was implemented in 2020. Given prior period loss models wereprovision on its statements of income.
Loans for which the borrower or sponsor is experiencing financial difficulty, and where repayment of the loan is expected substantially through the operation or sale of the underlying collateral, are considered collateral dependent loans.
For collateral dependent loans, the Company may elect a practical expedient which allows the Company to measure expected losses based on the incurred loss model, management notes that prior periods are not measured on a comparable basis.
The asset-specific reserve component relates to reserves for losses on individually impaired loans. The Company evaluates each loan for impairment at least quarterly. Impairment occurs when it is deemed probable thatdifference between the Company will not be able to collect all amounts due according tocollateral’s fair value and the contractual termsamortized cost basis of the loan. IfWhen the repayment or satisfaction of the loan is considered to be impaired, an allowance is recorded to reduce the carrying valuedependent on a sale, rather than operations of the loan to the present value of the expected future cash flows discounted at the loan’s effective rate orcollateral, the fair value of the collateral, lessis adjusted for the estimated costs to sell if recovery of the Company’s investment is expected solely from the collateral. If foreclosure is probable, the Company is required to measure for expected losses using this methodology.
The Company may use the direct capitalization rate valuation methodology, the discounted cash flow methodology, or the sales comparison approach to estimate the fair value of the collateral for suchcollateral dependent loans and in certain cases will obtain external appraisals and take into account potential sale bids. Determining fair value of the collateral may take into account a number of assumptions including, but not limited to, cash flow projections, market capitalization rates, discount rates and data regarding recent comparable sales of similar properties. Such assumptions are generally based on current market conditions and are subject to economic and market uncertainties.
The Company’s loans are typically collateralized by real estate directly or indirectly. As a result, the Company regularly evaluates the extent and impact of any credit deterioration associated with the performance and/or value of the underlying collateral property as well as the financial and operating capability of the borrower/sponsor on a loan-by-loan basis. Specifically, a property’s operating results and any cash reserves are analyzed and used to assessassess: (i) whether cash flow from operations is sufficient to cover the debt service requirements currently and into the future,future; (ii) the ability of the borrower to refinance the loan at maturity,maturity; and/or (iii) the property’s liquidation value. The Company also evaluates the financial wherewithal of any loan guarantors as well as the borrower’s competency in managing and operating the properties. In addition, the Company considers the overall economic environment, real estate sector, and geographic submarket in which the collateral property is located. Such impairment analyses are completed and reviewed by asset management and underwriting personnel, who utilize various data sources, includingincluding: (i) periodic financial data such as property occupancy, tenant profile, rental rates, operating expenses, the borrowers’ business plan, and capitalization and discount rates,rates; (ii) site inspections,inspections; and (iii) current credit spreads and other market data and ultimately presented to management for approval.
A loan is also considered impaired if its terms are modified inWhen a troubled debt restructuring (“TDR”). A TDR occurs when a concession is granted and the debtor is experiencing financial difficulties. Impairments on TDR loans are generally measured based ondifficulties and a loan is modified, the present value of expected future cash flows discounted at the effective interest rateeffect of the original loans.modification will be included in the Company’s assessment of the CECL allowance for loan losses. If the Company provides principal forgiveness, the amortized cost basis of the loan is written off against the allowance for loan losses. Generally, when granting concessions,modifying loans, the Company will seek to protect its position by requiring incremental pay downs, additional collateral or guarantees and, in some cases, lookback features or equity interests to offset concessionsthe effects of modifications granted should conditions impacting the loan improve. The Company’s determination of credit losses is impacted by TDRs whereby loans that have gone through TDRs are considered impaired and are assessed for specific reserves. Loans previously restructured under TDRs that subsequently default are reassessed to incorporate the Company’s current assumptions on expected cash flows and additional provision expense is recorded to the extent necessary.
The Company designates a loan as a non-accrual loansloan generally whenwhen: (i) the principal or coupon interest components of loan payments become 90-days past duedue; or (ii) in the opinion of the Company, it is doubtful the Company will be able to collect all amountsprincipal and coupon interest due according to the contractual terms of the loan. Interest income on non-accrual loans in which the Company reasonably expects a full recovery of the loan’s outstanding principal balance is recognized when received in cash. Otherwise, income recognition will be suspended and any cash received will be applied as a reduction to the amortized cost.cost basis. A non-accrual loan is returned to accrual status at such time as the loan becomes contractually current and future principal and coupon interest are reasonably assured to be received in accordance with the contractual loan terms. A loan will be written off when management has determined itprincipal and coupon interest is no longer realizable and deemed non-recoverable.
Mortgage Loan Receivables Held for Sale
Mortgage loan receivables held for sale are first mortgage loans that are secured by cash-flowing commercial real estate and are available for sale to securitizations. Mortgage loan receivables held for sale are recorded at lower of cost or market value on an individual basis.
Real Estate
Securities
The Company classifies its real estate securities investments on the date of acquisition of the investment. Real estate securities
Securities that the Company does not hold for the purpose of selling in the near-term, but may dispose of prior to maturity, are designated as available-for-sale and are carried at estimated fair value with the net unrealized gains or losses on all securities, except for recorded as a component of other comprehensive income (loss) in shareholders’ equity.
Government National Mortgage Association (“GNMA”) interest-only and Federal Home Loan Mortgage Corp (“FHLMC”) interest-only securities (collectively, “Agency interest-only securities”) and equity securities, recorded as a componentare carried at estimated fair value with changes in fair value recognized in earnings in the consolidated statements of other comprehensive income (loss) in shareholders’ equity. income.
As more fully described in Note 4, Securities, certain securities whichthat were purchased from the LCCM LC-26 securitization trust are designated as risk retention securities under the Dodd-Frank Wall Street Reform and Consumer Protection Act of 2010, as amended (“Dodd-Frank Act”) which are subject to transfer restrictions over the term of the securitization trust and are classified as held-to-maturity and reported at amortized cost.
The Company’s Agency interest-only securities are considered to be hybrid financial instruments that contain embedded derivatives. As a result, the Company accounts for them as hybrid instruments in their entirety at fair value with changes in fair value recognized in earnings in the consolidated statements of income in accordance with ASC 815. income.
The Company’s recognition of interest income from its Agency interest-only and all other securities, including effective interest from amortization of premiums, follows the Company’s Revenue Recognition policy, as disclosed within this Note for recognizing interest income on its securities. The interest income recognized from the Company’s Agency interest-only securities is recorded in interest income on the consolidated statements of income.
The Company uses the specific identification method when determining the cost of securities sold and the amount of gain (loss) on securities recognized in earnings. The Company accounts for the changes in the fair value of the unfunded portion of its GNMA Construction securities, which are included in real estate securities, available-for-sale, on the consolidated balance sheet, as available for sale securities. Unrealized losses on securities are evaluated by management to determine if the decline in fair value below the amortized cost basis is due to credit-related factors or noncredit-related factors, any impairment that is not credit-related is recognized in the judgment of management, are other than temporary are charged againstcomprehensive income, whereas any credit-related loss is recognized currently in earnings as a loss in the consolidated statements of income.
Equity securities are classified as available-for-sale. The Company has elected the fair market value option for accounting for these equity securities and changes in fair value are recorded in current period earnings.
When the estimated fair value of an available-for-sale security is less than amortized cost, the Company will consider whether there is an other-than-temporary impairment in the value of the security. An impairment will be considered other-than-temporary based on consideration of several factors, includingincluding: (i) if the Company intends to sell the security,security; (ii) if it is more likely than not that the Company will be required to sell the security before recovering its cost,cost; or (iii) the Company does not expect to recover the security’s cost basis (i.e., a credit loss)loss exists). A credit loss will have occurred if the present value of cash flows expected to be collected from the debt security is less than the amortized cost basis. If the Company intends to sell an impaired debt security or it is more likely than not that it will be required to sell the security before recovery of its amortized cost basis less any current period credit loss, the cost basis of the security will be written down to fair value, and the related impairment is other-than-temporary and will be recognized currently in earnings equal to the entire difference between fair value and amortized cost.earnings. If a credit loss exists, but the Company does not intend to, nor is it more likely than not that it will be required to sell before recovery, the impairment is other-than-temporary and will be separated intointo: (i) the estimated amount relating to the credit loss,loss; and (ii) the amount relating to all other factors. OnlyThe amount of the estimatedimpairment relating to credit loss amountlosses will be recognized as an allowance for credit losses, which is recognized currentlya contra-asset and a reduction in earnings, with the remainder of the loss recognized in other comprehensive income.
Estimating cash flows and determining whether there is other-than-temporary impairment requirerequires management to exercise judgment and make significant assumptions, including, but not limited to, assumptions regarding estimated prepayments, loss assumptions, and assumptions regarding changes in interest rates. As a result, actual impairment losses, and the timing of income recognized on these securities, could differ from reported amounts.
For cash flow statement purposes, receipts of interest from interest-only real estate securities are bifurcated between amortization of premium/(accretion) of discount and other fees on securities as part of cash flows from operations and basis recovery of Agency interest-onlyinterest only securities as part of cash flows from investing activities.
The Company utilizes an internal model as its primary pricing source to develop its prices for its commercial mortgage-backed securities (“CMBS”)CMBS and other commercial real estate securities guaranteed by a U.S. governmental agency or by a government sponsored entity (together, “U.S. Agency Securities”securities”). Different judgments and assumptions could result in materially different estimates of fair value. To confirm its own valuations, the Company requests prices for each of its CMBS and U.S. Agency Securitiessecurities investments from threefour different sources, including third parties that provide pricing services and brokers, although since broker quotes for the same or similar securities in which Ladder has invested are non-binding, the Company does not consider them to be a primary source for
valuation. The Company may also develop a price for a security based on its direct observations of market activity and other observations. Typically, at least two prices per security are obtained.
Prior to using a third-party pricing service for valuation, theThe Company develops an understanding of the valuation methodologies used by suchthird-party pricing services through discussions with their representatives and review of their valuation methodologies used for different types of securities. The Company understands that the pricing services develop estimates of fair value for CMBS and U.S. Agency Securitiessecurities using various techniques, including discussion with their internal trading desks, proprietary models and matrix pricing approaches. The Company does not have access to, and is therefore not able to review in detail, the inputs used by the pricing services in developing their estimates of fair value. However, on at least a monthly basis as part of our closing process, the Company evaluates the fair value information provided by the pricing services by comparing this information for reasonableness against its direct observations of market activity for similar securities and anecdotal information obtained from market participants that, in its assessment, is relevant to the determination of fair value. This process may result in the Company “challenging” the estimate of fair value for a security if it is unable to reconcile the estimate provided by the pricing service with its assessment of fair value for the security. Accordingly, in following this approach, the Company’s objective is to ensure that the information used by pricing services in their determination of fair value of securities is reasonable and appropriate.
Since inception, the Company has not encountered significant variation in the values obtained from the various pricing sources. In the extremely limited occasions where the prices received were challenged, the challenge resulted in the prices provided by the pricing services being updated to reflect current market updates or cash flow assumptions.
Real Estate
The Company generally acquires real estate assets or land and development assets through cash purchases and may also acquire such assets through foreclosure or deed-in-lieu of foreclosure in full or partial satisfaction of defaulted loans. Based on the Company’s strategic plan to realize the maximum value from the real estate acquired, properties are either classified as Real estate, net or Real estate held for sale in the consolidated balance sheets. When the Company intends to hold, operate or develop the property for a period of at least 12 months, assets are classified as Real estate, net, and whennet. If the Company intends to market these properties for sale in the near term, assets are evaluated against the held for sale criteria and then may be classified as Realreal estate held for sale in the consolidated balance sheets. The Company records acquired real estate at cost and makes assessments as to the useful lives of depreciable assets. The Company records real estate acquired through foreclosure at fair value. The Company considers the period of future benefit of the asset to determine its appropriate useful lives. Depreciation is computed using a straight-line method over the estimated useful life of 20 to 55 years for buildings, four to 15 years for building fixtures and improvements and the remaining lease term for acquired intangible lease assets.assets or liabilities.
The Company classifies most of its investments in real estate as held and used. The Company measures and records a property that is classified as held and used at its carrying amount, adjusted for any depreciation expense and impairments, as applicable and are included in Real estate, net in the consolidated balance sheets.
Certain of the Company’s real estate is leased to others on a net lease basis where the tenant is generally responsible for payment of real estate taxes, property, building and general liability insurance and property and building maintenance. These leases are for fixed terms of varying length and provide for annual rentals. Rental income from leases is recognized on a straight-line basis over the term of the respective leases. The cumulative excess of rents recognized over amounts contractually due pursuant to the underlying leases are included in unbilled rent receivable within other assets in the consolidated balance sheets.
Allocation of Purchase Price for Acquired Real Estate
Upon acquisition of rental property,real estate, the Company estimates the fair value of acquired tangible assets, consisting of land, building and improvements, and identified intangible assets and liabilities assumed, generally consisting of the fair value ofof: (i) above and below market leases,leases; (ii) in-place leasesleases; and (iii) tenant relationships.assumed mortgages. The Company allocates the purchase price to the assets acquired and liabilities assumed based on their relative fair values and real estate acquisition costs are capitalized as a component of the cost of the assets acquired for asset acquisitions. The Company records goodwill or a gain on bargain purchase (if any) if the net assets acquired/liabilities assumed exceed the purchase consideration of a transaction. In estimating the fair value of the tangible and intangible assets acquired, the Company considers information obtained about each property as a result of its due diligence and marketing and leasing activities, and utilizes various valuation methods. These methods may include discounted cash flow models, for which assumptions including cash flow projections, discount and capitalization rates, or market comparable transactions, which require management judgment in determining the appropriateness of recent comparable sales of similar properties, or the ground lease approach for land valuation, which requires management judgement in determining comparable ground leases to forecast the economic ground rent and apply capitalization rate to the forecast economic ground rent to estimate land value. The Company may also utilize estimates of replacement costs net of depreciation. The fair value of the tangible assets of an acquired property considers the value of the property as if it were vacant.
Above-market and below-market lease values for acquired properties are initially recorded based on the present value (using a discount rate which reflects the risks associated with the leases acquired) of the difference betweenbetween: (i) the contractual amounts to be paid pursuant to each in-place leaselease; and (ii) management’s estimate of fair market lease rates for each corresponding in-place lease, measured over a period equal to the remaining term of the lease for above-market leases and the remaining initial term plus the term of any below-market fixed rate renewal options for below-market leases. The capitalized above-market lease values are amortized as a reduction of base rental revenue over the remaining terms of the respective leases, and the capitalized below-market lease values are amortized as an increase to base rental revenue over the remaining initial terms plus the terms of any below-market fixed rate renewal options of the respective leases. If a tenant with a below market rent renewal does not renew, any remaining unamortized amount will be taken into income at that time.
Other intangible assets acquired include amounts for in-place lease values and tenant relationship values, which are based on management’s evaluation of the specific characteristics of each tenant’s lease and the Company’s overall relationship with the respective tenant.values. Factors to be considered by management in its analysis of in-place lease values include an estimate of carrying costs during hypothetical expected lease-up periods considering current market conditions, and costs to execute similar leases. In estimating carrying costs, management includes real estate taxes, insurance and other operating expenses and estimates of lost rentals at market rates during the expected lease-up periods, depending on local market conditions. In estimating costs to execute similar leases, management considers leasing commissions, legal and other related expenses. Characteristics considered by management in valuing tenant relationships include the nature and extent of the Company’s existing business relationships with the tenant, growth prospects for developing new business with the tenant, the tenant’s credit quality and expectations of lease renewals. The value of in-place leases are amortized to expense over the remaining initial terms of the respective leases. The value of tenant relationship intangibles are amortized to expense over the anticipated life of the relationshipsleases but in no event do the amortization periods for intangible assets exceed the depreciable lives of the buildings. If a tenant terminates its lease, the unamortized portion of the in-place lease value and tenant relationship intangibles are charged to expense.
The fair value of other investments and debt assumed are valued using techniques consistent with those disclosed in Note 1514, Fair Value of Financial Instruments, depending on the nature of the investments or debt. The fair value of other assumed assets and liabilities are based on best information available at the time of the acquisition.
Impairment of Property Held for Use
On a periodic basis, management assesses whether there are any indicators that the value of the Company’s properties classified as held for use may be impaired. In addition to identifying any specific circumstances which may affect a property or properties, management considers other criteria for determining which properties may require assessment for potential impairment. The criteria considered by management include reviewing low leased percentages, significant near-term lease expirations, recently acquired properties, historical, current and historicalprojected operating and/or cash flow losses, near-term mortgage debt maturities or other factors that might impact the Company’s intent and ability to hold the property. A property’s value is impaired only if management’s estimate of the aggregate future cash flows (undiscounted and without debt service charges) to be generated by the property is less than the carrying value of the property. To the extent impairment has occurred, the loss shall be measured as the excess of the carrying amount of the property over the fair value of the property. The Company’s estimates of aggregate future cash flows expected to be generated by each property are based on a number of assumptions. These assumptions are generally based on management’s experience in its local real estate markets and the effects of current market conditions. The assumptions are subject to economic and market uncertainties including, among others, demand for space, competition for tenants, changes in market rental rates, and costs to operate each property. As these factors are difficult to predict and are subject to future events that may alter management’s assumptions, the future cash flows estimated by management in its impairment analyses may not be achieved, and actual losses or impairments may be realized in the future.
Real Estate Held for Sale
In accordance with accounting guidance found in ASC Topic 360 - Property, Plant, and Equipment (“ASC 360”), when assets are identified by management asmeet the criteria for held for sale, the Company discontinues depreciating the assets and estimates the sales price, net of selling costs, of such assets. If, in management’s opinion, the estimated net sales price of the assets which have been identified as held for sale is less than the net book value of the assets, an impairment charge will be recorded in the consolidated statements of income.
If circumstances arise that previously were considered unlikely and, as a result, the Company decides not to sell a property previously classified as held for sale, the property is reclassified as held and used. A property that is reclassified is measured and recorded individually at the lower of (a) its carrying amount before the property was classified as held for sale, adjusted for any depreciation (amortization) expense that would have been recognized had the property been continuously classified as held and used, or (b) the fair value at the date of the subsequent decision not to sell.
Sales of Real Estate
Gains on sales of real estate after January 1, 2018 are recognized pursuant to the provisions included in ASC 606-20, Revenue from Contracts with Customers (“ASC 606-20”) or ASC 610-20, Gains and Losses from the Derecognition of Nonfinancial Assets (“ASC 610-20”). Generally, the Company’s sales of residential condominiums would be governed by ASC 606-20 and the sales of rental properties under ASC 610-20.
Gain on sales of real estate prior to January 1, 2018 are recognized pursuant to the provisions included in ASC 360-20, Real Estate Sales (“ASC 360-20”). The specific timing of a sale was measured against various criteria in ASC 360-20 related to the terms of the transaction and any continuing involvement in the form of management or financial assistance associated with the properties. If the sales criteria for the full accrual method are not met, depending on the circumstances, the Company may not record a sale or may record a sale but may defer some or all of the gain recognition. If the criteria for full accrual are not met, the Company may account for the transaction by applying the finance, leasing, profit sharing, deposit, installment or cost recovery methods, as appropriate, until the sales criteria for the full accrual method are met.
Investments in and Advances to Unconsolidated Joint Ventures
The Company accounts for its investments in unconsolidated joint ventures under the equity method of accounting. The Company applies the equity method by initially recording these investments at cost, as investments in unconsolidated joint ventures, subsequently adjusted for equity in earnings and cash contributions and distributions. TheIn the event there is an outside basis
portion of the Company’s joint ventures, it is amortized over the anticipated useful lives of the underlying ventures’ tangible and intangible assets acquired and liabilities assumed. Generally, the Company would discontinue applying the equity method when the investment (and any advances) is reduced to zero and would not provide for additional losses unless the Company has guaranteed obligations of the venture or is otherwise committed to providing further financial support for the investee. If the venture subsequently generates income, the Company only recognizes its share of such income to the extent it exceeds its share of previously unrecognized losses. The Company classifies distributions received from its investments in unconsolidated joint ventures using the nature of the distribution approach.
On a periodic basis, management assesses whether there are any indicators that the value of the Company’s investments in unconsolidated joint ventures may be impaired. An investment is impaired only if management’s estimate of the value of the investment is less than the carrying value of the investment, and such decline in value is deemed to be other than temporary. To the extent impairment has occurred, the loss shall be measured as the excess of the carrying amount of the investment over the value of the investment. The Company’s estimates of value for each investment (particularly in commercial real estate joint ventures) are based on a number of assumptions that are subject to economic and market uncertainties including, among others, demand for space, competition for tenants, changes in market rental rates, and operating costs. As these factors are difficult to predict and are subject to future events that may alter management’s assumptions, the values estimated by management in its impairment analyses may not be realized, and actual losses or impairment may be realized in the future.
Capitalization of InterestCommitments and Contingencies
Capitalization of costs begins whenThe Company, as lessee, records right-of-use lease assets in other assets and lease liabilities in other liabilities on its consolidated balance sheets. A lease is evaluated for classification as an operating or finance lease at the activities necessary to get the development project ready for its intended use begins, which include costs incurred before the beginning of construction. Capitalization of costs ceases when the development project is substantially complete and ready for its intended use. Determining when a development project commences, and when it is substantially complete and ready for its intended use involves a degree of judgment. We generally consider a development project to be substantially complete and ready for its intended use upon receipt of a certificate of occupancy. We cease cost capitalization if activities necessary for the developmentcommencement date of the property have been suspended. Capitalized costs are allocated tolease. Right-of-use assets initially equal the specific componentslease liability. The lease liability equals the present value of a project that are benefited.the minimum rental payments due under the lease discounted at the rate implicit in the lease or the Company's incremental borrowing rate for similar collateral if the rate implicit in the lease is not readily determinable.
Interest shallFuture lease payments include fixed lease payments as well as variable lease payments that depend upon an index or rate using the index or rate at the commencement date and probable amounts owed under residual value guarantees. The amount of future lease payments may be capitalized for investments accounted for byincreased to include additional payments related to lease extension when the equity method while the investeeCompany has activities in progress necessarydetermined, at or subsequent to commence its planned principal operations, providedlease commencement that the investee’s activities include the useit is reasonably certain of funds to acquire qualifying assets for its operations. The investor’s investment in the investee, not the individual assets or projects of the investee, is the qualifying asset for purposes of interest capitalization.exercising such options.
112The Company recognizes a single lease cost for operating leases in operating expenses in the consolidated statements of income, calculated so that the cost of the lease is allocated generally on a straight-line basis over the term of the lease, and classifies all cash payments within operating activities in the consolidated statements of cash flows.
The Company has elected not to record assets and liabilities on its consolidated balance sheet for lease arrangements with terms of Contents12 months or less.
Valuation of Financial Instruments
Considerable judgment is necessary to interpret market data and develop estimated fair values. Accordingly, fair values are not necessarily indicative of the amounts the Company could realize upon disposition of the financial instruments. Financial instruments with readily available active quoted prices, or for which fair value can be measured from actively quoted prices, generally will have a higher degree of pricing observability and will therefore require a lesser degree of judgment to be utilized in measuring fair value. Conversely, financial instruments rarely traded or not quoted will generally have less, or no, pricing observability and will require a higher degree of judgment in measuring fair value. Pricing observability is generally affected by such items as the type of financial instrument, whether the financial instrument is new to the market and not yet established, the characteristics specific to the transaction and overall market conditions. The use of different market assumptions and/or estimation methodologies may have a material effect on estimated fair value amounts.
For a further discussion regarding the measurement of financial instruments see Note 15,14, Fair Value of Financial Instruments.
Valuation Hierarchy
In accordance with the authoritative guidance on fair value measurements and disclosures under ASC 820 -Fair Value Measurement, the methodologies used for valuing such instruments have been categorized into three broad levels as follows:
Level 1 - Quoted prices in active markets for identical instruments.
Level 2 - Valuations based principally on other observable market parameters, including:
•Quoted prices in active markets for similar instruments,instruments;
•Quoted prices in less active or inactive markets for identical or similar instruments,instruments;
•Other observable inputs (such as interest rates, yield curves, volatilities, prepayment speeds, loss severities, credit risks and default rates),; and
•Market corroborated inputs (derived principally from or corroborated by observable market data).
Level 3 - Valuations based significantly on unobservable inputs.inputs, including:
•Valuations based on third-party indications (broker quotes, counterparty quotes or pricing services), which were in turn, based significantly on unobservable inputs or were otherwise not supportable as Level 2 valuations,valuations; and
•Valuations based on internal models with significant unobservable inputs.
Pursuant to the authoritative guidance, these levels form a hierarchy. The Company follows this hierarchy for its financial instruments measured at fair value on a recurring basis. The classifications are based on the lowest level of input that is significant to the fair value measurement.
It is the Company’s policy to determine when transfers between levels of the fair value hierarchy are deemed to have occurred at the end of the reporting period.
Tuebor/Federal Home Loan Bank Membership
Tuebor Captive Insurance Company LLC (“Tuebor”), was licensed in Michigan and approved to operate as a captive insurance company as well as being approved to become a member of the Federal Home Loan Bank (“FHLB”), with membership finalized with the purchase of stock, in the FHLB on July 11, 2012. That approval allowed Tuebor to purchase capital stock in the FHLB, the prerequisite to obtaining financing on eligible collateral. Refer to Note 7, Debt Obligations, Net.
Each member of the FHLB must purchase and hold FHLB stock as a condition of initial and continuing membership, in proportion to their borrowings from the FHLB and levels of certain assets. Members may need to purchase additional stock to comply with these capital requirements from time to time. FHLB stock is redeemable by Tuebor upon five (5) years’years prior written notice, subject to certain restrictions and limitations. Under certain conditions, the FHLB may also, at its sole discretion, repurchase FHLB stock from its members. The Company records its investment in FHLB stock at its par value and the FHLB stock is expected to be repurchased by the FHLB at its par value. As of December 31, 2023 and 2022, the carrying value of the FHLB stock was $5.2 million and $9.6 million respectively, which is included in other assets on the consolidated balance sheets.
Debt Issuance Costs
The Company recognizes debt issuance costs related to its senior unsecured notes on its consolidated balance sheet as a direct deduction from the carrying amount of that debt liability, consistent with debt discounts. Unamortized debt issuance costs of $12.9 million and $8.4 million are included in senior unsecured notes as of December 31, 2020 and 2019, respectively. The Company defers debt issuance costs associated with lines of credit and presents them as an asset and subsequently amortizes the debt issuance costs ratably over the term of the revolving debt arrangement. The Company considers its committed loan master repurchase facilities, borrowings under credit agreement and revolving credit facility to be revolving debt arrangements.
Derivative Instruments
In the normal course of business, the Company is exposed to the effect of interest rate changes and may undertake a strategy to limit these risks through the use of derivatives. To address exposure to interest rates, the Company uses derivatives primarily to economically hedge the fair value variability of fixed rate assets caused by interest rate fluctuations and overall portfolio market risk. The Company may use a variety of derivative instruments that are considered conventional, or “plain vanilla” derivatives, including interest rate swaps, futures, caps, collars and floors, to manage interest rate risk.
To determine the fair value of derivative instruments, the Company uses a variety of methods and assumptions that are based on market conditions and risks existing at each balance sheet date. Standard market conventions and techniques such as discounted cash flow analysis, option-pricing models, and termination cost may be used to determine fair value. All such methods of measuring fair value for derivative instruments result in an estimate of fair value, and such value may never actually be realized.
The Company recognizes all derivatives on the consolidated balance sheets at fair value. The Company does not generally designate derivatives as hedges to qualify for hedge accounting for financial reporting purposes and therefore any net payments under, or fluctuations in the fair value of, these derivatives have been recognized currently in net result from derivative transactions in the accompanying consolidated statements of income. The Company records derivative asset and liability positions on a gross basis with any collateral posted with or received from counterparties recorded separately on the Company’s consolidated balance sheets.
Repurchase Agreements
The Company finances certain of its mortgage loan receivables held for sale, a portion of its mortgage loan receivables held for investment and the majority of its real estate securities using repurchase agreements. Under a repurchase agreement, an asset is sold to a counterparty to be repurchased at a future date at a predetermined price, which represents the original sales price plus interest. The Company accounts for these repurchase agreements as financings under ASC 860-10-40. Under this standard, for these transactions to be treated as financings, they must be separate transactions and not linked. If the Company finances the purchase of its mortgage loan receivables held for sale, mortgage loan receivables held for investment and real estate securities with repurchase agreements with the same counterparty from which the securities are purchased and both transactions are entered into contemporaneously or in contemplation of each other, the transactions are presumed under GAAP to be part of the same arrangement, or a “Linked Transaction,” unless certain criteria are met. As of December 31, 2020 and 2019, none of the Company’s repurchase agreements are accounted for as linked transactions.
Repurchases of Contentsshares and shares acquired to satisfy tax withholding in connection with the vesting of restricted stock are recorded at cost as a reduction of shareholders’ equity in treasury stock.
Reissuances of shares at an amount greater or (less) than the average cost basis of the shares results in gains (losses) that are recognized in shareholders’ equity. Gains on reissuances are recorded to additional paid-in capital. Losses on reissuances are recorded to additional paid-in capital to the extent previous net gains from reissuances of are included in additional paid-in capital. Losses in excess of that amount are recorded to retained earnings.
During the year ended December 31, 2023, the Company reclassified $73.6 million and $5.3 million from treasury stock to additional paid in capital and retained earnings, respectively, for treasury stock repurchases and reissuances prior to January 1, 2023. As a part of this out-of-period reclassification, there was no impact to total equity.
Income Taxes
The Company has elected to be taxed as a REIT under the Code effective January 1, 2015. The Company is subject to federal income taxation at corporate rates on its REIT taxable income; however, the Company is allowed a deduction for the amount of dividends paid to its stockholders, thereby subjecting the distributed net income of the Company to taxation at the stockholder level only. Any income associated with a TRS is fully taxable because a TRS is subject to federal and state income taxes as a domestic C corporation based upon its taxable net income. The Company is also subject to U.S. federal income tax (and possibly state and local taxes) to the extent it recognizes any “built-in gains” that existed as of January 1, 2015, the effective date of Company’s election to be subject to tax as a REIT under the Code (the “REIT Election”) for the five yearfive-year period following the REIT Election. The Company intends to continue to operate in a manner consistent with and to elect to be treated as a REIT for tax purposes.
Prior to electing REIT status, a portion of the Company’s income was subject to U.S. federal, state and local corporate income taxes and taxed at the prevailing corporate tax rates in addition to being subject to the New York City Unincorporated Business Tax (“NYC UBT”). Prior to February 11, 2014, the Company’s predecessor had not been subject to U.S. federal income taxes as the predecessor entity is a Limited Liability Limited Partnership, but had been subject to the NYC UBT.
As part of the Tax Cuts and Jobs Act, the federal income tax rate applicable to TRS activities has been reduced. The Company has adjusted its deferred tax positions at the TRSs to reflect the reduced tax rate as part of its 2017 tax provision.
The Company accounts for income taxes in accordance with ASC Topic 740 - Income Taxes (“ASC 740”), which requires the recognition of tax benefits or expenses on the temporary differences between financial reporting and tax bases of assets and liabilities. The Company evaluates the realizability of its deferred tax assets and recognizes a valuation allowance if, based on the available evidence, both positive and negative, it is more likely than not that some portion or all of its deferred tax assets will not be realized. When evaluating the realizability of its deferred tax assets, the Company considers, among other matters, estimates of expected future taxable income, nature of current and cumulative losses, existing and projected book/tax differences, tax planning strategies available, and the general and industry-specific economic outlook. The realizability analysis is inherently subjective, and it requires the Company to forecast its business and general economic environment in future periods.
The Company determines whether a tax position of the Company is more likely than not to be sustained upon examination by the applicable taxing authority, including resolution of any related appeals or litigation processes, based on the technical merits of the position. The tax benefit to be recognized is measured as the largest amount of benefit that is greater than 50% likely of beingto be realized upon ultimate settlement which could result in the Company recording a tax liability that would reduce shareholders’ equity.
The Company’s policy is to classify interest and penalties associated with underpayment of U.S. federal and state income taxes, if any, as a component of operatingincome tax expense (benefit) on its consolidated statements of income. For the years ended December 31, 20202023, 2022 and 2019,2021, the Company did not have material interest or penalties associated with the underpayment of any income taxes. The last three2019-2023 tax years remain open and subject to examination by tax jurisdictions.
Interest Income
Interest income is accrued based on the outstanding principal amount and contractual terms of the Company’s loans and securities. Discounts or premiums associated with the purchase of loans and investment securities are amortized or accreted into interest income as a yield adjustment on the effective interest method, based on expected cash flows through the expected recovery period of the investment. On at least a quarterly basis, the Company reviews and, if appropriate, makes adjustments to its cash flow projections. The Company has historically collected, and expects to continue to collect, all contractual amounts due on its originated loans. As a result, the Company does not adjust the projected cash flows to reflect anticipated credit losses for these loans. If the performance
The Company applies the provisions of ASC 310-20 for our high credit quality securities rated AA or above. The effective yield on securities is based on the projected cash flows from each security, which is estimated based on the Company’s observation of the then current information and events and will include assumptions related to interest rates, prepayment rates and the timing and amount of credit losses. On at least a quarterly basis, the Company reviews and, if appropriate, makes adjustments to its cash flow projections based on input and analysis received from external sources, internal
models, and its judgment about interest rates, prepayment rates, the timing and amount of credit losses (if applicable), and other factors. Changes in cash flows from those originally projected, or from those estimated at the last evaluation, may result in a prospectiveretrospective change in the yield/interest income recognized on such securities. Actual maturities of the securities are affected by the contractual lives of the associated mortgage collateral, periodic payments of scheduled principal, and repayments of principal. Therefore, actual maturities of the securities will generally be shorter than stated contractual maturities.
For loans classified as held for investment and that the Company has not elected to record at fair value under ASC 825, origination fees and direct loan origination costs are recognized in interest income over the loan term as a yield adjustment using the effective interest method. For loans classified as held for sale and that the Company has not elected to record at fair value under ASC 825, origination fees and direct loan origination costs are deferred adjusting the basis of the loan and are realized as a portion of the gain/(loss) on sale of loans when sold. As of December 31, 2020,2023 and 2022, the Company did not hold any loans for which the fair value option was elected.
ForThe Company applies the provisions in ASC 325-40 for our CMBSsecurities rated below AA, which represents 11.2% of the Company’s CMBS portfolio as of December 31, 2020, cash flows from a security are estimated by applying assumptions used to determine the fair value of such security and the excess of the future cash flows over the investment are recognized as interest income under the effective yield method. The Company will review and, if appropriate, make adjustments to, its cash flow projections at least quarterly and monitor these projections based on input and analysis received from external sources and its judgment about interest rates, prepayment rates, the timing and amount of credit losses and other factors. Changes in cash flows from those originally projected, or from those estimated at the last evaluation, may result in a prospective change in interest income recognized and amortization of any premium or discount on, or the carrying value of, such securities.
For investments purchased that either meet the definition of a purchased financial asset with evidence ofcredit deterioration of credit quality for which it(“PCD”) or where there is probable, at acquisition, that the Company will be unable to collect all contractually required payments receivable, the Company will apply the provisions of ASC 310-30, “Loans and Debt Securities Acquired with Deteriorated Credit Quality.” ASC 310-30 addresses accounting for differencessignificant difference between contractual cash flows and expected cash flows, the Company applies the PCD guidance in ASC 326-30. ASC 326-30 requires an initial estimate of expected credit losses to be collected fromrecognized through an investor’s initial investment in loans or debt securities (loans) acquired in a transfer if those differences are attributable, at least in part, to credit quality. ASC 310-30 limits the yield that may be accreted (accretable yield)adjustment to the excessamortized cost basis of the investor’s estimate of undiscounted expected principal, interest and other cash flows (cash flows expected at acquisitionfinancial asset (i.e., a balance sheet gross up) with no impact to be collected) over the investor’s initial investment in the loan. ASC 310-30 requires that the excess of contractual cash flows over cash flows expected to be collected (nonaccretable difference) not be recognized as an adjustment of yield, loss accrual or valuation allowance. Subsequent increases in cash flows expected to be collected generally should be recognized prospectively through adjustment of the loan’s yield over its remaining life. Decreases in cash flows expected to be collected should be recognized as impairment.earnings.
As of the date of acquisition, the amount of expected credit losses is added to the purchase price of the security to establish the initial amortized cost basis. Any difference between the amortized cost basis (purchase price plus the initial allowance for credit losses) and the par amount of the security is considered to be a non-credit discount/premium and will be accreted/amortized into interest income using the interest method.
When assessing whether the credit quality of the asset has deteriorated, the Company compares the credit quality of the asset at the time of origination with the credit quality at the time of acquisition. An asset that was originated with low credit quality should not be considered to be PCD if there has not been a more-than-insignificant deterioration in credit since origination.
Recognition of Operating Lease Income and Tenant Recoveries
The Company adopted ASC Topic 842, Leases (“ASC Topic 842”) on January 1, 2019. The primary impact of applying ASC Topic 842 was the initial recognition of a $3.5 million lease liability and a $3.3 million right-of-use asset (including previously accrued straight line rent) on the Company’s consolidated financial statements, for leases classified as operating leases under ASC Topic 840, primarily for the Company’s corporate headquarters and other identified leases. There is no cumulative effect on retained earnings or other components of equity recognized as of January 1, 2019.
Certain arrangements may contain both lease and non-lease components. The Company determines if an arrangement is, or contains, a lease at contract inception. Only the lease components of these contractual arrangements are subject to the provisions of ASC Topic 842. Any non-lease components are subject to other applicable accounting guidance. We elected, however, to adopt the optional practical expedient not to separate lease components from non-lease components for accounting purposes. This policy election has been adopted for each of the Company’s leased asset classes existing as of the effective date and subject to the transition provisions of ASC Topic 842 - Leases, will be applied to all new or modified leases executed on or after January 1, 2019. For contractual arrangements executed in subsequent periods involving a new leased asset class, the Company will determine at contract inception whether it will apply the optional practical expedient to the new leased asset class.
ACertain of the Company’s real estate is leased to others on a net lease basis where the tenant is evaluatedgenerally responsible for classification aspayment of real estate taxes, property, building and general liability insurance and property and building maintenance. These leases are for fixed terms of varying length and provide for annual rentals.
Rental income from operating leases is recognized in real estate operating income on a straight-line basis, generally from the later of the date the lessee takes possession of the space or finance leases at the commencementspace is ready for its intended use. If the Company acquires a facility subject to an existing operating lease, the Company will recognize operating lease income on the straight-line method beginning on the date of acquisition over the lease. Right-of-use assets and corresponding liabilities are recognized on the Company’s consolidated balance sheet based on the present value of future lease payments relating to the useterm of the underlying asset during the lease term. Future lease payments include fixed lease payments as well as variable lease payments that depend upon an index or rate using the index or rate at the commencement date and probable amounts owed under residual value guarantees.respective leases. The amount of future lease payments may be increased to include additional payments related to lease extension termination, and/or purchase options when the Company has determined at or subsequent to lease commencement, generally due to limited asset availability or operating commitments, it is reasonably certain of exercising such options.the extension
options are reasonably certain to be exercised. The cumulative excess of rents recognized over amounts contractually due pursuant to the underlying leases are included in unbilled rent receivable within other assets in the consolidated balance sheets.
The Company uses its incremental borrowing rate as the discount rate in determining the present value of future lease payments, unless the interest rate implicit in the lease arrangement is readily determinable. Lease payments that vary based on future usage levels, the nature of leased asset activities, or certain other contingencies, are not included in the measurement of lease right-of-use assets and corresponding liabilities. The Company has elected not to record assets and liabilities on its consolidated balance sheet for lease arrangements with terms of 12 months or less. Tenant recoveries related to reimbursementreimbursements, which consist of real estate taxes insurance, utilities, repairs and maintenance, and other operating expensesmunicipal charges paid by the Company, which were reimbursable by our tenants pursuant to the terms of the lease agreements, are recognized as revenue in the period during which the applicable expenses are incurred. Tenant reimbursements are included in real estate operating income on the Company’s consolidated statements of income.
The Company moves to cash basis for operating lease income recognition in the period in which collectability of all lease payments is no longer considered probable. At such time, any operating lease receivable or unbilled rent receivable balance will be written off. If and when lease payments that were previously not considered probable of collection become probable, the Company will move back to the straight-line method of income recognition and record an adjustment to operating lease income in that period as if the lease was always on the straight-line method of income recognition.
Transfers of Financial Assets
For a transfer of financial assets to be considered a sale, the transfer must meet the sale criteria of ASC 860, which, at the time of the transfer, require that the transferred assets qualify as recognized financial assets and the Company surrender control over the assets. Such surrender requires that the assets be isolated from the Company, even in bankruptcy or other receivership, the purchaser have the right to pledge or sell the assets transferred and the Company not have an option or obligation to reacquire the assets. If the sale criteria are not met, the transfer is considered to be a secured borrowing, the assets remain on the Company’s consolidated balance sheets and the sale proceeds are recognized as a liability. In November 2017, the SEC staff indicated that, despite transfer restrictions placed on qualified Third Party Purchasers by the risk retention rules of the Dodd-Frank Act, they would not take exception to a registrant treating transfers of financial instruments in a securitization as sales if the transfers otherwise met all the criteria for sale accounting. The Company believes treatment of such transfers as sales is consistent with the substance of such transactions and, accordingly, reflects such transfers as sales. We recognize gains on sale of loans net of any costs related to that sale.
Debt Issued
From time to time, a subsidiary of the Company will originate a loan (each, an “Intercompany Loan,” and collectively, “Intercompany Loans”) to another subsidiary of the Company to finance the purchase of real estate. The mortgage loan receivable and the related obligation do not appear in the Company’s consolidated balance sheets as they are eliminated upon consolidation. Once the Company issues (sells) an Intercompany Loan to a third-party securitization trust (for cash), the related mortgage note is heldrecognized as a financing transaction and accounted for the first time by a creditor external to the Company.under ASC 470. The accounting for the securitization of an Intercompany Loan—a financial instrument that has never been recognized in our consolidated financial statements as an asset—is considered a financing transaction under ASC 470 -Debt, and ASC 835 Interest.- Interest.
The periodic securitization of the Company’s mortgage loans involves both Intercompany Loans and mortgage loans made to third parties with the latter recognized as financial assets in the Company’s consolidated financial statements as part of an integrated transaction. The Company receives aggregate proceeds equal to the transaction’s all-in securitization value and sales price. In accordance with the guidance under ASC 835, when initially measuring the obligation arising from an Intercompany Loan’s securitization, the Company allocates the proceeds from each securitization transaction between the third-party loans and each Intercompany Loan so securitized on a relative fair value basis determined in accordance with the guidance in ASC 820, Fair Value Measurement. The difference between the amount allocated to each Intercompany Loan and the loan’s face amount is recorded as a premium or discount, and is amortized, using the effective interest method, as a reduction or increase in reported interest expense, respectively.
Fee and Other Income
Fee and other income is composed of income from dividend income on our investment in FHLB stock, as well as from originationunderwriting fees, exit fees and other fees on the loans we originate and in which we invest.
Fee ExpenseInvestment Related Expenses
Fee expense isInvestment related expenses are composed primarily of servicing costs, fees related to financing arrangements, transaction related costs and financing arrangements and other investment related costs.
Stock Based Compensation Plan
The Company accounts for its equity-based compensation awards using the fair value method, which requires an estimate of fair value of the award at the time of grant. The Company recognizes the compensation expense related to the time-based vesting criteria on a straight-line basis over the requisite service period. Accruals of compensation cost for an award with a performance condition shall be based on the probable outcome of that performance condition. Therefore, compensation cost shall be accrued if it is probable that the performance condition will be achieved and shall not be accrued if it is not probable that the performance condition will be achieved. The Company made a policy election to account for forfeitures as they occur rather than on an estimated basis.
Out-of-Period Adjustments
During the first quarter of 2018, the Company recorded an out-of-period adjustment to increase tenant real estate tax recoveries on a net leased property by $1.1 million, which was not billed until the three month period ended March 31, 2018, although the real estate tax recoveries related to prior periods. The Company concluded that this adjustment was not material to the financial position or results of operations for the three months ended March 31, 2018 or any prior periods; accordingly, the Company recorded the related adjustment in the three month period ended March 31, 2018.
Recently Adopted Accounting Pronouncements
In June 2016, the Financial Accounting Standards Board (“FASB”) issued Accounting Standards Update (“ASU”) 2016-13 Financial Instruments - Credit Losses - Measurement of Credit Losses on Financial Instruments (Topic 326) (“ASU 2016-13”) and in April 2019,March 2022, the FASB issued ASU 2019-04 Codification Improvements to Topic 326, 2022-02—Financial Instruments-Credit Losses Topic 815, Derivatives(Topic 326): Troubled Debt Restructurings and Hedging,Vintage Disclosures (“ASU 2022-02”). ASU 2022-02 eliminated the accounting guidance for troubled debt restructurings and Topic 825, Financial Instruments (“requires disclosure of current-period gross write-offs by year of loan origination. Additionally, ASU 2019-04”), collectively,2022-02 updates the “CECL Standard.” These updates change how entities measure potentialaccounting for credit losses under ASC 326 and adds enhanced disclosures with respect to loan refinancing and restructuring in the form of principal forgiveness, interest rate concessions, other-than-insignificant payment delays, or term extensions when the borrower is experiencing financial difficulties. The amendments should be applied prospectively, however for most financial assetsthe recognition and certain other instruments that are not measured at fair value. The CECL Standard replacedmeasurement of troubled debt restructurings, the “incurred loss” approach under previous guidance with an “expected loss” model for instruments measured at amortized cost. The net carrying value of an asset underentity has the CECL Standard is intended to represent the amount expected to be collected on such asset and requires entities to deduct allowances for potential losses on mortgage loan receivables held for investment, net and held-to-maturity debt securities. The Company will continue to record asset-specific reserves consistent with our existing accounting policy. In addition, the Company will now record a general reserve in accordance with the CECL Standard on the remainder of the loan portfolio (“CECL Reserve”). At adoption, on January 1, 2020, the Company recorded a CECL Reserve of $11.6 million, which equated to 0.36% of $3.2 billion carrying value of its held for investment loan portfolio. This reserve excluded 3 loans that previously had an aggregate of $14.7 million of asset-specific reserves and a carrying value of $39.8 million as of January 1, 2020. Upon adoption, the aggregated CECL Reserve reduced total shareholder’s equity by $5.8 million (or approximately $0.05 of book value per share of common stock).
In August 2018, the FASB issued ASU 2018-13, Fair Value Measurement, (Topic 820): Disclosure Framework—Changes to the Disclosure Requirements for Fair Value Measurement, (“ASU 2018-13”). ASU 2018-13 eliminates, adds and modifies certain disclosure requirements for fair value measurements as part of its disclosure framework project. The standard is effective for all entities for financial statements issued for fiscal years beginning after December 15, 2019, and interim periods within those fiscal years. The adoption of ASU 2018-13 had no material impact on the Company’s consolidated financial statements.
In October 2018, the FASB issued ASU 2018-17, Consolidation (Topic 810): Targeted Improvements to Related Party Guidance for Variable Interest Entities, (“ASU 2018-17”). ASU 2018-17 requires reporting entities to consider indirect interests held through related parties under common control on a proportional basis rather than as the equivalent of a direct interest in its entirety for determining whether a decision-making fee is a variable interest. The standard is effective for all entities for financial statements issued for fiscal years beginning after December 15, 2019, and interim periods within those fiscal years. Early adoption is permitted. Entities are requiredoption to apply the amendmentsa modified retrospective transition method, resulting in ASU 2018-17 retrospectively with a cumulative-effect adjustment to retained earnings atin the beginningperiod of adoption. The Company adopted ASU 2022-02 on January 1, 2023 and the earliest period presented. The adoption of ASU 2018-17 had no material impact on the Company’s consolidated financial statements.
In April 2019, the FASB issued ASU 2019-04, Codification Improvements to Topic 326, Financial Instruments—Credit Losses, Topic 815, Derivatives and Hedging, and Topic 825, Financial Instruments, (“ASU 2019-04”). ASU 2019-04 clarifies and improves areas of guidance related to the recently issued standards on credit losses (ASU 2016-13), hedging (ASU 2017-12), and recognition and measurement of financial instruments (ASU 2016-01). The amendments generally have the same effective dates as their related standards. If already adopted, the amendments of ASU 2016-01 and ASU 2016-13 are effective for fiscal years beginning after December 15, 2019 and the amendments of ASU 2017-12 are effective as of the beginning of the Company’s next annual reporting period; early adoption is permitted. The Company previously adopted ASU 2016-01. The adoption of ASU 2019-04 had no material impact on the Company’s consolidated financial statements.
In March 2020, the FASB issued ASU 2020-03, Codification Improvements to Financial Instruments, (“ASU 2020-03”). ASU 2020-03 improves various financial instruments topics, including the CECL Standard. ASU 2020-03 includes seven different issues that describe the areas of improvement and the related amendments to GAAP, intended to make the standards easier to understand and apply by eliminating inconsistencies and providing clarifications. The amendments related to Issue 1, Issue 2, Issue 4 and Issue 5 were effective upon issuance of ASU 2020-03. The amendments related to Issue 3, Issue 6 and Issue 7 were effective for the Company beginning on January 1, 2020. The adoption of ASU 2020-03 had no material impact on the Company’s consolidated financial statements.
In March 2020, the FASB issued ASU 2020-04, Reference Rate Reform (Topic 848): Facilitation of the Effects of Reference Rate Reform on Financial Reporting, (“ASU 2020-04”). ASU 2020-04 provides optional expedients and exceptions for applying GAAP to contracts, hedging relationships and other transactions that reference the London Interbank Offered Rate (“LIBOR”) or another reference rate expected to be discontinued because of reference rate reform. ASU 2020-04 is effective upon issuance of ASU 2020-04 for contract modifications and hedging relationships on a prospective basis. While the Company is currently assessing the impact of ASU 2020-04, the Company does2022-02 did not expect the adoption to have a material impact on the Company’s consolidated financial statements.
Recent Accounting Pronouncements Pending Adoption
In December 2019,November 2023, the FASB issued ASU 2019-12, Income Taxes2023-07—Segment Reporting (Topic 815),280): Improvements to Reportable Segment Disclosures (“ASU 2019-12”2023-07”). ASU 2019-12 simplifies the accounting for income taxes by removing certain exceptions to the general principles in Topic 740.2023-07 improves reportable segment disclosure requirements, primarily through enhanced disclosures about significant segment expenses. ASU 2019-12 also improves the consistent application of, and simplifies, GAAP for other areas of Topic 740 by clarifying and amending existing guidance. The standard2023-07 is effective for all entities for financial statements issued for fiscal years beginning after December 15, 2020,2023 and interim periods within those fiscal years. Early adoption is permitted. The Company does not expect the adoption of ASU 2019-12 to have a material impact on its consolidated financial statements.
In October 2020, the FASB issued ASU 2020-08, Codification Improvements to Subtopic 310-20, Receivables–Nonrefundable Fees and Other Costs, (“ASU 2020-08”). This ASU clarifies that an entity should reevaluate whether a callable debt security is within the scope of ASC paragraph 310-20-35-33 for each reporting period. The guidance is effective for public business entities for fiscal years, and interim periods within those fiscal years beginning after December 15, 2020. Early application2024, early adoption is not permitted. All entitiesThe amendments should apply ASU 2020-08be applied retrospectively to all prior periods presented in the financial statements. Upon transition, the segment expense categories and amounts disclosed in the prior periods should be based on a prospective basis as of the beginning ofsignificant segment expense categories identified and disclosed in the period of adoption for existing or newly purchased callable debt securities.adoption. The Company is assessingcurrently evaluating the impact of the update on the Company’s consolidated financial statements.
In December 2023, the FASB issued ASU 2020-082023-09—Income Taxes (Topic 740): Improvements to Income Tax Disclosures (“ASU 2023-09”). ASU 2023-09 improves the transparency of income tax disclosures related to rate reconciliation and itsincome taxes. ASU 2023-07 is effective for annual periods beginning after December 15, 2024. For entities other than public business entities, the amendments are effective for annual periods beginning after December 15, 2025. Early adoption is permitted for annual financial statements that have not yet been issued or made available for issuance. The amendments should be applied prospectively, however retrospective application is permitted. The Company is currently evaluating the impact its accounting and disclosures.of the update on the Company’s consolidated financial statements.
Any new accounting standards not disclosed above that have been issued or proposed by FASB and that do not require adoption until a future date are being evaluated or not expected to have a material impact on the consolidated financial statements upon adoption.
3. MORTGAGE LOAN RECEIVABLES
December 31, 20202023 ($ in thousands)
| | Outstanding
Face Amount | | Carrying
Value | | Weighted
Average
Yield (1) | | Remaining
Maturity
(years) |
| Outstanding
Face Amount | | | Outstanding
Face Amount | | Carrying
Value | | Weighted
Average
Yield (1)(2) | | Remaining
Maturity
(years)(2)(3) |
| | Mortgage loan receivables held for investment, net, at amortized cost: | Mortgage loan receivables held for investment, net, at amortized cost: | | | | | | | |
| Mortgage loan receivables held for investment, net, at amortized cost: | |
| Mortgage loan receivables held for investment, net, at amortized cost: | |
| First mortgage loans | |
| First mortgage loans | |
| First mortgage loans | First mortgage loans | $ | 2,243,639 | | | $ | 2,232,749 | | | 6.50 % | | 1.00 | $ | 3,131,803 | | | $ | | $ | 3,122,707 | | | 9.63 | | 9.63 | % | | 0.7 |
| Mezzanine loans | Mezzanine loans | 121,565 | | | 121,310 | | | 10.83 % | | 2.42 | Mezzanine loans | 32,423 | | | 32,382 | | 32,382 | | | 11.46 | | 11.46 | % | | 0.9 |
| Total mortgage loans | 2,365,204 | | | 2,354,059 | | | 6.65 % | | 1.07 |
| Total mortgage loans receivable | | Total mortgage loans receivable | 3,164,226 | | | 3,155,089 | | | 9.65 | % | | 0.7 |
| | Allowance for credit losses | Allowance for credit losses | N/A | | (41,507) | | |
| | Allowance for credit losses | |
| | Allowance for credit losses | |
| Total mortgage loan receivables held for investment, net, at amortized cost | |
| Total mortgage loan receivables held for investment, net, at amortized cost | |
| Total mortgage loan receivables held for investment, net, at amortized cost | Total mortgage loan receivables held for investment, net, at amortized cost | 2,365,204 | | | 2,312,552 | | |
| Mortgage loan receivables held for sale: | Mortgage loan receivables held for sale: | |
| Mortgage loan receivables held for sale: | |
| Mortgage loan receivables held for sale: | |
| First mortgage loans | |
| First mortgage loans | |
| First mortgage loans | First mortgage loans | 30,478 | | | 30,518 | | | 4.05 % | | 9.18 | 31,350 | | | 26,868 | | 26,868 | | (4) | (4) | 4.57 | % | | 8.2 |
| Total | Total | $ | 2,395,682 | | | $ | 2,343,070 | | | 6.74 % | | 1.23 | Total | $ | 3,195,576 | | | $ | | $ | 3,138,792 | | (5) | (5) | 9.61 | % | | 0.7 |
(1)Includes the impact fromof interest rate floors. Term SOFR rates in effect as of December 31, 2020 LIBOR rates2023 are used to calculate weighted average yield for floating rate loans.
(2)Excludes one non-accrual loan of $14.5 million. Refer to “Non-Accrual Status” below for further details.
(3)The remaining maturity is calculated based on the initial maturity. The weighted average extended maturity for all loans is 1.8 years.
(4)As a result of changes in prevailing rates, the Company recorded a lower of cost or market adjustment as of December 31, 2023. The adjustment was calculated using a 5.18% discount rate.
(5)Net of $9.1 million of deferred origination fees and other items as of December 31, 2023.
As of December 31, 2020, $1.92023, $2.8 billion, or 82.0%87.8%, of the outstanding face amount of our mortgage loan receivables held for investment, net, at amortized cost, were at variable interest rates linked to LIBOR.Term SOFR. Of this $1.9$2.8 billion, 100% of these variable interest rate mortgage loan receivables were subject to interest rate floors. As of December 31, 2020, $30.52023, $31.4 million, or 100%, of the outstanding face amount of our mortgage loan receivables held for sale were at fixed interest rates.
December 31, 20192022 ($ in thousands)
| | Outstanding
Face Amount | | Carrying
Value | | Weighted
Average
Yield (1) | | Remaining
Maturity
(years) |
| Outstanding
Face Amount | | | Outstanding
Face Amount | | Carrying
Value | | Weighted
Average
Yield (1)(2)(3) | | Remaining
Maturity
(years)(2)(3) |
| | Mortgage loan receivables held for investment, net, at amortized cost: | Mortgage loan receivables held for investment, net, at amortized cost: | | | | | | | |
| Mortgage loan receivables held for investment, net, at amortized cost: | |
| Mortgage loan receivables held for investment, net, at amortized cost: | |
| First mortgage loans | |
| First mortgage loans | |
| First mortgage loans | First mortgage loans | $ | 3,147,275 | | | $ | 3,127,173 | | | 6.77 | % | | 1.35 | $ | 3,841,315 | | | $ | | $ | 3,819,860 | | | 8.83 | | 8.83 | % | | 1.3 |
| Mezzanine loans | Mezzanine loans | 130,322 | | | 129,863 | | | 10.97 | % | | 3.26 | Mezzanine loans | 65,950 | | | 65,886 | | 65,886 | | | 10.62 | | 10.62 | % | | 1.6 |
| Total mortgage loans | 3,277,597 | | | 3,257,036 | | | 6.94 | % | | 1.43 |
| Total mortgage loans receivable | | Total mortgage loans receivable | 3,907,265 | | | 3,885,746 | | | 8.85 | % | | 1.3 |
| | Allowance for credit losses | Allowance for credit losses | N/A | | (20,500) | | |
| | Allowance for credit losses | |
| | Allowance for credit losses | |
| Total mortgage loan receivables held for investment, net, at amortized cost | |
| Total mortgage loan receivables held for investment, net, at amortized cost | |
| Total mortgage loan receivables held for investment, net, at amortized cost | Total mortgage loan receivables held for investment, net, at amortized cost | 3,277,597 | | | 3,236,536 | | |
| Mortgage loan receivables held for sale: | Mortgage loan receivables held for sale: | |
| Mortgage loan receivables held for sale: | |
| Mortgage loan receivables held for sale: | |
| First mortgage loans | |
| First mortgage loans | |
| First mortgage loans | First mortgage loans | 122,748 | | | 122,325 | | | 4.20 | % | | 9.99 | 31,350 | | | 27,391 | | 27,391 | | (4) | (4) | 4.57 | % | | 9.2 |
| Total | Total | $ | 3,400,345 | | | $ | 3,358,861 | | | 6.88 | % | | 1.75 | Total | $ | 3,938,615 | | | $ | | $ | 3,892,382 | | (5) | (5) | 8.82 | % | | 1.3 |
(1)Includes the impact from interest rate floors. December 31, 20192022 LIBOR and SOFR rates are used to calculate weighted average yield for floating rate loans.
(3)Includes the impact of one first mortgage loan with a principal balance of $51.5 million, which was extended through 2026 in January 2023.
(4)As a result of rising prevailing rates, the Company recorded a lower of cost or market adjustment as of December 31, 2022. The adjustment was calculated using a 5.16% discount rate.
(5)Net of $21.5 million of deferred origination fees and other items as of December 31, 2022.
As of December 31, 2019, $2.52022, $3.4 billion, or 77.2%87.2%, of the outstanding principalface amount of our mortgage loan receivables held for investment, net, at amortized cost, were at variable interest rates with $2.3 billion linked to LIBOR or a replacement index generally determined in our discretion.and $1.1 billion linked to Term SOFR. Of this $2.5$3.4 billion, 100%99.2% of these variable interest rate mortgage loan receivables were subject to interest rate floors. As of December 31, 2019, $122.72022, $31.4 million, or 100%, of the carrying valueoutstanding face amount of our mortgage loan receivables held for sale were at fixed interest rates.
For the years ended December 31, 20202023, 2022, and 2019,2021, the activity in our loan portfolio was as follows ($ in thousands):
| | | | | | | | | | | | | | | | | | | |
| Mortgage loan receivables held for investment, net, at amortized cost: | | |
| | Mortgage loans receivable | | | | Allowance for credit losses | | Mortgage loan
receivables held
for sale |
| | | | | | | |
| Balance, December 31, 2019 | $ | 3,257,036 | | | | | $ | (20,500) | | | $ | 122,325 | |
| Origination of mortgage loan receivables | 353,661 | | | | | — | | | 212,845 | |
| | | | | | | |
| Repayment of mortgage loan receivables | (960,832) | | | | | — | | | (404) | |
| Proceeds from sales of mortgage loan receivables | (270,491) | | | | | — | | | (312,273) | |
| Non-cash disposition of loans via foreclosure(1) | (31,249) | | | | | — | | | 0 | |
| Sale of loans, net | (9,596) | | | | | — | | | 8,025 | |
| | | | | | | |
| Accretion/amortization of discount, premium and other fees | 15,530 | | | | | — | | | 0 | |
| Release of asset-specific loan loss provision via foreclosure(1) | — | | | | | 2,500 | | | — | |
| Provision for current expected credit loss (implementation impact)(2) | — | | | | | (4,964) | | | — | |
| Provision for current expected credit loss, net (impact to earnings)(2) | — | | | | | (18,543) | | | — | |
| | | | | | | |
| Balance, December 31, 2020 | $ | 2,354,059 | | | | | $ | (41,507) | | | $ | 30,518 | |
| | | | | | | | | | | | | | | | | | | |
| Mortgage loan receivables held for investment, net, at amortized cost: | | |
| | Mortgage loans receivable | | | | Allowance for credit losses | | Mortgage loan
receivables held
for sale |
| Balance, December 31, 2022 | $ | 3,885,746 | | | | | $ | (20,755) | | | $ | 27,391 | |
| Origination of mortgage loan receivables (1) | 68,415 | | | | | — | | | — | |
| | | | | | | |
| Repayment of mortgage loan receivables (2) | (726,710) | | | | | — | | | — | |
| | | | | | | |
| Non-cash disposition of loans via foreclosure (3) | (91,408) | | | | | — | | | — | |
| Net result from mortgage loan receivables held for sale (4) | — | | | | | — | | | (523) | |
| | | | | | | |
| Accretion/amortization of discount, premium and other fees | 19,046 | | | | | — | | | — | |
| | | | | | | |
| | | | | | | |
| | | | | | | |
| Charge offs | — | | | | | 2,700 | | | — | |
| Release (addition) of provision for current expected credit loss, net (5) | — | | | | | (25,110) | | | — | |
| | | | | | | |
| Balance, December 31, 2023 | $ | 3,155,089 | | | | | $ | (43,165) | | | $ | 26,868 | |
(1)Includes funding of commitments on existing mortgage loans.
(2)Excludes $11.8 million of proceeds received from repayments in transit.
(3)Refer to Note 5, Real Estate and Related Lease Intangibles, Net, for further detail on foreclosure of real estate.
(2)(4)During the year ended December 31, 2020, the initial impactIncludes unrealized lower of the implementation of the CECL accounting standard as of January 1, 2020 is recorded against retained earnings. Subsequent remeasurement, including the period to date changecost or market adjustment and realized gain/loss on loans held for the year ended December 31, 2020, is accounted for as provision for current expected credit loss in the consolidated statements of income.sale.
| | | | | | | | | | | | | | | | | | | | | | | |
| Mortgage loan receivables held for investment, net, at amortized cost: | | |
| | Mortgage loans receivable | | Mortgage loans transferred but not considered sold | | Allowance for credit losses | | Mortgage loan
receivables held
for sale |
| | | | | | | |
| Balance, December 31, 2018 | $ | 3,318,390 | | | $ | — | | | $ | (17,900) | | | $ | 182,439 | |
| Origination of mortgage loan receivables | 1,452,049 | | | — | | | — | | | 946,178 | |
| Purchases of mortgage loan receivables | 0 | | | — | | | — | | | 9,934 | |
| Repayment of mortgage loan receivables | (1,531,551) | | | — | | | — | | | (795) | |
| Proceeds from sales of mortgage loan receivables(1) | 0 | | | (15,504) | | | — | | | (1,008,853) | |
| Non-cash disposition of loan via foreclosure(2) | (45,529) | | | — | | | — | | | 0 | |
| Sale of loans, net | 0 | | | — | | | — | | | 54,758 | |
| Transfer between held for investment and held for sale(1) | 45,832 | | | 15,504 | | | — | | | (61,336) | |
| Accretion/amortization of discount, premium and other fees | 17,845 | | | — | | | — | | | 0 | |
| Provision for/(release of) loan loss reserves | — | | | — | | | (2,600) | | | — | |
| Balance, December 31, 2019 | $ | 3,257,036 | | | $ | 0 | | | $ | (20,500) | | | $ | 122,325 | |
| | | | | | | | | | | | | | | | | | | |
| Mortgage loan receivables held for investment, net, at amortized cost: | | |
| | Mortgage loans receivable | | | | Allowance for credit losses | | Mortgage loan
receivables held
for sale |
| Balance, December 31, 2021 | $ | 3,553,737 | | | | | $ | (31,752) | | | $ | — | |
| Origination of mortgage loan receivables (1) | 1,234,765 | | | | | — | | | 61,318 | |
| | | | | | | |
| Repayment of mortgage loan receivables | (901,082) | | | | | — | | | (68) | |
| Proceeds from sales of mortgage loan receivables | — | | | | | — | | | (29,151) | |
| Non-cash disposition of loans via foreclosure (2) | (10,235) | | | | | — | | | — | |
| Net result from mortgage loan receivables held for sale (3) | 2,197 | | | | | — | | | (4,708) | |
| | | | | | | |
| Accretion/amortization of discount, premium and other fees | 20,759 | | | | | — | | | — | |
| | | | | | | |
| | | | | | | |
| | | | | | | |
| Charge offs | (14,395) | | | | | 14,395 | | | — | |
| Release (addition) of provision for current expected credit loss, net (4) | — | | | | | (3,398) | | | — | |
| | | | | | | |
| Balance, December 31, 2022 | $ | 3,885,746 | | | | | $ | (20,755) | | | $ | 27,391 | |
(1)We sell certainIncludes funding of commitments on existing mortgage loans.
(2)Refer to Note 5, Real Estate and Related Lease Intangibles, Net, for further detail on foreclosure of real estate.
(3)Represents unrealized lower of cost or market adjustment on loans into securitizations; however, for a transfer of financial assets to be considered a sale, the transfer must meet the sale criteria of ASC 860 under which the Company must surrender control over the transferred assets which must qualify as recognized financial assets at the time of transfer. The assets must be isolated from the Company, even in bankruptcy or other receivership, the purchaser must have the right to pledge or sell the assets transferred and the Company may not have an option or obligation to reacquire the assets. If the sale criteria are not met, the transfer is considered to be a secured borrowing, the assets remain on the Company’s consolidated balance sheets and the sale proceeds are recognized as a liability. During the three months ended March 31, 2019, the Company reclassified from mortgage loan receivables held for sale to mortgage loans transferred but not considered sold, at amortized cost, one loan with an outstanding face amount of $15.4 million, a book value of $15.5 million (fair value at the date of reclassification) and a remaining maturity of 9.8 years, which was sold to the WFCM 2019-C49 securitization trust. Subsequent to March 31, 2019, the controlling loan interest was sold to the UBS 2019-C16 securitization trust, and as a result, the loan previously sold during the three months ended March 31, 2019 was accounted for as a sale during the year ended December 31, 2019.sale.
(2)(4)Refer to “Allowance for Credit Losses” table below for further detail.
| | | | | | | | | | | | | | | | | | | |
| Mortgage loan receivables held for investment, net, at amortized cost: | | |
| | Mortgage loans receivable | | | | Allowance for credit losses | | Mortgage loan
receivables held
for sale |
| Balance, December 31, 2020 | $ | 2,354,059 | | | | | $ | (41,507) | | | $ | 30,518 | |
| Origination of mortgage loan receivables | 2,309,888 | | | | | — | | | 220,359 | |
| Purchases of mortgage loan receivables | 63,600 | | | | | — | | | — | |
| Repayment of mortgage loan receivables | (1,059,796) | | | | | — | | | (183) | |
| Proceeds from sales of mortgage loan receivables | (46,557) | | | | | — | | | (259,092) | |
| Non-cash disposition of loan via foreclosure(1) | (81,289) | | | | | — | | | — | |
| Net result from mortgage loan receivables held for sale | — | | | | | — | | | 8,398 | |
| | | | | | | |
| Accretion/amortization of discount, premium and other fees | 13,832 | | | | | — | | | — | |
| | | | | | | |
| Release of asset-specific loan loss provision via foreclosure(1) | — | | | | | 1,150 | | | — | |
| Release (addition) of provision for current expected credit loss, net | — | | | | | 8,605 | | | — | |
| | | | | | | |
| | | | | | | |
| Balance, December 31, 2021 | $ | 3,553,737 | | | | | $ | (31,752) | | | $ | — | |
(1)Refer to Note 5, Real Estate and Related Lease Intangibles, Net, for further detail on real estate acquired via foreclosure.
| | | | | | | | | | | | | | | | | | | |
| Mortgage loan receivables held for investment, net, at amortized cost: | | |
| | Mortgage loans receivable | | | | Allowance for credit losses | | Mortgage loan
receivables held
for sale |
| | | | | | | |
| Balance, December 31, 2017 | $ | 3,282,462 | | | | | $ | (4,000) | | | $ | 230,180 | |
| Origination of mortgage loan receivables | 1,478,771 | | | | | — | | | 1,297,221 | |
| | | | | | | |
| Repayment of mortgage loan receivables | (1,518,066) | | | | | — | | | (14,242) | |
| Proceeds from sales of mortgage loan receivables | 0 | | | | | — | | | (1,291,828) | |
| | | | | | | |
| Sale of loans, net | 0 | | | | | — | | | 16,511 | |
| Transfer between held for investment and held for sale | 55,403 | | | | | — | | | (55,403) | |
| Accretion/amortization of discount, premium and other fees | 19,820 | | | | | — | | | 0 | |
| Provision for (release of) loan loss reserves | — | | | | | (13,900) | | | — | |
| Balance, December 31, 2018 | $ | 3,318,390 | | | | | $ | (17,900) | | | $ | 182,439 | |
During the years ended December 31, 2020, 2019 and 2018, the transfers of financial assets via sales of loans were treated as sales under ASC Topic 860 — Transfers and Servicing. During the year ended December 31, 2019, the transfers of financial assets via sales of loans were treated as sales under ASC Topic 860 — Transfers and Servicing, except for the one loan discussed above.
As of December 31, 2020 and 2019, there was $0.5 million and $0.4 million, respectively, of unamortized discounts included in our mortgage loan receivables held for investment, net, at amortized cost, on our consolidated balance sheets.
Allowance for Credit Losses and Non-Accrual Status ($ in thousands)
| | | Year Ended December 31, | |
| | | 2020 | | 2019 | | 2018 | |
| | | | Year Ended December 31, | |
| | | Year Ended December 31, | |
| | | Year Ended December 31, | |
| Allowance for Credit Losses | | Allowance for Credit Losses | | | | | 2023 | | 2022 | | 2021 |
| Allowance for credit losses at beginning of period | Allowance for credit losses at beginning of period | | $ | 20,500 | | | $ | 17,900 | | | $ | 4,000 | | |
| Provision for current expected credit loss (implementation impact) | | 4,964 | | (5) | | 0 | | | 0 | | |
| Provision for current expected credit loss, net (impact to earnings) (3) | | 18,543 | | (4) | | 2,600 | | | 13,900 | | |
| Provision for (release of) current expected credit loss, net (1) | |
| | Foreclosure of loans subject to asset-specific reserve | Foreclosure of loans subject to asset-specific reserve | | (2,500) | | | 0 | | | 0 | | |
| | Foreclosure of loans subject to asset-specific reserve | |
| Foreclosure of loans subject to asset-specific reserve | |
| Charge-offs | |
| Recoveries (2) | |
| Allowance for credit losses at end of period | Allowance for credit losses at end of period | | $ | 41,507 | | | $ | 20,500 | | | $ | 17,900 | | |
| | | December 31, 2020 | | December 31, 2019 | | |
| Carrying value of loans on non-accrual status, net of asset-specific reserve | | $ | 175,022 | | (1) | $ | 86,025 | | (2) | | |
(1)Represents 2There were no asset-specific reserves recorded for the years ended December 31, 2023, 2022, and 2021.
(2)Recoveries are recognized within the consolidated statements of income through “Provision for (release of) loan loss reserves.”
| | | | | | | | | | | |
| Non-Accrual Status (1) | December 31, 2023(2) | | December 31, 2022(3)(4) |
| Amortized cost basis of loans on non-accrual status, net of asset-specific reserve | $ | 14,541 | | | $ | 53,809 | |
(1)As of December 31, 2023 and December 31, 2022, the Company’s loans on non-accrual status were greater than 90 days past due and are considered collateral dependent.
(2)Comprised of one multi-family with an amortized cost basis of $14.5 million, for which were originated simultaneously as partthe Company determined no asset-specific reserve was necessary.
(3)Includes two retail loans with an amortized cost basis of a single transaction$26.0 million and had a combined carrying valueasset-specific reserves of $24.2$2.7 million.
(4)Includes one mixed-use loan with an amortized cost basis of $30.5 million, 2for which the Company determined no asset-specific reserve was necessary.
During the year ended December 31, 2023, the Company modified two first mortgage loans with a combined carrying valueamortized cost basis of $27.1$106.5 million 1 loan with a carrying valueas of $36.4 million, 1 loan with a carrying value of $13.0 million, 1 loan with a carrying value of $30.6 million, and 1 loan with a carrying value of $43.8 million which was foreclosed on in 2021 and is under contract for sale, as further discussed below.
(2)Represents 2December 31, 2023, or 3.4% of the Company’s mortgage loan receivable portfolio. Together, these modifications resulted in a weighted average extension of 2.3 years, in exchange for terms that included $6.0 million of payments that reduced our amortized cost basis and $6.5 million of reserve replenishments. No principal or interest was forgiven, and Ladder also received a 15% non-controlling common equity interest in one of the properties. The payment structure of both loans which were originated simultaneously as partwas modified to defer a portion of a single transactionthe contractual interest until maturity and had a combined carrying valuethe Company is accruing only the current pay component. As of $24.2 million, 1 loan with a carrying value of $0.4 million and 1 loan with a carrying value of $61.5 million, as further discussed below.
(3)The total provision includes asset specific reserves of $9.2 million, $2.0 million and $12.7 million as well as a general reserve component of $9.4 million, $0.6 million, and $1.2 million forDecember 31, 2023, both loans are current. Subsequent to the years ended 2020, 2019, and 2018 respectively.
(4)Additional provisions for current expected credit losses that impact earningsmodifications, for the year ended 2020 include releasesDecember 31, 2023, the Company accrued $2.6 million of $0.3 million on unfunded commitments and $2.0 thousand on held-to-maturity securities.
(5)Additional provisions for current expected credit lossesinterest income related to implementation of $0.8 million and $22.0 thousand related to unfunded commitments and held-to-maturity securities, respectively, were recorded on January 1, 2020 at implementation of CECL.these two loans.
Current Expected Credit Loss (“CECL”)
On January 1, 2020,As of December 31, 2023, the Company recordedhas a CECL Reserve$43.9 million allowance for current expected credit losses, of $11.6which $43.2 million which equatedpertains to 0.36%mortgage loan receivables and $0.7 million relates to unfunded commitments included in other liabilities in the consolidated balance sheets. As of $3.2 billion carrying valueDecember 31, 2023, the Company concluded that none of its held for investment loan portfolio. This reserve excluded 3 loans that previously hadrequired an aggregate of $14.7 million of asset-specific reserves and a carrying value of $39.8 million as of January 1, 2020. Upon adoption, the aggregated CECL Reserve reduced total shareholder’s equity by $5.8 million.reserve.
As of December 31, 2020,2022, the Company hashad a $42.1$21.5 million allowance for current expected credit losses.losses, of which $20.8 million pertained to mortgage loan receivables and $0.7 million related to unfunded commitments. This includes 3 loans that have an aggregate of $21.4allowance included $2.7 million of asset-specific reserves against a carrying valuerelating to two retail loans with an amortized cost basis of $116.4$26.0 million as of December 31, 2020.2022. The Company concluded that none of its other loans were individually impaired as of December 31, 2022.
The total change in provision for loan loss reserves for the year ended December 31, 2023 was an increase of the provision of $25.1 million. The increase for the year ended December 31, 2023 represents an increase in the general reserve of loans held for investment of $25.1 million. The increase in provision associated with the general reserve during the year ended December 31, 2023 is due to adverse changes in macroeconomic market conditions affecting commercial real estate.
The total change in reserveprovision for provisionloan loss reserves for the year ended December 31, 20202022 was $18.3 million, which includes $9.1 millionan increase of the provision of $3.7 million. The net increase for the year ended December 31, 2022 represents an increase in the general reserve on both theof loans held for investment of $6.5 million, and the related unfunded commitments and $9.2 million in asset-specific provisionan increase related to 3 loans. These increases and decreasesunfunded loan commitments $0.3 million, partially offset by a $3.1 million recovery of provision. The increase in the general reserve during the year areended December 31, 2022 was primarily due to the update of the macro economic assumptions used instead of the more stable “Baseline” scenario from the Federal Reserve that was utilizedadverse changes in macroeconomic scenarios and an overall increase in the January 1, 2020 CECL reserve analysis. For additional information, refer to “Allowance for Credit Losses and Non-Accrual Status” in Note 3, Mortgage Loan Receivables to the consolidated financial statements.size of our balance sheet first mortgage portfolio as a result of net originations during that time.
The Company has concluded that none of its loans, other than the 4 loans discussed below, are individually impaired as of December 31, 2020.
Loan Portfolio by Geographic Region, Property Type and Vintage ($ in thousands)
| | | | | | | | | | | | | | | | |
| | Amortized Cost | | | | |
Geographic Region | | | | | | | | |
| | | | | | | | | | |
Northeast | | $ | 707,485 | | | | | | | | | |
Southwest | | 437,153 | | | | | | | | | |
South | | 313,759 | | | | | | | | | |
Midwest | | 462,602 | | | | | | | | | |
West | | 316,620 | | | | | | | | | |
Subtotal loans | | 2,237,619 | | | | | | | | | |
Individually impaired loans(1) | | 116,440 | | | | | | | | | |
Total loans | | $ | 2,354,059 | | | | | | | | | |
(1)Included in individually impaired loans are 2 loans, which were originated in 2016 simultaneously as part of a single transaction with a combined amortized cost of $26.9 million, collateralized by a mixed use property located in the Northeast region; 1 loan, which was originated in 2016 and subsequently restructured into 2 loans in 2018, with a combined amortized cost of $44.6 million, collateralized by a mixed use property located in the Northeast region; and 1 loan, originated in 2018, with an amortized cost of $45.0 million, collateralized by a hotel located in the South region. The above individually impaired loans’ amortized cost bases exclude asset-specific provisions totaling $21.4 million.
Management’s method for monitoring credit is the performance of a loan. A loan is impaired or not impaired based on the expectation that all amounts contractually due under a loan will be collected when due. The primary credit quality indicator management utilizes to assess its current expected credit loss reserve is by viewing Ladder’sthe Company’s mortgage loan portfolio by collateral type. The primary credit quality indicator is reviewed by management on a quarterly basis. The following table summarizestables summarize the amortized cost of the mortgage loan portfolio by propertycollateral type as of December 31, 2023 and December 31, 2022, respectively ($ in thousands).:
| | | Amortized Cost Basis by Origination Year as of December 31, 2023 | |
| | Amortized Cost Basis by Origination Year as of December 31, 2023 | |
| | Amortized Cost Basis by Origination Year as of December 31, 2023 | |
| Collateral Type | |
| Collateral Type | |
| Collateral Type | |
| | Multifamily | |
| | Multifamily | |
| | Multifamily | |
| Office | |
| Office | |
| Office | |
| Mixed Use | |
| Mixed Use | |
| Mixed Use | |
| Industrial | |
| Industrial | |
| Industrial | |
| Manufactured Housing | |
| Manufactured Housing | |
| Manufactured Housing | |
| Retail | |
| Retail | |
| Retail | |
| Hospitality | |
| Hospitality | |
| Hospitality | |
| Other | |
| Other | |
| Other | |
| | | Amortized Cost Basis by Origination Year | | |
| Property Type | | 2020 | | 2019 | | 2018 | | 2017 | | 2016 and Earlier | | Total | |
| | Office | | $ | 0 | | | $ | 196,610 | | | $ | 249,330 | | | $ | 83,673 | | | $ | 50,935 | | | $ | 580,548 | | |
| Multifamily | | 65,537 | | | 260,254 | | | 44,665 | | | 24,406 | | | 0 | | | 394,862 | | |
| Hospitality | | 0 | | | 43,000 | | | 139,394 | | | 67,307 | | | 78,694 | | | 328,395 | | |
| Other | | 31,217 | | | 131,434 | | | 77,484 | | | 0 | | | 0 | | | 240,135 | | |
| Mixed Use | | 106,537 | | | 101,704 | | | 0 | | | 13,268 | | | 0 | | | 221,509 | | |
| Retail | | 0 | | | 110,492 | | | 0 | | | 0 | | | 65,734 | | | 176,226 | | |
| Industrial | | 46,130 | | | 114,630 | | | 0 | | | 0 | | | 6,461 | | | 167,221 | | |
| Manufactured Housing | | 4,553 | | | 57,305 | | | 11,718 | | | 0 | | | 3,961 | | | 77,537 | | |
| Self-Storage | | 0 | | | 35,986 | | | 15,200 | | | 0 | | | 0 | | | 51,186 | | |
| Subtotal loans | | 253,974 | | | 1,051,415 | | | 537,791 | | | 188,654 | | | 205,785 | | | 2,237,619 | | |
| Individually Impaired loans (1) | | 0 | | | 0 | | | 44,952 | | | 0 | | | 71,488 | | | 116,440 | | |
| Total loans (2) | | $ | 253,974 | | | $ | 1,051,415 | | | $ | 582,743 | | | $ | 188,654 | | | $ | 277,273 | | | $ | 2,354,059 | | |
| | Subtotal mortgage loans receivable | |
| | Subtotal mortgage loans receivable | |
| | Subtotal mortgage loans receivable | |
| Individually Impaired loans | |
| Individually Impaired loans | |
| Individually Impaired loans | |
| Total mortgage loans receivable (2) | |
| Total mortgage loans receivable (2) | |
| Total mortgage loans receivable (2) | |
| | | | | | | | | | | | | | | | | | | | | | | | | | | | | | | | | | | | | | | | | | | | | | |
| | Amortized Cost Basis by Origination Year as of December 31, 2022 | | | | | | |
| Collateral Type | | 2022 | | 2021 | | 2020 | | 2019 | | 2018 and Earlier | | Total | | | | | | | |
| | | | | | | | | | | | | | | | | | | | |
| Multifamily | | $ | 702,125 | | | $ | 722,862 | | | $ | — | | | $ | — | | | $ | — | | | $ | 1,424,987 | | | | | | | | | |
| Office | | 78,754 | | | 676,431 | | | 29,650 | | | 58,684 | | | 136,512 | | | 980,031 | | | | | | | | | |
| Mixed Use | | 201,777 | | | 351,291 | | | 26,500 | | | 120,300 | | | — | | | 699,868 | | | | | | | | | |
| Industrial | | 37,616 | | | 96,486 | | | — | | | 115,545 | | | — | | | 249,647 | | | | | | | | | |
| Retail | | 60,089 | | | 107,305 | | | — | | | 12,953 | | | 9,126 | | | 189,473 | | | | | | | | | |
| Hospitality | | — | | | 45,416 | | | — | | | 13,843 | | | 78,364 | | | 137,623 | | | | | | | | | |
| Manufactured Housing | | 32,515 | | | 82,618 | | | — | | | 2,921 | | | — | | | 118,054 | | | | | | | | | |
| Other | | 32,353 | | | 19,898 | | | — | | | 7,800 | | | — | | | 60,051 | | | | | | | | | |
| | | | | | | | | | | | | | | | | | | | |
| | | | | | | | | | | | | | | | | | | | |
| | | | | | | | | | | | | | | | | | | | |
| | | | | | | | | | | | | | | | | | | | |
| | | | | | | | | | | | | | | | | | | | |
| | | | | | | | | | | | | | | | | | | | |
| | | | | | | | | | | | | | | | | | | | |
| | | | | | | | | | | | | | | | | | | | |
| | | | | | | | | | | | | | | | | | | | |
| Subtotal mortgage loans receivable | | 1,145,229 | | | 2,102,307 | | | 56,150 | | | 332,046 | | | 224,002 | | | 3,859,734 | | | | | | | | | |
| Individually Impaired loans | | — | | | — | | | — | | | — | | | 26,012 | | | 26,012 | | | | | | | | | |
| Total mortgage loans receivable (3) | | $ | 1,145,229 | | | $ | 2,102,307 | | | $ | 56,150 | | | $ | 332,046 | | | $ | 250,014 | | | $ | 3,885,746 | | | | | | | | | |
(1)IncludedFor the year ended December 31, 2023, there was a $2.7 million of write-off of an asset-specific allowance in individually impaired loans are 2 loans, which were originated in 2016 simultaneously as part of a single transactionconnection with a combined amortized costforeclosure of $26.9 million, collateralized by a mixed useone retail property located in the Northeast region, 1 loan, which was originated in 2016 and subsequently restructured into 2 loans in 2018, with a combined amortized cost of $44.6 million, collateralized by a mixed use property located in the Northeast region, and 1 loan, originated in 2018, with a amortized cost of $45.0 million, collateralized by a hotel located in the South region. The above individually impaired loans’ amortized cost basis excludes asset-specific provisions totaling $21.4 million.New York, NY.
(2)Not included above is $14.5$22.4 million of accrued interest receivable on all loans at December 31, 2023.
(3)Not included above is $23.2 million of accrued interest receivable on all loans at December 31, 2020.2022.
Individually Impaired Loans
As of December 31, 2020, 2 loans with a carrying value of $24.2 million were impaired and on non-accrual status. The loans are collateralized by a mixed use property in the Northeast region, which were originated simultaneously as part of a single transaction and are directly and indirectly secured by the same property. In assessing these collateral-dependent loans for impairment, the most significant consideration is the fair value of the underlying real estate collateral, which includes an in-place long-dated retail lease. The value of such property is most significantly affected by the contractual lease terms and the appropriate market capitalization rates, which are driven by the property’s market strength, the general interest rate environment and the retail tenant’s creditworthiness. In view of these considerations, the Company uses a direct capitalization rate valuation methodology to calculate the fair value of the underlying real estate collateral. The Company previously recorded an asset-specific provision for loss in 2018 on 1 of these loans, with a carrying value of $5.9 million, of $2.7 million to reduce the carrying value of the two loans collectively to the fair value of the property less the cost to foreclose and sell the property utilizing direct capitalization rates of 4.70% to 5.00%. As of December 31, 2020, the Company believed no additional loss provision was necessary based on the application of direct capitalization rates of 4.60% to 4.90%.
In 2018, a loan secured by a mixed-use property in the Northeast region, with a carrying value of $45.0 million, was determined to be impaired and a reserve of $10.0 million was recorded to reduce the carrying value of the loan to the estimated fair value of the collateral, less the estimated costs to sell. In 2018, the loan experienced a maturity default and its terms were modified in a TDR, which provided for, among other things, the restructuring of the Company’s existing $45.0 million first mortgage loan into a $35.0 million A-Note and a $10.0 million B-Note. The reserve of $10.0 million was applied to the B-Note and the B-Note was placed on non-accrual status. For the three months ended March 31, 2020, management determined that the A-Note was impaired, reflecting a decline in collateral value due to: (i) new information available during the three months ended March 31, 2020 regarding two recent comparable sales and (ii) a change in market conditions driven by COVID-19 as capital flow to the tertiary markets shifted. As a result, on March 31, 2020, the Company recorded an asset-specific provision for loss on the A-Note of $7.5 million to reduce the carrying value of this loan to the fair value of the property less the cost to foreclose and sell the property utilizing direct capitalization rates of 7.50% to 8.60%. The Company placed the A-Note on non-accrual status as of March 31, 2020. As of December 31, 2020, the combined carrying value, after impairment of the A-Note and the B-Note was $27.1 million.
For the three months ended December 31, 2020, management identified 1 loan secured by a hotel in the Southeast region with a carrying value of $45.0 million as impaired, reflecting a decline in the collateral value attributable to new information available related to a purchase offer on the property. A reserve of $1.2 million was recorded for this impaired loan in the three months ended December 31, 2020 to reduce the carrying value of the loan to the estimated fair value of the collateral, less the estimated costs to sell. Subsequent to year end, in February 2021, the Company foreclosed on the asset and closed on the sale of the asset.
As of December 31, 2020, there were no unfunded commitments associated with modified loans considered TDRs.
These non-recurring fair values are considered Level 3 measurements in the fair value hierarchy.
Other Loans on Non-Accrual Status
As of December 31, 2020, 3 other loans were on non-accrual status, with a combined carrying value of $79.9 million. The Company put such loans on non-accrual status in the fourth quarter 2020 and performed a review of the collateral for the loans. The review consisted of conversations with market participants familiar with the property locations as well as reviewing market data and comparable properties. The Company will continue to monitor for impairment.
There are 0 other loans on non-accrual status other than those discussed in Individually Impaired Loans and Other Loans on Non-Accrual Status above as of December 31, 2020.
4. REAL ESTATE SECURITIES
The Company invests in primarily AAA-rated real estate securities, typically front pay securities, with relatively short duration and significant credit subordination. CMBS,
Commercial mortgage-backed securities (“CMBS”), CMBS interest-only securities, U.S. Agency securities, Government National Mortgage Association (“GNMA”) construction securities, GNMA permanent securities and corporate bonds and U.S. Treasury securities are classified as available-for-sale and reported at fair value with changes in fair value recorded in the current period in other comprehensive income. GNMAAs of December 31, 2023, the Company does not intend to sell these investments and it is not more likely than not that the Company will be required to sell the investments before recovery of their amortized cost bases.
Government National Mortgage Association (“GNMA”) interest-only, Federal Home Loan Mortgage Corp (“FHLMC”) and equity securities (collectively, “Agency interest-only securities”) are recorded at fair value with changes in fair value recordedrecognized in current period earnings. Equity securities are reported at fair value with changesearnings in fair value recorded in current period earnings.the consolidated statements of income. The following is a summary of the Company’s securities at December 31, 20202023 and 2019December 31, 2022 ($ in thousands):
December 31, 20202023
| | | | | | | | | | | | | | | | | | | | | | | | | | | | | | | | | | | | | | | | | | | | | | | | | | | | | | | | | | | | | | |
| | | | | | | Gross Unrealized | | | | | | Weighted Average |
| Asset Type | | Outstanding
Face Amount | | Amortized Cost Basis | | Gains | | Losses | | Carrying
Value | | # of
Securities | | Rating (1) | | Coupon % | | Yield % | | Remaining
Duration
(years) |
| | | | | | | | | | | | | | | | | | | | |
| CMBS(2) | | $ | 1,015,520 | | | $ | 1,015,282 | | | $ | 1,382 | | | $ | (13,363) | | | $ | 1,003,301 | | (3) | 90 | | | AAA | | 1.56 | % | | 1.56 % | | 2.01 |
| CMBS interest-only(2)(4) | | 1,498,181 | | | 21,567 | | | 672 | | | (26) | | | 22,213 | | (5) | 15 | | | AAA | | 0.44 | % | | 3.53 % | | 2.19 |
| GNMA interest-only(4)(6) | | 75,350 | | | 868 | | | 232 | | | (100) | | | 1,000 | | | 11 | | | AA+ | | 0.43 | % | | 5.06 % | | 3.59 |
| Agency securities(2) | | 586 | | | 593 | | | 12 | | | 0 | | | 605 | | | 2 | | | AA+ | | 2.55 | % | | 1.64 % | | 1.26 |
| GNMA permanent securities(2) | | 30,254 | | | 30,340 | | | 859 | | | 0 | | | 31,199 | | | 5 | | | AA+ | | 3.87 | % | | 3.49 % | | 1.98 |
| Total debt securities | | $ | 2,619,891 | | | $ | 1,068,650 | | | $ | 3,157 | | | $ | (13,489) | | | $ | 1,058,318 | | | 123 | | | | | 0.91 | % | | 1.66 | % | | 2.01 |
| | | | | | | | | | | | | | | | | | | | |
| Provision for current expected credit losses | | N/A | | — | | | — | | | (20) | | | (20) | | | | | | | | | | | |
| Total real estate securities | | $ | 2,619,891 | | | $ | 1,068,650 | | | $ | 3,157 | | | $ | (13,509) | | | $ | 1,058,298 | | | 123 | | | | | | | | | |
| | | | | | | | | | | | | | | | | | | | | | | | | | | | | | | | | | | | | | | | | | | | | | | | | | | | | | | | | | | | | | |
| | | | | | | Gross Unrealized | | | | | | Weighted Average |
| Asset Type | | Outstanding
Face Amount | | Amortized Cost Basis | | Gains | | Losses (7) | | Carrying
Value | | # of
Securities | | Rating (1) | | Coupon % | | Yield % | | Remaining
Duration
(years) |
| CMBS | | $ | 439,679 | | | $ | 439,052 | | | $ | 277 | | | $ | (14,439) | | | $ | 424,890 | | (2) | 64 | | | AAA | | 6.67 % | | 6.83 % | | 2.00 |
| CMBS interest-only(3) | | 876,555 | | (3) | 6,453 | | | 169 | | | (53) | | | 6,569 | | (4) | 9 | | | AAA | | 0.57 % | | 6.61 % | | 1.07 |
| GNMA interest-only(5) | | 37,053 | | (3) | 214 | | | 51 | | | (52) | | | 213 | | | 14 | | | AAA | | 0.36 % | | 6.12 % | | 3.60 |
| Agency securities | | 22 | | | 22 | | | — | | | (1) | | | 21 | | | 1 | | | AAA | | 4.00 % | | 2.70 % | | 1.05 |
| U.S. Treasury securities | | 54,031 | | | 53,648 | | | 68 | | | — | | | 53,716 | | | 7 | | | AAA | | N/A | | 5.41 % | | 0.07 |
| | | | | | | | | | | | | | | | | | | | |
| | | | | | | | | | | | | | | | | | | | |
| Total debt securities | | $ | 1,407,340 | | | $ | 499,389 | | | $ | 565 | | | $ | (14,545) | | | $ | 485,409 | | (6) | 95 | | | | | 2.55 | % | | 6.82 | % | | 1.98 |
| Equity securities | | N/A | | 160 | | | — | | | (16) | | | 144 | | | 1 | | | N/A | | N/A | | N/A | | N/A |
| | | | | | | | | | | | | | | | | | | | |
| Allowance for current expected credit losses | | N/A | | — | | | — | | | (20) | | | (20) | | | | | | | | | | | |
| Total securities | | $ | 1,407,340 | | | $ | 499,549 | | | $ | 565 | | | $ | (14,581) | | | $ | 485,533 | | | 96 | | | | | | | | | |
December 31, 2022
| | | | | | | | | | | | | | | | | | | | | | | | | | | | | | | | | | | | | | | | | | | | | | | | | | | | | | | | | | | | | | |
| | | | | | | Gross Unrealized | | | | | | Weighted Average |
| Asset Type | | Outstanding
Face Amount | | Amortized
Cost Basis | | Gains | | Losses (7) | | Carrying
Value | | # of
Securities | | Rating (1) | | Coupon % | | Yield % | | Remaining
Duration
(years) |
| | | | | | | | | | | | | | | | | | | | |
| CMBS | | $ | 562,839 | | | $ | 562,246 | | | $ | — | | | $ | (20,913) | | | $ | 541,333 | | (2) | 71 | | | AAA | | 5.22 | % | | 5.32 | % | | 1.06 |
| CMBS interest-only(3) | | 1,026,195 | | (3) | 10,498 | | | 121 | | | (176) | | | 10,443 | | (4) | 10 | | | AAA | | 0.41 | % | | 3.65 | % | | 1.45 |
| GNMA interest-only(5) | | 45,369 | | (3) | 285 | | | 17 | | | (21) | | | 281 | | | 14 | | | AAA | | 0.31 | % | | 4.23 | % | | 3.30 |
| Agency securities | | 36 | | | 36 | | | — | | | (1) | | | 35 | | | 1 | | | AAA | | 4.00 | % | | 2.70 | % | | 1.54 |
| | | | | | | | | | | | | | | | | | | | |
| | | | | | | | | | | | | | | | | | | | |
| U.S. Treasury securities | | 36,000 | | | 35,374 | | | 6 | | | (52) | | | 35,328 | | | 10 | | | AAA | | N/A | | 4.17 | % | | 0.60 |
| Total debt securities | | $ | 1,670,439 | | | $ | 608,439 | | | $ | 144 | | | $ | (21,163) | | | $ | 587,420 | | (6) | 106 | | | | | 2.06 | % | | 5.29 | % | | 1.07 |
| Equity securities | | N/A | | 160 | | | — | | | (41) | | | 119 | | | 1 | | | N/A | | N/A | | N/A | | N/A |
| Allowance for current expected credit losses | | N/A | | — | | | — | | | (20) | | | (20) | | | | | | | | | | | |
| Total securities | | $ | 1,670,439 | | | $ | 608,599 | | | $ | 144 | | | $ | (21,224) | | | $ | 587,519 | | | 107 | | | | | | | | | |
(1)Represents the weighted average of the ratings of all securities in each asset type, expressed as an S&P equivalent rating. For each security rated by multiple rating agencies, the highest rating is used. RatingsThe ratings provided were determined by third-party rating agencies as of a particular date,agencies. The rates may not be current and are subject to change (including the assignment of a “negative outlook” or “credit watch”) at any time.
(2)CMBS, CMBS interest-only securities, Agency securities, GNMA permanent securitiesAs of December 31, 2023 and corporate bonds are classified as available-for-sale and reported at fair value with changes in fair value recorded in the current period in other comprehensive income.
(3)Includes $11.1December 31, 2022, includes $9.0 million of restricted securities which are designated as risk retention securities under the Dodd-Frank Wall Street Reform and Consumer Protection Act of 2010, (the “Dodd-Frankas amended (“Dodd-Frank Act”) and are therefore subject to transfer restrictions over the term of the securitization trust and are classified as held-to-maturity and reported at amortized cost.
(4)(3)The amounts presented represent the principal amount of the mortgage loans outstanding in the pool in which the interest-only securities participate.
(4)Includes $0.7As of December 31, 2023 and December 31, 2022, includes $0.3 million and $0.4 million, respectively of restricted securities which are designated as risk retention securities under the Dodd-Frank Act and are therefore subject to transfer restrictions over the term of the securitization trust and are classified as held-to-maturity and reported at amortized cost.
(6)(5)AgencyGNMA interest-only securities are recorded at fair value with changes in fair value recorded in current period earnings. The Company’s AgencyGNMA interest-only securities are considered to be hybrid financial instruments that contain embedded derivatives. As a result, the Company has elected to account for them as hybrid instruments in their entirety at fair value with changes in fair value recognized in unrealized gain (loss) on Agency interest-only securities in the consolidated statements of income in accordance with ASC 815.
December 31, 2019
| | | | | | | | | | | | | | | | | | | | | | | | | | | | | | | | | | | | | | | | | | | | | | | | | | | | | | | | | | | | | | |
| | | | | | | Gross Unrealized | | | | | | Weighted Average |
| Asset Type | | Outstanding
Face Amount | | Amortized
Cost Basis | | Gains | | Losses | | Carrying
Value | | # of
Securities | | Rating (1) | | Coupon % | | Yield % | | Remaining
Duration
(years) |
| | | | | | | | | | | | | | | | | | | | |
| CMBS(2) | | $ | 1,640,597 | | | $ | 1,640,905 | | | $ | 4,337 | | | $ | (920) | | | $ | 1,644,322 | | (3) | 125 | | | AAA | | 3.06 | % | | 3.08 | % | | 2.41 |
| CMBS interest-only(2)(4) | | 1,559,160 | | | 28,553 | | | 630 | | | (37) | | | 29,146 | | (5) | 15 | | | AAA | | 0.60 | % | | 3.04 | % | | 2.53 |
| GNMA interest-only(4)(6) | | 109,783 | | | 1,982 | | | 123 | | | (254) | | | 1,851 | | | 11 | | | AA+ | | 0.49 | % | | 4.59 | % | | 2.77 |
| Agency securities(2) | | 629 | | | 640 | | | 1 | | | (4) | | | 637 | | | 2 | | | AA+ | | 2.65 | % | | 1.73 | % | | 1.83 |
| GNMA permanent securities(2) | | 31,461 | | | 31,681 | | | 688 | | | 0 | | | 32,369 | | | 6 | | | AA+ | | 3.91 | % | | 3.17 | % | | 1.93 |
| | | | | | | | | | | | | | | | | | | | |
| Total debt securities | | $ | 3,341,630 | | | $ | 1,703,761 | | | $ | 5,779 | | | $ | (1,215) | | | $ | 1,708,325 | | | 159 | | | | | 1.84 | % | | 3.06 | % | | 2.39 |
| Equity securities(7) | | N/A | | 12,848 | | | 292 | | | (160) | | | 12,980 | | | 2 | | | N/A | | N/A | | N/A | | N/A |
| Total real estate securities | | $ | 3,341,630 | | | $ | 1,716,609 | | | $ | 6,071 | | | $ | (1,375) | | | $ | 1,721,305 | | | 161 | | | | | | | | | |
(1)Represents the weighted average of the ratings of all securities in each asset type, expressed as an S&P equivalent rating. For each security rated by multiple rating agencies, the highest rating is used. Ratings provided were determined by third-party rating agencies as of a particular date, may not be current and are subject to change (including the assignment of a “negative outlook” or “credit watch”) at any time.
(2)CMBS, CMBS interest-only securities, Agency securities, GNMA permanent securities and corporate bonds are classified as available-for-sale and reported at fair value with changes in fair value recorded in the current period in other comprehensive income.
(3)Includes $11.6 million of restricted securities which are designated as risk retention securities under the Dodd-Frank Act and are therefore subject to transfer restrictions over the term of the securitization trust and are classified as held-to-maturity and reported at amortized cost.
(4)The amounts presented represent the principal amount of the mortgage loans outstanding in the pool in which the interest-only securities participate.
(5)Includes $0.8 million of restricted securities which are designated as risk retention securities under the Dodd-Frank Act and are therefore subject to transfer restrictions over the term of the securitization trust and are classified as held-to-maturity and reported at amortized cost.
(6)Agency interest-only securities are recorded at fair value with changes in fair value recorded in current period earnings. The Company’s Agency interest-onlyinvestments in debt securities are consideredrepresent an ownership interest in unconsolidated VIEs. The Company’s maximum exposure to be hybrid financial instruments that contain embedded derivatives. As a result,loss from these unconsolidated VIEs is the Company accounts for themamortized cost basis of the securities which represents the purchase price of the investment adjusted by any unamortized premiums or discounts as hybrid instruments in their entirety at fair value with changes in fair value recognized in unrealized gain (loss) on Agency interest-only securities inof the consolidated statements of income in accordance with ASC 815.reporting date.
(7)The Company has electedBased on the Company’s analysis, including review of interest rate changes and current levels of subordination, among other factors, the unrealized loss positions are determined to account for equity securities at fair value with changes in fair value recorded in current period earnings.be due to market factors other than credit.
The following is a breakdown ofsummarizes the carrying value of the Company’s debt securities by remaining maturity based upon expected cash flows at December 31, 20202023 and 2019December 31, 2022 ($ in thousands):
December 31, 20202023
| | | | | | | | | | | | | | | | | | | | | | | | | | | | | | | | |
| Asset Type | | Within 1 year | | 1-5 years | | 5-10 years | | After 10 years | | Total |
| | | | | | | | | | |
| CMBS | | $ | 81,343 | | | $ | 343,547 | | | $ | — | | | $ | — | | | $ | 424,890 | |
| CMBS interest-only | | 2,121 | | | 4,448 | | | — | | | — | | | 6,569 | |
| GNMA interest-only | | 86 | | | 22 | | | 105 | | | — | | | 213 | |
| Agency securities | | — | | | 21 | | | — | | | — | | | 21 | |
| | | | | | | | | | |
| | | | | | | | | | |
| U.S. Treasury securities | | 53,716 | | | — | | | — | | | — | | | 53,716 | |
| | | | | | | | | | |
| Total securities (1) | | $ | 137,266 | | | $ | 348,038 | | | $ | 105 | | | $ | — | | | $ | 485,409 | |
(1)Excluded from the table above are $0.1 million of equity securities and $(20.0) thousand of allowance for current expected credit losses.
| | | | | | | | | | | | | | | | | | | | | | | | | | | | | | | | |
| Asset Type | | Within 1 year | | 1-5 years | | 5-10 years | | After 10 years | | Total |
| | | | | | | | | | |
| CMBS | | $ | 230,977 | | | $ | 748,953 | | | $ | 23,371 | | | $ | 0 | | | $ | 1,003,301 | |
| CMBS interest-only | | 1,572 | | | 20,641 | | | 0 | | | 0 | | | 22,213 | |
| GNMA interest-only | | 65 | | | 647 | | | 288 | | | 0 | | | 1,000 | |
| Agency securities | | 0 | | | 605 | | | 0 | | | 0 | | | 605 | |
| GNMA permanent securities | | 67 | | | 31,132 | | | 0 | | | 0 | | | 31,199 | |
| | | | | | | | | | |
| Provision for current expected credit losses | | 0 | | | 0 | | | 0 | | | 0 | | | (20) | |
| Total debt securities | | $ | 232,681 | | | $ | 801,978 | | | $ | 23,659 | | | $ | 0 | | | $ | 1,058,298 | |
December 31, 20192022
| | | | | | | | | | | | | | | | | | | | | | | | | | | | | | | | |
| Asset Type | | Within 1 year | | 1-5 years | | 5-10 years | | After 10 years | | Total |
| | | | | | | | | | |
| CMBS | | $ | 346,272 | | | $ | 195,061 | | | $ | — | | | $ | — | | | $ | 541,333 | |
| CMBS interest-only | | 937 | | | 9,506 | | | — | | | — | | | 10,443 | |
| GNMA interest-only | | 40 | | | 111 | | | 130 | | | — | | | 281 | |
| Agency securities | | — | | | 35 | | | — | | | — | | | 35 | |
| | | | | | | | | | |
| | | | | | | | | | |
| U.S. Treasury securities | | 32,451 | | | 2,877 | | | — | | | — | | | 35,328 | |
| | | | | | | | | | |
| Total securities (1) | | $ | 379,700 | | | $ | 207,590 | | | $ | 130 | | | $ | — | | | $ | 587,420 | |
| | | | | | | | | | | | | | | | | | | | | | | | | | | | | | | | |
| Asset Type | | Within 1 year | | 1-5 years | | 5-10 years | | After 10 years | | Total |
| | | | | | | | | | |
| CMBS | | $ | 177,193 | | | $ | 1,389,392 | | | $ | 77,737 | | | $ | 0 | | | $ | 1,644,322 | |
| CMBS interest-only | | 1,439 | | | 27,707 | | | 0 | | | 0 | | | 29,146 | |
| GNMA interest-only | | 91 | | | 1,504 | | | 256 | | | 0 | | | 1,851 | |
| Agency securities | | 0 | | | 637 | | | 0 | | | 0 | | | 637 | |
| GNMA permanent securities | | 416 | | | 31,953 | | | 0 | | | 0 | | | 32,369 | |
| | | | | | | | | | |
| Total debt securities | | $ | 179,139 | | | $ | 1,451,193 | | | $ | 77,993 | | | $ | 0 | | | $ | 1,708,325 | |
(1)Excluded from the table above are $0.1 million of equity securities and $(20.0) thousand of allowance for current expected credit losses.
During the yearsyear ended December 31, 2020 and 2019,2023, the Company realized a gain (loss) on the sale ofdid not sell any equity securities of $1.1 million and $0.2 million, respectively, which is included in realized gain (loss) on securities on the Company’s consolidated statements of income. There was a $0.1 million realized a gain (loss) on the sale of equity securities forsecurities. During the year ended December 31, 2018.
During the years ended December 31, 2020, 2019, and 2018,2022, the Company realized losses on securities recorded as other than temporary impairmentssold $1.5 million of $0.5 million, $0.1 million and $2.8 million, respectively, which are included in realized gain (loss) on securities on the Company’s consolidated statements of income.equity securities.
5. REAL ESTATE AND RELATED LEASE INTANGIBLES, NET
The market conditions due to the COVID-19 pandemic and the resulting economic disruption have broadly impacted the commercialCompany’s real estate sector. As expected, the net leased commercial real estate properties, which comprise the majority of our portfolio, have remained minimally impacted as the majorityassets were comprised of the net leased properties in our real estate portfolio are necessity-based businesses and have remained open and stable during the COVID-19 pandemic. We continue to actively monitor the diversified commercial real estate properties for both the immediate and long term impact of the pandemic on the buildings, the tenants, the business plans and the ability to execute those business plans.
The following tables present additional detail related to our real estate portfolio, net, including foreclosed properties ($ in thousands):
| | December 31, 2023 | | | December 31, 2023 | | December 31, 2022 |
| | | December 31, 2020 | | December 31, 2019 |
| | Land | |
| Land | |
| Land | Land | $ | 220,511 | | | $ | 209,955 | |
| Building | Building | 838,542 | | | 883,005 | |
| In-place leases and other intangibles | In-place leases and other intangibles | 157,176 | | | 161,203 | |
| Undepreciated Real estate and related lease intangibles | 1,216,229 | | | 1,254,163 | |
| Undepreciated real estate and related lease intangibles | |
| Less: Accumulated depreciation and amortization | Less: Accumulated depreciation and amortization | (230,925) | | | (206,082) | |
| | Real estate and related lease intangibles, net | $ | 985,304 | | | $ | 1,048,081 | |
| Real estate and related lease intangibles, net(1) | |
| Real estate and related lease intangibles, net(1) | |
| Real estate and related lease intangibles, net(1) | |
| | Below market lease intangibles, net (other liabilities) | $ | (36,952) | | | $ | (39,067) | |
| Below market lease intangibles, net (other liabilities)(2) | |
| Below market lease intangibles, net (other liabilities)(2) | |
| Below market lease intangibles, net (other liabilities)(2) | |
AtThere was unencumbered real estate of $160.8 million and $140.3 million as of December 31, 20202023 and 2019, the Company held foreclosed properties included in real estate and relatedDecember 31, 2022, respectively.
(2)Below market lease intangibles is net with a carrying value of $106.8$15.8 million and $89.5$13.6 million of accumulated amortization as of December 31, 2023 and December 31, 2022, respectively.
The following table presents depreciation and amortization expense on real estate recorded by the Company ($ in thousands):
| | | | | | Year Ended December 31, |
| | | | 2020 | | 2019 | | 2018 | | | Year Ended December 31, |
| | | | | | | 2023 | | 2022 | | 2021 |
| Depreciation expense(1) | Depreciation expense(1) | | $ | 32,383 | | | $ | 30,421 | | | $ | 31,537 | |
| Amortization expense | Amortization expense | | 6,696 | | | 7,991 | | | 10,347 | |
| Total real estate depreciation and amortization expense | Total real estate depreciation and amortization expense | | $ | 39,079 | | | $ | 38,412 | | | $ | 41,884 | |
(1)Depreciation expense on the consolidated statements of income also includes $99 thousand, $99$0.4 million, $41 thousand, and $75$99 thousand of depreciation on corporate fixed assets for the years ended December 31, 2020, 20192023, 2022 and 2018,2021, respectively.
The Company’s intangible assets are comprised of in-place leases, above market leases and other intangibles. The following tables present additional detail related to our intangible assets ($ in thousands):
| | | | December 31, 2020 | | December 31, 2019 | | December 31, 2023 | | December 31, 2022 |
| | Gross intangible assets(1) | Gross intangible assets(1) | $ | 157,176 | | | $ | 161,203 | |
| Gross intangible assets(1) | |
| Gross intangible assets(1) | |
| Accumulated amortization | Accumulated amortization | 66,014 | | | 62,773 | |
| Net intangible assets | Net intangible assets | $ | 91,162 | | | $ | 98,430 | |
(1)Includes $4.2 million and $4.5$2.8 million of unamortized above market lease intangibles, which are included in real estate and related lease intangibles, net on the consolidated balance sheets as of December 31, 20202023 and 2019, respectively.December 31, 2022.
The following table presents increases/reductions in operating lease income
related to the amortization of above or below market leases recorded by the Company ($ in thousands):
| | | | | | | | | | | | | | | | | | | | | |
| | | | Year Ended December 31, |
| | | | | | 2023 | | 2022 | | 2021 |
| | | | | | | | | |
| Reduction in operating lease income for amortization of above market lease intangibles acquired | | | | | $ | (309) | | | $ | (305) | | | $ | (367) | |
| Increase in operating lease income for amortization of below market lease intangibles acquired | | | | | 2,106 | | | 2,068 | | | 2,255 | |
| Total | | | | | $ | 1,797 | | | $ | 1,763 | | | $ | 1,888 | |
| | | | | | | | | | | | | | | | | | | | | |
| | | | Year Ended December 31, |
| | | | | | 2020 | | 2019 | | 2018 |
| | | | | | | | | |
| Reduction in operating lease income for amortization of above market lease intangibles acquired | | | | | $ | (367) | | | $ | (819) | | | $ | (648) | |
| Increase in operating lease income for amortization of below market lease intangibles acquired | | | | | 2,600 | | | 2,177 | | | 2,387 | |
The following table presents expected adjustment to operating lease income and expected amortization expense during the next five years and thereafter related to the above and below market leases and acquired in-place lease and other intangibles for property owned as of December 31, 20202023 ($ in thousands):
| | Period Ending December 31, | Period Ending December 31, | | Adjustment to Operating Lease Income | | Amortization Expense | Period Ending December 31, | | Increase/(Decrease) to Operating Lease Income | | Amortization Expense |
| | 2021 | | $ | 1,071 | | | $ | 5,509 | |
| 2022 | | 1,071 | | | 5,509 | |
| 2023 | | 1,071 | | | 5,509 | |
| 2024 | |
| 2024 | |
| 2024 | 2024 | | 1,071 | | | 5,509 | |
| 2025 | 2025 | | 1,071 | | | 5,509 | |
| 2026 | |
| 2027 | |
| 2028 | |
| Thereafter | Thereafter | | 27,426 | | | 59,449 | |
| Total | Total | | $ | 32,781 | | | $ | 86,994 | |
Lease Prepayment by Lessor, Retirement of Related Mortgage Loan Financing and Impairment of Real Estate
On January 10, 2019, the Company received $10.0 million prepayment of a lease on a single-tenant two-story office building in Wayne, NJ. As of March 31, 2019, this property had a book value of $5.6 million, which is net of accumulated depreciation and amortization of $2.7 million. The Company recognized the $10.0 million of operating lease income on a straight-line basis over the revised lease term. On February 6, 2019, the Company paid off $6.6 million of mortgage loan financing related to the property, recognizing a loss on extinguishment of debt of $1.1 million. During the three months ended March 31, 2019, the Company recorded a $1.4 million impairment of real estate to reduce the carrying value of the real estate to the estimated fair value of the real estate. On May 1, 2019, the Company completed the sale of the property recognizing $3.9 million of operating lease income, $3.5 million realized loss on sale of real estate, net and $0.4 million of depreciation and amortization expense, resulting in a net loss of $20 thousand. See Note 15, Fair Value of Financial Instruments for further detail.Rent Receivables
There were $0.5$1.1 million and $0.9$1.3 million of rent receivables included in other assets on the consolidated balance sheets as of December 31, 20202023 and 2019,December 31, 2022, respectively.
There was unencumbered real estate of $75.9 million and $59.2 million as of December 31, 2020 and 2019, respectively.Operating Lease Income & Tenant Reimbursements
During the years ended December 31, 2020 and 2019, the Company recorded $5.6 million and $2.6 million, respectively, of real estate operating income, which is included in operating lease income in the consolidated statements of income. There was no real estate operating income recorded during the year ended December 31, 2018.
The following is a schedule of non-cancellable, contractual, future minimum rent under leases (excluding property operating expenses paid directly by tenant under net leases) at December 31, 20202023 ($ in thousands):
| | | | | | | | |
| Period Ending December 31, | | Amount |
| | |
| 2024 | | $ | 61,285 | |
| 2025 | | 56,123 | |
| 2026 | | 53,724 | |
| 2027 | | 48,804 | |
| 2028 | | 47,305 | |
| Thereafter | | 160,590 | |
| Total | | $ | 427,831 | |
| | | | | | | | |
| Period Ending December 31, | | Amount |
| | |
| 2021 | | $ | 79,393 | |
| 2022 | | 70,983 | |
| 2023 | | 64,425 | |
| 2024 | | 63,438 | |
| 2025 | | 62,138 | |
| Thereafter | | 471,409 | |
| Total | | $ | 811,786 | |
Tenant reimbursements, which consist of real estate taxes and other municipal charges paid by the Company, which were reimbursable by our tenants pursuant to the terms of the lease agreements, were $4.8 million, $5.2 million, and $5.0 million for the years ended December 31, 2023, 2022, and 2021, respectively. Tenant reimbursements are included in operating lease income on the Company’s consolidated statements of income.
Acquisitions
DuringThe Company acquired the following properties during the year ended December 31, 2020, the Company acquired the following properties2023 ($ in thousands):
| | | | | | | | | | | | | | | | | | | | | | | | | | | | | |
| Acquisition Date | | Type | | Primary Location(s) | | Purchase Price/Fair Value on the Date of Foreclosure | | | | | Ownership Interest (1) |
| | | | | | | | | | | |
| | | | | | | | | |
| | | | | | | | | | | |
| | | | | | | | | | | |
| | | | | | | | | | | |
| | | | | | | | | | | |
| | | | | | | | | | | |
| | | | | | | | | | | |
| | | | | | | | | | | |
| | | | | | | | | | | |
| | | | | | | | | | | |
| | | | | | | | | | | |
| | | | | | | | | | | |
| | | | | | | | | | | |
| | | | | | | | | | | |
| | | | | | | | | | | |
| | | | | | | | | | | |
| | | | | | | | | | | |
| | | | | | | | | | | |
| | | | | | | | | | | |
| | | | | | | | | | | |
| Aggregate purchases of net leased real estate | | $ | 7,440 | | | | | | 100.0% |
| | | | | | | | | | | |
| Real estate acquired via foreclosure | | | | | | | |
| March 2020 | | Diversified | | Los Angeles, CA | | 21,535 | | | | | | 100.0% |
| June 2020 | | Diversified | | Winston Salem, NC | | 3,900 | | | | | | 100.0% |
| December 2020 | | Diversified | | South Bend, IN | | 3,875 | | | | | | 100.0% |
| | | | | | | | | | | |
| Total real estate acquired via foreclosure | | 29,310 | | | | | | |
| | | | | | | | | | | |
| Total real estate acquisitions | | | | $ | 36,750 | | | | | | |
| | | | | | | | | | | | | | | | | | | | | | | | | | | | | | | | | | | | | | | | |
| Acquisition Date | | Type | | Primary Location(s) | | Purchase Price/Fair Value on the Date of Foreclosure | | | | | Ownership Interest (1) | | | | | | | | | | | |
| September 2023 | (2) | Mixed Use | | New York, NY | | $ | 30,400 | | | | | | 100% | | | | | | | | | | | |
| November 2023 | (3) | Multifamily | | Pittsburgh, PA | | 34,479 | | | | | | 100% | | | | | | | | | | | |
| December 2023 | (4) | Retail | | New York, NY | | 22,647 | | | | | | 100% | | | | | | | | | | | |
| Total real estate acquisitions | | | | $ | 87,526 | | | | | | | | | | | | | | | | | |
(1)Properties were consolidated as of acquisition date.
(2)In September 2023, the Company acquired a multifamily portfolio consisting of four properties in New York, NY via foreclosure. The portfolio served as collateral for a mortgage loan receivable held for investment. The Company obtained a third-party appraisal of the property. The $30.4 million fair value was determined by using the sales comparison and income approaches. The appraiser utilized a terminal capitalization rate of 5.5%. There was no gain or loss resulting from the foreclosure of the loan. The key inputs used to determine fair value were determined to be Level 3 inputs.
(3)In November 2023, the Company acquired a multifamily property in Pittsburgh, PA via foreclosure. The property served as collateral for a mortgage loan receivable held for investment. The Company obtained a third-party appraisal of the property. The $34.5 million fair value was determined by using the sales comparison and income approaches. The appraiser utilized a terminal capitalization rate of 6.00%. There was no gain or loss resulting from the foreclosure of the loan. The key inputs used to determine fair value were determined to be Level 3 inputs.
(4)In December 2023, the Company acquired a retail property in New York, NY via foreclosure. The property served as collateral for two mortgage loan receivables held for investment. The Company obtained a third-party appraisal of the property. The $22.6 million fair value was determined by using the sales comparison and income approaches. The appraiser utilized a terminal capitalization rate of 5.25%. There was no gain or loss resulting from the foreclosure of the loan. The key inputs used to determine fair value were determined to be Level 3 inputs.
The Company acquired the following properties during the year ended December 31, 2022 ($ in thousands):
| | | | | | | | | | | | | | | | | | | | | | | | | | | | | | | | | | | | | | | | |
| Acquisition Date | | Type | | Primary Location(s) | | Purchase Price/Fair Value on the Date of Foreclosure | | | | | Ownership Interest (1) | | | | | | | | | | | |
| | | | | | | | | | | | | | | | | | | | | | |
| | | | | | | | | | | | | | | | | | | | |
| | | | | | | | | | | | | | | | | | | | | | |
| | | | | | | | | | | | | | | | | | | | | | |
| | | | | | | | | | | | | | | | | | | | | | |
| | | | | | | | | | | | | | | | | | | | | | |
| | | | | | | | | | | | | | | | | | | | | | |
| | | | | | | | | | | | | | | | | | | | | | |
| | | | | | | | | | | | | | | | | | | | | | |
| | | | | | | | | | | | | | | | | | | | | | |
| | | | | | | | | | | | | | | | | | | | | | |
| | | | | | | | | | | | | | | | | | | | | | |
| | | | | | | | | | | | | | | | | | | | | | |
| | | | | | | | | | | | | | | | | | | | | | |
| | | | | | | | | | | | | | | | | | | | | | |
| | | | | | | | | | | | | | | | | | | | | | |
| | | | | | | | | | | | | | | | | | | | | | |
| | | | | | | | | | | | | | | | | | | | | | |
| | | | | | | | | | | | | | | | | | | | | | |
| | | | | | | | | | | | | | | | | | | | | | |
| | | | | | | | | | | | | | | | | | | | | | |
| | | | | | | | | | | | | | | | | | |
| | | | | | | | | | | | | | | | | | | | | | |
| | | | | | | | | | | | | | | | | | |
| | | | | | | | | | | | | | | | | | | | | | |
| | | | | | | | | | | | | | | | | | | | | | |
| | | | | | | | | | | | | | | | | | | | | | |
| | | | | | | | | | | | | | | | | | | | | | |
| | | | | | | | | | | | | | | | | | | | | | |
| February 2022 | (2) | Apartments | | New York, NY | | $ | 15,436 | | | | | | 100% | | | | | | | | | | | |
| November 2022 | (3) | Office | | Houston, TX | | 9,386 | | | | | | 100% | | | | | | | | | | | |
| | | | | | | | | | | | | | | | | | | | | | |
| | | | | | | | | | | | | | | | | | | | | | |
| | | | | | | | | | | | | | | | | | |
| | | | | | | | | | | | | | | | | | | | | | |
| Total real estate acquisitions | | | | $ | 24,822 | | | | | | | | | | | | | | | | | |
(1)Properties were consolidated as of acquisition date.
(2)In February 2022, the Company acquired, via change in control, a previously held interest in a non-controlling equity investment in a mixed use property with one remaining residential condo unit and one remaining retail condo unit in New York, New York. The carrying value of the property at the time of change in control was $15.4 million, which was determined to be fair value. The fair value of the remaining condo unit was determined based on comparable sales in the building and the value of the remaining retail unit was valued utilizing a direct capitalization rate of 5.5%. The key inputs used to determine fair value were determined to be Level 3 inputs.
(3)In November 2022, the Company acquired an office property in Houston, TX via foreclosure. The property served as collateral for a mortgage loan receivable held for investment with a basis of $10.3 million. In connection with the foreclosure, the Company received $0.9 million of cash. The Company obtained a third-party appraisal of the property. The $9.4 million fair value was determined by using the sales comparison and income approaches. The appraiser utilized a terminal capitalization rate of 9.5% and a discount rate of 10.5%. There was no gain or loss resulting from the foreclosure of the loan.
The Company acquired the following properties during the year ended December 31, 2021 ($ in thousands):
| | | | | | | | | | | | | | | | | | | | | | | | | | | | | | | | | | | | | | | | |
| Acquisition Date | | Type | | Primary Location(s) | | Purchase Price/Fair Value on the Date of Foreclosure | | | | | Ownership Interest (1) | | | | | | | | | | | |
| | | | | | | | | | | | | | | | | | | | | | |
| | | | | | | | | | | | | | | | | | | | |
| | | | | | | | | | | | | | | | | | | | | | |
| | | | | | | | | | | | | | | | | | | | | | |
| | | | | | | | | | | | | | | | | | | | | | |
| | | | | | | | | | | | | | | | | | | | | | |
| | | | | | | | | | | | | | | | | | | | | | |
| | | | | | | | | | | | | | | | | | | | | | |
| | | | | | | | | | | | | | | | | | | | | | |
| | | | | | | | | | | | | | | | | | | | | | |
| | | | | | | | | | | | | | | | | | | | | | |
| | | | | | | | | | | | | | | | | | | | | | |
| | | | | | | | | | | | | | | | | | | | | | |
| | | | | | | | | | | | | | | | | | | | | | |
| | | | | | | | | | | | | | | | | | | | | | |
| | | | | | | | | | | | | | | | | | | | | | |
| | | | | | | | | | | | | | | | | | | | | | |
| | | | | | | | | | | | | | | | | | | | | | |
| | | | | | | | | | | | | | | | | | | | | | |
| | | | | | | | | | | | | | | | | | | | | | |
| | | | | | | | | | | | | | | | | | | | | | |
| | | | | | | | | | | | | | | | | | |
| | | | | | | | | | | | | | | | | | | | | | |
| | | | | | | | | | | | | | | | | | |
| | | | | | | | | | | | | | | | | | | | | | |
| | | | | | | | | | | | | | | | | | | | | | |
| | | | | | | | | | | | | | | | | | | | | | |
| | | | | | | | | | | | | | | | | | | | | | |
| | | | | | | | | | | | | | | | | | | | | | |
| February 2021 | (2) | Hotel | | Miami, FL | | $ | 43,750 | | | | | | 100% | | | | | | | | | | | |
| August 2021 | | Apartments | | Stillwater, OK | | 20,452 | | | | | | 80% | | | | | | | | | | | |
| December 2021 | (3) | Hotel | | Schaumburg, IL | | 38,000 | | | | | | 100% | | | | | | | | | | | |
| | | | | | | | | | | | | | | | | | | | | | |
| | | | | | | | | | | | | | | | | | |
| | | | | | | | | | | | | | | | | | | | | | |
| Total real estate acquisitions | | | | $ | 102,202 | | | | | | | | | | | | | | | | | |
(1)Properties were consolidated as of acquisition date.
(2)In February 2021, the Company acquired a hotel in Miami, FL via foreclosure, recognizing a $25.8 thousand loss, which is included in its consolidated statements of income. The property previously served as collateral for a mortgage loan receivable held for investment with a basis of $45.1 million, net of an asset-specific loan loss provision of $1.2 million recorded in the three months ended December 31, 2020. In February 2021, the foreclosed property was sold without any gain or loss. The Company recorded no revenues from its 2021 acquisitions for the year ended December 31, 2021.
(3)In December 2021, the Company acquired a hotel in Schaumburg, IL via foreclosure. The property served as collateral for a mortgage loan receivable held for investment with a basis of $38.0 million. The Company obtained a third-party appraisal of the property. The $38.0 million fair value was determined by using the sales comparison and income approaches. The appraiser utilized a terminal capitalization rate of 8.0% and a discount rate of 10.0%. There was no gain or loss resulting from the foreclosure of the loan.
The Company allocates purchase consideration based on relative fair values, and real estate acquisition costs are capitalized as a component of the cost of the assets acquired for asset acquisitions. During the yearyears ended December 31, 2020,2023, 2022, and 2021, all acquisitions were determined to be asset acquisitions.
The purchase prices were allocated to the asset acquisitions during the year ended December 31, 2020, as follows ($ in thousands):
| | | | | | | | |
| | Purchase Price Allocation |
| | |
Land | | $ | 25,250 | |
Building | | 10,473 | |
Intangibles | | 1,379 | |
Below Market Lease Intangibles | | (352) | |
Total purchase price | | $ | 36,750 | |
The weighted average amortization period for intangible assets acquired during the year ended December 31, 2020 was 39.8 years. The Company recorded $0.4 million in revenues from its 2020 acquisitions for the year ended December 31, 2020, which is included in its consolidated statements of income. The Company recorded $(0.9) million in earnings (losses) from its 2020 acquisitions for the year ended December 31, 2020, which is included in its consolidated statements of income.
During the year ended December 31, 2019, the Company acquired the following properties ($ in thousands):
| | | | | | | | | | | | | | | | | | | | | | | | | | | | | |
| Acquisition Date | | Type | | Primary Location(s) | | Purchase Price/Fair Value on the Date of Foreclosure | | | | | Ownership Interest (1) |
| | | | | | | | | | | |
| | | | | | | | | |
| | | | | | | | | | | |
| | | | | | | | | | | |
| | | | | | | | | | | |
| | | | | | | | | | | |
| | | | | | | | | | | |
| | | | | | | | | | | |
| | | | | | | | | | | |
| | | | | | | | | | | |
| | | | | | | | | | | |
| | | | | | | | | | | |
| | | | | | | | | | | |
| | | | | | | | | | | |
| | | | | | | | | | | |
| | | | | | | | | | | |
| | | | | | | | | | | |
| | | | | | | | | | | |
| | | | | | | | | | | |
| | | | | | | | | | | |
| | | | | | | | | | | |
| Aggregate purchases of net leased real estate | | $ | 20,441 | | | | | | 100.0% |
| | | | | | | | | | | |
| Real estate acquired via foreclosure | | | | | | | |
| February 2019 | | Diversified | | Omaha, NE | | 18,200 | | | | | | 100.0% |
| December 2019 | | Diversified | | San Diego, CA | | 42,250 | | | | | | 100.0% |
| December 2019 | | Diversified | | Fort Worth and Arlington, TX | | 23,700 | | | | | | 100.0% |
| Total real estate acquired via foreclosure | | 84,150 | | | | | | |
| | | | | | | | | | | |
| Total real estate acquisitions | | | | $ | 104,591 | | | | | | |
(1)Properties were consolidated as of acquisition date.
The Company allocates purchase consideration based on relative fair values, and real estate acquisition costs are capitalized as a component of the cost of the assets acquired for asset acquisitions. During the year ended December 31, 2019, all acquisitions were determined to be asset acquisitions.
The purchase prices were allocated to the asset acquisitions during the year ended December 31, 2019, as follows ($ in thousands):
| | | | | | | | |
| | Purchase Price Allocation |
| | |
Land | | $ | 17,373 | |
Building | | 84,725 | |
Intangibles | | 3,802 | |
Below Market Lease Intangibles | | (1,309) | |
Total purchase price | | $ | 104,591 | |
The weighted average amortization period for intangible assets acquired during the year ended December 31, 2019 was 34.2 years. The Company recorded $0.6 million in revenues from its 2019 acquisitions for the year ended December 31, 2019, respectively, which is included in its consolidated statements of income. The Company recorded $(2.3) million in earnings (losses) from its 2019 acquisitions for the year ended December 31, 2019, respectively, which is included in its consolidated statements of income.
Acquisitions via Foreclosure
In December 2020, the Company acquired a hotel in South Bend, IN, via foreclosure. The property previously served as collateral for a mortgage loan receivable held for investment with a basis of $4.1 million, net of an asset-specific loan loss provision of $0.5 million. The Company recorded a gain of $0.1 million resulting from the foreclosure of the loan. In December 2020, the foreclosed property was sold without any gain or loss.
In June 2020, the Company acquired a hotel in Winston Salem, NC via foreclosure. This property previously served as collateral for a mortgage loan receivable held for investment with a net basis of $3.8 million. The Company obtained a third-party appraisal of the property. The $3.9 million fair value was determined using the ground lease approach and the income approach to value. The appraiser utilized a terminal capitalization rate of 9.50% and a discount rate of 13.50%. There was 0 gain or loss resulting from the foreclosure of the loan. In September 2020, the foreclosed property was sold for a gain of $0.8 million.
In March 2020, the Company acquired a development property in Los Angeles, CA, via foreclosure. This property previously served as collateral for a mortgage loan receivable held for investment with a basis of $21.6 million, net of an asset-specific loan loss provision of $2.0 million. The Company obtained a third-party appraisal of the property. Substantially all of the fair value was attributed to land. The $21.5 million fair value was determined using the sales comparison approach to value. Using this approach, the appraiser developed an opinion of the fee simple value of the underlying land by comparing the property to similar, recently sold properties in the surrounding or competing area. The Company recorded a $0.1 million loss resulting from the foreclosure of the loan.
In December 2019, the Company acquired a hotel in San Diego, CA, via foreclosure. This property previously served as collateral for two mortgage loan receivables held for investment with a net basis of $40.0 million. The receivables consisted of a $33.9 million first mortgage loan receivable to a third-party and a $5.7 million mortgage loan receivable held for investment by the Company as of the date of foreclosure. The $33.9 million first mortgage loan obligation was assumed by the Company on the date of acquisition. The Company obtained a third-party appraisal of the property with a fair value of $42.3 million. The value was determined using the income approach. The appraiser utilized a terminal capitalization rate of 8.50% and a discount rate of 10.50%. There was a $2.3 million gain resulting from the foreclosure of the loan.
In December 2019, the Company acquired a portfolio of two student housing properties in Fort Worth and Arlington, TX, via foreclosure. These properties previously served as collateral for a mortgage loan receivable held for investment with a net basis of $22.6 million. The acquisitions were recorded at fair value. The Company obtained a third-party appraisal of both properties. The $12.8 million fair value of the Fort Worth, TX property was determined using the income approach. The appraiser utilized a projected stabilized cash flow and a cap rate of 5.75%. The $10.9 million fair value of the Arlington, TX property was determined using the income approach. The appraiser utilized a projected stabilized cash flow and a cap rate of 6.00%. The Company also assumed $0.9 million of other liabilities, net in connection with the foreclosure. There was 0 gain or loss resulting from the foreclosure of the loan.
In February 2019, the Company acquired a hotel in Omaha, NE, via foreclosure. This property previously served as collateral for a mortgage loan receivable held for investment with a net basis of $17.9 million. The Company obtained a third-party appraisal of the property. The $18.2 million fair value was determined using the income approach to value. The appraiser utilized a terminal capitalization rate of 8.75% and a discount rate of 10.25%. There was 0 gain or loss resulting from the foreclosure of the loan.
These non-recurring fair values are considered Level 3 measurements in the fair value hierarchy.
Sales
The Company sold the following properties during the year ended December 31, 20202023 ($ in thousands):
| | | | | | | | | | | | | | | | | | | | | | | | | | | | | | | | | | | | | | | | | | | | | | | | | | | | | | | | | | |
| Sales Date | | Type | | | | Primary Location(s) | | Net Sales Proceeds | | Net Book Value | | Realized Gain/(Loss)(1) | | Properties | | Units Sold | | Units Remaining | | |
| | | | | | | | | | | | | | | | | | | | |
| Various | | Condominium | | | | Miami, FL | | $ | 1,832 | | | $ | 1,821 | | | $ | 11 | | | 0 | | | 6 | | | 0 | | | |
| March 2020 | | Diversified | | | | Richmond, VA | | 22,527 | | | 14,829 | | | 7,698 | | | 7 | | | 0 | | | 0 | | | |
| March 2020 | | Diversified | | | | Richmond, VA | | 6,932 | | | 4,109 | | | 2,823 | | | 1 | | | 0 | | | 0 | | | |
| August 2020 | | Net Lease | | | | Bellport, NY | | 19,434 | | | 15,012 | | | 4,422 | | | 1 | | | 0 | | | 0 | | | |
| September 2020 | | Diversified | | | | Lithia Springs, GA | | 39,491 | | | 23,187 | | | 16,304 | | | 1 | | | 0 | | | 0 | | | |
| September 2020 | | Diversified | | | | Winston Salem, NC | | 4,647 | | | 3,803 | | | 844 | | | 1 | | | 0 | | | 0 | | | |
| December 2020 | | Diversified | | | | South Bend, IN | | 3,875 | | | 3,875 | | | 0 | | | 1 | | | 0 | | | 0 | | | |
| Totals | | | | | | | | $ | 98,738 | | | $ | 66,636 | | | $ | 32,102 | | | | | | | | | |
| | | | | | | | | | | | | | | | | | | | | | | | | | | | | | | | | | | | | | | | | | | | |
| Sales Date | | Type | | | | Primary Location(s) | | Sales Proceeds | | Net Book Value | | Realized Gain/(Loss) | | Properties | | | | |
| August 2023 | | Hotel | | | | San Diego, CA | (1) | $ | 43,335 | | | $ | 34,526 | | | $ | 8,808 | | | 1 | | | | | |
| | | | | | | | | | | | | | | | | | |
| | | | | | | | | | | | | | | | | | |
| | | | | | | | | | | | | | | | | | |
| | | | | | | | | | | | | | | | | | |
| | | | | | | | | | | | | | | | | | |
| Totals | | | | | | | | $ | 43,335 | | | $ | 34,526 | | | $ | 8,808 | | | | | | | |
(1)Realized gain (loss) on the sale of real estate, net on the consolidated statements of income also includes $32.1Included within sales proceeds is $31.3 million of realized gain (loss) onmortgage financing that was assumed by the disposal of fixed assets for the year ended December 31, 2020.buyer.
The Company sold the following properties during the year ended December 31, 20192022 ($ in thousands):
| | | | | | | | | | | | | | | | | | | | | | | | | | | | | | | | | | | | | | | | | | | | | | | | | | | | |
| Sales Date | | Type | | | | Primary Location(s) | | Net Sales Proceeds | | Net Book Value | | Realized Gain/(Loss) | | Properties | | Units Sold | | Units Remaining |
| | | | | | | | | | | | | | | | | | |
| November 2019 | | Condominium | | | | Las Vegas, NV | | $ | 809 | | | $ | 415 | | | $ | 394 | | | 0 | | | 1 | | | 0 | |
| Various | | Condominium | | | | Miami, FL | | 4,715 | | | 4,282 | | | 433 | | | 0 | | | 16 | | | 6 | |
| April 2019 | | Diversified | | | | Wayne, NJ | | 1,729 | | | 4,799 | | | (3,070) | | | 1 | | | 0 | | | 0 | |
| May 2019 | | Diversified | | | | Grand Rapids, MI | | 10,019 | | | 8,254 | | | 1,765 | | | 1 | | | 0 | | | 0 | |
| August 2019 | | Diversified | | | | Grand Rapids, MI | | 6,970 | | | 4,920 | | | 2,050 | | | 1 | | | 0 | | | 0 | |
| | | | | | | | | | | | | | | | | | |
| Totals | | | | | | | | $ | 24,242 | | | $ | 22,670 | | | $ | 1,572 | | | | | | | |
| | | | | | | | | | | | | | | | | | | | | | | | | | | | | | | | | | | | | | | | | | | | | | |
| Sales Date | | Type | | | | Primary Location(s) | | Net Sales Proceeds | | Net Book Value | | Realized Gain/(Loss) | | Properties | | | | | | |
| March 2022 | | Office | | | | Ewing, NJ | | $ | 38,694 | | | $ | 24,175 | | | $ | 14,519 | | | 1 | | | | | | | |
| March 2022 | | Warehouse | | | | Conyers, GA | | 40,752 | | | 26,116 | | | 14,636 | | | 1 | | | | | | | |
| June 2022 | | Apartments | | | | Stillwater, OK | | 23,314 | | | 18,032 | | | 5,283 | | | 1 | | | | | | | |
| June 2022 | | Apartments | | | | Miami, Fl | | 60,856 | | | 37,585 | | | 23,270 | | | 1 | | | | | | | |
| September 2022 | | Retail | | | | Wichita, KS | | 9,503 | | | 5,110 | | | 4,393 | | | 1 | | | | | | | |
| December 2022 | | Apartments | | | | New York, NY | (1) | 7,935 | | | 7,402 | | | 533 | | | 1 | | | | | | | |
| December 2022 | | Retail | | | | Sennett, NY | | 10,599 | | | 4,245 | | | 6,354 | | | 1 | | | | | | | |
| December 2022 | | Office | | | | Richmond, VA | | 118,872 | | | 71,862 | | | 47,010 | | | 1 | | | | | | | |
| | | | | | | | | | | | | | | | | | | | |
| Totals | | | | | | | (2) | $ | 310,525 | | | $ | 194,527 | | | $ | 115,998 | | | | | | | | | |
| | | | | | | | | | | | | | | | | | | | |
(1)Realized gain (loss) on the saleOne unit was sold, and one unit remains.
(2)Excludes $4.4 million of real estate, netprepayment costs upon repayment of mortgage financings in connection with certain sales that is recorded within interest expense on the consolidated statementsstatement of income, also includes $1.4 millionsuch amount was correspondingly paid by the buyer and received by the Company as part of realized lossthe sale and recorded in fee and other income on the disposalconsolidated statement of fixed assets for the year ended December 31, 2019.
The Company sold the following properties during the year ended December 31, 20182021 ($ in thousands):
| | | | | | | | | | | | | | | | | | | | | | | | | | | | | | | | | | | | | | | | | | | | | | | | | | | | | | | | | | |
| Sales Date | | Type | | | | Primary Location(s) | | Net Sales Proceeds | | Net Book Value | | Realized Gain/(Loss) | | Realized Gain Allocated to Third Party Investor | | Properties | | Units Sold | | Units Remaining |
| | | | | | | | | | | | | | | | | | | | |
| Various | | Condominium | | | | Las Vegas, NV | | $ | 8,763 | | | $ | 4,458 | | | $ | 4,305 | | | $ | 0 | | | 0 | | | 12 | | | 1 | |
| Various | | Condominium | | | | Miami, FL | | 7,851 | | | 6,716 | | | 1,135 | | | 0 | | | 0 | | | 26 | | | 22 | |
| March 2018 | | Diversified | | | | El Monte, CA | | 71,807 | | | 52,610 | | | 19,197 | | | 6,999 | | | 1 | | | 0 | | | 0 | |
| March 2018 | | Diversified | | | | Richmond, VA | | 20,966 | | | 11,370 | | | 9,596 | | | 389 | | | 1 | | | 0 | | | 0 | |
| September 2018 | | Diversified | | | | St. Paul, MN | | 109,275 | | | 47,627 | | | 61,648 | | | 7,928 | | | 4 | | | 0 | | | 0 | |
| | | | | | | | | | | | | | | | | | | | |
| Totals | | | | | | | | $ | 218,662 | | | $ | 122,781 | | | $ | 95,881 | | | $ | 15,316 | | | | | | | |
| | | | | | | | | | | | | | | | | | | | | | | | | | | | | | | | | | | | | | | | | | | | |
| Sales Date | | Type | | | | Primary Location(s) | | Net Sales Proceeds | | Net Book Value | | Realized Gain/(Loss) | | Properties | | | | |
| | | | | | | | | | | | | | | | | | |
| | | | | | | | | | | | | | | | | | |
| February 2021 | | Hotel | | | | Miami, FL | | $ | 43,750 | | | $ | 43,750 | | | $ | — | | | 1 | | | | | |
| June 2021 | | Net Lease | | | | North Dartmouth, MA | | 38,732 | | | 19,343 | | | 19,389 | | | 1 | | | | | |
| August 2021 | | Net Lease | | | | Pittsfield, MA | | 18,651 | | | 10,564 | | | 8,087 | | | 1 | | | | | |
| August 2021 | | Net Lease | | | | Ankeny, IA | | 19,021 | | | 13,341 | | | 5,680 | | | 1 | | | | | |
| August 2021 | | Apartments | | | | Arlington/Fort Worth, TX | | 26,496 | | | 22,498 | | | 3,998 | | | 2 | | | | | |
| November 2021 | | Net Lease | | | | Bessemer City, NC | | 33,447 | | | 21,333 | | | 12,114 | | | 1 | | | | | |
| December 2021 | | Land | | | | Los Angeles, CA | | 19,469 | | | 21,452 | | | (1,983) | | | 1 | | | | | |
| December 2021 | | Net Lease | | | | Snellville, GA | | 9,695 | | | 5,483 | | | 4,212 | | | 1 | | | | | |
| December 2021 | | Net Lease | | | | Columbia, SC | | 9,941 | | | 5,674 | | | 4,269 | | | 1 | | | | | |
| Totals | | | | | | | | $ | 219,202 | | | $ | 163,438 | | | $ | 55,766 | | | | | | | |
6. INVESTMENT IN AND ADVANCES TO UNCONSOLIDATED JOINT VENTURES
The following is a summary of the Company’s investments in and advances to unconsolidated joint ventures, which we account for using the equity method, as of December 31, 2020 and 2019 ($ in thousands):
| | | | | | | | | | | | | | |
| Entity | | December 31, 2020 | | December 31, 2019 |
| | | | |
| | | | |
| Grace Lake JV, LLC | | $ | 4,023 | | | $ | 3,047 | |
| 24 Second Avenue Holdings LLC | | 42,230 | | | 45,386 | |
| Investment in unconsolidated joint ventures | | $ | 46,253 | | | $ | 48,433 | |
The following is a summary of the Company’s allocated earnings (losses) based on its ownership interests from investment in unconsolidated joint ventures for the years ended December 31, 2020 and 2019 ($ in thousands):
| | | | | | | | | | | | | | | | | | | | | | | | |
| | | | | Year Ended December 31, |
| Entity | | | | | | 2020 | | 2019 | | 2018 |
| | | | | | | | | | |
| | | | | | | | | | |
| Grace Lake JV, LLC | | | | | | $ | 976 | | | $ | 1,047 | | | 1,658 | |
| 24 Second Avenue Holdings LLC | | | | | | 845 | | | 2,385 | | | (868) | |
| Earnings (loss) from investment in unconsolidated joint ventures | | | | | | $ | 1,821 | | | $ | 3,432 | | | $ | 790 | |
Grace Lake JV, LLC
In connection with the origination of a loan in April 2012, the Company received a 25% equity interest with the right to convert upon a capital event. On March 22, 2013, the loan was refinanced, and the Company converted its interest into a 19% limited liability company membership interest in Grace Lake JV, LLC (“Grace Lake LLC”), which holds an investment in an office building complex. After taking into account the preferred return of 8.25% and the return of all equity remaining in the property to the Company’s operating partner, the Company is entitled to 25% of the distribution of all excess cash flows and all disposition proceeds upon any sale. The Company is not legally required to provide any future funding to Grace Lake LLC. The Company accounts for its interest in Grace Lake LLC using the equity method of accounting, as it has a 19% investment, compared to the 81% investment of its operating partner and does not control the entity.
The Company’s investment in Grace Lake LLC is an unconsolidated joint venture, which is a VIE for which the Company is not the primary beneficiary. This joint venture was deemed to be a VIE primarily based on the fact there are disproportionate voting and economic rights within the joint venture. The Company determined that it was not the primary beneficiary of this VIE based on the fact that the Company has a passive investment and no control of this entity and therefore does not have controlling financial interests in this VIE. The Company’s maximum exposure to loss is limited to its investment in the VIE. The Company has not provided financial support to this VIE that it was not previously contractually required to provide.
During the year ended December 31, 2020, the Company received 0 distributions from its investment in Grace Lake LLC. During the years ended December 31, 2019 and 2018, the Company had received $3.3 million and $1.3 million, respectively, of distributions from its investment in Grace Lake LLC.
The Company holds its investment in Grace Lake LLC in a TRS.
24 Second Avenue Holdings LLC
On August 7, 2015, the Company entered into a joint venture, 24 Second Avenue Holdings LLC (“24 Second Avenue”), with an operating partner (the “Operating Partner”) to invest in a ground-up residential/retail condominium development and construction project located at 24 Second Avenue, New York, NY. The Company accounted for its interest in 24 Second Avenue using the equity method of accounting as its joint venture partner was the managing member of 24 Second Avenue and had substantive management rights.
During the three months ended March 31, 2019, the Company converted its existing $35.0 million common equity interest into a $35.0 million priority preferred equity position. The Company also provided $50.4 million in first mortgage financing in order to refinance the existing $48.1 million first mortgage construction loan which was made by another lending institution. In addition to the new $50.4 million first mortgage loan, the Company also funded a $6.5 million mezzanine loan for use in completing the project. The Operating Partner must fully fund any and all additional capital for necessary expenses.
Due to the Company’s non-controlling equity interest in 24 Second Avenue, the Company accounts for the new loans as additional investments in the joint venture.
During the years ended December 31, 2020, 2019 and 2018, the Company recorded $0.8 million, $2.4 million and $(0.9) million, respectively, in income (expenses), each of which is recorded in earnings (loss) from investment in unconsolidated joint ventures in the consolidated statements of income. During 2019 and 2018, the Company capitalized interest related to the cost of its investment in 24 Second Avenue, as 24 Second Avenue had activities in progress necessary to construct and ultimately sell condominium units. During the years ended December 31, 2019 and 2018, the Company capitalized $0.1 million and $1.5 million, respectively, of interest expense, using a weighted average interest rate. The capitalized interest expense was recorded in investment in unconsolidated joint ventures in the consolidated balance sheets. As a result of the transactions described above, subsequent to the three months ended March 31, 2019, the Company no longer capitalizes interest related to this investment, and income generated from the new loans is accounted for as earnings from investment in unconsolidated joint ventures.
The 24 Second Avenue investment consists of residential condominium units and 1 commercial condominium unit. 24 Second Avenue started closing on the existing sales contracts during the quarter ended March 31, 2019, upon receipt of New York City Building Department approvals and a temporary certificate of occupancy for a portion of the project. As of December 31, 2020, 24 Second Avenue sold 20 residential condominium units for $53.0 million in total gross sale proceeds, and 1 residential condominium unit was under contract for sale for $2.3 million in gross sales proceeds with a 10% deposit down on the sales contract. As of December 31, 2020, the Company had 0 additional remaining capital commitment to 24 Second Avenue.
The Company’s non-controlling investment in 24 Second Avenue is an unconsolidated joint venture, which is a VIE for which the Company is not the primary beneficiary. This joint venture was deemed to be a VIE primarily based on (i) the fact that the total equity investment at risk (inclusive of the additional financing the Company provided through the first mortgage and mezzanine loans) is sufficient to permit the entities to finance activities without additional subordinated financial support provided by any parties, including equity holders; and (ii) the voting and economic rights are not disproportionate within the joint venture. The Company determined that it was not the primary beneficiary of this VIE because it does not have a controlling financial interest.
The Company holds its investment in 24 Second Avenue in a TRS.
Combined Summary Financial Information for Unconsolidated Joint Ventures
The following is a summary of the combined financial position of the unconsolidated joint ventures in which the Company had investment interests as of December 31, 2020 and 2019 ($ in thousands):
| | | | | | | | | | | | | | |
| | | December 31, 2020 | | December 31, 2019 |
| | | | |
| Total assets | | $ | 114,916 | | | $ | 118,727 | |
| Total liabilities | | 75,775 | | | 78,762 | |
| Partners’/members’ capital | | $ | 39,141 | | | $ | 39,965 | |
The following is a summary of the combined results from operations of the unconsolidated joint ventures for the period in which the Company had investment interests during the years ended December 31, 2020, 2019 and 2018 ($ in thousands):
| | | | | | | | | | | | | | | | | | | | | | | | |
| | | | | Year Ended December 31, |
| | | | | | | 2020 | | 2019 | | 2018 |
| | | | | | | | | | |
| Total revenues | | | | | | $ | 17,461 | | | $ | 7,630 | | | $ | 19,122 | |
| Total expenses | | | | | | 14,206 | | | 14,930 | | | 13,381 | |
| Net income (loss) | | | | | | $ | 3,255 | | | $ | (7,300) | | | $ | 5,741 | |
7. DEBT OBLIGATIONS, NET
The details of the Company’s debt obligations at December 31, 20202023 and December 31, 20192022 are as follows ($ in thousands):
December 31, 2020
| | | | | | | | | | | | | | | | | | | | | | | | | | | | | | | | | | | | | | | | | | | | | | | | | | | | | | | | | | | | | | | | | |
| Debt Obligations | | Committed Financing | | Debt Obligations Outstanding | | Committed but Unfunded | | Interest Rate at December 31, 2020(1) | | Current Term Maturity | | Remaining Extension Options | | Eligible Collateral | | Carrying Amount of Collateral | | Fair Value of Collateral | |
| | | | | | | | | | | | | | | | | | | | | |
| Committed Loan Repurchase Facility(2) | | $ | 500,000 | | | $ | 112,004 | | | $ | 387,996 | | | 1.91% | — | 2.16% | | 12/19/2022 | | (3) | | (4) | | $ | 180,416 | | | $ | 180,416 | | |
| Committed Loan Repurchase Facility | | 250,000 | | | 0 | | | 250,000 | | | 0% | — | 0% | | 2/26/2021 | | (5) | | (6) | | 0 | | | 0 | | |
| Committed Loan Repurchase Facility | | 300,000 | | | 90,197 | | | 209,803 | | | 1.91% | — | 2.91% | | 12/16/2021 | | (7) | | (8) | | 154,850 | | | 154,850 | | |
| Committed Loan Repurchase Facility | | 300,000 | | | 11,312 | | | 288,688 | | | 2.19% | — | 2.19% | | 11/6/2022 | | (9) | | (4) | | 28,285 | | | 28,285 | | |
| Committed Loan Repurchase Facility | | 100,000 | | | 26,183 | | | 73,817 | | | 2.28% | — | 2.28% | | 12/31/2022 | | (10) | | (4) | | 45,235 | | | 45,235 | | |
| Committed Loan Repurchase Facility | | 100,000 | | | 15,672 | | | 84,328 | | | 2.66% | — | 3.5% | | 10/24/2021 | | (11) | | (12) | | 30,600 | | | 30,600 | | |
| Total Committed Loan Repurchase Facilities | | 1,550,000 | | | 255,368 | | | 1,294,632 | | | | | | | | | | | | | 439,386 | | | 439,386 | | |
| Committed Securities Repurchase Facility(2) | | 787,996 | | | 149,633 | | | 638,363 | | | 0.86% | — | 1.11% | | 12/23/2021 | | N/A | | (13) | | 226,008 | | | 226,008 | | |
| Uncommitted Securities Repurchase Facility | | N/A (14) | | 415,836 | | | N/A (14) | | 0.73% | — | 2.84% | | 1/2021-3/2021 | | N/A | | (13) | | 502,476 | | | 502,476 | | (15) |
| Total Repurchase Facilities | | 1,950,000 | | | 820,837 | | | 1,544,999 | | | | | | | | | | | | | 1,167,870 | | | 1,167,870 | | |
| Revolving Credit Facility | | 266,430 | | | 266,430 | | | 0 | | | 3.15% | — | 3.15% | | 2/11/2022 | | (16) | | N/A (17) | | N/A (17) | | N/A (17) | |
| Mortgage Loan Financing | | 766,064 | | | 766,064 | | | 0 | | | 3.75% | — | 6.16% | | 2021 - 2030(18) | | N/A | | (19) | | 909,406 | | | 1,133,703 | | (20) |
| Secured Financing Facility | | 206,350 | | | 192,646 | | (21) | 0 | | | 10.75% | — | 10.75% | | 5/6/2023 | | N/A | | (22) | | 327,769 | | | 328,097 | | |
| CLO Debt | | 279,156 | | | 276,516 | | (23) | — | | | 5.5% | — | 5.5% | | 5/16/2024 | | N/A | | (4) | | 362,600 | | | 362,600 | | |
| | | | | | | | | | | | | | | | | | | | | |
| Borrowings from the FHLB | | 1,500,000 | | | 288,000 | | | 1,212,000 | | | 0.41% | — | 2.74% | | 2021 - 2024 | | N/A | | (24) | | 388,400 | | | 392,212 | | (25) |
| Senior Unsecured Notes | | 1,612,299 | | | 1,599,371 | | (26) | 0 | | | 4.25% | — | 5.88% | | 2021 - 2027 | | N/A | | N/A (27) | | N/A (27) | | N/A (27) | |
| | | | | | | | | | | | | | | | | | | | | |
| | | | | | | | | | | | | | | | | | | | | |
| Total Debt Obligations, Net | | $ | 6,580,299 | | | $ | 4,209,864 | | | $ | 2,756,999 | | | | | | | | | | | | | $ | 3,156,045 | | | $ | 3,384,482 | | |
| | | | | | | | | | | | | | | | | | | | | | | | | | | | | | | | | | | | | | | | | | | | | | | | | | | | | | | | | | | | | | | | | |
| Debt Obligations | | Committed /
Principal Amount | | Carrying Value of Debt Obligations | | Committed but Unfunded | | Interest Rate at December 31, 2023(1) | | Current Term Maturity | | Remaining Extension Options | | Eligible Collateral | | Carrying Amount of Collateral | | Fair Value of Collateral | |
| | | | | | | | | | | | | | | | | | | | | |
| Committed Loan Repurchase Facility | | $ | 500,000 | | | $ | 235,594 | | | $ | 264,406 | | | 7.08% | — | 7.48% | | 9/27/2025 | | (2) | | (3) | | $ | 342,467 | | | $ | 342,467 | | |
| Committed Loan Repurchase Facility | | 300,000 | | | 118,903 | | | 181,097 | | | 7.46% | — | 8.36% | | 12/19/2024 | | (4) | | (5) | | 174,938 | | | 174,938 | | |
| Committed Loan Repurchase Facility | | 141,997 | | | 139,162 | | | 2,835 | | | 7.06% | — | 7.60% | | 4/30/2024 | | (6) | | (3) | | 65,110 | | | 65,110 | | (7) |
| Committed Loan Repurchase Facility | | 200,000 | | | 111,340 | | | 88,660 | | | 7.22% | — | 8.29% | | 10/3/2025 | | (8) | | (3) | | 150,280 | | | 150,559 | | |
| Committed Loan Repurchase Facility | | 100,000 | | | — | | | 100,000 | | | —% | — | —% | | 1/22/2024 | | (9) | | (5) | | — | | | — | | |
| | | | | | | | | | | | | | | | | | | | | |
| Total Committed Loan Repurchase Facilities | | 1,241,997 | | | 604,999 | | | 636,998 | | | | | | | | | | | | | 732,795 | | | 733,074 | | |
| Committed Securities Repurchase Facility | | 100,000 | | | — | | | 100,000 | | | —% | — | —% | | 5/27/2024 | | N/A | | (10) | | — | | | — | | |
| Uncommitted Securities Repurchase Facility | | N/A (11) | | 1,608 | | | N/A (11) | | 6.61% | — | 7.56% | | 1/17/2024 | | N/A | | (10) | | 2,511 | | | 2,511 | | (12) |
| Total Repurchase Facilities | | 1,341,997 | | | 606,607 | | | 736,998 | | | | | | | | | | | | | 735,306 | | | 735,585 | | |
| Revolving Credit Facility | | 323,850 | | | — | | | 323,850 | | | —% | — | —% | | 7/27/2024 | | (13) | | N/A (14) | | N/A (14) | | N/A (14) | |
| Mortgage Loan Financing | | 437,384 | | | 437,759 | | | — | | | 4.39% | — | 9.03% | | 2024-2031 (15) | | N/A | | (16) | | 474,740 | | | 625,454 | | (17) |
| | | | | | | | | | | | | | | | | | | | | |
| | | | | | | | | | | | | | | | | | | | | |
| CLO Debt | | 1,062,777 | | | 1,060,719 | | (18) | — | | | 6.68% | — | 9.13% | | 2024-2026 (19) | | N/A | | (3) | | 1,327,722 | | | 1,327,722 | | |
| | | | | | | | | | | | | | | | | | | | | |
| Borrowings from the FHLB | | 115,000 | | | 115,000 | | | — | | | 5.76% | — | 5.88% | | 2024 | | N/A | | (20) | | 140,276 | | | 140,276 | | |
| Senior Unsecured Notes | | 1,575,614 | | | 1,563,861 | | (21) | — | | | 4.25% | — | 5.25% | | 2025-2029 | | N/A | | N/A (22) | | N/A (22) | | N/A (22) | |
| | | | | | | | | | | | | | | | | | | | | |
| | | | | | | | | | | | | | | | | | | | | |
| Total Debt Obligations, Net | | $ | 4,856,622 | | | $ | 3,783,946 | | | $ | 1,060,848 | | | | | | | | | | | | | $ | 2,678,044 | | | $ | 2,829,037 | | |
(1)December 2020 LIBORInterest rates are used to calculate interest rates foron floating rate debt.debt reflect the applicable index in effect as of December 31, 2023.
(2)The combined committed amounts for the loan repurchase facility and the securities repurchase facility total $900.0 million, with maximum capacity on the loan repurchase facility of $500.0 million, and maximum capacity on the securities repurchase facility of $900.0 million less outstanding commitments on the loan repurchase facility.
(3)NaN additionalTwo 12-month periods at Company’s option. No new advances are permitted after the initial maturity date.
(4)First mortgage commercial real estate loans and senior and pari passu interests therein. It does not include the real estate collateralizing such loans.
(5)NaN additional 12-month periods at Company’s option.
(6)First mortgage commercial real estate loans. It does not include the real estate collateralizing such loans.
(7)NaN additional 364-day periods at Company’s option.
(8)First mortgage and mezzanine commercial real estate loans and senior and pari passu interests therein. It does not include the real estate collateralizing such loans.
(9)NaN additional 12-month extension period and 2 additional 6-month extension periods at Company’s option.
(10)NaN additional 12-month extension periods at Company’s option. No new advances are permitted after the initial maturity date.
(11)The Company may extend periodically with lender’s consent. At no time can the maturity of the facility exceed 364 days from the date of determination.
(12)First mortgage, junior and mezzanine commercial real estate loans, and certain senior and/or pari passu interests therein.
(13)Commercial real estate securities. It does not include the real estate collateralizing such securities.
(14)Represents uncommitted securities repurchase facilities for which there is no committed amount subject to future advances.
(15)Includes $2.1 million of restricted securities under the risk retention rules of the Dodd-Frank Act. These securities are accounted for as held-to-maturity and recorded at amortized cost basis.
(16)NaN additional 12-month periods at Company’s option.
(17)The obligations under the Revolving Credit Facility are guaranteed by the Company and certain of its subsidiaries and secured by equity pledges in certain Company subsidiaries.
(18)Anticipated repayment dates.
(19)Certain of our real estate investments serve as collateral for our mortgage loan financing.
(20)Using undepreciated carrying value of commercial real estate to approximate fair value.
(21)Presented net of unamortized debt issuance costs of $7.2 million and an unamortized discount of $6.6 million related to the Purchase Right (described in detail under Secured Financing Facility below) at December 31, 2020.
(22)First mortgage commercial real estate loans. Substitution of collateral and conversion of loan collateral to mortgage collateral are permitted with Lender’s approval.
(23)Presented net of unamortized debt issuance costs of $2.6 million at December 31, 2020.
(24)First mortgage commercial real estate loans and investment grade commercial real estate securities. It does not include the real estate collateralizing such loans and securities.
(25)Includes $9.4 million of restricted securities under the risk retention rules of the Dodd-Frank Act. These securities are accounted for as held-to-maturity and recorded at amortized cost basis.
(26)Presented net of unamortized debt issuance costs of $12.9 million at December 31, 2020.
(27)The obligations under the senior unsecured notes are guaranteed by the Company and certain of its subsidiaries.
December 31, 2019
| | | | | | | | | | | | | | | | | | | | | | | | | | | | | | | | | | | | | | | | | | | | | | | | | | | | | | | | | | | | | | | | | |
| Debt Obligations | | Committed Financing | | Debt Obligations Outstanding | | Committed but Unfunded | | Interest Rate at December 31, 2019(1) | | Current Term Maturity | | Remaining Extension Options | | Eligible Collateral | | Carrying Amount of Collateral | | Fair Value of Collateral | |
| | | | | | | | | | | | | | | | | | | | | |
| Committed Loan Repurchase Facility | | $ | 600,000 | | | $ | 183,828 | | | $ | 416,172 | | | 3.24% | — | 3.74% | | 12/19/2022 | | (2) | | (3) | | $ | 287,974 | | | $ | 288,210 | | |
| Committed Loan Repurchase Facility | | 350,000 | | | 70,697 | | | 279,303 | | | 3.71% | — | 3.81% | | 5/24/2020 | | (4) | | (5) | | 101,590 | | | 103,868 | | |
| Committed Loan Repurchase Facility | | 300,000 | | | 248,182 | | | 51,818 | | | 3.49% | — | 3.74% | | 12/19/2020 | | (6) | | (7) | | 382,778 | | | 382,778 | | |
| Committed Loan Repurchase Facility | | 300,000 | | | 98,678 | | | 201,322 | | | 3.50% | — | 3.75% | | 11/6/2022 | | (8) | | (3) | | 175,000 | | | 175,270 | | |
| Committed Loan Repurchase Facility | | 100,000 | | | 9,952 | | | 90,048 | | | 3.96% | — | 3.99% | | 1/3/2023 | | (9) | | (3) | | 75,628 | | | 75,813 | | |
| Committed Loan Repurchase Facility | | 100,000 | | | 90,927 | | | 9,073 | | | 3.74% | — | 3.80% | | 12/24/2020 | | (10) | | (11) | | 126,311 | | | 126,311 | | |
| Total Committed Loan Repurchase Facilities | | 1,750,000 | | | 702,264 | | | 1,047,736 | | | | | | | | | | | | | 1,149,281 | | | 1,152,250 | | |
| Committed Securities Repurchase Facility | | 400,000 | | | 42,751 | | | 357,249 | | | 2.50% | — | 2.56% | | 12/23/2021 | | N/A | | (12) | | 52,691 | | | 52,691 | | |
| Uncommitted Securities Repurchase Facility | | N/A (13) | | 1,070,919 | | | N/A (13) | | 2.17% | — | 3.54% | | 1/2020 - 3/2020 | | N/A | | (12) | | 1,188,440 | | | 1,188,440 | | (14) |
| Total Repurchase Facilities | | 2,150,000 | | | 1,815,934 | | | 1,404,985 | | | | | | | | | | | | | 2,390,412 | | | 2,393,381 | | |
| Revolving Credit Facility | | 266,430 | | | 0 | | | 266,430 | | | NA | | | | 2/11/2020 | | (15) | | N/A (16) | | N/A (16) | | N/A (16) | |
| Mortgage Loan Financing | | 812,606 | | | 812,606 | | | 0 | | | 3.75% | — | 6.75% | | 2020 - 2029(17) | | N/A | | (18) | | 988,857 | | | 1,192,106 | | (19) |
| | | | | | | | | | | | | | | | | | | | | |
| | | | | | | | | | | | | | | | | | | | | |
| Borrowings from the FHLB | | 1,945,795 | | | 1,073,500 | | | 872,295 | | | 1.47% | — | 2.95% | | 2020 - 2024 | | N/A | | (20) | | 1,107,188 | | | 1,113,811 | | (21) |
| Senior Unsecured Notes | | 1,166,201 | | | 1,157,833 | | (22) | 0 | | | 5.25% | — | 5.88% | | 2021 - 2025 | | N/A | | N/A (23) | | N/A (23) | | N/A (23) | |
| | | | | | | | | | | | | | | | | | | | | |
| | | | | | | | | | | | | | | | | | | | | |
| Total Debt Obligations | | $ | 6,341,032 | | | $ | 4,859,873 | | | $ | 2,543,710 | | | | | | | | | | | | | $ | 4,486,457 | | | $ | 4,699,298 | | |
(1)December 31, 2019 LIBOR rates are used to calculate interest rates for floating rate debt.
(2)NaN additional 12-month periods at Company’s option. No new advances are permitted after the initial maturity date.
(3)First mortgage commercial real estate loans and senior and pari passu interests therein. It does not include the real estate collateralizing such loans.
(4)NaNOne additional 364-day period at Company’s option.
(5)First mortgage and mezzanine commercial real estate loans and senior and pari passu interests therein. It does not include the real estate collateralizing such loans.
(6)Three additional 12-month extension periods at Company’s option.
(7)The Company has pledged mortgage loans receivable with a value of $114.7 million that eliminates in consolidation and is thus not included in the carrying amount of collateral or fair value of collateral.
(8)Two additional 12-month extension periods at Company’s option. No new advances permitted past 30 days prior to initial maturity.
(9)Two additional 12-month extension periods at Company's option. No new advances permitted during the final 12-month period.
(10)Commercial real estate securities. It does not include the first mortgage commercial real estate loans collateralizing such securities.
(11)Represents uncommitted securities repurchase facilities for which there is no committed amount subject to future advances.
(12)Includes $1.9 million of restricted securities under the risk retention rules of the Dodd-Frank Act. These securities are accounted for as held-to-maturity and recorded at amortized cost basis.
(13)Three additional 12-month periods at Company’s option.
(14)The obligations under the Revolving Credit Facility are guaranteed by the Company and certain of its subsidiaries and secured by equity pledges in certain Company subsidiaries.
(15)Anticipated repayment dates.
(16)Certain of our real estate investments serve as collateral for our mortgage loan financing.
(17)Represents undepreciated carrying value of commercial real estate collateral.
(18)Presented net of unamortized debt issuance costs of $2.1 million at December 31, 2023.
(19)Represents the estimated maturity date based on the remaining reinvestment period and underlying loan maturities.
(20)Investment grade commercial real estate securities. It does not include the first mortgage commercial real estate loans collateralizing such securities.
(21)Presented net of unamortized debt issuance costs of $11.8 million at December 31, 2023.
(22)The obligations under the senior unsecured notes are guaranteed by the Company and certain of its subsidiaries.
December 31, 2022 | | | | | | | | | | | | | | | | | | | | | | | | | | | | | | | | | | | | | | | | | | | | | | | | | | | | | | | | | | | | | | | | | |
| Debt Obligations | | Committed /
Principal Amount | | Carrying Value of Debt Obligations | | Committed but Unfunded | | Interest Rate at December 31, 2022(1) | | Current Term Maturity | | Remaining Extension Options | | Eligible Collateral | | Carrying Amount of Collateral | | Fair Value of Collateral | |
| | | | | | | | | | | | | | | | | | | | | |
| Committed Loan Repurchase Facility(2) | | $ | 500,000 | | | $ | 318,983 | | | $ | 181,017 | | | 6.07% | — | 6.57% | | 9/27/2025 | | (2) | | (3) | | $ | 428,477 | | | $ | 429,276 | | |
| Committed Loan Repurchase Facility | | 100,000 | | | — | | | 100,000 | | | —% | — | —% | | 2/26/2023 | | (4) | | (5) | | — | | | — | | |
| Committed Loan Repurchase Facility | | 300,000 | | | 157,558 | | | 142,442 | | | 6.19% | — | 7.07% | | 12/19/2023 | | (6) | | (7) | | 244,102 | | | 244,102 | | |
| Committed Loan Repurchase Facility | | 100,000 | | | 47,415 | | | 52,585 | | | 6.00% | — | 6.00% | | 4/30/2024 | | (8) | | (3) | | 63,307 | | | 63,307 | | |
| Committed Loan Repurchase Facility | | 100,000 | | | 77,959 | | | 22,041 | | | 5.74% | — | 6.24% | | 1/3/2023 | | (2) | | (3) | | 103,393 | | | 103,393 | | |
| Committed Loan Repurchase Facility | | 100,000 | | | — | | | 100,000 | | | —% | | —% | | 1/22/2024 | | (9) | | (7) | | — | | | — | | |
| Committed Loan Repurchase Facility | | 100,000 | | | 14,979 | | | 85,021 | | | 7.07% | — | 7.07% | | 7/14/2023 | | (10) | | (11) | | 21,206 | | | 21,206 | | |
| Total Committed Loan Repurchase Facilities | | 1,300,000 | | | 616,894 | | | 683,106 | | | | | | | | | | | | | 860,485 | | | 861,284 | | |
| Committed Securities Repurchase Facility(2) | | 100,000 | | | 8,640 | | | 91,360 | | | 5.04% | — | 5.29% | | 5/27/2023 | | N/A | | (12) | | 10,023 | | | 10,023 | | |
| Uncommitted Securities Repurchase Facility | | N/A (13) | | 222,328 | | | N/A (13) | | 4.73% | — | 6.00% | | 3/2/2023 | | N/A | | (12) | | 247,351 | | | 247,351 | | (14) |
| Total Repurchase Facilities | | 1,400,000 | | | 847,862 | | | 774,466 | | | | | | | | | | | | | 1,117,859 | | | 1,118,658 | | |
| Revolving Credit Facility | | 323,850 | | | — | | | 323,850 | | | —% | — | —% | | 7/27/2023 | | (15) | | N/A (16) | | N/A (16) | | N/A (16) | |
| Mortgage Loan Financing | | 497,454 | | | 497,991 | | | — | | | 4.25% | — | 8.03% | | 2023 - 2031(17) | | N/A | | (18) | | 559,885 | | | 710,977 | | (19) |
| | | | | | | | | | | | | | | | | | | | | |
| | | | | | | | | | | | | | | | | | | | | |
| CLO Debt | | 1,064,365 | | | 1,058,462 | | (20) | — | | | 5.52% | — | 7.97% | | 2024 - 2026(21) | | N/A | | (3) | | 1,308,654 | | | 1,308,654 | | |
| | | | | | | | | | | | | | | | | | | | | |
| Borrowings from the FHLB | | 213,000 | | | 213,000 | | | — | | | 2.74% | — | 4.70% | | 2023 - 2024 | | N/A | | (22) | | 248,806 | | | 248,806 | | (23) |
| Senior Unsecured Notes | | 1,643,794 | | | 1,628,382 | | (24) | — | | | 4.25% | — | 5.25% | | 2025 - 2029 | | N/A | | N/A (25) | | N/A (25) | | N/A (25) | |
| | | | | | | | | | | | | | | | | | | | | |
| | | | | | | | | | | | | | | | | | | | | |
| Total Debt Obligations, Net | | $ | 5,142,463 | | | $ | 4,245,697 | | | $ | 1,098,316 | | | | | | | | | | | | | $ | 3,235,204 | | | $ | 3,387,095 | | |
(1)LIBOR and Term SOFR rates in effect as of December 31, 2022 are used to calculate interest rates for floating rate debt, as applicable.
(2)Two 12-month extension periods at Company’s option. No new advances are permitted after the initial maturity date.
(3)First mortgage commercial real estate loans and senior and pari passu interests therein. It does not include the real estate collateralizing such loans.
(4)One additional 12-month period at Company’s option.
(5)First mortgage commercial real estate loans. It does not include the real estate collateralizing such loans.
(6)NaNTwo additional 364-day periods.periods at Company’s option.
(7)First mortgage and mezzanine commercial real estate loans and senior and pari passu interests therein. It does not include the real estate collateralizing such loans.
(8)NaNThree additional 12-month extension period and 2 additional 6-month extension periods at Company’s option.
(9)NaNTwo additional 12-month extension periods at Company’sCompany's option. No new advances are permitted afterduring the initial maturity date.final 12-month period.
(10)The Company may extend periodically with lender’s consent. At no time can the maturity of the facility exceed 364 days from the date of determination.
(11)First mortgage, junior and mezzanine commercial real estate loans, and certain senior and/or pari passu interests therein.
(12)Commercial real estate securities. It does not include the first mortgage commercial real estate loans collateralizing such securities.
(13)Represents uncommitted securities repurchase facilities for which there is no committed amount subject to future advances.
(14)Includes $2.2$2.0 million of restricted securities under the risk retention rules of the Dodd-Frank Act. These securities are accounted for as held-to-maturity and recorded at amortized cost basis.
(15)NaNFour additional 12-month periods at Company’s option.
(16)The obligations under the Revolving Credit Facility are guaranteed by the Company and certain of its subsidiaries and secured by equity pledges in certain Company subsidiaries.
(17)Anticipated repayment dates.
(18)Certain of our real estate investments serve as collateral for our mortgage loan financing.
(19)Using undepreciated carrying value of commercial real estate to approximate fair value.
(20)First mortgage commercial real estate loansPresented net of unamortized debt issuance costs of $5.9 million at December 31, 2022.
(21)Represents the estimated maturity date based on the remaining reinvestment period and investmentunderlying loan maturities.
(22)Investment grade commercial real estate securities. It does not include the first mortgage commercial real estate loans collateralizing such loans and securities.
(21)(23)Includes $9.9$6.6 million of restricted securities under the risk retention rules of the Dodd-Frank Act. These securities are accounted for as held-to-maturity and recorded at amortized cost basis. Additionally includes $261.0 million of cash collateral.
(22)(24)Presented net of unamortized debt issuance costs of $8.4$15.4 million at December 31, 2019.2022.
(23)(25)The obligations under the senior unsecured notes are guaranteed by the Company and certain of its subsidiaries.
Committed Loan and Securities Repurchase Facilities
The Company has entered into multiple committed master repurchase agreements in order to finance its lending activities. The Company has entered into 6five committed master repurchase agreements, as outlined in the December 31, 20202023 table above, totaling $1.6$1.2 billion of credit capacity.capacity in order to finance its lending activities. Assets pledged as collateral under these facilities are limited to whole mortgage loans or participation interests in mortgage loans collateralized by first liens on commercial properties and mezzanine debt. The Company also has a term master repurchase agreement with a major U.S. bank to finance CMBS totaling $788.0$100 million. The Company’s repurchase facilities include covenants covering net worth requirements, minimum liquidity levels, maximum leverage ratios, and minimum fixed charge coverage ratios. The Company believes it was in compliance with all covenants as of December 31, 20202023 and December 31, 2019.2022.
The Company has the option to extend some of the current facilities subject to a number of conditions, including satisfaction of certain notice requirements, nothe absence of an event of default, exists, and nothe absence of a margin deficit, exists, all as defined in the repurchase facility agreements. The lenders have sole discretion with respect to the inclusion of collateral in these facilities to determineand the determination of the market value of the collateral on a daily basis, to be exercised on a good faith basis, and have the right in certain cases to require additional collateral, a full and/or partial repayment of the facilities (margin call), or a reduction in unused availability under the facilities, sufficient to rebalance the facilities if the estimated market value of the included collateral declines.
As of December 31, 2020,2023, the Company had total debt obligations of $606.6 million outstanding pursuant to repurchase agreements with 8 counterparties, with total debt obligations outstandingfour counterparties. All of $820.8 million.the loan repurchase facilities are due greater than 90 days from December 31, 2023, and the securities repurchase facility was due within 30 days of December 31, 2023. As of December 31, 2020, 22023, no counterparties JP Morgan and Wells Fargo, held collateral that exceeded the amounts borrowed under the related repurchase agreements by more than $77.4$153.2 million, or 5%10% of our total equity. As of December 31, 2020,2023, the weighted average haircut, or the percent of collateral value in excess of the loan amount, under our repurchase agreements was 29.7%18%. There have been no significant fluctuations in haircuts across asset classes on our repurchase facilities.
On February 14, 2020, the Company amended one of its committed loan repurchase facilities with a major U.S. bank to reduce the maximum capacity of the facility from $600.0 million to $500.0 million.
On February 26, 2020, the Company amended one of its committed loan repurchase facilities with a major U.S. bank, extending the term of the facility. The current maturity date is now February 26, 2021, and the Company has 3 one-year extension options for a final maturity date of February 26, 2024. The Company also reduced the maximum size of the facility from $350.0 million to $250.0 million.
On March 23, 2020, the Company amended one of its committed loan and securities repurchase facilities with a major U.S. bank to allow for an increase in the capacity on the securities repurchase facility, to the extent the Company has excess capacity on the loan repurchase facility. Prior to the amendment, the committed amounts on the facility were $500.0 million and $400.0 million on the loan and securities repurchase facilities, respectively. After the amendment, the committed amounts continue to total $900.0 million, with maximum capacity on the loan repurchase facility of $500.0 million, and maximum capacity on the securities repurchase facility of $900.0 million less outstanding commitments on the loan repurchase facility.
Effective June 16, 2020, the Company amended the pricing side letter related to one of its committed loan repurchase facility with a major U.S. bank to extend the current maturity date to March 24, 2021. The Company also temporarily increased the leverage covenant to 4.0x through and including December 31, 2020. On December 9, 2020, the Company further amended the pricing side letter to extend the current maturity date to October 24, 2021.
Revolving Credit Facility
The Company’s revolving credit facility (the “RevolvingRevolving Credit Facility”)Facility provides for an aggregate maximum borrowing amount of $266.4$323.9 million, including a $25.0 million sublimit for the issuance of letters of credit. The Revolving Credit Facility is available on a revolving basis to finance the Company’s working capital needs and for general corporate purposes. On November 25, 2019, the Company amendedBorrowings under the Revolving Credit Facility incur interest at a fixed margin of 2.50% over the index rate, with reductions in the fixed margin upon the achievement of investment grade credit ratings. On January 25, 2024, the Company amended its Revolving Credit Facility to add two additional one-year extension options, extendingextend the final maturity date including all extension options, to February 2025. The amendment also provided for a reduction of the interest rate to one-month LIBOR plus 3.00% upon the upgrade of the Company’s credit ratings, which occurred in January 2020.25, 2029. As of December 31, 2020, interest2023, the Company had no outstanding borrowings on the Revolving Credit Facility, is one-month LIBOR plus 3.00% per annum payable monthly in arrears. As of December 31, 2020,but still maintains the Company had $266.4 million borrowings outstanding.ability to draw $323.9 million.
The obligations under the Revolving Credit Facility are guaranteed by the Company and certain of its subsidiaries. The Revolving Credit Facility is secured by a pledge of the shares of (or other ownership or equity interests in) certain subsidiaries to the extent the pledge is not restricted under existing regulations, law or contractual obligations.
LCFHThe Company is subject to customary affirmative covenants and negative covenants, including limitations on the incurrence of additional debt, liens, restricted payments, sales of assets and affiliate transactions. In addition, under the Revolving Credit Facility, LCFHCompany is required to comply with financial covenants relating to minimum net worth, maximum leverage, minimum liquidity, and minimum fixed charge coverage, consistent with our other credit facilities. The Company’s ability to borrow under the Revolving Credit Facility is dependent on, among other things, LCFH’s compliance with the financial covenants. The Revolving Credit Facility contains customary events of default, including non-payment of principal or interest, fees or other amounts, failure to perform or observe covenants, cross-default to other indebtedness, the rendering of judgments against the Company or certain of our subsidiaries to pay certain amounts of money and certain events of bankruptcy or insolvency.
Debt Issuance Costs
As discussed in Note 2, Significant Accounting Policies in this Annual Report,of December 31, 2023 and December 31, 2022, the Company considers its committed loanamounts of unamortized costs relating to our master repurchase facilities and Revolving Credit Facility to be revolving debt arrangements. As such, the Company continues to defer and present costs associated with these facilities as an asset, subsequently amortizing those costs ratably over the term of each revolving debt arrangement. As of December 31, 2020 and 2019, the amount of unamortized costs relating to such facilities are $5.8were $4.0 million and $8.0$5.0 million, respectively, and are included in other assets in the consolidated balance sheets.
Uncommitted Securities Repurchase Facilities
The Company has also entered into multiple uncommitted master repurchase agreements with several counterparties collateralized by real estate securities.securities with several counterparties. The borrowings under these agreements have typical advance rates between 75% and 95% of the fair value of collateral.collateral, which is primarily AAA-rated securities.
Mortgage Loan Financing
The Company typically finances its real estate investments with long-term, non-recourse mortgage financing. These non-recourse debt agreements provide for fixed rate financing at rates ranging from 3.75% to 6.16%, with anticipated maturity dates between 2021- 2030 as of December 31, 2020. Thesemortgage loans have carrying amounts of $766.1$437.8 million and $812.6$498.0 million, net of unamortized premiums of $4.6$1.8 million and $5.5$2.4 million as of December 31, 20202023 and 2019,December 31, 2022, respectively, representing proceeds received upon financing greater than the contractual amounts due under these agreements. The premiums are being amortized over the remaining life of the respective debt instruments using the effective interest method. The Company recorded $1.2 million, $1.6$0.6 million and $1.0$0.7 million and $1.4 million of premium amortization, which decreased interest expense for the years ended December 31, 2020, 20192023, 2022, and 2018,2021 respectively. These non-recourse debt agreements provide for secured financing at rates ranging from 4.39% to 9.03%, and, as of December 31, 2023, have anticipated maturity dates between 2024 - 2031, with an average term of 3.1 years. The mortgage loans are collateralized by real estate and related lease intangibles, net, of $909.4$474.7 million and $988.9$559.9 million as of December 31, 20202023 and 2019,December 31, 2022, respectively. During the yearsyear ended December 31, 2020, 2019 and 2018,2023 the Company did not execute any new term debt agreements to finance properties in its real estate portfolio. During the year ended December 31, 2022, the Company executed 10, 22 and 12one new term debt agreements, respectively,agreement to finance properties in its real estate portfolio.
On February 6, 2019, the Company paid off $6.6 million of mortgage loan financing, recognizing a loss on extinguishment of debt of $1.1 million.
Secured Financing Facility
On April 30, 2020, the Company entered into a strategic financing arrangement with an American multinational corporation (the “Lender”), under which the Lender provided the Company with approximately $206.4 million in senior secured financing (the “Secured Financing Facility”Collateralized Loan Obligations (“CLO”) to fund transitional and land loans. The Secured Financing Facility is secured on a first lien basis on a portfolio of certain of the Company’s loans and will mature on May 6, 2023, and borrowings thereunder bear interest at LIBOR (or a minimum of 0.75% if greater) plus 10.0%, with a minimum interest premium of approximately $39.2 million minus the aggregate sum of all interest payments made under the Secured Financing Facility prior to the date of payment of the minimum interest premium, which is payable upon the earlier of maturity or repayment in full of the loan. The Senior Financing Facility is non-recourse, subject to limited exceptions, and does not contain mark-to-market provisions. Additionally, the Senior Financing Facility provides the Company optionality to modify or restructure loans or forbear in exercising remedies, which maximizes the Company’s financial flexibility.Debt
As part of the strategic financing, the Lender also had the ability to make an equity investment in the Company of up to 4.0 million Class A common shares at $8.00 per share, subject to certain adjustments (the “Purchase Right”). The Purchase Right was exercised in full at $8.00 per share on December 29, 2020. In addition, the Lender has agreed not to sell, transfer, assign, pledge, hypothecate, mortgage, dispose of or in any way encumber the shares acquired as a result of exercising the Purchase Right for a period of time following the exercise date. In connection with the issuance of the Purchase Right, the Company and the Lender entered into a registration rights agreement, pursuant to which the Company has agreed to provide customary demand and piggyback registration rights to the Lender.
The Purchase Right was classified as equity and the $200.9 million of net proceeds from the original issuance were allocated $192.5 million to the originally issued debt obligation and $8.4 million to the Purchase Right using the relative fair value method. The commitment to issue shares will not be subsequently remeasured. The $8.4 million allocated to the Purchase Right is being treated as a discount to the debt and amortized over the life of the Purchase Right to interest expense.
As 2020,2023, the Company had $192.6 million$1.1 billion of borrowings outstanding under the secured financing facilitymatched term, non-mark-to-market and non-recourse CLO debt included in debt obligations on its consolidated balance sheets, net ofwhich includes unamortized debt issuance costs of $7.2 million and an $6.6 million unamortized discount related to the Purchase Right.
Collateralized Loan Obligation (“CLO”) Debt$2.1 million.
On April 27, 2020,July 13, 2021, a consolidated subsidiary of the Company completed a privateprivately-marketed CLO transaction, with a major U.S. bank which generated $310.2$498.2 million of gross proceeds to Ladder, financing $481.3$607.5 million of loans (“Contributed July 2021 CLO Loans”) at a 64.5%an 82% advance rate on a matched term, non-mark-to-market and non-recourse basis. A consolidated subsidiary of the Company retained a 35.5%an 18% subordinate and controlling interest in the CLO. The Company retained controlconsent rights over major decisions made with respect to the administrationservicing of the Contributed July 2021 CLO Loans, including broad discretion in managing these loans in light of the COVID-19 pandemic, and has the abilityright to appoint and replace the special servicer under the CLO. The CLO is a VIE and the Company wasis the primary beneficiary and, therefore, consolidated the VIE - SeeVIE. Refer to Note 10,9, Consolidated Variable Interest Entities. Proceeds from the transaction were used to pay off other secured debt including bank and FHLB financing that was subject to mark-to-market provisions.
As of December 31, 2020, the Company had $276.5 million of matched term, non-mark-to-market and non-recourse CLO debt included in debt obligations on its consolidated balance sheets. Unamortized debt issuance costs of $2.6 million were included in CLO debt as of December 31, 2020.
The Company completed CLO issuances in the two transactions described below. In October 2019, the Company redeemed all outstanding debt obligations related to the two CLO transactions.Entities, for further detail.
On October 17, 2017,December 2, 2021, a consolidated subsidiary of the Company consummatedcompleted a securitization of floating-rate commercial mortgage loans through a staticprivately-marketed CLO structure. Over $456.9transaction, which generated $566.2 million of balance sheetgross proceeds to Ladder, financing $729.4 million of loans (“Contributed December 2021 CLO Loans”) were contributed into the CLO.at a maximum 77.6% advance rate on a matched term, non-mark-to-market and non-recourse basis. A consolidated subsidiary of the Company retained an approximately 18.5%15.6% subordinate and controlling interest in the CLO by retaining the most subordinate classes of notes issued byCLO. The Company also held two additional tranches as investments totaling 6.8% interest in the CLO. The Company retained controlconsent rights over major decisions made with respect to the administrationservicing of the Contributed December 2021 CLO Loans, and hadincluding the abilityright to appoint and replace the special servicer under the CLO. The CLO wasis a VIE and the Company wasis the primary beneficiary.beneficiary and, therefore, consolidated the VIE. Refer to Note 9, Consolidated Variable Interest Entities, for further detail.
On December 21, 2017, a subsidiary of the Company consummated a securitization of fixed and floating-rate commercial mortgage loans through a static CLO structure. Over $431.5 million of Contributed Loans were contributed into the CLO. A consolidated subsidiary of the Company retained an approximately 25.0% interest in the CLO by retaining the most subordinate classes of notes issued by the CLO. The Company retained control over major decisions made with respect to the administration of the Contributed Loans and had the ability to appoint the special servicer under the CLO. The CLO was a VIE and the Company was the primary beneficiary.
On July 11, 2012, Tuebor, a consolidated subsidiary of the Company, became a member of the FHLB and subsequently drew its first secured funding advances from the FHLB. On December 6, 2017, Tuebor’s advance limit was updated by the FHLB to the lowest of a Set Dollar Limit ($2.0 billion), 40% of Tuebor’s total assets or 150% of the Company’s total equity. Beginning April 1, 2020 through December 31, 2020, the Set Dollar Limit was $1.5 billion. Beginning January 1, 2021 through February 19, 2021, the Set Dollar Limit will be $750.0 million. Tuebor has met its obligations and paid down its advances in accordance with the scheduled reduction in the Set Dollar Limit, which remains subject to revision by the FHLB or as a result of any future changes in applicable regulations.
As of December 31, 2020, Tuebor had $288.0 million of borrowings outstanding (with an additional $1.2 billion of committed term financing available from the FHLB), with terms of overnight to 3.75 years (with a weighted average of 2.76 years), interest rates of 0.41% to 2.74% (with a weighted average of 1.12%), and advance rates of 45.0% to 95.7% on eligible collateral. As of December 31, 2020, collateral for the borrowings was comprised of $280.1 million of CMBS and U.S. Agency Securities and $108.3 million of first mortgage commercial real estate loans.
As of December 31, 2019, Tuebor had $1.1 billion of borrowings outstanding (with an additional $872.3 million of committed term financing available from the FHLB), with terms of overnight to 4.75 years (with a weighted average of 2.1 years), interest rates of 1.47% to 2.95% (with a weighted average of 2.33%), and advance rates of 60.8% to 100% of the collateral, including cash collateral. As of December 31, 2019, collateral for the borrowings was comprised of $432.0 million of CMBS and U.S. Agency Securities and $675.2 million of first mortgage commercial real estate loans and $261.0 million of cash.
FHLB advances amounted to 6.8% of the Company’s outstanding debt obligations as of December 31, 2020.
After February 19, 2021, pursuant to a final rule adopted by the Federal Housing Finance Agency (the "FHFA"“FHFA”) regarding the eligibility of captive insurance companies, Tuebor'sTuebor’s membership in the FHLB has been terminated, although outstanding advances may remain outstanding until their scheduled maturity dates, but Tuebor may not borrow additional funds.dates. Funding for future advance paydowns is expected to be obtained from the natural amortization and/or sales of securities collateral, or from other financing sources. There is no assurance that the FHFA or the FHLB will not take actions that could adversely impact Tuebor’s existing advances.
As of December 31, 2023, Tuebor had $115.0 million of borrowings outstanding, with terms of 0.34 years to 0.75 years (with a weighted average of 0.57 years), and interest rates of 5.76% to 5.88% (with a weighted average of 5.82%). As of December 31, 2023, collateral for the borrowings was comprised of $140.3 million of CMBS and U.S. Agency securities (with advance rates of 71.7% to 95.7%).
Tuebor is subject to state regulations which require that dividends (including dividends to the Company as its parent) may only be made with regulatory approval. However, there can be no assurance that we would obtain such approval if sought. Largely as a result of this restriction, approximately $2.1 billion$831.9 million of theTuebor’s member’s capital was restricted from transfer via dividend to Tuebor’s parent without prior approval of state insurance regulators at December 31, 2020.2023. To facilitate intercompany cash funding of operations and investments, Tuebor and its parent maintain regulator-approved intercompany borrowing/lending agreements.
Senior Unsecured Notes
As of December 31, 2020,2023, the Company had $1.6 billion of unsecured corporate bonds outstanding. These unsecured financings were comprised of $146.7 million in aggregate principal amount of 5.875% senior notes due 2021 (the “2021 Notes”), $465.9 million in aggregate principal amount of 5.25% senior notes due 2022 (the “2022 Notes”), $348.0$327.8 million in aggregate principal amount of 5.25% senior notes due 2025 (the “2025 Notes”) and $651.8, $611.9 million in aggregate principal amount of 4.25% senior notes due 2027 (the “2027 Notes”) and $635.9 million in aggregate principal of 4.75% senior notes due 2029 (the “2029 Notes,” collectively with the 2021 Notes, the 20222025 Notes and the 2027 Notes, the “Notes,”.
During the year ended December 31, 2023, the Company repurchased $16.2 million of the 2025 Notes the “Notes”). Asand recognized a resultnet gain of the Company’s financing and liquidity measures implemented to date as a direct response to the COVID-19 pandemic, Ladder repurchased an aggregate principal of the Notes of $139.1$1.3 million recognizing a gain on extinguishment of debt, repurchased $38.9 million of $19.0the 2027 Notes and recognized a net gain of $6.8 million offset by accelerated deferred financing cost amortizationon extinguishment of $1.5debt, and repurchased $13.1 million duringof the three months ended June 30, 2020.2029 Notes and recognized a net gain of $2.6 million on extinguishment of debt for an aggregate gain of $10.7 million.
LCFH issued the Notes with Ladder Capital Finance Corporation (“LCFC”), as co-issuers on a joint and several basis. LCFC is a 100% owned finance subsidiary of Series TRS of LCFH with no assets, operations, revenues or cash flows other than those related to the issuance, administration and repayment of the Notes. The Company and certain subsidiaries of LCFH currently guarantee the obligations under the Notes and the indenture. The Company is the general partner of LCFH and, through LCFH and its subsidiaries, operates the Ladder Capital business. As of December 31, 2020, the Company has a 100.0% economic and voting interest in LCFH and controls the management of LCFH as a result of its ability to appoint board members. Accordingly, the Company consolidates the financial results of LCFH. In addition, the Company, through certain subsidiaries which are treated as TRSs, is indirectly subject to U.S. federal, state and local income taxes. Other than federal, state and local income taxes, there are no material differences between the Company’s consolidated financial statements and LCFH’s consolidated financial statements. The Company believes it was in compliance with all covenants of the Notes as of December 31, 20202023 and 2019.
Unamortized debt issuance costs of $12.9 million and $8.4 million are included in senior unsecured notes as of December 31, 2020 and 2019, respectively, in accordance with GAAP.2022.
2021 Notes
On August 1, 2014, LCFH issued $300.0 million in aggregate principal amount of 5.875% senior notes due August 1, 2021 (the “2021 Notes”). The 2021 Notes require interest payments semi-annually in cash in arrears, on February 1 and August 1 of each year, beginning on February 1, 2015. The 2021 Notes will mature on August 1, 2021. The 2021 Notes are unsecured and are subject to incurrence-based covenants, including limitations on the incurrence of additional debt, restricted payments, liens, sales of assets, affiliate transactions and other covenants typical for financings of this type. At any time on or after August 1, 2017, the Company may redeem the 2021 Notes in whole or in part, upon not less than 30 nor more than 60 days’ notice, at redemption prices defined in the indenture governing the 2021 Notes, plus accrued and unpaid interest, if any, to the redemption date. On February 24, 2016, the board of directors authorized the Company to make up to $100.0 million in repurchases of the 2021 Notes from time to time without further approval. On May 2, 2018, the board of the directors authorized the Company to repurchase any or all of the 2021 Notes from time to time without further approval. During the year ended December 31, 2020, the Company retired $119.5 million of principal of the 2021 Notes for a repurchase price of $119.3 million, recognizing a $0.1 million net gain on extinguishment of debt after recognizing $(0.2) million of unamortized debt issuance costs associated with the retired debt. As of December 31, 2020, the remaining $146.7 million in aggregate principal amount of the 2021 Notes was due on August 1, 2021; however, subsequent to year end, the Company redeemed in full its 5.875% Senior Notes due 2021. Refer to Note 21 Subsequent Events for further details.
2022 Notes
On March 16, 2017, LCFH issued $500.0 million in aggregate principal amount of 5.250% senior notes due March 15, 2022 (the “2022 Notes”). The 2022 Notes require interest payments semi-annually in cash in arrears on March 15 and September 15 of each year, beginning on September 15, 2017. The 2022 Notes will mature on March 15, 2022. The 2022 Notes are unsecured and are subject to an unencumbered assets to unsecured debt covenant. At any time on or after September 15, 2021, the 2022 Notes are redeemable at the option of the Company, in whole or in part, upon not less than 15 nor more than 60 days’ notice, without penalty. On May 2, 2018, the board of the directors authorized the Company to repurchase any or all of the 2022 Notes from time to time without further approval. During the year ended December 31, 2020, the Company retired $34.2 million of principal of the 2022 Notes for a repurchase price of $33.2 million, recognizing a $0.7 million net gain on extinguishment of debt after recognizing $(0.2) million of unamortized debt issuance costs associated with the retired debt. As of December 31, 2020, the remaining $465.9 million in aggregate principal amount of the 2022 Notes is due March 15, 2022.
2025 Notes
On September 25, 2017, LCFH issued $400.0 million in aggregate principal amount of 5.250% senior notes due October 1, 2025 (the “2025 Notes”). The 2025 Notes require interest payments semi-annually in cash in arrears on April 1 and October 1 of each year, beginning on April 1, 2018. The 2025 Notes will mature on October 1, 2025. The 2025 Notes are unsecured, and are subject to an unencumbered assets to unsecured debt covenant. The Company may redeem the 2025 Notes prior to their stated maturity, in whole or in part, at any time or from time to time, prior to their stated maturity upon not less than 15 nor more than 60 days’with required notice and at a redemption price as specified in theeach respective indenture governing the 2025 Notes, plus accrued and unpaid interest, if any, to the redemption date. On May 2, 2018, theThe board of the directors has authorized the Company to repurchase any or all of the 2025 Notes from time to time without further approval. During
Financial Covenants
The Company’s debt facilities are subject to covenants that require the year endedCompany to maintain a minimum level of total equity. Largely as a result of this restriction, approximately $871.4 million of the total equity is restricted from payment as a dividend by the Company at December 31, 2020, the2023.
The Company retired $52.0 millionwas in compliance with all covenants as of principal of the 2025 Notes for a repurchase price of $45.1 million, recognizing a $6.4 million net gain on extinguishment of debt after recognizing $(0.5) million of unamortized debt issuance costs associated with the retired debt. December 31, 2023.
LIBOR Transition to SOFR
As of December 31, 2020, the remaining $348.0 million in aggregate principal amount2023, all of the 2025 Notes is due October 1, 2025.our floating rate debt obligations bear interest indexed to Term SOFR.
2027 Notes
On January 30, 2020, LCFH issued $750.0 million in aggregate principal amount of 4.25% senior notes due February 1, 2027. The 2027 Notes require interest payments semi-annually in cash in arrears on August 1 and February 1 of each year, beginning on August 1, 2020. The 2027 Notes will mature on February 1, 2027. The 2027 Notes are unsecured and are subject to an unencumbered assets to unsecured debt covenant. The Company may redeem the 2027 Notes, in whole, at any time, or from time to time, prior to their stated maturity. At any time on or after February 1, 2023, the Company may redeem the 2027 Notes in whole or in part, upon not less than 15 nor more than 60 days’ notice, at a redemption price defined in the indenture governing the 2027 Notes, plus accrued and unpaid interest, if any, to the redemption date. Net proceeds of the offering were used to repay secured indebtedness. During the year ended December 31, 2020, the Company retired $98.2 million of principal of the 2027 Notes for a repurchase price of $83.9 million, recognizing a $12.9 million net gain on extinguishment of debt after recognizing $(1.3) million of unamortized debt issuance costs associated with the retired debt. As of December 31, 2020, the remaining $651.8 million in aggregate principal amount of the 2027 Notes is due February 1, 2027.
Combined Maturity of Debt Obligations
The following schedule reflects the Company’s contractual payments under all borrowings by maturity ($ in thousands):
| | | | | | | | |
| Period ending December 31, | | Borrowings by
Maturity(1) |
| | |
| 2021 | | $ | 1,219,750 | |
| 2022 | | 734,290 | |
| 2023 | | 351,800 | |
| 2024 | | 575,471 | |
| 2025 | | 468,876 | |
| Thereafter | | 884,678 | |
| Subtotal | | 4,234,865 | |
| Debt issuance costs included in senior unsecured notes | | (12,928) | |
| | |
| Debt issuance costs included in secured financing facility | | (7,154) | |
| Discount on secured financing facility related to Purchase Right | | (6,550) | |
| Debt issuance costs included in CLO debt | | (2,640) | |
| Debt issuance costs included in mortgage loan financing | | (280) | |
| Premiums included in mortgage loan financing(2) | | 4,551 | |
| Total | | $ | 4,209,864 | |
| | | | | | | | |
| Period ending December 31, | | Borrowings by
Maturity(1) |
| 2024 | | $ | 320,900 | |
| 2025 | | 659,782 | |
| 2026 | | 138,170 | |
| 2027 | | 909,961 | |
| 2028 | | 24,317 | |
| Thereafter | | 681,474 | |
| Subtotal | | 2,734,604 | |
| Debt issuance costs included in senior unsecured notes | | (11,753) | |
| | |
| | |
| | |
| | |
| Debt issuance costs included in mortgage loan financings | | (1,441) | |
| Premiums included in mortgage loan financings(2) | | 1,816 | |
| Total (3) | | $ | 2,723,226 | |
(1)Contractual paymentsThe allocation of repayments under current maturities, someour committed loan repurchase facilities is based on the earlier of: (i) the maturity date of which are subject to extensions. The maturities listed above for 2021 relate to debt obligations that are subject to existing Company controlledeach agreement; or (ii) the maximum maturity date of the collateral loans, assuming all extension options for one or more additional one year periods or could be refinancedare exercised by other existing facilities as of December 31, 2020.the borrower.
(2)DeferredRepresents deferred gains on intercompany mortgage loans, secured by our own real estate, sold into securitizations. These premiums are amortized as a reduction to interest expense.
The Company’sTotal does not include $1.1 billion of consolidated CLO debt facilities are subject to covenants which requireobligations and the Company to maintain a minimum levelrelated debt issuance costs of total equity. Largely as a result of this restriction, approximately $871.4$2.1 million, of the total equity is restricted from payment as a dividend by the Company at December 31, 2020.
Financing Strategy in Current Market Conditions
In March 2020, as the COVID-19 health crisis rapidly transformed into a financial crisis, management took swift action to increase liquidity resourcessatisfaction of these liabilities will be paid through cash flow from loan collateral including amortization and actively manage its financing arrangements with its bank partners. In an abundance of caution, the Company first drew down on its $266.4 million unsecured revolving credit facility, which continues to be fully-drawn, and the proceeds continue to be held as unrestrictedwill not require cash on the Company’s balance sheet as of February 19, 2021.
Securities Repurchase Facilities: The Company invests in AAA-rated CRE CLO securities, typically front pay securities, with relatively short duration and significant subordination. These securities have historically been financed with short-term maturity repurchase agreements with various bank counterparties. The Company has been able to continue to access securities repurchase funding and the pricing of such borrowings has continued to improve during the three months ended December 31, 2020 as liquidity continued to return to the market and pricing for the securities that serve as collateral improved. Furthermore, during the three months ended December 31, 2020, the Company paid down $257.7 million of securities repurchase financing, primarily through sales of securities.outlays from us.
Federal Home Loan Bank (“FHLB”) Financing: In 2016, the FHFA adopted a final rule that limited our captive insurance subsidiary’s membership in the FHLB, requiring us to significantly reduce the amounts of FHLB borrowings outstanding by February of 2021. See “Liquidity and Capital Resources - FHLB financing” for further information.
During the three months ended December 31, 2020, the Company paid down FHLB borrowings of $38.0 million. The remaining maturities are staggered out through 2024. Funding for future advance paydowns would be obtained from the natural amortization of securities over time, loan pay offs and/or sales of loan and securities collateral. During the three months ended June 30, 2020, the Company paid down FHLB borrowings of $646.8 million and incurred $6.5 million in prepayment penalties related to this paydown.
Loan Repurchase Financing: The Company has maintained a consistent dialogue with its loan financing counterparties since the COVID-19 crisis unfolded in late March 2020. In addition to using proceeds from the Company’s 2027 Notes offering in January to reduce secured debt, during the year ended December 31, 2020, the Company paid down over $446.9 million on such loan repurchase financing through loan collateral pay offs and loans securitized through a CLO financing transaction (refer to above). The Company continues to maintain an active dialogue with its bank counterparties as it expects loan collateral could experience some measure of forbearance.
Secured Financing Facility: On April 30, 2020, the Company entered into a strategic financing arrangement (the “Agreement”) with an American multinational corporation (the “Lender”), under which the Lender will provide the Company with approximately $206.4 million in senior secured financing (the “Secured Financing Facility”) to fund transitional and land loans (see above).
Completion of Private CLO: On April 27, 2020, the Company completed a private CLO financing transaction with a major U.S. bank which generated $310.2 million of gross proceeds, financing $481.3 million of loans at a 64.5% advance rate on a matched term, non-mark-to-market and non-recourse basis (refer to above).
Based on the financing actions described above, the Company has significantly decreased its exposure to mark-to-market financing.
Financial Covenants
We were in compliance with all covenants described in the Company’s Annual Report, as of December 31, 2020.
8.7. DERIVATIVE INSTRUMENTS
The Company primarily uses derivative instruments primarily to economically manage the fair value variability of fixed rate assets caused by interest rate fluctuations and overall portfolio market risk. The following is a breakdown of the derivatives outstanding as of December 31, 20202023 and 2019December 31, 2022 ($ in thousands):
December 31, 2020 2023
| | | | | | | Fair Value | | Remaining
Maturity
(years) | | | | | Fair Value | | Remaining
Maturity
(years) |
| Contract Type | Contract Type | | Notional | | Asset(1) | | Liability(1) | |
| | Caps | Caps | | | | | | | | |
| 1 Month LIBOR | | $ | 69,571 | | | $ | 0 | | | $ | 0 | | | 0.35 |
| Caps | |
| Caps | | | |
| 1 Month Term SOFR | | 1 Month Term SOFR | | $ | 90,000 | | | $ | 908 | | | $ | — | | | 0.62 |
| Futures | Futures | | | | | | | | |
| 5-year Swap | | 23,800 | | | 108 | | | 0 | | | 0.25 |
| 10-year Swap | | 41,800 | | | 191 | | | 0 | | | 0.25 |
| 5-year Treasury-Note Futures | |
| 5-year Treasury-Note Futures | |
| 5-year Treasury-Note Futures | | | 18,800 | | | 98 | | | — | | | 0.25 |
| 10-year Treasury-Note Futures | | 10-year Treasury-Note Futures | | 86,100 | | | 447 | | | — | | | 0.25 |
| | Total futures | Total futures | | 65,600 | | | 299 | | | 0 | | | |
| | Total futures | |
| | Total futures | |
| | Options | |
| | Options | |
| | Options | |
| Options | |
| Options | |
| Options | | | N/A | (2) | 1 | | | — | | | 0.05 |
| | Total derivatives | Total derivatives | | $ | 135,171 | | | $ | 299 | | | $ | 0 | | | |
| | Total derivatives | |
| | Total derivatives | | | $ | 194,900 | | | $ | 1,454 | | | $ | — | | | |
(1)Shown as derivative instruments at fair value, in the accompanying consolidated balance sheets.
(2)The Company held 104 options contracts as of December 31, 2023.
December 31, 2019
| | | | | | | | | | | | | | | | | | | | | | | | | | |
| | | | | Fair Value | | Remaining
Maturity
(years) |
| Contract Type | | Notional | | Asset(1) | | Liability(1) | |
| | | | | | | | |
| Caps | | | | | | | | |
| 1Month LIBOR | | $ | 69,571 | | | $ | 0 | | | $ | 0 | | | 0.36 |
| Futures | | | | | | | | |
| 5-year Swap | | 46,000 | | | 158 | | | 0 | | | 0.25 |
| 10-year Swap | | 149,800 | | | 516 | | | 0 | | | 0.25 |
| 5-year U.S. Treasury Note | | 1,100 | | | 4 | | | 0 | | | 0.25 |
| | | | | | | | |
| Total futures | | 196,900 | | | 678 | | | 0 | | | |
| | | | | | | | |
| | | | | | | | |
| Credit Derivatives | | | | | | | | |
| | | | | | | | |
| S&P 500 Put Options | | 143,300 | | | 15 | | | 0 | | | 0.05 |
| | | | | | | | |
| Total credit derivatives | | 143,300 | | | 15 | | | 0 | | | |
| Total derivatives | | $ | 409,771 | | | $ | 693 | | | $ | 0 | | | |
| | | | | | | | | | | | | | | | | | | | | | | | | | |
| | | | | Fair Value | | Remaining
Maturity
(years) |
| Contract Type | | Notional | | Asset(1) | | Liability(1) | |
| | | | | | | | |
| Caps | | | | | | | | |
| 1 Month Term SOFR | | $ | 90,000 | | | $ | 1,804 | | | $ | — | | | 1.68 |
| Futures | | | | | | | | |
| 5-year Treasury-Note Futures | | 44,200 | | | 51 | | | — | | | 0.25 |
| 10-year Treasury-Note Futures | | 61,400 | | | 71 | | | — | | | 0.25 |
| | | | | | | | |
| | | | | | | | |
| Total futures | | 105,600 | | | 122 | | | — | | | |
| | | | | | | | |
| | | | | | | | |
| Options | | | | | | | | |
| | | | | | | | |
| Options | | 9,100 | | | 112 | | | — | | | 0.20 |
| | | | | | | | |
| | | | | | | | |
| Total derivatives | | $ | 204,700 | | | $ | 2,038 | | | $ | — | | | |
(1)Shown as derivative instruments at fair value, in the accompanying consolidated balance sheets.
The following table indicatessummarizes the net realized gains (losses) and unrealized appreciation (depreciation)gains (losses) on derivatives, by primary underlying risk exposure, as included in net result from derivatives transactions in the consolidated statements of operationsincome for the years ended December 31, 2020, 20192023, 2022, and 20182021 ($ in thousands):
| | | |
| | | | | Year Ended December 31, 2020 | | | Year Ended December 31, 2023 |
| Contract Type | Contract Type | | Unrealized
Gain/(Loss) | | Realized
Gain/(Loss) | | Net Result
from
Derivative
Transactions | Contract Type | | | | | | | Unrealized
Gain/(Loss) | | Realized
Gain/(Loss) | | Net Result
from
Derivative
Transactions |
| | Caps | |
| Caps | |
| Caps | |
| Futures | Futures | | $ | (379) | | | $ | (15,113) | | | $ | (15,492) | |
| | Credit Derivatives | | 111 | | | 111 | | | 222 | |
| Options | |
| Options | |
| Options | |
| Total | Total | | $ | (268) | | | $ | (15,002) | | | $ | (15,270) | |
| | | |
| | | | | Year Ended December 31, 2019 | | | Year Ended December 31, 2022 |
| Contract Type | Contract Type | | Unrealized
Gain/(Loss) | | Realized
Gain/(Loss) | | Net Result
from
Derivative
Transactions | Contract Type | | | | | | | Unrealized
Gain/(Loss) | | Realized
Gain/(Loss) | | Net Result
from
Derivative
Transactions |
| | Caps | |
| Futures | Futures | | $ | 1,653 | | | $ | (31,469) | | | $ | (29,816) | |
| | Credit Derivatives | | (111) | | | (84) | | | (195) | |
| Options | |
| Options | |
| Options | |
| Total | Total | | $ | 1,542 | | | $ | (31,553) | | | $ | (30,011) | |
| | | | | Year Ended December 31, 2018 | | Year Ended December 31, 2021 |
| Contract Type | Contract Type | | Unrealized
Gain/(Loss) | | Realized
Gain/(Loss) | | Net Result
from
Derivative
Transactions | Contract Type | Unrealized
Gain/(Loss) | | Realized
Gain/(Loss) | | Net Result
from
Derivative
Transactions |
| Caps | |
| Futures | |
| | Futures | | $ | (747) | | | $ | 16,176 | | | $ | 15,429 | |
| Swaps | | 1,403 | | | (848) | | | 555 | |
| Credit Derivatives | | 49 | | | (107) | | | (58) | |
| Total | Total | | $ | 705 | | | $ | 15,221 | | | $ | 15,926 | |
| | Total | |
| | Total | |
The Company’s counterparties held $0.8 million, $3.5 million and $5.0 million of cash margin as collateral for derivatives as of December 31, 2020, 2019, and 2018, respectively, which is included in restricted cash in the consolidated balance sheets.
Futures
Collateral posted with our futures counterparties is segregated in the Company’s books and records. Interest rate futures are centrally cleared by the Chicago Mercantile Exchange (“CME”) through a futures commission merchant. Interest rate futures that are governed by an ISDAInternational Swaps and Derivatives Association (“ISDA”) agreement provide for bilateral collateral pledging based on the counterparties’ market value. The counterparties have the right to re-pledge the collateral posted but have the obligation to return the pledged collateral, or substantially the same collateral, if agreed to by us, as the market value of the interest rate futures change.
The Company is required to post initial margin and daily variation margin for our interest rate futures that are centrally cleared by CME. CME determines the fair value of our centrally cleared futures, including daily variation margin. Effective January 3, 2017, CME amended their rulebooks to legally characterize daily variation margin payments for centrally cleared interest rate futures as settlement rather than collateral. As a result of this rule change, variationVariation margin pledged on the Company’s centrally cleared interest rate futures is settled against the realized results of these futures. The Company’s counterparties held $2.8 million, $2.5 million, and $0.5 million of cash margin as collateral for derivatives as of December 31, 2023, 2022, and 2021, respectively, which is included in restricted cash in the consolidated balance sheets.
9.8. OFFSETTING ASSETS AND LIABILITIES
The following tables present both gross information and net information about derivatives and other instruments eligible for offset in the statement of financial position as of December 31, 20202023 and 2019.December 31, 2022. The Company’s accounting policy is to record derivative asset and liability positions on a gross basis; therefore, the following tables present the gross derivative asset and liability positions recorded on the balance sheets, while also disclosing the eligible amounts of financial instruments and cash collateral to the extent those amounts could offset the gross amount of derivative asset and liability positions. The actual amounts of collateral posted by or received from counterparties may be in excess of the amounts disclosed in the following tables as the following only disclose amounts eligible to be offset to the extent of the recorded gross derivative positions.
AsThe following table represents offsetting of financial assets and derivative assets as of December 31, 2020
Offsetting of Financial Assets and Derivative Assets
($2023 ($ in thousands):
| | | Description | |
| | Description | Description | | Gross amounts of
recognized assets | | Gross amounts
offset in the
balance sheet | | Net amounts of
assets presented
in the balance
sheet | | Gross amounts not offset in the
balance sheet | | Net amount | Description | | Gross amounts of
recognized assets | | Gross amounts
offset in the
balance sheet | | Net amounts of
assets presented
in the balance
sheet | | Gross amounts not offset in the
balance sheet | | Net amount |
| Financial
instruments | | Cash collateral
received/(posted)(1) | |
| | Derivatives | Derivatives | | $ | 299 | | | $ | 0 | | | $ | 299 | | | $ | 0 | | | $ | 0 | | | $ | 299 | |
| | Derivatives | |
| | Derivatives | |
| Total | Total | | $ | 299 | | | $ | 0 | | | $ | 299 | | | $ | 0 | | | $ | 0 | | | $ | 299 | |
(1)Included in restricted cash on consolidated balance sheets.
AsThe following table represents offsetting of financial liabilities and derivative liabilities as of December 31, 2020
Offsetting of Financial Liabilities and Derivative Liabilities
($2023 ($ in thousands)
| | | | | | | | | | | | | | | | | | | | | | | | | | | | | | | | | | | | | | |
| Description | | Gross amounts of
recognized
liabilities | | Gross amounts
offset in the
balance sheet | | Net amounts of
liabilities
presented in the
balance sheet | | Gross amounts not offset in the
balance sheet | | Net amount |
| | | | Financial
instruments
collateral | | Cash collateral
posted/(received)(1) | |
| | | | | | | | | | | | |
| | | | | | | | | | | | |
| Repurchase agreements | | $ | 820,837 | | | $ | 0 | | | $ | 820,837 | | | $ | 820,837 | | | $ | 0 | | | $ | 0 | |
| Total | | $ | 820,837 | | | $ | 0 | | | $ | 820,837 | | | $ | 820,837 | | | $ | 0 | | | $ | 0 | |
| | | | | | | | | | | | | | | | | | | | | | | | | | | | | | | | | | | | | | |
| Description | | Gross amounts of
recognized
liabilities | | Gross amounts
offset in the
balance sheet | | Net amounts of
liabilities
presented in the
balance sheet | | Gross amounts not offset in the
balance sheet | | Net amount |
| | | | Financial
instruments
collateral | | Cash collateral
posted/(received)(1) | |
| | | | | | | | | | | | |
| | | | | | | | | | | | |
| Repurchase agreements | | $ | 606,607 | | | $ | — | | | $ | 606,607 | | | $ | 606,607 | | | $ | — | | | $ | 606,607 | |
| Total | | $ | 606,607 | | | $ | — | | | $ | 606,607 | | | $ | 606,607 | | | $ | — | | | $ | 606,607 | |
(1)Included in restricted cash on consolidated balance sheets.
AsThe following table represents offsetting of financial assets and derivative assets as of December 31, 2019
Offsetting of Financial Assets and Derivative Assets
2022($ in thousands):
| | Description | Description | | Gross amounts of
recognized assets | | Gross amounts
offset in the
balance sheet | | Net amounts of
assets presented
in the balance
sheet | | Gross amounts not offset in the
balance sheet | | Net amount | Description | | Gross amounts of
recognized assets | | Gross amounts
offset in the
balance sheet | | Net amounts of
assets presented
in the balance
sheet | | Gross amounts not offset in the
balance sheet | | Net amount |
| Financial
instruments | | Cash collateral
received/(posted)(1) | |
| | Derivatives | Derivatives | | $ | 693 | | | $ | 0 | | | $ | 693 | | | $ | 0 | | | $ | 0 | | | $ | 693 | |
| | Derivatives | |
| | Derivatives | |
| Total | Total | | $ | 693 | | | $ | 0 | | | $ | 693 | | | $ | 0 | | | $ | 0 | | | $ | 693 | |
(1)Included in restricted cash on consolidated balance sheets.
Asfinancial liabilities and derivative liabilities as of December 31, 2019
Offsetting of Financial Liabilities and Derivative Liabilities
($2022 ($ in thousands)
| | | | | | | | | | | | | | | | | | | | | | | | | | | | | | | | | | | | | | |
| Description | | Gross amounts of
recognized
liabilities | | Gross amounts
offset in the
balance sheet | | Net amounts of
liabilities
presented in the
balance sheet | | Gross amounts not offset in the
balance sheet | | Net amount |
| | | | Financial
instruments
collateral | | Cash collateral
posted/(received)(1) | |
| | | | | | | | | | | | |
| | | | | | | | | | | | |
| Repurchase agreements | | $ | 1,815,934 | | | $ | 0 | | | $ | 1,815,934 | | | $ | 1,815,934 | | | $ | 0 | | | $ | 0 | |
| Total | | $ | 1,815,934 | | | $ | 0 | | | $ | 1,815,934 | | | $ | 1,815,934 | | | $ | 0 | | | $ | 0 | |
| | | | | | | | | | | | | | | | | | | | | | | | | | | | | | | | | | | | | | |
| Description | | Gross amounts of
recognized
liabilities | | Gross amounts
offset in the
balance sheet | | Net amounts of
liabilities
presented in the
balance sheet | | Gross amounts not offset in the
balance sheet | | Net amount |
| | | | Financial
instruments
collateral | | Cash collateral
posted/(received)(1) | |
| | | | | | | | | | | | |
| | | | | | | | | | | | |
| Repurchase agreements | | $ | 847,863 | | | $ | — | | | $ | 847,863 | | | $ | 847,863 | | | $ | 19,128 | | | $ | 828,735 | |
| Total | | $ | 847,863 | | | $ | — | | | $ | 847,863 | | | $ | 847,863 | | | $ | 19,128 | | | $ | 828,735 | |
(1)Included in restricted cash on consolidated balance sheets.
Master netting agreements that the Company has entered into with its derivative and repurchase agreement counterparties allow for netting of the same transaction, in the same currency, on the same date. Assets, liabilities, and collateral subject to master netting agreements as of December 31, 20202023 and 2019December 31, 2022 are disclosed in the tables above. The Company does not present its derivative and repurchase agreements net on the consolidated financial statements as it has elected gross presentation.
10.9. CONSOLIDATED VARIABLE INTEREST ENTITIES
FASB ASC Topic 810 — Consolidation (“ASC 810”), provides guidance on the identification of entities for which control is achieved through means other than voting rights (“variable interest entities” or “VIEs”) and the determination of which business enterprise, if any, should consolidate the VIEs. Generally, the consideration of whether an entity is a VIE applies when either: (1) the equity investors (if any) lack one or more of the essential characteristics of a controlling financial interest; (2) the equity investment at risk is insufficient to finance that entity’s activities without additional subordinated financial support; or (3) the equity investors have voting rights that are not proportionate to their economic interests and the activities of the entity involve or are conducted on behalf of an investor with a disproportionately small voting interest. The Company consolidates VIEs in which it is considered to be the primary beneficiary. The primary beneficiary is the entity that has both of the following characteristics: (1) the power to direct the activities that, when taken together, most significantly impact the VIE’s performance; and (2) the obligation to absorb losses and right to receive the returns from the VIE that would be significant to the VIE. The Company consolidates one collateralized loan obligation (“CLO”) VIE with the followingon its balance sheet two CLOs that are considered VIEs as of December 31, 2023 and December 31, 2022 ($ in thousands):
| | | | | | | | | | | |
| December 31, 2023 | | December 31, 2022 |
| |
| | | |
| Restricted cash | $ | — | | | $ | 4,902 | |
| Mortgage loan receivables held for investment, net, at amortized cost | 1,327,722 | | | 1,308,654 | |
| | | |
| Accrued interest receivable | 9,394 | | | 8,313 | |
| Other assets | 4,469 | | | 17,505 | |
| Total assets | $ | 1,341,585 | | | $ | 1,339,374 | |
| Debt obligations, net | $ | 1,060,719 | | | $ | 1,058,462 | |
| | | |
| Accrued expenses | 3,555 | | | 3,029 | |
| Other liabilities | — | | | 65 | |
| Total liabilities | 1,064,274 | | | 1,061,556 | |
| Net equity in VIEs (eliminated in consolidation) | 277,311 | | | 277,818 | |
| | | |
| Total equity | 277,311 | | | 277,818 | |
| Total liabilities and equity | $ | 1,341,585 | | | $ | 1,339,374 | |
Refer to Note 6, Debt Obligations, Net - Collateralized Loan Obligations (“CLO”) Debt for further details.
| | | | | |
| December 31, 2020 |
| Notes 3 & 7 |
| |
| |
Restricted cash | $ | 3,925 | |
Mortgage loan receivables held for investment, net, at amortized cost | 362,600 | |
| |
Accrued interest receivable | 1,382 | |
Other assets | 69,649 | |
Total assets | $ | 437,556 | |
| |
Debt obligations, net | $ | 276,516 | |
| |
Accrued expenses | 682 | |
| |
Total liabilities | 277,198 | |
| |
Net equity in VIEs (eliminated in consolidation) | 160,358 | |
| |
Total equity | 160,358 | |
| |
Total liabilities and equity | $ | 437,556 | |
11.10. EQUITY STRUCTURE AND ACCOUNTS
The Company has 2 classesone outstanding class of common stock, Class A as of December 31, 2023, 2022 and 2021. Prior to September 30, 2020, the Company also had Class B common stock outstanding. The Class A and Class B whichcommon stock are described as follows:
Class A Common Stock
Voting Rights
Holders of shares of Class A common stock are entitled to 1one vote per share on all matters on which stockholders generally are entitled to vote. The holders of Class A common stock do not have cumulative voting rights in the election of directors.
Dividend Rights
Subject to the rights of the holders of any preferred stock that may be outstanding and any contractual or statutory restrictions, holders of Class A common stock are entitled to receive equally and ratably, share for share, dividends as may be declared by the board of directors out of funds legally available to pay dividends. Dividends upon Class A common stock may be declared by the board of directors at any regular or special meeting and may be paid in cash, in property, or in shares of capital stock.
Liquidation Rights
Upon liquidation, dissolution, distribution of assets or other winding up, the holders of Class A common stock are entitled to receive ratably the assets available for distribution to the shareholders after payment of liabilities and the liquidation preference of any outstanding shares of preferred stock.
Other Matters
The shares of Class A common stock have no preemptive or conversion rights and are not subject to further calls or assessment by the Company. There are no redemption or sinking fund provisions applicable to the Class A common stock. All outstanding shares of our Class A common stock are fully paid and non-assessable.
Class B Common Stock
We do not currently have any shares of Class B common stock outstanding.
Voting Rights
Holders of shares of Class B common stock are entitled to 1one vote for each share on all matters on which stockholders generally are entitled to vote. Holders of shares of our Class B common stock vote together with holders of our Class A common stock on all such matters. Our stockholders do not have cumulative voting rights in the election of directors.
No Dividend or Liquidation Rights
Holders of Class B common stock do not have any right to receive dividends or to receive a distribution upon a liquidation or winding up of Ladder Capital Corp.
Exchange for Class A Common Stock
We are a holding company and have no material assets other than our direct and indirect ownership of Series REIT limited partnership units (“Series REIT LP Units”) and Series TRS limited partnership units (“Series TRS LP Units,” and, collectively with Series REIT LP Units, “Series Units”) of LCFH. Series TRS LP Units are exchangeable for the same number of limited liability company interests of LC TRS I LLC (“LC TRS I Shares”), which is a limited liability company that is a TRS as well as a general partner of Series TRS. Pursuant to the Third Amended and Restated LLLP Agreement of LCFH, the Continuing LCFH Limited Partners may from time to time, subject to certain conditions, receive one share of the Company’s Class A common stock in exchange for (i) one share of the Company’s Class B common stock, (ii) one Series REIT LP Unit and (iii) either one Series TRS LP Unit or one TRS I LLC Share, subject to equitable adjustments for stock splits, stock dividends and reclassifications. As of September 30, 2020, all shares of Class B common stock, Series REIT LP Units and Series TRS LP Units have been exchanged for shares of Class A common stock and no Class B common stock is outstanding as of December 31, 2020.
During the year ended December 31, 2020, 12,158,933 Series REIT LP Units and 12,158,933 Series TRS LP Units were collectively exchanged for 12,158,933 shares of Class A common stock and 12,158,933 shares of Class B common stock were
canceled. We received no other consideration in connection with these exchanges. As of December 31, 2020, the Company held a 100.0% interest in LCFH.
During the year ended December 31, 2019, 1,139,411 Series REIT LP Units and 1,139,411 Series TRS LP Units were collectively exchanged for 1,139,411 shares of Class A common stock; and 1,139,411 shares of Class B common stock were canceled. We received no other consideration in connection with these exchanges. As of December 31, 2019, the Company held a 89.8% interest in LCFH.
Stock Repurchases
On October 30, 2014,July 27, 2022, the board of directors authorized the Company to repurchase up toof $50.0 million of the Company’s Class A common stock from time to time without further approval. This authorization increased the remaining outstanding authorization per the August 4, 2021 authorization from $39.5 million to $50.0 million. Stock repurchases by the Company are generally made for cash in open market transactions at prevailing market prices but may also be made in privately negotiated transactions or otherwise. The timing and amount of purchases are determined based upon prevailing market conditions, our liquidity requirements, contractual restrictions and other factors. As of December 31, 2020,2023, the Company has a remaining amount available for repurchase of $38.1$44.3 million, which represents 3.1%3.0% in the aggregate of its outstanding Class A common stock, based on the closing price of $9.78$11.51 per share on such date.
The following table is a summary oftables summarize the Company’s repurchase activity of its Class A common stock during the years ended December 31, 2020, 20192023 and 20182022 ($ in thousands):
| | | | | | | | | | | | | | |
| | Shares | | Amount(1) |
| | | | |
| Authorizations remaining as of December 31, 2019 | | | | $ | 41,132 | |
| Additional authorizations | | | | 0 | |
| Repurchases paid | | 384,251 | | | (3,030) | |
| Repurchases unsettled | | | | 0 | |
| Authorizations remaining as of December 31, 2020 | | | | $ | 38,102 | |
| | | | | | | | | | | | | | | | |
| | Shares | | | | Amount(1) |
| Authorizations remaining as of December 31, 2022 | | | | | | $ | 46,737 | |
| | | | | | |
| Repurchases paid: | | | | | | |
| March 1, 2023 - March 31, 2023 | | 250,000 | | | | | (2,285) | |
| | | | | | |
| | | | | | |
| | | | | | |
| | | | | | |
| | | | | | |
| September 1 - September 30, 2023 | | 19,000 | | | | | (196) | |
| | | | | | |
| | | | | | |
| | | | | | |
| | | | | | |
| Authorizations remaining as of December 31, 2023 | | | | | | $ | 44,256 | |
(1)Amount excludes commissions paid associated with share repurchases.
| | | | | | | | | | | | | | |
| | Shares | | Amount(1) |
| | | | |
| Authorizations remaining as of December 31, 2018 | | | | $ | 41,769 | |
| Additional authorizations | | | | 0 | |
| Repurchases paid | | 40,065 | | | (637) | |
| Repurchases unsettled | | | | 0 | |
| Authorizations remaining as of December 31, 2019 | | | | $ | 41,132 | |
| | | | | | | | | | | | | | |
| | Shares | | Amount(1) |
| Authorizations remaining as of December 31, 2021 | | | | $ | 44,122 | |
| Additional authorizations(2) | | | | 10,534 | |
| Repurchases paid | | 783,599 | | | (7,919) | |
| | | | |
| Authorizations remaining as of December 31, 2022 | | | | $ | 46,737 | |
(1)Amount excludes commissions paid associated with share repurchases.
| | | | | | | | | | | | | | |
| | Shares | | Amount(1) |
| | | | |
| Authorizations remaining as of December 31, 2017 | | | | $ | 41,769 | |
| Additional authorizations | | | | 0 | |
| Repurchases paid | | 0 | | | 0 | |
| Repurchases unsettled | | | | 0 | |
| Authorizations remaining as of December 31, 2018 | | | | $ | 41,769 | |
(1)Amount excludes commissions paid associated with share repurchases.
(2)On July 27, 2022 the Board authorized repurchases up to $50.0 million in aggregate.
| | | | | | | | | | | | | | |
| | Shares | | Amount(1) |
| | | | |
| Authorizations remaining as of December 31, 2020 | | | | $ | 38,102 | |
| Additional authorizations(2) | | | | 15,027 | |
| Repurchases paid | | 822,928 | | | (9,007) | |
| | | | |
| Authorizations remaining as of December 31, 2021 | | | | $ | 44,122 | |
(1)Amount excludes commissions paid associated with share repurchases.
(2)On August 4, 2021, the Board authorized additional repurchases of up to $50.0 million in aggregate.
Dividends
In order for the Company to maintain its qualification as a REIT under the Code, it must annually distribute at least 90% of its taxable income. The Company has paid and in the future intends to declare regular quarterly distributions to its shareholders in order to continue to qualify as a REIT.
Consistent with IRS guidance, the Company may, subject to a cash/stock election by its shareholders, pay a portion of its dividends in stock, to provide for meaningful capital retention; however, the REIT distribution requirements limit its ability to retain earnings and thereby replenish or increase capital for operations. The timing and amount of future distributions is based on a number of factors, including, among other things, the Company’s future operations and earnings, capital requirements and surplus, general financial condition and contractual restrictions. All dividend declarations are subject to the approval of the Company’s board of directors. Generally, the Company expects its distributions to be taxable as ordinary dividends to its shareholders, whether paid in cash or a combination of cash and common stock, and not as a tax-free return of capital or a capital gain (although forFor taxable years beginning after December 31, 2017 and before January 1, 2026, generally stockholders that are individuals, trusts or estates may deduct 20% of the aggregate amount of ordinary dividends distributed by us, subject to certain limitations).limitations. The Company believes that its significant capital resources and access to financing will provide the financial flexibility at levels sufficient to meet current and anticipated capital requirements, including funding new investment opportunities, paying distributions to its shareholders and servicing our debt obligations.
The following table presents dividends declared (on a per share basis) of Class A common stock for the years ended December 31, 2020, 20192023 and 2018:2022:
| | | | | | | | | |
| Declaration Date | | Dividend per Share | |
| | | |
February 27, 2020March 15, 2023 | | $ | 0.3400.23 | | |
May 28, 2020June 15, 2023 | | 0.2000.23 | | |
August 31, 2020September 15, 2023 | | 0.2000.23 | | |
December 15, 20202023 | | 0.2000.23 | | |
| Total | | $ | 0.9400.92 | | |
| | | |
February 27, 2019March 15, 2022 | | $ | 0.3400.20 | | |
May 30, 2019June 15, 2022 | | 0.3400.22 | | |
August 22, 2019September 15, 2022 | | 0.3400.23 | | |
November 26, 2019December 15, 2022 | | 0.3400.23 | | |
| Total | | $ | 1.3600.88 | | |
| | | |
February 27, 2018December 15, 2021 | | $ | 0.3150.20 | | |
May 30, 2018 | | 0.325 | | |
September 5, 201815, 2021 | | 0.3250.20 | | |
November 1, 2018(1)June 15, 2021 | | 0.5700.20 | | |
| March 15, 2021 | | 0.20 | | |
| Total | | $ | 1.5350.80 | | |
| | | |
| | | |
| | | |
| | | |
| | | |
| | | |
| | | |
| | | |
| | | |
| | | |
| | | |
| | | |
(1)
On October 30, 2018, the Company’s board of directors approved the fourth quarter 2018 dividend of $0.570 per share of the Company’s Class A common stock in order to meet its annual REIT taxable income distribution requirement. The dividend was paid as a combination of cash and Class A common stock, subject to shareholder elections.
The following table presents the tax treatment for our aggregate distributions per share of common stock paid for the years ended December 31, 2020, 20192023, 2022 and 2018:2021:
| | | | | | | | | | | | | | | | | | | | | | | | | | | | | | | | | | | | | | | | | | | | | | | | | | |
| Record Date | | Payment Date | | Dividend per Share | | Ordinary Dividends | | Qualified Dividends | | Capital Gain | | Unrecaptured 1250 Gain | | Return of Capital | | Section 199A
Dividends |
| | | | | | | | | | | | | | | | |
| March 31, 2023 | | April 17, 2023 | | 0.230 | | | 0.230 | | | — | | | — | | | — | | | — | | | 0.230 | |
| June 30, 2023 | | July 17, 2023 | | 0.230 | | | 0.230 | | | — | | | — | | | — | | | — | | | 0.230 | |
| September 29, 2023 | | October 16, 2023 | | 0.230 | | | 0.230 | | | — | | | — | | | — | | | — | | | 0.230 | |
| December 29, 2023 | | January 16, 2024 | (1) | 0.230 | | | 0.230 | | | — | | | — | | | — | | | — | | | 0.230 | |
| Total | | | | $ | 0.920 | | | $ | 0.920 | | | $ | — | | | $ | — | | | $ | — | | | $ | — | | | $ | 0.920 | |
| | | | | | | | | | | | | | | | | | | | | | | | | | | | | | | | | | | | | | | | | | | | |
| Record Date | | Payment Date | | Dividend per Share | | Ordinary Dividends | | Qualified Dividends | | Capital Gain | | Unrecaptured 1250 Gain | | Return of Capital |
| | | | | | | | | | | | | | |
| | | | | | | | | | | | | | |
| March 10, 2020 | | April 1, 2020 | | $ | 0.340 | | | $ | 0.230 | | | $ | 0 | | | $ | 0.039 | | | $ | 0.016 | | | $ | 0.071 | |
| June 10, 2020 | | July 1, 2020 | | 0.200 | | | 0.135 | | | 0 | | | 0.023 | | | 0.009 | | | 0.042 | |
| September 10, 2020 | | October 1, 2020 | | 0.200 | | | 0.135 | | | 0 | | | 0.023 | | | 0.009 | | | 0.042 | |
| December 31, 2020 | | January 15, 2021 | (1) | 0.200 | | | 0 | | | 0 | | | 0 | | | 0 | | | 0 | |
| Total | | | | $ | 0.940 | | | $ | 0.500 | | | $ | 0 | | | $ | 0.085 | | | $ | 0.034 | | | $ | 0.155 | |
(1)The fourth quarter dividend paid on January 16, 2024 was $0.230 and is considered a 2023 dividend for U.S. federal income tax purposes.
| | | | | | | | | | | | | | | | | | | | | | | | | | | | | | | | | | | | | | | | | | | | | | | | | | |
| Record Date | | Payment Date | | Dividend per Share | | Ordinary Dividends | | Qualified Dividends | | Capital Gain | | Unrecaptured 1250 Gain | | Return of Capital | | Section 199A
Dividends |
| December 31, 2021 | | January 18, 2022 | (1) | $ | 0.200 | | | $ | 0.034 | | | $ | — | | | $ | 0.166 | | | $ | 0.051 | | | $ | — | | | $ | 0.034 | |
| March 31, 2022 | | April 15, 2022 | | 0.200 | | | 0.034 | | | — | | | 0.166 | | | 0.051 | | | — | | | 0.034 | |
| June 30, 2022 | | July 15, 2022 | | 0.220 | | | 0.038 | | | — | | | 0.182 | | | 0.056 | | | — | | | 0.038 | |
| September 30, 2022 | | October 17, 2022 | | 0.230 | | | 0.039 | | | — | | | 0.191 | | | 0.059 | | | — | | | 0.039 | |
| December 31, 2022 | | January 17, 2023 | (2) | 0.230 | | | 0.039 | | | — | | | 0.191 | | | 0.059 | | | — | | | 0.039 | |
| Total | | | | $ | 1.080 | | | $ | 0.184 | | | $ | — | | | $ | 0.896 | | | $ | 0.276 | | | $ | — | | | $ | 0.184 | |
(1)The fourth quarter dividend paid on January 18, 2022 was $0.200 and is considered a 2022 dividend for U.S. federal income tax purposes.
(2)The fourth quarter dividend paid on January 16, 2023 was $0.230 and is considered a 2022 dividend for U.S. federal income tax purposes.
| | | | | | | | | | | | | | | | | | | | | | | | | | | | | | | | | | | | | | | | | | | | | | | | | | |
| Record Date | | Payment Date | | Dividend per Share | | Ordinary Dividends | | Qualified Dividends | | Capital Gain | | Unrecaptured 1250 Gain | | Return of Capital | | Section 199A
Dividends |
| December 31, 2020 | | January 15, 2021 | (1) | $ | 0.200 | | | $ | 0.053 | | | $ | 0.001 | | | $ | 0.095 | | | $ | 0.039 | | | $ | 0.052 | | | $ | 0.053 | |
| March 31, 2021 | | April 15, 2021 | | 0.200 | | | 0.053 | | | 0.001 | | | 0.095 | | | 0.039 | | | 0.052 | | | 0.053 | |
| June 30, 2021 | | July 15, 2021 | | 0.200 | | | 0.053 | | | 0.001 | | | 0.095 | | | 0.039 | | | 0.052 | | | 0.053 | |
| September 30, 2021 | | October 15, 2021 | | 0.200 | | | 0.053 | | | 0.001 | | | 0.095 | | | 0.039 | | | 0.052 | | | 0.053 | |
| December 31, 2021 | | January 18, 2022 | (2) | — | | | — | | | — | | | — | | | — | | | — | | | — | |
| Total | | | | $ | 0.800 | | | $ | 0.212 | | | $ | 0.004 | | | $ | 0.380 | | | $ | 0.156 | | | $ | 0.208 | | | $ | 0.212 | |
(1)The fourth quarter dividend paid on January 15, 2021 was $0.200 and is considered a 2021 dividend for U.S. federal income tax purposes.
| | | | | | | | | | | | | | | | | | | | | | | | | | | | | | | | | | | | | | |
| Record Date | | Payment Date | | Dividend per Share | | Ordinary Dividends | | Qualified Dividends | | Capital Gain | | Unrecaptured 1250 Gain |
| | | | | | | | | | | | |
| | | | | | | | | | | | |
| March 11, 2019 | | April 1, 2019 | | $ | 0.340 | | | $ | 0.324 | | | $ | 0.054 | | | $ | 0.016 | | | $ | 0.005 | |
| June 10, 2019 | | July 1, 2019 | | 0.340 | | | 0.324 | | | 0.054 | | | 0.016 | | | 0.005 | |
| September 10, 2019 | | October 1, 2019 | | 0.340 | | | 0.324 | | | 0.054 | | | 0.016 | | | 0.005 | |
| December 10, 2019 | | January 3, 2020 | (1) | 0.340 | | | 0.324 | | | 0.054 | | | 0.016 | | | 0.005 | |
| Total | | | | $ | 1.360 | | | $ | 1.296 | | | $ | 0.216 | | | $ | 0.064 | | | $ | 0.020 | |
(1)(2)The $0.340 fourth quarter dividend paid on January 3, 202018, 2022 was $0.200 and is considered a 2019 dividend for U.S. federal income tax purposes.
| | | | | | | | | | | | | | | | | | | | | | | | | | | | | | | | | | | | | | |
| Record Date | | Payment Date | | Dividend per Share | | Ordinary Dividends | | Qualified Dividends | | Capital Gain | | Unrecaptured 1250 Gain |
| | | | | | | | | | | | |
| December 11, 2017 | | January 3, 2018 | (1) | $ | 0.050 | | | $ | 0.038 | | | $ | 0 | | | $ | 0.012 | | | $ | 0.001 | |
| March 12, 2018 | | April 2, 2018 | | 0.315 | | | 0.239 | | | 0 | | | 0.076 | | | 0.009 | |
| June 11, 2018 | | July 2, 2018 | | 0.325 | | | 0.246 | | | 0 | | | 0.079 | | | 0.009 | |
| September 17, 2018 | | October 1, 2018 | | 0.325 | | | 0.246 | | | 0 | | | 0.079 | | | 0.009 | |
| December 10, 2018 | | January 24, 2019 | (2) | 0.570 | | | 0.432 | | | 0 | | | 0.138 | | | 0.015 | |
| Total | | | | $ | 1.585 | | | $ | 1.201 | | | $ | 0 | | | $ | 0.384 | | | $ | 0.043 | |
(1)$0.265 of the $0.315 fourth quarter dividend paid on January 3, 2018 is considered a 2017 dividend for U.S. federal income tax purposes. $0.050 is considered a 2018 dividend for U.S. federal income tax purposes and was reflected in 2019 tax reporting.
(2)The $0.570 fourth quarter dividend paid on January 24, 2019 is considered a 20182022 dividend for U.S. federal income tax purposes.
Stock Dividend
In order for the Company to maintain its qualification as a REIT under the Code, it must annually distribute at least 90% of its taxable income. The Company elected, subject to the cash/stock election by its shareholders described below, to pay its fourth quarter 2018 dividend in a mix of cash and stock and have such dividend be treated as a taxable distribution to its shareholders for U.S. federal income tax purposes.
Pursuant to IRS guidance, shareholders had the option to elect to receive the fourth quarter 2018 dividend in all cash (a “Cash Election”), or all shares of Ladder’s Class A common stock (a “Share Election”). Shareholders who did not return an election form, or who otherwise failed to properly complete an election form, were deemed to have made a Share Election. The total amount of cash paid to all shareholders was limited to a maximum of 20% of the total value of each of the fourth quarter 2018 dividend (the “Cash Amount”). The aggregate amount of the dividends owed to shareholders who made Cash Elections exceeded the Cash Amount, and accordingly, the Cash Amount was prorated among such shareholders, with the remaining portion of the fourth quarter 2018 dividend, as applicable, paid to such shareholders in shares of Ladder’s Class A common stock plus cash in lieu of any fractional shares. Shareholders making Stock Elections received the full amount of the dividend in shares of Ladder’s Class A common stock plus cash in lieu of any fractional shares.
On January 24, 2019, the Company paid an aggregate of $34.9 million in cash to its Class A shareholders, accrued for dividends payable on unvested restricted stock and unvested options with dividend equivalent rights of $0.5 million and issued 1,434,297 shares of its Class A common stock, equivalent to $23.9 million, in connection with the fourth quarter 2018 dividend totaling $0.570 per share. The total number of shares of Class A common stock distributed pursuant to the fourth quarter 2018 dividend was determined based on shareholder elections and the volume weighted average price of $16.67 per share of Class A common stock on the New York Stock Exchange for the three trading days after January 10, 2019, the date that election forms were due. The Company also issued 180,925 shares of its Class B common stock and each of Series REIT and Series TRS of LCFH issued 1,615,222 of their respective Series LP units corresponding to the aggregate number of Class A and Class B shares issued by the Company. The Company believes that the total value of its 2018 dividend was sufficient to fully distribute its 2018 taxable income.
Changes in Accumulated Other Comprehensive Income (Loss)
The following table presents changes in accumulated other comprehensive income related to the cumulative difference between the fair market value and the amortized cost basis of securities classified as available for sale for the years ended December 31, 2020, 20192023 and 20182022 ($ in thousands):
| | | | | | | | | | | | | | | | | | | | |
| | Accumulated Other Comprehensive Income (Loss) | | Accumulated Other Comprehensive Income (Loss) of Noncontrolling Interests | | Total Accumulated Other Comprehensive Income (Loss) |
| | | | | | |
| December 31, 2019 | | $ | 4,218 | | | $ | 475 | | | $ | 4,693 | |
| Other comprehensive income (loss) | | (9,950) | | | (5,208) | | | (15,158) | |
| Exchange of noncontrolling interest for common stock | | (6,952) | | | 6,952 | | | 0 | |
| Rebalancing of ownership percentage between Company and Operating Partnership | | 2,221 | | | (2,221) | | | 0 | |
| December 31, 2020 | | $ | (10,463) | | | $ | (2) | | | $ | (10,465) | |
| | | | | | | | | | | | | | | | | | | | |
| | Accumulated Other Comprehensive Income (Loss) | | Accumulated Other Comprehensive Income (Loss) of Noncontrolling Interests | | Total Accumulated Other Comprehensive Income (Loss) |
| | | | | | |
| December 31, 2018 | | $ | (4,649) | | | $ | (588) | | | $ | (5,237) | |
| Other comprehensive income (loss) | | 8,785 | | | 1,145 | | | 9,930 | |
| Exchange of noncontrolling interest for common stock | | 65 | | | (65) | | | 0 | |
| Rebalancing of ownership percentage between Company and Operating Partnership | | 17 | | | (17) | | | 0 | |
| December 31, 2019 | | $ | 4,218 | | | $ | 475 | | | $ | 4,693 | |
| | | | | | | | | | | | | | | | | | | | | | | | |
| | Year Ended December 31, | | | | |
| | 2023 | | 2022 | | 2021 | | | | |
| Accumulated Other Comprehensive Income (Loss) beginning of period | | $ | (21,009) | | | $ | (4,112) | | | $ | (10,463) | | | | | |
| Other comprehensive income (loss) | | 7,156 | | | (16,897) | | | 6,351 | | | | | |
| | | | | | | | | | |
| | | | | | | | | | |
| | | | | | | | | | |
| Accumulated Other Comprehensive Income (Loss) end of period | | $ | (13,853) | | | $ | (21,009) | | | $ | (4,112) | | | | | |
| | | | | | | | | | | | | | | | | | | | |
| | Accumulated Other Comprehensive Income (Loss) | | Accumulated Other Comprehensive Income (Loss) of Noncontrolling Interests | | Total Accumulated Other Comprehensive Income (Loss) |
| | | | | | |
| December 31, 2017 | | $ | (212) | | | $ | 116 | | | $ | (96) | |
| Other comprehensive income (loss) | | (4,211) | | | (930) | | | (5,141) | |
| Exchange of noncontrolling interest for common stock | | (167) | | | 167 | | | 0 | |
| Rebalancing of ownership percentage between Company and Operating Partnership | | (59) | | | 59 | | | 0 | |
| December 31, 2018 | | $ | (4,649) | | | $ | (588) | | | $ | (5,237) | |
12.11. NONCONTROLLING INTERESTS
There are two main types of noncontrolling interest reflectedNoncontrolling Interests in the Company’s consolidated financial statements (i) noncontrolling interest in the operating partnership and (ii) noncontrolling interest in consolidated joint ventures.
Noncontrolling Interest in the Operating Partnership
Pursuant to LCFH’s Third Amended and Restated LLLP Agreement, dated as of December 31, 2014 and as amended, and subject to the applicable minimum retained ownership requirements and certain other restrictions, including notice requirements, limited partners of LCFH prior to Ladder Capital Corp’s IPO who held an economic interest in LCFH and voting shares of Ladder Capital Corp Class B common stock (the “Continuing LCFH Limited Partners”) (or certain transferees thereof) were, subject to certain conditions, able to receive one share of the Company’s Class A common stock in exchange for (i) one share of the Company’s Class B common stock, (ii) one Series REIT LP Unit and (iii) either one Series TRS LP Unit or one TRS Share, subject to equitable adjustments for stock splits, stock dividends and reclassifications. However, such exchange for shares of Ladder Capital Corp Class A common stock did not affect the exchanging owners’ voting power since the votes represented by the canceled shares of Ladder Capital Corp Class B common stock were replaced with the votes represented by the shares of Class A common stock for which such Series Units, including TRS Shares as applicable, were exchanged. As of September 30, 2020, all shares of Class B common stock had been exchanged for shares of Class A common stock and the Company held a 100% interest in LCFH.
The roll-forward of the Operating Partnership’s LP Units followed the Class B common stock of the Company as disclosed in the consolidated statements of changes in equity. As of December 31, 2020, all shares of Class B common stock have been exchanged for shares of Class A common stock, and the Company held a 100% interest in LCFH.
Pursuant to ASC 810, Consolidation, on the accounting and reporting for noncontrolling interests and changes in ownership interests of a subsidiary, changes in a parent’s ownership interest (and transactions with noncontrolling interest unitholders in the subsidiary), while the parent retains its controlling interest in its subsidiary, should be accounted for as equity transactions. The carrying amount of the noncontrolling interest shall be adjusted to reflect the change in its ownership interest in the subsidiary, with the offset to equity attributable to the parent. Accordingly, as a result of Continuing LCFH Limited Partners exchanges which caused changes in ownership percentages between the Company’s Class A shareholders and the noncontrolling interests in the Operating Partnership that occurred during the year ended December 31, 2020, the Company has increased noncontrolling interests in the Operating Partnership and accumulated other comprehensive income and increased additional paid-in capital in the Company’s shareholders’ equity by $1.0 million as of December 31, 2020.
Distributions to Noncontrolling Interest in the Operating Partnership
Notwithstanding the foregoing, subject to any restrictions in applicable debt financing agreements and available liquidity as determined by the board of directors of each of Series REIT of LCFH and Series TRS of LCFH, each Series used commercially reasonable efforts to make quarterly distributions to each of its partners (including the Company) at least equal to such partner’s “Quarterly Estimated Tax Amount,” which was computed (as more fully described in LCFH’s Third Amended and Restated LLLP Agreement) for each partner as the product of (x) the U.S. federal taxable income (or alternative minimum taxable income, if higher) allocated by such Series to such partner in respect of the Series REIT LP Units and Series TRS LP Units held by such partner and (y) the highest marginal blended U.S. federal, state and local income tax rate (or alternative minimum taxable rate, as applicable) applicable to an individual residing in New York, NY, taking into account, for U.S. federal income tax purposes, the deductibility of state and local taxes; provided that Series TRS of LCFH took into account, in determining the amount of tax distributions to holders of Series TRS LP Units, the amount of any distributions each such holder received from Series REIT of LCFH in excess of tax distributions. In addition, to the extent the Company required an additional distribution from the Series of LCFH in excess of its quarterly tax distribution in order to pay its quarterly cash dividend, the Series of LCFH was required to make a corresponding distribution of cash to each of their partners (other than the Company) on a pro-rata basis. As of December 31, 2020, all shares of Class B common stock have been exchanged for shares of Class A common stock, and the Company held a 100% interest in LCFH. Due to the expiration of the partnership during the year, the above will no longer be applicable prospectively.
Income and losses and comprehensive income were allocated among the partners in a manner to reflect as closely as possible the amount each partner would be distributed under the Third Amended and Restated LLLP Agreement of LCFH upon liquidation of the Operating Partnership’s assets.
Noncontrolling Interest in Consolidated Joint Ventures
As of December 31, 2020,2023, the Company consolidates 4two ventures and in whicheach, there are otherdifferent noncontrolling investors, which own between 10.0% - 25.0% of such ventures. These ventures hold investments in a 40-building student housing portfolio in Isla Vista, CA with a book value of $81.7$78.7 million, 11 office buildings in Richmond, VA with a book value of $72.2 million,and a single-tenant office building in Oakland County, MI with a book value of $9.2 million and an apartment complex in Miami, FL with a book value of $37.1$8.9 million. The Company makes distributions and allocates income from these ventures to the noncontrolling interests in accordance with the terms of the respective governing agreements.
Sales
During the year ended December 31, 2023 there were no sales of assets with noncontrolling interests. During the year ended December 31, 2022, the Company sold its apartment complex in Stillwater, OK, and its apartment complex in Miami, FL. Refer to Note 5, Real Estate and Related Lease Intangibles, Net, for further details.
13.12. EARNINGS PER SHARE
The Company’s net income (loss) and weighted average shares outstanding for the years ended December 31, 2020, 20192023, 2022, and 20182021 consist of the following:
| | | | Year Ended December 31, |
| | | Year Ended December 31, | |
| | | Year Ended December 31, | |
| | | Year Ended December 31, | |
| ($ in thousands except share amounts) | ($ in thousands except share amounts) | | | 2020 | | 2019 | | 2018 | ($ in thousands except share amounts) | | | | | 2023 | | 2022 | | 2021 |
| | Basic Net income (loss) available for Class A common shareholders | | | $ | (14,445) | | | $ | 122,645 | | | $ | 180,015 | |
| Diluted Net income (loss) available for Class A common shareholders | | | $ | (14,445) | | | $ | 122,645 | | | $ | 180,015 | |
| Weighted average shares outstanding | | | | | | | |
| Basic and Diluted Net income (loss) available for Class A common shareholders | |
| Basic and Diluted Net income (loss) available for Class A common shareholders | |
| Basic and Diluted Net income (loss) available for Class A common shareholders | |
| | Weighted average shares outstanding: | |
| Weighted average shares outstanding: | |
| Weighted average shares outstanding: | | | | | | | | |
| Basic | Basic | | | 112,409,615 | | | 105,455,849 | | | 97,226,027 | |
| Diluted | Diluted | | | 112,409,615 | | | 106,399,783 | | | 97,652,065 | |
The calculation of basic and diluted net income (loss) per share amounts for the years ended December 31, 2020, 20192023, 2022, and 20182021 consist of the following:
| | | | Year Ended December 31, |
| (In thousands except share and per share amounts) | | | 2020(1) | | 2019(1) | | 2018(1) |
| | | | Year Ended December 31, | |
| | | Year Ended December 31, | |
| | | Year Ended December 31, | |
| (In thousands except share and per share amounts) (1) | | (In thousands except share and per share amounts) (1) | | | | | 2023 | | 2022 | | 2021 |
| Basic Net Income (Loss) Per Share of Class A Common Stock | Basic Net Income (Loss) Per Share of Class A Common Stock | | | | | | | | Basic Net Income (Loss) Per Share of Class A Common Stock | | | | | | | |
| Numerator: | | | | | | | |
Numerator: | | Numerator: | | | | | | | |
| Net income (loss) attributable to Class A common shareholders | Net income (loss) attributable to Class A common shareholders | | | $ | (14,445) | | | $ | 122,645 | | | $ | 180,015 | |
| Denominator: | | | | | | | |
Denominator: | | Denominator: | | | | | | | |
| Weighted average number of shares of Class A common stock outstanding | Weighted average number of shares of Class A common stock outstanding | | | 112,409,615 | | | 105,455,849 | | | 97,226,027 | |
| Basic net income (loss) per share of Class A common stock | Basic net income (loss) per share of Class A common stock | | | $ | (0.13) | | | $ | 1.16 | | | $ | 1.85 | |
| | Diluted Net Income (Loss) Per Share of Class A Common Stock | Diluted Net Income (Loss) Per Share of Class A Common Stock | | | | | | | |
| Diluted Net Income (Loss) Per Share of Class A Common Stock | |
| Diluted Net Income (Loss) Per Share of Class A Common Stock | | | | | | | | |
| Numerator: | Numerator: | | | | | | | | Numerator: | | | | | | | |
| Net income (loss) attributable to Class A common shareholders | Net income (loss) attributable to Class A common shareholders | | | $ | (14,445) | | | $ | 122,645 | | | $ | 180,015 | |
| Add (deduct) - dilutive effect of: | | | | | | | |
| Amounts attributable to operating partnership’s share of Ladder Capital Corp net income (loss)(2) | | | 0 | | | 0 | | | 0 | |
| Additional corporate tax (expense) benefit(2) | | | 0 | | | 0 | | | 0 | |
| | Diluted net income (loss) attributable to Class A common shareholders | |
| | Diluted net income (loss) attributable to Class A common shareholders | |
| | Diluted net income (loss) attributable to Class A common shareholders | Diluted net income (loss) attributable to Class A common shareholders | | | (14,445) | | | 122,645 | | | $ | 180,015 | |
| Denominator: | Denominator: | | | | | | | | Denominator: | | | | | | | |
| Basic weighted average number of shares of Class A common stock outstanding | Basic weighted average number of shares of Class A common stock outstanding | | | 112,409,615 | | | 105,455,849 | | | 97,226,027 | |
| Add - dilutive effect of: | Add - dilutive effect of: | | | | | | | | Add - dilutive effect of: | | | | | | | |
| Shares issuable relating to converted Class B common shareholders(3) | | | 0 | | | 0 | | | 0 | |
| Incremental shares of unvested Class A restricted stock(3) | | | 0 | | | 943,934 | | | 426,038 | |
| Incremental shares of unvested stock options | | | 0 | | | 0 | | | 0 | |
| Diluted weighted average number of shares of Class A common stock outstanding | | | 112,409,615 | | | 106,399,783 | | | 97,652,065 | |
| | Incremental shares of unvested Class A restricted stock(1) | |
| Incremental shares of unvested Class A restricted stock(1) | |
| Incremental shares of unvested Class A restricted stock(1) | |
| | Diluted weighted average number of shares of Class A common stock outstanding (2) | |
| Diluted weighted average number of shares of Class A common stock outstanding (2) | |
| Diluted weighted average number of shares of Class A common stock outstanding (2) | |
| Diluted net income (loss) per share of Class A common stock | Diluted net income (loss) per share of Class A common stock | | | $ | (0.13) | | | $ | 1.15 | | | $ | 1.84 | |
(1)ForThe Company applies the treasury stock method.
(2)There were 367,001 anti-dilutive shares for the years ended December 31, 2020, 2019 and 2018, shares issuable relating to converted Class B common shareholders are excluded from the calculation of diluted EPS as the inclusion of such potential common shares in the calculation would be anti-dilutive.2023.
(2)The Company is using the as-if converted method for the Class B common shareholders while adjusting for additional corporate income tax expense (benefit) for the described net income (loss) add-back for periods prior to September 30, 2020. There are no Class B common stock outstanding as of December 31, 2020.
(3)The Company is using the treasury stock method.
The shares of Class B common stock do not share in the earnings of Ladder Capital Corp and are, therefore, not participating securities. Accordingly, basic and diluted net income (loss) per share of Class B common stock has not been presented, although the assumed conversion of Class B common stock has been included in the presented diluted net income (loss) per share of Class A common stock for the period of time that Class B common stock was outstanding.
14. STOCK BASED13. STOCK-BASED AND OTHER COMPENSATION PLANS
Summary of Stock and Shares Unvested/Outstanding
The following table summarizes the impact on the consolidated statementstatements of operationsincome of the various stock basedstock-based compensation plans and other compensation plans ($ in thousands):
| | | | | | | | | | | | | | | | | | | | | |
| | | Year Ended December 31, |
| | | | | 2020 | | 2019 | | 2018 |
| | | | | | | | | |
| | | | | | | | | |
| | | | | | | | | |
| | | | | | | | | |
| | | | | | | | | |
| | | | | | | | | |
| | | | | | | | | |
| | | | | | | | | |
| | | | | | | | | |
| | | | | | | | | |
| | | | | | | | | |
| | | | | | | | | |
| | | | | | | | | |
| | | | | | | | | |
| Stock Based Compensation Expense | | | | | $ | 42,728 | | | $ | 21,777 | | | $ | 8,831 | |
| | | | | | | | | |
| Phantom Equity Investment Plan | | | | | (1,238) | | | 1,341 | | | — | |
| Stock Options Exercised | | | | | 270 | | | — | | | — | |
| Ladder Capital Corp Deferred Compensation Plan | | | | | — | | | — | | | 1,163 | |
| Bonus Expense | | | | | 1,082 | | | 28,235 | | | 34,465 | |
| Total | | | | | $ | 42,842 | | | $ | 51,353 | | | $ | 44,459 | |
| | | | | | | | | | | | | | | | | | | | | |
| | | Year Ended December 31, |
| | | | | 2023 | | 2022 | | 2021 |
| | | | | | | | | |
| Stock-based compensation expense | | | | | $ | 18,577 | | | $ | 31,584 | | | $ | 15,300 | |
| Phantom Equity Investment Plan | | | | | — | | | — | | | 22 | |
| | | | | | | | | |
| Total Stock-Based Compensation Expense (1) | | | | | $ | 18,577 | | | $ | 31,584 | | | $ | 15,322 | |
SummaryVariance between twelve months ended December 31, 2023, 2022, and 2021 is primarily due to timing of Stock2021, 2022 and Shares/Options Nonvested/Outstanding2023 employee stock and bonus compensation.
A summary of the grants is presented below:
| | | | | | | | | | | | | | | | | | | | | | | | | | | | | | | | | | | | | | | | | | | |
| | | | Year Ended December 31, |
| | | | | | 2020 | | 2019 | | 2018 |
| | | | | | | | | Number
of Shares/Options | | Weighted
Average
Fair Value
Per Share | | Number
of Shares/Options | | Weighted
Average
Fair Value
Per Share | | Number
of Shares/Options | | Weighted
Average
Fair Value
Per Share |
| | | | | | | | | | | | | | | | | | | |
| Grants - Class A Common Stock | | | | | | | | | 4,423,215 | | | $ | 12.84 | | | 1,569,694 | | | $ | 17.54 | | | 33,656 | | | $ | 14.86 | |
| Grants - Class A Common Stock dividends | | | | | | | | | 0 | | | 0 | | | 11,113 | | | 16.61 | | | — | | | — | |
| Stock Options | | | | | | | | | 0 | | | — | | | 12,073 | | | — | | | — | | | — | |
| | | | | | | | | | | | | | | | | | | | | | | | | | | | | | | | | | | | | | | | | | | |
| | | | Year Ended December 31, |
| | | | | | 2023 | | 2022 | | 2021 |
| | | | | | | | | Number
of Shares | | Weighted
Average
Fair Value
Per Share | | Number
of Shares | | Weighted
Average
Fair Value
Per Share | | Number
of Shares | | Weighted
Average
Fair Value
Per Share |
| | | | | | | | | | | | | | | | | | | |
| Grants - Class A Common Stock | | | | | | | | | 1,417,561 | | | $ | 11.58 | | | 2,884,303 | | | $ | 11.87 | | | 747,713 | | | $ | 9.81 | |
| | | | | | | | | | | | | | | | | | | |
| | | | | | | | | | | | | | | | | | | |
The table below presents the number of unvested shares of Class A common stock and outstanding stock options at December 31, 20202023 and changes during 20202023 of the Class A Commoncommon stock and Stock Optionsstock options of Ladder Capital Corp granted under the 2014 Omnibus Incentive Plan:
| | | | | | | | | | | | | |
| Restricted Stock | | Stock Options | | |
| | | | | |
| Nonvested/Outstanding at December 31, 2019 | 1,436,683 | | | 994,208 | | | |
| Granted | 4,423,215 | | | 0 | | | |
| Exercised | — | | | (83,845) | | | |
| Vested | (3,031,109) | | | — | | | |
| Forfeited | (27,965) | | | 0 | | | |
| Expired | — | | | (229,261) | | | |
| Nonvested/Outstanding at December 31, 2020 | 2,800,824 | | | 681,102 | | | |
| | | | | |
| Exercisable at December 31, 2020 (1) | | | 681,102 | | | |
| | | | | | | | | | | | | | | | | | | |
| Restricted Stock | | Weighted Average Grant Date Fair Value | | Stock Options | | |
| | | | | | | |
| Nonvested/Outstanding at December 31, 2022 | 2,529,571 | | | $ | 12.62 | | | 623,788 | | | |
| Granted | 1,417,561 | | | 11.58 | | | — | | | |
| | | | | | | |
| Vested | (1,699,744) | | | 12.14 | | | — | | | |
| Forfeited | (49,425) | | | 10.43 | | | — | | | |
| | | | | | | |
| Nonvested/Outstanding at December 31, 2023 | 2,197,963 | | | $ | 12.37 | | | 623,788 | | | |
| | | | | | | |
| Exercisable at December 31, 2023 (1) | | | | | 623,788 | | | |
(1)The weighted-averageweighted average exercise price of outstanding options warrants and rights is $14.84 at December 31, 2020.2023.
At December 31, 20202023, there was $13.3$9.5 million of total unrecognized compensation cost related to certain share-based compensation awards that is expected to be recognized over a period of up to 21.726.0 months, with a weighted-averageweighted average remaining vesting period of 2619.9 months.
2014 Omnibus Incentive Plan
In connection with the IPO Transactions, the 2014 Ladder Capital Corp Omnibus Incentive Equity Plan (the “2014 Omnibus Incentive Plan”) was adopted by the board of directors on February 11, 2014, and providesprovided certain members of management, employees and directors of the Company or its affiliates with additional incentives including grants of stock options, stock appreciation rights, restricted stock, other stock-based awards and other cash-based awards.
2023 Omnibus Incentive Plan
At the Company’s Annual Meeting held on June 6, 2023, the stockholders of the Company approved the Ladder Capital Corp 2023 Omnibus Incentive Plan (the “2023 Omnibus Incentive Plan”), effective as of the date of the Annual Meeting (the
2018 Restricted Stock Awards“Effective Date”). The 2023 Omnibus Incentive Plan superseded and replaced the 2014 Omnibus Incentive Plan in its entirety as of the Effective Date.
On February 18, 2018, certain membersThe aggregate number of shares of the board of directors each received annual restricted stock awards with a grant date fair value of $0.4 million, representing 25,370 shares of restrictedCompany’s Class A common stock which vested in full on the first anniversary of the date of grant, subjectthat will be available for issuance to continued service on the board of directors. Compensation expense related to the time-based vesting criteria of the award was recognized on a straight-line basis over the one year vesting period.
On April 23, 2018, a new employeeemployees, non-employee directors and consultants of the Company received a restricted stock award with a grant date fair value of $0.1 million, representing 3,566and its affiliates under the 2023 Omnibus Incentive Plan will not exceed 3,000,000 shares of restricted Class A common stock, which vested in 3 equal installments on each of the first two anniversaries of the date of grant and the employee’s termination date. Compensation expense was recognized on a straight-line basis over the requisite service period.
On July 19, 2018, a new member of the board of directors received a restricted stock award with a grant date fair value of $0.1 million, representing 4,720plus an additional amount, not to exceed 10,253,867 shares of restricted Class A common stock, which will vest in 3 equal installments on eachremaining available for new awards under the 2014 Omnibus Incentive Plan as of the first 3 anniversaries of the date of grant,Effective Date, subject to continued service on the board of directors. Compensation expense for restricted stock subject to time-based vesting criteria granted toterms and conditions set forth in the director will be expensed 1/3 each year, for three years on an annual basis following such grant.2023 Omnibus Incentive Plan.
Annual Incentive Awards Granted in 20192023 with Respectrespect to 20182022 Performance
For 20182022 performance, certain employees received stock-based incentive equity onin February 18, 2019. Fair value for all restricted and unrestricted stock grants was calculated using the most recent closing stock price prior to the grant date (due to markets being closed on grant date). Compensation expense for unrestricted stock grants was expensed immediately. The Company elected to recognize the compensation expense related to the time-based vesting of the annual restricted stock awards for the entire award on a straight-line basis over the requisite service period for the entire award.2023. Restricted stock subject to performance criteria is eligible to vest in three equal installments upon the compensation committee’s confirmation that the Company achieves a return on equity, based on distributable earnings divided by the Company’s average book value of equity, equal to or greater than 8% for such year (the “Performance Target”) for the years ended December 31, 2019, 2020 and 2021, respectively. If the Company misses the Performance Target during either the first or second calendar year but meets the Performance Target for a subsequent year during the three year performance period and the Company’s return on equity for such subsequent year and any years for which it missed its Performance Target equals or exceeds the compounded return on equity of 8% based on distributable earnings divided by the Company’s average book value of equity, the performance-vesting restricted stock which failed to vest because the Company previously missed its Performance Target will vest subject to continued employment on the applicable vesting date (the “Catch-Up Provision”). Accruals of compensation cost for an award with a performance condition shall be based on the probable outcome of that performance condition. Therefore, compensation cost shall be accrued if it is probable that the performance condition will be achieved and shall not be accrued if it is not probable that the performance condition will be achieved. In view of the adverse impacts of COVID-19 on the Company’s operations and investments and the resulting intensified corporate focus on defensive actions, including maintaining high levels of unrestricted cash liquidity and refinancing debt with more expensive non-mark-to-market funding sources, the Company no longer classified the 2020 Performance Target as probable as of May 27, 2020 and reversed $1.0 million of previous compensation expense relating to grants of restricted stock with a December 2020 performance hurdle as their last vesting date (not available to take advantage of the Catch-Up Provision). However, recognizing that Ladder’s employees took these actions that, while in the best interests of the Company and its shareholders, would not produce earnings consistent with the Performance Target in their deferred compensation arrangements, on May 27, 2020, the compensation committee of the board of directors used its discretion to waive the Performance Target for shares eligible to vest based on the Company’s performance in 2020 and 2021, subject to continued employment on the applicable vesting dates (the “Performance Waiver”). The Company recorded $0.1 million of incremental compensation cost during the year ended December 31, 2020 as a result of this modification. As of December 31, 2020, there were 46 Ladder employees and one consultant eligible for the Performance Waiver.
On February 18, 2019, in connection with 2018 compensation, annual stock awards were granted to management employees (each, a “Management Grantee”) with an aggregate value of $11.7 million which represented 666,288 shares of Class A common stock. The award to Mr. Harris, and 50% of the awards to Mr. Fox, Mr. Harney, and Mr. Perelman, were unrestricted. For Ms. McCormack, 50% of her award became fully vested on her executive retirement eligibility date, December 8, 2019. The other 50% of incentive equity awarded to Mr. Fox, Mr. Harney, Ms. McCormack, and Mr. Perelman is restricted stock subject to attainment of the Performance Target for the applicable years and also subject to the Performance Waiver and Catch-Up Provision, each described above.
On February 18, 2019, in connection with 2018 compensation, annual stock awards were granted to certain non-management employees (each, a “Non-Management Grantee”) with an aggregate value of $14.9 million which represents 849,087 shares of mostly restricted Class A common stock. Fifty percent of most stock awards granted is subject to time-based vesting criteria and the remaining 50% of each stock award is subject to attainment of the Performance Target for the applicable years and is also subject to the Performance Waiver and Catch-Up Provision, each described above. The time-vesting restricted stock granted to Non-Management Grantees will vest in three installments on February 18 of each of 2020, 20212024, 2025 and 20222026, subject to continued employment on the applicable vesting dates.
Other 2019 Restricted Stock Awards
On February 18, 2019, certain members of the board of directors each received annual restricted stock awards with a grant date fair value of $0.4 million, representing 25,626 shares of restricted Class A common stock, which vested in full on the first anniversary of the date of grant, subject to continued service on the board of directors. Compensation expense related to the time-based vesting criteria of the award was recognized on a straight-line basis over the one year vesting period.
On January 24, 2019, Management Grantees received a restricted stock award with a grant date fair value of $11,328, representing 682 shares of restricted Class A common stock. These shares represent stock dividends paid on the number of shares subject to the 2016 options (had such shares been outstanding) and vested with the time-vesting 2016 options they are associated with, subject to the Retirement Eligibility Date of the respective member of management. Compensation expense was recognized on a straight-line basis over the requisite service period.
An equitable adjustment was also made to outstanding options in the first quarter of 2019 for the Company’s stock dividend paid on January 24, 2019. Those additional options are reflected in the summary of grants table above.
On June 4, 2019, a new member of the board of directors received a restricted stock award with a grant date fair value of $0.1 million, representing 4,568 shares of restricted Class A common stock, which will vest in 3 equal installments on each of the first 3 anniversaries of the date of grant, subject to continued service on the board of directors. Compensation expense for restricted stock subject to time-based vesting criteria granted to the director will be expensed 1/3 each year, for three years on an annual basis following such grant.
On July 1, 2019, a new employee of the Company received a restricted stock award with a grant date fair value of $0.4 million, representing 24,125 shares of restricted Class A common stock. Fifty percent of this restricted stock award granted is subject to time-based vesting criteria, and the remaining 50% of this restricted stock award is subject to attainment of the Performance Target for the applicable years and is also subject to the Performance Waiver and Catch-Up Provision, each described above. The time-vesting restricted stock granted will vest in 3 installments on July 1 of each of 2020, 2021 and 2022 subject to continued employment on the applicable vesting dates. The performance-vesting restricted stock will vest in 3 equal installments on July 1 of each of 2020, 2021 and 2022 upon the Compensation Committee’s confirmation that the Company achieves the Performance Target for the years ended December 31, 2019, 2020 and 2021, respectively subject to the Performance Waiver. The Company has elected to recognize the compensation expense related to the time-based vesting criteria of these restricted stock award on a straight-line basis over the requisite service period.
Annual Incentive Awards Granted in 2020 with Respect to 2019 Performance
For 2019 performance, certain employees received stock-based incentive equity. Fair value for all restricted and unrestricted stock grants was calculated using the closing stock price on the grant date. Compensation expense for unrestricted stock grants was expensed immediately. The Company has elected to recognize the compensation expense related to the time-based vesting of the annual restricted stock awards for the entire award on a straight-line basis over the requisite service period for the entire award. Restricted stock subject to performance criteria is eligible to vest in three equal installments upon the compensation committee’s confirmation that the Company achieves a pre-tax return on average equity, based on distributable earnings divided by the Performance TargetCompany’s average shareholders’ equity, equal to or greater than 8% for such year (the “Performance Target”) for the years ended December 31, 2020, 20212023, 2024 and 2022,2025, respectively. RestrictedIf the Company misses the Performance Target during either the first or second calendar year but meets the Performance Target for a subsequent year during the three-year performance period and the Company’s return on equity for such subsequent year and any years for which it missed its Performance Target equals or exceeds the compounded pre-tax return on average equity of 8% based on distributable earnings divided by the Company’s average shareholders’ equity, the performance-vesting restricted stock which failed to vest because the Company previously missed its Performance Target will vest subject to performance criteria iscontinued employment on the applicable vesting date (the “Catch-Up Provision”). Approximately 2/3 of all the shares subject to attainment of the Performance Target are also subject to the Performance Waiver andCatch-Up Provision, as the Catch-Up Provision each described above.is not available for the missed performance during the third performance year and has the effect of requiring the Company to achieve an average 8% return over the full three-year performance plan in order to be effective. Accruals of compensation cost for an award with a performance condition shall be based on the probable outcome of that performance condition. Therefore, compensation cost shall be accrued if it is probable that the performance condition will be achieved and shall not be accrued if it is not probable that the performance condition will be achieved. The probability of meeting the performance outcome is assessed quarterly.
On February 18, 2020,2023, in connection with 2019 compensation,2022 performance, annual stock awards were granted to Management Grantees, other than Ms. Porcella,management employees (each, a “Management Grantee”), with an aggregate grant date fair value of $12.0 million$8.5 million, which represents 639,690733,607 shares of Class A common stock. The grant to Ms. Porcella is subject to the same time-based and performance-based vesting described below for Non-Management Grantees and her shares are included in that total. The grant to Mr. Harris and 50%approximately half of the grants to Mr. Fox,
Ms. McCormack and Mr. Perelman were unrestricted. The other 50%half of incentive equity granted to Mr. Fox,each of Ms. McCormack and Mr. Perelman is restricted stock subject to attainment of the Performance Target for the applicable years and is also subject to the Performance Waiver and Catch-Up Provision each described above.
On February 18, 2020, in connection with 2019 compensation, annual stock awards were granted For the grants to Mr. Miceli and Ms. Porcella and Non-Management Grantees(a total of 101,344 shares with an aggregate fair value of $15.0 million which represents 802,611 shares$1.2 million), approximately half of mostly restricted Class A common stock. Fifty percent of most stockthe awards isare subject to time-based vesting criteria and the remaining 50% of these stock awards ishalf are subject to attainment of the Performance Target for the applicable yearsyears.
On February 18, 2023, in connection with 2022 performance, annual stock awards were granted to certain non-management employees (“Non-Management Grantees”) with an aggregate grant date fair value of $7.5 million, which represents 651,429 shares of Class A common stock. Of these awards, 19,558 shares were unrestricted, 306,162 shares are subject to time-based vesting criteria and is alsothe remaining 325,709 shares are subject to the attainment of the Performance Waiver andTarget, including the Catch-Up Provision, each described above. The time-vesting restricted stock will vest in three installments on February 18 of each of 2021, 2022 and 2023 subject to continued employment onfor the applicable vesting dates.years.
Other 20202023 Restricted Stock Awards
On February 18, 2020,2023, certain members of the board of directors each received annual restricted stock awards with a grant date fair value of $0.4 million, representing 24,03632,525 shares of restricted Class A common stock, which will vest in full on the first anniversary of the date of grant, subject to continued service on the board of directors. Compensation expense related to the time-based vesting criteria of the award shall be recognized on a straight-line basis over the one yearone-year vesting period. On March 26, 2020, 5,803 shares of restricted Class A common stock were forfeited when a member resigned from the board of directors.
Annual Incentive Awards Granted in 20202022 with Respectrespect to 20202021 Performance
For 20202021 performance, certain employees received stock-based incentive equity in December 2020. Fair value for all restrictedJanuary 2022. Restricted stock subject to time-based vesting criteria will vest in three installments on February 18 of each of 2023, 2024 and unrestricted stock grants was calculated using the closing stock price2025, subject to continued employment on the grant date. Compensation expense for unrestricted stock grants was expensed immediately.applicable vesting dates. The Company has elected to recognize the compensation expense related to the
time-based vesting of the annual restricted stock awards for the entire award on a straight-line basis over the requisite service period for the entire award. Restricted stock subject to performance criteria is eligible to vest in three equal installments upon the compensation committee’s confirmation that the Company achieves the Performance Target for the years ended December 31, 2021, 2022, 2023 and 2023,2024, respectively. Restricted stockApproximately 2/3 of all the shares subject to performance criteria isattainment of the Performance Target are also subject to the Performance Waiver and the Catch-Up Provision, each described above.Provision. Accruals of compensation cost for an award with a performance condition shall be based on the probable outcome of that performance condition. Therefore, compensation cost shall be accrued if it is probable that the performance condition will be achieved and shall not be accrued if it is not probable that the performance condition will be achieved. The probability of meeting the performance outcome is assessed quarterly.
On December 17, 2020,January 31, 2022, in connection with 2020 compensation,2021 performance, annual stock awards were granted to Management Grantees, other than Ms. Porcella,management employees (each, a “Management Grantee”), with an aggregate grant date fair value of $14.5$18 million, which represents 1,463,0391,517,627 shares of Class A common stock. The grant to Ms. Porcella is subject to the same time-based and performance-based vesting described below for Non-Management Grantees and her shares are included in the total. The grant to Mr. Harris and approximately 2/3 of the grants to Mr. Fox,each of Ms. McCormack and Mr. Perelman were unrestricted. The other 1/3 of incentive equity granted to Mr. Fox,each of Ms. McCormack and Mr. Perelman is restricted stock subject to attainment of the Performance Target for the applicable years and is also subject to the Performance Waiver and Catch-Up Provision each described above.
On December 17, 2020, in connection with 2020 compensation, annual stock awards were granted For the grants to Mr. Miceli and Ms. Porcella and Non-Management employees(a total of 210,662 shares with an aggregate fair value of $14.8 million, which represents 1,493,839 shares of Class A common stock. Approximately$2.5 million), approximately 1/3 of the awards to Ms. Porcella and Non-Management Grantees employees were unrestricted, with another 1/3 of the awards subject to time-based vesting criteria, and the remaining 1/3 subject to attainment of the Performance Target for the applicable years. The 1/3
On January 31, 2022, in connection with 2021 performance, annual stock awards were granted to certain non-management employees (“Non-Management Grantees”) with an aggregate grant date fair value of $15.4 million, which represents 1,293,853 shares of Class A common stock. Of these awards, 264,704 shares were unrestricted, 497,169 shares are subject to time-based vesting criteria, and the remaining 531,980 shares are subject to attainment of the Performance Target, including the Catch-Up Provision, for the applicable years.
Other Incentive Awards Granted in 2022
On May 10, 2022, a new employee of the Company received a restricted stock award with a grant date fair value of $0.4 million, representing 33,784 shares of restricted Class A common stock. Fifty percent of the restricted stock award is also subject to time-based vesting criteria, and the remaining 50% of the restricted stock award is subject to attainment of the Performance Waiver and Catch-Up Provision, each described above.Target for the applicable years. The time-vesting restricted stock will vest in 3three installments on February 18 of each of 2022, 2023, 2024 and 20242025, subject to continued employment on the applicable vesting dates. The performance-vesting restricted stock will vest in three equal installments upon the Compensation Committee’s confirmation that the Company achieves the Performance Target for the years ended December 31, 2022, 2023 and 2024, respectively. The Catch-Up Provision applies to the performance vesting portion of this award, provided that a termination has not occurred. The Company has elected to recognize the compensation expense related to the time-based vesting criteria of these Restricted Stock Awards on a straight-line basis over the requisite service period.
Other 2022 Restricted Stock Awards
On February 18, 2022, certain members of the board of directors received annual restricted stock awards with a grant date fair value of $0.4 million, representing 31,860 shares of restricted Class A common stock, which will vest in full on the first anniversary of the date of grant, subject to continued service on the board of directors. Compensation expense related to the time-based vesting criteria of the award shall be recognized on a straight-line basis over the one-year vesting period.
Change in Control
Upon a change in control (as defined in the respective award agreements), restricted stock awards to Mr. Fox,Miceli, Ms. McCormack, and Mr. Perelman, and one Non-Management Grantee will become fully vested ifif: (1) such Management Grantee continues to be employed through the closing of the change in controlcontrol; or (2) after the signing of definitive documentation related to the change in control, but prior to its closing, such Management Grantee’s employment is terminated without cause or due to death or disability or the Management Grantee resigns for Good Reason, as defined in each Management Grantee’s employment agreement. The compensation committee retains the right, in its sole discretion, to provide for the accelerated vesting (in whole or in part) of the restricted stock awards granted.
In the event Ms. Porcella or a Non-Management Grantee, except for the one mentioned above, is terminated by the Company without cause within six months of certain changes in control, all unvested time shares shall vest on the termination date and all unvested performance shares shall remain outstanding and be eligible to vest (or be forfeited) in accordance with the performance conditions.
Ladder Capital Corp Deferred Compensation Plan
On July 3, 2014, the Company adopted a nonqualified deferred compensation plan, which was amended and restated on March 17, 2015 (the “2014 Deferred Compensation Plan”), in which certain eligible employees participate. On February 22, 2018, the board of directors froze the 2014 Deferred Compensation Plan. Pursuant to the 2014 Deferred Compensation Plan, participants elected, or in some cases non-management participants were required, to defer all or a portion of their annual cash performance-based bonuses into the 2014 Deferred Compensation Plan. Generally, if a participant’s total compensation was in excess of a certain threshold, a portion of a participant’s performance-based annual bonus was required to be deferred into the 2014 Deferred Compensation Plan. Otherwise, a portion of the participant’s annual bonus could have been deferred into the 2014 Deferred Compensation Plan at the election of the participant, so long as such elections were timely made in accordance with the terms and procedures of the 2014 Deferred Compensation Plan.
In the event that a participant elected to (or was required to) defer a portion of his or her compensation pursuant to the 2014 Deferred Compensation Plan, such amount was not paid to the participant and was instead credited to such participant’s notional account under the 2014 Deferred Compensation Plan. Such amounts were then invested on a phantom basis in Class A common stock of the Company, or the phantom units, and a participant’s account is credited with any dividends or other distributions received by holders of Class A common stock of the Company, which are subject to the same vesting and payment conditions as the applicable contributions. Elective contributions were immediately vested upon contribution. Mandatory contributions are subject to one-third vesting over three years on a straight-line basis following the applicable year in which the related compensation was earned and mandatory contributions for compensation earned in 2016 and 2017 remain in the 2014 Deferred Compensation Plan, subject to vesting in 2019 and 2020, respectively.
If a participant’s employment with the Company is terminated by the Company other than for cause and such termination is within six months following a change in control (each, as defined in the 2014 Deferred Compensation Plan), then the participant will fully vest in his or her unvested account balances. Furthermore, the unvested account balances will fully vest in the event of the participant’s death, disability, retirement (as defined in the 2014 Deferred Compensation Plan) or in the event of certain hostile takeovers of the board of directors of the Company. In the event that a participant’s employment is terminated by the Company other than for cause, the participant will vest in the portion of the participant’s account that would have vested had the participant remained employed through the end of the year in which such termination occurs, subject to, in such case or in the case of retirement, the participant’s timely execution of a general release of claims in favor of the Company. Unvested amounts are otherwise generally forfeited upon the participant’s resignation or termination of employment, and vested mandatory contributions are generally forfeited upon the participant’s termination for cause.
Amounts deferred into the 2014 Deferred Compensation Plan are paid upon the earliest to occur of (1) a change in control, (2) within sixty days following the end of the participant’s employment with the Company, or (3) the date of payment of the annual bonus payments following December 31 of the third calendar year following the applicable year to which the underlying deferred annual compensation relates. Payment is made in cash equal to the fair market value of the number of phantom units credited to a participant’s account, provided that, if the participant’s termination was by the Company for cause or was a voluntary resignation other than on account of such participant’s retirement, the amount paid is based on the lowest fair market value of a share of Class A common stock during the forty-five day period following such termination of employment.The amount of the final cash payment may be more or less than the amount initially deferred into the 2014 Deferred Compensation Plan, depending upon the change in the value of the Class A common stock of the Company during such period.
As of December 31, 2020, there are 165,735 phantom units outstanding in the 2014 Deferred Compensation Plan, of which 0 are unvested, resulting in a liability of $1.6 million, which is included in accrued expenses on the consolidated balance sheets. As of December 31, 2019, there were 265,275 phantom units outstanding in the 2014 Deferred Compensation Plan, of which 52,861 were unvested, resulting in a liability of $4.9 million, which is included in accrued expenses on the consolidated balance sheets.
Bonus Payments
On December 16, 2020, the board of directors of Ladder Capital Corp approved the 2020 bonus payments to employees, including officers, totaling $36.8 million of which $35.7 million consisted of equity based compensation. Of the total approved amount, there was $29.4 million of equity based compensation granted and recognized in 2020. On February 6, 2020, the board of directors of Ladder Capital Corp approved the 2019 bonus payments to employees, including officers, totaling $55.2 million, which included $27.0 million of equity based compensation. The bonuses were accrued for as of December 31, 2019 and paid to employees in full on February 14, 2020. On February 7, 2019, the board of directors of Ladder Capital Corp approved the 2018 bonus payments to employees, including officers, totaling $61.4 million, which included $26.6 million of equity based compensation. The bonuses were accrued for as of December 31, 2018 and paid to employees in full on February 15, 2019. During the year ended December 31, 2020, the Company recorded $1.1 million compensation expense related to bonuses due to the significant market disruption caused by the COVID-19 pandemic and the substantial economic uncertainty present in the commercial real estate market and overall economy. During the years ended December 31, 2019 and 2018, the Company recorded compensation expense of $28.2 million and $34.5 million, respectively, related to bonuses.
15.14. FAIR VALUE OF FINANCIAL INSTRUMENTS
Fair value is based upon internal models, using market quotations, broker quotations, counterparty quotations or pricing services quotations, which provide valuation estimates based upon reasonable market order indications and are subject to significant variability based on market conditions, such as interest rates, credit spreads and market liquidity. The fair value of the mortgage loan receivables held for sale is based upon a securitization model utilizing market data from recent securitization spreads and pricing.
Fair Value Summary Table
The carrying values and estimated fair values of the Company’s financial instruments, which are both reported at fair value on a recurring basis (as indicated) or amortized cost/par, at December 31, 20202023 and 2019December 31, 2022 are as follows ($ in thousands):
December 31, 2020
| | | | | | | | | | | | | | | | | | | | | | | | | | | | | | | | | | | |
| | | | | | | | | | Weighted Average |
| | Outstanding
Face Amount | | Amortized Cost Basis/Purchase Price | | Fair Value | | Fair Value Method | | Yield
% | | Remaining
Maturity/Duration (years) |
| Assets: | | | | | | | | | | | |
| CMBS(1) | $ | 1,015,520 | | | $ | 1,015,282 | | | $ | 1,003,301 | | | Internal model, third-party inputs | | 1.56 % | | 2.01 |
| CMBS interest-only(1) | 1,498,181 | | (2) | 21,567 | | | 22,213 | | | Internal model, third-party inputs | | 3.53 % | | 2.19 |
| GNMA interest-only(3) | 75,350 | | (2) | 868 | | | 1,001 | | | Internal model, third-party inputs | | 5.06 % | | 3.59 |
| Agency securities(1) | 586 | | | 593 | | | 605 | | | Internal model, third-party inputs | | 1.64 % | | 1.26 |
| GNMA permanent securities(1) | 30,254 | | | 30,340 | | | 31,199 | | | Internal model, third-party inputs | | 3.49 % | | 1.98 |
| | | | | | | | | | | |
| | | | | | | | | | | |
| Provision for current expected credit reserves | N/A | | (20) | | | (20) | | | (5) | | N/A | | N/A |
| Mortgage loan receivables held for investment, net, at amortized cost: | | | | | | | | | | | |
| Mortgage loan receivables held for investment, net, at amortized cost | 2,365,204 | | | 2,354,059 | | | 2,328,441 | | | Discounted Cash Flow(4) | | 6.67 % | | 1.07 |
| | | | | | | | | | | |
| Provision for current expected credit reserves | N/A | | (41,507) | | | (41,507) | | | (5) | | N/A | | N/A |
| Mortgage loan receivables held for sale | 30,478 | | | 30,518 | | | 32,082 | | | Internal model, third-party inputs(6) | | 4.05 % | | 9.18 |
| FHLB stock(7) | 31,000 | | | 31,000 | | | 31,000 | | | (7) | | 3.00 % | | N/A |
| Nonhedge derivatives(1)(8) | 65,600 | | | N/A | | 299 | | | Counterparty quotations | | N/A | | 0.25 |
| | | | | | | | | | | |
| Liabilities: | | | | | | | | | | | |
| Repurchase agreements - short-term | 708,833 | | | 708,833 | | | 708,833 | | | Discounted Cash Flow(9) | | 1.16 % | | 0.34 |
| Repurchase agreements - long-term | 112,004 | | | 112,004 | | | 112,004 | | | Discounted Cash Flow(10) | | 9.47 % | | 2.21 |
| Revolving credit facility | 266,430 | | | 266,430 | | | 266,430 | | | Discounted Cash Flow(9) | | 3.15 % | | 0.07 |
| Mortgage loan financing | 761,793 | | | 766,064 | | | 786,405 | | | Discounted Cash Flow(10) | | 4.84 | % | | 4.04 |
| Secured financing facility | 192,646 | | | 192,646 | | | 192,646 | | | Discounted Cash Flow(9) | | 10.75 % | | 2.35 |
| CLO debt | 276,516 | | | 276,516 | | | 276,516 | | | Discounted Cash Flow(10) | | 5.50 % | | 3.38 |
| | | | | | | | | | | |
| Borrowings from the FHLB | 288,000 | | | 288,000 | | | 289,091 | | | Discounted Cash Flow | | 1.12 | % | | 2.76 |
| Senior unsecured notes | 1,612,299 | | | 1,599,371 | | | 1,607,930 | | | Internal model, third-party inputs | | 4.90 % | | 3.89 |
| | | | | | | | | | | |
| | | | | | | | | | | |
| | | | | | | | | | | | | | | | | | | | | | | | | | | | | | | | | | | |
| | | | | | | | | | Weighted Average |
| | Principal Amount | | Amortized Cost Basis/Purchase Price | | Fair Value | | Fair Value Method | | Yield
% | | Remaining
Maturity/Duration (years) |
| Assets: | | | | | | | | | | | |
| CMBS(1) | $ | 439,679 | | | $ | 439,052 | | | $ | 424,890 | | | Internal model | | 6.83 | % | | 2.00 |
| CMBS interest-only(1) | 876,555 | | (2) | 6,453 | | | 6,569 | | | Internal model | | 6.61 | % | | 1.07 |
| GNMA interest-only(3) | 37,053 | | (2) | 214 | | | 213 | | | Internal model | | 6.12 | % | | 3.60 |
| Agency securities(1) | 22 | | | 22 | | | 21 | | | Internal model | | 2.70 | % | | 1.05 |
| | | | | | | | | | | |
| | | | | | | | | | | |
| U.S. Treasury securities(1) | 54,031 | | | 53,648 | | | 53,716 | | | Internal model | | 5.41 % | | 0.07 |
| Equity securities(3) | N/A | | 160 | | | 144 | | | Observable market prices | | N/A | | N/A |
| | | | | | | | | | | |
| | | | | | | | | | | |
| | | | | | | | | | | |
| | | | | | | | | | | |
| | | | | | | | | | | |
| Mortgage loan receivables held for investment, net, at amortized cost(4) | 3,164,226 | | | 3,155,089 | | | 3,150,843 | | | Discounted Cash Flow(5) | | 9.65 | % | | 0.68 |
| | | | | | | | | | | |
| | | | | | | | | | | |
| Mortgage loan receivables held for sale | 31,350 | | | 26,868 | | | 26,868 | | | Internal model, third-party inputs(6) | | 4.57 | % | | 8.19 |
| FHLB stock(7) | 5,175 | | | 5,175 | | | 5,175 | | | (7) | | 8.25 | % | | N/A |
| Nonhedge derivatives(1)(10) | 194,900 | | | 1,454 | | | 1,454 | | | Counterparty quotations | | N/A | | 0.48 |
| | | | | | | | | | | |
| Liabilities: | | | | | | | | | | | |
| Repurchase agreements - short-term | 337,631 | | | 337,631 | | | 337,631 | | | Cost plus Accrued Interest (8) | | 7.57 | % | | 0.48 |
| Repurchase agreements - long-term | 268,976 | | | 268,976 | | | 268,976 | | | Discounted Cash Flow(9) | | 7.35 | % | | 1.74 |
| | | | | | | | | | | |
| Mortgage loan financing | 437,384 | | | 437,759 | | | 425,992 | | | Discounted Cash Flow | | 5.87 | % | | 2.64 |
| | | | | | | | | | | |
| | | | | | | | | | | |
| CLO debt | 1,062,777 | | | 1,060,719 | | | 1,060,719 | | | Discounted Cash Flow(9) | | 7.08 | % | | 1.89 |
| | | | | | | | | | | |
| Borrowings from the FHLB | 115,000 | | | 115,000 | | | 115,000 | | | Discounted Cash Flow | | 5.82 | % | | 0.57 |
| Senior unsecured notes | 1,575,614 | | | 1,563,861 | | | 1,475,303 | | | Internal model, third-party inputs | | 4.66 | % | | 3.77 |
| | | | | | | | | | | |
| | | | | | | | | | | |
(1)Measured at fair value on a recurring basis with the net unrealized gains or losses recorded as a component of other comprehensive income (loss) in equity.
(2)Represents notional outstanding balance of underlying collateral.
(3)Measured at fair value on a recurring basis with the net unrealized gains or losses recorded in current period earnings.
(4)Balance does not include impact of allowance for current expected credit losses of $43.2 million at December 31, 2023.
(5)Fair value for floating rate mortgage loan receivables, held for investment is estimated to approximate the outstanding face amount given the short interest rate reset risk (30 days) and no significant change in credit spreads. Fair value for fixed rate mortgage loan receivables, held for investment is measured using a discounted cash flow model.
(6)Fair value for mortgage loan receivables, held for sale is measured using a hypothetical securitization model utilizing market data from recent securitization spreads and pricing.
(7)Fair value of the FHLB stock approximates outstanding face amount as the Company’s captive insurance subsidiary is restricted from trading the stock and can only put the stock back to the FHLB, at the FHLB’s discretion, at par.
(8)For repurchase agreements - short term, the value approximates the cost plus accrued interest.
(9)For repurchase agreements - long term and CLO debt, the carrying value approximates the fair value discounting the expected cash flows at current market rates. If the collateral is determined to be impaired, the related financing would be revalued accordingly. There are no impairments on any positions.
(10)The outstanding face amount of the nonhedge derivatives represents the notional amount of the underlying contracts.
December 31, 2022 | | | | | | | | | | | | | | | | | | | | | | | | | | | | | | | | | | | |
| | | | | | | | | | Weighted Average |
| | Principal Amount | | Amortized Cost Basis/Purchase Price | | Fair Value | | Fair Value Method | | Yield
% | | Remaining
Maturity/Duration (years) |
| Assets: | | | | | | | | | | | |
| CMBS(1) | $ | 562,839 | | | $ | 562,246 | | | $ | 541,333 | | | Internal model, third-party inputs | | 5.32 | % | | 1.06 |
| CMBS interest-only(1) | 1,026,195 | | (2) | 10,498 | | | 10,443 | | | Internal model, third-party inputs | | 3.65 | % | | 1.45 |
| GNMA interest-only(3) | 45,369 | | (2) | 285 | | | 281 | | | Internal model, third-party inputs | | 4.23 | % | | 3.30 |
| Agency securities(1) | 36 | | | 36 | | | 35 | | | Internal model, third-party inputs | | 2.70 | % | | 1.54 |
| | | | | | | | | | | |
| | | | | | | | | | | |
| U.S. Treasury securities(1) | 36,000 | | | 35,328 | | | 35,328 | | | Internal model, third-party inputs | | 4.17 | % | | 0.60 |
| Equity securities(3) | N/A | | 160 | | | 118 | | | Observable market prices | | N/A | | N/A |
| | | | | | | | | | | |
| Mortgage loan receivables held for investment, net, at amortized cost(4) | 3,907,295 | | | 3,885,746 | | | 3,875,708 | | | Discounted Cash Flow(5) | | 8.85 | % | | 1.26 |
| | | | | | | | | | | |
| | | | | | | | | | | |
| Mortgage loan receivables held for sale | 31,350 | | | 27,391 | | | 27,391 | | | Internal model, third-party inputs(6) | | 4.57 | % | | 9.19 |
| FHLB stock(7) | 9,585 | | | 9,585 | | | 9,585 | | | (7) | | 4.75 | % | | N/A |
| Nonhedge derivatives(1)(10) | 204,700 | | | 2,038 | | | 2,038 | | | Counterparty quotations | | N/A | | 1.52 |
| | | | | | | | | | | |
| Liabilities: | | | | | | | | | | | |
| Repurchase agreements - short-term | 481,465 | | | 481,465 | | | 481,465 | | | Cost plus Accrued Interest (8) | | 4.04 | % | | 0.37 |
| Repurchase agreements - long-term | 366,398 | | | 366,398 | | | 366,398 | | | Discounted Cash Flow(9) | | 4.06 | % | | 2.56 |
| | | | | | | | | | | |
| Mortgage loan financing | 497,454 | | | 497,991 | | | 477,101 | | | Discounted Cash Flow | | 5.51 | % | | 3.36 |
| | | | | | | | | | | |
| | | | | | | | | | | |
| CLO debt | 1,064,365 | | | 1,058,462 | | | 1,058,462 | | | Discounted Cash Flow(9) | | 6.35 | % | | 15.92 |
| | | | | | | | | | | |
| Borrowings from the FHLB | 213,000 | | | 213,000 | | | 213,055 | | | Discounted Cash Flow | | 1.61 | % | | 1.25 |
| Senior unsecured notes | 1,643,794 | | | 1,628,382 | | | 1,397,977 | | | Internal model, third-party inputs | | 4.66 | % | | 4.75 |
| | | | | | | | | | | |
| | | | | | | | | | | |
(1)Measured at fair value on a recurring basis with the net unrealized gains or losses recorded as a component of other comprehensive income (loss) in equity.
(2)Represents notional outstanding balance of underlying collateral.
(3)Measured at fair value on a recurring basis with the net unrealized gains or losses recorded in current period earnings.
(4)Balance does not include impact of allowance for current expected credit losses of $20.8 million at December 31, 2022.
(5)Fair value for floating rate mortgage loan receivables, held for investment is estimated to approximate the outstanding face amount given the short interest rate reset risk (30 days) and no significant change in credit risk. Fair value for fixed rate mortgage loan receivables, held for investment is measured using a discounted cash flow model.
(5)Fair value is estimated to equal par value.
(6)Fair value for mortgage loan receivables, held for sale is measured using a hypothetical securitization model utilizing market data from recent securitization spreads and pricing.
(7)Fair value of the FHLB stock approximates outstanding face amount as the Company’s captive insurance subsidiary is restricted from trading the stock and can only put the stock back to the FHLB, at the FHLB’s discretion, at par.
(8)The outstanding face amount of the nonhedge derivatives represents the notional amount of the underlying contracts.
(9)Fair value for repurchase agreement liabilities - short term borrowings under the secured financing facility and borrowings under the revolving credit facility is estimated to approximate carrying amount primarily due to the short interest rate reset risk (30 days) of the financings and the high credit quality of the assets collateralizing these positions. If the collateral is determined to be impaired, the related financing would be revalued accordingly. There are no impairments on any positions.
(10)For repurchase agreements - long term, mortgage loan financing, and CLO debt the carrying value approximates the fair value discounting the expected cash flows at current market rates. If the collateral is determined to be impaired, the related financing would be revalued accordingly. There are no impairments on any positions.
December 31, 2019
| | | | | | | | | | | | | | | | | | | | | | | | | | | | | | | | | | | |
| | | | | | | | | | Weighted Average |
| | Outstanding
Face Amount | | Amortized
Cost Basis | | Fair Value | | Fair Value Method | | Yield
% | | Remaining
Maturity/Duration (years) |
| Assets: | | | | | | | | | | | |
| CMBS(1) | $ | 1,640,597 | | | $ | 1,640,905 | | | $ | 1,644,322 | | | Internal model, third-party inputs | | 3.08 | % | | 2.41 |
| CMBS interest-only(1) | 1,559,160 | | (2) | 28,553 | | | 29,146 | | | Internal model, third-party inputs | | 3.04 | % | | 2.53 |
| GNMA interest-only(3) | 109,783 | | (2) | 1,982 | | | 1,851 | | | Internal model, third-party inputs | | 4.59 | % | | 2.77 |
| Agency securities(1) | 629 | | | 640 | | | 637 | | | Internal model, third-party inputs | | 1.73 | % | | 1.83 |
| GNMA permanent securities(1) | 31,461 | | | 31,681 | | | 32,369 | | | Internal model, third-party inputs | | 3.17 | % | | 1.93 |
| | | | | | | | | | | |
| Equity securities(3) | N/A | | 12,848 | | | 12,980 | | | Observable market prices | | N/A | | N/A |
| Mortgage loan receivables held for investment, net, at amortized cost: | | | | | | | | | | | |
| Mortgage loan receivables held for investment, net, at amortized cost | 3,277,596 | | | 3,257,036 | | | 3,273,219 | | | Discounted Cash Flow(4) | | 6.94 | % | | 1.43 |
| | | | | | | | | | | |
| Provision for loan losses | N/A | | (20,500) | | | (20,500) | | | (5) | | N/A | | N/A |
| Mortgage loan receivables held for sale | 122,748 | | | 122,325 | | | 124,989 | | | Internal model, third-party inputs(6) | | 4.20 | % | | 9.99 |
| FHLB stock(7) | 61,619 | | | 61,619 | | | 61,619 | | | (7) | | 4.75 | % | | N/A |
| Nonhedge derivatives(1)(8) | 340,200 | | | N/A | | 693 | | | Counterparty quotations | | N/A | | 0.25 |
| | | | | | | | | | | |
| Liabilities: | | | | | | | | | | | |
| Repurchase agreements - short-term | 1,781,253 | | | 1,781,253 | | | 1,781,253 | | | Discounted Cash Flow(9) | | 2.50 | % | | 0.19 |
| Repurchase agreements - long-term | 34,681 | | | 34,681 | | | 34,681 | | | Discounted Cash Flow(10) | | 2.81 | % | | 1.41 |
| | | | | | | | | | | |
| Mortgage loan financing | 807,854 | | | 812,606 | | | 838,766 | | | Discounted Cash Flow(10) | | 4.91 | % | | 5.65 |
| | | | | | | | | | | |
| | | | | | | | | | | |
| Borrowings from the FHLB | 1,073,500 | | | 1,073,500 | | | 1,080,354 | | | Discounted Cash Flow | | 2.33 | % | | 2.08 |
| Senior unsecured notes | 1,166,201 | | | 1,157,833 | | | 1,208,860 | | | Internal model, third-party inputs | | 5.39 | % | | 3.28 |
| | | | | | | | | | | |
| Nonhedge derivatives(1)(8) | 69,571 | | | N/A | | 0 | | | Counterparty quotations | | N/A | | 0.36 |
(1)Measured at fair value on a recurring basis with the net unrealized gains or losses recorded as a component of other comprehensive income (loss) in equity.
(2)Represents notional outstanding balance of underlying collateral.
(3)Measured at fair value on a recurring basis with the net unrealized gains or losses recorded in current period earnings.
(4)Fair value for floating rate mortgage loan receivables, held for investment is estimated to approximate the outstanding face amount given the short interest rate reset risk (30 days) and no significant change in credit risk. Fair value for fixed rate mortgage loan receivables, held for investment is measured using a discounted cash flow.
(5)Fair value is estimated to equal par value.
(6)Fair value for mortgage loan receivables, held for sale is measured using a hypothetical securitization model utilizing market data from recent securitization spreads and pricing.
(7)Fair value of the FHLB stock approximates outstanding face amount as the Company’s captive insurance subsidiary is restricted from trading the stock and can only put the stock back to the FHLB, at the FHLB’s discretion, at par.
(8)The outstanding face amount of the nonhedge derivatives represents the notional amount of the underlying contracts.
(9)Fair value for repurchase agreement liabilitiesRevolving Credit Facility is estimated to approximate carrying amount primarily due to the short interest rate reset risk (30 days) of the financings and the high credit quality of the assets collateralizing these positions. If the collateral is determined to be impaired, the related financing would be revalued accordingly. There are no impairments on any positions.
(10)For repurchase agreements - long term and mortgage loan financing,CLO debt, the carrying value approximates the fair value discounting the expected cash flows at current market rates. If the collateral is determined to be impaired, the related financing would be revalued accordingly. There are no impairments on any positions.
(11)The outstanding face amount of the nonhedge derivatives represents the notional amount of the underlying contracts.
The following table summarizes the Company’s financial assets and liabilities, which are both reported at fair value on a recurring basis (as indicated) or amortized cost/par, at December 31, 20202023 and 2019December 31, 2022 ($ in thousands):
December 31, 20202023
| | Financial Instruments Reported at Fair Value on Consolidated Statements of Financial Condition | Financial Instruments Reported at Fair Value on Consolidated Statements of Financial Condition | | Outstanding Face
Amount | | Fair Value | Financial Instruments Reported at Fair Value on Consolidated Statements of Financial Condition | | Principal
Amount | | Fair Value |
| | Level 1 | | Level 2 | | Level 3 | | Total | | Level 1 | | Level 2 | | Level 3 | | Total |
| | Assets: | Assets: | | | | | | | | | | |
| Assets: | |
| Assets: | | | | | | | |
| CMBS(1) | CMBS(1) | | $ | 1,003,998 | | | $ | 0 | | | $ | 0 | | | $ | 992,227 | | | $ | 992,227 | |
| CMBS interest-only(1) | CMBS interest-only(1) | | 1,487,616 | | (2) | 0 | | | 0 | | | 21,538 | | | 21,538 | |
| GNMA interest-only(3) | GNMA interest-only(3) | | 75,350 | | (2) | 0 | | | 0 | | | 1,001 | | | 1,001 | |
| Agency securities(1) | Agency securities(1) | | 586 | | | 0 | | | 0 | | | 605 | | | 605 | |
| GNMA permanent securities(1) | | 30,254 | | | 0 | | | 0 | | | 31,199 | | | 31,199 | |
| | U.S. Treasury securities | |
| | U.S. Treasury securities | |
| | U.S. Treasury securities | |
| Equity securities | |
| Nonhedge derivatives(4) | Nonhedge derivatives(4) | | 65,600 | | | 0 | | | 299 | | | 0 | | | 299 | |
| | | | $ | |
| | Financial Instruments Not Reported at Fair Value on Consolidated Statements of Financial Condition | |
| | | Financial Instruments Not Reported at Fair Value on Consolidated Statements of Financial Condition | |
| | | $ | 0 | | | $ | 299 | | | $ | 1,046,570 | | | $ | 1,046,869 | |
| | | Financial Instruments Not Reported at Fair Value on Consolidated Statements of Financial Condition | Financial Instruments Not Reported at Fair Value on Consolidated Statements of Financial Condition | | Outstanding Face
Amount | | Fair Value | | Principal
Amount | | Fair Value |
| | Level 1 | | Level 2 | | Level 3 | | Total | | Level 1 | | Level 2 | | Level 3 | | Total |
| | Assets: | Assets: | | | | | | | | | | |
| Assets: | |
| Assets: | |
| Mortgage loan receivable held for investment, net, at amortized cost: | Mortgage loan receivable held for investment, net, at amortized cost: | |
| Mortgage loans held by consolidated subsidiaries | | $ | 2,365,204 | | | $ | 0 | | | $ | 0 | | | $ | 2,328,441 | | | $ | 2,328,441 | |
| Mortgage loan receivable held for investment, net, at amortized cost: | |
| Mortgage loan receivable held for investment, net, at amortized cost: | |
| Mortgage loan receivables held for investment, net, at amortized cost(5) | |
| Mortgage loan receivables held for investment, net, at amortized cost(5) | |
| Mortgage loan receivables held for investment, net, at amortized cost(5) | |
| | Provision for current expected credit losses | | N/A | | 0 | | | 0 | | | (41,507) | | | (41,507) | |
| Mortgage loan receivable held for sale | | 30,478 | | | 0 | | | 0 | | | 32,082 | | | 32,082 | |
| CMBS(5) | | 11,523 | | | 0 | | | 0 | | | 11,074 | | | 11,074 | |
| CMBS interest-only(5) | | 10,566 | | (2) | 0 | | | 0 | | | 675 | | | 675 | |
| Provision for current expected credit losses | | N/A | | (20) | | | (20) | |
| | Mortgage loan receivable held for sale(6) | |
| | Mortgage loan receivable held for sale(6) | |
| | Mortgage loan receivable held for sale(6) | |
| CMBS(7) | |
| CMBS interest-only(7) | |
| | | FHLB stock | FHLB stock | | 31,000 | | | 0 | | | 0 | | | 31,000 | | | 31,000 | |
| | $ | 0 | | | $ | 0 | | | $ | 2,361,745 | | | $ | 2,361,745 | |
| FHLB stock | |
| | FHLB stock | |
| | | | $ | |
| Liabilities: | Liabilities: | | | | | | | | | | |
| Repurchase agreements - short-term | Repurchase agreements - short-term | | 708,833 | | | $ | 0 | | | $ | 0 | | | $ | 708,833 | | | $ | 708,833 | |
| Repurchase agreements - short-term | |
| Repurchase agreements - short-term | |
| Repurchase agreements - long-term | Repurchase agreements - long-term | | 112,004 | | | 0 | | | 0 | | | 112,004 | | | 112,004 | |
| Revolving credit facility | | 266,430 | | | 0 | | | 0 | | | 266,430 | | | 266,430 | |
| | Mortgage loan financing | Mortgage loan financing | | 761,793 | | | 0 | | | 0 | | | 786,405 | | | 786,405 | |
| Secured financing facility | | 192,646 | | | 0 | | | 0 | | | 192,646 | | | 192,646 | |
| Mortgage loan financing | |
| Mortgage loan financing | |
| | CLO debt | CLO debt | | 276,516 | | | 0 | | | 0 | | | 276,516 | | | 276,516 | |
| | CLO debt | |
| | CLO debt | |
| | Borrowings from the FHLB | |
| Borrowings from the FHLB | |
| Borrowings from the FHLB | Borrowings from the FHLB | | 288,000 | | | 0 | | | 0 | | | 289,091 | | | 289,091 | |
| Senior unsecured notes | Senior unsecured notes | | 1,612,299 | | | 0 | | | 0 | | | 1,607,930 | | | 1,607,930 | |
| | | $ | 0 | | | $ | 0 | | | $ | 4,239,855 | | | $ | 4,239,855 | |
| | | | $ | |
| | | | | $ | |
| | | | | $ | |
(1)Measured at fair value on a recurring basis with the net unrealized gains or losses recorded as a component of other comprehensive income (loss) in equity.
(2)Represents notional outstanding balance of underlying collateral.
(3)Measured at fair value on a recurring basis with the net unrealized gains or losses recorded in current period earnings.
(4)Measured at fair value on a recurring basis with the net unrealized gains or losses recorded in current period earnings. The outstanding face amount of the nonhedge derivatives represents the notional amount of the underlying contracts.
(5)Balance does not include impact of allowance for current expected credit losses of $43.2 million at December 31, 2023.
(6)A lower of cost or market adjustment was recorded as of December 31, 2023.
(7)Restricted securities which are designated as risk retention securities under the Dodd-Frank Act and are therefore subject to transfer restrictions over the term of the securitization trust, which are classified as held-to-maturity and reported at amortized cost.
December 31, 20192022
| | Financial Instruments Reported at Fair Value on Consolidated Statements of Financial Condition | Financial Instruments Reported at Fair Value on Consolidated Statements of Financial Condition | | Outstanding Face
Amount | | Fair Value | Financial Instruments Reported at Fair Value on Consolidated Statements of Financial Condition | | Principal
Amount | | Fair Value |
| | Level 1 | | Level 2 | | Level 3 | | Total | | Level 1 | | Level 2 | | Level 3 | | Total |
| | Assets: | Assets: | | | | | | | | | | |
| Assets: | |
| Assets: | | | | | | | |
| CMBS(1) | CMBS(1) | | $ | 1,628,476 | | | $ | 0 | | | $ | 0 | | | $ | 1,632,714 | | | $ | 1,632,714 | |
| CMBS interest-only(1) | CMBS interest-only(1) | | 1,548,061 | | (2) | 0 | | | 0 | | | 28,342 | | | 28,342 | |
| GNMA interest-only(3) | GNMA interest-only(3) | | 109,783 | | (2) | 0 | | | 0 | | | 1,851 | | | 1,851 | |
| Agency securities(1) | Agency securities(1) | | 629 | | | 0 | | | 0 | | | 637 | | | 637 | |
| GNMA permanent securities(1) | | 31,461 | | | 0 | | | 0 | | | 32,369 | | | 32,369 | |
| | | Equity securities | Equity securities | | N/A | | 12,980 | | | — | | | — | | | 12,980 | |
| | Equity securities | |
| | Equity securities | |
| U.S. Treasury securities | |
| Nonhedge derivatives(4) | Nonhedge derivatives(4) | | 340,200 | | | 0 | | | 693 | | | 0 | | | 693 | |
| | | | $ | |
| | $ | 12,980 | | | $ | 693 | | | $ | 1,695,913 | | | $ | 1,709,586 | |
| Liabilities: | | | | | | | | |
| Nonhedge derivatives(4) | | $ | 69,571 | | | $ | 0 | | | $ | 0 | | | $ | 0 | | | $ | 0 | |
| | Financial Instruments Not Reported at Fair Value on Consolidated Statements of Financial Condition | |
| | | Financial Instruments Not Reported at Fair Value on Consolidated Statements of Financial Condition | |
| | | Financial Instruments Not Reported at Fair Value on Consolidated Statements of Financial Condition | Financial Instruments Not Reported at Fair Value on Consolidated Statements of Financial Condition | | Outstanding Face
Amount | | Fair Value | | Principal
Amount | | Fair Value |
| | Level 1 | | Level 2 | | Level 3 | | Total | | Level 1 | | Level 2 | | Level 3 | | Total |
| | Assets: | Assets: | | | | | | | | | | |
| Assets: | |
| Assets: | |
| Mortgage loan receivable held for investment, net, at amortized cost: | Mortgage loan receivable held for investment, net, at amortized cost: | |
| Mortgage loans held by consolidated subsidiaries | | $ | 3,277,597 | | | $ | 0 | | | $ | 0 | | | $ | 3,273,219 | | | $ | 3,273,219 | |
| Mortgage loan receivable held for investment, net, at amortized cost: | |
| Mortgage loan receivable held for investment, net, at amortized cost: | |
| Mortgage loan receivables held for investment, net, at amortized cost(5) | |
| Mortgage loan receivables held for investment, net, at amortized cost(5) | |
| Mortgage loan receivables held for investment, net, at amortized cost(5) | |
| | Provision for loan losses | | N/A | | 0 | | | 0 | | | (20,500) | | | (20,500) | |
| Mortgage loan receivables held for sale | | 122,748 | | | 0 | | | 0 | | | 124,989 | | | 124,989 | |
| CMBS(5) | | 12,121 | | | 0 | | | 0 | | | 11,608 | | | 11,608 | |
| CMBS interest-only(5) | | 11,099 | | (2) | 0 | | | 0 | | | 804 | | | 804 | |
| | Mortgage loan receivable held for sale(6) | |
| | Mortgage loan receivable held for sale(6) | |
| | Mortgage loan receivable held for sale(6) | |
| CMBS(7) | |
| CMBS interest-only(7) | |
| | FHLB stock | FHLB stock | | 61,619 | | | 0 | | | 0 | | | 61,619 | | | 61,619 | |
| $ | 0 | | | $ | 0 | | | $ | 3,451,739 | | | $ | 3,451,739 | |
| FHLB stock | |
| FHLB stock | |
| | | | $ | |
| Liabilities: | Liabilities: | | | | | | | | | | |
| Repurchase agreements - short-term | |
| Repurchase agreements - short-term | |
| Repurchase agreements - short-term | Repurchase agreements - short-term | | 1,781,253 | | | $ | 0 | | | $ | 0 | | | $ | 1,781,253 | | | $ | 1,781,253 | |
| Repurchase agreements - long-term | Repurchase agreements - long-term | | 34,681 | | | 0 | | | 0 | | | 34,681 | | | 34,681 | |
| | Mortgage loan financing | Mortgage loan financing | | 807,854 | | | 0 | | | 0 | | | 838,766 | | | 838,766 | |
| Mortgage loan financing | |
| Mortgage loan financing | |
| | CLO debt | |
| | CLO debt | |
| | CLO debt | |
| | Borrowings from the FHLB | |
| Borrowings from the FHLB | |
| Borrowings from the FHLB | Borrowings from the FHLB | | 1,073,500 | | | 0 | | | 0 | | | 1,080,354 | | | 1,080,354 | |
| Senior unsecured notes | Senior unsecured notes | | 1,166,201 | | | 0 | | | 0 | | | 1,208,860 | | | 1,208,860 | |
| | | $ | 0 | | | $ | 0 | | | $ | 4,943,914 | | | $ | 4,943,914 | |
| | | | $ | |
| | | | | $ | |
| | | | | $ | |
(1)Measured at fair value on a recurring basis with the net unrealized gains or losses recorded as a component of other comprehensive income (loss) in equity.
(2)Represents notional outstanding balance of underlying collateral.
(3)Measured at fair value on a recurring basis with the net unrealized gains or losses recorded in current period earnings.
(4)Measured at fair value on a recurring basis with the net unrealized gains or losses recorded in current period earnings. The outstanding face amount of the nonhedge derivatives represents the notional amount of the underlying contracts.
(5)Balance does not include impact of allowance for current expected credit losses of $20.8 million at December 31, 2022.
(6)A lower of cost or market adjustment was recorded as of December 31, 2022.
(7)Restricted securities which are designated as risk retention securities under the Dodd-Frank Act and are therefore subject to transfer restrictions over the term of the securitization trust, which are classified as held-to-maturity and reported at amortized cost.
The following table summarizes changes in Level 3 financial instruments reported at fair value on the consolidated statements of financial condition for the years ended December 31, 20202023 and December 31, 20192022 ($ in thousands):
| | Year Ended December 31, |
| | Year Ended December 31, | |
| | Year Ended December 31, | |
| | Year Ended December 31, | |
| Level 3 | Level 3 | | 2020 | | 2019 | |
| | Balance at January 1, | Balance at January 1, | | $ | 1,695,913 | | | $ | 1,398,576 | | |
| Transfer from level 2 | | 0 | | | 0 | | |
| | Balance at January 1, | |
| | Balance at January 1, | |
| Transfer into level 3 | |
| Transfer into level 3 | |
| Transfer into level 3 | |
| | Purchases | |
| | Purchases | |
| | Purchases | Purchases | | 439,735 | | | 1,627,063 | | |
| Sales | Sales | | (917,372) | | | (850,513) | | |
| Sales | |
| Sales | |
| Paydowns/maturities | |
| Paydowns/maturities | |
| Paydowns/maturities | Paydowns/maturities | | (135,343) | | | (491,790) | | |
| Amortization of premium/discount | Amortization of premium/discount | | (8,073) | | | (12,185) | | |
| Amortization of premium/discount | |
| Amortization of premium/discount | |
| Unrealized gain/(loss) | Unrealized gain/(loss) | | (14,896) | | | 10,014 | | |
| Realized gain/(loss) on sale(1) | | (13,396) | | | 14,748 | | |
| Unrealized gain/(loss) | |
| Unrealized gain/(loss) | |
| Realized gain/(loss) on sale | |
| Realized gain/(loss) on sale | |
| Realized gain/(loss) on sale | |
| Transfer out of level 3 (1) | |
| Transfer out of level 3 (1) | |
| Transfer out of level 3 (1) | |
| Balance at December 31, | Balance at December 31, | | $ | 1,046,568 | | | $ | 1,695,913 | | |
| Balance at December 31, | |
| Balance at December 31, | |
(1)Includes realized lossesAs of December 31, 2023, the Company determined that $440.8 million of securities were level 2 based on securities recorded as other than temporary impairments.the Company’s increased observability of the inputs used to internally value the securities.
The following is quantitative information about significant unobservable inputs in our Level 3 measurements for those assets and liabilities measured at fair value on a recurring basis ($ in thousands):
December 31, 20202022
| | Financial Instrument | Financial Instrument | | Carrying Value | | Valuation Technique | | Unobservable Input | | Minimum | | Weighted Average | | Maximum | Financial Instrument | | Carrying Value | | Valuation Technique | | Unobservable Input | | Minimum | | Weighted Average | | Maximum |
| | CMBS(1) | CMBS(1) | | $ | 992,226 | | | Discounted cash flow | | Yield (4) | | 0 | % | | 2.09 | % | | 23.85 | % |
| CMBS(1) | |
| CMBS(1) | | | $ | 532,304 | | | Discounted cash flow | | Yield (4) | | 2.89 | % | | 5.29 | % | | 17.47 | % |
| | Duration (years)(5) | | 0 | | 2.68 | | 5.82 |
| CMBS interest-only(1) | CMBS interest-only(1) | | 21,537 | | (2) | Discounted cash flow | | Yield (4) | | 1 | % | | 2.51 | % | | 9.94 | % |
| CMBS interest-only(1) | |
| CMBS interest-only(1) | | | 10,026 | | (2) | Discounted cash flow | | Yield (4) | | 1.39 | % | | 3.72 | % | | 19.66 | % |
| | Duration (years)(5) | | 0.12 | | 2.23 | | 3.15 |
| | GNMA interest-only(3) | |
| | GNMA interest-only(3) | |
| | Prepayment speed (CPY)(5) | | 100.00 | | 100.00 | | 100.00 |
| GNMA interest-only(3) | GNMA interest-only(3) | | 1,001 | | (2) | Discounted cash flow | | Yield (4) | | 0 | % | | 7.93 | % | | 35.82 | % | | 281 | | (2) | (2) | Discounted cash flow | | Yield (4) | | 1.28 | % | | 5.50 | % | | 10.00 | % |
| | Duration (years)(5) | | 0 | | 2.80 | | 6.79 |
| | Prepayment speed (CPJ)(5) | | 5.00 | | 17.78 | | 35.00 |
| Agency securities(1) | Agency securities(1) | | 605 | | | Discounted cash flow | | Yield (4) | | 0 | % | | 11.31 | % | | 72 | % |
| | Duration (years)(5) | | 0 | | 1.23 | | 1.44 |
| GNMA permanent securities(1) | | 31,199 | | | Discounted cash flow | | Yield (4) | | 0 | % | | 2.99 | % | | 3.47 | % |
| Agency securities(1) | |
| | Agency securities(1) | | | 35 | | | Discounted cash flow | | Yield (4) | | 2.70 | % | | 2.70 | % | | 2.70 | % |
| | | Duration (years)(5) | | 1.57 | | 9.74 | | 14.57 |
| | Total | Total | | $ | 1,046,568 | | |
| | Total | |
| | Total | |
(1)CMBS, CMBS interest-only securities, Agency securities, GNMA constructionpermanent securities, GNMA permanentU.S. Treasury securities and corporate bonds are classified as available-for-sale and reported at fair value with changes in fair value recorded in the current period in other comprehensive income.
(2)The amounts presented represent the principal amount of the mortgage loans outstanding in the pool in which the interest-only securities participate.
(3)AgencyGNMA interest-only securities are recorded at fair value with changes in fair value recorded in current period earnings.
Sensitivity of the Fair Value to Changes in the Unobservable Inputs
(4)Significant increase (decrease) in the unobservable input in isolation would result in significantly lower (higher) fair value measurement.
(5)Significant increase (decrease) in the unobservable input in isolation would result in either a significantly lower or higher (lower or higher) fair value measurement depending on the structural features of the security in question.
December 31, 2019
| | | | | | | | | | | | | | | | | | | | | | | | | | | | | | | | | | | | | | |
| Financial Instrument | | Carrying Value | | Valuation Technique | | Unobservable Input | | Minimum | | Weighted Average | | Maximum |
| | | | | | | | | | | | |
| CMBS(1) | | $ | 1,632,714 | | | Discounted cash flow | | Yield (3) | | 0 | % | | 3.11 | % | | 19.92 | % |
| | | | | | Duration (years)(4) | | 0.00 | | 1.63 | | 6.87 |
| CMBS interest-only(1) | | 28,342 | | (2) | Discounted cash flow | | Yield (3) | | 1.57 | % | | 3.93 | % | | 7.62 | % |
| | | | | | Duration (years)(4) | | 0.26 | | 2.47 | | 3.51 |
| | | | | | Prepayment speed (CPY)(4) | | 100.00 | | 97.24 | | 100.00 |
| GNMA interest-only(3) | | 1,851 | | (2) | Discounted cash flow | | Yield (4) | | (4.82) | % | | 15.13 | % | | 44.5 | % |
| | | | | | Duration (years)(5) | | 0.85 | | 2.90 | | 13.69 |
| | | | | | Prepayment speed (CPJ)(5) | | 5.00 | | 12.36 | | 35.00 |
| Agency securities(1) | | 637 | | | Discounted cash flow | | Yield (4) | | 0 | % | | 1.7 | % | | 2.16 | % |
| | | | | | Duration (years)(5) | | 0.00 | | 2.30 | | 2.92 |
| GNMA permanent securities(1) | | 32,369 | | | Discounted cash flow | | Yield (4) | | 56.56 | % | | 166.79 | % | | 410 | % |
| | | | | | Duration (years)(5) | | 2.60 | | 3.61 | | 6.49 |
| | | | | | | | | | | | |
| | | | | | | | | | | | |
| Total | | $ | 1,695,913 | | | | | | | | | | | |
(1)CMBS, CMBS interest-only securities, Agency securities, GNMA construction securities, GNMA permanent securities and corporate bonds are classified as available-for-sale and reported at fair value with changes in fair value recorded in the current period in other comprehensive income.
(2)The amounts presented represent the principal amount of the mortgage loans outstanding in the pool in which the interest-only securities participate.
(3)Agency interest-only securities are recorded at fair value with changes in fair value recorded in current period earnings.
Sensitivity of the Fair Value to Changes in the Unobservable Inputs
(4)Significant increase (decrease) in the unobservable input in isolation would result in significantly lower (higher) fair value measurement.
(5)Significant increase (decrease) in the unobservable input in isolation would result in either a significantly lower or higher (lower or higher) fair value measurement depending on the structural features of the security in question.
Nonrecurring Fair Values
The Company measures fair value of certain assets on a nonrecurring basis when events or changes in circumstances indicate that the carrying value of the assets may be impaired. Adjustments to fair value generally result from the application of lower of amortized cost or fair value accounting for assets held for sale or write-down of assets value due to impairment. Refer to Note 3, Mortgage Loan Receivables and Note 5, Real Estate and Related Lease Intangibles, Net, for disclosure of level 3 inputs.inputs for certain assets measured on a nonrecurring basis.
16.15. INCOME TAXES
The Company elected to be taxed as a REIT under Sections 856 through 860 of the Internal Revenue Code of 1986, as amended, commencing with the taxable year ended December 31, 2015. As such, the Company’s income is generally not subject to U.S. federal, state and local corporate income taxes other than as described below.
Certain of the Company’s subsidiaries have elected to be treated as TRSs. TRSs permit the Company to participate in certain activities from which REITs are generally precluded, as long as these activities meet specific criteria, are conducted within the parameters of certain limitations established by the Code, and are conducted in entities which elect to be treated as taxable subsidiaries under the Code. To the extent these criteria are met, the Company will continue to maintain its qualification as a REIT. The Company’s TRSs are not consolidated for U.S. federal income tax purposes, but are instead taxed as corporations. For financial reporting purposes, a provision for current and deferred taxes is established for the portion of earnings recognized by the Company with respect to its interest in TRSs.
| | | | | | | | | | | | | | | | | | | | | |
| | | | Year Ended December 31, |
| | | | | 2020 | | 2019 | | 2018 |
| | | | | | | | | |
| Current expense (benefit) | | | | | | | | | |
| U.S. federal | | | | | $ | (8,087) | | | $ | (1,772) | | | $ | 7,099 | |
| State and local | | | | | (1,796) | | | (396) | | | 7,068 | |
| Total current expense (benefit) | | | | | (9,883) | | | (2,168) | | | 14,167 | |
| Deferred expense (benefit) | | | | | | | | | |
| U.S. federal | | | | | 119 | | | 3,824 | | | (5,115) | |
| State and local | | | | | (25) | | | 990 | | | (2,409) | |
| Total deferred expense (benefit) | | | | | 94 | | | 4,814 | | | (7,524) | |
| Provision for income tax expense (benefit) | | | | | $ | (9,789) | | | $ | 2,646 | | | $ | 6,643 | |
| | | | | | | | | | | | | | | | | | | | | |
| | | | Year Ended December 31, |
| | | | | 2023 | | 2022 | | 2021 |
| Current expense (benefit) | | | | | | | | | |
| U.S. federal | | | | | $ | 2,204 | | | $ | 1,823 | | | $ | (280) | |
| State and local | | | | | 858 | | | 3,591 | | | 936 | |
| Total current expense (benefit) | | | | | 3,062 | | | 5,414 | | | 656 | |
| Deferred expense (benefit) | | | | | | | | | |
| U.S. federal | | | | | 964 | | | (445) | | | 311 | |
| State and local | | | | | 218 | | | (60) | | | (39) | |
| Total deferred expense (benefit) | | | | | 1,182 | | | (505) | | | 272 | |
| Provision for income tax expense (benefit) | | | | | $ | 4,244 | | | $ | 4,909 | | | $ | 928 | |
A reconciliation between the U.S. federal statutory income tax rate and the effective tax rate for the years ended December 31, 2020, 20192023, 2022 and 20182021 is as follows:
| | | | | | | | | | | | | | | | | | | | | | | | |
| | | | | Year Ended December 31, | |
| | | | | | 2020 | | 2019 | | 2018 | |
| | | | | | | | | | |
| US statutory tax rate | | | | | 21.00 | % | | 21.00 | % | | 21.00 | % | |
| REIT income not subject to corporate income tax | | | | | 65.98 | % | | (21.89) | % | | (18.86) | % | |
| Increase due to state and local taxes | | | | | 9.85 | % | | (0.25) | % | | 2.44 | % | (1) |
| Change in valuation allowance | | | | | 6.91 | % | | 3.26 | % | | (1.64) | % | |
| Offshore non-taxable income | | | | | (41.96) | % | | (0.24) | % | | 0 | % | |
| UTP released | | | | | (2.54) | % | | (0.46) | % | | 0 | % | |
| Section 163 (j) interest expense limitation | | | | | (7.12) | % | | 0 | % | | 0 | % | |
| REIT Income Taxes | | | | | (2.59) | % | | 0 | % | | 0 | % | |
| Return to Provision | | | | | (1.25) | % | | 0 | % | | 0 | % | |
| Net operating loss carryback benefit | | | | | 4.54 | % | | 0 | % | | 0 | % | |
| Other | | | | | (1.96) | % | | 0.45 | % | | (0.03) | % | |
| Effective income tax rate | | | | | 50.86 | % | | 1.87 | % | | 2.91 | % | |
(1)The increase in state taxes shown above is primarily related to additional tax expense of $3.3 million for the year ended December 31, 2018, pertaining to New York State tax audits, further discussed below. | | | | | | | | | | | | | | | | | | | | | |
| | | | | Year Ended December 31, |
| | | | | | 2023 | | 2022 | | 2021 |
| U.S. statutory tax rate | | | | | 21.00 | % | | 21.00 | % | | 21.00 | % |
| REIT income not subject to corporate income tax | | | | | (15.22) | % | | (18.09) | % | | (17.72) | % |
| Increase due to state and local taxes | | | | | 1.07 | % | | 0.59 | % | | (0.46) | % |
| Change in valuation allowance | | | | | (1.57) | % | | (1.17) | % | | (1.20) | % |
| Offshore non-taxable income | | | | | (3.79) | % | | (1.35) | % | | (3.75) | % |
| Uncertain tax position recorded (released) | | | | | 0.14 | % | | 1.45 | % | | — | % |
| Section 163 (j) interest expense limitation | | | | | 0.17 | % | | 0.08 | % | | 0.27 | % |
| REIT income taxes | | | | | 0.14 | % | | 0.28 | % | | (0.31) | % |
| Return to provision | | | | | (0.23) | % | | (0.64) | % | | 1.64 | % |
| Net operating loss carryback benefit | | | | | — | % | | — | % | | — | % |
| Other | | | | | 2.34 | % | | 0.74 | % | | 2.14 | % |
| Effective income tax rate | | | | | 4.05 | % | | 2.89 | % | | 1.61 | % |
The differences between the Company’s statutory rate and effective tax rate are largely determined by the amount of income subject to tax by the Company’s TRS subsidiaries. The Company expects that its future effective tax rate will be determined in a similar manner.
As of December 31, 20202023 and 2019,2022, the Company’s net deferred tax assets (liabilities) were $(2.0)$(3.0) million and $(2.1)$(1.8) million, respectively, and are included in other assets (liabilities) in the Company’s consolidated balance sheets. The Company believes that, other than the specific deferred tax assets described below, it is more likely than not that the net deferred tax assets will be realized in the future. Realization of the net deferred tax assets (liabilities) is dependent upon our generation of sufficient taxable income in future years in appropriate tax jurisdictions to obtain benefit from the reversal of temporary differences. The amount of net deferred tax assets considered realizable is subject to adjustment in future periods if estimates of future taxable income change.
The Company has recorded deferred tax assets related to net operating losses in the taxable REIT subsidiaries that are expected to be fully utilized in future periods. The net operating loss subject to unlimited carryforward is $22.8$8.0 million as of December 31, 2020.2023.
The components of the Company’s deferred tax assets and liabilities are as follows ($ in thousands):
| | December 31, 2023 | | | December 31, 2023 | | December 31, 2022 |
| Deferred Tax Assets | | Deferred Tax Assets | | | |
| | December 31, 2020 | | December 31, 2019 |
| | Deferred Tax Assets | | | |
| Basis difference in operating partnerships | $ | 6,222 | | | $ | 246 | |
| Net operating loss carryforward | |
| Net operating loss carryforward | |
| Net operating loss carryforward | |
| Net unrealized losses | Net unrealized losses | 986 | | | 1,440 | |
| Capital losses carryforward | Capital losses carryforward | 5,664 | | | 6,717 | |
| Valuation allowance | Valuation allowance | (5,664) | | | (6,717) | |
| Interest expense limitation | Interest expense limitation | 1,370 | | | 846 | |
| Valuation Allowance | (1,370) | | | 0 | |
| Valuation allowance | |
| | Total Deferred Tax Assets | Total Deferred Tax Assets | $ | 7,208 | | | $ | 2,532 | |
| Total Deferred Tax Assets | |
| Total Deferred Tax Assets | |
| | December 31, 2020 | | December 31, 2019 |
| | December 31, 2023 | | | December 31, 2023 | | December 31, 2022 |
| Deferred Tax Liability | Deferred Tax Liability | | | | Deferred Tax Liability | | | |
| Basis difference in operating partnerships | Basis difference in operating partnerships | $ | 9,218 | | | $ | 4,671 | |
| | Total Deferred Tax Liability | Total Deferred Tax Liability | $ | 9,218 | | | $ | 4,671 | |
| | Total Deferred Tax Liability | |
| | Total Deferred Tax Liability | |
As of December 31, 2020,2023, the Company had $5.7$2.8 million of deferred tax assets relating to capital losses which it may only use to offset capital gains. As of December 31, 2019,2022, the Company had $6.7$4.4 million of deferred tax assets relating to capital losses which it may only use to offset capital gains. These tax attributes will begin to expire if unused in 2021.2024. As the realization of these assets are not more likely than not before their expiration, the Company has provided a full valuation allowance against these deferred tax assets.
The Company’s tax returns are subject to audit by taxing authorities. Generally, as of December 31, 2020,2023, the tax years 2017-20202019-2023 remain open to examination by the major taxing jurisdictions in which the Company is subject to taxes. The Company acquired certain corporate entities at the time of its IPO. The related acquisition agreements provided an indemnification to the Company by each transferor of any amounts due for any potential tax liabilities owed by these entities for tax years prior to their acquisition. In January 2019, a settlement was reached with New York State pertaining to an audit of these corporate entities for the years 2013-2015. As a result of the settlement, management recorded income tax expense in the amount of $3.3 million and a corresponding payable to the State of New York in 2018. Pursuant to the indemnification, management expected to recover $2.5 million of the $3.3 million from indemnity counterparties and, accordingly, recorded fee and other income in the amount of $2.5 million as well as a corresponding receivable from the indemnity counterparties. As of July 31, 2019, the Company collected all amounts owed by the counterparties related to the 2013-2015 audit. The IRS recently completed its audit of the 2014 tax year and did not recommend any changes to the Company’s tax return. The Company is currently under New York City audit for tax years 2012-2014. SeveralOne of the Company’s subsidiary entities areis currently under New York Statean IRS audit for tax year 2020 and also under audit in New York City for tax years 2015-2018.2014-2020. The Company does not expect these audits to result in any material changes to the Company’s financial position. In April 2023, a settlement was reached for $2.6 million with New York City pertaining to an audit of the
Company for the years 2012-2013 resulting in an incremental income tax expense of $0.2 million for the twelve months ended December 31, 2023. The Company does not expect tax expense to have an impact on either short or long-term liquidity or capital needs.
As of December 31, 2020 and 2019,2023, the Company’sCompany did not have any unrecognized tax benefits. As of December 31, 2022, the Company had an unrecognized tax benefit is a liability for $0.7of $2.4 million, and $0.2 million, respectively, andwhich is included in the accrued expenses in the Company’s consolidated balance sheets. This unrecognized tax benefit, if recognized, would have a favorable impact on our effective income tax rate in future periods. As of December 31, 2020,2023, the Company has not recognized a significant amount of any interest or penalties related to uncertain tax positions. In
addition, the Company does not believe that it has any tax positions for which it is reasonably possible that it will be required to record a significant liability for unrecognized tax benefits within the next twelve months.
Tax Receivable Agreement
Upon consummation of the IPO, the Company entered into a Tax Receivable Agreement with the Continuing LCFH Limited Partners (the “TRA Members”). Under the Tax Receivable Agreement the Company generally was required to pay to the TRA Members that exchanged their interests in LCFH and Class B shares of the Company for Class A shares of the Company, 85% of the applicable cash savings, if any, in U.S. federal, state and local income tax that the Company realized (or was deemed to realize in certain circumstances) as a result of (i) the increase in tax basis in its proportionate share of LCFH’s assets that was attributable to the Company as a result of the exchanges and (ii) payments under the Tax Receivable Agreement, including any tax benefits related to imputed interest deemed to be paid by the Company as a result of such agreement.
To determine the current amount of the payments due, the Company estimated the amount of the Tax Receivable Agreement payments to be made within twelve months of the balance sheet date. As of December 31, 2020 and 2019, pursuant to the Tax Receivable Agreement, the Company had a liability of $0.9 million and $1.6 million, respectively, included in other liabilities in the consolidated balance sheets for TRA Members.
Following the remaining partners’ exchange during the three months ended September 30, 2020, the Company elected to compute Early Termination Payments for each exchanging partner as provided under the terms of the Tax Receivable Agreement. All of the participants were notified of the payments to which they would be entitled, including those entitled to no payment. The Early Termination Payments totaling $0.9 million were either executed or scheduled to be executed in February and March 2021, thereby satisfying the TRA liability reported as of December 31, 2020.
17.16. RELATED PARTY TRANSACTIONS
Ladder Select Bond Fund
On October 18, 2016, Ladder Capital Asset Management LLC (“LCAM”), a subsidiary of the Company and a registered investment adviser, launched the Ladder Select Bond Fund, a mutual fund (the “Fund”). In addition, on October 18, 2016, the Company made a $10.0 million investment in the Fund, which was included in other assets in the consolidated balance sheets. On June 22, 2020, the Fund was liquidated and LCAM deregistered with the SEC. The Company recognized a realized loss of $0.7 million upon liquidation of the Fund which is included in fee and other income on the consolidated statements of income for the year ended December 31, 2020.
18. COMMITMENTS AND CONTINGENCIES
Leases
The Company adopted ASC Topic 842 on January 1, 2019. The primary impacthas no material related party relationships to disclose.
17. COMMITMENTS AND CONTINGENCIES
Leases
As of applying ASC Topic 842 wasDecember 31, 2023, the initial recognition ofCompany had a $3.5$(16.4) million lease liability and a $3.3 million right of use asset (including previously accrued straight line rent) on the Company’s consolidated financial statements, for leases classified as operating leases under ASC Topic 840, primarily for the Company’s corporate headquarters and other identified leases. As of December 31, 2020, the Company had a $1.3 million lease liability and a $1.3$14.7 million right-of-use asset on its consolidated balance sheets foundrecorded within other liabilities and other assets, respectively. Tenant reimbursements, which consist of real estate taxes and other municipal charges paid by us which were reimbursable by our tenants pursuantThe right-of-use lease asset relates to the termsCompany's operating lease of triple-netoffice space. Right-of use lease agreements, were $5.5 million, $6.4 million and $9.7 million forassets initially equal the lease liability. During the years ended December 31, 2020, 2019 and 2018, respectively, and are included in operating lease income on the Company’s consolidated statements of income.
Investments in Unconsolidated Joint Ventures
We have made investments in various unconsolidated joint ventures. See Note 6, Investment in and Advances to Unconsolidated Joint Ventures for further details of our unconsolidated investments. Our maximum exposure to loss from these investments is limited to the carrying value of our investments.
December 31, 2023 and 2022, the Company recognized $2.2 million and $1.1 million, respectively, in operating expenses in its consolidated statements of income relating to operating leases.
Future minimum lease payments under non-cancelable operating leases as of December 31, 2023 are as follows ($ in thousands):
| | | | | | | | |
| | |
| 2024 | | $ | 2,171 | |
| 2025 | | 2,207 | |
| 2026 | | 2,219 | |
| 2027 | | 2,232 | |
| 2028 | | 13,344 | |
| Thereafter | | — | |
| Total undiscounted cash flows | | 22,173 | |
| Present value discount (1) | | (5,755) | |
| Lease liabilities (2) | | $ | 16,418 | |
(1)Lease liabilities were discounted at the Company's weighted average incremental borrowing rate for similar collateral, which was estimated to be 6.62%. The remaining lease term is 9.6 years.
(2)The Company has a five-year extension option which is not reflected in the total lease liability.
Unfunded Loan Commitments
As of December 31, 2020,2023, the Company’s off-balance sheet arrangements consisted of $148.8$204.0 million of unfunded commitments on mortgage loan receivables held for investment to provide additional first mortgage loan financing over the next three years at rates to be determined at the time of funding,funding. 63% of whichthese additional funds relate to the occurrence of certain “good news” events, such as the owner concluding a lease agreement with a major tenant in the building or reaching some pre-determined net operating income. As of December 31, 2019,2022, the Company’s off-balance sheet arrangements consisted of $286.5$321.8 million of unfunded commitments on mortgage loan receivables held for investment to provide additional first mortgage loan financing.
Commitments are subject to our loan borrowers’ satisfaction of certain financial and nonfinancial covenants and may or may not be funded depending on a variety of circumstances including timing, credit metric hurdles, and other nonfinancial events occurring. The COVID-19 pandemic has impactedCompany carefully monitors the progress of work generally and, depending on specific property locations,at properties that serve as collateral underlying its commercial mortgage loans, including the progress of capital expenditures, construction, leasing and leasing, which have been delayed and/or slower paced than originally anticipated. The progressbusiness plans in light of those particular projects located in states or local municipalities with continuing restrictions on such activities is anticipated to remain slower to complete than otherwise expected, and the pace of future funding relating to these capital needs has been, and may continue to be, commensurately slower.current market conditions. These commitments are not reflected on the consolidated balance sheets.
Unsettled Trades
As of December 31, 2023, the Company had $44.8 million of U.S. Treasury securities traded and not yet settled on its consolidated balance sheets. The U.S. Treasury securities are recorded within other assets, and the related payable is recorded within other liabilities. These balances relate to the Company’s purchase of U.S. Treasury securities with maturities of less than three months, which will be recorded within cash and cash equivalents upon settlement.
19.18. SEGMENT REPORTING
The Company has determined that it has 3three reportable segments based on how the chief operating decision maker reviewsmakers review and managesmanage the business. These reportable segments include loans, securities, and real estate. The loans segment includes mortgage loan receivables held for investment (balance sheet loans) and mortgage loan receivables held for sale (conduit loans). The securities segment is composed of all of the Company’s activities related to commercial real estate securities, which include investments in CMBS, U.S. Agency Securities,securities, corporate bonds, equity securities and equityU.S. Treasury securities. The real estate segment includes net leased properties, office buildings, student housing portfolios, hotels, industrial buildings, a shopping center and condominium units. Corporate/other includes certain of the Company’s investments in joint ventures, other asset management activities and operating expenses.
The Company evaluates performance based on the following financial measures for each segment ($ in thousands):
| | | Year ended December 31, 2020 | Loans | | Securities | | Real Estate (1) | | Corporate/Other(2) | | Company
Total |
| Year ended December 31, 2023 | | Year ended December 31, 2023 | Loans | | Securities | | Real Estate (1) | | Corporate/Other(2) | | Company
Total |
| Interest income | Interest income | $ | 205,640 | | | $ | 32,904 | | | $ | 13 | | | $ | 1,293 | | | 239,849 | |
| Interest expense | Interest expense | (48,084) | | | (21,554) | | | (39,396) | | | (118,440) | | | (227,474) | |
| Net interest income (expense) | Net interest income (expense) | 157,556 | | | 11,349 | | | (39,383) | | | (117,148) | | | 12,375 | |
| Provision for (release of) loan loss reserves | (18,277) | | | 2 | | | 0 | | | 0 | | | (18,275) | |
| (Provision for) release of loan loss reserves | |
| Net interest income (expense) after provision for (release of) loan reserves | Net interest income (expense) after provision for (release of) loan reserves | 139,279 | | | 11,351 | | | (39,383) | | | (117,148) | | | (5,900) | |
| | Operating lease income | 0 | | | 0 | | | 100,248 | | | 0 | | | 100,248 | |
| Real estate operating income | |
| Real estate operating income | |
| Real estate operating income | |
| | Sale of loans, net | (1,571) | | | 0 | | | 0 | | | 0 | | | (1,571) | |
| Net result from mortgage loan receivables held for sale | |
| | Net result from mortgage loan receivables held for sale | |
| | Net result from mortgage loan receivables held for sale | |
| Realized gain (loss) on securities | Realized gain (loss) on securities | 0 | | | (12,410) | | | 0 | | | 0 | | | (12,410) | |
| Unrealized gain (loss) on equity securities | 0 | | | (132) | | | 0 | | | 0 | | | (132) | |
| Unrealized gain (loss) on Agency interest-only securities | 0 | | | 263 | | | 0 | | | 0 | | | 263 | |
| Unrealized gain (loss) on securities | |
| | Realized gain on sale of real estate, net | |
| Realized gain on sale of real estate, net | |
| Realized gain on sale of real estate, net | Realized gain on sale of real estate, net | 0 | | | 0 | | | 32,102 | | | 0 | | | 32,102 | |
| | Fee and other income | Fee and other income | 9,142 | | | 403 | | | 25 | | | 3,084 | | | 12,654 | |
| Fee and other income | |
| Fee and other income | |
| Net result from derivative transactions | Net result from derivative transactions | (11,264) | | | (4,006) | | | 0 | | | 0 | | | (15,270) | |
| Earnings (loss) from investment in unconsolidated joint ventures | 0 | | | 0 | | | 1,821 | | | 0 | | | 1,821 | |
| Earnings (loss) from investment in unconsolidated ventures | |
| | Gain (loss) on extinguishment of debt | |
| Gain (loss) on extinguishment of debt | |
| Gain (loss) on extinguishment of debt | Gain (loss) on extinguishment of debt | 0 | | | 0 | | | 0 | | | 22,250 | | | 22,250 | |
| Total other income (loss) | Total other income (loss) | (3,693) | | | (15,882) | | | 134,196 | | | 25,334 | | | 139,955 | |
| | Salaries and employee benefits | 0 | | | 0 | | | 0 | | | (58,101) | | | (58,101) | |
| Operating expenses(3) | 3 | | | 0 | | | 0 | | | (20,297) | | | (20,294) | |
| Compensation and employee benefits | |
| Compensation and employee benefits | |
| Compensation and employee benefits | |
| Operating expenses | |
| Real estate operating expenses | Real estate operating expenses | 0 | | | 0 | | | (28,584) | | | 0 | | (28,584) | |
| | Fee expense | (6,124) | | | (236) | | | (884) | | | 0 | | | (7,244) | |
| Investment related expenses | |
| Investment related expenses | |
| Investment related expenses | |
| Depreciation and amortization | Depreciation and amortization | 0 | | | 0 | | | (38,980) | | | (99) | | | (39,079) | |
| Total costs and expenses | Total costs and expenses | (6,121) | | | (236) | | | (68,448) | | | (78,497) | | | (153,302) | |
| | Income tax (expense) benefit | Income tax (expense) benefit | 0 | | | 0 | | | 0 | | | 9,789 | | | 9,789 | |
| Income tax (expense) benefit | |
| Income tax (expense) benefit | |
| Segment profit (loss) | Segment profit (loss) | $ | 129,465 | | | $ | (4,767) | | | $ | 26,365 | | | $ | (160,522) | | | $ | (9,458) | |
| | Total assets as of December 31, 2020 | $ | 2,343,070 | | | $ | 1,058,298 | | | $ | 1,031,557 | | | $ | 1,448,303 | | | $ | 5,881,229 | |
| Total assets as of December 31, 2023 | |
| Total assets as of December 31, 2023 | |
| Total assets as of December 31, 2023 | |
| | | Year ended December 31, 2019 | Loans | | Securities | | Real Estate (1) | | Corporate/Other(2) | | Company
Total |
| Year ended December 31, 2022 | | Year ended December 31, 2022 | Loans | | Securities | | Real Estate (1) | | Corporate/Other(2) | | Company
Total |
| Interest income | Interest income | $ | 270,239 | | | $ | 58,880 | | | $ | 32 | | | $ | 1,084 | | | $ | 330,235 | |
| Interest expense | Interest expense | (50,293) | | | (19,248) | | | (37,226) | | | (97,586) | | | (204,353) | |
| Net interest income (expense) | Net interest income (expense) | 219,946 | | | 39,632 | | | (37,194) | | | (96,502) | | | 125,882 | |
| Provision for (release of) loan loss reserves | (2,600) | | | 0 | | | 0 | | | 0 | | | (2,600) | |
| (Provision for) release of loan loss reserves | |
| Net interest income (expense) after provision for (release of) loan reserves | Net interest income (expense) after provision for (release of) loan reserves | 217,346 | | | 39,632 | | | (37,194) | | | (96,502) | | | 123,282 | |
| | Operating lease income | 0 | | | 0 | | | 106,366 | | | 0 | | | 106,366 | |
| Real estate operating income | |
| Real estate operating income | |
| Real estate operating income | |
| | Sale of loans, net | 54,758 | | | 0 | | | 0 | | | 0 | | | 54,758 | |
| Net result from mortgage loan receivables held for sale | |
| | Net result from mortgage loan receivables held for sale | |
| | Net result from mortgage loan receivables held for sale | |
| Realized gain (loss) on securities | Realized gain (loss) on securities | 0 | | | 14,911 | | | 0 | | | 0 | | | 14,911 | |
| Unrealized gain (loss) on equity securities | 0 | | | 1,737 | | | 0 | | | 0 | | | 1,737 | |
| Unrealized gain (loss) on Agency interest-only securities | 0 | | | 84 | | | 0 | | | 0 | | | 84 | |
| Unrealized gain (loss) on securities | |
| Realized gain on sale of real estate, net | Realized gain on sale of real estate, net | 0 | | | 0 | | | 1,392 | | | 0 | | | 1,392 | |
| Impairment of real estate | 0 | | | 0 | | | (1,350) | | | 0 | | | (1,350) | |
| | Fee and other income | |
| Fee and other income | |
| Fee and other income | Fee and other income | 19,188 | | | 1,592 | | | 8 | | | 3,615 | | | 24,403 | |
| Net result from derivative transactions | Net result from derivative transactions | (16,160) | | | (13,851) | | | 0 | | | 0 | | | (30,011) | |
| Earnings (loss) from investment in unconsolidated joint ventures | 0 | | | 0 | | | 3,432 | | | 0 | | | 3,432 | |
| Earnings (loss) from investment in unconsolidated ventures | |
| | Gain (loss) on extinguishment of debt | |
| Gain (loss) on extinguishment of debt | |
| Gain (loss) on extinguishment of debt | Gain (loss) on extinguishment of debt | 0 | | | 0 | | | (1,070) | | | 0 | | | (1,070) | |
| Total other income (loss) | Total other income (loss) | 57,786 | | | 4,473 | | | 108,778 | | | 3,615 | | | 174,652 | |
| | Salaries and employee benefits | 0 | | | 0 | | | 0 | | | (67,768) | | | (67,768) | |
| Operating expenses(3) | 0 | | | 0 | | | 0 | | | (22,595) | | | (22,595) | |
| Compensation and employee benefits | |
| Compensation and employee benefits | |
| Compensation and employee benefits | |
| Operating expenses | |
| Real estate operating expenses | Real estate operating expenses | 0 | | | 0 | | | (23,323) | | | 0 | | | (23,323) | |
| | Fee expense | (4,602) | | | (350) | | | (1,138) | | | 0 | | | (6,090) | |
| Investment related expenses | |
| Investment related expenses | |
| Investment related expenses | |
| Depreciation and amortization | Depreciation and amortization | 0 | | | 0 | | | (38,412) | | | (99) | | | (38,511) | |
| Total costs and expenses | Total costs and expenses | (4,602) | | | (350) | | | (62,873) | | | (90,462) | | | (158,287) | |
| | Income tax (expense) benefit | Income tax (expense) benefit | 0 | | | 0 | | | 0 | | | (2,646) | | | (2,646) | |
| Income tax (expense) benefit | |
| Income tax (expense) benefit | |
| Segment profit (loss) | Segment profit (loss) | $ | 270,530 | | | $ | 43,755 | | | $ | 8,711 | | | $ | (185,995) | | | $ | 137,001 | |
| | Total assets as of December 31, 2019 | $ | 3,358,861 | | | $ | 1,721,305 | | | $ | 1,096,514 | | | $ | 492,472 | | | $ | 6,669,152 | |
| Total assets as of December 31, 2022 | |
| Total assets as of December 31, 2022 | |
| Total assets as of December 31, 2022 | |
| | | Year ended December 31, 2018 | Loans | | Securities | | Real Estate (1) | | Corporate/Other(2) | | Company
Total |
| Year ended December 31, 2021 | | Year ended December 31, 2021 | Loans | | Securities | | Real Estate (1) | | Corporate/Other(2) | | Company
Total |
| Interest income | Interest income | $ | 310,149 | | | $ | 34,217 | | | $ | 24 | | | $ | 426 | | | $ | 344,816 | |
| Interest expense | Interest expense | (62,474) | | | (4,617) | | | (34,739) | | | (92,461) | | | (194,291) | |
| Net interest income (expense) | Net interest income (expense) | 247,675 | | | 29,600 | | | (34,715) | | | (92,035) | | | 150,525 | |
| Provision for (release of) loan loss reserves | (13,900) | | | 0 | | | 0 | | | 0 | | | (13,900) | |
| (Provision for) release of loan loss reserves | |
| Net interest income (expense) after provision for (release of) loan reserves | Net interest income (expense) after provision for (release of) loan reserves | 233,775 | | | 29,600 | | | (34,715) | | | (92,035) | | | 136,625 | |
| | Operating lease income | 0 | | | 0 | | | 106,177 | | | 0 | | | 106,177 | |
| Real estate operating income | |
| Real estate operating income | |
| Real estate operating income | |
| | Sale of loans, net | 16,511 | | | 0 | | | 0 | | | 0 | | | 16,511 | |
| Net result from mortgage loan receivables held for sale | |
| | Net result from mortgage loan receivables held for sale | |
| | Net result from mortgage loan receivables held for sale | |
| Realized gain (loss) on securities | Realized gain (loss) on securities | 0 | | | (5,808) | | | 0 | | | 0 | | | (5,808) | |
| Unrealized gain (loss) on equity securities | 0 | | | (1,605) | | | 0 | | | 0 | | | (1,605) | |
| Unrealized gain (loss) on Agency interest-only securities | 0 | | | 555 | | | 0 | | | 0 | | | 555 | |
| | Unrealized gain (loss) on securities | |
| Unrealized gain (loss) on securities | |
| Unrealized gain (loss) on securities | |
| Realized gain on sale of real estate, net | Realized gain on sale of real estate, net | 0 | | | 0 | | | 95,881 | | | 0 | | | 95,881 | |
| | Fee and other income | Fee and other income | 16,490 | | | 0 | | | 3,416 | | | 6,379 | | | 26,285 | |
| Fee and other income | |
| Fee and other income | |
| Net result from derivative transactions | Net result from derivative transactions | 10,467 | | | 5,459 | | | 0 | | | 0 | | | 15,926 | |
| Earnings (loss) from investment in unconsolidated joint ventures | 0 | | | 0 | | | 790 | | | 0 | | | 790 | |
| Earnings (loss) from investment in unconsolidated ventures | |
| | Gain (loss) on extinguishment of debt | (69) | | | 0 | | | (4,323) | | | 0 | | | (4,392) | |
| | Total other income (loss) | Total other income (loss) | 43,399 | | | (1,399) | | | 201,941 | | | 6,379 | | | 250,320 | |
| | Salaries and employee benefits | 0 | | | 0 | | | 0 | | | (60,117) | | | (60,117) | |
| Operating expenses(3) | 0 | | | 0 | | | 0 | | | (21,696) | | | (21,696) | |
| Total other income (loss) | |
| | Total other income (loss) | |
| | Compensation and employee benefits | |
| Compensation and employee benefits | |
| Compensation and employee benefits | |
| Operating expenses | |
| Real estate operating expenses | Real estate operating expenses | 0 | | | 0 | | | (29,799) | | | 0 | | (29,799) | |
| | Fee expense | (4,040) | | | (398) | | | (617) | | | 0 | | | (5,055) | |
| Investment related expenses | |
| Investment related expenses | |
| Investment related expenses | |
| Depreciation and amortization | Depreciation and amortization | 0 | | | 0 | | | (41,884) | | | (75) | | | (41,959) | |
| Total costs and expenses | Total costs and expenses | (4,040) | | | (398) | | | (72,300) | | | (81,888) | | | (158,626) | |
| | Income tax (expense) benefit | Income tax (expense) benefit | 0 | | | 0 | | | 0 | | | (6,643) | | | (6,643) | |
| Income tax (expense) benefit | |
| Income tax (expense) benefit | |
| Segment profit (loss) | Segment profit (loss) | $ | 273,134 | | | $ | 27,803 | | | $ | 94,926 | | | $ | (174,187) | | | $ | 221,676 | |
| | Total assets as of December 31, 2018 | $ | 3,482,929 | | | $ | 1,410,126 | | | $ | 1,038,376 | | | $ | 341,441 | | | $ | 6,272,872 | |
| Total assets as of December 31, 2021 | |
| Total assets as of December 31, 2021 | |
| Total assets as of December 31, 2021 | |
|
(1)Includes the Company’s investment in unconsolidated joint ventures that held real estate of $46.3$6.9 million and $48.4$6.2 million as of December 31, 20202023 and 2019,December 31, 2022, respectively.
(2)Corporate/Other represents all corporate level and unallocated items including any intercompany eliminations necessary to reconcile to consolidated Company totals. This segment also includes the Company’s investment in unconsolidated joint ventures and strategic investments that are not related to the other reportable segments above, including the Company’s investment in FHLB stock of $31.0 million and $61.6$5.2 million as of December 31, 20202023 and 2019, respectively,$9.6 million as of December 31, 2022, and the Company’s senior unsecured notes of $1.6 billion and $1.2 billion as ofat December 31, 20202023 and 2019, respectively.December 31, 2022.
19. SUBSEQUENT EVENTS
The Company has evaluated subsequent events through the issuance date of the financial statements and determined that no additional disclosure is necessary.
20. QUARTERLY FINANCIAL DATA (UNAUDITED)
The following table summarizes the consolidated quarterly financial information for the Company ($ in thousands except per share and dividend amounts):
| | | | | | | | | | | | | | | | | | | | | | | | | | | | |
| | Q4 2020 | | Q3 2020 | | Q2 2020 | | Q1 2020 | | |
| | | | | | | | | | |
| Interest income | | $ | 50,543 | | | $ | 54,621 | | | $ | 62,096 | | | $ | 72,589 | | | |
| Net interest income after provision for (release of) loan reserves | | 4,359 | | | 735 | | | (5,600) | | | (5,393) | | | |
| Other income (loss) | | 27,235 | | | 52,810 | | | 30,909 | | | 29,002 | | | |
| Costs and expenses | | 47,889 | | | 32,149 | | | 31,052 | | | 42,211 | | | |
| Income (loss) before taxes | | (16,295) | | | 21,396 | | | (5,743) | | | (18,602) | | | |
| Income tax expense (benefit) | | (4,712) | | | 14 | | | (550) | | | (4,541) | | | |
| Net income (loss) | | (11,583) | | | 21,382 | | | (5,193) | | | (14,061) | | | |
| Net (income) loss attributable to noncontrolling interest in consolidated joint ventures | | (127) | | | (4,149) | | | 250 | | | (1,519) | | | |
| Net (income) loss attributable to noncontrolling interest in operating partnership | | (4) | | | (45) | | | 754 | | | (148) | | | |
| Net income (loss) attributable to Class A common shareholders | | $ | (11,714) | | | $ | 17,188 | | | $ | (4,189) | | | $ | (15,728) | | | |
| | | | | | | | | | |
| Earnings (loss) per share: | | | | | | | | | | |
| Basic | | $ | (0.10) | | | $ | 0.15 | | | $ | (0.04) | | | $ | (0.15) | | | |
| Diluted | | $ | (0.10) | | | $ | 0.14 | | | $ | (0.04) | | | $ | (0.15) | | | |
| | | | | | | | | | |
| Dividends per share of Class A common stock | | $ | 0.200 | | | $ | 0.200 | | | $ | 0.200 | | | $ | 0.340 | | | |
| | | | | | | | | | |
| | Q4 2019 | | Q3 2019 | | Q2 2019 | | Q1 2019 | | |
| | | | | | | | | | |
| Interest income | | $ | 76,196 | | | $ | 82,251 | | | $ | 85,322 | | | $ | 86,466 | | | |
| Net interest income after provision for (release of) loan reserves | | 24,857 | | | 30,854 | | | 32,653 | | | 34,918 | | | |
| Other income (loss) | | 59,601 | | | 38,195 | | | 43,708 | | | 33,148 | | | |
| Costs and expenses | | 36,839 | | | 36,989 | | | 38,069 | | | 46,390 | | | |
| Income (loss) before taxes | | 47,619 | | | 32,060 | | | 38,291 | | | 21,677 | | | |
| Income tax expense (benefit) | | 2,169 | | | 1,112 | | | 2,219 | | | (2,854) | | | |
| Net income (loss) | | 45,450 | | | 30,948 | | | 36,072 | | | 24,531 | | | |
| Net (income) loss attributable to noncontrolling interest in consolidated joint ventures | | 4 | | | (64) | | | 307 | | | 447 | | | |
| Net (income) loss attributable to noncontrolling interest in operating partnership | | (4,804) | | | (3,308) | | | (4,136) | | | (2,802) | | | |
| Net income (loss) attributable to Class A common shareholders | | $ | 40,650 | | | $ | 27,577 | | | $ | 32,242 | | | $ | 22,175 | | | |
| | | | | | | | | | |
| Earnings (loss) per share: | | | | | | | | | | |
| Basic | | $ | 0.38 | | | $ | 0.26 | | | $ | 0.31 | | | $ | 0.21 | | | |
| Diluted | | $ | 0.37 | | | $ | 0.26 | | | $ | 0.30 | | | $ | 0.21 | | | |
| | | | | | | | | | |
| Dividends per share of Class A common stock | | $ | 0.340 | | | $ | 0.340 | | | $ | 0.340 | | | $ | 0.340 | | | |
| | | | | | | | | | |
| | | | | | | | | | |
| | | | | | | | | | |
| | | | | | | | | | |
| | | | | | | | | | |
| | | | | | | | | | |
| | | | | | | | | | |
| | | | | | | | | | |
| | | | | | | | | | |
| | | | | | | | | | |
| | | | | | | | | | |
| | | | | | | | | | |
| | | | | | | | | | |
| | | | | | | | | | |
| | | | | | | | | | |
| | | | | | | | | | |
| | | | | | | | | | |
| | | | | | | | | | |
| | | | | | | | | | |
| | | | | | | | | | |
| | | | | | | | | | |
| | | | | | | | | | |
| | | | | | | | | | |
| | | | | | | | | | |
| | | | | | | | | | |
| | | | | | | | | | |
| | | | | | | | | | |
| | | | | | | | | | |
| | | | | | | | | | |
| | | | | | | | | | |
| | | | | | | | | | |
| | | | | | | | | | |
| | | | | | | | | | |
| | | | | | | | | | |
| | | | | | | | | | |
| | | | | | | | | | |
| | | | | | | | | | |
| | | | | | | | | | |
21. SUBSEQUENT EVENTS
On January 27, 2021, the Company redeemed in full the its 5.875% Senior Notes due 2021 (the “2021 Notes”) for $150.9 million. The 2021 Notes were redeemed at par, plus accrued and unpaid interest to the redemption date, pursuant to the optional redemption provisions of the indenture governing the 2021 Notes. The redemption of a portion of the 2021 Notes that were redeemed was subject to the condition that the Company’s subsidiary issuers of the 2021 Notes complete a notes offering of not less than $400 million. The issuers waived the condition prior to redeeming the 2021 Notes in full.
On February 9, 2021, the Company announced the appointment of Paul J. Miceli as Chief Financial Officer, effective March 1, 2021. Mr. Miceli, Ladder’s Director of Finance, will succeed Marc Fox, who has announced his intention to leave the Company. Mr. Fox will remain at the Company through May 7, 2021, to ensure an orderly transition.
Schedule III-Real Estate and Accumulated Depreciation
Ladder Capital Corp
December 31, 20202023
($ in thousands)
| | Initial Cost to Company | | Costs Capitalized Subsequent to Acquisition | | Gross Amount at which Carried at Close of Period | | Accumulated Depreciation and Amortization | | Date Acquired | | Year Built | | Life on which Depreciation in Latest Statement of Income is Computed |
| | | | Initial Cost to Company | | | | | | Initial Cost to Company | | Costs Capitalized Subsequent to Acquisition | | Gross Amount at which Carried at Close of Period | | Accumulated Depreciation and Amortization | | Date Acquired | | Year Built | | Life on which Depreciation in Latest Statement of Income is Computed |
| Description | Description | | Encumbrances | | Land | | Building | | Intangibles | | Costs Capitalized Subsequent to Acquisition | | Land | | Building | | Intangibles | | Total | | Accumulated Depreciation and Amortization | | Date Acquired | | Year Built | | Life on which Depreciation in Latest Statement of Income is Computed |
| | Real Estate: | Real Estate: | |
| | Real Estate: | |
| | Real Estate: | |
| | Retail Property in Newburgh, IN | Retail Property in Newburgh, IN | | 0 | | | 126 | | | 954 | | | 178 | | | 0 | | | 126 | | | 954 | | | 178 | | | 1,258 | | | (6) | | | 10/13/20 | | 2020 | | 45 years |
| | Retail Property in Little Falls, MN | | 870 | | | 199 | | | 783 | | | 249 | | | 0 | | | 199 | | | 783 | | | 249 | | | 1,231 | | | (23) | | | 03/10/20 | | 2020 | | 55 years |
| | Retail Property in Newburgh, IN | |
| | Retail Property in Newburgh, IN | | | $ | 859 | | | $ | 126 | | | $ | 954 | | | $ | 178 | | | $ | — | | | $ | 126 | | | $ | 954 | | | $ | 178 | | | $ | 1,258 | | | $ | (99) | | | 10/13/20 | | 2020 | | 45 years |
| Retail Property in Newburgh, IN | Retail Property in Newburgh, IN | | 929 | | | 213 | | | 873 | | | 220 | | | 0 | | | 213 | | | 873 | | | 220 | | | 1,306 | | | (25) | | | 03/16/20 | | 2020 | | 45 years | Retail Property in Newburgh, IN | | 915 | | | 213 | | 213 | | | 873 | | 873 | | | 220 | | 220 | | | — | | — | | | 213 | | 213 | | | 873 | | 873 | | | 220 | | 220 | | | 1,306 | | 1,306 | | | (120) | | (120) | | | 03/16/20 | | 03/16/20 | | 2020 | | 45 years |
| Retail Property in Isanti, MN | Retail Property in Isanti, MN | | 1,016 | | | 249 | | | 894 | | | 297 | | | 0 | | | 249 | | | 894 | | | 297 | | | 1,440 | | | (24) | | | 03/16/20 | | 2020 | | 55 years | Retail Property in Isanti, MN | | 1,000 | | | 249 | | 249 | | | 894 | | 894 | | | 297 | | 297 | | | — | | — | | | 249 | | 249 | | | 894 | | 894 | | | 297 | | 297 | | | 1,440 | | 1,440 | | | (114) | | (114) | | | 03/16/20 | | 03/16/20 | | 2020 | | 55 years |
| | Retail Property in Little Falls, MN | | Retail Property in Little Falls, MN | | 856 | | | 199 | | | 783 | | | 249 | | | — | | | 199 | | | 783 | | | 249 | | | 1,231 | | | (106) | | | 03/10/20 | | 2020 | | 55 years |
| Retail Property in Waterloo, IA | Retail Property in Waterloo, IA | | 875 | | | 130 | | | 896 | | | 214 | | | 0 | | | 130 | | | 896 | | | 214 | | | 1,240 | | | (29) | | | 01/30/20 | | 2019 | | 45 years | Retail Property in Waterloo, IA | | 862 | | | 130 | | 130 | | | 896 | | 896 | | | 214 | | 214 | | | — | | — | | | 130 | | 130 | | | 896 | | 896 | | | 214 | | 214 | | | 1,240 | | 1,240 | | | (122) | | (122) | | | 01/30/20 | | 01/30/20 | | 2019 | | 45 years |
| Retail Property in Sioux City, IA | Retail Property in Sioux City, IA | | 933 | | | 220 | | | 876 | | | 222 | | | 0 | | | 220 | | | 876 | | | 222 | | | 1,318 | | | (29) | | | 01/30/20 | | 2019 | | 45 years | Retail Property in Sioux City, IA | | 919 | | | 220 | | 220 | | | 876 | | 876 | | | 222 | | 222 | | | — | | — | | | 220 | | 220 | | | 876 | | 876 | | | 222 | | 222 | | | 1,318 | | 1,318 | | | (125) | | (125) | | | 01/30/20 | | 01/30/20 | | 2019 | | 45 years |
| Retail Property in Wardsville, MO | Retail Property in Wardsville, MO | | 984 | | | 257 | | | 919 | | | 202 | | | 0 | | | 257 | | | 919 | | | 202 | | | 1,378 | | | (36) | | | 11/22/19 | | 2019 | | 40 years | Retail Property in Wardsville, MO | | 981 | | | 257 | | 257 | | | 919 | | 919 | | | 202 | | 202 | | | — | | — | | | 257 | | 257 | | | 919 | | 919 | | | 202 | | 202 | | | 1,378 | | 1,378 | | | (135) | | (135) | | | 11/22/19 | | 11/22/19 | | 2019 | | 40 years |
| Retail Property in Kincheloe, MI | Retail Property in Kincheloe, MI | | 892 | | | 58 | | | 939 | | | 229 | | | 0 | | | 58 | | | 939 | | | 229 | | | 1,226 | | | (36) | | | 11/22/19 | | 2019 | | 45 years | Retail Property in Kincheloe, MI | | 886 | | | 58 | | 58 | | | 939 | | 939 | | | 229 | | 229 | | | — | | — | | | 58 | | 58 | | | 939 | | 939 | | | 229 | | 229 | | | 1,226 | | 1,226 | | | (134) | | (134) | | | 11/22/19 | | 11/22/19 | | 2019 | | 45 years |
| Retail Property in Clinton, IN | Retail Property in Clinton, IN | | 1,041 | | | 269 | | | 954 | | | 204 | | | 0 | | | 269 | | | 954 | | | 204 | | | 1,427 | | | (35) | | | 11/22/19 | | 2019 | | 44 years | Retail Property in Clinton, IN | | 1,037 | | | 269 | | 269 | | | 954 | | 954 | | | 204 | | 204 | | | — | | — | | | 269 | | 269 | | | 954 | | 954 | | | 204 | | 204 | | | 1,427 | | 1,427 | | | (128) | | (128) | | | 11/22/19 | | 11/22/19 | | 2019 | | 44 years |
| Retail Property in Saginaw, MI | Retail Property in Saginaw, MI | | 956 | | | 96 | | | 1,014 | | | 210 | | | 0 | | | 96 | | | 1,014 | | | 210 | | | 1,320 | | | (44) | | | 10/04/19 | | 2019 | | 45 years | Retail Property in Saginaw, MI | | 952 | | | 96 | | 96 | | | 1,014 | | 1,014 | | | 210 | | 210 | | | — | | — | | | 96 | | 96 | | | 1,014 | | 1,014 | | | 210 | | 210 | | | 1,320 | | 1,320 | | | (151) | | (151) | | | 10/04/19 | | 10/04/19 | | 2019 | | 45 years |
| Retail Property in Rolla, MO | Retail Property in Rolla, MO | | 944 | | | 110 | | | 1,011 | | | 188 | | | 0 | | | 110 | | | 1,011 | | | 188 | | | 1,309 | | | (44) | | | 10/04/19 | | 2019 | | 40 years | Retail Property in Rolla, MO | | 937 | | | 110 | | 110 | | | 1,011 | | 1,011 | | | 188 | | 188 | | | — | | — | | | 110 | | 110 | | | 1,011 | | 1,011 | | | 188 | | 188 | | | 1,309 | | 1,309 | | | (152) | | (152) | | | 10/04/19 | | 10/04/19 | | 2019 | | 40 years |
| Retail Property in Sullivan, IL | Retail Property in Sullivan, IL | | 1,178 | | | 340 | | | 981 | | | 257 | | | 0 | | | 340 | | | 981 | | | 257 | | | 1,578 | | | (41) | | | 09/13/19 | | 2019 | | 50 years | Retail Property in Sullivan, IL | | 1,175 | | | 340 | | 340 | | | 981 | | 981 | | | 257 | | 257 | | | — | | — | | | 340 | | 340 | | | 981 | | 981 | | | 257 | | 257 | | | 1,578 | | 1,578 | | | (136) | | (136) | | | 09/13/19 | | 09/13/19 | | 2019 | | 50 years |
| Retail Property in Becker, MN | Retail Property in Becker, MN | | 942 | | | 136 | | | 922 | | | 188 | | | 0 | | | 136 | | | 922 | | | 188 | | | 1,246 | | | (38) | | | 09/13/19 | | 2019 | | 55 years | Retail Property in Becker, MN | | 936 | | | 136 | | 136 | | | 922 | | 922 | | | 188 | | 188 | | | — | | — | | | 136 | | 136 | | | 922 | | 922 | | | 188 | | 188 | | | 1,246 | | 1,246 | | | (124) | | (124) | | | 09/13/19 | | 09/13/19 | | 2019 | | 55 years |
| Retail Property in Adrian, MO | Retail Property in Adrian, MO | | 861 | | | 136 | | | 884 | | | 191 | | | 0 | | | 136 | | | 884 | | | 191 | | | 1,211 | | | (39) | | | 09/13/19 | | 2019 | | 45 years | Retail Property in Adrian, MO | | 858 | | | 136 | | 136 | | | 884 | | 884 | | | 191 | | 191 | | | — | | — | | | 136 | | 136 | | | 884 | | 884 | | | 191 | | 191 | | | 1,211 | | 1,211 | | | (130) | | (130) | | | 09/13/19 | | 09/13/19 | | 2019 | | 45 years |
| Retail Property in Chillicothe, IL | Retail Property in Chillicothe, IL | | 1,027 | | | 227 | | | 1,047 | | | 245 | | | 0 | | | 227 | | | 1,047 | | | 245 | | | 1,519 | | | (46) | | | 09/05/19 | | 2019 | | 50 years | Retail Property in Chillicothe, IL | | 1,025 | | | 227 | | 227 | | | 1,047 | | 1,047 | | | 245 | | 245 | | | — | | — | | | 227 | | 227 | | | 1,047 | | 1,047 | | | 245 | | 245 | | | 1,519 | | 1,519 | | | (149) | | (149) | | | 09/05/19 | | 09/05/19 | | 2019 | | 50 years |
| Retail Property in Poseyville, IN | Retail Property in Poseyville, IN | | 871 | | | 160 | | | 947 | | | 194 | | | 0 | | | 160 | | | 947 | | | 194 | | | 1,301 | | | (43) | | | 08/13/19 | | 2019 | | 44 years | Retail Property in Poseyville, IN | | 868 | | | 160 | | 160 | | | 947 | | 947 | | | 194 | | 194 | | | — | | — | | | 160 | | 160 | | | 947 | | 947 | | | 194 | | 194 | | | 1,301 | | 1,301 | | | (138) | | (138) | | | 08/13/19 | | 08/13/19 | | 2019 | | 44 years |
| Retail Property in Dexter, MO | Retail Property in Dexter, MO | | 880 | | | 141 | | | 890 | | | 177 | | | 0 | | | 141 | | | 890 | | | 177 | | | 1,208 | | | (45) | | | 07/09/19 | | 2019 | | 40 years | Retail Property in Dexter, MO | | 874 | | | 141 | | 141 | | | 890 | | 890 | | | 177 | | 177 | | | — | | — | | | 141 | | 141 | | | 890 | | 890 | | | 177 | | 177 | | | 1,208 | | 1,208 | | | (135) | | (135) | | | 07/09/19 | | 07/09/19 | | 2019 | | 40 years |
| Retail Property in Hubbard Lake, MI | Retail Property in Hubbard Lake, MI | | 921 | | | 40 | | | 1,017 | | | 203 | | | 0 | | | 40 | | | 1,017 | | | 203 | | | 1,260 | | | (52) | | | 07/09/19 | | 2019 | | 40 years | Retail Property in Hubbard Lake, MI | | 914 | | | 40 | | 40 | | | 1,017 | | 1,017 | | | 203 | | 203 | | | — | | — | | | 40 | | 40 | | | 1,017 | | 1,017 | | | 203 | | 203 | | | 1,260 | | 1,260 | | | (157) | | (157) | | | 07/09/19 | | 07/09/19 | | 2019 | | 40 years |
| | | | | Initial Cost to Company | | | | | | Initial Cost to Company | | Costs Capitalized Subsequent to Acquisition | | Gross Amount at which Carried at Close of Period | | Accumulated Depreciation and Amortization | | Date Acquired | | Year Built | | Life on which Depreciation in Latest Statement of Income is Computed |
| Description | |
| | Initial Cost to Company | | Costs Capitalized Subsequent to Acquisition | | Gross Amount at which Carried at Close of Period | | Accumulated Depreciation and Amortization | | Date Acquired | | Year Built | | Life on which Depreciation in Latest Statement of Income is Computed |
| Description | | Encumbrances | | Land | | Building | | Intangibles | | Land | | Building | | Intangibles | | Total | |
| Retail Property in Fayette, MO | |
| | Retail Property in Fayette, MO | |
| | Retail Property in Fayette, MO | Retail Property in Fayette, MO | | 1,092 | | | 107 | | | 1,168 | | | 219 | | | 0 | | | 107 | | | 1,168 | | | 219 | | | 1,494 | | | (61) | | | 06/26/19 | | 2019 | | 40 years | | 1,085 | | | 107 | | 107 | | | 1,168 | | 1,168 | | | 219 | | 219 | | | — | | — | | | 107 | | 107 | | | 1,168 | | 1,168 | | | 219 | | 219 | | | 1,494 | | 1,494 | | | (179) | | (179) | | | 06/26/19 | | 06/26/19 | | 2019 | | 40 years |
| Retail Property in Centralia, IL | Retail Property in Centralia, IL | | 949 | | | 200 | | | 913 | | | 193 | | | 0 | | | 200 | | | 913 | | | 193 | | | 1,306 | | | (58) | | | 04/25/19 | | 2019 | | 40 years | Retail Property in Centralia, IL | | 943 | | | 200 | | 200 | | | 913 | | 913 | | | 193 | | 193 | | | — | | — | | | 200 | | 200 | | | 913 | | 913 | | | 193 | | 193 | | | 1,306 | | 1,306 | | | (159) | | (159) | | | 04/25/19 | | 04/25/19 | | 2019 | | 40 years |
| Retail Property in Trenton, MO | Retail Property in Trenton, MO | | 892 | | | 396 | | | 628 | | | 202 | | | 0 | | | 396 | | | 628 | | | 202 | | | 1,226 | | | (61) | | | 02/26/19 | | 2019 | | 30 years | Retail Property in Trenton, MO | | 886 | | | 396 | | 396 | | | 628 | | 628 | | | 202 | | 202 | | | — | | — | | | 396 | | 396 | | | 628 | | 628 | | | 202 | | 202 | | | 1,226 | | 1,226 | | | (160) | | (160) | | | 02/26/19 | | 02/26/19 | | 2019 | | 30 years |
| Retail Property in Houghton Lake, MI | Retail Property in Houghton Lake, MI | | 965 | | | 124 | | | 939 | | | 241 | | | 0 | | | 124 | | | 939 | | | 241 | | | 1,304 | | | (64) | | | 02/26/19 | | 2018 | | 40 years | Retail Property in Houghton Lake, MI | | 953 | | | 124 | | 124 | | | 939 | | 939 | | | 241 | | 241 | | | — | | — | | | 124 | | 124 | | | 939 | | 939 | | | 241 | | 241 | | | 1,304 | | 1,304 | | | (168) | | (168) | | | 02/26/19 | | 02/26/19 | | 2018 | | 40 years |
| Retail Property in Pelican Rapids, MN | Retail Property in Pelican Rapids, MN | | 917 | | | 78 | | | 1,016 | | | 169 | | | 0 | | | 78 | | | 1,016 | | | 169 | | | 1,263 | | | (90) | | | 12/26/18 | | 2018 | | 30 years | Retail Property in Pelican Rapids, MN | | 908 | | | 78 | | 78 | | | 1,016 | | 1,016 | | | 169 | | 169 | | | — | | — | | | 78 | | 78 | | | 1,016 | | 1,016 | | | 169 | | 169 | | | 1,263 | | 1,263 | | | (222) | | (222) | | | 12/26/18 | | 12/26/18 | | 2018 | | 30 years |
| Retail Property in Carthage, MO | Retail Property in Carthage, MO | | 845 | | | 225 | | | 766 | | | 176 | | | 0 | | | 225 | | | 766 | | | 176 | | | 1,167 | | | (58) | | | 12/26/18 | | 2018 | | 40 years | Retail Property in Carthage, MO | | 837 | | | 225 | | 225 | | | 766 | | 766 | | | 176 | | 176 | | | — | | — | | | 225 | | 225 | | | 766 | | 766 | | | 176 | | 176 | | | 1,167 | | 1,167 | | | (146) | | (146) | | | 12/26/18 | | 12/26/18 | | 2018 | | 40 years |
| Retail Property in Bolivar, MO | Retail Property in Bolivar, MO | | 894 | | | 186 | | | 876 | | | 182 | | | 0 | | | 186 | | | 876 | | | 182 | | | 1,244 | | | (65) | | | 12/26/18 | | 2018 | | 40 years | Retail Property in Bolivar, MO | | 886 | | | 186 | | 186 | | | 876 | | 876 | | | 182 | | 182 | | | — | | — | | | 186 | | 186 | | | 876 | | 876 | | | 182 | | 182 | | | 1,244 | | 1,244 | | | (161) | | (161) | | | 12/26/18 | | 12/26/18 | | 2018 | | 40 years |
| Retail Property in Pinconning, MI | Retail Property in Pinconning, MI | | 949 | | | 167 | | | 905 | | | 221 | | | 0 | | | 167 | | | 905 | | | 221 | | | 1,293 | | | (61) | | | 12/06/18 | | 2018 | | 45 years | Retail Property in Pinconning, MI | | 942 | | | 167 | | 167 | | | 905 | | 905 | | | 221 | | 221 | | | — | | — | | | 167 | | 167 | | | 905 | | 905 | | | 221 | | 221 | | | 1,293 | | 1,293 | | | (151) | | (151) | | | 12/06/18 | | 12/06/18 | | 2018 | | 45 years |
| Retail Property in New Hampton, IA | Retail Property in New Hampton, IA | | 1,014 | | | 177 | | | 1,111 | | | 187 | | | 0 | | | 177 | | | 1,111 | | | 187 | | | 1,475 | | | (92) | | | 11/30/18 | | 2018 | | 35 years | Retail Property in New Hampton, IA | | 1,007 | | | 177 | | 177 | | | 1,111 | | 1,111 | | | 187 | | 187 | | | — | | — | | | 177 | | 177 | | | 1,111 | | 1,111 | | | 187 | | 187 | | | 1,475 | | 1,475 | | | (225) | | (225) | | | 11/30/18 | | 11/30/18 | | 2018 | | 35 years |
| Retail Property in Ogden, IA | Retail Property in Ogden, IA | | 857 | | | 107 | | | 931 | | | 153 | | | 0 | | | 107 | | | 931 | | | 153 | | | 1,191 | | | (84) | | | 10/03/18 | | 2018 | | 35 years | Retail Property in Ogden, IA | | 856 | | | 107 | | 107 | | | 931 | | 931 | | | 153 | | 153 | | | — | | — | | | 107 | | 107 | | | 931 | | 931 | | | 153 | | 153 | | | 1,191 | | 1,191 | | | (197) | | (197) | | | 10/03/18 | | 10/03/18 | | 2018 | | 35 years |
| Retail Property in Wonder Lake, IL | Retail Property in Wonder Lake, IL | | 941 | | | 221 | | | 888 | | | 214 | | | 0 | | | 221 | | | 888 | | | 214 | | | 1,323 | | | (95) | | | 04/12/18 | | 2017 | | 39 years | Retail Property in Wonder Lake, IL | | 937 | | | 221 | | 221 | | | 888 | | 888 | | | 214 | | 214 | | | — | | — | | | 221 | | 221 | | | 888 | | 888 | | | 214 | | 214 | | | 1,323 | | 1,323 | | | (199) | | (199) | | | 04/12/18 | | 04/12/18 | | 2017 | | 39 years |
| Retail Property in Moscow Mills, MO | Retail Property in Moscow Mills, MO | | 990 | | | 161 | | | 945 | | | 203 | | | 0 | | | 161 | | | 945 | | | 203 | | | 1,309 | | | (92) | | | 04/12/18 | | 2018 | | 45 years | Retail Property in Moscow Mills, MO | | 986 | | | 161 | | 161 | | | 945 | | 945 | | | 203 | | 203 | | | — | | — | | | 161 | | 161 | | | 945 | | 945 | | | 203 | | 203 | | | 1,309 | | 1,309 | | | (193) | | (193) | | | 04/12/18 | | 04/12/18 | | 2018 | | 45 years |
| Retail Property in Foley, MN | Retail Property in Foley, MN | | 883 | | | 238 | | | 823 | | | 172 | | | 0 | | | 238 | | | 823 | | | 172 | | | 1,233 | | | (96) | | | 04/12/18 | | 2018 | | 35 years | Retail Property in Foley, MN | | 883 | | | 238 | | 238 | | | 823 | | 823 | | | 172 | | 172 | | | — | | — | | | 238 | | 238 | | | 823 | | 823 | | | 172 | | 172 | | | 1,233 | | 1,233 | | | (203) | | (203) | | | 04/12/18 | | 04/12/18 | | 2018 | | 35 years |
| Retail Property in Kirbyville, MO | Retail Property in Kirbyville, MO | | 870 | | | 98 | | | 965 | | | 155 | | | 0 | | | 98 | | | 965 | | | 155 | | | 1,218 | | | (92) | | | 04/02/18 | | 2018 | | 40 years | Retail Property in Kirbyville, MO | | 869 | | | 98 | | 98 | | | 965 | | 965 | | | 155 | | 155 | | | — | | — | | | 98 | | 98 | | | 965 | | 965 | | | 155 | | 155 | | | 1,218 | | 1,218 | | | (193) | | (193) | | | 04/02/18 | | 04/02/18 | | 2018 | | 40 years |
| Retail Property in Gladwin, MI | Retail Property in Gladwin, MI | | 883 | | | 88 | | | 951 | | | 203 | | | 0 | | | 88 | | | 951 | | | 203 | | | 1,242 | | | (87) | | | 04/02/18 | | 2017 | | 45 years | Retail Property in Gladwin, MI | | 883 | | | 88 | | 88 | | | 951 | | 951 | | | 203 | | 203 | | | — | | — | | | 88 | | 88 | | | 951 | | 951 | | | 203 | | 203 | | | 1,242 | | 1,242 | | | (181) | | (181) | | | 04/02/18 | | 04/02/18 | | 2017 | | 45 years |
| Retail Property in Rockford, MN | Retail Property in Rockford, MN | | 887 | | | 187 | | | 850 | | | 207 | | | 0 | | | 187 | | | 850 | | | 207 | | | 1,244 | | | (133) | | | 12/08/17 | | 2017 | | 30 years | Retail Property in Rockford, MN | | 891 | | | 187 | | 187 | | | 850 | | 850 | | | 207 | | 207 | | | — | | — | | | 187 | | 187 | | | 850 | | 850 | | | 207 | | 207 | | | 1,244 | | 1,244 | | | (262) | | (262) | | | 12/08/17 | | 12/08/17 | | 2017 | | 30 years |
| Retail Property in Winterset, IA | Retail Property in Winterset, IA | | 936 | | | 272 | | | 830 | | | 200 | | | 0 | | | 272 | | | 830 | | | 200 | | | 1,302 | | | (104) | | | 12/08/17 | | 2017 | | 35 years | Retail Property in Winterset, IA | | 940 | | | 272 | | 272 | | | 830 | | 830 | | | 200 | | 200 | | | — | | — | | | 272 | | 272 | | | 830 | | 830 | | | 200 | | 200 | | | 1,302 | | 1,302 | | | (207) | | (207) | | | 12/08/17 | | 12/08/17 | | 2017 | | 35 years |
| Retail Property in Kawkawlin, MI | Retail Property in Kawkawlin, MI | | 918 | | | 242 | | | 871 | | | 179 | | | 0 | | | 242 | | | 871 | | | 179 | | | 1,292 | | | (123) | | | 10/05/17 | | 2017 | | 30 years | Retail Property in Kawkawlin, MI | | 922 | | | 242 | | 242 | | | 871 | | 871 | | | 179 | | 179 | | | — | | — | | | 242 | | 242 | | | 871 | | 871 | | | 179 | | 179 | | | 1,292 | | 1,292 | | | (238) | | (238) | | | 10/05/17 | | 10/05/17 | | 2017 | | 30 years |
| Retail Property in Aroma Park, IL | Retail Property in Aroma Park, IL | | 949 | | | 223 | | | 869 | | | 164 | | | 0 | | | 223 | | | 869 | | | 164 | | | 1,256 | | | (104) | | | 10/05/17 | | 2017 | | 35 years | Retail Property in Aroma Park, IL | | 947 | | | 223 | | 223 | | | 869 | | 869 | | | 164 | | 164 | | | — | | — | | | 223 | | 223 | | | 869 | | 869 | | | 164 | | 164 | | | 1,256 | | 1,256 | | | (201) | | (201) | | | 10/05/17 | | 10/05/17 | | 2017 | | 35 years |
| Retail Property in East Peoria, IL | Retail Property in East Peoria, IL | | 1,018 | | | 233 | | | 998 | | | 161 | | | 0 | | | 233 | | | 998 | | | 161 | | | 1,392 | | | (117) | | | 10/05/17 | | 2017 | | 40 years | Retail Property in East Peoria, IL | | 1,017 | | | 233 | | 233 | | | 998 | | 998 | | | 161 | | 161 | | | — | | — | | | 233 | | 233 | | | 998 | | 998 | | | 161 | | 161 | | | 1,392 | | 1,392 | | | (225) | | (225) | | | 10/05/17 | | 10/05/17 | | 2017 | | 40 years |
| Retail Property in Milford, IA | Retail Property in Milford, IA | | 986 | | | 254 | | | 883 | | | 217 | | | 0 | | | 254 | | | 883 | | | 217 | | | 1,354 | | | (111) | | | 09/08/17 | | 2017 | | 40 years | Retail Property in Milford, IA | | 983 | | | 254 | | 254 | | | 883 | | 883 | | | 217 | | 217 | | | — | | — | | | 254 | | 254 | | | 883 | | 883 | | | 217 | | 217 | | | 1,354 | | 1,354 | | | (211) | | (211) | | | 09/08/17 | | 09/08/17 | | 2017 | | 40 years |
| | | | | Initial Cost to Company | | | | | | Initial Cost to Company | | Costs Capitalized Subsequent to Acquisition | | Gross Amount at which Carried at Close of Period | | Accumulated Depreciation and Amortization | | Date Acquired | | Year Built | | Life on which Depreciation in Latest Statement of Income is Computed |
| Description | |
| | Initial Cost to Company | | Costs Capitalized Subsequent to Acquisition | | Gross Amount at which Carried at Close of Period | | Accumulated Depreciation and Amortization | | Date Acquired | | Year Built | | Life on which Depreciation in Latest Statement of Income is Computed |
| Description | | Encumbrances | | Land | | Building | | Intangibles | | Land | | Building | | Intangibles | | Total | |
| Retail Property in Jefferson City, MO | |
| | Retail Property in Jefferson City, MO | |
| | Retail Property in Jefferson City, MO | Retail Property in Jefferson City, MO | | 946 | | | 164 | | | 966 | | | 205 | | | 0 | | | 164 | | | 966 | | | 205 | | | 1,335 | | | (123) | | | 06/02/17 | | 2016 | | 40 years | | 939 | | | 164 | | 164 | | | 966 | | 966 | | | 205 | | 205 | | | — | | — | | | 164 | | 164 | | | 966 | | 966 | | | 205 | | 205 | | | 1,335 | | 1,335 | | | (226) | | (226) | | | 06/02/17 | | 06/02/17 | | 2016 | | 40 years |
| Retail Property in Denver, IA | Retail Property in Denver, IA | | 900 | | | 198 | | | 840 | | | 191 | | | 0 | | | 198 | | | 840 | | | 191 | | | 1,229 | | | (120) | | | 05/31/17 | | 2017 | | 35 years | Retail Property in Denver, IA | | 893 | | | 198 | | 198 | | | 840 | | 840 | | | 191 | | 191 | | | — | | — | | | 198 | | 198 | | | 840 | | 840 | | | 191 | | 191 | | | 1,229 | | 1,229 | | | (220) | | (220) | | | 05/31/17 | | 05/31/17 | | 2017 | | 35 years |
| Retail Property in Port O'Connor, TX | Retail Property in Port O'Connor, TX | | 951 | | | 167 | | | 937 | | | 200 | | | 0 | | | 167 | | | 937 | | | 200 | | | 1,304 | | | (134) | | | 05/25/17 | | 2017 | | 35 years | Retail Property in Port O'Connor, TX | | 944 | | | 167 | | 167 | | | 937 | | 937 | | | 200 | | 200 | | | — | | — | | | 167 | | 167 | | | 937 | | 937 | | | 200 | | 200 | | | 1,304 | | 1,304 | | | (246) | | (246) | | | 05/25/17 | | 05/25/17 | | 2017 | | 35 years |
| Retail Property in Wabasha, MN | Retail Property in Wabasha, MN | | 967 | | | 237 | | | 912 | | | 214 | | | 0 | | | 237 | | | 912 | | | 214 | | | 1,363 | | | (143) | | | 05/25/17 | | 2016 | | 35 years | Retail Property in Wabasha, MN | | 959 | | | 237 | | 237 | | | 912 | | 912 | | | 214 | | 214 | | | — | | — | | | 237 | | 237 | | | 912 | | 912 | | | 214 | | 214 | | | 1,363 | | 1,363 | | | (262) | | (262) | | | 05/25/17 | | 05/25/17 | | 2016 | | 35 years |
| Office in Jacksonville, FL | Office in Jacksonville, FL | | 83,112 | | | 13,290 | | | 106,601 | | | 21,362 | | | 4,141 | | | 13,290 | | | 110,741 | | | 21,362 | | | 145,393 | | | (16,798) | | | 05/23/17 | | 1989 | | 36 years | Office in Jacksonville, FL | | 82,709 | | | 13,290 | | 13,290 | | | 106,601 | | 106,601 | | | 21,362 | | 21,362 | | | 8,788 | | 8,788 | | | 13,290 | | 13,290 | | | 115,389 | | 115,389 | | | 21,362 | | 21,362 | | | 150,041 | | 150,041 | | | (32,151) | | (32,151) | | | 05/23/17 | | 05/23/17 | | 1989 | | 36 years |
| Retail Property in Shelbyville, IL | Retail Property in Shelbyville, IL | | 865 | | | 189 | | | 849 | | | 199 | | | 0 | | | 189 | | | 849 | | | 199 | | | 1,237 | | | (116) | | | 05/23/17 | | 2016 | | 40 years | Retail Property in Shelbyville, IL | | 858 | | | 189 | | 189 | | | 849 | | 849 | | | 199 | | 199 | | | — | | — | | | 189 | | 189 | | | 849 | | 849 | | | 199 | | 199 | | | 1,237 | | 1,237 | | | (212) | | (212) | | | 05/23/17 | | 05/23/17 | | 2016 | | 40 years |
| Retail Property in Jesup, IA | Retail Property in Jesup, IA | | 886 | | | 119 | | | 890 | | | 191 | | | 0 | | | 119 | | | 890 | | | 191 | | | 1,200 | | | (127) | | | 05/05/17 | | 2017 | | 35 years | Retail Property in Jesup, IA | | 879 | | | 119 | | 119 | | | 890 | | 890 | | | 191 | | 191 | | | — | | — | | | 119 | | 119 | | | 890 | | 890 | | | 191 | | 191 | | | 1,200 | | 1,200 | | | (231) | | (231) | | | 05/05/17 | | 05/05/17 | | 2017 | | 35 years |
| Retail Property in Hanna City, IL | Retail Property in Hanna City, IL | | 867 | | | 174 | | | 925 | | | 132 | | | 0 | | | 174 | | | 925 | | | 132 | | | 1,231 | | | (127) | | | 04/11/17 | | 2016 | | 39 years | Retail Property in Hanna City, IL | | 860 | | | 174 | | 174 | | | 925 | | 925 | | | 132 | | 132 | | | — | | — | | | 174 | | 174 | | | 925 | | 925 | | | 132 | | 132 | | | 1,231 | | 1,231 | | | (229) | | (229) | | | 04/11/17 | | 04/11/17 | | 2016 | | 39 years |
| Retail Property in Ridgedale, MO | Retail Property in Ridgedale, MO | | 994 | | | 250 | | | 928 | | | 187 | | | 0 | | | 250 | | | 928 | | | 187 | | | 1,365 | | | (129) | | | 03/09/17 | | 2016 | | 40 years | Retail Property in Ridgedale, MO | | 986 | | | 250 | | 250 | | | 928 | | 928 | | | 187 | | 187 | | | — | | — | | | 250 | | 250 | | | 928 | | 928 | | | 187 | | 187 | | | 1,365 | | 1,365 | | | (231) | | (231) | | | 03/09/17 | | 03/09/17 | | 2016 | | 40 years |
| Retail Property in Peoria, IL | Retail Property in Peoria, IL | | 906 | | | 209 | | | 933 | | | 133 | | | 0 | | | 209 | | | 933 | | | 133 | | | 1,275 | | | (138) | | | 02/06/17 | | 2016 | | 35 years | Retail Property in Peoria, IL | | 898 | | | 209 | | 209 | | | 933 | | 933 | | | 133 | | 133 | | | — | | — | | | 209 | | 209 | | | 933 | | 933 | | | 133 | | 133 | | | 1,275 | | 1,275 | | | (244) | | (244) | | | 02/06/17 | | 02/06/17 | | 2016 | | 35 years |
| Retail Property in Carmi, IL | Retail Property in Carmi, IL | | 1,102 | | | 286 | | | 916 | | | 239 | | | 0 | | | 286 | | | 916 | | | 239 | | | 1,441 | | | (132) | | | 02/03/17 | | 2016 | | 40 years | Retail Property in Carmi, IL | | 1,093 | | | 286 | | 286 | | | 916 | | 916 | | | 239 | | 239 | | | — | | — | | | 286 | | 286 | | | 916 | | 916 | | | 239 | | 239 | | | 1,441 | | 1,441 | | | (234) | | (234) | | | 02/03/17 | | 02/03/17 | | 2016 | | 40 years |
| Retail Property in Springfield, IL | Retail Property in Springfield, IL | | 1,003 | | | 391 | | | 784 | | | 227 | | | 0 | | | 393 | | | 789 | | | 224 | | | 1,406 | | | (123) | | | 11/16/16 | | 2016 | | 40 years | Retail Property in Springfield, IL | | 995 | | | 391 | | 391 | | | 784 | | 784 | | | 227 | | 227 | | | — | | — | | | 393 | | 393 | | | 789 | | 789 | | | 224 | | 224 | | | 1,406 | | 1,406 | | | (213) | | (213) | | | 11/16/16 | | 11/16/16 | | 2016 | | 40 years |
| Retail Property in Fayetteville, NC | Retail Property in Fayetteville, NC | | 4,892 | | | 1,379 | | | 3,121 | | | 2,472 | | | 0 | | | 1,379 | | | 3,121 | | | 2,471 | | | 6,971 | | | (983) | | | 11/15/16 | | 2008 | | 37 years | Retail Property in Fayetteville, NC | | 4,851 | | | 1,379 | | 1,379 | | | 3,121 | | 3,121 | | | 2,472 | | 2,472 | | | — | | — | | | 1,379 | | 1,379 | | | 3,121 | | 3,121 | | | 2,471 | | 2,471 | | | 6,971 | | 6,971 | | | (1,697) | | (1,697) | | | 11/15/16 | | 11/15/16 | | 2008 | | 37 years |
| Retail Property in Dryden Township, MI | Retail Property in Dryden Township, MI | | 913 | | | 178 | | | 893 | | | 201 | | | 0 | | | 178 | | | 899 | | | 202 | | | 1,279 | | | (133) | | | 10/26/16 | | 2016 | | 40 years | Retail Property in Dryden Township, MI | | 905 | | | 178 | | 178 | | | 893 | | 893 | | | 201 | | 201 | | | — | | — | | | 178 | | 178 | | | 899 | | 899 | | | 202 | | 202 | | | 1,279 | | 1,279 | | | (229) | | (229) | | | 10/26/16 | | 10/26/16 | | 2016 | | 40 years |
| Retail Property in Lamar, MO | Retail Property in Lamar, MO | | 903 | | | 164 | | | 903 | | | 171 | | | 0 | | | 164 | | | 903 | | | 171 | | | 1,238 | | | (140) | | | 07/22/16 | | 2016 | | 40 years | Retail Property in Lamar, MO | | 895 | | | 164 | | 164 | | | 903 | | 903 | | | 171 | | 171 | | | — | | — | | | 164 | | 164 | | | 903 | | 903 | | | 171 | | 171 | | | 1,238 | | 1,238 | | | (234) | | (234) | | | 07/22/16 | | 07/22/16 | | 2016 | | 40 years |
| Retail Property in Union, MO | Retail Property in Union, MO | | 946 | | | 267 | | | 867 | | | 207 | | | 0 | | | 267 | | | 867 | | | 207 | | | 1,341 | | | (150) | | | 07/01/16 | | 2016 | | 40 years | Retail Property in Union, MO | | 939 | | | 267 | | 267 | | | 867 | | 867 | | | 207 | | 207 | | | — | | — | | | 267 | | 267 | | | 867 | | 867 | | | 207 | | 207 | | | 1,341 | | 1,341 | | | (250) | | (250) | | | 07/01/16 | | 07/01/16 | | 2016 | | 40 years |
| Retail Property in Pawnee, IL | Retail Property in Pawnee, IL | | 946 | | | 249 | | | 775 | | | 206 | | | 0 | | | 249 | | | 775 | | | 206 | | | 1,230 | | | (137) | | | 07/01/16 | | 2016 | | 40 years | Retail Property in Pawnee, IL | | 939 | | | 249 | | 249 | | | 775 | | 775 | | | 206 | | 206 | | | — | | — | | | 249 | | 249 | | | 775 | | 775 | | | 206 | | 206 | | | 1,230 | | 1,230 | | | (227) | | (227) | | | 07/01/16 | | 07/01/16 | | 2016 | | 40 years |
| Retail Property in Linn, MO | Retail Property in Linn, MO | | 861 | | | 89 | | | 920 | | | 183 | | | 0 | | | 89 | | | 920 | | | 183 | | | 1,192 | | | (146) | | | 06/30/16 | | 2016 | | 40 years | Retail Property in Linn, MO | | 854 | | | 89 | | 89 | | | 920 | | 920 | | | 183 | | 183 | | | — | | — | | | 89 | | 89 | | | 920 | | 920 | | | 183 | | 183 | | | 1,192 | | 1,192 | | | (243) | | (243) | | | 06/30/16 | | 06/30/16 | | 2016 | | 40 years |
| Retail Property in Cape Girardeau, MO | Retail Property in Cape Girardeau, MO | | 1,027 | | | 453 | | | 702 | | | 217 | | | 0 | | | 453 | | | 702 | | | 217 | | | 1,372 | | | (128) | | | 06/30/16 | | 2016 | | 40 years | Retail Property in Cape Girardeau, MO | | 1,035 | | | 453 | | 453 | | | 702 | | 702 | | | 217 | | 217 | | | — | | — | | | 453 | | 453 | | | 702 | | 702 | | | 217 | | 217 | | | 1,372 | | 1,372 | | | (213) | | (213) | | | 06/30/16 | | 06/30/16 | | 2016 | | 40 years |
| Retail Property in Decatur-Pershing, IL | Retail Property in Decatur-Pershing, IL | | 1,052 | | | 395 | | | 924 | | | 155 | | | 0 | | | 395 | | | 924 | | | 155 | | | 1,474 | | | (146) | | | 06/30/16 | | 2016 | | 40 years | Retail Property in Decatur-Pershing, IL | | 1,044 | | | 395 | | 395 | | | 924 | | 924 | | | 155 | | 155 | | | — | | — | | | 395 | | 395 | | | 924 | | 924 | | | 155 | | 155 | | | 1,474 | | 1,474 | | | (243) | | (243) | | | 06/30/16 | | 06/30/16 | | 2016 | | 40 years |
| Retail Property in Rantoul, IL | | Retail Property in Rantoul, IL | | 917 | | | 100 | | | 1,023 | | | 178 | | | — | | | 100 | | | 1,023 | | | 178 | | | 1,301 | | | (252) | | | 06/21/16 | | 2016 | | 40 years |
| | Initial Cost to Company | | Costs Capitalized Subsequent to Acquisition | | Gross Amount at which Carried at Close of Period | | Accumulated Depreciation and Amortization | | Date Acquired | | Year Built | | Life on which Depreciation in Latest Statement of Income is Computed |
| | | | Initial Cost to Company | | | | | | Initial Cost to Company | | Costs Capitalized Subsequent to Acquisition | | Gross Amount at which Carried at Close of Period | | Accumulated Depreciation and Amortization | | Date Acquired | | Year Built | | Life on which Depreciation in Latest Statement of Income is Computed |
| Description | Description | | Encumbrances | | Land | | Building | | Intangibles | | Costs Capitalized Subsequent to Acquisition | | Land | | Building | | Intangibles | | Total | | Accumulated Depreciation and Amortization | | Date Acquired | | Year Built | | Life on which Depreciation in Latest Statement of Income is Computed |
| | Retail Property in Rantoul, IL | | 925 | | | 100 | | | 1,023 | | | 178 | | | 0 | | | 100 | | | 1,023 | | | 178 | | | 1,301 | | | (152) | | | 06/21/16 | | 2016 | | 40 years |
| Retail Property in Flora Vista, NM | |
| | Retail Property in Flora Vista, NM | |
| | Retail Property in Flora Vista, NM | Retail Property in Flora Vista, NM | | 1,002 | | | 272 | | | 864 | | | 198 | | | 0 | | | 272 | | | 864 | | | 198 | | | 1,334 | | | (180) | | | 06/06/16 | | 2016 | | 35 years | | 994 | | | 272 | | 272 | | | 864 | | 864 | | | 198 | | 198 | | | — | | — | | | 272 | | 272 | | | 864 | | 864 | | | 198 | | 198 | | | 1,334 | | 1,334 | | | (299) | | (299) | | | 06/06/16 | | 06/06/16 | | 2016 | | 35 years |
| Retail Property in Mountain Grove, MO | Retail Property in Mountain Grove, MO | | 982 | | | 163 | | | 1,026 | | | 212 | | | 0 | | | 163 | | | 1,026 | | | 212 | | | 1,401 | | | (168) | | | 06/03/16 | | 2016 | | 40 years | Retail Property in Mountain Grove, MO | | 974 | | | 163 | | 163 | | | 1,026 | | 1,026 | | | 212 | | 212 | | | — | | — | | | 163 | | 163 | | | 1,026 | | 1,026 | | | 212 | | 212 | | | 1,401 | | 1,401 | | | (279) | | (279) | | | 06/03/16 | | 06/03/16 | | 2016 | | 40 years |
| Retail Property in Decatur-Sunnyside, IL | Retail Property in Decatur-Sunnyside, IL | | 951 | | | 182 | | | 954 | | | 139 | | | 0 | | | 182 | | | 954 | | | 139 | | | 1,275 | | | (150) | | | 06/03/16 | | 2016 | | 40 years | Retail Property in Decatur-Sunnyside, IL | | 956 | | | 182 | | 182 | | | 954 | | 954 | | | 139 | | 139 | | | — | | — | | | 182 | | 182 | | | 954 | | 954 | | | 139 | | 139 | | | 1,275 | | 1,275 | | | (248) | | (248) | | | 06/03/16 | | 06/03/16 | | 2016 | | 40 years |
| Retail Property in Champaign, IL | Retail Property in Champaign, IL | | 1,017 | | | 365 | | | 915 | | | 149 | | | 0 | | | 365 | | | 915 | | | 149 | | | 1,429 | | | (140) | | | 06/03/16 | | 2016 | | 40 years | Retail Property in Champaign, IL | | 1,009 | | | 365 | | 365 | | | 915 | | 915 | | | 149 | | 149 | | | — | | — | | | 365 | | 365 | | | 915 | | 915 | | | 149 | | 149 | | | 1,429 | | 1,429 | | | (231) | | (231) | | | 06/03/16 | | 06/03/16 | | 2016 | | 40 years |
| Retail Property in San Antonio, TX | Retail Property in San Antonio, TX | | 892 | | | 252 | | | 703 | | | 196 | | | 0 | | | 251 | | | 702 | | | 196 | | | 1,149 | | | (143) | | | 05/06/16 | | 2015 | | 35 years | Retail Property in San Antonio, TX | | 896 | | | 252 | | 252 | | | 703 | | 703 | | | 196 | | 196 | | | — | | — | | | 251 | | 251 | | | 702 | | 702 | | | 196 | | 196 | | | 1,149 | | 1,149 | | | (236) | | (236) | | | 05/06/16 | | 05/06/16 | | 2015 | | 35 years |
| Retail Property in Borger, TX | Retail Property in Borger, TX | | 788 | | | 68 | | | 800 | | | 181 | | | 0 | | | 68 | | | 800 | | | 181 | | | 1,049 | | | (143) | | | 05/06/16 | | 2016 | | 40 years | Retail Property in Borger, TX | | 792 | | | 68 | | 68 | | | 800 | | 800 | | | 181 | | 181 | | | — | | — | | | 68 | | 68 | | | 800 | | 800 | | | 181 | | 181 | | | 1,049 | | 1,049 | | | (235) | | (235) | | | 05/06/16 | | 05/06/16 | | 2016 | | 40 years |
| Retail Property in Dimmitt, TX | Retail Property in Dimmitt, TX | | 1,057 | | | 86 | | | 1,077 | | | 236 | | | 0 | | | 85 | | | 1,074 | | | 236 | | | 1,395 | | | (185) | | | 04/26/16 | | 2016 | | 40 years | Retail Property in Dimmitt, TX | | 1,066 | | | 86 | | 86 | | | 1,077 | | 1,077 | | | 236 | | 236 | | | — | | — | | | 85 | | 85 | | | 1,074 | | 1,074 | | | 236 | | 236 | | | 1,395 | | 1,395 | | | (303) | | (303) | | | 04/26/16 | | 04/26/16 | | 2016 | | 40 years |
| Retail Property in St. Charles, MN | Retail Property in St. Charles, MN | | 966 | | | 200 | | | 843 | | | 226 | | | 0 | | | 200 | | | 843 | | | 226 | | | 1,269 | | | (183) | | | 04/26/16 | | 2016 | | 30 years | Retail Property in St. Charles, MN | | 971 | | | 200 | | 200 | | | 843 | | 843 | | | 226 | | 226 | | | — | | — | | | 200 | | 200 | | | 843 | | 843 | | | 226 | | 226 | | | 1,269 | | 1,269 | | | (301) | | (301) | | | 04/26/16 | | 04/26/16 | | 2016 | | 30 years |
| Retail Property in Philo, IL | Retail Property in Philo, IL | | 929 | | | 160 | | | 889 | | | 189 | | | 0 | | | 160 | | | 889 | | | 189 | | | 1,238 | | | (141) | | | 04/26/16 | | 2016 | | 40 years | Retail Property in Philo, IL | | 934 | | | 160 | | 160 | | | 889 | | 889 | | | 189 | | 189 | | | — | | — | | | 160 | | 160 | | | 889 | | 889 | | | 189 | | 189 | | | 1,238 | | 1,238 | | | (231) | | (231) | | | 04/26/16 | | 04/26/16 | | 2016 | | 40 years |
| Retail Property in Radford, VA | Retail Property in Radford, VA | | 1,131 | | | 411 | | | 896 | | | 256 | | | 0 | | | 411 | | | 896 | | | 256 | | | 1,563 | | | (209) | | | 12/23/15 | | 2015 | | 40 years | Retail Property in Radford, VA | | 1,124 | | | 411 | | 411 | | | 896 | | 896 | | | 256 | | 256 | | | — | | — | | | 411 | | 411 | | | 896 | | 896 | | | 256 | | 256 | | | 1,563 | | 1,563 | | | (334) | | (334) | | | 12/23/15 | | 12/23/15 | | 2015 | | 40 years |
| Retail Property in Rural Retreat, VA | Retail Property in Rural Retreat, VA | | 1,028 | | | 328 | | | 811 | | | 260 | | | 0 | | | 328 | | | 811 | | | 260 | | | 1,399 | | | (182) | | | 12/23/15 | | 2015 | | 40 years | Retail Property in Rural Retreat, VA | | 1,012 | | | 328 | | 328 | | | 811 | | 811 | | | 260 | | 260 | | | — | | — | | | 328 | | 328 | | | 811 | | 811 | | | 260 | | 260 | | | 1,399 | | 1,399 | | | (290) | | (290) | | | 12/23/15 | | 12/23/15 | | 2015 | | 40 years |
| Retail Property in Albion, PA | Retail Property in Albion, PA | | 1,114 | | | 100 | | | 1,033 | | | 392 | | | 0 | | | 100 | | | 1,033 | | | 392 | | | 1,525 | | | (307) | | | 12/23/15 | | 2015 | | 50 years | Retail Property in Albion, PA | | 1,097 | | | 100 | | 100 | | | 1,033 | | 1,033 | | | 392 | | 392 | | | — | | — | | | 100 | | 100 | | | 1,033 | | 1,033 | | | 392 | | 392 | | | 1,525 | | 1,525 | | | (491) | | (491) | | | 12/23/15 | | 12/23/15 | | 2015 | | 50 years |
| Retail Property in Mount Vernon, AL | Retail Property in Mount Vernon, AL | | 935 | | | 187 | | | 876 | | | 174 | | | 0 | | | 187 | | | 876 | | | 174 | | | 1,237 | | | (176) | | | 12/23/15 | | 2015 | | 44 years | Retail Property in Mount Vernon, AL | | 920 | | | 187 | | 187 | | | 876 | | 876 | | | 174 | | 174 | | | — | | — | | | 187 | | 187 | | | 876 | | 876 | | | 174 | | 174 | | | 1,237 | | 1,237 | | | (280) | | (280) | | | 12/23/15 | | 12/23/15 | | 2015 | | 44 years |
| Retail Property in Malone, NY | Retail Property in Malone, NY | | 1,081 | | | 183 | | | 1,154 | | | 137 | | | 0 | | | 183 | | | 1,154 | | | 137 | | | 1,474 | | | (203) | | | 12/16/15 | | 2015 | | 39 years | Retail Property in Malone, NY | | 1,075 | | | 183 | | 183 | | | 1,154 | | 1,154 | | | — | | — | | | 166 | | 166 | | | 183 | | 183 | | | 1,320 | | 1,320 | | | — | | — | | | 1,503 | | 1,503 | | | (313) | | (313) | | | 12/16/15 | | 12/16/15 | | 2015 | | 39 years |
| Retail Property in Mercedes, TX | Retail Property in Mercedes, TX | | 833 | | | 257 | | | 874 | | | 132 | | | 0 | | | 257 | | | 874 | | | 132 | | | 1,263 | | | (146) | | | 12/16/15 | | 2015 | | 45 years | Retail Property in Mercedes, TX | | 829 | | | 257 | | 257 | | | 874 | | 874 | | | 132 | | 132 | | | — | | — | | | 257 | | 257 | | | 874 | | 874 | | | 132 | | 132 | | | 1,263 | | 1,263 | | | (232) | | (232) | | | 12/16/15 | | 12/16/15 | | 2015 | | 45 years |
| Retail Property in Gordonville, MO | Retail Property in Gordonville, MO | | 771 | | | 247 | | | 787 | | | 173 | | | 0 | | | 247 | | | 787 | | | 173 | | | 1,207 | | | (148) | | | 11/10/15 | | 2015 | | 40 years | Retail Property in Gordonville, MO | | 769 | | | 247 | | 247 | | | 787 | | 787 | | | 173 | | 173 | | | — | | — | | | 247 | | 247 | | | 787 | | 787 | | | 173 | | 173 | | | 1,207 | | 1,207 | | | (235) | | (235) | | | 11/10/15 | | 11/10/15 | | 2015 | | 40 years |
| Retail Property in Rice, MN | Retail Property in Rice, MN | | 817 | | | 200 | | | 859 | | | 184 | | | 0 | | | 200 | | | 859 | | | 184 | | | 1,243 | | | (216) | | | 10/28/15 | | 2015 | | 30 years | Retail Property in Rice, MN | | 814 | | | 200 | | 200 | | | 859 | | 859 | | | 184 | | 184 | | | — | | — | | | 200 | | 200 | | | 859 | | 859 | | | 184 | | 184 | | | 1,243 | | 1,243 | | | (340) | | (340) | | | 10/28/15 | | 10/28/15 | | 2015 | | 30 years |
| Retail Property in Bixby, OK | Retail Property in Bixby, OK | | 7,955 | | | 2,609 | | | 7,776 | | | 1,765 | | | 0 | | | 2,609 | | | 7,776 | | | 1,765 | | | 12,150 | | | (1,503) | | | 10/27/15 | | 2012 | | 37 years | Retail Property in Bixby, OK | | 7,927 | | | 2,609 | | 2,609 | | | 7,776 | | 7,776 | | | 1,765 | | 1,765 | | | — | | — | | | 2,609 | | 2,609 | | | 7,776 | | 7,776 | | | 1,765 | | 1,765 | | | 12,150 | | 12,150 | | | (2,374) | | (2,374) | | | 10/27/15 | | 10/27/15 | | 2012 | | 37 years |
| Retail Property in Farmington, IL | Retail Property in Farmington, IL | | 896 | | | 96 | | | 1,161 | | | 150 | | | 0 | | | 96 | | | 1,161 | | | 150 | | | 1,407 | | | (192) | | | 10/23/15 | | 2015 | | 40 years | Retail Property in Farmington, IL | | 892 | | | 96 | | 96 | | | 1,161 | | 1,161 | | | 150 | | 150 | | | — | | — | | | 96 | | 96 | | | 1,161 | | 1,161 | | | 150 | | 150 | | | 1,407 | | 1,407 | | | (304) | | (304) | | | 10/23/15 | | 10/23/15 | | 2015 | | 40 years |
| Retail Property in Grove, OK | Retail Property in Grove, OK | | 3,626 | | | 402 | | | 4,364 | | | 817 | | | 0 | | | 402 | | | 4,364 | | | 817 | | | 5,583 | | | (886) | | | 10/20/15 | | 2012 | | 37 years | Retail Property in Grove, OK | | 3,613 | | | 402 | | 402 | | | 4,364 | | 4,364 | | | 817 | | 817 | | | — | | — | | | 402 | | 402 | | | 4,364 | | 4,364 | | | 817 | | 817 | | | 5,583 | | 5,583 | | | (1,397) | | (1,397) | | | 10/20/15 | | 10/20/15 | | 2012 | | 37 years |
| Retail Property in Jenks, OK | | Retail Property in Jenks, OK | | 8,770 | | | 2,617 | | | 8,694 | | | 2,107 | | | — | | | 2,617 | | | 8,694 | | | 2,107 | | | 13,418 | | | (2,812) | | | 10/19/15 | | 2009 | | 38 years |
| | Initial Cost to Company | | Costs Capitalized Subsequent to Acquisition | | Gross Amount at which Carried at Close of Period | | Accumulated Depreciation and Amortization | | Date Acquired | | Year Built | | Life on which Depreciation in Latest Statement of Income is Computed |
| | | | Initial Cost to Company | | | | | | Initial Cost to Company | | Costs Capitalized Subsequent to Acquisition | | Gross Amount at which Carried at Close of Period | | Accumulated Depreciation and Amortization | | Date Acquired | | Year Built | | Life on which Depreciation in Latest Statement of Income is Computed |
| Description | Description | | Encumbrances | | Land | | Building | | Intangibles | | Costs Capitalized Subsequent to Acquisition | | Land | | Building | | Intangibles | | Total | | Accumulated Depreciation and Amortization | | Date Acquired | | Year Built | | Life on which Depreciation in Latest Statement of Income is Computed |
| | Retail Property in Jenks, OK | | 8,802 | | | 2,617 | | | 8,694 | | | 2,107 | | | 0 | | | 2,617 | | | 8,694 | | | 2,107 | | | 13,418 | | | (1,783) | | | 10/19/15 | | 2009 | | 38 years |
| Retail Property in Bloomington, IL | |
| | Retail Property in Bloomington, IL | |
| | Retail Property in Bloomington, IL | Retail Property in Bloomington, IL | | 817 | | | 173 | | | 984 | | | 138 | | | 0 | | | 173 | | | 984 | | | 138 | | | 1,295 | | | (173) | | | 10/14/15 | | 2015 | | 40 years | | 814 | | | 173 | | 173 | | | 984 | | 984 | | | 138 | | 138 | | | — | | — | | | 173 | | 173 | | | 984 | | 984 | | | 138 | | 138 | | | 1,295 | | 1,295 | | | (272) | | (272) | | | 10/14/15 | | 10/14/15 | | 2015 | | 40 years |
| Retail Property in Montrose, MN | Retail Property in Montrose, MN | | 779 | | | 149 | | | 876 | | | 169 | | | 0 | | | 149 | | | 876 | | | 169 | | | 1,194 | | | (218) | | | 10/14/15 | | 2015 | | 30 years | Retail Property in Montrose, MN | | 772 | | | 149 | | 149 | | | 876 | | 876 | | | 169 | | 169 | | | — | | — | | | 149 | | 149 | | | 876 | | 876 | | | 169 | | 169 | | | 1,194 | | 1,194 | | | (343) | | (343) | | | 10/14/15 | | 10/14/15 | | 2015 | | 30 years |
| Retail Property in Lincoln County , MO | Retail Property in Lincoln County , MO | | 739 | | | 149 | | | 800 | | | 188 | | | 0 | | | 149 | | | 800 | | | 188 | | | 1,137 | | | (152) | | | 10/14/15 | | 2015 | | 40 years | Retail Property in Lincoln County , MO | | 736 | | | 149 | | 149 | | | 800 | | 800 | | | 188 | | 188 | | | — | | — | | | 149 | | 149 | | | 800 | | 800 | | | 188 | | 188 | | | 1,137 | | 1,137 | | | (240) | | (240) | | | 10/14/15 | | 10/14/15 | | 2015 | | 40 years |
| Retail Property in Wilmington, IL | Retail Property in Wilmington, IL | | 902 | | | 161 | | | 1,078 | | | 160 | | | 0 | | | 161 | | | 1,078 | | | 160 | | | 1,399 | | | (188) | | | 10/07/15 | | 2015 | | 40 years | Retail Property in Wilmington, IL | | 899 | | | 161 | | 161 | | | 1,078 | | 1,078 | | | 160 | | 160 | | | — | | — | | | 161 | | 161 | | | 1,078 | | 1,078 | | | 160 | | 160 | | | 1,399 | | 1,399 | | | (296) | | (296) | | | 10/07/15 | | 10/07/15 | | 2015 | | 40 years |
| Retail Property in Danville, IL | Retail Property in Danville, IL | | 739 | | | 158 | | | 870 | | | 132 | | | 0 | | | 158 | | | 870 | | | 132 | | | 1,160 | | | (144) | | | 10/07/15 | | 2015 | | 40 years | Retail Property in Danville, IL | | 736 | | | 158 | | 158 | | | 870 | | 870 | | | 132 | | 132 | | | — | | — | | | 158 | | 158 | | | 870 | | 870 | | | 132 | | 132 | | | 1,160 | | 1,160 | | | (226) | | (226) | | | 10/07/15 | | 10/07/15 | | 2015 | | 40 years |
| Retail Property in Moultrie, GA | Retail Property in Moultrie, GA | | 931 | | | 170 | | | 962 | | | 173 | | | 0 | | | 170 | | | 962 | | | 173 | | | 1,305 | | | (234) | | | 09/22/15 | | 2014 | | 44 years | Retail Property in Moultrie, GA | | 929 | | | 170 | | 170 | | | 962 | | 962 | | | 173 | | 173 | | | — | | — | | | 170 | | 170 | | | 962 | | 962 | | | 173 | | 173 | | | 1,305 | | 1,305 | | | (366) | | (366) | | | 09/22/15 | | 09/22/15 | | 2014 | | 44 years |
| Retail Property in Rose Hill, NC | Retail Property in Rose Hill, NC | | 1,001 | | | 245 | | | 972 | | | 203 | | | 0 | | | 245 | | | 972 | | | 203 | | | 1,420 | | | (226) | | | 09/22/15 | | 2014 | | 44 years | Retail Property in Rose Hill, NC | | 999 | | | 245 | | 245 | | | 972 | | 972 | | | 203 | | 203 | | | — | | — | | | 245 | | 245 | | | 972 | | 972 | | | 203 | | 203 | | | 1,420 | | 1,420 | | | (355) | | (355) | | | 09/22/15 | | 09/22/15 | | 2014 | | 44 years |
| Retail Property in Rockingham, NC | Retail Property in Rockingham, NC | | 822 | | | 73 | | | 922 | | | 163 | | | 0 | | | 73 | | | 922 | | | 163 | | | 1,158 | | | (202) | | | 09/22/15 | | 2014 | | 44 years | Retail Property in Rockingham, NC | | 820 | | | 73 | | 73 | | | 922 | | 922 | | | 163 | | 163 | | | — | | — | | | 73 | | 73 | | | 922 | | 922 | | | 163 | | 163 | | | 1,158 | | 1,158 | | | (317) | | (317) | | | 09/22/15 | | 09/22/15 | | 2014 | | 44 years |
| Retail Property in Biscoe, NC | Retail Property in Biscoe, NC | | 861 | | | 147 | | | 905 | | | 164 | | | 0 | | | 147 | | | 905 | | | 164 | | | 1,216 | | | (206) | | | 09/22/15 | | 2014 | | 44 years | Retail Property in Biscoe, NC | | 859 | | | 147 | | 147 | | | 905 | | 905 | | | 164 | | 164 | | | — | | — | | | 147 | | 147 | | | 905 | | 905 | | | 164 | | 164 | | | 1,216 | | 1,216 | | | (323) | | (323) | | | 09/22/15 | | 09/22/15 | | 2014 | | 44 years |
| Retail Property in De Soto, IA | Retail Property in De Soto, IA | | 705 | | | 139 | | | 796 | | | 176 | | | 0 | | | 139 | | | 796 | | | 176 | | | 1,111 | | | (164) | | | 09/08/15 | | 2015 | | 35 years | Retail Property in De Soto, IA | | 703 | | | 139 | | 139 | | | 796 | | 796 | | | 176 | | 176 | | | — | | — | | | 139 | | 139 | | | 796 | | 796 | | | 176 | | 176 | | | 1,111 | | 1,111 | | | (256) | | (256) | | | 09/08/15 | | 09/08/15 | | 2015 | | 35 years |
| Retail Property in Kerrville, TX | Retail Property in Kerrville, TX | | 768 | | | 186 | | | 849 | | | 200 | | | 0 | | | 186 | | | 849 | | | 200 | | | 1,235 | | | (204) | | | 08/28/15 | | 2015 | | 35 years | Retail Property in Kerrville, TX | | 767 | | | 186 | | 186 | | | 849 | | 849 | | | 200 | | 200 | | | — | | — | | | 186 | | 186 | | | 849 | | 849 | | | 200 | | 200 | | | 1,235 | | 1,235 | | | (319) | | (319) | | | 08/28/15 | | 08/28/15 | | 2015 | | 35 years |
| Retail Property in Floresville, TX | Retail Property in Floresville, TX | | 814 | | | 268 | | | 828 | | | 216 | | | 0 | | | 268 | | | 828 | | | 216 | | | 1,312 | | | (207) | | | 08/28/15 | | 2015 | | 35 years | Retail Property in Floresville, TX | | 814 | | | 268 | | 268 | | | 828 | | 828 | | | 216 | | 216 | | | — | | — | | | 268 | | 268 | | | 828 | | 828 | | | 216 | | 216 | | | 1,312 | | 1,312 | | | (323) | | (323) | | | 08/28/15 | | 08/28/15 | | 2015 | | 35 years |
| Retail Property in Minot, ND | Retail Property in Minot, ND | | 4,697 | | | 1,856 | | | 4,472 | | | 618 | | | 0 | | | 1,856 | | | 4,472 | | | 618 | | | 6,946 | | | (812) | | | 08/19/15 | | 2012 | | 38 years | Retail Property in Minot, ND | | 4,693 | | | 1,856 | | 1,856 | | | 4,472 | | 4,472 | | | 618 | | 618 | | | — | | — | | | 1,856 | | 1,856 | | | 4,472 | | 4,472 | | | 618 | | 618 | | | 6,946 | | 6,946 | | | (1,266) | | (1,266) | | | 08/19/15 | | 08/19/15 | | 2012 | | 38 years |
| Retail Property in Lebanon, MI | Retail Property in Lebanon, MI | | 820 | | | 359 | | | 724 | | | 178 | | | 0 | | | 359 | | | 724 | | | 178 | | | 1,261 | | | (145) | | | 08/14/15 | | 2015 | | 40 years | Retail Property in Lebanon, MI | | 819 | | | 359 | | 359 | | | 724 | | 724 | | | 178 | | 178 | | | — | | — | | | 359 | | 359 | | | 724 | | 724 | | | 178 | | 178 | | | 1,261 | | 1,261 | | | (226) | | (226) | | | 08/14/15 | | 08/14/15 | | 2015 | | 40 years |
| Retail Property in Effingham County, IL | Retail Property in Effingham County, IL | | 820 | | | 273 | | | 774 | | | 205 | | | 0 | | | 273 | | | 774 | | | 205 | | | 1,252 | | | (168) | | | 08/10/15 | | 2015 | | 40 years | Retail Property in Effingham County, IL | | 819 | | | 273 | | 273 | | | 774 | | 774 | | | 205 | | 205 | | | — | | — | | | 273 | | 273 | | | 774 | | 774 | | | 205 | | 205 | | | 1,252 | | 1,252 | | | (262) | | (262) | | | 08/10/15 | | 08/10/15 | | 2015 | | 40 years |
| Retail Property in Ponce, Puerto Rico | Retail Property in Ponce, Puerto Rico | | 6,520 | | | 1,365 | | | 6,662 | | | 1,318 | | | 0 | | | 1,365 | | | 6,662 | | | 1,318 | | | 9,345 | | | (1,234) | | | 08/03/15 | | 2012 | | 37 years | Retail Property in Ponce, Puerto Rico | | 6,513 | | | 1,365 | | 1,365 | | | 6,662 | | 6,662 | | | 1,318 | | 1,318 | | | — | | — | | | 1,365 | | 1,365 | | | 6,662 | | 6,662 | | | 1,318 | | 1,318 | | | 9,345 | | 9,345 | | | (1,919) | | (1,919) | | | 08/03/15 | | 08/03/15 | | 2012 | | 37 years |
| Retail Property in Tremont, IL | Retail Property in Tremont, IL | | 787 | | | 164 | | | 860 | | | 168 | | | 0 | | | 164 | | | 860 | | | 168 | | | 1,192 | | | (180) | | | 06/25/15 | | 2015 | | 35 years | Retail Property in Tremont, IL | | 782 | | | 164 | | 164 | | | 860 | | 860 | | | 168 | | 168 | | | — | | — | | | 164 | | 164 | | | 860 | | 860 | | | 168 | | 168 | | | 1,192 | | 1,192 | | | (278) | | (278) | | | 06/25/15 | | 06/25/15 | | 2015 | | 35 years |
| Retail Property in Pleasanton, TX | Retail Property in Pleasanton, TX | | 863 | | | 311 | | | 850 | | | 216 | | | 0 | | | 311 | | | 850 | | | 216 | | | 1,377 | | | (209) | | | 06/24/15 | | 2015 | | 35 years | Retail Property in Pleasanton, TX | | 858 | | | 311 | | 311 | | | 850 | | 850 | | | 216 | | 216 | | | — | | — | | | 311 | | 311 | | | 850 | | 850 | | | 216 | | 216 | | | 1,377 | | 1,377 | | | (323) | | (323) | | | 06/24/15 | | 06/24/15 | | 2015 | | 35 years |
| Retail Property in Peoria, IL | Retail Property in Peoria, IL | | 852 | | | 180 | | | 934 | | | 179 | | | 0 | | | 180 | | | 934 | | | 179 | | | 1,293 | | | (196) | | | 06/24/15 | | 2015 | | 35 years | Retail Property in Peoria, IL | | 847 | | | 180 | | 180 | | | 934 | | 934 | | | 179 | | 179 | | | — | | — | | | 180 | | 180 | | | 934 | | 934 | | | 179 | | 179 | | | 1,293 | | 1,293 | | | (303) | | (303) | | | 06/24/15 | | 06/24/15 | | 2015 | | 35 years |
| Retail Property in Bridgeport, IL | Retail Property in Bridgeport, IL | | 819 | | | 192 | | | 874 | | | 175 | | | 0 | | | 192 | | | 874 | | | 175 | | | 1,241 | | | (183) | | | 06/24/15 | | 2015 | | 35 years | Retail Property in Bridgeport, IL | | 815 | | | 192 | | 192 | | | 874 | | 874 | | | 175 | | 175 | | | — | | — | | | 192 | | 192 | | | 874 | | 874 | | | 175 | | 175 | | | 1,241 | | 1,241 | | | (282) | | (282) | | | 06/24/15 | | 06/24/15 | | 2015 | | 35 years |
| Retail Property in Warren, MN | | Retail Property in Warren, MN | | 696 | | | 108 | | | 825 | | | 157 | | | — | | | 108 | | | 825 | | | 157 | | | 1,090 | | | (323) | | | 06/24/15 | | 2015 | | 30 years |
| | Initial Cost to Company | | Costs Capitalized Subsequent to Acquisition | | Gross Amount at which Carried at Close of Period | | Accumulated Depreciation and Amortization | | Date Acquired | | Year Built | | Life on which Depreciation in Latest Statement of Income is Computed |
| | | | Initial Cost to Company | | | | | | Initial Cost to Company | | Costs Capitalized Subsequent to Acquisition | | Gross Amount at which Carried at Close of Period | | Accumulated Depreciation and Amortization | | Date Acquired | | Year Built | | Life on which Depreciation in Latest Statement of Income is Computed |
| Description | Description | | Encumbrances | | Land | | Building | | Intangibles | | Costs Capitalized Subsequent to Acquisition | | Land | | Building | | Intangibles | | Total | | Accumulated Depreciation and Amortization | | Date Acquired | | Year Built | | Life on which Depreciation in Latest Statement of Income is Computed |
| | Retail Property in Warren, MN | | 697 | | | 108 | | | 825 | | | 157 | | | 0 | | | 108 | | | 825 | | | 157 | | | 1,090 | | | (209) | | | 06/24/15 | | 2015 | | 30 years |
| Retail Property in Canyon Lake, TX | |
| | Retail Property in Canyon Lake, TX | |
| | Retail Property in Canyon Lake, TX | Retail Property in Canyon Lake, TX | | 905 | | | 291 | | | 932 | | | 220 | | | 0 | | | 291 | | | 932 | | | 220 | | | 1,443 | | | (218) | | | 06/18/15 | | 2015 | | 35 years | | 900 | | | 291 | | 291 | | | 932 | | 932 | | | 220 | | 220 | | | — | | — | | | 291 | | 291 | | | 932 | | 932 | | | 220 | | 220 | | | 1,443 | | 1,443 | | | (336) | | (336) | | | 06/18/15 | | 06/18/15 | | 2015 | | 35 years |
| Retail Property in Wheeler, TX | Retail Property in Wheeler, TX | | 714 | | | 53 | | | 887 | | | 188 | | | 0 | | | 53 | | | 887 | | | 188 | | | 1,128 | | | (207) | | | 06/18/15 | | 2015 | | 35 years | Retail Property in Wheeler, TX | | 711 | | | 53 | | 53 | | | 887 | | 887 | | | 188 | | 188 | | | — | | — | | | 53 | | 53 | | | 887 | | 887 | | | 188 | | 188 | | | 1,128 | | 1,128 | | | (319) | | (319) | | | 06/18/15 | | 06/18/15 | | 2015 | | 35 years |
| Retail Property in Aurora, MN | Retail Property in Aurora, MN | | 627 | | | 126 | | | 709 | | | 157 | | | 0 | | | 126 | | | 709 | | | 157 | | | 992 | | | (148) | | | 06/18/15 | | 2015 | | 40 years | Retail Property in Aurora, MN | | 624 | | | 126 | | 126 | | | 709 | | 709 | | | 157 | | 157 | | | — | | — | | | 126 | | 126 | | | 709 | | 709 | | | 157 | | 157 | | | 992 | | 992 | | | (229) | | (229) | | | 06/18/15 | | 06/18/15 | | 2015 | | 40 years |
| Retail Property in Red Oak, IA | Retail Property in Red Oak, IA | | 779 | | | 190 | | | 839 | | | 179 | | | 0 | | | 190 | | | 839 | | | 179 | | | 1,208 | | | (216) | | | 05/07/15 | | 2014 | | 35 years | Retail Property in Red Oak, IA | | 780 | | | 190 | | 190 | | | 839 | | 839 | | | 179 | | 179 | | | — | | — | | | 190 | | 190 | | | 839 | | 839 | | | 179 | | 179 | | | 1,208 | | 1,208 | | | (331) | | (331) | | | 05/07/15 | | 05/07/15 | | 2014 | | 35 years |
| Retail Property in Zapata, TX | Retail Property in Zapata, TX | | 747 | | | 62 | | | 998 | | | 145 | | | 0 | | | 62 | | | 998 | | | 145 | | | 1,205 | | | (269) | | | 05/07/15 | | 2015 | | 35 years | Retail Property in Zapata, TX | | 747 | | | 62 | | 62 | | | 998 | | 998 | | | 145 | | 145 | | | — | | — | | | 62 | | 62 | | | 998 | | 998 | | | 145 | | 145 | | | 1,205 | | 1,205 | | | (412) | | (412) | | | 05/07/15 | | 05/07/15 | | 2015 | | 35 years |
| Retail Property in St. Francis, MN | Retail Property in St. Francis, MN | | 733 | | | 105 | | | 911 | | | 163 | | | 0 | | | 105 | | | 911 | | | 163 | | | 1,179 | | | (263) | | | 03/26/15 | | 2014 | | 35 years | Retail Property in St. Francis, MN | | 734 | | | 105 | | 105 | | | 911 | | 911 | | | 163 | | 163 | | | — | | — | | | 105 | | 105 | | | 911 | | 911 | | | 163 | | 163 | | | 1,179 | | 1,179 | | | (400) | | (400) | | | 03/26/15 | | 03/26/15 | | 2014 | | 35 years |
| Retail Property in Yorktown, TX | Retail Property in Yorktown, TX | | 785 | | | 97 | | | 1,005 | | | 199 | | | 0 | | | 97 | | | 1,005 | | | 199 | | | 1,301 | | | (285) | | | 03/25/15 | | 2015 | | 35 years | Retail Property in Yorktown, TX | | 786 | | | 97 | | 97 | | | 1,005 | | 1,005 | | | 199 | | 199 | | | — | | — | | | 97 | | 97 | | | 1,005 | | 1,005 | | | 199 | | 199 | | | 1,301 | | 1,301 | | | (433) | | (433) | | | 03/25/15 | | 03/25/15 | | 2015 | | 35 years |
| Retail Property in Battle Lake, MN | Retail Property in Battle Lake, MN | | 720 | | | 136 | | | 875 | | | 157 | | | 0 | | | 136 | | | 875 | | | 157 | | | 1,168 | | | (274) | | | 03/25/15 | | 2014 | | 30 years | Retail Property in Battle Lake, MN | | 721 | | | 136 | | 136 | | | 875 | | 875 | | | 157 | | 157 | | | — | | — | | | 136 | | 136 | | | 875 | | 875 | | | 157 | | 157 | | | 1,168 | | 1,168 | | | (417) | | (417) | | | 03/25/15 | | 03/25/15 | | 2014 | | 30 years |
| Retail Property in Paynesville, MN | Retail Property in Paynesville, MN | | 805 | | | 246 | | | 816 | | | 192 | | | 0 | | | 246 | | | 816 | | | 192 | | | 1,254 | | | (228) | | | 03/05/15 | | 2015 | | 40 years | Retail Property in Paynesville, MN | | 806 | | | 246 | | 246 | | | 816 | | 816 | | | 192 | | 192 | | | — | | — | | | 246 | | 246 | | | 816 | | 816 | | | 192 | | 192 | | | 1,254 | | 1,254 | | | (346) | | (346) | | | 03/05/15 | | 03/05/15 | | 2015 | | 40 years |
| Retail Property in Wheaton, MO | Retail Property in Wheaton, MO | | 645 | | | 73 | | | 800 | | | 97 | | | 0 | | | 73 | | | 800 | | | 97 | | | 970 | | | (193) | | | 03/05/15 | | 2015 | | 40 years | Retail Property in Wheaton, MO | | 639 | | | 73 | | 73 | | | 800 | | 800 | | | 97 | | 97 | | | — | | — | | | 73 | | 73 | | | 800 | | 800 | | | 97 | | 97 | | | 970 | | 970 | | | (293) | | (293) | | | 03/05/15 | | 03/05/15 | | 2015 | | 40 years |
| Retail Property in Rotterdam, NY | Retail Property in Rotterdam, NY | | 8,949 | | | 2,530 | | | 7,924 | | | 2,165 | | | 0 | | | 2,530 | | | 7,924 | | | 2,165 | | | 12,619 | | | (3,700) | | | 03/03/15 | | 1996 | | 20 years | Retail Property in Rotterdam, NY | | 8,993 | | | 2,530 | | 2,530 | | | 7,924 | | 7,924 | | | 2,165 | | 2,165 | | | — | | — | | | 2,530 | | 2,530 | | | 7,924 | | 7,924 | | | 2,165 | | 2,165 | | | 12,619 | | 12,619 | | | (5,605) | | (5,605) | | | 03/03/15 | | 03/03/15 | | 1996 | | 20 years |
| Retail Property in Hilliard, OH | Retail Property in Hilliard, OH | | 4,538 | | | 654 | | | 4,870 | | | 860 | | | 0 | | | 654 | | | 4,870 | | | 860 | | | 6,384 | | | (1,056) | | | 03/02/15 | | 2007 | | 41 years | Retail Property in Hilliard, OH | | 4,496 | | | 654 | | 654 | | | 4,870 | | 4,870 | | | 860 | | 860 | | | — | | — | | | 654 | | 654 | | | 4,870 | | 4,870 | | | 860 | | 860 | | | 6,384 | | 6,384 | | | (1,600) | | (1,600) | | | 03/02/15 | | 03/02/15 | | 2007 | | 41 years |
| Retail Property in Niles, OH | Retail Property in Niles, OH | | 3,687 | | | 437 | | | 4,084 | | | 680 | | | 0 | | | 437 | | | 4,084 | | | 680 | | | 5,201 | | | (880) | | | 03/02/15 | | 2007 | | 41 years | Retail Property in Niles, OH | | 3,653 | | | 437 | | 437 | | | 4,084 | | 4,084 | | | 680 | | 680 | | | — | | — | | | 437 | | 437 | | | 4,084 | | 4,084 | | | 680 | | 680 | | | 5,201 | | 5,201 | | | (1,332) | | (1,332) | | | 03/02/15 | | 03/02/15 | | 2007 | | 41 years |
| Retail Property in Youngstown, OH | Retail Property in Youngstown, OH | | 3,818 | | | 380 | | | 4,363 | | | 658 | | | 0 | | | 380 | | | 4,363 | | | 658 | | | 5,401 | | | (961) | | | 02/20/15 | | 2005 | | 40 years | Retail Property in Youngstown, OH | | 3,798 | | | 380 | | 380 | | | 4,363 | | 4,363 | | | 658 | | 658 | | | — | | — | | | 380 | | 380 | | | 4,363 | | 4,363 | | | 658 | | 658 | | | 5,401 | | 5,401 | | | (1,452) | | (1,452) | | | 02/20/15 | | 02/20/15 | | 2005 | | 40 years |
| Retail Property in Kings Mountain, NC | | 18,503 | | | 1,368 | | | 19,533 | | | 3,266 | | | 4,850 | | | 1,368 | | | 24,383 | | | 3,266 | | | 29,017 | | | (6,695) | | | 01/29/15 | | 1995 | | 35 years |
| Retail Property in Iberia, MO | Retail Property in Iberia, MO | | 888 | | | 130 | | | 1,033 | | | 165 | | | 0 | | | 130 | | | 1,033 | | | 165 | | | 1,328 | | | (256) | | | 01/23/15 | | 2015 | | 39 years | Retail Property in Iberia, MO | | 880 | | | 130 | | 130 | | | 1,033 | | 1,033 | | | 165 | | 165 | | | — | | — | | | 130 | | 130 | | | 1,033 | | 1,033 | | | 165 | | 165 | | | 1,328 | | 1,328 | | | (386) | | (386) | | | 01/23/15 | | 01/23/15 | | 2015 | | 39 years |
| Retail Property in Pine Island, MN | Retail Property in Pine Island, MN | | 764 | | | 112 | | | 845 | | | 185 | | | 0 | | | 112 | | | 845 | | | 185 | | | 1,142 | | | (247) | | | 01/23/15 | | 2014 | | 40 years | Retail Property in Pine Island, MN | | 757 | | | 112 | | 112 | | | 845 | | 845 | | | 185 | | 185 | | | — | | — | | | 112 | | 112 | | | 845 | | 845 | | | 185 | | 185 | | | 1,142 | | 1,142 | | | (372) | | (372) | | | 01/23/15 | | 01/23/15 | | 2014 | | 40 years |
| Retail Property in Isle, MN | Retail Property in Isle, MN | | 718 | | | 120 | | | 787 | | | 171 | | | 0 | | | 120 | | | 787 | | | 171 | | | 1,078 | | | (239) | | | 01/23/15 | | 2014 | | 40 years | Retail Property in Isle, MN | | 711 | | | 120 | | 120 | | | 787 | | 787 | | | 171 | | 171 | | | — | | — | | | 120 | | 120 | | | 787 | | 787 | | | 171 | | 171 | | | 1,078 | | 1,078 | | | (359) | | (359) | | | 01/23/15 | | 01/23/15 | | 2014 | | 40 years |
| Retail Property in Jacksonville, NC | Retail Property in Jacksonville, NC | | 5,636 | | | 1,863 | | | 5,749 | | | 1,020 | | | 0 | | | 1,863 | | | 5,749 | | | 1,020 | | | 8,632 | | | (1,354) | | | 01/22/15 | | 2014 | | 44 years | Retail Property in Jacksonville, NC | | 5,584 | | | 1,863 | | 1,863 | | | 5,749 | | 5,749 | | | 1,020 | | 1,020 | | | — | | — | | | 1,863 | | 1,863 | | | 5,749 | | 5,749 | | | 1,020 | | 1,020 | | | 8,632 | | 8,632 | | | (2,038) | | (2,038) | | | 01/22/15 | | 01/22/15 | | 2014 | | 44 years |
| Retail Property in Evansville, IN | Retail Property in Evansville, IN | | 6,377 | | | 1,788 | | | 6,348 | | | 864 | | | 0 | | | 1,788 | | | 6,348 | | | 864 | | | 9,000 | | | (1,589) | | | 11/26/14 | | 2014 | | 35 years | Retail Property in Evansville, IN | | 6,318 | | | 1,788 | | 1,788 | | | 6,348 | | 6,348 | | | 864 | | 864 | | | — | | — | | | 1,788 | | 1,788 | | | 6,348 | | 6,348 | | | 864 | | 864 | | | 9,000 | | 9,000 | | | (2,372) | | (2,372) | | | 11/26/14 | | 11/26/14 | | 2014 | | 35 years |
| Retail Property in Woodland Park, CO | | Retail Property in Woodland Park, CO | | 2,770 | | | 668 | | | 2,681 | | | 620 | | | — | | | 668 | | | 2,681 | | | 620 | | | 3,969 | | | (1,264) | | | 11/14/14 | | 2014 | | 35 years |
| Retail Property in Springfield, MO | | Retail Property in Springfield, MO | | 8,212 | | | 3,658 | | | 6,296 | | | 1,870 | | | — | | | 3,658 | | | 6,296 | | | 1,870 | | | 11,824 | | | (2,836) | | | 11/04/14 | | 2011 | | 37 years |
| | Initial Cost to Company | | Costs Capitalized Subsequent to Acquisition | | Gross Amount at which Carried at Close of Period | | Accumulated Depreciation and Amortization | | Date Acquired | | Year Built | | Life on which Depreciation in Latest Statement of Income is Computed |
| | | | Initial Cost to Company | | | | | | Initial Cost to Company | | Costs Capitalized Subsequent to Acquisition | | Gross Amount at which Carried at Close of Period | | Accumulated Depreciation and Amortization | | Date Acquired | | Year Built | | Life on which Depreciation in Latest Statement of Income is Computed |
| Description | Description | | Encumbrances | | Land | | Building | | Intangibles | | Costs Capitalized Subsequent to Acquisition | | Land | | Building | | Intangibles | | Total | | Accumulated Depreciation and Amortization | | Date Acquired | | Year Built | | Life on which Depreciation in Latest Statement of Income is Computed |
| | Retail Property in Woodland Park, CO | | 2,787 | | | 668 | | | 2,681 | | | 620 | | | 0 | | | 668 | | | 2,681 | | | 620 | | | 3,969 | | | (849) | | | 11/14/14 | | 2014 | | 35 years |
| Retail Property in Ankeny, IA | | 11,648 | | | 3,180 | | | 10,513 | | | 2,843 | | | 0 | | | 3,180 | | | 10,513 | | | 2,843 | | | 16,536 | | | (2,919) | | | 11/04/14 | | 2013 | | 39 years |
| Retail Property in Springfield, MO | | 8,289 | | | 3,658 | | | 6,296 | | | 1,870 | | | 0 | | | 3,658 | | | 6,296 | | | 1,870 | | | 11,824 | | | (1,907) | | | 11/04/14 | | 2011 | | 37 years |
| Retail Property in Cedar Rapids, IA | |
| | Retail Property in Cedar Rapids, IA | |
| | Retail Property in Cedar Rapids, IA | Retail Property in Cedar Rapids, IA | | 7,761 | | | 1,569 | | | 7,553 | | | 1,878 | | | 0 | | | 1,569 | | | 7,553 | | | 1,878 | | | 11,000 | | | (2,461) | | | 11/04/14 | | 2012 | | 30 years | | 7,713 | | | 1,569 | | 1,569 | | | 7,553 | | 7,553 | | | 1,878 | | 1,878 | | | — | | — | | | 1,569 | | 1,569 | | | 7,553 | | 7,553 | | | 1,878 | | 1,878 | | | 11,000 | | 11,000 | | | (3,660) | | (3,660) | | | 11/04/14 | | 11/04/14 | | 2012 | | 30 years |
| Retail Property in Fairfield, IA | Retail Property in Fairfield, IA | | 7,549 | | | 1,132 | | | 7,779 | | | 1,800 | | | 0 | | | 1,132 | | | 7,779 | | | 1,800 | | | 10,711 | | | (2,127) | | | 11/04/14 | | 2011 | | 37 years | Retail Property in Fairfield, IA | | 7,503 | | | 1,132 | | 1,132 | | | 7,779 | | 7,779 | | | 1,800 | | 1,800 | | | — | | — | | | 1,132 | | 1,132 | | | 7,779 | | 7,779 | | | 1,800 | | 1,800 | | | 10,711 | | 10,711 | | | (3,164) | | (3,164) | | | 11/04/14 | | 11/04/14 | | 2011 | | 37 years |
| Retail Property in Owatonna, MN | Retail Property in Owatonna, MN | | 7,063 | | | 1,398 | | | 7,125 | | | 1,564 | | | 0 | | | 1,398 | | | 7,125 | | | 1,564 | | | 10,087 | | | (2,037) | | | 11/04/14 | | 2010 | | 36 years | Retail Property in Owatonna, MN | | 6,997 | | | 1,398 | | 1,398 | | | 7,125 | | 7,125 | | | 1,564 | | 1,564 | | | — | | — | | | 1,398 | | 1,398 | | | 7,125 | | 7,125 | | | 1,564 | | 1,564 | | | 10,087 | | 10,087 | | | (3,030) | | (3,030) | | | 11/04/14 | | 11/04/14 | | 2010 | | 36 years |
| Retail Property in Muscatine, IA | Retail Property in Muscatine, IA | | 5,065 | | | 1,060 | | | 6,636 | | | 1,307 | | | 0 | | | 1,060 | | | 6,636 | | | 1,307 | | | 9,003 | | | (2,023) | | | 11/04/14 | | 2013 | | 29 years | Retail Property in Muscatine, IA | | 5,018 | | | 1,060 | | 1,060 | | | 6,636 | | 6,636 | | | 1,307 | | 1,307 | | | — | | — | | | 1,060 | | 1,060 | | | 6,636 | | 6,636 | | | 1,307 | | 1,307 | | | 9,003 | | 9,003 | | | (3,008) | | (3,008) | | | 11/04/14 | | 11/04/14 | | 2013 | | 29 years |
| Retail Property in Sheldon, IA | Retail Property in Sheldon, IA | | 3,046 | | | 633 | | | 3,053 | | | 708 | | | 0 | | | 633 | | | 3,053 | | | 708 | | | 4,394 | | | (870) | | | 11/04/14 | | 2011 | | 37 years | Retail Property in Sheldon, IA | | 3,018 | | | 633 | | 633 | | | 3,053 | | 3,053 | | | 708 | | 708 | | | — | | — | | | 633 | | 633 | | | 3,053 | | 3,053 | | | 708 | | 708 | | | 4,394 | | 4,394 | | | (1,294) | | (1,294) | | | 11/04/14 | | 11/04/14 | | 2011 | | 37 years |
| Retail Property in Memphis, TN | Retail Property in Memphis, TN | | 3,898 | | | 1,986 | | | 2,800 | | | 803 | | | 0 | | | 1,986 | | | 2,800 | | | 803 | | | 5,589 | | | (1,692) | | | 10/24/14 | | 1962 | | 15 years | Retail Property in Memphis, TN | | 3,874 | | | 1,986 | | 1,986 | | | 2,800 | | 2,800 | | | 803 | | 803 | | | — | | — | | | 1,986 | | 1,986 | | | 2,800 | | 2,800 | | | 803 | | 803 | | | 5,589 | | 5,589 | | | (2,406) | | (2,406) | | | 10/24/14 | | 10/24/14 | | 1962 | | 15 years |
| Retail Property in Bennett, CO | Retail Property in Bennett, CO | | 2,478 | | | 470 | | | 2,503 | | | 563 | | | 0 | | | 470 | | | 2,503 | | | 563 | | | 3,536 | | | (816) | | | 10/02/14 | | 2014 | | 34 years | Retail Property in Bennett, CO | | 2,467 | | | 470 | | 470 | | | 2,503 | | 2,503 | | | 563 | | 563 | | | — | | — | | | 470 | | 470 | | | 2,503 | | 2,503 | | | 563 | | 563 | | | 3,536 | | 3,536 | | | (1,208) | | (1,208) | | | 10/02/14 | | 10/02/14 | | 2014 | | 34 years |
| Retail Property in Conyers, GA | | 22,807 | | | 876 | | | 27,396 | | | 4,258 | | | 0 | | | 876 | | | 27,396 | | | 4,258 | | | 32,530 | | | (6,350) | | | 08/28/14 | | 2014 | | 45 years |
| Retail Property in O'Fallon, IL | Retail Property in O'Fallon, IL | | 5,679 | | | 2,488 | | | 5,388 | | | 1,064 | | | 0 | | | 2,488 | | | 5,388 | | | 1,064 | | | 8,940 | | | (3,251) | | | 08/08/14 | | 1984 | | 15 years | Retail Property in O'Fallon, IL | | 5,672 | | | 2,488 | | 2,488 | | | 5,388 | | 5,388 | | | 1,064 | | 1,064 | | | — | | — | | | 2,488 | | 2,488 | | | 5,388 | | 5,388 | | | 1,064 | | 1,064 | | | 8,940 | | 8,940 | | | (4,479) | | (4,479) | | | 08/08/14 | | 08/08/14 | | 1984 | | 15 years |
| Retail Property in El Centro, CA | Retail Property in El Centro, CA | | 2,980 | | | 569 | | | 3,133 | | | 575 | | | 0 | | | 569 | | | 3,133 | | | 575 | | | 4,277 | | | (784) | | | 08/08/14 | | 2014 | | 50 years | Retail Property in El Centro, CA | | 2,976 | | | 569 | | 569 | | | 3,133 | | 3,133 | | | 575 | | 575 | | | — | | — | | | 569 | | 569 | | | 3,133 | | 3,133 | | | 575 | | 575 | | | 4,277 | | 4,277 | | | (1,153) | | (1,153) | | | 08/08/14 | | 08/08/14 | | 2014 | | 50 years |
| Retail Property in Durant, OK | Retail Property in Durant, OK | | 3,243 | | | 594 | | | 3,900 | | | 498 | | | 0 | | | 594 | | | 3,900 | | | 498 | | | 4,992 | | | (1,037) | | | 01/28/13 | | 2007 | | 40 years | Retail Property in Durant, OK | | — | | | 594 | | 594 | | | 3,900 | | 3,900 | | | 498 | | 498 | | | — | | — | | | 594 | | 594 | | | 3,900 | | 3,900 | | | 498 | | 498 | | | 4,992 | | 4,992 | | | (1,420) | | (1,420) | | | 01/28/13 | | 01/28/13 | | 2007 | | 40 years |
| Retail Property in Gallatin, TN | Retail Property in Gallatin, TN | | 3,315 | | | 1,725 | | | 2,616 | | | 721 | | | 0 | | | 1,725 | | | 2,616 | | | 721 | | | 5,062 | | | (928) | | | 12/28/12 | | 2007 | | 40 years | Retail Property in Gallatin, TN | | — | | | 1,725 | | 1,725 | | | 2,616 | | 2,616 | | | 721 | | 721 | | | — | | — | | | 1,725 | | 1,725 | | | 2,616 | | 2,616 | | | 721 | | 721 | | | 5,062 | | 5,062 | | | (1,275) | | (1,275) | | | 12/28/12 | | 12/28/12 | | 2007 | | 40 years |
| Retail Property in Mt. Airy, NC | Retail Property in Mt. Airy, NC | | 2,944 | | | 729 | | | 3,353 | | | 621 | | | 0 | | | 729 | | | 3,353 | | | 621 | | | 4,703 | | | (1,059) | | | 12/27/12 | | 2007 | | 39 years | Retail Property in Mt. Airy, NC | | — | | | 729 | | 729 | | | 3,353 | | 3,353 | | | 621 | | 621 | | | — | | — | | | 729 | | 729 | | | 3,353 | | 3,353 | | | 621 | | 621 | | | 4,703 | | 4,703 | | | (1,422) | | (1,422) | | | 12/27/12 | | 12/27/12 | | 2007 | | 39 years |
| Retail Property in Aiken, SC | Retail Property in Aiken, SC | | 3,877 | | | 1,588 | | | 3,480 | | | 858 | | | 0 | | | 1,588 | | | 3,480 | | | 858 | | | 5,926 | | | (1,130) | | | 12/21/12 | | 2008 | | 41 years | Retail Property in Aiken, SC | | — | | | 1,588 | | 1,588 | | | 3,480 | | 3,480 | | | 858 | | 858 | | | — | | — | | | 1,588 | | 1,588 | | | 3,480 | | 3,480 | | | 858 | | 858 | | | 5,926 | | 5,926 | | | (1,552) | | (1,552) | | | 12/21/12 | | 12/21/12 | | 2008 | | 41 years |
| Retail Property in Johnson City, TN | Retail Property in Johnson City, TN | | 3,446 | | | 917 | | | 3,607 | | | 739 | | | 0 | | | 917 | | | 3,607 | | | 739 | | | 5,263 | | | (1,139) | | | 12/21/12 | | 2007 | | 40 years | Retail Property in Johnson City, TN | | — | | | 917 | | 917 | | | 3,607 | | 3,607 | | | 739 | | 739 | | | — | | — | | | 917 | | 917 | | | 3,607 | | 3,607 | | | 739 | | 739 | | | 5,263 | | 5,263 | | | (1,564) | | (1,564) | | | 12/21/12 | | 12/21/12 | | 2007 | | 40 years |
| Retail Property in Palmview, TX | Retail Property in Palmview, TX | | 4,505 | | | 938 | | | 4,837 | | | 1,044 | | | 0 | | | 938 | | | 4,837 | | | 1,044 | | | 6,819 | | | (1,304) | | | 12/19/12 | | 2012 | | 44 years | Retail Property in Palmview, TX | | — | | | 938 | | 938 | | | 4,837 | | 4,837 | | | 1,044 | | 1,044 | | | — | | — | | | 938 | | 938 | | | 4,837 | | 4,837 | | | 1,044 | | 1,044 | | | 6,819 | | 6,819 | | | (1,791) | | (1,791) | | | 12/19/12 | | 12/19/12 | | 2012 | | 44 years |
| Retail Property in Ooltewah, TN | Retail Property in Ooltewah, TN | | 3,772 | | | 903 | | | 3,957 | | | 843 | | | 0 | | | 903 | | | 3,957 | | | 843 | | | 5,703 | | | (1,219) | | | 12/18/12 | | 2008 | | 41 years | Retail Property in Ooltewah, TN | | — | | | 903 | | 903 | | | 3,957 | | 3,957 | | | 843 | | 843 | | | — | | — | | | 903 | | 903 | | | 3,957 | | 3,957 | | | 843 | | 843 | | | 5,703 | | 5,703 | | | (1,673) | | (1,673) | | | 12/18/12 | | 12/18/12 | | 2008 | | 41 years |
| Retail Property in Abingdon, VA | Retail Property in Abingdon, VA | | 3,029 | | | 682 | | | 3,733 | | | 666 | | | 0 | | | 682 | | | 3,733 | | | 666 | | | 5,081 | | | (1,161) | | | 12/18/12 | | 2006 | | 41 years | Retail Property in Abingdon, VA | | — | | | 682 | | 682 | | | 3,733 | | 3,733 | | | 666 | | 666 | | | — | | — | | | 682 | | 682 | | | 3,733 | | 3,733 | | | 666 | | 666 | | | 5,081 | | 5,081 | | | (1,594) | | (1,594) | | | 12/18/12 | | 12/18/12 | | 2006 | | 41 years |
| Retail Property in Vineland, NJ | | Retail Property in Vineland, NJ | | — | | | 1,482 | | | 17,742 | | | 3,282 | | | — | | | 1,482 | | | 17,742 | | | 3,282 | | | 22,506 | | | (9,636) | | | 09/21/12 | | 2003 | | 30 years |
| Retail Property in Saratoga Springs, NY | | Retail Property in Saratoga Springs, NY | | — | | | 748 | | | 13,936 | | | 5,538 | | | — | | | 748 | | | 13,936 | | | 5,538 | | | 20,222 | | | (9,059) | | | 09/21/12 | | 1994 | | 27 years |
| Retail Property in Waldorf, MD | | Retail Property in Waldorf, MD | | — | | | 4,933 | | | 11,684 | | | 2,882 | | | — | | | 4,933 | | | 11,684 | | | 2,882 | | | 19,499 | | | (7,548) | | | 09/21/12 | | 1999 | | 25 years |
| Retail Property in Mooresville, NC | | Retail Property in Mooresville, NC | | — | | | 2,615 | | | 12,462 | | | 2,566 | | | — | | | 2,615 | | | 12,462 | | | 2,566 | | | 17,643 | | | (8,113) | | | 09/21/12 | | 2000 | | 24 years |
| | | | | | | | | | | | | | | | | | | | | | | | | | | | | | | | | | | | | | | | | | | | | | | | | | | | | | | | | | | | | | | | | | | | | | | | | | | | | | | | |
| | | | Initial Cost to Company | | Costs Capitalized Subsequent to Acquisition | | Gross Amount at which Carried at Close of Period | | Accumulated Depreciation and Amortization | | Date Acquired | | Year Built | | Life on which Depreciation in Latest Statement of Income is Computed |
| Description | | Encumbrances | | Land | | Building | | Intangibles | | | Land | | Building | | Intangibles | | Total | | | | |
| | | | | | | | | | | | | | | | | | | | | | | | | | |
| Retail Property in Wichita, KS | | 4,720 | | | 1,187 | | | 4,850 | | | 1,163 | | | 0 | | | 1,187 | | | 4,850 | | | 1,163 | | | 7,200 | | | (1,962) | | | 12/14/12 | | 2012 | | 34 years |
| Retail Property in North Dartmouth, MA | | 18,652 | | | 7,033 | | | 19,745 | | | 3,187 | | | 0 | | | 7,033 | | | 19,745 | | | 3,187 | | | 29,965 | | | (10,120) | | | 09/21/12 | | 1989 | | 20 years |
| Retail Property in Vineland, NJ | | 13,724 | | | 1,482 | | | 17,742 | | | 3,282 | | | 0 | | | 1,482 | | | 17,742 | | | 3,282 | | | 22,506 | | | (7,072) | | | 09/21/12 | | 2003 | | 30 years |
| Retail Property in Saratoga Springs, NY | | 12,331 | | | 748 | | | 13,936 | | | 5,538 | | | 0 | | | 748 | | | 13,936 | | | 5,538 | | | 20,222 | | | (6,634) | | | 09/21/12 | | 1994 | | 27 years |
| Retail Property in Waldorf, MD | | 11,465 | | | 4,933 | | | 11,684 | | | 2,882 | | | 0 | | | 4,933 | | | 11,684 | | | 2,882 | | | 19,499 | | | (5,649) | | | 09/21/12 | | 1999 | | 25 years |
| Retail Property in Mooresville, NC | | 10,758 | | | 2,615 | | | 12,462 | | | 2,566 | | | 0 | | | 2,615 | | | 12,462 | | | 2,566 | | | 17,643 | | | (5,958) | | | 09/21/12 | | 2000 | | 24 years |
| Retail Property in Sennett, NY | | 4,653 | | | 1,147 | | | 4,480 | | | 1,848 | | | 0 | | | 1,147 | | | 4,480 | | | 1,848 | | | 7,475 | | | (2,631) | | | 09/21/12 | | 1996 | | 23 years |
| Retail Property in DeLeon Springs, FL | | 807 | | | 239 | | | 782 | | | 221 | | | 0 | | | 239 | | | 782 | | | 221 | | | 1,242 | | | (413) | | | 08/13/12 | | 2011 | | 35 years |
| Retail Property in Orange City, FL | | 798 | | | 229 | | | 853 | | | 235 | | | 0 | | | 229 | | | 853 | | | 235 | | | 1,317 | | | (430) | | | 05/23/12 | | 2011 | | 35 years |
| Retail Property in Satsuma, FL | | 720 | | | 79 | | | 821 | | | 192 | | | 0 | | | 79 | | | 821 | | | 192 | | | 1,092 | | | (414) | | | 04/19/12 | | 2011 | | 35 years |
| Retail Property in Greenwood, AR | | 3,365 | | | 1,038 | | | 3,415 | | | 694 | | | 0 | | | 1,038 | | | 3,415 | | | 694 | | | 5,147 | | | (1,128) | | | 04/12/12 | | 2009 | | 43 years |
| Retail Property in Snellville, GA | | 5,291 | | | 1,293 | | | 5,724 | | | 983 | | | 0 | | | 1,293 | | | 5,724 | | | 983 | | | 8,000 | | | (2,278) | | | 04/04/12 | | 2011 | | 34 years |
| Retail Property in Columbia, SC | | 5,146 | | | 2,148 | | | 4,629 | | | 1,023 | | | 0 | | | 2,148 | | | 4,629 | | | 1,023 | | | 7,800 | | | (1,924) | | | 04/04/12 | | 2001 | | 34 years |
| Retail Property in Millbrook, AL | | 4,537 | | | 970 | | | 5,972 | | | 0 | | | 0 | | | 970 | | | 5,972 | | | 0 | | | 6,942 | | | (1,648) | | | 03/28/12 | | 2008 | | 32 years |
| Retail Property in Pittsfield, MA | | 11,030 | | | 1,801 | | | 11,556 | | | 1,344 | | | 0 | | | 1,801 | | | 11,556 | | | 1,344 | | | 14,701 | | | (3,882) | | | 02/17/12 | | 2011 | | 34 years |
| Retail Property in Spartanburg, SC | | 3,369 | | | 828 | | | 2,567 | | | 772 | | | 0 | | | 828 | | | 2,567 | | | 772 | | | 4,167 | | | (1,143) | | | 01/14/11 | | 2007 | | 42 years |
| Retail Property in Tupelo, MS | | 4,536 | | | 1,120 | | | 3,070 | | | 939 | | | 0 | | | 1,120 | | | 3,070 | | | 939 | | | 5,129 | | | (1,313) | | | 08/13/10 | | 2007 | | 47 years |
| | | | | | | | | | | | | | | | | | | | | | | | | | | | | | | | | | | | | | | | | | | | | | | | | | | | | | | | | | | | | | | | | | | | | | | | | | | | | | | | |
| | | | Initial Cost to Company | | Costs Capitalized Subsequent to Acquisition | | Gross Amount at which Carried at Close of Period | | Accumulated Depreciation and Amortization | | Date Acquired | | Year Built | | Life on which Depreciation in Latest Statement of Income is Computed |
| Description | | Encumbrances | | Land | | Building | | Intangibles | | | Land | | Building | | Intangibles | | Total | | | | |
| | | | | | | | | | | | | | | | | | | | | | | | | | |
| Retail Property in DeLeon Springs, FL | | — | | | 239 | | | 782 | | | 221 | | | — | | | 239 | | | 782 | | | 221 | | | 1,242 | | | (561) | | | 08/13/12 | | 2011 | | 35 years |
| Retail Property in Orange City, FL | | — | | | 229 | | | 853 | | | 235 | | | — | | | 229 | | | 853 | | | 235 | | | 1,317 | | | (580) | | | 05/23/12 | | 2011 | | 35 years |
| Retail Property in Satsuma, FL | | — | | | 79 | | | 821 | | | 192 | | | — | | | 79 | | | 821 | | | 192 | | | 1,092 | | | (557) | | | 04/19/12 | | 2011 | | 35 years |
| Retail Property in Greenwood, AR | | — | | | 1,038 | | | 3,415 | | | 694 | | | — | | | 1,038 | | | 3,415 | | | 694 | | | 5,147 | | | (1,516) | | | 04/12/12 | | 2009 | | 43 years |
| Retail Property in Millbrook, AL | | — | | | 970 | | | 5,972 | | | — | | | — | | | 970 | | | 5,972 | | | — | | | 6,942 | | | (2,212) | | | 03/28/12 | | 2008 | | 32 years |
| Retail Property in Spartanburg, SC | | 3,327 | | | 828 | | | 2,567 | | | 772 | | | — | | | 828 | | | 2,567 | | | 772 | | | 4,167 | | | (1,467) | | | 01/14/11 | | 2007 | | 42 years |
| Retail Property in Tupelo, MS | | 4,506 | | | 1,120 | | | 3,070 | | | 939 | | | — | | | 1,120 | | | 3,070 | | | 939 | | | 5,129 | | | (1,673) | | | 08/13/10 | | 2007 | | 47 years |
| Retail Property in Lilburn, GA | | — | | | 1,090 | | | 3,673 | | | 1,028 | | | — | | | 1,090 | | | 3,673 | | | 1,028 | | | 5,791 | | | (1,933) | | | 08/12/10 | | 2007 | | 47 years |
| Retail Property in Douglasville, GA | | 4,709 | | | 1,717 | | | 2,705 | | | 987 | | | — | | | 1,717 | | | 2,705 | | | 987 | | | 5,409 | | | (1,537) | | | 08/12/10 | | 2008 | | 48 years |
| Retail Property in Elkton, MD | | 4,351 | | | 963 | | | 3,049 | | | 860 | | | — | | | 963 | | | 3,049 | | | 860 | | | 4,872 | | | (1,629) | | | 07/27/10 | | 2008 | | 49 years |
| | Initial Cost to Company | | Costs Capitalized Subsequent to Acquisition | | Gross Amount at which Carried at Close of Period | | Accumulated Depreciation and Amortization | | Date Acquired | | Year Built | | Life on which Depreciation in Latest Statement of Income is Computed |
| | | | Initial Cost to Company | | | | | | Initial Cost to Company | | Costs Capitalized Subsequent to Acquisition | | Gross Amount at which Carried at Close of Period | | Accumulated Depreciation and Amortization | | Date Acquired | | Year Built | | Life on which Depreciation in Latest Statement of Income is Computed |
| Description | Description | | Encumbrances | | Land | | Building | | Intangibles | | Costs Capitalized Subsequent to Acquisition | | Land | | Building | | Intangibles | | Total | | Accumulated Depreciation and Amortization | | Date Acquired | | Year Built | | Life on which Depreciation in Latest Statement of Income is Computed |
| | Retail Property in Lilburn, GA | | 0 | | | 1,090 | | | 3,673 | | | 1,028 | | | 0 | | | 1,090 | | | 3,673 | | | 1,028 | | | 5,791 | | | (1,516) | | | 08/12/10 | | 2007 | | 47 years |
| Retail Property in Douglasville, GA | | 4,740 | | | 1,717 | | | 2,705 | | | 987 | | | 0 | | | 1,717 | | | 2,705 | | | 987 | | | 5,409 | | | (1,196) | | | 08/12/10 | | 2008 | | 48 years |
| Retail Property in Elkton, MD | | 4,405 | | | 963 | | | 3,049 | | | 860 | | | 0 | | | 963 | | | 3,049 | | | 860 | | | 4,872 | | | (1,265) | | | 07/27/10 | | 2008 | | 49 years |
| Retail Property in Lexington, SC | |
| | Retail Property in Lexington, SC | |
| | Retail Property in Lexington, SC | Retail Property in Lexington, SC | | 4,129 | | | 1,644 | | | 2,219 | | | 869 | | | 0 | | | 1,644 | | | 2,219 | | | 869 | | | 4,732 | | | (1,077) | | | 06/28/10 | | 2009 | | 48 years | | 4,101 | | | 1,644 | | 1,644 | | | 2,219 | | 2,219 | | | 869 | | 869 | | | — | | — | | | 1,644 | | 1,644 | | | 2,219 | | 2,219 | | | 869 | | 869 | | | 4,732 | | 4,732 | | | (1,377) | | (1,377) | | | 06/28/10 | | 06/28/10 | | 2009 | | 48 years |
| Total Net Lease | Total Net Lease | | 515,740 | | | 115,078 | | | 550,290 | | | 117,112 | | | 8,991 | | | 115,078 | | | 559,287 | | | 117,109 | | | 791,474 | | | (151,840) | | |
| | Hotel in San Diego, CA | | 33,248 | | | 7,469 | | | 34,781 | | | 0 | | | 0 | | | 7,469 | | | 34,986 | | | 0 | | | 42,455 | | | (2,718) | | | 12/17/19 | | 1970 | | 23 years |
| Apartments in Fort Worth and Arlington, TX | | 0 | | | 3,910 | | | 19,536 | | | 460 | | | 0 | | | 3,910 | | | 19,814 | | | 460 | | | 24,184 | | | (1,335) | | | 12/03/19 | | 2011 | | 41 years |
| Retail in New York, NY | |
| | Retail in New York, NY | |
| | Retail in New York, NY | | | $ | — | | | $ | 8,896 | | | $ | 13,750 | | | $ | — | | | $ | — | | | $ | 8,896 | | | $ | 13,751 | | | $ | — | | | $ | 22,647 | | | $ | — | | | 12/21/23 | | 1985 | | 40 years |
| Multifamily in Pittsburgh, PA | | Multifamily in Pittsburgh, PA | | — | | | 7,141 | | | 26,222 | | | 1,116 | | | — | | | 7,141 | | | 26,227 | | | 1,122 | | | 34,490 | | | (428) | | | 11/01/23 | | 1966 | | 37 years |
| Multifamily in New York, NY | | Multifamily in New York, NY | | — | | | 15,824 | | | 13,512 | | | 1,135 | | | — | | | 15,824 | | | 13,628 | | | 1,019 | | | 30,471 | | | (409) | | | 09/19/23 | | 1921 | | 20 years |
| Office in Houston, TX | | Office in Houston, TX | | — | | | 826 | | | 6,322 | | | 2,380 | | | 2,106 | | | 826 | | | 8,430 | | | 2,380 | | | 11,636 | | | (1,416) | | | 11/01/22 | | 1983 | | 28 years |
| Retail in New York, NY | | Retail in New York, NY | | — | | | 2,434 | | | 5,482 | | | — | | | 33 | | | 2,434 | | | 5,515 | | | — | | | 7,949 | | | (373) | | | 02/11/22 | | 2019 | | 28 years |
| Hotel in Schaumburg, IL | | Hotel in Schaumburg, IL | | — | | | 8,029 | | | 29,971 | | | — | | | 718 | | | 8,029 | | | 30,689 | | | — | | | 38,718 | | | (5,824) | | | 12/17/21 | | 1983 | | 25 years |
| Hotel in Omaha, NE | Hotel in Omaha, NE | | 0 | | | 2,963 | | | 15,237 | | | 0 | | | 0 | | | 2,963 | | | 15,483 | | | 0 | | | 18,446 | | | (1,450) | | | 02/27/19 | | 1969 | | 35 years | Hotel in Omaha, NE | | — | | | 2,963 | | 2,963 | | | 15,237 | | 15,237 | | | — | | — | | | 1,228 | | 1,228 | | | 2,963 | | 2,963 | | | 16,465 | | 16,465 | | | — | | — | | | 19,428 | | 19,428 | | | (3,897) | | (3,897) | | | 02/27/19 | | 02/27/19 | | 1969 | | 35 years |
| Apartments in Isla Vista, CA | Apartments in Isla Vista, CA | | 69,669 | | | 36,274 | | | 47,694 | | | 1,118 | | | 948 | | | 36,274 | | | 48,812 | | | 1,118 | | | 86,204 | | | (4,456) | | | 05/01/18 | | 2009 | | 42 years | Apartments in Isla Vista, CA | | 88,854 | | | 36,274 | | 36,274 | | | 47,694 | | 47,694 | | | 1,118 | | 1,118 | | | 2,142 | | 2,142 | | | 36,274 | | 36,274 | | | 49,837 | | 49,837 | | | 1,118 | | 1,118 | | | 87,229 | | 87,229 | | | (8,520) | | (8,520) | | | 05/01/18 | | 05/01/18 | | 2009 | | 42 years |
| Vacant Lot in Los Angeles, CA | | 0 | | | 21,439 | | | 96 | | | 0 | | | 0 | | | 21,439 | | | 96 | | | 0 | | | 21,535 | | | (38) | | | 03/26/20 | | 2 years |
| Office in Crum Lynne, PA | Office in Crum Lynne, PA | | 6,024 | | | 1,403 | | | 7,518 | | | 1,666 | | | 0 | | | 1,403 | | | 7,518 | | | 1,666 | | | 10,587 | | | (991) | | | 09/29/17 | | 1999 | | 35 years | Office in Crum Lynne, PA | | 6,013 | | | 1,403 | | 1,403 | | | 7,518 | | 7,518 | | | 1,666 | | 1,666 | | | — | | — | | | 1,403 | | 1,403 | | | 7,518 | | 7,518 | | | 1,666 | | 1,666 | | | 10,587 | | 10,587 | | | (1,903) | | (1,903) | | | 09/29/17 | | 09/29/17 | | 1999 | | 35 years |
| Apartment Building in Miami, FL | | 33,870 | | | 12,643 | | | 24,533 | | | 968 | | | 3,375 | | | 12,643 | | | 27,722 | | | 968 | | | 41,333 | | | (4,198) | | | 08/31/17 | | 1987 | | 35 years |
| Office in Peoria, IL | Office in Peoria, IL | | 0 | | | 940 | | | 439 | | | 1,508 | | | 880 | | | 1,174 | | | 1,319 | | | 1,508 | | | 4,001 | | | (733) | | | 10/21/16 | | 1926 | | 15 years | Office in Peoria, IL | | — | | | 940 | | 940 | | | 439 | | 439 | | | 1,508 | | 1,508 | | | 1,020 | | 1,020 | | | 1,174 | | 1,174 | | | 1,460 | | 1,460 | | | 1,508 | | 1,508 | | | 4,142 | | 4,142 | | | (1,398) | | (1,398) | | | 10/21/16 | | 10/21/16 | | 1926 | | 15 years |
| Office in Wayne, NJ | | 21,703 | | | 2,744 | | | 20,212 | | | 8,323 | | | 0 | | | 2,744 | | | 20,212 | | | 8,323 | | | 31,279 | | | (5,650) | | | 08/04/16 | | 2009 | | 45 years |
| Shopping Center in Carmel, NY | Shopping Center in Carmel, NY | | 0 | | | 2,041 | | | 3,632 | | | 1,033 | | | 606 | | | 2,041 | | | 4,238 | | | 1,033 | | | 7,312 | | | (1,550) | | | 10/14/15 | | 1985 | | 20 years | Shopping Center in Carmel, NY | | — | | | 2,041 | | 2,041 | | | 3,632 | | 3,632 | | | 1,033 | | 1,033 | | | — | | — | | | 2,041 | | 2,041 | | | 4,269 | | 4,269 | | | 1,033 | | 1,033 | | | 7,343 | | 7,343 | | | (2,319) | | (2,319) | | | 10/14/15 | | 10/14/15 | | 1985 | | 20 years |
| Office in Richmond, VA | | 67,778 | | | 14,632 | | | 87,629 | | | 17,658 | | | 10,447 | | | 12,227 | | | 82,483 | | | 15,064 | | | 109,774 | | | (37,543) | | | 06/07/13 | | 1984 | | 41 years |
| Office in Oakland County, MI | Office in Oakland County, MI | | 18,032 | | | 1,147 | | | 7,707 | | | 9,932 | | | 8,871 | | | 1,146 | | | 16,572 | | | 9,929 | | | 27,647 | | | (18,423) | | | 02/01/13 | | 1989 | | 35 years | Office in Oakland County, MI | | 17,401 | | | 1,147 | | 1,147 | | | 7,707 | | 7,707 | | | 9,932 | | 9,932 | | | 10,887 | | 10,887 | | | 1,144 | | 1,144 | | | 18,587 | | 18,587 | | | 9,928 | | 9,928 | | | 29,659 | | 29,659 | | | (20,768) | | (20,768) | | | 02/01/13 | | 02/01/13 | | 1989 | | 35 years |
| Total Diversified | | 250,324 | | | 107,605 | | | 269,014 | | | 42,666 | | | 25,127 | | | 105,433 | | | 279,255 | | | 40,069 | | | 424,757 | | | (79,085) | | |
| | $ | |
| | | | | | | | | | | | | | | | | | 0 | | | |
| | Total Real Estate | Total Real Estate | | $ | 766,064 | | | $ | 222,683 | | | $ | 819,304 | | | $ | 159,778 | | | $ | 34,118 | | | $ | 220,511 | | | $ | 838,542 | | | $ | 157,178 | | | $ | 1,216,231 | | (2) | $ | (230,925) | | |
| | Total Real Estate | |
| | Total Real Estate | |
(1)Gross carrying value amounts are charged off as cost of sales upon delivery of condo units.
(2) The aggregate cost for U.S. federal income tax purposes is $0.9 billion at December 31, 2020.2023.
Reconciliation of Real Estate:
The following table reconciles real estate from December 31, 20192022 to December 31, 20202023 ($ in thousands):
| | | | | | | | | |
| Total Real Estate | | | | |
| Balance at December 31, 2022 | $ | 899,144 | | | | | |
| Acquisitions | — | | | | | |
| Acquisitions through foreclosures | 87,598 | | | | | |
| Improvements | 4,374 | | | | | |
| | | | | |
| Dispositions and write-offs | (43,890) | | | | | |
| Impairments | — | | | | | |
| Balance at December 31, 2023 | $ | 947,226 | | | | | |
| | | | | | | | | | | | | | | | | | | | |
| | Total Real Estate | | Commercial Real Estate | | Residential Real Estate |
| | | | | | |
| Balance at December 31, 2019 | | $ | 1,254,163 | | | $ | 1,213,965 | | | $ | 40,198 | |
| | | | | | |
| Improvements and additions | | 42,477 | | | 42,432 | | | 45 | |
| Acquisitions through foreclosures | | 729 | | | 729 | | | 0 | |
| Dispositions | | (81,138) | | | (79,042) | | | (2,096) | |
| | | | | | |
| Balance at December 31, 2020 | | $ | 1,216,231 | | | $ | 1,178,084 | | | $ | 38,147 | |
The following table reconciles real estate from December 31, 20182021 to December 31, 2019 $2022 ($ in thousands):
| | | | | | | | | | | | | | | | | | | | |
| | Total Real Estate | | Commercial Real Estate | | Residential Real Estate |
| | | | | | |
| Balance at December 31, 2018 | | $ | 1,171,960 | | | $ | 1,126,443 | | | $ | 45,517 | |
| | | | | | |
| Improvements and additions | | 29,135 | | | 29,103 | | | 32 | |
| Acquisitions through foreclosures | | 84,356 | | | 84,356 | | | 0 | |
| Dispositions | | (29,938) | | | (24,587) | | | (5,351) | |
| Impairments | | (1,350) | | | (1,350) | | | 0 | |
| Balance at December 31, 2019 | | $ | 1,254,163 | | | $ | 1,213,965 | | | $ | 40,198 | |
| | | | | | | | | |
| Total Real Estate | | | | |
| Balance at December 31, 2021 | $ | 1,127,495 | | | | | |
| | | | | |
| Acquisitions through foreclosures | 24,965 | | | | | |
| Improvements | 6,949 | | | | | |
| | | | | |
| Dispositions and write-offs | (260,265) | | | | | |
| | | | | |
| Balance at December 31, 2022 | $ | 899,144 | | | | | |
The following table reconciles real estate from December 31, 20172020 to December 31, 2018 $2021 ($ in thousands):
| | | | | | | | | | | | | | | | | | | | |
| | Total Real Estate | | Commercial Real Estate | | Residential Real Estate |
| | | | | | |
| Balance at December 31, 2017 | | $ | 1,193,104 | | | $ | 1,135,358 | | | $ | 57,746 | |
| | | | | | |
| Improvements and additions | | 131,294 | | | 130,969 | | | 325 | |
| | | | | | |
| Dispositions | | (152,438) | | | (139,884) | | | (12,554) | |
| | | | | | |
| Balance at December 31, 2018 | | $ | 1,171,960 | | | $ | 1,126,443 | | | $ | 45,517 | |
| | | | | | | | | |
| Total Real Estate | | | | |
| Balance at December 31, 2020 | $ | 1,216,229 | | | | | |
| Acquisitions | 20,452 | | | | | |
| Acquisitions through foreclosures | 81,750 | | | | | |
| Improvements | 4,871 | | | | | |
| | | | | |
| Dispositions and write-offs | (195,807) | | | | | |
| | | | | |
| Balance at December 31, 2021 | $ | 1,127,495 | | | | | |
Reconciliation of Accumulated Depreciation and Amortization:Amortization Expense:
The following table reconciles accumulated depreciation and amortization from December 31, 20192022 to December 31, 20202023 ($ in thousands):
| | | | | | | | | | | | | | | | | | | | |
| | Total Real Estate | | Commercial Real Estate | | Residential Real Estate |
| | | | | | |
| Balance at December 31, 2019 | | $ | 206,082 | | | $ | 205,823 | | | $ | 259 | |
| | | | | | |
| Additions | | 39,346 | | | 39,330 | | | 16 | |
| Dispositions | | (14,503) | | | (14,228) | | | (275) | |
| Balance at December 31, 2020 | | $ | 230,925 | | | $ | 230,925 | | | $ | 0 | |
| | | | | | | | | |
| Total Real Estate | | | | |
| Balance at December 31, 2022 | $ | 199,008 | | | | | |
| | | | | |
| Depreciation and amortization expense | 29,791 | | | | | |
| Dispositions/write-offs | (8,015) | | | | | |
| Balance at December 31, 2023 | $ | 220,784 | | | | | |
The following table reconciles accumulated depreciation and amortization from December 31, 20182021 to December 31, 20192022 ($ in thousands):
| | | | | | | | | | | | | | | | | | | | |
| | Total Real Estate | | Commercial Real Estate | | Residential Real Estate |
| | | | | | |
| Balance at December 31, 2018 | | $ | 173,938 | | | $ | 173,107 | | | $ | 831 | |
| | | | | | |
| Additions | | 39,231 | | | 39,149 | | | 82 | |
| Dispositions | | (7,087) | | | (6,433) | | | (654) | |
| Balance at December 31, 2019 | | $ | 206,082 | | | $ | 205,823 | | | $ | 259 | |
| | | | | | | | | |
| Total Real Estate | | | | |
| | | | | |
| Balance at December 31, 2021 | $ | 236,622 | | | | | |
| | | | | |
| Depreciation and amortization expense | 32,937 | | | | | |
| Dispositions/write-offs | (70,551) | | | | | |
| Balance at December 31, 2022 | $ | 199,008 | | | | | |
The following table reconciles accumulated depreciation and amortization from December 31, 20172020 to December 31, 20182021 ($ in thousands):
| | | | | | | | | | | | | | | | | | | | |
| | Total Real Estate | | Commercial Real Estate | | Residential Real Estate |
| | | | | | |
| Balance at December 31, 2017 | | $ | 161,063 | | | $ | 159,138 | | | $ | 1,925 | |
| | | | | | |
| Additions | | 42,532 | | | 42,246 | | | 286 | |
| Dispositions | | (29,657) | | | (28,277) | | | (1,380) | |
| Balance at December 31, 2018 | | $ | 173,938 | | | $ | 173,107 | | | $ | 831 | |
| | | | | | | | | |
| Total Real Estate | | | | |
| Balance at December 31, 2020 | $ | 230,925 | | | | | |
| | | | | |
| Depreciation and amortization expense | 38,069 | | | | | |
| Dispositions/write-offs | (32,372) | | | | | |
| Balance at December 31, 2021 | $ | 236,622 | | | | | |
Schedule IV-Mortgage Loans on Real Estate
Ladder Capital Corp
December 31, 20202023
($ in thousands)
| | Type of Loan | Type of Loan | | Underlying Property Type | | Interest Rates (1) | | Effective Maturity Dates | | Periodic Payment Terms (2) | | Prior Liens | | Face amount of Mortgages | | Carrying Amount of Mortgages | | Principal Amount of Mortgages Subject to Delinquent Principal or Interest (3) | Type of Loan | | Underlying Property Type | | Interest Rates (1) | | Effective Maturity Dates | | Periodic Payment Terms (2) | | Prior Liens | | Face amount of Mortgages | | Carrying Amount of Mortgages | | Principal Amount of Mortgages Subject to Delinquent Principal or Interest (3) |
| | First Mortgages individually >3% | First Mortgages individually >3% | | | | | | | | | | | | | | |
| First Mortgages individually >3% | |
| First Mortgages individually >3% | |
| | First Mortgage | First Mortgage | | Office, Mixed | | 8.25% - 5.50% | | 2021-2022 | | IO | | $ | 0 | | | $ | 166,339 | | | $ | 165,965 | | | $ | 0 | |
| | First Mortgage | |
| | First Mortgage | |
| First Mortgage | |
| First Mortgage | |
| First Mortgage | |
| First Mortgages individually <3% | First Mortgages individually <3% | |
| First Mortgage | |
| First Mortgage | |
| First Mortgage | First Mortgage | | Hotel, Industrial, Land, Mobile Home Park, Mixed Use, Multi-family, Office, Retail, Self Storage and Condominium, Other | | 3.50% - 11.00% | | 2021 - 2030 | | 0 | | | 2,107,778 | | | 2,097,302 | | | 190,934 | |
| Total First Mortgages | Total First Mortgages | | $ | 0 | | | $ | 2,274,117 | | | $ | 2,263,267 | | | $ | 190,934 | |
| | | Subordinated Mortgages individually <3% | |
| | Subordinated Mortgages individually <3% | |
| | Subordinated Mortgages individually <3% | Subordinated Mortgages individually <3% | |
| Subordinate Mortgage | Subordinate Mortgage | | Hotel, Multi-family, Office and Retail | | 6.04% - 12.00% | | 2021 - 2027 | | 853,175 | | | 121,565 | | | 121,310 | | | 5,850 | |
| Subordinate Mortgage | |
| Subordinate Mortgage | |
| Total Subordinated Mortgages | Total Subordinated Mortgages | | $ | 853,175 | | | $ | 121,565 | | | $ | 121,310 | | | $ | 5,850 | |
| | Total Mortgages | Total Mortgages | | $ | 853,175 | | | $ | 2,395,682 | | | $ | 2,384,577 | | | $ | 196,784 | |
| | Allowance for Credit Losses | | N/A | | N/A | | $ | (41,507) | | (4) | N/A |
| | Allowance for credit losses | | Allowance for credit losses | | | | | | | | | | | | N/A | | N/A | | (43,165) | | (4) | N/A |
| Total Mortgages after Allowance for Credit Losses | Total Mortgages after Allowance for Credit Losses | | $ | 853,175 | | | $ | 2,395,682 | | | $ | 2,343,070 | | (5) | $ | 196,784 | |
(1) Interest rates as of December 31, 2020.2023.
(2) IO = Interest only.
P&I = Principal and interest.Interest.
(3) Represents principal amount of loans on non-accrual status. The carrying value of loans on non-accrual status was $175.0$14.5 million as of December 31, 2020.2023. Refer to the Allowance for Credit Losses and Non-Accrual Status insection of Note 3, Mortgage Loan Receivables, to the consolidated financial statements for further disclosure.detail.
(4) Refer to Note 3, Mortgage Loan Receivables, for further detail.
(5) The aggregate cost for U.S. federal income tax purposes is $2.3$3.2 billion.
(6) Includes $26.9 million of mortgage loans held for sale as of December 31, 2023.
Reconciliation of mortgage loans on real estate:
The following tables reconcile mortgage loans on real estate from December 31, 20172020 to December 31, 20202023 ($ in thousands):
| | | | | | | | | | | | | | | | | | | | | | | | | |
| Mortgage loan receivables held for investment, net, at amortized cost: | | | | |
| | Mortgage loans receivable | | | | Allowance for credit losses | | Mortgage loan
receivables held
for sale | | Total Mortgage loan
receivables |
| | | | | | | | | |
| Balance December 31, 2019 | $ | 3,257,036 | | | | | $ | (20,500) | | | $ | 122,325 | | | $ | 3,358,861 | |
| Origination of mortgage loan receivables | 353,661 | | | | | — | | | 212,845 | | | 566,506 | |
| | | | | | | | | |
| Repayment of mortgage loan receivables | (960,832) | | | | | — | | | (404) | | | (961,236) | |
| Proceeds from sales of mortgage loan receivables | (270,491) | | | | | — | | | (312,273) | | | (582,764) | |
| Non-cash disposition of loan via foreclosure | (31,249) | | | | | — | | | 0 | | | (31,249) | |
| Realized gain on sale of mortgage loan receivables | (9,596) | | | | | — | | | 8,025 | | | (1,571) | |
| | | | | | | | | |
| Accretion/amortization of discount, premium and other fees | 15,530 | | | | | — | | | 0 | | | 15,530 | |
| | | | | | | | | |
| Release of asset-specific loan loss provision via foreclosure(1) | — | | | | | 2,500 | | | — | | | 2,500 | |
| Provision for current expected credit loss (implementation impact)(2) | — | | | | | (4,964) | | | — | | | (4,964) | |
| Provision for current expected credit loss (impact to earnings)(2) | — | | | | | (18,543) | | | — | | | (18,543) | |
| Balance December 31, 2020 | $ | 2,354,059 | | | | | $ | (41,507) | | | $ | 30,518 | | | $ | 2,343,070 | |
| | | | | | | | | | | | | | | | | | | | | | | | | |
| Mortgage loan receivables held for investment, net, at amortized cost: | | | | |
| | Mortgage loans receivable | | | | Allowance for credit losses | | Mortgage loan
receivables held
for sale | | Total Mortgage loan
receivables |
| Balance December 31, 2022 | $ | 3,885,746 | | | | | $ | (20,755) | | | $ | 27,391 | | | $ | 3,892,382 | |
| Origination of mortgage loan receivables | 68,415 | | | | | — | | | — | | | 68,415 | |
| | | | | | | | | |
| Repayment of mortgage loan receivables | (726,710) | | | | | — | | | — | | | (726,710) | |
| | | | | | | | | |
| Non-cash disposition of loan via foreclosure | (91,408) | | | | | — | | | — | | | (91,408) | |
| Realized gain on sale of mortgage loan receivables | — | | | | | — | | | (523) | | | (523) | |
| | | | | | | | | |
| Accretion/amortization of discount, premium and other fees | 19,046 | | | | | — | | | — | | | 19,046 | |
| Charge-offs | — | | | | | 2,700 | | | — | | | 2,700 | |
| | | | | | | | | |
| | | | | | | | | |
| Release of provision for current expected credit loss, net | — | | | | | (25,110) | | | — | | | (25,110) | |
| Balance December 31, 2023 | $ | 3,155,089 | | | | | $ | (43,165) | | | $ | 26,868 | | | $ | 3,138,792 | |
(1)Refer to Note 5, Real Estate and Related Lease Intangibles, Net for further detail on foreclosure of real estate.
(2)
| | | | | | | | | | | | | | | | | | | | | | | | | |
| Mortgage loan receivables held for investment, net, at amortized cost: | | | | |
| | Mortgage loans receivable | | | | Allowance for credit losses | | Mortgage loan receivables held | | Total Mortgage loan
receivables |
| Balance December 31, 2021 | $ | 3,553,737 | | | | | $ | (31,752) | | | $ | — | | | $ | 3,521,985 | |
| Origination of mortgage loan receivables | 1,234,765 | | | | | — | | | 61,318 | | | 1,296,083 | |
| | | | | | | | | |
| Repayment of mortgage loan receivables | (901,082) | | | | | — | | | (68) | | | (901,150) | |
| Proceeds from sales of mortgage loan receivables | — | | | | | — | | | (29,151) | | | (29,151) | |
| Non-cash disposition of loan via foreclosure | (10,235) | | | | | — | | | — | | | (10,235) | |
| Realized gain on sale of mortgage loan receivables | 2,197 | | | | | — | | | (4,708) | | | (2,511) | |
| | | | | | | | | |
| Accretion/amortization of discount, premium and other fees | 20,759 | | | | | — | | | — | | | 20,759 | |
| Charge-offs | (14,395) | | | | | 14,395 | | | — | | | — | |
| | | | | | | | | |
| Release of provision for current expected credit loss, net | — | | | | | (3,398) | | | — | | | (3,398) | |
| | | | | | | | | |
| | | | | | | | | |
| Balance December 31, 2022 | $ | 3,885,746 | | | | | $ | (20,755) | | | $ | 27,391 | | | $ | 3,892,382 | |
(1)During the year ended December 31, 2020, the initial impactRefer to Note 5, Real Estate and Related Lease Intangibles, Net for further detail on foreclosure of the implementation of the CECL accounting standard as of January 1, 2020 is recorded against retained earnings. Subsequent remeasurement, including the period to date change for the year ended December 31, 2020, is accounted for as provision for current expected credit loss in the consolidated statements of income.real estate.
| | Mortgage loan receivables held for investment, net, at amortized cost: | |
| Mortgage loan receivables held for investment, net, at amortized cost: | |
| Mortgage loan receivables held for investment, net, at amortized cost: | |
| | | Mortgage loan receivables held for investment, net, at amortized cost: | |
| | | Mortgage loans receivable | | Mortgage loans transferred but not considered sold | | Allowance for credit losses | | Mortgage loan receivables held | | Total Mortgage loan
receivables | Mortgage loans receivable | | | | Allowance for credit losses | | Mortgage loan receivables held | | Total Mortgage loan
receivables |
| | Balance December 31, 2018 | $ | 3,318,390 | | | $ | — | | | $ | (17,900) | | | $ | 182,439 | | | $ | 3,482,929 | |
| Balance December 31, 2020 | |
| Balance December 31, 2020 | |
| Balance December 31, 2020 | |
| Origination of mortgage loan receivables | Origination of mortgage loan receivables | 1,452,049 | | | — | | | — | | | 946,178 | | | 2,398,227 | |
| Purchases of mortgage loan receivables | 0 | | | — | | | — | | | 9,934 | | | 9,934 | |
| | Repayment of mortgage loan receivables | |
| Repayment of mortgage loan receivables | |
| Repayment of mortgage loan receivables | Repayment of mortgage loan receivables | (1,531,551) | | | — | | | — | | | (795) | | | (1,532,346) | |
| Proceeds from sales of mortgage loan receivables | Proceeds from sales of mortgage loan receivables | 0 | | | (15,504) | | | — | | | (1,008,853) | | | (1,024,357) | |
| Non-cash disposition of loan via foreclosure | Non-cash disposition of loan via foreclosure | (45,529) | | | — | | | — | | | 0 | | | (45,529) | |
| Realized gain on sale of mortgage loan receivables | Realized gain on sale of mortgage loan receivables | 0 | | | — | | | — | | | 54,758 | | | 54,758 | |
| Transfer between held for investment and held for sale | 45,832 | | | 15,504 | | | — | | | (61,336) | | | 0 | |
| | Accretion/amortization of discount, premium and other fees | Accretion/amortization of discount, premium and other fees | 17,845 | | | — | | | — | | | 0 | | | 17,845 | |
| Provision for (release of) loan loss reserves | — | | | — | | | (2,600) | | | — | | | (2,600) | |
| Balance December 31, 2019 | $ | 3,257,036 | | | $ | — | | | $ | (20,500) | | | $ | 122,325 | | | $ | 3,358,861 | |
| Accretion/amortization of discount, premium and other fees | |
| Accretion/amortization of discount, premium and other fees | |
| Release of asset-specific loan loss provision via foreclosure(1) | |
| | Release of provision for current expected credit loss, net | |
| Release of provision for current expected credit loss, net | |
| Release of provision for current expected credit loss, net | |
| Balance December 31, 2021 | |
| | | | | | | | | | | | | | | | | | | | | | | | | |
| Mortgage loan receivables held for investment, net, at amortized cost: | | | | |
| | Mortgage loans receivable | | | | Allowance for credit losses | | Mortgage loan
receivables held
for sale | | Total Mortgage loan
receivables |
| | | | | | | | | |
| Balance December 31, 2017 | $ | 3,282,462 | | | | | $ | (4,000) | | | $ | 230,180 | | | $ | 3,508,642 | |
| Origination of mortgage loan receivables | 1,478,771 | | | | | — | | | 1,297,221 | | | 2,775,992 | |
| Purchases of mortgage loan receivables | 0 | | | | | — | | | 0 | | | 0 | |
| Repayment of mortgage loan receivables | (1,518,066) | | | | | — | | | (14,242) | | | (1,532,308) | |
| Proceeds from sales of mortgage loan receivables | 0 | | | | | — | | | (1,291,828) | | | (1,291,828) | |
| | | | | | | | | |
| Realized gain on sale of mortgage loan receivables | 0 | | | | | — | | | 16,511 | | | 16,511 | |
| Transfer between held for investment and held for sale | 55,403 | | | | | — | | | (55,403) | | | 0 | |
| Accretion/amortization of discount, premium and other fees | 19,820 | | | | | — | | | 0 | | | 19,820 | |
| Provision for (release of) loan loss reserves | — | | | | | (13,900) | | | — | | | (13,900) | |
| Balance December 31, 2018 | $ | 3,318,390 | | | | | $ | (17,900) | | | $ | 182,439 | | | $ | 3,482,929 | |
Item 9. Changes in and Disagreements with Accountants on Accounting and Financial Disclosure
None.
Item 9A. Controls and Procedures
Attached as exhibits to this Annual Report are certifications of the Company’s Chief Executive Officer and Chief Financial Officer, in accordance with Rule 13a-14 under the Exchange Act. This “Controls and Procedures” section includes information concerning the controls and procedures evaluation referred to in the certifications. This section should be read in conjunction with the certifications for a more complete understanding of the topics presented.
Disclosure Controls and Procedures
The management of the Company established and maintains disclosure controls and procedures that are designed to ensure that information relating to the Company and its subsidiaries required to be disclosed in the reports that are filed or submitted under the Exchange Act are recorded, processed, summarized, and reported within the time periods specified in the SEC’s rules and forms, and that such information is accumulated and communicated to management, including our Chief Executive Officer and Chief Financial Officer, as appropriate to allow timely decisions regarding required disclosures.
As of the end of the period covered by this report, our management conducted an evaluation (as required under Rules 13a-15(b) and 15d-15(b) under the Exchange Act), under the supervision and with the participation of our Chief Executive Officer and Chief Financial Officer, of the effectiveness of our disclosure controls and procedures (as defined in Rules 13a-15(e) and 15d-15(e) under the Exchange Act). Based on this evaluation, our Chief Executive Officer and Chief Financial Officer concluded that, as of December 31, 2020,2023, the end of the period covered by this report, our disclosure controls and procedures are effective at the reasonable assurance level. Notwithstanding the foregoing, a control system, no matter how well designed and operated, can provide only reasonable, not absolute, assurance that it will detect or uncover failures to disclose material information otherwise required to be set forth in our periodic reports.
Internal Control Over Financial Reporting
(a) Management’s annual report on internal control over financial reporting.
Management is responsible for establishing and maintaining adequate internal control over financial reporting. As defined in Exchange Act Rules 13a-15(f) and 15d-15(f), internal control over financial reporting is a process designed by, or under the supervision of, the principal executive and principal financial officer and effected by the board of directors, management and other personnel, to provide reasonable assurance regarding the reliability of financial reporting and the preparation of financial statements for external purposes in accordance with generally accepted accounting principles and includes those policies and procedures that: (i) pertain to the maintenance of records that in reasonable detail accurately and fairly reflect the transactions and dispositions of the assets of the Company; (ii) provide reasonable assurance that transactions are recorded as necessary to permit preparation of financial statements in accordance with generally accepted accounting principles, and that receipts and expenditures of the Company are being made only in accordance with authorizations of management and directors of the Company; and (iii) provide reasonable assurance regarding prevention or timely detection of unauthorized acquisition, use or disposition of the Company’s assets that could have a material effect on the financial statements.
Under the supervision and with the participation of management, including the Chief Executive Officer and Chief Financial Officer, the Company carried out an evaluation of the effectiveness of its internal control over financial reporting as of December 31, 2020,2023, based on the Internal Control-Integrated Framework (2013) issued by the Committee of Sponsoring Organizations of the Treadway Commission (COSO). Based upon this evaluation, management has concluded that the Company’s internal control over financial reporting was effective as of December 31, 2020.2023.
The effectiveness of our internal control over financial reporting as of December 31, 20202023 has been audited by PricewaterhouseCoopersErnst & Young LLP, an independent registered public accounting firm, as stated in its report which is included herein.
(b) Changes in internal control over financial reporting.
There have not been any changes in the Company’s internal control over financial reporting (as defined in Rules 13a-15(f) and 15d-15(f) under the Exchange Act) during the most recent fiscal quarter ended December 31, 20202023 that materially affected, or are reasonably likely to materially affect, the Company’s internal control over financial reporting.
Inherent Limitations on Effectiveness of Controls
The Company’s management, including the Chief Executive Officer and Chief Financial Officer, does not expect that our disclosure controls and procedures or our internal control over financial reporting will prevent or detect all errors and all fraud. A control system, no matter how well designed and operated, can provide only reasonable, not absolute, assurance that the control system’s objectives will be met. The design of a control system must reflect the fact that there are resource constraints, and the benefits of controls must be considered relative to their costs.
Item9B.Item 9B. Other Information
None.
Item 9C. Disclosure Regarding Foreign Jurisdictions that Prevent Inspections
None.
Part III
Item 10. Directors, Executive Officers and Corporate Governance
The information required by Item 10 will be set forth in the Company’s definitive proxy statement for its 2023 annual meeting of shareholders expected to be held on June 1, 2021,stockholders and is incorporated herein by reference.
Item 11. Executive Compensation
The information required by Item 11 will be set forth in the Company’s definitive proxy statement for its annual 2023 meeting of shareholders expected to be held on June 1, 2021,stockholders and is incorporated herein by reference.
Item 12. Security Ownership of Certain Beneficial Owners and Management and Related Stockholder Matters
The information required by this itemItem 12 regarding security ownership of certain beneficial owners, directors and executive officers will be set forth in the Company’s definitive proxy statement for its annual 2023 meeting of shareholders expected to be held on June 1, 2021,stockholders and is incorporated herein by reference.
The information required by this itemItem 12 regarding our equity compensation plans in incorporated by reference from Item 5 of this Annual Report on Form 10-K.
Item 13. Certain Relationships and Related Transactions, and Director Independence
The information required by Item 13 will be set forth in the Company’s definitive proxy statement for its annual 2023 meeting of shareholders expected to be held on June 1, 2021,stockholders and is incorporated herein by reference.
Item 14. Principal AccountingAccountant Fees and Services
The information required by Item 14 will be set forth in the Company’s definitive proxy statement for its annual 2023 meeting of shareholders expected to be held on June 1, 2021,stockholders and is incorporated herein by reference.
Part IV
Item 15. Exhibits and Financial Statement Schedules
The following documents are filed or incorporated by reference as part of this Annual Report:
| | | | | |
| (a)1. Consolidated Financial Statements | |
| |
| |
| |
| |
| |
| |
| |
| |
| |
| |
| (a)2. Financial Statement Schedules | |
| |
| |
| |
(a)3. Exhibits required to be filed by Item 601 of Regulation S-K
The exhibits listed on the exhibit index preceding the signature page are filed as part of, or hereby incorporated by reference into this Form 10-K.
Item 16. Form 10-K Summary
None.
| | | | | | | | | | | | |
| EXHIBIT INDEX | | | | |
| | | | | | |
EXHIBIT
NO. | | DESCRIPTION | | | | |
| | | | | | |
| | | | | | |
| | | | | | |
| | | | | | |
| | | | | | |
| | | | | | |
| | | | | | |
| | | | | | |
| | | | | | |
| | | | | | |
| | | | | | |
| | | | | | |
| | | | | | |
| | | | | | |
| | | | | | |
| | | | | | |
| | | | | | |
| | | | | | |
| | | | | | |
| | | | | | |
| | | | | | |
| | | | | | |
| | | | | | |
| | First Supplemental Indenture for the 2017 Notes, dated as of March 12, 2014, by and among certain subsidiaries of Ladder Capital Corp, as guarantors, Ladder Capital Finance Holdings LLLP and Ladder Capital Finance Corporation, as co-issuers, and Wilmington Trust, National Association, as trustee (incorporated by reference to Exhibit 4.9 to the Company’s Form 10-K filed on March 6, 2015) | | | | |
| | Second Supplemental Indenture for the 2017 Notes, dated as of March 28, 2014, by and among Ladder Capital Corp, as guarantor, Ladder Capital Finance Holdings LLLP and Ladder Capital Finance Corporation, as co-issuers, and Wilmington Trust, National Association, as trustee (incorporated by reference to Exhibit 4.1 to the Company’s Form 8-K filed on April 3, 2014) | | | | |
| | Third Supplemental Indenture for the 2017 Notes, dated as of December 31, 2014, by and among Lafayette Park JV Member LLC, Series REIT of Ladder Midco LLC, Series TRS of Ladder Midco LLC, Series REIT of Ladder Midco II LLC, Series TRS of Ladder Midco II LLC, Series REIT of Ladder Capital Finance Holdings LLLP, Series TRS of Ladder Capital Finance Holdings LLLP, LC TRS I LLC, LC TRS III LLC and Ladder Capital Insurance LLC, as guarantors, Ladder Capital Finance Holdings LLLP and Ladder Capital Finance Corporation, as co-issuers, and Wilmington Trust, National Association, as trustee (incorporated by reference to Exhibit 4.1 to the Company’s Form 8-K filed on January 5, 2015) | | | | |
| | | | | | |
| | First Supplemental Indenture for the 2021 Notes, dated as of December 31, 2014, by and among Lafayette Park JV Member LLC, Series REIT of Ladder Midco LLC, Series TRS of Ladder Midco LLC, Series REIT of Ladder Midco II LLC, Series TRS of Ladder Midco II LLC, Series REIT of Ladder Capital Finance Holdings LLLP, Series TRS of Ladder Capital Finance Holdings LLLP, LC TRS I LLC, LC TRS III LLC and Ladder Capital Insurance LLC, as guarantors, Ladder Capital Finance Holdings LLLP and Ladder Capital Finance Corporation, as co-issuers, and Wilmington Trust, National Association, as trustee (incorporated by reference to Exhibit 4.2 to the Company’s Form 8-K filed on January 5, 2015) | | | | |
| | Second Supplemental Indenture for the 2021 Notes, dated as of March 1, 2016, by and among Grand Rapids JV Member LLC, Pelham JV Member LLC, CanPac JV LLC, CanPac JV Member II Partner LLC, CanPac JV Member II LLC, as guarantors, Ladder Capital Finance Holdings LLLP and Ladder Capital Finance Corporation, as co-issuers, and Wilmington Trust, National Association, as trustee (incorporated by reference to Exhibit 4.10 to the Company’s Form 10-K filed on February 24, 2017) | | | | |
| | Fourth Supplemental Indenture for the 2017 Notes, dated as of March 1, 2016, by and among Grand Rapids JV Member LLC, Pelham JV Member LLC, CanPac JV LLC, CanPac JV Member II Partner LLC, CanPac JV Member II LLC, as guarantors, Ladder Capital Finance Holdings LLLP and Ladder Capital Finance Corporation, as co-issuers, and Wilmington Trust, National Association, as trustee (incorporated by reference to Exhibit 4.11 to the Company’s Form 10-K filed on February 24, 2017) | | | | |
| | Third Supplemental Indenture for the 2021 Notes, dated as of September 13, 2016, by and among Tuebor TRS IV LLC, as guarantor, Ladder Capital Finance Holdings LLLP and Ladder Capital Finance Corporation, as co-issuers, and Wilmington Trust, National Association, as trustee (incorporated by reference to Exhibit 4.12 to the Company’s Form 10-K filed on February 24, 2017) | | | | |
| | | | | | | | | | | | |
EXHIBIT INDEX | | | | |
| | | | | | |
EXHIBIT
NO. | | DESCRIPTION | | | | |
| | Fifth Supplemental Indenture for the 2017 Notes, dated as of September 13, 2016, by and among Tuebor TRS IV LLC, as guarantor, Ladder Capital Finance Holdings LLLP and Ladder Capital Finance Corporation, as co-issuers, and Wilmington Trust, National Association, as trustee (incorporated by reference to Exhibit 4.13 to the Company’s Form 10-K filed on February 24, 2017) | | | | |
| | | | | | |
| | | | | | |
| | | | | | |
| | | | | | |
| | | | | | |
| | | | | | |
| | | | | | |
| | | | | | |
| | Indenture, for 2029 Notes, dated June 23, 2021, among Ladder Capital Finance Holdings LLLP, Ladder Capital Finance Corporation, the guarantors party thereto and Wilmington Trust, National Association, as trustee (incorporated by reference to Exhibit 4.1 to the Company's Current Report on Form 8-K, filed on June 23, 2021). | | | | |
| | | | | | |
| | | | | | |
| | | | | | |
| | | | | | |
| | | | | | |
| | | | | | |
| | | | | | |
| | | | | | |
| | | | | | |
| | Counterpart Agreement, dated as of December 31, 2014, by and among Lafayette Park JV Member LLC, Series REIT of Ladder Midco LLC, Series TRS of Ladder Midco LLC, Series REIT of Ladder Midco II LLC, Series TRS of Ladder Midco II LLC, Series REIT of Ladder Capital Finance Holdings LLLP, Series TRS of Ladder Capital Finance Holdings LLLP, LC TRS I LLC, LC TRS III LLC and Ladder Capital Insurance LLC, and with respect to Section 3 thereof only, Ladder Capital Finance Holdings LLLP, Ladder Midco LLC and Ladder Midco II LLC (incorporated by reference to Exhibit 10.1 to the Company’s Form 8-K filed on January 5, 2015) | | | | |
| | | | | | |
| | | | | | |
| | | | | | |
| | | | | | |
| | | | | | |
| | | | | | | | | | | | |
EXHIBIT INDEX | | | | |
| | | | | | |
EXHIBIT
NO. | | DESCRIPTION | | | | |
| | | | | | |
| | | | | | |
| | | | | | |
| | | | | | |
| | | | | | |
| | | | | | |
| | | | | | |
| | | | | | |
| | | | | | |
| | | | | | |
| | | | | | |
| | | | | | |
| | | | | | |
| | | | | | |
| | | | | | |
| | | | | | |
| | | | | | |
| | | | | | |
| | | | | | |
| | | | | | |
| | | | | | | | | | | | |
| EXHIBIT INDEX | | | | |
| | | | | | |
EXHIBIT
NO. | | DESCRIPTION | | | | |
| | | | | | |
| | | | | | |
| | | | | | |
| | | | | | |
| | | | | | |
| | | | | | |
| | | | | | |
| | | | | | |
| | | | | | |
| | | | | | |
| | | | | | | | | | | | |
| | | | | |
| | | | | | |
EXHIBIT
NO. | | DESCRIPTION | | | | |
| 101 | | Inline Interactive Data Files Pursuant to Rule 405 of Regulation S-T: (i) the Consolidated Balance Sheets as of December 31, 2020 and December 31, 2019; (ii) the Consolidated Statements of Income for the years ended December 31, 2020, 2019 and 2018; (iii) the Consolidated Statements of Comprehensive Income for the years ended December 31, 2020, 2019 and 2018; (iv) the Consolidated Statement of Changes in Equity for the years ended December 31, 2020, 2019 and 2018; (v) the Consolidated Statements of Cash Flows for the years ended December 31, 2020, 2019 and 2018; and (vi) the Notes to the Consolidated Financial Statements.101.SCH* iXBRL Schema Document.
101.CAL* iXBRL Calculation Linkbase Document.
101.DEF* iXBRL Definition Linkbase Document.
101.LAB* iXBRL Label Linkbase Document.
101.PRE* iXBRL Presentation Linkbase Document. | | | | |
| 104 | | Cover Page Interactive Data File (formatted as Inline XBRL and contained in Exhibit 101) | | | | |
* The certifications attached hereto as Exhibits 32.1 and 32.2 are furnished to the SEC pursuant to Section 906 of the Sarbanes-Oxley Act of 2002 and shall not be deemed “filed” for purposes of Section 18 of the Exchange Act, nor shall they be deemed incorporated by reference in any filing under the Securities Act, except as shall be expressly set forth by specific reference in such filing.
# Management contract or compensatory plan or arrangement.
SIGNATURES
Pursuant to the requirements of the Securities Exchange Act of 1934, the Registrant has duly caused this report to be signed on its behalf by the undersigned, thereunto duly authorized.
| | | | | | | | | | | |
| | | LADDER CAPITAL CORP |
| | | (Registrant) |
| | |
| | |
Date: February 25, 202112, 2024 | | By: | /s/ MARC FOXPAUL J. MICELI |
| | | | Marc FoxPaul J. Miceli |
| | | | Chief Financial Officer |
Pursuant to the requirements of the Securities Exchange Act of 1934, this report has been signed below by the following persons on behalf of the Registrant and in the capacities and on the dates indicated.
| | | | | | | | | | | | | | |
| Signature | | Title | | Date |
| | | | |
| /s/ BRIAN HARRIS | | Chief Executive Officer and Director (Principal Executive Officer) | | February 25, 202112, 2024 |
| Brian Harris | | | |
| | | | |
/s/ MARC FOXPAUL J. MICELI | | Chief Financial Officer (Principal Financial Officer) | | February 25, 202112, 2024 |
Marc FoxPaul J. Miceli | | | | |
| | | | |
/s/ KEVIN MOCLAIRANTHONY V. ESPOSITO | | Chief Accounting Officer (Principal Accounting Officer) | | February 25, 202112, 2024 |
Kevin MoclairAnthony V. Esposito | | | | |
| | | | |
| /s/ ALAN FISHMAN | | Non-Executive Chairman and Director | | February 25, 202112, 2024 |
| Alan Fishman | | | | |
| | | | |
| /s/ MARK ALEXANDER | | Director | | February 25, 202112, 2024 |
| Mark Alexander | | | | |
| | | | |
| /s/ DOUGLAS DURST | | Director | | February 25, 202112, 2024 |
| Douglas Durst | | | | |
| | | | |
| /s/ PAMELA MCCORMACK | | Director | | February 25, 202112, 2024 |
| Pamela McCormack | | | | |
| | | | |
| /s/ JEFFREY STEINER | | Director | | February 25, 202112, 2024 |
| Jeffrey Steiner | | | | |
| | | | |
| /s/ DAVID WEINER | | Director | | February 25, 202112, 2024 |
| David Weiner | | | | |