UNITED STATES SECURITIES AND EXCHANGE COMMISSION
Washington, DC 20549
Form 10-K
|
| | |
| | þ | ANNUAL REPORT PURSUANT TO SECTION 13 OR 15(d) OF THE SECURITIES EXCHANGE ACT OF 1934 |
| | | For the fiscal year ended September 30, 20162017 |
OR
|
| | |
| | ¨
| TRANSITION REPORT PURSUANT TO SECTION 13 OR 15(d) OF THE SECURITIES EXCHANGE ACT OF 1934 |
COMMISSION FILE NUMBER: 1-35999
Fifth Street Senior Floating Rate Corp.OaktreeStrategic Income Corporation
(EXACT NAME OF REGISTRANT AS SPECIFIED IN ITS CHARTER)
|
| | |
DELAWARE (State or jurisdiction of
incorporation or organization) | | 61-1713295 (I.R.S. Employer
Identification No.) |
| | | |
777 West Putnam333 South Grand Avenue, 3rd28th Floor
Greenwich, CTLos Angeles, CA
(Address of principal executive office) | | 0683090071
(Zip Code) |
REGISTRANT’S TELEPHONE NUMBER, INCLUDING AREA CODE:
(203) 681-3600(213) 830-6300
SECURITIES REGISTERED PURSUANT TO SECTION 12(b) OF THE ACT:
|
| | |
| Title of Each Class | | Name of Each Exchange on Which Registered |
| Common Stock, par value $0.01 per share | | The NASDAQ Global Select Market |
SECURITIES REGISTERED PURSUANT TO SECTION 12(g) OF THE ACT: None
Indicate by check mark if the registrant is a well-known seasoned issuer, as defined in Rule 405 of the Securities Act. Yes ¨ No þ
Indicate by check mark if the registrant is not required to file reports pursuant to Section 13 or Section 15(d) of the Act. Yes ¨ No þ
Indicate by check mark whether the registrant (1) has filed all reports required to be filed by Section 13 or 15(d) of the Securities Exchange Act of 1934 during the preceding 12 months (or for such shorter periods as the registrant was required to file such reports), and (2) has been subject to such filing requirements for the past 90 days. Yes þ No ¨
Indicate by check mark whether the registrant has submitted electronically and posted on its corporate Web site, if any, every Interactive Data File required to be submitted and posted pursuant to Rule 405 of Regulation S-T during the preceding 12 months (or for such shorter period that the registrant was required to submit and post such files). Yes ¨ No ¨
Indicate by check mark if disclosure of delinquent filers pursuant to Item 405 of Regulation S-K is not contained herein, and will not be contained, to the best of registrant’s knowledge, in definitive proxy or information statements incorporated by reference in Part III of this Form 10-K or any amendment to this Form 10-K. þ
Indicate by check mark whether the registrant is a large accelerated filer, an accelerated filer, a non-accelerated filer, or a smaller reporting company. See the definitions of “large accelerated filer,” “accelerated filer” and “smaller reporting company” in Rule 12b-2 of the Exchange Act. (Check one):
|
| | | | | | |
Large accelerated filer ¨o | | Accelerated filer þ | | Non-accelerated filer ¨o | | Smaller reporting company ¨o |
| | | | | (Do not check if a smaller reporting company) | | |
| | | | | | |
Emerging growth company þ
| | If an emerging growth company, indicate by check mark if the registrant has elected not to use the extended transition period for complying with any new or revised financial accounting standards provided pursuant to Section 13(a) of the Exchange Act þ
|
Indicate by check mark whether the registrant is a shell company (as defined in Rule 12b-2 of the Act) Yes ¨ No þ
The aggregate market value of the registrant’s common stock held by non-affiliates of the registrant as of March 31, 20162017 is $211,431,851.190,396,952. For the purposes of calculating the aggregate market value of common stock held by non-affiliates, the registrant has excluded (1) shares held by its current directors and officers and (2) those reported to be held by Fifth Street Holdings L.P. and Leonard M. Tannenbaum and his other affiliates. The registrant had 29,466,768 shares of common stock outstanding as of December 13, 2016.7, 2017.
DOCUMENTS INCORPORATED BY REFERENCE
Portions of the registrant’s definitive Proxy Statement relating to the registrant’s 20172018 Annual Meeting of Stockholders, to be filed with the Securities and Exchange Commission within 120 days following the end of the Company’s fiscal year, are incorporated by reference in Part III of this Annual Report on Form 10-K as indicated herein.
OAKTREE STRATEGIC INCOME CORPORATION
FORM 10-K FOR THE YEAR ENDED SEPTEMBER 30, 2017
TABLE OF CONTENTS
|
| | |
| | |
| | Page |
| | | |
| | PART I | |
| Item 1. | | |
| Item 1A. | | |
| Item 1B. | | |
| Item 2. | | |
| Item 3. | | |
| Item 4. | | |
| | PART II | |
| Item 5. | | |
| Item 6. | | |
| Item 7. | | |
| Item 7A. | | |
| Item 8. | | |
| Item 9. | | |
| Item 9A. | | |
| Item 9B. | | |
| | PART III | |
| Item 10. | | |
| Item 11. | | |
| Item 12. | | |
| Item 13. | | |
| Item 14. | | |
| | PART IV | |
| Item 15. | | |
| |
| |
PART I
Item 1. Business
General
Oaktree Strategic Income Corporation (formerly known as Fifth Street Senior Floating Rate Corp. through October 17, 2017), a Delaware corporation, or together with its subsidiaries, where applicable, the Company, which may also be referred to as "we", "us" or "our", is a specialty finance company that isdedicated to providing customized capital solutions for middle-market companies in both the syndicated and private placement markets. We were formed in May 2013 as a Delaware corporation, commenced operations on June 29, 2013, and currently operate as a closed-end, externally managed, non-diversified management investment company. We havecompany that has elected to be regulated as a business development company or BDC, under the Investment Company Act of 1940, as amended, or the 1940 Act. In addition, we have qualified and elected to be treated as a regulated investment company, or RIC, under the Internal Revenue Code of 1986, as amended, or the Code, for tax purposes. See “ - Taxation“Taxation as a Regulated Investment Company.” As a RIC, we generally will not have to pay corporate-level U.S. federal income taxes on any net ordinary income or net realized capital gains that we distribute to our stockholders if we meet certain source-of-income, income distribution and asset diversification requirements. We are managed by Fifth Street Management LLC, which we also refer to as "Fifth Street Management" or our "investment adviser." Also, we are an “emerging growth company,” as defined in the Jumpstart Our Business Startups Act of 2012, or JOBS Act, and take advantage of the exemption for emerging growth companies allowing us to temporarily forgo the auditor attestation requirements of Section 404(b) of the Sarbanes-Oxley Act of 2002.2002, or the Sarbanes-Oxley Act. We do not take advantage of other disclosure or reporting exemptions for emerging growth companies under the JOBS Act.
OurAs of October 17, 2017, we are externally managed by Oaktree Capital Management, L.P., which we also refer to as “Oaktree” or our “Investment Adviser,” pursuant to an Investment Advisory Agreement, dated October 17, 2017, or the New Investment Advisory Agreement, between the Company and Oaktree. Oaktree is a subsidiary of Oaktree Capital Group, LLC, or OCG, a global investment objective ismanager specializing in alternative investments. Oaktree Fund Administration, LLC, which we refer to maximizeas “Oaktree Administrator” or “OFA”, a subsidiary of our portfolio’s total returnInvestment Adviser, also provides certain administrative and other services necessary for us to operate. Prior to October 17, 2017, we were externally managed and advised by generatingFifth Street Management LLC, which we refer to as our “Former Adviser” or “Fifth Street Management.” For more information about the New Investment Advisory Agreement and Oaktree see “-The Investment Adviser” below.
We seek to generate a stable source of current income from our debt investments while seekingminimizing the risk of principal loss and, to preserve our capital. We investa lesser extent, capital appreciation by providing middle-market companies with primarily in senior secured loans, including first lien unitranche and second liensecured debt instruments,financings that pay us interest at rates which are determined periodically on the basis of a floating base lending rate, maderate. We invest in companies across a variety of industries that typically possess business models we expect to private middle market companies whose debt is rated below investment grade,be resilient in the future with underlying fundamentals that will provide strength in future downturns. We intend to deploy capital across credit and economic cycles with a focus on long-term results, which we referbelieve will enable us to collectively as “senior loans.”build lasting partnerships with financial sponsors and management teams. Under normal market conditions, through January 18, 2018, at least 80% of the value of our net assets plus borrowings for investment purposes will be invested in floating rate senior loans.loans, which include both first and second lien secured debt financings. We may also invest in unsecured loans, including subordinated loans, issued by private middle marketmiddle-market companies and, to a lesser extent, senior and subordinated loans issued by public companies and equity investments. This policy may be changed by our Board of Directors with at least 60 days’ prior written notice to stockholders to the extent such a change would not affect our ability to maintain our election as a BDC.
SeniorWe have invested primarily in senior secured loans, typicallyincluding first lien, unitranche and second lien debt instruments, that pay interest at rates which are determined periodically on the basis of a floating base lending rate, primarily the London-Interbank Offered Rate, or LIBOR, plus a premium. The senior loans in which we invest are typically made to U.S. and, to a limited extent, non-U.S. corporations, partnerships and other business entities in the middle-market which operate in various industries and geographical regions. We generally invest in securities that are rated below investment grade by rating agencies or that would be rated below investment grade if they were rated. Below investment grade securities, which are often referred to as “high yield” and “junk,” have predominantly speculative characteristics with respect to the issuer’s capacity to pay interest and repay principal. We target senior loans that generally bear annual interest at a rate of LIBOR plus a 5.0% premium (with a LIBOR floor), and for our investments that are not considered senior loans, we target an annual interest rate of LIBOR plus a 9.0% premium (with a LIBOR floor). If the LIBOR floor is higher than the current applicable LIBOR rate, the LIBOR floor will be deemed to be the applicable LIBOR rate. We may make investments with interest rates that differ from our target rates and will periodically reassess our target rates in light of prevailing market conditions.
We seek to invest in senior loans made primarily to private, leveraged, middle marketOur Former Adviser targeted middle-market companies with approximately $20 million to $120 million of EBITDA (Earnings(generally defined as Earnings before Interest, Taxes, Depreciation and Amortization).
Our business model is focused primarily onInvestment Adviser intends to reposition our portfolio in the direct originationnear-term in order to (1) rotate out of a small number of investments through portfolio companies or their financial sponsors. Our investments generally range in size between $3 million and $30 million each, although we expect that this investment size will vary proportionately withit views as challenged, (2) focus on increasing the size of our capital base. In addition,core private investments and (3) supplement the portfolio with broadly syndicated and select privately placed loans. We expect that our Investment Adviser will focus on middle-market companies, which we may invest a portiondefine as companies with enterprise values of between $100 and $750 million. Going forward, we expect our portfolio in other types of investments, which we refer to as opportunistic investments, which are not our primary focus, but are intended to enhance our overall returns. These opportunistic investments may include direct investments in public companies that are not thinly traded and securities of leveraged companies located in select countries outside of the United States. We may invest up to 30% of our total assets in such opportunistic investments, includingprimarily first lien floating rate senior loans issued by non-U.S. issuers, subject to compliance with our regulatory obligations as a BDC under the 1940 Act. See “ - Business Development Company Regulations.”secured financings.
We were formed in May 2013 as a Delaware corporation and commenced operations on June 29, 2013.
From the time we commenced operationsinception through September 30, 2016,2017, we have originated over $1.7$2.0 billion of funded debt investments. As of September 30, 2016, ourOur portfolio totaled $573.6$560.4 million at fair value as of September 30, 2017 and was comprised of 63 investments,67 portfolio companies, including our investment in subordinated notes and limited liability company, or LLC, equity interests in FSFR Glick JV LLC, or FSFR Glick JV. At fair value as of September 30, 2016, 87.6%2017, 89.5% of our portfolio consisted of senior secured floating rate debt investments, and 11.0%10.3% of the portfolio consisted of investments in the subordinated notes and LLC equity interests of FSFR Glick JV.JV and 0.2% consisted of equity investments in other portfolio companies. The weighted average annual yield of our debt investments as of September 30, 2016,2017, including the return on our subordinated note investment in FSFR Glick JV, was approximately 8.58%7.5%, of which 8.29% representedincluding 7.3% representing cash payments. The weighted average annual yield of
our debt investments is determined before the payment of, and therefore does not take into account, the payment of all of our and(and our consolidated subsidiaries’) expenses and the payment by an investor of any stockholder transaction expenses, and does not represent the return on investment for our stockholders.
As a BDC, we are required to comply with certain regulatory requirements, including limitations on our use of debt. We are permitted to, and expect to continue to, finance our investments through borrowings. However, as a BDC,business development company, we are generally only generally allowed to borrow amounts such that our asset coverage, as defined in the 1940 Act, equals at least 200% after such borrowing. The amount of leverage that we employ will depend on our assessment of market conditions and other factors at the time of any proposed borrowing, such as the maturity, covenant package and rate structure of the proposed borrowings, our ability to raise funds through the issuance of shares of our common stock and the risks of such borrowings within the context of our investment outlook. Ultimately, we only intend to use leverage if the expected returns from borrowing to make investments will exceed the cost of such borrowing. As of September 30, 2016,2017, we had a debt to equity ratio of 0.90x (i.e., one dollar of equity for each $0.90 of debt outstanding).
Our principal executive office is located at 777 West Putnam Avenue, 3rd Floor, Greenwich, Connecticut 06830 and our telephone number is (203) 681-3600.
Joint Venture
We and GF Equity Funding 2014 LLC, or GF Equity Funding, also co-invest through an unconsolidated, Delaware limited liability company, FSFR Glick JV. FSFR Glick JV was formed in October 2014 and began investing in April 2015 primarily in senior secured loans of middle market companies. We co-invest in these securities with GF Equity Funding through our investment in FSFR Glick JV. FSFR Glick JV is managed by a four person board of directors, two of whom are selected by us and two of whom are selected by GF Equity Funding. FSFR Glick JV is capitalized as transactions are completed, and all portfolio decisions and investment decisions in respect of the FSFR Glick JV must be approved by anits investment committee of the FSFR Glick JV consisting of one representative of the Companyselected by us and one representative ofselected by GF Equity Funding (with approval of each required). The members provide capital to FSFR Glick JV in exchange for limited liability company, or LLC equity interests, and the Company and GF Debt Funding 2014 LLC, or GF Debt Funding, an entity advised by affiliates of GF Equity Funding, provide capital to the FSFR Glick JV in exchange for subordinated notes, or the Subordinated Notes. Additionally, FSFR Glick JV has a senior revolving credit facility with Credit SuisseDeutsche Bank AG, Cayman IslandNew York Branch, or the Credit SuisseDeutsche Bank facility, with a stated maturity date of April 17, 2023, which, as of September 30, 2016,2017, permits up to $200.0 million of borrowings. As of September 30, 20162017 and September 30, 2015,2016, FSFR Glick JV had total capital commitments of $100.0 million, $87.5 million of which was from the Company and the remaining $12.5 million from GF Equity Funding and GF Debt Funding. At September 30, 2016,2017, we had funded approximately $71.1$71.4 million of our commitment. As of September 30, 2016,2017, our investment in SLFFSFR Glick JV I was approximately $63.3$57.6 million at fair value. We do not consolidate SLFFSFR Glick JV I in our Consolidated Financial Statements.
Organizational Structure
The following diagram shows a simplified organizational structure reflecting our relationship with Oaktree and OFA, our Investment Adviser and administrator, respectively, as of October 17, 2017 and our direct and indirect ownership interest in certain of our subsidiaries as of such date:
Our principal executive office is located at 333 South Grand Avenue, 28th Floor, Los Angeles, CA 90071 and our telephone number is (213) 830-6300.
The Investment Adviser
WeAs of October 17, 2017, we are externally managed and advised by Fifth Street Management,Oaktree, a registered investment adviser under the Investment Advisers Act of 1940, as amended, or the Advisers Act, thatAct. Oaktree, subject to the overall supervision of our Board of Directors, manages our day-to-day operations, and provides investment advisory services to us pursuant to the New Investment Advisory Agreement.
Our Investment Adviser was formed in April 1995 and is partiallya premier credit manager and indirectly ownedleader among alternative investment managers headquartered in Los Angeles, California. Oaktree has $99.5 billion in assets under management as of September 30, 2017, with approximately 70% in credit strategies. The firm has an extensive global investment platform with more than 900 employees, including over 250 investment professionals who have significant origination, structuring and underwriting expertise. Oaktree’s disciplined investment philosophy and commitment to credit investing and lending have been demonstrated across market cycles for more than 20 years. Oaktree emphasizes an opportunistic, value-oriented and risk-controlled approach to investments in distressed debt, corporate debt (including mezzanine finance, high yield debt and senior loans), control investing, real estate, convertible securities and listed equities. Oaktree manages assets for a wide variety of clients, including many of the most significant investors in the world. As of September 30, 2017, this client base includes 75 of the 100 largest U.S. pension plans, the main pension fund of 38 states in the United States, over 400 corporations, over 350 university, charitable and other endowments and foundations, over 350 non-U.S. institutional investors and 16 sovereign wealth funds.
Members of our Investment Adviser’s Strategic Credit team have, in the aggregate, over 50 years of investment experience and include professionals who have experience structuring new investments and restructuring existing capital structures in order to maximize recoveries. Our Investment Adviser’s Strategic Credit team is comprised of individuals with a diversity of backgrounds, including, as of the date hereof, former investment bankers, corporate/restructuring lawyers, a doctor, private equity investors, and management consultants. We believe this diversity of experience helps enhance the investment process by bringing different perspectives to credit discussions.
The Transaction and the New Investment Advisory Agreement with Oaktree
On July 13, 2017, Oaktree, entered into an Asset Purchase Agreement, or the Purchase Agreement, with our Former Adviser, and for certain limited purposes, Fifth Street Asset Management Inc., or FSAM, the indirect, partial owner of our Former Adviser, and Fifth Street Holdings L.P., the direct, partial owner of our Former Adviser.
In order to ensure that the transactions contemplated by the Purchase Agreement, or the Transaction, complied with Section 15(f) of the 1940 Act, our Investment Adviser and our Former Adviser agreed to certain conditions. First, for a publicly-traded, nationally-recognized asset manager with over $5 billionperiod of assetsthree years after the closing of the Transaction, at least 75% of the members of our Board of Directors must not be interested persons of Oaktree or our Former Adviser. Second, an “unfair burden” must not be imposed on us as a result of the closing of the Transaction or any express or implied terms, conditions or understandings applicable thereto during the two-year period after the closing of the Transaction. In addition, for the two-year period commencing on October 17, 2017, Oaktree will waive,
to the extent necessary, any management or incentive fees payable under management asthe New Investment Advisory Agreement that exceed what would have been paid to the Former Adviser in the aggregate under the Former Investment Advisory Agreement.
On September 7, 2017, we held a special meeting of September 30, 2016.stockholders, or the Special Meeting. At the Special Meeting, our stockholders approved the New Investment Advisory Agreement to take effect upon the closing of the Transaction. Our investment adviser serves pursuantstockholders also approved, contingent upon the closing of the Transaction, the election of John B. Frank, Marc H. Gamsin, Craig Jacobson, Richard G. Ruben and Bruce Zimmerman to an investment advisory agreement adoptedserve on our Board of Directors, each of whom commenced serving on our Board of Directors on October 17, 2017. In addition, in accordanceconnection with the Advisers Act, under which it receives from us a percentageTransaction, Edgar Lee became our Chief Executive Officer and Chief Investment Officer, Mathew Pendo became our Chief Operating Officer, Mel Carlisle became our Chief Financial Officer and Treasurer and Kimberly Larin became our Chief Compliance Officer.
Upon the closing of our gross assets as a management fee and a percentage of our ordinary income and capital gains as an incentive fee. See “- Investment Advisory Agreement.”
The key principals and members of senior management of our investment adviser are Leonard M. Tannenbaum, our investment adviser’s chief executive officer, Bernard D. Berman, our chairman and our investment adviser’s president, Todd G. Owens, our president, Ivelin M. Dimitrov, our chief executive officer and the chief investment officer of our investment adviser, and Alexander C. Frank, the chief operating officer of our investment adviser. Mr. Tannenbaum has led the investment of over $10 billion in small and mid-sized companies and the origination of over 300 investment transactions since 1998. Our investment adviser also currently serves asTransaction on October 17, 2017, Oaktree became the investment adviser to another business development company,each of Oaktree Specialty Lending Corporation (formerly known as Fifth Street Finance Corp.), or FSC,OCSL, and us, and Oaktree paid gross cash consideration of $320 million to our Former Adviser. The closing of the Transaction resulted in addition to various other private fund vehicles. Since we focusing on senior loans that bear interest onan assignment for purposes of the basis1940 Act of the investment advisory agreement between our Former Adviser and us, or the Former Investment Advisory Agreement, and, as a floating base lending rate, our primary investment focus differs from that of FSC, which focuses more generally on debt and equity investments in small and mid-sized companies. However, there may be overlap inresult, its immediate termination. The material terms of the services to be provided under the New Investment Advisory Agreement, other than the fee structure, are substantially the same as the Former Investment Advisory Agreement, except that services are provided by Oaktree.
On October 17, 2017, each of Bernard D. Berman, James Castro-Blanco, Richard P. Dutkiewicz, Alexander C. Frank and Jeffrey R. Kay resigned as a member of our targeted investments.Board of Directors. In addition, on October 17, 2017, each of Mr. Berman, our former Chief Executive Officer, Mr. Steven Noreika, our former Chief Financial Officer, and Ms. Kerry Acocella, our former Secretary and Chief Compliance Officer, resigned from his or her role as an officer of the Company.
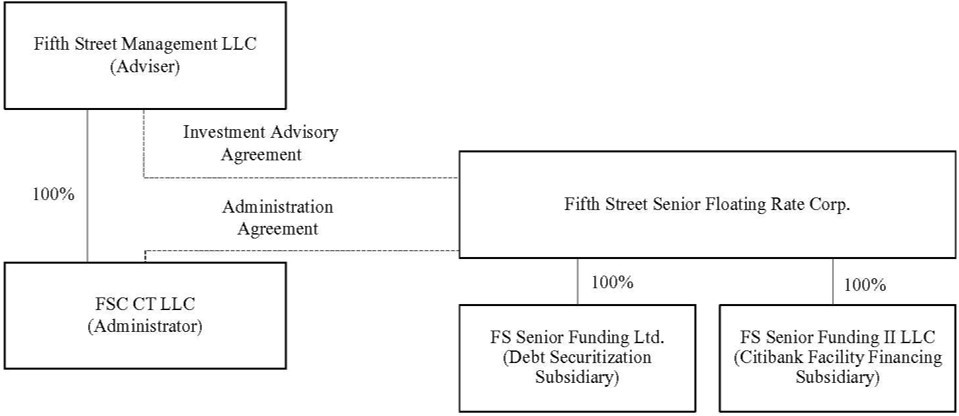
Our administrator,Former Adviser and Administrator
Prior to October 17, 2017, we were externally managed and advised by our Former Adviser, which was a registered investment adviser under the Advisers Act. Subject to the overall supervision of our Board of Directors, our Former Adviser managed our day-to-day operations and provided us with investment advisory services similar to those now provided by Oaktree as described below under “-New Investment Advisory Agreement.” FSC CT LLC, or FSC CT,our Former Administrator, was a wholly-owned subsidiary of Fifth Street Management, provides theour Former Adviser. Our Former Administrator provided administrative services necessary for us to operate.operate pursuant to an administrative and loan services agreement, or the Former Administration Agreement. See “- Former Administration Agreement.”
The following diagram shows a simplified organizational structure reflecting our relationship with our Former Adviser and Former Administrator and our direct and indirect ownership interest in certain of our subsidiaries as of September 30, 2017:
Market Opportunity
We believe that the middle market represents a significant opportunity for direct lending for many reasons, including:
Large Market. According to the National Center for the Middle Market, as of the second quarter of 2017, there were nearly 200,000 businesses with annual revenues of $50 million to $1 billion or EBITDA of $10 million to $50 million, which businesses represented one-third of private sector U.S. gross domestic product and accounted for nearly 48 million jobs in the United States.
Demand From Middle-Market Companies. According to Thomson Reuters Q3’17 Middle Market Lender Outlook, over the past five years, middle-market lending has averaged $170 billion annually, much of which we believe has been used to finance leveraged buyouts, recapitalizations, capital expenditures and acquisitions. While the market for middle-market lending has attracted increased capital flows and competition, we believe that the market remains robust and growing and that new market participants may not have the same experience in direct lending and investing across credit cycles as our Investment Adviser. We believe that the market for middle-market lending is relatively less efficient and less well-trafficked, which may provide us with opportunities for incremental returns on our investments relative to the risk of such investments.
Reduced Focus From Banks on Middle-Market Lending. We believe that many commercial banks have decreased their lending to middle-market companies in recent years, which has created an opportunity for non-traditional market participants. According to the Standard & Poor’s Leveraged Commentary & Data Leveraged Lending Review - Q2’17, banks account for just 10% of middle-market loans as of September 30, 2017.
Business Strategy
Our investment objective isWe seek to maximize our portfolio’s total return by generatinggenerate a stable source of current income from our debt investments while seekingminimizing the risk of principal loss and, to preserve our capital.a lesser extent, capital appreciation. We have adoptedinvest in companies across a variety of industries that typically possess business models we expect to be resilient in the future with underlying fundamentals that will provide strength in future downturns. We intend to deploy capital across credit and economic cycles with a focus on long-term results, which we believe will enable us to build lasting partnerships with financial sponsors and management teams. Our Investment Adviser intends to implement the following business strategy to achieve our investment objective:
Portfolio Repositioning.Our Investment Adviser intends to reposition our portfolio in the near-term in order to (1) rotate out of a small number of investments that it views as challenged, (2) focus on increasing the size of our core private investments and (3) supplement the portfolio with broadly syndicated and select privately placed loans. In the longer-term, our Investment Adviser intends to generate consistent income to support sustainable dividends through (1) providing larger, more liquid first lien loans in the established middle market, (2) minimizing risk of principal loss, with reduced focus on opportunities for capital appreciation, (3) mitigating interest rate risk by targeting floating-rate loans and (4) strategically accessing the broadly syndicated and private placement markets.
Emphasis on Proprietary Deals.Our Investment Adviser is primarily focused on proprietary opportunities as well as partnering with other lenders as appropriate and, to a lesser extent strategically accessing the broadly syndicated and private placement markets. Dedicated sourcing professionals of our Investment Adviser are in continuous contact with financial sponsors and corporate clients to originate proprietary deals and seek to leverage the networks and relationships of Oaktree’s over 250 investment professionals with management teams and corporations to originate non-sponsored transactions. Since 2005, our Investment Adviser has invested more than $10 billion in over 200 directly originated loans, and the Oaktree platform has the capacity to invest in large deals and to solely underwrite transactions.
Focus On Quality Companies And Extensive Diligence. Our Investment Adviser seeks to maintain a conservative approach to investing with discipline around fundamental credit analysis and downside protection. Our Investment Adviser intends to focus on companies with business models we expect to be resilient in the future, underlying fundamentals that will provide strength in future downturns, significant asset or enterprise value and seasoned management teams, although not all portfolio companies will meet each of these criteria. Our Investment Adviser intends to leverage its deep credit and deal structuring expertise to lend to companies that have unique needs, complex business models or specific business challenges. Our Investment Adviser conducts diligence on underlying collateral value, including cash flows, hard assets or intellectual property, and will typically model exit scenarios as part of the diligence process, including assessing potential “work-out” scenarios.
Disciplined Portfolio Management. Our Investment Adviser monitors our portfolio on an ongoing basis to manage risk and take preemptive action to resolve potential problems where possible. Our Investment Adviser intends to seek to reduce the impact of individual investment risks by limiting positions to no more than 5% of our portfolio.
Manage Risk Through Loan Structures. Our Investment Adviser seeks to leverage its experience in identifying structural risks in prospective portfolio companies and developing creative solutions in an effort to enhance downside
protection where possible. Our Investment Adviser has the expertise to structure comprehensive, flexible and creative solutions for companies of all sizes across numerous industry sectors. Our Investment Adviser employs a rigorous due diligence process and seeks to include covenant protections designed to ensure that we, as the lender, can negotiate with a portfolio company before a deal reaches impairment. The Oaktree platform has the ability to address a wide range of borrower needs, with capability to invest across the capital structure and to fund large loans, and our Investment Adviser pays close attention to market trends. Our Investment Adviser provides certainty to borrowers by seeking to provide fully underwritten financing commitments and has expertise in both performing credit as well as restructuring and turnaround situations, which we expect will allow us to invest and lend during times of market stress when our competitors may halt investment activity.
Concentrate on floating rate senior loans.Floating Rate Senior Loans. We intend to concentrate on seniorfirst lien secured loans that bear interest based on a floating rate. We believe that seniorthese loans, which are often supported by a pledge of collateral, provide us with adequate protection and attractive risk-adjusted returns. However, we can provide no assurance that any collateral will be sufficient to pay interest due or repayminimize the risk of principal in the event of a default by a portfolio company.loss. In addition, with interest rates atnear historically low levels, we believe that investing in floating rate loans provides us with positive exposure to any near future period ofin a rising interest rates.rate environment.
CapitalizeOur Investment Adviser’s emphasis is on ourfundamental credit analysis, consistency and downside protection, all of which are key tenets of its investment adviser's strong relationships with private equity sponsors.Our investment adviser has developed an extensive network of relationships with private equity sponsors that invest in middle market companies, which should serve as a significant source of investment opportunities for us.philosophy. We believe thatthis philosophy strongly aligns with the strengthinterests of these relationships is due to a common investment philosophy, a consistent market focus, a rigorous approach to diligence and a reputationour stockholders. Our Investment Adviser controls primarily for delivering on commitments.risk, rather than return. Although our intereststhis may not always be aligned with our private equity sponsors given their position as the equity holder and our position as the debt holder in our portfolio companies, we believe that private equity sponsors provide significant benefits including incremental due diligence, additional monitoring capabilities and a potential source of capital and operational expertise for our portfolio companies.
Focus on established middle market companies. We believe that there are fewer finance companies focused on transactions involving middle market companies than larger companies and that this is one factor that allowslead us to negotiate favorable investment terms. Such favorable terms include higher debt yields and lower leverage levels, as well as more significant covenant protection than typical of transactions involving larger companies. We generally investunderperform in companies with established market positions, seasoned management teams, proven products and services and strong regional or national operations. We believe that these companies possess better risk-adjusted return profiles than newer companies that are in the early stages of building management teams and/or a revenue base.
Make direct originations.Over the last several years, the principals of our investment adviser have developed an origination strategy that allows us to directly originate a significant portion of our investments. We believe that the benefits of direct originations include, among other things, our ability to control the structuring of investment protections and to generate origination and prepayment fees.
Benefit from the large pool of uninvested private equity capital likely to seek complementary debt financing. Webullish markets, we expect that private equity firmsprudence across the economic cycle and limiting losses will continue to be active investors in middle market companies. These private equity funds generally seek to leverage their investments by combining their capital with senior secured loans and/or mezzanine debt provided by other sources, and we believe that our capital is well-positioned to partner with such equity investors who we believe have raised substantial amounts of private equity capital in recent years.
Selectively participate in a broad pipeline of capital market transactions. In addition to making direct originations, we also acquire senior loans through assignments or participations of interests in such loans. To do so, we utilize our investment adviser’s extensive network of sponsor and bank relationships to review a wide variety of transactions. This robust pipeline should allow us to efficiently deployachieve our investment objectives.
Investment Criteria
Our Investment Adviser has identified the following investment criteria and guidelines for identifying and investing in prospective portfolio companies. However, not all of these criteria will be met by each prospective portfolio company in which we invest.
Equity Cushion. We generally expect to invest in loans that have covenants that may help to minimize our risk of capital loss and makemeaningful equity investments in selected companies that align with our investment objective.
Employ disciplined underwriting policies and rigorous portfolio management.Our investment adviser has developed an extensive underwriting process which includes a review of the prospects, competitive position, financial performance and industry dynamics of each potential portfolio company. In addition, we perform substantial diligence on potentialWe intend to target investments and seek to invest alongside private equity sponsors whothat have proven capabilities in building value. As part of the monitoring process, our investment adviser will analyze monthly and quarterly financial statements versus the previous periods and year, review financial projections, compliance certificates and covenants, meet with management and attend board meetings.
Structure our investments to minimize risk of loss and achieve attractive risk-adjusted returns. We structure our investments on a conservative basis with high cash yields, cash advisory fees, low leverage levels and strong investmentcredit protections, including prepayment fees. As of September 30, 2016, our debt investments had a weighted average debt to EBITDA multiple of 4.5x calculated at the time of origination of the investment. The weighted average annual yield of our debt investments as of September 30, 2016, including the return on our subordinated note investment in FSFR Glick JV, was approximately 8.58%, of which 8.29% represented cash payments. Our investments typically have strong investment protections, which may include one or more of: default penalties, prepayment fees, information rights, board observation rights and affirmative, negative and financial covenants, such as limitations on debt incurrence, lien protection and prohibitions against change of control. We believe these protections, coupled with the other features of ouron dividends.
investments described above, should allow us to reduce our risk of capital lossSustainable Cash Flow. Our investment philosophy places emphasis on fundamental analysis from an investor’s perspective and achieve attractive risk-adjusted returns; however, there can be no assurance that we will be ablehas a distinct value orientation. We intend to successfully structure our investments to minimize risk of loss and achieve attractive risk-adjusted returns.
Leverage the skills and experience of our investment adviser.The principals of our investment adviser have broad investment backgrounds, with prior experience at private investment funds, investment banks and other financial services companies and they also have experience managing distressed companies. We believe that our investment adviser’s expertise in valuing, structuring, negotiating and closing transactions provides us with a competitive advantage by allowing us to provide financing solutions that meet the needs of our portfolio companies while adhering to our underwriting standards.
Investment Criteria
The principals of our investment adviser have identified the following investment criteria and guidelines for use in evaluating prospective portfolio companies and they use these criteria and guidelines in evaluating investment opportunities for us. However, not all of these criteria and guidelines were, or will be, met in connection with each of our investments.
Established companies with a history of positive operating cash flow. We generally seek to invest in established companies with sound historical financial performance. We typically focus on companies with a historysignificant asset or enterprise value in which we can invest at relatively low multiples of profitability on annormalized operating cash flow basis however,flow. Additionally, we anticipate investing in certain casescompanies with a demonstrated ability or credible plan to de-lever. Typically, we will not invest in start-up companies, companies having speculative business plans or structures that could impair capital over the long-term although we may target investments incertain earlier stage companies some of whichthat have yet to reach positive levels of profitability.
Strong market presence. Experienced Management Team.We seekgenerally will look to invest in portfolio companies thatwith an experienced management team and proper incentive arrangements, including equity compensation, to induce management to succeed and to act in concert with our interests as investors.
Strong Relative Position In Its Market. We intend to target companies with what we believe have developed strongto be established and leading market positions within their respective markets and exhibit the potential to maintain sufficient cash flows and profitability to service their obligations in a range of economic environments. We also seek portfolio companies that we believe possess advantages in scale, scope, customer loyalty, product pricing or product quality as compared to their competitors.
Private equity sponsorship.We generally seek to invest in companies in connection with private equity sponsors who have proven capabilities in building value. We believe that a private equity sponsor can serve as a committed partner and advisor that will actively work with the company and its management team to meet company goals and create value. We assess a private equity sponsor’s commitment to a portfolio company by, among other things, the capital contribution it has made or will make in the portfolio company.
Seasoned management team.We generally will require that our portfolio companies have a seasoned management team, with strong corporate governance. We also seek to invest in companies that have proper incentives in place, including having significant equity interests, to motivate management to act in accordance with our interests.
Defensible and sustainable business. We seek to invest in companies with proven products and/or services and strong regional or national operations.well-developed long-term business strategies.
Exit strategy.Strategy.We generally seekintend to invest in companies that we believe possess attributes that will provide us with the ability to exit our investments. We expectopportunity to exit our investments typicallyin three to eight years, including through one(1) the repayment of three scenarios: (i)the remaining principal outstanding at maturity, (2) the recapitalization of the company resulting in our debt investments being repaid and (3) the sale of the company resulting in the repayment of all of its outstanding debt, (ii)debt.
Geography. As a business development company, we will invest at least 70% of our investments in U.S. companies. To the recapitalizationextent we invest in non-U.S. companies, we intend to do so in accordance with 1940 Act limitations and only in jurisdictions with established legal frameworks and a history of respecting creditor rights.
Investment Process
Our investment process consists of the following five distinct stages.
Source.
Oaktree’s Strategic Credit team has dedicated sourcing professionals and also leverages its strong market presences and relationships across Oaktree’s global platform, which includes more than 250 highly-experienced investment professionals, to gain access to opportunities from advisers, sponsors, banks, management teams, capital raising advisers and other sources. Our Investment Adviser is a trusted partner to financial sponsors and management teams based on its long-term commitment and focus on lending across economic cycles. We believe this will give us access to proprietary deal flow and first looks at
investment opportunities and that we are well-positioned for difficult and complex transactions. In 2016, Oaktree’s Strategic Credit team evaluated more than 200 potential direct lending opportunities with total transaction value of approximately $30 billion. More than 85% of these potential direct lending opportunities were for transactions of $50 million or larger, and Oaktree’s Strategic Credit team continues to see a meaningful pipeline of sizeable transactions.
Screen Using Investment Criteria.
We expect to be highly selective in making new investments. The initial screening process will typically include a review of the proposed capital structure of the portfolio company, through whichincluding level of assets or enterprise value coverage, an assessment by our loanInvestment Adviser of the company’s management team and its equity ownership levels as well as the viability of its long-term business model, and a review of forecasted financial statements and liquidity profile. In addition, our Investment Adviser may assess the prospect of industry or macroeconomic catalysts that may create enhanced value in the investment as well as the potential ability to enforce creditor rights, particularly where collateral is replaced with debt or equity fromlocated outside of the United States.
Research.
Prior to making any new investment, our Investment Adviser intends to engage in an extensive due diligence process led by investment analysts assigned to each transaction. The analysts will assess a company’s products, services, competitive position in its markets, barriers to entry and operating and financial performance, as well as the growth potential of its markets. In performing this evaluation, the analysts may use financial, descriptive and other due diligence materials provided by the target company, commissioned third party or parties or (iii) the repaymentreports and internal sources, including members of the initial or remaining principal amount ofinvestment team, industry participants and experts with whom our loan then outstanding at maturity. In some investments, there may be scheduled amortization of some portion of our loan which would result in a partial exit of our investment prior to the maturityInvestment Adviser has relationships. As part of the loan.research process, our Investment Adviser’s analysts typically perform a “what-if” analysis that explores a range of values for each proposed investment and a range of potential credit events.
Evaluate.
Our Investment Adviser assesses each potential investment through a robust, collaborative decision-making process. Our Investment Adviser applies disciplined investment criteria and evaluates potential risk and reward of each investment with significant focus on downside risk. Our Investment Adviser sizes investments at the portfolio level across a variety of characteristics, including based on the investment criteria described above.
Monitor.
Our Investment Adviser prioritizes managing risk. In addition, although less common, we may sellmanaging our portfolio, our Investment Adviser intends to closely monitor each portfolio company and be well-positioned to make hold and exit decisions when credit events occur, our collateral becomes overvalued or opportunities with more attractive risk/reward profiles are identified. Investment analysts will be assigned to each investment to monitor industry developments, review company financial statements, attend company presentations and regularly speak with company management. In circumstances where a particular investment is underperforming, our Investment Adviser intends to employ a variety of strategies to maximize its recovery based on the specific facts and circumstances of the underperforming investment, including actively working with the management to restructure all or a portion of the business, explore the possibility of a sale or merger of all or a portion of the assets, recapitalize or refinance the balance sheet, negotiate deferrals or other concessions from existing creditors and arrange new liquidity or new equity contributions. We believe that our investmentsInvestment Adviser’s experience with restructurings and our access to our Investment Adviser’s deep knowledge, expertise and contacts in the distressed debt area will help us preserve the value of our investments.
Due Diligence Process
As part of the underwriting process, our Investment Adviser completes a rigorous due diligence process that focuses on four key areas:
Company Analysis. Our Investment Adviser actively engages and assesses company management teams. The focus of this analysis also includes identifying and understanding key business and demand drivers. Our Investment Adviser strives to evaluate core risks within businesses and industries and to complete the analysis by thinking like company ownership when evaluating cash flows.
Financial Analysis. Our Investment Adviser analyzes the consistency, stability and reliability of cash flows in addition to evaluating the quality of earnings and conversion of EBITDA to cash. Our Investment Adviser also reviews historical performance through economic cycles, analyzes the potential impact of a downturn in the prospective portfolio company’s end markets and compares the prospective portfolio company’s key metrics to those of its competitors.
Down-side Focus. Our Investment Adviser considers the impact on the secondary market.prospective portfolio company’s business and cash flows under a number of downside case scenarios and develops an exit strategy in the event of the downside case. There is also a focus on potential risks to business models. Following this analysis, our Investment Adviser considers appropriate risk mitigants, including the structure of the investment and affirmative, negative and financial covenants.
Value. Our Investment Adviser analyzes the risk/reward potential of each new investment relative to other opportunities in the industry and market as well as overall industry valuation trends as compared to the industry risk profile. As part of this analysis, our Investment Adviser considers the cost of capital to competitors as well as alternative investment options. Our Investment Adviser also considers the value of liquidity to our business and operations as well as appropriate illiquidity premiums where we are unlikely to acquire liquid securities.
Investments
We invest in portfolioseek to generate a stable source of current income while minimizing the risk of principal loss and, to a lesser extent, capital appreciation by providing middle-market companies primarily with first lien senior secured debt financings that pay us interest at a floating rate. We seek to structure our debt investments to provide downside protection through strong credit protections, including default penalties, information rights and affirmative, negative and financial covenants, such as limitations on debt incurrence, lien protection and prohibitions on dividends, although not all of our investments will meet each of these criteria. Our Investment Adviser has expertise in creative, efficient structuring and institutional knowledge of bankruptcy and restructurings enabling our Investment Adviser to focus on risk control. Going forward, we expect most of our debt investments to be collateralized by a first lien on the formassets of the portfolio company. As of September 30, 2017, 89.5% of our portfolio at fair value consisted of debt investments that were secured by first or second priority liens on the assets of the portfolio company.
Debt Investments
We intend to tailor the terms of each investment by negotiating a structure that seeks to protect our rights and manage our risk while creating incentives for the portfolio company to achieve its business plan. A substantial source of return is monthly or quarterly cash interest that we collect on our debt investments. We expect that our Investment Adviser will focus on middle-market companies, which we define as companies with enterprise values of between $100 and $750 million. Going forward, we expect our portfolio to include primarily first lien senior loans. These seniorsecured floating rate loans typicallyalthough we may also make other investments.
First Lien Loans. Our first lien loans generally have current cash payterms of three to seven years, provide for a variable or fixed interest with some amortizationrate, contain prepayment penalties and are secured by a first priority security interest in all existing and future assets of principal. Interestthe borrower. We target first lien loans where interest is generally paid on a floating rate basis, often with a floor, based on the LIBOR rate. WeOur first lien loans may take many forms, including revolving lines of credit, term loans and acquisition lines of credit.
Unitranche Loans. Our unitranche loans generally obtainhave terms of five to seven years and provide for a variable or fixed interest rate, contain prepayment penalties and are generally secured by a first priority security interestsinterest in theall existing and future assets of our portfolio companies that serve as collateralthe borrower. Our unitranche loans may take many forms, including revolving lines of credit, term loans and acquisition lines of credit.
Second Lien Loans. Our second lien loans generally have terms of five to eight years, provide for a variable or fixed interest rate, contain prepayment penalties and are secured by a second priority security interest in supportall existing and future assets of the repaymentborrower. Our second lien loans may include payment-in-kind, or PIK, interest, which represents contractual interest accrued and added to the principal that generally becomes due at maturity.
Unsecured Loans. Our unsecured investments generally have terms of these loans. This collateral may take the form of first or second priority liens on the assets offive to ten years and provide for a portfolio company.fixed interest rate. We also may make unsecured investments on a stand-alone basis, or in connection with a senior secured loan, a junior secured loan or a “one-stop” financing. Our unsecured investments may include PIK interest and an equity component, such as warrants to purchase common stock in the portfolio company.
Equity Investments
When we make a debt orinvestment, we may be granted equity investmentsin the company in the same class of security as the sponsor receives upon funding. In addition, from time to time including investments in structured products such as loan securitizations.
The senior loans that we target typically have final maturities of four to seven years. However, we expect that our portfolio companies often may repay these loans early, generally within three to four years from the date of initial investment. Early repayments of loans by portfolio companies may have an adverse effect on our earnings to the extent that we are not able to re-invest the proceeds from such repayments in loans that bear interest at rates similar to the rates of the repaid loans or at all.
We generally tailor the terms of an investment to the facts and circumstances of the transaction and the prospective portfolio company, negotiating a structure that protects our rights and manages our risk while creating incentives for the portfolio company to achieve its business plan and improve its profitability. We seek to limit the downside potential of our
investments by negotiating covenantsmake non-control, equity co-investments in connection with private equity sponsors. We generally seek to structure our equity investments, that afford our portfolio companies flexibilitysuch as direct equity co-investments, to provide us with minority rights provisions and event-driven put rights. We also seek to obtain limited registration rights in managing their businesses, consistentconnection with preservation of our capital. Such restrictionsthese investments, which may include affirmative and negative covenants, default penalties, lien protection, change of control provisions and board rights, including either observation or participation“piggyback” registration rights.
FSFR Glick JV
We have invested in FSFR Glick JV, which as of September 30, 2016,2017, consisted of a portfolio of loans to 3623 different borrowers in industries similar to the companies in our portfolio. FSFR Glick JV invests in middle-market and other corporate debt securities, including traditional senior debt that are secured by some or all of the issuer’scompany’s assets.
Deal Origination
Our deal originating efforts are focused on building relationships with private equity sponsors that are focused on investing in the small and mid-sized companies that we target. We divide the country geographically into Eastern, Central and Western regions and emphasize active, consistent sponsor coverage. The investment professionals of our investment adviser have developed an extensive network of relationships with these private equity sponsors. We estimate that our investment adviser has active relationships with approximately 200 private equity sponsors. An active relationship is one through which our investment adviser has received at least one investment opportunity from the private equity sponsor within the last year.
Our investment adviser reviewed over 700 potential investment transactions with private equity sponsors during the year ended September 30, 2016. A significant portion of the investment transactions that we have completed to date were originated through our investment adviser’s relationships with private equity sponsors. We believe that our investment adviser has a reputation as a reliable, responsive and efficient source of funding to support private equity investments. We believe that this reputation and the relationships of our investment adviser with private equity sponsors will provide us with significant investment opportunities.
Our origination process is designed to efficiently evaluate a large number of opportunities and to identify the most attractive of such opportunities. A significant number of opportunities that clearly do not fit our investment criteria are screened by the originators of our investment adviser when they are initially identified. If an originator believes that an opportunity fits our investment criteria and merits consideration, the investment is presented to our investment adviser’s Investment Committee. This is the first stage of our origination process, the “Review” stage. During this stage, the originator gives a preliminary description of the opportunity. This is followed by preliminary due diligence, from which an investment summary is created. The opportunity may be discussed several times by the full Investment Committee of our investment adviser, or subsets of that committee. At any point in this stage, we may reject the opportunity, and, indeed, we have historically decided not to proceed with more than 80% of the investment opportunities reviewed by our investment adviser's Investment Committee.
For the subset of opportunities that we decide to pursue, we issue preliminary term sheets and classify them in the “Term Sheet Issued” stage. This term sheet serves as a basis for negotiating the critical terms of a transaction. At this stage we begin our underwriting and investment approval process, as more fully described below. After the term sheet for a potential transaction has been fully negotiated, the transaction is presented to our investment adviser’s Investment Committee for approval. If the deal is approved, the term sheet is signed. Approximately half of the term sheets we issue result in an executed term sheet. Our underwriting and investment approval process is ongoing during this stage, during which we begin documentation of the loan. The final stage, “Closings,” culminates with the funding of an investment only after all due diligence is satisfactorily completed and all closing conditions, including the sponsor’s funding of its investment in the portfolio company, have been satisfied.
Investment Underwriting
Investment Underwriting Process and Investment Approval
We make our investment decisions only after consideration of a number of factors regarding the potential investment including: (i) historical and projected financial performance; (ii) company and industry specific characteristics, such as strengths, weaknesses, opportunities and threats; (iii) composition and experience of the management team; and (iv) track record of the private equity sponsor leading the transaction.
If an investment is deemed appropriate to pursue, a more detailed and rigorous evaluation is made along a variety of investment parameters, not all of which may be relevant or considered in evaluating a potential investment opportunity. The following outlines the general parameters and areas of evaluation and due diligence for investment decisions, although not all will necessarily be considered or given equal weighting in the evaluation process.
Management Assessment
Our investment adviser makes an in-depth assessment of the management team, including evaluation along several key metrics:
The number of years in their current positions;
Track record;
Industry experience;
Management incentive, including the level of direct investment in the enterprise;
Background investigations; and
Completeness of the management team (lack of positions that need to be filled).
Industry Dynamics
An evaluation of the industry is undertaken by our investment adviser that considers several factors. If considered appropriate, industry experts will be consulted or retained. The following factors are analyzed by our investment adviser:
Sensitivity to economic cycles;
Competitive environment, including number of competitors, threat of new entrants or substitutes;
Fragmentation and relative market share of industry leaders;
Growth potential; and
Regulatory and legal environment.
Business Model and Financial Assessment
Prior to making an investment decision, our investment adviser will undertake a review and analysis of the financial and strategic plans for the potential investment. There is significant evaluation of and reliance upon the due diligence performed by the private equity sponsor and third party experts including accountants and consultants. Areas of evaluation include:
Historical and projected financial performance;
Quality of earnings, including source and predictability of cash flows;
Customer and vendor interviews and assessments;
Potential exit scenarios, including probability of a liquidity event;
Internal controls and accounting systems; and
Assets, liabilities and contingent liabilities.
Private Equity Sponsor
Among the most critical due diligence investigations is the evaluation of the private equity sponsor making the investment. A private equity sponsor is typically the controlling shareholder upon completion of an investment and as such is considered critical to the success of the investment. The private equity sponsor is evaluated along several key criteria, including:
Investment track record;
Industry experience;
Capacity and willingness to provide additional financial support to the company through additional capital contributions, if necessary; and
Reference checks.
Portfolio Management
Active Involvement in our Portfolio Companies
As a business development company, we are obligated to offer to provide significant managerial assistance to our portfolio companies and to provide it if requested. In fact, weWe provide managerial assistance to most of our portfolio companies as a general practice and we seek investments where such assistance is appropriate. We monitor the financial trends of each portfolio company to assess the appropriate course of action for each company and to evaluate overall portfolio quality. We have several methods of evaluating and monitoring the performance of our investments, including but not limited to, the following:
Review of monthly and quarterly financial statements and financial projections for portfolio companies;
Periodic and regular contact with portfolio company management to discuss financial position requirements and accomplishments;
Attendance at board meetings;
Periodic formal update interviews with portfolio company management and, if appropriate, the private equity sponsor; and
Assessment of business development success, including product development, profitability and the portfolio company’s overall adherence to its business plan.
Ranking Criteria
In addition to various risk management and monitoring tools, we use an investment ranking system to characterize and monitor the credit profile and our expected level of returns on each investment in our portfolio. See “Management’s Discussion and Analysis of Financial Condition and Results of Operations - Portfolio Asset Quality” for a description of our four-level numeric ranking scale and the distributions of our investments on the 1 to 4 investment ranking scale at fair value as of September 30, 2016 and 2015.
Valuation of Portfolio Investments
As a business development company, we generally invest in illiquid senior loans issued by private middle marketmiddle-market companies. All of our Level 3 investments are recorded at fair value as determined in good faith by our Board of Directors. See “Management’s Discussion and Analysis of Financial Condition and Results of Operations - Critical Accounting Policies- Investment Valuation” for a description of our investment valuation processes and procedures.
Net Asset Value Determinations
Our Board of Directors determines the net asset value per share of our common stock on a quarterly basis. The net asset value per share of our common stock is equal to the value of our total assets minus liabilities divided by the total number of shares of common stock outstanding. Our liabilities will include amounts that we have accrued under our investment advisory agreement, including the management fee, income incentive fee and capital gains incentive fee, the latter of which will be accrued for GAAP purposes based upon the cumulative realized and unrealized capital appreciation in our portfolio.
Competition
We compete for investments with a number ofother business development companies, public and investmentprivate funds (including hedge funds, mezzanine funds and collateralized loan obligations) and private equity funds)funds (to the extent they provide an alternative form of financing), as well as traditional financial services companies such as commercial and investment banks, commercial financing companies and other sources of financing. Many of these entities have greater financial and managerial resources than we do. We believe we are able to be competitive with these entities primarily on the basis of the experience and contacts of our management team, our responsive and efficient investment analysis and decision-making processes, the investment terms we offer, and our willingness to make smaller investments.
We believe that some of our competitors make loans with interesttotal rates andof returns that are comparable to or lower than the rates and returns that we target. Therefore, we do not seek to compete solely on the interest rates that we offer to potential portfolio companies. For additional information concerning the competitive risks we face, seeSee “Risk Factors —- Risks Relating to Our Business and Structure —- We may face increasing competition for investment opportunities, which could reduce returns and result in losses.”
Employees
We do not have any employees. Our day-to-day investment operations are managed by Fifth StreetOaktree Capital Management, L.P. as our investment adviser.Investment Adviser. See “—“-New Investment Advisory Agreement.” Fifth Street Management utilizes over 25Our Investment Adviser and its affiliates employ more than 250 investment professionals, including its principals.professionals. In addition, we reimburse our administrator, FSC CT,Oaktree Administrator, for the allocable portion of overhead and other expenses incurred by it in performing its obligations under an administration agreement, or the New Administration Agreement, including our allocable portion of the costs of compensation of our chief financial officerChief Financial Officer, Chief Compliance Officer, their staffs and chief compliance officer and their staffs. For a more detailed discussion of the administration agreement, see “— Administrationother non-investment professionals at Oaktree that perform duties for us. See “- New Administrative Services Agreement.”
Properties
We do not own any real estate or other physical properties material to our operations. Our administrative and principal executive offices are located at 333 South Grand Avenue, 28th Floor, Los Angeles, CA 90071. We utilizebelieve that our office space that is leased by our administrator from an affiliate controlled by the chief executive officer of our investment adviserfacilities are suitable and administrator, Mr. Tannenbaum. See “Material Conflicts of Interest.” Pursuant to an administration agreement with our administrator, we pay FSC CT an allocable portion of the rent at market ratesadequate for our principal executive office at 777 West Putnam Avenue, 3rd Floor, Greenwich, CT 06830. Such reimbursement is at cost with no profit to, or markup by, FSC CT. We also utilize additional office space that is leased by affiliates of our administrator at 311 South Wacker Drive, Suite 3380, Chicago, IL 60606 and 309 23rd Street, Suite 200A, Miami Beach, FL 33139.
Material Conflicts of Interest
Our executive officers and directors, and certain members of our investment adviser, serve or may serve as officers, directors or principals of entities that operate in the same or a related line of business as we do or of investment funds managed by our affiliates. For example, Fifth Street Managementit is presently serves as investment adviser to FSC, a publicly-traded BDC with total assets at fair value of approximately $2.4 billion as of September 30, 2016. FSC invests in the debt and equity of small and mid-sized companies, primarily in connection with investments by private equity sponsors, including in middle market leveraged companies similar to those we target for investment. Specifically, FSC generally targets small and mid-sized companies with annual EBITDA between $10 million and $120 million and generally targets investment sizes ranging from $10 million to $100 million. In addition, though not the primary focus of its investment portfolio, FSC's investments also include floating rate senior loans. In contrast, we target investments ranging from between $3 million and $30 million, and generally target private leveraged middle market companies with approximately $20 million to $120 million of EBITDA. Therefore, there may be certain investment opportunities that satisfy the investment criteria for both FSC and us. In addition, certain of our executive officers and three of our independent directors serve in substantially similar capacities for FSC. Fifth Street Management and its affiliates also manage private investment funds, and may manage other funds in the future, that have investment mandates that are similar, in whole or in part, with ours. Accordingly, they may have obligations to investors in those entities, the fulfillment of which might not be in the best interests of us or our stockholders. For example, the principals of our investment adviser may face conflicts of interest in the allocation of investment opportunities to us and such other funds. The fact that our investment advisory fees are lower than those of certain other funds, such as FSC, could amplify this conflict of interest.conducted.
Fifth Street Management has adopted, and our Board of Directors has approved, an investment allocation policy that governs the allocation of investment opportunities among the investment funds managed by Fifth Street Management and its affiliates. To the extent an investment opportunity is appropriate for us or FSC or any other investment fund managed by our affiliates, Fifth Street Management will adhere to its investment allocation policy in order to determine to which entity to allocate the opportunity. As a business development company, we were substantially limited in our ability to co-invest in privately negotiated transactions with affiliated funds until we obtained an exemptive order from the SEC in September 2014. The exemptive relief permits us to participate in negotiated co-investment transactions with certain affiliates, each of whose investment adviser is Fifth Street Management, or an investment adviser controlling, controlled by or under common control with Fifth Street Management, in a manner consistent with our investment objective, positions, policies, strategies and restrictions as well as regulatory requirements and other pertinent factors, and pursuant to the conditions to the exemptive relief.
If we are unable to rely on our exemptive relief for a particular opportunity, such opportunity will be allocated first to the entity whose investment strategy is the most consistent with the opportunity being allocated, and second, if the terms of the opportunity are consistent with more than one entity's investment strategy, on an alternating basis. Although our investment professionals will endeavor to allocate investment opportunities in a fair and equitable manner, we and our common stockholders could be adversely affected to the extent investment opportunities are allocated among us and other investment vehicles managed or sponsored by, or affiliated with, our executive officers, directors and members of our investment adviser.
Fifth Street Management’s investment allocation policy is also designed to manage and mitigate the conflicts of interest associated with the allocation of investment opportunities if we are able to co-invest, either pursuant to Securities and Exchange Commission, or the SEC, interpretive positions or our exemptive order, with other accounts managed by our investment adviser and its affiliates. Generally, under the investment allocation, co-investments will be allocated pursuant to the conditions of the exemptive order. Under the investment allocation policy, a portion of each opportunity that is appropriate for us and any affiliated fund will be offered to us and such other eligible accounts as determined by Fifth Street Management and generally based on asset class, fund size and liquidity, among other factors. If there is a sufficient amount of securities to satisfy all participants, the securities will be allocated among the participants in accordance with their order size and if there is an insufficient amount of securities to satisfy all participants, the securities will be allocated pro rata based on each participating party’s capital available for investment in the asset class being allocated, up to the amount proposed to be invested
by each. In accordance with Fifth Street Management’s investment allocation policy, we might not participate in each individual opportunity, but will, on an overall basis, be entitled to participate equitably with other entities managed by Fifth Street Management and its affiliates. Fifth Street Management seeks to treat all clients fairly and equitably such that none receive preferential treatment vis-à-vis the others over time, in a manner consistent with its fiduciary duty to each of them; however, in some instances, especially in instances of limited liquidity, the factors may not result in pro rata allocations or may result in situations where certain funds receive allocations where others do not. See “Certain Relationships and Related Transactions, and Director Independence.”
Pursuant to the administration agreement with FSC CT, FSC CT furnishes us with the facilities, including our principal executive office, and administrative services necessary to conduct our day-to-day operations. We pay FSC CT its allocable portion of overhead and other expenses incurred by FSC CT in performing its obligations under the administration agreement, including a portion of the rent at market rates and compensation of our chief financial officer and chief compliance officer and their respective staffs.
New Investment Advisory Agreement
The following is a description of the New Investment Advisory Agreement, which has been in effect since October 17, 2017.
Management Services
Our investment adviser, Fifth Street Management,Oaktree is registered as an investment adviser under the Advisers Act. Our investment adviser serves pursuant to an investment advisory agreement in accordance with the Advisers Act. Subject to the overall supervision of our Board of Directors our investment adviser managessince October 17, 2017, Oaktree has managed our day-to-day operations and providesprovided us with investment advisory services. Under the terms of the investment advisory agreement, our investment adviser:New Investment Advisory Agreement, Oaktree:
determines the composition of our portfolio, the nature and timing of the changes to our portfolio and the manner of implementing such changes;
determines what securities we purchase, retain or sell;
identifies, evaluates and negotiates the structure of the investments we make; and
executes, closes, monitors and services the investments we make.make;
Our investment adviser’sdetermines what securities and other assets we purchase, retain or sell; and
performs due diligence on prospective portfolio companies.
The New Investment Advisory Agreement provides that Oaktree’s services under the investment advisory agreement mayare not be exclusive to us and itOaktree is generally free to furnish similar services to other entities so long as its services to us are not impaired.
Management Fee
WeUnder the New Investment Advisory Agreement, we pay our investment adviserOaktree a fee for its services under the investment advisory agreement consisting of two components —components: a base management fee and an incentive fee. The cost of both the base management fee payable to our investment adviserOaktree and any incentive fees earned by our investment adviser willOaktree is ultimately be borne by our common stockholders.
Base Management Fee
TheUnder the New Investment Advisory Agreement, the base management fee is calculated at an annual rate of 1% of ouron total gross assets, (i.e., total assets held before deduction ofincluding any liabilities), which includes any investments acquiredinvestment made with the use of leverage, and excludes anyborrowings, but excluding cash and cash equivalents, (as defined in the notes to our Consolidated Financial Statements). Although we do not anticipate making significant investments in derivative financial instruments, the fair value of any such investments, which will not necessarily equal their notional value, will be included in our calculation of gross assets. The base management fee is calculated based on the average value of our gross assets at the end of the two most recently completed quarters. The base management fee is payable quarterly in arrears and the fee for any partial month or quarter is appropriately prorated.1.00%.
Incentive Fee
The incentive fee hasconsists of two parts. TheUnder the New Investment Advisory Agreement, the first part of the incentive fee, which is referred to as the incentive fee on income, is calculated and payable quarterly in arrears based onupon our “Pre-Incentive Fee Net Investment Income”“pre-incentive fee net investment income” for the immediately preceding quarter. The payment of the incentive fee on income is subject to payment of a preferred return to investors each quarter (i.e., a “hurdle rate”), expressed as a rate of return on the value of our net assets at the end of the most recently completed quarter, of 1.50%, subject to a “catch up” feature.
For this purpose, “Pre-Incentive Fee Net Investment Income”“pre-incentive fee net investment income” means interest income, dividend income and any other income (including any other fees (other than fees for providing managerial assistance), such as commitment, origination, structuring, diligence and consulting fees or other fees that we receive from portfolio companies),companies, other than fees for providing managerial assistance) accrued during the fiscal quarter, minus our operating expenses for the quarter (including the base management fee, expenses payable under the administration agreement with FSC CT,New Administration Agreement and any interest expense and dividends paid on any issued and outstanding preferred stock, but excluding the incentive fee). Pre-Incentive Fee Net Investment IncomePre-incentive fee net investment income includes, in the case of investments with a deferred interest feature (such as original issue discount, or OID, debt instruments with PIK interest and zero coupon securities), accrued income that we have not yet received in cash. Pre-Incentive Fee Net Investment IncomePre-incentive fee net investment income does not include any realized capital gains, realized capital losses or unrealized capital appreciation or depreciation.
depreciation. Pre-Incentive Fee NetUnder the New Investment Income, expressed as a rate of return onAdvisory Agreement, the value of our net assets at the end of the immediately preceding quarter, will be compared to a “hurdle rate” of 1.5% per quarter, subject to a “catch-up” provision measured as of the end of each quarter. Our net investment income used to calculate this partcalculation of the incentive fee is also included in the amount of our gross assets used to calculate the 1% base management fee. The operation of the incentive fee with respect to our Pre-Incentive Fee Net Investment Incomeon income for each quarter is as follows:
noNo incentive fee is payable to the investment adviserOaktree in any quarter in which our Pre-Incentive Fee Net Investment Incomepre-incentive fee net investment income does not exceed the hurdlepreferred return rate of 1.5%1.50% (the “preferred return” or “hurdle”); on net assets.
50%100% of our Pre-Incentive Fee Net Investment Income with respect to that portion of such Pre-Incentive Fee Net Investment Income,pre-incentive fee net investment income, if any, that exceeds the hurdle ratepreferred return but is less than or equal to 2.5%1.8182% in any fiscal quarter is payable to the investment adviser.Oaktree. We refer to this portion of our Pre-Incentive Fee Net Investment Income (which exceeds the hurdle rate but is less than or equal to 2.5%)incentive fee on income as the “catch-up.” The “catch-up” provision, and it is intended to provide our investment adviserOaktree with an incentive fee of 20%17.5% on all of our Pre-Incentive Fee Net Investment Income as if a hurdle rate did not applypre-incentive fee net investment income when our Pre-Incentive Fee Net Investment Income exceeds 2.5%pre-incentive fee net investment income reaches 1.8182% on net assets in any quarter; andfiscal quarter.
20%
For any quarter in which our pre-incentive fee net investment income exceeds 1.8182% on net assets, the subordinated incentive fee on income is equal to 17.5% of the amount of our Pre-Incentive Fee Net Investment Income, if any, that exceeds 2.5% in any quarterpre-incentive fee net investment income, as the preferred return and catch-up will have been achieved.
There is payable to the investment adviser onceno accumulation of amounts on the hurdle rate from quarter to quarter and accordingly there is reached andno clawback of amounts previously paid if subsequent quarters are below the catch-up is achieved.quarterly hurdle.
The following is a graphical representation of the calculation of the income-related portion ofincentive fee on income under the incentive fee:New Investment Advisory Agreement:
Quarterly Incentive Fee based on Pre-Incentive Fee Net Investment Income
Pre-incentive fee net investment income
(expressed as a percentage of the value of net assets)
Percentage of pre-incentive fee net investment income
allocated to Fifth Street Managementthe incentive fee on income
TheUnder the New Investment Advisory Agreement, the second part of the incentive fee iswill be determined and payable in arrears as of the end of each fiscal year (or upon termination of the investment advisory agreement, as of the termination date) commencing onwith the fiscal year ending September 30, 20132019 and equals 20%will equal 17.5% of our realized capital gains, if any, on a cumulative basis from inceptionthe beginning of the fiscal year ending September 30, 2019 through the end of each fiscal year, computed net of all realized capital losses and unrealized capital depreciation on a cumulative basis, less the aggregate amount of any previously paid capital gain incentive fees.fees under the New Investment Advisory Agreement. Any realized capital gains, realized capital losses, unrealized capital appreciation and unrealized capital depreciation with respect to the Company’s portfolio as of the end of the fiscal year ending September 30, 2018 will be excluded from the calculations of the second part of the incentive fee.
Examples of Quarterly Incentive Fee Calculation under the New Investment Advisory Agreement (A)
Example 1: Income Related Portion of Incentive Fee on Income for Each Fiscal Quarter
ScenarioAlternative 1
Assumptions
Investment income (including interest, dividends, fees, etc.) = 1.25%1.75%
Hurdle ratePreferred return under the New Investment Advisory Agreement1 = 1.5%1.50%
Management fee(1)fee under the New Investment Advisory Agreement2 = 0.25%
Other expenses (legal, accounting, custodian, transfer agent, etc.) = 0.2%0.20%
Pre-Incentive Fee Net Investment IncomePre-incentive fee net investment income
(investment income –- (management fee + other expenses)) = 0.80%1.30%
Pre-Incentive Fee Net Investment Income
Pre-incentive fee net investment income does not exceed hurdle rate,the preferred return under the New Investment Advisory Agreement, therefore there is no income-related incentive fee.fee on income under the New Investment Advisory Agreement.
ScenarioAlternative 2
Assumptions
Investment income (including interest, dividends, fees, etc.) = 2.65%2.25%
Hurdle ratePreferred return under the New Investment Advisory Agreement1 = 1.5%1.50%
Management fee(1)fee under the New Investment Advisory Agreement2 = 0.25%
Other expenses (legal, accounting, custodian, transfer agent, etc.) = 0.2%0.20%
Pre-Incentive Fee Net Investment IncomePre-incentive fee net investment income
(investment income –- (management fee + other expenses)) = 2.2%1.80%
Incentive fee = 50%17.5% × Pre-Incentive Fee Net Investment Income (subjectpre-incentive fee net investment income, subject to “catch-up”)(2)3
= 50%100% × (2.2% – 1.5%(1.80% - 1.50%)
= 0.35%0.30%
Pre-Incentive Fee Net Investment Income exceeds the hurdle rate, but does not fully satisfy the “catch-up” provision, therefore the income-related portion of the incentive fee is 0.35%.
ScenarioAlternative 3
Assumptions
Investment income (including interest, dividends, fees, etc.) = 3.25%3.5%
Hurdle ratePreferred return under the New Investment Advisory Agreement1 = 1.5%1.50%
Management fee(1)fee under the New Investment Advisory Agreement2 = 0.25%
Other expenses (legal, accounting, custodian, transfer agent, etc.) = 0.2%0.20%
Pre-Incentive Fee Net Investment IncomePre-incentive fee net investment income
(investment income –- (management fee + other expenses)) = 2.8%3.05%
Incentive fee = 17.5% × pre-incentive fee net investment income, subject to “catch-up”3
Incentive fee = 50%100% × Pre-Incentive Fee Net Investment Income (subject to “catch-up” + (17.5% × (pre-incentive fee net investment income - 1.8182%)(2))
Catch-up = 1.8182% - 1.50% = 0.3182%
Incentive fee = 50%(100% × “catch-up” + (20% × (Pre-Incentive Fee Net Investment Income – 2.5%))
Catch up = 2.5% – 1.5%
= 1.0%
Incentive fee = (50% × 1.0%0.3182%) + (20%(17.5% × (2.8% – 2.5%(3.05% - 1.8182%))
= 0.50%0.3182% + (20%(17.5% × 0.3%1.2318%)
= 0.50%0.3182% + 0.06%0.2158%
= 0.56%0.534%
Pre-Incentive Fee Net Investment Income exceeds the hurdle rate, and fully satisfies the “catch-up” provision, therefore the income-related portion of the incentive fee is 0.56%.
| |
(1) | Represents 1% annualized base management fee. |
| |
(2) | The “catch-up” provision is intended to provide our investment adviser with an incentive fee of 20% on all Pre- Incentive Fee Net Investment Income as if a hurdle rate did not apply when our net investment income exceeds 2.5% in any quarter. |
Example 2: Incentive Fee on Capital Gains Portion of Incentive Fee(*):
Scenario 1:under the New Investment Advisory Agreement
Assumptions
Year 1: $20$10 million investment made in Company A (“Investment A”), and $30$10 million investment made in Company B (“Investment B”), $10 million investment made in Company C (“Investment C”), $10 million investment made in Company D (“Investment D”) and $10 million investment made in Company E (“Investment E”).
Year 2: Investment A sold for $50$20 million, and fair market value (“FMV”) of Investment B determined to be $32$8 million, FMV of Investment C determined to be $12 million, and FMV of Investments D and E each determined to be $10 million.
Year 3: FMV of Investment B determined to be $25$8 million, FMV of Investment C determined to be $14 million, FMV of Investment D determined to be $14 million and FMV of Investment E determined to be $16 million.
Year 4: Investment D sold for $12 million, FMV of Investment B determined to be $10 million, FMV of Investment C determined to be $16 million and FMV of Investment E determined to be $14 million.
Year 5: Investment C sold for $20 million, FMV of Investment B determined to be $14 million and FMV of Investment E determined to be $10 million.
Year 6: Investment B sold for $31$16 million and FMV of Investment E determined to be $8 million.
Year 7: Investment E sold for $8 million and FMV.
These assumptions are summarized in the following chart:
|
| | | | | | | | |
| Investment A | Investment B | Investment C | Investment D | Investment E | Cumulative Unrealized Capital Depreciation | Cumulative Realized Capital Losses | Cumulative Realized Capital Gains |
| Year 1 | $10 million (cost basis) | $10 million (cost basis) | $10 million (cost basis) | $10 million (cost basis) | $10 million (cost basis) | -- | -- | -- |
| Year 2 | $20 million (sale price) | $8 million FMV | $12 million FMV | $10 million FMV | $10 million FMV | $2 million | -- | $10 million |
| Year 3 | -- | $8 million FMV | $14 million FMV | $14 million FMV | $16 million FMV | $2 million | -- | $10 million |
| Year 4 | -- | $10 million FMV | $16 million FMV | $12 million (sale price) | $14 million FMV | -- | -- | $12 million |
| Year 5 | -- | $14 million FMV | $20 million (sale price) | -- | $10 million FMV | -- | -- | $22 million |
| Year 6 | -- | $16 million (sale price) | -- | -- | $8 million FMV | $2 million | -- | $28 million |
| Year 7 | -- | -- | -- | -- | $8 million (sale price) | -- | $2 million | $28 million |
The capital gains portion ofIncentive Fee on Capital Gains under the incentive feeNew Investment Advisory Agreement would be:
Year 1: None
Year 2: Capital gains incentive fee of $6 million —Gains Fee = 17.5% multiplied by ($3010 million realized capital gains on sale of Investment A multiplied by 20%)less $2 million cumulative capital depreciation) = $1.4 million
Year 3: None — $5 million (20%Capital Gains Fee = (17.5% multiplied by ($3010 million cumulative realized capital gains less $5$2 million cumulative capital depreciation)) less $6$1.4 million (previous capital gains incentive feecumulative Capital Gains Fee previously paid in Year 2)= $1.4 million less $1.4 million = $0.00 million
Year 4: Capital gains incentive fee of $200,000 — $6.2 millionGains Fee = (17.5% multiplied by ($3112 million cumulative realized capital gainsgains)) less $1.4 million cumulative Capital Gains Fee previously paid = $2.1 million less $1.4 million = $0.7 million
Year 5: Capital Gains Fee = (17.5% multiplied by 20%($22 million cumulative realized capital gains)) less $6$2.1 million (capital gains incentive feecumulative Capital Gains Fee previously paid in = $3.85 million less $2.1 million = $1.75 million
Year 2)
Scenario 2
Assumptions
Year 1: $20 million investment made in Company A (“Investment A”), $30 million investment made in Company B (“Investment B”) and $25 million investment made in Company C (“Investment C”)
Year 2: Investment A sold for $50 million, FMV of Investment B determined to be $25 million and FMV of Investment C determined to be $25 million
Year 3: FMV of Investment B determined to be $27 million and Investment C sold for $30 million
Year 4: FMV of Investment B determined to be $24 million
Year 5: Investment B sold for $20 million
The capital gains incentive fee, if any, would be:
Year 1: None
Year 2: $5 million capital gains incentive fee — 20%6: Capital Gains Fee = (17.5% multiplied by $25 million ($30 million realized capital gains on Investment A less $5 million unrealized capital depreciation on Investment B)
Year 3: $1.4 million capital gains incentive fee(1) — $6.4 million (20% multiplied by $32 million ($3528 million cumulative realized capital gains less $3$2 million unrealizedcumulative capital depreciation)) less $5$3.85 million capital gains incentive feecumulative Capital Gains Fee previously paid in = $4.55 million less $3.85 million = $0.70 million
Year 2
Year 4: None
Year 5: None — $5 million (20%7: Capital Gains Fee = (17.5% multiplied by $25($28 million (cumulativecumulative realized capital gains of $35less $2 million cumulative realized capital losses)) less $4.55 million cumulative Capital Gains Fee previously paid = $4.55 million less realized capital losses$4.55 million = $0.00 million
__________
(A) Solely for purposes of $10 million)) less $6.4 million cumulative capital gains incentive fee paidthese illustrative examples, we have assumed that the Company has not incurred any leverage. However, we have in Year 2the past and Year 3(2)expect to continue in the future to use leverage to partially finance our investments.
* The hypothetical amounts of returns shown are based on a percentage of our total net assets and assume no leverage. There is no guarantee that positive returns will be realized and actual returns may vary from those shown in this example.
| |
(1)1. | As illustrated in Year 3 of Scenario 2 above, if we were to be wound up on a date other than our fiscal year end of any year, we may have paid aggregate capital gains incentive fees that are more than the amount of such fees that would be payable if we had been wound up on our fiscal year end of such year.Represents 6.0% annualized preferred return. |
| |
(2)2. | As noted above, it is possible that the cumulative aggregate capital gains fee received by our investment adviser ($6.4 million) is effectively greater than $5 million (20% of cumulative aggregate realized capital gains less net realized capital losses or net unrealized depreciation ($25 million)).Represents 1.0% annualized management fee. |
| |
| 3. | The “catch-up” provision is intended to provide our Investment Adviser with an incentive fee of 17.5% on all of our pre-incentive fee net investment income as if a preferred return did not apply when our net investment income exceeds 1.50% in any calendar quarter and is not applied once our Investment Adviser has received 17.5% of investment income in a quarter. The “catch-up” portion of our pre-incentive fee net investment income is the portion that exceeds the 1.50% preferred return but is less than or equal to approximately 1.8182% (that is, 1.50% divided by (1 - 0.175)) in any fiscal quarter. |
Collection and Disbursement of Fees Owed to Our Former Adviser
Under the Former Investment Advisory Agreement described below, both the base management fee and incentive fee on income were calculated and paid to our Former Adviser at the end of each quarter. In order to ensure that our Former Adviser receives any compensation earned during the quarter ending December 31, 2017, the initial payment of the base management fee and incentive fee on income under the New Investment Advisory Agreement will cover the entire quarter in which the New Investment Advisory Agreement became effective, and be calculated at a blended rate that will reflect fee rates under the respective investment advisory agreements for the portion of the quarter in which our Former Adviser and Oaktree were serving as investment adviser. This structure will allow Oaktree to pay our Former Adviser in early 2018, the pro rata portion of the fees that were earned by, but not paid to, our Former Adviser for services rendered to us prior to October 17, 2017.
Duration and Termination
Unless earlier terminated as described below, the New Investment Advisory Agreement will remain in effect until October 17, 2019 and thereafter from year-to-year if approved annually by our Board or by the affirmative vote of the holders of a majority of our outstanding voting securities, including, in either case, approval by a majority of our directors who are not interested persons. The New Investment Advisory Agreement will automatically terminate in the event of its assignment. The New Investment Advisory Agreement may be terminated by either party without penalty upon 60 days’ written notice to the other. The New Investment Advisory Agreement may also be terminated, without penalty, upon the vote of a majority of our outstanding voting securities.
Indemnification
The New Investment Advisory Agreement provides that, absent willful misfeasance, bad faith or gross negligence in the performance of their respective duties or by reason of the reckless disregard of their respective duties and obligations, Oaktree and its officers, managers, partners, agents, employees, controlling persons, members (or their owners) and any other person or entity affiliated with it, are entitled to indemnification from us for any damages, liabilities, costs and expenses (including reasonable attorneys’ fees and amounts reasonably paid in settlement) arising from the rendering of Oaktree’s services under the New Investment Advisory Agreement or otherwise as our investment adviser.
Fee Waiver
For the two-year period commencing on October 17, 2017, Oaktree will waive, to the extent necessary, any management or incentive fees payable under the New Investment Advisory Agreement that exceed what would have been paid to the Former Adviser in the aggregate under the Former Investment Advisory Agreement.
Organization of our Investment Adviser
Our Investment Adviser is a Delaware limited partnership that is registered as an investment adviser under the Advisers Act. The principal address of our Investment Adviser is 333 South Grand Avenue, 28th Floor, Los Angeles, CA 90071.
Board Approval of the New Investment Advisory Agreement
The then-current members of our Board of Directors met in person with Oaktree to consider the New Investment Advisory Agreement on June 20, 2017 and July 13, 2017. At the in person meeting held on July 13, 2017, such members of the Board of Directors, including all of the then-current independent directors, unanimously approved the New Investment Advisory Agreement. Such independent directors met separately with independent counsel on multiple occasions in connection with their review of the New Investment Advisory Agreement and the Transaction. In reaching its decision to approve the New Investment Advisory Agreement, our Board of Directors, including all of the then-current independent directors, reviewed a significant amount of information, which had been furnished by Oaktree at the request of independent counsel, on behalf of the independent directors. In reaching a decision to approve the New Investment Advisory Agreement, the then-current members of our Board of Directors considered, among other things:
the nature, extent and quality of services to be performed by Oaktree;
the investment performance of us and funds managed by Oaktree;
the expected costs of services to be provided and the anticipated profits to be realized by Oaktree and its affiliates from their relationship with us;
the possible economies of scale that would be realized due to our growth;
whether fee levels reflect such economies of scale for the benefit of investors; and
comparisons of services to be rendered to and fees to be paid by us with the services provided by and the fees paid to other investment advisers and the services provided to and the fees paid by other Oaktree clients.
The then-current members of our Board of Directors noted that the terms of the New Investment Advisory Agreement would in comparison to the Former Investment Advisory Agreement:
maintain the base management fee at 1.00% of gross assets;
decrease the rate of the income incentive fee from 20.0% to 17.5%;
decrease the rate of the capital gains incentive fee from 20.0% to 17.5%;
increase the catch-up rate from 50.0% to 100.0%, which may have the effect of increasing the income-based incentive fee payable to Oaktree; and
eliminate a capital gains incentive fee until the fiscal year ending September 30, 2019.
The Board of Directors also considered other investment management services to be provided to us, such as the provision of managerial assistance, monitoring adherence to our investment restrictions and monitoring compliance with various of our policies and procedures and with applicable securities laws and regulations. The then-current members of our Board of Directors discussed Oaktree’s cyber security programs and those of its service providers. Based on the factors above, as well as those discussed below, the then-current members of our Board of Directors concluded that they were satisfied with the nature, extent and quality of the services to be provided to us by Oaktree.
No single factor was determinative of the decision of the Board of Directors, including all of the then-current independent directors, to approve the New Investment Advisory Agreement and individual directors may have weighed certain factors differently. Throughout the process, the independent directors were advised by independent counsel. Following this process, the then-current members of the Board of Directors, including all of the then-current independent directors, unanimously voted to approve the New Investment Advisory Agreement subject to stockholder approval. Our stockholders approved the New Investment Advisory Agreement at the Special Meeting.
Payment of Our Expenses
Our primary operating expenses are the payment of (i) a base management fee and any incentive fees underas described below in “-Former Investment Advisory Agreement” with respect to the investment advisory agreementperiod prior to October 17, 2017 and as described above in “-New Investment Advisory Agreement” with respect to the period subsequent to that date and (ii) the allocable portion of overhead and other expenses incurred by FSC CTour Former Administrator or Oaktree Administrator, as applicable, in performing its obligations under the administration agreement.Former Administration Agreement or New Administration Agreement, as applicable. Our management fee compensates our investment adviser for its work in identifying, evaluating, negotiating, executing and servicing our investments. We generally bear all other costs and expenses of our operations and transactions, including (without limitation) fees and expenses relating to:
expenses of offering expenses;our debt and equity securities;
the investigation and monitoring of our investments;
the cost of calculating our net asset value;
the cost of effecting sales and repurchases of shares of our common stock and other securities;
management and incentive fees payable pursuant to the investment advisory agreement;
fees payable to third parties relating to, or associated with, making investments and valuing investments (including third-party valuation firms);
transfer agent, trustee and custodial fees;
interest payments and other costs related to our borrowings;
fees and expenses associated with marketing efforts (including attendance at investment conferences and similar events);
federal and state registration fees;
any exchange listing fees;
federal, state and local taxes;
independent directors’ fees and expenses;
brokerage commissions;
costs of mailing proxy statements, stockholders’ reports and notices;
costs of preparing government filings, including periodic and current reports with the SEC;
fidelity bond, liability insurance and other insurance premiums; and
printing, mailing, independent accountants and outside legal costs and all other direct expenses incurred by either our administrator or us in connection with administering our business, including payments under the administration agreementagreement.
Former Investment Advisory Agreement
The following is a description of the Former Investment Advisory Agreement, which was terminated on October 17, 2017. The Former Investment Advisory Agreement, dated June 27, 2013, was most recently approved by our Board of Directors on August 7, 2017, and was effective June 27, 2013 through its termination on October 17, 2017.
Management Fee
Through October 17, 2017, we paid our Former Adviser a fee for its services under the Former Investment Advisory Agreement consisting of two components: a base management fee and an incentive fee. The cost of both the base management fee paid to our Former Adviser and any incentive fees earned by our Former Adviser were ultimately borne by our common stockholders.
Base Management Fee
The base management fee was calculated at an annual rate of 1.0% of our gross assets, including any borrowings for investment purposes but excluding cash and cash equivalents. The base management fee was payable quarterly in arrears and the fee for any partial month or quarter was appropriately prorated.
Incentive Fee
The incentive fee paid to our Former Adviser had two parts. The first part was calculated and payable quarterly in arrears based on our pre-incentive fee net investment income for the immediately preceding fiscal quarter. Pre-incentive fee net investment income, expressed as a rate of return on the value of our net assets at the end of the immediately preceding quarter, was compared to a “hurdle rate” of 1.5% per quarter, subject to a “catch-up” provision measured as of the end of each quarter. Our net investment income used to calculate this part of the incentive fee was also included in the amount of our gross assets used to calculate the 1.0% base management fee. The operation of the incentive fee with respect to our pre-incentive fee net investment income for each quarter was as follows:
No incentive fee was payable to the Former Adviser in any fiscal quarter in which our pre-incentive fee net investment income did not exceed the preferred return rate of 1.5% (the “preferred return”);
50% of our pre-incentive fee net investment income, if any, that exceeded the preferred return rate but was less than or equal to 2.5% in any fiscal quarter was payable to our Former Adviser. We refer to this portion of our pre-incentive fee net investment income (which exceeds the preferred return rate but is less than or equal to 2.5%) as the “catch-up.” The “catch-up” provision was intended to provide our Former Adviser with an incentive fee of 20% on all of our pre-incentive fee net investment income as if a preferred return rate did not apply when our pre-incentive fee net investment income exceeded 2.5% in any quarter; and
20% of the amount of our pre-incentive fee net investment income, if any, that exceeds 2.5% in any quarter is payable to our Former Adviser once the preferred return is reached and the catch-up is achieved (20% of all pre-incentive fee net investment income thereafter is allocated to Fifth Street Management).
There was no accumulation of amounts on the hurdle rate from quarter to quarter and accordingly there was no clawback of amounts previously paid if subsequent quarters were below the quarterly hurdle and there was no delay of payment if prior quarters were below the quarterly hurdle.
The following is a graphical representation of the calculation of the income-related portion of the incentive fee:
Quarterly Incentive Fee on Income based on Pre-incentive fee net investment income
(expressed as a percentage of net assets)
Percentage of pre-incentive fee net investment income
allocated to income-related portion of incentive fee
The second part of the incentive fee was determined and payable in arrears as of the end of each fiscal year (or upon termination of the Former Investment Advisory Agreement, as of the termination date) commencing on September 30, 2013 and equaled 20% of our realized capital gains, if any, on a cumulative basis from inception through the end of each fiscal year, computed net of all realized capital losses and unrealized capital depreciation on a cumulative basis, less the aggregate amount of any previously paid capital gain incentive fees.
Duration and Termination
The Former Investment Advisory Agreement terminated pursuant to its terms on October 17, 2017.
Indemnification
The Former Investment Advisory Agreement provided indemnification similar to that described above under “-New Investment Advisory Agreement-Indemnification.”
New Administrative Services Agreement
We entered into the New Administration Agreement with Oaktree Administrator on October 17, 2017. Pursuant to the New Administration Agreement, Oaktree Administrator provides administrative services to us necessary for our operations, which include providing office facilities, equipment, clerical, bookkeeping and record keeping services at such facilities and such other services as Oaktree Administrator, subject to review by our Board of Directors, shall from time to time deem to be necessary or useful to perform its obligations under the New Administration Agreement. Oaktree Administrator may, on behalf of us, conduct relations and negotiate agreements with custodians, trustees, depositories, attorneys, underwriters, brokers and dealers, corporate fiduciaries, insurers, banks and such other persons in any such other capacity deemed to be necessary or desirable. Oaktree Administrator will make reports to our Board of Directors of its performance of obligations under the New Administration Agreement and furnish advice and recommendations with respect to such other aspects of our business and affairs, in each case, as it shall determine to be desirable or as reasonably required by our Board of Directors; provided that Oaktree Administrator shall not provide any investment advice or recommendation.
Oaktree Administrator will also provide portfolio collection functions for interest income, fees and warrants and is responsible for the financial and other records that we are based uponrequired to maintain, and prepares, prints and disseminates reports to our stockholders and all other materials filed with the SEC. In addition, Oaktree Administrator will assist us in determining and publishing our net asset value, overseeing the preparation and filing of our tax returns, and generally overseeing the payment of our expenses and the performance of administrative and professional services rendered to us by others. Oaktree Administrator may also offer to provide, on our behalf, managerial assistance to our portfolio companies.
For providing these services, facilities and personnel, we will reimburse Oaktree Administrator the allocable portion of overhead and other expenses incurred by our administratorOaktree Administrator in performing its obligations under the administration agreementNew Administration Agreement, including our allocable portion of the rent of the Company’s principal executive offices at market rates and the Company’s allocable portion of the costs of compensation and related expenses of our chief financial officerChief Financial Officer, Chief Compliance Officer, their staffs and chief compliance officer and their respective staffs.
Duration and Termination
Unless earlier terminated as described below, the investment advisory agreement will remain in effect from year-to-year if approved annuallyother non-investment professionals at Oaktree that perform duties for us. Such reimbursement is at cost, with no profit to, or markup by, the Board of Directors or by the affirmative vote of the holders of a majority of our outstanding voting securities, including, in either case, approval by a majority of our directors who are not interested persons. The investment advisory agreement will automatically terminate in the event of its assignment. The investment advisory agreement may be terminated by either party without penalty upon not more than 60 days’ written notice to the other. The investment advisory agreement may also be terminated, without penalty, upon the vote of a majority of our outstanding voting securities.
IndemnificationOaktree Administrator.
The investment advisory agreementNew Administration Agreement provides that, absent willful misfeasance, bad faith or gross negligence in the performance of their respective duties or by reason of the reckless disregard of their respective duties and obligations, our investment adviserOaktree Administrator and its officers, managers, partners, agents, employees, controlling persons, members (or their owners) and any other person or entity affiliated with it, are entitled to indemnification from us for any damages, liabilities, costs and expenses (including reasonable attorneys’ fees and amounts reasonably paid in settlement) arising from the rendering of our investment adviser’sOaktree Administrator’s services under the investment advisory agreementNew Administration Agreement or otherwise as our investment adviser.
Organization of our Investment Adviser
Our investment adviser is a Delaware limited liability company that registeredadministrator. Unless earlier terminated as an investment adviser underdescribed below, the Advisers Act. The principal address of our investment adviser is 777 West Putnam Avenue, 3rd Floor, Greenwich, CT 06830.
Board Approval of the Investment AdvisoryNew Administration Agreement
The investment advisory agreement was first will remain in effect until October 17, 2019 and thereafter from year-to-year if approved annually by our Board of Directors in June 2013. Most recently, at a meetingor by the affirmative vote of the Boardholders of Directors held in September 2016, our Board of Directors, including a majority of the directors who were not “interested persons” as definedour outstanding voting securities, including, in the 1940 Act, approved the annual renewal of the investment advisory agreement. In reaching a decision to approve the renewal of the investment advisory agreement, the Board of Directors reviewed a significant amount of information and considered, among other things:
the nature, extent and quality of services to be performedeither case, approval by Fifth Street Management;
our investment performance and that of Fifth Street Management’s portfolio managers with other investment portfolios with similar strategies to ours;
the anticipated costs of providing services to us;
the anticipated profitability of the relationship between us and Fifth Street Management;
comparative information on fees and expenses borne by other comparable BDCs;
comparative business development company performance and other competitive factors;
the extent to which economies of scale have been realized as we have grown; and
whether proposed fee levels reflect these economies of scale for the benefit of our investors.
No single factor was determinative of the decision of our Board of Directors, including a majority of theour directors who are not “interested persons” as defined ininterested persons. The New Administration Agreement may be terminated by either party without penalty upon 60 days’ written notice to the 1940 Act, to approveother. The New Administration Agreement may also be terminated, without penalty, upon the renewalvote of the investment advisory agreement. Rather, consistent with applicable law and guidance from the federal courts and based on the considerations described above, our Board of Directors, including a majority of the independent directors, based its determination to approve the continuation of theour outstanding voting securities.
investment advisory agreement on the total mix of information and concluded that the investment advisory agreement is fair and reasonable in relation to the services provided.
Former Administration Agreement
We have also entered into an administration agreement with FSC CT,The Former Administration Agreement was in effect throughout our 2017 fiscal year and terminated by its terms on October 17, 2017. Our Former Administrator was a wholly-owned subsidiary of Fifth Street Management. Pursuant to the Former Administration Agreement, our investment adviser,Former Administrator provided services substantially similar to those provided by Oaktree Administrator as described above under which FSC CT provides administrative services for us, including office facilities, including our principal executive offices, and equipment and clerical, bookkeeping and record-keeping services at such facilities. Under the administration agreement, FSC CT also performs, or oversees the performance of, our required administrative services, which includes being responsible for the financial records which we are required to maintain and preparing reports to our stockholders and reports filed with the SEC. In addition, FSC CT assists us in determining and publishing our net asset value, overseeing the preparation and filing of our tax returns and the printing and dissemination of reports to our stockholders, and generally overseeing the payment of our expenses and the performance of administrative and professional services rendered to us by others. FSC CT may also provide on our behalf managerial assistance to our portfolio companies.“-New Administrative Services Agreement.” For providing these services, facilities and personnel, we reimburse FSC CTreimbursed the Former Administrator the allocable portion of overhead and other expenses incurred by FSC CTit in performing its obligations under the administration agreement,Former Administration Agreement, including rent and our allocable portion of the costs of compensation and related expenses of our chief financial officerChief Financial Officer and chief compliance officerChief Compliance Officer and their staffs. Such reimbursement iswas at cost, with no profit to, or markup by, FSC CT.our Former Administrator. Our allocable portion of FSC CT'sour Former Administrator’s costs iswas determined based upon costs attributable to our operations versus costs attributable to the operations of other entities for which FSC CT providesour Former Administrator provided administrative services.
The administration agreement may be terminated by either party without penalty upon 60 days’ written noticeFormer Administration Agreement provided indemnification similar to the other party.
The administration agreement provides that absent willful misfeasance, bad faith or gross negligence in the performance of their respective duties or by reason of the reckless disregard of their respective duties and obligations, FSC CT and its officers, managers, agents, employees, controlling persons, members and any other person or entity affiliated with it are entitled to indemnification from us for any damages, liabilities, costs and expenses (including reasonable attorneys’ fees and amounts reasonably paid in settlement) arising from the rendering of servicesdescribed under the administration agreement or otherwise as administrator for us."- New Administrative Services Agreement."
License Agreement
We have entered intowere party to a license agreement with Fifth Street Capital LLCan affiliate of our Former Adviser pursuant to which Fifth Street Capital LLC has agreed to grantsuch affiliate granted us a non-exclusive, royalty-free license to use the name “Fifth Street.” Under this agreement, we will have a right to use the “Fifth Street” name, for so long as Fifth Street Managementour Former Adviser or one of its affiliates remainsremained our investment adviser. OtherThat license agreement terminated on October 17, 2017.
Material Conflicts of Interest
Our executive officers and directors, and certain members of our Investment Adviser, serve or may serve as officers, directors or principals of entities that operate in the same or a related line of business as we do or of investment funds managed by our affiliates. For example, Oaktree presently serves as the investment adviser to OCSL, a publicly-traded business development company with a portfolio of approximately $1.5 billion at fair value as of September 30, 2017. OCSL has historically invested in debt and equity of small and mid-sized companies, primarily in connection with investments by private equity sponsors, including in middle-market leveraged companies similar to those we target for investment. In addition, though not the primary focus of its investment portfolio, OCSL’s investments also include floating rate senior loans. Therefore, there may be certain investment opportunities that satisfy the investment criteria for both OCSL and us. OCSL operates as a distinct and separate public company and any investment in our common stock will not be an investment in OCSL. In addition, all of
our executive officers and four of our independent directors serve in substantially similar capacities for OCSL. Oaktree and its affiliates also manage and sub-advise private investment funds and accounts, and may manage other such funds and accounts in the future, which have investment mandates that are similar, in whole and in part, with ours. Accordingly, they may have obligations to investors in those entities, the fulfillment of which might not be in the best interests of us or our stockholders. For example, the personnel of our Investment Adviser may face conflicts of interest in the allocation of investment opportunities to us and such other funds and accounts.
Oaktree has investment allocation guidelines that govern the allocation of investment opportunities among the investment funds and accounts managed or sub-advised by Oaktree and its affiliates. To the extent an investment opportunity is appropriate for us or OCSL or any other investment fund or account managed or sub-advised by Oaktree or its affiliates, Oaktree will adhere to its investment allocation guidelines in order to determine a fair and equitable allocation. We may invest alongside funds and accounts managed or sub-advised by our Investment Adviser and its affiliates in certain circumstances where doing so is consistent with applicable law and SEC staff interpretations. For example, we may invest alongside such accounts consistent with guidance promulgated by the staff of the SEC permitting us and such other accounts to purchase interests in a single class of privately placed securities so long as certain conditions are met, including that our Investment Adviser, acting on our behalf and on behalf of other clients, negotiates no term other than price or terms related to price.
In addition, on October 18, 2017, our Investment Adviser received exemptive relief from the SEC to allow certain managed funds and accounts, each of whose investment adviser is Oaktree or an investment adviser controlling, controlled by or under common control with respectOaktree, to this limited license, we will have no legal rightparticipate in negotiated co-investment transactions where doing so is consistent with the applicable registered fund’s or business development company’s investment objective and strategies as well as regulatory requirements and other pertinent factors, and pursuant to the “Fifth Street” name.conditions of the exemptive relief. Each potential co-investment opportunity that falls under the terms of the exemptive relief and is appropriate for us and any affiliated fund or account, and satisfies the then-current board-established criteria, will be offered to us and such other eligible funds and accounts. If there is a sufficient amount of securities to satisfy all participants, the securities will be allocated among the participants in accordance with their proposed order size and if there is an insufficient amount of securities to satisfy all participants, the securities will be allocated pro rata based on the investment proposed by the applicable investment adviser to such participant, up to the amount proposed to be invested by each, which is reviewed and approved by an independent committee of legal, compliance and accounting professionals at our Investment Adviser.
Although Oaktree will endeavor to allocate investment opportunities in a fair and equitable manner, we and our common stockholders could be adversely affected to the extent investment opportunities are allocated among us and other investment vehicles managed or sponsored by, or affiliated with, our executive officers, directors and members of our Investment Adviser. We might not participate in each individual opportunity, but will, on an overall basis, be entitled to participate equitably with other entities managed by Oaktree and its affiliates. Oaktree seeks to treat all clients fairly and equitably such that none receive preferential treatment vis-à-vis the others over time, in a manner consistent with its fiduciary duty to each of them; however, in some instances, especially in instances of limited liquidity, the factors may not result in pro rata allocations or may result in situations where certain funds or accounts receive allocations where others do not.
Pursuant to the New Investment Advisory Agreement, our Investment Adviser’s liability is limited and we are required to indemnify our Investment Adviser against certain liabilities. This may lead our Investment Adviser to act in a riskier manner in performing its duties and obligations under the New Investment Advisory Agreement than it would if it were acting for its own account, and creates a potential conflict of interest.
Pursuant to the New Administration Agreement, the Oaktree Administrator furnishes us with the facilities, including our principal executive office, and administrative services necessary to conduct our day-to-day operations. We pay the Oaktree Administrator its allocable portion of overhead and other expenses incurred by the Oaktree Administrator in performing its obligations under the New Administration Agreement, including, without limitation, a portion of the rent at market rates and compensation of our Chief Financial Officer, Chief Compliance Officer, their respective staffs and other non-investment professionals at Oaktree that perform duties for us.
Available Information
We maintain a website at http://fsfr.fifthstreetfinance.com.www.oaktreestrategicincome.com. The information on our website is not incorporated by reference in this annual report on Form 10-K.
We make available on or through our website certain reports and amendments to those reports that we file with or furnish to the SEC in accordance with the Securities Exchange Act of 1934, as amended, or the Exchange Act. These include our annual reports on Form 10-K, our quarterly reports on Form 10-Q and our current reports
on Form 8-K. We make this information available on our website free of charge as soon as reasonably practicable after we electronically file the information with, or furnish it to, the SEC.
Business Development Company Regulations
We have elected to be regulated as a business development company under the 1940 Act. The 1940 Act contains prohibitions and restrictions relating to transactions between business development companies and their affiliates, principal underwriters and affiliates of those affiliates or underwriters. The 1940 Act requires that a majority of theour directors be persons other than “interested persons,” as that term is defined in the 1940 Act. In addition, the 1940 Act provides that we may not change the nature of our business so as to cease to be, or to withdraw our election as, a business development company unless approved by a majority of our outstanding voting securities.
The 1940 Act defines “a majority of the outstanding voting securities” as the lesser of (i) 67% or more of the voting securities present at a meeting if the holders of more than 50% of our outstanding voting securities are present or represented by proxy or (ii) more than 50% of our outstanding voting securities.
As a business development company, we were substantially limited inOn October 18, 2017, our ability to co-invest in privately negotiated transactions with affiliated funds until we obtained anInvestment Adviser received exemptive orderrelief from the SEC in September 2014. The exemptive relief permits us to participate in negotiated co-investment transactions, subject to the conditions of the relief granted by the SEC, withallow certain affiliates,managed funds and accounts, each of whose investment adviser is Fifth Street Management,Oaktree or an investment adviser controlling, controlled by or under common control with Fifth Street Management,Oaktree, to participate in a mannernegotiated co-investment transactions where doing so is consistent with ourthe applicable registered fund’s or business development company’s investment objective positions, policies,and strategies, and restrictions as well as regulatory requirements and other pertinent factors, and pursuant to the conditions toof the exemptive relief.
We may invest up to 100% of our assets in securities acquired directly from issuers in privately negotiated transactions. With respect to such securities, we may, for the purpose of public resale, be deemed an “underwriter” as that term is defined in the Securities Act of 1933, as amended, or the Securities Act. Our intention is to not write (sell) or buy put or call options to manage risks associated with the publicly traded securities of our portfolio companies, except that we may enter into hedging transactions to manage the risks associated with interest rate and foreign exchange fluctuations. However, we may purchase or otherwise receive warrants to purchase the common stock of our portfolio companies in connection with acquisition financing or other investments. Similarly, in connection with an acquisition, we may acquire rights to require the issuers of acquired securities or their affiliates to repurchase themsuch securities under certain circumstances. We also do not intend to acquire securities issued by any investment company that exceed the limits imposed by the 1940 Act. Under these limits, we generally cannot acquire more than three percent of the voting stock of any registered investment company, invest more than five percent of the value of our total assets in the securities of one registered investment company or invest more than 10% of the value of our total assets in the securities of registered investment companies. With regard to that portion of our portfolio invested in securities issued by investment companies, it should be noted that such investments might subject our stockholders to additional expenses. None of these policies is fundamental, and all may be changed without stockholder approval.
Qualifying Assets
Under the 1940 Act, a business development company may not acquire any asset other than assets of the type listed in Section 55(a) of the 1940 Act, which are referred to as qualifying assets, unless, at the time the acquisition is made, qualifying assets represent at least 70% of the company’s total assets. The principal categories of qualifying assets relevant to our business are any of the following:
(1) Securities purchased in transactions not involving any public offering from the issuer of such securities, which issuer (subject to certain limited exceptions) is an eligible portfolio company, or from any person who is, or has been during the preceding 13 months, an affiliated person of an eligible portfolio company, or from any other person, subject to such rules as may be prescribed by the SEC. An eligible portfolio company is defined in the 1940 Act as any issuer which:
(a) is organized under the laws of, and has its principal place of business in, the United States;
(b) is not an investment company (other than a small business investment company wholly owned by the business development company) or a company that would be an investment company but for certain exclusions under the 1940 Act; and
(c) satisfies any of the following:
(i) does not have any class of securities that is traded on a national securities exchange;
(ii) has a class of securities listed on a national securities exchange, but has an aggregate market value of outstanding voting and non-voting common equity of less than $250 million;
(iii) is controlled by a business development company or a group of companies including a business development company and the business development company has an affiliated person who is a director of the eligible portfolio company; or
(iv) is a small and solvent company having total assets of not more than $4 million and capital and surplus of not less than $2 million;
(2) Securities of any eligible portfolio company that we control;
(3) Securities purchased in a private transaction from a U.S. issuer that is not an investment company or from an affiliated person of the issuer, or in transactions incident thereto, if the issuer is in bankruptcy and subject to reorganization or if the issuer, immediately prior to the purchase of its securities was unable to meet its obligations as they came due without material assistance other than conventional lending or financing arrangements;
(4) Securities of an eligible portfolio company purchased from any person in a private transaction if there is no ready market for such securities and we already own 60% of the outstanding equity of the eligible portfolio company;
(5) Securities received in exchange for or distributed on or with respect to securities described in (1) through (4) above, or pursuant to the exercise of warrants or rights relating to such securities; or
(6) Cash, cash equivalents, U.S. government securities or high-quality debt securities maturing in one year or less from the time of investment.
In addition, a business development company must be operated for the purpose of making investments in the types of securities described in (1), (2) or (3) above.
Managerial Assistance to Portfolio Companies
Business development companies generally must offer to make available to the issuer of the securities significant managerial assistance, except in circumstances where either (i) the business development company controls such issuer of securities or (ii) the business development company purchases such securities in conjunction with one or more other persons acting together and one of the other persons in the group makes available such managerial assistance. Making available managerial assistance means, among other things, any arrangement whereby the business development company, through its directors, officers or employees (if any), offers to provide, and, if accepted, does so provide, significant guidance and counsel concerning the management, operations or business objectives and policies of a portfolio company.
Temporary Investments
Pending investment in other types of “qualifying assets,” as described above, our investments may consist of cash, cash equivalents, U.S. government securities or high-quality debt securities maturing in one year or less from the time of investment, which we refer to, collectively, as temporary investments, so that 70% of our assets are qualifying assets. We may invest in U.S. Treasury bills or in repurchase agreements, provided that such agreements are fully collateralized by cash or securities issued by the U.S. government or its agencies. A repurchase agreement (which is substantially similar to a secured loan) involves the purchase by an investor, such as us, of a specified security and the simultaneous agreement by the seller to repurchase it at an agreed-upon future date and at a price that is greater than the purchase price by an amount that reflects an agreed-upon interest rate. There is no percentage restriction on the proportion of our assets that may be invested in such repurchase agreements. However, if more than 25% of our total assets constitute repurchase agreements from a single counterparty, we would generally not meet the diversification tests in order to qualify as a RIC for U.S. federal income tax purposes. Thus, we do not intend to enter into repurchase agreements with a single counterparty in excess of this limit. Our investment adviserInvestment Adviser will monitor the creditworthiness of the counterparties with which we enter into repurchase agreement transactions.
Managerial Assistance to Portfolio Companies
Business development companies generally must offer to make available to the issuer of the securities significant managerial assistance, except in circumstances where either (i) the business development company controls such issuer of securities or (ii) the business development company purchases such securities in conjunction with one or more other persons acting together and one of the other persons in the group makes available such managerial assistance. Making available significant managerial assistance means, among other things, any arrangement whereby the business development company, through its directors, officers or employees (if any), offers to provide, and, if accepted, does so provide, significant guidance and counsel concerning the management, operations or business objectives and policies of a portfolio company.
Senior Securities
We are permitted, under specified conditions, to issue multiple classes of debt and one class of stock senior to our common stock if our asset coverage, as defined in the 1940 Act, is at least equal to 200% immediately after each such issuance. In addition, while any senior securities remain outstanding, we may be prohibited from making distributions to our stockholders or repurchasing such securities or shares unless we meet the applicable asset coverage ratios at the time of the distribution or repurchase. We may also borrow amounts up to 5% of the value of our total assets for temporary or emergency purposes without regard to asset coverage. For a discussion of the risks associated with leverage, see “Risk Factors — Risks Relating to Our Business and Structure — Regulations governing our operation as a business development company and RIC affect our ability to raise, and the way in which we raise, additional capital or borrow for investment purposes, which may have
a negative effect on our growth” and “— Because we borrow money, the potential for loss on amounts invested in us will be magnified and may increase the risk of investing in us.”
Common Stock
We are not generally able to issue and sell our common stock at a price below net asset value per share. We may, however, sell our common stock, warrants, options or rights to acquire our common stock, at a price below the current net asset value of the common stock if our Board of Directors determines that such sale is in our best interests and that of our stockholders, and our stockholders approve such sale. In any such case, the price at which our securities are to be issued and sold may not be less than a price which, in the determination of our Board of Directors, closely approximates the market value of such securities (less any distributing commission or discount). We may also make rights offerings to our stockholders at prices per share less than the net asset value per share, subject to applicable requirements of the 1940 Act. See “Risk Factors — Risks Relating to Our Business and Structure — Regulations governing our operation as a business development company and RIC may affect our ability to raise, and the way in which we raise, additional capital or borrow for investment purposes, which may have a negative effect on our growth.”
Code of Ethics
We have adopted a joint code of ethics with OCSL pursuant to Rule 17j-1 under the 1940 Act and we have also approved the investment adviser’s code of ethics that was adopted by it under Rule 17j-1 under the 1940 Act and Rule 204A-1 under the Advisers Act. These codes establish procedures for personal investments and restrict certain personal securities transactions. Personnel subject to the code may invest in securities for their personal investment accounts, including securities that may be purchased or held by us, so long as such investments are made in accordance with the code’s requirements. You may read and copy the codes of ethics at the SEC’s Public Reference Room located at 100 F Street, NE, Washington, DC 20549. You may obtain information on the operation of the Public Reference Room by calling the SEC at 1-800-SEC-0330. In addition, the codes of ethics are available on the EDGAR Database on the SEC’s website at http://www.sec.gov and are available at the Investor RelationsInvestors: Corporate Governance portion of our website at http://fsfr.fifthstreetfinance.com.www.oaktreestrategicincome.com.
Compliance Policies and Procedures
We and our investment adviserInvestment Adviser have adopted and implemented written policies and procedures reasonably designed to prevent violation of the federal securities laws and are required to review these compliance policies and procedures annually for their adequacy and the effectiveness of their implementation. Our chief compliance officerChief Compliance Officer is responsible for administering these policies and procedures.
Proxy Voting Policies and Procedures
We have delegated our proxy voting responsibility to our investment adviser.Investment Adviser. The proxy voting policies and procedures of our investment adviser are set forth below. The guidelines are reviewed periodically by our investment adviserInvestment Adviser and our non-interested directors, and, accordingly, are subject to change.
Introduction
As an investment adviser registered under the Advisers Act, our investment adviserInvestment Adviser has a fiduciary duty to act solely in the best interests of its clients. As part of this duty, it recognizes that it must vote client securities in a timely manner free of conflicts of interest and in the best interests of its clients.
These policies and procedures for voting proxies for the investment advisory clients of our investment adviserInvestment Adviser are intended to comply with Section 206 of, and Rule 206(4)-6 under, the Advisers Act.
Proxy Voting Policies
Our investment adviserInvestment Adviser will vote proxies relating to our securities in the best interest of our stockholders. It will review on a case-by-case basis each proposal submitted for a stockholder vote to determine its impact on the portfolio securities held by us. Although our investment adviser will generally vote against proposals that may have a negative impact on our portfolio securities, it may vote for such a proposal if there exists compelling long-term reasons to do so.
The proxy voting decisions of our investment adviserInvestment Adviser with respect to any of our investments are made by the officers who areinvestment professionals responsible for monitoring each of our investments.such investment. To ensure that its vote is not the product of a conflict of interest, our investment adviser will requireInvestment Adviser requires that: (a) anyone involved in the decision-making process disclose to its chieflegal and compliance officerpersonnel any potential conflict that he or she is aware of and any contact that he or she has had with any interested party regarding a proxy vote; and (b) employees involved in the decision-makingdecision making process or vote administration are prohibited from revealing how our investment adviserInvestment Adviser intends to vote on a proposal in order to reduce any attempted influence from interested parties.
Proxy Voting Records
You may obtain information, without charge, regarding how our investment adviserInvestment Adviser and Former Adviser voted proxies for us for the most recent 12-month period ended June 30, 20162017 with respect to our portfolio securities by making a written request for proxy voting information to: Fifth Street Senior Floating Rate Corp.Oaktree Specialty Lending Corporation, Chief Compliance Officer, 777 West Putnam333 South Grand Avenue, 3rd28th Floor, Greenwich, CT 06830.Los Angeles, CA 90071.
Other
We are subject to periodic examination by the SEC for compliance with the 1940 Act.
We are required to provide and maintain a bond issued by a reputable fidelity insurance company to protect us against larceny and embezzlement. Furthermore, as a business development company, we are prohibited from protecting any director or officer against any liability to us or our stockholders arising from willful misfeasance, bad faith, gross negligence or reckless disregard of the duties involved in the conduct of such person’s office.
Securities Exchange Act and Sarbanes-Oxley Act Compliance
We are subject to the reporting and disclosure requirements of the Exchange Act, including the filing of quarterly, annual and current reports, proxy statements and other required items. In addition, we are subject to the Sarbanes-Oxley Act, of 2002, which imposes a wide variety of regulatory requirements on publicly-held companies and their insiders. For example:
pursuant to Rule 13a-14 under the Exchange Act, our chief executive officer and chief financial officer are required to certify the accuracy of the financial statements contained in our periodic reports;
pursuant to Item 307 of Regulation S-K, our periodic reports are required to disclose our conclusions about the effectiveness of our disclosure controls and procedures; and
pursuant to Rule 13a-15 under the Exchange Act, our management is required to prepare a report regarding its assessment of our internal control over financial reporting. Our independent registered public accounting firm is required to audit our internal control over financial reporting. When we are no longer an emerging growth company under the JOBS Act, our independent registered public accounting firm will be required to audit our internal control over financial reporting.
We will remain an “emerging growth company,” as defined in the JOBS Act until the earliest of:
the last day of our fiscal year ending September 30, 2018;
the last day of the fiscal year in which our total annual gross revenues first exceed $1.0 billion; or
the date on which we have, during the prior three-year period, issued more than $1.0 billion in non-convertible debt;
or
the last day of a fiscal year in which we have an aggregate worldwide market value of our common stock held by non-affiliates of $700 million or more, computed at the end of each fiscal year as of the last business day of our most recently completed second fiscal quarter.debt.
Stock Exchange Corporate Governance Regulations
The NASDAQ Global Select Market has adopted corporate governance regulations that listed companies must comply with. We are in compliance with such corporate governance regulations applicable to business development companies.
Taxation as a Regulated Investment Company
As a business development company, we have elected to be treated, and intend to continue to qualify annually, as a RIC under Subchapter M of the Code. As a RIC, we generally will not be subject to corporate-level U.S. federal income taxes on any income that we distribute (or are deemed to have distributed) to our stockholders as dividends for U.S. federal income tax purposes. To continue to qualify as a RIC, we must, among other things, meet certain source-of-income and asset diversification requirements (as described below). In addition, to qualify for RIC tax treatment we must distribute to our stockholders, for each taxable year, dividends of an amount generally equal to at least 90% of our “investment company taxable income,” which is generally our ordinary income plus the excess of our realized net short-term capital gains over our realized net long-term capital losses, determined without regard to any deduction for dividends paid, or the Annual Distribution Requirement.
If we qualify as a RIC and satisfy the Annual Distribution Requirement, then we generally will not be subject to U.S. federal income tax on the portion of our income we distribute (or are deemed to distribute) to stockholders. We will be subject to U.S. federal income tax at the regular corporate rates on any income or capital gains not distributed (or deemed distributed) to our stockholders.
We will be subject to a 4% nondeductible U.S. federal excise tax on certain undistributed income unless we timely distribute dividends in respect of each calendar year of an amount at least equal to the sum of (1) 98% of our net ordinary income (taking into account certain deferrals and elections) for each calendar year, (2) 98.2% of our capital gain net income (adjusted for certain ordinary losses) for the one-year period ending October 31 in that calendar year and (3) any net ordinary
income or capital gain net income recognized, but not distributed, in preceding years and on which we paid no U.S. federal corporate income tax, or the Excise Tax Avoidance Requirement. We generally will endeavor in each taxable year to make sufficient distributions to our stockholders to avoid any U.S. federal excise tax on our earnings.
In order to qualify as a RIC for U.S. federal income tax purposes, we must, among other things:
continue to maintain our election to be treated as a business development company under the 1940 Act at all times during each taxable year;
derive in each taxable year at least 90% of our gross income from dividends, interest, payments with respect to loans of certain securities, gains from the sale of stock or other securities, net income from certain “qualified publicly traded partnerships,” or other income derived with respect to our business of investing in such stock or securities, or the 90% Income Test; and
diversify our holdings so that at the end of each quarter of the taxable year:
at least 50% of the value of our assets consists of cash, cash equivalents, U.S. Government securities, securities of other RICs, and other securities if such other securities of any one issuer do not represent more than 5% of the value of our assets or more than 10% of the outstanding voting securities of the issuer; and
no more than 25% of the value of our assets is invested in the securities, other than U.S. government securities or securities of other RICs, of one issuer, of two or more issuers that are controlled, as determined under applicable Code rules, by us and that are engaged in the same or similar or related trades or businesses or of certain “qualified publicly traded partnerships,” or the Diversification Tests.
Earnings considered qualifying income in determining our satisfaction of the 90% Income Test may exclude such income as management fees received in connection with potential outside managed funds and certain other fees.
We may be required to recognize taxable income in circumstances in which we do not receive cash. For example, if we hold debt instruments that are treated under applicable tax rules as having OID (such as debt instruments with PIK interest or, in certain cases, increasing interest rates or debt issued with warrants), we generally would be required to include in income each taxable year a portion of the OID that accrues over the life of the debt instrument, regardless of whether cash representing such income is received by us in the same taxable year. We also may be required to include in income other amounts that we have not yet received in cash, such as PIK interest and deferred loan origination fees that are paid after origination of a loan or are paid in non-cash compensation such as warrants or stock. Because any OID or other amounts accrued will be included in our investment company taxable income for the taxable year of accrual, we may be required to make a distribution to our stockholders in order to satisfy the Annual Distribution Requirement or the Excise Tax Avoidance Requirement, even though we will not have received any corresponding cash amount.
Although we do not presently expect to do so, we are authorized to borrow funds and to sell assets in order to satisfy the Annual Distribution Requirement or the Excise Tax Avoidance Requirement. However, under the 1940 Act, we are not permitted in certain circumstances to make distributions to our stockholders while our debt obligations and other senior securities are outstanding unless certain “asset coverage” tests are met. Moreover, our ability to dispose of assets to meet Annual Distribution Requirement or the Excise Tax Avoidance Requirement may be limited by (1) the illiquid nature of our portfolio and/or (2) other requirements relating to maintaining our status as a RIC. If we dispose of assets in order to meet the Annual Distribution Requirement or the Excise Tax Avoidance Requirement, we may make such dispositions at times that, from an investment standpoint, are not advantageous.
RISK FACTORS
Item 1A. Risk Factors
RISK FACTORS
Investing in our securities involves a number of significant risks. In addition to the other information contained in this annual report on Form 10-K, you should consider carefully the following information before making an investment in our securities. The risks set out below are not the only risks we or other BDCsbusiness development companies face. Additional risks and uncertainties not presently known to us or not presently deemed material by us might also impair our operations and performance. If any of the following events occur, our business, financial condition and results of operations could be materially and adversely affected. In such case, our net asset value and the trading price of our securities could decline, and you may lose part or all of your investment. This section also describes the special risks of investing in BDCs,business development companies, including the risks associated with investing in a portfolio of small and developing or financially troubled businesses.
Risks Relating to Economic Conditions
Economic recessions or downturns may have a material adverse effect on our business, financial condition and results of operations, and could impair the ability of our portfolio companies to repay loans.debt or pay interest.
Economic recessions or downturns may result in a prolonged period of market illiquidity which could have a material adverse effect on our business, financial condition and results of operations. Unfavorable economic conditions also could increase our funding costs, limit our access to the capital markets or result in a decision by lenders not to extend credit to us. These events could limit our investment originations, limit our ability to grow and negatively impact our operating results.
In addition, whenuncertainty with regard to economic recovery from recessions or downturns could also have a negative impact on our business, financial condition and results of operations.
When recessionary conditions exist, the financial results of middle marketsmall and mid-sized companies, like those in which we invest, typically experience deterioration, which could ultimately lead to difficulty in meeting debt service requirements and an increase in defaults. Additionally, the end markets for certain of our portfolio companies’ products and services would likely experience negative economic trends. The performances of certain of our portfolio companies have been, and may continue to be, negatively impacted by these economic or other conditions, which may ultimately result in our receipt of a reduced level of interest income from our portfolio companies and/or losses or charge offs related to our investments, and, in turn, may adversely affect distributable income. Further, adverse economic conditions may decrease the value of collateral securing some of our loans and the value of our equity investments. As a result, we may need to modify the payment terms of our investments, including changes in PIK interest provisions and/or cash interest rates. These factorsThe performances of certain of our portfolio companies have been, and may continue to be, negatively impacted by these economic or other conditions, which may result in our receipt of a reduced level of interest income from our portfolio companies and/or losses or charge offs related to our investments, and, in turn, may adversely affect distributable income and have a material adverse effect on our results of operations.
Global economic, political and market conditions, including downgrades of the U.S. credit rating, may adversely affect our business, results of operations and financial condition, including our revenue growth and profitability.
The current worldwide financial market situation, as well as various social and political tensions in the United States and around the world, may contribute to increased market volatility, may have long-term effects on the United States and worldwide financial markets and may cause economic uncertainties or deterioration in the United StatesU.S. and worldwide. The impact of downgrades by rating agencies to the U.S. government’s sovereign credit rating or its perceived creditworthiness as well as potential government shutdowns could adversely affect the U.S. and global financial markets and economic conditions. Since 2010, several European Union, (“EU”)or EU, countries including Greece, Ireland, Italy, Spain, and Portugal, have faced budget issues, some of which may have negative long-term effects for the economies of those countries and other EU countries. There is continued concern about national-level support for the Euro and the accompanying coordination of fiscal and wage policy among European Economic and Monetary Union member countries. In addition, the fiscal policy of foreign nations, such as Russia and China, may have a severe impact on the worldwide and United StatesU.S. financial markets. The recent decision made in the United Kingdom referendum to leave the EU (the so-called "Brexit") has led to volatility in global financial markets and may lead to weakening in consumer, corporate and financial confidence in the United Kingdom and Europe. The extent and process by which the United Kingdom will exit the EU areremain unclear at this time and are likely tocould lead to ongoing political and economic uncertainty and periods of exacerbated volatility in both the United Kingdom and in wider European markets. Additionally, volatility in the Chinese stock markets and global markets for commodities may affect other financial markets worldwide. We cannot predict the effects of these or similar events in the future on the United StatesU.S. and global economies and securities markets or on our investments. We monitor developments and seek to manage our investments in a manner consistent with achieving our investment objective, but there can be no assurance that we will be successful in doing so.
Risks Relating to Our Business and Structure
Our Investment Adviser has limited experience operating under the constraints imposed on us as a business development company, which may hinder the achievement of our investment objectives.
The 1940 Act imposes numerous constraints on the operations of business development companies that do not apply to other investment vehicles managed by Oaktree and its affiliates. Business development companies are required, for example, to invest at least 70% of their total assets primarily in securities of U.S. private or thinly-traded public companies, cash, cash equivalents, U.S. government securities and other high-quality debt instruments that mature in one year or less from the date of investment. Our Investment Adviser does not have any experience operating under these constraints, which may hinder our ability to take advantage of attractive investment opportunities and to achieve our investment objective. Our Investment Adviser's track record and achievements are not necessarily indicative of the future results it will achieve. Accordingly, we can offer no assurance that we will replicate the historical performance of other investment companies with which our investment professionals have been affiliated and we caution that our investment returns could be substantially lower than the returns achieved by such other companies.
Changes in interest rates, changes in the method for determining LIBOR and the potential replacement of LIBOR may affect our cost of capital and net investment income.
General interest rate fluctuations and changes in credit spreads on floating rate loans may have a substantial negative impact on our investments and investment opportunities and, accordingly, may have a material adverse effect on our rate of return on invested capital, our net investment income, our net asset value and the market price of our common stock. Substantially allThe majority of our debt investments have, and are expected to have, variable interest rates that reset periodically based on benchmarks such as the London Interbank Offered Rate, or LIBOR, andor the federal funds rate, or prime rate, so an increase in interest rates from their historically low present levels may make it more difficult for our portfolio companies to service their obligations under the debt investments that we will hold and increase defaults even whenwhere our investment income increases. In addition, any such increase in interest rates would make it more expensive to use debt to finance our investments. Decreases in credit spreads on debt that pays a floating rate of return would have an impact on the income generation of our floating rate assets. Trading prices for debt that pays a fixed rate of return tend to fall as interest rates rise. Trading prices tend to fluctuate more for fixed rate securities that have longer maturities. Although we have no policy governing the maturities of our investments, under current market conditions we expect that we will invest in a portfolio of debt generally having maturities of up to seven years. This means that we will be subject to greater risk (other things being equal) than an entity investing solely in shorter-term securities.
In addition, because we may borrow to fund our investments, a portion of our net investment income may beis dependent upon the difference between the interest rate at which we borrow funds and the interest rate at which we invest these funds. Portions of our investment portfolio and our borrowings under our $175 million revolving Citibank credit facility, or the Citibank facility, our $25 million revolving East West Bank credit facility, or the East West Bank Facility, and our $309 million debt securitization, or the 2015 Debt Securitization, have floating rate components. As a result, a significant change in market interest rates could have a material adverse effect on our net investment income. In periods of rising interest rates, our cost of funds could increase, which would reduce our net investment income. We may hedge against such interest rate fluctuations by using standard hedging instruments such as interest rate swap agreements, futures, options and forward contracts, subject to applicable legal requirements, including all necessary registrations (or exemptions from registration) with the Commodity Futures Trading Commission. These activities may limit our ability to participate in the benefits of lower interest rates with respect to the hedged borrowings. Adverse developments resulting from changes in interest rates or hedging transactions could have a material adverse effect on our business, financial condition and results of operations.
As a result of concerns about the accuracy of the calculation of LIBOR, a number of British Bankers’ Association, or BBA, member banks entered into settlements with certain regulators and law enforcement agencies with respect to the alleged manipulation of LIBOR. Actions by the BBA, regulators or law enforcement agencies as a result of these or future events, may result in changes to the manner in which LIBOR is determined. Potential changes, or uncertainty related to such potential changes may adversely affect the market for LIBOR-based securities, including our portfolio of LIBOR-indexed, floating-rate debt securities and our borrowings. In addition, changes or reforms to the determination or supervision of LIBOR may result in a sudden or prolonged increase or decrease in reported LIBOR, which could have an adverse impact on the market for LIBOR-based securities or the value of our portfolio of LIBOR-indexed, floating-rate debt securities and our borrowings.
In July 2017, the head of the United Kingdom Financial Conduct Authority announced the desire to phase out the use of LIBOR by the end of 2021. There is currently no definitive information regarding the future utilization of LIBOR or of any particular replacement rate. As such, the potential effect of any such event on our cost of capital and net investment income cannot yet be determined.
A general increase in interest rates will likely have the effect of increasing our net investment income, which would make it easier for our investment adviserInvestment Adviser to receive incentive fees.
Given the structure of our investment advisory agreement with our investment adviser, anyAny general increase in interest rates would likely have the effect of makingincreasing the interest rate that we receive on many of our debt investments. Accordingly, a general increase in interest rates may make it easier for our investment adviserInvestment Adviser to meet the quarterly hurdle rate for payment of income incentive fees under the investment advisory agreement. In addition,New Investment Advisory Agreement and may result in view of the catch-up provision applicable to income incentive fees under the investment advisory agreement, our investment adviser could potentially receive a significant portion of thesubstantial increase in our investment income attributable to such a general increase in interest rates. If that were to occur, our increase in net earnings, if any, would likely be significantly smaller than the relative increase in our investment adviser's incomeamount of incentive fee resulting from such a general increase in interest rates.on income payable to our New Investment Adviser.
A significant portion of our investment portfolio is and will continue to be recorded at fair value as determined in good faith by our Board of Directors and, as a result, there is and will continue to be uncertainty as to the value of our portfolio investments.
Under the 1940 Act, we are required to carry our portfolio investments at market value or, if there is no readily available market value, at fair value as determined by our Board of Directors. Typically, there is not a public market for the securities of the privately held companies in which we have invested and will generally continue to invest. As a result, we value these securities quarterly at fair value as determined in good faith by our Board of Directors. The fair value of such securities may change, potentially materially, between the date of the fair value determination by our Board of Directors and the release of the financial results for the corresponding period or the next date at which fair value is determined.
Certain factors that may be considered in determining the fair value of our investments include the nature and realizable value of any collateral, the portfolio company’s earnings and its ability to make payments on its indebtedness, the markets in which the portfolio company does business, comparison to comparable publicly-traded companies, discounted cash flow and
other relevant factors. Because such valuations, and particularly valuations of private securities and private companies, are inherently uncertain, may fluctuate over short periods of time and may be based on estimates, our determinations of fair value may differ materially from the values that would have been used if a ready market for these securities existed. In addition, any investments that include OID or PIK interest may have unreliable valuations because their continuing accruals require ongoing judgments about the collectability of their deferred payments and the value of their underlying collateral. Due to these
uncertainties, our fair value determinations may cause our net asset value on a given date to materially understate or overstate the value that we may ultimately realize upon the sale of one or more of our investments. As a result, investors purchasing our common stock based on an overstated net asset value would pay a higher price than the realizable value of our investments might warrant.
Our ability to achieve our investment objective depends on our investment adviser’sInvestment Adviser’s ability to support our investment process; if our investment adviserInvestment Adviser were to lose any of its key principals,personnel, our ability to achieve our investment objective could be significantly harmed.
We depend on the investment expertise, skill and network of business contacts of the principalssenior personnel of our investment adviser. The principalsInvestment Adviser. Our Investment Adviser evaluates, negotiates, structures, executes, monitors and services our investments. Key personnel of our investment adviser evaluate, negotiate, structure, execute, monitor and service our investments.Investment Adviser could depart at any time. Our future success will depend to a significant extent on the continued service and coordination of the principals of our investment adviser. The departure of any key principals could have a material adverse effect on our ability to achieve our investment objective.
In particular our ability to achieve our investment objective depends on our investment adviser’s ability to identify, analyze, invest in, finance and monitor companies that meet our investment criteria. Our investment adviser’sInvestment Adviser’s capabilities in structuring the investment process, providing competent, attentive and efficient services to us, and facilitating access to financing on acceptable terms depend on the employment of investment professionals in adequate number and of adequate sophistication to match the corresponding flow of transactions. ToThe departure of key personnel or of a significant number of the investment professionals or partners of our Investment Adviser, could have a material adverse effect on our ability to achieve our investment objective, our investment adviserobjective. Our Investment Adviser may need to hire, train, supervise and manage new investment professionals to participate in our investment selection and monitoring process. Our investment adviserprocess and may not be able to find investment professionals in a timely manner or at all. Failure to support our investment process could have a material adverse effect on our business, financial condition and results of operations.
Our business model depends to a significant extent upon strong referral relationships, with private equity sponsors, and the inability of the principals ofpersonnel associated with our investment adviserInvestment Adviser to maintain or develop these relationships, or the failure of these relationships to generate investment opportunities, could adversely affect our business.
We expect that the principals ofpersonnel associated with our investment adviserInvestment Adviser will maintain and develop their relationships with private equity sponsors,intermediaries, banks and other sources, and we will rely to a significant extent upon these relationships to provide us with potential investment opportunities. If the principals of our investment adviserthese individuals fail to maintain their existing relationships or develop new relationships with other sponsors or sources of investment opportunities, we may not be able to grow or maintain our investment portfolio. In addition, individuals with whom the principals ofpersonnel associated with our investment adviserInvestment Adviser have relationships are not obligated to provide us with investment opportunities, and, therefore, there is no assurance that such relationships will generate investment opportunities for us. The failure of the personnel associated with our Investment Adviser to maintain existing relationships, grow new relationships, or for those relationships to generate investment opportunities could have an adverse effect on our business, financial condition and results of operations.
We may face increasing competition for investment opportunities, which could reduce returns and result in losses.
We compete for investments with other business development companies, public and investmentprivate funds (including hedge funds, mezzanine funds and collateralized loan obligations) and private equity funds)funds (to the extent they provide an alternative form of financing), as well as traditional financial services companies such as commercial and investment banks, commercial financing companies and other sources of funding.financing. Many of our competitors are substantially larger and have considerably greater financial, technical and marketing resources than we do. For example, some competitors may have a lower cost of capital and access to funding sources that are not available to us. In addition, some of our competitors may have higher risk tolerances or different risk assessments than we have. These characteristics could allow our competitors to consider a wider variety of investments, establish more relationships and offer better pricing and more flexible structuring than we are able to do. We may lose investment opportunities if we do not match our competitors’ pricing, terms and structure. If we are forced to match our competitors’ pricing, terms and structure, we may not be able to achieve acceptable returns on our investments or may bear substantial risk of capital loss. A significant part of our competitive advantage stems from the fact that the market for investments in middle market companies is underserved by traditional commercial banks and other financial sources. A significant increase in the number and/or the size of our competitors in this target market could force us to accept less attractive investment terms. Furthermore, many of our competitors are not subject to, the regulatory restrictions that the 1940 Act imposes on us as a business development company.
Because we borrow money, the potential for loss on amounts invested in us will be magnified and may increase the risk of investing in us.
Borrowings, also known as leverage, magnify the potential for loss on invested equity capital. If we continue to use leverage to partially finance our investments, through borrowings from banks and other lenders, you will experience increased risks of investing in our securities. If the value of our assets decreases, leveraging would cause net asset value to decline more sharply than it otherwise would have had we not leveraged. Similarly, any decrease in our income would cause net income to decline more sharply than it would have had we not borrowed. Such a decline could negatively affect our ability to make common stock distributions or scheduled debt payments. Leverage is generally considered a speculative investment technique and we only intend to use leverage if expected returns would exceed the cost of borrowing. We are currently targeting a debt to equity ratio of 0.90x (i.e., we aim to have one dollar of equity for each $0.90 of debt outstanding).
As of September 30, 2016, we had $107.4 million of outstanding indebtedness under our Citibank facility, $180.0 million outstanding under the 2015 Debt Securitization and $5.0 million of secured borrowings. These debt instruments require periodic payments of interest. The weighted average interest rate charged on our borrowings as of September 30, 2016 was 2.81% (exclusive of deferred financing costs). We will need to generate sufficient cash flow to make these required interest payments. In order for us to cover our annual interest payments on indebtedness, we must achieve annual returns on our total assets as of September 30, 2016 of at least 1.43%. If we are unable to meet the financial obligations under our credit facilities, the lenders under the credit facilities will have a superior to claim to our assets over our stockholders.
Illustration. The following table illustrates the effect of leverage on returns from an investment in our common stock assuming various annual returns, net of expenses. The calculations in the table below are hypothetical and actual returns may be higher or lower than those appearing below.
Assumed Return on Our Portfolio
(net of expenses)
|
| | | | | | | | | | | | | | | |
| Assumed Return on Portfolio (Net of Expenses) | - 10% | - 5% | 0% | 5% | 10% |
| Corresponding net return to common stockholder | -20.13% | -11.33% | -2.52% | 6.28% | 15.08% |
|
| |
| Assumes $573.6 million in total assets, $292.4 million in debt outstanding, $325.8 million in net assets as of September 30, 2016, and a weighted average interest rate of 2.81% as of September 30, 2016 (exclusive of deferred financing costs). Actual interest payments may be different. |
Our incentive fee may induce our investment adviserInvestment Adviser to make speculative investments.
The incentive fee payable by us to our investment adviserInvestment Adviser may create an incentive for it to make investments on our behalf that are risky or more speculative than would be the case in the absence of such compensation arrangement, which could result in higher investment losses, particularly during cyclical economic downturns. The way in which the incentive fee payable to our investment adviser is determined, whichInvestment Adviser is calculated separately in two components as a percentage of the income (subject to a hurdle rate) and as a percentage of the realized gain on invested capital, which may encourage our investment adviserInvestment Adviser to use leverage to increase the return on our investments or otherwise manipulate our income so as to recognize income in quarters where the hurdle rate is exceeded.exceeded and may result in an obligation for us to pay an incentive fee to the Investment Adviser even if we have incurred a loss for an applicable period. Under certain circumstances, the use of leverage may increase the likelihood of default, which would disfavor the holders of our common stock.
The incentive fee payable by us to our investment adviserInvestment Adviser also may create an incentive for our investment adviserInvestment Adviser to invest on our behalf in instruments that have a deferred interest feature. Under these investments, we would accrue the interest over the life of the investment but would not receive the cash income from the investment until the end of the investment’s term, if at all. Our net investment income used to calculate the income portion of our incentive fee, however, includes accrued interest. Thus, a portion of the incentive fee would be based on income that we have not yet received in cash and may never receive in cash if the portfolio company is unable to satisfy such interest payment obligation to us. While we may make incentive fee payments on income accruals that we may not collect in the future and with respect to which we do not have a formal “clawback” right against our investment adviser,Investment Adviser, the amount of accrued income written off in any period will reduce the income in the period in which such write-off was taken and thereby reduce such period’s incentive fee payment.
In addition, commencing with the fiscal year ending September 30, 2019, our investment adviser receives theInvestment Adviser will receive an incentive fee based in part, upon net capital gains realized on our investments. Unlike the portion of the incentive fee based on income, there is no performance threshold applicable to the portion of the incentive fee based on net capital gains. As a result, our investment adviserInvestment Adviser may have a tendency to invest more in investments that are likely to result in capital gains as compared to income producing securities. Such a practice could result
in our investing in more speculative securities than would otherwise be the case, which could result in higher investment losses, particularly during economic downturns.
Given the subjective nature of the investment decisions made by our investment adviserInvestment Adviser on our behalf, we will be unable to monitor these potential conflicts of interest between us and our investment adviser.Investment Adviser.
Our base management fee may induce our investment adviserInvestment Adviser to incur leverage.
The fact that our base management fee is payable based upon our gross assets, which includes borrowings for investment purposes, may encourage our investment adviserInvestment Adviser to use leverage to make additional investments. Under certain circumstances, the use of increased leverage may increase the likelihood of default, which would disfavor holders of our common stock. Given the subjective nature of the investment decisions made by our investment adviserInvestment Adviser on our behalf, we may not be able to monitor this potential conflict of interest.
The incentive fee we pay to our Investment Adviser relating to capital gains may be effectively greater than 17.5%.
Commencing with the fiscal year ending September 30, 2019, the Investment Adviser can earn an incentive fee based on our capital gains, calculated on a cumulative basis from the beginning of the fiscal year ending September 30, 2019 through the end of each fiscal year. As a result of the operation of the cumulative method of calculating such capital gains portion of the incentive fee, the cumulative aggregate capital gains fee received by our Investment Adviser could be effectively greater than 17.5%, depending on the timing and extent of subsequent net realized capital losses or net unrealized depreciation. This result would occur to the extent that, following receipt by the Investment Adviser of a capital gain incentive fee, we subsequently recognize capital depreciation and capital losses in excess of cumulative recognized capital gains. We cannot predict whether, or to what extent, this payment calculation would affect your investment in our stock.
Because we borrow money, the potential for loss on amounts invested in us will be magnified and may increase the risk of investing in us.
Borrowings, also known as leverage, magnify the potential for loss on invested equity capital. If we continue to use leverage to partially finance our investments, through borrowings from banks and other lenders, you will experience increased risks of investing in our common stock. We borrow under our credit facility, have issued notes in our debt securitization and may issue other debt securities or enter into other types of borrowing arrangements in the future. If the value of our assets decreases, leveraging would cause net asset value to decline more sharply than it otherwise would have had we not leveraged. Similarly, any decrease in our income would cause net income to decline more sharply than it would have had we not borrowed. Such a decline could negatively affect our ability to make common stock distributions or scheduled debt payments. Leverage is generally considered a speculative investment technique and we only intend to use leverage if expected returns will exceed the cost of borrowing.
As of September 30, 2017, we had $76.5 million of outstanding indebtedness under our revolving credit facility with the lenders referred to therein, Citibank, N.A., as administrative agent, and Wells Fargo Bank, N.A., as collateral agent and custodian, or the Citibank facility; $180.0 million of debt outstanding under our $309.0 million debt securitization, or the 2015 Debt Securitization; and $6.5 million outstanding under our $25 million senior secured revolving credit facility with the lenders referenced therein, U.S. Bank National Association, as Custodian, and East West Bank as Secured Lender, or the East West Bank Facility. These debt instruments require periodic payments of interest. The weighted average interest rate charged on our borrowings as of September 30, 2017 was 3.46% (exclusive of deferred financing costs). We will need to generate sufficient cash flow to make these required interest payments. In order for us to cover our annual interest payments on indebtedness, we must achieve annual returns on our September 30, 2017 total assets of at least 1.49%. If we are unable to meet the financial obligations under our credit facilities, the lenders under the credit facilities will have a superior claim to our assets over our stockholders.
As a business development company, under the 1940 Act we generally are not permitted to incur indebtedness unless immediately after such borrowing we have an asset coverage for total borrowings of at least 200% (i.e., the amount of debt may not exceed 50% of the value of our assets). If legislation to modify the 1940 Act and increase the amount of debt that business development companies may incur by modifying the asset coverage percentage were enacted into law, we would able to incur additional indebtedness.
Illustration. The following table illustrates the effect of leverage on returns from an investment in our common stock assuming various annual returns, net of expenses. The calculations in the table below are hypothetical and actual returns may be higher or lower than those appearing below.
|
| | | | | | | | | | | | | | | |
| Assumed Return on Portfolio (Net of Expenses) | - 10% | - 5% | 0% | 5% | 10% |
| Corresponding net return to common stockholder | -23.82% | -13.46% | -3.10% | 7.27% | 17.63% |
For purposes of this table, we have assumed $608.7 million in total assets, $263.0 million in debt outstanding, $293.6 million in net assets as of September 30, 2017, and a weighted average interest rate of 3.46% as of September 30, 2017 (exclusive of deferred financing costs). Actual interest payments may be different.
Substantially all of our assets are subject to security interests under secured credit facilities or the 2015 Debt Securitization and if we default on our obligations under the facilities or the 2015 Debt Securitization, we may suffer adverse consequences, including foreclosure on our assets.
As of September 30, 2016,2017, substantially all of our assets were pledged as collateral under our credit facilities or the 2015 Debt Securitization. If we default on our obligations under these facilities or the 2015 Debt Securitization, the lenders may have the right to foreclose upon and sell, or otherwise transfer, the collateral subject to their security interests or their superior claim. In such event, we may be forced to sell our investments to raise funds to repay our outstanding borrowings in order to avoid foreclosure and these forced sales may be at times and at prices we would not consider advantageous. Moreover, such deleveraging of our company could significantly impair our ability to effectively operate our business in the manner in which we have historically operated. As a result, we could be forced to curtail or cease new investment activities and lower or eliminate the distributions that we have historically paid to our stockholders.
In addition, if the lenders exercise their right to sell the assets pledged under our credit facilities or the 2015 Debt Securitization, such sales may be completed at distressed sale prices, thereby diminishing or potentially eliminating the amount of cash available to us after repayment of the amounts outstanding under the credit facilities or 2015 Debt Securitization.
Pending legislation may allow us to incur additional leverage.
As a BDC, under the 1940 Act we generally are not permitted to incur indebtedness unless immediately after such borrowing we have an asset coverage for total borrowings of at least 200% (i.e., the amount of debt may not exceed 50% of the value of our assets). Legislation introduced in the U.S. House of Representatives, would modify this section of the 1940 Act and increase the amount of debt that BDCs may incur by modifying the asset coverage percentage from 200% to 150%. As a result, we may be able to incur additional indebtedness in the future and therefore your risk of an investment in us may increase.
Because we intend to distribute at least 90% of our taxable income each taxable year to our stockholders in connection with our election to be treated as a RIC, we will continue to need additional capital to finance our growth. If additional funds are unavailable or not available on favorable terms, our ability to grow will be impaired.
In order to qualify for the tax benefits available to RICs and to minimize corporate-level U.S. federal income taxes, we intend to distribute to our stockholders at least 90% of our taxable income each taxable year, except that we may retain certain net capital gains for investment, and treat such amounts as deemed distributions to our stockholders. If we elect to treat any amounts as deemed distributions, we would be subject to income taxes at the corporate rate applicable to net capital gains on such deemed distributions on behalf of our stockholders. As a result of these requirements, we will likely need to raise capital from other sources to grow our business. As a business development company, we generally are required to meet a coverage ratio of total assets, less liabilities and indebtedness not represented by senior securities, to total senior securities, which includes all of our borrowings and any outstanding preferred stock, of at least 200%. These requirements limit the amount that we may borrow. Because we will continue to need capital to grow our investment portfolio, these limitations may prevent us from incurring debt and require us to raise additional equity at a time when it may be disadvantageous to do so.
While we expect to be able to issue additional equity securities, we cannot assure you that equity financing will be available to us on favorable terms, or at all. Also, as a business development company, we generally are not permitted to issue equity securities priced below net asset value without stockholder approval. If additional funds are not available to us, we could be forced to curtail or cease new investment activities, and our net asset value and share price could decline.
Our ability to enter into transactions with our affiliates is restricted.
We are prohibited under the 1940 Act from participating in certain transactions with certain of our affiliates without the prior approval of the members of our independent directors and, in some cases, the SEC. Any person that owns, directly or indirectly, 5% or more of our outstanding voting securities is our affiliate for purposes of the 1940 Act and we are generally prohibited from buying or selling any securities (other than our securities) from or to such affiliate, absent the prior approval of our independent directors. The 1940 Act also prohibits certain “joint” transactions with certain of our affiliates, which could include investments in the same portfolio company (whether at the same or different times), without prior approval of our independent directors and, in some cases, the SEC. If a person acquires more than 25% of our voting securities, we will be prohibited from buying or selling any security (other than any security of which we are the issuer) from or to such person or certain of that person’s affiliates, or entering into prohibited joint transactions with such person, absent the prior approval of the SEC. Similar restrictions limit our ability to transact business with our officers or directors or their affiliates. As a result of these restrictions, we may be prohibited from buying or selling any security (other than any security of which we are the issuer) from or to any portfolio company of a private equity fund managed by our investment adviserInvestment Adviser without the prior approval of the SEC, which may limit the scope of investment opportunities that would otherwise be available to us.
We haveOur Investment Adviser has received exemptive relief from the SEC to allow certain managed funds and accounts to co-invest, subject to the conditions of the relief granted by the SEC, with investment funds managed by Fifth Street Management where doing so is consistent with ourthe applicable registered fund’s or business development company’s investment strategy as well as applicable law (including the terms and conditions of the exemptive order issued by the SEC). Under the terms of thethis exemptive relief permitting us to co-invest with other funds managed by Fifth Street Management,our Investment Adviser and its affiliates, a “required majority” (as defined in Section 57(o) of the 1940 Act) of our independent directors must make certain conclusions in connection with a co-investment transaction, including that (1) the terms of the proposed transaction, including the consideration to be paid, are reasonable and fair to us and our stockholders and do not involve overreaching of us or our stockholders on the part of any person concerned, and (2) the transaction is consistent with the interests of our stockholders and is consistent with our investment objectives and strategies.strategies and (3) the investment by other funds advised by our Investment Adviser or its affiliates would not disadvantage us and our participation would not be on a basis different from, or less advantageous than, that of any other fund advised by our Investment Adviser or its affiliates participating in the transaction. We intend to co-invest, subject to the conditions included in the exemptive order we received from the SEC, with certain of our affiliates. We may also invest alongside funds managed by our Investment Adviser and its affiliates in certain circumstances where doing so is consistent with applicable law and SEC staff interpretations. For example, we may invest alongside such accounts consistent with guidance promulgated by the staff of the SEC permitting us and such other accounts to purchase interests in a single class of privately placed securities so long as certain conditions are met, including that our Investment Adviser, acting on our behalf and on behalf of other clients, negotiates no term other than price.
There are significant potential conflicts of interest including our investment adviser’s management of FSC and certain private investment funds, whichthat could adversely impact our investment returns.
Certain of ourOur executive officers and directors, and certain members of the investment committee of our investment adviser,Investment Adviser, serve or may serve as officers, directors or principals of other entities and affiliates of our investment adviser, FSAM or other investment funds managed by our affiliates that may operate in the same or a related line of business as we do. Accordingly, they may have obligations to investors in those entities, the fulfillmentdo or of which might not be ininvestment funds managed by our or our stockholders' best interests or may require them to devote time to services for other entities, which could interfere with the time available to provide services to us.affiliates. For example, Fifth Street ManagementOaktree presently serves as the investment adviser to FSC,OCSL, a publicly-traded BDCbusiness development company with total assetsa portfolio of approximately $2.4$1.5 billion at fair value as of September 30, 2016, that invests2017. OCSL has historically invested in the debt and equity of small and mid-sized companies, primarily in connection with investments by private equity sponsors, including in middle market leveragedmiddle-market companies similar to those we target for investment. FSC generally targets small and mid-sized companies with annual EBITDA between $10 million and $120 million and generally targets investment sizes ranging from $10 million to $100 million. In addition, though not the primary focus of its investment portfolio, FSC'sOCSL’s investments also include floating rate senior loans. In contrast, we target investments ranging from between $3 million and $30 million, and generally target private leveraged middle market companies with approximately $20 million to $120 million of EBITDA. Therefore, there may be certain investment opportunities that satisfy the investment criteria for both FSCOCSL and us. FSCOCSL operates as a distinct and separate public company and any investment in our common stock will not be an investment in FSC.OCSL. In addition, certainall of our executive officers and threefour of our independent directors serve in substantially similar capacities for FSC. Fifth Street ManagementOCSL. Oaktree and its affiliates also manage and sub-advise private investment funds and accounts, and may manage other such funds and accounts in the future, thatwhich have investment mandates that are similar, in whole and in part, with ours. Accordingly, they may have obligations to investors in those entities, the fulfillment of which might not be in the best interests of us or our stockholders. For example, the principalspersonnel of our investment adviserInvestment Adviser may face conflicts of interest in the allocation of investment opportunities to us and such other funds. The fact that our investment advisory fees are lower than those of certain other funds such as FSC, could amplify this conflict of interest. Our investment adviser’s track record and achievements are not necessarily indicative of the future results it will achieve. Accordingly, we can offer no assurance that we will replicate the historical performance of other investment companies with which our investment professionals have been affiliated, such as FSC, and we caution that our investment returns could be substantially lower than the returns achieved by such other companies.accounts.
Fifth Street ManagementOaktree has adopted, and our Board of Directors has approved, an investment allocation policyguidelines that governsgovern the allocation of investment opportunities among the investment funds and accounts managed or sub-advised by Fifth Street ManagementOaktree and its affiliates. To the extent an investment opportunity is appropriate for us or FSFROCSL or any other investment fund or account managed or sub-advised by Fifth Street ManagementOaktree or its affiliates, and co-investment is not possible, Fifth Street ManagementOaktree will adhere to its investment allocation policyguidelines in order to determine a fair and equitable allocation.
We may invest alongside funds and accounts managed or sub-advised by our Investment Adviser and its affiliates in certain circumstances where doing so is consistent with applicable law and SEC staff interpretations. For example, we may invest alongside such accounts consistent with guidance promulgated by the staff of the SEC permitting us and such other accounts to which entitypurchase interests in a single class of privately placed securities so long as certain conditions are met, including that our Investment Adviser, acting on our behalf and on behalf of other clients, negotiates no term other than price or terms related to allocateprice.
In addition, on October 18, 2017, our Investment Adviser received exemptive relief from the opportunity. UnderSEC to allow certain managed funds and accounts, each of whose investment adviser is Oaktree or an investment adviser controlling, controlled by or under common control with Oaktree, to participate in negotiated co-investment transactions where doing so is consistent with the applicable registered fund’s or business development company’s investment allocation policy, a
portionobjective and strategies as well as regulatory requirements and other pertinent factors, and pursuant to the conditions of eachthe exemptive relief. Each potential co-investment opportunity that falls under the terms of the exemptive relief and is appropriate for us and any affiliated fund or account, and satisfies the then-current board-established criteria, will be offered to us and such other eligible accounts as determined by Fifth Street Managementfunds and generally based on asset class, fund size and liquidity, among other factors.accounts. If there is a sufficient amount of securities to satisfy all participants, the securities will be allocated among the participants in accordance with their proposed order size and if there is an insufficient amount of securities to satisfy all participants, the securities will be allocated pro rata based on each participating party’s capital available forthe investment inproposed by the asset class being allocated,applicable investment adviser to such participant, up to the amount proposed to be invested by each. If we are unable to (or where we do not) rely oneach, which is reviewed and approved by an independent committee of legal, compliance and accounting professionals at our exemptive relief for a particular opportunity, such opportunity will be allocated first to the entity whose investment strategy is the most consistent with the opportunity being allocated, and second, if the terms of the opportunity are consistent with more than one entity’s investment strategy, on an alternating basis.Investment Adviser. Although our investment professionalsOaktree will endeavor to allocate investment opportunities in a fair and equitable manner, we and our common stockholders could be adversely affected to the extent investment opportunities are allocated among us and other investment vehicles managed or sponsored by, or affiliated with, our executive officers, directors and members of our investment adviser. In accordance with Fifth Street Management’s investment allocation policy, weInvestment Adviser. We might not participate in each individual opportunity, but will, on an overall basis, be entitled to participate equitably with other entities managed by Fifth Street ManagementOaktree and its affiliates. Fifth Street ManagementOaktree seeks to treat all clients fairly and equitably such that none receive preferential treatment vis-à-vis the others over time, in a manner consistent with its fiduciary duty to each of them; however, in some instances, especially in instances of limited liquidity, the factors may not result in pro rata allocations or may result in situations where certain funds or accounts receive allocations where others do not. See “Certain Relationships and Related Party Transactions.”
Pursuant to the administration agreement with FSC CT, whichNew Investment Advisory Agreement, our Investment Adviser’s liability is limited and we are required to indemnify our Investment Adviser against certain liabilities. This may lead our Investment Adviser to act in a wholly-owned subsidiaryriskier manner in performing its duties and obligations under the New Investment Advisory Agreement than it would if it were acting for its own account, and creates a potential conflict of our investment adviser, FSC CTinterest.
Pursuant to the New Administration Agreement, the Oaktree Administrator furnishes us with the facilities, including our principal executive office, and administrative services necessary to conduct our day-to-day operations. We pay FSC CTthe Oaktree Administrator its allocable portion of overhead and other expenses incurred by FSC CTthe Oaktree Administrator in performing its obligations under the administration agreement,New Administration Agreement, including, without limitation, a portion of the rent at market rates and the compensation of our chief financial officer and chief compliance officer andChief Financial Officer, Chief Compliance Officer, their respective staffs.staffs and other non-investment
professionals at Oaktree that perform duties for us. This arrangement creates conflicts of interest that our Board of Directors must monitor.
The incentive fee we pay to our investment adviser relating to capital gains may be effectively greater than 20%.
As a result of the operation of the cumulative method of calculating the capital gains portion of the incentive fee we pay to our investment adviser, the cumulative aggregate capital gains fee received by our investment adviser could be effectively greater than 20%, depending on the timing and extent of subsequent net realized capital losses or net unrealized depreciation. For additional information on this calculation, see the disclosure in footnote 2 to Example 2 under the caption “— Investment Advisory Agreement — Management Fee — Incentive Fee.” We cannot predict whether, or to what extent, this payment calculation would affect your investment in our stock.
A failure on our part to maintain our qualification as a business development company would significantly reduce our operating flexibility.
If we fail to continuously qualify as a business development company, we might be subject to regulation as a registered closed-end investment company under the 1940 Act, which would significantly decrease our operating flexibility. In addition, failure to comply with the requirements imposed on business development companies by the 1940 Act could cause the SEC to bring an enforcement action against us. For additional information on the qualification requirements of a business development company, seeSee “ — Business-Business Development Company Regulations.”
Regulations governing our operation as a business development company and RIC affect our ability to raise, and the way in which we raise, additional capital or borrow for investment purposes, which may have a negative effect on our growth.
In order to qualify for the tax benefits available to RICs and to minimize corporate-level U.S. federal income taxes, we intend to distribute to our stockholders at least 90% of our taxable income each taxable year, except that we may retain certain net capital gains for investment, and treat such amounts as deemed distributions to our stockholders. If we elect to treat any amounts as deemed distributions, we would be subject to income taxes at the corporate rate on such deemed distributions on behalf of our stockholders.
As a business development company, we generally are required to meet amay issue “senior securities,” including borrowing money from banks or other financial institutions only in amounts such that our asset coverage, ratio of total assets, less liabilities and indebtedness not represented by senior securities, to total senior securities, which includes all of our borrowings and any outstanding preferred stock, ofas defined in the 1940 Act, equals at least 200%. after such incurrence or issuance. These requirements limit the amount that we may borrow. borrow, may unfavorably limit our investment opportunities and may reduce our ability in comparison to other companies to profit from favorable spreads between the rates at which we can borrow and the rates at which we can lend. If the value of our assets declines, we may be unable to satisfy the asset coverage test, which could prohibit us from paying distributions and could prevent us from being subject to tax as a RIC. If we cannot satisfy the asset coverage test, we may be required to sell a portion of our investments and, depending on the nature of our debt financing, repay a portion of our indebtedness at a time when such sales may be disadvantageous.
Because we will continue to need capital to grow our investment portfolio, these limitations may prevent us from incurring debt and require us to raise additional equity at a time when it may be disadvantageous to do so. As a result of these requirements we need to periodically access the capital markets to raise cash to fund new investments.investments at a more frequent pace than our privately owned competitors. We generally are not able to issue or sell our common stock at a price below net asset value per share, which may be a disadvantage as compared with other public companies or private investment funds. If our common stock trades at a discount to net asset value, this restriction could adversely affect our ability to raise capital. We may, however, sell our common stock, or warrants, options or rights to acquire our common stock, at a price below the current net asset value of the common stock if our Board of Directors and independent directors determine that such sale is in our best interests and the best interests of our stockholders, and our stockholders as well as those stockholders that are not affiliated with us approve such sale in accordance with the requirements of the 1940 Act. In any such case, the price at which our securities are to be issued and sold may not be less than a price that, in the determination of our Board of Directors, closely approximates the market value of such securities (less any underwriting commission or discount).
We also may make rights offerings to our stockholders at prices less than net asset value, subject to applicable requirements of the 1940 Act. If we raise additional funds by issuing more shares of our common stock or issuing senior securities convertible into, or exchangeable for, our common stock, the percentage ownership of our stockholders may decline at that time and such stockholders may experience dilution. Moreover, we can offer no assurance that we will be able to issue and sell additional equity securities in the future, on terms favorable to us or at all.
In addition, we may issue “senior securities,” including borrowing money from banks or other financial institutions only in amounts such that our asset coverage, as defined in the 1940 Act, equals at least 200% after such incurrence or issuance. Our ability to issue different types of securities is also limited. Compliance with these requirements may unfavorably limit our investment opportunities and may reduce our ability in comparison to other companies to profit from favorable spreads between the rates at which we can borrow and the rates at which we can lend. As a business development company, therefore, we may need to issue equity more frequently than our privately owned competitors, which may lead to greater stockholder dilution.
If the value of our assets declines, we may be unable to satisfy the asset coverage test, which could prohibit us from paying distributions and could prevent us from being subject to tax as a RIC. If we cannot satisfy the asset coverage test, we may be required to sell a portion of our investments and, depending on the nature of our debt financing, repay a portion of our indebtedness at a time when such sales may be disadvantageous.
In addition, we may in the future seek to securitize our portfolio securities to generate cash for funding new investments. To securitize loans, we would likely create a wholly-owned subsidiary and contribute a pool of loans to the subsidiary. We would then sell interests in the subsidiary on a non-recourse basis to purchasers and we would retain all or a portion of the equity in the subsidiary. An inability to successfully securitize our loan portfolio could limit our ability to grow our business or fully execute our business strategy and may decrease our earnings, if any. The securitization market is subject to changing market conditions and we may not be able to access this market when we would otherwise deem appropriate. Moreover, the successful securitization of our portfolio might expose us to losses as the residual investments in which we do not sell interests will tend to be those that are riskier and more apt to generate losses. The 1940 Act also may impose restrictions on the structure of any securitization.
We may experience fluctuations in our quarterly results.
We could experience fluctuations in our quarterly results due to a number of factors, including our ability or inability to make investments in companies that meet our investment criteria, the interest rate payable on the debt securities we acquire, changes in accrual status of our portfolio company investments, distributions, the level of our expenses, variations in and the timing of the recognition of realized and unrealized gains or losses, the degree to which we encounter competition in our market and general economic conditions. As a result of these factors, results for any period should not be relied upon as being indicative of performance in future periods.
Our Board of Directors may change our investment objective, operating policies and strategies without prior notice or stockholder approval, the effects of which may be adverse.
Our Board of Directors has the authority to modify or waive our current investment objective, operating policies and strategies without prior notice and without stockholder approval. We cannot predict the effect any changes to our current investment objective, operating policies and strategies would have on our business, net asset value, operating results and value of our stock. However, the effects might be adverse, which could negatively impact our ability to pay you distributions and cause you to lose part or all of your investment.
We will be subject to corporate-level U.S. federal income tax if we are unable to maintain our qualification as a RIC under Subchapter M of the Code or do not satisfy the Annual Distribution Requirement.
To maintain our tax status as a RIC and be relieved of U.S. federal taxes on income and gains distributed to our stockholders, we must meet the following annual distribution, income source and asset diversification requirements:
The Annual Distribution Requirement will be satisfied if we distribute dividends to our stockholders each taxable year of an amount generally at least equal to 90% of the sum of our net taxable income plus realized net short-term capital gains in excess of realized net long term capital losses, if any. Because we use debt financing, we are and may, in the future, be subject to certain financial covenants under our debt arrangements that could, under certain circumstances, restrict us from making distributions necessary to satisfy the Annual Distribution Requirement. If we are unable to obtain cash from other sources, we could fail to qualify for RIC tax treatment and thus could become subject to corporate-level income tax.
The 90% Income Test will be satisfied if we earn at least 90% of our gross income for each taxable year from dividends, interest, gains from the sale of stock or securities or similar sources.
The Diversification Tests will be satisfied if, at the end of each quarter of our taxable year, at least 50% of the value of our assets must consist of cash, cash equivalents, U.S. government securities, securities of other RICs, and other acceptable securities; and no more than 25% of the value of our assets can be invested in the securities, other than U.S. government securities or securities of other RICs, of one issuer, of two or more issuers that are controlled, as determined under applicable Code rules, by us and that are engaged in the same or similar or related trades or businesses or of certain “qualified publicly traded partnerships.” Failure to meet these requirements may result in our having to dispose of certain investments quickly in order to prevent the loss of RIC status. Because most of our investments will be in private companies, and therefore will be relatively illiquid, any such dispositions could be made at disadvantageous prices and could cause us to incur substantial losses.
If we fail to be subject to tax as a RIC status and are subject to entity-level U.S. federal corporate income tax, the resulting corporate taxes could substantially reduce our net assets, the amount of income available for distribution and the amount of our distributions.
We may not be able to pay you distributions, our distributions may not grow over time and a portion of our distributions may be a return of capital.
We intend to pay distributions to our stockholders out of assets legally available for distribution. We cannot assure you that we will achieve investment results that will allow us to sustain a specified level of cash distributions or periodic increases in cash distributions. Our ability to pay distributions might be adversely affected by, among other things, the impact of one or more of the risk factors described herein. In addition, the inability to satisfy the asset coverage test applicable to us as a business development company can limit our ability to pay distributions. All distributions will be paid at the discretion of our Board of Directors and will depend on our earnings, our financial condition, maintenance of our ability to be subject to tax as a RIC, compliance with applicable business development company regulations and such other factors as our Board of Directors may deem relevant from time to time. We cannot assure you that we will continue to pay distributions to our stockholders.stockholders at current levels, or at all.
When we make distributions, our distributions generally will be treated as dividends for U.S. federal income tax purposes to the extent such distributions are paid out of our current or accumulated earnings and profits. Distributions in excess of current and accumulated earnings and profits will be treated as a non-taxable return of capital to the extent of a stockholder’sstockholder's basis in our stock and, assuming that a stockholder holds our stock as a capital asset, thereafter as a capital gain. A return of capital generally is a return of a stockholder’s investment rather than a return of earnings or gains derived from our investment activities. Moreover, we may pay all or a substantial portion of our distributions from the proceeds of the sale of shares of our common stock or from borrowings in anticipation of future cash flow, which could constitute a return of stockholders’ capital and will lower such stockholders’ tax basis in our shares, which may result in increased tax liability to stockholders when they sell or otherwise dispose of such shares. The tax liability incurred by such stockholders upon the sale or other disposition of shares of our common stock may increase even if such shares are sold at a loss.
We will be subject to corporate-level U.S. federal income tax if we are unable to maintain our qualification as a RIC under Subchapter M of the Code or do not satisfy the Annual Distribution Requirement.
To maintain our tax status as a RIC and be relieved of U.S. federal taxes on income and gains distributed to our stockholders, we must meet the following annual distribution, income source and asset diversification requirements:
The Annual Distribution Requirement will be satisfied if we distribute dividends to our stockholders each taxable year of an amount generally at least equal to 90% of the sum of our net taxable income plus realized net short-term capital gains in excess of realized net long-term capital losses, if any. Because we use debt financing, we are and may, in the future, be subject to certain financial covenants under our debt arrangements that could, under certain circumstances, restrict us from making distributions necessary to satisfy the Annual Distribution Requirement. If we are unable to obtain cash from other sources, we could fail to qualify for RIC tax treatment and thus could become subject to corporate-level income tax.
The 90% Income Test will be satisfied if we earn at least 90% of our gross income for each taxable year from dividends, interest, gains from the sale of stock or securities or similar sources.
The Diversification Tests will be satisfied if, at the end of each quarter of our taxable year, at least 50% of the value of our assets consist of cash, cash equivalents, U.S. government securities, securities of other RICs, and other acceptable securities; and no more than 25% of the value of our assets can be invested in the securities, other than U.S. government securities or securities of other RICs, of one issuer, of two or more issuers that are controlled, as determined under applicable Code rules, by us and that are engaged in the same or similar or related trades or businesses or of certain “qualified publicly traded partnerships.” Failure to meet these requirements may result in our having to dispose of certain investments quickly in order to prevent the loss of RIC status. Because most of our investments will be in
private companies, and therefore will be relatively illiquid, any such dispositions could be made at disadvantageous prices and could cause us to incur substantial losses.
If we fail to be subject to tax as a RIC and are subject to entity-level U.S. federal corporate income tax, the resulting corporate taxes could substantially reduce our net assets, the amount of income available for distribution and the amount of our distributions.
We may have difficulty paying our required distributions if we are required to recognize income for U.S. federal income tax purposes before or without receiving cash representing such income.
For U.S. federal income tax purposes, we generally are required to include in income certain amounts that we have not yet received in cash, such as OID or certain income accruals on a contingent payment debt instrument,instruments, which may occur if we receive warrants in connection with the origination of a loan or possibly in other circumstances. Such OID is generally required to be included in income before we receive any corresponding cash payments. In addition, our loans typically contain PIK interest provisions. Any PIK interest, computed at the contractual rate specified in each loan agreement, is generally required to be added to the principal balance of the loan and recorded as interest income. We also may be required to include in income certain other amounts that we do not receive, and may never receive, in cash. To avoid the imposition of corporate-level tax on us, this non-cash source of income may need to be distributed to our stockholders in cash or, in the event that we determine to do so, in shares of our common stock, even though we may have not yet collected and may never collect the cash relating to such income.
Since, in certain cases, we may recognize income before or without receiving cash representing such income, we may have difficulty meeting the Annual Distribution Requirement necessary to be relieved of entity-level U.S. federal taxes on income and gains distributed to our stockholders. Accordingly, we may have to sell or otherwise dispose of some of our investments at times and/or at prices we would not consider advantageous, raise additional debt or equity capital or forgo new investment opportunities for this purpose. If we are not able to obtain cash from other sources, we may fail to satisfy the Annual Distribution Requirement and thus become subject to corporate-level U.S. federal income tax.
We may be exposed to higher risks with respect to our investments that include OID or PIK interest.
Our investments may include OID and contractual PIK interest, which represents contractual interest added to a loan balance and due at the end of such loan’s term. To the extent OID or PIK interest constitute a portion of our income, we are exposed to typical risks associated with such income being required to be included in taxable and accounting income prior to receipt of cash, including the following:
•OID and PIK instruments may have higher yields, which reflect the payment deferral and credit risk associated with these instruments;
•OID and PIK accruals may create uncertainty about the source of our distributions to stockholders;
•OID and PIK instruments may have unreliable valuations because their continuing accruals require continuing judgments about the collectability of the deferred payments and the value of the collateral; and
•OID and PIK instruments may represent a higher credit risk than coupon loans.
We may in the future choose to pay distributions partly in our own stock, in which case you may be subject to tax in excess of the cash you receive.
We may distribute taxable distributions that are payable in part in our stock. In accordance with certain applicable Treasury regulations and other related administrative pronouncements issued by the Internal Revenue Service, or the IRS, a RIC may be eligible to treat a distribution of its own stock as fulfilling its RIC distribution requirements if each stockholder is permitted to elect to receive his or her entire distribution in either cash or stock of the RIC, subject to the satisfaction of certain guidelines. If too many stockholders elect to receive cash (which generally may not be less than 20% of the value of the overall distribution), each stockholder electing to receive cash must receive a pro rata amount of cash (with the balance of the distribution paid in stock). If these and certain other requirements are met, for U.S. federal income tax purposes, the amount of the distribution paid in stock generally will be equal to the amount of cash that could have been received instead of stock. Taxable stockholders receiving such distributions will be required to include the full amount of the distribution as ordinary income (or as long-term capital gain to the extent such distribution is properly reported as a capital gain dividend) to the extent of their share of our current and accumulated earnings and profits for U.S. federal income tax purposes. As a result, a U.S. stockholder may be subject to tax with respect to such distributions in excess of any cash received. If a U.S. stockholder sells the stock it receives as a distribution in order to pay this tax, the sales proceeds may be less than the amount included in income with respect to the distribution, depending on the market price of our stock at the time of the sale. Furthermore, with respect to non-U.S. stockholders, we may be required to withhold U.S. tax with respect to such distribution, including in respect of all or a portion of such distribution that is payable in stock. In addition, if a significant number of our stockholders determine to sell shares of our stock in order to pay taxes owed on a distribution, such sales may put downward pressure on the trading price of our stock.
We may enter into reverse repurchase agreements, which are another form of leverage.
We may enter into reverse repurchase agreements as part of our management of our temporary investment portfolio. Our entry into any such reverse repurchase agreements would be subject to the 1940 Act limitations on leverage. In connection with entry into a reverse repurchase agreement, we would effectively pledge our assets as collateral to secure a short-term loan. Generally, the other party to the agreement would make a loan to us in an amount equal to a percentage of the fair value of the collateral we have pledged. At the maturity of the reverse repurchase agreement, we will be required to repay the loan and then receive back our investment adviser could becollateral. While used as collateral, the targetassets continue to pay principal and interest which are for the benefit of litigation.us.
Our use of reverse repurchase agreements, if any, involves many of the same risks involved in our use of leverage. For example, the market value of the securities acquired in the reverse repurchase agreement may decline below the price of the securities that we have sold but we would remain obligated to purchase those securities, meaning that we bear the risk of loss that the proceeds at settlement are less than the fair value of the securities pledged. In addition, the market value of the securities retained by us may decline. If a buyer of securities under a reverse repurchase agreement were to file for bankruptcy or experience insolvency, we would be adversely affected. In addition, due to the interest costs associated with reverse repurchase agreements, our net asset value would decline, and, in some cases, we may be worse off than if we had not used such agreements.
We orare currently subject to an SEC investigation that could adversely affect our investment adviserfinancial condition, business and results of operations.
We are the subject of an SEC investigation principally related to the activities of our Former Adviser, and we may possibly be the subject to a variety of securities class action litigationadditional claims and lawsuits as well as additional SEC examinations or other similar claims or lawsuits.investigations. See “Business - Legal Proceedings.” The outcome of any such proceedings couldthe SEC investigation may materially adversely affect our business, financial condition, and/or operating results and couldmay continue without resolution for long periods of time. Any litigation or other similar claims couldLitigation and responses to the SEC’s inquiries might consume substantial amounts of our management’s time and attention, and that time and attention and the devotion of associatedthese resources could,may, at times, be disproportionate to the amounts at stake. Litigation and other claims areThe SEC investigation is subject to inherent uncertainties and amanagement’s view of these matters may change in the future. A material adverse impact on our financial statements also could occur for the period in which the effect of an unfavorable final outcome in litigation or other similar claims becomes probable and reasonably estimable, particularly where suchthe claims with respect to a particular period exceed both the amount of our insurance coverage relating to claims made with respect to the same period and the amount of any insurance coverage we have.indemnification recoverable from Fifth Street Holdings L.P. In addition, we couldmay incur expenses associated with defending ourselves against this litigation and other similarfuture claims and responding to the SEC’s inquiries, and these expenses couldmay be material to our earnings in future periods.periods that might exceed the amount of any indemnification recoverable from Fifth Street Holdings L.P. Under the investment advisory agreement,New Investment Advisory Agreement, we are required to indemnify our investment adviserInvestment Adviser for its expenses incurred in any litigation arising from the rendering of our investment adviser’sInvestment Adviser’s services under the investment advisory agreement or otherwise as our investment adviserInvestment Adviser absent willful misfeasance, bad faith or gross negligence in the performance of its duties or by reason of the reckless disregard of its duties and obligations.
We could becomeobligations, and our Former Adviser may seek similar indemnification under the subject of a proxy contest.
In connection with our 2016 annual meeting of stockholders, Ironsides Partners LLC, Ironsides Partners Special Situations Master Fund II L.P. and Ironsides P Fund L.P., together with their affiliates, set forth proposals to elect two nominees to our Board of Directors and to terminate our investment advisory agreement. Any future proxy contest could be disruptive, costly and time consuming in addition to diverting the attention of our management team and the employees of our investment adviser from the management of our business and operations. In addition, if any activist investor were successful in electing additional nominees to the Board of Directors, it may adversely affect our ability to effectively implement our business strategy.Former Investment Advisory Agreement.
We may be unable to invest a significant portion of the net proceeds from an offering of our securities on acceptable terms within an attractive timeframe.
Delays in investing the net proceeds raised in an offering of our securities may cause our performance to be worse than that of other fully invested business development companies or other lenders or investors pursuing comparable investment strategies. We cannot assure you that we will be able to identify any investments that meet our investment objective or that any investment that we make will produce a positive return. We may be unable to invest the net proceeds of any offering on acceptable terms within the time period that we anticipate or at all, which could harm our financial condition and operating results.
We anticipate that, depending on market conditions, it may take us a substantial period of time to invest substantially all of the net proceeds of any offering in securities meeting our investment objective. During this period, we will invest the net proceeds of an offering primarily in cash, cash equivalents, U.S. government securities, repurchase agreements and high-quality debt instruments maturing in one year or less from the time of investment, which may produce returns that are significantly lower than the returns which we expect to achieve when our portfolio is fully invested in securities meeting our investment objective. As a result, any distributions that we pay during this period may be substantially lower than the distributions that we may be able to pay when our portfolio is fully invested in securities meeting our investment objective. In addition, until such time as the net proceeds of an offering are invested in securities meeting our investment objective, the market price for our common stock may decline. Thus, the return on your investment may be lower than when, if ever, our portfolio is fully invested in securities meeting our investment objective.
Increased regulatory oversight and changes in the method for determining LIBOR may affect the value of the financial obligations to be held or issued by us that are linked to LIBOR and how such changes could affect our results of operations or financial condition.
As a result of concerns about the accuracy of the calculation of LIBOR, a number of British Bankers’ Association, or BBA, member banks entered into settlements with certain regulators and law enforcement agencies with respect to the alleged manipulation of LIBOR, and there are ongoing investigations by regulators and governmental authorities in various jurisdictions. Following a review of LIBOR conducted at the request of the U.K. government, on September 28, 2012, recommendations for reforming the setting and governing of LIBOR were released, which are referred to as the Wheatley Review. The Wheatley Review made a number of recommendations for changes with respect to LIBOR, including the introduction of S-5 statutory regulation of LIBOR, the transfer of responsibility for LIBOR from the BBA to an independent administrator, changes to the method of the compilation of lending rates and new regulatory oversight and enforcement mechanisms for rate-setting and a reduction in the number of currencies and tenors for which LIBOR is published. Based on the Wheatley Review and on a subsequent public and governmental consultation process, on March 25, 2013, the U.K. Financial Services Authority published final rules for the U.K. Financial Conduct Authority’s regulation and supervision of LIBOR, which are referred to as the FCA Rules.
In particular, the FCA Rules include requirements that (1) an independent LIBOR administrator monitor and survey LIBOR submissions to identify breaches of practice standards and/or potentially manipulative behavior, and (2) firms submitting data to LIBOR establish and maintain a clear conflicts of interest policy and appropriate systems and controls. The FCA Rules took effect on April 2, 2013. It is uncertain what additional regulatory changes or what changes, if any, in the method of determining LIBOR may be required or made by the U.K. government or other governmental or regulatory authorities. Accordingly, uncertainty as to the nature of such changes may adversely affect the market for or value of any LIBOR-linked securities, loans, derivatives and other financial obligations or extensions of credit held by or due to us or on our overall financial condition or results of operations. In addition, any further changes or reforms to the determination or supervision of LIBOR may result in a sudden or prolonged increase or decrease in reported LIBOR, which could have an adverse impact on the market for or value of any LIBOR-linked securities, loans, derivatives and other financial obligations or extensions of credit held by or due to us or on our overall financial condition or results of operations.
We are an “emerging growth company” and we cannot be certain if the reduced disclosure requirements applicable to emerging growth companies will make our shares of common stock less attractive to investors.
We are an “emerging growth company,” as defined in the Jumpstart Our Business Startups Act of 2012, or the “JOBSJOBS Act.” As a result, we have taken advantage of the exemption for emerging growth companies allowing us to temporarily forgo the auditor attestation requirements of Section 404(b) of the Sarbanes-Oxley Act of 2002.Act. We cannot predict if investors will find shares of our common stock less attractive because we will rely on this exemption. If some investors find our shares of common stock less attractive as a result, there may be a less active trading market for our shares and our share price may be more volatile. We did not take advantage of other disclosure or reporting exemptions for emerging growth companies under the JOBS Act. We will remain an emerging growth
company until the earlier of (a) the last day of the fiscal year (i) following the fifth anniversary of the completion of our initial public offering, (ii) in which we have total annual gross revenue of at least $1 billion,September 30, 2018 or (iii) in which we are deemed to be a large accelerated filer, which means the market value of our common stock that is held by non-affiliates exceeds $700 million as of the end of our prior second fiscal quarter, and (b) the date on which we have issued more than $1 billion in non-convertible debt during the prior three-year period.
Changes in laws or regulations governing our operations may adversely affect our business or cause us to alter our business strategy.
We and our portfolio companies are subject to regulation at the local, state and federal level. New legislation may be enacted or new interpretations, rulings or regulations could be adopted, including those governing the types of investments we are permitted to make or that impose limits on our ability to pledge a significant amount of our assets to secure loans or that restrict the operations of a portfolio company, any of which could harm us and our stockholders and the value of our investments, potentially with retroactive effect. For example, President Trump and certain members of Congress have indicated that they intend to seek to amend or repeal the Dodd-Frank Wall Street Reform and Consumer Protection Act, which influences many aspects of the financial services industry, and to substantially amend and reform the Code. Any amendment or repeal of such legislation, or changes in regulations or regulatory interpretations thereof, could create uncertainty in the near term, which could have a material adverse impact on our business, financial condition and results of operations.
Additionally, any changes to the laws and regulations governing our operations relating to permitted investments may cause us to alter our investment strategy in order to avail ourselves of new or different opportunities. Such changes could result in material differences to the strategies and plans set forth herein and may result in our investment focus shifting from the areas of expertise of our investment adviserInvestment Adviser to other types of investments in which our investment adviserInvestment Adviser may have less expertise or little or no experience. Thus, any such changes, if they occur, could have a material adverse effect on our results of operations and the value of your investment.
Our ability to effect certain amendments to or new issuances by the 2015 Debt Securitization may be adversely impacted by certain regulations applicable to debt securitizations implementing credit risk retention requirements that have taken effect or will take effect in both the U.S. and in Europe, and such regulations may adversely affect or prevent us from entering into any future securitization transaction. The impact of these risk retention rules on the loan securitization market are uncertain, and such rules may cause an increase in our cost of funds under or may prevent us from completing any future securitization transactions or certain amendments to or new issuances by our existing debt securitizations. The U.S. risk retention rules adopted pursuant to Section 941 of the Dodd-Frank Wall Street Reform and Consumer Protection Act and issued on October 21, 2014, or the U.S. Risk Retention Rules, require the sponsor (directly or through a majority-owned affiliate) of a debt securitization subject to such rules, such as collateralized loan obligations, in the absence of an exemption, to retain an economic interest in the credit risk of the assets being securitized in the form of an eligible horizontal residual interest, an eligible vertical interest, or a combination thereof, in accordance with the requirements of the U.S. Risk Retention Rules. The U.S. Risk Retention Rules become effective December 24, 2016. The 2015 Debt Securitization currently serves as a source of long-term balance sheet financing for portfolios of middle-market loans, and, generally, debt securitizations of this type have significantly more favorable financing costs than a traditional senior secured credit facility. However, it is unclear whether we will be able to use these types of debt securitizations to finance our existing loans or to originate future loans in compliance with the U.S. Risk Retention Rules after December 24, 2016. An inability to use these types of debt securitizations could, in turn, increase our financing costs, with any associated increase in financing costs ultimately borne by our common stockholders.
We have identified a material weakness in our internal control over financial reporting that, if not properly remediated, could result in material misstatements in our financial statements in future periods.
We identified a material weakness relating to our internal control over financial reporting under standards established by the Public Company Accounting Oversight Board, or PCAOB, for the period ended September 30, 2016.2017. The PCAOB defines a material weakness as a deficiency, or a combination of deficiencies, in internal control over financial reporting such that there is a reasonable possibility that a material misstatement of the company’s annual or interim financial statements will not be prevented or detected on a timely basis. A deficiency in internal control exists when the design or operation of a control does not allow management or employees, in the normal course of performing their assigned functions, to prevent or detect misstatements on a timely basis.
We have taken and will take a number of actions to remediate this material weakness, but some of these measures will take time to be fully integrated and confirmed to be effective. We cannot assure you that the steps taken will remediate such weaknesses, nor can we be certain of whether additional actions will be required or the costs of any such actions. Until measures are fully implemented and tested, the identified material weakness may continue to exist.
We may need to take additional measures to fully mitigate these issues, and the measures we have taken, and expect to take, to improve our internal controls may not be sufficient to address the issues identified, to ensure that our internal controls are effective or to ensure that the identified material weaknesses or significant deficiencies or other material weaknesses or deficiencies will not result in a material misstatement of our annual or interim financial statements. In addition, other material weaknesses or deficiencies may be identified in the future. If we are unable to correct material weaknesses or deficiencies in internal controls in a timely manner, our ability to record, process, summarize and report financial information accurately and within the time periods specified in the rules and forms of the SEC will be adversely affected. This failure could negatively affect the market price and trading liquidity of our securities, cause investors to lose confidence in our reported financial information, subject us to civil and criminal investigations and penalties, and generally materially and adversely impact our business and financial condition.
Future control deficiencies could prevent us from accurately and timely reporting our financial results.
We may identify deficiencies in our internal control over financial reporting in the future, including significant deficiencies and material weaknesses. A “significant deficiency” is a deficiency, or a combination of deficiencies, in internal control over financial reporting that is less severe than a material weakness, yet important enough to merit attention by those responsible for oversight of a company’s financial reporting.
Our failure to identify deficiencies in our internal control over financial reporting in a timely manner or remediate any deficiencies, or the identification of material weaknesses or significant deficiencies in the future could prevent us from accurately and timely reporting our financial results.
We are subject to risks associated with communications and information systems.
We depend on the communications and information systems of our investment adviserInvestment Adviser and its affiliates as well as certain third-party service providers. As our reliance on these systems has increased, so have the risks posed to these communications and information systems. Any failure or interruption in these systems could cause disruptions in our activities. In addition, these systems are subject to potential attacks, including through adverse events that threaten the confidentiality, integrity or availability of our information resources. These attacks, which may include cyber incidents, may involve a third party gaining unauthorized access to our communications or information systems for purposes of misappropriating assets, stealing confidential information, corrupting data or causing operational disruption. Any such attack could result in disruption to our business, misstated or unreliable financial data, liability for stolen assets or information, increased cybersecurity protection and insurance costs, litigation and damage to our business relationships, any of which could have a material adverse effect on our business, financial condition and results of operations.
We incur significant costs as a result of being a publicly traded company.
As a publicly-traded company, we incur legal, accounting and other expenses, including costs associated with the periodic reporting requirements applicable to a company whose securities are registered under the Securities Exchange Act of 1934, as amended, or the Exchange Act, as well as additional corporate governance requirements, including requirements under the Sarbanes-Oxley Act, of 2002, and other rules implemented by the SEC and the listing standards of the NASDAQ Global Select Market. Upon ceasing to qualify as an emerging growth company underBeginning with the JOBS Act,fiscal year ending September 30, 2018, our independent registered public accounting firm will be required to attest to the effectiveness of our internal control over financial reporting pursuant to Section 404 of the Sarbanes-Oxley Act, which will increase costs associated with our periodic reporting requirements.
Risks Relating to Our Investments
Our investments in portfolio companies may be risky, and we could lose all or parts of our investments.
The companies in which we invest are typically highly leveraged, and, in most cases, our investments in such companies are not rated by any rating agency. If such investments were rated, we believe that they would likely receive a rating from a nationally recognized statistical rating organization of below investment grade (i.e., below BBB- or Baa), which is often referred to as "high yield" and “junk.” Exposure to below investment grade securities involves certain risks, and those securities are viewed as having predominately speculative characteristics with respect to the issuer's capacity to pay interest and repay principal. Investing in small and mid-sized companies involves a number of significant risks. As of September 30, 2016, 22.4%2017, 19.7% of our debt portfolio at fair value consisted of debt securities for which issuers were not required to make principal payments until the maturity of such debt securities, which could result in a substantial loss to us if such issuers are unable to refinance or repay their debt at maturity. Increases in interest rates may affect the ability of our portfolio companies to repay debt or pay interest, which may in turn affect the value of our portfolio investments, and our business, financial condition and results of operations. Among other things, our portfolio companies:
may have limited financial resources, may have limited or negative EBITDA and may be unable to meet their obligations under their debt instruments that we hold, which may be accompanied by a deterioration in the value of any collateral and a reduction in the likelihood of us realizing any guarantees from subsidiaries or affiliates of our portfolio companies that we may have obtained in connection with our investments, as well as a corresponding decrease in the value of the equity components of our investments;
may not have collateral sufficient to pay any outstanding interest or principal due to us in the event of a default by these companies;
may have shorter operating histories, narrower product lines, smaller market shares and/or significant customer concentrations than larger businesses, which tend to render them more vulnerable to competitors’ actions and market conditions, as well as general economic downturns;
may operate in regulated industries and/or provide services to federal, state or local governments, or operate in industries that provide services to regulated industries or federal, state or local governments, any of which could lead to delayed payments for services or subject the company to changing payment and reimbursement rates or other terms;
may not have collateral sufficient to pay any outstanding interest or principal due to us in the event of a default by these companies;
are more likely to depend on the management talents and efforts of a small group of persons;people; therefore, the death, disability, resignation or termination of one or more of these persons could have a material adverse impact on our portfolio company and, in turn, on us;
may have difficulty accessing the capital markets to fund capital needs, which may limit their ability to grow or repay outstanding indebtedness at maturity;
generally have less predictable operating results, may from time to time be parties to litigation, may be engaged in rapidly changing businesses with products subject to a substantial risk of obsolescence, and may require substantial additional capital to support their operations, finance expansion or maintain their competitive position; and
generally have less publicly available information about their businesses, operations and financial condition. If we are unable to uncover all material information about these companies, we may not make a fully informed investment decision, and as a result may lose part or all of our investment.
In addition, in the course of providing managerial assistance to certain of our portfolio companies, certain of our officers and directors may serve as directors on the boards of such companies. To the extent that litigation arises out of our investments in these companies, our officers and directors may be named as defendants in such litigation, which could result in an expenditure of funds (through our indemnification of such officers and directors) and the diversion of management time and resources.
We may incur greater riskbe exposed to higher risks with respect to our investments that include OID or PIK interest.
Our investments may include OID and contractual PIK interest, which represents contractual interest added to a loan balance and due at the end of such loan’s term. To the extent OID or PIK interest constitute a portion of our income, we acquire through assignments or participationsare exposed to typical risks associated with such income being required to be included in taxable and accounting income prior to receipt of interests.cash, including the following:
We•OID and PIK instruments may acquire senior loans through assignments or participationshave higher yields, which reflect the payment deferral and credit risk associated with these instruments;
•OID and PIK accruals may create uncertainty about the source of interests in such loans. The purchaser of an assignment typically succeedsour distributions to allstockholders;
•OID and PIK instruments may have unreliable valuations because their continuing accruals require continuing judgments about the rights and obligationscollectability of the assigning institutiondeferred payments and becomes a lender under the credit agreement with respect to such debt obligation. However, the purchaser’s rights can be more restricted than thosevalue of the assigning institution,collateral; and we
•OID and PIK instruments may not be able to unilaterally enforce all rights and remedies under an assigned debt obligation and with regard to any associated collateral. A participation typically results inrepresent a contractual relationship only with the institution participating out the interest and not directly with the borrower. Sellers of participations typically include banks, broker-dealers, other financial institutions and lending institutions. In purchasing participations, we generally will have no right to enforce compliance by the borrower with the terms of the loan agreement against the borrower, and we may not directly benefit from the collateral supporting the debt obligation in which we have purchased the participation. As a result, we will be exposed to thehigher credit risk of both the borrower and the institution selling the participation. Further, in purchasing participations in lending syndicates, we will not be able to conduct the same level of due diligence on a borrower or the quality of the senior loan with respect to which we are buying a participation as we would conduct if we were investing directly in the senior loan. This difference may result in us being exposed to greater credit or fraud risk with respect to such senior loans than we expected when initially purchasing the participation.coupon loans.
An investment strategy focused primarily on privately held companies presents certain challenges, including the lack of available information about these companies.
We invest primarily in privately held companies. Generally, little public information exists about these companies, including typically a lack of audited financial statements and ratings by third parties. Furthermore, such an investment strategy involves a dependence on the management talents and efforts of a small group of people as well as a greater vulnerability to economic downturns. We must therefore rely on the ability of our investment adviserInvestment Adviser to obtain adequate information to evaluate the potential risks of investing in these companies. These companies and their financial information may not be subject to the Sarbanes-Oxley Act and other rules that govern public companies. If we are unable to uncover all material information about these companies, we may not make a fully informed investment decision, and we may lose money on our investments. These factors could affect our investment returns.
We may allocate the net proceeds from an offering in ways with which you may not agree.
We have significant flexibility in investing the net proceeds of an offering, and may do so in a way with which you may not agree. Additionally, our investment adviser will select our investments subsequent to the closing of an offering, and our stockholders will have no input with respect to such investment decisions. Further, other than general limitations that may be included in a future credit facility, the holders of our debt securities will generally not have veto power or a vote in approving any changes to our investment or operational policies. These factors increase the uncertainty, and thus the risk, of investing in our securities. In addition, pending such investments, we will invest the net proceeds from an offering primarily in high quality, short-term debt securities, consistent with our business development company election and our election to be taxed as a RIC, at yields significantly below the returns which we expect to achieve when our portfolio is fully invested in securities meeting our investment objective. If we are not able to identify or gain access to suitable investments, our income may be limited.
If we invest inacquire the securities and obligations of distressed or bankrupt companies, such investments may be subject to significant risks, including lack of income, extraordinary expenses, uncertainty with respect to satisfaction of debt, lower-than-expected investment values or income potentials and resale restrictions.
We are authorized to invest inmay acquire the securities and other obligations of distressed or bankrupt companies. At times, distressed debt obligations may not produce income and may require us to bear certain extraordinary expenses (including legal, accounting, valuation and transaction expenses) in order to protect and recover our investment. Therefore, to the extent we invest in distressed debt, our ability to achieve current income for our stockholders may be diminished, particularly where the portfolio company has negative EBITDA.
We also will be subject to significant uncertainty as to when and in what manner and for what value the distressed debt we invest in will eventually be satisfied (e.g.,whether through a liquidation, of the obligor’s assets, an exchange offer or plan of
reorganization involving the distressed debt securities or a payment of some amount in satisfaction of the obligation).obligation. In addition, even if an exchange offer is made or plan of reorganization is adopted with respect to distressed debt held by us, there can be no assurance that the securities or other assets received by us in connection with such exchange offer or plan of reorganization will not have a lower value or income potential than may have been anticipated when the investment was made.
Moreover, any securities received by us upon completion of an exchange offer or plan of reorganization may be restricted as to resale. As a result of our participation in negotiations with respect to any exchange offer or plan of reorganization with respect to an issuer of distressed debt, we may be restricted from disposing of such securities.
The lack of liquidity in our investments may adversely affect our business.
We invest, and will continue to invest, in companies whose securities are not publicly traded, and whose securities are subject to legal and other restrictions on resale or are otherwise less liquid than publicly traded securities. In fact, all of our assets may be invested in illiquid securities. The illiquidity of these investments may make it difficult for us to sell these investments when desired. In addition, if we are required to liquidate all or a portion of our portfolio quickly, we may realize significantly less than the value at which we had previously recorded these investments. Our investments are usually subject to contractual or legal restrictions on resale or are otherwise illiquid because there is usually no established trading market for such investments. In addition, we may also face restrictions on our ability to liquidate our investments if our investment adviserInvestment Adviser or any of its affiliates have material nonpublic information regarding the portfolio company. The illiquidity of most of our investments may make it difficult for us to dispose of them at a favorable price, and, as a result, we may suffer losses.
We may not have the funds or ability to make additional investments in our portfolio companies.
After our initial investment in a portfolio company, we may be called upon from time to time to provide additional funds to such company or have the opportunity to increase our investment through the exercise of a warrant to purchase common stock.follow-on investment. There is no assurance that we will make, or will have sufficient funds to make, follow-on investments. Any decisions not to make a follow-on investment or any inability on our part to make such an investment may have a negative impact on a portfolio company in need of such an investment, may result in a missed opportunity for us to increase our participation in a successful operation, or may reduce the expected yield on the investment.investment or impair the value of our investment in any such portfolio company.
Our portfolio companies may incur debt that ranks equally with, or senior to, our investments in such companies.
We invest primarily in senior securedfirst lien loans including unitranche and second lien debt instruments, as well as unsecured debt instruments, issued by our portfoliosmall and mid-sized companies. If we invest in unitranche, second lien, or unsecured debt instruments, ourOur portfolio companies typicallymay have, or may be permitted to incur, other debt that ranks equally with, or senior to, suchthe debt instruments.in which we invest. By their terms, such debt instruments may entitle the holders are entitled to receive paymentpayments of interest or principal on or before the dates on which we are entitled to receive payments with respect to the debt instruments in which we invest. Also, in the event of insolvency, liquidation, dissolution, reorganization or bankruptcy of a portfolio company, holders of debt instruments ranking senior to our investment in that portfolio company would typically be entitled to receive payment in full before we receive any distribution. After repaying such senior creditors, such portfolio company may not have any remaining assets to use for repaying its obligation to us. In the case of debt ranking equally with debt instruments in which we will invest, we would have to share on an equal basis any distributions with other creditors holding such debt in the event of an insolvency, liquidation, dissolution, reorganization or bankruptcy of the relevant portfolio company.
The disposition of our investments may result in contingent liabilities.
Most of our investments involve private securities. In connection with the disposition of an investment in private securities, we may be required to make representations about the business and financial affairs of the portfolio company typical of those made in connection with the sale of a business. We may also be required to indemnify the purchasers of such investment to the extent that any such representations turn out to be inaccurate or with respect to certain potential liabilities. These arrangements may result in contingent liabilities that ultimately yield funding obligations that must be satisfied through our return of certain distributions previously made to us.
There may be circumstances where our debt investments could be subordinated to claims of other creditors or we could be subject to lender liability claims.
Even though we have structured some of our investments as senior loans, if one of our portfolio companies were to enter bankruptcy proceedings, depending on the facts and circumstances, including the extent to which we actually provided managerial assistance to that portfolio company, a bankruptcy court might re-characterize our debt investment and subordinate all or a portion of our claim to that of other creditors.creditors, depending on the facts and circumstances, including the extent to which we actually provided managerial assistance to that portfolio company. We may also be subject to lender liability claims for actions taken by us with respect to a borrower’s business or instances where we exercise control over the borrower. It is possible that we could become subject to a lender’s liability claim, including as a result of actions taken in rendering significant managerial assistance.
Second priority liens on collateral securing loans that we make to our portfolio companies may be subject to control by senior creditors with first priority liens. If there is a default, the value of the collateral may not be sufficient to repay in full both the first priority creditors and us.
Certain loans that we make to portfolio companies will be secured on a second priority basis by the same collateral securing first prioritysenior secured debt of such companies. The first priority liens on the collateral will secure the portfolio company’s obligations under any outstanding senior debt and may secure certain other future debt that may be permitted to be incurred by the company under the agreements governing the loans. The holders of obligations secured by the first priority liens on the collateral will generally control the liquidation of and be entitled to receive proceeds from any realization of the collateral to repay their obligations in full before us. In addition, the value of the collateral in the event of liquidation will depend on market and economic conditions, the availability of buyers and other factors. There can be no assurance that the proceeds, if any, from the sale or sales of all of the collateral would be sufficient to satisfy the loan obligations secured by the second priority liens after payment in full of all obligations secured by the first priority liens on the collateral. If such proceeds are not sufficient to repay amounts outstanding under the loan obligations secured by the second priority liens, then we, to the extent not repaid from the proceeds of the sale of the collateral, will only have an unsecured claim against the company’s remaining assets, if any.
The rights we may have with respect to the collateral securing the loans we make to our portfolio companies with senior debt outstanding may also be limited pursuant to the terms of one or more inter-creditor agreements that we enter into with the holders of senior debt. Under such an inter-creditor agreement, at any time that obligations that have the benefit of the first priority liens are outstanding, any of the following actions that may be taken with respect to the collateral and will be at the direction of the holders of the obligations secured by the first priority liens: the ability to cause the commencement of enforcement proceedings against the collateral; the ability to control the conduct of such proceedings; the approval of amendments to collateral documents; releases of liens on the collateral; and waivers of past defaults under collateral documents. We may not have the ability to control or direct such actions, even if our rights are adversely affected.
If we make unsecured debt investments, we may lack adequate protection in the event our portfolio companies become distressed or insolvent and will likely experience a lower recovery than more senior debtholders in the event such portfolio companies default on their indebtedness.
We have made, and may in the future make, unsecured debt investments in portfolio companies. Unsecured debt investments are unsecured and junior to other indebtedness of the portfolio company. As a consequence, the holder of an unsecured debt investment may lack adequate protection in the event the portfolio company becomes distressed or insolvent and will likely experience a lower recovery than more senior debtholders in the event the portfolio company defaults on its indebtedness. In addition, unsecured debt investments of small and mid-sized companies are often highly illiquid and in adverse market conditions may experience steep declines in valuation even if they are fully performing.
We may incur greater risk with respect to investments we acquire through assignments or participations of interests.
Although we originate a substantial portion of our loans, we may acquire loans through assignments or participations of interests in such loans. The purchaser of an assignment typically succeeds to all the rights and obligations of the assigning institution and becomes a lender under the credit agreement with respect to such debt obligation. However, the purchaser’s rights can be more restricted than those of the assigning institution, and we may not be able to unilaterally enforce all rights and remedies under an assigned debt obligation and with regard to any associated collateral. A participation typically results in a contractual relationship only with the institution participating out the interest and not directly with the borrower. Sellers of participations typically include banks, broker-dealers, other financial institutions and lending institutions. In purchasing participations, we generally will have no right to enforce compliance by the borrower with the terms of the loan agreement against the borrower, and we may not directly benefit from the collateral supporting the debt obligation in which we have purchased the participation. As a result, we will be exposed to the credit risk of both the borrower and the institution selling the participation. Further, in purchasing participations in lending syndicates, we will not be able to conduct the same level of due diligence on a borrower or the quality of the loan with respect to which we are buying a participation as we would conduct if we were investing directly in the loan. This difference may result in us being exposed to greater credit or fraud risk with respect to such loans than we expected when initially purchasing the participation.
Our investments in Internet and software companies are subject to many risks, including regulatory concerns, litigation risks and intense competition.
As of September 30, 2017, our investments in Internet and software companies represented 21.72% of our total portfolio, at fair value. Our investments in Internet and software companies are subject to substantial risks. For example, our portfolio companies face intense competition since their businesses are rapidly evolving and intensely competitive, and are subject to changing technology, shifting user needs, and frequent introductions of new products and services. Internet and software companies have many competitors in different industries, including general purpose search engines, vertical search engines and e-commerce sites, social networking sites, traditional media companies, and providers of online products and services. Potential competitors to our portfolio companies in the Internet and software industries range from large and established companies to emerging start-ups. Further, such companies are subject to laws that were adopted prior to the advent of the Internet and related technologies and, as a result, do not contemplate or address the unique issues of the Internet and related technologies. The laws that do reference the Internet are being interpreted by the courts, but their applicability and scope remain uncertain. For example, the laws relating to the liability of providers of online services are currently unsettled both within the United States and abroad. Claims have been threatened and filed under both U.S. and foreign laws for defamation, invasion of privacy and other tort claims, unlawful activity, copyright and trademark infringement, or other theories based on the nature and content of the materials searched and the ads posted by a company’s users, a company’s products and services, or content generated by a company’s users. Further, the growth of Internet and software companies into a variety of new fields implicate a variety of new regulatory issues and may subject such companies to increased regulatory scrutiny, particularly in the United States and Europe. As a result, these portfolio company investments face considerable risk. This could, in turn, materially adversely affect the value of the Internet and software companies in our portfolio.
We generally do not, and do not expect to, control our portfolio companies.
We do not, and do not expect to, control most of our portfolio companies, even though we may have board representation or board observation rights, and our debt agreements may contain certain restrictive covenants.companies. As a result, we are subject to the risk that a portfolio company in which we invest may make business decisions with which we disagree and the management of such company, as representatives of the holders of their common equity, may take risks or otherwise act in ways that do not serve our interests as a debt investor.investor, including actions that could decrease the value of our investment. Due to the lack of liquidity for our investments in non-traded companies, we may not be able to dispose of our interests in our portfolio companies as readily as we would like or at an appropriate valuation. As a result, a portfolio company may make decisions that could decrease the value of our portfolio holdings.
Defaults by our portfolio companies would harm our operating results.
A portfolio company’s failure to satisfy financial or operating covenants imposed by us or other lenders could lead to defaults and, potentially, termination of its loans and foreclosure on its secured assets, which could trigger cross-defaults under other agreements and jeopardize a portfolio company’s ability to meet its obligations under the debt or equity securities that we hold. We may incur expenses to the extent necessary to seek recovery upon default or to negotiate new terms, which may include the waiver of certain financial covenants, with a defaulting portfolio company. In addition, we may write-down the value of a portfolio company investment upon the worsening of the financial condition of the portfolio company or in anticipation of a default, which could also have a material adverse effect on our business, financial condition and results of operations.
Our portfolio companies may experience financial distress and our investments in such companies may be restructured.
Our portfolio companies may experience financial distress from time to time. Debt investments in such companies may cease to be income-producing, may require us to bear certain expenses to protect our investment and may subject us to uncertainty as to when, in what manner and for what value such distressed debt will eventually be satisfied, including through liquidation, reorganization or bankruptcy. Any restructuring can fundamentally alter the nature of the related investment, and restructurings may not be subject to the same underwriting standards that our investment adviserInvestment Adviser employs in connection with the origination of an investment. In addition, we may write-down the value of our investment in any such company to reflect the status of financial distress and future prospects of the business. Any restructuring could alter, reduce or delay the payment of interest or principal on any investment, which could delay the timing and reduce the amount of payments made to us. For example, if an exchange offer is made or plan of reorganization is adopted with respect to the debt securities we currently hold, there can be no assurance that the securities or other assets received by us in connection with such exchange offer or plan of reorganization will have a value or income potential similar to what we anticipated when our original investment was made or even at the time of restructuring. Restructurings of investments might also result in extensions of the term thereof, which could delay the timing of payments made to us, or we may receive equity securities, which may require significantly more of our management’s time and attention or carry restrictions on their disposition. We cannot assure you that any particular restructuring strategy pursued by our investment adviserInvestment Adviser will maximize the value of or recovery on any investment.
Our portfolio may be limited to a small number of industries, which may subject us to a risk of significant loss if there is a downturn in any such industry.
Our portfolio may be limited to a small number of industries. A downturn in any particular industry in which we are invested could significantly impact the aggregate returns we realize.
As of September 30, 2016, our investments in the Internet and software services industry represented approximately 20.8% of the fair value of our portfolio and our investments in the healthcare sector represented approximately 17.0% of the fair value of our portfolio. If an industry in which we have significant investments suffers from adverse business or economic conditions, as these industries have to varying degrees, a material portion of our investment portfolio could be affected adversely, which, in turn, could adversely affect our financial position and results of operations.
Our investments in the Internet software and services sector face considerable uncertainties including volatility, intense competition, decreasing life cycles, product obsolescence, changing consumer preferences, periodic downturns, regulatory concerns and litigation risks.
As of September 30, 2016, our investments in portfolio companies that operate in the Internet software and services sector represents approximately 20.8% of the fair value our total portfolio. The revenues, income (or losses) and valuations of technology-related companies can and often do fluctuate suddenly and dramatically. In addition, because of rapid technological change, the average selling prices of products and some services provided by technology-related sectors have historically decreased over their productive lives. As a result, the average selling prices of products and services offered by our portfolio companies that operated in technology-related sectors may decrease over time, which could adversely affect their operating results and, correspondingly, the value of any investments that we may hold.
Our investments in Internet and software companies are subject to substantial risks. For example, our portfolio companies face intense competition since their businesses are rapidly evolving and intensely competitive, and are subject to changing technology, shifting user needs, and frequent introductions of new products and services. Internet and software companies have many competitors in different industries, including general purpose search engines, vertical search engines and e-commerce sites, social networking sites, traditional media companies, and providers of online products and services. Potential competitors to our portfolio companies in the Internet and software industries range from large and established companies to emerging startups.
Further, such companies are subject to laws that were adopted prior to the advent of the Internet and related technologies and, as a result, do not contemplate or address the unique issues of the Internet and related technologies. The laws that do reference the Internet are being interpreted by the courts, but their applicability and scope remain uncertain. For example, the laws relating to the liability of providers of online services are currently unsettled both within the U.S. and abroad. Claims have been threatened and filed under both U.S. and foreign laws for defamation, invasion of privacy and other tort claims, unlawful activity, copyright and trademark infringement, or other theories based on the nature and content of the materials searched and the ads posted by a company’s users, a company’s products and services, or content generated by a company’s users. Further, the growth of Internet and software companies into a variety of new fields implicate a variety of new regulatory issues and may subject such companies to increased regulatory scrutiny, particularly in the U.S. and Europe. As a result, these portfolio company investments face considerable risk. This could, in turn, materially adversely affect the value of the Internet and software companies in our portfolio.
Our investments in the healthcare sector face considerable uncertainties including substantial regulatory challenges.
As of September 30, 2016, our investments in portfolio companies that operate in the healthcare sector represent approximately 17.0% of the fair value of our total portfolio. Our investments in the healthcare sector are subject to substantial risks. The laws and rules governing the business of healthcare companies and interpretations of those laws and rules are subject to frequent change. Broad latitude is given to the agencies administering those regulations. Existing or future laws and rules could force our portfolio companies engaged in healthcare to change how they do business, restrict revenue, increase costs, change reserve levels and change business practices.
Healthcare companies often must obtain and maintain regulatory approvals to market many of their products, change prices for certain regulated products and consummate some of their acquisitions and divestitures. Delays in obtaining or failing to obtain or maintain these approvals could reduce revenue or increase costs. Policy changes on the local, state and federal level, such as the expansion of the government’s role in the healthcare arena and alternative assessments and tax increases specific to the healthcare industry or healthcare products as part of federal health care reform initiatives, could fundamentally change the dynamics of the healthcare industry. In addition, insurance company and other reimbursement rates may be subject to change, often with little notice, and decreases in such rates could materially adversely affect the value of the healthcare companies in our portfolio.
We are subject to risks associated with our investments in energy companies.
As of September 30, 2016, our investments in portfolio companies that operate in the energy sector represent 0.71% of the fair value of our total portfolio. The energy industry has been in a period of disruption and volatility that has been characterized by decreases in oil and gas prices and production levels. This disruption and volatility has led to, and future disruptions and volatility may lead to, decreases in the credit quality and performance of certain of our debt and equity investments in energy companies, which could, in turn, negatively impact the fair value of our investments in energy companies. Any prolonged decline in oil and gas prices or production levels could adversely impact the ability of our portfolio companies in the energy industry to satisfy financial or operating covenants that may be imposed by us and other lenders or to make payments to us as and when due, which could have a material adverse effect on our business, financial condition and results of operations. In addition, energy companies are subject to supply and demand fluctuations in the markets in which they operate, which are impacted by a numerous factors, including weather, use of renewable fuel sources, natural disasters, governmental regulation and general economic conditions, in addition to the effects of increasing regulation and general operational risks, any of which could have a material adverse effect on the performance and value of our energy-related investments as well as our cash flows from such investments.
We may not realize gains from our equity investments.
Certain investments that we have made in the past and may make in the future include warrants or other equity securities. In addition, we have made in the past and may make in the future direct equity investments in companies. Our goal is ultimately to realize gains upon our disposition of such equity interests. However, the equity interests we receive may not appreciate in value and, in fact, may decline in value. Accordingly, we may not be able to realize gains from our equity interests, and any gains that we do realize on the disposition of any equity interests may not be sufficient to offset any other losses we experience. We also may be unable to realize any value if a portfolio company does not have a liquidity event, such as a sale of the business, recapitalization or public offering, which would allow us to sell the underlying equity interests. We may seek puts or similar rights to give us the right to sell our equity securities back to the portfolio company issuer. We may be unable to exercise these put rights for the consideration provided in our investment documents if the issuer is in financial distress.
We are subject to certain risks associated with foreign investments.
We have made in the past and may make in the future investments in foreign companies. Investing in foreign companies may expose us to additional risks not typically associated with investing in U.S. companies. These risks include changes in foreign exchange rates, exchange control regulations, political and social instability, expropriation, imposition of foreign taxes, less liquid markets and less available information than is generally the case in the U.S., higher transaction costs, less government supervision of exchanges, brokers and issuers, less developed bankruptcy laws, difficulty in enforcing contractual obligations, lack of uniform accounting and auditing standards and greater price volatility. In addition, our foreign investments generally do not constitute "qualifying assets" under the 1940 Act, under which qualifying assets must represent at least 70% of our total assets. See “Regulation — Business“Business Development Company Regulations — Qualifying Assets.”
Our success will depend, in part, on our ability to anticipate and effectively manage these and other risks. We cannot assure you that these and other factors will not have a material adverse effect on our business as a whole.
We may expose ourselves to risks if we engage in hedging transactions.
Subject to applicable provisions of the 1940 Act and applicable regulations promulgated by the Commodities Futures Trading Commission, we have in the past and may in the future enter into hedging transactions, which may expose us to risks associated with such transactions. Such hedging may utilize instruments such as forward contracts, currency options and interest rate swaps, caps, collars and floors to seek to hedge against fluctuations in the relative values of our portfolio positions and amounts due under our credit facilities from changes in currency exchange rates and market interest rates. Use of these hedging instruments may include counterparty credit risk. Hedging against a decline in the values of our portfolio positions does not eliminate the possibility of fluctuations in the values of such positions and amounts due under our credit facilities or prevent losses if the values of such positions decline. However, such hedging can establish other positions designed to gain from those same developments, thereby offsetting the decline in the value of such portfolio positions. Such hedging transactions may also limit the opportunity for gain if the values of the underlying portfolio positions should increase. Moreover, it may not be possible to hedge against an exchange rate or interest rate fluctuation that is so generally anticipated that we are not able to enter into a hedging transaction at an acceptable price.
The success of any hedging transactions will depend on our ability to correctly predict movements in currencies and interest rates. Therefore, while we may enter into such transactions to seek to reduce currency exchange ratesrate and interest rate risks, unanticipated changes in currency exchange rate or interest rates may result in poorer overall investment performance than if we had not engaged in any such hedging transactions. In addition, the degree of correlation between price movements of the instruments used in a hedging strategy and price movements in the portfolio positions being hedged may vary. Moreover, for a variety of reasons, we may not seek to (or be able to) establish a perfect correlation between such hedging instruments and the portfolio holdings or credit facilities being hedged. Any such imperfect correlation may prevent us from achieving the intended hedge and expose us to risk of loss. In addition, it may not be possible to hedge fully or perfectly against currency fluctuations affecting the value of securities denominated in non-U.S. currencies because the value of those securities is likely to fluctuate as a result of factors not related to currency fluctuations. See also “—“Risks Relating to Our Business and Structure- Changes in interest rates, changes in the method for determining LIBOR and the potential replacement of LIBOR may affect our cost of capital and net investment income.”
We are a non-diversified investment company within the meaning of the 1940 Act, and therefore have few restrictions with respect to the proportion of our assets that may be invested in securities of a single industry or issuer.
We are classified as a non-diversified investment company within the meaning of the 1940 Act, which means that we are not limited by the 1940 Act with respect to the proportion of our assets that we may invest in securities of a single industry or issuer, excluding limitations on investments in other investment companies. We cannot predict the industries or sectors in which our investment strategy may cause us to concentrate and cannot predict the level of our diversification among industries or issuers. To the extent that we assume large positions in a certain type of security or the securities of a small number of industries or issuers, our net asset value may fluctuate to a greater extent than that of a diversified investment company as a result of changes in the financial condition or the market’s assessment of the security, industry or issuer. We may also be more susceptible to any single economic or regulatory occurrence than a diversified investment company. Beyond RIC diversification requirements, we do not have fixed guidelines for diversification, and our investments could be concentrated in relatively few industries or issuers.
Our portfolio may be concentrated in a limited number of portfolio companies and industries, which will subject us to a risk of significant loss if any of these companies defaults on its obligations under any of its debt instruments or if there is a downturn in a particular industry.
Our portfolio may be concentrated in a limited number of portfolio companies and industries. As a result, the aggregate returns we realize may be significantly and adversely affected if a small number of investments perform poorly or if we need to write down the value of any one investment. Additionally, while we are not targeting any specific industries, our investments may be concentrated in relatively few industries, including the healthcare, Internet and software and energy industries.industry. As a result, a downturn in any particular industry in which we are invested could also significantly impact the aggregate returns we realize.
We may allocate the net proceeds from an offering in ways with which you may not agree.
We are subject to risks associated with the Debt Securitization.
As a result of the Debt Securitization, we are subject to a variety of risks, including those set forth below. We use the term “debt securitization” to describe a form of secured borrowing under which an operating company (sometimes referred to as an “originator” or “sponsor”) acquires or originates mortgages, receivables, loans or other assets that earn income, whether on a one-time or recurring basis (collectively, “income producing assets”), and borrows money on a non-recourse basis against a legally separate pool of loans or other income producing assets. In a typical debt securitization, the originator transfers the loans or income producing assets to a single-purpose, bankruptcy-remote subsidiary (also referred to as a “special purpose entity”), which is established solely for the purpose of holding loans and income producing assets and issuing debt secured by these income producing assets. The special purpose entity completes the borrowing through the issuance of notes secured by the loans or other assets. The special purpose entity may issue the noteshave significant flexibility in the capital markets to a variety of investors, including banks, non-bank financial institutions and other investors. In the Debt Securitization, institutional investors purchased $222.6 million long-term secured notes, or the 2015 Notes, issued by FS Senior Funding Ltd., our wholly-owned subsidiary, in a private placement.
We are subject to certain risks as a result of our interests in the junior notes and membership interests of the 2015 Issuer.
Under the terms of the master transfer agreement governing the Debt Securitization, we sold to FS Senior Funding Ltd., or the 2015 Issuer, all of our ownership interest in certain of our portfolio loans and participations for the purchase price and other consideration set forth in such master transfer agreement. Following this transfer, the 2015 Issuer held all of the ownership interest in such portfolio loans and participations. As a result of the Debt Securitization and as of September 30, 2015, we held the Class C Senior Secured Notes, or the Class C Notes, as well as all of the subordinated notes, or the Subordinated 2015 Notes, of the 2015 Issuer. As a result, we consolidate the financial statements of the 2015 Issuer, as well as our other subsidiaries, in our Consolidated Financial Statements. Because the 2015 Issuer is disregarded as an entity separate from its owner for U.S. federal income tax purposes, the sale or contribution by us to the 2015 Issuer did not constitute a taxable event for U.S. federal income tax purposes. If the U.S. Internal Revenue Service were to take a contrary position, there could be a material adverse effect on our business, financial condition, results of operations or cash flows.
The Class C Notes are subordinated obligations of the 2015 Issuer.
The Class C Notes are the most junior class of rated notes issued by the 2015 Issuer, are subordinated in priority of payment to the Class A-T Senior Secured Floating Rate Notes, Class A-R Senior Secured Revolving Floating Rate Notes, Class A-S Senior Secured Floating Rate Notes, or collectively, the Class A Notes, and the Class B Senior Secured Floating Rate Notes, or the Class B Notes, and, together with the Class A Notes, the Senior 2015 Notes, and are subject to certain payment restrictions set forth in the indenture governing the Debt Securitization. Therefore, we only receive cash distributions on the Class C Notes if the 2015 Issuer has made all cash interest payments on all the Senior 2015 Notes it has issued. Consequently, to the extent that the value of the 2015 Issuer’s portfolio of loan investments has been reduced as a result of conditions in the credit markets, or as a result of defaulted loans or individual fund assets, the value of the Class C Notes at their redemption will be reduced because the Class C Notes are junior to the Senior 2015 Notes and will bear losses of the 2015 Issuer’s portfolio of loan investments prior to the Senior 2015 Notes.
The 2015 Issuer, as holders of the Subordinated 2015 Notes, is the residual claimant on funds, if any, remaining after holders of all classes of 2015 Notes have been paid in full on each payment date or upon maturity of such notes under the Debt Securitization documents. The Subordinated 2015 Notes in the 2015 Issuer represent all of the residual interest in the 2015 Issuer, and, as the holder of the Subordinated 2015 Notes, we may receive distributions, if any, only to the extent that the 2015 Issuer makes distributions out of funds remaining after holders of all classes of 2015 Notes have been paid in full on each payment date any amounts due and owing on such payment date or upon maturity of such 2015 Notes.
The interests of holders of the senior classes of securities issued by the 2015 Issuer may not be aligned with our interests.
The Class A Notes are the debt obligations ranking senior in right of payment to other securities issued by the 2015 Issuer in the Debt Securitization. As such, there are circumstances in which the interests of holders of the Class A Notes may not be aligned with the interests of holders of the other classes of notes issued by the 2015 Issuer. For example, under the terms of the Class A Notes, holders of the Class A Notes have the right to receive payments of principal and interest prior to holders of the Class B Notes, the Class C Notes and the 2015 Issuer and the holders of the Class B Notes have the right to receive payments of the principal and interest prior to the holders of the Class C Notes.
For as long as the Class A Notes remain outstanding, holders of the Class A Notes comprise the most senior class of notes outstanding of the 2015 Issuer, or the Controlling Class, under the 2015 Debt Securitization. If the Class A Notes are paid in full, the Class B Notes would comprise the Controlling Class under the 2015 Debt Securitization. Holders of the Controlling
Class under the 2015 Debt Securitization have the right to act in certain circumstances with respect to the portfolio loans in ways that may benefit their interests but not the interests of holders of more junior classes of notes and Subordinated 2015 Notes, including by exercising remedies under the indenture in the 2015 Debt Securitization.
If an event of default has occurred and acceleration occurs in accordance with the terms of the indenture governing the Debt Securitization, the Controlling Class, as the most senior class of notes then outstanding in the 2015 Debt Securitization will be paid in full before any further payment or distribution on the more junior classes of notes and Subordinated Notes. In addition, if an event of default under the 2015 Debt Securitization occurs, holders of a majority of the Controlling Class of the 2015 Debt Securitization may be entitled to determine the remedies to be exercised under the indenture, subject to the terms of such indenture. For example, upon the occurrence of an event of default with respect to the notes issued by the 2015 Issuer, the trustee or holders of a majority of the Controlling Class may declare the principal, together with any accrued interest, of all the notes of such class and any junior classes to be immediately due and payable. This would have the effect of accelerating the principal on such notes, triggering a repayment obligation on the part of the 2015 Issuer. If at such time the portfolio loans were not performing well, the 2015 Issuer may not have sufficient proceeds available to enable the trustee under the indenture to repay the obligations of holders of the 2015 Notes or the Subordinated 2015 Notes.
Remedies pursued by the Controlling Class could be adverse to the interests of the holders of the 2015 Notes that are subordinated to the Controlling Class, and the Controlling Class will have no obligation to consider any possible adverse effect on such other interests. Thus, we cannot assure you that any remedies pursued by the Controlling Class will be in the best interests of the 2015 Issuer or us or that the 2015 Issuer or we will receive any payments or distributions upon an acceleration of the notes. In a liquidation under the 2015 Debt Securitization, the Class C Notes will be subordinated to payment of the Class A Notes and Class B Notes and may not be paid in full to the extent funds remaining after payment of the Class A Notes and Class B Notes are insufficient. In addition, under the Debt Securitization, after the Class A Notes and Class B Notes are paid in full, the holder of the Class C Notes will be the only remaining noteholder and may amend the applicable indenture to, among other things, direct the assignment of any remaining assets to other wholly-owned subsidiaries for a price less than the fair market value of such assets with the difference in price to be considered an equity contribution to such subsidiaries. Any failure of the 2015 Issuer to make distributions on the notes we indirectly or directly hold, whether as a result of an event of default, liquidation or otherwise, could have a material adverse effect on our business, financial condition, results of operations and cash flows and may result in an inability of us to make distributions sufficient to maintain our status as a RIC.
The 2015 Issuer may fail to meet certain asset coverage tests.
Under the documents governing the 2015 Debt Securitization, there are two asset coverage tests applicable to the 2015 Notes. The first such test compares the amount of interest received on the portfolio loans held by the 2015 Issuer to the amount of interest payable in respect of the Class A Notes, the Class B Notes and the Class C Notes, with respect to the 2015 Issuer. To meet this first test, interest received on the portfolio loans must equal at least 200.0% of the interest payable in respect of the Class A Notes and Class B Notes, taken together, and at least 175.00% of the interest payable in respect of the Class C Notes. The second such test compares the principal amount of the portfolio loans of the applicable debt securitization to the aggregate outstanding principal amount of the Class A Notes, the Class B Notes and the Class C Notes. To meet this second test at any time, the aggregate principal amount of the portfolio loans must equal at least 144.95% of the Class A Notes and the Class B Notes, taken together, and 131.63% of the Class C Notes. If any asset coverage test with respect to the Class A Notes, the Class B Notes or Class C Notes is not met, proceeds from the portfolio of loan investments that otherwise would have been distributed to the holders of the Class C Notes and the 2015 Issuer will instead be used to redeem first the Class A Notes and then the Class B Notes, to the extent necessary to satisfy the applicable asset coverage tests on a pro forma basis after giving effect to all payments made in respect of the notes, which we refer to as a mandatory redemption, or to obtain the necessary ratings confirmation.
The value of the Class B Notes or the Class C Notes could be adversely affected by a mandatory redemption because such redemption could result in the applicable notes being redeemed at par at a time when they are trading in the secondary market at a premium to their stated principal amount and when other investments bearing the same rate of interest may be difficult or expensive to acquire. A mandatory redemption could also result in a shorter investment duration than a holder of such notes may have wanted or anticipated, which could, in turn, result in such a holder incurring breakage costs on related hedging transactions. In addition, the reinvestment period under the 2015 Debt Securitization may extend through as late as May 28, 2019, which could affect the value of the collateral securing the Class C Notes.
We may not receive cash from the 2015 Issuer.
We receive cash from the 2015 Issuer only to the extent of payments on the Class C Notes and distributions, if any, with respect to the membership interests of the 2015 Issuer as permitted under the 2015 Debt Securitization. The 2015 Issuer may only make payments on such securities to the extent permitted by the payment priority provisions of the indenture governing the Debt Securitization, which generally provide that principal payments on the Class C Notes may not be made on any payment date unless all amounts owing under the Class A Notes and Class B Notes are paid in full. If the 2015 Issuer does not meet the asset coverage tests or the interest coverage test set forth in the documents governing the 2015 Debt Securitization, cash would be diverted from the Class C Notes to first pay the Class A Notes and Class B Notes in amounts sufficient to cause such tests to be satisfied. In the event that we fail to receive cash indirectly from the 2015 Issuer, we could be unable to make such distributions in amounts sufficient to maintain our status as a RIC, or at all.
We may be required to assume liabilities of the 2015 Issuer and are indirectly liable for certain representations and warranties in connection with the 2015 Debt Securitization.
The structure of the 2015 Debt Securitization is intended to prevent, in the event of our bankruptcy, the consolidation of the 2015 Issuer with our operations. If the true sale of the assets in the 2015 Debt Securitization was not respected in the event of our insolvency, a trustee or debtor-in-possession might reclaim the assets of the 2015 Issuer for our estate. However, in doing so, we would become directly liable for all of the indebtedness then outstanding under the 2015 Debt Securitization, which would equal the full amount of debt of the 2015 Issuer reflected on our consolidated balance sheet. In addition, we cannot assure you that the recovery in the event we were consolidated with the 2015 Issuer for purposes of any bankruptcy proceeding would exceed the amount to which we would otherwise be entitled as the holder of the Class C Notes had we not been consolidated with the 2015 Issuer.
In addition, in connection with the 2015 Debt Securitization, we gave the lenders certain customary representations with respect to the legal structure of the 2015 Issuer, and the quality of the assets transferred to each entity. We remain liable for any breach of such representations for the life of the 2015 Debt Securitization.
The 2015 Issuer may issue additional 2015 Notes.
Under the terms of the 2015 Debt Securitization documents, the 2015 Issuer could issue additional 2015 Notes in any class at any time during the reinvestment period on a pro rata basis for each class of notes (but not for each sub-class) and useinvesting the net proceeds of such issuance to purchase additional portfolio loans or for another permitted use as providedan offering, and may do so in the 2015 Debt Securitization documents. Any such additional issuance, however, would require the consent of the collateral managera way with which you may not agree. Additionally, our Investment Adviser will select our investments subsequent to the 2015 Debt Securitizationclosing of an offering, and our stockholders will have no input with respect to such investment decisions. Further, other than general limitations that may be included in a future credit facility, the holders of our debt securities will generally not have veto power or a majorityvote in approving any changes to our investment or operational policies. These factors increase the uncertainty, and thus the risk, of investing in our securities. In addition, pending such investments, we will invest the Subordinated 2015 Notes. Among the other conditions that mustnet proceeds from an offering primarily in high quality, short-term debt securities, consistent with our business development company election and our election to be satisfied in connection with an additional issuance of 2015 Notes, the aggregate principal amount of all additional issuances of any class of 2015 Notes may not exceed 100% of the outstanding principal amount of such class of 2015 Notes; the 2015 Issuer must notify each rating agency of such issuance prior to the issuance date and such rating agency, if it then rates any class of 2015 Notes, must confirm in writing that no immediate withdrawal or reduction with respect to its then-current rating of any such class of 2015 Notes will occurtaxed as a result of such issuance; andRIC, at yields significantly below the terms of the 2015 Notes to be issued must be identical to the terms of previously issued 2015 Notes of the same class (except that all monies due on such additional 2015 Notes will accrue from the issue date of such notes and that the prices of such 2015 Notes do not have to be identical to those of the initial 2015 Notes). We do notreturns which we expect to cause the 2015 Issuer to issue any additional 2015 Notes at this time. The total purchase price for any additional 2015 Notes that may be issued may not always equal 100% of the par value of such 2015 Notes, depending on several factors, including fees and closing expenses.
Restructurings of investments ofachieve when our 2015 Debt Securitization may decrease their value and reduce amounts payable on the 2015 Notes.
We and FS Senior Funding Ltd. have entered into a collateral management agreement, an agreement entered into between a manager and a debt securitization vehicle or similar issuer, which sets forth the terms and conditions pursuant to which the manager provides advisory and/or management services with respect to the client’sportfolio is fully invested in securities portfolio. Under the collateral management agreement, we serve as collateral manager of the 2015 Debt Securitization. In addition, we retained our investments adviser to furnish collateral management sub-advisory services to us pursuant to a sub-collateral management agreement withmeeting our investment adviser. Our investment adviser is a registered investment adviser under the Advisers Act.
We have broad authority to direct and supervise the investment and reinvestment of the investments held by the 2015 Debt Securitization, which may include exercising or enforcing, or refraining from exercising or enforcing, any or all of the 2015 Debt Securitization’s rights in connection with the execution of amendments, waivers, modifications and other changes to the investment documentation in accordance with the collateral management agreement. During periods of economic uncertainty and recession, the incidence of amendments, waivers, modifications and restructurings of investments may increase. Such amendments, waivers, modifications and other restructurings will change the terms of the investments and in
some cases may result in the 2015 Debt Securitization holding assets not meeting its criteria for investments. This could adversely impact the coverage tests under the indenture governing the 2015 Notes. Any amendment, waiver, modification or other restructuring that reduces the 2015 Debt Securitization’s compliance with certain financial tests will make it more likely that the 2015 Debt Securitization will need to utilize cash to pay down the unpaid principal amount of the 2015 Notes to cure any breach in such test instead of making payments on the 2015 Notes. Any such use of cash would reduce distributions available and delay the timing of payments to us.
We cannot assure you that any particular restructuring strategy pursued by us or any successor collateral manager will maximize the value of or recovery on any investment. Any restructuring can fundamentally alter the nature of the related investment, and restructurings are not subject to the same underwriting standards that are employed in connection with the origination or acquisition of investments. Any restructuring could alter, reduce or delay the payment of interest or principal on any investment, which could delay the timing and reduce the amount of payments made to us. Restructurings of investments might also result in extensions of the term thereof, which could delay the timing of payments made to us.
The 2015 Debt Securitization depends on the managerial expertise available to the collateral manager and its key personnel.
The 2015 Debt Securitization’s activities are directed by us (or any successor collateral manager). We have retained the investment adviser to furnish collateral management sub-advisory services. In our capacity as holder of the 2015 Notes,objective. If we are generally not able to make decisions with respectidentify or gain access to the management, disposition or other realization of any investment, or other decisions regarding the business and affairs of the 2015 Debt Securitization. Consequently, the success of the 2015 Debt Securitization will depend, in large part, on the financial and managerial expertise of the investment adviser’s investment professionals. There cansuitable investments, our income may be no assurance that such investment professionals will continue to serve in their current positions or continue to be authorized persons of the investment adviser. Although such investment professionals will devote such time as they determine in their discretion is reasonably necessary to fulfill the collateral manager’s obligations to the 2015 Debt Securitization effectively, they will not devote all of their professional time to the affairs of the 2015 Debt Securitization.
Our ability to transfer the 2015 Notes is limited.
The notes issued pursuant to the 2015 Debt Securitization are illiquid investments and subject to extensive transfer restrictions, and no party is under any obligation to make a market for the notes. There is no market for the notes, and we may not be able to sell or otherwise transfer the 2015 Notes at their fair value, or at all, in the event that we determine to sell them. During economic downturns, notes issued in securitization transactions may experience high volatility and significant fluctuations in market value. Additionally, some potential buyers of such notes now view securitization products as an inappropriate investment, thereby reducing the number of potential buyers and/or potentially affecting liquidity in the secondary market.
Risks Relating to Our SecuritiesCommon Stock
Shares of closed-end investment companies, including business development companies, may trade at a discount to their net asset value.
Shares of closed-end investment companies, including business development companies, may trade at a discount from net asset value. This characteristic of closed-end investment companies and business development companies is separate and distinct from the risk that our net asset value per share may decline. During the last two years, shares of our common stock have regularly traded below our net asset value. We cannot predict whether our common stock will trade at, above or below net asset value.
Investing in our common stock may involve an above average degree of risk.
The investments we make in accordance with our investment objective may result in a higher amount of risk than alternative investment options and a higher risk of volatility or loss of principal. Our investments in portfolio companies involve higher levels of risk, and therefore, an investment in our shares may not be suitable for someone with lower risk tolerance.
The market price of our common stock may fluctuate significantly.
The market price and liquidity of the market for shares of our common stock may be significantly affected by numerous factors, some of which are beyond our control and may not be directly related to our operating performance. These factors include:
significant volatility in the market price and trading volume of securities of business development companies or other companies in our sector, which are not necessarily related to the operating performance of these companies;
inability to obtain any exemptive relief that may be required by us from the SEC;
changes in regulatory policies, accounting pronouncements or tax guidelines, particularly with respect to RICs and business development companies;
loss of our business development company or RIC status;
changes in earnings or variations in operating results;
increases in expenses associated with defense of litigation and responding to SEC inquiries;
changes in the value of our portfolio of investments;
any shortfall in revenue or net income or any increase in losses from levels expected by investors or securities analysts;
departure of our investment adviser’sInvestment Adviser’s key personnel; and
general economic trends and other external factors.
Sales of substantial amounts of our common stock in the public market may have an adverse effect on the market price of our common stock.
Sales of substantial amounts of our common stock, or the availability of such common stock for sale, could adversely affect the prevailing market prices for our common stock. If this occurs and continues for a sustained period of time, it could impair our ability to raise additional capital through the sale of securities should we desire to do so.
Certain provisions of our amended and restated certificate of incorporation and our bylaws as well as the Delaware General Corporation Law could deter takeover attempts and have an adverse impact on the price of our common stock.
Our amended and restated certificate of incorporation and our bylaws as well as the Delaware General Corporation Law contain provisions that may have the effect of discouraging a third party from making an acquisition proposal for us. These anti-takeover provisions may inhibit a change in control in circumstances that could give the holders of our common stock the opportunity to realize a premium over the market price for our common stock.
Stockholders may incur dilution if we issue securities to subscribe to, convert to or purchase shares of our common stock.
The 1940 Act prohibits us from selling shares of our common stock at a price below the current net asset value per share of such stock with certain exceptions. One such exception is prior stockholder approval of issuances of securities to subscribe to, convert to or purchase shares of our common stock even if the subscription, conversion or purchase price per share of our common stock is below the net asset value per share of our common stock at the time of any such subscription, conversion or purchase. At our 2011 annual meeting of stockholders, our stockholders approved a proposal to authorize us to issue securities to subscribe to, convert to, or purchase shares of our common stock in one or more offerings, including under such circumstance. Such authorization has no expiration. Any decision to sell securities to subscribe to, convert to, or purchase shares of our common stock will be subject to the determination by our board of directors that such issuance is in our and our stockholders’ best interests. If we issue securities to subscribe to, convert to or purchase shares of common stock, the exercise or conversion of such securities would increase the number of outstanding shares of our common stock. Any such exercise or conversion would be dilutive on the voting power of existing stockholders, and could be dilutive with regard to distributions and our net asset value, and other economic aspects of the common stock.
Because the number of shares of common stock that could be so issued and the timing of any issuance is not currently known, the actual dilutive effect cannot be predicted; however, the table below illustrates the impact on the net asset value per common share of a business development company that would be experienced upon the exercise of a subscription right to acquire shares of common stock of the business development company.
Example of Impact of Exercise of Subscription Right to Acquire Common Stock on Net Asset Value Per Share
The example assumes that the business development company has 1,000,000 shares of common stock outstanding, $15,000,000 in total assets and $5,000,000 in total liabilities at the time of the exercise of the subscription right. As a result, the net asset value and net asset value per common share of the business development company are $10,000,000 and $10.00, respectively.
Further, the example assumes that the subscription right permits the holder thereof to acquire 250,000 common shares under the following three different scenarios: (i) with an exercise price equal to a 10% premium to the business development company’s net asset value per share at the time of exercise, or $11.00 per share, (ii) with an exercise price equal to the business development company’s net asset value per share at the time of exercise, or $10.00 per share, and (iii) with an exercise price equal to a 10% discount to the business development company’s net asset value per share at the time of exercise, or $9.00 per
|
| | | | | | | | |
| Subscription Rights Exercise Price | | Net Asset Value Per Share Prior To Exercise | | Net Asset Value Per Share After Exercise |
| 10% premium to net asset value per common share | | $ | 10.00 |
| | $ | 10.20 |
|
| Net asset value per common share | | $ | 10.00 |
| | $ | 10.00 |
|
| 10% discount to net asset value per common share | | $ | 10.00 |
| | $ | 9.80 |
|
Although have we chosen to demonstrate the impact on the net asset value per common share of a business development company that would be experienced by existing stockholders of the business development company upon the exercise of a subscription right to acquire shares of common stock of the business development company, the results noted above would be similar in connection with the exercise or conversion of other securities exercisable or convertible into shares of the business development company’s common stock. In addition, the example does not take into account the impact of other securities that may be issued in connection with the issuance of exercisable or convertible securities (e.g., the issuance of shares of common stock in conjunction with the issuance of subscription rights to acquire shares of common stock).
Risks Related to Our Debt Securitization
We are subject to risks associated with the 2015 Debt Securitization.
As a result of the 2015 Debt Securitization, we are subject to a variety of risks, including those set forth below. We use the term “debt securitization” to describe a form of secured borrowing under which an operating company (sometimes referred to as an “originator” or “sponsor”) acquires or originates mortgages, receivables, loans or other assets that earn income, whether on a one-time or recurring basis (collectively, “income producing assets”), and borrows money on a non-recourse basis against a legally separate pool of loans or other income producing assets. In a typical debt securitization, the originator transfers the loans or income producing assets to a single-purpose, bankruptcy-remote subsidiary (also referred to as a “special purpose entity”), which is established solely for the purpose of holding loans and income producing assets and issuing debt secured by these income producing assets. The special purpose entity completes the borrowing through the issuance of notes secured by the loans or other assets. The special purpose entity may issue the notes in the capital markets to a variety of investors, including banks, non-bank financial institutions and other investors. In the 2015 Debt Securitization, institutional investors purchased $222.6 million long-term secured notes, or the 2015 Notes, issued by FS Senior Funding Ltd., our wholly-owned subsidiary, or the 2015 Issuer, in a private placement.
We are subject to certain risks as a result of our interests in the junior notes and membership interests of the 2015 Issuer.
Under the terms of the master transfer agreement governing the 2015 Debt Securitization, we sold to the 2015 Issuer all of our ownership interest in certain of our portfolio loans and participations for the purchase price and other consideration set forth in such master transfer agreement. Following this transfer, the 2015 Issuer held all of the ownership interest in such portfolio loans and participations. As a result of the 2015 Debt Securitization and as of September 30, 2015, we held the Class C Senior Secured Notes, or the Class C Notes, as well as all of the subordinated notes, or the Subordinated 2015 Notes, of the 2015 Issuer. As a result, we consolidate the financial statements of the 2015 Issuer, as well as our other subsidiaries, in our Consolidated Financial Statements. Because the 2015 Issuer is disregarded as an entity separate from its owner for U.S. federal income tax purposes, the sale or contribution by us to the 2015 Issuer did not constitute a taxable event for U.S. federal income tax purposes. If the U.S. Internal Revenue Service were to take a contrary position, there could be a material adverse effect on our business, financial condition, results of operations or cash flows.
The Class C Notes are subordinated obligations of the 2015 Issuer.
The Class C Notes are the most junior class of rated notes issued by the 2015 Issuer, are subordinated in priority of payment to the Class A-T Senior Secured Floating Rate Notes, Class A-R Senior Secured Revolving Floating Rate Notes, Class A-S Senior Secured Floating Rate Notes, or collectively, the Class A Notes, and the Class B Senior Secured Floating Rate Notes, or the Class B Notes, and, together with the Class A Notes, the Senior 2015 Notes, and are subject to certain payment restrictions set forth in the indenture governing the 2015 Debt Securitization. Therefore, we issueonly receive cash distributions on the Class C Notes if the 2015 Issuer has made all cash interest payments on all the Senior 2015 Notes it has issued. Consequently, to the extent that the value of the 2015 Issuer’s portfolio of loan investments has been reduced as a result of conditions in the credit markets, or as a result of defaulted loans or individual fund assets, the value of the Class C Notes at their redemption will be reduced because the Class C Notes are junior to the Senior 2015 Notes and will bear losses of the 2015 Issuer’s portfolio of loan investments prior to the Senior 2015 Notes.
The 2015 Issuer, as holder of the Subordinated 2015 Notes, is the residual claimant on funds, if any, remaining after holders of all classes of 2015 Notes have been paid in full on each payment date or upon maturity of such notes under the 2015 Debt Securitization documents. The Subordinated 2015 Notes in the 2015 Issuer represent all of the residual interest in the 2015 Issuer, and, as the holder of the Subordinated 2015 Notes, we may receive distributions, if any, only to the extent that the 2015 Issuer makes distributions out of funds remaining after holders of all classes of 2015 Notes have been paid in full on each payment date any amounts due and owing on such payment date or upon maturity of such 2015 Notes.
The interests of holders of the senior classes of securities issued by the 2015 Issuer may not be aligned with our interests.
The Class A Notes are the debt obligations ranking senior in right of payment to other securities issued by the net asset value2015 Issuer in the 2015 Debt Securitization. As such, there are circumstances in which the interests of holders of the Class A Notes may not be aligned with the interests of holders of the other classes of notes issued by the 2015 Issuer. For example, under the terms of the Class A Notes, holders of the Class A Notes have the right to receive payments of principal and interest prior to holders of the Class B Notes, the Class C Notes and the 2015 Issuer and the holders of the Class B Notes have the right to receive payments of the principal and interest prior to the holders of the Class C Notes.
For as long as the Class A Notes remain outstanding, holders of the Class A Notes comprise the most senior class of notes outstanding of the 2015 Issuer, or the Controlling Class, under the 2015 Debt Securitization. If the Class A Notes are paid in full, the Class B Notes would comprise the Controlling Class under the 2015 Debt Securitization. Holders of the Controlling Class under the 2015 Debt Securitization have the right to act in certain circumstances with respect to the portfolio loans in ways that may benefit their interests but not the interests of holders of more junior classes of notes and Subordinated 2015 Notes, including by exercising remedies under the indenture in the 2015 Debt Securitization.
If an event of default has occurred and acceleration occurs in accordance with the terms of the indenture governing the 2015 Debt Securitization, the Controlling Class, as the most senior class of notes then outstanding in the 2015 Debt Securitization will be paid in full before any further payment or distribution on the more junior classes of notes and Subordinated 2015 Notes. In addition, if an event of default under the 2015 Debt Securitization occurs, holders of a majority of the Controlling Class of the 2015 Debt Securitization may be entitled to determine the remedies to be exercised under the indenture, subject to the terms of such indenture. For example, upon the occurrence of an event of default with respect to the notes issued by the 2015 Issuer, the trustee or holders of a majority of the Controlling Class may declare the principal, together with any accrued interest, of all the notes of such class and any junior classes to be immediately due and payable. This would have the effect of accelerating the principal on such notes, triggering a repayment obligation on the part of the 2015 Issuer. If at such time the portfolio loans were not performing well, the 2015 Issuer may not have sufficient proceeds available to enable the trustee under the indenture to repay the obligations of holders of the 2015 Notes or the Subordinated 2015 Notes.
Remedies pursued by the Controlling Class could be adverse to the interests of the holders of the 2015 Notes that are subordinated to the Controlling Class, and the Controlling Class will have no obligation to consider any possible adverse effect on such other interests. Thus, we cannot assure you that any remedies pursued by the Controlling Class will be in the best interests of the 2015 Issuer or us or that the 2015 Issuer or we will receive any payments or distributions upon an acceleration of the notes. In a liquidation under the 2015 Debt Securitization, the Class C Notes will be subordinated to payment of the Class A Notes and Class B Notes and may not be paid in full to the extent funds remaining after payment of the Class A Notes and Class B Notes are insufficient. In addition, under the 2015 Debt Securitization, after the Class A Notes and Class B Notes are paid in full, the holder of the Class C Notes will be the only remaining noteholder and may amend the applicable indenture to, among other things, direct the assignment of any remaining assets to other wholly-owned subsidiaries for a price less than the fair market value of such assets with the difference in price to be considered an equity contribution to such subsidiaries. Any failure of the 2015 Issuer to make distributions on the notes we indirectly or directly hold, whether as a result of an event of default, liquidation or otherwise, could have a material adverse effect on our common stockbusiness, financial condition, results of operations and cash flows and may result in an inability of us to make distributions sufficient to maintain our status as a RIC.
The 2015 Issuer may fail to meet certain asset coverage tests.
Under the documents governing the 2015 Debt Securitization, there are two asset coverage tests applicable to the 2015 Notes. The first such test compares the amount of interest received on the portfolio loans held by the 2015 Issuer to the amount of interest payable in respect of the Class A Notes, the Class B Notes and the Class C Notes, with respect to the 2015 Issuer. To meet this first test, interest received on the portfolio loans must equal at least 200.0% of the interest payable in respect of the Class A Notes and Class B Notes, taken together, and at least 175.0% of the interest payable in respect of the Class C Notes. The second such test compares the principal amount of the portfolio loans of the applicable debt securitization to the aggregate outstanding principal amount of the Class A Notes, the Class B Notes and the Class C Notes. To meet this second test at any time, the aggregate principal amount of the portfolio loans must equal at least 144.95% of the Class A Notes and the Class B Notes, taken together, and 131.63% of the Class C Notes. If any asset coverage test with respect to the Class A Notes, the Class B Notes or Class C Notes is not met, proceeds from the portfolio of loan investments that otherwise would have been distributed to the holders of the Class C Notes and the 2015 Issuer will instead be used to redeem first the Class A Notes and then the Class B Notes, to the extent necessary to satisfy the applicable asset coverage tests on a pro forma basis after giving effect to all payments made in respect of the notes, which we refer to as a mandatory redemption, or to obtain the necessary ratings confirmation.
The value of the Class B Notes or the Class C Notes could be adversely affected by a mandatory redemption because such redemption could result in the applicable notes being redeemed at par at a time when they are trading in the secondary market at a premium to their stated principal amount and when other investments bearing the same rate of interest may be difficult or expensive to acquire. A mandatory redemption could also result in a shorter investment duration than a holder of such notes may have wanted or anticipated, which could, in turn, result in such a holder incurring breakage costs on related hedging transactions. In addition, the reinvestment period under the 2015 Debt Securitization may extend through as late as May 28, 2019, which could affect the value of the collateral securing the Class C Notes.
We may not receive cash from the 2015 Issuer.
We receive cash from the 2015 Issuer only to the extent of payments on the Class C Notes and distributions, if any, with respect to the membership interests of the 2015 Issuer as permitted under the 2015 Debt Securitization. The 2015 Issuer may only make payments on such securities to the extent permitted by the payment priority provisions of the indenture governing the 2015 Debt Securitization, which generally provide that principal payments on the Class C Notes may not be made on any payment date unless all amounts owing under the Class A Notes and Class B Notes are paid in full. If the 2015 Issuer does not meet the asset coverage tests or the interest coverage test set forth in the documents governing the 2015 Debt Securitization, cash would be diverted from the Class C Notes to first pay the Class A Notes and Class B Notes in amounts sufficient to cause such tests to be satisfied. In the event that we fail to receive cash indirectly from the 2015 Issuer, we could be unable to make such distributions in amounts sufficient to maintain our status as a RIC, or at all.
We may be required to assume liabilities of the 2015 Issuer and are indirectly liable for certain representations and warranties in connection with the 2015 Debt Securitization.
The structure of the 2015 Debt Securitization is intended to prevent, in the event of our bankruptcy, the consolidation of the 2015 Issuer with our operations. If the true sale of the assets in the 2015 Debt Securitization was not respected in the event of our insolvency, a trustee or debtor-in-possession might reclaim the assets of the 2015 Issuer for our estate. However, in doing so, we would become directly liable for all of the indebtedness then outstanding under the 2015 Debt Securitization, which would equal the full amount of debt of the 2015 Issuer reflected on our consolidated balance sheet. In addition, we cannot assure you that the recovery in the event we were consolidated with the 2015 Issuer for purposes of any bankruptcy proceeding would exceed the amount to which we would otherwise be entitled as the holder of the Class C Notes had we not been consolidated with the 2015 Issuer.
In addition, in connection with the 2015 Debt Securitization, we gave the lenders certain customary representations with respect to the legal structure of the 2015 Issuer, and the quality of the assets transferred to each entity. We remain liable for any breach of such representations for the life of the 2015 Debt Securitization.
The 2015 Issuer may issue additional 2015 Notes.
Under the terms of the 2015 Debt Securitization documents, the 2015 Issuer could issue additional 2015 Notes in any class at any time during the reinvestment period on a pro rata basis for each class of notes (but not for each sub-class) and use the net proceeds of such issuance to purchase additional portfolio loans or for another permitted use as provided in the 2015 Debt Securitization documents. Any such additional issuance, however, would require the consent of the collateral manager to the 2015 Debt Securitization and the holders of a majority of the Subordinated 2015 Notes. Among the other conditions that must be satisfied in connection with an additional issuance of 2015 Notes, the aggregate principal amount of all additional issuances of any class of 2015 Notes may not exceed 100% of the outstanding principal amount of such class of 2015 Notes; the 2015 Issuer must notify each rating agency of such issuance prior to the issuance date and such rating agency, if it then rates any class of 2015 Notes, must confirm in writing that no immediate withdrawal or reduction with respect to its then-current rating of any such class of 2015 Notes will occur as a result of such issuance; and the terms of the 2015 Notes to be issued must be identical to the terms of previously issued 2015 Notes of the same class (except that all monies due on such additional 2015 Notes will accrue from the issue date of such notes and that the prices of such 2015 Notes do not have to be identical to those of the initial 2015 Notes). We do not expect to cause the 2015 Issuer to issue any additional 2015 Notes at this time. The total purchase price for any additional 2015 Notes that may be issued may not always equal 100% of the par value of such 2015 Notes, depending on several factors, including fees and closing expenses.
Restructurings of investments of our 2015 Debt Securitization may decrease their value and reduce amounts payable on the 2015 Notes.
We and FS Senior Funding Ltd. have entered into a collateral management agreement, an agreement entered into between a manager and a debt securitization vehicle or similar issuer, which sets forth the terms and conditions pursuant to which the manager provides advisory and/or management services with respect to the client’s securities portfolio. Under the collateral management agreement, we serve as collateral manager of the 2015 Debt Securitization. We have retained a sub-collateral manager, which, as of October 17, 2017, was the Investment Adviser and, prior to October 17, 2017, was the Former Adviser, to furnish collateral management sub-advisory services to us pursuant to a sub-collateral management agreement with our investment adviser.
In our capacity as the collateral manager, we have broad authority to direct and supervise the investment and reinvestment of the investments held by the 2015 Debt Securitization, which may include exercising or enforcing, or refraining from exercising or enforcing, any or all of the 2015 Debt Securitization’s rights in connection with the execution of amendments, waivers, modifications and other changes to the investment documentation in accordance with the collateral management agreement. During periods of economic uncertainty and recession, the incidence of amendments, waivers, modifications and restructurings of investments may increase. Such amendments, waivers, modifications and other restructurings will change the terms of the investments and in some cases may result in the 2015 Debt Securitization holding assets not meeting its criteria for investments. This could adversely impact the coverage tests under the indenture governing the 2015 Notes. Any amendment, waiver, modification or other restructuring that reduces the 2015 Debt Securitization’s compliance with certain financial tests will make it more volatile.likely that the 2015 Debt Securitization will need to utilize cash to pay down the unpaid principal amount of the 2015 Notes to cure any breach in such test instead of making payments on the 2015 Notes. Any such use of cash would reduce distributions available and delay the timing of payments to us.
We cannot assure you that the issuance of debt securities would result in a higher yieldany particular restructuring strategy pursued by us or rate of return to the holders of our common stock. The issuance of debt securities would likely cause the net asset value and market value of our common stock to become more volatile. If the interest rate on the debt securities were to approach the net rate of return on our investment portfolio, the benefit of leverage to the holders of our common stock would be reduced. If the interest rate on the debt securities, were to exceed the net rate of return on our portfolio, the use of leverage would result in a lower rate of return to the holders of common stock than if we had not issued the debt securities. Any decline in the net asset value of our investment would be borne entirely by the holders of our common stock. Therefore, if the market value of our portfolio were to decline, the leverage would result in a greater decrease in net asset value to the holders of our common stock than if we were not leveraged through the issuance of debt securities. This decline in net asset value would also tend to cause a greater decline in the market price for our common stock.
There is also a risk that, in the event of a sharp decline inany successor collateral manager will maximize the value of our net assets, we would be in danger of failing to maintain required asset coverage ratios which may be required byor recovery on any investment. Any restructuring can fundamentally alter the debt securities or of a downgrade in the ratingsnature of the debt securitiesrelated investment, and restructurings are not subject to the same underwriting standards that are employed in connection with the origination or our currentacquisition of investments. Any restructuring could alter, reduce or delay the payment of interest or principal on any investment, incomewhich could delay the timing and reduce the amount of payments made to us. Restructurings of investments might not be sufficientalso result in extensions of the term thereof, which could delay the timing of payments made to meet the distribution requirementsus.
The 2015 Debt Securitization depends on the interest paymentsmanagerial expertise and key personnel available to the collateral manager.
The 2015 Debt Securitization’s activities are directed by us (or any successor collateral manager). As of October 17, 2017, we retained the Investment Adviser to furnish collateral management sub-advisory services. In our capacity as holder of the 2015 Notes, we are generally not able to make decisions with respect to the management, disposition or other realization of any investment, or other decisions regarding the business and affairs of the 2015 Debt Securitization. Consequently, the success of the 2015 Debt Securitization will depend, in large part, on the debt securities. In orderfinancial and managerial expertise of the investment professionals available to counteractthe sub-collateral manager, which, as of October 17, 2017, was the Investment Adviser. There can be no assurance that such an event, we might needinvestment professionals will continue to liquidate investmentsserve in ordertheir current positions or continue to fund redemptionbe authorized persons of some orthe Investment Adviser. Although such investment professionals will devote such time as they determine in their discretion is reasonably necessary to fulfill the obligations under the collateral management sub-advisory services agreement to the 2015 Debt Securitization effectively, they will not devote all of the debt securities. In addition, we would pay (and the holders of our common stock would bear) all costs and expenses relatingtheir professional time to the issuance and ongoing maintenanceaffairs of the debt securities. Holders of debt securities may have different interests than holders of common stock and may at times have disproportionate influence over our affairs.
The trading market or market value of our debt securities or any convertible debt securities, if issued to the public, may be volatile.
Our debt securities or any convertible debt securities, if issued to the public, may or may not have an established trading market. We cannot assure investors that a trading market for our debt securities or any convertible debt securities, if issued to the public, would develop or be maintained if developed. In addition to our creditworthiness, many factors may materially adversely affect the trading market for, and market value of, our publicly issued debt securities or any convertible debt securities, if issued to the public. These factors would likely include, but are not limited to, the following:
•the time remaining to the maturity of these debt securities;
•the outstanding principal amount of debt securities with terms identical to these debt securities;
•the general economic environment;
•the supply of debt securities trading in the secondary market, if any;
•the redemption, repayment or convertible features, if any, of these debt securities;
•the level, direction and volatility of market interest rates generally; and
•market rates of interest higher or lower than rates borne by the debt securities.
There also may be a limited number of buyers for our debt securities, if issued to the public. This too may materially adversely affect the market value of such debt securities or the trading market for such debt securities. Our debt securities may include convertible features that cause them to more closely bear risks associated with an investment in our common stock.2015 Debt Securitization.
Terms relatingOur ability to redemption may materially adversely affecttransfer the return on any debt securities.2015 Notes is limited.
If we issue any debt securities or any convertible debt securities thatThe notes issued pursuant to the 2015 Debt Securitization are redeemable at our option, we may choose to redeem the debt securities at times when prevailing interest rates are lower than the interest rate paid on the debt securities. In addition, if the debt securities areilliquid investments and subject to mandatory redemption,extensive transfer restrictions, and no party is under any obligation to make a market for the notes. There is no market for the notes, and we may be required to redeem the debt securities at times when prevailing interest rates are lower than the interest rate paid on the debt securities. In this circumstance, a holder of our debt securities may not be able to reinvestsell or otherwise transfer the redemption proceeds2015 Notes at their fair value, or at all, in a comparable security at an effective interest rate asthe event that we determine to sell them. During economic downturns, notes issued in securitization transactions may experience high as the debt securities being redeemed.
The issuance of warrants or convertible debt that are exchangeable for our common stock, will cause your interestvolatility and significant fluctuations in us to be diluted as a result of any such warrants or convertible debt offering.
Stockholders who do not fully exercise warrants or convertible debt issued to them in any offering of warrants or convertible debt to purchase our common stock should expect that they will, at the completion of the offering, own a smaller proportional interest in us than would otherwise be the case if they fully exercised their warrants or convertible debt. We cannot state precisely the amount of any such dilution in share ownership because we do not know what proportion of the common stock would be purchased as a result of any such offering.
In addition, if the warrant price or convertible debt price is less than our net asset value per share of common stock at the timemarket value. Additionally, some potential buyers of such offering, then our stockholders would experiencenotes now view securitization products as an immediate dilutioninappropriate investment, thereby reducing the number of potential buyers and/or potentially affecting liquidity in the aggregate net asset value of their shares as a result of the offering. The amount of any such decrease in net asset value is not predictable because it is not known at this time what the warrant price, convertible debt price or net asset value per share will be on the expiration date of such offering or what proportion of our common stock will be purchased as a result of any such offering. However, our Board of Directors will make a good faith determination that any offering of warrants or convertible debt would result in a net benefit to existing stockholders.secondary market.
Item 1B. Unresolved Staff Comments
None.
Item 2. Properties
We do not own any real estate or other physical properties material to our operations. Our administrative and principal executive offices are located at 333 South Grand Avenue, 28th Floor, Los Angeles, CA 90071. We utilizebelieve that our office space that is leased by our administrator from an affiliate controlled by the chief executive officer of our investment adviserfacilities are suitable and administrator, Mr. Tannenbaum. See “Material Conflicts of Interest.” Pursuant to an administration agreement with our administrator, we pay FSC CT an allocable portion of the rent at market ratesadequate for our principal executive office at 777 West Putnam Avenue, 3rd Floor, Greenwich, CT 06830. Such reimbursementbusiness as it is at cost with no profit to, or markup by, FSC CT. We also utilize additional office space that is leased by our affiliate at 311 South Wacker Drive, Suite 3380, Chicago, IL 60606 and 309 23rd Street, Suite 200A, Miami Beach, FL 33139. We may from time to time, through our affiliates, lease satellite office space elsewhere, but these leases are generally not material to our operations.presently conducted.
Item 3. Legal Proceedings
Although we may, from time to time, be involved in litigation arising out of our operations in the normal course of business or otherwise, we are currently not a party to any pending material legal proceedings except as described below.
SEC Examination and Investigation
On March 23, 2016, the Division of Enforcement of the SEC sent document subpoenas and document-preservationdocument preservation notices to us, FSAM, FSCO GP LLC - General Partner of Fifth Street Opportunities Fund, L.P., or FSOF, and FSC.OCSL. The subpoenas sought production of documents relating to a variety of issues principally related to the activities of our Former Adviser, including those raised in an ordinary-course examination of Fifth Street Managementthe Former Adviser by the SEC’s Office of Compliance Inspections and Examinations that began in October 2015, and in FSCthe previously disclosed OCSL and FSAM securities class actions and FSC derivative actions.other previously disclosed litigation. The subpoenas were issued pursuant to a formal order of private investigation captioned In the Matter of the Fifth Street Group of Companies, No. HO-12925, dated March 23, 2016, which addresses (among other things) (i) the valuation of our portfolio companies and investments, (ii) the expenses allocated or charged to us and FSC,OCSL, (iii) FSOF’s trading in the securities of publicly traded business-developmentbusiness development companies, (iv) statements to theour board of directors, other representatives of pooled investment vehicles, investors, or prospective investors concerning the fair value of our portfolio companies or investments as well as expenses allocated or charged to us and FSC,OCSL, (v) various issues relating to adoption and implementation of policies and procedures under the Advisers Act, (vi) statements and/or potential omissions in the entities’ SEC filings, (vii) the entities’ books, records, and accounts and whether they fairly and accurately reflected the entities’ transactions and dispositions of assets, and (viii) several other issues relating to corporate books and records. The formal order cites various provisions of the Securities Act, the Exchange Act, and the Advisers Act, as well as rules promulgated under those acts,Acts, as the bases of the investigation. The subpoenaed Fifth Street entitiesWe are
cooperating with the Division of Enforcement investigation, have produced requested documents, and have been communicating with Division of Enforcement personnel. Our Investment Adviser is not subject to these subpoenas.
Item 4. Mine Safety Disclosures
Not applicable.
PART II
Item 5. Market for Registrant’s Common Equity, Related Stockholder Matters and Issuer Purchases of Equity Securities
Price Range of Common Stock
Our common stock currently trades on the NASDAQ Global Select Market under the symbol “OCSI.” Through October 17, 2017, our common stock traded under the symbol “FSFR.” The following table sets forth, for each fiscal quarter during the two most recently completed fiscal years, the range of high and low sales prices of our common stock as reported on the NASDAQ Global Select Market:
| | | | | High | | Low | | High | | Low |
| Fiscal year ended September 30, 2017 | | | | | |
| First quarter | | | $ | 9.53 |
| | $ | 8.30 |
|
| Second quarter | | | $ | 10.37 |
| | $ | 8.50 |
|
| Third quarter | | | $ | 8.88 |
| | $ | 7.30 |
|
| Fourth quarter | | | $ | 9.09 |
| | $ | 7.89 |
|
| Fiscal year ended September 30, 2016 | | | | | | | | |
| First quarter | | $ | 9.10 |
| | $ | 7.34 |
| | $ | 9.10 |
| | $ | 7.34 |
|
| Second quarter | | $ | 8.68 |
| | $ | 6.53 |
| | $ | 8.68 |
| | $ | 6.53 |
|
| Third quarter | | $ | 8.35 |
| | $ | 7.25 |
| | $ | 8.35 |
| | $ | 7.25 |
|
| Fourth quarter | | $ | 8.99 |
| | $ | 7.94 |
| | $ | 8.99 |
| | $ | 7.94 |
|
| Fiscal year ended September 30, 2015 | | | | | |
| First quarter | | $ | 11.75 |
| | $ | 9.77 |
| |
| Second quarter | | $ | 11.02 |
| | $ | 10.21 |
| |
| Third quarter | | $ | 10.94 |
| | $ | 9.22 |
| |
| Fourth quarter | | $ | 9.40 |
| | $ | 8.51 |
| |
The last reported price for our common stock on December 12, 20167, 2017 was $8.89$8.32 per share. As of December 12, 2016,7, 2017, we had five stockholders of record, which did not include stockholders for whom shares are held in nominee or “street” name.
Sales of Unregistered Securities
We did not engage in any sales of unregistered securities during the fiscal year ended September 30, 2016.2017.
Distributions
Our distributions, if any, are determined by our Board of Directors.
In addition, we have elected to be treated for U.S. federal income tax purposes as a RIC under Subchapter M of the Code. As long as we continue to qualify as a RIC, we will not be subject to tax on our investment company taxable income or realized net capital gains, to the extent that such taxable income or gains are distributed as dividends for U.S. federal income tax purposes, or deemed to be distributed, to our stockholders on a timely basis.
To maintain RIC tax treatment, we must, among other things, distribute dividends to our stockholders each taxable year of an amount generally, with respect to each taxable year, at least equal to 90% of our investment company net taxable income (i.e., the sum of our net ordinary income plus our realized net short-term capital gains in excess of realized net long-term capital losses determined without regard to any deduction for dividends paid). Depending on the level of taxable income earned in a taxtaxable year, we may choose to carry forward taxable income in excess of current year distributions into the next taxable year and incur a 4% U.S. federal excise tax on such income. Any such carryover taxable income must be distributed through a dividend declared prior to filing the final tax return related to the taxable year in which such taxable income was generated. We may, in the future, make actual distributions to our stockholders of our net capital gains. We can offer no assurance that we will achieve results that will permit the payment of any cash distributions and we may be prohibited from making distributions if doing so causes us to fail to maintain the asset coverage ratios stipulated by the 1940 Act or if distributions are limited by the terms of any of our borrowings. See “Item 1. Business —“Business - Taxation as a Regulated Investment Company.Company” and “Management’s Discussion and Analysis of Financial Condition and Results of Operations-Regulated Investment Company Status and Distributions.”
We have adopted an “opt out” dividend reinvestment plan, or DRIP, for our common stockholders. As a result, if we make a cash distribution, then stockholders’ cash distributions will be automatically reinvested in additional shares of our common stock, unless they specifically “opt out” of the dividend reinvestment planDRIP so as to receive cash distributions.
In accordance with certain applicable Treasury regulations and related administrative authorities issued by the IRS, a RIC may treat a distribution of its own stock as fulfilling its RIC distribution requirements if each stockholder may elect to receive
his or her entire distribution in either cash or stock of the RIC, subject to certain limitationsrequirements, including those relatedrelating to the amount of cash to be distributed to all stockholders in connection with such distributions. If too many stockholders elect to receive cash (which generally may not be less than 20% of the value of the overall distribution), each stockholder electing to receive cash must receive a pro rata amount of cash (with the balance of the distribution paid in stock). If these and certain other requirements are met, for U.S federal income tax purposes, the amount of
the dividend paid in stock will be equal to the amount of cash that could have been received instead of stock. We have no current intention of paying dividends in shares of our stock in accordance with these Treasury regulations or private letter rulings.administrative authorities.
The following table reflects the distributions per share, including any return of capital, that our Board of Directors has declared, including shares issued under our DRIP on our common stock since October 1, 2014:2015:
| | | Frequency | | Date Declared | | Record Date | | Payment Date | | Amount
per Share | | Total Distribution | | DRIP Shares Issued (1) | | DRIP Shares Value | | Date Declared | | Record Date | | Payment Date | | Amount
per Share | | Total Distribution | | DRIP Shares Issued (1) | | DRIP Shares Value |
| Quarterly | | September 9, 2014 | | December 15, 2014 | | January 15, 2015 | | 0.30 | | 8,840,030 | | 23,183 | | 242,678 | |
| Quarterly | | November 20, 2014 | | April 2, 2015 | | April 15, 2015 | | 0.30 | | 8,840,030 | | 28,296 | | 307,794 | |
| Monthly | | February 4, 2015 | | May 1, 2015 | | May 15, 2015 | | 0.10 | | 2,946,677 | | 5,045 | | 50,830 | | July 10, 2015 | | October 6, 2015 | | October 15, 2015 | | 0.075 | | 2,210,008 | | 12,080 | | 108,563 |
| Monthly | | February 4, 2015 | | June 1, 2015 | | June 15, 2015 | | 0.10 | | 2,946,677 | | 5,296 | | 53,237 | | July 10, 2015 | | November 5, 2015 | | November 16, 2015 | | 0.075 | | 2,210,008 | | 13,269 | | 116,730 |
| Monthly | | February 4, 2015 | | July 1, 2015 | | July 15, 2015 | | 0.10 | | 2,946,677 | | 14,572 | | 137,463 | | November 30, 2015 | | December 11, 2015 | | December 22, 2015 | | 0.075 | | 2,210,007 | | 11,103 | | 94,563 |
| Monthly | | February 4, 2015 | | August 3, 2015 | | August 17, 2015 | | 0.10 | | 2,946,677 | | 6,174 | | 56,388 | | November 30, 2015 | | January 4, 2016 | | January 15, 2016 | | 0.075 | | 2,210,007 | | 8,627 | | 61,079 |
| Monthly | | July 10, 2015 | | September 4, 2015 | | September 15, 2015 | | 0.075 | | 2,210,007 | | 4,575 | | 41,121 | | November 30, 2015 | | February 5, 2016 | | February 16, 2016 | | 0.075 | | 2,210,008 | | 4,542 | | 32,923 |
| Monthly | | July 10, 2015 | | October 6, 2015 | | October 15, 2015 | | 0.075 | | 2,210,008 | | 12,080 | | 108,563 | | February 8, 2016 | | March 15, 2016 | | March 31, 2016 | | 0.075 | | 2,210,008 | | 4,383 | | 34,578 |
| Monthly | | July 10, 2015 | | November 5, 2015 | | November 16, 2015 | | 0.075 | | 2,210,008 | | 13,269 | | 116,730 | | February 8, 2016 | | April 15, 2016 | | April 29, 2016 | | 0.075 | | 2,210,008 | | 4,452 | | 35,033 |
| Monthly | | November 30, 2015 | | December 11, 2015 | | December 22, 2015 | | 0.075 | | 2,210,007 | | 11,103 | | 94,563 | | February 8, 2016 | | May 13, 2016 | | May 31, 2016 | | 0.075 | | 2,210,007 | | 4,256 | | 33,494 |
| Monthly | | November 30, 2015 | | January 4, 2016 | | January 15, 2016 | | 0.075 | | 2,210,007 | | 8,627 | | 61,079 | | May 6, 2016 | | June 15, 2016 | | June 30, 2016 | | 0.075 | | 2,210,007 | | 5,822 | | 46,881 |
| Monthly | | November 30, 2015 | | February 5, 2016 | | February 16, 2016 | | 0.075 | | 2,210,008 | | 4,542 | | 32,923 | | May 6, 2016 | | July 15, 2016 | | July 29, 2016 | | 0.075 | | 2,210,008 | | 3,627 | | 30,745 |
| Monthly | | February 8, 2016 | | March 15, 2016 | | March 31, 2016 | | 0.075 | | 2,210,008 | | 4,383 | | 34,578 | | May 6, 2016 | | August 15, 2016 | | August 31, 2016 | | 0.075 | | 2,210,008 | | 3,260 | | 29,002 |
| Monthly | | February 8, 2016 | | April 15, 2016 | | April 29, 2016 | | 0.075 | | 2,210,008 | | 4,452 | | 35,033 | | August 4, 2016 | | September 15, 2016 | | September 30, 2016 | | 0.075 | | 2,210,008 | | 3,078 | | 26,811 |
| Monthly | | February 8, 2016 | | May 13, 2016 | | May 31, 2016 | | 0.075 | | 2,210,007 | | 4,256 | | 33,494 | | August 4, 2016 | | October 14, 2016 | | October 31, 2016 | | 0.075 | | 2,210,008 | | 3,146 | | 26,985 |
| Monthly | | May 6, 2016 | | June 15, 2016 | | June 30, 2016 | | 0.075 | | 2,210,007 | | 5,822 | | 46,881 | | August 4, 2016 | | November 15, 2016 | | November 30, 2016 | | 0.075 | | 2,210,008 | | 2,986 | | 26,909 |
| Monthly | | May 6, 2016 | | July 15, 2016 | | July 29, 2016 | | 0.075 | | 2,210,008 | | 3,627 | | 30,745 | | October 19, 2016 | | December 15, 2016 | | December 30, 2016 | | 0.075 | | 2,210,008 | | 3,438 | | 30,586 |
| Monthly | | May 6, 2016 | | August 15, 2016 | | August 31, 2016 | | 0.075 | | 2,210,008 | | 3,260 | | 29,002 | | October 19, 2016 | | January 31, 2017 | | January 31, 2017 | | 0.075 | | 2,210,008 | | 2,905 | | 29,363 |
| Monthly | | August 4, 2016 | | September 15, 2016 | | September 30, 2016 | | 0.075 | | 2,210,008 | | 3,078 | | 26,811 | | October 19, 2016 | | February 15, 2017 | | February 28, 2017 | | 0.075 | | 2,210,008 | | 2,969 | | 26,427 |
| Monthly | | August 4, 2016 | | October 14, 2016 | | October 31, 2016 | | 0.075 | | 2,210,008 | | 3,146 | | 26,985 | | February 6, 2017 | | March 15, 2017 | | March 31, 2017 | | 0.040 | | 1,178,671 | | 1,508 | | 13,253 |
| Monthly | | August 4, 2016 | | November 15, 2016 | | November 30, 2016 | | 0.075 | | 2,210,008 | | 2,986 | | 26,909 | |
| Quarterly | | | February 6, 2017 | | June 15, 2017 | | June 30, 2017 | | 0.190 | | 5,598,686 | | 6,840 | | 55,221 |
| Quarterly | | | August 7, 2017 | | September 15, 2017 | | September 29, 2017 | | 0.190 | | 5,598,686 | | 6,991 | | 61,887 |
| Quarterly | | | August 7, 2017 | | December 15, 2017 | | December 29, 2017 | | 0.190 | |
_______________________
(1) Shares were purchased on the open market and distributed.
Stock Performance Graph
The following graph compares the cumulative total return provided to our shareholders on Oaktree Strategic Income Corporation’s common stock relative to the cumulative total returns of the NYSE Composite index, the NASDAQ Financial index and a customized peer group of our two direct competitors, Solar Senior Capital Ltd. and PennantPark Floating Rate Capital Ltd. An investment of $100 (with reinvestment of all dividends) is assumed to have been made in our common stock on July 12, 2013, the date our common stock was listed, and in each index and in the peer group at June 30, 2013, and its relative performance is tracked through September 30, 2016.2017. The stock performance graph shows returns during management by the Former Adviser.
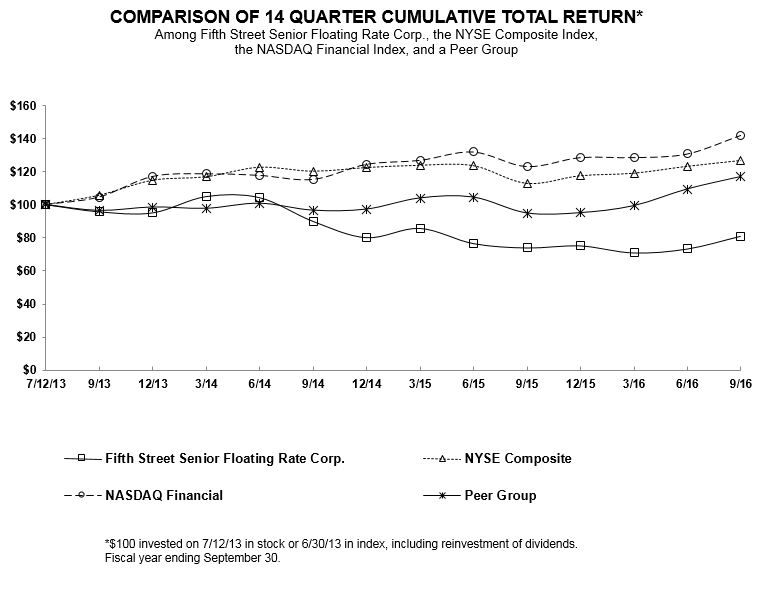
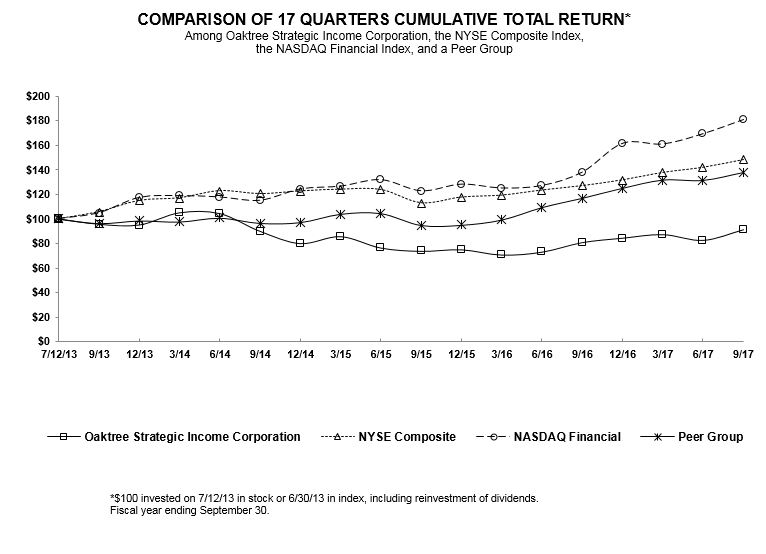
| | | | 7/12/13 | 9/13 | 12/13 | 3/14 | 6/14 | 9/14 | 12/14 | 7/12/13 | 9/13 | 12/13 | 3/14 | 6/14 | 9/14 | 12/14 | 3/15 | 6/15 |
| | | |
| Fifth Street Senior Floating Rate Corp. | 100.00 |
| 95.69 |
| 95.04 |
| 104.85 |
| 104.23 |
| 90.00 |
| 80.14 |
| |
| Oaktree Strategic Income Corporation | | 100.00 |
| 95.69 |
| 95.04 |
| 104.85 |
| 104.23 |
| 90.00 |
| 80.14 |
| 85.71 |
| 76.59 |
|
| NYSE Composite | 100.00 |
| 105.64 |
| 114.82 |
| 116.93 |
| 122.75 |
| 120.34 |
| 122.57 |
| 100.00 |
| 105.64 |
| 114.82 |
| 116.93 |
| 122.75 |
| 120.34 |
| 122.57 |
| 123.97 |
| 123.72 |
|
| NASDAQ Financial | 100.00 |
| 104.58 |
| 117.12 |
| 118.75 |
| 117.78 |
| 115.30 |
| 124.48 |
| 100.00 |
| 104.75 |
| 117.25 |
| 118.72 |
| 117.66 |
| 114.96 |
| 124.17 |
| 126.50 |
| 131.77 |
|
| Peer Group | 100.00 |
| 96.46 |
| 98.55 |
| 97.72 |
| 100.79 |
| 96.61 |
| 97.25 |
| 100.00 |
| 96.46 |
| 98.55 |
| 97.72 |
| 100.79 |
| 96.61 |
| 97.25 |
| 103.96 |
| 104.49 |
|
| | | | 3/15 | 6/15 | 9/15 | 12/15 | 3/16 | 6/16 | 9/16 | 9/15 | 12/15 | 3/16 | 6/16 | 9/16 | 12/16 | 3/17 | 6/17 | 9/17 |
| | | |
| Fifth Street Senior Floating Rate Corp. | 85.71 |
| 76.59 |
| 73.94 |
| 75.19 |
| 70.94 |
| 73.29 |
| 80.95 |
| |
| Oaktree Strategic Income Corporation | | 73.94 |
| 75.19 |
| 70.94 |
| 73.29 |
| 80.95 |
| 84.47 |
| 87.36 |
| 82.74 |
| 91.28 |
|
| NYSE Composite | 123.97 |
| 123.72 |
| 112.91 |
| 117.55 |
| 119.12 |
| 123.31 |
| 126.85 |
| 112.91 |
| 117.55 |
| 119.12 |
| 123.31 |
| 126.85 |
| 131.59 |
| 137.62 |
| 141.83 |
| 148.09 |
|
| NASDAQ Financial | 126.91 |
| 132.01 |
| 123.14 |
| 128.59 |
| 128.58 |
| 130.80 |
| 142.09 |
| 122.67 |
| 128.11 |
| 124.96 |
| 127.04 |
| 137.93 |
| 161.48 |
| 160.89 |
| 169.33 |
| 180.84 |
|
| Peer Group | 103.96 |
| 104.49 |
| 94.94 |
| 95.11 |
| 99.33 |
| 109.35 |
| 116.81 |
| 94.94 |
| 95.11 |
| 99.33 |
| 109.35 |
| 116.81 |
| 124.87 |
| 131.45 |
| 131.22 |
| 137.57 |
|
Selected unaudited quarterly financial data for Fifth Street Senior Floating Rate Corp.Oaktree Strategic Income Corporation for the years ended September 30, 2017, 2016, 2015, and 2014,2015, are below:
|
| | | | | | | | | | | | | | | | | | | | | | | | | | | | | | | | | | | | |
| | For the three months ended |
(dollars in thousands,
except per share
amounts) | September 30, 2016 | June 30,
2016 | March 31,
2016 | December
31, 2015 | September 30, 2015 | June 30,
2015 (revised) | March 31,
2015 (revised) | December
31, 2014 (revised) | September 30, 2014 (revised) | June 30, 2014 (revised) | March 31, 2014 (revised) | December 31, 2013 (revised) |
| Total investment income | $ | 13,203 |
| $ | 13,114 |
| $ | 13,195 |
| $ | 13,914 |
| $ | 14,068 |
| $ | 14,140 |
| $ | 11,341 |
| $ | 11,923 |
| $ | 4,918 |
| $ | 3,043 |
| $ | 2,910 |
| $ | 1,646 |
|
| Net investment income | 6,342 |
| 6,164 |
| 5,785 |
| 7,002 |
| 7,402 |
| 7,086 |
| 6,294 |
| 7,496 |
| 2,297 |
| 1,263 |
| 1,438 |
| 765 |
|
| Net realized and unrealized gain (loss) | 2,251 |
| (5,248 | ) | (6,445 | ) | (20,308 | ) | (7,115 | ) | (4,632 | ) | 393 |
| (1,012 | ) | 2,070 |
| 733 |
| 409 |
| 389 |
|
| Net increase (decrease) in net assets resulting from operations | 8,593 |
| 916 |
| (660 | ) | (13,306 | ) | 287 |
| 2,454 |
| 6,687 |
| 6,484 |
| 4,367 |
| 1,996 |
| 1,847 |
| 1,154 |
|
| Net assets | 325,829 |
| 323,866 |
| 329,580 |
| 334,661 |
| 356,807 |
| 361,782 |
| 368,168 |
| 370,322 |
| 372,678 |
| 100,969 |
| 100,773 |
| 100,459 |
|
| Total investment income per common share | $ | 0.45 |
| $ | 0.45 |
| $ | 0.45 |
| $ | 0.47 |
| $ | 0.48 |
| $ | 0.48 |
| $ | 0.38 |
| $ | 0.40 |
| $ | 0.29 |
| $ | 0.46 |
| $ | 0.44 |
| $ | 0.25 |
|
| Net investment income per common share | 0.22 |
| 0.21 |
| 0.20 |
| 0.24 |
| 0.25 |
| 0.24 |
| 0.21 |
| 0.25 |
| 0.13 |
| 0.19 |
| 0.22 |
| 0.11 |
|
| Earnings (loss) per common share | 0.29 |
| 0.03 |
| (0.02 | ) | (0.45 | ) | 0.01 |
| 0.08 |
| 0.23 |
| 0.22 |
| 0.26 |
| 0.30 |
| 0.28 |
| 0.17 |
|
| Net asset value per common share at period end | 11.06 |
| 10.99 |
| 11.18 |
| 11.36 |
| 12.11 |
| 12.28 |
| 12.49 |
| 12.57 |
| 12.65 |
| 15.15 |
| 15.12 |
| 15.07 |
|
Refer to Note 2 and Note 15 of the Consolidated Financial Statements for additional information regarding the revised periods. |
| | | | | | | | | | | | | | | | | | | | | | | | | | | | | | | | | | | | |
| | For the three months ended |
(dollars in thousands,
except per share
amounts) | September 30, 2017 | June 30,
2017 | March 31,
2017 | December
31, 2016 | September 30, 2016 | June 30,
2016 | March 31,
2016 | December
31, 2015 | September 30, 2015 | June 30,
2015 | March 31,
2015 | December
31, 2014 |
| Total investment income | $ | 11,820 |
| $ | 12,171 |
| $ | 11,020 |
| $ | 11,561 |
| $ | 13,203 |
| $ | 13,114 |
| $ | 13,195 |
| $ | 13,914 |
| $ | 14,068 |
| $ | 14,140 |
| $ | 11,341 |
| $ | 11,923 |
|
| Net investment income | 5,521 |
| 5,930 |
| 5,086 |
| 5,884 |
| 6,342 |
| 6,164 |
| 5,785 |
| 7,002 |
| 7,402 |
| 7,086 |
| 6,294 |
| 7,496 |
|
| Net realized and unrealized gain (loss) | (19,984 | ) | (5,791 | ) | (254 | ) | (5,159 | ) | 2,251 |
| (5,248 | ) | (6,445 | ) | (20,308 | ) | (7,115 | ) | (4,632 | ) | 393 |
| (1,012 | ) |
| Net increase (decrease) in net assets resulting from operations | (14,463 | ) | 139 |
| 4,832 |
| 725 |
| 8,593 |
| 916 |
| (660 | ) | (13,306 | ) | 287 |
| 2,454 |
| 6,687 |
| 6,484 |
|
| Net assets | 293,636 |
| 313,698 |
| 319,158 |
| 319,924 |
| 325,829 |
| 323,866 |
| 329,580 |
| 334,661 |
| 356,807 |
| 361,782 |
| 368,168 |
| 370,322 |
|
| Total investment income per common share | $ | 0.40 |
| $ | 0.41 |
| $ | 0.37 |
| $ | 0.39 |
| $ | 0.45 |
| $ | 0.45 |
| $ | 0.45 |
| $ | 0.47 |
| $ | 0.48 |
| $ | 0.48 |
| $ | 0.38 |
| $ | 0.40 |
|
| Net investment income per common share | 0.19 |
| 0.20 |
| 0.17 |
| 0.20 |
| 0.22 |
| 0.21 |
| 0.20 |
| 0.24 |
| 0.25 |
| 0.24 |
| 0.21 |
| 0.25 |
|
| Earnings (loss) per common share | (0.49 | ) | — |
| 0.16 |
| 0.02 |
| 0.29 |
| 0.03 |
| (0.02 | ) | (0.45 | ) | 0.01 |
| 0.08 |
| 0.23 |
| 0.22 |
|
| Net asset value per common share at period end | 9.97 |
| 10.65 |
| 10.83 |
| 10.86 |
| 11.06 |
| 10.99 |
| 11.18 |
| 11.36 |
| 12.11 |
| 12.28 |
| 12.49 |
| 12.57 |
|
Item 6. Selected Financial Data
The following selected financial data should be read together with our Consolidated Financial Statements and the related notes and the discussion under “Management’s Discussion and Analysis of Financial Condition and Results of Operations” which is included elsewhere in this annual report on Form 10-K. The financial information as of and for the fiscal years ended September 30, 2017, 2016, September 30, 2015 September 30,and 2014 and as of September 30, 2013 and for the period from the commencement of operations, June 29, 2013, through September 30, 2013 set forth below was derived from our audited financial statements and related notes for Fifth Street Senior Floating Rate Corp.Oaktree Strategic Income Corporation.
| | | | | As of and for the Year Ended September 30, 2016 | | As of and for the Year Ended September 30, 2015 | | As of and for the Year Ended September 30, 2014 (revised) | | As of September 30 and for the period from June 29, 2013 through September 30, 2013 (revised) | | As of and for the Year Ended September 30, 2017 | | As of and for the Year Ended September 30, 2016 | | As of and for the Year Ended September 30, 2015 | | As of and for the Year Ended September 30, 2014 | | As of September 30 and for the period from June 29, 2013 through September 30, 2013 |
| Statement of Operations data: | | | | | | | | | | | | | | | | | | |
| Total investment income | | $ | 53,426,234 |
| | $ | 51,472,531 |
| | $ | 12,516,674 |
| | $ | 456,417 |
| | $ | 46,571,856 |
| | $ | 53,426,234 |
| | $ | 51,472,531 |
| | $ | 12,516,674 |
| | $ | 456,417 |
|
| Base management fee, net | | 6,128,072 |
| | 5,931,155 |
| | 1,602,617 |
| | 61,379 |
| | 5,648,467 |
| | 6,128,072 |
| | 5,931,155 |
| | 1,602,617 |
| | 61,379 |
|
| Part I incentive fee | | 5,211,729 |
| | 5,689,371 |
| | 708,235 |
| | — |
| | 3,236,320 |
| | 5,211,729 |
| | 5,689,371 |
| | 708,235 |
| | — |
|
| Part II incentive fee | | — |
| | (766,552 | ) | | 774,841 |
| | 137,609 |
| | — |
| | — |
| | (766,552 | ) | | 774,841 |
| | 137,609 |
|
| All other expenses | | 16,793,749 |
| | 12,340,527 |
| | 3,667,100 |
| | 241,723 |
| | 15,265,376 |
| | 16,793,749 |
| | 12,340,527 |
| | 3,667,100 |
| | 241,723 |
|
| Net investment income | | 25,292,684 |
| | 28,278,030 |
| | 5,763,881 |
| | 15,706 |
| | 22,421,693 |
| | 25,292,684 |
| | 28,278,030 |
| | 5,763,881 |
| | 15,706 |
|
| Net realized and unrealized gain (loss) on investments | | (29,750,301 | ) | | (12,365,948 | ) | | 3,600,076 |
| | 688,043 |
| | (31,188,572 | ) | | (29,750,301 | ) | | (12,365,948 | ) | | 3,600,076 |
| | 688,043 |
|
| Net increase (decrease) in net assets resulting from operations | | (4,457,617 | ) | | 15,912,082 |
| | 9,363,957 |
| | 703,749 |
| | (8,766,879 | ) | | (4,457,617 | ) | | 15,912,082 |
| | 9,363,957 |
| | 703,749 |
|
| Per share data: | | | | | | | | | | | | | | | | | | |
| Net asset value per common share at period end | | $ | 11.06 |
| | $ | 12.11 |
| | $ | 12.65 |
| | $ | 15.11 |
| | $ | 9.97 |
| | $ | 11.06 |
| | $ | 12.11 |
| | $ | 12.65 |
| | $ | 15.11 |
|
| Market price at period end | | 8.56 |
| | 8.73 |
| | 11.82 |
| | 13.54 |
| | 8.80 |
| | 8.56 |
| | 8.73 |
| | 11.82 |
| | 13.54 |
|
| Net investment income (2) | | 0.86 |
| | 0.96 |
| | 0.62 |
| | — |
| | 0.76 |
| | 0.86 |
| | 0.96 |
| | 0.62 |
| | — |
|
| Net realized and unrealized gain (loss) on investments (2) | | (1.01 | ) | | (0.42 | ) | | 0.39 |
| | 0.13 |
| | (1.06 | ) | | (1.01 | ) | | (0.42 | ) | | 0.39 |
| | 0.13 |
|
| Net increase (decrease) in net assets resulting from operations (2) | | (0.15 | ) | | 0.54 |
| | 1.01 |
| | 0.13 |
| | (0.30 | ) | | (0.15 | ) | | 0.54 |
| | 1.01 |
| | 0.13 |
|
| Distributions per common share | | 0.90 |
| | 1.07 |
| | 1.01 |
| | — |
| | 0.80 |
| | 0.90 |
| | 1.07 |
| | 1.01 |
| | — |
|
| Balance Sheet data at period end: | | | | | | | | | | | | | | | | | | |
| Total investments at fair value | | $ | 573,604,381 |
| | $ | 623,647,474 |
| | $ | 300,001,397 |
| | $ | 48,653,617 |
| | $ | 560,436,660 |
| | $ | 573,604,381 |
| | $ | 623,647,474 |
| | $ | 300,001,397 |
| | $ | 48,653,617 |
|
| Cash, cash equivalents and restricted cash | | 28,815,679 |
| | 52,692,097 |
| | 109,557,165 |
| | 52,346,831 |
| | 43,012,387 |
| | 28,815,679 |
| | 52,692,097 |
| | 109,557,165 |
| | 52,346,831 |
|
| Other assets | | 22,511,317 |
| | 21,370,913 |
| | 2,946,782 |
| | 449,596 |
| | 5,213,604 |
| | 19,997,081 |
| | 21,370,913 |
| | 2,946,782 |
| | 449,596 |
|
| Total assets | | 624,931,377 |
| | 697,710,484 |
| | 412,505,344 |
| | 101,450,044 |
| | 608,662,651 |
| | 622,417,141 |
| | 697,710,484 |
| | 412,505,344 |
| | 101,450,044 |
|
| Total liabilities | | 299,101,983 |
| | 340,903,381 |
| | 39,827,666 |
| | 744,775 |
| | 315,026,217 |
| | 296,587,747 |
| | 340,903,381 |
| | 39,827,666 |
| | 744,775 |
|
| Total net assets | | 325,829,394 |
| | 356,807,103 |
| | 372,677,678 |
| | 100,705,269 |
| | 293,636,434 |
| | 325,829,394 |
| | 356,807,103 |
| | 372,677,678 |
| | 100,705,269 |
|
| Other data: | | | | | | | | | | | | | | | | | | |
| Weighted average yield on debt investments(1) | | 8.58 | % | | 8.22 | % | | 7.27 | % | | 6.81 | % | | 7.52 | % | | 8.58 | % | | 8.22 | % | | 7.27 | % | | 6.81 | % |
| Number of investments at period end | | 63 |
| | 64 |
| | 48 |
| | 8 |
| |
| Number of portfolio companies at period end | | | 67 |
| | 63 |
| | 64 |
| | 48 |
| | 8 |
|
| |
| (1) | Weighted average yield is calculated based upon our debt investments at the end of the period. |
| |
| (2) | Calculated based on weighted average shares outstanding for the period. |
Item 7. Management's Discussion and Analysis of Financial Condition and Results of Operations
The following discussion and analysis should be read in connectionconjunction with ourthe Consolidated Financial Statements and the notes thereto included elsewhere in this annual report on Form 10-K.
Some of the statements in this annual report on Form 10-K constitute forward-looking statements because they relate to future events or our future performance or financial condition. The forward-looking statements contained in this annual report on Form 10-K may include statements as to:
our future operating results and dividenddistribution projections;
the ability of our Investment Adviser to reposition our portfolio and to implement our Investment Adviser’s future plans with respect to our business;
our business prospects and the prospects of our portfolio companies;
the impact of the investments that we expect to make;
the ability of our portfolio companies to achieve their objectives;
our expected financings and investments;
the adequacy of our cash resources and working capital;
the timing of cash flows, if any, from the operations of our portfolio companies; and
the cost or potential outcome of any litigation to which we may be a party.
In addition, words such as "anticipate," "believe," "expect," "seek," "plan," "should," "estimate," "project"“anticipate,” “believe,” “expect,” “seek,” “plan,” “should,” “estimate,” “project” and "intend"“intend” indicate forward-looking statements, although not all forward-looking statements include these words. The forward-looking statements contained in this annual report on Form 10-K involve risks and uncertainties. Our actual results could differ materially from those implied or expressed in the forward-looking statements for any reason, including the factors set forth in "Item“Item 1A. Risk Factors"Factors” and elsewhere in this annual report on Form 10-K.
Other factors that could cause actual results to differ materially include:
changes in the economy, financial markets and political environment;
risks associated with possible disruption in our operations or the economy generally due to terrorism or natural disasters;
future changes in laws or regulations (including the interpretation of these laws and regulations by regulatory authorities) and conditions in our operating areas, particularly with respect to business development companies or RICs; and
other considerations that may be disclosed from time to time in our publicly disseminated documents and filings.
We have based the forward-looking statements included in this annual report on Form 10-K on information available to us on the date of this annual report, and we assume no obligation to update any such forward-looking statements. Although we undertake no obligation to revise or update any forward-looking statements, whether as a result of new information, future events or otherwise, you are advised to consult any additional disclosures that we may make directly to you or through reports that we in the future may file with the SEC, including annual reports on Form 10-K, quarterly reports on Form 10-Q and current reports on Form 8-K.
Except as otherwise specified, references to the "Company," "we," "us,"“Company,” “we,” “us,” and "our,"“our,” refer to Fifth Street Senior Floating Rate Corp.Oaktree Strategic Income Corporation and its consolidated subsidiaries.
All amounts are in dollars, except share amounts, percentages and as otherwise indicated.
Business Overview
We are a specialty finance company that isdedicated to providing customized capital solutions for middle-market companies in both the syndicated and private placement markets. We are a closed-end, externally managed, non-diversified management investment company. We havecompany that has elected to be regulated as a BDCbusiness development company under the Investment Company Act of 1940, as amended, or the 1940 Act. WeIn addition, we have qualified and elected to be treated as a RIC under the Code for tax purposes.
OurAs of October 17, 2017, we are externally managed by Oaktree, a subsidiary of OCG, a global investment objective ismanager specializing in alternative investments, pursuant the New Investment Advisory Agreement. OFA, a subsidiary of our Investment Adviser, also provides certain administrative and other services necessary for us to maximizeoperate. Prior to October 17, 2017, we were externally managed and advised by our portfolio's total return by generatingFormer Adviser, and we were named Fifth Street Senior Floating Rate Corp.
We seek to generate a stable source of current income from our debt investments while seekingminimizing the risk of principal loss and, to preserve our capital. We investa lesser extent, capital appreciation by providing middle-market companies with primarily in senior secured loans, including first lien unitranche and second liensecured debt instruments,financings that pay us interest at rates which are determined periodically on the basis of a floating base lending rate. We invest in companies across a variety of industries that typically possess resilient business models with strong underlying fundamentals. We deploy capital across credit and economic cycles with a focus on long-term results, which enables us to build lasting partnerships with financial sponsors and management teams. Under normal market conditions, through January 18, 2018, at least 80% of the value of our net assets plus borrowings for investment purposes will be invested
in floating rate madesenior loans, which include both first and second lien secured debt financings. We may also invest in unsecured loans, including subordinated loans, issued by private middle-market companies and, to a lesser extent, senior and subordinated loans issued by public companies and equity investments.
Following entry into the New Investment Advisory Agreement, our Investment Adviser intends to reposition our portfolio in the near-term in order to (1) rotate out of a small number of investments that it views as challenged, (2) focus on increasing the size of our core private middle marketinvestments and (3) supplement the portfolio with broadly syndicated and select privately placed loans. We expect that our Investment Adviser will focus on middle-market companies, whose debt iswhich we define as companies with enterprise values of between $100 and $750 million. Going forward, we expect our portfolio to include primarily first lien floating rate senior secured financings. We generally invest in securities that are rated below investment grade by rating agencies or that would be rated below investment grade if they were rated. Below investment grade securities, which are often referred to as “high yield” and “junk,” have predominantly speculative characteristics with respect to the issuer’s capacity to pay interest and repay principal. We also have an investment in a joint venture that invests in similar types of loans. We may also invest in
senior unsecured loans issuedBusiness Environment and Developments
The opportunity set in credit is still dominated by private middle marketthe search for yield as central banks in Japan and Europe continue their accommodative monetary policies. This glut of capital is resulting in significant inflows into sub-investment grade credit from investors seeking higher spreads as investment grade and highly rated sub-investment grade credit trade at close-to-historically tight levels.
During the fiscal year 2017, the spread on the BAML High Yield Single B Index ranged between 3.43% and 5.34% and was 3.57% as of September 30, 2017. In addition, during fiscal year 2017 the Credit Suisse Leveraged Loan Index spread ranged between 3.64% and 4.57% and was 3.87% as of September 30, 2017. The weighted average annual yield on the OCSI portfolio of 7.5% compares favorably in the current environment.
In this environment, we believe attractive risk-adjusted returns can be achieved by investing in companies that cannot efficiently access traditional debt capital markets. We believe that the Company has the resources and experience to source, diligence and structure investments in these companies and is well placed to a lesser extent, subordinated loans issued by private middle market companies, senior and subordinated loans issued by public companies and equity investments.generate attractive returns for investors.
We are externally managed by
New Investment Advisory Agreement with Oaktree
Upon the closing of the Transaction on October 17, 2017, Oaktree became the investment adviser to each of OCSL and us, and Oaktree paid gross cash consideration of $320 million to our Former Adviser. The closing of the Transaction resulted in an assignment for purposes of the 1940 Act of the Former Investment Advisory Agreement and, as a subsidiaryresult, its immediate termination. The material terms of FSAM, a publicly traded alternative asset manager, pursuantthe services to an investment advisory agreement. FSC CT LLC, a subsidiary of our investment adviser, also provides certain administrativebe provided under the New Investment Advisory Agreement, other than the fee structure, are substantially the same as the Former Investment Advisory Agreement, except that services are provided by Oaktree. See “Business-The Investment Adviser” and other services necessary for us to operate.“-New Investment Advisory Agreement.”
Critical Accounting Policies
Basis of Presentation
Our Consolidated Financial Statements have been prepared pursuant toin accordance with accounting principles generally accepted in the United States of America, or GAAP, and pursuant to the requirements for reporting on Form 10-K and Regulation S-X. All intercompany balances and transactions have been eliminated. We are an investment company following the accounting and reporting guidance in Financial Accounting Standards Board, or FASB, Accounting Standards Codification, or ASC, Topic 946, FinancialServices-Investment Companies, or ASC 946.
Investment Valuation
We are required to report our investments that are not publicly traded or for which current market values are not readily available at fair value. The fair value is deemed to be the price that would be received to sell an asset or paid to transfer a liability in an orderly transaction between market participants at the measurement date.
We value our investments in accordance with FASB ASC Topic 820, Fair Value Measurements and Disclosures, or ASC 820, which defines fair value as the amount that would be received to sell an asset or paid to transfer a liability in an orderly transaction between market participants at the measurement date. A liability's fair value is defined as the amount that would be paid to transfer the liability to a new obligor, not the amount that would be paid to settle the liability with the creditor. ASC 820 prioritizes the use of observable market prices derived from such prices over entity-specific inputs. Where observable prices or inputs are not available or reliable, valuation techniques are applied. These valuation techniques involve some level of management estimation and judgment, the degree of which is dependent on the price transparency for the investments or market and the investments' complexity.
Hierarchical levels, defined by ASC 820 and directly related to the amount of subjectivity associated with the inputs to fair valuation of these assets and liabilities, are as follows:follow:
Level 1 - Unadjusted, quoted prices in active markets for identical assets or liabilities at the measurement date.
Level 2 - Observable inputs other than Level 1 prices, such as quoted prices for similar assets or liabilities; quoted prices in markets that are not active; or other inputs that are observable or can be corroborated by observable market data at the measurement date for substantially the full term of the assets or liabilities.
Level 3 - Unobservable inputs that reflect management's best estimate of what market participants would use in pricing the asset or liability at the measurement date. Consideration is given to the risk inherent in the valuation technique and the risk inherent in the inputs to the model.
In certain cases, theIf inputs used to measure fair value may fall into different levels of the fair value hierarchy, established by ASC 820. In such cases, an investment's level within the fair value hierarchy is based on the lowest level of input that is significant to the fair value measurement. Our assessment of the significance of a particular input to the fair value measurement in its entirety requires judgment and considers factors specific to the investment. Generally, it is expected that all of our investment securities will be valued using Level 3 inputs. This includes investment securities that are valued using "bid" and "ask" prices obtained from independent third party pricing services or directly from brokers. These investments are generallymay be classified as Level 3 because the quoted prices may be indicative in nature for securities that are in an inactive market, may be for similar securities or may require adjustments for investment-specific factors or restrictions.
Financial instruments with readily available quoted prices generally will have a higher degree of market price observability and a lesser degree of judgment inherent in measuring fair value. As such, our investment adviser's capital markets groupInvestment Adviser obtains and analyzes readily available market quotations provided by independent pricing services for all of our senior secured debt investments for which quotations are available. In determining the fair value of a particular investment, pricing services use observable market information, including both binding and non-binding indicative quotations.
Our investment adviserInvestment Adviser evaluates the prices obtained from independent pricing services based on available market information and company specific data that could affect the credit quality and/or fair value of the investment. Investments for which market quotations are readily available may be valued at such market quotations. In order to validate market quotations, our investment adviserInvestment Adviser looks at a number of factors to determine if the quotations are representative of fair value, including the source and
nature of the quotations. Our investment adviserInvestment Adviser does not adjust the prices unless it has a reason to believe any such market quotations are not reflective of the fair value of an investment. Examples of these events that would cause market quotations to not reflect fair value could include cases when a security trades infrequently causing a quoted purchase or sale price to become stale or in the event of a "fire sale" by a distressed seller. In these instances, we value such investments by using the valuation procedure that it useswe use with respect to assets for which market quotations are not readily available (as discussed below).
If the quotation provided by the pricing service is based on only one or two market sources, we perform additional procedures to corroborate such information, which may include the bondmarket yield approachtechnique discussed below and a quantitative and qualitative assessment of the credit quality and market trends affecting the portfolio company.
We perform detailed valuations of allour debt and equity investments for which market quotations are not readily available or are deemed not to represent fair value of the investments. We typically use twothree different valuation techniques. The first valuation technique is the transaction precedent technique, which utilizes recent or expected future transactions of the investment to determine fair value, to the extent applicable. The second valuation technique is an analysis of the enterprise value, or EV, of the portfolio company. EV means the entire value of the portfolio company to a market participant, including the sum of the values of debt and equity securities used to capitalize the enterprise at a point in time. The primary method for determining EV uses a multiple analysis whereby appropriate multiples are applied to the portfolio company's EBITDA. EBITDA multiples are typically determined based upon review of market comparable transactions and publicly traded comparable companies, if any. We may also employ other valuation multiples to determine EV, such as revenues. The second method for determining EV uses a discounted cash flow analysis whereby future expected cash flows of the portfolio company are discounted to determine a present value using estimated discount rates (typically a weighted average cost of capital based on costs of debt and equity consistent with current market conditions). The EV analysis is typically performed to determine the value of equity investments, and to determine if there is credit impairment for debt investments. Ifinvestments and to determine the value for debt investments that we are credit impaired, andeemed to control under the 1940 Act. To estimate the EV of a portfolio company, the Investment Adviser analyzes various factors, including the portfolio company’s historical and projected financial results, macroeconomic impacts on the company, and competitive dynamics in the company’s industry. The Investment Adviser also utilizes some or all of the following information based on the individual circumstances of the portfolio company, including: (i) valuations of comparable public companies, (ii) recent sales of private and public comparable companies in similar industries or having similar business or earnings characteristics, (iii) purchase price multiples as a multiple of their earnings or cash flow, (iv) the portfolio company’s ability to meet its forecasts and its business prospects, (v) a discounted cash flow analysis, (vi) estimated liquidation or collateral value of the portfolio company's assets and (vii) offers from third parties to buy the portfolio company. We may be usedprobability weight potential sale outcomes with respect to value such debt investments; however, in additiona portfolio company due to the methods outlined above, other alternative methods suchuncertainty that exists as an asset liquidation model, expected recovery model or a recent observable or pending transaction may be utilized to estimate EV.of the valuation date. The secondthird valuation technique is a bondmarket yield approach,technique, which is typically performed for non-credit impaired debt investments. To determine fair value using a bondmarket yield approach,technique, a current price is imputed for the investment based upon an assessment of the expected market yield for a similarly structured investment with a similar level of risk. In the bondmarket yield approach,technique, we consider the current contractual interest rate, the capital structure and other terms of the investment relative to risk of the company and the specific investment. A key determinant of risk, among other things, is the leverage through the investment relative to the EV of the portfolio company. As debt investments held by us are substantially illiquid with no active transaction market, we depend on primary market data, including newly funded transactions and industry specific market movements, as well as secondary market data with respect to high yield debt instruments and syndicated loans, as inputs in determining the appropriate market yield, as applicable.
In accordance with ASC 820-10, certain investments that qualify as investment companies in accordance with ASC 946 may be valued using net asset value as a practical expedient for fair value. Consistent with FASB guidance under ASC 820, these investments are excluded from the hierarchical levels.
We estimate the fair value of privately held warrants using a Black Scholes pricing model, which includes an analysis of various factors and subjective assumptions including, but not limited to, the current stock price (by analyzing the portfolio company's operating performance and financial condition and general market conditions)using an EV analysis as described above), the expected period until exercise, expected volatility of the underlying stock price, expected dividends and the risk freerisk-free rate. Changes in the subjective input assumptions can materially affect the fair value estimates.
Our Board of Directors undertakes a multi-step valuation process each quarter in connection with determining the fair value of our investments:
The quarterly valuation process begins with each portfolio company or investment being initially valued by our investment adviser'sInvestment Adviser’s valuation team in conjunction with the investment adviser'sInvestment Adviser’s portfolio management team and capital markets teams;investment professionals responsible for each portfolio investment;
•Preliminary valuations are then reviewed and discussed with principalsmanagement of our investment adviser;Investment Adviser;
Separately, independent valuation firms engaged by our Board of Directors prepare valuations of our investments, on a selected basis, for which market quotations are not readily available or are readily available but deemed not reflective of the fair value of the investment, and submit the reports to us and provide such reports to our investment adviserInvestment Adviser and the Audit Committee of our Board of Directors;
The investment adviserInvestment Adviser compares and contrasts its preliminary valuations to the valuations of the independent valuation firms and prepares a valuation report for the Audit Committee of our Board of Directors;
The Audit Committee of our Board of Directors reviews the preliminary valuations with the portfolio managers of the investment adviserour Investment Adviser, and our investment adviserInvestment Adviser responds and supplements the preliminary valuations to reflect any discussions between our investment adviserInvestment Adviser and the Audit Committee;
The Audit Committee of our Board of Directors makes a recommendation to our Board of Directors regarding the fair value of the investments in our portfolio for which market quotations are not readily available;portfolio; and
Our Board of Directors discusses valuations and determines the fair value of each investment in our portfolio for which market quotations are not readily available in good faith.portfolio.
The fair value of our investments at September 30, 20162017 and September 30, 2015,2016 was determined in good faith by our Board of Directors. Our Board of Directors has authorized the engagement of independent valuation firms to provide valuation assistance. We will continue to engage independent valuation firms to provide assistance regarding the determination of the fair value of a portion of our portfolio securities for which market quotations are not readily available or are readily available but deemed not reflective of the fair value of the investment each quarter. Asquarter, and the Board of September 30, 2016, 73.5% of our portfolio at fair value was valued by independent valuation firms.Directors may reasonably rely on that assistance. The percentage of our portfolio valued by independent valuation firms may vary from period to period based on the availability of market quotations for our portfolio investments during the respective periods. Typically, a higher percentage of our portfolio is valued by independent valuation firms in our fiscal fourth quarter due to additional year-end procedures. However, our Board of Directors is ultimately and solely responsible for the ultimate valuation of the portfolio investments at fair value as determined in good faith pursuant to our valuation policy and a consistently applied valuation process.
The percentages of our portfolio, at fair value, valued by independent valuation firms as of the end of each period during the current and two preceding fiscal years were as follows:
|
| | |
As of December 31, 2013 | 34.1 | % |
As of March 31, 2014 | 30.5 | % |
As of June 30, 2014 | 56.6 | % |
As of September 30, 2014 | 44.3 | % |
| As of December 31, 2014 | 54.1 | % |
| As of March 31, 2015 (1) | 32.1 | % |
| As of June 30, 2015 | 23.8 | % |
| As of September 30, 2015 (2) | 76.5 | % |
| As of December 31, 2015 | 29.3 | % |
| As of March 31, 2016 | 25.0 | % |
| As of June 30, 2016 | 32.0 | % |
| As of September 30, 2016 (2) | 73.5 | % |
| As of December 31, 2016 | 29.6 | % |
| As of March 31, 2017 | 30.1 | % |
| As of June 30, 2017 | 29.4 | % |
| As of September 30, 2017 (2) | 63.8 | % |
__________
(1) The decrease from prior quarters is primarily related to the increased use of market quotations to value certain of our portfolio investments beginning in the quarter ended March 31, 2015.
(2) Valuations performed by independent valuation firms as of September 30, 2017, 2016 and 2015 were higher primarily due to additional year-end procedures related to portfolio investments that were valued using market quotations based on only one source.
As of September 30, 20162017 and September 30, 2015,2016, approximately 91.8%92.1% and 89.4%92.2%, respectively, of our total assets represented investments in portfolio companies valued at prices equal to fair value.
Revenue Recognition
Interest and Dividend Income
Interest income, adjusted for accretion of original issue discount, or OID, is recorded on the accrual basis to the extent that such amounts are expected to be collected. We stop accruing interest on investments when it is determined that interest is no longer collectible. Investments that are expected to pay regularly scheduled interest in cash are generally placed on non-accrual status when there is reasonable doubt that principal or interest cash payments will be collected. Cash interest payments received on investments may be recognized as income or a return of capital depending upon management’s judgment. Such non-accrual investments are restored to accrual status if past due principal and interest are paid in cash, and the portfolio companies, in management’s judgment, are likely to continue timely payment of their remaining interest. As of September 30, 2017, there were three investments on which we had stopped accruing cash and/or PIK interest or OID income.
In connection with our investment in a portfolio company, we sometimes receive nominal cost equity that is valued as part of the negotiation process with the particular portfolio company. When we receive nominal cost equity, we allocate our cost basis in the investment between debt securities and the nominal cost equity at the time of origination. Any resulting discount from recording the loan, or otherwise purchasing a security at a discount, is accreted into interest income over the life of the loan. Distributions of income from portfolio companies are
We generally recorded asrecognize dividend income on the ex-dividend date.
As Distributions received from equity investments are evaluated to determine if the distribution should be recorded as dividend income or a return of September 30, 2016,capital. Generally, we will not record distributions from such equity investments as dividend income unless there was one investment on which we stopped accruing cash and/or PIK interest or OID income.are sufficient earnings at the portfolio company prior to the distribution. Distributions that are classified as a return of capital are recorded as a reduction in the cost basis of the investment.
Fee Income
We receive a variety of fees in the ordinary course of business, including servicing, advisory, amendment, structuring and prepayment fees, which are classified as fee income and recognized as they are earned.
PIK Interest
Although our loans typically do not contain contractual PIK interest provisions, a portion of ourOur loans may contain contractual PIK interest provisions. The PIK interest, which represents contractually deferred interest will be added to the loan balance that is generally due at the end of the loan term, and is generally recorded on the accrual basis to the extent such amounts are expected to be collected. We generally cease accruing PIK interest if there is insufficient value to support the accrual or if we do not expect the portfolio company to be able to pay all principal and interest due. Our decision to cease accruing PIK interest involves subjective judgments and determinations based on available information about a particular portfolio company, including whether the portfolio company is current with respect to its payment of principal and interest on its loans and debt securities; monthly and quarterly financial statements and financial projections for the portfolio company; our assessment of the portfolio company's business development success, including product development, profitability and the portfolio company's overall adherence to its business plan;success; information obtained by us in connection with periodic formal update interviews with the portfolio company's management and, if appropriate, the private equity sponsor; and information about the general economic and market conditions in which the portfolio company operates. Based on this and other information, we determine whether to cease accruing PIK interest on a loan or debt security.security when it is determined that PIK interest is no longer collectible. Our determination to cease accruing PIK interest on a loan or debt security is generally made well before our full write-down of such loan or debt security when it is determined that PIK interest is no longer collectible.security. In addition, if it is subsequently determined that we will not be able to collect any previously accrued PIK interest, the fair value of our loans or debt securities would declinebe reduced by the amount of such previously accrued, but uncollectible, PIK interest. The accrual of PIK interest on our debt investments increases the recorded cost basisbases of these investments in our Consolidated Financial Statements and, as a result, increases the cost basisbases of these investments for purposes of computing the capital gains incentive fee payable by us to our investment adviser.Investment Adviser.
For a discussion of risks we are subject to as a result of our use of PIK interest in connection with our investments, see "Risk Factors —- Risks Relating to Our Business and Structure —- We may have difficulty paying our required distributions if we are required to recognize income for U.S. federal income tax purposes before or without receiving cash representing such income," "—"- We may in the future choose to pay distributions partly in our own stock, in which case you may be subject to tax in excess of the cash you receive" and "—"- Our incentive fee may induce our investment adviserInvestment Adviser to make speculative investments" elsewhere in this annual report on Form 10-K in connection with our investments. In addition, if it is subsequently determined that we will not be able to collect any previously accrued PIK interest, the fair value of our loans or debt securities would decline by the amount of such previously accrued, but uncollectible, PIK interest. The accrual of PIK interest on our debt investments increases the recorded cost basis of these investments both in our Consolidated Financial Statements and for purposes of computing the capital gains incentive fee payable by us to our investment adviser.
report. To maintain our status as a RIC, income from PIK incomeinterest must be paid out to our stockholders as distributions even though we have not yet collected the cash and may never collect the cash relating to the PIK interest. Accumulated PIK interest was $0.5 million and $0.1 million as of September 30, 2016. We did not have any accumulated PIK interest as of2017 and September 30, 2015.2016, respectively. The net increases in loan balances as a result of contractual PIK arrangements are separately identified in our Consolidated Statements of Cash Flows.
Portfolio Composition
Our investments principally consist of senior loans in private middle market companies. Ourmiddle-market companies and investments in FSFR Glick JV. As of September 30, 2017, our senior loans arewere typically secured by a first or second lien on the assets of the portfolio company and generally have terms of up to seventen years (but an expected average life of between three and four years). We are currently focusingbelieve the environment for direct lending remains active, and, as a result, a number of our origination efforts on a prudent mixportfolio companies were able to refinance and repay their loans during the fiscal year ended September 30, 2017.
During the year ended September 30, 2017, we originated $290.8 million of first lieninvestment commitments in 36 new and second lien loans which12 existing portfolio companies and funded $290.6 million of investments.
During the year ended September 30, 2017, we believe will provide attractive risk-adjusted returns while maintaining adequate credit protection. The mix may change over time based on market conditionsreceived $215.3 million in connection with the full repayments and management's viewexits of where the best risk-adjusted returns are available.27 of our investments and an additional $61.7 million in connection with other paydowns and sales of investments.
A summary of the composition of our investment portfolio at cost and fair value as a percentage of total investments is shown in the following tables:
| | | | | September 30, 2016 | | September 30, 2015 | | September 30, 2017 | | September 30, 2016 |
| Cost: | | | | | | | | |
| Senior secured debt | | 86.40 | % | | 90.61 | % | | 86.50 | % | | 86.40 | % |
| Subordinated notes of FSFR Glick JV | | 10.66 |
| | 8.38 |
| | 10.61 |
| | 10.66 |
|
| LLC equity interests of FSFR Glick JV | | 1.18 |
| | 0.93 |
| | 1.18 |
| | 1.18 |
|
| Purchased equity | | 1.76 |
| | 0.08 |
| | 1.71 |
| | 1.76 |
|
| Equity Grants | | — |
| | — |
| |
| Equity grants | | | — |
| | — |
|
| Total | | 100.00 | % | | 100.00 | % | | 100.00 | % | | 100.00 | % |
| | | | | September 30, 2016 | | September 30, 2015 | | September 30, 2017 | | September 30, 2016 |
| Fair value: | | | | | | | | |
| Senior secured debt | | 87.58 | % | | 90.68 | % | | 89.53 | % | | 87.58 | % |
| Subordinated notes of FSFR Glick JV | | 9.92 |
| | 8.43 |
| | 10.28 |
| | 9.92 |
|
| LLC equity interests of FSFR Glick JV | | 1.12 |
| | 0.73 |
| | — |
| | 1.12 |
|
| Purchased equity | | 1.36 |
| | 0.13 |
| | 0.19 |
| | 1.36 |
|
| Equity grants | | 0.02 |
| | 0.03 |
| | — |
| | 0.02 |
|
| Total | | 100.00 | % | | 100.00 | % | | 100.00 | % | | 100.00 | % |
The industry composition of our portfolio at cost and fair value respectively, as a percentage of total investments was as follows: | | | | | September 30, 2016 | | September 30, 2015 | | September 30, 2017 | | September 30, 2016 |
| Cost: | | | | | | | | |
| Internet software & services | | 22.07 | % | | 22.79 | % | | 21.46 | % | | 22.07 | % |
| Multi-sector holdings (1) | | | 11.79 |
| | 11.84 |
|
| Healthcare services | | 14.80 |
| | 14.13 |
| | 8.41 |
| | 14.80 |
|
| Multi-sector holdings | | 11.84 |
| | 9.31 |
| |
| Advertising | | 8.06 |
| | 6.86 |
| | 7.19 |
| | 8.06 |
|
| Application software | | 5.35 |
| | 3.37 |
| | 5.59 |
| | 5.35 |
|
| Diversified support services | | | 4.00 |
| | 3.28 |
|
| IT consulting & other services | | | 3.39 |
| | 1.47 |
|
| Human resources & employment services | | | 3.33 |
| | — |
|
| Specialized finance | | | 2.54 |
| | — |
|
| Environmental & facilities services | | | 2.34 |
| | 1.06 |
|
| Oil & gas equipment & services | | | 2.32 |
| | 0.70 |
|
| Distributors | | | 2.14 |
| | — |
|
| Industrial machinery | | | 2.06 |
| | 0.64 |
|
| Real estate services | | | 2.02 |
| | — |
|
| Commercial printing | | | 1.96 |
| | 0.98 |
|
| Integrated telecommunication services | | 4.06 |
| | 6.01 |
| | 1.87 |
| | 4.06 |
|
| Food retail | | | 1.66 |
| | 1.15 |
|
| Data processing & outsourced services | | | 1.62 |
| | 1.64 |
|
| Pharmaceuticals | | | 1.50 |
| | 1.53 |
|
| Specialty Stores | | | 1.38 |
| | — |
|
| Security & alarm services | | | 1.33 |
| | 2.97 |
|
| Computer & Electronics Retail | | | 1.22 |
| | — |
|
| Research & consulting services | | | 1.14 |
| | 2.85 |
|
| Personal products | | | 1.08 |
| | 0.21 |
|
| Aerospace & defense | | | 1.07 |
| | — |
|
| Auto parts & equipment | | | 0.97 |
| | — |
|
| Healthcare distributors | | | 0.82 |
| | — |
|
| Casinos & gaming | | | 0.82 |
| | — |
|
| Housewares & specialties | | | 0.79 |
| | — |
|
| Trucking | | | 0.67 |
| | — |
|
| Fertilizers & agricultural chemicals | | | 0.54 |
| | 0.59 |
|
| Hypermarkets & super centers | | | 0.50 |
| | — |
|
| Specialized consumer services | | 3.76 |
| | 4.53 |
| | 0.27 |
| | 3.76 |
|
| Diversified support services | | 3.28 |
| | 4.67 |
| |
| Security & alarm services | | 2.97 |
| | 2.80 |
| |
| Research & consulting services | | 2.85 |
| | 1.47 |
| |
| Computer hardware | | | 0.21 |
| | 0.66 |
|
| Education services | | 2.54 |
| | 3.43 |
| | — |
| | 2.54 |
|
| Electronic equipment & instruments | | 1.82 |
| | 2.17 |
| | — |
| | 1.82 |
|
| Data processing & outsourced services | | 1.64 |
| | 2.14 |
| |
| Pharmaceuticals | | 1.53 |
| | 1.55 |
| |
| IT consulting & other services | | 1.47 |
| | 1.89 |
| |
| Diversified capital markets | | 1.45 |
| | 1.38 |
| | — |
| | 1.45 |
|
| Food retail | | 1.15 |
| | 1.63 |
| |
| Environmental & facilities services | | 1.06 |
| | 1.58 |
| |
| Commercial printing | | 0.98 |
| | — |
| |
| Construction and engineering | | 0.98 |
| | 0.94 |
| | — |
| | 0.98 |
|
| Wireless telecommunication services | | 0.95 |
| | 0.91 |
| | — |
| | 0.95 |
|
| Food distributors | | 0.95 |
| | 1.41 |
| | — |
| | 0.95 |
|
| Restaurants | | 0.83 |
| | — |
| | — |
| | 0.83 |
|
| Healthcare technology | | 0.81 |
| | 0.78 |
| | — |
| | 0.81 |
|
| Oil & gas equipment & services | | 0.70 |
| | 0.70 |
| |
| Computer hardware | | 0.66 |
| | 0.65 |
| |
| Industrial machinery | | 0.64 |
| | 0.63 |
| |
| Fertilizers & agricultural chemicals | | 0.59 |
| | 0.57 |
| |
| Personal products | | 0.21 |
| | 1.70 |
| |
| | | 100.00 | % | | 100.00 | % | | 100.00 | % | | 100.00 | % |
| | | | | September 30, 2016 | | September 30, 2015 | | September 30, 2017 | | September 30, 2016 |
Fair value:
| | | | | | | | |
| Internet software & services | | 20.82 | % | | 22.34 | % | | 21.72 | % | | 20.82 | % |
| Healthcare services | | 14.64 |
| | 13.79 |
| |
| Multi-sector holdings | | 11.04 |
| | 9.16 |
| |
| Multi-sector holdings (1) | | | 10.28 |
| | 11.04 |
|
| Advertising | | 8.49 |
| | 6.99 |
| | 7.34 |
| | 8.49 |
|
| Application software | | 5.65 |
| | 3.51 |
| | 6.06 |
| | 5.65 |
|
| Healthcare services | | | 5.27 |
| | 14.64 |
|
| Diversified support services | | | 4.40 |
| | 3.42 |
|
| IT consulting & other services | | | 3.66 |
| | 1.55 |
|
| Human resources & employment services | | | 3.59 |
| | — |
|
| Specialized finance | | | 2.79 |
| | — |
|
| Environmental & facilities services | | | 2.55 |
| | 1.14 |
|
| Oil & gas equipment & services | | | 2.51 |
| | 0.71 |
|
| Distributors | | | 2.31 |
| | — |
|
| Industrial machinery | | | 2.22 |
| | 0.66 |
|
| Real estate services | | | 2.19 |
| | — |
|
| Commercial printing | | | 2.13 |
| | 1.03 |
|
| Integrated telecommunication services | | 4.30 |
| | 6.14 |
| | 2.03 |
| | 4.30 |
|
| Food retail | | | 1.82 |
| | 1.22 |
|
| Data processing & outsourced services | | | 1.76 |
| | 1.71 |
|
| Pharmaceuticals | | | 1.61 |
| | 1.57 |
|
| Specialty Stores | | | 1.46 |
| | — |
|
| Security & alarm services | | | 1.42 |
| | 3.11 |
|
| Computer & Electronics Retail | | | 1.34 |
| | — |
|
| Research & consulting services | | | 1.25 |
| | 2.99 |
|
| Personal products | | | 1.18 |
| | 0.22 |
|
| Aerospace & defense | | | 1.17 |
| | — |
|
| Auto parts & equipment | | | 1.03 |
| | — |
|
| Casinos & gaming | | | 0.90 |
| | — |
|
| Healthcare distributors | | | 0.88 |
| | — |
|
| Housewares & specialties | | | 0.85 |
| | — |
|
| Trucking | | | 0.73 |
| | — |
|
| Hypermarkets & super centers | | | 0.51 |
| | — |
|
| Fertilizers & agricultural chemicals | | | 0.50 |
| | 0.59 |
|
| Specialized consumer services | | 3.93 |
| | 4.62 |
| | 0.30 |
| | 3.93 |
|
| Diversified support services | | 3.42 |
| | 4.73 |
| |
| Security & alarm services | | 3.11 |
| | 2.85 |
| |
| Research & consulting services | | 2.99 |
| | 1.49 |
| |
| Computer hardware | | | 0.24 |
| | 0.68 |
|
| Education services | | 2.67 |
| | 3.43 |
| | — |
| | 2.67 |
|
| Electronic equipment & instruments | | 1.90 |
| | 2.20 |
| | — |
| | 1.90 |
|
| Data processing & outsourced services | | 1.71 |
| | 2.19 |
| |
| Pharmaceuticals | | 1.57 |
| | 1.57 |
| |
| IT consulting & other services | | 1.55 |
| | 1.94 |
| |
| Diversified capital markets | | 1.53 |
| | 1.42 |
| | — |
| | 1.53 |
|
| Food retail | | 1.22 |
| | 1.67 |
| |
| Environmental & facilities services | | 1.14 |
| | 1.60 |
| |
| Commercial printing | | 1.03 |
| | — |
| |
| Construction and engineering | | 1.01 |
| | 0.95 |
| | — |
| | 1.01 |
|
| Food distributors | | 0.98 |
| | 1.44 |
| | — |
| | 0.98 |
|
| Restaurants | | 0.87 |
| | — |
| | — |
| | 0.87 |
|
| Healthcare technology | | 0.83 |
| | 0.78 |
| | — |
| | 0.83 |
|
| Wireless telecommunication services | | 0.74 |
| | 0.87 |
| | — |
| | 0.74 |
|
| Oil & gas equipment & services | | 0.71 |
| | 0.70 |
| |
| Computer hardware | | 0.68 |
| | 0.66 |
| |
| Industrial machinery | | 0.66 |
| | 0.62 |
| |
| Fertilizers & agricultural chemicals | | 0.59 |
| | 0.61 |
| |
| Personal products | | 0.22 |
| | 1.73 |
| |
| | | 100.00 | % | | 100.00 | % | | 100.00 | % | | 100.00 | % |
Portfolio Asset Quality
We employ a ranking system to assess and monitor the credit risk of our investment portfolio. We rank all investments on a scale from 1 to 4. The system is intended to reflect the performance of the borrower's business, the collateral coverage of the loan, and other factors considered relevant to making a credit judgment. We have determined that there should be an individual ranking assigned to each tranche of securities in the same portfolio company where appropriate. This may arise when the perceived risk of loss on the investment varies significantly between tranches due to their respective seniority in the capital structure.
Investment Ranking 1 is used for investments that are performing above expectations and/or capital gains are expected.
Investment Ranking 2 is used for investments that are performing substantially within our expectations, and whose risks remain materially consistent with the potential risks at the time of the original or restructured investment. All new investments are initially ranked 2.
Investment Ranking 3 is used for investments that are performing below our expectations and for which risk has materially increased since the original or restructured investment. The portfolio company may be out of compliance with debt covenants and may require closer monitoring. To the extent that the underlying agreement has a PIK interest provision, investments with a ranking of 3 are generally those on which we are not accruing PIK interest.
Investment Ranking 4 is used for investments that are performing substantially below our expectations and for which
risk has increased substantially since the original or restructured investment. Investments with a ranking of 4 are those for which some loss of principal is expected and are generally those on which we are not accruing cash interest.
The following table shows the distribution of our investments on the 1 to 4 investment ranking scale at fair value as of September 30, 2016 and September 30, 2015:
|
| | | | | | | | | | | | | | | | | | | | |
| Investment Ranking | | September 30, 2016 | | September 30, 2015 |
| | Fair Value | | % of Portfolio | | Leverage Ratio | | Fair Value | | % of Portfolio | | Leverage Ratio |
| 1 | | $ | 20,056,209 |
| | 3.49 | % | | 3.80 |
| | — |
| | — |
| | — |
|
| 2 | | 533,951,690 |
| | 93.09 |
| | 4.20 |
| | $ | 596,955,786 |
| | 95.72 | % | | 4.71 |
|
| 3 | | 12,440,322 |
| | 2.17 |
| | NM |
| (1) | 26,691,688 |
| | 4.28 |
| | 5.87 |
|
| 4 | | 7,156,160 |
| | 1.25 |
| | NM |
| (1) | — |
| | — |
| | — |
|
| Total | | $ | 573,604,381 |
| | 100.00 | % | | 4.19 |
| | $ | 623,647,474 |
| | 100.00 | % | | 4.76 |
|
___________________________________
| |
| (1) | Due to operating performance this ratio is not measurable and, as a result, is excluded from the total portfolio calculation.This industry includes our investment in FSFR Glick JV. |
We may from time to time modify the payment terms of our investments, either in response to current economic conditions and their impact on certain of our portfolio companies or in accordance with tier pricing provisions in certain loan agreements. Such modified terms may include increased PIK interest provisions and reduced cash interest rates. Any modifications to our loan agreements may limit the amount of interest income that we recognize from the modified investments, which may, in turn, limit our ability to make distributions to our stockholders. As of September 30, 2016, we had modified the payment terms of our investments in five portfolio companies. As of September 30, 2015, we had modified the payment terms of our investments in two portfolio companies.
Loans and Debt Securities on Non-Accrual Status
As of September 30, 2017, September 30, 2016 and September 30, 2015, there waswere three, one investmentand one investments, respectively, on which we stopped accruing cash and/or PIK interest or OID income. As of September 30, 2014, there were no investments on which we had stopped accruing cash and/or PIK interest or OID income.
The percentages of our debt investments at cost and fair value by accrual status as of September 30, 2017, September 30, 2016 and September 30, 2015 were as follows:
| | | | | September 30, 2016 | | September 30, 2015 | | September 30, 2017 | | September 30, 2016 | | September 30, 2015 |
| | | Cost | | % of Debt
Portfolio | | Fair
Value | | % of Debt
Portfolio | | Cost | | % of Debt
Portfolio | | Fair
Value | | % of Debt
Portfolio | | Cost | | % of Debt
Portfolio | | Fair
Value | | % of Debt
Portfolio | | Cost | | % of Debt
Portfolio | | Fair
Value | | % of Debt
Portfolio | | Cost | | % of Debt
Portfolio | | Fair
Value | | % of Debt
Portfolio |
| Accrual | | $ | 563,757,229 |
| | 96.74 | % | | $ | 552,114,644 |
| | 98.72 | % | | $ | 619,529,324 |
| | 98.79 | % | | $ | 613,701,960 |
| | 99.28 | % | | $ | 564,231,285 |
| | 96.02 | % | | $ | 553,084,120 |
| | 98.88 | % | | $ | 563,757,229 |
| | 96.74 | % | | $ | 552,114,644 |
| | 98.72 | % | | $ | 619,529,324 |
| | 98.79 | % | | $ | 613,701,960 |
| | 99.28 | % |
| PIK non-accrual (paying) (1) | | — |
| | — |
| | — |
| | — |
| | 7,605,257 |
| | 1.21 |
| | 4,427,839 |
| | 0.72 |
| | — |
| | — |
| | — |
| | — |
| | — |
| | — |
| | — |
| | — |
| | 7,605,257 |
| | 1.21 |
| | 4,427,839 |
| | 0.72 |
|
Cash non-accrual (nonpaying) (1)(2) | | 19,027,017 |
| | 3.26 |
| | 7,156,160 |
| | 1.28 |
| | — |
| | — |
| | — |
| | — |
| | 23,381,863 |
| | 3.98 |
| | 6,292,551 |
| | 1.12 |
| | 19,027,017 |
| | 3.26 |
| | 7,156,160 |
| | 1.28 |
| | — |
| | — |
| | — |
| | — |
|
| Total | | $ | 582,784,246 |
| | 100.00 | % | | $ | 559,270,804 |
| | 100.00 | % | | $ | 627,134,581 |
| | 100.00 | % | | $ | 618,129,799 |
| | 100.00 | % | | $ | 587,613,148 |
| | 100.00 | % | | $ | 559,376,671 |
| | 100.00 | % | | $ | 582,784,246 |
| | 100.00 | % | | $ | 559,270,804 |
| | 100.00 | % | | $ | 627,134,581 |
| | 100.00 | % | | $ | 618,129,799 |
| | 100.00 | % |
__________________
| |
| (1) | PIK non-accrual status is inclusive of other non-cash income, where applicable. |
| |
| (2) | Cash non-accrual status is inclusive of PIK and other non-cash income, where applicable. |
The non-accrual status of our portfolio investments as of September 30, 2017, September 30, 2016 and September 30, 2015 was as follows:
|
| | | | | | |
| | September 30, 2017 | | September 30, 2016 | | September 30, 2015 |
| Answers Corporation (2) | | — | | Cash non-accrual (1) | | PIK non-accrual (1) |
| Ameritox Ltd. | | Cash non-accrual (1) | | — | | — |
| New Trident Holdcorp, Inc. - second lien term loan | | Cash non-accrual (1) | | — | | — |
| Metamorph US 3, LLC | | Cash non-accrual (1) | | — | | — |
__________________
| |
| (1) | PIK non-accrual status is inclusive of other non-cash income, where applicable. Cash non-accrual status is inclusive of PIK and other non-cash income, where applicable. |
The non-accrual status of our portfolio investments as of September 30, 2016 and September 30, 2015 was as follows: |
| | | | |
| | September 30, 2016 | | September 30, 2015 |
Answers Corporation (2) | | Cash non-accrual (1) | | PIK non-accrual (1) |
__________________
| |
(1) | Cash non-accrual status is inclusive of other non-cash income, where applicable. Cash non-accrual status is inclusive of PIK and other non-cash income, where applicable. |
| |
| (2) | As of September 30, 2015, only our investment in the second lien term loan of the Answers Corporation was on PIK non-accrual status.2017, we no longer held this investment. As of September 30, 2016, our investments in both the first and second lienslien term loans of the Answers Corporation were on cash non-accrual status. As of September 30, 2015, only the second lien term loan was on PIK non-accrual. |
Income non-accrual amountamounts for the years ended September 30, 2017, 2016 and September 30, 2015, is presented inwhich may include amounts for investments that were no longer held at the following table.end of the period, were as follows:
| | | | | Year ended
September 30, 2016 | | Year ended
September 30, 2015 | | Year ended
September 30, 2017 | | Year ended
September 30, 2016 | | Year ended
September 30, 2015 |
| Cash interest income | | $ | 1,136,652 |
| | $ | — |
| | $ | 1,291,399 |
| | $ | 1,136,652 |
| | $ | — |
|
| PIK interest income | | | 351,323 |
| | — |
| | — |
|
| OID income | | 57,735 |
| | 13,816 |
| | 89,553 |
| | 57,735 |
| | 13,816 |
|
| Total | | $ | 1,194,387 |
| | $ | 13,816 |
| | $ | 1,732,275 |
| | $ | 1,194,387 |
| | $ | 13,816 |
|
FSFR Glick JV LLC
In October 2014, we entered into aan LLC agreement with GF Equity Funding to form FSFR Glick JV. On April 21, 2015, FSFR Glick JV began investing in senior secured loans of middle marketmiddle-market companies. We co-invest in these securities with GF Equity Funding through FSFR Glick JV. FSFR Glick JV is managed by a four person Board of Directors, two of whom are selected by us and two of whom are selected by GF Equity Funding. FSFR Glick JV is capitalized as transactions are completed, and portfolio decisions and investment decisions in respect of FSFR Glick JV must be approved by an investment committee ofthe FSFR Glick JV investment committee, consisting of one representative ofselected by us and one representative ofselected by GF Equity Funding (with approval from a representative of each required). The members provide capital to FSFR Glick JV in exchange for LLC equity interests, and we and GF Debt Funding, an entity advised by affiliates of GF Equity Funding, provide capital to FSFR Glick JV in exchange for the Subordinated Notes. As of September 30, 20162017 and September 30, 2015,2016, we and GF Equity Funding owned 87.5% and 12.5%, respectively, of the outstanding LLC interests, and we and GF Debt Funding owned 87.5% and 12.5%, respectively, of the Subordinated Notes. FSFR Glick JV is not an "eligible portfolio company" as defined in section 2(a)(46) of the 1940 Act.
FSFR Glick JV's portfolio consisted of middle-market and other corporate debt securities of 23 and 36 "eligible portfolio companies" (as defined in Section 2(a)(46) of the 1940 Act) as of September 30, 2017 and September 30, 2016, respectively. The portfolio companies in FSFR Glick JV are in industries similar to those in which we may invest directly.
FSFR Glick JV has a senior revolving credit facility with Deutsche Bank AG, New York Branch, or the Deutsche Bank facility, with a stated maturity date of April 17, 2023, which permitted up to $200.0 million of borrowings as of both September 30, 2017 and September 30, 2016. On June 29, 2017, this Deutsche Bank facility was assigned by Credit Suisse AG, Cayman Islands Branch to Deutsche Bank AG, New York Branch. Borrowings under the Deutsche Bank facility are secured by all of the assets of FSFR Glick JV and all of the equity interests in FSFR Glick JV and bore interest at a rate equal to the 3-month LIBOR plus 2.5% per annum with no LIBOR floor as of September 30, 2017 and September 30, 2016. Under the Deutsche Bank facility, $56.9 million and $124.6 million in borrowings were outstanding as of September 30, 2017 and September 30, 2016, respectively.
We have determined that FSFR Glick JV is an investment company under ASC 946; however, in accordance with such guidance, we will generally not consolidate our investment in a company other than a wholly-owned investment company subsidiary or a controlled operating company whose business consists of providing services to us. Accordingly, we do not consolidate our noncontrollingnon-controlling interest in FSFR Glick JV.
As of September 30, 20162017 and September 30, 2015,2016, FSFR Glick JV had total assets of $201.1$126.7 million and $190.4$201.1 million, respectively. Our investment in FSFR Glick JV consisted of LLC equity interests of $6.4 million and Subordinated Notes of $56.9$57.6 million in the aggregate at fair value as of September 30, 2016.2017. As of September 30, 2015,2016, our investment consisted of LLC equity interests of $4.6 million and Subordinated Notes of $52.6$63.3 million in the aggregate at fair value. The Subordinated Notes are junior in right of payment to the repayment of temporary contributions made by us to fund investments of FSFR Glick JV that are repaid when GF Equity Funding and GF Debt Funding make their capital contributions and fund their Subordinated Notes, respectively. FSFR Glick JV's portfolio consisted of middle market and other corporate debt securities of 36 and 29 "eligible portfolio companies" (as defined in section 2(a)(46) of the 1940 Act) as of September 30, 2016 and September 30, 2015, respectively. The portfolio companies in FSFR Glick JV are in industries similar to those in which we may invest directly.
As of September 30, 20162017 and September 30, 2015,2016, FSFR Glick JV had total capital commitments of $100.0 million,million. $87.5 million of which was from us and the remaining $12.5 million from GF Equity Funding and GF Debt Funding. Approximately $81.3$81.6 million and $67.4$81.3 million in aggregate commitments werewas funded as of September 30, 20162017 and September 30, 2015,2016, respectively, of which $71.1$71.4 million and $59.0$71.1 million, respectively, was from us. As of each of September 30, 2017 and September 30, 2016, we had commitments to fund Subordinated Notes to FSFR Glick JV of $78.8 million, of which $14.5 million and $14.7 million, respectively, was unfunded. As of each of September 30, 2017 and September 30, 2016, we had commitments to fund LLC equity interests in FSFR Glick JV of $8.7 million, of which $1.6 million was unfunded. As of September 30, 2015, we had commitments to fund Subordinated Notes to FSFR Glick JV of $78.8 million, of which $25.7 million was unfunded. As of September 30, 2015, we had commitments to fund LLC equity interests in FSFR Glick JV of $8.7 million, of which $2.9 million was unfunded.
Additionally, FSFR Glick JV has the Credit Suisse facility, with a stated maturity date of April 17, 2023, which permitted up to $200.0 million of borrowings as of both September 30, 2016 and September 30, 2015. Borrowings under the Credit Suisse facility are secured by all of the assets of FSFR Glick JV and all of the equity interests in FSFR Glick JV and bore interest at a rate equal to the 3-month LIBOR plus 2.5% per annum with no LIBOR floor as of September 30, 2016 and September 30, 2015. Under the Credit Suisse facility, $124.6 million and $122.4 million in borrowings were outstanding as of September 30, 2016 and September 30, 2015, respectively.
Below is a summary of FSFR Glick JV's portfolio, followed by a listing of the individual loans in FSFR Glick JV's portfolio as of September 30, 20162017 and September 30, 2015:2016: |
| | | | |
| | | September 30, 2017 | | September 30, 2016 |
| Senior secured loans (1) | | $115,964,537 | | $194,346,557 |
| Weighted average current interest rate on senior secured loans (2) | | 6.92% | | 7.08% |
| Number of borrowers in FSFR Glick JV | | 23 | | 36 |
| Largest loan exposure to a single borrower (1) | | $11,267,524 | | $12,641,009 |
| Total of five largest loan exposures to borrowers (1) | | $42,833,696 | | $49,318,344 |
|
| | | | |
| | | September 30, 2016 | | September 30, 2015 |
| Senior secured loans (1) | | $194,346,557 | | $186,764,451 |
| Weighted average current interest rate on senior secured loans (2) | | 7.08% | | 6.93% |
| Number of borrowers in FSFR Glick JV | | 36 | | 29 |
| Largest loan exposure to a single borrower (1) | | $12,641,009 | | $14,777,933 |
| Total of five largest loan exposures to borrowers (1) | | $49,318,344 | | $58,331,216 |
__________
(1) At principal amount.
(2) Computed using the annual interest rate on accruing senior secured loans.
FSFR Glick JV Portfolio as of September 30, 20162017
|
| | | | | | | | | | | | | | | | | | | | |
| Portfolio Company (4) | | Industry | | Investment Type | | Maturity Date | | Current Interest Rate (1) | | Principal | | Cost | | Fair Value (2) |
| Ameritox Ltd. (3) | | Healthcare services | | First Lien Term Loan | | 4/11/2021 | | LIBOR+5% (1% floor) cash 3% PIK | | $ | 2,339,146 |
| | $ | 2,336,840 |
| | $ | 2,322,917 |
|
| | | Healthcare services | | 119,910.76 Class B Preferred Units | | | | | | — |
| | 119,911 |
| | 131,369 |
|
| | | Healthcare services | | 368.96 Class A Common Units | | | | | | — |
| | 2,174,034 |
| | 981,348 |
|
| Total Ameritox, Ltd. | | | | | | | | | | 2,339,146 |
| | 4,630,785 |
| | 3,435,634 |
|
| Answers Corporation (3) (5) | | Internet software & services | | First Lien Term Loan | | 10/3/2021 | | LIBOR+5.25% (1% floor) cash | | 7,899,749 |
| | 7,636,708 |
| | 4,265,865 |
|
| Beyond Trust Software, Inc. (3) | | Application software | | First Lien Term Loan | | 9/25/2019 | | LIBOR+7% (1% floor) cash | | 12,641,009 |
| | 12,554,571 |
| | 12,538,499 |
|
| Compuware Corporation (3) | | Internet software & services | | First Lien Term Loan B1 | | 12/15/2019 | | LIBOR+5.25% (1% floor) cash | | 7,392,405 |
| | 7,306,444 |
| | 7,420,127 |
|
| Metamorph US 3, LLC (3) | | Internet software & services | | First Lien Term Loan | | 12/1/2020 | | LIBOR+6.5% (1% floor) cash | | 6,900,283 |
| | 6,808,009 |
| | 5,744,139 |
|
| Motion Recruitment Partners LLC (3) | | Diversified support services | | First Lien Term Loan | | 2/13/2020 | | LIBOR+6% (1% floor) cash | | 9,125,000 |
| | 9,125,000 |
| | 9,099,254 |
|
| NAVEX Global, Inc. (3) | | Internet software & services | | First Lien Term Loan | | 11/19/2021 | | LIBOR+4.75% (1% floor) cash | | 1,793,550 |
| | 1,779,633 |
| | 1,784,582 |
|
| Teaching Strategies, LLC | | Education services | | First Lien Term Loan (3) | | 10/1/2019 | | LIBOR+5.5% (0.5% floor) cash | | 2,570,471 |
| | 2,567,575 |
| | 2,556,891 |
|
| | | Education services | | First Lien Delayed Draw Term Loan | | 10/1/2019 | | LIBOR+5.5% (0.5% floor) cash | | 6,840,000 |
| | 6,832,715 |
| | 6,803,695 |
|
| Total Teaching Strategies, LLC | | | | | | | | | | 9,410,471 |
| | 9,400,290 |
| | 9,360,586 |
|
| TrialCard Incorporated (3) | | Healthcare services | | First Lien Term Loan | | 12/31/2019 | | LIBOR+4.5% (1% floor) cash | | 7,179,097 |
| | 7,144,396 |
| | 7,144,248 |
|
| Air Newco LLC | | IT consulting & other services | | First Lien Term Loan B | | 3/20/2022 | | LIBOR+5.5% (1% floor) cash | | 8,291,864 |
| | 8,267,671 |
| | 7,960,189 |
|
| Fineline Technologies, Inc. (3) | | Electronic equipment & instruments | | First Lien Term Loan | | 5/5/2017 | | LIBOR+5.5% (1% floor) cash | | 7,034,441 |
| | 7,010,963 |
| | 7,015,051 |
|
| LegalZoom.com, Inc. (3) | | Specialized consumer services | | First Lien Term Loan | | 5/13/2020 | | LIBOR+7% (1% floor) cash | | 9,850,000 |
| | 9,672,034 |
| | 9,772,706 |
|
| GK Holdings, Inc. | | IT consulting & other services | | First Lien Term Loan | | 1/20/2021 | | LIBOR+5.5% (1% floor) cash | | 3,438,750 |
| | 3,452,038 |
| | 3,412,959 |
|
| Vitera Healthcare Solutions, LLC | | Healthcare technology | | Second Lien Term Loan | | 11/4/2021 | | LIBOR+8.25% (1% floor) cash | | 3,000,000 |
| | 2,958,409 |
| | 2,782,500 |
|
| TIBCO Software, Inc. (3) | | Internet software & services | | First Lien Term Loan | | 12/4/2020 | | LIBOR+5.5% (1% floor) cash | | 2,304,900 |
| | 2,308,815 |
| | 2,277,114 |
|
| CM Delaware LLC | | Advertising | | First Lien Term Loan | | 3/18/2021 | | LIBOR+5.25% (1% floor) cash | | 2,096,666 |
| | 2,094,658 |
| | 1,978,729 |
|
| New Trident Holdcorp, Inc. (3) | | Healthcare services | | First Lien Term Loan B | | 7/31/2019 | | LIBOR+5.25% (1.25% floor) cash | | 2,041,357 |
| | 2,014,233 |
| | 1,755,567 |
|
| Central Security Group, Inc. (3) | | Specialized consumer services | | First Lien Term Loan | | 10/6/2020 | | LIBOR+5.625% (1% floor) cash | | 5,909,774 |
| | 5,915,626 |
| | 5,776,805 |
|
| Auction.com, LLC | | Internet software & services | | First Lien Term Loan | | 5/12/2019 | | LIBOR+5% (1% floor) cash | | 3,940,000 |
| | 3,926,700 |
| | 3,959,700 |
|
| | | Portfolio Company | | | Industry | | Investment Type | | Maturity Date | | Current Interest Rate (1)(4) | | Cash Interest Rate (1) | | Principal | | Cost | | Fair Value (2) |
| Ameritox Ltd. (3)(5) | | | Healthcare services | | First Lien Term Loan | | 4/11/2021 | | LIBOR+5% (1% floor) cash 3% PIK | | 6.33 | % | | $ | 2,287,177 |
| | $ | 2,243,202 |
| | $ | 265,211 |
|
| | | | Healthcare services | | 119,910.76 Class B Preferred Units | | | |
| | 119,911 |
| | — |
|
| | | | Healthcare services | | 368.96 Class A Common Units | | | |
| | 2,174,034 |
| | — |
|
| Total Ameritox Ltd. | | | | | 2,287,177 |
| | 4,537,147 |
| | 265,211 |
|
| Beyond Trust Software, Inc. (3) | | | Application software | | First Lien Term Loan | | 9/25/2019 | | LIBOR+7% (1% floor) cash | | 8.33 | % | | 11,267,524 |
| | 11,220,478 |
| | 11,267,116 |
|
| Compuware Corporation (3) | | | Internet software & services | | First Lien Term Loan B3 | | 12/15/2021 | | LIBOR+4.25% (1% floor) cash | | 5.49 | % | | 6,279,920 |
| | 6,225,992 |
| | 6,358,419 |
|
| Metamorph US 3, LLC (3)(5) | | | Internet software & services | | First Lien Term Loan | | 12/1/2020 | | LIBOR+5.5% (1% floor) cash 2% PIK | | 6.74 | % | | 6,825,900 |
| | 6,477,372 |
| | 2,592,115 |
|
| Motion Recruitment Partners LLC (3) | | | Human resources & employment services | | First Lien Term Loan | | 2/13/2020 | | LIBOR+6% (1% floor) cash | | 7.24 | % | | 8,659,650 |
| | 8,659,650 |
| | 8,659,223 |
|
| NAVEX Global, Inc. | | | Internet software & services | | First Lien Term Loan | | 11/19/2021 | | LIBOR+4.25% (1% floor) cash | | 5.49 | % | | 2,977,041 |
| | 2,967,620 |
| | 2,988,205 |
|
| Air Newco LLC | | | IT consulting & other services | | First Lien Term Loan B | | 3/20/2022 | | LIBOR+5.5% (1% floor) cash | | 6.82 | % | | 8,160,622 |
| | 8,141,224 |
| | 8,099,417 |
|
| CM Delaware LLC | | | Advertising | | First Lien Term Loan | | 3/18/2021 | | LIBOR+5.25% (1% floor) cash | | 6.58 | % | | 2,075,162 |
| | 2,073,617 |
| | 2,064,786 |
|
| New Trident Holdcorp, Inc. (3) | | | Healthcare services | | First Lien Term Loan B | | 7/31/2019 | | LIBOR+5.75% (1.25% floor) cash | | 7.08 | % | | 2,018,206 |
| | 2,000,877 |
| | 1,453,109 |
|
| Central Security Group, Inc. (3) | | | Specialized consumer services | | First Lien Term Loan | | 10/6/2021 | | LIBOR+5.625% (1% floor) cash | | 6.86 | % | | 3,876,067 |
| | 3,880,408 |
| | 3,892,211 |
|
| Aptos, Inc. (3) | | Data processing & outsourced services | | First Lien Term Loan B | | 9/1/2022 | | LIBOR+6.75% (1% floor) cash | | 8,000,000 |
| | 7,842,222 |
| | 7,920,000 |
| | Data processing & outsourced services | | First Lien Term Loan B | | 9/1/2022 | | LIBOR+6.75% (1% floor) cash | | 8.08 | % | | 7,920,000 |
| | 7,790,262 |
| | 7,840,800 |
|
| Vubiquity, Inc. | | Application software | | First Lien Term Loan | | 8/12/2021 | | LIBOR+5.5% (1% floor) cash | | 4,168,500 |
| | 4,133,700 |
| | 4,147,658 |
| | Application software | | First Lien Term Loan | | 8/12/2021 | | LIBOR+5.5% (1% floor) cash | | 6.83 | % | | 4,126,500 |
| | 4,099,195 |
| | 4,095,551 |
|
| Too Faced Cosmetics, LLC (3) | | Personal products | | First Lien Term Loan B | | 7/7/2021 | | LIBOR+5% (1% floor) cash | | 642,692 |
| | 581,620 |
| | 645,155 |
| |
| American Seafoods Group LLC (3) | | Food distributors | | First Lien Term Loan | | 8/19/2021 | | LIBOR+5% (1% floor) cash | | 3,853,704 |
| | 3,837,366 |
| | 3,844,069 |
| |
| Worley Claims Services, LLC | | Internet software & services | | First Lien Term Loan | | 10/31/2020 | | LIBOR+8% (1% floor) cash | | 5,730,937 |
| | 5,707,511 |
| | 5,702,282 |
| |
| Poseidon Merger Sub, Inc. (3) | | Advertising | | Second Lien Term Loan | | 8/15/2023 | | LIBOR+8.5% (1% floor) cash | | 3,000,000 |
| | 2,922,316 |
| | 3,039,954 |
| | Advertising | | Second Lien Term Loan | | 8/15/2023 | | LIBOR+8.5% (1% floor) cash | | 9.81 | % | | 3,000,000 |
| | 2,933,633 |
| | 3,030,000 |
|
| AccentCare, Inc. | | Healthcare services | | First Lien Term Loan | | 9/3/2021 | | LIBOR+5.75% (1% floor) cash | | 7,850,000 |
| | 7,773,386 |
| | 7,727,344 |
| |
| Novetta Solutions, LLC | | Diversified support services | | First Lien Term Loan | | 10/17/2022 | | LIBOR+5.75% (1% floor) cash | | 6,477,948 |
| | 6,392,100 |
| | 6,226,928 |
| | Diversified support services | | First Lien Term Loan | | 10/16/2022 | | LIBOR+5% (1% floor) cash | | 6.34 | % | | 5,990,978 |
| | 5,932,073 |
| | 5,826,226 |
|
| SHO Holding I Corporation | | Footwear | | First Lien Term Loan | | 10/27/2022 | | LIBOR+5% (1% floor) cash | | 6,451,250 |
| | 6,393,472 |
| | 6,443,186 |
| | Footwear | | First Lien Term Loan | | 10/27/2022 | | LIBOR+5% (1% floor) cash | | 6.24 | % | | 6,386,250 |
| | 6,338,479 |
| | 6,306,422 |
|
| Valet Merger Sub, Inc. (3) | | Environmental & facilities services | | First Lien Term Loan | | 9/24/2021 | | LIBOR+7% (1% floor) cash | | 3,960,000 |
| | 3,906,498 |
| | 4,026,826 |
| | Environmental & facilities services | | First Lien Term Loan | | 9/24/2021 | | LIBOR+7% (1% floor) cash | | 8.24 | % | | 3,920,000 |
| | 3,877,655 |
| | 3,919,865 |
|
| | | | Environmental & facilities services | | Incremental Term Loan | | 9/24/2021 | | LIBOR+7% (1% floor) cash | | 8.24 | % | | 1,027,425 |
| | 1,006,080 |
| | 1,027,390 |
|
| Total Valet Merger Sub, Inc. (3) | | | | | 4,947,425 |
| | 4,883,735 |
| | 4,947,255 |
|
| RSC Acquisition, Inc. | | Insurance brokers | | First Lien Term Loan | | 11/30/2022 | | LIBOR+5.25% (1% floor) cash | | 3,970,390 |
| | 3,948,754 |
| | 3,950,538 |
| | Insurance brokers | | First Lien Term Loan | | 11/30/2022 | | LIBOR+5.25% (1% floor) cash | | 6.58 | % | | 3,930,134 |
| | 3,912,198 |
| | 3,890,832 |
|
| Integro Parent Inc. | | Insurance brokers | | First Lien Term Loan | | 10/31/2022 | | LIBOR+5.75% (1% floor) cash | | 4,963,924 |
| | 4,814,658 |
| | 4,889,465 |
| | Insurance brokers | | First Lien Term Loan | | 10/31/2022 | | LIBOR+5.75% (1% floor) cash | | 7.06 | % | | 4,913,924 |
| | 4,790,511 |
| | 4,901,639 |
|
| TruckPro, LLC | | Auto parts & equipment | | First Lien Term Loan | | 8/6/2018 | | LIBOR+5% (1% floor) cash | | 1,920,000 |
| | 1,916,612 |
| | 1,919,232 |
| | Auto parts & equipment | | First Lien Term Loan | | 8/6/2018 | | LIBOR+5% (1% floor) cash | | 6.24 | % | | 1,823,268 |
| | 1,821,822 |
| | 1,825,054 |
|
| Falmouth Group Holdings Corp. | | Specialty chemicals | | First Lien Term Loan | | 12/13/2021 | | LIBOR+6.75% (1% floor) cash | | 4,962,500 |
| | 4,912,596 |
| | 4,967,689 |
| | Specialty chemicals | | First Lien Term Loan | | 12/13/2021 | | LIBOR+6.75% (1% floor) cash | | 8.08 | % | | 4,610,174 |
| | 4,572,990 |
| | 4,610,400 |
|
| Sundial Group Holdings LLC | | Personal products | | First Lien Term Loan | | 10/19/2021 | | LIBOR+6.25% (1% floor) cash | | 3,900,000 |
| | 3,839,938 |
| | 3,954,402 |
| |
| Onvoy, LLC (3) | | Integrated telecommunication services | | First Lien Term Loan | | 4/29/2021 | | LIBOR+6.25% (1% floor) cash | | 7,406,250 |
| | 7,261,422 |
| | 7,386,738 |
| |
| Ancile Solutions, Inc. (3) | | Internet software & services | | First Lien Term Loan | | 6/30/2021 | | LIBOR+7% (1% floor) cash | | 4,500,000 |
| | 4,433,644 |
| | 4,432,500 |
| | Internet software & services | | First Lien Term Loan | | 6/30/2021 | | LIBOR+7% (1% floor) cash | | 8.33 | % | | 4,042,355 |
| | 3,995,621 |
| | 4,010,198 |
|
| California Pizza Kitchen, Inc. | | | Restaurants | | First Lien Term Loan | | 8/23/2022 | | LIBOR+6% (1% floor) cash | | 7.24 | % | | 4,950,000 |
| | 4,938,077 |
| | 4,917,008 |
|
| MHE Intermediate Holdings, LLC (3) | | | Diversified support services | | First Lien Term Loan B | | 3/11/2024 | | LIBOR+5% (1% floor) cash | | 6.33 | % | | 4,228,750 |
| | 4,150,304 |
| | 4,228,752 |
|
| | | | Diversified support services | | Delayed Draw Term Loan | | 3/11/2024 | | LIBOR+5% (1% floor) cash | | 6.33 | % | | 667,510 |
| | 635,208 |
| | 667,510 |
|
| Total MHE Intermediate Holdings, LLC | | | | | 4,896,260 |
| | 4,785,512 |
| | 4,896,262 |
|
| Total Portfolio Investments | | $ | 194,346,557 |
| | $ | 194,624,798 |
| | $ | 188,708,220 |
| | | | $ | 115,964,537 |
| | $ | 116,978,493 |
| | $ | 108,737,459 |
|
__________
(1) Represents the current interest rate as of September 30, 2016.2017. All interest rates are payable in cash, unless otherwise noted.
(2) Represents the current determination of fair value as of September 30, 20162017 utilizing a similar processtechnique as us in accordance with ASC 820. However, the determination of such fair value is not included in our Board of Directors' valuation process described elsewhere herein.
(3) This investment is held by both us and FSFR Glick JV atas of September 30, 2016.2017.
(4) The interest rate on the principal balance outstanding for all floating rate loans is indexed to LIBOR andand/or an alternate base rate (e.g., prime rate), which typically resets semi-annually, quarterly, or monthly at the borrower's option. The borrower may also elect to have multiple interest reset periods for each loan. For each of these loans, we have provided the applicable margin over LIBOR or the alternate base rate based on each respective credit agreement.
(5) This investment was on cash non-accrual status as of September 30, 2016.
2017.
FSFR Glick JV Portfolio as of September 30, 20152016
| | Portfolio Company (4) | | Industry | | Investment Type | | Maturity Date | | Current Interest Rate (1) | | Principal | | Cost | | Fair Value (2) | | Industry | | Investment Type | | Maturity Date | | Current Interest Rate (1)(4) | | Cash Interest Rate (1) | | Principal | | Cost | | Fair Value (2) |
| Accruent, LLC (3) | | Internet software & services | | First Lien Term Loan | | 11/25/2019 | | LIBOR +6.25% (1% floor) cash | | $ | 14,777,933 |
| | $ | 14,576,963 |
| | $ | 14,853,895 |
| |
| Ameritox Ltd. (3) | | Healthcare services | | First Lien Term Loan | | 6/23/2019 | | LIBOR+7.5% (1% floor) cash | | 7,794,458 |
| | 7,661,251 |
| | 7,048,923 |
| | Healthcare services | | First Lien Term Loan | | 4/11/2021 | | LIBOR+5% (1% floor) cash 3% PIK | | 6.00 | % | | $ | 2,339,146 |
| | $ | 2,336,840 |
| | $ | 2,322,917 |
|
| Answers Corporation (3) | | Internet software & services | | First Lien Term Loan | | 10/1/2021 | | LIBOR+5.25% (1% floor) cash | | 7,959,900 |
| | 7,658,675 |
| | 5,857,173 |
| |
| | | | Healthcare services | | 119,910.76 Class B Preferred Units | | | | — |
| | 119,911 |
| | 131,369 |
|
| | | | Healthcare services | | 368.96 Class A Common Units | | | | — |
| | 2,174,034 |
| | 981,348 |
|
| Total Ameritox Ltd. | | | | | 2,339,146 |
| | 4,630,785 |
| | 3,435,634 |
|
| Answers Corporation (3) (5) | | | Internet software & services | | First Lien Term Loan | | 10/3/2021 | | LIBOR+5.25% (1% floor) cash | | 6.25 | % | | 7,899,749 |
| | 7,636,708 |
| | 4,265,865 |
|
| Beyond Trust Software, Inc. (3) | | Application software | | First Lien Term Loan | | 9/25/2019 | | LIBOR+7% (1% floor) cash | | 13,665,783 |
| | 13,549,710 |
| | 13,549,671 |
| | Application software | | First Lien Term Loan | | 9/25/2019 | | LIBOR+7% (1% floor) cash | | 8.00 | % | | 12,641,009 |
| | 12,554,571 |
| | 12,538,499 |
|
| Compuware Corporation (3) | | Internet software & services | | First Lien Term Loan B1 | | 12/15/2019 | | LIBOR+5.25% (1% floor) cash | | 7,797,468 |
| | 7,684,361 |
| | 7,551,848 |
| | Internet software & services | | First Lien Term Loan B1 | | 12/15/2019 | | LIBOR+5.25% (1% floor) cash | | 6.25 | % | | 7,392,405 |
| | 7,306,444 |
| | 7,420,127 |
|
| Idera, Inc. (3) | | Internet software & services | | First Lien Term Loan | | 11/5/2020 | | LIBOR+5.5% (0.5% floor) cash | | 3,160,000 |
| | 3,134,841 |
| | 3,160,000 |
| |
| Metamorph US 3, LLC (3) | | Internet software & services | | First Lien Term Loan | | 12/1/2020 | | LIBOR+5.5% (1% floor) cash | | 8,398,019 |
| | 8,283,147 |
| | 8,310,898 |
| | Internet software & services | | First Lien Term Loan | | 12/1/2020 | | LIBOR+6.5% (1% floor) cash | | 7.50 | % | | 6,900,283 |
| | 6,808,009 |
| | 5,744,139 |
|
| Motion Recruitment Partners LLC (3) | | Diversified support services | | First Lien Term Loan | | 2/13/2020 | | LIBOR+6% (1% floor) cash | | 9,562,500 |
| | 9,562,500 |
| | 9,459,652 |
| | Human resources & employment services | | First Lien Term Loan | | 2/13/2020 | | LIBOR+6% (1% floor) cash | | 7.00 | % | | 9,125,000 |
| | 9,125,000 |
| | 9,099,254 |
|
| NAVEX Global, Inc. (3) | | Internet software & services | | First Lien Term Loan | | 11/19/2021 | | LIBOR+4.75% (1% floor) cash | | 2,435,442 |
| | 2,429,788 |
| | 2,423,265 |
| | Internet software & services | | First Lien Term Loan | | 11/19/2021 | | LIBOR+4.75% (1% floor) cash | | 5.99 | % | | 1,793,550 |
| | 1,779,633 |
| | 1,784,582 |
|
| Teaching Strategies, LLC (3) | | Education services | | First Lien Term Loan | | 10/1/2019 | | LIBOR+5.5% (0.5% floor) cash | | 2,695,442 |
| | 2,691,552 |
| | 2,673,135 |
| |
| Teaching Strategies, LLC | | Education services | | First Lien Delayed Draw Term Loan | | 10/1/2019 | | LIBOR+5.5% (0.5% floor) cash | | 7,020,000 |
| | 7,010,218 |
| | 6,961,725 |
| | Education services | | First Lien Term Loan (3) | | 10/1/2019 | | LIBOR+5.5% (0.5% floor) cash | | 6.34 | % | | 2,570,471 |
| | 2,567,575 |
| | 2,556,891 |
|
| | | | Education services | | First Lien Delayed Draw Term Loan | | 10/1/2019 | | LIBOR+5.5% (0.5% floor) cash | | 6.34 | % | | 6,840,000 |
| | 6,832,715 |
| | 6,803,695 |
|
| Total Teaching Strategies, LLC | | | | | 9,410,471 |
| | 9,400,290 |
| | 9,360,586 |
|
| TrialCard Incorporated (3) | | Healthcare services | | First Lien Term Loan | | 12/31/2019 | | LIBOR+5% (1% floor) cash | | 7,332,387 |
| | 7,286,727 |
| | 7,232,017 |
| | Healthcare services | | First Lien Term Loan | | 12/31/2019 | | LIBOR+4.5% (1% floor) cash | | 5.50 | % | | 7,179,097 |
| | 7,144,396 |
| | 7,144,248 |
|
| Air Newco LLC | | IT consulting & other services | | First Lien Term Loan B | | 3/20/2022 | | LIBOR+5.5% (1% floor) cash | | 5,970,000 |
| | 6,004,722 |
| | 5,977,463 |
| | IT consulting & other services | | First Lien Term Loan B | | 3/20/2022 | | LIBOR+5.5% (1% floor) cash | | 6.50 | % | | 8,291,864 |
| | 8,267,671 |
| | 7,960,189 |
|
| Fineline Technologies, Inc. (3) | | Electronic equipment & instruments | | First Lien Term Loan | | 5/5/2017 | | LIBOR+5.5% (1% floor) cash | | 8,820,000 |
| | 8,749,565 |
| | 8,818,256 |
| | Electronic equipment & instruments | | First Lien Term Loan | | 5/5/2017 | | LIBOR+5.5% (1% floor) cash | | 6.50 | % | | 7,034,441 |
| | 7,010,963 |
| | 7,015,051 |
|
| LegalZoom.com, Inc. (3) | | Specialized consumer services | | First Lien Term Loan | | 5/13/2020 | | LIBOR+7% (1% floor) cash | | 9,950,000 |
| | 9,721,186 |
| | 9,882,838 |
| | Specialized consumer services | | First Lien Term Loan | | 5/13/2020 | | LIBOR+7% (1% floor) cash | | 8.00 | % | | 9,850,000 |
| | 9,672,034 |
| | 9,772,706 |
|
| GK Holdings, Inc. | | IT consulting & other services | | First Lien Term Loan | | 1/20/2021 | | LIBOR+5.5% (1% floor) cash | | 3,473,750 |
| | 3,490,164 |
| | 3,460,723 |
| | IT consulting & other services | | First Lien Term Loan | | 1/20/2021 | | LIBOR+5.5% (1% floor) cash | | 6.50 | % | | 3,438,750 |
| | 3,452,038 |
| | 3,412,959 |
|
| Vitera Healthcare Solutions, LLC | | Healthcare technology | | Second Lien Term Loan | | 11/4/2021 | | LIBOR+8.25% (1% floor) cash | | 3,000,000 |
| | 2,950,227 |
| | 2,925,000 |
| | Healthcare technology | | Second Lien Term Loan | | 11/4/2021 | | LIBOR+8.25% (1% floor) cash | | 9.25 | % | | 3,000,000 |
| | 2,958,409 |
| | 2,782,500 |
|
| TIBCO Software, Inc. (3) | | Internet software & services | | First Lien Term Loan | | 12/4/2020 | | LIBOR+5.5% (1% floor) cash | | 2,328,300 |
| | 2,333,155 |
| | 2,310,838 |
| | Internet software & services | | First Lien Term Loan | | 12/4/2020 | | LIBOR+5.5% (1% floor) cash | | 6.50 | % | | 2,304,900 |
| | 2,308,815 |
| | 2,277,114 |
|
| CM Delaware LLC | | Advertising | | First Lien Term Loan | | 3/18/2021 | | LIBOR+5.25% (1% floor) cash | | 2,152,041 |
| | 2,149,579 |
| | 2,143,971 |
| | Advertising | | First Lien Term Loan | | 3/18/2021 | | LIBOR+5.25% (1% floor) cash | | 6.25 | % | | 2,096,666 |
| | 2,094,658 |
| | 1,978,729 |
|
| New Trident Holdcorp, Inc. (3) | | Healthcare services | | First Lien Term Loan B | | 7/31/2019 | | LIBOR+5.25% (1.25% floor) cash | | 2,064,508 |
| | 2,027,520 |
| | 2,000,003 |
| | Healthcare services | | First Lien Term Loan B | | 7/31/2019 | | LIBOR+5.25% (1.25% floor) cash | | 6.50 | % | | 2,041,357 |
| | 2,014,233 |
| | 1,755,567 |
|
| Central Security Group, Inc. (3) | | Specialized consumer services | | First Lien Term Loan | | 10/6/2020 | | LIBOR+5.25% (1% floor) cash | | 5,969,925 |
| | 5,977,239 |
| | 5,910,225 |
| | Specialized consumer services | | First Lien Term Loan | | 10/6/2020 | | LIBOR+5.625% (1% floor) cash | | 6.63 | % | | 5,909,774 |
| | 5,915,626 |
| | 5,776,805 |
|
| Language Line, LLC (3) | | Integrated telecommunication services | | First Lien Term Loan | | 7/7/2021 | | LIBOR+5.5% (1% floor) cash | | 10,000,000 |
| | 10,013,409 |
| | 10,020,850 |
| |
| All Web Leads, Inc. (3) | | Advertising | | First Lien Term Loan | | 6/30/2020 | | LIBOR+6.5% (1% floor) cash | | 9,937,500 |
| | 9,700,212 |
| | 9,884,905 |
| |
| Auction.com, LLC | | Internet software & services | | First Lien Term Loan | | 5/12/2019 | | LIBOR+5% (1% floor) cash | | 3,980,000 |
| | 3,961,380 |
| | 3,970,050 |
| | Internet software & services | | First Lien Term Loan | | 5/12/2019 | | LIBOR+5% (1% floor) cash | | 6.00 | % | | 3,940,000 |
| | 3,926,700 |
| | 3,959,700 |
|
| Aptos, Inc. (3) | | Data processing & outsourced services | | First Lien Term Loan B | | 6/23/2022 | | LIBOR+5.25% (0.75% floor) cash | | 7,980,000 |
| | 7,999,277 |
| | 7,960,050 |
| | Data processing & outsourced services | | First Lien Term Loan B | | 9/1/2022 | | LIBOR+6.75% (1% floor) cash | | 7.75 | % | | 8,000,000 |
| | 7,842,222 |
| | 7,920,000 |
|
| Vubiquity, Inc. | | Application software | | First Lien Term Loan | | 8/12/2021 | | LIBOR+5.5% (1% floor) cash | | 4,200,000 |
| | 4,158,000 |
| | 4,179,000 |
| | Application software | | First Lien Term Loan | | 8/12/2021 | | LIBOR+5.5% (1% floor) cash | | 6.50 | % | | 4,168,500 |
| | 4,133,700 |
| | 4,147,658 |
|
| Too Faced Cosmetics, LLC (3) | | Personal products | | First Lien Term Loan B | | 7/7/2021 | | LIBOR+5% (1% floor) cash | | 3,000,000 |
| | 2,926,072 |
| | 3,000,000 |
| |
| American Seafoods Group LLC (3) | | Food distributors | | First Lien Term Loan | | 8/19/2021 | | LIBOR+5% (1% floor) cash | | 4,000,000 |
| | 3,980,282 |
| | 3,980,000 |
| |
| Worley Claims Services, LLC (3) | | Internet software & services | | First Lien Term Loan | | 10/31/2020 | | LIBOR+8% (1% floor) cash | | 4,339,095 |
| | 4,317,702 |
| | 4,317,400 |
| |
| Poseidon Merger Sub, Inc. (3) | | Advertising | | Second Lien Term Loan | | 8/15/2023 | | LIBOR+8.5% (1% floor) cash | | 3,000,000 |
| | 2,910,947 |
| | 3,000,000 |
| |
| Total Portfolio Investments | | $ | 186,764,451 |
| | $ | 184,900,371 |
| | $ | 182,823,774 |
| |
|
| | | | | | | | | | | | | | | | | | | | | | | |
| Too Faced Cosmetics, LLC (3) | | Personal products | | First Lien Term Loan B | | 7/7/2021 | | LIBOR+5% (1% floor) cash | | 6.00 | % | | 642,692 |
| | 581,620 |
| | 645,155 |
|
| American Seafoods Group LLC (3) | | Food distributors | | First Lien Term Loan | | 8/19/2021 | | LIBOR+5% (1% floor) cash | | 6.00 | % | | 3,853,704 |
| | 3,837,366 |
| | 3,844,069 |
|
| Worley Claims Services, LLC | | Internet software & services | | First Lien Term Loan | | 10/31/2020 | | LIBOR+8% (1% floor) cash | | 9.00 | % | | 5,730,937 |
| | 5,707,511 |
| | 5,702,282 |
|
| Poseidon Merger Sub, Inc. (3) | | Advertising | | Second Lien Term Loan | | 8/15/2023 | | LIBOR+8.5% (1% floor) cash | | 9.50 | % | | 3,000,000 |
| | 2,922,316 |
| | 3,039,954 |
|
| AccentCare, Inc. | | Healthcare services | | First Lien Term Loan | | 9/3/2021 | | LIBOR+5.75% (1% floor) cash | | 6.75 | % | | 7,850,000 |
| | 7,773,386 |
| | 7,727,344 |
|
| Novetta Solutions, LLC | | Diversified support services | | First Lien Term Loan | | 10/17/2022 | | LIBOR+5.75% (1% floor) cash | | 6.00 | % | | 6,477,948 |
| | 6,392,100 |
| | 6,226,928 |
|
| SHO Holding I Corporation | | Footwear | | First Lien Term Loan | | 10/27/2022 | | LIBOR+5% (1% floor) cash | | 6.00 | % | | 6,451,250 |
| | 6,393,472 |
| | 6,443,186 |
|
| Valet Merger Sub, Inc. (3) | | Environmental & facilities services | | First Lien Term Loan | | 9/24/2021 | | LIBOR+7% (1% floor) cash | | 8.00 | % | | 3,960,000 |
| | 3,906,498 |
| | 4,026,826 |
|
| RSC Acquisition, Inc. | | Insurance brokers | | First Lien Term Loan | | 11/30/2022 | | LIBOR+5.25% (1% floor) cash | | 6.25 | % | | 3,970,390 |
| | 3,948,754 |
| | 3,950,538 |
|
| Integro Parent Inc. | | Insurance brokers | | First Lien Term Loan | | 10/31/2022 | | LIBOR+5.75% (1% floor) cash | | 6.75 | % | | 4,963,924 |
| | 4,814,658 |
| | 4,889,465 |
|
| TruckPro, LLC | | Auto parts & equipment | | First Lien Term Loan | | 8/6/2018 | | LIBOR+5% (1% floor) cash | | 6.00 | % | | 1,920,000 |
| | 1,916,612 |
| | 1,919,232 |
|
| Falmouth Group Holdings Corp. | | Specialty chemicals | | First Lien Term Loan | | 12/13/2021 | | LIBOR+6.75% (1% floor) cash | | 7.75 | % | | 4,962,500 |
| | 4,912,596 |
| | 4,967,689 |
|
| Sundial Group Holdings LLC | | Personal products | | First Lien Term Loan | | 10/19/2021 | | LIBOR+6.25% (1% floor) cash | | 7.25 | % | | 3,900,000 |
| | 3,839,938 |
| | 3,954,402 |
|
| Onvoy, LLC (3) | | Integrated telecommunication services | | First Lien Term Loan | | 4/29/2021 | | LIBOR+6.25% (1% floor) cash | | 7.25 | % | | 7,406,250 |
| | 7,261,422 |
| | 7,386,738 |
|
| Ancile Solutions, Inc. (3) | | Internet software & services | | First Lien Term Loan | | 6/30/2021 | | LIBOR+7% (1% floor) cash | | 8.00 | % | | 4,500,000 |
| | 4,433,644 |
| | 4,432,500 |
|
| Total Portfolio Investments | | | | | | | | | | | | $ | 194,346,557 |
| | $ | 194,624,798 |
| | $ | 188,708,220 |
|
__________
(1) Represents the current interest rate as of September 30, 2015.2016. All interest rates are payable in cash, unless otherwise noted.
(2) Represents the current determination of fair value determinedas of September 30, 2016 utilizing a similar processtechnique as us in accordance with ASC 820. However, the determination of such fair value is not included in our Board of Directors' valuation process described elsewhere herein.
(3) This investment is held by both us and FSFR Glick JV atas of September 30, 2015.2016.
(4) The interest rate on the principal balance outstanding for all floating rate loans is indexed to LIBOR andand/or an alternate base rate (e.g., prime rate), which typically resets semi-annually, quarterly, or monthly at the borrower's option. The borrower may also elect to have multiple interest reset periods for each loan. For each of these loans, we have provided the applicable margin over LIBOR or the alternate base rate based on each respective credit agreement.
(5) This investment was on cash non-accrual status as of September 30, 2016.
The amortized cost and fair value of the Subordinated Notesour aggregate investment in FSFR Glick JV held by us was $64.0$71.3 million and $56.9$57.6 million, respectively, as of September 30, 20162017 and $53.1$71.1 million and $52.6$63.3 million, respectively, as of September 30, 2015.2016. The Subordinated Notes pay a weighted average interest rate of LIBOR plus 8.0% per annum. For the yearsyear ended September 30, 20162017 and September 30, 2015,2016, we earned interest income of $5.1$5.8 million and $1.8$5.1 million, respectively, on our investment in the Subordinated Notes. The cost and fair valueNotes, respectively. We reversed $0.6 million of dividend income previously recorded in prior periods during the year ended September 30, 2017 with respect to our LLC equity interests held by us was $7.1 million and $6.4 million as of September 30, 2016, respectively and $5.9 million and $4.6 million, respectively, as of September 30, 2015.since we determined that such dividend payments may no longer be collectible. We earned dividend income of $0.7$2.7 million for each of the yearsyear ended September 30, 2016 and September 30, 2015 with respect to ourits LLC equity interests. The LLC equity interests are dividend producing to the extent there isFSFR Glick JV has residual incomecash to be distributed on a quarterly basis. The total investment income earned on FSFR Glick JV represented a 11.7% and 12.4% weighted average annualized return on our total investment as of September 30, 2016 and September 30, 2015, respectively.
Below is certain summarized financial information for FSFR Glick JV as of September 30, 20162017 and September 30, 20152016 and for the years ended September 30, 20162017 and 2015:September 30, 2016:
| | | | | September 30, 2016 | | September 30, 2015 | | September 30, 2017 | | September 30, 2016 |
| Selected Balance Sheet Information: | | | | | | | | |
| Investments in loans at fair value (cost September 30, 2016: $194,624,798; cost September 30, 2015: $184,900,371) | | $ | 188,708,220 |
| | $ | 182,823,774 |
| |
| Investments in loans at fair value (cost September 30, 2017: $116,978,493; cost September 30, 2016: $194,624,798) | | | $ | 108,737,459 |
| | $ | 188,708,220 |
|
| Receivable from secured financing arrangement at fair value (September 30, 2016 cost: $5,000,000) | | 4,985,425 |
| | — |
| | — |
| | 4,985,425 |
|
| Cash and cash equivalents | | 980,605 |
| | 3,127,824 |
| | 13,891,899 |
| | 980,605 |
|
| Restricted cash | | 3,343,303 |
| | 2,188,133 |
| | 2,249,575 |
| | 3,343,303 |
|
| Receivable from unsettled transactions | | 952,591 |
| | — |
| | — |
| | 952,591 |
|
| Due from portfolio companies | | | 7,653 |
| | — |
|
| Other assets | | 2,162,942 |
| | 2,253,143 |
| | 1,791,077 |
| | 2,162,942 |
|
| Total assets | | $ | 201,133,086 |
| | $ | 190,392,874 |
| | $ | 126,677,663 |
| | $ | 201,133,086 |
|
| | | | | | | | | |
| Senior credit facility payable | | $ | 124,615,636 |
| | $ | 122,380,636 |
| | $ | 56,881,939 |
| | $ | 124,615,636 |
|
| Subordinated notes payable at fair value (proceeds September 30, 2016: $73,149,434; proceeds September 30, 2015: $60,680,682) | | 65,012,167 |
| | 60,118,109 |
| |
| Subordinated notes payable at fair value (proceeds September 30, 2017: $73,404,435; cost September 30, 2016: $73,149,434) | | | 65,836,199 |
| | 65,012,167 |
|
| Other liabilities | | 4,196,688 |
| | 2,690,043 |
| | 3,959,525 |
| | 4,196,688 |
|
| Total liabilities | | $ | 193,824,491 |
| | $ | 185,188,788 |
| | $ | 126,677,663 |
| | $ | 193,824,491 |
|
| Members' equity | | 7,308,595 |
| | 5,204,086 |
| | — |
| | 7,308,595 |
|
| Total liabilities and members' equity | | $ | 201,133,086 |
| | $ | 190,392,874 |
| | $ | 126,677,663 |
| | $ | 201,133,086 |
|
| | | | | Year ended
September 30, 2016 | | Year ended
September 30, 2015 | | Year ended
September 30, 2017 | | Year ended
September 30, 2016 |
| Selected Statement of Operations Information: | | | | | |
| Selected Statements of Operations Information: | | | | | |
| Interest income | | $ | 14,109,946 |
| | $ | 4,295,162 |
| | $ | 11,148,203 |
| | $ | 14,109,946 |
|
| PIK interest income | | 33,170 |
| | — |
| | 53,620 |
| | 33,170 |
|
| Fee income | | 95,756 |
| | — |
| | 160,984 |
| | 95,756 |
|
| Total investment income | | 14,238,872 |
| | 4,295,162 |
| | 11,362,807 |
| | 14,238,872 |
|
| Interest expense | | $ | 10,780,919 |
| | $ | 3,408,486 |
| | $ | 11,055,880 |
| | $ | 10,780,919 |
|
| Other expenses | | 283,267 |
| | 56,281 |
| | 224,559 |
| | 283,267 |
|
| Total expenses (1) | | 11,064,186 |
| | 3,464,767 |
| | 11,280,439 |
| | 11,064,186 |
|
| Net unrealized appreciation (depreciation) | | $ | 3,832,274 |
| | $ | (1,514,024 | ) | | $ | (2,893,408 | ) | | $ | 3,832,274 |
|
| Realized loss on investments | | (3,119,735 | ) | | — |
| | (3,873,454 | ) | | (3,119,735 | ) |
| Net income (loss) | | $ | 3,887,225 |
| | $ | (683,629 | ) | | $ | (6,684,494 | ) | | $ | 3,887,225 |
|
__________
(1) There are no management fees or incentive fees charged at FSFR Glick JV.
FSFR Glick JV has elected to fair value the Subordinated Notes issued to usthe Company and GF Debt Funding under FASB ASC Topic 825 — Financial Instruments, or ASC 825.Instruments. The Subordinated Notessubordinated notes are valued by calculatingbased on the net presenttotal assets less the liabilities senior to the subordinated notes of FSFR Glick JV in an amount not exceeding par under the enterprise value oftechnique.
During the future expected cash flow streams using an appropriate risk-adjusted discount rate model.
year ended September 30, 2017, we did not sell any senior secured debt investments to FSFR Glick JV. During the year ended September 30, 2016, we sold $48.9 million of senior secured debt investments at fair value to FSFR Glick JV in exchange for $47.6 million cash consideration, $1.2 million of subordinated notes in FSFR Glick JV and $0.1 million of LLC equity interests in FSFR Glick JV. We realized a loss of $0.5 million on these transactions. During the year ended September 30, 2015, we sold $179.8 million of senior secured debt investments at fair value to FSFR Glick JV in exchange for $121.0 million cash consideration, $52.9 million of subordinated notes in FSFR Glick JV and $5.9 million of LLC equity interests in FSFR Glick JV. We recognized a $2.0 million realized loss on these transactions.
Discussion and Analysis of Results and Operations
Revisions to Prior Period Financial Information
We previously identified accounting errors from the commencement of operations through September 30, 2015 related to revenue recognition. The revenue recognition errors were the result of certain fees which were historically recognized on the deal closing date, but should have been amortized over the life of the loan since the fees did not represent a separately identifiable revenue contract. These errors were partially offset by the overpayment of Part I and Part II Incentive Fees paid to the investment adviser. We assessed the materiality of the errors on our prior quarterly and annual financial statements, assessing materiality both quantitatively and qualitatively, in accordance with the SEC’s Staff Accounting Bulletin, or SAB, No. 99 and No. 108, and concluded that the errors were not material to any of the previously issued financial statements. However, we concluded the cumulative corrections of these errors would be qualitatively material to our quarterly financial statements within any quarter during the September 30, 2015 fiscal year end, and, therefore, it was not appropriate to recognize the cumulative corrections in any 2015 period. Accordingly, all prior period financial statements from the commencement of operations to June 30, 2015 have been revised. These errors did not impact the financial information for the years ended September 30, 2016 and 2015. Refer to Note 2 of the Consolidated Financial Statements for additional information and a reconciliation of annual financial statements previously filed to revised amounts.
Results of Operations
The principal measure of our financial performance is the net increase (decrease) in net assets resulting from operations, which includes net investment income, (loss), net realized gain (loss) and net unrealized appreciation (depreciation). Net investment income is the difference between our income from interest, dividends, fees, and other investment income and total expenses. Net realized gain (loss) on investments and secured borrowings is the difference between the proceeds received from dispositions or other realizations of portfolio investments and secured borrowings and their stated costs. Net unrealized appreciation (depreciation) is the net change in the fair value of our investment portfolio and secured borrowings during the reporting period, including the reversal of previously recorded unrealized appreciation (depreciation) when gains or losses are realized.
Comparison of the yearsYears ended September 30, 20162017 and September 30, 20152016
Total Investment Income
Total investment income includes interest income on our investments, fee income and other investment income. Fee
Total investment income consists principallyfor the years ended September 30, 2017 and September 30, 2016 was $46.6 million and $53.4 million, respectively. For the year ended September 30, 2017, this amount primarily consisted of servicing, advisory, structuring, amendment$44.9 million of interest income from portfolio investments (which included $0.4 million of PIK interest) and prepayment$2.2 million of fee income. For the year ended September 30, 2016, this amount primarily consisted of $47.6 million of interest income from portfolio investments (which included $0.2 million of PIK interest), $3.1 million of fee income and $2.7 million of dividend income. The decrease of $6.9 million in our total investment income for the year ended September 30, 2017, as compared to the year ended September 30, 2016, was primarily attributable to a lower weighted average annual yield on our debt investments and lower dividend income earned on our investment in FSFR Glick JV. The weighted average annual yield on our debt investments as of September 30, 2017, including the return on our subordinated note investment in FSFR Glick JV, was approximately 7.52%, as compared to 8.58% as of September 30, 2016.
Expenses
Net expenses (expenses net of base management fee waivers and insurance recoveries) for the years ended September 30, 2017 and September 30, 2016 were $24.2 million and $28.1 million, respectively. The decrease of $3.9 million in our net expenses for the year ended September 30, 2017, as compared to the year ended September 30, 2016, was primarily due to a $2.9 million decrease in professional fees that we received(net of insurance recoveries) incurred in connection with proxy-related matters, a $2.0 million decrease in Part I incentive fees payable to our investment adviser, which was attributable to lower pre-incentive fee net investment income for the year-over-year period, partially offset by a $1.2 million increase in interest expense attributable to higher interest rates in the current year.
Net Investment Income
As a result of the $6.9 million decrease in total investment income, offset by the $3.9 million decrease in net expenses, net investment income for the year ended September 30, 2017 reflected an approximate $2.9 million decrease, as compared to the year ended September 30, 2016.
Realized Gain (Loss) on Investments
Realized gains or losses are measured by the difference between the net proceeds from the sale or redemption of portfolio investments and the cost basis of the investments without regard to unrealized appreciation or depreciation previously recognized, and includes investments written-off during the period, net of recoveries. Realized losses may also be recorded in connection with our debt investments. These feesdetermination that certain investments are recognized as earned. Other investment income consistsconsidered worthless securities and/or meet the conditions for loss recognition per the applicable tax rules.
Realized losses on investments and secured borrowings increased from $12.8 million for the year ended September 30, 2016 to $13.4 million for the year ended September 30, 2017. Realized losses for the year ended September 30, 2017 were primarily of dividend income received from certainattributable to the sale of our equityinvestment in Answers Corporation. Realized losses for the year ended September 30, 2016 were primarily attributable to the restructuring of our investment in Ameritox Ltd. and the disposition of our investment in B&H Education Inc.
See “Note 9. Realized Gains or Losses and Net Unrealized Appreciation or Depreciation on Investments” in the Consolidated Financial Statements for more details regarding investment realization events for the years ended September 30, 2017 and September 30, 2016.
Net Unrealized Appreciation (Depreciation) on Investments and Secured Borrowings
Net unrealized appreciation or depreciation is the net change in the fair value of our investments and secured borrowings during the reporting period, including the reversal of previously recorded unrealized appreciation or depreciation when gains or losses are realized.
Net unrealized depreciation on investments and secured borrowings increased from $17.0 million for the year ended September 30, 2016 to $17.8 million for the year ended September 30, 2017. Net unrealized depreciation for the year ended September 30, 2017 was primarily the result of significant write-downs on our investment portfolio, including a $13.6 million write-down on one of our investments. Net unrealized depreciation on investments and secured borrowings for the year ended September 30, 2016 was primarily the result of significant write-downs on our investment portfolio, including $11.9 million of aggregate write-downs on one of our investments and FSFR Glick JV.
See “Note 9. Realized Gains or Losses and Net Unrealized Appreciation or Depreciation on Investments” in the Consolidated Financial Statements for more details regarding unrealized appreciation (depreciation) on investments and secured borrowings for the years ended September 30, 2017 and September 30, 2016.
Comparison of Years ended September 30, 2016 and September 30, 2015
Total Investment Income
Total investment income for the years ended September 30, 2016 and September 30, 2015 was $53.4 million and $51.5 million, respectively. The increase of $2.0 million in our total investment income for the year ended September 30, 2016, as compared to the year ended September 30, 2015, was primarily attributable to higher average levels of outstanding debt investments and higher dividend income from our investment in FSFR Glick JV, partially offset by lower fee income as a result of a lower level of investment purchases. For the year ended September 30, 2016, this amount primarily consisted of $47.6 million of interest income from portfolio investments (which included $0.2 million of PIK interest), $3.1 million of fee income and $2.7 million of dividend income. For the year ended September 30, 2015, this amount primarily consisted of $41.1 million of interest income from portfolio investments, $9.7 million of fee income and $0.7 million of dividend income.
The weighted average cash yield onincrease of $2.0 million in our debt investments attotal investment income for the year ended September 30, 2016, andas compared to the year ended September 30, 2015, was 8.29%primarily attributable to higher average levels of outstanding debt investments and 8.14%, respectively.higher dividend income from our investment in FSFR Glick JV, partially offset by lower fee income as a result of a lower level of investment purchases.
Expenses
Total expenses for the years ended September 30, 2016 and September 30, 2015 were $28.1 million and $23.2 million, respectively. The increase of $4.9 million in our total expenses for the year ended September 30, 2016 as compared to the year ended September 30, 2015, was due primarily to an additional $2.6 million of professional fees incurred in connection with proxy-related matters, a $0.8 million reversal of the Part II incentive fee as a result of unrealized losses on the investment portfolio during the year ended September 30, 2015 and a $0.6 million increase in interest expense due to a higher average level of outstanding borrowings.
Net Investment Income
As a result of the $4.9 million increase in total expenses, offset by the $2.0 million increase in total investment income, net investment income for the year ended September 30, 2016 reflected an approximate $3.0 million decrease, as compared to the year ended September 30, 2015.
Realized Gain (Loss) on Investments and Secured Borrowings
DuringRealized gain (loss) on investments and secured borrowings was $(12.8) million for the year ended September 30, 2016 we recorded investment realization events, including the following:
In October 2015, we received a cash payment of $7.4as compared to $0.4 million from Reliant Hospital Partners, LLC in full satisfaction of all obligations under the loan agreement. The debt investment was exited at par and no realized gain or loss was recorded on the transaction;
In October 2015, we received a cash payment of $16.8 million from Idera, Inc. in full satisfaction of all obligations under the loan agreement. The debt investment was exited at par and no realized gain or loss was recorded on the transaction;
In October 2015, we received a cash payment of $5.7 million from Novetta Solutions, LLC in full satisfaction of all obligations under the loan agreement. The debt investment was exited at par and no realized gain or loss was recorded on the transaction;
In December 2015, we received a cash payment of $17.6 million from All Web Leads, Inc. in full satisfaction of all obligations under the loan agreement. The debt investment was exited at par and no realized gain or loss was recorded on the transaction;
In January 2016, we received a cash payment of $6.4 million from TWCC Holding Corp. in full satisfaction of all obligations under the loan agreement. The debt investment was exited at par and no realized gain or loss was recorded on the transaction;
In February 2016, we received a cash payment of $1.4 million from B&H Education Inc. in full satisfaction of all obligations under the loan agreement. The debt investment was exited and a realized loss of $4.3 million was recorded on the transaction;
In March 2016, we received a cash payment of $3.4 million from Pacific Architects and Engineers Incorporated in full satisfaction of all obligations under the loan agreement. The debt investment was exited at par and no realized gain or loss was recorded on the transaction;
In April 2016, we restructured our debt investment in Ameritox Ltd. As a part of the restructuring, we exchanged our debt securities for debt and equity securities in the restructured entity. The fair value of the debt securities exchanged on the restructuring date was $12.6 million, which approximated our fair value as of March 31, 2016. A realized loss of $8.7 million was recorded on the transaction;
In May 2016, we received a cash payment of $20.8 million from Accruent, LLC in full satisfaction of all obligations under the loan agreement. The debt investment was exited at par and no realized gain or loss was recorded on this transaction;
In June 2016, we received a cash payment of $13.3 million from GTCR Valor Companies, Inc. in full satisfaction of all obligations under the loan agreement. The debt investment was exited at par and no realized gain or loss was recorded on this transaction;
In August 2016, we received a cash payment of $5.8 million from Smile Brands Group Inc. in full satisfaction of all obligations under the loan agreement. The debt investment was exited at par and no realized gain or loss was recorded on the transaction;
In September 2016, we received a cash payment of $14.0 million from Language Line, LLC in full satisfaction of all obligations under the loan agreement. The debt investment was exited at par (plus additional fees) and no realized gain or loss was recorded on the transaction;
In September 2016, we received a cash payment of $5.9 million from Aptos, Inc. in full satisfaction of all obligations under the loan agreement. The debt investment was exited at par and no realized gain or loss was recorded on the transaction; and
During the year ended September 30, 2016, we received cash payments of $163.3 million in connection with syndications and sales of debt investments and recorded a net realized gain of $0.2 million.
During the year ended September 30, 2015, we recorded investment realization events, including the following:
In October 2014, we received a cash payment of $6.8 million from Answers Corporation in full satisfaction of all obligations under the loan agreement. The debt investment was exited at par (plus additional fees) and no realized gain or loss was recorded on the transaction;
In December 2014, we received a cash payment of $4.9 million from Survey Sampling International, LLC in full satisfaction of all obligations under the loan agreement. The debt investment was exited at par and no realized gain or loss was recorded on the transaction;
In April 2015, we received a cash payment of $9.4 million from Travel Leaders Group, LLC in full satisfaction of all obligations under the loan agreement. The debt investment was exited at par and no realized gain or loss was recorded on the transaction;
In April 2015, we received a cash payment of $11.2 million from IPC Systems, Inc. in full satisfaction of all obligations under the loan agreement. The debt investment was exited at par and no realized gain or loss was recorded on the transaction;
In April 2015, we received a cash payment of $2.5 million from Symphony Teleca Services, Inc. in full satisfaction of all obligations under the loan agreement. The debt investment was exited at par (plus additional fees) and no realized gain or loss was recorded on the transaction;
In May 2015, we received a cash payment of $4.1 million from GOBP Holdings, Inc. in full satisfaction of all obligations under the loan agreement. The debt investment was exited at par (plus additional fees) and no realized gain or loss was recorded on the transaction;
In August 2015, we received a cash payment of $14.3 million from AMAG Pharmaceuticals, Inc. in full satisfaction of all obligations under the loan agreement. The debt investment was exited at par (plus additional fees) and no realized gain or loss was recorded on the transaction; and
During the year ended September 30, 2015, we received cash payments of $480.4 million in connection with full or partial payoffs and sales of debt investments in the open market and recorded a net realized gain of $0.4 million.
Net Unrealized Appreciation (Depreciation) on Investments and Secured Borrowings
Net unrealized appreciation or depreciation is the net change in the fair value of our investments and secured borrowings during the reporting period, including the reversal of previously recorded unrealized appreciation or depreciation when gains or losses are realized.
During the year ended September 30, 2016, we recorded net unrealized depreciation of $17.0 million. This consisted of $17.5 million of net unrealized depreciation on debt investments and $2.5 million of net unrealized depreciation on equity investments, offset by $3.0 million of net reclassifications to realized loss (resulting in unrealized appreciation). During the year ended September 30, 2015, the Company recorded net unrealized depreciation of $12.8 million. This consisted of $11.8 million of net unrealized depreciation on debt investments and $1.0 million of net unrealized depreciation on equity investments.
Comparison of the years ended September 30, 2015 and September 30, 2014
Total Investment Income
Total investment income for the years ended September 30, 2015 and September 30, 2014 was $51.5 million and $12.5 million, respectively. For the year ended September 30, 2015, this amount primarily consisted of $41.1 million of interest income from portfolio investments and $9.7 million of fee income. For the year ended September 30, 2014, this amount primarily consisted of $10.5 million of interest income from portfolio investments and $2.0 million of fee income.
The increase in our total investment income for the year ended September 30, 2015, as compared toresulting in a decrease of $13.2 million. The decrease was driven primarily by the restructuring of our investment in Ameritox Ltd. and the disposition of our investment in B&H Education Inc. during the year ended September 30, 2014, was primarily attributable to higher average levels of outstanding debt investments, which was principally due to a net increase of 16 debt investments2016.
See “Note 9. Realized Gains or Losses and Net Unrealized Appreciation or Depreciation on Investments” in our portfolio year over year and an increase in fees related tothe Consolidated Financial Statements for more details regarding investment activity, partially offset by amortization repayments received on our debt investments.
The weighted average cash yield on our debt investments atrealization events for the years ended September 30, 20152016 and September 30, 2014 was 8.14% and 7.05%, respectively.
Expenses
Net expenses for the year ended September 30, 2015 and September 30, 2014 were $23.2 million and $6.8 million, respectively. Net expenses increased for the year ended September 30, 2015 as compared to the year ended September 30, 2014 by $16.4 million. This was due primarily to increases in:
Base management fee, which was attributable to $346.1 million of net funded deal originations during the year;
Part I incentive fee, which was attributable to a $26.0 million increase in pre-incentive fee net investment income for the year-over-year period; and
Interest expense, which was attributable to a $193.4 million increase in weighted average debt outstanding for the year-over-year period.
Net Investment Income
As a result of the $39.0 million increase in total investment income, as compared to the $16.4 million increase in total expenses, net investment income for the year ended September 30, 2015 reflected an approximate $22.5 million increase, as compared to the year ended September 30, 2014.
Realized Gain (Loss) on Investments
During the year ended September 30, 2015, we recorded investment realization events, including the following:
In October 2014, we received a cash payment of $6.8 million from Answers Corporation in full satisfaction of all obligations under the loan agreement. The debt investment was exited at par (plus additional fees) and no realized gain or loss was recorded on the transaction;
In December 2014, we received a cash payment of $4.9 million from Survey Sampling International, LLC in full satisfaction of all obligations under the loan agreement. The debt investment was exited at par and no realized gain or loss was recorded on the transaction;
In April 2015, we received a cash payment of $9.4 million from Travel Leaders Group, LLC in full satisfaction of all obligations under the loan agreement. The debt investment was exited at par and no realized gain or loss was recorded on the transaction;
In April 2015, we received a cash payment of $11.2 million from IPC Systems, Inc. in full satisfaction of all obligations under the loan agreement. The debt investment was exited at par and no realized gain or loss was recorded on the transaction;
In April 2015, we received a cash payment of $2.5 million from Symphony Teleca Services, Inc. in full satisfaction of all obligations under the loan agreement. The debt investment was exited at par (plus additional fees) and no realized gain or loss was recorded on the transaction;
In May 2015, we received a cash payment of $4.1 million from GOBP Holdings, Inc. in full satisfaction of all obligations under the loan agreement. The debt investment was exited at par (plus additional fees) and no realized gain or loss was recorded on the transaction;
In August 2015, we received a cash payment of $14.3 million from AMAG Pharmaceuticals, Inc. in full satisfaction of all obligations under the loan agreement. The debt investment was exited at par (plus additional fees) and no realized gain or loss was recorded on the transaction; and
During the year ended September 30, 2015, we received cash payments of $480.4 million in connection with full or partial payoffs and sales of debt investments in the open market and recorded a net realized gain of $0.4 million.
During the year ended September 30, 2014, we recorded investment realization events, including the following:
In March 2014, we received a cash payment of $5.0 million from Bellisio Foods, Inc. in full satisfaction of all obligations under the loan agreement. The debt investment was exited at par and no realized gain or loss was recorded on the transaction;
In May 2014, we received a cash payment of $8.8 million from American Auto Auction Group, LLC in full satisfaction of all obligations under the loan agreement. The debt investment was exited at par and no realized gain or loss was recorded on the transaction;
In August 2014, we received a cash payment of $4.5 million from Quorum Business Solutions (USA), Inc. in full satisfaction of all obligations under the loan agreement. The debt investment was exited at par (plus additional fees) and no realized gain or loss was recorded on the transaction;
In August 2014, we received a cash payment of $7.5 million from TriMark USA LLC in full satisfaction of all obligations under the loan agreement. The debt investment was exited at par and no realized gain or loss was recorded on the transaction; and
During the year ended September 30, 2014, we received cash payments of $120.6 million in connection with full or partial payoffs and sales of debt securities and recorded a net realized gain of $1.3 million.
2015.
Net Unrealized Appreciation (Depreciation) on Investments and Secured Borrowings
DuringNet unrealized depreciation on investments and secured borrowings increased from $12.8 million for the year ended September 30, 2015 we recorded net unrealized depreciation of $12.8 million. This consisted of$11.8to $17.0 million of net unrealized depreciation on debt investments and $1.0 million of net unrealized depreciation on equity investments. Duringfor the year ended September 30, 2014, we recorded net2016. Net unrealized appreciationdepreciation on investments and secured borrowings for the year ended September 30, 2016 was primarily the result of $2.3 million, consisting of$2.1significant write-downs on our investment portfolio, including $11.9 million of unrealized appreciationaggregate write-downs on debtone of our investments and $0.2 million ofFSFR Glick JV. Net unrealized appreciationdepreciation on equity investments. Forinvestments and secured borrowings for the three monthsyear ended September 30, 2015 approximately halfwas primarily the result of the net lossessignificant write-downs on our investment portfolio, were due to market movements, as increased volatilityincluding a $6.1 million write-down on one of our investments.
See “Note 9. Realized Gains or Losses and Net Unrealized Appreciation or Depreciation on Investments” in loan prices driven by the market dislocation that occurred duringConsolidated Financial Statements for more details regarding unrealized appreciation (depreciation) on investments and secured borrowings for the quarter negatively affected our investment valuations accordingly.years ended September 30, 2016 and September 30, 2015.
Financial Condition, Liquidity and Capital Resources
Cash Flows
We have a number of alternatives available to fund the growth of our investment portfolio and our operations, including raising equity, increasing debt and funding from operational cash flow. Additionally, to generate liquidity we may reduce investment size by syndicating a portion of any given transaction. We intend to continue to generate cash primarily from cash flows from operations, including interest earned and future borrowings. We may also from time to time issue securities in public or private offerings, which offerings will depend on future market conditions, funding needs and other factors. We intend to fund our future distribution obligations through operating cash flow or with funds obtained through future equity and debt offerings or credit facilities, as we deem appropriate.
In the future, we may also securitize a portion of our investments to the extent permitted by applicable law and regulation. To securitize investments, we would likely create a wholly-owned subsidiary and contribute a pool of loans to the subsidiary. We would then sell interests in the subsidiary on a non-recourse basis to purchasers and we would retain all or a portion of the equity in the subsidiary. Our primary uses of funds are investments in our targeted asset classes and cash distributions to holders of our common stock.
Although we may fund the growth of our investment portfolio through equity offerings, our plans to do so may not be successful. In this regard, because our common stock has at times traded at a price below our then-current net asset value per share (which has primarily been the case for several years) and we are limited in our ability to sell our common stock at a price below net asset value per share, we are currently limited in our ability to raise equity capital absent stockholder approval to issue shares of our common stock at prices below then-current net asset value per share.
For the year ended September 30, 2017, we experienced a net increase in cash and cash equivalents of $15.8 million. During that period, $68.8 million of cash was provided by operating activities, primarily consisting of $276.9 million of principal payments and proceeds from the sale of investments and cash activities related to $22.4 million of net investment income, partially offset by cash used to fund $290.6 million of investments and net revolvers. During the same period, cash used by financing activities was $53.0 million, primarily consisting of $24.5 millionof net repayments under our credit facilities, $23.2 million of cash distributions paid to our stockholders and $5.0 million of repayments of secured borrowings.
For the year ended September 30, 2016, we experienced a net decrease in cash and cash equivalents of $21.7 million. During that period, $40.9 million of cash was provided by operating activities, primarily consisting of $308.4 million of principal payments and proceeds from the sale of investments and cash activities related to $25.3 million of net investment income, partially offset by cash used to fund $286.1 million of investments and net revolvers. During the same period, cash used by financing activities was $62.6 million, primarily consisting of $29.2 million of net repayments under our credit facilities, $6.4 million of net repayments under the 2015 Debt Securitization and $25.9 million of cash distributions paid to our shareholders.
For the year ended September 30, 2015, we experienced a net decrease in cash and cash equivalents of $66.0 million. During that period, we used $342.3 million of cash in operating activities, primarily for the funding of $887.0 million of investments and net revolvers, partially offset by $552.5 million of amortization payments and proceeds from the sale of investments and cash activities related to $28.3 million of net investment income. During the same period, cash provided by financing activities was $276.3 million, primarily consisting of $136.7 million of net borrowings under credit facilities and $186.4 million of borrowings under our 2015 Debt Securitization, partially offset by $39.4 million of cash distributions paid to our shareholders and $6.1 million of deferred financing costs paid.
For the year endedAs of September 30, 2014,2017, we experienced a net increase inhad $43.0 million of cash and cash equivalents (including $7.4 million of $55.1restricted cash), portfolio investments (at fair value) of $560.4 million, $3.0 million of interest, dividends and fees receivable, $48.5 million of net payables from unsettled transactions, $83.0 million of borrowings outstanding under our revolving credit facilities, $177.8 million of borrowings outstanding under our 2015 Debt Securitization (net of unamortized financing costs) and unfunded commitments of $43.5 million. During that period,Pursuant to the terms of the Citibank facility, we used $214.5are restricted in terms of access to $2.0 million until such time as we submit required monthly reporting schedules. As of September 30, 2017, $5.4 million of cash held in operating activities, primarily forconnection with the funding2015 Debt Securitization was restricted.
As of $400.5 million of investments and net revolvers, partially offset by $153.1 million of amortization payments and proceeds from the sale of investments and $5.8 million of net investment income. During the same period, cash provided by financing activities was $269.6 million, primarily consisting of $276.7 million net proceeds from a follow-on equity offering, partially offset by $4.7 million of cash dividends paid, $1.8 million of deferred financing costs recognized and $0.5 million of offering costs paid.
At September 30, 2016, we had $28.8 million of cash and cash equivalents (including $9.0 million of restricted cash), portfolio investments (at fair value) of $573.6 million, $4.6 million of interest, dividends and fees receivable, of $4.6 million, $12.9 million receivables from unsettled transactions, $107.4 million of borrowings outstanding under our revolving credit facilities, $180.0$177.5 million of borrowings outstanding under our 2015 Debt Securitization (net of unamortized financing costs) and unfunded commitments of $52.8 million of unfunded commitments.million. Pursuant to the terms of the Citibank facility, we are restricted in terms of access to $3.5 million until such time as we submit required monthly reporting schedules. As of September 30, 2016, $5.5 million of cash held in connection with the 2015 Debt Securitization was restricted.
At September 30, 2015, we had $52.7 million of cash and cash equivalents (including $11.3 million of restricted cash), portfolio investments (at fair value) of $623.6 million, interest, dividends and fees receivable of $2.8 million, receivables from unsettled transactions of $13.5 million, payables from unsettled transactions of $11.8 million, $136.7 million of borrowings outstanding under our Citibank facility, $186.4 million of borrowings outstanding under our 2015 Debt Securitization and $76.8 million of unfunded commitments. Pursuant to the terms of our Citibank facility and 2015 Debt Securitization, we were restricted in terms of access to $4.2 million of restricted cash until such time as we submit required monthly reporting schedules as of September 30, 2015. As of September 30, 2015, $7.1 million of restricted cash could be used only for the payment of interest expense on the notes issued in the 2015 Debt Securitization.
Other Sources of Liquidity
We intend to continue to generate cash primarily from cash flows from operations, including interest earned, future borrowings and future offerings of securities. We may from time to time issue securities pursuant to a shelf registration statement or otherwise pursuant to private offerings. The issuance of debt or equity securities will depend on future market conditions, funding needs and other factors and there can be no assurance that any such issuance will occur or be successful. In the future, we may also securitize a portion of our investments in first and second lien senior loans or unsecured debt or other assets. To securitize loans, we would likely create a wholly-owned subsidiary and contribute a pool of loans to the subsidiary. We would then sell interests in the subsidiary on a non-recourse basis to purchasers and we would retain all or a portion of the equity in the subsidiary. Our primary use of funds is investments in our targeted asset classes and cash distributions to holders of our common stock.
Although we expect to fund the growth of our investment portfolio through the net proceeds from future equity offerings and issuances of senior securities or future borrowings to the extent permitted by the 1940 Act, our plans to raise capital may not be successful. In this regard, because our common stock has at times traded at a price below our then-current net asset value per share (which has primarily been the case for the past year) and we are limited in our ability to sell our common stock at a price below net asset value per share, we may be limited in our ability to raise equity capital.
In addition, we intend to distribute at least 90% of our taxable income as dividends to our stockholders each taxable year in order to satisfy the requirements applicable to RICs under Subchapter M of the Code. See "Regulated Investment Company Status and Distributions" below. Consequently, we may not have the funds or the ability to fund new investments, to make
additional investments in our portfolio companies, to fund our unfunded commitments to portfolio companies or to repay borrowings. In addition, the illiquidity of our portfolio investments may make it difficult for us to sell these investments when desired and, if we are required to sell these investments, we may realize significantly less than their recorded value.
As a BDC, under the 1940 Act, we generally are not permitted to incur indebtedness unless immediately after such borrowing we have an asset coverage for total borrowings of at least 200% (i.e., the amount of debt may not exceed 50% of the value of our assets). This requirement limits the amount that we may borrow. As of September 30, 2016, we were in compliance with this asset coverage requirement. The amount of leverage that we employ will depend on our assessment of market conditions and other factors at the time of any proposed borrowing, such as the maturity, covenant package and rate structure of the proposed borrowings, our ability to raise funds through the issuance of shares of our common stock and the risks of such borrowings within the context of our investment outlook. Ultimately, we only intend to use leverage if the expected returns from borrowing to make investments will exceed the cost of such borrowing. To fund growth in our investment portfolio in the future, we anticipate needing to raise additional capital from various sources, including the equity markets and the securitization or other debt-related markets, which may or may not be available on favorable terms, if at all.
Significant Capital Transactions
The following table reflects the dividend distributions per share that our Board of Directors has paid,declared, including shares issued under our dividend reinvestment plan, or DRIP, on our common stock during the years ended September 30, 2016 and September 30,since October 1, 2015:
| | | Frequency | | Date Declared | | Record Date | | Payment Date | | Amount
per Share | | Total Distribution | | DRIP Shares Issued (1) | | DRIP Shares Value | | Date Declared | | Record Date | | Payment Date | | Amount
per Share | | Cash Distribution | | DRIP Shares Issued (1) | | DRIP Shares Value |
| Monthly | | July 10, 2015 | | October 6, 2015 | | October 15, 2015 | | $ | 0.075 |
| | $ | 2,210,008 |
| | 12,080 | | $ | 108,563 |
| | July 10, 2015 | | October 6, 2015 | | October 15, 2015 | | $ | 0.075 |
| | $ | 2,101,445 |
| | 12,080 | | $ | 108,563 |
|
| Monthly | | July 10, 2015 | | November 5, 2015 | | November 16, 2015 | | 0.075 |
| | 2,210,008 |
| | 13,269 | | 116,730 |
| | July 10, 2015 | | November 5, 2015 | | November 16, 2015 | | 0.075 |
| | 2,093,278 |
| | 13,269 | | 116,730 |
|
| Monthly | | November 30, 2015 | | December 11, 2015 | | December 22, 2015 | | 0.075 |
| | 2,210,007 |
| | 11,103 | | 94,563 |
| | November 30, 2015 | | December 11, 2015 | | December 22, 2015 | | 0.075 |
| | 2,115,444 |
| | 11,103 | | 94,563 |
|
| Monthly | | November 30, 2015 | | January 4, 2016 | | January 15, 2016 | | 0.075 |
| | 2,210,007 |
| | 8,627 | | 61,079 |
| | November 30, 2015 | | January 4, 2016 | | January 15, 2016 | | 0.075 |
| | 2,148,928 |
| | 8,627 | | 61,079 |
|
| Monthly | | November 30, 2015 | | February 5, 2016 | | February 16, 2016 | | 0.075 |
| | 2,210,008 |
| | 4,542 | | 32,923 |
| | November 30, 2015 | | February 5, 2016 | | February 16, 2016 | | 0.075 |
| | 2,177,085 |
| | 4,542 | | 32,923 |
|
| Monthly | | February 8, 2016 | | March 15, 2016 | | March 31, 2016 | | 0.075 |
| | 2,210,008 |
| | 4,383 | | 34,578 |
| | February 8, 2016 | | March 15, 2016 | | March 31, 2016 | | 0.075 |
| | 2,175,431 |
| | 4,383 | | 34,577 |
|
| Monthly | | February 8, 2016 | | April 15, 2016 | | April 29, 2016 | | 0.075 |
| | 2,210,008 |
| | 4,452 | | 35,033 |
| | February 8, 2016 | | April 15, 2016 | | April 29, 2016 | | 0.075 |
| | 2,174,974 |
| | 4,452 | | 35,033 |
|
| Monthly | | February 8, 2016 | | May 13, 2016 | | May 31, 2016 | | 0.075 |
| | 2,210,007 |
| | 4,256 | | 33,494 |
| | February 8, 2016 | | May 13, 2016 | | May 31, 2016 | | 0.075 |
| | 2,176,513 |
| | 4,256 | | 33,494 |
|
| Monthly | | May 6, 2016 | | June 15, 2016 | | June 30, 2016 | | 0.075 |
| | 2,210,007 |
| | 5,822 | | 46,881 |
| | May 6, 2016 | | June 15, 2016 | | June 30, 2016 | | 0.075 |
| | 2,163,126 |
| | 5,822 | | 46,881 |
|
| Monthly | | May 6, 2016 | | July 15, 2016 | | July 29, 2016 | | 0.075 |
| | 2,210,008 |
| | 3,627 | | 30,745 |
| | May 6, 2016 | | July 15, 2016 | | July 29, 2016 | | 0.075 |
| | 2,179,263 |
| | 3,627 | | 30,745 |
|
| Monthly | | May 6, 2016 | | August 15, 2016 | | August 31, 2016 | | 0.075 |
| | 2,210,008 |
| | 3,260 | | 29,002 |
| | May 6, 2016 | | August 15, 2016 | | August 31, 2016 | | 0.075 |
| | 2,181,006 |
| | 3,260 | | 29,002 |
|
| Monthly | | August 4, 2016 | | September 15, 2016 | | September 30, 2016 | | 0.075 |
| | 2,210,008 |
| | 3,078 | | 26,811 |
| | August 4, 2016 | | September 15, 2016 | | September 30, 2016 | | 0.075 |
| | 2,183,197 |
| | 3,078 | | 26,811 |
|
| Total for the year ended September 30, 2016 | | $ | 0.90 |
| | $ | 26,520,092 |
| | 78,499 | | $ | 650,402 |
| |
| Frequency | | Date Declared | | Record Date | | Payment Date | | Amount
per Share | | Total Distribution | | DRIP Shares Issued (1) | | DRIP Shares Value | |
| Quarterly | | September 9, 2014 | | December 15, 2014 | | January 15, 2015 | | 0.30 |
| | 8,840,030 |
| | 23,183 | | 242,678 |
| |
| Quarterly | | November 20, 2014 | | April 2, 2015 | | April 15, 2015 | | 0.30 |
| | 8,840,030 |
| | 28,296 | | 307,794 |
| |
| Monthly | | February 4, 2015 | | May 1, 2015 | | May 15, 2015 | | 0.10 |
| | 2,946,677 |
| | 5,045 | | 50,830 |
| | August 4, 2016 | | October 14, 2016 | | October 31, 2016 | | 0.075 |
| | 2,183,023 |
| | 3,146 | | 26,985 |
|
| Monthly | | February 4, 2015 | | June 1, 2015 | | June 15, 2015 | | 0.10 |
| | 2,946,677 |
| | 5,296 | | 53,237 |
| | August 4, 2016 | | November 15, 2016 | | November 30, 2016 | | 0.075 |
| | 2,183,100 |
| | 2,986 | | 26,908 |
|
| Monthly | | February 4, 2015 | | July 1, 2015 | | July 15, 2015 | | 0.10 |
| | 2,946,677 |
| | 14,572 | | 137,463 |
| | October 19, 2016 | | December 15, 2016 | | December 30, 2016 | | 0.075 |
| | 2,179,421 |
| | 3,438 | | 30,586 |
|
| Monthly | | February 4, 2015 | | August 3, 2015 | | August 17, 2015 | | 0.10 |
| | 2,946,677 |
| | 6,174 | | 56,388 |
| | October 19, 2016 | | January 31, 2017 | | January 31, 2017 | | 0.075 |
| | 2,180,645 |
| | 2,905 | | 29,363 |
|
| Monthly | | July 10, 2015 | | September 4, 2015 | | September 15, 2015 | | 0.07 |
| | 2,210,007 |
| | 4,575 | | 41,121 |
| | October 19, 2016 | | February 15, 2017 | | February 28, 2017 | | 0.075 |
| | 2,183,581 |
| | 2,969 | | 26,427 |
|
| Total for the year ended September 30, 2015 | | $ | 1.07 |
| | $ | 31,676,775 |
| | 87,141 | | $ | 889,511 |
| |
| Monthly | | | February 6, 2017 | | March 15, 2017 | | March 31, 2017 | | 0.04 |
| | 1,165,417 |
| | 1,508 | | 13,253 |
|
| Quarterly | | | February 6, 2017 | | June 15, 2017 | | June 30, 2017 | | 0.19 |
| | 5,543,465 |
| | 6,840 | | 55,221 |
|
| Quarterly | | | August 7, 2017 | | September 15, 2017 | | September 29, 2017 | | 0.19 |
| | 5,536,798 |
| | 6,991 | | 61,888 |
|
| Quarterly | | | August 7, 2017 | | December 15, 2017 | | December 29, 2017 | | 0.19 |
| |
|
| |
| |
|
|
______________
(1) Shares were purchased on the open market and distributed.
On August 19, 2014, we completed a follow-on public offering of 22,800,000 shares of our common stock at the public offering price of $12.91. The net proceeds totaled $276.2 million after deducting underwriting commissions of $17.7 million and offering costs of $0.5 million.Indebtedness
Borrowings
Natixis Facility
On November 1, 2013, FS Senior Funding LLC, our wholly-owned, special purpose financing subsidiary entered into the $100 million revolving credit facility, or the Natixis facility, with the lenders referred to therein, Natixis, New York Branch, as administrative agent, and U.S. Bank National Association, as collateral agent and custodian.
Borrowings under the Natixis facility were subject to certain customary advance rates and accrued interest at a rate equal to either the applicable commercial paper rate (subject to an overall cap) plus 1.90%See “Note 6. Borrowings” in the case of a lender that is a commercial paper conduit or otherwise the three-month LIBOR plus 2.00% per annum. In addition, there was a commitment fee payable on the undrawn amount under the credit facility equal to 1.00% (or 0.50%Consolidated Financial Statements for the first six months after the closing date) of such undrawn amount. Interestmore details regarding our indebtedness and commitment fees were payable quarterly in arrears. The reinvestment period under the credit facility ended 18 months after the closing date and the credit facility was scheduled to mature on November 1, 2021.
On October 16, 2014, we entered into agreements to expand the Natixis facility from $100 million to $200 million, including a $100 million term loan and a $100 million revolving credit facility. Fifth Third Bank, or Fifth Third, also joined the facility as a term loan lender. The $50 million term loan provided by Fifth Third was priced at LIBOR plus 2% per annum, and the $100 million revolving credit facility and $50 million term loan provided by Natixis, New York Branch, were priced at the applicable commercial paper rate plus 1.9% per annum. The facility maturity date remained unchanged.
Borrowings under the Natixis facility, were secured by all of the assets of FS Senior Funding LLC and all of our equity interest in FS Senior Funding LLC. We used the Natixis facility to fund a portion of FS Senior Funding LLC's loan origination activities and for general corporate purposes. Each loan origination under the Natixis facility was subject to the satisfaction of certain conditions. Our borrowings under the Natixis facility bore interest at a weighted average interest rate of 2.253% and 2.203% for the years ended September 30, 2015 and September 30, 2014, respectively. For the years ended September 30, 2015 and September 30, 2014, we recorded interest expense of $4.8 million and $1.6 million, respectively, related to the Natixis facility.
On May 28, 2015, we completed the 2015 Debt Securitization, a $309.0 million debt securitization transaction, the proceeds of which were used to repay the entire amount outstanding under the Natixis facility. In connection therewith, the Amended and Restated Loan and Servicing Agreement and other related documents governing the Natixis facility were also terminated. Upon termination of the Natixis facility, we accelerated the $2.1 million remaining unamortized fee balance into interest expense during the year ended September 30, 2015. As such, we had no borrowings outstanding, capacity available or interest expense incurred under the Natixis facility as of or for the year ended September 30, 2016.borrowings.
Citibank Facility
On January 15, 2015, FS Senior Funding II LLC, our wholly-owned, special purpose financing subsidiary, entered intoAs of September 30, 2017, the $175 million revolving Citibank facility with the lenders referredpermitted up to therein, Citibank, N.A., as administrative agent, and Wells Fargo Bank, N.A., as collateral agent and custodian.
$125.0 million of borrowings. Borrowings under the Citibank facility are subject to certain customary advance rates and accruedaccrue interest at a rate equal to LIBOR plus 2.00% per annum on broadly syndicated loans and LIBOR plus 2.25% per annum on all other eligible loans during the reinvestment period, and rates equal to LIBOR plus 3.50% per annum and LIBOR plus 4.00% per annum during the subsequent two years, respectively. In addition, there is a commitment fee payable on the undrawn amount under the Citibank facility of either 0.50% per annum on the unused amount of the Citibank facility (if the advances outstanding on the Citibank facility exceed 50% of the aggregate commitments by lenders to make advances on such day) or 0.75% per annum on the unused amount of the Citibank facility (if the advances outstanding on the Citibank facility do not exceed 50% of the aggregate commitments by lenders to make advances on such day) for the duration of the reinvestment period. Interest and commitment fees are payable quarterly in arrears. The reinvestment period under the Citibank facility ends January 15, 2018 and the credit facility will mature onfinal maturity date is January 15, 2020. The Citibank facility requires us to comply with certain affirmative and negative covenants and other customary requirements for similar credit facilities.
As of September 30, 2017 and September 30, 2016, we had $76.5 million and $107.4 million outstanding under the Citibank facility. Borrowings under the Citibank facility, are secured by all of the assets of FS Senior Funding II LLC and all of our equity interests in FS Senior Funding II LLC. We may use the Citibank facility to fund a portion of our loan origination activities and for general corporate purposes. Each loan origination under the Citibank facility is subject to the satisfaction of certain conditions.respectively. Our borrowings under the Citibank facility bore interest at a weighted average interest rate of 3.559%, 2.838% and 2.516% for the years ended September 30, 2017, September 30, 2016 and September 30, 2015, respectively. For the years ended September 30, 2017, September 30, 2016 and September 30, 2015, we recorded interest expense of $4.2 million, $4.1 million and $2.6 million, respectively, related to the Citibank facility.
East West Bank Facility
On January 6, 2016, we entered into the five-year, $25 million, East West Bank Facility. Borrowings under the East West Bank Facility a five-year $25 million senior secured revolving credit facility with the lenders referenced therein, U.S. Bank National Association, as Custodian, and East West Bank as Secured Lender. The East West Bank Facility bearsbear an interest rate of either (i) LIBOR plus 3.75% per annum for borrowings in year one, 3.50% per annum for borrowings in
year two, 3.25% per annum for borrowings in years three and four and 3.00% per annum for borrowings in year five, or (ii) East West Bank’s prime rate plus 0.75% per annum for borrowings in year one, 0.50% per annum for borrowings in year two, 0.25% per annum for borrowings in years three and four, and 0.00% per annum for borrowings in year five. The East West Bank Facility matures on January 6, 2021. The East West Bank Facility requires us to comply with certain affirmative and negative covenants and other customary requirements for similar credit facilities.
As of September 30, 2016,2017, we did not have anyhad $6.5 million borrowings outstanding under the East West Bank Facility. Borrowingsfacility. As of September 30, 2016, there were no borrowings outstanding under the East West Bank Facility are secured by the loans pledged as collateral thereunder from time to time as well as certain of our other assets. We may use the East West Bank Facility to fund a portion of our loan origination activities and for general corporate purposes.facility. Our borrowings under the East West Bank facility bore interest at a weighted average interest rate of 4.633% and 4.857% for the year ended September 30, 2017 and for the period from January 6, 2016 through September 30, 2016.2016, respectively. For the period from January 6, 2016 throughyears ended September 30, 2017 and September 30, 2016, we recorded interest expense of $0.5 million and $0.4 million, respectively, related to the East West Bank Facility.facility.
Debt Securitization
On May 28, 2015, we completed our $309.0 million 2015 Debt Securitization consistingAs of $222.6 million in 2015 Notes, and $86.4 million of 2015 Subordinated Notes. The notes offered inSeptember 30, 2017, the 2015 Debt Securitization were issued by the 2015 Issuer, a wholly-owned subsidiary of us, through a private placement. The 2015 Notes are secured by the assets held by the 2015 Issuer. The 2015 Debt Securitization consists of $126.0 million Class A-T Senior Secured 2015 Notes which bear interest at three-month LIBOR plus 1.80%; $29.0 million Class A-S Senior Secured 2015 Notes which bearbore interest at a rate of three-month LIBOR plus 1.55%, withuntil a step-up in spread to 2.10% to occuroccurred in October 2016; $20.0 million Class A-R Senior Secured Revolving 2015 Notes which bear interest at a rate of commercial paper, or CP, plus 1.80%, or, collectively, the Class A 2015 Notes; and $25.0 million Class B Senior Secured 2015 Notes which bear interest at a rate of three-month LIBOR plus 2.65% per annum. In partial consideration for the loans transferred to the 2015 Issuer as part of the 2015 Debt Securitization, weannum, which were issued in a private placement. We currently retain the entire $22.6 million of the Class C Senior Secured 2015 Notes (which we purchased at 98.0% of par value) and the entire $86.4 million of the Subordinated 2015 Subordinated Notes. The Class A 2015 NotesDebt Securitization requires us to comply with certain monthly financial covenants, including overcollateralization and Class B 2015 Notes are included in ourinterest coverage tests.
For the years ended September 30, 2017, September 30, 2016 and September 30, 2015 Consolidated Statement of Assets and Liabilities as notes payable. As of September 30, 2016 and September 30, 2015, the Class C 2015 Notes and the 2015 Subordinated Notes were eliminated in consolidation.
The proceeds of the private placement of the 2015 Notes, net of expenses, were used to repay the entire amount outstanding under the Natixis facility. As part of the 2015 Debt Securitization, FS Senior Funding LLC, the borrower under the Natixis facility, merged with and into the 2015 Issuer, with the 2015 Issuer remaining as the surviving entity. Upon completion of the 2015 Debt Securitization, our Natixis facility was paid off and terminated.
We serve as collateral manager to the 2015 Issuer under a collateral management agreement. We are entitled to a fee for our services as collateral manager. The collateral management fee is eliminated in consolidation. We have retained Fifth Street Management LLC, our investment adviser, to furnish collateral management sub-advisory services to us pursuant to a sub-collateral management agreement. Our investment adviser has waived, and intends to continue to waive, its right to such sub-collateral management fees in respect of the 2015 Debt Securitization.
The collateral management agreement does not include any incentive fee payable to us as collateral manager or payable to our investment adviser as sub-advisor under the sub-collateral management agreement.
Through May 28, 2019, all principal collections received on the underlying collateral may be used by the 2015 Issuer to purchase new collateral under the direction of the investment adviser in its capacity as sub-collateral manager of the 2015 Issuer and in accordance with our investment strategy. All classes of 2015 Notes are scheduled to mature on May 28, 2025.
As of September 30, 2016 and September 30, 2015, there were 49 and 51 investments, respectively, in portfolio companies with a total fair value of $255.8 million, securing the 2015 Notes. The pool of loans in the 2015 Debt Securitization must meet certain requirements, including asset mix and concentration, collateral coverage, term, agency rating, minimum coupon, minimum spread and sector diversity requirements.
The aggregate accrued interest payable on the 2015 Notes at September 30, 2016 and September 30, 2015 was approximately $1.1 million and $1.5 million, respectively. Deferred debt issuance costs consist of fees and expenses incurred in connection with debt offerings. As of September 30, 2015, we had a deferred debt issuance costs balance of approximately $2.8 million associated with the 2015 Debt Securitization.
For the year ended September 30, 2016 and 2015, the components of interest expense, cash paid for interest, average interest rates and average outstanding balances for the 2015 Debt Securitization were as follows:
| | | | | Year ended September 30, 2016 | | Year ended September 30, 2015 | | Year ended September 30, 2017 | | Year ended September 30, 2016 | | Year ended September 30, 2015 |
| Interest expense | | $ | 4,668,947 |
| | $ | 1,476,995 |
| | $ | 5,741,534 |
| | $ | 4,668,947 |
| | $ | 1,476,995 |
|
| Loan administration fees | | 79,882 |
| | — |
| | 69,514 |
| | 79,882 |
| | — |
|
| Amortization of debt issuance costs | | 290,104 |
| | 120,877 |
| | 290,104 |
| | 290,104 |
| | 120,877 |
|
| Total interest and other debt financing expenses | | $ | 5,038,933 |
| | $ | 1,597,872 |
| | $ | 6,101,152 |
| | $ | 5,038,933 |
| | $ | 1,597,872 |
|
| Cash paid for interest expense | | $ | 5,136,063 |
| | $ | — |
| | $ | 5,449,738 |
| | $ | 5,136,063 |
| | $ | — |
|
| Annualized average interest rate | | 2.466 | % | | 2.390 | % | | 3.425 | % | | 2.466 | % | | 2.39 | % |
| Average outstanding balance | | $ | 181,782,413 |
| | $ | 61,900,170 |
| | $ | 180,462,192 |
| | $ | 181,782,413 |
| | $ | 61,900,170 |
|
The classes, interest rates, spread over LIBOR, cash paid for interest, stated interest expense and note discount expense of each of the Class A-T, A-S, A-R, B and C 2015 Notes for the year ended September 30, 20162017 is as follows:
| | | | | | Year ended September 30, 2016 | | | Year ended September 30, 2017 |
| | Stated Interest Rate | | LIBOR Spread (basis points) | | Cash Paid for Interest | | Interest Expense | | Stated Interest Rate | | LIBOR Spread (basis points) | | Cash Paid for Interest | | Interest Expense |
| Class A-T Notes | | 2.4691% | | 180 | | $ | 3,267,127 |
| | $ | 3,009,871 |
| | 3.1035% | | 180 | | $ | 3,487,268 |
| | $ | 3,664,619 |
|
| Class A-S Notes | | 2.2191% | | 155 | (1) | 668,956 |
| | 619,040 |
| | 3.4035% | | 210 | (1) | 850,073 |
| | 926,401 |
|
| Class A-R Notes | | 2.4691% | | 180 | (2) | 308,546 |
| | 226,798 |
| | 2.9551% | | 180 | (2) | 205,027 |
| | 207,900 |
|
| Class B Notes | | 3.3191% | | 265 | | 891,434 |
| | 813,238 |
| | 3.9535% | | 265 | | 907,370 |
| | 942,614 |
|
| Class C Notes | | 3.9191% | | 325 | (3) | — |
| | — |
| | 4.5535% | | 325 | (3) | — |
| | — |
|
| Total | | | | | $ | 5,136,063 |
| | $ | 4,668,947 |
| | | | | $ | 5,449,738 |
| | $ | 5,741,534 |
|
_______________________
(1) Spread to step-upincreased to 2.10% in October 2016.2016 from 1.55%.
(2) Interest expense includes 1.0% undrawn fee. Class A-R 2015 Notes were partially undrawnnot drawn during the yearthree months ended September 30, 2016.2017.
(3) We hold all Class C Notes outstanding and thus have not recorded any related interest expense as it is eliminated in consolidation.
The classes, amounts, ratings and interest rates (expressed as a spread to three-month LIBOR) of the Class A, B, C and Subordinated 2015 Notes as of September 30, 2016 and 20152017 are as follows:
| | | Description | | Class A-T Notes | | Class A-S Notes | | Class A-R
Notes (1) | | Class B Notes | | Class C Notes | | Subordinated Notes | | Class A-T Notes | | Class A-S Notes | | Class A-R
Notes | | Class B Notes | | Class C Notes | | Subordinated Notes |
| Type | | Senior Secured Floating Rate Term Debt | | Senior Secured Floating Rate Term Debt | | Senior Secured Floating Rate Revolver | | Senior Secured Floating Rate Term Debt | | Senior Secured Floating Rate Term Debt | | Subordinated Term Notes | | Senior Secured Floating Rate Term Debt | | Senior Secured Floating Rate Term Debt | | Senior Secured Floating Rate Revolver | | Senior Secured Floating Rate Term Debt | | Senior Secured Floating Rate Term Debt | | Subordinated Term Notes |
| Amount Outstanding | | $126,000,000 | | $29,000,000 | | $— | | $25,000,000 | | $22,575,680 | | $86,400,000 | | $126,000,000 | | $29,000,000 | | $— | | $25,000,000 | | $22,575,680 | | $86,400,000 |
| Moody's Rating | | "Aaa" | | "Aaa" | | "Aaa" | | "Aa2" | | "Aa2" | | NR | | "Aaa" | | "Aaa" | | "Aaa" | | "Aa2" | | "Aa2" | | NR |
| S&P Rating | | "AAA" | | "AAA" | | "AAA" | | NR | | NR | | NR | | "AAA" | | "AAA" | | "AAA" | | NR | | NR | | NR |
| Interest Rate | | LIBOR + 1.80% | | LIBOR + 1.55%* | | CP + 1.80% ** | | LIBOR + 2.65% | | LIBOR + 3.25% | | NA | | LIBOR + 1.80% | | LIBOR + 2.10%* | | CP + 1.80% ** | | LIBOR + 2.65% | | LIBOR + 3.25% | | NA |
| Stated Maturity | | May 28, 2025 | | May 28, 2025 | | May 28, 2025 | | May 28, 2025 | | May 28, 2025 | | May 28, 2025 | | May 28, 2025 | | May 28, 2025 | | May 28, 2025 | | May 28, 2025 | | May 28, 2025 | | May 28, 2025 |
_______________________
* Spread to step-upincreased to 2.10% in October 2016.2016 from 1.55%.
** Carries a 1.0% undrawn fee.
(1) $6,366,000 outstanding as of September 30, 2015.
The proceeds of the private placement of the Class A Notes and the Class B Notes, net of debt issuance costs, may be used to fund a portion of the 2015 Issuer's loan origination activities and for general corporate purposes. The creditors of the 2015 Issuer have received security interests in the assets owned by the 2015 Issuer and such assets are not intended to be available to our creditors (or any of our other affiliates). As part of the 2015 Debt Securitization, we entered into master loan sale agreements under which we agreed to directly or indirectly sell or contribute certain senior secured debt investments (or participation interests therein) to the 2015 Issuer, and to purchase or otherwise acquire the 2015 Subordinated Notes of the 2015
Issuer, as applicable. The 2015 Notes (other than the Class C Notes) are the secured obligations of the 2015 Issuer and indentures governing the 2015 Notes include customary covenants and events of default. The 2015 Debt Securitization requires us to comply with certain monthly financial covenants, including overcollateralization and interest coverage tests.
Off-Balance Sheet Arrangements
We may be a party to financial instruments with off-balance sheet risk in the normal course of business to meet the financial needs of our portfolio companies. As of September 30, 20162017 and September 30, 2015,2016, off-balance sheet arrangements consisted of $52.8$43.5 million and $76.8$52.8 million, respectively, of unfunded commitments to provide debt and equity financing to certain of our portfolio companies. Such commitments are subject to our portfolio companies' satisfaction of certain financial and nonfinancial covenants and may involve, to varying degrees, elements of credit risk in excess of the amount recognized in the Consolidated Statements of Assets and Liabilities and are not reflected on our Consolidated Statements of Assets and Liabilities. We believe that our assets will provide adequate cover to satisfy all
A list of our unfunded commitments as of September 30, 2016.
A summary of the composition of unfunded commitmentsby investment (consisting of revolvers, term loans with delayed draw components and FSFR Glick JV Subordinated Notes and LLC equity interests) as of September 30, 20162017 and September 30, 20152016 is shown in the table below:
| | | | | September 30, 2016 | | September 30, 2015 | | September 30, 2017 | | September 30, 2016 |
| FSFR Glick JV LLC | | $ | 16,382,494 |
| | $ | 28,522,027 |
| | $ | 16,159,368 |
| | $ | 16,382,494 |
|
| TIBCO Software, Inc. | | 5,300,000 |
| | 5,300,000 |
| |
| MHE Intermediate Holdings | | | 6,749,698 |
| | — |
|
| Triple Point Group Holdings, Inc. | | 4,968,590 |
| | 4,968,590 |
| | 4,968,590 |
| | 4,968,590 |
|
| BeyondTrust Software, Inc. | | 3,605,000 |
| | 3,605,000 |
| | 3,605,000 |
| | 3,605,000 |
|
| Motion Recruitment Partners LLC | | | 2,900,000 |
| | 2,900,000 |
|
| PowerPlan, Inc. | | | 2,100,000 |
| | 2,100,000 |
|
| Ministry Brands, LLC | | | 1,857,967 |
| | — |
|
| Impact Sales, LLC | | | 1,078,125 |
| | — |
|
| Valet Merger Sub, Inc. | | | 833,333 |
| | 333,333 |
|
| Executive Consulting Group, Inc. | | | 800,000 |
| | 800,000 |
|
| Internet Pipeline, Inc. | | | 800,000 |
| | 800,000 |
|
| Metamorph US 3, LLC (1) | | | 720,000 |
| | 1,800,000 |
|
| Systems, Inc. | | | 600,000 |
| | — |
|
| Sailpoint Technologies, Inc. | | | 300,000 |
| | 200,000 |
|
| 4 Over International, LLC | | | 68,452 |
| | 68,452 |
|
| TIBCO Software, Inc. | | | — |
| | 5,300,000 |
|
| All Web Leads, Inc. | | 3,458,537 |
| | 2,454,572 |
| | — |
| | 3,458,537 |
|
| Motion Recruitment Partners LLC | | 2,900,000 |
| | 2,900,000 |
| |
| Legalzoom.com, Inc. | | 2,607,018 |
| | 2,607,018 |
| | — |
| | 2,607,018 |
|
| Teaching Strategies, LLC | | 2,400,000 |
| | 2,400,000 |
| | — |
| | 2,400,000 |
|
| PowerPlan, Inc. | | 2,100,000 |
| | 2,100,000 |
| |
| Metamorph US 3, LLC | | 1,800,000 |
| | 1,800,000 |
| |
| Dynatect Group Holdings, Inc. | | 1,800,000 |
| | 1,800,000 |
| | — |
| | 1,800,000 |
|
| My Alarm Center, LLC | | 1,212,472 |
| | 1,287,499 |
| | — |
| | 1,212,472 |
|
| Baart Programs, Inc. | | 1,000,000 |
| | — |
| | — |
| | 1,000,000 |
|
| TrialCard Incorporated | | 850,000 |
| | 850,000 |
| | — |
| | 850,000 |
|
| Executive Consulting Group, Inc. | | 800,000 |
| | 4,800,000 |
| |
| Internet Pipeline, Inc. | | 800,000 |
| | 800,000 |
| |
| NextCare, Inc. | | — |
| | 1,221,621 |
| |
| Valet Merger Sub, Inc. | | 333,333 |
| | 1,000,000 |
| |
| Sailpoint Technologies, inc. | | 200,000 |
| | — |
| |
| OBHG Management Services, LLC | | 100,000 |
| | — |
| | — |
| | 100,000 |
|
| Accruent, LLC | | 85,000 |
| | — |
| | — |
| | 85,000 |
|
| 4 Over International, LLC | | 68,452 |
| | — |
| |
| Landslide Holdings, Inc. | | — |
| | 5,000,000 |
| |
| Idera, Inc. | | — |
| | 2,400,000 |
| |
| Ameritox Ltd. | | — |
| | 1,000,000 |
| |
| Total | | $ | 52,770,896 |
| | $ | 76,816,327 |
| | $ | 43,540,533 |
| | $ | 52,770,896 |
|
_______
(1) This investment was on cash non-accrual status as of September 30, 2017.
Contractual Obligations
The following table reflects information pertaining to our debt outstanding under the Citibank facility, the East West Bank Facility, the 2015 Debt Securitization and our secured borrowings:
| | | | | Debt Outstanding
as of
September 30, 2015 | | Debt Outstanding
as of September 30,
2016 | | Weighted average debt
outstanding for the
year ended
September 30, 2016 | | Maximum debt
outstanding
for the year ended
September 30, 2016 | | Debt Outstanding
as of
September 30, 2016 | | Debt Outstanding
as of September 30,
2017 | | Weighted average debt
outstanding for the
year ended
September 30, 2017 | | Maximum debt
outstanding
for the year ended
September 30, 2017 |
| Citibank facility | | $ | 136,659,800 |
| | $ | 107,426,800 |
| | $ | 114,452,625 |
| | $ | 140,426,800 |
| | $ | 107,426,800 |
| | $ | 76,456,800 |
| | $ | 80,785,238 |
| | $ | 107,426,800 |
|
| 2015 Debt Securitization | | 186,366,000 |
| | 180,000,000 |
| | 181,782,413 |
| | 190,966,000 |
| | 180,000,000 |
| | 180,000,000 |
| | 180,462,192 |
| | 187,500,000 |
|
| East West Bank facility | | — |
| | — |
| | 6,969,180 |
| | 18,500,000 |
| |
| East West Bank Facility | | | — |
| | 6,500,000 |
| | 6,306,301 |
| | 19,500,000 |
|
| Secured borrowings | | — |
| | 5,000,000 |
| | — |
| | 5,000,000 |
| | 5,000,000 |
| | — |
| | 54,795 |
| | 5,000,000 |
|
| Total debt | | $ | 323,025,800 |
| | $ | 292,426,800 |
| | $ | 303,204,218 |
| | | | $ | 292,426,800 |
| | $ | 262,956,800 |
| | $ | 267,608,526 |
| | |
The following table reflects our contractual obligations arising from the Citibank facility, 2015 Debt Securitization and secured borrowings:East West Bank Facility:
| | | | | Payments due by period as of September 30, 2016 | | Payments due by period as of September 30, 2017 |
| | | Total | | < 1 year | | 1-3 years | | 3-5 years | | > 5 years | | Total | | < 1 year | | 1-3 years | | 3-5 years | | > 5 years |
| Citibank facility | | $ | 107,426,800 |
| | $ | — |
| | $ | — |
| | $ | 107,426,800 |
| | $ | — |
| | $ | 76,456,800 |
| | $ | — |
| | $ | 76,456,800 |
| | $ | — |
| | $ | — |
|
| Interest due on Citibank facility | | 10,007,068 |
| | 3,038,752 |
| | 6,077,504 |
| | 890,812 |
| | — |
| | 6,636,652 |
| | 2,894,119 |
| | 3,742,533 |
| | — |
| | — |
|
| 2015 Debt Securitization | | 180,000,000 |
| | — |
| | — |
| | — |
| | 180,000,000 |
| | 180,000,000 |
| | — |
| | — |
| | — |
| | 180,000,000 |
|
| Interest due on 2015 Debt Securitization | | 39,102,505 |
| | 4,513,731 |
| | 4,513,731 |
| | 4,513,731 |
| | 25,561,312 |
| | 45,102,966 |
| | 5,885,800 |
| | 11,771,600 |
| | 11,771,600 |
| | 15,673,966 |
|
| Secured borrowings | | 5,000,000 |
| | — |
| | — |
| | 5,000,000 |
| | — |
| |
| Interest due on Secured borrowings | | 2,064,521 |
| | 350,000 |
| | 700,000 |
| | 700,000 |
| | 314,521 |
| |
| East West Bank Facility | | | 6,500,000 |
| | — |
| | — |
| | 6,500,000 |
| | — |
|
| Interest due on East West Bank Facility | | | 1,009,993 |
| | 308,750 |
| | 617,500 |
| | 83,743 |
| | — |
|
| Total | | $ | 343,600,894 |
| | $ | 7,902,483 |
| | $ | 11,291,235 |
| | $ | 118,531,343 |
| | $ | 205,875,833 |
| | $ | 315,706,411 |
| | $ | 9,088,669 |
| | $ | 92,588,433 |
| | $ | 18,355,343 |
| | $ | 195,673,966 |
|
Regulated Investment Company Status and Distributions
We have elected to be treated as a RIC under Subchapter M of the Code. As long as we continue to qualify as a RIC, we will not be taxedsubject to tax on our investment company taxable income (determined without regard to any deduction for dividends paid) or realized net capital gains, to the extent that such taxable income or gains areis distributed, or deemed to be distributed as dividends, to stockholders on a timely basis.
Taxable income generally differs from net income for financial reporting purposes due to temporary and permanent differences in the recognition of income and expenses, and generally excludes net unrealized appreciation or depreciation until realized.depreciation. Distributions declared and paid by us in a taxable year may differ from taxable income for that taxable year as such distributions may include the distribution of taxable income derived from the current taxable year or the distribution of taxable income derived from the prior taxable year carried forward into and distributed in the current taxable year. Distributions also may include returns of capital.
To maintain RIC tax treatment, we must, among other things, distribute dividends, with respect to each taxable year, of an amount at least equal to 90% of our investment company net taxable income (i.e., our net ordinary income and our realized net short-term capital gains in excess of realized net long-term capital losses, if any) determined without regard to any deduction for dividends paid. As a RIC, we are also subject to a federal excise tax, based on distribution requirements of our taxable income on a calendar year basis (e.g., calendar year 2015).basis. We anticipate timely distribution of our taxable income in accordance with the tax rules; however, we incurred a de minimis federal excise tax for calendar year 2013.rules. We did not incur a U.S. federal excise tax for calendar year 2014years 2015 and 20152016 and do not expect to incur a U.S. federal excise tax for the calendar year 2016.2017. We may incur a U.S. federal excise tax in future years.
We intend to distribute to our stockholders betweenat least 90% and 100% of our annual taxable income (which includes our taxable interest and fee income). to our stockholders. The covenants under the respective documents governing the Citibank facility, the East West Bank facility and the 2015 Debt Securitization could, under certain circumstances, hinder our ability to satisfy the distribution requirement associated with our ability to be subject to tax as a RIC. In addition, we may retain for investment some or all of our net taxable capital gains (i.e., realized net long-term capital gains in excess of realized net short-term capital losses) and treat such amounts as deemed distributions to our stockholders. If we do this, our stockholders will be treated as if they received actual distributions of the capital gains we retained and then reinvested the net after-tax proceeds in our common stock. Our stockholders also may be eligible to claim tax credits (or, in certain circumstances, tax refunds) equal to their allocable share of the tax we paid on the capital gains deemed distributed to them. To the extent our taxable earnings for a fiscal and taxable year fall below the total amount of our dividend distributions for that fiscal and taxable year, a portion of those distributions may be deemed a return of capital to our stockholders.
We may not be able to achieve operating results that will allow us to make distributions at a specific level or to increase the amount of these distributions from time to time. In addition, we may be limited in our ability to make distributions due to the asset coverage test
for borrowings applicable to us as a business development company under the 1940 Act and due to provisions in our Citibank facility, the East West Bank facilitycredit facilities and the 2015 Debt Securitization.debt instruments. If we do not distribute a certain percentage of our taxable income annually, we will suffer adverse tax consequences, including possible loss of our ability to be subject to tax as a RIC. We cannot assure stockholders that they will receive any distributions or distributions at a particular level.
A RIC may treat a distribution of its own stock as fulfilling its RIC distribution requirements if each stockholder may electelects to receive his or her entire distribution in either cash or stock of the RIC, subject to certain limitations regarding the aggregate amount of cash to be distributed to all stockholders. If these and certain other requirements are met, for U.S federal income tax purposes, the amount of the dividend paid in stock will be equal to the amount of cash that could have been received instead of stock. We have no current intention of paying dividends in shares of our stock in accordance with these guidelines.
We may generate qualified net interest income or qualified net short-term capital gains that may be exempt from United StatesU.S. withholding tax onwhen distributed to foreign accounts.stockholders. A RIC is permitted to designate distributions of qualified net interest income and qualified short-term capital gains as exempt from U.S. withholding tax when paid to non-U.S. shareholders with proper documentation. The following table, which may be subject to change as we finalize our annual tax filings, lists the percentage of qualified net interest income and qualified short-term capital gains for the three monthsyear ended December 31, 2015, March 31, 2016, June 30, 2016 and September 30, 2016.2017.
|
| | | | | |
| Years Ended | | Qualified Interest Income | Qualified Short-Term Capital Gains |
| December 31, 2015 | | 63.47 | % | 30.6 | % |
| March 31, 2016 | | 91.46 | % | — |
|
| June 30, 2016 | | 85.73 | % | — |
|
| September 30, 2016 | | 88.10 | % | — |
|
|
| | | | | |
| Year Ended | | Qualified Net Interest Income | Qualified Short-Term Capital Gains |
| September 30, 2017 | | 86.7 | % | — |
|
Related Party Transactions
We have entered into the New Investment Advisory Agreement with our Investment Adviser and the New Administration Agreement with Oaktree Administrator, a wholly-owned subsidiary of the Investment Adviser. Mr. John B. Frank, an interested member of our Board of Directors, has an indirect pecuniary interest in our Investment Adviser. The Investment Adviser is a registered investment advisory agreement with Fifth Street Management.adviser under the Advisers Act that is partially and indirectly owned by OCG. See “Item 1. Business-The Investment Adviser” and “-New Investment Advisory Agreement.”
Prior to October 17, 2017, we were externally managed and advised by our Former Adviser, and our administrator was our Former Administrator, a wholly-owned subsidiary of our Former Adviser. Messrs. Bernard D. Berman Dimitrov and Owens,Alexander C. Frank, each an interested member of our Board of Directors haveprior to October 17, 2017, had a direct or indirect pecuniary interest in Fifth Street Management. Fifth Street Management is a registered investment adviser under the Investment Advisers Act of 1940, as amended, that is partiallyour Former Adviser. See “Item 1. Business-Our Former Adviser and indirectly owned by FSAM. Pursuant to the investment advisory agreement, fees payable to our investment adviser are equal to (a) a base management fee of 1.0% of the average value of our gross assets at the end of the two most recently completed quarters, which includes any borrowings for investment purposes and excludes cash, cash equivalents and restricted cash and (b) an incentive fee based on our performance. The incentive fee consists of two parts. The Part I incentive fee is calculated and payable quarterly in arrears and equals 20% of our Pre-Incentive Fee Net Investment Income for the immediately preceding quarter, subject to a preferred return, or "hurdle," and a "catch up" feature. The Part II incentive fee is determined and payable in arrears as of the end of each fiscal year (or upon termination of the investment advisory agreement) and equals 20% of realized capital gains on a cumulative basis from inception through the end of the year, if any, computed net of all realized capital losses and unrealized capital depreciation on a cumulative basis, less the aggregate amount of any previously paid capital gain incentive fee. From inception to date, the Company has paid in aggregate Part II incentive fees of approximately $0.1 million. The investment advisory agreement may be terminated by either party without penalty upon no fewer than 60 days' written notice to the other. During the years ended September 30, 2016, September 30, 2015 and September 30, 2014, we accrued fees of $11.3 million, $10.9 million and $3.1 million, respectively, under the investment advisory agreement. For the year ended September 30, 2014, the investment adviser voluntarily agreed to waive the portion of the base management fee attributable to assets funded with proceeds from the August 2014 offering, which resulted in an irrevocable waiver of $0.2 million.Administrator.”
We serve as collateral manager to the 2015 Issuer under a collateral management agreement in connection with the 2015 Debt Securitization and are entitled to receive a fee for providing these services. We have retained Fifth Street Managementa sub-collateral manager, which, as of October 17, 2017, was the Investment Adviser and, prior to furnishOctober 17, 2017, was the Former Adviser, to provide collateral management sub-advisory services to us pursuant to a sub-collateral management agreement. Fifth Street ManagementThe sub-collateral manager is entitled to receive 100% of the collateral management fees paid to us under the collateral management agreement, but haseach of our Investment Adviser and the Former Adviser irrevocably waived and, in the case of the Investment Adviser, intends to continue to irrevocably waive its right to such sub-collateral management fees in respect of the 2015 Debt Securitization.
We have also entered into an administration agreement with FSC CT, a wholly-owned subsidiary of our investment adviser, under which FSC CT provides administrative services for us, including facilities, including our principal executive offices, and equipment and clerical, bookkeeping and recordkeeping services at such facilities. Under the administration agreement, FSC CT also performs, or oversees the performance of, our required administrative services, which includes being responsible for the financial records whichRecent Developments
Change in Investment Policy
On November 17, 2017, we are required to maintain and preparing reportsmailed notices to our stockholders and reports filed with the SEC. In addition, FSC CT assists us in determining and publishing our net asset value, overseeing the preparation and filing of our tax returns and the printing and dissemination of reports to our stockholders, and generally overseeing the payment of our expenses and the performance of administrative and professional services rendered to us by others. FSC CT may also provide on our behalf managerial assistance to our portfolio companies. For providing these services, facilities and personnel, we reimburse FSC CT the allocable portion of overhead and other expenses incurred by FSC CT in performing its obligations under the administration agreement, including rent and our allocable portion of the costs of compensation and related expenses of our chief financial officer and chief compliance officer and their respective staffs. Such reimbursement is at cost, with no profit to, or markup by, FSC CT. Our allocable portion of FSC CT’s costs is determined based upon costs attributable to our operations versus costs attributable to the operations of other entities for which FSC CT provides administrative services. We utilize office space that is leased by our administrator from an affiliate controlled by the chief executive officer of our investment adviser and administrator, Mr. Tannenbaum. We also utilize additional office space that is
leased by affiliates of our investment adviser and administrator in Chicago, IL and Miami Beach, FL. Any reimbursement for a portion of the rent at these locations is at cost with no profit to, or markup by, FSC CT.
The administration agreement may be terminated by either party without penalty upon no fewer than 60 days' written notice to the other. For the year ended September 30, 2016, we accrued administrative expenses of $1.2 million, including $0.7 million of general and administrative expenses. For the year ended September 30, 2015, we accrued administrative expenses of $1.3 million, including $0.5 million of general and administrative expenses. For the year ended September 30, 2014, we accrued administrative expenses of $0.7 million, including $0.2 million of general and administrative expenses. At September 30, 2016 and September 30, 2015, $0.4 million and $0.4 million, respectively, was included in Due to FSC CT in the Consolidated Statements of Assets and Liabilities.
We have also entered into a license agreement with Fifth Street Capital LLC pursuant to which Fifth Street Capital LLC has agreed to grant us a non-exclusive, royalty-free license to use the name "Fifth Street." Under this agreement, we will have a right to use the "Fifth Street" name for so long as Fifth Street Management or one of its affiliates remains our investment adviser. Other than with respect to this limited license, we will have no legal right to the "Fifth Street" name. Fifth Street Capital LLC is controlled by Mr. Tannenbaum, our investment adviser's chief executive officer.
Common stock held by FSAM
As of September 30, 2016, FSAM held 1,381,752 shares of our common stock, which represents approximately 4.7% of our common stock outstanding.
Recent Developments
On December 8, 2016, our Board of Directors appointed Patrick J. Dalton as Chief Executive Officerapproved a change to our investment policies and, elected himeffective January 19, 2018, we will no longer be subject to our current policy to invest, under normal market conditions, at least 80% of the value of our net assets (plus borrowings for investment purposes) in floating rate senior loans.
Citibank Facility Amendment
On December 6, 2017, we entered into an amendment to the documents governing the Citibank facility to remove Citibank, N.A.’s approval rights regarding our ability to purchase assets using proceeds from the Citibank facility, subject to a mark-to-market valuation protocol for broadly syndicated loans and a revised valuation dispute mechanism. The other material terms of the Citibank facility did not change as a memberresult of this amendment. We are in discussions to further amend and/or restate the BoardCitibank facility to extend the reinvestment period and final maturity date, among other changes. Although we cannot assure you that we will successfully amend and/or restate the Citibank facility, we currently expect the facility to be of Directors, effective January 2, 2017, succeeding Ivelin M. Dimitrov. In addition, Todd G. Owens will also step down from his roles as Presidenta similar size to the existing facility and a member ofto include certain affirmative and negative covenants and other customary requirements for similar credit facilities. The new facility is not committed, and the Board of Directors, effective January 2, 2017.terms, including pricing, remain subject to change.
On October 19, 2016, our Board of Directors declared the following distributions:
$0.075 per share, payable on December 30, 2016 to stockholders of record on December 15, 2016;
$0.075 per share, payable on January 31, 2017 to stockholders of record on January 13, 2017; and
$0.075 per share, payable on February 28, 2017 to stockholders of record on February 15, 2017.
For a discussion of legal proceedings, see Part II - Other Information - Item 1. Legal Proceedings.
Recently Issued Accounting Standards
See Note 3 to“Note 2. Significant Accounting Policies” in the Consolidated Financial Statements for a description of recent accounting pronouncements, including the expected dates of adoption and the anticipated impact on our Consolidated Financial Statements.
Item 7A. Quantitative and Qualitative Disclosures about Market Risk
We are subject to financial market risks, including changes in interest rates. Changes in interest rates may affect both our cost of funding and our interest income from portfolio investments, cash and cash equivalents and idle funds investments. Our risk management systems and procedures are designed to identify and analyze our risk, to set appropriate policies and limits and to continually monitor these risks and limits by means of reliable administrative and information systems and other policies and programs. Our investment income will be affected by changes in various interest rates, including LIBOR and prime rates, to the extent our debt investments include floating interest rates. In addition, our investments are carried at fair value as determined in good faith by our Board of Directors in accordance with the 1940 Act. Our valuation methodology utilizes discount rates in part in valuing our investments, and changes in those discount rates may have an impact on the valuation of our investments.
As of September 30, 2016,2017, 100% of our debt investment portfolio (at cost and fair value) bore interest at floating rates and had interest rate floors between 0% and 2%.
Based on our Consolidated Statement of Assets and Liabilities as of September 30, 2016,2017, the following table shows the approximate annualized increase in net interest income from hypothetical base rate changes in interest rates, assuming no changes in our investment and capital structure. However, there can be no assurances our portfolio companies will be able to meet their contractual obligations at any or all levels of increases in interest rates.
| | Basis point increase(1) | | Interest Income | | Interest Expense | | Net increase (decrease) | | Interest Income | | Interest Expense | | Net increase (decrease) |
| 500 | | $ | 24,029,015 |
| | $ | (14,371,340 | ) | | 9,657,675 |
| | $ | 23,202,957 |
| | $ | (13,147,840 | ) | | $ | 10,055,117 |
|
| 400 | | 18,507,869 |
| | (11,497,072 | ) | | 7,010,797 |
| | 18,562,365 |
| | (10,518,272 | ) | | 8,044,093 |
|
| 300 | | 12,986,723 |
| | (8,622,804 | ) | | 4,363,919 |
| | 13,921,774 |
| | (7,888,704 | ) | | 6,033,070 |
|
| 200 | | 7,465,576 |
| | (5,748,536 | ) | | 1,717,040 |
| | 9,281,183 |
| | (5,259,136 | ) | | 4,022,047 |
|
| 100 | | 1,944,430 |
| | (2,874,268 | ) | | (929,838 | ) | | 4,640,591 |
| | (2,629,568 | ) | | 2,011,023 |
|
|
| | | | | | | | | |
| Basis point decrease (1) | | Interest Income | | Interest Expense | | Net increase (decrease) |
| 100 | | (1,158,703 | ) | | 2,629,568 |
| | 1,470,865 |
|
__________________
| |
| (1) | A decline in interest rates of 200 basis points or greater would not have a material incremental impact on our financial statements.Consolidated Financial Statements as compared to a 100 basis point decrease. |
We regularly measure exposure to interest rate risk. We assess interest rate risk and manage our interest rate exposure on an ongoing basis by comparing our interest rate sensitive assets to our interest rate sensitive liabilities. Based on this review, we determine whether or not any hedging transactions are necessary to mitigate exposure to changes in interest rates. The following table shows a comparison of the interest rate base for our interest-bearing cash and outstanding investments, at principal, and our outstanding borrowings as of September 30, 20162017 and September 30, 2015.2016:
| | | | | September 30, 2016 | | September 30, 2015 | | September 30, 2017 | | September 30, 2016 |
| | | Interest Bearing Cash and Investments | | Borrowings | | Interest Bearing Cash and Investments | | Borrowings | | Interest Bearing Cash and Investments | | Borrowings | | Interest Bearing Cash and Investments | | Borrowings |
| Money market rate | | $ | 28,815,679 |
| | $ | — |
| | $ | 52,692,097 |
| | $ | — |
| | $ | 43,012,387 |
| | $ | — |
| | $ | 28,815,679 |
| | $ | — |
|
| Prime rate | | 543,445 |
| | — |
| | 18,905,206 |
| | — |
| | 490,693 |
| | — |
| | 543,445 |
| | — |
|
| LIBOR: | | | | | | | | | | | | | | | | |
| 30 day | | — |
| | — |
| | 171,084,244 |
| | — |
| | 218,782,104 |
| | 6,500,000 |
| | — |
| | — |
|
| 60 day | | — |
| | — |
| | 14,963,919 |
| | — |
| | 32,508,060 |
| | | | — |
| | — |
|
| 90 day | | 588,697,358 |
| | 180,000,000 |
| | 420,878,965 |
| | 186,366,000 |
| | 340,420,366 |
| | 256,456,800 |
| | 588,697,358 |
| | 180,000,000 |
|
| 180 day | | — |
| | 107,426,800 |
| | 6,352,000 |
| | 136,659,800 |
| | — |
| | — |
| | — |
| | 107,426,800 |
|
| Fixed rate | | — |
| | — |
| | — |
| | — |
| | — |
| | — |
| | — |
| | — |
|
| Total | | $ | 618,056,482 |
| | $ | 287,426,800 |
| | $ | 684,876,431 |
| | $ | 323,025,800 |
| | $ | 635,213,610 |
| | $ | 262,956,800 |
| | $ | 618,056,482 |
| | $ | 287,426,800 |
|
Item 8. Consolidated Financial Statements and Supplementary Data
Index to Consolidated Financial Statements
|
| |
| Page |
| |
| |
| |
| |
| |
| |
| |
Consolidated Schedule of Investments as of September 30, 2015 | |
| Notes to Consolidated Financial Statements | |
Report of Independent Registered Public Accounting Firm
To the Board of Directors and StockholdersShareholders of Fifth Street Senior Floating Rate Corp.:Oaktree Strategic Income Corporation
In our opinion, the accompanying consolidated statementstatements of assets and liabilities, including the consolidated schedule of investments, and the related consolidated statements of operations, of changes in net assets and of cash flows present fairly, in all material respects, the financial position of Oaktree Strategic Income Corporation (formerly known as Fifth Street Senior Floating Rate Corp.) and its subsidiaries (the “Company”) atas of September 30, 2016,2017 and September 30, 20152016, and the results of their operations, the changes in their net assets and their cash flows for each of the three years in the period ended September 30, 20162017 in conformity with accounting principles generally accepted in the United States of America. In addition, in our opinion, the financial statement schedule listed in the accompanying index appearing under Item 15(2) presents fairly, in all material respects, the information set forth therein when read in conjunction with the related consolidated financial statements. These financial statements and financial statement schedule are the responsibility of the Company's management. Our responsibility is to express an opinion on these financial statements and financial statement schedule based on our audits. We conducted our audits of these financial statements in accordance with the standards of the Public Company Accounting Oversight Board (United States). Those standards require that we plan and perform the audit to obtain reasonable assurance about whether the financial statements are free of material misstatement. An audit includes examining, on a test basis, evidence supporting the amounts and disclosures in the financial statements, assessing the accounting principles used and significant estimates made by management, and evaluating the overall financial statement presentation. We believe that our audits, which included confirmation of securities atas of September 30, 20162017 by correspondence with the custodian, transfer agent and brokers and the application of alternative auditing procedures where confirmations wereconfirmation had not been received, provide a reasonable basis for the opinion expressed above.our opinion.
/s/ PricewaterhouseCoopers LLP
New York, New York
December 13, 20168, 2017
Fifth Street Senior Floating Rate Corp.Oaktree Strategic Income Corporation
Consolidated Statements of Assets and Liabilities
| | | | | September 30,
2016 | | September 30,
2015 | | September 30,
2017 | | September 30,
2016 |
| ASSETS | ASSETS | | | ASSETS | | |
| Investments at fair value: | | | | | | | | |
| Control investments (cost September 30, 2016: $71,117,506; cost September 30, 2015: $58,977,973) | | $ | 63,316,667 |
| | $ | 57,156,921 |
| |
| Affiliate investments (cost September 30, 2016: $15,953,798; cost September 30, 2015: $0) | | 13,006,458 |
| | — |
| |
| Non-control/Non-affiliate investments (cost September 30, 2016: $513,397,659; cost September 30, 2015: $574,538,984) | | 497,281,256 |
| | 566,490,553 |
| |
Total investments at fair value (cost September 30, 2016: $600,468,963; cost September 30, 2015: $633,516,957) | | 573,604,381 |
| | 623,647,474 |
| |
| Control investments (cost September 30, 2017: $71,340,632; cost September 30, 2016: $71,117,506) | | | $ | 57,606,674 |
| | $ | 63,316,667 |
|
| Affiliate investments (cost September 30, 2017: $17,479,053; cost September 30, 2016: $15,953,798) | | | 935,913 |
| | 13,006,458 |
|
| Non-control/Non-affiliate investments (cost September 30, 2017: $516,270,639; cost September 30, 2016: $513,397,659) | | | 501,894,073 |
| | 497,281,256 |
|
| Total investments at fair value (cost September 30, 2017: $605,090,324; cost September 30, 2016: $600,468,963) | | | 560,436,660 |
| | 573,604,381 |
|
| Cash and cash equivalents | | 19,778,841 |
| | 41,433,301 |
| | 35,604,127 |
| | 19,778,841 |
|
| Restricted cash | | 9,036,838 |
| | 11,258,796 |
| | 7,408,260 |
| | 9,036,838 |
|
| Interest, dividends and fees receivable | | 4,579,935 |
| | 2,783,379 |
| | 3,014,075 |
| | 4,579,935 |
|
| Due from portfolio companies | | 336,429 |
| | 11,587 |
| | 286,260 |
| | 336,429 |
|
| Receivables from unsettled transactions | | 12,869,092 |
| | 13,541,056 |
| | 505,000 |
| | 12,869,092 |
|
| Deferred financing costs | | 4,577,369 |
| | 5,001,675 |
| | 1,222,933 |
| | 2,063,133 |
|
| Other assets | | 148,492 |
| | 33,216 |
| | 185,336 |
| | 148,492 |
|
| Total assets | | $ | 624,931,377 |
| | $ | 697,710,484 |
| | $ | 608,662,651 |
| | $ | 622,417,141 |
|
| LIABILITIES AND NET ASSETS | LIABILITIES AND NET ASSETS | | | LIABILITIES AND NET ASSETS | | |
| Liabilities: | | | | | | | | |
| Accounts payable, accrued expenses and other liabilities | | $ | 1,246,286 |
| | $ | 1,911,599 |
| | $ | 482,877 |
| | $ | 1,246,286 |
|
| Base management fee and incentive fee payable | | 2,987,721 |
| | 2,055,179 |
| | 2,236,187 |
| | 2,987,721 |
|
| Due to FSC CT | | 402,073 |
| | 379,641 |
| | 450,517 |
| | 402,073 |
|
| Interest payable | | 1,798,653 |
| | 1,669,012 |
| | 1,996,171 |
| | 1,798,653 |
|
| Payables from unsettled transactions | | — |
| | 11,809,500 |
| | 49,029,789 |
| | — |
|
| Amounts payable to syndication partners | | 18,750 |
| | — |
| | — |
| | 18,750 |
|
| Director fees payable | | 236,275 |
| | 52,650 |
| | 98,008 |
| | 236,275 |
|
| Credit facilities payable | | 107,426,800 |
| | 136,659,800 |
| | 82,956,800 |
| | 107,426,800 |
|
| Notes payable | | 180,000,000 |
| | 186,366,000 |
| |
| Secured borrowings at fair value (proceeds September 30, 2016: $5,000,000; proceeds September 30, 2015: $0) | | 4,985,425 |
| | — |
| |
| Notes payable (net of $2,224,132 and $2,514,236 of unamortized financing costs as of September 30, 2017 and September 30, 2016, respectively) | | | 177,775,868 |
| | 177,485,764 |
|
| Secured borrowings at fair value (proceeds September 30, 2016: $5,000,000) | | | — |
| | 4,985,425 |
|
| Total liabilities | | 299,101,983 |
| | 340,903,381 |
| | 315,026,217 |
| | 296,587,747 |
|
| Commitments and contingencies (Note 14) | | | | | |
| Commitments and contingencies (Note 13) | | | | | |
| Net assets: | | | | | | | | |
| Common stock, $0.01 par value, 150,000,000 shares authorized; 29,466,768 shares issued and outstanding at September 30, 2016 and September 30, 2015 | | 294,668 |
| | 294,668 |
| |
| Common stock, $0.01 par value, 150,000,000 shares authorized; 29,466,768 shares issued and outstanding at September 30, 2017 and September 30, 2016 | | | 294,668 |
| | 294,668 |
|
| Additional paid-in-capital | | 373,995,934 |
| | 373,995,934 |
| | 373,995,934 |
| | 373,995,934 |
|
| Net unrealized depreciation on investments and secured borrowings | | (26,850,007 | ) | | (9,869,483 | ) | | (44,653,664 | ) | | (26,850,007 | ) |
| Net realized gain (loss) on investments | | (10,969,707 | ) | | 1,800,070 |
| |
| Net realized loss on investments | | | (24,354,622 | ) | | (10,969,707 | ) |
| Accumulated overdistributed net investment income | | (10,641,494 | ) | | (9,414,086 | ) | | (11,645,882 | ) | | (10,641,494 | ) |
| Total net assets (equivalent to $11.06 and $12.11 per common share at September 30, 2016 and September 30, 2015, respectively) (Note 13) | | 325,829,394 |
| | 356,807,103 |
| |
| Total net assets (equivalent to $9.97 and $11.06 per common share at September 30, 2017 and September 30, 2016, respectively) (Note 12) | | | 293,636,434 |
| | 325,829,394 |
|
| Total liabilities and net assets | | $ | 624,931,377 |
| | $ | 697,710,484 |
| | $ | 608,662,651 |
| | $ | 622,417,141 |
|
See notes to Consolidated Financial Statements.
Fifth Street Senior Floating Rate Corp.Oaktree Strategic Income Corporation
Consolidated Statements of Operations
| | | | | Year ended
September 30, 2016 | | Year ended
September 30, 2015 | | Year ended
September 30, 2014
(revised) | | Year ended
September 30, 2017 | | Year ended
September 30, 2016 | | Year ended
September 30, 2015 | |
| Interest income: | | | | | | | | | | | | | |
| Control investments | | $ | 5,065,350 |
| | $ | 1,770,130 |
| | $ | — |
| | $ | 5,541,299 |
| | $ | 5,065,350 |
| | $ | 1,770,130 |
| |
| Affiliate investments | | 182,194 |
| | — |
| | — |
| | 331,804 |
| | 182,194 |
| | — |
| |
| Non-control/Non-affiliate investments | | 42,152,565 |
| | 39,269,556 |
| | 10,468,094 |
| | 38,489,924 |
| | 42,152,565 |
| | 39,269,556 |
| |
| Interest on cash and cash equivalents | | 68,630 |
| | 28,571 |
| | 8,889 |
| | 166,896 |
| | 68,630 |
| | 28,571 |
| |
| Total interest income | | 47,468,739 |
| | 41,068,257 |
| | 10,476,983 |
| | 44,529,923 |
| | 47,468,739 |
| | 41,068,257 |
| |
| PIK interest income: | | | | | | | | | | | | | |
| Control investments | | | 223,125 |
| | — |
| | — |
| |
| Affiliate investments | | 91,097 |
| | — |
| | — |
| | 164,331 |
| | 91,097 |
| | — |
| |
| Non-control/Non-affiliate investments | | 75,968 |
| | — |
| | — |
| | 20,965 |
| | 75,968 |
| | — |
| |
| Total PIK interest income | | 167,065 |
| | — |
| | — |
| | 408,421 |
| | 167,065 |
| | — |
| |
| Fee income: | | | | | | | | | | | | | |
| Affiliate investments | | 6,296 |
| | — |
| | — |
| | 9,647 |
| | 6,296 |
| | — |
| |
| Non-control/Non-affiliate investments | | 3,071,634 |
| | 9,673,649 |
| | 2,039,691 |
| | 2,199,909 |
| | 3,071,634 |
| | 9,673,649 |
| |
| Total fee income | | 3,077,930 |
| | 9,673,649 |
| | 2,039,691 |
| | 2,209,556 |
| | 3,077,930 |
| | 9,673,649 |
| |
| Dividend and other income: | | | | | | | | | | | | | |
| Control investments | | 2,712,500 |
| | 730,625 |
| | — |
| | (576,044 | ) | | 2,712,500 |
| | 730,625 |
| |
| Total dividend and other income | | 2,712,500 |
| | 730,625 |
| | — |
| | (576,044 | ) | | 2,712,500 |
| | 730,625 |
| |
| Total investment income | | 53,426,234 |
| | 51,472,531 |
| | 12,516,674 |
| | 46,571,856 |
| | 53,426,234 |
| | 51,472,531 |
| |
| Expenses: | | | | | | | | | | | | | |
| Base management fee | | 6,134,304 |
| | 5,931,155 |
| | 1,757,492 |
| | 5,654,699 |
| | 6,134,304 |
| | 5,931,155 |
| |
| Part I incentive fee | | 5,211,729 |
| | 5,689,371 |
| | 708,235 |
| | 3,236,320 |
| | 5,211,729 |
| | 5,689,371 |
| |
| Part II incentive fee | | — |
| | (766,552 | ) | | 774,841 |
| | — |
| | — |
| | (766,552 | ) | |
| Professional fees | | 4,193,532 |
| | 985,607 |
| | 827,447 |
| | 1,515,536 |
| | 4,193,532 |
| | 985,607 |
| |
| Board of Directors fees | | 546,300 |
| | 359,700 |
| | 185,083 |
| | 538,072 |
| | 546,300 |
| | 359,700 |
| |
| Interest expense | | 9,594,441 |
| | 8,950,703 |
| | 1,555,767 |
| | 10,769,842 |
| | 9,594,441 |
| | 8,950,703 |
| |
| Administrator expense | | 504,299 |
| | 794,725 |
| | 514,861 |
| | 661,170 |
| | 504,299 |
| | 794,725 |
| |
| General and administrative expenses | | 1,955,177 |
| | 1,249,792 |
| | 583,942 |
| | 2,030,756 |
| | 1,955,177 |
| | 1,249,792 |
| |
| Total expenses | | 28,139,782 |
| | 23,194,501 |
| | 6,907,668 |
| | 24,406,395 |
| | 28,139,782 |
| | 23,194,501 |
| |
| Base management fee waived | | (6,232 | ) | | — |
| | (154,875 | ) | | (6,232 | ) | | (6,232 | ) | | — |
| |
| Insurance recoveries | | | (250,000 | ) | | — |
| | — |
| |
| Net expenses | | 28,133,550 |
| | 23,194,501 |
| | 6,752,793 |
| | 24,150,163 |
| | 28,133,550 |
| | 23,194,501 |
| |
| Net investment income | | 25,292,684 |
| | 28,278,030 |
| | 5,763,881 |
| | 22,421,693 |
| | 25,292,684 |
| | 28,278,030 |
| |
| Unrealized appreciation (depreciation) on investments: | | | | | | | | | | | | | |
| Control investments | | (5,979,787 | ) | | (1,821,052 | ) | | — |
| | (5,933,119 | ) | | (5,979,787 | ) | | (1,821,052 | ) | |
| Affiliate investments | | (2,947,340 | ) | | — |
| | — |
| | (13,595,800 | ) | | (2,947,340 | ) | | — |
| |
| Non-control/Non-affiliate investments | | (8,067,972 | ) | | (10,951,116 | ) | | 2,254,642 |
| | 1,739,837 |
| | (8,067,972 | ) | | (10,951,116 | ) | |
| Net unrealized appreciation (depreciation) on investments | | (16,995,099 | ) | | (12,772,168 | ) | | 2,254,642 |
| |
| Net unrealized depreciation on secured borrowings | | 14,575 |
| | — |
| | — |
| |
| Realized gain (loss) on investments: | | | | | | | |
| Net unrealized depreciation on investments | | | (17,789,082 | ) | | (16,995,099 | ) | | (12,772,168 | ) | |
| Net unrealized (appreciation) depreciation on secured borrowings | | | (14,575 | ) | | 14,575 |
| | — |
| |
| Realized gain (loss) on investments and secured borrowings: | | | | | | | | |
| Non-control/Non-affiliate investments | | (12,769,777 | ) | | 406,220 |
| | 1,345,434 |
| | (13,384,915 | ) | | (12,769,777 | ) | | 406,220 |
| |
| Net realized gain (loss) on investments | | (12,769,777 | ) | | 406,220 |
| | 1,345,434 |
| |
| Net realized gain (loss) on investments and secured borrowings | | | (13,384,915 | ) | | (12,769,777 | ) | | 406,220 |
| |
| Net increase (decrease) in net assets resulting from operations | | $ | (4,457,617 | ) | | $ | 15,912,082 |
| | $ | 9,363,957 |
| | $ | (8,766,879 | ) | | $ | (4,457,617 | ) | | $ | 15,912,082 |
| |
| Net investment income per common share — basic and diluted | | $ | 0.86 |
| | $ | 0.96 |
| | $ | 0.62 |
| | $ | 0.76 |
| | $ | 0.86 |
| | $ | 0.96 |
| |
| Earnings (loss) per common share — basic and diluted | | $ | (0.15 | ) | | $ | 0.54 |
| | $ | 1.01 |
| |
| Earnings (loss) per common share — basic and diluted (Note 5) | | | $ | (0.30 | ) | | $ | (0.15 | ) | | $ | 0.54 |
| |
| Weighted average common shares outstanding — basic and diluted | | 29,466,768 |
| | 29,466,768 |
| | 9,290,330 |
| | 29,466,768 |
| | 29,466,768 |
| | 29,466,768 |
| |
| Distributions per common share (Note 6) | | $ | 0.90 |
| | $ | 1.07 |
| | $ | 1.01 |
| |
| Distributions per common share | | | $ | 0.80 |
| | $ | 0.90 |
| | $ | 1.07 |
| |
See notes to Consolidated Financial Statements.
Fifth Street Senior Floating Rate Corp.Oaktree Strategic Income Corporation
Consolidated Statements of Changes in Net Assets
|
| | | | | | | | | | | | |
| | | Year ended
September 30, 2016 | | Year ended
September 30, 2015 | | Year ended
September 30, 2014 (revised) |
| Operations: | | | | | | |
| Net investment income | | $ | 25,292,684 |
| | $ | 28,278,030 |
| | $ | 5,763,881 |
|
| Net unrealized appreciation (depreciation) on investments | | (16,995,099 | ) | | (12,772,168 | ) | | 2,254,642 |
|
| Net unrealized depreciation on secured borrowings | | 14,575 |
| | — |
| | — |
|
| Net realized gain (loss) on investments | | (12,769,777 | ) | | 406,220 |
| | 1,345,434 |
|
| Net increase (decrease) in net assets resulting from operations | | (4,457,617 | ) | | 15,912,082 |
| | 9,363,957 |
|
| Stockholder transactions: | | | | | | |
| Distributions to stockholders | | (26,520,092 | ) | | (31,676,775 | ) | | (11,823,899 | ) |
| Tax return of capital | | — |
| | — |
| | (1,749,538 | ) |
| Net decrease in net assets from stockholder transactions | | (26,520,092 | ) | | (31,676,775 | ) | | (13,573,437 | ) |
| Capital share transactions: | | | | | | |
| Issuance of common stock, net | | — |
| | (105,882 | ) | | 276,181,889 |
|
| Issuance of common stock under dividend reinvestment plan | | 650,402 |
| | 889,511 |
| | 224,038 |
|
| Repurchases of common stock under dividend reinvestment plan | | (650,402 | ) | | (889,511 | ) | | (224,038 | ) |
| Net increase (decrease) in net assets from capital share transactions | | — |
|
| (105,882 | ) | | 276,181,889 |
|
| Total increase (decrease) in net assets | | (30,977,709 | ) | | (15,870,575 | ) | | 271,972,409 |
|
| Net assets at beginning of period | | 356,807,103 |
| | 372,677,678 |
| | 100,705,269 |
|
| Net assets at end of period | | $ | 325,829,394 |
| | $ | 356,807,103 |
| | $ | 372,677,678 |
|
| Net asset value per common share | | $ | 11.06 |
| | $ | 12.11 |
| | $ | 12.65 |
|
| Common shares outstanding at end of period | | 29,466,768 |
| | 29,466,768 |
| | 29,466,768 |
|
See notes to Consolidated Financial Statements.
Fifth Street Senior Floating Rate Corp.
Consolidated Statements of Cash Flows
|
| | | | | | | | | | | | |
| | | Year ended
September 30, 2016 | | Year ended
September 30, 2015 | | Year ended
September 30, 2014 (revised) |
| Operating activities: | | | |
| | |
| Net increase (decrease) in net assets resulting from operations | | $ | (4,457,617 | ) | | $ | 15,912,082 |
| | $ | 9,363,957 |
|
| Adjustments to reconcile net increase (decrease) in net assets resulting from operations to net cash provided (used) by operating activities: | | | | | | |
| Net unrealized (appreciation) depreciation on investments | | 16,995,099 |
| | 12,772,168 |
| | (2,254,642 | ) |
| Net unrealized depreciation on secured borrowings | | (14,575 | ) | | — |
| | — |
|
| Net realized (gain) loss on investments | | 12,769,777 |
| | (406,220 | ) | | (1,345,434 | ) |
| PIK interest income | | (167,065 | ) | | — |
| | |
| Recognition of fee income | | (3,077,930 | ) | | (9,673,649 | ) | | (2,039,691 | ) |
| Accretion of original issue discount on investments | | (1,924,087 | ) | | (1,634,191 | ) | | (396,488 | ) |
| Amortization of deferred financing costs | | 874,680 |
| | 2,768,573 |
| | 210,415 |
|
| Changes in operating assets and liabilities: | | | | | | |
| Fee income received | | 3,060,760 |
| | 9,767,645 |
| | 2,082,659 |
|
| (Increase) decrease in restricted cash | | 2,221,958 |
| | (9,131,391 | ) | | (2,127,405 | ) |
| Increase in interest, dividends and fees receivable | | (1,796,556 | ) | | (1,663,369 | ) | | (725,987 | ) |
| (Increase) decrease in due from portfolio companies | | (324,842 | ) | | 189,253 |
| | (192,507 | ) |
| (Increase) decrease in receivables from unsettled transactions | | 5,671,964 |
| | (13,541,056 | ) | | — |
|
| (Increase) decrease in other assets | | (115,276 | ) | | (33,216 | ) | | 47,240 |
|
| Increase (decrease) in accounts payable, accrued expenses and other liabilities | | (665,313 | ) | | 697,916 |
| | 729,617 |
|
| Increase in base management fee and incentive fee payable | | 932,542 |
| | 589,489 |
| | 1,266,702 |
|
| Increase in due to FSC CT | | 22,432 |
| | 140,024 |
| | 177,896 |
|
| Increase in interest payable | | 129,641 |
| | 1,463,366 |
| | 205,646 |
|
| Increase (decrease) in payables from unsettled transactions | | (11,809,500 | ) | | (16,053,500 | ) | | 27,863,000 |
|
| Increase in amounts payable to syndication partners | | 18,750 |
| | — |
| | — |
|
| Increase (decrease) in director fees payable | | 183,625 |
| | 52,650 |
| | — |
|
| Purchases of investments and net revolver activity | | (286,134,332 | ) | | (886,999,491 | ) | | (400,524,925 | ) |
| Principal payments received on investments (scheduled payments) | | 12,221,079 |
| | 11,677,139 |
| | 5,587,277 |
|
| Principal payments received on investments (payoffs) | | 132,931,016 |
| | 60,488,532 |
| | 26,978,730 |
|
| PIK interest income received in cash | | 78,226 |
| | — |
| | — |
|
| Proceeds from the sale of investments | | 163,290,550 |
| | 480,361,990 |
| | 120,564,734 |
|
| Net cash provided (used) by operating activities | | 40,915,006 |
| | (342,255,256 | ) | | (214,529,206 | ) |
| Financing activities: | | | | | | |
| Proceeds from issuance of common stock | | — |
| | — |
| | 276,687,121 |
|
| Distributions paid in cash | | (25,869,690 | ) | | (39,436,200 | ) | | (4,700,460 | ) |
| Borrowings under credit facilities | | 16,267,000 |
| | 428,509,800 |
| | 110,620,610 |
|
| Repayments of borrowings under credit facilities | | (45,500,000 | ) | | (291,850,000 | ) | | (110,620,610 | ) |
| Proceeds from issuance of notes payable | | 29,715,000 |
| | 186,366,000 |
| | — |
|
| Repayments of notes payable | | (36,081,000 | ) | | — |
| | — |
|
| Repurchases of common stock under dividend reinvestment plan | | (650,402 | ) | | (1,080,605 | ) | | (32,946 | ) |
| Deferred financing costs paid | | (450,374 | ) | | (6,144,316 | ) | | (1,836,347 | ) |
| Offering costs paid | | — |
| | (105,882 | ) | | (505,233 | ) |
| Net cash provided (used) by financing activities | | (62,569,466 | ) | | 276,258,797 |
| | 269,612,135 |
|
| Net increase (decrease) in cash and cash equivalents | | (21,654,460 | ) | | (65,996,459 | ) | | 55,082,929 |
|
| Cash and cash equivalents, beginning of period | | 41,433,301 |
| | 107,429,760 |
| | 52,346,831 |
|
| Cash and cash equivalents, end of period | | $ | 19,778,841 |
| | $ | 41,433,301 |
| | $ | 107,429,760 |
|
Fifth Street Senior Floating Rate Corp.
Consolidated Statements of Cash Flows
|
| | | | | | | | | | | | |
| | | Year ended
September 30, 2016 | | Year ended
September 30, 2015 | | Year ended
September 30, 2014 (revised) |
| Supplemental information: | | | | | | |
| Cash paid for interest | | $ | 8,590,120 |
| | $ | 4,718,763 |
| | $ | 1,220,079 |
|
| Non-cash operating activities: | | | | | | |
| Purchase of investment from restructuring | | $ | (12,559,122 | ) | | $ | — |
| | $ | — |
|
| Proceeds from investment restructuring | | $ | 12,559,122 |
| | $ | — |
| | $ | — |
|
| Exchange of investments | | $ | 1,325,000 |
| | $ | 58,823,756 |
| | $ | — |
|
| Non-cash financing activities: | | | | | | |
| Proceeds from unsettled secured borrowings | | $ | 5,000,000 |
| | $ | — |
| | $ | — |
|
| Issuance of shares of common stock under dividend reinvestment plan | | $ | 650,402 |
| | $ | 1,080,605 |
| | $ | 32,946 |
|
|
| | | | | | | | | | | | |
| | | Year ended
September 30, 2017 | | Year ended
September 30, 2016 | | Year ended
September 30, 2015 |
| Operations: | | | | | | |
| Net investment income | | $ | 22,421,693 |
| | $ | 25,292,684 |
| | $ | 28,278,030 |
|
| Net unrealized depreciation on investments | | (17,789,082 | ) | | (16,995,099 | ) | | (12,772,168 | ) |
| Net unrealized (appreciation) depreciation on secured borrowings | | (14,575 | ) | | 14,575 |
| | — |
|
| Net realized gain (loss) on investments and secured borrowings | | (13,384,915 | ) | | (12,769,777 | ) | | 406,220 |
|
| Net increase (decrease) in net assets resulting from operations | | (8,766,879 | ) | | (4,457,617 | ) | | 15,912,082 |
|
| Stockholder transactions: | | | | | | |
| Distributions to stockholders | | (23,426,081 | ) | | (26,520,092 | ) | | (31,676,775 | ) |
| Net decrease in net assets from stockholder transactions | | (23,426,081 | ) | | (26,520,092 | ) | | (31,676,775 | ) |
| Capital share transactions: | | | | | | |
| Issuance of common stock, net | | — |
| | — |
| | (105,882 | ) |
| Issuance of common stock under dividend reinvestment plan | | 270,630 |
| | 650,402 |
| | 889,511 |
|
| Repurchases of common stock under dividend reinvestment plan | | (270,630 | ) | | (650,402 | ) | | (889,511 | ) |
| Net decrease in net assets from capital share transactions | | — |
|
| — |
| | (105,882 | ) |
| Total decrease in net assets | | (32,192,960 | ) | | (30,977,709 | ) | | (15,870,575 | ) |
| Net assets at beginning of period | | 325,829,394 |
| | 356,807,103 |
| | 372,677,678 |
|
| Net assets at end of period | | $ | 293,636,434 |
| | $ | 325,829,394 |
| | $ | 356,807,103 |
|
| Net asset value per common share | | $ | 9.97 |
| | $ | 11.06 |
| | $ | 12.11 |
|
| Common shares outstanding at end of period | | 29,466,768 |
| | 29,466,768 |
| | 29,466,768 |
|
See notes to Consolidated Financial Statements.
Fifth Street Senior Floating Rate Corp.Oaktree Strategic Income Corporation
Consolidated ScheduleStatements of InvestmentsCash Flows
September 30, 2016
|
| | | | | | | | | | | | | | |
| Portfolio Company/Type of Investment (1)(2)(10)(17) | | Industry | | Principal (5) |
| | Cost | | Fair Value |
| Control Investments (3) | | | | | | | | |
| FSFR Glick JV LLC (7)(12)(18) | | Multi-sector holdings | | | | | | |
| Subordinated Note, LIBOR+8% cash due 10/20/2021 (8) | | | | $ | 64,005,755 |
| | $ | 64,005,755 |
| | $ | 56,885,646 |
|
| 87.5% equity interest (14) | | | | | | 7,111,751 |
| | 6,431,021 |
|
| | | | | | | 71,117,506 |
| | 63,316,667 |
|
| Total Control Investments (19.4% of net assets) | | | | | | $ | 71,117,506 |
| | $ | 63,316,667 |
|
| Affiliate Investments (4) | | | | | | | | |
| Ameritox Ltd. (15) | | Healthcare services | | | | | | |
| First Lien Term Loan, LIBOR+5% (1% floor) cash 3% PIK due 4/11/2021 (8)(13) | | | | $ | 6,387,128 |
| | $ | 6,380,832 |
| | $ | 6,342,286 |
|
| 3,309,873.6 Class A Preferred Units in Ameritox Holdings II, LLC | | | | | | 3,309,874 |
| | 3,626,150 |
|
| 327,393.6 Class B Preferred Units in Ameritox Holdings II, LLC | | | | | | 327,394 |
| | 358,679 |
|
| 1,007.36 Class A Units in Ameritox Holdings II, LLC | | | | | | 5,935,698 |
| | 2,679,343 |
|
| | | | | | | 15,953,798 |
| | 13,006,458 |
|
| Total Affiliate Investments (4.0% of net assets) | | | | | | $ | 15,953,798 |
| | $ | 13,006,458 |
|
| | | | | | | | | |
| Non-Control/Non-Affiliate Investments (6) | | | | | | | | |
| Triple Point Group Holdings, Inc. | | Application software | | | | | | |
| First Lien Revolver, LIBOR+4.25% (1% floor) cash due 7/10/2018 (8) | | | | | | $ | — |
| | $ | — |
|
| | | | | | | — |
| | — |
|
| Blackhawk Specialty Tools, LLC | | Oil & gas equipment & services | | | | | | |
| First Lien Term Loan, LIBOR+5.25% (1.25% floor) cash due 8/1/2019 (8)(13) | | | | $ | 4,249,996 |
| | 4,177,081 |
| | 4,090,429 |
|
| | | | | | | 4,177,081 |
| | 4,090,429 |
|
| New Trident Holdcorp, Inc. | | Healthcare services | | | | | | |
| First Lien Term Loan B, LIBOR+5.25% (1.25% floor) cash due 7/31/2019 (8)(13) | | | | 13,707,532 |
| | 13,289,778 |
| | 11,788,478 |
|
| Second Lien Term Loan, LIBOR+9% (1.25% floor) cash due 7/31/2020 (8) | | | | 1,000,000 |
| | 972,500 |
| | 820,000 |
|
| | | | | | | 14,262,278 |
| | 12,608,478 |
|
| NXT Capital, LLC | | Diversified capital markets | | | | | | |
| First Lien Term Loan, LIBOR+5.25% (1% floor) cash due 9/4/2018 (8)(13) | | | | 8,719,887 |
| | 8,685,189 |
| | 8,763,486 |
|
| | | | | | | 8,685,189 |
| | 8,763,486 |
|
| Vitera Healthcare Solutions, LLC | | Healthcare technology | | | | | | |
| First Lien Term Loan, LIBOR+5% (1% floor) cash due 11/4/2020 (8)(13) | | | | 4,862,500 |
| | 4,856,420 |
| | 4,747,016 |
|
| | | | | | | 4,856,420 |
| | 4,747,016 |
|
| The Active Network, Inc. | | Internet software & services | | | | | | |
| Second Lien Term Loan, LIBOR+8.5% (1% floor) cash due 11/15/2021 (8)(13) | | | | 2,400,000 |
| | 2,314,573 |
| | 2,370,000 |
|
| | | | | | | 2,314,573 |
| | 2,370,000 |
|
| Accruent, LLC | | Internet software & services | | | | | | |
| First Lien Term Loan, LIBOR+5.25% (1% floor) cash due 5/16/2022 (8) | | | | 9,975,000 |
| | 9,881,944 |
| | 9,994,012 |
|
| First Lien Revolver, LIBOR+5.25% (1% floor) cash due 5/16/2022 (8)(11) | | | | | | (791 | ) | | — |
|
| | | | | | | 9,881,153 |
| | 9,994,012 |
|
| Survey Sampling International, LLC | | Research & consulting services | | | | | | |
| First Lien Term Loan, LIBOR+5% (1% floor) cash due 12/16/2020 (8)(13) | | | | 5,726,682 |
| | 5,691,793 |
| | 5,726,682 |
|
| Second Lien Term Loan, LIBOR+9% (1% floor) cash due 12/16/2021 (8) | | | | 1,000,000 |
| | 985,238 |
| | 980,000 |
|
| | | | | | | 6,677,031 |
| | 6,706,682 |
|
|
| | | | | | | | | | | | |
| | | Year ended
September 30, 2017 | | Year ended
September 30, 2016 | | Year ended
September 30, 2015 |
| Operating activities: | | | |
| | |
| Net increase (decrease) in net assets resulting from operations | | $ | (8,766,879 | ) | | $ | (4,457,617 | ) | | $ | 15,912,082 |
|
| Adjustments to reconcile net increase (decrease) in net assets resulting from operations to net cash provided (used) by operating activities: | | | | | | |
| Net unrealized depreciation on investments | | 17,789,082 |
| | 16,995,099 |
| | 12,772,168 |
|
| Net unrealized appreciation (depreciation) on secured borrowings | | 14,575 |
| | (14,575 | ) | | — |
|
| Net realized (gain) loss on investments and secured borrowings | | 13,384,915 |
| | 12,769,777 |
| | (406,220 | ) |
| PIK interest income | | (408,421 | ) | | (167,065 | ) | | — |
|
| Recognition of fee income | | (2,209,556 | ) | | (3,077,930 | ) | | (9,673,649 | ) |
| Accretion of original issue discount on investments | | (3,945,886 | ) | | (1,924,087 | ) | | (1,634,191 | ) |
| Amortization of deferred financing costs | | 1,255,304 |
| | 874,680 |
| | 2,768,573 |
|
| Changes in operating assets and liabilities: | | | | | | |
| Fee income received | | 2,190,276 |
| | 3,060,760 |
| | 9,767,645 |
|
| (Increase) decrease in restricted cash | | 1,628,578 |
| | 2,221,958 |
| | (9,131,391 | ) |
| (Increase) decrease in interest, dividends and fees receivable | | 1,565,860 |
| | (1,796,556 | ) | | (1,663,369 | ) |
| (Increase) decrease in due from portfolio companies | | 50,169 |
| | (324,842 | ) | | 189,253 |
|
| (Increase) decrease in receivables from unsettled transactions | | 12,364,092 |
| | 5,671,964 |
| | (13,541,056 | ) |
| Increase in other assets | | (36,844 | ) | | (115,276 | ) | | (33,216 | ) |
| Increase (decrease) in accounts payable, accrued expenses and other liabilities | | (763,409 | ) | | (665,313 | ) | | 697,916 |
|
| Increase (decrease) in base management fee and incentive fee payable | | (751,534 | ) | | 932,542 |
| | 589,489 |
|
| Increase in due to FSC CT | | 48,444 |
| | 22,432 |
| | 140,024 |
|
| Increase in interest payable | | 197,518 |
| | 129,641 |
| | 1,463,366 |
|
| Increase (decrease) in payables from unsettled transactions | | 49,029,789 |
| | (11,809,500 | ) | | (16,053,500 | ) |
| Increase (decrease) in amounts payable to syndication partners | | (18,750 | ) | | 18,750 |
| | — |
|
| Increase (decrease) in director fees payable | | (138,267 | ) | | 183,625 |
| | 52,650 |
|
| Purchases of investments and net revolver activity | | (290,578,883 | ) | | (286,134,332 | ) | | (886,999,491 | ) |
| Principal payments received on investments (scheduled payments) | | 16,222,229 |
| | 12,221,079 |
| | 11,677,139 |
|
| Principal payments received on investments (payoffs) | | 215,278,210 |
| | 132,931,016 |
| | 60,488,532 |
|
| PIK interest income received in cash | | — |
| | 78,226 |
| | — |
|
| Proceeds from the sale of investments | | 45,445,755 |
| | 163,290,550 |
| | 480,361,990 |
|
| Net cash provided (used) by operating activities | | 68,846,367 |
| | 40,915,006 |
| | (342,255,256 | ) |
| Financing activities: | | | | | | |
| Distributions paid in cash | | (23,155,451 | ) | | (25,869,690 | ) | | (39,436,200 | ) |
| Borrowings under credit facilities | | 55,500,000 |
| | 16,267,000 |
| | 428,509,800 |
|
| Repayments of borrowings under credit facilities | | (79,970,000 | ) | | (45,500,000 | ) | | (291,850,000 | ) |
| Repayments of secured borrowings | | (5,000,000 | ) | | — |
| | — |
|
| Proceeds from issuance of notes payable | | 7,500,000 |
| | 29,715,000 |
| | 186,366,000 |
|
| Repayments of notes payable | | (7,500,000 | ) | | (36,081,000 | ) | | — |
|
| Repurchases of common stock under dividend reinvestment plan | | (270,630 | ) | | (650,402 | ) | | (1,080,605 | ) |
| Deferred financing costs paid | | (125,000 | ) | | (450,374 | ) | | (6,144,316 | ) |
| Offering costs paid | | — |
| | — |
| | (105,882 | ) |
| Net cash provided (used) by financing activities | | (53,021,081 | ) |
| (62,569,466 | ) | | 276,258,797 |
|
| Net increase (decrease) in cash and cash equivalents | | 15,825,286 |
| | (21,654,460 | ) | | (65,996,459 | ) |
| Cash and cash equivalents, beginning of period | | 19,778,841 |
| | 41,433,301 |
| | 107,429,760 |
|
| Cash and cash equivalents, end of period | | $ | 35,604,127 |
| | $ | 19,778,841 |
| | $ | 41,433,301 |
|
Oaktree Strategic Income Corporation
Consolidated Statements of Cash Flows
|
| | | | | | | | | | | | |
| | | Year ended
September 30, 2017 | | Year ended
September 30, 2016 | | Year ended
September 30, 2015 |
| Supplemental information: | | | | | | |
| Cash paid for interest | | $ | 9,317,020 |
| | $ | 8,590,120 |
| | $ | 4,718,763 |
|
| Non-cash operating activities: | | | | | | |
| Purchase of investment from restructuring | | $ | — |
| | $ | (12,559,122 | ) | | $ | — |
|
| Proceeds from investment restructuring | | $ | — |
| | $ | 12,559,122 |
| | $ | — |
|
| Exchange of investments | | $ | — |
| | $ | 1,325,000 |
| | $ | 58,823,756 |
|
| Non-cash financing activities: | | | | | | |
| Proceeds from unsettled secured borrowings | | $ | — |
| | $ | 5,000,000 |
| | $ | — |
|
| Issuance of shares of common stock under dividend reinvestment plan | | $ | 270,630 |
| | $ | 650,402 |
| | $ | 1,080,605 |
|
See notes to Consolidated Financial Statements.
Oaktree Strategic Income Corporation
Consolidated Schedule of Investments
September 30, 2017
|
| | | | | | | | | | | | | | | | |
| Portfolio Company/Type of Investment (1)(2)(9)(10)(14) | | Cash Interest Rate (8) | | Industry | | Principal (5) |
| | Cost | | Fair Value |
| Control Investments (3) | | | | | | | | | | |
| FSFR Glick JV LLC (7)(12)(15) | | | | Multi-sector holdings | | | | | | |
| Subordinated Note, LIBOR+8% cash due 10/20/2021 (8) | | 9.23% | | | | $ | 64,228,881 |
| | $ | 64,228,881 |
| | $ | 57,606,674 |
|
| 87.5% equity interest | | | | | | | | 7,111,751 |
| | — |
|
| | | | | | | | | 71,340,632 |
| | 57,606,674 |
|
| Total Control Investments (19.6% of net assets) | | | | | | | | $ | 71,340,632 |
| | $ | 57,606,674 |
|
| Affiliate Investments (4) | | | | | | | | | | |
| Ameritox Ltd. | | | | Healthcare services | | | | | | |
| First Lien Term Loan, LIBOR+5% (1% floor) cash 3% PIK due 4/11/2021 (8)(13) | | 6.33% | | | | 8,071,313 |
| | $ | 7,906,087 |
| | $ | 935,913 |
|
| 3,309,873.6 Class A Preferred Units in Ameritox Holdings II, LLC | | | | | | | | 3,309,874 |
| | — |
|
| 327,393.6 Class B Preferred Units in Ameritox Holdings II, LLC | | | | | | | | 327,394 |
| | — |
|
| 1,007.36 Class A Units in Ameritox Holdings II, LLC | | | | | | | | 5,935,698 |
| | — |
|
| | | | | | | | | 17,479,053 |
| | 935,913 |
|
| Total Affiliate Investments (0.3% of net assets) | | | | | | | | $ | 17,479,053 |
| | $ | 935,913 |
|
| | | | | | | | | | | |
| Non-Control/Non-Affiliate Investments (6) | | | | | | | | | | |
| Triple Point Group Holdings, Inc. | | | | Application software | | | | | | |
| First Lien Revolver, LIBOR+4.25% (1% floor) cash due 7/10/2018 (8)(11) | | 5.25% | | | | | | $ | — |
| | $ | (437,932 | ) |
| | | | | | | | | — |
| | (437,932 | ) |
| New Trident Holdcorp, Inc. | | | | Healthcare services | | | | | | |
| First Lien Term Loan B, LIBOR+5.75% (1.25% floor) cash due 7/31/2019 (8)(13)(16) | | 7.08% | | | | 13,552,077 |
| | 13,285,041 |
| | 9,757,495 |
|
| Second Lien Term Loan, LIBOR+9.5% (1.25% floor) cash due 7/31/2020 (8)(16) | | 10.83% | | | | 1,000,000 |
| | 950,590 |
| | 50,000 |
|
| | | | | | | | | 14,235,631 |
| | 9,807,495 |
|
| Survey Sampling International, LLC | | | | Research & consulting services | | | | | | |
| First Lien Term Loan, LIBOR+5% (1% floor) cash due 12/16/2020 (8)(13) | | 6.27% | | | | 5,668,523 |
| | 5,642,223 |
| | 5,583,495 |
|
| Second Lien Term Loan, LIBOR+9% (1% floor) cash due 12/16/2021 (8) | | 10.27% | | | | 1,000,000 |
| | 988,095 |
| | 990,000 |
|
| | | | | | | | | 6,630,318 |
| | 6,573,495 |
|
| Maxor National Pharmacy Services, LLC | | | | Pharmaceuticals | | | | | | |
| First Lien Term Loan, LIBOR+4.75% (1.25% floor) cash due 1/31/2020 (8)(13) | | 6.08% | | | | 9,068,650 |
| | 9,068,650 |
| | 9,038,634 |
|
| | | | | | | | | 9,068,650 |
| | 9,038,634 |
|
| NextCare, Inc. | | | | Healthcare services | | | | | | |
| Senior Term Loan, LIBOR+6% (1% floor) cash due 7/31/2018 (8)(13) | | 7.24% | | | | 6,957,971 |
| | 6,957,970 |
| | 6,667,987 |
|
| Delayed Draw Term Loan, LIBOR+6% (1% floor) cash due 7/31/2018 (8) | | 7.24% | | | | 1,393,853 |
| | 1,393,853 |
| | 1,322,900 |
|
| | | | | | | | | 8,351,823 |
| | 7,990,887 |
|
| Aptean, Inc. | | | | Application software | | | | | | |
| First Lien Term Loan, LIBOR+4.25% (1% floor) cash due 12/20/2022 (8)(13) | | 5.59% | | | | 11,243,500 |
| | 11,170,440 |
| | 11,323,161 |
|
| Second Lien Term Loan, LIBOR+9.5% (1% floor) cash due 12/20/2023 (8) | | 10.84% | | | | 200,000 |
| | 197,320 |
| | 201,750 |
|
| | | | | | | | | 11,367,760 |
| | 11,524,911 |
|
| Stratus Technologies, Inc. | | | | Computer hardware | | | | | | |
| First Lien Term Loan, LIBOR+5% (1% floor) cash due 4/28/2021 (8)(13) | | 6.24% | | | | 1,315,119 |
| | 1,279,988 |
| | 1,324,983 |
|
| | | | | | | | | 1,279,988 |
| | 1,324,983 |
|
See notes to Consolidated Financial Statements.
Fifth Street Senior Floating Rate Corp.Oaktree Strategic Income Corporation
Consolidated Schedule of Investments
September 30, 20162017
|
| | | | | | | | | | | | | | | | |
| Portfolio Company/Type of Investment (1)(2)(9)(10)(14) | | Cash Interest Rate (8) | | Industry | | Principal (5) |
| | Cost | | Fair Value |
| TravelCLICK, Inc. | | | | Internet software & services | | | | | | |
| Second Lien Term Loan, LIBOR+7.75% (1% floor) cash due 11/6/2021 (8)(13) | | 8.99% | | | | $ | 2,048,485 |
| | $ | 2,010,607 |
| | $ | 2,058,727 |
|
| | | | | | | | | 2,010,607 |
| | 2,058,727 |
|
| Verdesian Life Sciences, LLC | | | | Fertilizers & agricultural chemicals | | | | | | |
| First Lien Term Loan, LIBOR+5% (1% floor) cash due 7/1/2020 (8)(13) | | 6.31% | | | | 3,295,860 |
| | 3,273,753 |
| | 2,801,481 |
|
| | | | | | | | | 3,273,753 |
| | 2,801,481 |
|
| TV Borrower US, LLC (7) | | | | Integrated telecommunication services | | | | | | |
| First Lien Dollar Term B-1 Loan, LIBOR+4.75% (1% floor) cash due 2/22/2024 (8) | | 6.08% | | | | 3,383,000 |
| | 3,367,510 |
| | 3,406,258 |
|
| | | | | | | | | 3,367,510 |
| | 3,406,258 |
|
| BeyondTrust Software, Inc. | | | | Application software | | | | | | |
| First Lien Term Loan, LIBOR+7% (1% floor) cash due 9/25/2019 (8)(13) | | 8.33% | | | | 16,384,644 |
| | 16,255,828 |
| | 16,384,050 |
|
| First Lien Revolver, LIBOR+7% (1% floor) cash due 9/25/2019 (8)(11) | | 8.33% | | | | | | (21,305 | ) | | (130 | ) |
| 500,000 Class A membership interests in BeyondTrust Holdings LLC | | | | | | | | 500,000 |
| | 628,846 |
|
| | | | | | | | | 16,734,523 |
| | 17,012,766 |
|
| Dynatect Group Holdings, Inc. | | | | Industrial machinery | | | | | | |
| First Lien Term Loan, LIBOR+4.5% (1% floor) cash due 9/30/2020 (8) | | 5.83% | | | | 3,786,203 |
| | 3,786,203 |
| | 3,672,617 |
|
| | | | | | | | | 3,786,203 |
| | 3,672,617 |
|
| Idera, Inc. | | | | Internet software & services | | | | | | |
| First Lien Term Loan B, LIBOR+5% (1% floor) cash due 6/27/2024 (8) | | 6.24% | | | | 3,457,698 |
| | 3,424,359 |
| | 3,483,630 |
|
| | | | | | | | | 3,424,359 |
| | 3,483,630 |
|
| Central Security Group, Inc. | | | | Specialized consumer services | | | | | | |
| First Lien Term Loan, LIBOR+5.625% (1% floor) cash due 10/6/2021 (8) | | 6.86% | | | | 1,665,740 |
| | 1,660,679 |
| | 1,672,677 |
|
| | | | | | | | | 1,660,679 |
| | 1,672,677 |
|
| Kellermeyer Bergensons Services, LLC | | | | Diversified support services | | | | | | |
| First Lien Term Loan, LIBOR+5% (1% floor) cash due 10/29/2021 (8)(13) | | 6.32% | | | | 5,251,500 |
| | 5,208,454 |
| | 5,248,218 |
|
| Second Lien Term Loan, LIBOR+8.5% (1% floor) cash due 4/29/2022 (8)(13) | | 9.81% | | | | 280,000 |
| | 280,000 |
| | 274,400 |
|
| | | | | | | | | 5,488,454 |
| | 5,522,618 |
|
| GOBP Holdings Inc. | | | | Food retail | | | | | | |
| Second Lien Term Loan, LIBOR+8.25% (1% floor) cash due 10/21/2022 (8)(13) | | 9.58% | | | | 3,685,714 |
| | 3,644,031 |
| | 3,717,983 |
|
| | | | | | | | | 3,644,031 |
| | 3,717,983 |
|
| Executive Consulting Group, LLC | | | | Healthcare services | | | | | | |
| First Lien Term Loan, LIBOR+4.75% (1% floor) cash due 11/21/2019 (8)(13) | | 5.99% | | | | 7,000,000 |
| | 7,000,000 |
| | 6,999,745 |
|
| Delayed Draw Term Loan, LIBOR+4.75% (1% floor) cash due 11/21/2019 (8) | | 5.99% | | | | 3,791,650 |
| | 3,791,650 |
| | 3,791,657 |
|
| | | | | | | | | 10,791,650 |
| | 10,791,402 |
|
| Metamorph US 3, LLC | | | | Internet software & services | | | | | | |
| First Lien Term Loan, LIBOR+5.5% (1% floor) cash 2% PIK due 12/1/2020 (8)(13) | | 6.74% | | | | 14,070,138 |
| | 13,488,111 |
| | 5,343,093 |
|
| First Lien Revolver, LIBOR+6.5% (1% floor) cash due 12/1/2020 (8)(11)(13) | | 7.74% | | | | 1,080,000 |
| | 1,037,075 |
| | (36,455 | ) |
| | | | | | | | | 14,525,186 |
| | 5,306,638 |
|
See notes to Consolidated Financial Statements.
Oaktree Strategic Income Corporation
Consolidated Schedule of Investments
September 30, 2017
|
| | | | | | | | | | | | | | |
| Portfolio Company/Type of Investment (1)(2)(10)(17) | | Industry | | Principal (5) |
| | Cost | | Fair Value |
| Answers Corporation | | Internet software & services | | | | | | |
| First Lien Term Loan, LIBOR+5.25% (1% floor) cash due 10/3/2021 (8)(13) | | | | $ | 11,820,000 |
| | $ | 11,421,760 |
| | $ | 6,382,800 |
|
| Second Lien Term Loan, LIBOR+9% (1% floor) cash due 10/3/2022 (8) | | | | 8,000,000 |
| | 7,605,257 |
| | 773,360 |
|
| | | | | | | 19,027,017 |
| | 7,156,160 |
|
| Maxor National Pharmacy Services, LLC | | Pharmaceuticals | | | | | | |
| First Lien Term Loan, LIBOR+5.25% (1.25% floor) cash due 1/31/2020 (8)(13) | | | | 9,162,870 |
| | 9,162,870 |
| | 9,033,850 |
|
| | | | | | | 9,162,870 |
| | 9,033,850 |
|
| NextCare, Inc. (9) | | Healthcare services | | | | | | |
| Senior Term Loan, LIBOR+6% (1% floor) cash due 7/31/2018 (8)(13) | | | | 7,029,160 |
| | 7,029,160 |
| | 6,744,944 |
|
| Delayed Draw Term Loan, LIBOR+6% (1% floor) cash due 7/31/2018 (8) | | | | 1,407,969 |
| | 1,407,969 |
| | 1,330,269 |
|
| | | | | | | 8,437,129 |
| | 8,075,213 |
|
| Aptean, Inc. | | Application software | | | | | | |
| Second Lien Term Loan, LIBOR+7.5% (1% floor) cash due 2/26/2021 (8) | | | | 1,250,000 |
| | 1,240,179 |
| | 1,232,038 |
|
| | | | | | | 1,240,179 |
| | 1,232,038 |
|
| Stratus Technologies, Inc. | | Computer hardware | | | | | | |
| First Lien Term Loan, LIBOR+5% (1% floor) cash due 4/28/2021 (8)(13) | | | | 4,003,658 |
| | 3,956,802 |
| | 3,903,567 |
|
| | | | | | | 3,956,802 |
| | 3,903,567 |
|
| TravelCLICK, Inc. | | Internet software & services | | | | | | |
| Second Lien Term Loan, LIBOR+7.75% (1% floor) cash due 11/6/2021 (8)(13) | | | | 3,380,000 |
| | 3,299,165 |
| | 3,027,128 |
|
| | | | | | | 3,299,165 |
| | 3,027,128 |
|
| GTCR Valor Companies, Inc. | | Advertising | | | | | | |
| First Lien Term Loan, LIBOR+6% (1% floor) cash due 6/16/2023 (8)(13) | | | | 12,219,375 |
| | 11,607,301 |
| | 11,688,626 |
|
| | | | | | | 11,607,301 |
| | 11,688,626 |
|
| ConvergeOne Holdings Corp. | | Integrated telecommunication services | | | | | | |
| First Lien Term Loan, LIBOR+5% (1% floor) cash due 6/17/2020 (8)(13) | | | | 5,343,010 |
| | 5,316,746 |
| | 5,322,974 |
|
| | | | | | | 5,316,746 |
| | 5,322,974 |
|
| Verdesian Life Sciences, LLC | | Fertilizers & agricultural chemicals | | | | | | |
| First Lien Term Loan, LIBOR+5% (1% floor) cash due 7/1/2020 (8)(13) | | | | 3,554,890 |
| | 3,522,668 |
| | 3,377,146 |
|
| | | | | | | 3,522,668 |
| | 3,377,146 |
|
|
| | | | | | | | | | | | | | | | |
| Portfolio Company/Type of Investment (1)(2)(9)(10)(14) | | Cash Interest Rate (8) | | Industry | | Principal (5) |
| | Cost | | Fair Value |
| Compuware Corporation | | | | Internet software & services | | | | | | |
| First Lien Term Loan B3, LIBOR+4.25% (1% floor) cash due 12/15/2021 (8)(13) | | 5.49% | | | | $ | 8,423,623 |
| | $ | 8,345,374 |
| | $ | 8,528,918 |
|
| | | | | | | | | 8,345,374 |
| | 8,528,918 |
|
| Motion Recruitment Partners LLC | | | | Diversified support services | | | | | | |
| First Lien Term Loan, LIBOR+6% (1% floor) cash due 2/13/2020 (8)(13) | | 7.24% | | | | 13,509,054 |
| | 13,498,295 |
| | 13,508,389 |
|
| First Lien Revolver, LIBOR+6% (1% floor) cash due 2/13/2020 (8)(11) | | 7.24% | | | | — |
| | (960 | ) | | (143 | ) |
| | | | | | | | | 13,497,335 |
| | 13,508,246 |
|
| PowerPlan, Inc. | | | | Internet software & services | | | | | | |
| First Lien Term Loan, LIBOR+5.25% (1% floor) cash due 2/23/2022 (8)(13) | | 6.49% | | | | 17,839,352 |
| | 17,800,018 |
| | 17,839,013 |
|
| First Lien Revolver, LIBOR+5.25% (1% floor) cash due 2/23/2021 (8)(11) | | 6.49% | | | | | | — |
| | (40 | ) |
| | | | | | | | | 17,800,018 |
| | 17,838,973 |
|
| Digital River, Inc. | | | | Internet software & services | | | | | | |
| First Lien Term Loan, LIBOR+6.5% (1% floor) cash due 2/12/2021 (8)(13) | | 7.82% | | | | 4,723,868 |
| | 4,681,840 |
| | 4,747,488 |
|
| | | | | | | | | 4,681,840 |
| | 4,747,488 |
|
| Research Now Group, Inc. | | | | Data processing & outsourced services | | | | | | |
| Second Lien Term Loan, LIBOR+8.75% (1% floor) cash due 3/18/2022 (8) | | 10.08% | | | | 4,000,000 |
| | 3,962,143 |
| | 3,960,000 |
|
| | | | | | | | | 3,962,143 |
| | 3,960,000 |
|
| Staples, Inc. | | | | Distributors | | | | | | |
| First Lien Term Loan, LIBOR+4% (1% floor) cash due 9/12/2024 (8)(16) | | 5.31% | | | | 13,000,000 |
| | 12,967,500 |
| | 12,957,035 |
|
| | | | | | | | | 12,967,500 |
| | 12,957,035 |
|
| Raley's | | | | Food retail | | | | | | |
| First Lien Term Loan, LIBOR+5.25% (1% floor) cash due 5/18/2022 (8)(13) | | 6.49% | | | | 3,209,821 |
| | 3,164,432 |
| | 3,209,821 |
|
| | | | | | | | | 3,164,432 |
| | 3,209,821 |
|
| Aptos, Inc. | | | | Data processing & outsourced services | | | | | | |
| First Lien Term Loan, LIBOR+6.75% (1% floor) cash due 9/1/2022 (8)(13) | | 8.08% | | | | 5,940,000 |
| | 5,842,031 |
| | 5,880,600 |
|
| | | | | | | | | 5,842,031 |
| | 5,880,600 |
|
| Zep Inc. | | | | Housewares & specialties | | | | | | |
| First Lien Term Loan, LIBOR+4% (1% floor) cash due 8/12/2024 (8) | | 5.24% | | | | 4,750,000 |
| | 4,795,075 |
| | 4,771,779 |
|
| | | | | | | | | 4,795,075 |
| | 4,771,779 |
|
| All Web Leads, Inc. | | | | Advertising | | | | | | |
| First Lien Term Loan, LIBOR+7.5% (1% floor) cash due 12/29/2020 (8)(13) | | 8.77% | | | | 25,839,538 |
| | 25,839,538 |
| | 23,192,266 |
|
| | | | | | | | | 25,839,538 |
| | 23,192,266 |
|
| Allied Universal Holdco, LLC (f/k/a USAGM Holdco, LLC) | | | | Security & alarm services | | | | | | |
| First Lien Term Loan, LIBOR+3.75% (1% floor) cash due 7/28/2022 (8)(16) | | 5.08% | | | | 7,979,747 |
| | 8,018,318 |
| | 7,972,286 |
|
| | | | | | | | | 8,018,318 |
| | 7,972,286 |
|
| Internet Pipeline, Inc. | | | | Internet software & services | | | | | | |
| First Lien Term Loan, LIBOR+7.25% (1% floor) cash due 8/4/2022 (8)(13) | | 8.49% | | | | 13,081,433 |
| | 13,068,115 |
| | 13,212,714 |
|
| First Lien Revolver, LIBOR+7.25% (1% floor) cash due 8/4/2021 (8) | | 8.49% | | | | | | — |
| | 8,029 |
|
| | | | | | | | | 13,068,115 |
| | 13,220,743 |
|
See notes to Consolidated Financial Statements.
Fifth Street Senior Floating Rate Corp.Oaktree Strategic Income Corporation
Consolidated Schedule of Investments
September 30, 2016
|
| | | | | | | | | | | | | | |
| Portfolio Company/Type of Investment (1)(2)(10)(17) | | Industry | | Principal (5) |
| | Cost | | Fair Value |
| PR Wireless, Inc. | | Wireless telecommunication services | | | | | | |
| First Lien Term Loan, LIBOR+9% (1% floor) cash due 6/29/2020 (7)(8) | | | | $ | 5,836,771 |
| | $ | 5,719,729 |
| | $ | 4,111,317 |
|
| 35.5263 Common Stock Warrants (exercise price $0.01) expiration date 6/27/2024 (7) | | | | | | — |
| | 120,342 |
|
| | | | | | | 5,719,729 |
| | 4,231,659 |
|
| TV Borrower US, LLC | | Integrated telecommunication services | | | | | | |
| First Lien Term Loan, LIBOR+5% (1% floor) cash due 1/8/2021 (7)(8)(13) | | | | 6,086,385 |
| | 5,973,885 |
| | 6,063,561 |
|
| Second Lien Term Loan, LIBOR+8.5% (1% floor) cash due 7/8/2021 (7)(8)(13) | | | | 3,000,000 |
| | 2,921,780 |
| | 2,910,000 |
|
| | | | | | | 8,895,665 |
| | 8,973,561 |
|
| American Dental Partners, Inc. | | Healthcare services | | | | | | |
| First Lien Term Loan, LIBOR+4.75% (1% floor) cash due 8/30/2021 (8)(13) | | | | 5,880,000 |
| | 5,860,000 |
| | 5,791,800 |
|
| | | | | | | 5,860,000 |
| | 5,791,800 |
|
| BeyondTrust Software, Inc. | | Application software | | | | | | |
| First Lien Term Loan, LIBOR+7% (1% floor) cash due 9/25/2019 (8)(13) | | | | 18,381,895 |
| | 18,136,331 |
| | 18,309,259 |
|
| First Lien Revolver, LIBOR+7% (1% floor) cash due 9/25/2019 (8)(11) | | | | | | (30,304 | ) | | — |
|
| 500,000 Class A membership interests in BeyondTrust Holdings LLC | | | | | | 500,000 |
| | 613,869 |
|
| | | | | | | 18,606,027 |
| | 18,923,128 |
|
| Hill International, Inc. | | Construction & engineering | | | | | | |
| First Lien Term Loan, LIBOR+6.75% (1% floor) cash due 9/26/2020 (8)(13) | | | | 5,978,000 |
| | 5,907,850 |
| | 5,768,770 |
|
| | | | | | | 5,907,850 |
| | 5,768,770 |
|
| Teaching Strategies, LLC | | Education services | | | | | | |
| First Lien Term Loan, LIBOR+5.5% (0.5% floor) cash due 10/1/2019 (8)(13) | | | | 15,252,341 |
| | 15,262,322 |
| | 15,293,164 |
|
| First Lien Revolver, LIBOR+5.5% (0.5% floor) cash due 10/1/2019 (8) | | | | | | — |
| | — |
|
| | | | | | | 15,262,322 |
| | 15,293,164 |
|
| Dynatect Group Holdings, Inc. | | Industrial machinery | | | | | | |
| First Lien Term Loan, LIBOR+4.5% (1% floor) cash due 9/30/2020 (8) | | | | 3,826,203 |
| | 3,826,203 |
| | 3,778,376 |
|
| First Lien Delayed Draw Term Loan, LIBOR+4.5% (1% floor) cash due 9/30/2020 (8) | | | | | | — |
| | — |
|
| | | | | | | 3,826,203 |
| | 3,778,376 |
|
| Idera, Inc. | | Internet software & services | | | | | | |
| First Lien Term Loan, LIBOR+5.5% (1% floor) cash due 4/9/2021 (8)(13) | | | | 17,356,053 |
| | 16,490,668 |
| | 16,878,761 |
|
| | | | | | | 16,490,668 |
| | 16,878,761 |
|
| Central Security Group, Inc. (9) | | Specialized consumer services | | | | | | |
| First Lien Term Loan, LIBOR+5.25% (1% floor) cash due 10/6/2020 (8) | | | | 2,539,726 |
| | 2,532,917 |
| | 2,482,582 |
|
| | | | | | | 2,532,917 |
| | 2,482,582 |
|
See notes to Consolidated Financial Statements.Fifth Street Senior Floating Rate Corp.
Consolidated Schedule of Investments
September 30, 2016
|
| | | | | | | | | | | | | | |
| Portfolio Company/Type of Investment (1)(2)(10)(17) | | Industry | | Principal (5) |
| | Cost | | Fair Value |
| Kellermeyer Bergensons Services, LLC | | Diversified support services | | | | | | |
| First Lien Term Loan, LIBOR+5% (1% floor) cash due 10/29/2021 (8)(13) | | | | $ | 5,265,325 |
| | $ | 5,211,587 |
| | $ | 5,081,038 |
|
| Second Lien Term Loan, LIBOR+8.5% (1% floor) cash due 4/29/2022 (8)(13) | | | | 280,000 |
| | 280,000 |
| | 266,000 |
|
| | | | | | | 5,491,587 |
| | 5,347,038 |
|
| GOBP Holdings Inc. | | Food retail | | | | | | |
| Second Lien Term Loan, LIBOR+8.25% (1% floor) cash due 10/21/2022 (8)(13) | | | | 3,685,714 |
| | 3,635,831 |
| | 3,685,714 |
|
| | | | | | | 3,635,831 |
| | 3,685,714 |
|
| NAVEX Global, Inc. | | Internet software & services | | | | | | |
| First Lien Term Loan, LIBOR+4.75% (1% floor) cash due 11/19/2021 (8)(13) | | | | 3,450,918 |
| | 3,440,820 |
| | 3,433,662 |
|
| Second Lien Term Loan, LIBOR+8.75% (1% floor) cash due 11/18/2022 (8) | | | | 1,438,468 |
| | 1,438,468 |
| | 1,395,314 |
|
| | | | | | | 4,879,288 |
| | 4,828,976 |
|
| Executive Consulting Group, LLC | | Healthcare services | | | | | | |
| First Lien Term Loan, LIBOR+4.75% (1% floor) cash due 11/21/2019 (8)(13) | | | | 7,000,000 |
| | 7,000,000 |
| | 6,960,668 |
|
| Delayed Draw Term Loan, LIBOR+4.75% (1% floor) cash due 11/21/2019 (8) | | | | 4,000,000 |
| | 4,000,000 |
| | 3,979,448 |
|
| | | | | | | 11,000,000 |
| | 10,940,116 |
|
| TIBCO Software, Inc. | | Internet software & services | | | | | | |
| First Lien Term Loan, LIBOR+5.5% (1% floor) cash due 12/4/2020 (8) | | | | 7,919,400 |
| | 7,590,582 |
| | 7,823,932 |
|
| First Lien Revolver, LIBOR+4% cash due 11/25/2020 (8) | | | | | | — |
| | — |
|
| | | | | | | 7,590,582 |
| | 7,823,932 |
|
| Metamorph US 3, LLC (9) | | Internet software & services | | | | | | |
| First Lien Term Loan, LIBOR+5.5% (1% floor) cash due 12/1/2020 (8)(13) | | | | 14,223,467 |
| | 14,181,149 |
| | 11,840,322 |
|
| First Lien Revolver, LIBOR+5.5% (1% floor) cash due 12/1/2020 (8)(13) | | | | 600,000 |
| | 573,856 |
| | 600,000 |
|
| | | | | | | 14,755,005 |
| | 12,440,322 |
|
| Compuware Corporation | | Internet software & services | | | | | | |
| First Lien Term Loan B1, LIBOR+5.25% (1% floor) cash due 12/15/2019 (8)(13) | | | | 7,825,554 |
| | 7,720,514 |
| | 7,854,900 |
|
| First Lien Term Loan B2, LIBOR+5.25% (1% floor) cash due 12/15/2021 (8) | | | | 905,896 |
| | 889,191 |
| | 904,198 |
|
| | | | | | | 8,609,705 |
| | 8,759,098 |
|
| AF Borrower, LLC | | IT consulting & other services | | | | | | |
| First Lien Term Loan, LIBOR+5.25% (1% floor) cash due 1/28/2022 (8)(13) | | | | 1,036,642 |
| | 1,020,406 |
| | 1,041,612 |
|
| | | | | | | 1,020,406 |
| | 1,041,612 |
|
| TrialCard Incorporated (9) | | Healthcare services | | | | | | |
| First Lien Term Loan, LIBOR+5.25% (1% floor) cash due 12/31/2019 (8)(13) | | | | 9,874,962 |
| | 9,869,718 |
| | 9,827,027 |
|
| First Lien Revolver, LIBOR+5.25% (1% floor) cash due 12/31/2019 (8)(11) | | | | | | (375 | ) | | — |
|
| | | | | | | 9,869,343 |
| | 9,827,027 |
|
| Motion Recruitment Partners LLC | | Diversified support services | | | | | | |
| First Lien Term Loan, LIBOR+6% (1% floor) cash due 2/13/2020 (8)(13) | | | | 14,235,000 |
| | 14,224,241 |
| | 14,250,584 |
|
| First Lien Revolver, LIBOR+6% (1% floor) cash due 2/13/2020 (8)(11) | | | | — |
| | (960 | ) | | — |
|
| | | | | | | 14,223,281 |
| | 14,250,584 |
|
See notes to Consolidated Financial Statements.Fifth Street Senior Floating Rate Corp.
Consolidated Schedule of Investments
September 30, 20162017
|
| | | | | | | | | | | | | | |
| Portfolio Company/Type of Investment (1)(2)(10)(17) | | Industry | | Principal (5) |
| | Cost | | Fair Value |
| PowerPlan, Inc. (9) | | Internet software & services | | | | | | |
| First Lien Term Loan, LIBOR+5.25% (1% floor) cash due 2/23/2022 (8)(13) | | | | $ | 16,737,833 |
| | $ | 16,710,709 |
| | $ | 16,731,213 |
|
| First Lien Revolver, LIBOR+5.25% (1% floor) cash due 2/23/2021 (8) | | | | | | — |
| | — |
|
| | | | | | | 16,710,709 |
| | 16,731,213 |
|
| Digital River, Inc. | | Internet software & services | | | | | | |
| First Lien Term Loan, LIBOR+6.5% (1% floor) cash due 2/12/2021 (8)(13) | | | | 4,523,868 |
| | 4,349,859 |
| | 4,515,386 |
|
| | | | | | | 4,349,859 |
| | 4,515,386 |
|
| Research Now Group, Inc. | | Data processing & outsourced services | | | | | | |
| Second Lien Term Loan, LIBOR+8.75% (1% floor) cash due 3/18/2022 (8) | | | | 4,000,000 |
| | 3,953,571 |
| | 3,880,000 |
|
| | | | | | | 3,953,571 |
| | 3,880,000 |
|
| Fineline Technologies, Inc. | | Electronic equipment & instruments | | | | | | |
| First Lien Term Loan, LIBOR+5.5% (1% floor) cash due 5/5/2017 (8)(13) | | | | 10,942,464 |
| | 10,942,464 |
| | 10,912,302 |
|
| | | | | | | 10,942,464 |
| | 10,912,302 |
|
| My Alarm Center, LLC | | Security & alarm services | | | | | | |
| First Lien Term Loan A, LIBOR+8% (1% floor) cash due 1/9/2019 (8)(13) | | | | 16,047,619 |
| | 16,047,619 |
| | 16,075,921 |
|
| First Lien Term Loan B, LIBOR+8% (1% floor) cash due 1/9/2019 (8) | | | | 909,936 |
| | 909,936 |
| | 911,452 |
|
| First Lien Term Loan C, LIBOR+8% (1% floor) cash due 1/9/2019 (8) | | | | 757,592 |
| | 757,592 |
| | 757,750 |
|
| First Lien Term Revolver, LIBOR+8% (1% floor) cash due 1/9/2019 (8) | | | | 120,000 |
| | 120,000 |
| | 120,000 |
|
| | | | | | | 17,835,147 |
| | 17,865,123 |
|
| Legalzoom.com, Inc. | | Specialized consumer services | | | | | | |
| First Lien Term Loan, LIBOR+7% (1% floor) cash due 5/13/2020 (8)(13) | | | | 19,700,000 |
| | 19,690,068 |
| | 19,659,526 |
|
| First Lien Revolver, LIBOR+7% (1% floor) cash due 5/13/2020 (8)(11) | | | | — |
| | (17,714 | ) | | — |
|
| First Lien Delayed Draw Term Loan, LIBOR+7% (1% floor) cash due 5/13/2020 (8) | | | | 400,000 |
| | 400,000 |
| | 396,683 |
|
| | | | | | | 20,072,354 |
| | 20,056,209 |
|
| Raley's | | Food retail | | | | | | |
| First Lien Term Loan, LIBOR+6.25% (1% floor) cash due 5/18/2022 (8)(13) | | | | 3,319,504 |
| | 3,254,099 |
| | 3,325,728 |
|
| | | | | | | 3,254,099 |
| | 3,325,728 |
|
| Aptos, Inc. | | Data processing & outsourced services | | | | | | |
| First Lien Term Loan, LIBOR+6.75% (1% floor) cash due 9/1/2022 (8)(13) | | | | 6,000,000 |
| | 5,881,667 |
| | 5,940,000 |
|
| | | | | | | 5,881,667 |
| | 5,940,000 |
|
| All Web Leads, Inc. | | Advertising | | | | | | |
| First Lien Term Loan, LIBOR+6.5% (1% floor) cash due 6/30/2020 (8)(13) | | | | 29,808,067 |
| | 29,808,066 |
| | 29,983,454 |
|
| First Lien Revolver, LIBOR+6.5% (1% floor) cash due 6/30/2020 (8) | | | | | | — |
| | — |
|
| | | | | | | 29,808,066 |
| | 29,983,454 |
|
| Too Faced Cosmetics, LLC | | Personal products | | | | | | |
| First Lien Term Loan, LIBOR+5% (1% floor) cash due 7/7/2021 (8)(13) | | | | 1,285,383 |
| | 1,285,383 |
| | 1,290,310 |
|
| | | | | | | 1,285,383 |
| | 1,290,310 |
|
| Internet Pipeline, Inc. | | Internet software & services | | | | | | |
| First Lien Term Loan, LIBOR+7.25% (1% floor) cash due 8/4/2022 (8)(13) | | | | 11,880,000 |
| | 11,880,000 |
| | 12,045,801 |
|
| First Lien Revolver, LIBOR+7.25% (1% floor) cash due 8/4/2021 (8) | | | | | | — |
| | — |
|
| | | | | | | 11,880,000 |
| | 12,045,801 |
|
| Poseidon Merger Sub, Inc. | | Advertising | | | | | | |
| Second Lien Term Loan, LIBOR+8.5% (1% floor) cash due 8/15/2023 (8) | | | | 7,000,000 |
| | 6,980,768 |
| | 7,012,868 |
|
| | | | | | | 6,980,768 |
| | 7,012,868 |
|
See notes to Consolidated Financial Statements.
Fifth Street Senior Floating Rate Corp.
Consolidated Schedule of Investments
September 30, 2016
|
| | | | | | | | | | | | | | |
| Portfolio Company/Type of Investment (1)(2)(10)(17) | | Industry | | Principal (5) |
| | Cost | | Fair Value |
| American Seafoods Group LLC | | Food distributors | | | | | | |
| First Lien Term Loan, LIBOR+5% (1% floor) cash due 8/19/2021 (8)(13) | | | | $ | 2,780,556 |
| | $ | 2,736,111 |
| | $ | 2,773,604 |
|
| Second Lien Term Loan, LIBOR+9% (1% floor) cash due 2/19/2022 (8) | | | | 3,000,000 |
| | 2,975,385 |
| | 2,850,000 |
|
| | | | | | | 5,711,496 |
| | 5,623,604 |
|
| CRGT Inc. | | IT consulting & other services | | | | | | |
| First Lien Term Loan, LIBOR+6.5% (1% floor) cash due 12/19/2020 (8)(13) | | | | 3,440,713 |
| | 3,433,096 |
| | 3,449,315 |
|
| | | | | | | 3,433,096 |
| | 3,449,315 |
|
| Valet Merger Sub, Inc. | | Environmental & facilities services | | | | | | |
| First Lien Term Loan, LIBOR+7% (1% floor) cash due 9/24/2021 (8)(13) | | | | 5,940,000 |
| | 5,905,025 |
| | 6,040,239 |
|
| First Lien Revolver, LIBOR+7% (1% floor) cash due 9/24/2021 (8) | | | | 500,000 |
| | 486,811 |
| | 500,000 |
|
| | | | | | | 6,391,836 |
| | 6,540,239 |
|
| Baart Programs, Inc. | | Healthcare services | | | | | | |
| First Lien Term Loan, LIBOR+7.75% cash due 10/9/2021 (8)(13) | | | | 7,661,077 |
| | 7,377,745 |
| | 7,647,291 |
|
| First Lien Revolver, LIBOR+7.75% cash due 10/9/2021 (8)(11) | | | | | | (12,500 | ) | | — |
|
| | | | | | | 7,365,245 |
| | 7,647,291 |
|
| DigiCert, Inc. | | Internet software & services | | | | | | |
| Second Lien Term Loan, LIBOR+9% (1% floor) cash due 10/21/2022 (8) | | | | 2,000,000 |
| | 1,982,857 |
| | 2,032,529 |
|
| | | | | | | 1,982,857 |
| | 2,032,529 |
|
| Lytx, Inc. | | Research & consulting services | | | | | | |
| First Lien Term Loan, LIBOR+8.5% (1% floor) cash due 3/15/2023 (8) | | | | 9,951,389 |
| | 9,951,389 |
| | 9,951,389 |
|
| 500 Class A Units in Lytx Holdings, LLC | | | |
| | 500,000 |
| | 504,173 |
|
| | | | | | | 10,451,389 |
| | 10,455,562 |
|
| Onvoy, LLC | | Integrated telecommunication services | | | | | | |
| First Lien Term Loan, LIBOR+6.25% (1% floor) cash due 4/29/2021 (8)(13) | | | | 10,368,750 |
| | 10,173,233 |
| | 10,341,433 |
|
| | | | | | | 10,173,233 |
| | 10,341,433 |
|
| 4 Over International, LLC | | Commercial printing | | | | | | |
| First Lien Term Loan, LIBOR+6.0% (1% floor) cash due 6/7/2022 (8)(13) | | | | 5,970,000 |
| | 5,913,333 |
| | 5,929,733 |
|
| First Lien Revolver LIBOR+6.0% (1% floor) cash due 6/7/2021 (8)(11) | | | | — |
| | (639 | ) | | — |
|
| | | | | | | 5,912,694 |
| | 5,929,733 |
|
| OBHG Management Services, LLC | | Healthcare services | | | | | | |
| First Lien Term Loan, LIBOR+5.25% (1% floor) cash due 6/28/2022 (8)(13) | | | | 16,123,227 |
| | 16,117,309 |
| | 16,076,397 |
|
| First Lien Revolver, LIBOR+5.25% (1% floor) cash due 6/28/2021 (8)(11) | | | | — |
| | (39 | ) | | — |
|
| | | | | | | 16,117,270 |
| | 16,076,397 |
|
| Ancile Solutions, Inc. | | Internet software & services | | | | | | |
| First Lien Term Loan, LIBOR+7% (1% floor) cash due 6/30/2021 (8)(13) | | | | 11,000,000 |
| | 10,692,000 |
| | 10,835,000 |
|
| | | | | | | 10,692,000 |
| | 10,835,000 |
|
| Pomeroy Group Holdings, Inc. | | IT consulting & other services | | | | | | |
| First Lien Term Loan, LIBOR+6% (1% floor) cash due 11/30/2021 (8)(13) | | | | 4,488,693 |
| | 4,357,979 |
| | 4,393,309 |
|
| | | | | | | 4,357,979 |
| | 4,393,309 |
|
| Sailpoint Technologies, Inc. | | Application software | | | | | | |
| First Lien Term Loan, LIBOR+8% (1% floor) cash due 8/16/2021 (8) | | | | 12,500,000 |
| | 12,258,333 |
| | 12,250,000 |
|
| First Lien Revolver, LIBOR+8% (1% floor) cash due 8/16/2021 (8)(11) | | | | — |
| | (3,867 | ) | | — |
|
| | | | | | | 12,254,466 |
| | 12,250,000 |
|
| California Pizza Kitchen, Inc. (16) | | Restaurants | | | | | | |
| First Lien Term Loan, LIBOR+6% (1% floor) cash due 8/23/2022 (8) | | | | 5,000,000 |
| | 5,000,000 |
| | 4,985,425 |
|
| | | | | | | 5,000,000 |
| | 4,985,425 |
|
| Total Non-Control/Non-Affiliate Investments (152.6% of net assets) | | | | | | $ | 513,397,659 |
| | $ | 497,281,256 |
|
| Total Portfolio Investments (176.0% of net assets) | | | | | | $ | 600,468,963 |
| | $ | 573,604,381 |
|
See notes to Consolidated Financial Statements.
Fifth Street Senior Floating Rate Corp.
Consolidated Schedule of Investments
September 30, 2016
|
| | | | | | | | | | | | |
| Cash and Cash Equivalents | | | | | | | | |
Wells Fargo Bank Institutional Money Market Fund
| | | | | | $ | 18,856,559 |
| | $ | 18,856,559 |
|
| Other cash accounts | | | | | | 922,282 |
| | 922,282 |
|
| Total Cash and Cash Equivalents (6.1% of net assets) | | | | | | $ | 19,778,841 |
| | $ | 19,778,841 |
|
| Total Portfolio Investments, Cash and Cash Equivalents (182.1% of net assets) | | | | | | $ | 620,247,804 |
| | $ | 593,383,222 |
|
|
| | | | | | | | | | | | | | | | |
| Portfolio Company/Type of Investment (1)(2)(9)(10)(14) | | Cash Interest Rate (8) | | Industry | | Principal (5) |
| | Cost | | Fair Value |
| Poseidon Merger Sub, Inc. | | | | Advertising | | | | | | |
| Second Lien Term Loan, LIBOR+8.5% (1% floor) cash due 8/15/2023 (8) | | 9.81% | | | | $ | 7,000,000 |
| | $ | 6,980,121 |
| | $ | 7,070,000 |
|
| | | | | | | | | 6,980,121 |
| | 7,070,000 |
|
| Valet Merger Sub, Inc. | | | | Environmental & facilities services | | | | | | |
| First Lien Term Loan, LIBOR+7% (1% floor) cash due 9/24/2021 (8)(13) | | 8.24% | | | | 5,880,000 |
| | 5,852,065 |
| | 5,879,798 |
|
| First Lien Revolver, LIBOR+7% (1% floor) cash due 9/24/2021 (8)(11) | | 8.24% | | | | — |
| | (10,697 | ) | | (29 | ) |
| Incremental Term Loan , LIBOR+7% (1% floor) cash due 9/24/2021 (8) | | 8.24% | | | | 8,407,683 |
| | 8,328,663 |
| | 8,407,394 |
|
| | | | | | | | | 14,170,031 |
| | 14,287,163 |
|
| DigiCert, Inc. | | | | Internet software & services | | | | | | |
| Second Lien Term Loan, LIBOR+9% (1% floor) cash due 10/21/2022 (8)(13) | | 10.24% | | | | 2,000,000 |
| | 1,984,880 |
| | 2,000,000 |
|
| First Lien Term Loan, LIBOR+4.75% (1% floor) cash due 10/21/2021 (8) | | 5.99% | | | | 11,000,000 |
| | 10,945,000 |
| | 11,000,000 |
|
| | | | | | | | | 12,929,880 |
| | 13,000,000 |
|
| Lytx, Inc. | | | | Research & consulting services | | | | | | |
| 500 Class B Units in Lytx Holdings, LLC | | | | | | | | — |
| | 351,355 |
|
| 500 Class A Units in Lytx Holdings, LLC | | | | | | | | 292,459 |
| | 79,788 |
|
| | | | | | | | | 292,459 |
| | 431,143 |
|
| 4 Over International, LLC | | | | Commercial printing | | | | | | |
| First Lien Term Loan, LIBOR+6.0% (1% floor) cash due 6/7/2022 (8)(13) | | 7.24% | | | | 5,850,412 |
| | 5,804,485 |
| | 5,850,463 |
|
| First Lien Revolver, LIBOR+6.0% (1% floor) cash due 6/7/2021 (8)(11) | | 7.24% | | | | | | (502 | ) | | — |
|
| | | | | | | | | 5,803,983 |
| | 5,850,463 |
|
| Ancile Solutions, Inc. | | | | Internet software & services | | | | | | |
| First Lien Term Loan, LIBOR+7% (1% floor) cash due 6/30/2021 (8)(13) | | 8.33% | | | | 9,881,312 |
| | 9,664,392 |
| | 9,802,707 |
|
| | | | | | | | | 9,664,392 |
| | 9,802,707 |
|
| Pomeroy Group Holdings, Inc. | | | | IT consulting & other services | | | | | | |
| First Lien Term Loan, LIBOR+6% (1% floor) cash due 11/30/2021 (8)(13) | | 7.59% | | | | 4,443,467 |
| | 4,339,309 |
| | 4,443,467 |
|
| | | | | | | | | 4,339,309 |
| | 4,443,467 |
|
| Sailpoint Technologies, Inc. | | | | Application software | | | | | | |
| First Lien Term Loan, LIBOR+7% (1% floor) cash due 8/16/2021 (8) | | 8.33% | | | | 17,391,304 |
| | 17,070,160 |
| | 17,391,307 |
|
| First Lien Revolver, LIBOR+7% (1% floor) cash due 8/16/2021 (8)(11) | | 8.33% | | | | | | (3,067 | ) | | — |
|
| | | | | | | | | 17,067,093 |
| | 17,391,307 |
|
| Curvature, Inc. | | | | IT consulting & other services | | | | | | |
| First Lien Term Loan B, LIBOR+5% (1% floor) cash due 10/30/2023 (8)(13) | | 6.24% | | | | 9,925,000 |
| | 9,871,624 |
| | 9,701,688 |
|
| | | | | | | | | 9,871,624 |
| | 9,701,688 |
|
| Cardenas Markets LLC | | | | Food retail | | | | | | |
| First Lien Term Loan, LIBOR+5.75% (1% floor) cash due 11/29/2023 (8)(13) | | 7.08% | | | | 3,275,250 |
| | 3,246,405 |
| | 3,254,780 |
|
| | | | | | | | | 3,246,405 |
| | 3,254,780 |
|
See notes to Consolidated Financial Statements.
Fifth Street Senior Floating Rate Corp.Oaktree Strategic Income Corporation
Consolidated Schedule of Investments
September 30, 20162017
|
| | | | | | | | | | | | | | | | |
| Portfolio Company/Type of Investment (1)(2)(9)(10)(14) | | Cash Interest Rate (8) | | Industry | | Principal (5) |
| | Cost | | Fair Value |
| Ministry Brands, LLC | | | | Internet software & services | | | | | | |
| First Lien Term Loan, LIBOR+5% (1% floor) cash due 12/2/2022 (8)(13) | | 6.24% | | | | $ | 9,648,871 |
| | $ | 9,565,812 |
| | $ | 9,648,874 |
|
| First Lien Delayed Draw Term Loan, LIBOR+5% (1% floor) cash due 12/2/2022 (8)(13) | | 6.24% | | | | 3,354,904 |
| | 3,314,185 |
| | 3,354,905 |
|
| Second Lien Term Loan, LIBOR+9.25% (1% floor) cash due 6/2/2023 (8)(13) | | 10.49% | | | | 1,568,067 |
| | 1,547,561 |
| | 1,568,067 |
|
| Second Lien Delayed Draw Term Loan, LIBOR+9.25% (1% floor) cash due 6/2/2023 (8) | | 10.49% | | | | 431,933 |
| | 426,285 |
| | 431,933 |
|
| First Lien Revolver, LIBOR+5% (1% floor) cash due 12/2/2022 (8)(11) | | 6.24% | | | | | | (861 | ) | | — |
|
| | | | | | | | | 14,852,982 |
| | 15,003,779 |
|
| Impact Sales, LLC | | | | Advertising | | | | | | |
| First Lien Term Loan B, LIBOR+7% (1% floor) cash due 12/30/2021 (8) | | 8.30% | | | | 3,721,875 |
| | 3,628,868 |
| | 3,715,131 |
|
| First Lien Delayed Draw Term Loan, LIBOR+7% (1% floor) cash due 12/30/2021 (8) | | 8.30% | | | | 171,016 |
| | 171,016 |
| | 168,751 |
|
| | | | | | | | | 3,799,884 |
| | 3,883,882 |
|
| Empower Payments Acquisition, Inc. | | | | Commercial printing | | | | | | |
| First Lien Term Loan B, LIBOR+5.5% (1% floor) cash due 11/30/2023 (8)(13) | | 6.83% | | | | 6,153,500 |
| | 6,043,807 |
| | 6,091,669 |
|
| | | | | | | | | 6,043,807 |
| | 6,091,669 |
|
| First American Payment Systems, L.P. | | | | Diversified support services | | | | | | |
| First Lien Term Loan B, LIBOR+5.75% (1% floor) cash due 1/8/2024 (8)(13) | | 6.98% | | | | 4,143,750 |
| | 4,106,872 |
| | 4,131,319 |
|
| | | | | | | | | 4,106,872 |
| | 4,131,319 |
|
| DFT Intermediate LLC | | | | Specialized finance | | | | | | |
| First Lien Term Loan, LIBOR+5.5% (1% floor) cash due 3/1/2023 (8)(13) | | 6.74% | | | | 14,962,500 |
| | 14,624,842 |
| | 14,864,020 |
|
| First Lien Revolver, LIBOR+5.5% (1% floor) cash due 3/1/2022 (8) | | 6.74% | | | | 750,000 |
| | 733,438 |
| | 745,064 |
|
| | | | | | | | | 15,358,280 |
| | 15,609,084 |
|
| Systems, Inc. | | | | Industrial machinery | | | | | | |
| First Lien Term Loan, LIBOR+5.25% (1% floor) cash due 3/3/2022 (8)(13) | | 6.57% | | | | 8,831,921 |
| | 8,715,152 |
| | 8,787,762 |
|
| First Lien Revolver, LIBOR+5.5% (1% floor) cash due 3/3/2022 (8)(11) | | 6.57% | | | | | | (7,950 | ) | | (7,920 | ) |
| | | | | | | | | 8,707,202 |
| | 8,779,842 |
|
| Onvoy, LLC | | | | Integrated telecommunication services | | | | | | |
| First Lien Term Loan, LIBOR+4.5% (1% floor) cash due 2/10/2024 (8)(13) | | 5.83% | | | | 7,960,000 |
| | 7,923,563 |
| | 7,962,507 |
|
| | | | | | | | | 7,923,563 |
| | 7,962,507 |
|
| Salient CRGT, Inc. | | | | IT consulting & other services | | | | | | |
| First Lien Term Loan, LIBOR+5.75% (1% floor) cash due 2/28/2022 (8)(13) | | 6.99% | | | | 6,387,798 |
| | 6,275,056 |
| | 6,343,083 |
|
| | | | | | | | | 6,275,056 |
| | 6,343,083 |
|
| MHE Intermediate Holdings, LLC | | | | Diversified support services | | | | | | |
| First Lien Term Loan B, LIBOR+5% (1% floor) cash due 3/11/2024 (8)(13) | | 6.33% | | | | 11,774,771 |
| | 11,556,138 |
| | 11,774,776 |
|
| First Lien Revolver, LIBOR+5% (1% floor) cash due 3/10/2023 (8) | | 6.33% | | | | 1,353,038 |
| | 1,255,454 |
| | 1,353,038 |
|
| Delayed Draw Term Loan, LIBOR+5% (1% floor) cash due 3/11/2024 (8) | | 6.33% | | | | 1,873,430 |
| | 1,782,689 |
| | 1,873,430 |
|
| | | | | | | | | 14,594,281 |
| | 15,001,244 |
|
See notes to Consolidated Financial Statements.
Oaktree Strategic Income Corporation
Consolidated Schedule of Investments
September 30, 2017
|
| | | | | | | | | | | | | | | | |
| Portfolio Company/Type of Investment (1)(2)(9)(10)(14) | | Cash Interest Rate (8) | | Industry | | Principal (5) |
| | Cost | | Fair Value |
| Paris Presents Incorporated | | | | Personal Products | | | | | | |
| First Lien Term Loan B, LIBOR+5% (1% floor) cash due 12/31/2020 (8)(13) | | 6.24% | | | | $ | 3,134,006 |
| | $ | 3,106,950 |
| | $ | 3,134,006 |
|
| Second Lien Term Loan, LIBOR+8.75% (1% floor) cash due 12/31/2021 (8)(13) | | 9.99% | | | | 3,500,000 |
| | 3,437,500 |
| | 3,465,000 |
|
| | | | | | | | | 6,544,450 |
| | 6,599,006 |
|
| PSI Services LLC | | | | Human Resource & Employment Services | | | | | | |
| First Lien Term Loan B, LIBOR+5% (1% floor) cash due 1/20/2023 (8)(13) | | 6.24% | | | | 6,736,979 |
| | 6,644,622 |
| | 6,616,844 |
|
| | | | | | | | | 6,644,622 |
| | 6,616,844 |
|
| MHVC Acquisition Corp. | | | | Aerospace & Defense | | | | | | |
| First Lien Term Loan B, LIBOR+5.25% (1% floor) cash due 4/25/2024 (8)(13) | | 6.49% | | | | 6,483,750 |
| | 6,453,287 |
| | 6,556,692 |
|
| | | | | | | | | 6,453,287 |
| | 6,556,692 |
|
| LSF9 Atlantis Holdings, LLC | | | | Computer & Electronics Retail | | | | | | |
| First Lien Term Loan B, LIBOR+6% (1% floor) cash due 5/1/2023 (8)(13) | | 7.24% | | | | 7,453,125 |
| | 7,383,862 |
| | 7,498,142 |
|
| | | | | | | | | 7,383,862 |
| | 7,498,142 |
|
| Everi Payments Inc. | | | | Casinos & gaming | | | | | | |
| First Lien Term Loan B, LIBOR+4.5% (1% floor) cash due 5/9/2024 (8)(13)(16) | | 5.74% | | | | 4,987,500 |
| | 4,963,767 |
| | 5,038,622 |
|
| | | | | | | | | 4,963,767 |
| | 5,038,622 |
|
| BJ's Wholesale Club, Inc. | | | | Hypermarkets & super centers | | | | | | |
| First Lien Term Loan B, LIBOR+3.75% (1% floor) cash due 1/26/2024 (8)(16) | | 4.98% | | | | 2,992,500 |
| | 2,996,051 |
| | 2,876,002 |
|
| | | | | | | | | 2,996,051 |
| | 2,876,002 |
|
| Bass Pro Group, LLC | | | | Specialty Stores | | | | | | |
| First Lien Term Loan B, LIBOR+5% (1% floor) cash due 12/15/2023 (8) | | 6.24% | | | | 6,000,000 |
| | 5,877,353 |
| | 5,667,480 |
|
| | | | | | | | | 5,877,353 |
| | 5,667,480 |
|
| Imagine! Print Solutions, LLC | | | | Advertising | | | | | | |
| First Lien Term Loan B, LIBOR+4.75% (1% floor) cash due 6/21/2022 (8) | | 6.09% | | | | 6,965,000 |
| | 6,898,900 |
| | 6,999,825 |
|
| | | | | | | | | 6,898,900 |
| | 6,999,825 |
|
| MND Holdings III Corp. | | | | Specialty Stores | | | | | | |
| First Lien Term Loan B, LIBOR+4.5% (1% floor) cash due 6/19/2024 (8)(13) | | 5.83% | | | | 2,493,750 |
| | 2,481,733 |
| | 2,526,480 |
|
| | | | | | | | | 2,481,733 |
| | 2,526,480 |
|
| Veritas US Inc. | | | | Internet software & services | | | | | | |
| First Lien Term Loan B, LIBOR+4.5% (1% floor) cash due 1/27/2023 (8)(16) | | 5.83% | | | | 10,077,193 |
| | 10,215,779 |
| | 10,189,503 |
|
| | | | | | | | | 10,215,779 |
| | 10,189,503 |
|
| UOS, LLC | | | | Trucking | | | | | | |
| First Lien Term Loan B, LIBOR+5.5% (1% floor) cash due 4/18/2023 (8) | | 6.74% | | | | 3,990,000 |
| | 4,079,548 |
| | 4,099,725 |
|
| | | | | | | | | 4,079,548 |
| | 4,099,725 |
|
| Accudyne Industries, LLC | | | | Oil & gas equipment & services | | | | | | |
| First Lien Term Loan, LIBOR+3.75% (1% floor) cash due 8/18/2024 (8)(16) | | 5.01% | | | | 14,000,000 |
| | 14,057,018 |
| | 14,052,500 |
|
| | | | | | | | | 14,057,018 |
| | 14,052,500 |
|
See notes to Consolidated Financial Statements.
Oaktree Strategic Income Corporation
Consolidated Schedule of Investments
September 30, 2017
|
| | | | | | | | | | | | | | | | |
| Portfolio Company/Type of Investment (1)(2)(9)(10)(14) | | Cash Interest Rate (8) | | Industry | | Principal (5) |
| | Cost | | Fair Value |
| DTZ U.S. Borrower, LLC | | | | Real Estate Services | | | | | | |
| First Lien Term Loan, LIBOR+3.25% (1% floor) cash due 11/4/2021 (8)(16) | | 4.57% | | | | $ | 12,211,343 |
| | $ | 12,247,424 |
| | $ | 12,256,098 |
|
| | | | | | | | | 12,247,424 |
| | 12,256,098 |
|
| Truck Hero, Inc. | | | | Auto parts & equipment | | | | | | |
| First Lien Term Loan, LIBOR+4% (1% floor) cash due 4/22/2024 (8) | | 5.33% | | | | 5,857,320 |
| | 5,871,777 |
| | 5,798,747 |
|
| | | | | | | | | 5,871,777 |
| | 5,798,747 |
|
| Alphabet Holding Company, Inc. | | | | Healthcare distributors | | | | | | |
| First Lien Term Loan, LIBOR+3.5% (1% floor) cash due 9/26/2024 (8) | | 4.83% | | | | 5,000,000 |
| | 4,975,000 |
| | 4,948,950 |
|
| | | | | | | | | 4,975,000 |
| | 4,948,950 |
|
| McAfee, LLC | | | | Internet software & services | | | | | | |
| First Lien Term Loan, LIBOR+4.5% (1% floor) cash due 9/30/2024 (8) | | 5.83% | | | | 7,000,000 |
| | 6,930,000 |
| | 7,072,905 |
|
| | | | | | | | | 6,930,000 |
| | 7,072,905 |
|
| | | | | | | | | | | |
| Total Non-Control/Non-Affiliate Investments (170.9% of net assets) | | | | | | | | $ | 516,270,639 |
| | $ | 501,894,073 |
|
| Total Portfolio Investments (190.9% of net assets) | | | | | | | | $ | 605,090,324 |
| | $ | 560,436,660 |
|
| Cash and Cash Equivalents | | | | | | | | | | |
Wells Fargo Bank Institutional Money Market Fund
| | | | | | | | $ | 32,214,184 |
| | $ | 32,214,184 |
|
| JP Morgan Prime Money Market Fund | | | | | | | | 3,118,675 |
| | 3,118,675 |
|
| Other cash accounts | | | | | | | | 271,268 |
| | 271,268 |
|
| Total Cash and Cash Equivalents (12.1% of net assets) | | | | | | | | $ | 35,604,127 |
| | $ | 35,604,127 |
|
| Total Portfolio Investments, Cash and Cash Equivalents (203.0% of net assets) | | | | | | | | $ | 640,694,451 |
| | $ | 596,040,787 |
|
See notes to Consolidated Financial Statements.
Oaktree Strategic Income Corporation
Consolidated Schedule of Investments
September 30, 2017
| |
| (1) | All debt investments are income producing unless otherwise noted. EquityAll equity investments are non-income producing unless otherwise noted. |
| |
| (2) | See Note 43 in the accompanying notes to the Consolidated Financial Statements for portfolio composition by geographic region. |
| |
| (3) | Control Investments generally are defined by the Investment Company Act of 1940, as amended ("1940 Act"), as investments in companies in which the Company owns more than 25% of the voting securities or maintains greater than 50% of the board representation. |
| |
| (4) | Affiliate Investments generally are defined by the 1940 Act as investments in companies in which the Company owns between 5% and 25% of the voting securities. |
| |
| (5) | Principal includes accumulated payment in kind ("PIK") interest and is net of repayments, if any. |
| |
| (6) | Non-Control/Non-Affiliate Investments are investments that are neither Control Investments nor Affiliate Investments. |
| |
| (7) | Investment is not a qualifying asset as defined under Section 55(a) of the 1940 Act. Under the 1940 Act, the Company may not acquire any non-qualifying asset unless, at the time the acquisition is made, qualifying assets represent at least 70% of the Company's total assets. As of SeptemberJune 30, 2016,2017, qualifying assets represent 84.9%represented 89.6% of the Company's total assets and non-qualifying assets represent 15.1%represented 10.4% of the Company's total assets. |
| |
| (8) | The interest rate on the principal balance outstanding for all floating rate loans is indexed to LIBOR andLondon Interbank Offered Rate ("LIBOR") and/or an alternate base rate (e.g., prime rate), which typically resets semi-annually, quarterly, or monthly at the borrower's option. The borrower may also elect to have multiple interest reset periods for each loan. For each of these loans, the Company has provided the applicable margin over LIBOR or the alternate base rate based on each respective credit agreement.agreement and the cash interest rate as of period end. |
| |
| (9) | Interest rates have beenmay be adjusted from period to period on certain term loans from the stated rates in the original credit agreement as shown in the Consolidated Schedule of Investments.and revolvers. These rate adjustments aremay be either temporary in nature due to tier pricing arrangements or financial or payment covenant violations in the original credit agreements or permanent in nature per loan amendment or waiver documents. The table below summarizes these rate adjustments by portfolio company: |
|
| | | | | | | | |
Portfolio Company | | Effective date | | Cash interest | | PIK interest | | Reason |
NextCare, Inc. | | September 2, 2016 | | + 1% on First Lien Term Loan & Delayed | | + 0.5% on First Lien Term Loan & Delayed Draw Term Loan | | Tier pricing per loan agreement |
PowerPlan, Inc. | | May 21, 2016 | | - 0.5% on First Lien Term Loan | | | | Tier pricing per loan agreement |
Metamorph US 3, LLC | | March 29, 2016 | | + 1.0% on First Lien Term Loan & Revolver | | | | Per loan amendment |
Central Security Group, Inc. | | February 3, 2016 | | + 0.375% on First Lien Term Loan | | | | Per loan amendment |
TrialCard Incorporated | | November 3, 2015 | | - 0.75% on Term Loan and Revolver | | | | Tier pricing per loan agreement |
| |
| (10) | Each of the Company's investments is pledged as collateral under one or more of its credit facilities or its debt securitization. A single investment may be divided into parts that are individually pledged as collateral to separate credit facilities. |
| |
| (11) | Investment has undrawn commitments. A negative cost basis may result from unamortized fees. Unamortized fees are classified as unearned income which reduces cost basis, which may result in a negative cost basis. A negative fair value may result from the unfunded commitment being valued below par. |
| |
| (12) | As defined in the 1940 Act, the Company is deemed to be both an "Affiliated Person" of and to "Control" this portfolio company as the Company owns more than 25% of the portfolio company's outstanding voting securities or has the power to exercise control over management or policies of such portfolio company (including through a management agreement). See Schedule 12-14 in the accompanying notes to the Consolidated Financial Statements for transactions during the year ended September 30, 20162017 in which the issuer was both an Affiliated Person and a portfolio company that the Company is deemed to control. |
| |
| (13) | Investment pledged as collateral under the Company's 2015 Debt Securitization (as defined in Note 7 6 -— Borrowings), in whole or in part. |
| |
| (14) | Income producing through payment of dividends or distributions. |
| |
(15) | In April 2016, the Companyrestructured its debt investment in Ameritox Ltd. As a part of the restructuring, the Company exchanged cash and its debt securities for debt and equity securities in the newly restructured entity.
|
| |
(16) | The sale of this loan does not qualify for true sale accounting under Financial Accounting Standards Board ("FASB") Accounting Standards Codification ("ASC") Topic 860 - Transfers and Servicing ("ASC" 860"), and therefore, the entire debt investment remains in the Consolidated Schedule of Investments. Accordingly, the fair value of the Company's debt investments includes $5.0 million related to the Company's secured borrowings. (See Note 7 in the accompanying notes to the Consolidated Financial Statements.) |
| |
(17) | Equity ownership may be held in shares or units of companies related to the portfolio companies. |
| |
(18)(15) | See Note 3 to the Consolidated Financial Statements for portfolio composition. |
| |
| (16) | As of September 30, 2017, these investments are categorized as level 2 within the fair value hierarchy established by FASB ASC Topic 820, Fair Value Measurements and Disclosures ("ASC 820"). All other investments are categorized as level 3 as of September 30, 2017 and were valued using significant unobservable inputs. |
See notes to Consolidated Financial Statements.
Fifth Street Senior Floating Rate Corp.Oaktree Strategic Income Corporation
Consolidated Schedule of Investments
September 30, 2015
2016
|
| | | | | | | | | | | | | | |
| Portfolio Company/Type of Investment (1)(2) | | Industry | | Principal (5) |
| | Cost | | Fair Value |
| Control Investments (3) | | | | | | | | |
| FSFR Glick JV LLC | | Multi-sector holdings | | | | | | |
| Subordinated Note, LIBOR+8% cash due 10/20/2021 (7)(8)(12) | | | | $ | 53,095,597 |
| | $ | 53,095,597 |
| | $ | 52,603,346 |
|
| 87.5% equity interest (7)(14) | | | | | | 5,882,376 |
| | 4,553,575 |
|
| | | | | | | 58,977,973 |
| | 57,156,921 |
|
| Total Control Investments (16.0% of net assets) | | | | | | $ | 58,977,973 |
| | $ | 57,156,921 |
|
| Affiliate Investments (4) | | | | | | $ | — |
| | $ | — |
|
| Non-Control/Non-Affiliate Investments (6) | | | | | | | | |
| Triple Point Group Holdings, Inc. | | Application software | | | | | | |
| First Lien Revolver, LIBOR+4.25% (1% floor) cash due 7/10/2018 (8) | | | | | | $ | — |
| | $ | — |
|
| | | | | | | — |
| | — |
|
| Blackhawk Specialty Tools, LLC | | Oil & gas equipment & services | | | | | | |
| First Lien Term Loan, LIBOR+5.25% (1.25% floor) cash due 8/1/2019 (8)(13) | | | | $ | 4,499,996 |
| | 4,418,746 |
| | 4,364,794 |
|
| | | | | | | 4,418,746 |
| | 4,364,794 |
|
| New Trident Holdcorp, Inc. | | Healthcare services | | | | | | |
| First Lien Term Loan B, LIBOR+5.25% (1.25% floor) cash due 7/31/2019 (8)(10)(13) | | | | 11,851,711 |
| | 11,701,369 |
| | 11,481,404 |
|
| Second Lien Term Loan, LIBOR+9% (1.25% floor) cash due 7/31/2020 (8) | | | | 1,000,000 |
| | 969,500 |
| | 966,665 |
|
| | | | | | | 12,670,869 |
| | 12,448,069 |
|
| Landslide Holdings, Inc. | | Application software | | | | | | |
| First Lien Revolver, LIBOR+4.25% (1% floor) cash due 8/9/2018 (8) | | | | | | — |
| | — |
|
| | | | | | | — |
| | — |
|
| Smile Brands Group Inc. | | Healthcare services | | | | | | |
| First Lien Term Loan B, LIBOR+6.25% (1.25% floor) cash due 8/16/2019 (8)(13) | | | | 4,900,000 |
| | 4,825,097 |
| | 3,448,375 |
|
| | | | | | | 4,825,097 |
| | 3,448,375 |
|
| NXT Capital, LLC | | Diversified capital markets | | | | | | |
| First Lien Term Loan, LIBOR+5.25% (1% floor) cash due 9/4/2020 (8)(13) | | | | 8,809,782 |
| | 8,756,158 |
| | 8,831,807 |
|
| | | | | | | 8,756,158 |
| | 8,831,807 |
|
| Vitera Healthcare Solutions, LLC | | Healthcare technology | | | | | | |
| First Lien Term Loan, LIBOR+5% (1% floor) cash due 11/4/2020 (8)(13) | | | | 4,912,500 |
| | 4,959,398 |
| | 4,838,813 |
|
| | | | | | | 4,959,398 |
| | 4,838,813 |
|
| The Active Network, Inc. | | Internet software & services | | | | | | |
| Second Lien Term Loan, LIBOR+8.5% (1% floor) cash due 11/15/2021 (8)(13) | | | | 2,400,000 |
| | 2,297,362 |
| | 2,282,004 |
|
| | | | | | | 2,297,362 |
| | 2,282,004 |
|
| Accruent, LLC | | Internet software & services | | | | | | |
| First Lien Term Loan, LIBOR+4.5% (1.25% floor) cash due 11/25/2019 (8)(9)(10)(13) | | | | 19,872,068 |
| | 19,872,068 |
| | 19,974,214 |
|
| | | | | | | 19,872,068 |
| | 19,974,214 |
|
| Pacific Architects and Engineers Incorporated | | Diversified support services | | | | | | |
| First Lien Term Loan B, LIBOR+6.25% (1% floor) cash due 7/17/2018 (8)(13) | | | | 3,438,750 |
| | 3,405,864 |
| | 3,403,709 |
|
| | | | | | | 3,405,864 |
| | 3,403,709 |
|
| Survey Sampling International, LLC | | Research & consulting services | | | | | | |
| First Lien Term Loan, LIBOR+5% (1% floor) cash due 12/16/2020 (8)(10)(13) | | | | 8,358,000 |
| | 8,301,333 |
| | 8,326,658 |
|
| Second Lien Term Loan, LIBOR+9% (1% floor) cash due 12/16/2021 (8) | | | | 1,000,000 |
| | 982,381 |
| | 990,000 |
|
| | | | | | | 9,283,714 |
| | 9,316,658 |
|
| | | | | | | | | |
|
| | | | | | | | | | | | | | | | |
| Portfolio Company/Type of Investment (1)(2)(9)(10)(17)(19) | | Cash Interest Rate (8) | | Industry | | Principal (5) |
| | Cost | | Fair Value |
| Control Investments (3) | | | | | | | | | | |
| FSFR Glick JV LLC (7)(12)(18) | | | | Multi-sector holdings | | | | | | |
| Subordinated Note, LIBOR+8% cash due 10/20/2021 (8) | | 8.47% | | | | $ | 64,005,755 |
| | $ | 64,005,755 |
| | $ | 56,885,646 |
|
| 87.5% equity interest (14) | | | | | | | | 7,111,751 |
| | 6,431,021 |
|
| | | | | | | | | 71,117,506 |
| | 63,316,667 |
|
| Total Control Investments (19.4% of net assets) | | | | | | | | $ | 71,117,506 |
| | $ | 63,316,667 |
|
| Affiliate Investments (4) | | | | | | | | | | |
| Ameritox Ltd. (15) | | | | Healthcare services | | | | | | |
| First Lien Term Loan, LIBOR+5% (1% floor) cash 3% PIK due 4/11/2021 (8)(13) | | 6.00% | | | | 6,387,128 |
| | $ | 6,380,832 |
| | $ | 6,342,286 |
|
| 3,309,873.6 Class A Preferred Units in Ameritox Holdings II, LLC | | | | | | | | 3,309,874 |
| | 3,626,150 |
|
| 327,393.6 Class B Preferred Units in Ameritox Holdings II, LLC | | | | | | | | 327,394 |
| | 358,679 |
|
| 1,007.36 Class A Units in Ameritox Holdings II, LLC | | | | | | | | 5,935,698 |
| | 2,679,343 |
|
| | | | | | | | | 15,953,798 |
| | 13,006,458 |
|
| Total Affiliate Investments (4.0% of net assets) | | | | | | | | $ | 15,953,798 |
| | $ | 13,006,458 |
|
| | | | | | | | | | | |
| Non-Control/Non-Affiliate Investments (6) | | | | | | | | | | |
| Triple Point Group Holdings, Inc. | | | | Application software | | | | | | |
| First Lien Revolver, LIBOR+4.25% (1% floor) cash due 7/10/2018 (8) | | 5.25% | | | | | | — |
| | — |
|
| | | | | | | | | — |
| | — |
|
| Blackhawk Specialty Tools, LLC | | | | Oil & gas equipment & services | | | | | | |
| First Lien Term Loan, LIBOR+5.25% (1.25% floor) cash due 8/1/2019 (8)(13) | | 6.50% | | | | 4,249,996 |
| | 4,177,081 |
| | 4,090,429 |
|
| | | | | | | | | 4,177,081 |
| | 4,090,429 |
|
| New Trident Holdcorp, Inc. | | | | Healthcare services | | | | | | |
| First Lien Term Loan B, LIBOR+5.25% (1.25% floor) cash due 7/31/2019 (8)(13) | | 6.50% | | | | 13,707,532 |
| | 13,289,778 |
| | 11,788,478 |
|
| Second Lien Term Loan, LIBOR+9% (1.25% floor) cash due 7/31/2020 (8) | | 10.25% | | | | 1,000,000 |
| | 972,500 |
| | 820,000 |
|
| | | | | | | | | 14,262,278 |
| | 12,608,478 |
|
| NXT Capital, LLC | | | | Diversified capital markets | | | | | | |
| First Lien Term Loan, LIBOR+5.25% (1% floor) cash due 9/4/2018 (8)(13) | | 6.25% | | | | 8,719,887 |
| | 8,685,189 |
| | 8,763,486 |
|
| | | | | | | | | 8,685,189 |
| | 8,763,486 |
|
| Vitera Healthcare Solutions, LLC | | | | Healthcare technology | | | | | | |
| First Lien Term Loan, LIBOR+5% (1% floor) cash due 11/4/2020 (8)(13) | | 6.00% | | | | 4,862,500 |
| | 4,856,420 |
| | 4,747,016 |
|
| | | | | | | | | 4,856,420 |
| | 4,747,016 |
|
| The Active Network, Inc. | | | | Internet software & services | | | | | | |
| Second Lien Term Loan, LIBOR+8.5% (1% floor) cash due 11/15/2021 (8)(13) | | 9.50% | | | | 2,400,000 |
| | 2,314,573 |
| | 2,370,000 |
|
| | | | | | | | | 2,314,573 |
| | 2,370,000 |
|
| Accruent, LLC | | | | Internet software & services | | | | | | |
| First Lien Term Loan, LIBOR+5.25% (1% floor) cash due 5/16/2022 (8) | | 6.25% | | | | 9,975,000 |
| | 9,881,944 |
| | 9,994,012 |
|
| First Lien Revolver, LIBOR+5.25% (1% floor) cash due 5/16/2022 (8)(11) | | 6.25% | | | | | | (791 | ) | | — |
|
| | | | | | | | | 9,881,153 |
| | 9,994,012 |
|
See notes to Consolidated Financial Statements.
Fifth Street Senior Floating Rate Corp.Oaktree Strategic Income Corporation
Consolidated Schedule of Investments
September 30, 2015
2016
| | | Portfolio Company/Type of Investment (1)(2) | | Industry | | Principal (5) |
| | Cost | | Fair Value | |
| Portfolio Company/Type of Investment (1)(2)(9)(10)(17)(19) | | | Cash Interest Rate (8) | | Industry | | Principal (5) |
| | Cost | | Fair Value |
| Survey Sampling International, LLC | | | Research & consulting services | | | | | | |
| First Lien Term Loan, LIBOR+5% (1% floor) cash due 12/16/2020 (8)(13) | | | 6.00% | | $ | 5,726,682 |
| | $ | 5,691,793 |
| | $ | 5,726,682 |
|
| Second Lien Term Loan, LIBOR+9% (1% floor) cash due 12/16/2021 (8) | | | 10.00% | | 1,000,000 |
| | 985,238 |
| | 980,000 |
|
| | | | | | 6,677,031 |
| | 6,706,682 |
|
| Answers Corporation | | Internet software & services | | | | | | | | Internet software & services | | | | | | |
| First Lien Term Loan, LIBOR+5.25% (1% floor) cash due 10/1/2021 (8)(10)(13) | | $ | 11,910,000 |
| | $ | 11,504,344 |
| | $ | 8,763,795 |
| |
| First Lien Term Loan, LIBOR+5.25% (1% floor) cash due 10/3/2021 (8)(13) | | | 6.25% | | 11,820,000 |
| | 11,421,760 |
| | 6,382,800 |
|
| Second Lien Term Loan, LIBOR+9% (1% floor) cash due 10/3/2022 (8) | | 8,000,000 |
| | 7,605,257 |
| | 4,427,839 |
| | 10.00% | | 8,000,000 |
| | 7,605,257 |
| | 773,360 |
|
| | | | | 19,109,601 |
| | 13,191,634 |
| | | | 19,027,017 |
| | 7,156,160 |
|
| Maxor National Pharmacy Services, LLC | | Pharmaceuticals | | | | | | | | Pharmaceuticals | | | | | | |
| First Lien Term Loan, LIBOR+5.25% (1.25% floor) cash due 1/31/2020 (8)(10)(13) | | 9,825,000 |
| | 9,825,000 |
| | 9,819,438 |
| |
| First Lien Term Loan, LIBOR+5.25% (1.25% floor) cash due 1/31/2020 (8)(13) | | | 6.50% | | 9,162,870 |
| | 9,162,870 |
| | 9,033,850 |
|
| | | | | 9,825,000 |
| | 9,819,438 |
| | | | 9,162,870 |
| | 9,033,850 |
|
| NextCare, Inc. | | Healthcare services | | | | | | | | Healthcare services | | | | | | |
| Senior Term Loan, LIBOR+6% (1% floor) cash due 7/31/2018 (8)(13) | | 7,100,334 |
| | 7,100,334 |
| | 7,085,839 |
| |
| Delayed Draw Term Loan, LIBOR+6% (1% floor) cash due 7/31/2018 (8) | | 610,250 |
| | 610,250 |
| | 609,204 |
| |
| | | | | 7,710,584 |
| | 7,695,043 |
| |
| J.A. Cosmetics Holdings, Inc. | | Personal products | | | | | | | |
| First Lien Term Loan, LIBOR+5% (1.25% floor) cash due 1/31/2019 (8)(13) | | 4,812,500 |
| | 4,787,500 |
| | 4,818,516 |
| |
| | | | | 4,787,500 |
| | 4,818,516 |
| |
| B&H Education, Inc. | | Education services | | | | | | | |
| First Lien Term Loan, LIBOR+5.25% (1.5% floor) cash due 5/3/2015 (8)(14) | | 5,686,571 |
| | 5,686,571 |
| | 5,256,256 |
| |
| Senior Term Loan, LIBOR+7.5% (1% floor) cash due 7/31/2018 (8)(13) | | | 8.50% | | 7,029,160 |
| | 7,029,160 |
| | 6,744,944 |
|
| Delayed Draw Term Loan, LIBOR+7.5% (1% floor) cash due 7/31/2018 (8) | | | 8.50% | | 1,407,969 |
| | 1,407,969 |
| | 1,330,269 |
|
| | | | | 5,686,571 |
| | 5,256,256 |
| | | | 8,437,129 |
| | 8,075,213 |
|
| Aptean, Inc. | | Application software | | | | | | | | Application software | | | | | | |
| Second Lien Term Loan, LIBOR+7.5% (1% floor) cash due 2/26/2021 (8) | | 1,250,000 |
| | 1,237,500 |
| | 1,205,206 |
| | 8.50% | | 1,250,000 |
| | 1,240,179 |
| | 1,232,038 |
|
| | | | | 1,237,500 |
| | 1,205,206 |
| | | | 1,240,179 |
| | 1,232,038 |
|
| Stratus Technologies, Inc. | | Computer hardware | | | | | | | | Computer hardware | | | | | | |
| First Lien Term Loan, LIBOR+5% (1% floor) cash due 4/28/2021 (8)(13) | | 4,131,944 |
| | 4,099,489 |
| | 4,121,614 |
| | 6.00% | | 4,003,658 |
| | 3,956,802 |
| | 3,903,567 |
|
| | | | | 4,099,489 |
| | 4,121,614 |
| | | | 3,956,802 |
| | 3,903,567 |
|
| TravelCLICK, Inc. | | Internet software & services | | | | | | | | Internet software & services | | | | | | |
| Second Lien Term Loan, LIBOR+7.75% (1% floor) cash due 11/6/2021 (8)(13) | | 3,380,000 |
| | 3,281,969 |
| | 3,333,525 |
| | 8.75% | | 3,380,000 |
| | 3,299,165 |
| | 3,027,128 |
|
| | | | | 3,281,969 |
| | 3,333,525 |
| | | | 3,299,165 |
| | 3,027,128 |
|
| Language Line, LLC | | Integrated telecommunication services | | | | | | | |
| First Lien Term Loan, LIBOR+5.5% (1% floor) cash due 7/7/2021 (8)(10)(13) | | 15,000,000 |
| | 15,000,000 |
| | 15,031,275 |
| |
| Second Lien Term Loan, LIBOR+9.75% (1% floor) cash due 7/7/2022 (8)(10)(13) | | 8,000,000 |
| | 8,000,000 |
| | 8,040,000 |
| |
| | | | | 23,000,000 |
| | 23,071,275 |
| |
| GTCR Valor Companies, Inc. | | Advertising | | | | | | | | Advertising | | | | | | |
| First Lien Term Loan, LIBOR+5% (1% floor) cash due 5/30/2021 (8)(10)(13) | | 13,455,992 |
| | 13,275,118 |
| | 13,338,252 |
| |
| First Lien Term Loan, LIBOR+6% (1% floor) cash due 6/16/2023 (8)(13) | | | 7.00% | | 12,219,375 |
| | 11,607,301 |
| | 11,688,626 |
|
| | | | | 13,275,118 |
| | 13,338,252 |
| | | | 11,607,301 |
| | 11,688,626 |
|
| ConvergeOne Holdings Corp. | | Integrated telecommunication services | | | | | | | | Integrated telecommunication services | | | | | | |
| First Lien Term Loan, LIBOR+5% (1% floor) cash due 6/17/2020 (8)(13) | | 5,397,670 |
| | 5,363,527 |
| | 5,367,308 |
| | 6.00% | | 5,343,010 |
| | 5,316,746 |
| | 5,322,974 |
|
| | | | | 5,363,527 |
| | 5,367,308 |
| | | | 5,316,746 |
| | 5,322,974 |
|
| Verdesian Life Sciences, LLC | | Fertilizers & agricultural chemicals | | | | | | | | Fertilizers & agricultural chemicals | | | | | | |
| First Lien Term Loan, LIBOR+5% (1% floor) cash due 7/1/2020 (8)(13) | | 3,754,945 |
| | 3,713,056 |
| | 3,754,945 |
| | 6.00% | | 3,554,890 |
| | 3,522,668 |
| | 3,377,146 |
|
| | | | | 3,713,056 |
| | 3,754,945 |
| | | | 3,522,668 |
| | 3,377,146 |
|
| PR Wireless, Inc. | | | Wireless telecommunication services | | | | | | |
| First Lien Term Loan, LIBOR+9% (1% floor) cash due 6/29/2020 (7)(8) | | | 10.00% | | 5,836,771 |
| | 5,719,729 |
| | 4,111,317 |
|
| 35.5263 Common Stock Warrants (exercise price $0.01) expiration date 6/27/2024 (7) | | | | | — |
| | 120,342 |
|
| | | | | | 5,719,729 |
| | 4,231,659 |
|
See notes to Consolidated Financial Statements.
Fifth Street Senior Floating Rate Corp.Oaktree Strategic Income Corporation
Consolidated Schedule of Investments
September 30, 2015
2016
|
| | | | | | | | | | | | | | |
| Portfolio Company/Type of Investment (1)(2) | | Industry | | Principal (5) |
| | Cost | | Fair Value |
| PR Wireless, Inc. | | Wireless telecommunication services | | | | | | |
| First Lien Term Loan, LIBOR+9% (1% floor) cash due 6/29/2020 (7)(8) | | | | $ | 5,896,482 |
| | $ | 5,746,610 |
| | $ | 5,299,540 |
|
| 35.5263 Common Stock Warrants (exercise price of $0.01) expiration 6/27/2024 (7) | | | | | | — |
| | 154,706 |
|
| | | | | | | 5,746,610 |
| | 5,454,246 |
|
| TV Borrower US, LLC | | Integrated telecommunication services | | | | | | |
| First Lien Term Loan, LIBOR+5% (1% floor) cash due 1/8/2021 (7)(8)(13) | | | | 6,930,000 |
| | 6,792,500 |
| | 6,919,606 |
|
| Second Lien Term Loan, LIBOR+8.5% (1% floor) cash due 7/8/2021 (7)(8)(13) | | | | 3,000,000 |
| | 2,902,560 |
| | 2,929,995 |
|
| | | | | | | 9,695,060 |
| | 9,849,601 |
|
| American Dental Partners, Inc. | | Healthcare services | | | | | | |
| First Lien Term Loan, LIBOR+4.75% (1% floor) cash due 8/30/2021 (8)(10) | | | | 5,940,000 |
| | 5,915,714 |
| | 5,940,000 |
|
| | | | | | | 5,915,714 |
| | 5,940,000 |
|
| BeyondTrust Software, Inc. | | Application software | | | | | | |
| First Lien Term Loan, LIBOR+7% (1% floor) cash due 9/25/2019 (8)(10)(13) | | | | 19,872,068 |
| | 19,590,591 |
| | 19,868,049 |
|
| First Lien Revolver, LIBOR+7% (1% floor) cash due 9/25/2019 (8) | | | | | | — |
| | — |
|
| 500,000 Class A membership interest in BeyondTrust Holdings LLC | | | | | | 500,000 |
| | 809,394 |
|
| | | | | | | 20,090,591 |
| | 20,677,443 |
|
| Reliant Hospital Partners, LLC | | Healthcare services | | | | | | |
| First Lien Term Loan, LIBOR+4.75% (1% floor) cash due 10/1/2019 (8)(13) | | | | 7,359,375 |
| | 7,359,375 |
| | 7,359,375 |
|
| | | | | | | 7,359,375 |
| | 7,359,375 |
|
| Hill International, Inc. | | Construction and engineering | | | | | | |
| First Lien Term Loan, LIBOR+6.75% (1% floor) cash due 9/26/2020 (8)(13) | | | | 6,039,000 |
| | 5,945,467 |
| | 5,908,869 |
|
| | | | | | | 5,945,467 |
| | 5,908,869 |
|
| Teaching Strategies, LLC | | Education services | | | | | | |
| First Lien Term Loan, LIBOR+5.5% (0.5% floor) cash due 10/1/2019 (8)(10)(13) | | | | 16,106,327 |
| | 16,057,408 |
| | 16,129,873 |
|
| First Lien Revolver, LIBOR+5.5% (0.5% floor) cash due 10/1/2019 (8) | | | | | | — |
| | — |
|
| | | | | | | 16,057,408 |
| | 16,129,873 |
|
| Dynatect Group Holdings, Inc. | | Industrial machinery | | | | | | |
| First Lien Term Loan, LIBOR+4.5% (1% floor) cash due 9/30/2020 (8)(10) | | | | 3,970,000 |
| | 3,970,000 |
| | 3,867,602 |
|
| First Lien Delayed Draw Term Loan, LIBOR+4.5% (1% floor) cash due 9/30/2020 (8)(10) | | | | | | — |
| | — |
|
| | | | | | | 3,970,000 |
| | 3,867,602 |
|
| Idera, Inc. | | Internet software & services | | | | | | |
| First Lien Term Loan, LIBOR+5.5% (0.5% floor) cash due 11/5/2020 (8)(10)(13) | | | | 16,787,500 |
| | 16,553,740 |
| | 16,787,500 |
|
| First Lien Revolver, LIBOR+5.5% (0.5% floor) cash due 11/5/2019 (8)(11) | | | | | | (128 | ) | | — |
|
| | | | | | | 16,553,612 |
| | 16,787,500 |
|
| Central Security Group, Inc. | | Specialized consumer services | | | | | | |
| First Lien Term Loan, LIBOR+5.25% (1% floor) cash due 10/6/2020 (8)(10) | | | | 2,565,575 |
| | 2,535,124 |
| | 2,539,919 |
|
| | | | | | | 2,535,124 |
| | 2,539,919 |
|
|
| | | | | | | | | | | | | | | | |
| Portfolio Company/Type of Investment (1)(2)(9)(10)(17)(19) | | Cash Interest Rate (8) | | Industry | | Principal (5) |
| | Cost | | Fair Value |
| TV Borrower US, LLC | | | | Integrated telecommunication services | | | | | | |
| First Lien Term Loan, LIBOR+5% (1% floor) cash due 1/8/2021 (7)(8)(13) | | 6.00% | | | | $ | 6,086,385 |
| | $ | 5,973,885 |
| | $ | 6,063,561 |
|
| Second Lien Term Loan, LIBOR+8.5% (1% floor) cash due 7/8/2021 (7)(8)(13) | | 9.50% | | | | 3,000,000 |
| | 2,921,780 |
| | 2,910,000 |
|
| | | | | | | | | 8,895,665 |
| | 8,973,561 |
|
| American Dental Partners, Inc. | | | | Healthcare services | | | | | | |
| First Lien Term Loan, LIBOR+4.75% (1% floor) cash due 8/30/2021 (8)(13) | | 5.75% | | | | 5,880,000 |
| | 5,860,000 |
| | 5,791,800 |
|
| | | | | | | | | 5,860,000 |
| | 5,791,800 |
|
| BeyondTrust Software, Inc. | | | | Application software | | | | | | |
| First Lien Term Loan, LIBOR+7% (1% floor) cash due 9/25/2019 (8)(13) | | 8.00% | | | | 18,381,895 |
| | 18,136,331 |
| | 18,309,259 |
|
| First Lien Revolver, LIBOR+7% (1% floor) cash due 9/25/2019 (8)(11) | | 8.00% | | | | | | (30,304 | ) | | — |
|
| 500,000 Class A membership interests in BeyondTrust Holdings LLC | | | | | | | | 500,000 |
| | 613,869 |
|
| | | | | | | | | 18,606,027 |
| | 18,923,128 |
|
| Hill International, Inc. | | | | Construction & engineering | | | | | | |
| First Lien Term Loan, LIBOR+6.75% (1% floor) cash due 9/26/2020 (8)(13) | | 7.75% | | | | 5,978,000 |
| | 5,907,850 |
| | 5,768,770 |
|
| | | | | | | | | 5,907,850 |
| | 5,768,770 |
|
| Teaching Strategies, LLC | | | | Education services | | | | | | |
| First Lien Term Loan, LIBOR+5.5% (0.5% floor) cash due 10/1/2019 (8)(13) | | 6.34% | | | | 15,252,341 |
| | 15,262,322 |
| | 15,293,164 |
|
| First Lien Revolver, LIBOR+5.5% (0.5% floor) cash due 10/1/2019 (8) | | 6.34% | | | | | | — |
| | — |
|
| | | | | | | | | 15,262,322 |
| | 15,293,164 |
|
| Dynatect Group Holdings, Inc. | | | | Industrial machinery | | | | | | |
| First Lien Term Loan, LIBOR+4.5% (1% floor) cash due 9/30/2020 (8) | | 5.50% | | | | 3,826,203 |
| | 3,826,203 |
| | 3,778,376 |
|
| First Lien Delayed Draw Term Loan, LIBOR+4.5% (1% floor) cash due 9/30/2020 (8) | | 5.50% | | | | | | — |
| | — |
|
| | | | | | | | | 3,826,203 |
| | 3,778,376 |
|
| Idera, Inc. | | | | Internet software & services | | | | | | |
| First Lien Term Loan, LIBOR+5.5% (1% floor) cash due 4/9/2021 (8)(13) | | 6.50% | | | | 17,356,053 |
| | 16,490,668 |
| | 16,878,761 |
|
| | | | | | | | | 16,490,668 |
| | 16,878,761 |
|
| Central Security Group, Inc. | | | | Specialized consumer services | | | | | | |
| First Lien Term Loan, LIBOR+5.625% (1% floor) cash due 10/6/2020 (8) | | 6.63% | | | | 2,539,726 |
| | 2,532,917 |
| | 2,482,582 |
|
| | | | | | | | | 2,532,917 |
| | 2,482,582 |
|
| Kellermeyer Bergensons Services, LLC | | | | Diversified support services | | | | | | |
| First Lien Term Loan, LIBOR+5% (1% floor) cash due 10/29/2021 (8)(13) | | 6.00% | | | | 5,265,325 |
| | 5,211,587 |
| | 5,081,038 |
|
| Second Lien Term Loan, LIBOR+8.5% (1% floor) cash due 4/29/2022 (8)(13) | | 9.50% | | | | 280,000 |
| | 280,000 |
| | 266,000 |
|
| | | | | | | | | 5,491,587 |
| | 5,347,038 |
|
| GOBP Holdings Inc. | | | | Food retail | | | | | | |
| Second Lien Term Loan, LIBOR+8.25% (1% floor) cash due 10/21/2022 (8)(13) | | 9.25% | | | | 3,685,714 |
| | 3,635,831 |
| | 3,685,714 |
|
| | | | | | | | | 3,635,831 |
| | 3,685,714 |
|
See notes to Consolidated Financial Statements.
Fifth Street Senior Floating Rate Corp.Oaktree Strategic Income Corporation
Consolidated Schedule of Investments
September 30, 2015
|
| | | | | | | | | | | | | | |
| Portfolio Company/Type of Investment (1)(2) | | Industry | | Principal (5) |
| | Cost | | Fair Value |
| Kellermeyer Bergensons Services, LLC | | Diversified support services | | | | | | |
| First Lien Term Loan, LIBOR+5% (1% floor) cash due 10/29/2021 (8)(13) | | | | $ | 5,359,500 |
| | $ | 5,295,190 |
| | $ | 5,292,506 |
|
| Second Lien Term Loan, LIBOR+8.5% (1% floor) cash due 4/29/2022 (8)(13) | | | | 280,000 |
| | 280,000 |
| | 281,400 |
|
| | | | | | | 5,575,190 |
| | 5,573,906 |
|
| GOBP Holdings Inc. | | Food retail | | | | | | |
| Second Lien Term Loan, LIBOR+8.25% (1% floor) cash due 10/21/2022 (8)(10)(13) | | | | 6,400,000 |
| | 6,328,892 |
| | 6,384,000 |
|
| | | | | | | 6,328,892 |
| | 6,384,000 |
|
| NAVEX Global, Inc. | | Internet software & services | | | | | | |
| First Lien Term Loan, LIBOR+4.75% (1% floor) cash due 11/19/2021 (8)(13) | | | | 6,802,442 |
| | 6,726,246 |
| | 6,768,430 |
|
| Second Lien Term Loan, LIBOR+8.75% (1% floor) cash due 11/18/2022 (8) | | | | 1,500,000 |
| | 1,500,000 |
| | 1,485,000 |
|
| | | | | | | 8,226,246 |
| | 8,253,430 |
|
| Executive Consulting Group, LLC | | Healthcare services | | | | | | |
| First Lien Term Loan, LIBOR+4.75% (1% floor) cash due 11/21/2019 (8)(10)(13) | | | | 7,000,000 |
| | 7,000,000 |
| | 6,988,039 |
|
| Delayed Draw Term Loan, LIBOR+4.75% (1% floor) cash due 11/21/2019 (8)(10) | | | | | | — |
| | — |
|
| | | | | | | 7,000,000 |
| | 6,988,039 |
|
| TIBCO Software, Inc. | | Internet software & services | | | | | | |
| First Lien Term Loan, LIBOR+5.5% (1% floor) cash due 12/4/2020 (8)(10) | | | | 7,999,800 |
| | 7,571,941 |
| | 7,939,802 |
|
| First Lien Revolver, LIBOR+4% cash due 11/25/2020 (8) | | | | | | — |
| | — |
|
| | | | | | | 7,571,941 |
| | 7,939,802 |
|
| Metamorph US 3, LLC | | Internet software & services | | | | | | |
| First Lien Term Loan, LIBOR+5.5% (1% floor) cash due 12/1/2020 (8)(10)(13) | | | | 17,310,731 |
| | 17,200,848 |
| | 17,131,150 |
|
| First Lien Revolver, LIBOR+5.5% (1% floor) cash due 12/1/2020 (8)(13) | | | | 600,000 |
| | 567,664 |
| | 600,000 |
|
| | | | | | | 17,768,512 |
| | 17,731,150 |
|
| Compuware Corporation | | Internet software & services | | | | | | |
| First Lien Term Loan B1, LIBOR+5.25% (1% floor) cash due 12/15/2019 (8)(10)(13) | | | | 8,254,351 |
| | 8,140,683 |
| | 7,994,339 |
|
| First Lien Term Loan B2, LIBOR+5.25% (1% floor) cash due 12/15/2021 (8)(10) | | | | 6,451,250 |
| | 6,164,940 |
| | 6,233,520 |
|
| | | | | | | 14,305,623 |
| | 14,227,859 |
|
| Novetta Solutions, LLC | | Diversified support services | | | | | | |
| First Lien Term Loan, LIBOR+5% (1% floor) cash due 10/2/2020 (8)(13) | | | | 5,742,000 |
| | 5,693,114 |
| | 5,742,000 |
|
| | | | | | | 5,693,114 |
| | 5,742,000 |
|
| AF Borrower, LLC | | IT consulting & other services | | | | | | |
| First Lien Term Loan, LIBOR+5.25% (1% floor) cash due 1/28/2022 (8)(10) | | | | 8,258,500 |
| | 8,078,315 |
| | 8,217,208 |
|
| | | | | | | 8,078,315 |
| | 8,217,208 |
|
| Ameritox Ltd. | | Healthcare services | | | | | | |
| First Lien Term Loan, LIBOR+7.5% (1% floor) cash due 6/23/2019 (8)(10)(13) | | | | 19,680,542 |
| | 19,677,876 |
| | 17,815,474 |
|
| First Lien Revolver, LIBOR+7.5% (1% floor) cash due 6/23/2019 (8) | | | | 1,000,000 |
| | 999,810 |
| | 1,000,000 |
|
| | | | | | | 20,677,686 |
| | 18,815,474 |
|
| TrialCard Incorporated | | Healthcare services | | | | | | |
| First Lien Term Loan, LIBOR+5.25% (1% floor) cash due 12/31/2019 (8)(9)(10)(13) | | | | 10,085,815 |
| | 10,080,571 |
| | 9,947,755 |
|
| First Lien Revolver, LIBOR+5.25% (1% floor) cash due 12/31/2019 (8)(9)(11) | | | | | | (375 | ) | | — |
|
| | | | | | | 10,080,196 |
| | 9,947,755 |
|
| Motion Recruitment Partners LLC | | Diversified support services | | | | | | |
| First Lien Term Loan, LIBOR+6% (1% floor) cash due 2/13/2020 (8)(10)(13) | | | | 14,917,500 |
| | 14,906,741 |
| | 14,757,057 |
|
| First Lien Revolver, LIBOR+6% (1% floor) cash due 2/13/2020 (8)(11) | | | | | | (960 | ) | | — |
|
| | | | | | | 14,905,781 |
| | 14,757,057 |
|
See notes to Consolidated Financial Statements.Fifth Street Senior Floating Rate Corp.
Consolidated Schedule of Investments
September 30, 2015
2016
|
| | | | | | | | | | | | | | |
| Portfolio Company/Type of Investment (1)(2) | | Industry | | Principal (5) |
| | Cost | | Fair Value |
| PowerPlan, Inc. | | Internet software & services | | | | | | |
| First Lien Term Loan, LIBOR+5.25% (1% floor) cash due 2/23/2022 (8)(10)(13) | | | | $ | 13,668,333 |
| | $ | 13,668,333 |
| | $ | 13,665,537 |
|
| First Lien Revolver, LIBOR+5.25% (1% floor) cash due 2/23/2021 (8) | | | | | | — |
| | — |
|
| | | | | | | 13,668,333 |
| | 13,665,537 |
|
| Digital River, Inc. | | Internet software & services | | | | | | |
| First Lien Term Loan, LIBOR+6.5% (1% floor) cash due 2/12/2021 (8)(10)(13) | | | | 9,937,500 |
| | 9,751,027 |
| | 9,937,500 |
|
| | | | | | | 9,751,027 |
| | 9,937,500 |
|
| Curo Health Services Holdings, Inc. | | Healthcare services | | | | | | |
| First Lien Term Loan B, LIBOR+5.5% (1% floor) cash due 2/5/2022 (8)(10) | | | | 5,392,950 |
| | 5,344,819 |
| | 5,410,936 |
|
| | | | | | | 5,344,819 |
| | 5,410,936 |
|
| Research Now Group, Inc. | | Data processing & outsourced services | | | | | | |
| First Lien Term Loan, LIBOR+4.5% (1% floor) cash due 3/18/2021 (8)(13) | | | | 3,731,250 |
| | 3,708,681 |
| | 3,721,922 |
|
| Second Lien Term Loan, LIBOR+8.75% (1% floor) cash due 3/18/2022 (8)(10) | | | | 4,000,000 |
| | 3,945,000 |
| | 3,990,000 |
|
| | | | | | | 7,653,681 |
| | 7,711,922 |
|
| Fineline Technologies, Inc. | | Electronic equipment & instruments | | | | | | |
| First Lien Term Loan, LIBOR+5.5% (1% floor) cash due 5/5/2017 (8)(10)(13) | | | | 13,720,000 |
| | 13,720,000 |
| | 13,717,288 |
|
| | | | | | | 13,720,000 |
| | 13,717,288 |
|
| My Alarm Center, LLC | | Security & alarm services | | | | | | |
| First Lien Term Loan A, LIBOR+8% (1% floor) cash due 1/9/2018 (8)(10)(13) | | | | 16,047,619 |
| | 16,047,619 |
| | 16,046,254 |
|
| First Lien Term Loan B, LIBOR+8% (1% floor) cash due 1/9/2018 (8)(10) | | | | 960,356 |
| | 960,356 |
| | 966,015 |
|
| First Lien Term Loan C, LIBOR+8% (1% floor) cash due 1/9/2018 (8) | | | | 618,812 |
| | 618,812 |
| | 617,504 |
|
| First Lien Term Revolver, LIBOR+8% (1% floor) cash due 1/9/2018 (8) | | | | 133,333 |
| | 133,333 |
| | 133,333 |
|
| | | | | | | 17,760,120 |
| | 17,763,106 |
|
| Legalzoom.com, Inc. | | Specialized consumer services | | | | | | |
| First Lien Term Loan, LIBOR+7% (1% floor) cash due 5/13/2020 (8)(10)(13) | | | | 19,900,000 |
| | 19,874,564 |
| | 19,912,601 |
|
| First Lien Revolver, LIBOR+7% (1% floor) cash due 5/13/2020 (8)(11) | | | | | | (2,210 | ) | | — |
|
| | | | | | | 19,872,354 |
| | 19,912,601 |
|
| TWCC Holding Corp. | | Specialized consumer services | | | | | | |
| First Lien Term Loan B1, LIBOR+5% (0.75% floor) cash due 2/11/2020 (8)(13) | | | | 6,368,000 |
| | 6,309,614 |
| | 6,342,528 |
|
| | | | | | | 6,309,614 |
| | 6,342,528 |
|
| Raley's | | Food retail | | | | | | |
| First Lien Term Loan, LIBOR+6.25% (1% floor) cash due 5/18/2022 (8)(13) | | | | 4,048,750 |
| | 3,971,631 |
| | 4,048,750 |
|
| | | | | | | 3,971,631 |
| | 4,048,750 |
|
| Retail Solutions Group, Inc. | | Data processing & outsourced services | | | | | | |
| First Lien Term Loan, LIBOR+5.25% (0.75% floor) cash due 6/23/2022 (8)(13) | | | | 5,985,000 |
| | 5,927,667 |
| | 5,970,038 |
|
| | | | | | | 5,927,667 |
| | 5,970,038 |
|
| All Web Leads, Inc. | | Advertising | | | | | | |
| First Lien Term Loan, LIBOR+6.5% (1% floor) cash due 6/30/2020 (8)(10)(13) | | | | 17,598,366 |
| | 17,578,629 |
| | 17,604,775 |
|
| First Lien Revolver, LIBOR+6.5% (1% floor) cash due 6/30/2020 (8) | | | | 1,636,381 |
| | 1,633,468 |
| | 1,636,381 |
|
| | | | | | | 19,212,097 |
| | 19,241,156 |
|
| Too Faced Cosmetics, LLC | | Personal products | | | | | | |
| First Lien Term Loan, LIBOR+5% (1% floor) cash due 7/7/2021 (8)(13) | | | | 6,000,000 |
| | 6,000,000 |
| | 6,000,000 |
|
| | | | | | | 6,000,000 |
| | 6,000,000 |
|
| Internet Pipeline, Inc. | | Internet software & services | | | | | | |
| First Lien Term Loan, LIBOR+7.25% (1% floor) cash due 8/4/2022 (8)(13) | | | | 12,000,000 |
| | 12,000,000 |
| | 12,000,000 |
|
| First Lien Revolver, LIBOR+7.25% (1% floor) cash due 8/4/2021 (8) | | | | | | — |
| | — |
|
| | | | | | | 12,000,000 |
| | 12,000,000 |
|
| Poseidon Merger Sub, Inc. | | Advertising | | | | | | |
| First Lien Term Loan, LIBOR+4.75% (1% floor) cash due 8/15/2022 (8)(13) | | | | 4,000,000 |
| | 4,000,000 |
| | 4,000,000 |
|
| Second Lien Term Loan, LIBOR+8.5% (1% floor) cash due 8/15/2023 (8) | | | | 7,000,000 |
| | 6,980,768 |
| | 7,000,000 |
|
| | | | | | | 10,980,768 |
| | 11,000,000 |
|
|
| | | | | | | | | | | | | | | | |
| Portfolio Company/Type of Investment (1)(2)(9)(10)(17)(19) | | Cash Interest Rate (8) | | Industry | | Principal (5) |
| | Cost | | Fair Value |
| NAVEX Global, Inc. | | | | Internet software & services | | | | | | |
| First Lien Term Loan, LIBOR+4.75% (1% floor) cash due 11/19/2021 (8)(13) | | 5.99% | | | | $ | 3,450,918 |
| | $ | 3,440,820 |
| | $ | 3,433,662 |
|
| Second Lien Term Loan, LIBOR+9.5% (1% floor) cash due 11/18/2022 (8) | | 10.31% | | | | 1,438,468 |
| | 1,438,468 |
| | 1,395,314 |
|
| | | | | | | | | 4,879,288 |
| | 4,828,976 |
|
| Executive Consulting Group, LLC | | | | Healthcare services | | | | | | |
| First Lien Term Loan, LIBOR+4.75% (1% floor) cash due 11/21/2019 (8)(13) | | 5.75% | | | | 7,000,000 |
| | 7,000,000 |
| | 6,960,668 |
|
| Delayed Draw Term Loan, LIBOR+4.75% (1% floor) cash due 11/21/2019 (8) | | 5.75% | | | | 4,000,000 |
| | 4,000,000 |
| | 3,979,448 |
|
| | | | | | | | | 11,000,000 |
| | 10,940,116 |
|
| TIBCO Software, Inc. | | | | Internet software & services | | | | | | |
| First Lien Term Loan, LIBOR+5.5% (1% floor) cash due 12/4/2020 (8) | | 6.50% | | | | 7,919,400 |
| | 7,590,582 |
| | 7,823,932 |
|
| First Lien Revolver, LIBOR+4% cash due 11/25/2020 (8) | | 4.24% | | | | | | — |
| | — |
|
| | | | | | | | | 7,590,582 |
| | 7,823,932 |
|
| Metamorph US 3, LLC | | | | Internet software & services | | | | | | |
| First Lien Term Loan, LIBOR+6.5% (1% floor) cash due 12/1/2020 (8)(13) | | 7.50% | | | | 14,223,467 |
| | 14,181,149 |
| | 11,840,322 |
|
| First Lien Revolver, LIBOR+6.5% (1% floor) cash due 12/1/2020 (8)(13) | | 7.50% | | | | 600,000 |
| | 573,856 |
| | 600,000 |
|
| | | | | | | | | 14,755,005 |
| | 12,440,322 |
|
| Compuware Corporation | | | | Internet software & services | | | | | | |
| First Lien Term Loan B1, LIBOR+5.25% (1% floor) cash due 12/15/2019 (8)(13) | | 6.25% | | | | 7,825,554 |
| | 7,720,514 |
| | 7,854,900 |
|
| First Lien Term Loan B2, LIBOR+5.25% (1% floor) cash due 12/15/2021 (8) | | 6.25% | | | | 905,896 |
| | 889,191 |
| | 904,198 |
|
| | | | | | | | | 8,609,705 |
| | 8,759,098 |
|
| AF Borrower, LLC | | | | IT consulting & other services | | | | | | |
| First Lien Term Loan, LIBOR+5.25% (1% floor) cash due 1/28/2022 (8)(13) | | 6.25% | | | | 1,036,642 |
| | 1,020,406 |
| | 1,041,612 |
|
| | | | | | | | | 1,020,406 |
| | 1,041,612 |
|
| TrialCard Incorporated | | | | Healthcare services | | | | | | |
| First Lien Term Loan, LIBOR+4.5% (1% floor) cash due 12/31/2019 (8)(13) | | 5.50% | | | | 9,874,962 |
| | 9,869,718 |
| | 9,827,027 |
|
| First Lien Revolver, LIBOR+4.5% (1% floor) cash due 12/31/2019 (8)(11) | | 5.50% | | | | | | (375 | ) | | — |
|
| | | | | | | | | 9,869,343 |
| | 9,827,027 |
|
| Motion Recruitment Partners LLC | | | | Diversified support services | | | | | | |
| First Lien Term Loan, LIBOR+6% (1% floor) cash due 2/13/2020 (8)(13) | | 7.00% | | | | 14,235,000 |
| | 14,224,241 |
| | 14,250,584 |
|
| First Lien Revolver, LIBOR+6% (1% floor) cash due 2/13/2020 (8)(11) | | 7.00% | | | | | | (960 | ) | | — |
|
| | | | | | | | | 14,223,281 |
| | 14,250,584 |
|
| PowerPlan, Inc. | | | | Internet software & services | | | | | | |
| First Lien Term Loan, LIBOR+4.75% (1% floor) cash due 2/23/2022 (8)(13) | | 5.75% | | | | 16,737,833 |
| | 16,710,709 |
| | 16,731,213 |
|
| First Lien Revolver, LIBOR+4.75% (1% floor) cash due 2/23/2021 (8) | | 5.75% | | | | | | — |
| | — |
|
| | | | | | | | | 16,710,709 |
| | 16,731,213 |
|
See notes to Consolidated Financial Statements.
Fifth Street Senior Floating Rate Corp.Oaktree Strategic Income Corporation
Consolidated Schedule of Investments
September 30, 2015
2016
|
| | | | | | | | | | | | | | |
| Portfolio Company/Type of Investment (1)(2) | | Industry | | Principal (5) |
| | Cost | | Fair Value |
| American Seafoods Group LLC | | Food distributors | | | | | | |
| First Lien Term Loan, LIBOR+5% (1% floor) cash due 8/19/2021 (8)(13) | | | | $ | 6,000,000 |
| | $ | 5,942,222 |
| | $ | 5,970,000 |
|
| Second Lien Term Loan, LIBOR+9% (1% floor) cash due 2/19/2022 (8) | | | | 3,000,000 |
| | 2,970,769 |
| | 3,000,000 |
|
| | | | | | | 8,912,991 |
| | 8,970,000 |
|
| Accentcare, Inc. | | Healthcare services | | | | | | |
| First Lien Term Loan, LIBOR+5.75% (1% floor) cash due 9/3/2021 (8) | | | | 8,000,000 |
| | 7,921,111 |
| | 7,960,000 |
|
| | | | | | | 7,921,111 |
| | 7,960,000 |
|
| CRGT Inc. | | IT consulting & other services | | | | | | |
| First Lien Term Loan, LIBOR+6.5% (1% floor) cash due 12/19/2020 (8)(13) | | | | 3,875,316 |
| | 3,875,316 |
| | 3,865,628 |
|
| | | | | | | 3,875,316 |
| | 3,865,628 |
|
| Valet Merger Sub, Inc. | | Environmental & facilities services | | | | | | |
| First Lien Term Loan, LIBOR+7% (1% floor) cash due 9/24/2021 (8)(13) | | | | 10,000,000 |
| | 9,998,007 |
| | 10,000,000 |
|
| First Lien Revolver, LIBOR+7% (1% floor) cash due 9/24/2021 (8)(11) | | | | | | (200 | ) | | — |
|
| | | | | | | 9,997,807 |
| | 10,000,000 |
|
| Total Non-Control/Non-Affiliate Investments (158.8% of net assets) | | | | | | $ | 574,538,984 |
| | $ | 566,490,553 |
|
| Total Portfolio Investments (174.8% of net assets) | | | | | | $ | 633,516,957 |
| | $ | 623,647,474 |
|
| Cash and Cash Equivalents | | | | | | | | |
| JP Morgan Prime Money Market Fund | | | | | | $ | 29,593,397 |
| | $ | 29,593,397 |
|
| Other cash accounts | | | | | | 11,839,904 |
| | 11,839,904 |
|
| Total Cash and Cash Equivalents (11.6% of net assets) | | | | | | 41,433,301 |
| | 41,433,301 |
|
| Total Portfolio Investments, Cash and Cash Equivalents (186.4% of net assets) | | | | | | $ | 674,950,258 |
| | $ | 665,080,775 |
|
|
| | | | | | | | | | | | | | | | |
| Portfolio Company/Type of Investment (1)(2)(9)(10)(17)(19) | | Cash Interest Rate (8) | | Industry | | Principal (5) |
| | Cost | | Fair Value |
| Digital River, Inc. | | | | Internet software & services | | | | | | |
| First Lien Term Loan, LIBOR+6.5% (1% floor) cash due 2/12/2021 (8)(13) | | 7.50% | | | | $ | 4,523,868 |
| | $ | 4,349,859 |
| | $ | 4,515,386 |
|
| | | | | | | | | 4,349,859 |
| | 4,515,386 |
|
| Research Now Group, Inc. | | | | Data processing & outsourced services | | | | | | |
| Second Lien Term Loan, LIBOR+8.75% (1% floor) cash due 3/18/2022 (8) | | 9.75% | | | | 4,000,000 |
| | 3,953,571 |
| | 3,880,000 |
|
| | | | | | | | | 3,953,571 |
| | 3,880,000 |
|
| Fineline Technologies, Inc. | | | | Electronic equipment & instruments | | | | | | |
| First Lien Term Loan, LIBOR+5.5% (1% floor) cash due 5/5/2017 (8)(13) | | 6.50% | | | | 10,942,464 |
| | 10,942,464 |
| | 10,912,302 |
|
| | | | | | | | | 10,942,464 |
| | 10,912,302 |
|
| My Alarm Center, LLC | | | | Security & alarm services | | | | | | |
| First Lien Term Loan A, LIBOR+8% (1% floor) cash due 1/9/2019 (8)(13) | | 9.00% | | | | 16,047,619 |
| | 16,047,619 |
| | 16,075,921 |
|
| First Lien Term Loan B, LIBOR+8% (1% floor) cash due 1/9/2019 (8) | | 9.00% | | | | 909,936 |
| | 909,936 |
| | 911,452 |
|
| First Lien Term Loan C, LIBOR+8% (1% floor) cash due 1/9/2019 (8) | | 9.00% | | | | 757,592 |
| | 757,592 |
| | 757,750 |
|
| First Lien Term Revolver, LIBOR+8% (1% floor) cash due 1/9/2019 (8) | | 9.00% | | | | 120,000 |
| | 120,000 |
| | 120,000 |
|
| | | | | | | | | 17,835,147 |
| | 17,865,123 |
|
| Legalzoom.com, Inc. | | | | Specialized consumer services | | | | | | |
| First Lien Term Loan, LIBOR+7% (1% floor) cash due 5/13/2020 (8)(13) | | 8.00% | | | | 19,700,000 |
| | 19,690,068 |
| | 19,659,526 |
|
| First Lien Revolver, LIBOR+7% (1% floor) cash due 5/13/2020 (8)(11) | | 8.00% | | | | | | (17,714 | ) | | — |
|
| First Lien Delayed Draw Term Loan, LIBOR+7% (1% floor) cash due 5/13/2020 (8) | | 8.00% | | | | 400,000 |
| | 400,000 |
| | 396,683 |
|
| | | | | | | | | 20,072,354 |
| | 20,056,209 |
|
| Raley's | | | | Food retail | | | | | | |
| First Lien Term Loan, LIBOR+6.25% (1% floor) cash due 5/18/2022 (8)(13) | | 7.25% | | | | 3,319,504 |
| | 3,254,099 |
| | 3,325,728 |
|
| | | | | | | | | 3,254,099 |
| | 3,325,728 |
|
| Aptos, Inc. | | | | Data processing & outsourced services | | | | | | |
| First Lien Term Loan, LIBOR+6.75% (1% floor) cash due 9/1/2022 (8)(13) | | 7.75% | | | | 6,000,000 |
| | 5,881,667 |
| | 5,940,000 |
|
| | | | | | | | | 5,881,667 |
| | 5,940,000 |
|
| All Web Leads, Inc. | | | | Advertising | | | | | | |
| First Lien Term Loan, LIBOR+6.5% (1% floor) cash due 6/30/2020 (8)(13) | | 7.50% | | | | 29,808,067 |
| | 29,808,066 |
| | 29,983,454 |
|
| First Lien Revolver, LIBOR+6.5% (1% floor) cash due 6/30/2020 (8) | | 7.50% | | | | | | — |
| | — |
|
| | | | | | | | | 29,808,066 |
| | 29,983,454 |
|
| Too Faced Cosmetics, LLC | | | | Personal products | | | | | | |
| First Lien Term Loan, LIBOR+5% (1% floor) cash due 7/7/2021 (8)(13) | | 6.00% | | | | 1,285,383 |
| | 1,285,383 |
| | 1,290,310 |
|
| | | | | | | | | 1,285,383 |
| | 1,290,310 |
|
| Internet Pipeline, Inc. | | | | Internet software & services | | | | | | |
| First Lien Term Loan, LIBOR+7.25% (1% floor) cash due 8/4/2022 (8)(13) | | 8.25% | | | | 11,880,000 |
| | 11,880,000 |
| | 12,045,801 |
|
| First Lien Revolver, LIBOR+7.25% (1% floor) cash due 8/4/2021 (8) | | 8.25% | | | | | | — |
| | — |
|
| | | | | | | | | 11,880,000 |
| | 12,045,801 |
|
See notes to Consolidated Financial Statements.
Fifth Street Senior Floating Rate Corp.Oaktree Strategic Income Corporation
Consolidated Schedule of Investments
September 30, 20152016
|
| | | | | | | | | | | | | | | | |
| Portfolio Company/Type of Investment (1)(2)(9)(10)(17)(19) | | Cash Interest Rate (8) | | Industry | | Principal (5) |
| | Cost | | Fair Value |
| Poseidon Merger Sub, Inc. | | | | Advertising | | | | | | |
| Second Lien Term Loan, LIBOR+8.5% (1% floor) cash due 8/15/2023 (8) | | 9.50% | | | | $ | 7,000,000 |
| | $ | 6,980,768 |
| | $ | 7,012,868 |
|
| | | | | | | | | 6,980,768 |
| | 7,012,868 |
|
| American Seafoods Group LLC | | | | Food distributors | | | | | | |
| First Lien Term Loan, LIBOR+5% (1% floor) cash due 8/19/2021 (8)(13) | | 6.00% | | | | 2,780,556 |
| | 2,736,111 |
| | 2,773,604 |
|
| Second Lien Term Loan, LIBOR+9% (1% floor) cash due 2/19/2022 (8) | | 10.00% | | | | 3,000,000 |
| | 2,975,385 |
| | 2,850,000 |
|
| | | | | | | | | 5,711,496 |
| | 5,623,604 |
|
| CRGT Inc. | | | | IT consulting & other services | | | | | | |
| First Lien Term Loan, LIBOR+6.5% (1% floor) cash due 12/19/2020 (8)(13) | | 7.50% | | | | 3,440,713 |
| | 3,433,096 |
| | 3,449,315 |
|
| | | | | | | | | 3,433,096 |
| | 3,449,315 |
|
| Valet Merger Sub, Inc. | | | | Environmental & facilities services | | | | | | |
| First Lien Term Loan, LIBOR+7% (1% floor) cash due 9/24/2021 (8)(13) | | 8.00% | | | | 5,940,000 |
| | 5,905,025 |
| | 6,040,239 |
|
| First Lien Revolver, LIBOR+7% (1% floor) cash due 9/24/2021 (8) | | 8.00% | | | | 500,000 |
| | 486,811 |
| | 500,000 |
|
| | | | | | | | | 6,391,836 |
| | 6,540,239 |
|
| Baart Programs, Inc. | | | | Healthcare services | | | | | | |
| First Lien Term Loan, LIBOR+7.75% cash due 10/9/2021 (8)(13) | | 8.42% | | | | 7,661,077 |
| | 7,377,745 |
| | 7,647,291 |
|
| First Lien Revolver, LIBOR+7.75% cash due 10/9/2021 (8)(11) | | 8.42% | | | | | | (12,500 | ) | | — |
|
| | | | | | | | | 7,365,245 |
| | 7,647,291 |
|
| DigiCert, Inc. | | | | Internet software & services | | | | | | |
| Second Lien Term Loan, LIBOR+9% (1% floor) cash due 10/21/2022 (8) | | 10.00% | | | | 2,000,000 |
| | 1,982,857 |
| | 2,032,529 |
|
| | | | | | | | | 1,982,857 |
| | 2,032,529 |
|
| Lytx, Inc. | | | | Research & consulting services | | | | | | |
| First Lien Term Loan, LIBOR+8.5% (1% floor) cash due 3/15/2023 (8) | | 9.50% | | | | 9,951,389 |
| | 9,951,389 |
| | 9,951,389 |
|
| 500 Class A Units in Lytx Holdings, LLC | | | | | | | | 500,000 |
| | 504,173 |
|
| | | | | | | | | 10,451,389 |
| | 10,455,562 |
|
| Onvoy, LLC | | | | Integrated telecommunication services | | | | | | |
| First Lien Term Loan, LIBOR+6.25% (1% floor) cash due 4/29/2021 (8)(13) | | 7.25% | | | | 10,368,750 |
| | 10,173,233 |
| | 10,341,433 |
|
| | | | | | | | | 10,173,233 |
| | 10,341,433 |
|
| 4 Over International, LLC | | | | Commercial printing | | | | | | |
| First Lien Term Loan, LIBOR+6.0% (1% floor) cash due 6/7/2022 (8)(13) | | 7.00% | | | | 5,970,000 |
| | 5,913,333 |
| | 5,929,733 |
|
| First Lien Revolver LIBOR+6.0% (1% floor) cash due 6/7/2021 (8)(11) | | 7.00% | | | | | | (639 | ) | | — |
|
| | | | | | | | | 5,912,694 |
| | 5,929,733 |
|
| OBHG Management Services, LLC | | | | Healthcare services | | | | | | |
| First Lien Term Loan, LIBOR+5.25% (1% floor) cash due 6/28/2022 (8)(13) | | 6.25% | | | | 16,123,227 |
| | 16,117,309 |
| | 16,076,397 |
|
| First Lien Revolver, LIBOR+5.25% (1% floor) cash due 6/28/2021 (8)(11) | | 6.25% | | | | | | (39 | ) | | — |
|
| | | | | | | | | 16,117,270 |
| | 16,076,397 |
|
| Ancile Solutions, Inc. | | | | Internet software & services | | | | | | |
| First Lien Term Loan, LIBOR+7% (1% floor) cash due 6/30/2021 (8)(13) | | 8.00% | | | | 11,000,000 |
| | 10,692,000 |
| | 10,835,000 |
|
| | | | | | | | | 10,692,000 |
| | 10,835,000 |
|
| See notes to Consolidated Financial Statements. |
Oaktree Strategic Income Corporation
Consolidated Schedule of Investments
September 30, 2016
|
| | | | | | | | | | | | | | | | |
| Portfolio Company/Type of Investment (1)(2)(9)(10)(17)(19) | | Cash Interest Rate (8) | | Industry | | Principal (5) |
| | Cost | | Fair Value |
| Pomeroy Group Holdings, Inc. | | | | IT consulting & other services | | | | | | |
| First Lien Term Loan, LIBOR+6% (1% floor) cash due 11/30/2021 (8)(13) | | 7.00% | | | | $ | 4,488,693 |
| | $ | 4,357,979 |
| | $ | 4,393,309 |
|
| | | | | | | | | 4,357,979 |
| | 4,393,309 |
|
| Sailpoint Technologies, Inc. | | | | Application software | | | | | | |
| First Lien Term Loan, LIBOR+8% (1% floor) cash due 8/16/2021 (8) | | 9.00% | | | | 12,500,000 |
| | 12,258,333 |
| | 12,250,000 |
|
| First Lien Revolver, LIBOR+8% (1% floor) cash due 8/16/2021 (8)(11) | | 9.00% | | | | | | (3,867 | ) | | — |
|
| | | | | | | | | 12,254,466 |
| | 12,250,000 |
|
| California Pizza Kitchen, Inc. (16) | | | | Restaurants | | | | | | |
| First Lien Term Loan, LIBOR+6% (1% floor) cash due 8/23/2022 (8) | | 7.00% | | | | 5,000,000 |
| | 5,000,000 |
| | 4,985,425 |
|
| | | | | | | | | 5,000,000 |
| | 4,985,425 |
|
| Total Non-Control/Non-Affiliate Investments (152.6% of net assets) | | | | | | | | $ | 513,397,659 |
| | $ | 497,281,256 |
|
| Total Portfolio Investments (176.0% of net assets) | | | | | | | | $ | 600,468,963 |
| | $ | 573,604,381 |
|
| Cash and Cash Equivalents | | | | | | | | | | |
Wells Fargo Bank Institutional Money Market Fund
| | | | | | | | $ | 18,856,559 |
| | $ | 18,856,559 |
|
| Other cash accounts | | | | | | | | 922,282 |
| | 922,282 |
|
| Total Cash and Cash Equivalents (6.1% of net assets) | | | | | | | | $ | 19,778,841 |
| | $ | 19,778,841 |
|
| Total Portfolio Investments, Cash and Cash Equivalents (182.1% of net assets) | | | | | | | | $ | 620,247,804 |
| | $ | 593,383,222 |
|
See notes to Consolidated Financial Statements.
Oaktree Strategic Income Corporation
Consolidated Schedule of Investments
September 30, 2016
| |
| (1) | All debt investments are income producing unless otherwise noted. EquityAll equity investments are non-income producing unless otherwise noted. |
| |
| (2) | See Note 43 in the accompanying notes to the Consolidated Financial Statements for portfolio composition by geographic region. |
| |
| (3) | Control Investments generally are defined by the 1940 Act, as investments in companies in which the Company owns more than 25% of the voting securities or maintains greater than 50% of the board representation. |
| |
| (4) | Affiliate Investments generally are defined by the 1940 Act as investments in companies in which the Company owns between 5% and 25% of the voting securities. |
| |
| (5) | Principal amountincludes accumulated PIK interest and is net of repayments, if any. |
| |
| (6) | Non-Control/Non-Affiliate Investments are investments that are neither Control Investments nor Affiliate Investments. |
| |
| (7) | Investment is not a qualifying asset as defined under Section 55(a) of the 1940 Act. Under the 1940 Act, the Company may not acquire any non-qualifying asset unless, at the time the acquisition is made, qualifying assets represent at least 70% of the Company's total assets. As of September 30, 2015,2016, qualifying assets represent 87.0%represented 84.9% of the Company's total assets and non-qualifying assets represent 13.0%represented 15.1% of the Company's total assets. |
| |
| (8) | The interest rate on the principal balance outstanding for all floating rate loans is indexed to LIBOR andand/or an alternate base rate (e.g., prime rate), which typically resets semi-annually, quarterly, or monthly at the borrower's option. The borrower may also elect to have multiple interest reset periods for each loan. For each of these loans, the Company has provided the applicable margin over LIBOR or the alternate base rate based on each respective credit agreement.agreement and the cash interest rate as of period end. |
| |
| (9) | Interest rates have beenmay be adjusted from period to period on certain term loans from the stated rates in the original credit agreement as shown in the Consolidated Schedule of Investments.and revolvers. These rate adjustments aremay be either temporary in nature due to tier pricing arrangements or financial or payment covenant violations in the original credit agreements or permanent in nature per loan amendment or waiver documents. The table below summarizes these rate adjustments by portfolio company: |
|
| | | | | | |
Portfolio Company | | Effective date | | Cash interest | | Reason |
TrialCard Incorporated | | April 1, 2015 | | - 0.25% on Term Loan and Revolver | | Tier pricing per loan agreement |
Accruent, LLC | | November 14, 2014 | | + 1.50% on First Lien Term Loan | | Per loan amendment |
| |
| (10) | InvestmentEach of the Company's investments is pledged as collateral under the Company'sone or more of its credit facility, in wholefacilities or in part.its debt securitization. A single investment may be divided into parts that are individually pledged as collateral to separate credit facilities. |
| |
| (11) | Investment has undrawn commitments. A negative cost basis may result from unamortized fees. Unamortized fees are classified as unearned income which reduces cost basis, which may result in a negative cost basis. |
| |
| (12) | As defined in the 1940 Act, the Company is deemed to be both an "Affiliated Person" of and to "Control" this portfolio company as the Company owns more than 25% of the portfolio company's outstanding voting securities or has the power to exercise control over management or policies of such portfolio company (including through a management agreement). |
| |
| (13) | Investment pledged as collateral under the Company's 2015 Debt Securitization (as defined in Note 6 — Borrowings), in whole or in part. |
| |
| (14) | Income producing through payment of dividends or distributions. |
| |
| (15) | In April 2016, the Companyrestructured its debt investment in Ameritox Ltd. As a part of the restructuring, the Company exchanged cash and its debt securities for debt and equity securities in the newly restructured entity. |
| |
| (16) | The sale of this loan does not qualify for true sale accounting under Financial Accounting Standards Board ("FASB") Accounting Standards Codification ("ASC") Topic 860 - Transfers and Servicing ("ASC 860"), and therefore, the entire debt investment remains in the Consolidated Schedule of Investments. Accordingly, the fair value of the Company's debt investments includes $5.0 million related to the Company's secured borrowings. (See Note 6 in the accompanying notes to the Consolidated Financial Statements.) |
| |
| (17) | Equity ownership may be held in shares or units of companies related to the portfolio companies. |
| |
| (18) | See Note 3 to the Consolidated Financial Statements for portfolio composition. |
| |
| (19) | As of September 30, 2016, all investments are categorized as level 3 within the fair value hierarchy established by ASC 820 and were valued using significant unobservable inputs. |
See notes to Consolidated Financial Statements.
FIFTH STREET SENIOR FLOATING RATE CORP.OAKTREE STRATEGIC INCOME CORPORATION
NOTES TO CONSOLIDATED FINANCIAL STATEMENTS
Note 1. Organization
Oaktree Strategic Income Corporation (formerly known as Fifth Street Senior Floating Rate Corp. through October 17, 2017), (together with its consolidated subsidiaries, the "Company") is a specialty finance company that is a closed-end, externally managed, non-diversified management investment company andthat has elected to be regulated as a business development company under the 1940 Act. The Company has qualified and elected to be treated as a regulated investment company ("RIC") under the Internal Revenue Code of 1986, as amended (the "Code"), for tax purposes.
As of October 17, 2017, the Company is externally managed by Oaktree Capital Management, L.P., (“Oaktree” or the “Investment Adviser”), a subsidiary of Oaktree Capital Group, LLC (“OCG”), a global investment manager specializing in alternative investments, pursuant to an investment advisory agreement between the Company and the Investment Adviser (the “New Investment Advisory Agreement”). Oaktree Fund Administration, LLC (“Oaktree Administrator” or “OFA”), a subsidiary of the Investment Adviser, provides certain administrative and other services necessary for the Company to operate pursuant to an administration agreement between the Company and OFA (the “New Administration Agreement”). See Note 11 for additional information regarding the New Investment Advisory Agreement and the New Administration Agreement.
Prior to October 17, 2017, the Company was externally managed by Fifth Street Management LLC (“FSM”), an indirect, partially-owned subsidiary of Fifth Street Asset Management Inc. (“FSAM”), and FSC CT LLC ("FSC CT"), a subsidiary of FSM, also provided certain administrative and other services necessary for the Company to operate pursuant to an administration agreement (the “Prior Administration Agreement”).
The Company's investment objective isCompany seeks to maximize its portfolio's total return by generatinggenerate a stable source of current income from its debt investments while seekingminimizing the risk of principal loss and, to preserve its capital. The Company investsa lesser extent, capital appreciation by providing middle-market companies with primarily in senior secured loans, including first lien unitranche and second liensecured debt instruments,financings that pay interest at rates which are determined periodically on the basis of a floating base lending rate, made to private middle market companies whose debt is rated below investment grade.rate. The Company also has an investment in a joint venture that invests in similar types of loans. The Company may also invest in senior unsecured loans issued by private middle marketmiddle-market companies and, to a lesser extent, subordinated loans issued by private middle market companies, senior and subordinated loans issued by public companies and equity investments.
The Company is externally managed byOn July 13, 2017, Oaktree entered into an Asset Purchase Agreement (the “Purchase Agreement”) with FSM, and, for certain limited purposes, FSAM, and Fifth Street Management LLCHoldings L.P., the direct, partial owner of FSM.
On September 7, 2017, the Company held a special meeting of stockholders (the "Investment Adviser""Special Meeting"), an indirect, partially-owned subsidiary. At the Special Meeting, stockholders of the Company approved the New Investment Advisory Agreement to take effect upon the closing of the transactions contemplated by the Purchase Agreement (the “Transaction”). Upon the closing of the Transaction on October 17, 2017, Oaktree became the investment adviser to each of Oaktree Specialty Lending Corporation (formerly known as Fifth Street Asset Management Inc. ("FSAM"Finance Corp.), a publicly traded alternative asset manager, pursuant to(“OCSL”), and the Company. The closing of the Transaction resulted in an assignment for purposes of the 1940 Act of the investment advisory agreement. FSC CT LLC ("FSC CT"), a subsidiary of the Investment Adviser, also provides certain administrativeagreement between FSM and other services necessary for the Company to operate.
and, as a result, its immediate termination.
Note 2. Revision of Previously Issued Financial Statements for Correction of Immaterial Errors
The Company previously identified accounting errors from the commencement of operations through September 30, 2015 related to revenue recognition. The revenue recognition errors were the result of certain fees which were historically recognized on the deal closing date, but should have been amortized over the life of the loan since the fees did not represent a separately identifiable revenue contract. These errors were partially offset by the net overpayment of Part I and Part II incentive fees paid to the Investment Adviser. The Company assessed the materiality of the errors on its prior quarterly and annual financial statements, assessing materiality both quantitatively and qualitatively, in accordance with the Securities and Exchange Commission's ("SEC") Staff Accounting Bulletin ("SAB") No. 99 and No. 108, and concluded that the errors were not material to any of the previously issued financial statements. Under the SAB No. 99 and No. 108 framework, the Company concluded the cumulative corrections of these errors would be qualitatively material to the Company's quarterly financial statements within any quarter during the September 30, 2015 fiscal year and, therefore, it was not appropriate to recognize the cumulative corrections in any 2015 period. Accordingly, all prior period financial statements from the commencement of operations to June 30, 2015 have been revised. These errors did not impact the financial statements for the years ended September 30, 2016 and 2015, and the revisions to the Company’s financial statements had no net impact on the Company’s net cash provided by (used in) operating activities for any period presented. The following tables present a reconciliation of previously filed amounts to revised amounts to correct these errors for the year ended September 30, 2014:
|
| | | | | | | | | | | | |
| | | Year ended September 30, 2014
|
| Consolidated Statement of Operations: | | As previously reported | | Adjustment | | As revised (1) |
| Interest income | | $ | 10,130,569 |
| | $ | 346,414 |
| | $ | 10,476,983 |
|
| Fee income | | 5,712,050 |
| | (3,672,359 | ) | | 2,039,691 |
|
| Total investment income | | 15,842,619 |
| | (3,325,945 | ) | | 12,516,674 |
|
| Part I incentive fee | | 1,556,612 |
| | (848,377 | ) | | 708,235 |
|
| Part II incentive fee | | 54,826 |
| | 720,015 |
| | 774,841 |
|
| Net expenses | | 6,881,155 |
| | (128,362 | ) | | 6,752,793 |
|
| Net investment income | | 8,961,464 |
| | (3,197,583 | ) | | 5,763,881 |
|
| Net unrealized appreciation on investments | | 4,150 |
| | 2,250,492 |
| | 2,254,642 |
|
| Net realized gain on investments | | 269,981 |
| | 1,075,453 |
| | 1,345,434 |
|
| Net increase in net assets resulting from operations | | $ | 9,235,595 |
| | $ | 128,362 |
| | $ | 9,363,957 |
|
| Net investment income per common share - basic and diluted | | $ | 0.96 |
| | $ | (0.34 | ) | | $ | 0.62 |
|
| Earnings per common share - basic and diluted | | $ | 0.99 |
| | $ | 0.02 |
| | $ | 1.01 |
|
|
| | | | | | | | | | | | |
| | | Year ended September 30, 2014
|
| Consolidated Statement of Changes in Net Assets: | | As previously reported | | Adjustment | | As revised (1) |
| Net investment income | | $ | 8,961,464 |
| | $ | (3,197,583 | ) | | $ | 5,763,881 |
|
| Net unrealized appreciation on investments | | 4,150 |
| | 2,250,492 |
| | 2,254,642 |
|
| Net realized gain on investments | | 269,981 |
| | 1,075,453 |
| | 1,345,434 |
|
| Net increase in net assets resulting from operations | | 9,235,595 |
| | 128,362 |
| | 9,363,957 |
|
| Total increase in net assets | | 271,844,047 |
| | 128,362 |
| | 271,972,409 |
|
| Net assets at beginning of period | | 100,842,878 |
| | (137,609 | ) | | 100,705,269 |
|
| Net assets at end of period | | $ | 372,686,925 |
| | $ | (9,247 | ) | | $ | 372,677,678 |
|
| Net asset value per common share at period end | | $ | 12.65 |
| | $ | — |
| | $ | 12.65 |
|
|
| | | | | | | | | | | | |
| | | Year ended September 30, 2014
|
| Consolidated Statement of Cash Flows: | | As previously reported | | Adjustment | | As revised (1) |
| Net increase in net assets resulting from operations | | $ | 9,235,595 |
| | $ | 128,362 |
| | $ | 9,363,957 |
|
| Net unrealized appreciation on investments | | (4,150 | ) | | (2,250,492 | ) | | (2,254,642 | ) |
| Net realized gain on investments | | (269,981 | ) | | (1,075,453 | ) | | (1,345,434 | ) |
| Recognition of fee income | | (5,712,050 | ) | | 3,672,359 |
| | (2,039,691 | ) |
| Accretion of original issue discount on investments | | (50,074 | ) | | (346,414 | ) | | (396,488 | ) |
| Fee income received | | 5,755,018 |
| | (3,672,359 | ) | | 2,082,659 |
|
| Increase in base management fee and incentive fee payable | | 1,395,064 |
| | (128,362 | ) | | 1,266,702 |
|
| Purchases of investments and net revolver activity | | (404,197,284 | ) | | 3,672,359 |
| | (400,524,925 | ) |
| Net cash used in operating activities | | (214,529,206 | ) | | — |
| | (214,529,206 | ) |
| Net increase in cash and cash equivalents | | 55,082,929 |
| | — |
| | 55,082,929 |
|
| Cash and cash equivalents, beginning of period | | 52,346,831 |
| | — |
| | 52,346,831 |
|
| Cash and cash equivalents, end of period | | $ | 107,429,760 |
| | $ | — |
| | $ | 107,429,760 |
|
____________
(1) Revised amounts may not sum due to rounding.
Refer to Note 15 for more detail on the revised quarterly financial information for the fiscal years 2015 and 2014.
Certain prior year amounts have been reclassified to conform to current year presentation. Specifically, director fees payable were previously included within accounts payable, accrued expenses and other liabilities within the Consolidated Statements of Asset and Liabilities. Director fees payable are now reported separately in the Consolidated Statements of Assets and Liabilities.
Note 3.2. Significant Accounting Policies
Basis of Presentation:
The Consolidated Financial Statements of the Company have been prepared in accordance with accounting principles generally accepted in the United States of America ("GAAP") and pursuant to the requirements for reporting on Form 10-K and Regulation S-X. All intercompany balances and transactions have been eliminated. The Company is an investment company following the accounting and reporting guidance in Financial Accounting Standards Board ("FASB") Accounting Standards Codification ("ASC")FASB ASC Topic 946, Financial Services-InvestmentServices - Investment Companies ("ASC 946").
Use of Estimates:
The preparation of the financial statements in conformity with GAAP requires management to make certain estimates and assumptions affecting amounts reported in the financial statements and accompanying notes. These estimates are based on the information that is currently available to the Company and on various other assumptions that the Company believes to be reasonable under the circumstances. Changes in the economic and political environments, financial markets and any other parameters used in
FIFTH STREET SENIOR FLOATING RATE CORP.
NOTES TO CONSOLIDATED FINANCIAL STATEMENTS
determining these estimates could cause actual results to differ and such differences could be material. Significant estimates include the valuation of investments and revenue recognition.
Consolidation:
The accompanying Consolidated Financial Statements include the accounts of the CompanyOaktree Strategic Income Corporation and its consolidated subsidiaries. Each consolidated subsidiary is wholly-owned and, as such, consolidated into the Consolidated Financial Statements. Certain of the subsidiaries that hold investments are treated as pass through entities for tax purposes. The assets of certain of the Company's consolidated subsidiaries are not directly available to satisfy the claims of the creditors of the Company or any of its other
OAKTREE STRATEGIC INCOME CORPORATION
NOTES TO CONSOLIDATED FINANCIAL STATEMENTS
subsidiaries. As of September 30, 2017, the Company's consolidated subsidiaries were FS Senior Funding CLO LLC, FS Senior Funding II LLC and FS Senior Funding Ltd. (“2015 Issuer”).
Since the Company is an investment company, portfolio investments held by the Company and its subsidiaries are not consolidated into the Consolidated Financial Statements. The portfolio investments held by the Company and its subsidiaries are included on the Statements of Assets and Liabilities as investments at fair value.
Fair Value Measurements:
The Company is required to report its investments for which current market values are not readily available at fair value. The Company values its investments in accordance with FASB ASC 820,Fair Value Measurements and Disclosures ("ASC 820"), which defines fair value as the amount that would be received to sell an asset or paid to transfer a liability in an orderly transaction between market participants at the measurement date. A liability's fair value is defined as the amount that would be paid to transfer the liability to a new obligor, not the amount that would be paid to settle the liability with the creditor. ASC 820 prioritizes the use of observable market prices derived from such prices over entity-specific inputs. Where observable prices or inputs are not available or reliable, valuation techniques are applied. These valuation techniques involve some level of management estimation and judgment, the degree of which is dependent on the price transparency for the investments or market and the investments' complexity.
Hierarchical levels, defined by ASC 820 and directly related to the amount of subjectivity associated with the inputs to fair valuation of these assets and liabilities, are as follows:
Level 1 — Unadjusted, quoted prices in active markets for identical assets or liabilities at the measurement date.
Level 2 — Observable inputs other than Level 1 prices, such as quoted prices for similar assets or liabilities; quoted prices in markets that are not active; or other inputs that are observable or can be corroborated by observable market data at the measurement date for substantially the full term of the assets or liabilities.
Level 3 — Unobservable inputs that reflect management's best estimate of what market participants would use in pricing the asset or liability at the measurement date. Consideration is given to the risk inherent in the valuation technique and the risk inherent in the inputs to the model.
In certain cases, theIf inputs used to measure fair value may fall into different levels of the fair value hierarchy. In such cases,hierarchy an investment's level within the fair value hierarchy is based on the lowest level of input that is significant to the fair value measurement. The Company's assessment of the significance of a particular input to the fair value measurement in its entirety requires judgment, and considers factors specific to the investment. Generally, it is expected that all of the Company's investment securities will be valued using Level 3 inputs. This includes investment securities that are valued using "bid" and "ask" prices obtained from independent third party pricing services or directly from brokers. These investments are generallymay be classified as Level 3 because the quoted prices may be indicative in nature for securities that are in an inactive market, may be for similar securities or may require adjustments for investment-specific factors or restrictions.
Financial instruments with readily available quoted prices generally will have a higher degree of market price observability and a lesser degree of judgment inherent in measuring fair value. As such, the Investment Adviser's capital markets groupAdviser obtains and analyzes readily available market quotations provided by independent pricing services for all of the Company's first lien and second lien ("senior securedsecured") debt investments for which quotations are available. In determining the fair value of a particular investment, pricing services use observable market information, including both binding and non-binding indicative quotations.
The Investment Adviser evaluates the prices obtained from independent pricing services based on available market information and company specific data that could affect the credit quality and/or fair value of the investment. Investments for which market quotations are readily available may be valued at such market quotations. In order to validate market quotations, the Investment Adviser looks at a number of factors to determine if the quotations are representative of fair value, including the source and nature of the quotations. The Investment Adviser does not adjust the prices unless it has a reason to believe any such market quotations are not reflective of the fair value of an investment. Examples of events that would cause market quotations to not reflect fair value could include cases when a security trades infrequently causing a quoted purchase or sale price to become stale or in the event of a "fire sale" by a distressed seller. In these instances, the Company values such investments by using the valuation procedure that it uses with respect to assets for which market quotations are not readily available (as discussed below).
FIFTH STREET SENIOR FLOATING RATE CORP.
NOTES TO CONSOLIDATED FINANCIAL STATEMENTS
If the quotation provided by the pricing service is based on only one or two market sources, the Company performs additional procedures to corroborate such information, generally including, but not limited to,which may include the bondmarket yield approachtechnique discussed below and a quantitative and qualitative assessment of the credit quality and market trends affecting the portfolio company.
The Company performs detailed valuations of its debt and equity investments for which market quotations are not readily available or are deemed not to represent fair value of the investments. The Company typically uses twothree different valuation techniques. The first valuation technique is the transaction precedent technique, which utilizes recent or expected future transactions of the investment to determine fair value, to the extent applicable. The second valuation technique is an analysis of the enterprise value
OAKTREE STRATEGIC INCOME CORPORATION
NOTES TO CONSOLIDATED FINANCIAL STATEMENTS
("EV") of the portfolio company. EV means the entire value of the portfolio company to a market participant, including the sum of the values of debt and equity securities used to capitalize the enterprise at a point in time. The primary method for determining EV uses a multiple analysis whereby appropriate multiples are applied to the portfolio company's EBITDA (generally defined as earnings before net interest expense, income tax expense, depreciation and amortization). EBITDA multiples are typically determined based upon review of market comparable transactions and publicly traded comparable companies, if any. The Company may also employ other valuation multiples to determine EV, such as revenues. The second method for determining EV uses a discounted cash flow analysis whereby future expected cash flows of the portfolio company are discounted to determine a present value using estimated discount rates (typically a weighted average cost of capital based on costs of debt and equity consistent with current market conditions). The EV analysis is typically performed to determine the value of equity investments, and to determine if there is credit impairment for debt investments. Ifinvestments and to determine the value for debt investments are credit impaired, anthat the Company is deemed to control under the 1940 Act. To estimate the EV of a portfolio company, the Investment Adviser analyzes various factors including, the portfolio company’s historical and projected financial results, macroeconomic impacts on the company, and competitive dynamics in the company’s industry. The Investment Adviser also utilizes some or all of the following information based on the individual circumstances of the portfolio company, including: (i) valuations of comparable public companies, (ii) recent sales of private and public comparable companies in similar industries or having similar business or earnings characteristics, (iii) purchase price multiples as a multiple of their earnings or cash flow, (iv) the portfolio company’s ability to meet its forecasts and its business prospects, (v) a discounted cash flow analysis, (vi) estimated liquidation or collateral value of the portfolio company's assets and (vii) offers from third parties to buy the portfolio company. The Company may be usedprobability weight potential sale outcomes with respect to value such debt investments; however, in additiona portfolio company due to the methods outlined above, other alternative methods suchuncertainty that exists as an asset liquidation model, expected recovery model or a recent observable or pending transaction may be utilized to estimate EV.of the valuation date. The secondthird valuation technique is a bondmarket yield approach,technique, which is typically performed for non-credit impaired debt investments. To determine fair value using a bondmarket yield approach,technique, a current price is imputed for the investment based upon an assessment of the expected market yield for a similarly structured investment with a similar level of risk. In the bondmarket yield approach,technique, the Company considers the current contractual interest rate, the capital structure and other terms of the investment relative to risk of the company and the specific investment. A key determinant of risk, among other things, is the leverage through the investment relative to the EV of the portfolio company. As debt investments held by the Company are substantially illiquid with no active transaction market, the Company depends on primary market data, including newly funded transactions and industry specific market movements, as well as secondary market data with respect to high yield debt instruments and syndicated loans, as inputs in determining the appropriate market yield, as applicable.
In accordance with ASC 820-10, certain investments that qualify as investment companies in accordance with ASC 946 may be valued using net asset value as a practical expedient for fair value. Consistent with FASB guidance under ASC 820, these investments are excluded from the hierarchical levels.
The Company estimates the fair value of privately held warrants using a Black Scholes pricing model, which includes an analysis of various factors and subjective assumptions including the current stock price (by analyzing the portfolio company's operating performance and financial condition and general market conditions)using an EV analysis as described above), the expected period until exercise, expected volatility of the underlying stock price, expected dividends and the risk free rate. Changes in the subjective input assumptions can materially affect the fair value estimates.
The Company's Board of Directors undertakes a multi-step valuation process each quarter in connection with determining the fair value of the Company's investments:
The quarterly valuation process begins with each portfolio company or investment being initially valued by the Investment Adviser's valuation team in conjunction with the Investment Adviser's portfolio management team and capital markets teams;investment professionals responsible for each portfolio investment;
•Preliminary valuations are then reviewed and discussed with principalsmanagement of the Investment Adviser;
Separately, independent valuation firms engaged by the Board of Directors prepare valuations of the Company's investments, on a selected basis, for which market quotations are not readily available or are readily available but deemed not reflective of the fair value of the investment, and submit the reports to the Company and provide such reports to the Investment Adviser and the Audit Committee of the Board of Directors;
The Investment Adviser compares and contrasts its preliminary valuations to the valuations of the independent valuation firms and prepares a valuation report for the Audit Committee of the Board of Directors;
The Audit Committee of the Board of Directors reviews the preliminary valuations with the portfolio managers of the Investment Adviser, and the Investment Adviser responds and supplements the preliminary valuations to reflect any discussions between the Investment Adviser and the Audit Committee;
The Audit Committee of the Board of Directors makes a recommendation to the Board of Directors regarding the fair value of the investments in the Company's portfolio for which market quotations are not readily available;portfolio; and
The Board of Directors discusses valuations and determines the fair value of each investment in the Company's portfolio for which market quotations are not readily available in good faith.portfolio.
The fair value of each of the Company's investments at September 30, 20162017 and September 30, 20152016 was determined in good faith by the Board of Directors. The Board of Directors has authorized the engagement of independent valuation firms to provide
FIFTH STREET SENIOR FLOATING RATE CORP.
NOTES TO CONSOLIDATED FINANCIAL STATEMENTS
valuation assistance. The Company will continue to engage independent valuation firms to provide assistance regarding the determination of the fair value of a portion of the Company's portfolio securities for which market quotations are not readily available or are readily available but deemed not reflective of the fair value of the investment each quarter.quarter, and the Board of Directors may reasonably rely on that assistance. As of September 30, 2016, 86.5%2017, 84.5% of the Company's portfolio at fair value was valued either using market quotations or
OAKTREE STRATEGIC INCOME CORPORATION
NOTES TO CONSOLIDATED FINANCIAL STATEMENTS
by independent valuation firms. The percentage of ourthe Company's portfolio valued by independent valuation firms may vary from period to period based on the availability of market quotations for ourthe portfolio investments during the respective periods. However, the Board of Directors is ultimately and solely responsible for the ultimate valuation of the portfolio investments at fair value as determined in good faith pursuant to the Company's valuation policy and a consistently applied valuation process.
Investment Income:
Interest Income
Interest income, adjusted for accretion of original issue discount ("OID"), is recorded on an accrual basis to the extent that such amounts are expected to be collected. The Company stops accruing interest on investments when it is determined that interest is no longer collectible. Investments that are expected to pay regularly scheduled interest in cash are generally placed on non-accrual status when there is reasonable doubt that principal or interest cash payments will be collected. Cash interest payments received on investments may be recognized as income or a return of capital depending upon management’s judgment. Such non-accrual investments are restored to accrual status if past due principal and interest are paid in cash, and the portfolio companies, in management's judgment, are likely to continue timely payment of their remaining interest.
In connection with its investment in a portfolio company, the Company sometimes receives nominal cost equity that is valued as part of the negotiation process with the particular portfolio company. When the Company receives nominal cost equity, the Company allocates its cost basis in itsthe investment between its debt securities and itsthe nominal cost equity at the time of origination. Any resulting discount from recording the loan, or otherwise purchasing a security at a discount, is accreted into interest income over the life of the loan.
For the Company’s secured borrowings, the interest earned on the entire loan balance is recorded within interest income and the interest earned by the buyer from the partial loan sales is recorded within interest expense in the Consolidated Statements of Operations.
PIK Interest Income
The Company's investments in debt securities may contain PIK interest provisions. PIK interest, which represents contractually deferred interest added to the loan balance that is generally due at the end of the loan term, is generally recorded on the accrual basis to the extent such amounts are expected to be collected. The Company generally ceases accruing PIK interest if there is insufficient value to support the accrual or if the Company does not expect the portfolio company to be able to pay all principal and interest due. The Company's decision to cease accruing PIK interest involves subjective judgments and determinations based on available information about a particular portfolio company, including whether the portfolio company is current with respect to its payment of principal and interest on its loans and debt securities; financial statements and financial projections for the portfolio company; the Company's assessment of the portfolio company's business development success; information obtained by the Company in connection with periodic formal update interviews with the portfolio company's management and, if appropriate, the private equity sponsor; and information about the general economic and market conditions in which the portfolio company operates. Based on this and other information, the Company determines whether to cease accruing PIK interest on a loan or debt security. The Company's determination to cease accruing PIK interest on a loan or debt security is generally made well before the Company's full write-down of such loan or debt security. In addition, if it is subsequently determined that the Company will not be able to collect any previously accrued PIK interest, the fair value of the loans or debt securities would be reduced by the amount of such previously accrued, but uncollectible, PIK interest. The accrual of PIK interest on the Company’s debt investments increases the recorded cost bases of these investments in the consolidated financial statements and, as a result, increases the cost bases of these investments for purposes of computing the capital gain incentive fee payable by the Company to the Investment Adviser. To maintain its status as a RIC, income from PIK interest must be paid out to the Company’s stockholders as distributions, even though the Company has not yet collected the cash and may never collect the cash relating to the PIK interest.
Fee Income
The Company receives a variety of fees in the ordinary course of business, including servicing, advisory, amendment, structuring and prepayment fees, which are classified as fee income and recognized as they are earned.
Dividend Income
The Company generally recognizes dividend income on the ex-dividend date. Distributions received from equity investments are evaluated to determine if the distribution should be recorded as dividend income or a return of capital. Generally, the Company will not record distributions from such equity investments as dividend income unless there are sufficient earnings at the portfolio company prior to the distribution. Distributions that are classified as a return of capital are recorded as a reduction in the cost basis of the investment.
OAKTREE STRATEGIC INCOME CORPORATION
NOTES TO CONSOLIDATED FINANCIAL STATEMENTS
During the year ended September 30, 2017, the Company reversed $0.6 million of dividend income previously recorded in prior periods. The Company has investments in debt securities which contain PIK interest provisions. PIK interest is computed at the contractual rate specified in each investment agreement and added to the principal balance of the investment and recorded as income. The Company stops accruing PIK interest on investments when it is determined that PIK interest issuch dividend receivable balance may no longer be collectible.
Fee income consists of the monthly servicing fees, advisory fees, amendment fees, structuring fees and prepayment fees that the Company receives in connection with its debt investments. These fees are recognized as earned.
Cash and Cash Equivalents:Equivalents and Restricted Cash:
Cash and cash equivalents and restricted cash consist of demand deposits and highly liquid investments with maturities of three months or less, when acquired. The Company places its cash and cash equivalents and restricted cash with financial institutions and, at times, cash held in bank accounts may exceed the Federal Deposit Insurance Corporation ("FDIC") insuredinsurance limit. Cash and cash equivalents are classified as Level 1 assets and are included on the Company's Consolidated Schedule of Investments.
Restricted Cash:As of September 30, 2017, included in restricted cash was $7.4 million that was held at Wells Fargo Bank, N.A. in connection with the Company's Citibank facility and 2015 Debt Securitization (as defined in Note 6— Borrowings). Pursuant to the terms of the Citibank facility, the Company was restricted in terms of access to $2.0 million of that amount until such time as the Company submits its required monthly reporting schedules. As of September 30, 2017, $5.4 million of cash held in connection with the 2015 Debt Securitization was restricted due to the obligation to pay interest on the notes under the terms of the 2015 Debt Securitization.
As of September 30, 2016, included in restricted cash was $9.0 million that was held at Wells Fargo Bank, N.A. in connection with the Company's Citibank facility and 2015 Debt Securitization (as defined in Note 7— Borrowings).Securitization. Pursuant to the terms of the Citibank facility, the Company iswas restricted in terms of access to $3.5 million until such time as the Company submits its required monthly reporting schedules. As of September 30, 2016, $5.5 million of cash held in connection with the 2015 Debt Securitization was restricted.
As of September 30, 2015, included in restricted cash was $11.3 million that was held at Wells Fargo Bank, N.A. and U.S. Bank, National Association in connection withdue to the Company's Citibank facility and 2015 Debt Securitization (as defined in Note 7— Borrowings). Pursuantobligation to pay interest on the notes under the terms of the Citibank facility, the Company is restricted in terms of access to $3.0 million until such time as the Company submits its required monthly reporting schedules. As of September 30, 2015, $8.3 million of cash held in connection with the 2015 Debt Securitization was restricted.Securitization.
Due from Portfolio Companies:
Due from portfolio companies consists of amounts payable to the Company from its portfolio companies, excluding those amounts attributable to interest, dividends or fees receivable. These amounts are recognized as they become payable to the Company (e.g., principal payments on the scheduled amortization payment date).
Receivables/Payables fromFrom Unsettled Transactions:
Receivables/payables from unsettled transactions consists of amounts receivable to or payable by the Company for transactions that have not settled at the reporting date.
FIFTH STREET SENIOR FLOATING RATE CORP.
NOTES TO CONSOLIDATED FINANCIAL STATEMENTS
Deferred Financing Costs:
In April 2015, the FASB issued ASU 2015-03, Interest-Imputation of Interest (Subtopic 835-30): Simplifying the Presentation of Debt Issuance Costs which requires debt financing costs related to a recognized debt liability to be presented on the balance sheet as a direct deduction from the related debt liability, similar to the presentation of debt discounts. Additionally, in August 2015, the FASB issued ASU 2015-15, Interest - Imputation of Interest: Presentation and Subsequent Measurement of Debt Issuance Costs Associated with Line-of-Credit Arrangements, which provides further clarification on the same topic and states that the Securities and Exchange Commission ("SEC") would not object to the deferral and presentation of debt issuance costs as an asset and subsequent amortization of the deferred costs over the term of the line-of-credit arrangement, regardless of whether there are any outstanding borrowings on the line-of-credit arrangement. The Company adopted the guidance for debt arrangements that are not line-of-credit arrangements for the three months ended December 31, 2016 and applied a retrospective approach. As a result of the adoption, the Company reclassified $2.5 million of deferred financing costs assets to a direct deduction from the related debt liability on the Statement of Assets and Liabilities as of September 30, 2016. The adoption of this guidance had no impact on net assets or the Consolidated Statement of Operations.
Deferred financing costs consist of fees and expenses paid in connection with the closing or amending of the Company's credit facilities and debt securitization andofferings. Deferred financing costs in connection with credit facilities are capitalized as an asset at the time of payment. Deferred financing costs in connection with all other debt arrangements are a direct deduction from the related debt liability at the time of payment. Deferred financing costs are amortized either using the straight line method or effective interest method over the terms of the respective creditdebt arrangement, as appropriate. This amortization expense is included in interest expense in the Company's Consolidated Statements of Operations. Upon early termination or modification of a credit facility, the remaining balanceall or a portion of unamortized fees related to such facility ismay be accelerated into interest expense.
Offering Costs:
Offering costs consist of fees and expenses incurred in connection with the offer and sale of the Company's common stock,securities, including legal, accounting and printing fees. The Company charges offering costs to capital at the time of an offering. There were no offering costs charged to capital during the yearyears ended September 30, 2016. There were $0.1 million of offering costs charged to capital during the year ended2017 and September 30, 2015.2016.
OAKTREE STRATEGIC INCOME CORPORATION
NOTES TO CONSOLIDATED FINANCIAL STATEMENTS
Amounts Payable to Syndication Partners:
The Company acts as administrative agent for certain loans it originates and then syndicates. As administrative agent, the Company receives interest, principal and/or other payments from borrowers that getsare redistributed to syndication partners. If not redistributed by the reporting date, such amounts are classified as restricted cash and a payable is recorded to syndication partners on the Consolidated Statements of Assets and Liabilities.
Secured Borrowings:
The Company follows the guidance in ASC 860 when accounting for loan participations and other partial loan sales. Such guidance provides accounting and reporting standards for transfers and servicing of financial assets and requires a participation or other partial loan sales to meet the definition of a "participating interest," as defined in the guidance, in order for sale treatment to be allowed. Participations or other loan sales which do not meet the definition of a participating interest or which are not eligible for sale accounting remain on the Company's Consolidated Statements of Assets and Liabilities and the proceeds are recorded as a secured borrowingsborrowing until the definition is met. Secured borrowings are carried at fair value to correspond with the related investments, which are carried at fair value. See Note 76 for additional information.
Fair Value Option:
The Company adopted certain principles under FASB ASC Topic 825 Financial Instruments - Fair Value Option ("ASC 825") and elected the fair value option for its secured borrowings under FSAB ASC Topic 825 Financial Instruments - Fair Value Option ("ASC 825"), which had a cost basis of $5.0 million in the aggregate as of September 30, 2016.borrowings. The Company believes that by electing the fair value option for these financial instruments, it provides consistent measurement of the assets and liabilities which relate to the loan sales mentioned above.
However, the Company has not elected the fair value option to report other selected financial assets and liabilities at fair value. With the exception of the line items entitled "deferred financing costs", "credit facilities payable", and "notes payable," which are reported at amortized cost, all assets and liabilities approximate fair value on the Consolidated Statement of Assets and Liabilities. The carrying value of the line items titled "interest, dividends, and fees receivable," "due from portfolio companies," "receivables from unsettled transactions," "accounts payable, accrued expenses and other liabilities," "base management fee and incentive fee payable," "due to FSC CT," "directors fees payable," "interest payable," "amounts payable to syndication partners," "director fees payable" and "payables from unsettled transactions" approximate fair value due to their short maturities.
Income Taxes:
The Company has elected to be subject to tax as a RIC under Subchapter M of the Code and operates in a manner so as to qualify for the tax treatment applicable to RICs. In order to be subject to tax as a RIC, among other things, the Company is required to meet certain source of income and asset diversification requirements and timely distribute dividends to its stockholders of an amount generally at least equal to 90% of investment company taxable income, as defined by the Code and determined without regard to any deduction for dividends paid, for each taxable year. As a RIC, the Company is not subject to federal income tax on the portion of its taxable income and gains distributed currently to stockholders as a dividend. Depending on the level of taxable income earned during a taxable year, the Company may choose to retain taxable income in excess of current year dividend distributions and would distribute such taxable income in the next taxable year. The Company would then payincur a 4% excise tax on such income, as required. To the extent that the Company determines that its estimated current year annual taxable income, determined on a calendar year basis, could exceed estimated current calendar year dividend distributions, the Company accrues excise tax, if any, on estimated excess taxable income as taxable income is earned. The Company anticipates timely distribution of its taxable income in accordance withwithin the tax rules; however,
FIFTH STREET SENIOR FLOATING RATE CORP.
NOTES TO CONSOLIDATED FINANCIAL STATEMENTS
rules under Subchapter M of the Company incurred a de minimis federal excise tax for calendar year 2013.Code. The Company did not incur a U.S. federal excise tax for calendar years 20142015 and 20152016 and does not expect to incur a U.S. federal excise tax for calendar year 2016.2017. The Company may incur a U.S. federal excise tax in future years.
The Company holds certain portfolio investments through taxable subsidiaries. The purpose of the Company's taxable subsidiaries is to permit the Company to hold equity investments in portfolio companies which are "pass through" entities for U.S. federal income tax purposes in order to comply with the "source income" requirements contained in the RIC tax requirements. The taxable subsidiaries are consolidated for financial reporting purposes, and portfolio investments held by them are included in the Company’s consolidated financial statementsConsolidated Financial Statements as portfolio investments and recorded at fair value. The taxable subsidiaries are not consolidated with the Company for U.S. federal income tax purposes and may generate income tax expense, or benefit, and the related tax assets and liabilities, as a result of their ownership of certain portfolio investments. This income tax expense, if any, would be reflected in the Company's Consolidated Statements of Operations. The Company uses the asset and liability method to account for its taxable subsidiaries' income taxes. Using this method, the Company recognizes deferred tax assets and liabilities for the estimated future tax effects attributable to temporary differences between financial reporting and tax bases of assets and liabilities. In addition, the Company recognizes deferred tax benefits associated with net operating loss carry forwards that it may use to offset future tax obligations. The Company measures deferred tax
OAKTREE STRATEGIC INCOME CORPORATION
NOTES TO CONSOLIDATED FINANCIAL STATEMENTS
assets and liabilities using the enacted tax rates expected to apply to taxable income in the years in which it expects to recover or settle those temporary differences.
FASB ASC Topic 740 Accounting for Uncertainty in Income Taxes ("ASC 740") provides guidance for how uncertain tax positions should be recognized, measured, presented, and disclosed in the Company's Consolidated Financial Statements. ASC 740 requires the evaluation of tax positions taken or expected to be taken in the course of preparing the Company's tax returns to determine whether the tax positions are "more-likely-than-not" of being sustained by the applicable tax authority. Tax positions not deemed to meet the more-likely-than-not threshold are recorded as a tax benefit or expense in the current year. Management's determinations regarding ASC 740 may be subject to review and adjustment at a later date based upon factors including, but not limited to, an ongoing analysis of tax laws, regulations and interpretations thereof. The Company recognizes the tax benefits of uncertain tax positions only where the position is "more likely than not" to be sustained assuming examination by tax authorities. Management has analyzed the Company's tax positions, and has concluded that no liability for unrecognized tax benefits should be recorded related to uncertain tax positions taken on returns filed for open tax years 2013, 2014, 2015 or 2015.2016. The Company identifies its major tax jurisdictions as U.S. Federal and Connecticut, and the Company is not aware of any tax positions for which it is reasonably possible that the total amounts of unrecognized tax benefits will change materially in the next 12 months.
Recent Accounting Pronouncements:
In May 2014, the FASB issued ASU 2014-09, Revenue from Contracts with Customers("ASU 2014-09"), which requires an entity to recognize the amount of revenue to which it expects to be entitled for the transfer of promised goods or services to customers. ASU 2014-09 will replace most existing revenue recognition guidance in GAAP when it becomes effective. In March 2016, the FASB issued ASU 2016-08, Revenue from Contracts with Customers (Topic 606) - Principal versus Agent Considerations. This ASU is intended to clarify revenue recognition accounting when a third party is involved in providing goods or services to a customer. In April 2016, the FASB issued ASU 2016-10, Revenue from Contracts with Customers (Topic 606) - Identifying Performance Obligations and Licensing. This ASU is intended to clarify two aspects of Topic 606: identifying performance obligations and licensing implementation guidance. In May 2016, the FASB issued ASU 2016-12, Revenue from Contracts with Customers (Topic 606) - Narrow-Scope Improvements and Practical Expedients. This ASU amends certain aspects of ASU 2014-09, addresses certain implementation issues identified and clarifies the new revenue standards’ core revenue recognition principles. The new standards will be effective for the Company on JanuaryOctober 1, 2018 and early adoption is permitted on the original effective date of January 1, 2017. The standard permits the use of either the retrospective or cumulative effect transition method. The Company is evaluating the effect that new standards will have on its consolidated financial statements and related disclosures. The Company has not yet selected a transition method nor has it determined the effect of this standard on its Consolidated Financial Statements and related disclosures and its ongoing financial reporting.
In April 2015,August 2014, the FASB issued ASU 2014-15, ASU 2015-03, Interest-Imputation of Interest (Subtopic 835-30): Simplifying the Presentation of Debt Issuance CostsFinancial Statements - Going Concern,, that which requires debt issuance costs (deferred financing costs) relatedmanagement to evaluate, at each annual and interim reporting period, a recognized debt liabilitycompany's ability to be presented on the balance sheetcontinue as a direct deduction fromgoing concern within one year of the date the financial statements are issued and provide related debt liability, similar todisclosures. The Company adopted ASU 2014-16 on a prospective basis during the presentation of debt discounts. The update is effective for fiscal years beginning after December 15, 2015year ended September 30, 2017 and interim periods within those fiscal years. Additionally, in Augustdetermined that the adoption did not have a material impact on its Consolidated Financial Statements.
In May 2015, the FASB issued ASU 2015-15, which provides further clarification on2015-07, Disclosures for Investments in Certain Entities That Calculate Net Asset Value per Share (or Its Equivalent). The update eliminates the same topicrequirement to categorize investments in the fair value hierarchy if their fair value is measured at net asset value (NAV) per share (or its equivalent) using the practical expedient in the FASB’s fair value measurement guidance. Public companies are required to apply ASU 2015-07 retrospectively for interim and statesannual reporting periods beginning after December 15, 2015. Accordingly, the Company adopted ASU 2015-07 during the three months ended December 31, 2016 and determined that the SEC wouldadoption did not object to the deferral and presentation of debt issuance costs as an asset and subsequent amortization of the deferred costs over the term of the line-of-credit arrangement, regardless of whether there are any outstanding borrowings on the line-of-credit arrangement. This guidance is not expected to have a material effect on the consolidated financial statements as it will result only in a reclassification on the Consolidated Statements of Assets and Liabilities. Accordingly, there will be no impact on net asset value or net increase in net assets resulting from operations as a result of adoption of this guidance.its Consolidated Financial Statements.
FIFTH STREET SENIOR FLOATING RATE CORP.
NOTES TO CONSOLIDATED FINANCIAL STATEMENTS
In January 2016, the FASB issued ASU 2016-01, Financial Instruments - Overall("ASU 2016-01"), which makes limited amendments to the guidance in GAAP on the classification and measurement of financial instruments. The new standard significantly revises an entity’s accounting related to (1) the classification and measurement of investments in equity securities and (2) the presentation of certain fair value changes for financial liabilities measured at fair value. It also amends certain disclosure requirements associated with the fair value of financial instruments. ASU 2016-01 is effective for fiscal years beginning after December 15, 2017, including interim periods therein. Early adoption is permitted specifically for the amendments pertaining to the presentation of certain fair value changes for financial liabilities measured at fair value. Early adoption of all other amendments is not permitted. Upon adoption, the Company will be required to make a cumulative-effect adjustment to the Consolidated Statement of Assets and Liabilities as of the beginning of the first reporting period in which the guidance is effective. The Company did not early adopt the new guidance during the year ended September 30, 2016.2017. The Company is evaluating the effect that ASU 2016-01 will have on its Consolidated Financial Statements and related disclosures.
OAKTREE STRATEGIC INCOME CORPORATION
NOTES TO CONSOLIDATED FINANCIAL STATEMENTS
In November 2016, the FASB issued ASU 2016-18, Statement of Cash Flows (Topic 230), which requires that a statement of cash flows explain the change during the period in the total of cash, cash equivalents, and amounts generally described as restricted cash or restricted cash equivalents. Therefore, amounts generally described as restricted cash and restricted cash equivalents should be included within cash and cash equivalents when reconciling the beginning-of-period and end-of-period total amounts shown on the statement of cash flows. The new guidance is effective for interim and annual periods beginning after December 15, 2017 and early adoption is permitted. The amendment should be adopted retrospectively. The Company did not early adopt the new guidance during the year ended September 30, 2017. The new guidance is not expected to have a material effect on the Company's Consolidated Financial Statements.
Note 4.3. Portfolio Investments
At September 30, 2017, 190.9% of net assets at fair value, or $560.4 million, was invested in 67 portfolio companies, including 19.6% of net assets, or $57.6 million, in subordinated notes and limited liability company ("LLC") equity interests of FSFR Glick JV LLC (together with its consolidated subsidiaries, "FSFR Glick JV"), and 14.6% of net assets, or $43.0 million, was invested in cash and cash equivalents (including $7.4 million of restricted cash). In comparison, at September 30, 2016, 176.0% of net assets at fair value, or $573.6 million, was invested in 63 portfolio investments,companies, including 19.4% of net assets, or $63.3 million, in subordinated notes and limited liability company ("LLC")LLC equity interests of FSFR Glick JV, LLC ("FSFR Glick JV"), and 8.8% of net assets, or $28.8 million, was invested in cash and cash equivalents (including $9.0 million of restricted cash). In comparison, atAs of September 30, 2015, 174.8%2017, 89.5% of net assetsthe Company's portfolio at fair value consisted of senior secured debt investments that bore interest at floating rates and that are secured by first or $623.6 million, was investedsecond priority liens on the assets of the portfolio companies, 10.3% consisted of investments in 64 portfolio investments, including 16.0% of net assets, or $57.2 million, inthe subordinated notes and LLC equity interests of FSFR Glick JV and 14.8%0.2% consisted of net assets, or $52.7 million, was investedequity investments in cash and cash equivalents (including $11.3 million of restricted cash).other portfolio companies. As of September 30, 2016, 87.6% of the Company's portfolio at fair value consisted of senior secured debt investments that bore interest at floating rates and that are secured by first or second priority liens on the assets of the portfolio companies, 9.9% consisted of investments in the subordinated notes of FSFR Glick JV,1.1% consisted of investments in the LLC equity interests of FSFR Glick JV and 1.4% consisted of equity investments in other portfolio companies. As of September 30, 2015, 90.7% of the Company's portfolio at fair value, consisted of senior secured debt investments that bore interest at floating rates which are secured by first or second priority liens on the assets of the portfolio companies, 8.4% consisted of investments in the subordinated notes of FSFR Glick JV, 0.7% consisted of investments in the LLC equity interests of FSFR Glick JV and 0.2% consisted of equity investments on other portfolio companies.
During the years ended September 30, 2017, 2016 September 30,and 2015, and September 30, 2014, the Company recorded net unrealized appreciation (depreciation)realized gain (loss) on investments and secured borrowings of $(17.0)$(13.4) million, $(12.8) million and $2.3$0.4 million, respectively. During the years ended September 30, 2017, 2016 September 30,and 2015, and September 30, 2014, the Company recorded net realized gains (losses)unrealized depreciation on investments and secured borrowings of $(12.8)$17.8 million, $0.4$17.0 million and $1.3$12.8 million, respectively.
The composition of the Company's investments as of September 30, 20162017 and September 30, 20152016 at cost and fair value was as follows:
| | | | | September 30, 2016 | | September 30, 2015 | | September 30, 2017 | | September 30, 2016 |
| | | Cost | | Fair Value | | Cost | | Fair Value | | Cost | | Fair Value | | Cost | | Fair Value |
| Investments in debt securities (senior secured) | | $ | 518,778,491 |
| | $ | 502,385,158 |
| | $ | 574,038,984 |
| | $ | 565,526,453 |
| | $ | 523,384,267 |
| | $ | 501,769,997 |
| | $ | 518,778,491 |
| | $ | 502,385,158 |
|
| Investments in equity securities (common stock, preferred stock and warrants) | | 10,572,966 |
| | 7,902,556 |
| | 500,000 |
| | 964,100 |
| | 10,365,425 |
| | 1,059,989 |
| | 10,572,966 |
| | 7,902,556 |
|
| Debt investment in FSFR Glick JV | | 64,005,755 |
| | 56,885,646 |
| | 53,095,597 |
| | 52,603,346 |
| | 64,228,881 |
| | 57,606,674 |
| | 64,005,755 |
| | 56,885,646 |
|
| Equity investment in FSFR Glick JV | | 7,111,751 |
| | 6,431,021 |
| | 5,882,376 |
| | 4,553,575 |
| | 7,111,751 |
| | — |
| | 7,111,751 |
| | 6,431,021 |
|
| Total | | $ | 600,468,963 |
| | $ | 573,604,381 |
| | $ | 633,516,957 |
| | $ | 623,647,474 |
| | $ | 605,090,324 |
| | $ | 560,436,660 |
| | $ | 600,468,963 |
| | $ | 573,604,381 |
|
FIFTH STREET SENIOR FLOATING RATE CORP.OAKTREE STRATEGIC INCOME CORPORATION
NOTES TO CONSOLIDATED FINANCIAL STATEMENTS
The following table presents the financial instruments carried at fair value as of September 30, 2016,2017 on the Company's Consolidated StatementsStatement of Assets and Liabilities for each of the three levels of hierarchy established by ASC 820:
| | | | | Level 1 | | Level 2 | | Level 3 | | Total | | Level 1 | | Level 2 | | Level 3 | | Measured at Net Asset Value (a) | | Total |
| Investments in debt securities (senior secured) | | $ | — |
| | $ | — |
| | $ | 502,385,158 |
| | $ | 502,385,158 |
| | $ | — |
| | $ | 75,149,541 |
| | $ | 426,620,456 |
| | $ | — |
| | $ | 501,769,997 |
|
| Investments in debt securities (subordinated notes of FSFR Glick JV) | | — |
| | — |
| | 56,885,646 |
| | 56,885,646 |
| | — |
| | — |
| | 57,606,674 |
| | — |
| | 57,606,674 |
|
| Investment in equity securities (common stock, preferred stock and warrants, including LLC equity interests of FSFR Glick JV) | | — |
| | — |
| | 14,333,577 |
| | 14,333,577 |
| | — |
| | — |
| | 1,059,989 |
| | — |
| | 1,059,989 |
|
| Total investments at fair value | | — |
| | — |
| | 573,604,381 |
| | 573,604,381 |
| | — |
| | 75,149,541 |
| | 485,287,119 |
| | — |
| | 560,436,660 |
|
| Cash and cash equivalents | | 19,778,841 |
| | — |
| | — |
| | 19,778,841 |
| | 35,604,127 |
| | — |
| | — |
| | — |
| | 35,604,127 |
|
| Total assets at fair value | | $ | 19,778,841 |
| | $ | — |
| | $ | 573,604,381 |
| | $ | 593,383,222 |
| | $ | 35,604,127 |
| | $ | 75,149,541 |
| | $ | 485,287,119 |
| | $ | — |
| | $ | 596,040,787 |
|
| Secured borrowings | | — |
| | — |
| | 4,985,425 |
| | 4,985,425 |
| |
| Total liabilities at fair value | | $ | — |
| | $ | — |
| | $ | 4,985,425 |
| | $ | 4,985,425 |
| |
__________
| |
| (a) | In accordance with ASC 820-10, certain investments that are measured using the net asset value per share (or its equivalent) as a practical expedient for fair value have not been classified in the fair value hierarchy. These investments are generally not redeemable. The fair value amounts presented in this table are intended to permit reconciliation of the fair value hierarchy to the amounts presented in the Consolidated Statements of Assets and Liabilities. |
The following table presents the financial instruments carried at fair value as of September 30, 2015,2016 on the Company's Consolidated StatementsStatement of Assets and Liabilities for each of the three levels of hierarchy established by ASC 820:
| | | | | Level 1 | | Level 2 | | Level 3 | | Total | | Level 1 | | Level 2 | | Level 3 | | Measured at Net Asset Value (a) | | Total |
| Investments in debt securities (senior secured) | | $ | — |
| | $ | — |
| | $ | 565,526,453 |
| | $ | 565,526,453 |
| | $ | — |
| | $ | — |
| | $ | 502,385,158 |
| | $ | — |
| | $ | 502,385,158 |
|
| Investments in debt securities (subordinated notes of FSFR Glick JV) | | — |
| | — |
| | 52,603,346 |
| | 52,603,346 |
| | — |
| | — |
| | 56,885,646 |
| | — |
| | 56,885,646 |
|
| Investment in equity securities (common stock, preferred stock and warrants, including LLC equity interests of FSFR Glick JV) | | — |
| | — |
| | 5,517,675 |
| | 5,517,675 |
| | — |
| | — |
| | 7,902,556 |
| | 6,431,021 |
| | 14,333,577 |
|
| Total investments at fair value | | — |
| | — |
| | 623,647,474 |
| | 623,647,474 |
| | — |
| | — |
| | 567,173,360 |
| | 6,431,021 |
| | 573,604,381 |
|
| Cash and cash equivalents | | 41,433,301 |
| | — |
| | — |
| | 41,433,301 |
| | 19,778,841 |
| | — |
| | — |
| | — |
| | 19,778,841 |
|
| Total assets at fair value | | $ | 41,433,301 |
| | $ | — |
| | $ | 623,647,474 |
| | $ | 665,080,775 |
| | $ | 19,778,841 |
| | $ | — |
| | $ | 567,173,360 |
| | $ | 6,431,021 |
| | $ | 593,383,222 |
|
| Secured borrowings | | | — |
| | — |
| | 4,985,425 |
| | — |
| | 4,985,425 |
|
| Total liabilities at fair value | | | $ | — |
| | $ | — |
| | $ | 4,985,425 |
| | $ | — |
| | $ | 4,985,425 |
|
__________
| |
| (a) | In accordance with ASC 820-10, certain investments that are measured using the net asset value per share (or its equivalent) as a practical expedient for fair value have not been classified in the fair value hierarchy. These investments are generally not redeemable. The fair value amounts presented in this table are intended to permit reconciliation of the fair value hierarchy to the amounts presented in the Consolidated Statements of Assets and Liabilities. |
When a determination is made to classify a financial instrument within Level 3 of the valuation hierarchy, the determination is based upon the fact that the unobservable factors are significant to the overall fair value measurement. However, Level 3 financial instruments typically include, in addition to the unobservable or Level 3 components, observable components (i.e. components that are actively quoted and can be validated by external sources). Accordingly, the appreciation (depreciation) in the tables below includes changes in fair value due in part to observable factors that are part of the valuation methodology. Transfers between levels are recognized at the beginning of the reporting period.
FIFTH STREET SENIOR FLOATING RATE CORP.OAKTREE STRATEGIC INCOME CORPORATION
NOTES TO CONSOLIDATED FINANCIAL STATEMENTS
The following table provides a roll-forward in the changes in fair value from September 30, 2016 to September 30, 2017, for all investments and secured borrowings for which the Company determined fair value using unobservable (Level 3) factors:
|
| | | | | | | | | | | | | | | | | | | | |
| | | Investments | | Liabilities |
| | | | | | | | | | | |
| | | Senior Secured Debt | | Subordinated notes of FSFR Glick JV | | Common stock, preferred stock and warrants | | Total | | Secured Borrowings |
| Fair value as of September 30, 2016 | | $ | 502,385,158 |
| | $ | 56,885,646 |
| | $ | 7,902,556 |
| | $ | 567,173,360 |
| | $ | 4,985,425 |
|
| New investments & net revolver activity | | 225,012,781 |
| | — |
| | 14,743 |
| | 225,027,524 |
| | — |
|
| Redemptions/repayments/sales | | (276,479,425 | ) | | — |
| | (222,284 | ) | | (276,701,709 | ) | | (5,000,000 | ) |
| Transfers out (a) | | (12,608,478 | ) | | — |
| | — |
| | (12,608,478 | ) | | — |
|
| Net accrual of PIK interest income | | 185,296 |
| | 223,125 |
| | — |
| | 408,421 |
| | — |
|
| Accretion of original issue discount | | 3,794,604 |
| | — |
| | — |
| | 3,794,604 |
| | — |
|
| Net change in unearned income | | 19,280 |
| | — |
| | — |
| | 19,280 |
| | — |
|
| Net unrealized appreciation (depreciation) on investments | | (2,303,845 | ) | | 497,903 |
| | (6,635,026 | ) | | (8,440,968 | ) | | — |
|
| Net unrealized appreciation on secured borrowings | | — |
| | — |
| | — |
| | — |
| | 14,575 |
|
| Net realized loss on investments | | (13,384,915 | ) | | — |
| | — |
| | (13,384,915 | ) | | — |
|
| Fair value as of September 30, 2017 | | $ | 426,620,456 |
| | $ | 57,606,674 |
| | $ | 1,059,989 |
| | $ | 485,287,119 |
| | $ | — |
|
| Net unrealized appreciation (depreciation) relating to Level 3 assets and liabilities still held at September 30, 2017 and reported within net unrealized appreciation (depreciation) on investments and net unrealized appreciation on secured borrowings in the Consolidated Statement of Operations for the year ended September 30, 2017 | | $ | (15,458,340 | ) | | $ | 497,902 |
| | $ | 149,488 |
| | $ | (14,810,950 | ) | | $ | — |
|
__________
| |
| (a) | There was a transfer out of level 3 to level 2 for one investment during the year ended September 30, 2017 as a result of an increased number of market quotes available. |
OAKTREE STRATEGIC INCOME CORPORATION
NOTES TO CONSOLIDATED FINANCIAL STATEMENTS
The following table provides a roll-forward in the changes in fair value from September 30, 2015 to September 30, 2016 for all investments and secured borrowings for which the Company determined fair value using unobservable (Level 3) factors:
|
| | | | | | | | | | | | | | | | | | | | |
| | | Investments | | Liabilities |
| | | | | | | | | | | |
| | | Senior Secured Debt | | Subordinated notes of FSFR Glick JV | | Common stock, preferred stock and warrants, including LLC equity interests of FSFR Glick JV | | Total | | Secured Borrowings |
| Fair value as of September 30, 2015 | | $ | 565,526,453 |
| | $ | 52,603,346 |
| | $ | 5,517,675 |
| | $ | 623,647,474 |
| | $ | — |
|
| New investments & net revolver activity | | 276,326,738 |
| | 11,064,375 |
| | 11,302,341 |
| | 298,693,454 |
| | 5,000,000 |
|
| Redemptions/repayments | | (320,847,550 | ) | | (154,217 | ) | | — |
| | (321,001,767 | ) | | — |
|
| Net accrual of PIK interest income | | 88,839 |
| | — |
| | — |
| | 88,839 |
| | — |
|
| Accretion of original issue discount | | 1,924,087 |
| | — |
| | — |
| | 1,924,087 |
| | — |
|
| Net change in unearned income | | 17,170 |
| | — |
| | — |
| | 17,170 |
| | — |
|
| Net unrealized depreciation on investments | | (7,880,802 | ) | | (6,627,858 | ) | | (2,486,439 | ) | | (16,995,099 | ) | | — |
|
| Net unrealized depreciation on secured borrowings | | — |
| | — |
| | — |
| | — |
| | (14,575 | ) |
| Net realized loss on investments | | (12,769,777 | ) | | — |
| | — |
| | (12,769,777 | ) | | — |
|
| Fair value as of September 30, 2016 | | $ | 502,385,158 |
| | $ | 56,885,646 |
| | $ | 14,333,577 |
| | $ | 573,604,381 |
| | $ | 4,985,425 |
|
| Net unrealized depreciation relating to Level 3 assets and liabilities still held at September 30, 2016 and reported within net unrealized appreciation (depreciation) on investments and net unrealized depreciation on secured borrowings in the Consolidated Statement of Operations for the year ended September 30, 2016 | | $ | (10,913,833 | ) | | $ | (6,627,858 | ) | | $ | (2,486,439 | ) | | $ | (20,028,130 | ) | | $ | (14,575 | ) |
The following table provides a roll-forward in the changes in fair value from September 30, 2014 to September 30, 2015, for all investments for which the Company determines fair value using unobservable (Level 3) factors:
|
| | | | | | | | | | | | | | | | |
| | | Senior Secured Debt | | Subordinated notes of FSFR Glick JV | | Common stock, preferred stock and warrants, including LLC equity interests of FSFR Glick JV | | Total |
| Fair value at September 30, 2014 | | $ | 299,333,407 |
| | $ | — |
| | $ | 667,990 |
| | $ | 300,001,397 |
|
| New investments & net revolver activity | | 886,999,489 |
| | 53,095,597 |
| | 5,882,376 |
| | 945,977,462 |
|
| Redemptions/repayments | | (611,505,632 | ) | | — |
| | — |
| | (611,505,632 | ) |
| Accretion of original issue discount | | 1,634,191 |
| | — |
| | — |
| | 1,634,191 |
|
| Net change in unearned income | | (93,996 | ) | | — |
| | — |
| | (93,996 | ) |
| Net unrealized depreciation on investments | | (11,247,226 | ) | | (492,251 | ) | | (1,032,691 | ) | | (12,772,168 | ) |
| Net realized gain on investments | | 406,220 |
| | — |
| | — |
| | 406,220 |
|
| Fair value as of September 30, 2015 | | $ | 565,526,453 |
| | $ | 52,603,346 |
| | $ | 5,517,675 |
| | $ | 623,647,474 |
|
| Net unrealized depreciation relating to Level 3 assets still held at September 30, 2015 and reported within net unrealized appreciation (depreciation) on investments in the Consolidated Statement of Operations for the year ended September 30, 2015 | | $ | (10,273,110 | ) | | $ | (492,251 | ) | | $ | (1,032,691 | ) | | $ | (11,798,052 | ) |
FIFTH STREET SENIOR FLOATING RATE CORP.
NOTES TO CONSOLIDATED FINANCIAL STATEMENTS
|
| | | | | | | | | | | | | | | | | | | | |
| | | Investments | | Liabilities |
| | | | | | | | | | | |
| | | Senior Secured Debt | | Subordinated notes of FSFR Glick JV | | Common stock, preferred stock and warrants | | Total | | Secured Borrowings |
| Fair value as of September 30, 2015 | | $ | 565,526,453 |
| | $ | 52,603,346 |
| | $ | 964,100 |
| | $ | 619,093,899 |
| | $ | — |
|
| New investments & net revolver activity | | 276,326,738 |
| | 11,064,375 |
| | 10,072,966 |
| | 297,464,079 |
| | 5,000,000 |
|
| Redemptions/repayments/sales | | (320,847,550 | ) | | (154,217 | ) | | — |
| | (321,001,767 | ) | | — |
|
| Net accrual of PIK interest income | | 88,839 |
| | — |
| | — |
| | 88,839 |
| | — |
|
| Accretion of original issue discount | | 1,924,087 |
| | — |
| | — |
| | 1,924,087 |
| | — |
|
| Net change in unearned income | | 17,170 |
| | — |
| | — |
| | 17,170 |
| | — |
|
| Net unrealized depreciation on investments | | (7,880,802 | ) | | (6,627,858 | ) | | (3,134,510 | ) | | (17,643,170 | ) | | — |
|
| Net unrealized depreciation on secured borrowings | | — |
| | — |
| | — |
| | — |
| | (14,575 | ) |
| Net realized loss on investments | | (12,769,777 | ) | | — |
| | — |
| | (12,769,777 | ) | | — |
|
| Fair value as of September 30, 2016 | | $ | 502,385,158 |
| | $ | 56,885,646 |
| | $ | 7,902,556 |
| | $ | 567,173,360 |
| | $ | 4,985,425 |
|
| Net unrealized depreciation relating to Level 3 assets and liabilities still held at September 30, 2016 and reported within net unrealized appreciation (depreciation) on investments and net unrealized depreciation on secured borrowings in the Consolidated Statement of Operations for the year ended September 30, 2016 | | $ | (10,913,833 | ) | | $ | (6,627,858 | ) | | $ | (2,486,439 | ) | | $ | (20,028,130 | ) | | $ | (14,575 | ) |
Significant Unobservable Inputs for Level 3 Investments
The following table provides quantitative information related to the significant unobservable inputs for Level 3 investments, and secured borrowings, which are carried at fair value as of September 30, 2016:2017:
| | | Asset | | Fair Value | | Valuation Technique | | Unobservable Input | | Range | | Weighted Average (c) | | Fair Value | | Valuation Technique | | Unobservable Input | | Range | | Weighted Average (c) |
| Senior secured debt | | $ | 270,620,843 |
| | Bond yield approach | | Capital structure premium | | (a) | 0.0 | % | - | 2.0% | | 0.1% | | $ | 208,118,444 |
| | Market yield technique | | Capital structure premium | | (a) | 0.0% | - | 2.0% | | 0.2% |
| | | | | Tranche specific risk premium / (discount) | | (a) | (4.5 | )% | - | 5.3% | | (1.4)% | | | | Tranche specific risk premium / (discount) | | (a) | (3.1)% | - | 8.0% | | 0.2% |
| | | | | Size premium | | (a) | 0.0 | % | - | 1.5% | | 0.8% | | | | Size premium | | (a) | 0.0% | - | 1.5% | | 0.7% |
| | | | | Industry premium / (discount) | | (a) | (1.3 | )% | - | 5.4% | | 0.3% | | | | Industry premium / (discount) | | (a) | (1.1)% | - | 2.6% | | 0.0% |
| | | 12,440,322 |
| | Market and income approach | | Weighted average cost of capital | | 23.0 | % | - | 23.0% | | 23.0% | | 23,192,266 |
| | Enterprise value technique | | EBITDA multiple | | (b) | 6.4x | - | 6.4x | | 6.4x |
| | | | | Company specific risk premium | | (a) | 15.0 | % | - | 15.0% | | 15.0% | | 6,242,550 |
| | Enterprise value technique | | Revenue multiple | | (b) | 0.2x | - | 0.6x | | 0.5x |
| | | | | Revenue growth rate | | 6.0 | % | - | 6.0% | | 6.0% | | 20,070,000 |
| | Transactions precedent technique | | Transaction price | | (d) | N/A | - | N/A | | N/A |
| | | | | Revenue multiple | | (b) | 1.1x |
| - | 1.1x | | 1.1x | | 168,997,196 |
| | Market quotations | | Broker quoted price | | (e) | N/A | - | N/A | | N/A |
| | | 33,036,389 |
| | Transactions precedent approach | | Transaction price | | (d) | N/A |
| - | N/A | | N/A | |
| | | 186,287,604 |
| | Market quotations | | Broker quoted price | | (e) | N/A |
| - | N/A | | N/A | |
| FSFR Glick JV subordinated notes | | 56,885,646 |
| | Bond yield approach | | Capital structure premium | | (a) | 2.0 | % | - | 2.0% | | 2.0% | | 57,606,674 |
| | Enterprise value technique | | N/A | | (f) | N/A | - | N/A | | N/A |
| | | | | Tranche specific risk premium / (discount) | | (a) | (1.4 | )% | - | (1.4)% | | (1.4)% | |
| | | | | Size premium | | (a) | 2.0 | % | - | 2.0% | | 2.0% | |
| | | | | Industry premium / (discount) | | (a) | 1.9 | % | - | 1.9% | | 1.9% | |
| FSFR Glick JV equity interests | | 6,431,021 |
| | Net asset value | | Net asset value | | N/A |
| - | N/A | | N/A | |
| Preferred & Common Equity | | 7,902,556 |
| | Market and income approaches | | Weighted average cost of capital | | 14.0 | % | - | 18.0% | | 14.5% | | 1,059,989 |
| | Enterprise value technique | | EBITDA multiple | | (b) | 0.2x | - | 15.5x | | 8.1x |
| | | | | Company specific risk premium | | (a) | 1.0 | % | - | 2.0% | | 1.9% | |
| | | | | Revenue growth rate | | (21.6 | )% | - | 57.8% | | (12.0)% | |
| | | | | EBITDA/Revenue multiple | | (b) | 1.0x |
| - | 18.0x | | 3.1x | |
| Total | | $ | 573,604,381 |
| | | | | $ | 485,287,119 |
| |
| | | | | | | |
| Liabilities | | Fair Value | | Valuation Technique | | Unobservable Input | | Range | | Weighted Average | |
| Secured borrowings | | $ | 4,985,425 |
| | Market quotations | | Broker quoted price | | (e) | N/A |
| - | N/A | | N/A | |
| | | | | | | |
| Total | | $ | 4,985,425 |
| | | | |
_____________________
(a) Used when market participant would take into account this premium or discount when pricing the investment.
OAKTREE STRATEGIC INCOME CORPORATION
NOTES TO CONSOLIDATED FINANCIAL STATEMENTS
(b) Used when market participant would use such multiples when pricing the investment.
(c) Weighted averages are calculated based on fair value of investments.
(d) Used when there is an observable transaction or pending event for the investment.
(e) The Company generally uses prices provided by an independent pricing service which are non-binding indicative prices on or near the valuation date as the primary basis for the fair value determinations for quoted senior secured debt investments. Since these prices are non-binding, they may not be indicative of fair value. Each quoted price is evaluated by the Audit Committee of the Company's Board of Directors in conjunction with additional information compiled by the Company,Investment Adviser, including financial performance, recent business developments and various other factors.
FIFTH STREET SENIOR FLOATING RATE CORP.
NOTES TO CONSOLIDATED FINANCIAL STATEMENTS
(f) The Company determined the value based on the total assets less the total liabilities senior to the subordinated notes held at FSFR Glick JV in an amount not exceeding par under the enterprise value technique.
The following table provides quantitative information related to the significant unobservable inputs for Level 3 investments and secured borrowings, which are carried at fair value as of September 30, 2015:2016:
| | | Asset | | Fair Value | | Valuation Technique | | Unobservable Input | | Range | | Weighted Average (c) | | Fair Value | | Valuation Technique | | Unobservable Input | | Range | | Weighted Average (c) |
| Senior secured debt | | $ | 319,401,727 |
| | Bond yield approach | | Capital structure premium | | (a) | 0.0 | % | - | 2.0% | | 0.03% | | $ | 270,620,843 |
| | Market yield technique | | Capital structure premium | | (a) | 0.0% | - | 2.0% | | 0.1% |
| | | | | Tranche specific risk premium / (discount) | | (a) | (7.5 | )% | - | 6.0% | | (0.8)% | | | | Tranche specific risk premium / (discount) | | (a) | (4.5)% | - | 5.3% | | (1.4)% |
| | | | | Size premium | | (a) | 0.5 | % | - | 2.0% | | 1.1% | | | | Size premium | | (a) | 0.0% | - | 1.5% | | 0.8% |
| | | | | Industry premium / (discount) | | (a) | (2.2 | )% | - | 7.3% | | (0.02)% | | | | Industry premium / (discount) | | (a) | (1.3)% | - | 5.4% | | 0.3% |
| | | 246,124,726 |
| | Market quotations | | Broker quoted price | | (d) | N/A |
| - | N/A | | N/A | | 12,440,322 |
| | Enterprise value technique | | Weighted average cost of capital | | 23.0% | - | 23.0% | | 23.0% |
| | | | | | Company specific risk premium | | (a) | 15.0% | - | 15.0% | | 15.0% |
| | | | | | Revenue growth rate | | 6.0% | - | 6.0% | | 6.0% |
| | | | | | Revenue multiple | | (b) | 1.1x | - | 1.1x | | 1.1x |
| | | | 33,036,389 |
| | Transactions precedent technique | | Transaction price | | (d) | N/A | - | N/A | | N/A |
| | | | 186,287,604 |
| | Market quotations | | Broker quoted price | | (e) | N/A | - | N/A | | N/A |
| FSFR Glick JV subordinated notes | | 52,603,346 |
| | Bond yield approach | | Capital structure premium | | (a) | 2.0 | % | - | 2.0% | | 2.0% | | 56,885,646 |
| | Market yield technique | | Capital structure premium | | (a) | 2.0% | - | 2.0% | | 2.0% |
| | | | | Tranche specific risk premium / (discount) | | (a) | (1.4 | )% | - | (1.4)% | | (1.4)% | | | | Tranche specific risk premium / (discount) | | (a) | (1.4)% | - | (1.4)% | | (1.4)% |
| | | | | Size premium | | (a) | 2.0 | % | - | 2.0% | | 2.0% | | | | Size premium | | (a) | 2.0% | - | 2.0% | | 2.0% |
| | | | | Industry premium / (discount) | | (a) | (1.9 | )% | - | (1.9)% | | (1.9)% | | | | Industry premium / (discount) | | (a) | 1.9% | - | 1.9% | | 1.9% |
| FSFR Glick JV equity interests | | 4,553,575 |
| | Net asset value | | Net asset value | | N/A |
| - | N/A | | N/A | |
| Common equity/warrants | | 964,100 |
| | Market and income approaches | | Weighted average cost of capital | | 17.0 | % | - | 17.0% | | 17.0% | |
| Preferred & Common Equity | | | 7,902,556 |
| | Enterprise value technique | | Weighted average cost of capital | | 14.0% | - | 18.0% | | 14.5% |
| | | | | | Company specific risk premium | | (a) | 1.0% | - | 2.0% | | 1.9% |
| | | | | Company specific risk premium | | (a) | 1.0 | % | - | 1.0% | | 1.0% | | | | Revenue growth rate | | (21.6)% | - | 57.8% | | (12.0)% |
| | | | | Revenue growth rate | | 34.3 | % | - | 34.3% | | 34.3% | | | | Revenue multiple | | 1.0x | - | 1.0x | | 1.0x |
| | | | | EBITDA multiple | | (b) | 12.2x |
| - | 12.2x | | 12.2x | | | | EBITDA multiple | | (b) | 13.7x | - | 18.0x | | 15.6x |
| Total | | $ | 623,647,474 |
| | | | | $ | 567,173,360 |
| |
| Liabilities | | | Fair Value | | Valuation Technique | | Unobservable Input | | Range | | Weighted Average |
| Secured borrowings | | | $ | 4,985,425 |
| | Market quotations | | Broker quoted price | | (e) | N/A | - | N/A | | N/A |
| Total | | | $ | 4,985,425 |
| |
_____________________
(a) Used when market participant would take into account this premium or discount when pricing the investment.
(b) Used when market participant would use such multiples when pricing the investment.
(c) Weighted averages are calculated based on fair value of investments.
(d) Used when there is an observable transaction or pending event for the investment.
OAKTREE STRATEGIC INCOME CORPORATION
NOTES TO CONSOLIDATED FINANCIAL STATEMENTS
(e) The Company generally uses prices provided by an independent pricing service which are non-binding indicative prices on or near the valuation date as the primary basis for the fair value determinations for quoted senior secured debt investments. Since these prices are non-binding, they may not be indicative of fair value. Each quoted price is evaluated by the Audit Committee of the Company's Board of Directors in conjunction with additional information compiled by the Company, including financial performance, recent business developments and various other factors.
Under the bondmarket yield approach,technique, the significant unobservable inputs used in the fair value measurement of the Company's investments in debt securities and secured borrowings are capital structure premium, tranche specific risk premium (discount), size premium and industry premium (discount). Increases or decreases in any of those inputs in isolation may result in a lower or higher fair value measurement, respectively.
Under the market and income approaches,enterprise value technique, the significant unobservable inputsinput used in the fair value measurement of the Company's investments in debt or equity securities areis the weighted average cost of capital, company specific risk premium, revenue growth rate and EBITDA/Revenue multiple. Increases or decreases in a portfolio company's weighted average cost of capital or company specific risk premium in isolation may result in a lower or higher fair value measurement, respectively. Increases or decreases in the revenue growth rate or valuation multiples in isolation may result in a higher or lower fair value measurement, respectively.
FIFTH STREET SENIOR FLOATING RATE CORP.
NOTES TO CONSOLIDATED FINANCIAL STATEMENTS
Financial Instruments Disclosed, But Not Carried, At Fair Value
The following table presents the carrying value and fair value of the Company’s financial liabilities disclosed, but not carried, at fair value as of September 30, 2017 and the level of each financial liability within the fair value hierarchy:
|
| | | | | | | | | | | | | | | | | | | | |
| | | Carrying Value | | Fair Value | | Level 1 | | Level 2 | | Level 3 |
| Citibank facility payable | | $ | 76,456,800 |
| | $ | 76,456,800 |
| | $ | — |
| | $ | — |
| | $ | 76,456,800 |
|
| East West Bank facility payable | | 6,500,000 |
| | 6,500,000 |
| | — |
| | — |
| | 6,500,000 |
|
| Notes payable (net of unamortized financing costs) | | 177,775,868 |
| | 180,000,000 |
| | — |
| | — |
| | 180,000,000 |
|
| Total | | $ | 260,732,668 |
| | $ | 262,956,800 |
| | $ | — |
| | $ | — |
|
| $ | 262,956,800 |
|
The following table presents the carrying value and fair value of the Company’s financial liabilities disclosed, but not carried, at fair value as of September 30, 2016 and the level of each financial liability within the fair value hierarchy:
|
| | | | | | | | | | | | | | | | | | | | |
| | | Carrying Value | | Fair Value | | Level 1 | | Level 2 | | Level 3 |
| Citibank facility payable | | $ | 107,426,800 |
| | $ | 107,426,800 |
| | $ | — |
| | $ | — |
| | $ | 107,426,800 |
|
| Notes payable | | 180,000,000 |
| | 180,000,000 |
| | — |
| | — |
| | 180,000,000 |
|
| Total | | $ | 287,426,800 |
| | $ | 287,426,800 |
| | $ | — |
| | $ | — |
|
| $ | 287,426,800 |
|
The following table presents the carrying value and fair value of the Company’s financial liabilities disclosed, but not carried, at fair value as of September 30, 2015 and the level of each financial liability within the fair value hierarchy: | | | | | Carrying Value | | Fair Value | | Level 1 | | Level 2 | | Level 3 | | Carrying Value | | Fair Value | | Level 1 | | Level 2 | | Level 3 |
| Citibank facility payable | | $ | 136,659,800 |
| | $ | 136,659,800 |
| | $ | — |
| | $ | — |
| | $ | 136,659,800 |
| | $ | 107,426,800 |
| | $ | 107,426,800 |
| | $ | — |
| | $ | — |
| | $ | 107,426,800 |
|
| Notes payable | | 186,366,000 |
| | 186,366,000 |
| | — |
| | — |
| | 186,366,000 |
| |
| Notes payable (net of unamortized financing costs) | | | 177,485,764 |
| | 180,000,000 |
| | — |
| | — |
| | 180,000,000 |
|
| Total | | $ | 323,025,800 |
| | $ | 323,025,800 |
| | $ | — |
| | $ | — |
| | $ | 323,025,800 |
| | $ | 284,912,564 |
| | $ | 287,426,800 |
| | $ | — |
| | $ | — |
| | $ | 287,426,800 |
|
The carrying valueprincipal values of the Citibank credit facilityfacilities payable and notes payable approximate their fair values due to their variable interest rates and are included in Level 3 of the hierarchy.
Portfolio Composition
Summaries of the composition of the Company's investment portfolio at cost as a percentage of total investments and at fair value as a percentage of total investments and total net assets are shown in the following tables:
| | | | | September 30, 2016 | | September 30, 2015 | | September 30, 2017 | | September 30, 2016 |
| Cost: | | | | | | | | | | | | % of Total Investments | | | | % of Total Investments |
| Senior secured debt | | $ | 518,778,491 |
| | 86.40 | % | | $ | 574,038,984 |
| | 90.61 | % | | $ | 523,384,267 |
| | 86.50 | % | | $ | 518,778,491 |
| | 86.40 | % |
| Subordinated notes of FSFR Glick JV | | 64,005,755 |
| | 10.66 |
| | 53,095,597 |
| | 8.38 |
| | 64,228,881 |
| | 10.61 | % | | 64,005,755 |
| | 10.66 | % |
| LLC equity interests of FSFR Glick JV | | 7,111,751 |
| | 1.18 |
| | 5,882,376 |
| | 0.93 |
| | 7,111,751 |
| | 1.18 | % | | 7,111,751 |
| | 1.18 | % |
| Purchased equity | | 10,572,966 |
| | 1.76 |
| | 500,000 |
| | 0.08 |
| | 10,365,425 |
| | 1.71 | % | | 10,572,966 |
| | 1.76 | % |
| Equity grants | | — |
| | — |
| | — |
| | — |
| | — |
| | — |
| | — |
| | — |
|
| Total | | $ | 600,468,963 |
| | 100.00 | % | | $ | 633,516,957 |
| | 100.00 | % | | $ | 605,090,324 |
| | 100.00 | % | | $ | 600,468,963 |
| | 100.00 | % |
| Fair Value: | | | | | | | | | |
| Senior secured debt | | $ | 502,385,158 |
| | 87.58 | % | | $ | 565,526,453 |
| | 90.68 | % | |
| Subordinated notes of FSFR Glick JV | | 56,885,646 |
| | 9.92 |
| | 52,603,346 |
| | 8.43 |
| |
| LLC equity interests of FSFR Glick JV | | 6,431,021 |
| | 1.12 |
| | 4,553,575 |
| | 0.73 |
| |
| Purchased equity | | 7,782,214 |
| | 1.36 |
| | 809,394 |
| | 0.13 |
| |
| Equity grants | | 120,342 |
| | 0.02 |
| | 154,706 |
| | 0.03 |
| |
| Total | | $ | 573,604,381 |
| | 100.00 | % | | $ | 623,647,474 |
| | 100.00 | % | |
FIFTH STREET SENIOR FLOATING RATE CORP.OAKTREE STRATEGIC INCOME CORPORATION
NOTES TO CONSOLIDATED FINANCIAL STATEMENTS
|
| | | | | | | | | | | | | | | | | | | | |
| | | September 30, 2017 | | September 30, 2016 |
| Fair Value: | | | | % of Total Investments | | % of Total Net Assets | | | | % of Total Investments | | % of Total Net Assets |
| Senior secured debt | | $ | 501,769,997 |
| | 89.53 | % | | 170.87 | % | | $ | 502,385,158 |
| | 87.58 | % | | 154.18 | % |
| Subordinated notes of FSFR Glick JV | | 57,606,674 |
| | 10.28 | % | | 19.62 | % | | 56,885,646 |
| | 9.92 | % | | 17.46 | % |
| LLC equity interests of FSFR Glick JV | | — |
| | — |
| | — |
| | 6,431,021 |
| | 1.12 | % | | 1.97 | % |
| Purchased equity | | 1,059,989 |
| | 0.19 | % | | 0.36 | % | | 7,782,214 |
| | 1.36 | % | | 2.39 | % |
| Equity grants | | — |
| | — |
| | — |
| | 120,342 |
| | 0.02 | % | | 0.04 | % |
| Total | | $ | 560,436,660 |
| | 100.00 | % | | 190.85 | % | | $ | 573,604,381 |
| | 100.00 | % | | 176.04 | % |
The Company primarily invests in portfolio companies located in North America. The following tables show the portfolio composition by geographic region at cost and fair value as a percentage of total investments. The geographic composition is determined by the location of the corporate headquarters of the portfolio company, which may not be indicative of the primary source of the portfolio company's business. The following tables show the portfolio composition by geographic region at cost as a percentage of total investments and at fair value as a percentage of total investments and total net assets:
| | | | | September 30, 2016 | | September 30, 2015 | | September 30, 2017 | | September 30, 2016 |
| Cost: | | | | | | | | | | | | % of Total Investments | | | | % of Total Investments |
| Northeast U.S. | | $ | 223,662,953 |
| | 37.25 | % | | $ | 215,112,970 |
| | 33.96 | % | | $ | 217,508,260 |
| | 35.94 | % | | $ | 223,662,953 |
| | 37.25 | % |
| Midwest U.S. | | | 115,147,194 |
| | 19.03 | % | | 77,086,840 |
| | 12.84 | % |
| Southwest U.S. | | 123,909,372 |
| | 20.64 |
| | 124,389,488 |
| | 19.63 |
| | 101,583,440 |
| | 16.79 | % | | 123,909,372 |
| | 20.64 | % |
| Southeast U.S. | | | 89,214,997 |
| | 14.74 | % | | 76,201,785 |
| | 12.69 | % |
| West U.S. | | 84,992,619 |
| | 14.15 |
| | 117,699,067 |
| | 18.58 |
| | 74,469,039 |
| | 12.31 | % | | 84,992,619 |
| | 14.15 | % |
| Midwest U.S. | | 77,086,840 |
| | 12.84 |
| | 80,106,244 |
| | 12.64 |
| |
| Southeast U.S. | | 76,201,785 |
| | 12.69 |
| | 80,767,518 |
| | 12.75 |
| |
| Northwest | | | 3,799,884 |
| | 0.63 | % | | — |
| | — |
|
| International | | 14,615,394 |
| | 2.43 |
| | 15,441,670 |
| | 2.44 |
| | 3,367,510 |
| | 0.56 | % | | 14,615,394 |
| | 2.43 | % |
| Total | | $ | 600,468,963 |
| | 100.00 | % | | $ | 633,516,957 |
| | 100.00 | % | | $ | 605,090,324 |
| | 100.00 | % | | $ | 600,468,963 |
| | 100.00 | % |
| | | | | | | | | | |
| Fair Value: | | | | | | | | | |
| Northeast U.S. | | $ | 208,857,837 |
| | 36.41 | % | | $ | 211,240,832 |
| | 33.87 | % | |
| Southwest U.S. | | 124,470,758 |
| | 21.70 |
| | 125,336,010 |
| | 20.10 |
| |
| West U.S. | | 85,344,025 |
| | 14.88 |
| | 116,741,778 |
| | 18.72 |
| |
| Southeast U.S. | | 76,053,964 |
| | 13.26 |
| | 80,689,139 |
| | 12.94 |
| |
| Midwest U.S. | | 65,672,577 |
| | 11.45 |
| | 74,335,868 |
| | 11.92 |
| |
| International | | 13,205,220 |
| | 2.30 |
| | 15,303,847 |
| | 2.45 |
| |
| Total | | $ | 573,604,381 |
| | 100.00 | % | | $ | 623,647,474 |
| | 100.00 | % | |
|
| | | | | | | | | | | | | | | | | | | | |
| | | September 30, 2017 | | September 30, 2016 |
| Fair Value: | | | | % of Total Investments | | % of Total Net Assets | | | | % of Total Investments | | % of Total Net Assets |
| Northeast U.S. | | $ | 173,667,526 |
| | 30.99 | % | | 59.14 | % | | $ | 208,857,837 |
| | 36.41 | % | | 64.10 | % |
| Midwest U.S. | | 115,780,284 |
| | 20.66 | % | | 39.43 | % | | 65,672,577 |
| | 11.45 | % | | 20.16 | % |
| Southwest U.S. | | 99,398,397 |
| | 17.74 | % | | 33.85 | % | | 124,470,758 |
| | 21.70 | % | | 38.20 | % |
| Southeast U.S. | | 89,246,247 |
| | 15.92 | % | | 30.39 | % | | 76,053,964 |
| | 13.26 | % | | 23.34 | % |
| West U.S. | | 75,054,066 |
| | 13.39 | % | | 25.56 | % | | 85,344,025 |
| | 14.88 | % | | 26.19 | % |
| Northwest | | 3,883,882 |
| | 0.69 | % | | 1.32 | % | | — |
| | — |
| | — |
|
| International | | 3,406,258 |
| | 0.61 | % | | 1.16 | % | | 13,205,220 |
| | 2.30 | % | | 4.05 | % |
| Total | | $ | 560,436,660 |
| | 100.00 | % | | 190.85 | % | | $ | 573,604,381 |
| | 100.00 | % | | 176.04 | % |
FIFTH STREET SENIOR FLOATING RATE CORP.OAKTREE STRATEGIC INCOME CORPORATION
NOTES TO CONSOLIDATED FINANCIAL STATEMENTS
The composition of the Company's portfolio by industry at cost as a percentage of total investments and at fair value as a percentage of total investments and total net assets as of September 30, 20162017 and September 30, 20152016 was as follows:
| | | | September 30, 2016 | | September 30, 2015 | September 30, 2017 | | September 30, 2016 |
| Cost: | | | | | | | | | | % of Total Investments | | | | % of Total Investments |
| Internet software & services | $ | 132,462,581 |
| | 22.07 | % | | $ | 144,406,294 |
| | 22.79 | % | $ | 129,816,292 |
| | 21.46 | % | | $ | 132,462,581 |
| | 22.07 | % |
| Multi-sector holdings (1) | | 71,340,632 |
| | 11.79 |
| | 71,117,506 |
| | 11.84 |
|
| Healthcare services | 88,865,063 |
| | 14.80 |
| | 89,505,451 |
| | 14.13 |
| 50,858,157 |
| | 8.41 |
| | 88,865,063 |
| | 14.80 |
|
| Multi-sector holdings | 71,117,506 |
| | 11.84 |
| | 58,977,973 |
| | 9.31 |
| |
| Advertising | 48,396,135 |
| | 8.06 |
| | 43,467,983 |
| | 6.86 |
| 43,518,443 |
| | 7.19 |
| | 48,396,135 |
| | 8.06 |
|
| Application software | 32,100,672 |
| | 5.35 |
| | 21,328,090 |
| | 3.37 |
| 33,801,616 |
| | 5.59 |
| | 32,100,672 |
| | 5.35 |
|
| Diversified support services | | 24,189,607 |
| | 4.00 |
| | 19,714,868 |
| | 3.28 |
|
| IT consulting & other services | | 20,485,989 |
| | 3.39 |
| | 8,811,481 |
| | 1.47 |
|
| Human resources & employment services | | 20,141,957 |
| | 3.33 |
| | — |
| | — |
|
| Specialized finance | | 15,358,280 |
| | 2.54 |
| | — |
| | — |
|
| Environmental & facilities services | | 14,170,031 |
| | 2.34 |
| | 6,391,836 |
| | 1.06 |
|
| Oil & gas equipment & services | | 14,057,018 |
| | 2.32 |
| | 4,177,081 |
| | 0.70 |
|
| Distributors | | 12,967,500 |
| | 2.14 |
| | — |
| | — |
|
| Industrial machinery | | 12,493,405 |
| | 2.06 |
| | 3,826,203 |
| | 0.64 |
|
| Real estate services | | 12,247,424 |
| | 2.02 |
| | — |
| | — |
|
| Commercial printing | | 11,847,790 |
| | 1.96 |
| | 5,912,694 |
| | 0.98 |
|
| Integrated telecommunication services | 24,385,644 |
| | 4.06 |
| | 38,058,587 |
| | 6.01 |
| 11,291,073 |
| | 1.87 |
| | 24,385,644 |
| | 4.06 |
|
| Food retail | | 10,054,868 |
| | 1.66 |
| | 6,889,930 |
| | 1.15 |
|
| Data processing & outsourced services | | 9,804,174 |
| | 1.62 |
| | 9,835,238 |
| | 1.64 |
|
| Pharmaceuticals | | 9,068,650 |
| | 1.50 |
| | 9,162,870 |
| | 1.53 |
|
| Specialty Stores | | 8,359,086 |
| | 1.38 |
| | — |
| | — |
|
| Security & alarm services | | 8,018,318 |
| | 1.33 |
| | 17,835,147 |
| | 2.97 |
|
| Computer & Electronics Retail | | 7,383,862 |
| | 1.22 |
| | — |
| | — |
|
| Research & consulting services | | 6,922,777 |
| | 1.14 |
| | 17,128,420 |
| | 2.85 |
|
| Personal products | | 6,544,450 |
| | 1.08 |
| | 1,285,383 |
| | 0.21 |
|
| Aerospace & defense | | 6,453,287 |
| | 1.07 |
| | — |
| | — |
|
| Auto parts & equipment | | 5,871,777 |
| | 0.97 |
| | — |
| | — |
|
| Healthcare distributors | | 4,975,000 |
| | 0.82 |
| | — |
| | — |
|
| Casinos & gaming | | 4,963,767 |
| | 0.82 |
| | — |
| | — |
|
| Housewares & specialties | | 4,795,075 |
| | 0.79 |
| | — |
| | — |
|
| Trucking | | 4,079,548 |
| | 0.67 |
| | — |
| | — |
|
| Fertilizers & agricultural chemicals | | 3,273,753 |
| | 0.54 |
| | 3,522,668 |
| | 0.59 |
|
| Hypermarkets & super centers | | 2,996,051 |
| | 0.50 |
| | — |
| | — |
|
| Specialized consumer services | 22,605,271 |
| | 3.76 |
| | 28,717,092 |
| | 4.53 |
| 1,660,679 |
| | 0.27 |
| | 22,605,271 |
| | 3.76 |
|
| Diversified support services | 19,714,868 |
| | 3.28 |
| | 29,579,949 |
| | 4.67 |
| |
| Security & alarm services | 17,835,147 |
| | 2.97 |
| | 17,760,120 |
| | 2.80 |
| |
| Research & consulting services | 17,128,420 |
| | 2.85 |
| | 9,283,714 |
| | 1.47 |
| |
| Computer hardware | | 1,279,988 |
| | 0.21 |
| | 3,956,802 |
| | 0.66 |
|
| Education services | 15,262,322 |
| | 2.54 |
| | 21,743,979 |
| | 3.43 |
| — |
| | — |
| | 15,262,322 |
| | 2.54 |
|
| Electronic equipment & instruments | 10,942,464 |
| | 1.82 |
| | 13,720,000 |
| | 2.17 |
| — |
| | — |
| | 10,942,464 |
| | 1.82 |
|
| Data processing & outsourced services | 9,835,238 |
| | 1.64 |
| | 13,581,348 |
| | 2.14 |
| |
| Pharmaceuticals | 9,162,870 |
| | 1.53 |
| | 9,825,000 |
| | 1.55 |
| |
| IT consulting & other services | 8,811,481 |
| | 1.47 |
| | 11,953,631 |
| | 1.89 |
| |
| Diversified capital markets | 8,685,189 |
| | 1.45 |
| | 8,756,158 |
| | 1.38 |
| — |
| | — |
| | 8,685,189 |
| | 1.45 |
|
| Food retail | 6,889,930 |
| | 1.15 |
| | 10,300,523 |
| | 1.63 |
| |
| Environmental & facilities services | 6,391,836 |
| | 1.06 |
| | 9,997,808 |
| | 1.58 |
| |
| Commercial printing | 5,912,694 |
| | 0.98 |
| | — |
| | — |
| |
| Construction and engineering | 5,907,850 |
| | 0.98 |
| | 5,945,467 |
| | 0.94 |
| — |
| | — |
| | 5,907,850 |
| | 0.98 |
|
| Wireless telecommunication services | 5,719,729 |
| | 0.95 |
| | 5,746,610 |
| | 0.91 |
| — |
| | — |
| | 5,719,729 |
| | 0.95 |
|
| Food distributors | 5,711,496 |
| | 0.95 |
| | 8,912,991 |
| | 1.41 |
| — |
| | — |
| | 5,711,496 |
| | 0.95 |
|
| Restaurants | 5,000,000 |
| | 0.83 |
| | — |
| | — |
| — |
| | — |
| | 5,000,000 |
| | 0.83 |
|
| Healthcare technology | 4,856,420 |
| | 0.81 |
| | 4,959,398 |
| | 0.78 |
| | | | | 4,856,420 |
| | 0.81 |
|
| Oil & gas equipment & services | 4,177,081 |
| | 0.70 |
| | 4,418,746 |
| | 0.70 |
| |
| Computer hardware | 3,956,802 |
| | 0.66 |
| | 4,099,489 |
| | 0.65 |
| |
| Industrial machinery | 3,826,203 |
| | 0.64 |
| | 3,970,000 |
| | 0.63 |
| |
| Fertilizers & agricultural chemicals | 3,522,668 |
| | 0.59 |
| | 3,713,056 |
| | 0.57 |
| |
| Personal products | 1,285,383 |
| | 0.21 |
| | 10,787,500 |
| | 1.70 |
| |
| Total | $ | 600,468,963 |
| | 100.00 | % |
| $ | 633,516,957 |
| | 100.00 | % | $ | 605,090,324 |
| | 100.00 | % |
| $ | 600,468,963 |
| | 100.00 | % |
FIFTH STREET SENIOR FLOATING RATE CORP.OAKTREE STRATEGIC INCOME CORPORATION
NOTES TO CONSOLIDATED FINANCIAL STATEMENTS
| | | | September 30, 2016 | | September 30, 2015 | September 30, 2017 | | September 30, 2016 |
| Fair Value: | | | | | | | | | | % of Total Investments | | % of Total Net Assets | | | | % of Total Investments | | % of Total Net Assets |
| Internet software & services | $ | 119,438,318 |
| | 20.82 | % | | $ | 139,324,155 |
| | 22.34 | % | $ | 121,778,922 |
| | 21.72 | % | | 41.43 | % | | $ | 119,438,318 |
| | 20.82 | % | | 36.64 | % |
| Healthcare services | 83,972,780 |
| | 14.64 |
| | 86,013,066 |
| | 13.79 |
| |
| Multi-sector holdings | 63,316,667 |
| | 11.04 |
| | 57,156,921 |
| | 9.16 |
| |
| Multi-sector holdings (1) | | 57,606,674 |
| | 10.28 |
| | 19.62 |
| | 63,316,667 |
| | 11.04 |
| | 19.43 |
|
| Advertising | 48,684,948 |
| | 8.49 |
| | 43,579,408 |
| | 6.99 |
| 41,145,973 |
| | 7.34 |
| | 14.01 |
| | 48,684,948 |
| | 8.49 |
| | 14.94 |
|
| Application software | 32,405,166 |
| | 5.65 |
| | 21,882,649 |
| | 3.51 |
| 33,966,141 |
| | 6.06 |
| | 11.57 |
| | 32,405,166 |
| | 5.65 |
| | 9.95 |
|
| Healthcare services | | 29,525,697 |
| | 5.27 |
| | 10.06 |
| | 83,972,780 |
| | 14.64 |
| | 25.77 |
|
| Diversified support services | | 24,655,181 |
| | 4.40 |
| | 8.40 |
| | 19,597,622 |
| | 3.42 |
| | 6.01 |
|
| IT consulting & other services | | 20,488,238 |
| | 3.66 |
| | 6.98 |
| | 8,884,236 |
| | 1.55 |
| | 2.73 |
|
| Human resources & employment services | | 20,125,090 |
| | 3.59 |
| | 6.85 |
| | — |
| | — |
| | — |
|
| Specialized finance | | 15,609,084 |
| | 2.79 |
| | 5.32 |
| | — |
| | — |
| | — |
|
| Environmental & facilities services | | 14,287,163 |
| | 2.55 |
| | 4.87 |
| | 6,540,239 |
| | 1.14 |
| | 2.01 |
|
| Oil & gas equipment & services | | 14,052,500 |
| | 2.51 |
| | 4.79 |
| | 4,090,429 |
| | 0.71 |
| | 1.26 |
|
| Distributors | | 12,957,035 |
| | 2.31 |
| | 4.41 |
| | — |
| | — |
| | — |
|
| Industrial machinery | | 12,452,459 |
| | 2.22 |
| | 4.24 |
| | 3,778,376 |
| | 0.66 |
| | 1.16 |
|
| Real estate services | | 12,256,098 |
| | 2.19 |
| | 4.17 |
| | — |
| | — |
| | — |
|
| Commercial printing | | 11,942,132 |
| | 2.13 |
| | 4.07 |
| | 5,929,733 |
| | 1.03 |
| | 1.82 |
|
| Integrated telecommunication services | 24,637,968 |
| | 4.30 |
| | 38,288,184 |
| | 6.14 |
| 11,368,765 |
| | 2.03 |
| | 3.87 |
| | 24,637,968 |
| | 4.30 |
| | 7.56 |
|
| Food retail | | 10,182,584 |
| | 1.82 |
| | 3.47 |
| | 7,011,442 |
| | 1.22 |
| | 2.15 |
|
| Data processing & outsourced services | | 9,840,600 |
| | 1.76 |
| | 3.35 |
| | 9,820,000 |
| | 1.71 |
| | 3.01 |
|
| Pharmaceuticals | | 9,038,634 |
| | 1.61 |
| | 3.08 |
| | 9,033,850 |
| | 1.57 |
| | 2.77 |
|
| Specialty Stores | | 8,193,960 |
| | 1.46 |
| | 2.79 |
| | — |
| | — |
| | — |
|
| Security & alarm services | | 7,972,286 |
| | 1.42 |
| | 2.72 |
| | 17,865,123 |
| | 3.11 |
| | 5.48 |
|
| Computer & Electronics Retail | | 7,498,142 |
| | 1.34 |
| | 2.55 |
| | — |
| | — |
| | — |
|
| Research & consulting services | | 7,004,638 |
| | 1.25 |
| | 2.39 |
| | 17,162,244 |
| | 2.99 |
| | 5.27 |
|
| Personal products | | 6,599,006 |
| | 1.18 |
| | 2.25 |
| | 1,290,310 |
| | 0.22 |
| | 0.40 |
|
| Aerospace & defense | | 6,556,692 |
| | 1.17 |
| | 2.23 |
| | — |
| | — |
| | — |
|
| Auto parts & equipment | | 5,798,747 |
| | 1.03 |
| | 1.97 |
| | — |
| | — |
| | — |
|
| Casinos & gaming | | 5,038,622 |
| | 0.90 |
| | 1.72 |
| | — |
| | — |
| | — |
|
| Healthcare distributors | | 4,948,950 |
| | 0.88 |
| | 1.69 |
| | — |
| | — |
| | — |
|
| Housewares & specialties | | 4,771,779 |
| | 0.85 |
| | 1.63 |
| | — |
| | — |
| | — |
|
| Trucking | | 4,099,725 |
| | 0.73 |
| | 1.40 |
| | — |
| | — |
| | — |
|
| Hypermarkets & super centers | | 2,876,002 |
| | 0.51 |
| | 0.98 |
| | — |
| | — |
| | — |
|
| Fertilizers & agricultural chemicals | | 2,801,481 |
| | 0.50 |
| | 0.95 |
| | 3,377,146 |
| | 0.59 |
| | 1.04 |
|
| Specialized consumer services | 22,538,791 |
| | 3.93 |
| | 28,795,048 |
| | 4.62 |
| 1,672,677 |
| | 0.30 |
| | 0.57 |
| | 22,538,791 |
| | 3.93 |
| | 6.92 |
|
| Diversified support services | 19,597,622 |
| | 3.42 |
| | 29,476,672 |
| | 4.73 |
| |
| Security & alarm services | 17,865,123 |
| | 3.11 |
| | 17,763,106 |
| | 2.85 |
| |
| Research & consulting services | 17,162,244 |
| | 2.99 |
| | 9,316,658 |
| | 1.49 |
| |
| Computer hardware | | 1,324,983 |
| | 0.24 |
| | 0.45 |
| | 3,903,567 |
| | 0.68 |
| | 1.20 |
|
| Education services | 15,293,164 |
| | 2.67 |
| | 21,386,129 |
| | 3.43 |
| — |
| | — |
| | — |
| | 15,293,164 |
| | 2.67 |
| | 4.69 |
|
| Electronic equipment & instruments | 10,912,302 |
| | 1.90 |
| | 13,717,288 |
| | 2.20 |
| — |
| | — |
| | — |
| | 10,912,302 |
| | 1.90 |
| | 3.35 |
|
| Data processing & outsourced services | 9,820,000 |
| | 1.71 |
| | 13,681,960 |
| | 2.19 |
| |
| Pharmaceuticals | 9,033,850 |
| | 1.57 |
| | 9,819,438 |
| | 1.57 |
| |
| IT consulting & other services | 8,884,236 |
| | 1.55 |
| | 12,082,836 |
| | 1.94 |
| |
| Diversified capital markets | 8,763,486 |
| | 1.53 |
| | 8,831,807 |
| | 1.42 |
| — |
| | — |
| | — |
| | 8,763,486 |
| | 1.53 |
| | 2.69 |
|
| Food retail | 7,011,442 |
| | 1.22 |
| | 10,432,750 |
| | 1.67 |
| |
| Environmental & facilities services | 6,540,239 |
| | 1.14 |
| | 10,000,000 |
| | 1.60 |
| |
| Commercial printing | 5,929,733 |
| | 1.03 |
| | — |
| | — |
| |
| Construction and engineering | 5,768,770 |
| | 1.01 |
| | 5,908,869 |
| | 0.95 |
| — |
| | — |
| | — |
| | 5,768,770 |
| | 1.01 |
| | 1.77 |
|
| Food distributors | 5,623,604 |
| | 0.98 |
| | 8,970,000 |
| | 1.44 |
| — |
| | — |
| | — |
| | 5,623,604 |
| | 0.98 |
| | 1.73 |
|
| Restaurants | 4,985,425 |
| | 0.87 |
| | — |
| | — |
| — |
| | — |
| | — |
| | 4,985,425 |
| | 0.87 |
| | 1.53 |
|
| Healthcare technology | 4,747,016 |
| | 0.83 |
| | 4,838,813 |
| | 0.78 |
| — |
| | — |
| | — |
| | 4,747,016 |
| | 0.83 |
| | 1.46 |
|
| Wireless telecommunication services | 4,231,659 |
| | 0.74 |
| | 5,454,246 |
| | 0.87 |
| — |
| | — |
| | — |
| | 4,231,659 |
| | 0.74 |
| | 1.30 |
|
| Oil & gas equipment & services | 4,090,429 |
| | 0.71 |
| | 4,364,794 |
| | 0.70 |
| |
| Computer hardware | 3,903,567 |
| | 0.68 |
| | 4,121,614 |
| | 0.66 |
| |
| Industrial machinery | 3,778,376 |
| | 0.66 |
| | 3,867,602 |
| | 0.62 |
| |
| Fertilizers & agricultural chemicals | 3,377,146 |
| | 0.59 |
| | 3,754,945 |
| | 0.61 |
| |
| Personal products | 1,290,310 |
| | 0.22 |
| | 10,818,516 |
| | 1.73 |
| |
| Total | $ | 573,604,381 |
| | 100.00 | % | | $ | 623,647,474 |
| | 100.00 | % | $ | 560,436,660 |
| | 100.00 | % | | 190.85 | % | | $ | 573,604,381 |
| | 100.00 | % | | 176.04 | % |
___________________
| |
| (1) | This industry includes the Company's investment in FSFR Glick JV. |
OAKTREE STRATEGIC INCOME CORPORATION
NOTES TO CONSOLIDATED FINANCIAL STATEMENTS
The Company's investments are generally in middle marketmiddle-market companies in a variety of industries. The Company has one investment that represented greater than 10% of the total investment portfolio at fair value atas of September 30, 2017 and September 30, 2016, which is as follows: |
| | | |
| | September 30, 2016 |
FSFR Glick JV LLC | | 11.0 | % |
|
| | | | | | |
| | | September 30, 2017 | | September 30, 2016 |
| FSFR Glick JV LLC | | 10.3 | % | | 11.0 | % |
Income, consisting of interest, dividends, fees, other investment income and realization of gains or losses, can fluctuate upon repayment or sale of an investment and in any given year can be highly concentrated among several investments. The individual investment that producedDetails of investment income that exceeded 10% of total investment incomeFSFR Glick JV LLC for the yearyears ended September 30, 2017 and September 30, 2016 isare as follows:
|
| | | | | | | |
| | | Year ended September 30, 2016 |
| | | Investment Income | | Percent of Total Investment Income |
| FSFR Glick JV LLC | | $ | 7,777,850 |
| | 14.6 | % |
For the year ended September 30, 2015, no individual investment exceeded 10% of the total investment portfolio at fair value or total investment income.
FIFTH STREET SENIOR FLOATING RATE CORP.
NOTES TO CONSOLIDATED FINANCIAL STATEMENTS
|
| | | | | | | | | | | | | | |
| | | Year ended September 30, 2017 | | Year ended September 30, 2016 |
| | | Investment Income | | Percent of Total Investment Income | | Investment Income | | Percent of Total Investment Income |
| FSFR Glick JV LLC | | $ | 5,188,380 |
| | 11.1 | % | | $ | 7,777,850 |
| | 14.6 | % |
FSFR Glick JV LLC
In October 2014, the Company entered into an LLC agreement with GF Equity Funding 2014 LLC ("GF Equity Funding") to form FSFR Glick JV. On April 21, 2015, FSFR Glick JV began investing primarily in senior secured loans of middle marketmiddle-market companies. The Company co-invests in these securities with GF Equity Funding through its investment in FSFR Glick JV. FSFR Glick JV is managed by a four person Board of Directors, two of whom are selected by the Company and two of whom are selected by GF Equity Funding. FSFR Glick JV is capitalized as transactions are completed, and portfolio decisions and investment decisions in respect of FSFR Glick JV must be approved by an investment committee ofthe FSFR Glick JV consistinginvestment committee which consists of one representative ofselected by the Company and one representative ofselected by GF Equity Funding (with approval from a representative of each required). The members provide capital to FSFR Glick JV in exchange for LLC equity interests, and the Company and GF Debt Funding 2014 LLC ("GF Debt Funding"), an entity advised by affiliates of GF Equity Funding, provide capital to FSFR Glick JV in exchange for subordinated notes (the "Subordinated Notes"). As of September 30, 20162017 and September 30, 2015,2016, the Company and GF Equity Funding owned 87.5% and 12.5%, respectively, of the outstanding LLC equity interests and the Company and GF Debt Funding owned 87.5% and 12.5%, respectively, of the Subordinated Notes. FSFR Glick JV is not an "eligible portfolio company" as defined in section 2(a)(46) of the 1940 Act.
FSFR Glick JV's portfolio consisted of middle-market and other corporate debt securities of 23 and 36 "eligible portfolio companies" (as defined in Section 2(a)(46) of the 1940 Act) as of September 30, 2017 and September 30, 2016, respectively. The portfolio companies in FSFR Glick JV are in industries similar to those in which the Company may invest directly.
FSFR Glick JV has a senior revolving credit facility with Deutsche Bank AG, New York Branch ("Deutsche Bank facility") with a stated maturity date of April 17, 2023, which permitted up to $200.0 million of borrowings as of both September 30, 2017 and September 30, 2016. On June 29, 2017, the Deutsche Bank facility was assigned by Credit Suisse AG, Cayman Islands Branch to Deutsche Bank AG, New York Branch. Borrowings under the Deutsche Bank facility are secured by all of the assets of FSFR Glick JV and all of the equity interests in FSFR Glick JV and bore interest at a rate equal to the 3-month LIBOR plus 2.5% per annum with no LIBOR floor as of September 30, 2017 and September 30, 2016. Under the Deutsche Bank facility, $56.9 million and $124.6 million of borrowings were outstanding as of September 30, 2017 and September 30, 2016, respectively.
The Company has determined that FSFR Glick JV is an investment company under ASC 946; however, in accordance with such guidance, the Company will generally not consolidate its investment in a company other than a wholly-owned investment company subsidiary or a controlled operating company whose business consists of providing services to the Company. Accordingly, the Company does not consolidate its noncontrollingnon-controlling interest in FSFR Glick JV.
As of September 30, 20162017 and September 30, 2015,2016, FSFR Glick JV had total assets of $126.7 million and $201.1 million, respectively. As of September 30, 2017, the Company's investment in FSFR Glick JV consisted of LLC equity interests and $190.4Subordinated Notes of $57.6 million respectively.in the aggregate at fair value. As of September 30, 2016, the Company's investment in FSFR Glick JV consisted of LLC equity interests of $6.4 million and Subordinated Notes of $56.9$63.3 million at fair value. As of September 30, 2015,in the Company's investment consisted of LLC equity interests of $4.6 million and Subordinated Notes of $52.6 million,aggregate at fair value. The Subordinated Notes are junior in right of payment to the repayment of temporary contributions made by the Company to fund investments of FSFR Glick JV. FSFR Glick JV's portfolio consisted of middle marketJV that are repaid when GF Equity Funding and other corporate debt securities of 36GF Debt Funding make their capital contributions and 29 "eligible portfolio companies" (as defined in the Section 2(a)(46) of the 1940 Act) as of September 30, 2016 and September 30, 2015,fund their Subordinated Notes, respectively. The portfolio companies in FSFR Glick JV are in industries similar to those in which the Company may invest directly.
As of September 30, 20162017 and September 30, 2015,2016, FSFR Glick JV had total capital commitments of $100.0 million, $87.5 million of which was from the Company and the remaining $12.5 million of which was from GF Equity Funding and GF Debt Funding.
OAKTREE STRATEGIC INCOME CORPORATION
NOTES TO CONSOLIDATED FINANCIAL STATEMENTS
Approximately $81.3$81.6 million and $67.4$81.3 million in aggregate commitments were funded as of September 30, 20162017 and September 30, 2015,2016, respectively, of which $71.1$71.4 million and $59.0$71.1 million, respectively, was from the Company. As of each of September 30, 2017 and September 30, 2016, the Company had commitments to fund Subordinated Notes to FSFR Glick JV of $78.8 million, of which $14.5 million and $14.7 million, respectively, was unfunded. As of each of September 30, 2017 and September 30, 2016, the Company had commitments to fund LLC equity interests in FSFR Glick JV of $8.7 million, of which $1.6 million was unfunded. As of September 30, 2015, the Company had commitments to fund Subordinated Notes to FSFR Glick JV of $78.8 million, of which $25.7 million was unfunded. As of September 30, 2015, the Company had commitments to fund LLC equity interests in FSFR Glick JV of $8.7 million, of which $2.9 million was unfunded.
Additionally, FSFR Glick JV has a senior revolving credit facility with Credit Suisse AG, Cayman Island Branch ("Credit Suisse facility") with a stated maturity date of April 17, 2023, which permitted up to $200.0 million of borrowings as of both September 30, 2016 and September 30, 2015. Borrowings under the Credit Suisse facility are secured by all of the assets of FSFR Glick JV and all of the equity interests in FSFR Glick JV and bore interest at a rate equal to the 3-month LIBOR plus 2.5% per annum with no LIBOR floor as of September 30, 2016 and September 30, 2015. Under the Credit Suisse facility, $124.6 million and $122.4 million of borrowings were outstanding as of September 30, 2016 and September 30, 2015, respectively.
FIFTH STREET SENIOR FLOATING RATE CORP.
NOTES TO CONSOLIDATED FINANCIAL STATEMENTS
Below is a summary of FSFR Glick JV's portfolio, followed by a listing of the individual loans in FSFR Glick JV's portfolio as of September 30, 20162017 and September 30, 2015:2016:
| | | | | September 30, 2016 | | September 30, 2015 | | September 30, 2017 | | September 30, 2016 |
| Senior secured loans (1) | | $194,346,557 | | $186,764,451 | | $115,964,537 | | $194,346,557 |
| Weighted average current interest rate on senior secured loans (2) | | 7.08% | | 6.93% | | 6.92% | | 7.08% |
| Number of borrowers in FSFR Glick JV | | 36 | | 29 | | 23 | | 36 |
| Largest loan exposure to a single borrower (1) | | $12,641,009 | | $14,777,933 | | $11,267,524 | | $12,641,009 |
| Total of five largest loan exposures to borrowers (1) | | $49,318,344 | | $58,331,216 | | $42,833,696 | | $49,318,344 |
(1) At principal amount.
(2) Computed using the annual interest rate on accruing senior secured loans.
OAKTREE STRATEGIC INCOME CORPORATION
NOTES TO CONSOLIDATED FINANCIAL STATEMENTS
FSFR Glick JV Portfolio as of September 30, 2017 |
| | | | | | | | | | | | | | | | | | | | | | | |
| Portfolio Company | | Industry | | Investment Type | | Maturity Date | | Current Interest Rate (1)(4) | | Cash Interest Rate (1) | | Principal | | Cost | | Fair Value (2) |
| Ameritox Ltd. (3)(5) | | Healthcare services | | First Lien Term Loan | | 4/11/2021 | | LIBOR+5% (1% floor) cash 3% PIK | | 6.33 | % | | $2,287,177 | | $2,243,202 | | $265,211 |
| | | Healthcare services | | 119,910.76 Class B Preferred Units | | | | | | | |
| | 119,911 |
| | — |
|
| | | Healthcare services | | 368.96 Class A Common Units | | | | | | | |
| | 2,174,034 |
| | — |
|
| Total Ameritox Ltd | | | | | | | | | | | | 2,287,177 |
| | 4,537,147 |
| | 265,211 |
|
| Beyond Trust Software, Inc. (3) | | Application software | | First Lien Term Loan | | 9/25/2019 | | LIBOR+7% (1% floor) cash | | 8.33 | % | | 11,267,524 |
| | 11,220,478 |
| | 11,267,116 |
|
| Compuware Corporation (3) | | Internet software & services | | First Lien Term Loan B3 | | 12/15/2021 | | LIBOR+4.25% (1% floor) cash | | 5.49 | % | | 6,279,920 |
| | 6,225,992 |
| | 6,358,419 |
|
| Metamorph US 3, LLC (3)(5) | | Internet software & services | | First Lien Term Loan | | 12/1/2020 | | LIBOR+5.5% (1% floor) cash 2% PIK | | 6.74 | % | | 6,825,900 |
| | 6,477,372 |
| | 2,592,115 |
|
| Motion Recruitment Partners LLC (3) | | Human resources & employment services | | First Lien Term Loan | | 2/13/2020 | | LIBOR+6% (1% floor) cash | | 7.24 | % | | 8,659,650 |
| | 8,659,650 |
| | 8,659,223 |
|
| NAVEX Global, Inc. | | Internet software & services | | First Lien Term Loan | | 11/19/2021 | | LIBOR+4.25% (1% floor) cash | | 5.49 | % | | 2,977,041 |
| | 2,967,620 |
| | 2,988,205 |
|
| Air Newco LLC | | IT consulting & other services | | First Lien Term Loan B | | 3/20/2022 | | LIBOR+5.5% (1% floor) cash | | 6.82 | % | | 8,160,622 |
| | 8,141,224 |
| | 8,099,417 |
|
| CM Delaware LLC | | Advertising | | First Lien Term Loan | | 3/18/2021 | | LIBOR+5.25% (1% floor) cash | | 6.58 | % | | 2,075,162 |
| | 2,073,617 |
| | 2,064,786 |
|
| New Trident Holdcorp, Inc. (3) | | Healthcare services | | First Lien Term Loan B | | 7/31/2019 | | LIBOR+5.75% (1.25% floor) cash | | 7.08 | % | | 2,018,206 |
| | 2,000,877 |
| | 1,453,109 |
|
| Central Security Group, Inc. (3) | | Specialized consumer services | | First Lien Term Loan | | 10/6/2021 | | LIBOR+5.625% (1% floor) cash | | 6.86 | % | | 3,876,067 |
| | 3,880,408 |
| | 3,892,211 |
|
| Aptos, Inc. (3) | | Data processing & outsourced services | | First Lien Term Loan B | | 9/1/2022 | | LIBOR+6.75% (1% floor) cash | | 8.08 | % | | 7,920,000 |
| | 7,790,262 |
| | 7,840,800 |
|
| Vubiquity, Inc. | | Application software | | First Lien Term Loan | | 8/12/2021 | | LIBOR+5.5% (1% floor) cash | | 6.83 | % | | 4,126,500 |
| | 4,099,195 |
| | 4,095,551 |
|
| Poseidon Merger Sub, Inc. (3) | | Advertising | | Second Lien Term Loan | | 8/15/2023 | | LIBOR+8.5% (1% floor) cash | | 9.81 | % | | 3,000,000 |
| | 2,933,633 |
| | 3,030,000 |
|
| Novetta Solutions, LLC | | Diversified support services | | First Lien Term Loan | | 10/16/2022 | | LIBOR+5% (1% floor) cash | | 6.34 | % | | 5,990,978 |
| | 5,932,073 |
| | 5,826,226 |
|
| SHO Holding I Corporation | | Footwear | | First Lien Term Loan | | 10/27/2022 | | LIBOR+5% (1% floor) cash | | 6.24 | % | | 6,386,250 |
| | 6,338,479 |
| | 6,306,422 |
|
| Valet Merger Sub, Inc. (3) | | Environmental & facilities services | | First Lien Term Loan | | 9/24/2021 | | LIBOR+7% (1% floor) cash | | 8.24 | % | | 3,920,000 |
| | 3,877,655 |
| | 3,919,865 |
|
| | | Environmental & facilities services | | Incremental Term Loan | | 9/24/2021 | | LIBOR+7% (1% floor) cash | | 8.24 | % | | 1,027,425 |
| | 1,006,080 |
| | 1,027,390 |
|
| Total Valet Merger Sub, Inc. | | | | | | | | | | | | 4,947,425 |
| | 4,883,735 |
| | 4,947,255 |
|
| RSC Acquisition, Inc. | | Insurance brokers | | First Lien Term Loan | | 11/30/2022 | | LIBOR+5.25% (1% floor) cash | | 6.58 | % | | 3,930,134 |
| | 3,912,198 |
| | 3,890,832 |
|
| Integro Parent Inc. | | Insurance brokers | | First Lien Term Loan | | 10/31/2022 | | LIBOR+5.75% (1% floor) cash | | 7.06 | % | | 4,913,924 |
| | 4,790,511 |
| | 4,901,639 |
|
| TruckPro, LLC | | Auto parts & equipment | | First Lien Term Loan | | 8/6/2018 | | LIBOR+5% (1% floor) cash | | 6.24 | % | | 1,823,268 |
| | 1,821,822 |
| | 1,825,054 |
|
| Falmouth Group Holdings Corp. | | Specialty chemicals | | First Lien Term Loan | | 12/13/2021 | | LIBOR+6.75% (1% floor) cash | | 8.08 | % | | 4,610,174 |
| | 4,572,990 |
| | 4,610,400 |
|
| Ancile Solutions, Inc. (3) | | Internet software & services | | First Lien Term Loan | | 6/30/2021 | | LIBOR+7% (1% floor) cash | | 8.33 | % | | 4,042,355 |
| | 3,995,621 |
| | 4,010,198 |
|
| California Pizza Kitchen, Inc. | | Restaurants | | First Lien Term Loan | | 8/23/2022 | | LIBOR+6% (1% floor) cash | | 7.24 | % | | 4,950,000 |
| | 4,938,077 |
| | 4,917,008 |
|
| MHE Intermediate Holdings, LLC (3) | | Diversified support services | | First Lien Term Loan B | | 3/11/2024 | | LIBOR+5% (1% floor) cash | | 6.33 | % | | 4,228,750 |
| | 4,150,304 |
| | 4,228,752 |
|
| | | Diversified support services | | Delayed Draw Term Loan | | 3/11/2024 | | LIBOR+5% (1% floor) cash | | 6.33 | % | | 667,510 |
| | 635,208 |
| | 667,510 |
|
| Total MHE Intermediate Holdings, LLC | | | | | | | | | | | | 4,896,260 |
| | 4,785,512 |
| | 4,896,262 |
|
| Total Portfolio Investments | | | | | | | | | | | | $ | 115,964,537 |
| | $ | 116,978,493 |
| | $ | 108,737,459 |
|
__________
(1) Represents the current interest rate as of September 30, 2017. All interest rates are payable in cash, unless otherwise noted.
(2) Represents the current determination of fair value as of September 30, 2017 utilizing a similar technique as the Company in accordance with ASC 820. However, the determination of such fair value is not included in the Company's Board of Directors' valuation process described elsewhere herein.
OAKTREE STRATEGIC INCOME CORPORATION
NOTES TO CONSOLIDATED FINANCIAL STATEMENTS
(3) This investment is held by both the Company and FSFR Glick JV as of September 30, 2017.
(4) The interest rate on the principal balance outstanding for all floating rate loans is indexed to LIBOR and/or an alternate base rate (e.g., prime rate), which typically resets semi-annually, quarterly, or monthly at the borrower's option. The borrower may also elect to have multiple interest reset periods for each loan. For each of these loans, the Company has provided the applicable margin over LIBOR or the alternate base rate based on each respective credit agreement.
(5) This investment was on cash non-accrual status as of September 30, 2017.
FSFR Glick JV Portfolio as of September 30, 2016
| | Portfolio Company (4) | | Industry | | Investment Type | | Maturity Date | | Current Interest Rate (1) | | Principal | | Cost | | Fair Value (2) | | Industry | | Investment Type | | Maturity Date | | Current Interest Rate (1)(4) | | Cash Interest Rate (1) | | Principal | | Cost | | Fair Value (2) |
| Ameritox Ltd. (3) | | Healthcare services | | First Lien Term Loan | | 4/11/2021 | | LIBOR+5% (1% floor) cash 3% PIK | | $2,339,146 | | $2,336,840 | | $2,322,917 | | Healthcare services | | First Lien Term Loan | | 4/11/2021 | | LIBOR+5% (1% floor) cash 3% PIK | | 6.00 | % | | $2,339,146 | | $2,336,840 | | $2,322,917 |
| | | Healthcare services | | 119,910.76 Class B Preferred Units | | — |
| | 119,911 |
| | 131,369 |
| | Healthcare services | | 119,910.76 Class B Preferred Units | | | | — |
| | 119,911 |
| | 131,369 |
|
| | | Healthcare services | | 368.96 Class A Common Units | | — |
| | 2,174,034 |
| | 981,348 |
| | Healthcare services | | 368.96 Class A Common Units | | | | — |
| | 2,174,034 |
| | 981,348 |
|
| Total Ameritox, Ltd | | 2,339,146 |
| | 4,630,785 |
| | 3,435,634 |
| |
| Total Ameritox Ltd | | | | | 2,339,146 |
| | 4,630,785 |
| | 3,435,634 |
|
| Answers Corporation (3) (5) | | Internet software & services | | First Lien Term Loan | | 10/3/2021 | | LIBOR+5.25% (1% floor) cash | | 7,899,749 |
| | 7,636,708 |
| | 4,265,865 |
| | Internet software & services | | First Lien Term Loan | | 10/3/2021 | | LIBOR+5.25% (1% floor) cash | | 6.25 | % | | 7,899,749 |
| | 7,636,708 |
| | 4,265,865 |
|
| Beyond Trust Software, Inc. (3) | | Application software | | First Lien Term Loan | | 9/25/2019 | | LIBOR+7% (1% floor) cash | | 12,641,009 |
| | 12,554,571 |
| | 12,538,499 |
| | Application software | | First Lien Term Loan | | 9/25/2019 | | LIBOR+7% (1% floor) cash | | 8.00 | % | | 12,641,009 |
| | 12,554,571 |
| | 12,538,499 |
|
| Compuware Corporation (3) | | Internet software & services | | First Lien Term Loan B1 | | 12/15/2019 | | LIBOR+5.25% (1% floor) cash | | 7,392,405 |
| | 7,306,444 |
| | 7,420,127 |
| | Internet software & services | | First Lien Term Loan B1 | | 12/15/2019 | | LIBOR+5.25% (1% floor) cash | | 6.25 | % | | 7,392,405 |
| | 7,306,444 |
| | 7,420,127 |
|
| Metamorph US 3, LLC (3) | | Internet software & services | | First Lien Term Loan | | 12/1/2020 | | LIBOR+6.5% (1% floor) cash | | 6,900,283 |
| | 6,808,009 |
| | 5,744,139 |
| | Internet software & services | | First Lien Term Loan | | 12/1/2020 | | LIBOR+6.5% (1% floor) cash | | 7.50 | % | | 6,900,283 |
| | 6,808,009 |
| | 5,744,139 |
|
| Motion Recruitment Partners LLC (3) | | Diversified support services | | First Lien Term Loan | | 2/13/2020 | | LIBOR+6% (1% floor) cash | | 9,125,000 |
| | 9,125,000 |
| | 9,099,254 |
| | Diversified support services | | First Lien Term Loan | | 2/13/2020 | | LIBOR+6% (1% floor) cash | | 7.00 | % | | 9,125,000 |
| | 9,125,000 |
| | 9,099,254 |
|
| NAVEX Global, Inc. (3) | | Internet software & services | | First Lien Term Loan | | 11/19/2021 | | LIBOR+4.75% (1% floor) cash | | 1,793,550 |
| | 1,779,633 |
| | 1,784,582 |
| | Internet software & services | | First Lien Term Loan | | 11/19/2021 | | LIBOR+4.75% (1% floor) cash | | 5.99 | % | | 1,793,550 |
| | 1,779,633 |
| | 1,784,582 |
|
| Teaching Strategies, LLC | | Education services | | First Lien Term Loan (3) | | 10/1/2019 | | LIBOR+5.5% (0.5% floor) cash | | 2,570,471 |
| | 2,567,575 |
| | 2,556,891 |
| | Education services | | First Lien Term Loan (3) | | 10/1/2019 | | LIBOR+5.5% (0.5% floor) cash | | 6.34 | % | | 2,570,471 |
| | 2,567,575 |
| | 2,556,891 |
|
| | | Education services | | First Lien Delayed Draw Term Loan | | 10/1/2019 | | LIBOR+5.5% (0.5% floor) cash | | 6,840,000 |
| | 6,832,715 |
| | 6,803,695 |
| | Education services | | First Lien Delayed Draw Term Loan | | 10/1/2019 | | LIBOR+5.5% (0.5% floor) cash | | 6.34 | % | | 6,840,000 |
| | 6,832,715 |
| | 6,803,695 |
|
| Total Teaching Strategies, LLC | | 9,410,471 |
| | 9,400,290 |
| | 9,360,586 |
| | | | 9,410,471 |
| | 9,400,290 |
| | 9,360,586 |
|
| TrialCard Incorporated (3) | | Healthcare services | | First Lien Term Loan | | 12/31/2019 | | LIBOR+4.5% (1% floor) cash | | 7,179,097 |
| | 7,144,396 |
| | 7,144,248 |
| | Healthcare services | | First Lien Term Loan | | 12/31/2019 | | LIBOR+4.5% (1% floor) cash | | 5.50 | % | | 7,179,097 |
| | 7,144,396 |
| | 7,144,248 |
|
| Air Newco LLC | | IT consulting & other services | | First Lien Term Loan B | | 3/20/2022 | | LIBOR+5.5% (1% floor) cash | | 8,291,864 |
| | 8,267,671 |
| | 7,960,189 |
| | IT consulting & other services | | First Lien Term Loan B | | 3/20/2022 | | LIBOR+5.5% (1% floor) cash | | 6.50 | % | | 8,291,864 |
| | 8,267,671 |
| | 7,960,189 |
|
| Fineline Technologies, Inc. (3) | | Electronic equipment & instruments | | First Lien Term Loan | | 5/5/2017 | | LIBOR+5.5% (1% floor) cash | | 7,034,441 |
| | 7,010,963 |
| | 7,015,051 |
| | Electronic equipment & instruments | | First Lien Term Loan | | 5/5/2017 | | LIBOR+5.5% (1% floor) cash | | 6.50 | % | | 7,034,441 |
| | 7,010,963 |
| | 7,015,051 |
|
| LegalZoom.com, Inc. (3) | | Specialized consumer services | | First Lien Term Loan | | 5/13/2020 | | LIBOR+7% (1% floor) cash | | 9,850,000 |
| | 9,672,034 |
| | 9,772,706 |
| | Specialized consumer services | | First Lien Term Loan | | 5/13/2020 | | LIBOR+7% (1% floor) cash | | 8.00 | % | | 9,850,000 |
| | 9,672,034 |
| | 9,772,706 |
|
| GK Holdings, Inc. | | IT consulting & other services | | First Lien Term Loan | | 1/20/2021 | | LIBOR+5.5% (1% floor) cash | | 3,438,750 |
| | 3,452,038 |
| | 3,412,959 |
| | IT consulting & other services | | First Lien Term Loan | | 1/20/2021 | | LIBOR+5.5% (1% floor) cash | | 6.50 | % | | 3,438,750 |
| | 3,452,038 |
| | 3,412,959 |
|
| Vitera Healthcare Solutions, LLC | | Healthcare technology | | Second Lien Term Loan | | 11/4/2021 | | LIBOR+8.25% (1% floor) cash | | 3,000,000 |
| | 2,958,409 |
| | 2,782,500 |
| | Healthcare technology | | Second Lien Term Loan | | 11/4/2021 | | LIBOR+8.25% (1% floor) cash | | 9.25 | % | | 3,000,000 |
| | 2,958,409 |
| | 2,782,500 |
|
| TIBCO Software, Inc. (3) | | Internet software & services | | First Lien Term Loan | | 12/4/2020 | | LIBOR+5.5% (1% floor) cash | | 2,304,900 |
| | 2,308,815 |
| | 2,277,114 |
| | Internet software & services | | First Lien Term Loan | | 12/4/2020 | | LIBOR+5.5% (1% floor) cash | | 6.50 | % | | 2,304,900 |
| | 2,308,815 |
| | 2,277,114 |
|
| CM Delaware LLC | | Advertising | | First Lien Term Loan | | 3/18/2021 | | LIBOR+5.25% (1% floor) cash | | 2,096,666 |
| | 2,094,658 |
| | 1,978,729 |
| | Advertising | | First Lien Term Loan | | 3/18/2021 | | LIBOR+5.25% (1% floor) cash | | 6.25 | % | | 2,096,666 |
| | 2,094,658 |
| | 1,978,729 |
|
| New Trident Holdcorp, Inc. (3) | | Healthcare services | | First Lien Term Loan B | | 7/31/2019 | | LIBOR+5.25% (1.25% floor) cash | | 2,041,357 |
| | 2,014,233 |
| | 1,755,567 |
| | Healthcare services | | First Lien Term Loan B | | 7/31/2019 | | LIBOR+5.25% (1.25% floor) cash | | 6.50 | % | | 2,041,357 |
| | 2,014,233 |
| | 1,755,567 |
|
| Central Security Group, Inc. (3) | | Specialized consumer services | | First Lien Term Loan | | 10/6/2020 | | LIBOR+5.625% (1% floor) cash | | 5,909,774 |
| | 5,915,626 |
| | 5,776,805 |
| | Specialized consumer services | | First Lien Term Loan | | 10/6/2020 | | LIBOR+5.625% (1% floor) cash | | 6.63 | % | | 5,909,774 |
| | 5,915,626 |
| | 5,776,805 |
|
| Auction.com, LLC | | | Internet software & services | | First Lien Term Loan | | 5/12/2019 | | LIBOR+5% (1% floor) cash | | 6.00 | % | | 3,940,000 |
| | 3,926,700 |
| | 3,959,700 |
|
| Aptos, Inc. (3) | | | Data processing & outsourced services | | First Lien Term Loan B | | 9/1/2022 | | LIBOR+6.75% (1% floor) cash | | 7.75 | % | | 8,000,000 |
| | 7,842,222 |
| | 7,920,000 |
|
| Vubiquity, Inc. | | | Application software | | First Lien Term Loan | | 8/12/2021 | | LIBOR+5.5% (1% floor) cash | | 6.50 | % | | 4,168,500 |
| | 4,133,700 |
| | 4,147,658 |
|
| Too Faced Cosmetics, LLC (3) | | | Personal products | | First Lien Term Loan B | | 7/7/2021 | | LIBOR+5% (1% floor) cash | | 6.00 | % | | 642,692 |
| | 581,620 |
| | 645,155 |
|
| American Seafoods Group LLC (3) | | | Food distributors | | First Lien Term Loan | | 8/19/2021 | | LIBOR+5% (1% floor) cash | | 6.00 | % | | 3,853,704 |
| | 3,837,366 |
| | 3,844,069 |
|
| Worley Claims Services, LLC | | | Internet software & services | | First Lien Term Loan | | 10/31/2020 | | LIBOR+8% (1% floor) cash | | 9.00 | % | | 5,730,937 |
| | 5,707,511 |
| | 5,702,282 |
|
FIFTH STREET SENIOR FLOATING RATE CORP.OAKTREE STRATEGIC INCOME CORPORATION
NOTES TO CONSOLIDATED FINANCIAL STATEMENTS
| | | Auction.com, LLC | | Internet software & services | | First Lien Term Loan | | 5/12/2019 | | LIBOR+5% (1% floor) cash | | 3,940,000 |
| | 3,926,700 |
| | 3,959,700 |
| |
| Aptos, Inc. (3) | | Data processing & outsourced services | | First Lien Term Loan B | | 9/1/2022 | | LIBOR+6.75% (1% floor) cash | | 8,000,000 |
| | 7,842,222 |
| | 7,920,000 |
| |
| Vubiquity, Inc. | | Application software | | First Lien Term Loan | | 8/12/2021 | | LIBOR+5.5% (1% floor) cash | | 4,168,500 |
| | 4,133,700 |
| | 4,147,658 |
| |
| Too Faced Cosmetics, LLC (3) | | Personal products | | First Lien Term Loan B | | 7/7/2021 | | LIBOR+5% (1% floor) cash | | 642,692 |
| | 581,620 |
| | 645,155 |
| |
| American Seafoods Group LLC (3) | | Food distributors | | First Lien Term Loan | | 8/19/2021 | | LIBOR+5% (1% floor) cash | | 3,853,704 |
| | 3,837,366 |
| | 3,844,069 |
| |
| Worley Claims Services, LLC | | Internet software & services | | First Lien Term Loan | | 10/31/2020 | | LIBOR+8% (1% floor) cash | | 5,730,937 |
| | 5,707,511 |
| | 5,702,282 |
| |
| Portfolio Company | | | Industry | | Investment Type | | Maturity Date | | Current Interest Rate (1)(4) | | Cash Interest Rate (1) | | Principal | | Cost | | Fair Value (2) |
| Poseidon Merger Sub, Inc. (3) | | Advertising | | Second Lien Term Loan | | 8/15/2023 | | LIBOR+8.5% (1% floor) cash | | 3,000,000 |
| | 2,922,316 |
| | 3,039,954 |
| | Advertising | | Second Lien Term Loan | | 8/15/2023 | | LIBOR+8.5% (1% floor) cash | | 9.50 | % | | $ | 3,000,000 |
| | $ | 2,922,316 |
| | $ | 3,039,954 |
|
| AccentCare, Inc. | | Healthcare services | | First Lien Term Loan | | 9/3/2021 | | LIBOR+5.75% (1% floor) cash | | 7,850,000 |
| | 7,773,386 |
| | 7,727,344 |
| | Healthcare services | | First Lien Term Loan | | 9/3/2021 | | LIBOR+5.75% (1% floor) cash | | 6.75 | % | | 7,850,000 |
| | 7,773,386 |
| | 7,727,344 |
|
| Novetta Solutions, LLC | | Diversified support services | | First Lien Term Loan | | 10/17/2022 | | LIBOR+5.75% (1% floor) cash | | 6,477,948 |
| | 6,392,100 |
| | 6,226,928 |
| | Diversified support services | | First Lien Term Loan | | 10/17/2022 | | LIBOR+5.75% (1% floor) cash | | 6.00 | % | | 6,477,948 |
| | 6,392,100 |
| | 6,226,928 |
|
| SHO Holding I Corporation | | Footwear | | First Lien Term Loan | | 10/27/2022 | | LIBOR+5% (1% floor) cash | | 6,451,250 |
| | 6,393,472 |
| | 6,443,186 |
| | Footwear | | First Lien Term Loan | | 10/27/2022 | | LIBOR+5% (1% floor) cash | | 6.00 | % | | 6,451,250 |
| | 6,393,472 |
| | 6,443,186 |
|
| Valet Merger Sub, Inc. (3) | | Environmental & facilities services | | First Lien Term Loan | | 9/24/2021 | | LIBOR+7% (1% floor) cash | | 3,960,000 |
| | 3,906,498 |
| | 4,026,826 |
| | Environmental & facilities services | | First Lien Term Loan | | 9/24/2021 | | LIBOR+7% (1% floor) cash | | 8.00 | % | | 3,960,000 |
| | 3,906,498 |
| | 4,026,826 |
|
| RSC Acquisition, Inc. | | Insurance brokers | | First Lien Term Loan | | 11/30/2022 | | LIBOR+5.25% (1% floor) cash | | 3,970,390 |
| | 3,948,754 |
| | 3,950,538 |
| | Insurance brokers | | First Lien Term Loan | | 11/30/2022 | | LIBOR+5.25% (1% floor) cash | | 6.25 | % | | 3,970,390 |
| | 3,948,754 |
| | 3,950,538 |
|
| Integro Parent Inc. | | Insurance brokers | | First Lien Term Loan | | 10/31/2022 | | LIBOR+5.75% (1% floor) cash | | 4,963,924 |
| | 4,814,658 |
| | 4,889,465 |
| | Insurance brokers | | First Lien Term Loan | | 10/31/2022 | | LIBOR+5.75% (1% floor) cash | | 6.75 | % | | 4,963,924 |
| | 4,814,658 |
| | 4,889,465 |
|
| TruckPro, LLC | | Auto parts & equipment | | First Lien Term Loan | | 8/6/2018 | | LIBOR+5% (1% floor) cash | | 1,920,000 |
| | 1,916,612 |
| | 1,919,232 |
| | Auto parts & equipment | | First Lien Term Loan | | 8/6/2018 | | LIBOR+5% (1% floor) cash | | 6.00 | % | | 1,920,000 |
| | 1,916,612 |
| | 1,919,232 |
|
| Falmouth Group Holdings Corp. | | Specialty chemicals | | First Lien Term Loan | | 12/13/2021 | | LIBOR+6.75% (1% floor) cash | | 4,962,500 |
| | 4,912,596 |
| | 4,967,689 |
| | Specialty chemicals | | First Lien Term Loan | | 12/13/2021 | | LIBOR+6.75% (1% floor) cash | | 7.75 | % | | 4,962,500 |
| | 4,912,596 |
| | 4,967,689 |
|
| Sundial Group Holdings LLC | | Personal products | | First Lien Term Loan | | 10/19/2021 | | LIBOR+6.25% (1% floor) cash | | 3,900,000 |
| | 3,839,938 |
| | 3,954,402 |
| | Personal products | | First Lien Term Loan | | 10/19/2021 | | LIBOR+6.25% (1% floor) cash | | 7.25 | % | | 3,900,000 |
| | 3,839,938 |
| | 3,954,402 |
|
| Onvoy, LLC (3) | | Integrated telecommunication services | | First Lien Term Loan | | 4/29/2021 | | LIBOR+6.25% (1% floor) cash | | 7,406,250 |
| | 7,261,422 |
| | 7,386,738 |
| | Integrated telecommunication services | | First Lien Term Loan | | 4/29/2021 | | LIBOR+6.25% (1% floor) cash | | 7.25 | % | | 7,406,250 |
| | 7,261,422 |
| | 7,386,738 |
|
| Ancile Solutions, Inc. (3) | | Internet software & services | | First Lien Term Loan | | 6/30/2021 | | LIBOR+7% (1% floor) cash | | 4,500,000 |
| | 4,433,644 |
| | 4,432,500 |
| | Internet software & services | | First Lien Term Loan | | 6/30/2021 | | LIBOR+7% (1% floor) cash | | 8.00 | % | | 4,500,000 |
| | 4,433,644 |
| | 4,432,500 |
|
| Total Portfolio Investments | | $ | 194,346,557 |
| | $ | 194,624,798 |
| | $ | 188,708,220 |
| | | | $ | 194,346,557 |
| | $ | 194,624,798 |
| | $ | 188,708,220 |
|
___________________
(1) Represents the current interest rate as of September 30, 2016. All interest rates are payable in cash, unless otherwise noted.
(2) Represents the current determination of fair value as of September 30, 2016 utilizing a similar processtechnique as the Company in accordance with ASC 820. However, the determination of such fair value is not included in the Company's Board of Directors' valuation process described elsewhere herein.
(3) This investment is held by both the Company and FSFR Glick JV as of September 30, 2016.
(4) The interest rate on the principal balance outstanding for all floating rate loans is indexed to LIBOR andand/or an alternate base rate (e.g., prime rate), which typically resets semi-annually, quarterly, or monthly at the borrower's option. The borrower may also elect to have multiple interest reset periods for each loan. For each of these loans, the Company has provided the applicable margin over LIBOR or the alternate base rate based on each respective credit agreement.
(5) This investment was on cash non-accrual status as of September 30, 2016.
FIFTH STREET SENIOR FLOATING RATE CORP.
NOTES TO CONSOLIDATED FINANCIAL STATEMENTS
FSFR Glick JV Portfolio as of September 30, 2015
|
| | | | | | | | | | | | | | | | | | | | |
| Portfolio Company (4) | | Industry | | Investment Type | | Maturity Date | | Current Interest Rate (1) | | Principal | | Cost | | Fair Value (2) |
| Accruent, LLC (3) | | Internet software & services | | First Lien Term Loan | | 11/25/2019 | | LIBOR +6.25% (1% floor) cash | | $ | 14,777,933 |
| | $ | 14,576,963 |
| | $ | 14,853,895 |
|
| Ameritox Ltd. (3) | | Healthcare services | | First Lien Term Loan | | 6/23/2019 | | LIBOR+7.5% (1% floor) cash | | 7,794,458 |
| | 7,661,251 |
| | 7,048,923 |
|
| Answers Corporation (3) | | Internet software & services | | First Lien Term Loan | | 10/1/2021 | | LIBOR+5.25% (1% floor) cash | | 7,959,900 |
| | 7,658,675 |
| | 5,857,173 |
|
| Beyond Trust Software, Inc. (3) | | Application software | | First Lien Term Loan | | 9/25/2019 | | LIBOR+7% (1% floor) cash | | 13,665,783 |
| | 13,549,710 |
| | 13,549,671 |
|
| Compuware Corporation (3) | | Internet software & services | | First Lien Term Loan B1 | | 12/15/2019 | | LIBOR+5.25% (1% floor) cash | | 7,797,468 |
| | 7,684,361 |
| | 7,551,848 |
|
| Idera, Inc. (3) | | Internet software & services | | First Lien Term Loan | | 11/5/2020 | | LIBOR+5.5% (0.5% floor) cash | | 3,160,000 |
| | 3,134,841 |
| | 3,160,000 |
|
| Metamorph US 3, LLC (3) | | Internet software & services | | First Lien Term Loan | | 12/1/2020 | | LIBOR+5.5% (1% floor) cash | | 8,398,019 |
| | 8,283,147 |
| | 8,310,898 |
|
| Motion Recruitment Partners LLC (3) | | Diversified support services | | First Lien Term Loan | | 2/13/2020 | | LIBOR+6% (1% floor) cash | | 9,562,500 |
| | 9,562,500 |
| | 9,459,652 |
|
| NAVEX Global, Inc. (3) | | Internet software & services | | First Lien Term Loan | | 11/19/2021 | | LIBOR+4.75% (1% floor) cash | | 2,435,442 |
| | 2,429,788 |
| | 2,423,265 |
|
| Teaching Strategies, LLC (3) | | Education services | | First Lien Term Loan | | 10/1/2019 | | LIBOR+5.5% (0.5% floor) cash | | 2,695,442 |
| | 2,691,552 |
| | 2,673,135 |
|
| | | Education services | | First Lien Delayed Draw Term Loan | | 10/1/2019 | | LIBOR+5.5% (0.5% floor) cash | | 7,020,000 |
| | 7,010,218 |
| | 6,961,725 |
|
| Total Teaching Strategies, LLC | | | | | | | | | | 9,715,442 |
| | 9,701,770 |
| | 9,634,860 |
|
| TrialCard Incorporated (3) | | Healthcare services | | First Lien Term Loan | | 12/31/2019 | | LIBOR+5% (1% floor) cash | | 7,332,387 |
| | 7,286,727 |
| | 7,232,017 |
|
| Air Newco LLC | | IT consulting & other services | | First Lien Term Loan B | | 3/20/2022 | | LIBOR+5.5% (1% floor) cash | | 5,970,000 |
| | 6,004,722 |
| | 5,977,463 |
|
| Fineline Technologies, Inc. (3) | | Electronic equipment & instruments | | First Lien Term Loan | | 5/5/2017 | | LIBOR+5.5% (1% floor) cash | | 8,820,000 |
| | 8,749,565 |
| | 8,818,256 |
|
| LegalZoom.com, Inc. (3) | | Specialized consumer services | | First Lien Term Loan | | 5/13/2020 | | LIBOR+7% (1% floor) cash | | 9,950,000 |
| | 9,721,186 |
| | 9,882,838 |
|
| GK Holdings, Inc. | | IT consulting & other services | | First Lien Term Loan | | 1/20/2021 | | LIBOR+5.5% (1% floor) cash | | 3,473,750 |
| | 3,490,164 |
| | 3,460,723 |
|
| Vitera Healthcare Solutions, LLC | | Healthcare technology | | Second Lien Term Loan | | 11/4/2021 | | LIBOR+8.25% (1% floor) cash | | 3,000,000 |
| | 2,950,227 |
| | 2,925,000 |
|
| TIBCO Software, Inc. (3) | | Internet software & services | | First Lien Term Loan | | 12/4/2020 | | LIBOR+5.5% (1% floor) cash | | 2,328,300 |
| | 2,333,155 |
| | 2,310,838 |
|
| CM Delaware LLC | | Advertising | | First Lien Term Loan | | 3/18/2021 | | LIBOR+5.25% (1% floor) cash | | 2,152,041 |
| | 2,149,579 |
| | 2,143,971 |
|
| New Trident Holdcorp, Inc. (3) | | Healthcare services | | First Lien Term Loan B | | 7/31/2019 | | LIBOR+5.25% (1.25% floor) cash | | 2,064,508 |
| | 2,027,520 |
| | 2,000,003 |
|
| Central Security Group, Inc. (3) | | Specialized consumer services | | First Lien Term Loan | | 10/6/2020 | | LIBOR+5.25% (1% floor) cash | | 5,969,925 |
| | 5,977,239 |
| | 5,910,225 |
|
| Language Line, LLC (3) | | Integrated telecommunication services | | First Lien Term Loan | | 7/7/2021 | | LIBOR+5.5% (1% floor) cash | | 10,000,000 |
| | 10,013,409 |
| | 10,020,850 |
|
| All Web Leads, Inc. (3) | | Advertising | | First Lien Term Loan | | 6/30/2020 | | LIBOR+6.5% (1% floor) cash | | 9,937,500 |
| | 9,700,212 |
| | 9,884,905 |
|
| Auction.com, LLC | | Internet software & services | | First Lien Term Loan | | 5/12/2019 | | LIBOR+5% (1% floor) cash | | 3,980,000 |
| | 3,961,380 |
| | 3,970,050 |
|
| Aptos, Inc. (3) | | Data processing & outsourced services | | First Lien Term Loan B | | 6/23/2022 | | LIBOR+5.25% (0.75% floor) cash | | 7,980,000 |
| | 7,999,277 |
| | 7,960,050 |
|
| Vubiquity, Inc. | | Application software | | First Lien Term Loan | | 8/12/2021 | | LIBOR+5.5% (1% floor) cash | | 4,200,000 |
| | 4,158,000 |
| | 4,179,000 |
|
| Too Faced Cosmetics, LLC (3) | | Personal products | | First Lien Term Loan B | | 7/7/2021 | | LIBOR+5% (1% floor) cash | | 3,000,000 |
| | 2,926,072 |
| | 3,000,000 |
|
| American Seafoods Group LLC (3) | | Food distributors | | First Lien Term Loan | | 8/19/2021 | | LIBOR+5% (1% floor) cash | | 4,000,000 |
| | 3,980,282 |
| | 3,980,000 |
|
| Worley Claims Services, LLC (3) | | Internet software & services | | First Lien Term Loan | | 10/31/2020 | | LIBOR+8% (1% floor) cash | | 4,339,095 |
| | 4,317,702 |
| | 4,317,400 |
|
| Poseidon Merger Sub, Inc. (3) | | Advertising | | Second Lien Term Loan | | 8/15/2023 | | LIBOR+8.5% (1% floor) cash | | 3,000,000 |
| | 2,910,947 |
| | 3,000,000 |
|
| Total Portfolio Investments | | | | | | | | | | $ | 186,764,451 |
| | $ | 184,900,371 |
| | $ | 182,823,774 |
|
FIFTH STREET SENIOR FLOATING RATE CORP.
NOTES TO CONSOLIDATED FINANCIAL STATEMENTS
__________
(1) Represents the current interest rate as of September 30, 2015. All interest rates are payable in cash, unless otherwise noted.
(2) Represents the fair value determined utilizing a similar process as the Company in accordance with ASC 820. However, the determination of such fair value is not included in the Company's Board of Directors' valuation process described elsewhere herein.
(3) This investment is held by both the Company and FSFR Glick JV as of September 30, 2015.
(4) The interest rate on the principal balance outstanding for all floating rate loans is indexed to LIBOR and an alternate base rate (e.g., prime rate), which typically resets semi-annually, quarterly, or monthly at the borrower's option. The borrower may also elect to have multiple interest reset periods for each loan. For each of these loans, the Company has provided the applicable margin over LIBOR based on each respective credit agreement.
The amortized cost and fair value of the Subordinated Notes held by the CompanyCompany's aggregate investment in FSFR Glick JV was $64.0$71.3 million and $56.9$57.6 million, respectively, as of September 30, 20162017 and $53.1$71.1 million and $52.6$63.3 million, respectively, as of September 30, 2015.2016. The Subordinated Notes pay a weighted average interest rate of LIBOR plus 8.0% per annum. For the years ended September 30, 20162017 and September 30, 2015,2016, the Company earned interest income of $5.1$5.8 million and $1.8$5.1 million, respectively, on its investment in the Subordinated Notes. The cost and fair valueCompany reversed $0.6 million of dividend income previously recorded in prior periods during the year ended September 30, 2017 with respect to its LLC equity interests held bysince the Company was $7.1 million and $6.4 million, respectively, as of September 30, 2016 and $5.9 million and $4.6 million, respectively, as of September 30, 2015.determined that such dividend payments may no longer be collectible. The Company earned dividend income of $2.7 million and $0.7 million for the yearsyear ended September 30, 2016 and September 30, 2015, respectively, with respect to its LLC equity interests. The LLC equity interests are dividend producing to the extent there is residual incomecash to be distributed on a quarterly basis.
OAKTREE STRATEGIC INCOME CORPORATION
NOTES TO CONSOLIDATED FINANCIAL STATEMENTS
Below is certain summarized financial information for FSFR Glick JV as of September 30, 20162017 and September 30, 20152016 and for the years ended September 30, 20162017 and September 30, 2015:2016:
| | | | | September 30, 2016 | | September 30, 2015 | | September 30, 2017 | | September 30, 2016 |
| Selected Balance Sheet Information: | | | | | | | | |
| Investments in loans at fair value (cost September 30, 2016: $194,624,798; cost September 30, 2015: $184,900,371) | | $ | 188,708,220 |
| | $ | 182,823,774 |
| |
| Investments in loans at fair value (cost September 30, 2017: $116,978,493; cost September 30, 2016: $194,624,798) | | | $ | 108,737,459 |
| | $ | 188,708,220 |
|
| Receivable from secured financing arrangement at fair value (September 30, 2016 cost: $5,000,000) | | 4,985,425 |
| | — |
| | — |
| | 4,985,425 |
|
| Cash and cash equivalents | | 980,605 |
| | 3,127,824 |
| | 13,891,899 |
| | 980,605 |
|
| Restricted cash | | 3,343,303 |
| | 2,188,133 |
| | 2,249,575 |
| | 3,343,303 |
|
| Receivable from unsettled transactions | | 952,591 |
| | — |
| | — |
| | 952,591 |
|
| Due from portfolio companies | | | 7,653 |
| | — |
|
| Other assets | | 2,162,942 |
| | 2,253,143 |
| | 1,791,077 |
| | 2,162,942 |
|
| Total assets | | $ | 201,133,086 |
| | $ | 190,392,874 |
| | $ | 126,677,663 |
| | $ | 201,133,086 |
|
| | | | | | | | | |
| Senior credit facility payable | | $ | 124,615,636 |
| | $ | 122,380,636 |
| | $ | 56,881,939 |
| | $ | 124,615,636 |
|
| Subordinated notes payable at fair value (proceeds September 30, 2016: $73,149,434; proceeds September 30, 2015: $60,680,682) | | 65,012,167 |
| | 60,118,109 |
| |
| Subordinated notes payable at fair value (proceeds September 30, 2017: $73,404,435; cost September 30, 2016: $73,149,434) | | | 65,836,199 |
| | 65,012,167 |
|
| Other liabilities | | 4,196,688 |
| | 2,690,043 |
| | 3,959,525 |
| | 4,196,688 |
|
| Total liabilities | | $ | 193,824,491 |
| | $ | 185,188,788 |
| | $ | 126,677,663 |
| | $ | 193,824,491 |
|
| Members' equity | | 7,308,595 |
| | 5,204,086 |
| | — |
| | 7,308,595 |
|
| Total liabilities and members' equity | | $ | 201,133,086 |
| | $ | 190,392,874 |
| | $ | 126,677,663 |
| | $ | 201,133,086 |
|
FIFTH STREET SENIOR FLOATING RATE CORP.
NOTES TO CONSOLIDATED FINANCIAL STATEMENTS
| | | | | Year ended
September 30, 2016 | | Year ended
September 30, 2015 | | Year ended
September 30, 2017 | | Year ended
September 30, 2016 |
| Selected Statement of Operations Information: | | | | | |
| Selected Statements of Operations Information: | | | | | |
| Interest income | | $ | 14,109,946 |
| | $ | 4,295,162 |
| | $ | 11,148,203 |
| | $ | 14,109,946 |
|
| PIK interest income | | 33,170 |
| | — |
| | 53,620 |
| | 33,170 |
|
| Fee income | | 95,756 |
| | — |
| | 160,984 |
| | 95,756 |
|
| Total investment income | | 14,238,872 |
| | 4,295,162 |
| | 11,362,807 |
| | 14,238,872 |
|
| Interest expense | | 10,780,919 |
| | 3,408,486 |
| | 11,055,880 |
| | 10,780,919 |
|
| Other expenses | | 283,267 |
| | 56,281 |
| | 224,559 |
| | 283,267 |
|
| Total expenses (1) | | 11,064,186 |
| | 3,464,767 |
| | 11,280,439 |
| | 11,064,186 |
|
| Net unrealized appreciation (depreciation) | | 3,832,274 |
| | (1,514,024 | ) | | (2,893,408 | ) | | 3,832,274 |
|
| Realized loss on investments | | (3,119,735 | ) | | — |
| | (3,873,454 | ) | | (3,119,735 | ) |
| Net income (loss) | | $ | 3,887,225 |
| | $ | (683,629 | ) | | $ | (6,684,494 | ) | | $ | 3,887,225 |
|
(1) There are no management fees or incentive fees charged at FSFR Glick JV.
FSFR Glick JV has elected to fair value the Subordinated Notes issued to the Company and GF Debt Funding under FASB ASC Topic 825 — Financial Instruments.825. The Subordinated Notes are valued by calculatingbased on the net presenttotal assets less the liabilities senior to the subordinated notes of FSFR Glick JV in an amount not exceeding par under the enterprise value oftechnique.
During the future expected cash flow streams using an appropriate risk-adjusted discount rate model.
year ended September 30, 2017, the Company did not sell any senior secured debt investments to FSFR Glick JV. During the year ended September 30, 2016, the Company sold $48.9 million of senior secured debt investments at fair value to FSFR Glick JV in exchange for $47.6 million cash consideration, $1.2 million of subordinated notes in FSFR Glick JV and $0.1 million of LLC equity interests in FSFR Glick JV. The Company realized a loss of $0.5 million on these transactions. During the year ended September 30, 2015, the Company sold $179.8 million of senior secured debt investments at fair value to FSFR Glick JV in exchange for $121.0 million cash consideration, $52.9 million of subordinated notes in FSFR Glick JV and $5.9 million of LLC equity interests in FSFR Glick JV. The Company recognized a $2.0 million realized loss on these transactions.
In accordance with SEC Regulation S-X Rules 3-09 and 4-08(g), the Company must determine which of its unconsolidated portfolio companies, if any, are considered "significant subsidiaries." After performing this analysis for all periods presented, theThe Company determined that FSFR Glick JV is a significant subsidiary at a greater than 20% level of significancefor the years ended September 30, 2017 and September 30, 2016 under at least one of the three relevant tests for the year ended September 30, 2016. Disclosures regarding FSFR Glick JV that satisfy the requirementssignificance conditions of Rule 4-08(g) are includedof SEC Regulation S-X. The related summary financial information is presented in this Note 4. Absent relief from the SEC, we will amend this report within the time frame specified under Rule 3-09 to include the required audited financial statements of FSFR"FSFR Glick JV.JV LLC" heading above.
OAKTREE STRATEGIC INCOME CORPORATION
NOTES TO CONSOLIDATED FINANCIAL STATEMENTS
Note 5.4. Fee Income
The Company receives a variety of fees in the ordinary course of business including servicing, advisory, amendment, structuring and prepayment fees, which are classified as fee income and recognized as they are earned. The majority of fee income is comprised of advisory fees which are recognized at investment close and are non-recurring in nature.
For the year ended September 30, 2017, the Company recorded total fee income of $2.2 million, $0.5 million of which was recurring in nature. For the year ended September 30, 2016, the Company recorded total fee income of $3.1 million, $0.6 million of which was recurring in nature. For the year ended September 30, 2015, the Company recorded totalRecurring fee income primarily consists of $9.7 million, $0.5 million of which was recurring in nature.servicing fees.
FIFTH STREET SENIOR FLOATING RATE CORP.
NOTES TO CONSOLIDATED FINANCIAL STATEMENTS
Note 6.5. Share Data and Distributions
Earnings per Share
The following table sets forth the computation of basic and diluted earnings per share, pursuant to FASB ASC Topic 260-10, Earnings per Share, for the years ended September 30, 2017, 2016 September 30, 2015 and September 30, 2014:2015:
| | | | | Year ended
September 30, 2016 | | Year ended
September 30, 2015 | | Year ended
September 30, 2014 | | Year ended
September 30, 2017 | | Year ended
September 30, 2016 | | Year ended
September 30, 2015 | |
| Earnings (loss) per common share — basic and diluted: | | | | | | | | | | | | | |
| Net increase (decrease) in net assets resulting from operations | | $ | (4,457,617 | ) | | $ | 15,912,082 |
| | $ | 9,363,957 |
| | $ | (8,766,879 | ) | | $ | (4,457,617 | ) | | $ | 15,912,082 |
| |
| Weighted average common shares outstanding | | 29,466,768 |
| | 29,466,768 |
| | 9,290,330 |
| | 29,466,768 |
| | 29,466,768 |
| | 29,466,768 |
| |
| Earnings (loss) per common share — basic and diluted | | $ | (0.15 | ) | | $ | 0.54 |
| | $ | 1.01 |
| | $ | (0.30 | ) | | $ | (0.15 | ) | | $ | 0.54 |
| |
Distributions
Distributions to common stockholders are recorded on the ex-dividend date. The Company is required to distribute dividends each taxable year to its stockholders of an amount generally at least equal to at least 90% of its investment company taxable income, determined without regard to any deduction for dividends paid, in order to be eligible for tax benefits allowed to a RIC under Subchapter M of the Code. The Company anticipates paying out as a distribution all or substantially all of those amounts. The amount to be paid out as a dividend is determined by the Board of Directors and is based on management’s estimate of the Company’s annual taxable income. Net realized capital gains, if any, are generally distributed, although the Company may decide to retain such net realized capital gains for investment.
The Company has adopted a dividend reinvestment plan (“DRIP”) that provides for reinvestment of any distributions the Company declares in cash on behalf of its stockholders, unless a stockholder elects to receive cash. As a result, if the Company’s Board of Directors authorizes, and the Company declares, a cash distribution, then the Company’s stockholders who have not “opted out” of the Company’s DRIP will have their cash distributionsdistribution automatically reinvested in additional shares of the Company’s common stock, rather than receiving the cash distribution. If the Company’s shares are trading at a premium to net asset value, the Company typically issues new shares to implement the DRIP. If the Company’s shares are trading at a discount to net asset value, the Company typically purchases shares in the open market in connection with the Company’s obligations under the DRIP.
For income tax purposes, the Company estimates that its distributions for the 2017 calendar year will be composed primarily of ordinary income and the actual character of such distributions will be reflected onappropriately reported to the Form 1099-DIVInternal Revenue Service and stockholders for the 2017 calendar year. To the extent that the Company’s taxable earnings fall below the amount of distributions declared, however,paid, a portion of the total amount of the Company’s distributions for the fiscal year may be deemed a return of capital for tax purposes to the Company’s stockholders.
FIFTH STREET SENIOR FLOATING RATE CORP.OAKTREE STRATEGIC INCOME CORPORATION
NOTES TO CONSOLIDATED FINANCIAL STATEMENTS
The following table reflects the dividend distributions per share that our Board of Directorsthe Company has paid, including shares issued under our dividend reinvestment plan, orthe DRIP, on ourits common stock during the years ended September 30, 2017, 2016 and September 30, 2015:
| | | Frequency | | Date Declared | | Record Date | | Payment Date | | Amount
per Share | | Total Distribution | | DRIP Shares Issued (1) | | DRIP Shares Value | | Date Declared | | Record Date | | Payment Date | | Amount
per Share | | Cash Distribution | | DRIP Shares Issued (1) | | DRIP Shares Value |
| Monthly | | July 10, 2015 | | October 6, 2015 | | October 15, 2015 | | $ | 0.075 |
| | $ | 2,210,008 |
| | 12,080 | | $ | 108,563 |
| | August 4, 2016 | | October 14, 2016 | | October 31, 2016 | | $ | 0.075 |
| | $ | 2,183,023 |
| | 3,146 | | $ | 26,985 |
|
| Monthly | | July 10, 2015 | | November 5, 2015 | | November 16, 2015 | | 0.075 |
| | 2,210,008 |
| | 13,269 | | 116,730 |
| | August 4, 2016 | | November 15, 2016 | | November 30, 2016 | | 0.075 |
| | 2,183,100 |
| | 2,986 | | 26,908 |
|
| Monthly | | November 30, 2015 | | December 11, 2015 | | December 22, 2015 | | 0.075 |
| | 2,210,007 |
| | 11,103 | | 94,563 |
| | October 19, 2016 | | December 15, 2016 | | December 30, 2016 | | 0.075 |
| | 2,179,421 |
| | 3,438 | | 30,586 |
|
| Monthly | | November 30, 2015 | | January 4, 2016 | | January 15, 2016 | | 0.075 |
| | 2,210,007 |
| | 8,627 | | 61,079 |
| | October 19, 2016 | | January 31, 2017 | | January 31, 2017 | | 0.075 |
| | 2,180,645 |
| | 2,905 | | 29,363 |
|
| Monthly | | November 30, 2015 | | February 5, 2016 | | February 16, 2016 | | 0.075 |
| | 2,210,008 |
| | 4,542 | | 32,923 |
| | October 19, 2016 | | February 15, 2017 | | February 28, 2017 | | 0.075 |
| | 2,183,581 |
| | 2,969 | | 26,427 |
|
| Monthly | | February 8, 2016 | | March 15, 2016 | | March 31, 2016 | | 0.075 |
| | 2,210,008 |
| | 4,383 | | 34,578 |
| | February 6, 2017 | | March 15, 2017 | | March 31, 2017 | | 0.04 |
| | 1,165,417 |
| | 1,508 | | 13,253 |
|
| Monthly | | February 8, 2016 | | April 15, 2016 | | April 29, 2016 | | 0.075 |
| | 2,210,008 |
| | 4,452 | | 35,033 |
| |
| Monthly | | February 8, 2016 | | May 13, 2016 | | May 31, 2016 | | 0.075 |
| | 2,210,007 |
| | 4,256 | | 33,494 |
| |
| Monthly | | May 6, 2016 | | June 15, 2016 | | June 30, 2016 | | 0.075 |
| | 2,210,007 |
| | 5,822 | | 46,881 |
| |
| Monthly | | May 6, 2016 | | July 15, 2016 | | July 29, 2016 | | 0.075 |
| | 2,210,008 |
| | 3,627 | | 30,745 |
| |
| Monthly | | May 6, 2016 | | August 15, 2016 | | August 31, 2016 | | 0.075 |
| | 2,210,008 |
| | 3,260 | | 29,002 |
| |
| Monthly | | August 4, 2016 | | September 15, 2016 | | September 30, 2016 | | 0.075 |
| | 2,210,008 |
| | 3,078 | | 26,811 |
| |
| Total for the year ended September 30, 2016 | | $ | 0.90 |
| | $ | 26,520,092 |
| | 78,499 | | $ | 650,402 |
| |
| | | | | | | | |
| Frequency | | Date Declared | | Record Date | | Payment Date | | Amount
per Share | | Total Distribution | | DRIP Shares Issued (1) | | DRIP Shares Value | |
| Quarterly | | September 9, 2014 | | December 15, 2014 | | January 15, 2015 | | $ | 0.30 |
| | $ | 8,840,030 |
| | 23,183 | | $ | 242,678 |
| | February 6, 2017 | | June 15, 2017 | | June 30, 2017 | | 0.19 |
| | 5,543,465 |
| | 6,840 | | 55,221 |
|
| Quarterly | | November 20, 2014 | | April 2, 2015 | | April 15, 2015 | | 0.30 |
| | 8,840,030 |
| | 28,296 | | 307,794 |
| | August 7, 2017 | | September 15, 2017 | | September 29, 2017 | | 0.19 |
| | 5,536,798 |
| | 6,991 | | 61,888 |
|
| Monthly | | February 4, 2015 | | May 1, 2015 | | May 15, 2015 | | 0.10 |
| | 2,946,677 |
| | 5,045 | | 50,830 |
| |
| Monthly | | February 4, 2015 | | June 1, 2015 | | June 15, 2015 | | 0.10 |
| | 2,946,677 |
| | 5,296 | | 53,237 |
| |
| Monthly | | February 4, 2015 | | July 1, 2015 | | July 15, 2015 | | 0.10 |
| | 2,946,677 |
| | 14,572 | | 137,463 |
| |
| Monthly | | February 4, 2015 | | August 3, 2015 | | August 17, 2015 | | 0.10 |
| | 2,946,677 |
| | 6,174 | | 56,388 |
| |
| Monthly | | July 10, 2015 | | September 4, 2015 | | September 15, 2015 | | 0.07 |
| | 2,210,007 |
| | 4,575 | | 41,121 |
| |
| Total for the year ended September 30, 2015 | | $ | 1.07 |
| | $ | 31,676,775 |
| | 87,141 | | $ | 889,511 |
| |
| Total for the year ended September 30, 2017 | | Total for the year ended September 30, 2017 | | $ | 0.80 |
| | $ | 23,155,451 |
| | 30,783 | | $ | 270,630 |
|
|
| | | | | | | | | | | | | | | | | | | | |
| Frequency | | Date Declared | | Record Date | | Payment Date | | Amount
per Share | | Cash Distribution | | DRIP Shares Issued (1) | | DRIP Shares Value (2) |
| Monthly | | July 10, 2015 | | October 6, 2015 | | October 15, 2015 | | $ | 0.075 |
| | $ | 2,101,445 |
| | 12,080 | | $ | 108,563 |
|
| Monthly | | July 10, 2015 | | November 5, 2015 | | November 16, 2015 | | 0.075 |
| | 2,093,278 |
| | 13,269 | | 116,730 |
|
| Monthly | | November 30, 2015 | | December 11, 2015 | | December 22, 2015 | | 0.075 |
| | 2,115,444 |
| | 11,103 | | 94,563 |
|
| Monthly | | November 30, 2015 | | January 4, 2016 | | January 15, 2016 | | 0.075 |
| | 2,148,928 |
| | 8,627 | | 61,079 |
|
| Monthly | | November 30, 2015 | | February 5, 2016 | | February 16, 2016 | | 0.075 |
| | 2,177,085 |
| | 4,542 | | 32,923 |
|
| Monthly | | February 8, 2016 | | March 15, 2016 | | March 31, 2016 | | 0.075 |
| | 2,175,431 |
| | 4,383 | | 34,577 |
|
| Monthly | | February 8, 2016 | | April 15, 2016 | | April 29, 2016 | | 0.075 |
| | 2,174,974 |
| | 4,452 | | 35,033 |
|
| Monthly | | February 8, 2016 | | May 13, 2016 | | May 31, 2016 | | 0.075 |
| | 2,176,513 |
| | 4,256 | | 33,494 |
|
| Monthly | | May 6, 2016 | | June 15, 2016 | | June 30, 2016 | | 0.075 |
| | 2,163,126 |
| | 5,822 | | 46,881 |
|
| Monthly | | May 6, 2016 | | July 15, 2016 | | July 29, 2016 | | 0.075 |
| | 2,179,263 |
| | 3,627 | | 30,745 |
|
| Monthly | | May 6, 2016 | | August 15, 2016 | | August 31, 2016 | | 0.075 |
| | 2,181,006 |
| | 3,260 | | 29,002 |
|
| Monthly | | August 4, 2016 | | September 15, 2016 | | September 30, 2016 | | 0.075 |
| | 2,183,197 |
| | 3,078 | | 26,811 |
|
| Total for the year ended September 30, 2016 | | | | $ | 0.90 |
| | $ | 25,869,690 |
| | 78,499 | | $ | 650,402 |
|
|
| | | | | | | | | | | | | | | | | | | | |
| Frequency | | Date Declared | | Record Date | | Payment Date | | Amount
per Share | | Cash Distribution | | DRIP Shares Issued (1) | | DRIP Shares Value |
| Quarterly | | May 12, 2014 | | September 15, 2014 | | October 15, 2014 | | 0.30 |
| | 8,648,937 |
| | 17,127 | | 191,093 |
|
| Quarterly | | September 9, 2014 | | December 15, 2014 | | January 15, 2015 | | 0.30 |
| | 8,597,352 |
| | 23,183 | | 242,678 |
|
| Quarterly | | November 20, 2014 | | April 2, 2015 | | April 15, 2015 | | 0.30 |
| | 8,532,236 |
| | 28,296 | | 307,794 |
|
| Monthly | | February 4, 2015 | | May 1, 2015 | | May 15, 2015 | | 0.10 |
| | 2,895,847 |
| | 5,045 | | 50,830 |
|
| Monthly | | February 4, 2015 | | June 1, 2015 | | June 15, 2015 | | 0.10 |
| | 2,893,440 |
| | 5,296 | | 53,237 |
|
| Monthly | | February 4, 2015 | | July 1, 2015 | | July 15, 2015 | | 0.10 |
| | 2,809,213 |
| | 14,572 | | 137,464 |
|
| Monthly | | February 4, 2015 | | August 3, 2015 | | August 17, 2015 | | 0.10 |
| | 2,890,289 |
| | 6,174 | | 56,388 |
|
| Monthly | | July 10, 2015 | | September 4, 2015 | | September 15, 2015 | | 0.07 |
| | 2,168,886 |
| | 4,575 | | 41,121 |
|
| Total for the year ended September 30, 2015 | | | | $ | 1.37 |
| | $ | 39,436,200 |
| | 104,268 | | $ | 1,080,605 |
|
__________
(1) Shares were purchased on the open market and distributed.
(2) Totals do not sum due to rounding
Common Stock Offering
On August 19, 2014, the Company completed a follow-on public offering of 22,800,000 shares of its common stock at the public offering price of $12.91. The net proceeds totaled $276.2 million after deducting underwriting commissions of $17.7 million and offering costs of $0.5 million.
There were no common stock offerings during the years ended September 30, 2017, September 30, 2016 and September 30, 2015.
Note 7. Borrowings
Natixis Facility
On November 1, 2013, FS Senior Funding LLC, the Company's wholly-owned, special purpose financing subsidiary, entered into a $100 million revolving credit facility (the "Natixis facility") with the lenders referred to therein, Natixis, New York Branch, as administrative agent, and U.S. Bank National Association, as collateral agent and custodian.
Borrowings under the Natixis facility were subject to certain customary advance rates and accrued interest at a rate equal to either the applicable commercial paper rate (subject to an overall cap) plus 1.90% in the case of a lender that is a commercial paper conduit or otherwise the three-month LIBOR plus 2.00% per annum. In addition, there was a commitment fee payable on the undrawn amount under the Natixis facility equal to 1.00% (or 0.50% for the first six months after the closing date) of such undrawn amount. Interest and commitment fees were payable quarterly in arrears. The reinvestment period under the Natixis facility ended 18 months after the closing date and the Natixis facility was scheduled to mature on November 1, 2021.
FIFTH STREET SENIOR FLOATING RATE CORP.OAKTREE STRATEGIC INCOME CORPORATION
NOTES TO CONSOLIDATED FINANCIAL STATEMENTS
On October 16, 2014, the Company entered into agreements to expand the Natixis facility from $100 million to $200 million, including a $100 million term loan and a $100 million revolving credit facility. Fifth Third Bank ("Fifth Third") also joined the facility as a term loan lender. The $50 million term loan provided by Fifth Third was priced at LIBOR plus 2% per annum, and the $100 million revolving credit facility and $50 million term loan provided by Natixis, New York Branch, were priced at the applicable commercial paper rate plus 1.9% per annum. The facility maturity date remained unchanged.
Note 6. Borrowings under the Natixis facility were secured by all of the assets of FS Senior Funding LLC and all of the Company's equity interest in FS Senior Funding LLC. The Company used the Natixis facility to fund a portion of its loan origination activities and for general corporate purposes. Each loan origination under the Natixis facility was subject to the satisfaction of certain conditions. The Company's borrowings under the Natixis facility bore interest at a weighted average interest rate of 2.253% and 2.203% for the years ended September 30, 2015 and September 30, 2014, respectively. For the years ended September 30, 2015 and September 30, 2014, the Company recorded interest expense of $4.8 million and $1.6 million, respectively, related to the Natixis facility.
On May 28, 2015, the Company completed a $309.0 million debt securitization transaction (the "2015 Debt Securitization"), the proceeds of which were used to repay the entire amount outstanding under the Natixis facility. In connection therewith, the Amended and Restated Loan and Servicing Agreement and other related documents governing the Natixis facility were also terminated. Upon termination of the Natixis facility, the Company accelerated the $2.1 million remaining unamortized fee balance into interest expense during the year ended September 30, 2015. As such, the Company had no borrowings outstanding or capacity available under or interest expense related to the Natixis facility during the year ended September 30, 2016.
Citibank Facility
On January 15, 2015, FS Senior Funding II LLC, the Company's wholly-owned, special purpose financing subsidiary, entered into a $175 million revolving credit facility (the(as amended, the "Citibank facility") with the lenders referred to therein, Citibank, N.A., as administrative agent, and Wells Fargo Bank, N.A., as collateral agent and custodian.
In connection with the Transaction, on July 13, 2017, the Company entered into an amendment (the “Citibank Amendment”) to the Citibank facility that amends the Loan and Security Agreement, dated as of January 15, 2015, by and among the Company, as the collateral manager and as the seller, FS Senior Funding II LLC, as the borrower, Citibank, N.A., as administrative agent, and Citibank, N.A., as the sole lender. Under the Citibank Amendment, certain events of default that would result from the closing of the Transaction are waived and the ability to borrow amounts under the Citibank facility for investment was revised to require the consent of the lenders prior to the closing of the Transaction and completion of satisfactory due diligence by the lenders on Oaktree. In addition, the Citibank Amendment provided that if the closing of the Transaction did not occur by December 31, 2017, the reinvestment period for the Citibank facility would have terminated and the Company would have been required to pay down any amounts outstanding under the Citibank facility as set forth in the Citibank Amendment.
Borrowings under the Citibank facility are subject to certain customary advance rates and accrued interest at a rate equal to LIBOR plus 2.00% per annum on broadly syndicated loans and LIBOR plus 2.25% per annum on all other eligible loans during the reinvestment period, and rates equal to LIBOR plus 3.50% per annum and LIBOR plus 4.00% per annum during the subsequent two years, respectively. In addition, there is a commitment fee payable on the undrawn amount under the Citibank facility of either 0.50% per annum on the unused amount of the Citibank facility (if the advances outstanding on the Citibank facility exceed 50% of the aggregate commitments by lenders to make advances on such day) or 0.75% per annum on the unused amount of the credit facility (if the advances outstanding on the Citibank facility do not exceed 50% of the aggregate commitments by lenders to make advances on such day) for the duration of the reinvestment period. Interest and commitment fees are payable quarterly in arrears. The reinvestment period under the Citibank facility ends January 15, 2018 and the Citibank facility will mature on January 15, 2020. The Citibank facility requires the Company to comply with certain affirmative and negative covenants and other customary requirements for similar credit facilities.
On March 23, 2017, FS Senior Funding II LLC entered into an amendment to the documents governing the Citibank facility. The amendment was effective as of March 23, 2017 and, among other things, decreased the size of the Citibank facility from $175 million to $125 million. The interest rate, reinvestment period and maturity date were not modified as part of this amendment. The Company accelerated deferred financing costs of $406,230 in connection with the amendment.
As of September 30, 2017 and September 30, 2016, the Company had $76.5 million and $107.4 millionoutstanding under the Citibank facility.facility, respectively. Borrowings under the Citibank facility are secured by all of the assets of FS Senior Funding II LLC and all of the Company's equity interests in FS Senior Funding II LLC. The Company may use the Citibank facility to fund a portion of its loan origination activities and for general corporate purposes. Each loan origination under the Citibank facility is subject to the satisfaction of certain conditions. The Company's borrowings under the Citibank facility bore interest at a weighted average interest rate of 3.559%, 2.838% and 2.516% for the years ended September 30, 2017, September 30, 2016 and September 30, 2015, respectively. For the years ended September 30, 2017, September 30, 2016 and September 30, 2015, the Company recorded interest expense of $4.2 million, $4.1 million and $2.6 million, respectively, related to the Citibank facility.
East West Bank Facility
On January 6, 2016, the Company entered into a five-year $25 million senior secured revolving credit facility with the lenders referenced therein, U.S. Bank National Association, as Custodian, and East West Bank as Secured Lender (the "East West Bank facility"). The East West Bank facility bears an interest rate of either (i) LIBOR plus 3.75% per annum for borrowings in year one, 3.50% per annum for borrowings in year two, 3.25% per annum for borrowings in years three and four and 3.00% per annum for borrowings in year five, or (ii) East West Bank’s prime rate plus 0.75% per annum for borrowings in year one, 0.50% per annum for borrowings in year two, 0.25% per annum for borrowings in years three and four, and 0.00% per annum for borrowings in year five. The East West Bank facility matures on January 6, 2021. The East West Bank facility requires the Company to comply with certain affirmative and negative covenants and other customary requirements for similar credit facilities.
As of September 30, 2017, the Company had $6.5 million outstanding under the East West Bank facility. As of September 30, 2016, the Company had no borrowings outstanding under the East West Bank facility. Borrowings under the East West Bank facility are secured by the loans pledged as collateral thereunder from time to time as well as certain other assets of the
FIFTH STREET SENIOR FLOATING RATE CORP.
NOTES TO CONSOLIDATED FINANCIAL STATEMENTS
Company. The Company may use the East West Bank facility to fund a portion of its loan origination activities and for general corporate purposes. The Company’s borrowings under the East West Bank facility bore interest at a weighted average interest rate of 4.633% for the year ended September 30, 2017. The Company’s borrowings under the East West Bank facility bore interest at a weighted average interest rate of
OAKTREE STRATEGIC INCOME CORPORATION
NOTES TO CONSOLIDATED FINANCIAL STATEMENTS
4.857% for the period from January 6, 2016 through September 30, 2016. For the yearyears ended September 30, 2017 and September 30, 2016, the Company recorded interest expense of $0.5 million and $0.4 million, respectively, related to the East West Bank facility.
2015 Debt Securitization
On May 28, 2015, the Company completed its $309.0 million debt securitization ("2015 Debt SecuritizationSecuritization") consisting of $222.6 million in senior secured notes ("2015 Notes") and $86.4 million of unsecured subordinated notes ("Subordinated 2015 Notes"). The notes offered in the 2015 Debt Securitization were issued by FS Senior Funding Ltd. (the "2015 Issuer"),the 2015 Issuer, a wholly-owned subsidiary of the Company, through a private placement. The 2015 Notes are secured by the assets held by the 2015 Issuer. The 2015 Debt Securitization consists of $126.0 million Class A-T Senior Secured 2015 Notes, which bear interest at three-month LIBOR plus 1.80% per annum; $29.0 million Class A-S Senior Secured 2015 Notes, which bearbore interest at a rate of three-month LIBOR plus 1.55% per annum, withuntil a step-up in spread to 2.10% to occuroccurred in October 2016; $20.0 million Class A-R Senior Secured Revolving 2015 Notes, which bear interest at a rate of Commercial Paper ("CP") plus 1.80% per annum collectively,(collectively, the "Class A Notes;"Notes") and $25.0 million Class B Senior Secured 2015 Notes, which bear interest at a rate of three-month LIBOR plus 2.65% per annum (the "Class B Notes"). In partial consideration for the loans transferred to the 2015 Issuer as part of the 2015 Debt Securitization, the Company currently retains the entire $22.6 million of the Class C Senior Secured 2015 Notes (which the Company purchased at 98.0% of par value) (the "Class C Notes") and the entire $86.4 million of the Subordinated 2015 Notes. The Class A Notes and Class B Notes are included in the Company's September 30, 20162017 Consolidated Statements of Assets and Liabilities as notes payable. As of September 30, 2016,2017, the Class C Notes and the Subordinated 2015 Notes were eliminated in consolidation.
The proceeds of the private placement of the 2015 Notes, net of expenses, were used to repay the entire amount outstanding under the Natixis facility. As part of the 2015 Debt Securitization, FS Senior Funding LLC, the borrower under the Natixis facility, merged with and into 2015 Issuer, with the 2015 Issuer remaining as the surviving entity. Upon completion of the 2015 Debt Securitization, the Natixis facility was paid off and terminated.
The Company serves as collateral manager to the 2015 Issuer under a collateral management agreement. The Company is entitled
to a fee for its services as collateral manager. The Company has retained Fifth Street Management LLC,a sub-collateral manager, which, as of October 17, 2017, was the Company’s Investment Adviser and, prior to furnishOctober 17, 2017, was FSM, to provide collateral management sub-advisory services to the Company pursuant to a sub-collateral management agreement. Fifth Street Management LLC hasThe sub-collateral manager is entitled to receive 100% of the collateral management fees paid to the Company under the collateral management agreement, but each of the Investment Adviser and FSM irrevocably waived and, in the case of the Investment Adviser, intends to continue to irrevocably waive its right to such sub-collateral management fees in respect of the 2015 Debt Securitization.
The collateral management agreement does not include any incentive fee payable to the Company as collateral manager or payable to Fifth Street Management LLCthe sub-collateral manager as sub-advisor under the sub-collateral management agreement.
Through May 28, 2019, all principal collections received on the underlying collateral may be used by the 2015 Issuer to purchase new collateral under the direction of the Investment Adviser in its capacity as sub-collateral manager of the 2015 Issuer and in accordance with the Company's investment strategy. All 2015 Notes are scheduled to mature on May 28, 2025.
As of September 30, 2016,2017, there were 4957 investments in portfolio companies with a total fair value of $255.8$277.9 million, securing the 2015 Notes. The pool of loans in the 2015 Debt Securitization must meet certain requirements, including asset mix and concentration, collateral coverage, term, agency rating, minimum coupon, minimum spread and sector diversity requirements.
The aggregate accrued interest payable on the 2015 Notes at September 30, 2016 and 2015 was approximately $1.1 million and $1.5 million, respectively.
FIFTH STREET SENIOR FLOATING RATE CORP.
NOTES TO CONSOLIDATED FINANCIAL STATEMENTS
For the years ended September 30, 20162017 and September 30, 2015,2016, the components of interest expense, cash paid for interest, average interest rates and average outstanding balances for the 2015 Debt Securitization were as follows:
| | | | | Year ended September 30, 2016 | | Year ended September 30, 2015 | | Year ended September 30, 2017 | | Year ended September 30, 2016 | | Year ended September 30, 2015 | |
| Interest expense | | $ | 4,668,947 |
| | $ | 1,476,995 |
| | $ | 5,741,534 |
| | $ | 4,668,947 |
| | $ | 1,476,995 |
| |
| Loan administration fees | | 79,882 |
| | — |
| | 69,514 |
| | 79,882 |
| | — |
| |
| Amortization of debt issuance costs | | 290,104 |
| | 120,877 |
| | 290,104 |
| | 290,104 |
| | 120,877 |
| |
| Total interest and other debt financing expenses | | $ | 5,038,933 |
| | $ | 1,597,872 |
| | $ | 6,101,152 |
| | $ | 5,038,933 |
| | $ | 1,597,872 |
| |
| Cash paid for interest expense | | $ | 5,136,063 |
| | $ | — |
| | $ | 5,449,738 |
| | $ | 5,136,063 |
| | $ | — |
| |
| Annualized average interest rate | | 2.466 | % | | 2.390 | % | | 3.425 | % | | 2.466 | % | | 2.390 | % | |
| Average outstanding balance | | $ | 181,782,413 |
| | $ | 61,900,170 |
| | $ | 180,462,192 |
| | $ | 181,782,413 |
| | $ | 61,900,170 |
| |
OAKTREE STRATEGIC INCOME CORPORATION
NOTES TO CONSOLIDATED FINANCIAL STATEMENTS
The classes, interest rates, spread over LIBOR, cash paid for interest and interest expense of each of the Class A-T, A-S, A-R, B and C 2015 Notes for the year ended September 30, 20162017 is as follows:
| | | | | | Year ended September 30, 2016 | | | Year ended September 30, 2017 |
| | Stated Interest Rate | | LIBOR Spread (basis points) | | Cash Paid for Interest | | Interest Expense | | Stated Interest Rate | | LIBOR Spread (basis points) | | Cash Paid for Interest | | Interest Expense |
| Class A-T Notes | | 2.4691% | | 180 | | $ | 3,267,127 |
|
| $ | 3,009,871 |
| | 3.1035% | | 180 | | $ | 3,487,268 |
| | $ | 3,664,619 |
|
| Class A-S Notes | | 2.2191% | | 155 | (1) | 668,956 |
| | 619,040 |
| | 3.4035% | | 210 | (1) | 850,073 |
| | 926,401 |
|
| Class A-R Notes | | 2.4691% | | 180 | (2) | 308,546 |
| | 226,798 |
| | 2.9551% | | 180 | (2) | 205,027 |
| | 207,900 |
|
| Class B Notes | | 3.3191% | | 265 | | 891,434 |
| | 813,238 |
| | 3.9535% | | 265 | | 907,370 |
| | 942,614 |
|
| Class C Notes | | 3.9191% | | 325 | (3) | — |
| | — |
| | 4.5535% | | 325 | (3) | — |
| | — |
|
| Total | | | | | $ | 5,136,063 |
| | $ | 4,668,947 |
| | | | | $ | 5,449,738 |
| | $ | 5,741,534 |
|
_______________________
(1) Spread to step-upincreased to 2.10% in October 2016.2016 from 1.55%.
(2) Interest expense includes 1.0% undrawn fee. Class A-R 2015 Notes were partially undrawn during the year ended September 30, 2016.
(3) The Company holds all Class C Notes outstanding and thus has not recorded any related interest expense as they are eliminated in consolidation.
The classes, amounts, ratings and interest rates (expressed as a spread to three-month LIBOR) of the Class A, B, C and Subordinated 2015 Notes as of September 30, 2016 and 20152017 are as follows:
| | | Description | | Class A-T Notes | | Class A-S Notes | | Class A-R
Notes (1) | | Class B Notes | | Class C Notes | | Subordinated Notes | | Class A-T Notes | | Class A-S Notes | | Class A-R
Notes | | Class B Notes | | Class C Notes | | Subordinated Notes |
| Type | | Senior Secured Floating Rate Term Debt | | Senior Secured Floating Rate Term Debt | | Senior Secured Floating Rate Revolver | | Senior Secured Floating Rate Term Debt | | Senior Secured Floating Rate Term Debt | | Subordinated Term Notes | | Senior Secured Floating Rate Term Debt | | Senior Secured Floating Rate Term Debt | | Senior Secured Floating Rate Revolver | | Senior Secured Floating Rate Term Debt | | Senior Secured Floating Rate Term Debt | | Subordinated Term Notes |
| Amount Outstanding | | $126,000,000 | | $29,000,000 | | $— | | $25,000,000 | | $22,575,680 | | $86,400,000 | | $126,000,000 | | $29,000,000 | | $— | | $25,000,000 | | $22,575,680 | | $86,400,000 |
| Moody's Rating | | "Aaa" | | "Aaa" | | "Aaa" | | "Aa2" | | "Aa2" | | NR | | "Aaa" | | "Aaa" | | "Aaa" | | "Aa2" | | "Aa2" | | NR |
| S&P Rating | | "AAA" | | "AAA" | | "AAA" | | NR | | NR | | NR | | "AAA" | | "AAA" | | "AAA" | | NR | | NR | | NR |
| Interest Rate | | LIBOR + 1.80% | | LIBOR + 1.55%* | | CP + 1.80% ** | | LIBOR + 2.65% | | LIBOR + 3.25% | | NA | | LIBOR + 1.80% | | LIBOR + 2.10%* | | CP + 1.80% ** | | LIBOR + 2.65% | | LIBOR + 3.25% | | NA |
| Stated Maturity | | May 28, 2025 | | May 28, 2025 | | May 28, 2025 | | May 28, 2025 | | May 28, 2025 | | May 28, 2025 | | May 28, 2025 | | May 28, 2025 | | May 28, 2025 | | May 28, 2025 | | May 28, 2025 | | May 28, 2025 |
_______________________
* Spread to step-upincreased to 2.10% in October 2016.2016 from 1.55%.
** Carries a 1.0% undrawn fee.
(1) $6,366,000 outstanding as of September 30, 2015.
The proceeds of the private placement of the Class A Notes and the Class B Notes of the 2015 Issuer, net of debt issuance costs, may bewere used to fund a portion of the 2015 Issuer's loan origination activities and for general corporate purposes. The creditors of the 2015 Issuer have received security interests in the assets owned by the 2015 Issuer and such assets are not intended to be available to the creditors of the Company (or any other affiliate of the Company). As part of the 2015 Debt Securitization, the Company entered into master loan sale agreements under which the Company agreed to directly or indirectly sell or contribute certain senior secured debt investments (or participation interests therein) to the 2015 Issuer, and to purchase or otherwise acquire the Subordinated 2015 Notes, as
FIFTH STREET SENIOR FLOATING RATE CORP.
NOTES TO CONSOLIDATED FINANCIAL STATEMENTS
applicable. The 2015 Notes are the secured obligations of the 2015 Issuer and indenturesthe indenture governing the 2015 Notes includeincludes customary covenants and events of default. The 2015 Debt Securitization requires the Company to comply with certain monthly financial covenants, including overcollateralization and interest coverage tests.
Secured Borrowings
See Note 2 "Secured Borrowings" for a description of the Company's accounting treatment of secured borrowings.
As of September 30, 2016, secured borrowings at fair value totaled $5.0 million and the fair value of the investment that is associated with these secured borrowings was $5.0 million. These secured borrowings were the result of the Company's completion of a loan sale of a senior secured debt investment that did not meet the definition of a participating interest. As a result, sale treatment was not allowed and this loan sale was treated as a secured borrowing. During the years ended September 30, 2016, thereNo secured borrowings were $5.0 million of proceeds from secured borrowings. Asoutstanding as of September 30, 2016, the Company's secured borrowings bore interest at a rate of 7.0%.2017.
OAKTREE STRATEGIC INCOME CORPORATION
NOTES TO CONSOLIDATED FINANCIAL STATEMENTS
Principal Payments
Scheduled principal payments for debt obligations at September 30, 20162017 are as follows:
| | | | | Payments due during fiscal years ended September 30, | | Payments due during fiscal years ended September 30, |
| | | Total | | 2017 | | 2018 | | 2019 | | 2020 | | 2021 and Thereafter | | Total | | 2018 | | 2019 | | 2020 | | 2021 | | 2022 and Thereafter |
| Citibank facility | | $ | 107,426,800 |
| | $ | — |
| | $ | — |
| | $ | — |
| | $ | 107,426,800 |
| | $ | — |
| | $ | 76,456,800 |
| | $ | — |
| | $ | — |
| | $ | 76,456,800 |
| | $ | — |
| | $ | — |
|
| Notes Payable | | 180,000,000 |
| | — |
| | — |
| | — |
| | — |
| | 180,000,000 |
| | 180,000,000 |
| | — |
| | — |
| | — |
| | — |
| | 180,000,000 |
|
| Secured borrowings | | 5,000,000 |
| | — |
| | — |
| | — |
| | — |
| | 5,000,000 |
| |
| East West Bank facility | | | 6,500,000 |
| | — |
| | — |
| | — |
| | 6,500,000 |
| | — |
|
| Total | | $ | 292,426,800 |
| | $ | — |
| | $ | — |
| | $ | — |
| | $ | 107,426,800 |
| | $ | 185,000,000 |
| | $ | 262,956,800 |
| | $ | — |
| | $ | — |
| | $ | 76,456,800 |
| | $ | 6,500,000 |
| | $ | 180,000,000 |
|
Note 8.7. Interest and Dividend Income
See Note 2 "Investment Income" for a description of the Company's accounting treatment of investment income.
PIK interest on certain of the Company's debt investments, which represents contractually deferred interest added to the loan balance that is generally due at the end of the loan term, is generally recorded on the accrual basis to the extent such amounts are expected to be collected. The Company generally ceases accruing PIK interest if there is insufficient value to support the accrual or if the Company does not expect the portfolio company to be able to pay all principal and interest due. The Company's decision to cease accruing PIK interest involves subjective judgments and determinations based on available information about a particular portfolio company, including whether the portfolio company is current with respect to its payment of principal and interest on its loans and debt securities; monthly and quarterly financial statements and financial projections for the portfolio company; the Company's assessment of the portfolio company's business development success, including product development, profitability and the portfolio company's overall adherence to its business plan; information obtained by the Company in connection with periodic formal update interviews with the portfolio company's management and, if appropriate, the private equity sponsor; and information about the general economic and market conditions in which the portfolio company operates. Based on this and other information, the Company determines whether to cease accruing PIK interest on a loan or debt security. The Company's determination to cease accruing PIK interest on a loan or debt security is generally made well before the Company's full write-down of such loan or debt security.
Accumulated PIK interest was $0.1 million as ofactivity for the years ended September 30, 2016. The Company did not have any2017 and 2016 was as follows:
|
| | | | | | | | |
| | | Year ended
September 30, 2017 | | Year ended
September 30, 2016 |
| PIK balance at beginning of period | | $ | 88,839 |
| | $ | — |
|
| Gross PIK interest accrued | | 759,744 |
| | 167,065 |
|
| PIK income reserves (1) | | (351,323 | ) | | — |
|
| PIK interest received in cash | | — |
| | (78,226 | ) |
| PIK balance at end of period | | $ | 497,260 |
| | $ | 88,839 |
|
___________________
Note: There was no accumulated PIK interest as ofactivity during the year ended September 30, 2015.
| |
| (1) | PIK income is generally reserved for when a loan is placed on PIK non-accrual status. |
As of September 30, 2017, September 30, 2016 and September 30, 2015, there waswere three, one investmentand one investments, respectively, on which the Company stopped accruing cash and/or PIK interest or OID income. As of September 30, 2014, there were no investments on which the Company had stopped accruing cash and/or PIK interest or OID income.
FIFTH STREET SENIOR FLOATING RATE CORP.
NOTES TO CONSOLIDATED FINANCIAL STATEMENTS
The percentages of the Company's debt investments at cost and fair value by accrual status as of September 30, 2017, 2016 and September 30, 2015 were as follows:
| | | | | September 30, 2016 | | September 30, 2015 | | September 30, 2017 | | September 30, 2016 | | September 30, 2015 |
| | | Cost | | % of Debt
Portfolio | | Fair
Value | | % of Debt
Portfolio | | Cost | | % of Debt
Portfolio | | Fair
Value | | % of Debt
Portfolio | | Cost | | % of Debt
Portfolio | | Fair
Value | | % of Debt
Portfolio | | Cost | | % of Debt
Portfolio | | Fair
Value | | % of Debt
Portfolio | | Cost | | % of Debt
Portfolio | | Fair
Value | | % of Debt
Portfolio |
| Accrual | | $ | 563,757,229 |
| | 96.74 | % | | $ | 552,114,644 |
| | 98.72 | % | | $ | 619,529,324 |
| | 98.79 | % | | $ | 613,701,960 |
| | 99.28 | % | | $ | 564,231,285 |
| | 96.02 | % | | $ | 553,084,120 |
| | 98.88 | % | | $ | 563,757,229 |
| | 96.74 | % | | $ | 552,114,644 |
| | 98.72 | % | | $ | 619,529,324 |
| | 98.79 | % | | $ | 613,701,960 |
| | 99.28 | % |
| PIK non-accrual (paying) (1) | | — |
| | — |
| | — |
| | — |
| | 7,605,257 |
| | 1.21 |
| | 4,427,839 |
| | 0.72 |
| | — |
| | — |
| | — |
| | — |
| | — |
| | — |
| | — |
| | — |
| | 7,605,257 |
| | 1.21 |
| | 4,427,839 |
| | 0.72 |
|
Cash non-accrual (nonpaying) (1)(2) | | 19,027,017 |
| | 3.26 |
| | 7,156,160 |
| | 1.28 |
| | — |
| | — |
| | — |
| | — |
| | 23,381,863 |
| | 3.98 |
| | 6,292,551 |
| | 1.12 |
| | 19,027,017 |
| | 3.26 |
| | 7,156,160 |
| | 1.28 |
| | — |
| | — |
| | — |
| | — |
|
| Total | | $ | 582,784,246 |
| | 100.00 | % | | $ | 559,270,804 |
| | 100.00 | % | | $ | 627,134,581 |
| | 100.00 | % | | $ | 618,129,799 |
| | 100.00 | % | | $ | 587,613,148 |
| | 100.00 | % | | $ | 559,376,671 |
| | 100.00 | % | | $ | 582,784,246 |
| | 100.00 | % | | $ | 559,270,804 |
| | 100.00 | % | | $ | 627,134,581 |
| | 100.00 | % | | $ | 618,129,799 |
| | 100.00 | % |
__________________
| |
| (1) | PIK non-accrual status is inclusive of other noncashnon-cash income, where applicable. |
| |
| (2) | Cash non-accrual status is inclusive of PIK and other noncashnon-cash income, where applicable. |
The non-accrual status of the Company's portfolio investments as of September 30, 2017, 2016 and September 30, 2015 was as follows:
|
| | | | | | |
| | | September 30, 2017 | | September 30, 2016 | | September 30, 2015 |
| Answers Corporation (2) | | — | | Cash non-accrual (1) | | PIK non-accrual (1) |
| Ameritox Ltd. | | Cash non-accrual (1) | | — | | — |
| New Trident Holdcorp, Inc. - second lien term loan | | Cash non-accrual (1) | | — | | — |
| Metamorph US 3, LLC | | Cash non-accrual (1) | | — | | — |
OAKTREE STRATEGIC INCOME CORPORATION
NOTES TO CONSOLIDATED FINANCIAL STATEMENTS
__________________
| |
| (1) | PIK non-accrual status is inclusive of other noncash income, where applicable. Cash non-accrual status is inclusive of PIK and other noncashnon-cash income, where applicable. |
| |
| (2) | As of September 30, 2015, only2017, the Company's investment in the second lien term loan of the Answers Corporation was on PIK non-accrual status.Company no longer held this investment. As of September 30, 2016, the Company's investments in both the first and second lien term loans of the Answers Corporation were on cash non-accrual status. As of September 30, 2015, only the second lien term loan was on PIK non-accrual. |
Income non-accrual amounts for the years ended September 30, 2017, 2016 and 2015, are presented inwhich may include amounts for investments that were no longer held at the following table.end of the period, were as follows:
| | | | | Year ended
September 30, 2016 | | Year ended
September 30, 2015 | | Year ended
September 30, 2017 | | Year ended
September 30, 2016 | | Year ended
September 30, 2015 |
| Cash interest income | | $ | 1,136,652 |
| | $ | — |
| | $ | 1,291,399 |
| | $ | 1,136,652 |
| | $ | — |
|
| PIK interest income | | | 351,323 |
| | — |
| | — |
|
| OID income | | 57,735 |
| | 13,816 |
| | 89,553 |
| | 57,735 |
| | 13,816 |
|
| Total | | $ | 1,194,387 |
| | $ | 13,816 |
| | $ | 1,732,275 |
| | $ | 1,194,387 |
| | $ | 13,816 |
|
Note 9.8. Taxable/Distributable Income and Dividend Distributions
Taxable income may differdiffers from net increase (decrease) in net assets resulting from operations primarily due to: (1) unrealized appreciation (depreciation) on investments and secured borrowings, as gains and losses are not included in taxable income until they are realized; (2) origination fees received in connection with investments in portfolio companies; (3) recognition of interest income on certain loans; and (4) income or loss recognition on exited investments.
FIFTH STREET SENIOR FLOATING RATE CORP.
NOTES TO CONSOLIDATED FINANCIAL STATEMENTS
Listed below is a reconciliation of net increasedecrease in net assets resulting from operations to taxable income for the years ended September 30, 20162017 and September 30, 2015, including cumulative prior period items related to the Revision:2016:
| | | | | Year ended
September 30, 2016 | | Year ended
September 30, 2015 | | Year ended
September 30, 2017 | | Year ended
September 30, 2016 |
| Net increase (decrease) in net assets resulting from operations | | $ | (4,457,617 | ) | | $ | 15,912,082 |
| |
| Net decrease in net assets resulting from operations | | | $ | (8,766,879 | ) | | $ | (4,457,617 | ) |
| Net unrealized depreciation on investments and secured borrowings | | 16,980,524 |
| | 12,772,168 |
| | 17,803,657 |
| | 16,980,524 |
|
| Book/tax difference due to deferred loan fees | | (94,659 | ) | | 3,677,142 |
| | (1,438,850 | ) | | (94,659 | ) |
| Book/tax difference due to interest income on certain loans | | 1,136,652 |
| | — |
| | 1,642,722 |
| | 1,136,652 |
|
| Book/tax difference due to capital losses not recognized | | 12,769,777 |
| | — |
| | 13,384,915 |
| | 12,769,777 |
|
| Other book/tax differences | | (79,467 | ) | | 2,035,345 |
| | 557,519 |
| | (79,467 | ) |
| Other nondeductible expenses | | — |
| | — |
| |
| Taxable/Distributable Income (1) | | $ | 26,255,210 |
| | $ | 34,396,737 |
| | $ | 23,183,084 |
| | $ | 26,255,210 |
|
__________________
| |
| (1) | The Company's taxable income for the year ended September 30, 20162017 is an estimate and will not be finally determined until the Company files its tax return for the fiscal and taxable year ending September 30, 2016.return. Therefore, the final taxable income may be different than the estimate. |
As of September 30, 2016,2017, the components of accumulated undistributed income on a tax basis were as follows:
|
| | | |
| Undistributed ordinary income, net | $ | 2,459,655 |
|
| Net realized capital gains (losses) | (12,690,311 | ) |
| Unrealized gains, net | (16,980,523 | ) |
|
| | | |
| Undistributed ordinary income, net | $ | 2,808,747 |
|
| Net realized capital losses | 28,564,899 |
|
| Unrealized losses, net | (46,826,393 | ) |
The effect of the permanent book/tax reclassifications during the fiscal year ended September 30, 2016 resulted in an increase (decrease) to the components of net assets on the Consolidated Statements of Assets and Liabilities asAs of September 30, 2016 as follows:
|
| | | |
| Undistributed Net Investment Income | $ | 2,640,496 |
|
| Accumulated Net Realized Gain/(Loss) on Investments | (3,755,949 | ) |
| Paid-In Capital | (1,115,453 | ) |
For financial reporting purposes,2017, the Company had net capital accounts have been adjustedloss carryforwards of $28,564,899 to reflect the tax character of permanent book/tax differences. Reclassifications are primarily dueoffset net capital gains, to the extent available and permitted by U.S. federal income tax treatment of prepayment fees, nondeductible excise taxes paid, reclassification of distributions paid.
law. Of the capital loss carryforwards, $2,699,949 are available to offset future short-term capital gains and $25,864,950 are available to offset future long-term capital gains. The Company is permitted to carry forward any net capital losses, if any, incurred in taxable years beginning after December 22, 2010 for an unlimited period. However, any losses incurred during such taxable years will be required to be utilized prior to the capital losses incurred in taxable years ended prior to December 23, 2010, which are subject to an expiration date. As a result of this ordering rule, capital loss carryforwards may be more likely to expire unused.
As a RIC, the Company is also subject to a U.S. federal excise tax based on distribution requirements of its taxable income on a calendar year basis (e.g. calendar year 2015).basis. The Company anticipates timely distribution of its taxable income in accordance with tax rules. The Company incurred a de minimis U.S. federal excise tax for calendar year 2013. The Company did not incur a U.S. federal excise tax for calendar years 20142015 and 20152016 and does not expect to incur a U.S. federal excise tax for calendar year 2016.2017.
OAKTREE STRATEGIC INCOME CORPORATION
NOTES TO CONSOLIDATED FINANCIAL STATEMENTS
The aggregate cost of investments for income tax purposes was $607.3 million as of September 30, 2017. For the year ended September 30, 2017, the aggregate gross unrealized appreciation for all investments in which there was an excess of value over cost for income tax purposes was $4.6 million. For the year ended September 30, 2017, the aggregate gross unrealized depreciation for all investments in which there was an excess of cost for income tax purposes over value was $51.4 million. Net unrealized depreciation based on the aggregate cost of investments for income tax purposes was $46.8 million.
Note 10.9. Realized Gains or Losses and Net Unrealized Appreciation or Depreciation on Investments
Realized Gains or Losses
Realized gains or losses are measured by the difference between the net proceeds from the sale or redemption and the cost basis of the investment without regard to unrealized appreciation or depreciation previously recognized, and includesinclude investments written-off during the period, net of recoveries. Realized losses may also be recorded in connection with the Company's determination that certain investments are considered worthless securities and/or meet the conditions for loss recognition per the applicable tax rules.
Net unrealized appreciation or depreciation reflects the net change in the valuation of the portfolio pursuant to the Company's valuation guidelines and the reclassification of any prior period unrealized appreciation or depreciation.
DuringA summary of the Company's recorded investment realization events, excluding syndications of debt investments and sales of debt investments in the open market, for the year ended September 30, 2016,2017 is shown in the Company recorded investment realization events, including the following:table below:
FIFTH STREET SENIOR FLOATING RATE CORP.
|
| | | | | | | | | | | | |
| Date | | Portfolio Company | | Investment Type | | Consideration at Exit | | Realized Gain (Loss) | | Transaction |
| October 2016 | | TrialCard Incorporated | | Debt | | $ 9.9 million | | $ | — |
| | Full payoff |
| November 2016 | | Blackhawk Specialty Tools, LLC | | Debt | | 4.2 million | | — |
| | Full payoff |
| November 2016 | | NXT Capital, LLC | | Debt | | 8.7 million | | — |
| | Full payoff |
| November 2016 | | The Active Network, Inc. (a) | | Debt | | 2.4 million | | — |
| | Full payoff |
| November 2016 | | Fineline Technologies, Inc. | | Debt | | 10.5 million | | — |
| | Full payoff |
| November 2016 | | Legalzoom.com, Inc. (a) | | Debt | | 20.1 million | | — |
| | Full payoff |
| December 2016 | | Aptean, Inc. | | Debt | | 1.2 million | | — |
| | Full payoff |
| December 2016 | | Too Faced Cosmetics, LLC | | Debt | | 1.3 million | | — |
| | Full payoff |
| February 2017 | | Vitera Healthcare Solutions, LLC | | Debt | | 4.7 million | | — |
| | Full payoff |
| February 2017 | | TV Borrower US, LLC (a) | | Debt | | 9.1 million | | — |
| | Full payoff |
| February 2017 | | Teaching Strategies, LLC | | Debt | | 15.1 million | | — |
| | Full payoff |
| February 2017 | | AF Borrower, LLC | | Debt | | 1.1 million | | — |
| | Full payoff |
| February 2017 | | CRGT Inc. | | Debt | | 3.2 million | | — |
| | Full payoff |
| February 2017 | | Onvoy Merger Sub, LLC | | Debt | | 10.2 million | | — |
| | Full payoff |
| March 2017 | | NAVEX Global, Inc. | | Debt | | 5.0 million | | — |
| | Full payoff |
| May 2017 | | Hill International, Inc. | | Debt | | 5.9 million | | — |
| | Full payoff |
| May 2017 | | Baart Programs, Inc. (a) | | Debt | | 8.3 million | | — |
| | Full payoff |
| June 2017 | | ConvergeOne Holdings Corp. (a) | | Debt | | 5.3 million | | — |
| | Full payoff |
| June 2017 | | Idera, Inc. | | Debt | | 17.3 million | | — |
| | Full payoff |
| July 2017 | | TIBCO Software, Inc. | | Debt | | 7.9 million | | — |
| | Full payoff |
| July 2017 | | My Alarm Center, LLC (a) | | Debt | | 18.7 million | | — |
| | Full payoff |
| August 2017 | | GTCR Valor Companies, Inc. | | Debt | | 12.1 million | | — |
| | Full payoff |
| August 2017 | | NAVEX Global, Inc. | | Debt | | 0.9 million | | — |
| | Full payoff |
| August 2017 | | American Seafoods Group LLC (a) | | Debt | | 5.7 million | | — |
| | Full payoff |
| August 2017 | | Lytx, Inc. (a) | | Debt | | 9.9 million | | — |
| | Full payoff |
| August 2017 | | OBHG Management Services, LLC | | Debt | | 16.0 million | | — |
| | Full payoff |
| September 2017 | | Auction.com, LLC | | Debt | | 0.2 million | | — |
| | Full payoff |
| | | | | | | | $ | — |
| | |
OAKTREE STRATEGIC INCOME CORPORATION
NOTES TO CONSOLIDATED FINANCIAL STATEMENTS
In October 2015,__________
| |
| (a) | The Company also received prepayment fees in connection with the exit of these portfolio investments. |
During the year ended September 30, 2017, the Company received cash payments of $45.4 million in connection with syndications and sales of debt investments and recorded a cash paymentnet realized loss of $7.4$13.4 million, from Reliant Hospital Partners, LLC in full satisfaction of all obligations under the loan agreement. The debt investment was exited at par and no realized gain or loss was recorded on the transaction;
In October 2015, the Company received a cash payment of $16.8 million from Idera, Inc. in full satisfaction of all obligations under the loan agreement. The debt investment was exited at par and no realized gain or loss was recorded on the transaction;
In October 2015, the Company received a cash payment of $5.7 million from Novetta Solutions, LLC in full satisfaction of all obligations under the loan agreement. The debt investment was exited at par and no realized gain or loss was recorded on the transaction;
In December 2015, the Company received a cash payment of $17.6 million from All Web Leads, Inc. in full satisfaction of all obligations under the loan agreement. The debt investment was exited at par and no realized gain or loss was recorded on the transaction;
In January 2016, the Company received a cash payment of $6.4 million from TWCC Holding Corp. in full satisfaction of all obligations under the loan agreement. The debt investment was exited at par and no realized gain or loss was recorded on the transaction;
In February 2016, the Company received a cash payment of $1.4 million from B&H Education Inc. in full satisfaction of all obligations under the loan agreement. The debt investment was exited andincluding a realized loss of $4.3 million was recorded on the transaction;
In March 2016, the Company received a cash payment of $3.4$13.4 million from Pacific Architects and Engineers Incorporated in full satisfactionthe sale of all obligations under the loan agreement. The debt investment was exited at par and no realized gain or loss was recorded on the transaction;
In April 2016, the Company restructured its debtCompany's investment in Ameritox Ltd. As a partthe first and second lien term loans of Answers Corporation.
A summary of the restructuring, the Company exchanged itsCompany's recorded investment realization events, excluding syndications of debt securities forinvestments and sales of debt and equity securitiesinvestments in the restructured entity. The fair value ofopen market, during the debt securities exchanged onyear ended September 30, 2016 is shown in the restructuring date was $12.6 million, which approximated its fair value as of March 31, 2016. A realized loss of $8.7 million was recorded on the transaction;table below:
In May 2016, the Company received a cash payment of $20.8 million from Accruent, LLC in full satisfaction of all obligations under the loan agreement. The debt investment was exited at par and no realized gain or loss was recorded on the transaction;In June 2016, the Company received a cash payment of $13.3 million from GTCR Valor Companies, Inc. in full satisfaction of all obligations under the loan agreement. The debt investment was exited at par and no realized gain or loss was recorded on the transaction;
In August 2016, the Company received a cash payment of $5.8 million from Smile Brands Group Inc. in full satisfaction of all obligations under the loan agreement. The debt investment was exited at par and no realized gain or loss was recorded on the transaction;
In September 2016, the Company received a cash payment of $14.0 million from Language Line, LLC in full satisfaction of all obligations under the loan agreement. The debt investment was exited at par (plus additional fees) and no realized gain or loss was recorded on the transaction;
In September 2016, the Company received a cash payment of $5.9 million from Aptos, Inc. in full satisfaction of all obligations under the loan agreement. The debt investment was exited at par and no realized gain or loss was recorded on the transaction; |
| | | | | | | | | | | | |
| Date | | Portfolio Company | | Investment Type | | Consideration at Exit | | Realized Gain (Loss) | | Transaction |
| October 2015 | | Reliant Hospital Partners, LLC | | Debt | | $ 7.4 million | | $ | — |
| | Full payoff |
| October 2015 | | Idera, Inc. | | Debt | | 16.8 million | | — |
| | Full payoff |
| October 2015 | | Novetta Solutions, LLC | | Debt | | 5.7 million | | — |
| | Full payoff |
| December 2015 | | All Web Leads, Inc. | | Debt | | 17.6 million | | — |
| | Full payoff |
| January 2016 | | TWCC Holding Corp. | | Debt | | 6.4 million | | — |
| | Full payoff |
| February 2016 | | B&H Education Inc. | | Debt | | 1.4 million | | (4.3 million) |
| | Partial payoff |
| March 2016 | | Pacific Architects and Engineers Incorporated | | Debt | | 3.4 million | | — |
| | Full payoff |
| April 2016 | | Ameritox Ltd. | | Debt | | 12.6 million | | (8.7 million) |
| | Restructuring |
| May 2016 | | Accruent, LLC | | Debt | | 20.8 million | | — |
| | Full payoff |
| June 2016 | | GTCR Valor Companies, Inc. | | Debt | | 13.3 million | | — |
| | Partial payoff |
| August 2016 | | Smile Brands Group Inc. | | Debt | | 5.8 million | | — |
| | Full payoff |
| September 2016 | | Language Line, LLC | | Debt | | 14.0 million | | — |
| | Full payoff |
| September 2016 | | Aptos, Inc. | | Debt | | 5.9 million | | — |
| | Full payoff |
| | | | | | | | $ (13.0 million) |
| | |
During the year ended September 30, 2016, the Company received cash payments of $163.3 million in connection with syndications and sales of debt investments and recorded a net realized gain of $0.2 million.
DuringA summary of the Company's recorded investment realization events, excluding syndications of debt investments and sales of debt investments in the open market, for the year ended September 30, 2015 is shown in the Company recorded investment realization events, including the following:
In October 2014, the Company received a cash payment of $6.8 million from Answers Corporation in full satisfaction of all obligations under the loan agreement. The debt investment was exited at par (plus additional fees) and no realized gain or loss was recorded on the transaction;
In December 2014, the Company received a cash payment of $4.9 million from Survey Sampling International, LLC in full satisfaction of all obligations under the loan agreement. The debt investment was exited at par and no realized gain or loss was recorded on the transaction;table below:
FIFTH STREET SENIOR FLOATING RATE CORP.
NOTES TO CONSOLIDATED FINANCIAL STATEMENTS
In April 2015, the Company received a cash payment of $9.4 million from Travel Leaders Group, LLC in full satisfaction of all obligations under the loan agreement. The debt investment was exited at par and no realized gain or loss was recorded on the transaction;
In April 2015, the Company received a cash payment of $11.2 million from IPC Systems, Inc. in full satisfaction of all obligations under the loan agreement. The debt investment was exited at par and no realized gain or loss was recorded on the transaction;
In April 2015, the Company received a cash payment of $2.5 million from Symphony Teleca Services, Inc. in full satisfaction of all obligations under the loan agreement. The debt investment was exited at par (plus additional fees) and no realized gain or loss was recorded on the transaction; and
In May 2015, the Company received a cash payment of $4.1 million from GOBP Holdings, Inc. in full satisfaction of all obligations under the loan agreement. The debt investment was exited at par (plus additional fees) and no realized gain or loss was recorded on the transaction;
In August 2015, the Company received a cash payment of $14.3 million from AMAG Pharmaceuticals, Inc. in full satisfaction of all obligations under the loan agreement. The debt investment was exited at par (plus additional fees) and no realized gain or loss was recorded on the transaction; and |
| | | | | | | | | | | | |
| Date | | Portfolio Company | | Investment Type | | Consideration at Exit | | Realized Gain (Loss) | | Transaction |
| October 2014 | | Answers Corporation | | Debt | | $ 6.8 million | | $ | — |
| | Full payoff |
| December 2014 | | Survey Sampling International, LLC | | Debt | | 4.9 million | | — |
| | Full payoff |
| April 2015 | | Travel Leaders Group, LLC | | Debt | | 9.4 million | | — |
| | Full payoff |
| April 2015 | | IPC Systems, Inc. | | Debt | | 11.2 million | | — |
| | Full payoff |
| April 2015 | | Symphony Teleca Services, Inc. | | Debt | | 2.5 million | | — |
| | Full payoff |
| May 2015 | | GOBP Holdings, Inc. | | Debt | | 4.1 million | | — |
| | Full payoff |
| August 2015 | | AMAG Pharmaceuticals, Inc. | | Debt | | 14.3 million | | — |
| | Full payoff |
| | | | | | | | $ | — |
| | |
During the year ended September 30, 2015, the Company received cash payments of $480.4 million in connection with full or partial sales of debt investments and recorded a net realized gain of $0.4 million.
DuringNet Unrealized Appreciation or Depreciation on Investments
For the year ended September 30, 2014,2017, the Company recorded investment realization events, including the following:net unrealized depreciation of $17.8 million. This consisted of $14.1 millionof net unrealized depreciation on debt investments and $12.9 million of net unrealized depreciation on equity investments, offset by $9.2 millionof net reclassifications to realized loss (resulting in unrealized appreciation).
In March 2014, the Company received a cash payment of $5.0 million from Bellisio Foods, Inc. in full satisfaction of all obligations under the loan agreement. The debt investment was exited at par and no realized gain or loss was recorded on the transaction;OAKTREE STRATEGIC INCOME CORPORATION
In May 2014, the Company received a cash payment of $8.8 million from American Auto Auction Group, LLC in full satisfaction of all obligations under the loan agreement. The debt investment was exited at par and no realized gain or loss was recorded on the transaction;NOTES TO CONSOLIDATED FINANCIAL STATEMENTS
In August 2014, the Company received a cash payment of $4.5 million from Quorum Business Solutions (USA), Inc. in full satisfaction of all obligations under the loan agreement. The debt investment was exited at par (plus additional fees) and no realized gain or loss was recorded on the transaction;
In August 2014, the Company received a cash payment of $7.5 million from TriMark USA LLC in full satisfaction of all obligations under the loan agreement. The debt investment was exited at par and no realized gain or loss was recorded on the transaction; and
During the year ended September 30, 2014, the Company received cash payments of $120.6 million in connection with full or partial payoffs and sales of debt securities and recorded a net realized gain of $1.3 million.
DuringFor the year ended September 30, 2016, the Company recorded net unrealized depreciation of $17.0 million. This consisted of $17.5 million of net unrealized depreciation on debt investments and $2.5 million of net unrealized depreciation on equity investments, offset by $3.0 million of net reclassifications to realized loss (resulting in unrealized appreciation). During
For the year ended September 30, 2015, the Company recorded net unrealized depreciation of $12.8 million. This consisted of $11.8 million of net unrealized depreciation on debt investments and $1.0 million of net unrealized depreciation on equity investments. During the year ended September 30, 2014, the Company recorded net unrealized appreciation of $2.3 million, consisting of $2.1 million of unrealized appreciation on debt investments and $0.2 million of unrealized appreciation on equity investments.
Note 11.10. Concentration of Credit Risks
The Company placesdeposits its cash inwith financial institutions and at times such balances may be in excess of the FDIC insuredinsurance limit. The Company limits its exposure to credit loss by depositing its cash with high credit quality financial institutions and monitoring their financial stability.
FIFTH STREET SENIOR FLOATING RATE CORP.
NOTES TO CONSOLIDATED FINANCIAL STATEMENTS
Note 12.11. Related Party Transactions
TheAs of September 30, 2017, the Company has entered intowas party to an investment advisory agreement with FSM (the “Former Investment Advisory Agreement”), which was the Investment Adviser.Company’s investment adviser through the closing of the Transaction. Under the investment advisory agreement,Former Investment Advisory Agreement, the Company pays the Investment Adviserpaid FSM a fee for its services consisting of two components —components: a base management fee and an incentive fee.
Base Management Fee
The base management fee iswas calculated at an annual rate of 1% of the Company's gross assets (i.e., total assets held before deduction of any liabilities), which includesincluding any investments acquired with the use of leverage and excludesexcluding any cash, cash equivalents and restricted cash. The base management fee iswas calculated based on the average value of the Company's gross assets at the end of the two most recently completed quarters. The base management fee iswas payable quarterly in arrears and the fee for any partial month or quarter iswas appropriately prorated.
For the years ended September 30, 2017, 2016 September 30,and 2015, and September 30, 2014, base management fees (net of waivers, if any) were $5.6 million, $6.1 million $5.9 million and $1.6$5.9 million, respectively.
Incentive Fee
TheAs of September 30, 2017, the incentive fee portion of the investment advisory agreement hasFormer Investment Advisory Agreement had two parts. The first part ("Part I incentive fee") iswas calculated and payable quarterly in arrears based on the Company's "Pre-Incentive Fee Net Investment Income" for the immediately preceding fiscal quarter. For this purpose, "Pre-Incentive Fee Net Investment Income" meansmeant interest income, dividend income and any other income (including any other fees (other than fees for providing managerial assistance), such as commitment, origination, structuring, diligence and consulting fees or other fees that the Company receivesreceived from portfolio companies) accrued during the fiscal quarter, minus the Company's operating expenses for the quarter (including the base management fee, expenses payable under the Company's administration agreement,Prior Administration Agreement, and any interest expense and dividends paid on any issued and outstanding indebtedness or preferred stock, but excluding the incentive fee). Pre-Incentive Fee Net Investment Income includes,included, in the case of investments with a deferred interest feature (such as OID, debt instruments with PIK interest and zero coupon securities), accrued income that the Company hashad not yet received in cash. Pre-Incentive Fee Net Investment Income doesdid not include any realized capital gains, realized capital losses or unrealized capital appreciation or depreciation.
Pre-Incentive Fee Net Investment Income, expressed as a rate of return on the value of the Company's net assets at the end of the immediately preceding fiscal quarter, will bewas compared to a "hurdle rate" of 1.5% per quarter, subject to a "catch-up" provision measured as of the end of each fiscal quarter. The Company's net investment income used to calculate this part of the incentive fee iswas also included in the amount of its gross assets used to calculate the 1% base management fee. The operation of the incentive fee with respect to the Company's Pre-Incentive Fee Net Investment Income for each quarter iswas as follows:
No incentive fee iswas payable to the Investment AdviserFSM in any fiscal quarter in which the Company's Pre-Incentive Fee Net Investment Income doesdid not exceed the hurdle rate of 1.5% (the "preferred return" or "hurdle");
50% of the Company's Pre-Incentive Fee Net Investment Income with respect to that portion of such Pre-Incentive Fee Net Investment Income, if any, that exceedsexceeded the hurdle rate but iswas less than or equal to 2.5% in any fiscal quarter iswas payable to the Investment Adviser.FSM. The Company refers to this portion of its Pre-Incentive Fee Net Investment Income (which exceeds the hurdle rate but is less than or equal to 2.5%) as the "catch-up." The "catch-up" provision iswas intended to provide the Investment AdviserFSM with an incentive fee of
OAKTREE STRATEGIC INCOME CORPORATION
NOTES TO CONSOLIDATED FINANCIAL STATEMENTS
20% on all of the Company's Pre-Incentive Fee Net Investment Income as if a hurdle rate did not apply when the Company's Pre-Incentive Fee Net Investment Income exceeds 2.5% in any fiscal quarter; and
20% of the amount of the Company's Pre-Incentive Fee Net Investment Income, if any, that exceedsexceeded 2.5% in any fiscal quarter is payable to the Investment AdviserFSM once the hurdle is reached and the catch-up is achieved.
There iswas no accumulation of amounts on the hurdle rate from quarter to quarter and accordingly there iswas no clawback of amounts previously paid if subsequent quarters arewere below the quarterly hurdle and there iswas no delay of payment if prior quarters arewere below the quarterly hurdle.
For the years ended September 30, 2017, 2016 September 30,and 2015, and September 30, 2014, the Part I incentive fee was $3.2 million, $5.2 million $5.7 million and $0.7$5.7 million, respectively.
TheAs of September 30, 2017, the second part ("Part II incentive fee" or "capital gain incentive fee") of the incentive fee iswas determined and payable in arrears as of the end of each fiscal year (or upon termination of the investment advisory agreement,Former Investment Advisory Agreement, as of the termination date) and equalsequaled 20% of the Company's realized capital gains, if any, on a cumulative basis from inception through the end of each fiscal year, computed net of all realized capital losses and unrealized capital depreciation on a cumulative basis, less the aggregate amount of any previously paid capital gain incentive fees. For the years ended September 30, 2017 and 2016, there was no Part II incentive fee. For the year ended September 30, 2015, $0.8 million of the Part II incentive fee was reversed due to
unrealized losses on the investment portfolio. For the year ended September 30, 2014, the Part II incentive fee was $0.8 million. For
FIFTH STREET SENIOR FLOATING RATE CORP.
NOTES TO CONSOLIDATED FINANCIAL STATEMENTS
the year ended September 30, 2016, there was no Part II incentive fee. From inception to date, the Company has paid aggregate Part II incentive fees of approximately $0.1 million.
GAAP requires the Company to accrue for the theoretical capital gain incentive fee that would be payable after giving effect to the net unrealized capital appreciation. A fee so calculated and accrued would not be payable under the investment advisory agreement,Former Investment Advisory Agreement, and may never be paid based upon the computation of capital gain incentive fees in subsequent periods. Amounts ultimately paid under the investment advisory agreementFormer Investment Advisory Agreement will be consistent with the formula reflected in the investment advisory agreement.Former Investment Advisory Agreement. The Company doesdid not currently accrue for capital gain incentive fees as of September 30, 2017 due to the accumulated realized and unrealized losses in the portfolio.
AtAs of September 30, 20162017 and September 30, 2015,2016, the Company had a liability on its Consolidated Statements of Assets and Liabilities in the amount of $3.0$2.2 million and $2.1$3.0 million, respectively, reflecting the unpaid portion of the base management fee and incentive feesfee payable to the Investment Adviser.FSM.
IndemnificationPrior Administration Agreement
The investment advisory agreement provides that, absent willful misfeasance, bad faith or gross negligence in the performanceAs of their respective duties or by reason of the reckless disregard of their respective duties and obligations, the Investment Adviser and its officers, managers, partners, members (and their members, including the owners of their members), agents, employees, controlling persons and any other person or entity affiliated with it, are entitled to indemnification fromSeptember 30, 2017, the Company for any damages, liabilities, costs and expenses (including reasonable attorneys' fees and amounts reasonably paid in settlement) arising fromwas party to the rendering ofPrior Administration Agreement with FSC CT. Under the Investment Adviser's services under the investment advisory agreement or otherwise as the Investment Adviser.
Prior Administration Agreement,
On January 1, 2015, the Company entered into an administration agreement with its administrator, FSC CT LLC, a wholly-owned subsidiary of the Investment Adviser ("FSC CT"), under substantially similar terms as its prior administration agreement with FSC CT, Inc. Under the administration agreement, FSC CT providesprovided administrative services for the Company, including providing the Company with office facilities, including its principal executive offices, and equipment and clerical, bookkeeping and recordkeeping services at such facilities. Under the administration agreement,Prior Administration Agreement, FSC CT also performsperformed or overseesoversaw the performance of the Company's required administrative services, which includesincluded being responsible for the financial records which the Company is required to maintain and preparing reports to the Company's stockholders and reports filed with the SEC. In addition, FSC CT assistsassisted the Company in determining and publishing the Company's net asset value, overseeingoversaw the preparation and filing of the Company's tax returns and the printing and dissemination of reports to the Company's stockholders, and generally overseeingoversaw the payment of the Company's expenses and the performance of administrative and professional services rendered to the Company by others. FSCTFSC CT may also provide,provided, on behalf of the Company, managerial assistance to its portfolio companies. For providing these services, facilities and personnel, the Company reimbursesreimbursed FSC CT the allocable portion of overhead and other expenses incurred by FSC CT in performing its obligations under the administration agreement,Prior Administration Agreement, including rent, the Company's allocable portion of the costs of compensation and related expenses of the Company's chief financial officerChief Financial Officer and chief compliance officerChief Compliance Officer and their staffs. Such reimbursement iswas at cost with no profit to, or markup by, FSC CT. TheAs of September 30, 2017, the Company utilizesutilized office space in Greenwich, CT that iswas leased by FSC CT from an affiliateentity controlled by the chief executive officer of the Investment AdviserFSM and FSC CT, Mr. Leonard M. Tannenbaum. TheAs of September 30, 2017, the Company also utilizesutilized additional office space that iswas leased by affiliates of the Investment AdviserFSM and FSC CT in Chicago, IL and Miami Beach, FL.IL. Any reimbursement for a portion of the rent at these locations isthis location was at cost with no profit to, or markup by, FSC CT. The administration agreement may be terminatedwas terminable by either party without penalty upon 60 days' written notice to the other party.party and was terminated on October 17, 2017.
For the year ended September 30, 2017, the Company accrued administrative expenses of $1.9 million, including $1.2 million of general and administrative expenses, which was due to FSC CT. For the years ended September 30, 2016 and September 30, 2015, the Company accrued administrative expenses of $1.2 million, including $0.7 million of general and administrative expenses. For the years ended September 30, 2015expenses, and September 30, 2014, the Company accrued administrative expenses of $1.3 million, including $0.5 million of general and administrative expenses, and $0.7 million, including $0.2 millionrespectively, which was due to FSC CT. As of generalSeptember 30,
OAKTREE STRATEGIC INCOME CORPORATION
NOTES TO CONSOLIDATED FINANCIAL STATEMENTS
2017 and administrative expenses, respectively. At September 30, 2016, and September 30, 2015, $0.4$0.5 million and $0.4 million, respectively, was included in Due"Due to FSC CTCT" in the Consolidated Statements of Assets and Liabilities.
Common stockStock held by FSAM and Principals
AsBased on reports filed with the SEC, as of September 30, 2016,2017, a subsidiary of FSAM held 1,381,752reported holdings of 2,677,519 shares of FSFRthe Company's common stock, which represents approximately 4.7%9.1% of FSFRthe Company's common stock outstanding.
Based on reports filed with the SEC, as of September 30, 2017, Mr. Tannenbaum directly and indirectly held 5,333,785 shares of the Company's common stock, which represents approximately 18.1% of the Company's common stock outstanding.
FIFTH STREET SENIOR FLOATING RATE CORP.
NOTES TO CONSOLIDATED FINANCIAL STATEMENTS
Note 13.12. Financial Highlights
|
| | | | | | | | | | | | | | | | |
| | | Year ended
September 30, 2016 | | Year ended September 30, 2015 | | Year ended September 30, 2014 | | Period from June 29, 2013 (commencement of operations) through September 30, 2013
|
| Net asset value at beginning of period | | $ | 12.11 |
| | $ | 12.65 |
| | $ | 15.11 |
| | $ | — |
|
| Net investment income (5) | | 0.86 |
| | 0.96 |
| | 0.62 |
| | — |
|
| Net unrealized appreciation (depreciation) on investments and secured borrowings (5) | | (0.58 | ) | | (0.43 | ) | | 0.24 |
| | 0.12 |
|
| Net realized gain (loss) on investments (5) | | (0.43 | ) | | 0.01 |
| | 0.14 |
| | 0.01 |
|
| Distributions to stockholders (5) | | (0.90 | ) | | (1.07 | ) | | (0.62 | ) | | — |
|
| Tax return of capital (5) | | — |
| | — |
| | (0.39 | ) | | — |
|
| Net issuance of common stock (5) | | — |
| | (0.01 | ) | | (2.45 | ) | | 14.98 |
|
| Net asset value at end of period | | $ | 11.06 |
| | $ | 12.11 |
| | $ | 12.65 |
| | $ | 15.11 |
|
| Per share market value at beginning of period | | $ | 8.73 |
| | $ | 11.82 |
| | $ | 13.54 |
| | $ | 15.00 |
|
| Per share market value at end of period | | $ | 8.56 |
| | $ | 8.73 |
| | $ | 11.82 |
| | $ | 13.54 |
|
| Total return (1) | | 9.44 | % | | (15.76 | )% | | (8.20 | )% | | (9.73 | )% |
| Common shares outstanding at beginning of period | | 29,466,768 |
| | 29,466,768 |
| | 6,666,768 |
| | 100 |
|
| Common shares outstanding at end of period | | 29,466,768 |
| | 29,466,768 |
| | 29,466,768 |
| | 6,666,768 |
|
| Net assets at beginning of period | | $ | 356,807,103 |
| | $ | 372,677,678 |
| | $ | 100,705,269 |
| | $ | 1,500 |
|
| Net assets at end of period | | $ | 325,829,394 |
| | $ | 356,807,103 |
| | $ | 372,677,678 |
| | $ | 100,705,269 |
|
| Average net assets (2) | | $ | 332,486,362 |
| | $ | 368,839,422 |
| | $ | 132,873,801 |
| | $ | 80,133,138 |
|
| Ratio of net investment income to average net assets (3) | | 7.59 | % | | 7.67 | % | | 4.34 | % | | 0.08 | % |
| Ratio of total expenses to average net assets (3) | | 8.44 | % | | 6.29 | % | | 5.20 | % | | 2.14 | % |
| Ratio of base management fee waiver to average net assets (3) | | — | % | | — % |
| | (0.12 | )% | | — % |
|
| Ratio of net expenses to average net assets (3) | | 8.44 | % | | 6.29 | % | | 5.08 | % | | 2.14 | % |
| Ratio of portfolio turnover to average investments at fair value | | 28.02 | % | | 21.48 | % | | 78.96 | % | | 16.44 | % |
| Weighted average outstanding debt (4) | | $ | 303,204,218 |
| | $ | 243,240,691 |
| | $ | 49,833,018 |
| | $ | — |
|
| Average debt per share (5) | | $ | 10.29 |
| | $ | 8.25 |
| | $ | 5.36 |
| | $ | — |
|
_______________ |
| | | | | | | | | | | | | | | | | | | | |
| | | Year ended
September 30, 2017 | | Year ended
September 30, 2016 | | Year ended September 30, 2015 | | Year ended September 30, 2014 | | Period from June 29, 2013 (commencement of operations) through September 30, 2013
|
| Net asset value at beginning of period | | $ | 11.06 |
| | $ | 12.11 |
| | $ | 12.65 |
| | $ | 15.11 |
| | $ | — |
|
| Net investment income (5) | | 0.76 |
| | 0.86 |
| | 0.96 |
| | 0.62 |
| | — |
|
| Net unrealized appreciation (depreciation) on investments and secured borrowings (5) | | (0.60 | ) | | (0.58 | ) | | (0.43 | ) | | 0.24 |
| | 0.12 |
|
| Net realized gain (loss) on investments (5) | | (0.45 | ) | | (0.43 | ) | | 0.01 |
| | 0.14 |
| | 0.01 |
|
| Distributions to stockholders (5) | | (0.80 | ) | | (0.90 | ) | | (1.07 | ) | | (0.62 | ) | | — |
|
| Tax return of capital (5) | | — |
| | — |
| | — |
| | (0.39 | ) | | — |
|
| Net issuance of common stock (5) | | — |
| | — |
| | (0.01 | ) | | (2.45 | ) | | 14.98 |
|
| Net asset value at end of period | | $ | 9.97 |
| | $ | 11.06 |
| | $ | 12.11 |
| | $ | 12.65 |
| | $ | 15.11 |
|
| Per share market value at beginning of period | | $ | 8.56 |
| | $ | 8.73 |
| | $ | 11.82 |
| | $ | 13.54 |
| | $ | 15.00 |
|
| Per share market value at end of period | | $ | 8.80 |
| | $ | 8.56 |
| | $ | 8.73 |
| | $ | 11.82 |
| | $ | 13.54 |
|
| Total return (1) | | 12.51 | % | | 9.44 | % | | (15.76 | )% | | (8.20 | )% | | (9.73 | )% |
| Common shares outstanding at beginning of period | | 29,466,768 |
| | 29,466,768 |
| | 29,466,768 |
| | 6,666,768 |
| | 100 |
|
| Common shares outstanding at end of period | | 29,466,768 |
| | 29,466,768 |
| | 29,466,768 |
| | 29,466,768 |
| | 6,666,768 |
|
| Net assets at beginning of period | | $ | 325,829,394 |
| | $ | 356,807,103 |
| | $ | 372,677,678 |
| | $ | 100,705,269 |
| | $ | 1,500 |
|
| Net assets at end of period | | $ | 293,636,434 |
| | $ | 325,829,394 |
| | $ | 356,807,103 |
| | $ | 372,677,678 |
| | $ | 100,705,269 |
|
| Average net assets (2) | | $ | 316,440,902 |
| | $ | 332,486,362 |
| | $ | 368,839,422 |
| | $ | 132,873,801 |
| | $ | 80,133,138 |
|
| Ratio of net investment income to average net assets (3) | | 7.09 | % | | 7.59 | % | | 7.67 | % | | 4.34 | % | | 0.08 | % |
| Ratio of total expenses to average net assets (3) | | 7.71 | % | | 8.44 | % | | 6.29 | % | | 5.20 | % | | 2.14 | % |
| Ratio of base management fee waiver to average net assets (3) | | — | % | | — | % | | — % |
| | (0.12 | )% | | — % |
|
| Ratio of insurance recoveries to average net assets (3) | | (0.08 | )% | | — | % | | — | % | | — | % | | — | % |
| Ratio of net expenses to average net assets (3) | | 7.63 | % | | 8.44 | % | | 6.29 | % | | 5.08 | % | | 2.14 | % |
| Ratio of portfolio turnover to average investments at fair value | | 46.80 | % | | 28.02 | % | | 21.48 | % | | 78.96 | % | | 16.44 | % |
| Weighted average outstanding debt (4) | | $ | 267,608,526 |
| | $ | 303,204,218 |
| | $ | 243,240,691 |
| | $ | 49,833,018 |
| | $ | — |
|
| Average debt per share (5) | | $ | 9.08 |
| | $ | 10.29 |
| | $ | 8.25 |
| | $ | 5.36 |
| | $ | — |
|
|
| |
| (1) | Total return equals the increase or decrease of ending market value over beginning market value, plus distributions, divided by the beginning market value, assuming dividend reinvestment prices obtained under the Company's DRIP. Total return is not annualized during interim periods. |
| (2) | Calculated based upon the weighted average net assets for the period. |
| (3) | Periods less than twelve months are annualized. |
| (4) | Calculated based upon the weighted average of loans payable for the period. |
| (5) | Calculated based upon weighted average shares outstanding for the period. |
OAKTREE STRATEGIC INCOME CORPORATION
NOTES TO CONSOLIDATED FINANCIAL STATEMENTS
Note 14.13. Commitments and Contingencies
SEC Examination and Investigation
On March 23, 2016, the Division of Enforcement of the Securities and Exchange Commission (the “SEC”)SEC sent document subpoenas and document-preservation notices to the Company, FSAM, FSCO GP LLC - General Partner of Fifth Street Opportunities Fund, L.P. (“FSOF”), and Fifth Street Finance Corp. (“FSC”).OCSL. The subpoenas sought production of documents relating to a variety of issues principally related to the activities of FSM, including those raised in an ordinary-course examination of Fifth Street Management LLCFSM by the SEC’s Office of Compliance Inspections and Examinations that began in October 2015, and in certain FSCpreviously disclosed OCSL and FSAM securities class actions and the FSCOCSL derivative actions. The subpoenas were issued pursuant to a formal order of private investigation captioned In the Matter of the Fifth Street Group of Companies, No. HO-12925, dated March 23, 2016, which addresses (among other things) (i) the valuation of our
FIFTH STREET SENIOR FLOATING RATE CORP.
NOTES TO CONSOLIDATED FINANCIAL STATEMENTS
the Company's portfolio companies and investments, (ii) the expenses allocated or charged to the Company and FSC,OCSL, (iii) FSOF’s trading in the securities of publicly traded business-development companies, (iv) statements to the board of directors, other representatives of pooled investment vehicles, investors, or prospective investors concerning the fair value of the Company's portfolio companies or investments as well as expenses allocated or charged to the Company and FSC,OCSL, (v) various issues relating to adoption and implementation of policies and procedures under the Investment Advisers Act of 1940, as amended (the “Advisers Act”), (vi) statements and/or potential omissions in the entities’ SEC filings, (vii) the entities’ books, records, and accounts and whether they fairly and accurately reflected the entities’ transactions and dispositions of assets, and (viii) several other issues relating to corporate books and records. The formal order cites various provisions of the Securities Act of 1933, as amended, the Securities Exchange Act of 1934, as amended (the "Exchange Act"), and the Advisers Act, as well as rules promulgated under those Acts, as the bases of the investigation. The subpoenaed Fifth Street entities areCompany is cooperating with the Division of Enforcement investigation, havehas produced requested documents, and havehas been communicating with Division of Enforcement personnel. The Investment Adviser is not subject to these subpoenas.
During the year ended September 30, 2017, the Company received insurance reimbursements related to previously incurred legal professional fees of approximately $0.3 million.
Off-Balance Sheet Arrangements
The Company may be a party to financial instruments with off-balance sheet risk in the normal course of business to meet the financial needs of its portfolio companies. As of September 30, 20162017 and September 30, 2015,2016, off-balance sheet arrangements consisted of $52.8$43.5 million and $76.8$52.8 million, respectively, of unfunded commitments to provide debt and equity financing to certain of the Company's portfolio companies. Such commitments are subject to the portfolio companies' satisfaction of certain financial and nonfinancial covenants and may involve, to varying degrees, elements of credit risk in excess of the amount recognized in the Consolidated Statements of Assets and Liabilities and are not reflected on our Consolidated StatementsLiabilities.
OAKTREE STRATEGIC INCOME CORPORATION
NOTES TO CONSOLIDATED FINANCIAL STATEMENTS
A list of Assets and Liabilities. The Company believes that its assets will provide adequate cover to satisfy all of our unfunded commitments as of September 30, 2016.
A summary of the composition of unfunded commitmentsby investment (consisting of revolvers, term loans and FSFR Glick JV Subordinated Notes and LLC equity interests) as of September 30, 20162017 and September 30, 20152016 is shown in the table below: | | | | | September 30, 2016 | | September 30, 2015 | | September 30, 2017 | | September 30, 2016 |
| FSFR Glick JV LLC | | $ | 16,382,494 |
| | $ | 28,522,027 |
| | $ | 16,159,368 |
| | $ | 16,382,494 |
|
| TIBCO Software, Inc. | | 5,300,000 |
| | 5,300,000 |
| |
| MHE Intermediate Holdings | | | 6,749,698 |
| | — |
|
| Triple Point Group Holdings, Inc. | | 4,968,590 |
| | 4,968,590 |
| | 4,968,590 |
| | 4,968,590 |
|
| BeyondTrust Software, Inc. | | 3,605,000 |
| | 3,605,000 |
| | 3,605,000 |
| | 3,605,000 |
|
| Motion Recruitment Partners LLC | | | 2,900,000 |
| | 2,900,000 |
|
| PowerPlan, Inc. | | | 2,100,000 |
| | 2,100,000 |
|
| Ministry Brands, LLC | | | 1,857,967 |
| | — |
|
| Impact Sales, LLC | | | 1,078,125 |
| | — |
|
| Valet Merger Sub, Inc. | | | 833,333 |
| | 333,333 |
|
| Executive Consulting Group, Inc. | | | 800,000 |
| | 800,000 |
|
| Internet Pipeline, Inc. | | | 800,000 |
| | 800,000 |
|
| Metamorph US 3, LLC (1) | | | 720,000 |
| | 1,800,000 |
|
| Systems, Inc. | | | 600,000 |
| | — |
|
| Sailpoint Technologies, Inc. | | | 300,000 |
| | 200,000 |
|
| 4 Over International, LLC | | | 68,452 |
| | 68,452 |
|
| TIBCO Software, Inc. | | | — |
| | 5,300,000 |
|
| All Web Leads, Inc. | | 3,458,537 |
| | 2,454,572 |
| | — |
| | 3,458,537 |
|
| Motion Recruitment Partners LLC | | 2,900,000 |
| | 2,900,000 |
| |
| Legalzoom.com, Inc. | | 2,607,018 |
| | 2,607,018 |
| | — |
| | 2,607,018 |
|
| Teaching Strategies, LLC | | 2,400,000 |
| | 2,400,000 |
| | — |
| | 2,400,000 |
|
| PowerPlan, Inc. | | 2,100,000 |
| | 2,100,000 |
| |
| Metamorph US 3, LLC | | 1,800,000 |
| | 1,800,000 |
| |
| Dynatect Group Holdings, Inc. | | 1,800,000 |
| | 1,800,000 |
| | — |
| | 1,800,000 |
|
| My Alarm Center, LLC | | 1,212,472 |
| | 1,287,499 |
| | — |
| | 1,212,472 |
|
| Baart Programs, Inc. | | 1,000,000 |
| | — |
| | — |
| | 1,000,000 |
|
| TrialCard Incorporated | | 850,000 |
| | 850,000 |
| | — |
| | 850,000 |
|
| Executive Consulting Group, Inc. | | 800,000 |
| | 4,800,000 |
| |
| Internet Pipeline, Inc. | | 800,000 |
| | 800,000 |
| |
| NextCare, Inc. | | — |
| | 1,221,621 |
| |
| Valet Merger Sub, Inc. | | 333,333 |
| | 1,000,000 |
| |
| Sailpoint Technologies, inc. | | 200,000 |
| | — |
| |
| OBHG Management Services, LLC | | 100,000 |
| | — |
| | — |
| | 100,000 |
|
| Accruent, LLC | | 85,000 |
| | — |
| | — |
| | 85,000 |
|
| 4 Over International, LLC | | 68,452 |
| | — |
| |
| Landslide Holdings, Inc. | | — |
| | 5,000,000 |
| |
| Idera, Inc. | | — |
| | 2,400,000 |
| |
| Ameritox Ltd. | | — |
| | 1,000,000 |
| |
| Total | | $ | 52,770,896 |
| | $ | 76,816,327 |
| | $ | 43,540,533 |
| | $ | 52,770,896 |
|
_______
(1) This investment was on cash non-accrual status as of September 30, 2017.
FIFTH STREET SENIOR FLOATING RATE CORP.
NOTES TO CONSOLIDATED FINANCIAL STATEMENTS
Note 15.14. Selected Quarterly Financial Data (unaudited)
Selected unaudited quarterly financial data for Fifth Street Senior Floating Rate Corp.Oaktree Strategic Income Corporation for the years ended September 30, 2017, 2016 2015 and 20142015 are below:
| | | | For the three months ended | For the three months ended |
(dollars in thousands,
except per share
amounts) | September 30, 2016 | June 30,
2016 | March 31,
2016 | December
31, 2015 | September 30, 2015 | June 30,
2015 (revised) | March 31,
2015 (revised) | December
31, 2014 (revised) | September 30, 2014 (revised) | June 30, 2014 (revised) | March 31, 2014 (revised) | December 31, 2013 (revised) | September 30, 2017 | June 30,
2017 | March 31,
2017 | December
31, 2016 | September 30, 2016 | June 30,
2016 | March 31,
2016 | December
31, 2015 | September 30, 2015 | June 30,
2015 | March 31,
2015 | December
31, 2014 |
| Total investment income | $ | 13,203 |
| $ | 13,114 |
| $ | 13,195 |
| $ | 13,914 |
| $ | 14,068 |
| $ | 14,140 |
| $ | 11,341 |
| $ | 11,923 |
| $ | 4,918 |
| $ | 3,043 |
| $ | 2,910 |
| $ | 1,646 |
| $ | 11,820 |
| $ | 12,171 |
| $ | 11,020 |
| $ | 11,561 |
| $ | 13,203 |
| $ | 13,114 |
| $ | 13,195 |
| $ | 13,914 |
| $ | 14,068 |
| $ | 14,140 |
| $ | 11,341 |
| $ | 11,923 |
|
| Net investment income | 6,342 |
| 6,164 |
| 5,785 |
| 7,002 |
| 7,402 |
| 7,086 |
| 6,294 |
| 7,496 |
| 2,297 |
| 1,263 |
| 1,438 |
| 765 |
| 5,521 |
| 5,930 |
| 5,086 |
| 5,884 |
| 6,342 |
| 6,164 |
| 5,785 |
| 7,002 |
| 7,402 |
| 7,086 |
| 6,294 |
| 7,496 |
|
| Net realized and unrealized gain (loss) | 2,251 |
| (5,248 | ) | (6,445 | ) | (20,308 | ) | (7,115 | ) | (4,632 | ) | 393 |
| (1,012 | ) | 2,070 |
| 733 |
| 409 |
| 389 |
| (19,984 | ) | (5,791 | ) | (254 | ) | (5,159 | ) | 2,251 |
| (5,248 | ) | (6,445 | ) | (20,308 | ) | (7,115 | ) | (4,632 | ) | 393 |
| (1,012 | ) |
| Net increase (decrease) in net assets resulting from operations | 8,593 |
| 916 |
| (660 | ) | (13,306 | ) | 287 |
| 2,454 |
| 6,687 |
| 6,484 |
| 4,367 |
| 1,996 |
| 1,847 |
| 1,154 |
| (14,463 | ) | 139 |
| 4,832 |
| 725 |
| 8,593 |
| 916 |
| (660 | ) | (13,306 | ) | 287 |
| 2,454 |
| 6,687 |
| 6,484 |
|
| Net assets | 325,829 |
| 323,866 |
| 329,580 |
| 334,661 |
| 356,807 |
| 361,782 |
| 368,168 |
| 370,322 |
| 372,678 |
| 100,969 |
| 100,773 |
| 100,459 |
| 293,636 |
| 313,698 |
| 319,158 |
| 319,924 |
| 325,829 |
| 323,866 |
| 329,580 |
| 334,661 |
| 356,807 |
| 361,782 |
| 368,168 |
| 370,322 |
|
| Total investment income per common share | $ | 0.45 |
| $ | 0.45 |
| $ | 0.45 |
| $ | 0.47 |
| $ | 0.48 |
| $ | 0.48 |
| $ | 0.38 |
| $ | 0.40 |
| $ | 0.29 |
| $ | 0.46 |
| $ | 0.44 |
| $ | 0.25 |
| $ | 0.40 |
| $ | 0.41 |
| $ | 0.37 |
| $ | 0.39 |
| $ | 0.45 |
| $ | 0.45 |
| $ | 0.45 |
| $ | 0.47 |
| $ | 0.48 |
| $ | 0.48 |
| $ | 0.38 |
| $ | 0.40 |
|
| Net investment income per common share | 0.22 |
| 0.21 |
| 0.20 |
| 0.24 |
| 0.25 |
| 0.24 |
| 0.21 |
| 0.25 |
| 0.13 |
| 0.19 |
| 0.22 |
| 0.11 |
| 0.19 |
| 0.20 |
| 0.17 |
| 0.20 |
| 0.22 |
| 0.21 |
| 0.20 |
| 0.24 |
| 0.25 |
| 0.24 |
| 0.21 |
| 0.25 |
|
| Earnings (loss) per common share | 0.29 |
| 0.03 |
| (0.02 | ) | (0.45 | ) | 0.01 |
| 0.08 |
| 0.23 |
| 0.22 |
| 0.26 |
| 0.30 |
| 0.28 |
| 0.17 |
| (0.49 | ) | — |
| 0.16 |
| 0.02 |
| 0.29 |
| 0.03 |
| (0.02 | ) | (0.45 | ) | 0.01 |
| 0.08 |
| 0.23 |
| 0.22 |
|
| Net asset value per common share at period end | 11.06 |
| 10.99 |
| 11.18 |
| 11.36 |
| 12.11 |
| 12.28 |
| 12.49 |
| 12.57 |
| 12.65 |
| 15.15 |
| 15.12 |
| 15.07 |
| 9.97 |
| 10.65 |
| 10.83 |
| 10.86 |
| 11.06 |
| 10.99 |
| 11.18 |
| 11.36 |
| 12.11 |
| 12.28 |
| 12.49 |
| 12.57 |
|
During the three months ended September 30, 2015, the Company identified errors in the recognition of fee income from the commencement of operations through June 30, 2015. Refer to Note 2 for additional information regarding these errors.OAKTREE STRATEGIC INCOME CORPORATION
NOTES TO CONSOLIDATED FINANCIAL STATEMENTS
Note 16.15. Subsequent Events
The Company's management evaluatesevaluated subsequent events through the date of issuance of the Consolidated Financial Statements. There have been no subsequent events that occurred during such period that would require disclosure in, or would be required to be recognized in, the Consolidated Financial Statements as of and for the year ended September 30, 2016.2017, except as discussed below.
The Transaction and the New Investment Advisory Agreement with Oaktree
On July 13, 2017, Oaktree, entered into the Purchase Agreement, with FSM, and, for certain limited purposes, FSAM, the indirect, partial owner of FSM, and Fifth Street Holdings L.P. (“FSH”), the direct, partial owner of FSM.
In order to ensure that the Transaction complied with Section 15(f) of the 1940 Act, the Investment Adviser and FSM agreed to certain conditions. First, for a period of three years after the closing of the Transaction, at least 75% of the members of the Company’s Board of Directors must not be interested persons of Oaktree or FSM. Second, an “unfair burden” must not be imposed on the Company as a result of the closing of the Transaction or any express or implied terms, conditions or understandings applicable thereto during the two-year period after the closing of the Transaction. In addition, for the two-year period commencing on October 17, 2017, Oaktree will waive, to the extent necessary, any management or incentive fees payable under the New Investment Advisory Agreement that exceed what would have been paid to the Former Adviser in the aggregate under the Former Investment Advisory Agreement.
On September 7, 2017, the Company held a special meeting of stockholders (the "Special Meeting"). At the Special Meeting, stockholders of the Company approved the New Investment Advisory Agreement to take effect upon the closing of the Transaction. Stockholders of the Company also approved, contingent upon the closing of the Transaction, the election of John B. Frank, Marc H. Gamsin, Craig Jacobson, Richard G. Ruben and Bruce Zimmerman to serve on the Company’s Board of Directors, each of whom commenced serving on the Company’s Board of Directors on October 17, 2017. In addition, in connection with the Transaction, Edgar Lee became the Company’s Chief Executive Officer and Chief Investment Officer, Mathew Pendo became the Company’s Chief Operating Officer, Mel Carlisle became the Company’s Chief Financial Officer and Treasurer and Kimberly Larin became the Company’s Chief Compliance Officer.
Upon the closing of the Transaction on October 17, 2017, Oaktree became the investment adviser to each of OCSL and the Company, and Oaktree paid gross cash consideration of $320 million to FSM. The closing of the Transaction resulted in an assignment for purposes of the 1940 Act of the Former Investment Advisory Agreement and, as a result, its immediate termination. The material terms of the services to be provided under the New Investment Advisory Agreement, other than the fee structure, are substantially the same as the Former Investment Advisory Agreement, except that services are provided by Oaktree.
On October 17, 2017, each of Bernard D. Berman, James Castro-Blanco, Richard P. Dutkiewicz, Alexander C. Frank and Jeffrey R. Kay resigned as a member of the Company’s Board of Directors. In addition, on October 17, 2017, each of Mr. Berman, the Company’s former Chief Executive Officer, Mr. Steven Noreika, the Company’s former Chief Financial Officer, and Ms. Kerry Acocella, the Company’s former Secretary and Chief Compliance Officer, resigned from his or her role as an officer of the Company.
In connection with the Transaction, the Company and GF Equity Funding, in their respective capacities as members of FSFR Glick JV, consented to the assignment by FSC CT of the administrative and loan services agreement between FSFR Glick JV and FSC CT to Oaktree Administrator, effective as of October 17, 2017.
The following is a description of the New Investment Advisory Agreement, which has been in effect since October 17, 2017.
Management Services
Oaktree is registered as an investment adviser under the Advisers Act. Subject to the overall supervision of the Company’s Board of Directors since October 17, 2017, Oaktree has managed the day-to-day operations of the Company and provided the Company with investment advisory services. Under the New Investment Advisory Agreement, Oaktree:
determines the composition of the Company’s portfolio, the nature and timing of the changes to the Company’s portfolio and the manner of implementing such changes;
identifies, evaluates and negotiates the structure of the investments the Company makes;
executes, closes, monitors and services the investments the Company makes;
determines what securities and other assets the Company purchases, retains or sells; and
performs due diligence on prospective portfolio companies.
The New Investment Advisory Agreement provides that Oaktree’s services are not exclusive to the Company and Oaktree is generally free to furnish similar services to other entities so long as its services to us are not impaired.
OAKTREE STRATEGIC INCOME CORPORATION
NOTES TO CONSOLIDATED FINANCIAL STATEMENTS
Management Fee
Under the New Investment Advisory Agreement, the Company pays Oaktree a fee for its services under the New Investment Advisory Agreement consisting of two components - a base management fee and an incentive fee. The cost of both the base management fee payable to Oaktree and any incentive fees earned by Oaktree is ultimately borne by common stockholders of the Company.
Base Management Fee
Under the New Investment Advisory Agreement, the base management fee on total gross assets, including any investment made with borrowings, but excluding cash and cash equivalents, is 1.00%.
Incentive Fee
The incentive fee consists of two parts. Under the New Investment Advisory Agreement, the first part of the incentive fee (the “incentive fee on income”) is calculated and payable quarterly in arrears based upon the “pre-incentive fee net investment income” of the Company for the immediately preceding quarter. The payment of the incentive fee on income is subject to payment of a preferred return to investors each quarter (i.e., a “hurdle rate”), expressed as a rate of return on the value of the Company’s net assets at the end of the most recently completed quarter, of 1.50%, subject to a “catch up” feature.
For this purpose, “pre-incentive fee net investment income” means interest income, dividend income and any other income (including any other fees such as commitment, origination, structuring, diligence and consulting fees or other fees that the Company receives from portfolio companies, other than fees for providing managerial assistance) accrued during the fiscal quarter, minus the Company’s operating expenses for the quarter (including the base management fee, expenses payable under the New Administration Agreement and any interest expense and dividends paid on any issued and outstanding preferred stock, but excluding the incentive fee). Pre-incentive fee net investment income includes, in the case of investments with a deferred interest feature (such as original issue discount debt instruments with payment-in-kind interest and zero coupon securities), accrued income that the Company has not yet received in cash. Pre-incentive fee net investment income does not include any realized capital gains, realized capital losses or unrealized capital appreciation or depreciation.
Under the New Investment Advisory Agreement, the calculation of the incentive fee on income for each quarter is as follows:
No incentive fee is payable to Oaktree in any quarter in which the Company’s pre-incentive fee net investment income does not exceed the preferred return rate of 1.50% (the “preferred return”) on net assets.
100% of the Company’s pre-incentive fee net investment income, if any, that exceeds the preferred return but is less than or equal to 1.8182% in any fiscal quarter is payable to Oaktree. This portion of the incentive fee on income is referred to as the “catch-up” provision, and it is intended to provide Oaktree with an incentive fee of 17.5% on all of the Company’s pre-incentive fee net investment income when the Company’s pre-incentive fee net investment income exceeds 1.8182% on net assets in any fiscal quarter.
For any quarter in which the Company’s pre-incentive fee net investment income exceeds 1.8182% on net assets, the subordinated incentive fee on income is equal to 17.5% of the amount of the Company’s pre-incentive fee net investment income, as the preferred return and catch-up will have been achieved.
There is no accumulation of amounts on the hurdle rate from quarter to quarter and accordingly there is no clawback of amounts previously paid if subsequent quarters are below the quarterly hurdle.
Under the New Investment Advisory Agreement, the second part of the incentive fee will be determined and payable in arrears as of the end of each fiscal year (or upon termination of the New Investment Advisory Agreement, as of the termination date) commencing with the fiscal year ending September 30, 2019 and will equal 17.5% of the Company’s realized capital gains, if any, on a cumulative basis from the beginning of the fiscal year ending September 30, 2019 through the end of each fiscal year, computed net of all realized capital losses and unrealized capital depreciation on a cumulative basis, less the aggregate amount of any previously paid capital gain incentive fees under the New Investment Advisory Agreement. Any realized capital gains, realized capital losses, unrealized capital appreciation and unrealized capital depreciation with respect to the Company’s portfolio as of the end of the fiscal year ending September 30, 2018 will be excluded from the calculations of the second part of the incentive fee.
Collection and Disbursement of Fees Owed to Fifth Street Management
Under the Former Investment Advisory Agreement, both the base management fee and incentive fee on income were calculated and paid to FSM at the end of each quarter. In order to ensure that FSM receives any compensation earned during the quarter ending December 31, 2017, the initial payment of the base management fee and incentive fee on income under the New Investment Advisory Agreement will cover the entire quarter in which the New Investment Advisory Agreement became effective, and be calculated at a
OAKTREE STRATEGIC INCOME CORPORATION
NOTES TO CONSOLIDATED FINANCIAL STATEMENTS
blended rate that will reflect fee rates under the respective investment advisory agreements for the portion of the quarter in which FSM and Oaktree were serving as investment adviser. This structure will allow Oaktree to pay FSM in early 2018 the pro rata portion of the fees that were earned by, but not paid to, FSM for services rendered to the Company prior to the termination of the Former Investment Advisory Agreement with FSM.
Duration and Termination
Unless earlier terminated as described below, the New Investment Advisory Agreement will remain in effect until October 17, 2019 and thereafter from year-to-year if approved annually by the Company’s Board of Directors or by the affirmative vote of the holders of a majority of the outstanding voting securities of the Company, including, in either case, approval by a majority of the directors of the Company who are not interested persons. The New Investment Advisory Agreement will automatically terminate in the event of its assignment. The New Investment Advisory Agreement may be terminated by either party without penalty upon 60 days’ written notice to the other. The New Investment Advisory Agreement may also be terminated, without penalty, upon the vote of a majority of the outstanding voting securities of the Company.
Administrative Services
The Company entered into the New Administration Agreement with Oaktree Administrator on October 17, 2017. Pursuant to the New Administration Agreement, Oaktree Administrator provides administrative services to the Company necessary for the operations of the Company, which include providing office facilities, equipment, clerical, bookkeeping and record keeping services at such facilities and such other services as Oaktree Administrator, subject to review by the Company’s Board of Directors, shall from time to time deem to be necessary or useful to perform its obligations under the New Administration Agreement. Oaktree Administrator may, on behalf of the Company, conduct relations and negotiate agreements with custodians, trustees, depositories, attorneys, underwriters, brokers and dealers, corporate fiduciaries, insurers, banks and such other persons in any such other capacity deemed to be necessary or desirable. Oaktree Administrator will make reports to the Board of its performance of obligations under the New Administration Agreement and furnish advice and recommendations with respect to such other aspects of the business and affairs of the Company, in each case, as it shall determine to be desirable or as reasonably required by the Board; provided that the Oaktree Administrator shall not provide any investment advice or recommendation.
Oaktree Administrator will also provide portfolio collection functions for interest income, fees and warrants and is responsible for the financial and other records that the Company is required to maintain and prepares, prints and disseminates reports to the Company’s stockholders and all other materials filed with the SEC. In addition, Oaktree Administrator will assist the Company in determining and publishing the Company’s net asset value, overseeing the preparation and filing of the Company’s tax returns, and generally overseeing the payment of the Company’s expenses and the performance of administrative and professional services rendered to the Company by others. For providing these services, facilities and personnel, the Company will reimburse Oaktree Administrator the allocable portion of overhead and other expenses incurred by Oaktree Administrator in performing its obligations under the New Administration Agreement, including the Company’s allocable portion of the rent of the Company’s principal executive offices at market rates and the Company’s allocable portion of the costs of compensation and related expenses of its Chief Financial Officer, Chief Compliance Officer, their staffs and other non-investment professionals at Oaktree that perform duties for the Company. Such reimbursement is at cost, with no profit to, or markup by, Oaktree Administrator. Oaktree Administrator may also offer to provide, on the Company’s behalf, managerial assistance to the Company’s portfolio companies. The New Administration Agreement provides that, absent willful misfeasance, bad faith or gross negligence in the performance of their respective duties or by reason of the reckless disregard of their respective duties and obligations, Oaktree Administrator and its officers, managers, partners, agents, employees, controlling persons, members (or their owners) and any other person or entity affiliated with it, are entitled to indemnification from the Company for any damages, liabilities, costs and expenses (including reasonable attorneys’ fees and amounts reasonably paid in settlement) arising from the rendering of Oaktree Administrator’s services under the New Administration Agreement or otherwise as the Company’s administrator. Unless earlier terminated as described below, the New Administration Agreement will remain in effect until October 17, 2019 and thereafter from year-to-year if approved annually by the Company’s Board of Directors or by the affirmative vote of the holders of a majority of the Company’s outstanding voting securities, including, in either case, approval by a majority of the Company’s directors who are not interested persons. The New Administration Agreement may be terminated by either party without penalty upon 60 days’ written notice to the other. The New Administration Agreement may also be terminated, without penalty, upon the vote of a majority of the Company’s outstanding voting securities.
Pledge Agreement
On October 17, 2017, in connection with the Purchase Agreement, the Company entered into a pledge agreement (the “Pledge Agreement”) with FSH with respect to 1,131,991 shares of the Company’s common stock owned by FSH, pursuant to which FSH pledged such shares to the Company to secure indemnification obligations of FSM and FSH under the Purchase Agreement relating to certain SEC investigation-related legal costs and expenses, if any, and certain fees, fines, monetary penalties, deductibles and
OAKTREE STRATEGIC INCOME CORPORATION
NOTES TO CONSOLIDATED FINANCIAL STATEMENTS
disgorgements, if any, that may be ordered by the SEC to be paid by the Company, net of any disgorgements paid by FSM to the Company and any insurance recoveries received by the Company.
Change in Investment Policy
On November 17, 2017, the Company mailed notices to its stockholders that the Board of Directors of the Company approved a change to the Company’s investment policies and, effective January 19, 2018, the Company will no longer be subject to its current policy to invest, under normal market conditions, at least 80% of the value of its net assets (plus borrowings for investment purposes) in floating rate senior loans.
Citibank Facility Amendment
On December 6, 2017, the Company entered into an amendment to the documents governing the Citibank facility to remove Citibank, N.A.’s approval rights regarding the Company’s ability to purchase assets using proceeds from the Citibank facility, subject to a mark-to-market valuation protocol for broadly syndicated loans and a revised valuation dispute mechanism. The other material terms of the Citibank facility did not change as a result of this amendment.
Schedule 12-14
Fifth Street Senior Floating Rate Corp.Oaktree Strategic Income Corporation
Schedule of Investments in and Advances to Affiliates
Year ended September 30, 20162017
| | | Portfolio Company/Type of Investment (1) | | Amount of
Interest,
Fees or
Dividends
Credited in
Income (2) | | Fair Value
at October 1, 2015 | | Gross
Additions (3) | | Gross
Reductions (4) | | Fair Value at September 30, 2016 | | Cash Interest Rate | | Industry | | Principal | | Net Realized Gain (Loss) | | Net Unrealized Appreciation (Depreciation) | | Amount of
Interest,
Fees or
Dividends
Credited in
Income (2) | | Fair Value
at October 1, 2016 | | Gross
Additions (3) | | Gross
Reductions (4) | | Fair Value at September 30, 2017 | | % of Total Net Assets |
| Control Investments | | | | | | | | | | | | | | | | | | | | | | | | | | | | | | |
| FSFR Glick JV LLC | | | | | | | | | | | | Multi-sector holdings | | | | | | | | | | | | | | | | | |
| Subordinated Note, LIBOR+8% cash due 10/20/2021 | | $ | 5,065,350 |
| | $ | 52,603,346 |
| | $ | 10,910,158 |
| | $ | (6,627,858 | ) | | $ | 56,885,646 |
| | 9.23% | | $ | 64,228,881 |
| | $ | — |
| | $ | 497,902 |
| | $ | 5,764,424 |
| | $ | 56,885,646 |
| | $ | 5,186,507 |
| | $ | (4,465,479 | ) | | $ | 57,606,674 |
| | 19.6% |
| 87.5% LLC equity interest (5) | | 2,712,500 |
| | 4,553,575 |
| | 4,902,020 |
| | (3,024,574 | ) | | 6,431,021 |
| | | | — |
| | (6,431,021 | ) | | (576,044 | ) | | 6,431,021 |
| | — |
| | (6,431,021 | ) | | — |
| | —% |
| Total Control Investments | | $ | 7,777,850 |
| | $ | 57,156,921 |
| | $ | 15,812,178 |
| | $ | (9,652,432 | ) | | $ | 63,316,667 |
| | $ | 64,228,881 |
| | $ | — |
| | $ | (5,933,119 | ) | | $ | 5,188,380 |
| | $ | 63,316,667 |
| | $ | 5,186,507 |
| | $ | (10,896,500 | ) | | $ | 57,606,674 |
| | 19.6% |
| | | | | | | | | | | | | | | | | | | | | | | | | | | | |
| Affiliate Investments | | | | | | | | | | | | | | | | | | | | | | | | | | | |
Ameritox Ltd. | | | | | | | | | | | | Healthcare services | | | | | | | | | | | | | | | | | |
| First Lien Term Loan, LIBOR+5% (1% floor) cash 3% PIK due 4/11/2021 | | $ | 279,587 |
| | $ | — |
| | $ | 6,402,868 |
| | $ | (60,582 | ) | | $ | 6,342,286 |
| | 6.33% | | $ | 8,071,313 |
| | $ | — |
| | $ | (6,931,628 | ) | | $ | 505,782 |
| | $ | 6,342,286 |
| | $ | 2,118,166 |
| | $ | (7,524,539 | ) | | $ | 935,913 |
| | 0.3% |
| 3,309,873.6 Class A Preferred Units | | — |
| | — |
| | 3,626,150 |
| | — |
| | 3,626,150 |
| | | | — |
| | (3,626,150 | ) | | — |
| | 3,626,150 |
| | 169,172 |
| | (3,795,322 | ) | | — |
| | —% |
| 327,393.6 Class B Preferred Units | | — |
| | — |
| | 358,679 |
| | — |
| | 358,679 |
| | | | — |
| | (358,679 | ) | | — |
| | 358,679 |
| | 198,597 |
| | (557,276 | ) | | — |
| | —% |
| 1,007.36 Class A Units | | — |
| | — |
| | 5,935,698 |
| | (3,256,355 | ) | | 2,679,343 |
| | | | — |
| | (2,679,343 | ) | | — |
| | 2,679,343 |
| | — |
| | (2,679,343 | ) | | — |
| | —% |
| Total Affiliate Investments | | $ | 279,587 |
| | $ | — |
| | $ | 16,323,395 |
| | $ | (3,316,937 | ) | | $ | 13,006,458 |
| | $ | 8,071,313 |
| | $ | — |
| | $ | (13,595,800 | ) | | $ | 505,782 |
| | $ | 13,006,458 |
| | $ | 2,485,935 |
| | $ | (14,556,480 | ) | | $ | 935,913 |
| | 0.3% |
| | | | | | | | | | | | |
| Total Control & Affiliate Investments | | $ | 8,057,437 |
| | $ | 57,156,921 |
| | $ | 32,135,573 |
| | $ | (12,969,369 | ) | | $ | 76,323,125 |
| | $ | 72,300,194 |
| | $ | — |
| | $ | (19,528,919 | ) | | $ | 5,694,162 |
| | $ | 76,323,125 |
| | $ | 7,672,442 |
| | $ | (25,452,980 | ) | | $ | 58,542,587 |
| | 19.9% |
This schedule should be read in connection with the Company's Consolidated Financial Statements, including the Consolidated Schedules of Investments and Notes to the Consolidated Financial Statements.
______________________
| |
| (1) | The principal amount and ownership detail asare shown in the Company's Consolidated Schedules of Investments. |
| |
| (2) | Represents the total amount of interest, fees and dividends credited to income for the portion of the year an investment was included in the Control or Affiliate categories. |
| |
| (3) | Gross additions include increases in the cost basis of investments resulting from new portfolio investments, follow-on investments and accrued PIK interest (net of non-accrual amounts), and the exchange of one or more existing securities for one or more new securities. Gross additions also include net increases in unrealized appreciation or net decreases in unrealized depreciation as well as the movement of an existing portfolio company into this category or out of a different category. |
| |
| (4) | Gross reductions include decreases in the cost basis of investment resulting from principal payments or sales and exchanges of one or more existing securities for one or more new securities. Gross reductions also include net increases in unrealized depreciation or net decreases in unrealized appreciation as well as the movement of an existing portfolio company out of this category and into a different category. |
| |
| (5) | Together with GF Equity Funding, the Company co-invests through FSFR Glick JV. FSFR Glick JV is capitalized as transactions are completed and all portfolio and investment decisions in respect to FSFR Glick JV must be approved by the FSFR Glick JV investment committee consisting of representatives of the Company and GF Equity Funding (with approval from a representative of each required). |
| |
| (6) | This investment was on cash non-accrual status as of September 30, 2017. |
Schedule 12-14
Oaktree Strategic Income Corporation
Schedule of Investments in and Advances to Affiliates
Year ended September 30, 2016
|
| | | | | | | | | | | | | | | | | | | | | | | | | | | | | | | | | | | | | | |
| Portfolio Company/Type of Investment (1) | | Cash Interest Rate | | Industry | | Principal | | Net Realized Gain (Loss) | | Net Unrealized Appreciation (Depreciation) | | Amount of
Interest,
Fees or
Dividends
Credited in
Income (2) | | Fair Value
at October 1, 2015 | | Gross
Additions (3) | | Gross
Reductions (4) | | Fair Value at September 30, 2016 | | % of Total Net Assets |
| Control Investments | | | | | | | | | | | | | | | | | | | | | | |
| FSFR Glick JV LLC | | | | Multi-sector holdings | | | | | | | | | | | | | | | | | | |
| Subordinated Note, LIBOR+8% cash due 10/20/2021 | | 8.47% | | | | $ | 64,005,755 |
| | $ | — |
| | $ | (6,627,858 | ) | | $ | 5,065,350 |
| | $ | 52,603,346 |
| | $ | 10,910,158 |
| | $ | (6,627,858 | ) | | $ | 56,885,646 |
| | 17.5% |
| 87.5% LLC equity interest (5) | | | | | | | | — |
| | 648,071 |
| | 2,712,500 |
| | 4,553,575 |
| | 4,902,020 |
| | (3,024,574 | ) | | 6,431,021 |
| | 2.0% |
| Total Control Investments | | | | | | $ | 64,005,755 |
| | $ | — |
| | $ | (5,979,787 | ) | | $ | 7,777,850 |
| | $ | 57,156,921 |
| | $ | 15,812,178 |
| | $ | (9,652,432 | ) | | $ | 63,316,667 |
| | 19.4% |
| | | | | | | | | | | | | | | | | | | | | | | |
| Affiliate Investments | | | | | | | | | | | | | | | | | | | | | | |
| Ameritox Ltd. | | | | Healthcare services | | | | | | | | | | | | | | | | | | |
| First Lien Term Loan, LIBOR+5% (1% floor) cash 3% PIK due 4/11/2021 | | 6.00% | | | | $ | 6,387,128 |
| | $ | — |
| | $ | (38,546 | ) | | $ | 279,587 |
| | $ | — |
| | $ | 6,402,868 |
| | $ | (60,582 | ) | | $ | 6,342,286 |
| | 1.9% |
| 3,309,873.6 Class A Preferred Units | | | | | | | | — |
| | 316,276 |
| | — |
| | — |
| | 3,626,150 |
| | — |
| | 3,626,150 |
| | 1.1% |
| 327,393.6 Class B Preferred Units | | | | | | | | — |
| | 31,285 |
| | — |
| | — |
| | 358,679 |
| | — |
| | 358,679 |
| | 0.1% |
| 1,007.36 Class A Units | | | | | | | | — |
| | (3,256,355 | ) | | — |
| | — |
| | 5,935,698 |
| | (3,256,355 | ) | | 2,679,343 |
| | 0.8% |
| Total Affiliate Investments | | | | | | $ | 6,387,128 |
| | $ | — |
| | $ | (2,947,340 | ) | | $ | 279,587 |
| | $ | — |
| | $ | 16,323,395 |
| | $ | (3,316,937 | ) | | $ | 13,006,458 |
| | 4.0% |
| Total Control & Affiliate Investments | | | | | | $ | 70,392,883 |
| | $ | — |
| | $ | (8,927,127 | ) | | $ | 8,057,437 |
| | $ | 57,156,921 |
| | $ | 32,135,573 |
| | $ | (12,969,369 | ) | | $ | 76,323,125 |
| | 23.4% |
This schedule should be read in connection with the Company's Consolidated Financial Statements, including the Consolidated Schedules of Investments and Notes to the Consolidated Financial Statements.
______________________
| |
| (1) | The principal amount and ownership detail are shown in the Company's Consolidated Schedules of Investments. |
| |
| (2) | Represents the total amount of interest, fees and dividends credited to income for the portion of the year an investment was included in the Control or Affiliate categories. |
| |
| (3) | Gross additions include increases in the cost basis of investments resulting from new portfolio investments, follow-on investments and accrued PIK interest (net of non-accrual amounts), and the exchange of one or more existing securities for one or more new securities. Gross additions also include net increases in unrealized appreciation or net decreases in unrealized depreciation as well as the movement of an existing portfolio company into this category or out of a different category. |
| |
| (4) | Gross reductions include decreases in the cost basis of investment resulting from principal payments or sales and exchanges of one or more existing securities for one or more new securities. Gross reductions also include net increases in unrealized depreciation or net decreases in unrealized appreciation as well as the movement of an existing portfolio company out of this category and into a different category. |
| |
| (5) | Together with GF Equity Funding, the Company co-invests through FSFR Glick JV. FSFR Glick JV is capitalized as transactions are completed and all portfolio and investment decisions in respect to FSFR Glick JV must be approved by the FSFR Glick JV investment committee consisting of representatives of the Company and GF Equity Funding (with approval from a representative of each required). |
Schedule of Investments in and Advances to Affiliates
Year ended September 30, 2015
|
| | | | | | | | | | | | | | | | | | | | |
| Portfolio Company/Type of Investment (1) | | Amount of
Interest,
Fees or
Dividends
Credited in
Income (2) | | Fair Value
at October 1,
2014 | | Gross
Additions (3) | | Gross
Reductions (4) | | Fair Value at September 30, 2015 |
| Control Investments | | | | | | | | | | |
| FSFR Glick JV LLC | | | | | | | | | | |
| Subordinated Note, LIBOR+8% cash due 10/20/2021 | | $ | 1,770,130 |
| | $ | — |
| | $ | 53,095,597 |
| | $ | (492,251 | ) | | $ | 52,603,346 |
|
| 87.5% equity interest (5) | | 730,625 |
| | — |
| | 5,882,376 |
| | (1,328,801 | ) | | 4,553,575 |
|
| Total Control Investments | | $ | 2,500,755 |
| | $ | — |
| | $ | 58,977,973 |
| | $ | (1,821,052 | ) | | $ | 57,156,921 |
|
This schedule should be read in connection with the Company's Consolidated Financial Statements, including the Consolidated Schedules of Investments and Notes to the Consolidated Financial Statements.
______________________
| |
(1) | The principal amount and ownership detail as shown in the Company's Consolidated Schedules of Investments. |
| |
(2) | Represents the total amount of interest, fees and dividends credited to income for the portion of the year an investment was included in the Control or Affiliate categories. |
| |
(3) | Gross additions include increases in the cost basis of investments resulting from new portfolio investments, follow-on investments and accrued interest, and the exchange of one or more existing securities for one or more new securities. Gross additions also include net increases in unrealized appreciation or net decreases in unrealized depreciation as well as the movement of an existing portfolio company into this category or out of a different category. |
| |
(4) | Gross reductions include decreases in the cost basis of investment resulting from principal payments or sales and exchanges of one or more existing securities for one or more new securities. Gross reductions also include net increases in unrealized depreciation or net decreases in unrealized appreciation as well as the movement of an existing portfolio company out of this category and into a different category. |
| |
(5) | Together with GF Equity Funding, the Company co-invests through FSFR Glick JV. FSFR Glick JV is capitalized as transactions are completed and all portfolio and investment decisions in respect to FSFR Glick JV must be approved by the FSFR Glick JV investment committee consisting of representatives of the Company and GF Equity Funding (with approval from a representative of each required). |
Item 9. Changes in and Disagreements with Accountants on Accounting and Financial Disclosure
Not applicable.
Item 9A. Controls and Procedures
(a) Evaluation of Disclosure Controls and Procedures
Management, with the participation of the Company’s Chief Executive Officer and Chief Financial Officer, evaluated the effectiveness of our disclosure controls and procedures as of September 30, 2016.2017. The term “disclosure controls and procedures,” as defined in Rules 13a-15(e) and 15d-15(e) under the Securities Exchange Act of 1934, as amended (the "Exchange Act"“Exchange Act”), means controls and other procedures of a company that are designed to ensure that information required to be disclosed by a company in the reports that it files or submits under the Exchange Act is recorded, processed, summarized and reported, within the time periods specified in the SEC’s rules and forms. Disclosure controls and procedures include, without limitation, controls and procedures designed to ensure that information required to be disclosed by a company in the reports that it files or submits under the Exchange Act is accumulated and communicated to the company’s management, including its chief executive officer and chief financial officer, as appropriate to allow timely decisions regarding required disclosure. Management recognizes that any controls and procedures, no matter how well designed and operated, can provide only reasonable assurance of achieving their objectives. Based on the evaluation of our disclosure controls and procedures as of September 30, 2016,2017, our Chief Executive Officer and Chief Financial Officer concluded that, as a result of the material weakness in internal control over financial reporting that is described below, in Management's Report on Internal Control Over Financial Reporting, our disclosure controls and procedures were not effective.
(b) Management's Report on Internal Control Over Financial Reporting
Management is responsible for establishing and maintaining adequate internal control over financial reporting, as such term is defined in Exchange Act Rules 13a-15(f) and 15d-15(f). A company’s internal control over financial reporting is a process designed by, or under the supervision of, its chief executive officer and chief financial officer, and effected by such company's board of directors, management and other personnel to provide reasonable assurance regarding the reliability of financial reporting and the preparation of financial statements for external purposes in accordance with GAAP and includes those policies and procedures that:
(i)pertain to the maintenance of records that, in reasonable detail, accurately and fairly reflect the transactions and dispositions of the assets of the company;
(ii)provide reasonable assurance that transactions are recorded as necessary to permit preparation of financial statements in accordance with generally accepted accounting principles, and that receipts and expenditures of the company are being made only in accordance with authorizations of management and directors of the company; and
(iii)provide reasonable assurance regarding prevention or timely detection of unauthorized acquisition, use, or disposition of the company’s assets that could have a material effect on the financial statements.
Because of its inherent limitations, internal control over financial reporting may not prevent or detect misstatements. Also, projections of any evaluation of effectiveness to future periods are subject to the risk that controls may become inadequate because of changes in conditions, or that the degree of compliance with the policies or procedures may deteriorate.
Management, with the participation of our Chief Executive Officer and Chief Financial Officer, has conducted an evaluation of the effectiveness of our internal control over financial reporting as of September 30, 2016,2017, based on the framework set forth in Internal Control-Integrated Framework (2013) issued by the Committee of Sponsoring Organizations of the Treadway Commission (COSO). A material weakness is a deficiency, or a combination of deficiencies, in internal control over financial reporting, such that there is a reasonable possibility that a material misstatement of a company's annual or interim financial statements will not be prevented or detected on a timely basis.
Management
As of September 30, 2017, management has determined that the Company had a material weakness because it did not design or maintain effective controls to internally communicate current accounting policies and procedures including the nature of supporting documentation required to validate certain portfolio company data.
These control deficiencies, in the aggregate, could result in misstatements of accounts or disclosures that would each result in a material misstatement of the annual or interim consolidated financial statements that would not be prevented or detected and, therefore, management has determined that these control deficiencies constitute a material weakness. This
material weakness did not result in a material misstatement of the consolidated annual or interim financial statements in the year ended September 30, 2016.2017. Because of this material weakness, management concluded that the Company did not maintain effective internal control over financial reporting as of September 30, 2016.2017.
(c) Remediation of Material Weaknesses in Internal Control Over Financial Reporting
We have taken andDuring the fiscal year ending September 30, 2018, we will take a number of actionssteps to remediate this material weakness, including but not limited to, formalizingthe formalization of policies and procedures in all significant areas and communicating them throughout the organization, adding senior experienced accounting and financial reporting personnel, outsourcing certain accounting and operation activities and reallocating existing internal resources as necessary.implementation of controls over the validation of portfolio company data. Management is committed to improving our internal control processes and believes that the measures described above should be sufficient to remediate the identified material weakness and strengthen our internal control over financial reporting. Based on the steps we have taken to date and the anticipated timing of additional remediation measures and appropriate test work, we expect that the remediation of this material weakness will be completed prior to the end of calendar year 2017. We cannot assure you, however, that the steps taken will remediate such weakness, nor can we be certain of whether additional actions will be required or the costs of any such actions.
(d) Changes in Internal Control overControls Over Financial Reporting
Other than the remediation efforts described above, thereThere were no changes in our internal control over financial reporting that occurred during the fourth fiscal quarter of 20162017 that have materially affected, or are reasonably likely to materially affect, our internal control over financial reporting.
Item 9B. Other Information
None.
PART III
We will file a definitive Proxy Statement for our 20172018 Annual Meeting of Stockholders with the Securities and Exchange Commission, pursuant to Regulation 14A, not later than 120 days after the end of our fiscal year. Accordingly, certain information required by Part III has been omitted under General Instruction G (3) to Form 10-K. Only those sections of our definitive Proxy Statement that specifically address the items set forth herein are incorporated by reference.
Item 10. Directors, Executive Officers and Corporate Governance
The information required by Item 10 is hereby incorporated by reference from our definitive Proxy Statement relating to our 20172018 Annual Meeting of Stockholders, to be filed with the Securities and Exchange Commission within 120 days following the end of our fiscal year.
Item 11. Executive Compensation
The information required by Item 11 is hereby incorporated by reference from our definitive Proxy Statement relating to our 20172018 Annual Meeting of Stockholders, to be filed with the Securities and Exchange Commission within 120 days following the end of our fiscal year.
Item 12. Security Ownership of Certain Beneficial Owners and Management and Related Stockholder Matters
The information required by Item 12 is hereby incorporated by reference from our definitive Proxy Statement relating to our 20172018 Annual Meeting of Stockholders, to be filed with the Securities and Exchange Commission within 120 days following the end of our fiscal year.
Item 13. Certain Relationships and Related Transactions, and Director Independence
The information required by Item 13 is hereby incorporated by reference from our definitive Proxy Statement relating to our 20172018 Annual Meeting of Stockholders, to be filed with the Securities and Exchange Commission within 120 days following the end of our fiscal year.
Item 14. Principal Accountant Fees and Services
The information required by Item 14 is hereby incorporated by reference from our definitive Proxy Statement relating to our 20172018 Annual Meeting of Stockholders, to be filed with the Securities and Exchange Commission within 120 days following the end of our fiscal year.
PART IV
Item 15. Exhibits and Financial Statement Schedules
The following documents are filed or incorporated by reference as part of this Annual Report:
1. Consolidated Financial Statements
|
| |
| Page |
| Report of Independent Registered Public Accounting Firm | |
Consolidated Statements of Assets and Liabilities as of September 30, 20162017 and September 30, 20152016 | |
Consolidated Statements of Operations for the years endedYears Ended September 30, 2017, 2016 2015 and 20142015 | |
Consolidated Statements of Changes in Net Assets for the years endedYears Ended September 30, 2017, 2016 2015 and 20142015 | |
Consolidated Statements of Cash Flows for the years endedYears Ended September 30, 2017, 2016 2015 and 20142015 | |
| Consolidated Schedule of Investments as of September 30, 2017 | |
| Consolidated Schedule of Investments as of September 30, 2016 | |
Consolidated Schedule of Investments as of September 30, 2015 | |
| Notes to Consolidated Financial Statements | |
2. Financial Statement Schedule
The following financial statement schedule is filed herewith:
|
| |
| |
| Schedule 12-14 — Investments in and advances to affiliates | |
3. Exhibits required to be filed by Item 601 of Regulation S-K
The following exhibits are filed as part of this report or hereby incorporated by reference to exhibits previously filed with the SEC:
|
| | |
| | Amended and Restated Certificate of Incorporation of the Registrant (Incorporated by reference to Exhibit a filed with the Registrant’s Registration Statement on Form N-2 (File No. 333-188904) filed on July 8, 2013). |
| | Certificate of Amendment to the Amended and Restated Certificate of Incorporation of the Company, dated as of October 17, 2017 (Incorporated by reference to Exhibit 3.1 filed with the Registrant’s Current Report on Form 8-K (File No. 814-01013) filed on October 17, 2017). |
| | Bylaws of the Registrant (Incorporated by reference to Exhibit 3.1 filed with the Registrant’s Current Report on Form 8-K (File No. 814-01013) filed on September 9, 2016). |
| | Form of Common Stock Certificate (Incorporated by reference to Exhibit d filed with the Registrant’s Registration Statement on Form N-2 (File No. 333-188904) filed on July 8, 2013). |
| | Indenture among FS Senior Funding Ltd., as issuer, FS Senior Funding CLO LLC, as co-issuer, and Wells Fargo Bank, National Association, as trustee, dated as of May 28, 2015 (Incorporated by reference to Exhibit 4.1 filed with the Registrant’s Current Report on Form 8-K (File No. 814-01013) filed on June 3, 2015). |
| | Dividend Reinvestment Plan (Incorporated by reference to Exhibit e filed with the Registrant’s Registration Statement on Form N-2 (File No. 333-188904) filed on July 8, 2013). |
| | Investment Advisory Agreement, by anddated as of October 17, 2017, between the Registrant and Fifth StreetOaktree Capital Management, LLCL.P. (Incorporated by reference to Exhibit g10.1 filed with the Registrant’s Registration StatementCurrent Report on Form N-28-K (File No. 333-188904)814-01013) filed on July 8, 2013)October 17, 2017). |
| | Form of Custody Agreement (Incorporated by reference to Exhibit j filed with the Registrant’s Registration Statement on Form N-2 (File No. 333-188904) filed on July 8, 2013). |
| | Administration Agreement, by anddated as of October 17, 2017, between the Registrant and FSC, Inc. (Incorporated by reference to Exhibit k.1 filed with the Registrant’s Registration Statement on Form N-2 (File No. 333-188904) filed on July 8, 2013). |
10.5 | | License Agreement by and between Registrant and Fifth Street CapitalOaktree Fund Administration, LLC (Incorporated by reference to Exhibit k.210.2 filed with the Registrant’s Registration StatementCurrent Report on Form N-28-K (File No. 333-188904)814-01013) filed on July 8, 2013)October 17, 2017). |
| | Amended and Restated Credit Agreement by and among the lenders referred to therein, FS Senior Funding LLC, Natixis, New York Branch, and U.S. Bank National Association, dated as of October 16, 2014 (Incorporated by reference to Exhibit 10.1 filed with the Registrants Current Report on Form 8-k (File No. 814-01013) filed October 21, 2014). |
|
| | |
| | Amended and Restated Loan Sale and Contribution Agreement by and between Registrant and FS Senior Funding LLC, dated as of October 16, 2014 (Incorporated by reference to Exhibit 10.2 filed with the Registrants Current Report on Form 8-k (File No. 814-01013) filed October 21, 2014). |
| | Collateral Management Agreement by and between FS Senior Funding LLC and Registrant, dated as of November 1, 2013 (Incorporated by reference to Exhibit 10.3 filed with the Registrant’s Current Report on Form 8-K (File No. 814-01013) filed on November 7, 2013). |
| | Amended and Restated Credit Agreement by and among the lenders referred to therein, FS Senior Funding LLC, Natixis, New York Branch, and U.S. Bank National Association, dated as of October 16, 2014 (Incorporated by reference to Exhibit 10.1 filed with the Registrant’s Current Report on Form 8-K (File No. 814-01013) filed on October 21, 2014). |
| | Amended and Restated Loan Sale and Contribution Agreement by and between Registrant and FS Senior Funding LLC, dated as of October 16, 2014 (Incorporated by reference to Exhibit 10.2 filed with the Registrant’s Current Report on Form 8-K (File No. 814-01013) filed on October 21, 2014). |
| | Loan and Security Agreement by and among Registrant, FS Senior Funding II LLC, the lenders referred to therein, Citibank, N.A., and Wells Fargo Bank, National Association, dated as of January 15, 2015 (Incorporated by reference to Exhibit 10.1 filed with the Registrant’s Current Report on Form 8-K (File No. 814-01013) filed on January 21, 2015). |
| | Loan Sale Agreement by and between Registrant and FS Senior Funding II LLC, dated as of January 15, 2015 (Incorporated by reference to Exhibit 10.2 filed with the Registrant’s Current Report on Form 8-K (File No. 814-01013) filed on January 21, 2015). |
| | Administration Agreement by and between Registrant and FSC CT LLC dated as of January 1, 2014 (Incorporated by reference to Exhibit 10.1 filed with the Registrant’s Quarterly Report on Form 10-Q (File No. 814-010103) filed on February 9, 2015). |
| | Amendment No. 3 to the Amended and Restated Credit Agreement by and among the lenders referred to therein, FS Senior Funding LLC, Natixis, New York Branch, and U.S. Bank National Association, dated as of May 4, 2015 (Incorporated by reference to Exhibit 10.1 filed with the Registrant’s Quarterly Report on Form 10-Q (File No. 814-010103) filed on May 11, 2015). |
| | Class A-R Note Purchase Agreement, by and among FS Senior Funding Ltd., as issuer, FS Senior Funding CLO LLC, as co-issuer, Natixis, New York Branch, as Class A-R Note Agent, and each of the Class A-R Noteholders parties thereto, dated as of May 28, 2015 (Incorporated by reference to Exhibit 10.1 filed with the Registrant’s Quarterly Report on Form 10-Q (File No. 814-010103) filed on August 10, 2015).
|
| | Master Transfer Agreement by and between Registrant, as the seller, and FS Senior Funding Ltd., as the buyer, dated as of May 28, 2015 (Incorporated by reference to Exhibit 10.2 filed with the Registrant’s Quarterly Report on Form 10-Q (File No. 814-010103) filed on August 10, 2015). |
| | Collateral Management Agreement by and between FS Senior Funding Ltd., as issuer, and Registrant, as collateral manager, dated as of May 28, 2015 (Incorporated by reference to Exhibit 10.3 filed with the Registrant’s Quarterly Report on Form 10-Q (File No. 814-010103) filed on August 10, 2015). |
| | Sub-Advisory Agreement between Registrant, as collateral manager, and Fifth Street Management LLC, as sub-advisor, dated as of May 28, 2015 (Incorporated by reference to Exhibit 10.4 filed with the Registrant’s Quarterly Report on Form 10-Q (File No. 814-010103) filed on August 10, 2015). |
| | Loan and Security Agreement between East West Bank and Registrant, dated as of January 6, 2016 (Incorporated by reference to Exhibit 10.1 filed with Registrant’s Current Report on Form 8-K (File No. 814-01013) filed on January 12, 2016).
|
| | Fifth Amendment to Loan and Security Agreement and Waiver, dated as of July 13, 2017, by and among Fifth Street Senior Floating Rate Corp., FS Senior Funding II LLC and Citibank, N.A. (Incorporated by reference to Exhibit 10.1 filed with Registrant’s Current Report on Form 8-K (File No. 001-35999) filed on July 17, 2017). |
| | Pledge Agreement, dated as of October 17, 2017, between the Company and FSH (Incorporated by reference to Exhibit 10.3 filed with the Registrant’s Current Report on Form 8-K (File No. 814-01013) filed on October 17, 2017). |
| | Sixth Amendment to Loan and Security Agreement, dated as of October 25, 2017, by and among Registrant, FS Senior Funding II LLC and Citibank, N.A. |
| | Seventh Amendment to Loan and Security Agreement, dated as of December 6, 2017, by and among Registrant, FS Senior Funding II LLC and Citibank, N.A.
|
| | Computation of Per Share Earnings (included in the Notes to the Financial Statements contained in this report). |
14.1 | | Joint Code of Ethics of the Registrant and Fifth Street Finance Corp. (Incorporated by reference to Exhibit(r)(1) filed with Fifth Street Finance Corp.'s Registration Statement on Form N-2 (File No. 333-186101) filed on September 26, 2013).Oaktree Specialty Lending Corporation. |
14.2 | | Code of Ethics of Fifth StreetOaktree Capital Management, L.P. |
|
| | |
| 21 | | Subsidiaries of Registrant and jurisdiction of incorporation/organizations: FS Senior Funding CLO LLC and Fifth Street CLO Management- Delaware FS Senior Funding II LLC (Incorporated by reference to Exhibit (r)(2) filed with Fifth Street Finance Corp.'s Registration Statement- Delaware FS Senior Funding Ltd. - Delaware
|
| | Power of Attorney (included on Form N-2 (File No. 333-214129) filed on October 17, 2016)the signature page hereto). |
| | Certification of Chief Executive Officer Pursuant to Rule 13a-14(a) under the Securities Exchange Act of 1934. |
| | Certification of Chief Financial Officer Pursuant to Rule 13a-14(a) under the Securities Exchange Act of 1934. |
| | Certification of Chief Executive Officer Pursuant to Section 906 of the Sarbanes-Oxley Act of 2002 (18 U.S.C. 1350). |
| | Certification of Chief Financial Officer Pursuant to Section 906 of the Sarbanes-Oxley Act of 2002 (18 U.S.C. 1350). |
SIGNATURES
Pursuant to the requirements of Section 13 or 15(d) of the Securities Exchange Act of 1934, the registrant has duly caused this report to be signed on its behalf by the undersigned, thereunto duly authorized.
|
| | |
| | | |
FIFTH STREET SENIOR FLOATING RATE CORP.OAKTREE STRATEGIC INCOME CORPORATION |
| | |
| By: | | /s/ Ivelin M. DimitrovEdgar Lee |
| | | Ivelin M. DimitrovEdgar Lee
|
| | | Chief Executive Officer |
| | |
| By: | | /s/ Steven M. NoreikaMel Carlisle |
| | | Steven M. NoreikaMel Carlisle
|
| | | Chief Financial Officer and Treasurer |
Date: December 13, 20168, 2017
POWER OF ATTORNEY
KNOW ALL MEN BY THESE PRESENTS, that each person whose signature appears below hereby constitutes and appoints Edgar Lee, Mel Carlisle and Mathew Pendo, and each of them (with full power to each of them to act alone), his true and lawful attorneys-in-fact and agents, with full power of substitution and re-substitution, for him and on his behalf and in his name, place and stead, in any and all capacities, to sign, execute and file this Annual Report on Form 10-K for the fiscal year ended September 30, 2017, and any or all amendments to this Report, with all exhibits and any and all documents required to be filed with respect thereto, with the Securities and Exchange Commission or any other regulatory authority, granting unto such attorneys-in-fact and agents, and each of them, full power and authority to do and perform each and every act and thing appropriate or necessary to be done in order to effectuate the same, as fully to all intents and purposes as he himself might or could do in person, hereby ratifying and confirming all that such attorneys-in-fact and agents, or any of them, or their or his or her substitute or substitutes, may lawfully do or cause to be done by virtue hereof.
Pursuant to the requirements of the Securities Exchange Act of 1934, this report has been signed below by the following persons on behalf of the registrant and in the capacities and on the dates indicated.
|
| | | | |
| | | | | |
| Signature | | Title | | Date |
| | | |
/s/ IVELIN M. DIMITROV EDGAR LEE Ivelin M. DimitrovEdgar Lee
| | Chief Executive Officer (principal executive officer) | | December 13, 20168, 2017
|
| | | |
/s/ STEVEN M. NOREIKAMEL CARLISLE Steven M. NoreikaMel Carlisle
| | Chief Financial Officer and Treasurer (principal financial officer and principal accounting officer) | | December 13, 2016 |
| | |
/s/ TODD G. OWENS8, 2017
Todd G. Owens
| | President | | December 13, 2016 |
| | | |
/s/ BERNARD D. BERMANRICHARD W. COHEN
Bernard D. Berman Richard W. Cohen | | ChairmanDirector | | December 13, 20168, 2017
|
| | | | | |
/s/ JAMES CASTRO-BLANCO JOHN B. FRANK James Castro-BlancoJohn B. Frank
| | Director | | December 13, 20168, 2017
|
| | |
/s/ MARC H. GAMSIN Marc H. Gamsin | | Director | | December 8, 2017
|
| | |
/s/ CRAIG JACOBSON Craig Jacobson | | Director | | December 8, 2017
|
| | | | | |
/s/ RICHARD W. COHEN G. RUBEN Richard W. CohenG. Ruben | | Director | | December 13, 20168, 2017
|
| | | |
/s/ RICHARD P. DUTKIEWICZBRUCE ZIMMERMAN Richard P. DutkiewiczBruce Zimmerman
| | Director | | December 13, 2016 |
| | |
/s/ JEFFREY R. KAY8, 2017
Jeffrey R. Kay
| | Director | | December 13, 2016 |
| | | | | |
/s/ DOUGLAS F. RAY
Douglas F. Ray
| | Director | | December 13, 2016 |
EXHIBIT INDEX
|
| | |
Exhibit
Number
| | Description of Exhibit |
| |
31.1* | | Chief Executive Officer Certification Pursuant to Exchange Act Rule 13a-14 (a), as adopted pursuant to Section 302 of the Sarbanes-Oxley Act of 2002. |
| |
31.2* | | Chief Financial Officer Certification Pursuant to Exchange Act Rule 13a-14 (a), as adopted pursuant to Section 302 of the Sarbanes-Oxley Act of 2002. |
| |
32.1* | | Chief Executive Officer Certification pursuant to 18 U.S.C. Section 1350, as adopted pursuant to Section 906 of the Sarbanes-Oxley Act of 2002. |
| |
32.2* | | Chief Financial Officer Certification pursuant to 18 U.S.C. Section 1350, as adopted pursuant to Section 906 of the Sarbanes-Oxley Act of 2002. |