OAKTREE STRATEGIC INCOME CORPORATION
FORM 10-K FOR THE YEAR ENDED SEPTEMBER 30, 20172020
TABLE OF CONTENTS
| PART I | ||||||||
| Item 1. | ||||||||
| Item 1A. | ||||||||
| Item 1B. | ||||||||
| Item 2. | ||||||||
| Item 3. | ||||||||
| Item 4. | ||||||||
| PART II | ||||||||
| Item 5. | ||||||||
| Item 6. | ||||||||
| Item 7. | ||||||||
| Item 7A. | ||||||||
| Item 8. | ||||||||
| Item 9. | ||||||||
| Item 9A. | ||||||||
| Item 9B. | ||||||||
| PART III | ||||||||
| Item 10. | ||||||||
| Item 11. | ||||||||
| Item 12. | ||||||||
| Item 13. | ||||||||
| Item 14. | ||||||||
| PART IV | ||||||||
| Item 15. | ||||||||
PART I
Item 1. Business
General
Oaktree Strategic Income Corporation, (formerly known as Fifth Street Senior Floating Rate Corp. through October 17, 2017), a Delaware corporation, or together with its subsidiaries, where applicable, the Company, which may also be referred to as "we", "us"“we,” “us” or "our"“our”, is a specialty finance company dedicated to providing customized capital solutions for middle-market companies in both the syndicated and private placement markets. We were formed in May 2013, as a Delaware corporation, commenced operations on June 29, 2013, and currently operate as a closed-end, externally managed, non-diversified management investment company that has elected to be regulated as a business development companyBusiness Development Company under the Investment Company Act of 1940, as amended, or the 1940Investment Company Act. In addition, we have qualified and elected to be treated as a regulated investment company, or RIC, under the Internal Revenue Code of 1986, as amended, or the Code, for tax purposes. See “Taxation as a Regulated Investment Company.” As a RIC, we generally will not have to pay corporate-level U.S. federal income taxes on any net ordinary income or net realized capital gains that we distribute to our stockholders if we meet certain source-of-income, income distribution and asset diversification requirements. Also, we are an “emerging growth company,” as defined in the Jumpstart Our Business Startups Act of 2012, or JOBS Act, and take advantage of the exemption for emerging growth companies allowing us to temporarily forgo the auditor attestation requirements of Section 404(b) of the Sarbanes-Oxley Act of 2002, or the Sarbanes-Oxley Act. We do not take advantage of other disclosure or reporting exemptions for emerging growth companies under the JOBS Act.
We have invested primarily in senior secured loans, including first lien, unitranche and second lien debt instruments, that pay interest at rates which are determined periodically on the basis of a floating base lending rate, primarily the London-Interbank Offered Rate, or LIBOR, plus a premium. The senior loans in which we invest are typically made to U.S. and, to a limited extent, non-U.S. corporations, partnerships and other business entities in the middle-market which operate in various industries and geographical regions.
Our Adviser is generally focused on middle-market companies, which we define as companies with enterprise values of between $100 million and $750 million. We expect our portfolio to include primarily first lien floating rate senior secured financings although we may also make other investments. We generally invest in securities that are rated below investment grade by rating agencies or that would be rated below investment grade if they were rated. Below investment grade securities, which are often referred to as “high yield” and “junk,” have predominantly speculative characteristics with respect to the issuer’s capacity to pay interest and repay principal. Our Former Adviser targeted middle-market companies with approximately $20 million to $120 million of EBITDA (generally defined as Earnings before Interest, Taxes, Depreciation and Amortization).
We are permitted to, and expect to continue to, finance our investments through borrowings. However, as a business development company,Business Development Company, subject to certain limited exceptions, we are generallycurrently only allowed to borrow amounts such that ourin accordance
1
with the asset coverage as definedrequirements in the 1940Investment Company Act. At a special meeting of stockholders held on July 10, 2018, our stockholders approved the application of the reduced asset coverage requirements in Section 61(a)(2) of the Investment Company Act equals at least 200% after such borrowing.to us, effective as of July 11, 2018. The reduced asset coverage requirements permit us to double the maximum amount of leverage that we employ will depend on our assessment of market conditions and other factors atare permitted to incur by reducing the time of any proposed borrowing, such as the maturity, covenant package and rate structureasset coverage requirements applicable to us from 200% to 150%. As a result of the proposed borrowings, our abilityreduced asset coverage requirement, we can incur $2 of debt for each $1 of equity as compared to raise funds through the issuance$1 of sharesdebt for each $1 of our common stock and the risks of such borrowings within the context of our investment outlook. Ultimately, we only intend to use leverage if the expected returns from borrowing to make investments will exceed the cost of such borrowing.equity. As of September 30, 2017,2020, we had a debt to equity ratio of 0.90x1.00x (i.e., one dollar of equity for each $0.90$1.00 of debt outstanding). Under current market conditions, we generally expect to target a debt to equity ratio of 1.00x to 1.40x (i.e., one dollar of equity for each $1.00 to $1.40 of debt outstanding).

Our principal executive office is located at 333 South Grand Avenue, 28th Floor, Los Angeles, CA 90071 and our telephone number is (213) 830-6300.
Our Investment Adviser, was formed in April 1995 andan affiliate of OCM, is a premier credit manager and leader among alternativeleading global investment managersmanagement firm headquartered in Los Angeles, California. Oaktree has $99.5 billion in assets under management asCalifornia, focused on less efficient markets and alternative investments. A number of September 30, 2017, with approximately 70% in credit strategies. The firm has an extensive global investment platform with more than 900 employees, including over 250the senior executives and investment professionals who have significant origination, structuringof our Adviser and underwriting expertise. Oaktree’s disciplined investment philosophy and commitment to credit investing and lendingits affiliates have been demonstrated acrossinvesting together for over 34 years and have generated impressive investment performance through multiple market cycles for more than 20 years. Oaktree emphasizescycles. Our Adviser and its affiliates emphasize an opportunistic, value-oriented and risk-controlled approach to investments in distressed debt, corporate debt (including mezzanine finance, high yieldhigh-yield debt and senior loans), control investing, real estate, convertible securities and listed equities. Oaktree manages
In 2019, Brookfield acquired a majority economic interest in OCG. OCG operates as an independent business within Brookfield, with its own product offerings and investment, marketing and support teams. Brookfield is a leading global alternative asset manager with a 120-year history and approximately $550 billion of assets forunder management (inclusive of Oaktree) across a wide varietybroad portfolio of clients, including manyreal estate, infrastructure, renewable power, credit and private equity assets. Commencing in 2022, OCG's founders, senior management and current and former employee-unitholders of OCG will be able to sell their remaining OCG units to Brookfield over time pursuant to an agreed upon liquidity schedule and approach to valuing such units at the time of liquidation. Pursuant to this liquidity schedule, the earliest year in which Brookfield could own 100% of the most significant investorsOCG business is 2029.
The primary firm-wide goal of our Adviser and OCM is to achieve attractive returns while bearing less than commensurate risk. Our Adviser believes that it can achieve this goal by taking advantage of market inefficiencies in which financial markets and their participants fail to accurately value assets or fail to make available to companies the world.capital that they reasonably require.
Our Adviser and its affiliates believe that their defining characteristic is adherence to the highest professional standards, which has yielded several important benefits. First and foremost, this characteristic has allowed our Adviser and its affiliates to attract and retain an extremely talented group of investment professionals, or the Investment Professionals, as well as accounting, valuation, legal, compliance and other administrative professionals. As of September 30, 2017, this client base includes 752020, our Adviser and its affiliates had more than 1,000 professionals in 19 cities and 14 countries, including 39 portfolio managers with an average experience of the 100 largest U.S. pension plans, the main pension fund25 years and approximately 1,000 years of 38 states incombined industry experience. Specifically, the United States, over 400 corporations, over 350 university, charitable and other endowments and foundations, over 350 non-U.S. institutional investors and 16 sovereign wealth funds.
2
Our Adviser and its immediate termination. The material terms of theaffiliates provide discretionary investment management services to be provided under the New Investment Advisory Agreement, other than the fee structure, are substantially the same as the Former Investment Advisory Agreement, except that services are provided by Oaktree.
Strategic Credit
Our Adviser's affiliates officially launched the Strategic Credit strategy in early 2013 as a step-out from the Distressed Debt strategy, to capture attractive investment opportunities that appear to offer too little return for distressed debt investors, but may pose too much uncertainty for high-yield bond creditors. The strategy seeks to achieve an attractive total return by investing in public and private revenue-generating, performing debt.
Strategic Credit focuses on U.S. and non-U.S. investment opportunities that arise from pricing inefficiencies that occur in the primary and secondary markets or from the financing needs of healthy companies with limited access to traditional lenders or public markets. Typical investments will be in high yield bonds and senior secured loans for borrowers that are in need of direct loans, rescue financings, or other capital solutions or that have had challenged or unsuccessful primary offerings.
The Investment Professionals employ a fundamental, value-driven opportunistic approach to credit investing, which seeks to benefit from the resources, relationships and proprietary information of the global investment platform of our Adviser and its affiliates.
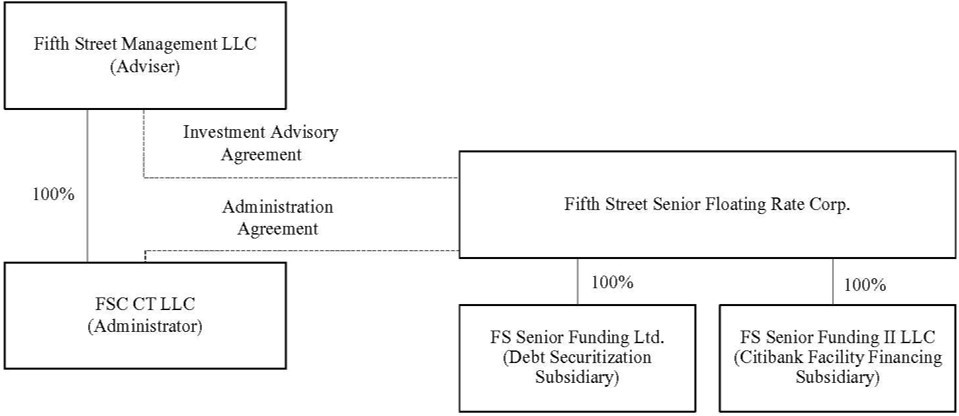
Our Administrator
We entered into an administration agreement, as amended from time to time, or the Administration Agreement, with Oaktree Administrator, a Delaware limited liability company and a wholly owned subsidiary of OCM. The principal executive offices of Oaktree Administrator are located at 333 South Grand Avenue, 28th Floor, Los Angeles, CA 90071. Pursuant to the Administration Agreement, Oaktree Administrator provides services to us, and we reimburse Oaktree Administrator for costs and expenses incurred by Oaktree as described belowAdministrator in performing its obligations under “-New Investment Advisory Agreement.” FSC CT LLC, or our Former Administrator, was a wholly-owned subsidiary of our Former Adviser. Our Former Administrator provided administrative services necessary for us to operate pursuant to an administrativethe Administration Agreement and loan services agreement, or the Former Administration Agreement. See “- Former Administration Agreement.”
Business Strategy
Emphasis on Proprietary Deals. Our Investment Adviser is primarily focused on proprietary opportunities as well as partnering with other lenders as appropriate and, to a lesser extent strategically accessing the broadly syndicated and private placement markets. Dedicated sourcing professionals of our Investment Adviser and its affiliates are in continuous contact with financial sponsors and corporate clients to originate proprietary deals and seek to leverage the networks and relationships of Oaktree’s over 250 investment professionalsInvestment Professionals with management teams and corporations to originate non-sponsored transactions. Since 2005, our Investment Adviser hasand its affiliates have invested more than $10$19 billion in over 200350 directly originated loans, and the Oaktree platform has the capacity to invest in large deals and to solely underwrite transactions.
•Focus On Quality Companies And Extensive Diligence. Our Investment Adviser seeks to maintain a conservative approach to investing with discipline around fundamental credit analysis and downside protection. Our Investment Adviser intends to focus on companies with resilient business models, we expect to be resilient in the future,strong underlying fundamentals, that will provide strength in future downturns, significant asset or enterprise value and seasoned management teams, although not all portfolio companies will meet each of these criteria. Our Investment Adviser intends to leverage its deep credit and deal structuring expertise to lend to companies that have unique needs, complex business models or specific business challenges. Our Investment Adviser conducts diligence on underlying collateral value, including cash flows, hard assets or intellectual property, and will typically model exit scenarios as part of the diligence process, including assessing potential “work-out” scenarios.
•Disciplined Portfolio Management. Our Investment Adviser monitors our portfolio on an ongoing basis to manage risk and take preemptive action to resolve potential problems where possible. Our Investment Adviser intends to seek to reduce the impact of individual investment risks by diversifying portfolios across industry sectors and, with the exception of investment vehicles with a diversified portfolio, limiting positions to no more than 5% of our portfolio.
•Manage Risk Through Loan Structures. Our Investment Adviser seeks to leverage its experience in identifying structural risks in prospective portfolio companies and developing creativecustomized solutions in an effort to enhance downside protection
3
•Concentrate on Floating Rate Senior Loans. We intend to concentrate on first lien secured loans that bear interest based on a floating rate. We believe that these loans, which are supported by a pledge of collateral, minimize the risk of principal loss. In addition,
•Completion of Rotation out of Non-Core Investments.Since an Oaktree affiliate became our investment adviser, Oaktree and its affiliates have reduced the investments identified as non-core by approximately $250 million at fair value. Oaktree intends to (1) continue to rotate out of a small number of investments where the underlying business fundamentals may expose us to significant risk of loss of principal, (2) focus on increasing the size of private first lien investments originated on Oaktree's platform (which we call "core investments" and (3) supplement the portfolio with interest rates near historically low levels, we believe that investing in floating rate loans provides us with positive exposure in a rising interest rate environment.broadly syndicated and select privately placed loans.
Our Investment Adviser’s emphasis is on fundamental credit analysis, consistency and downside protection, all of which are key tenets of its investment philosophy.philosophy and important during times of market dislocation, including during the COVID-19 pandemic. We believe this philosophy strongly aligns with the interests of our stockholders. Our Investment Adviser controls primarily for risk, rather than return. Although this may lead us to underperform in bullish markets, we expect that prudence across the economic cycle and limiting losses will allow us to achieve our investment objectives.
Identification of Investment CriteriaOpportunities
Macro Factors
Macro factors that drive market dislocations occur throughout the global economy and include sovereign debt crises, political elections, global pandemics, including the current COVID-19 pandemic, and other unexpected geopolitical events. These factors drive highly correlated “risk on” and “risk off” market swings and frequently result in the indiscriminate selling or buying of securities and obligations at prices that the Investment Professionals believe are well below or above their intrinsic values.
Market-Level Changes
We believe that many commercial banks have decreased their lending to middle-market companies in recent years, which has created an opportunity for non-traditional market participants. In addition, we believe that traditional capital providers are focusing on only higher-quality and more liquid opportunities. The lower-rated portion of the market is often less efficiently priced due to limited capital availability, which allows for more attractive risk and return opportunities.
Company Characteristics
Company-specific factors that drive market dislocations include over-leveraged balance sheets, near-term liquidity or maturity issues, secular pressures on businesses, acute shock to company operations (including from government shutdowns), asset-light businesses and new or relatively small issuers. These factors may result in mispriced securities or obligations or require a highly structured direct loan.
The Investment Professionals believe current market conditions give rise to two primary sources of investment opportunities with favorable risk-reward characteristics. The first source is private debt, which capitalizes on the Investment Professionals’ experience in negotiating and structuring complex debt investments. Private debt can include (a) loan portfolios that banks need to sell in response to regulatory capital pressure, (b) capital solutions, which involve customized, negotiated solutions for companies unable to access traditional syndicated loan and high yield markets, (c) rescue financings, which are transactions structured to provide liquidity to companies with overleveraged balance sheets, often on an urgent basis and (d) other direct loan investments to support acquisitions or capital projects that are unable to obtain financing via more traditional
4
channels. The second source is marketable securities or other forms of traded debt, which the Investment Professionals intend to purchase on the secondary market at prices they believe are below their intrinsic value.
Once the Investment Professionals have identified a potential investment opportunity, they will evaluate the opportunity against the following investment criteria and guidelines for identifying and investing in prospective portfolio companies.guidelines. However, not all of these criteria will be met by each prospective portfolio company in which we invest.
•Sustainable Cash Flow. Our investment philosophy places emphasis on fundamental analysis from an investor’s perspective and has a distinct value orientation. We intend to focus on companies with significant asset or enterprise value in which we can invest at relatively low multiples of normalized operating cash flow. Additionally, we anticipate investing in companies with a demonstrated ability or credible plan to de-lever. Typically, we will not invest in start-up companies, companies having speculative business plans or structures that could impair capital over the long-term although we may target certain earlier stage companies that have yet to reach profitability.
•Experienced Management Team. We generally will look to invest in portfolio companies with an experienced management team and proper incentive arrangements, including equity compensation, to induce management to succeed and to act in concert with our interests as investors.
•Strong Relative Position Inin Its Market. We intend to target companies with what we believe to be established and leading market positions within their respective markets and well-developed long-term business strategies.
•Exit Strategy. We generally intend to invest in companies that we believe will provide us with the opportunity to exit our investments in three to eight years, including through (1) the repayment of the remaining principal outstanding at maturity, (2) the recapitalization of the company resulting in our debt investments being repaid andor (3) the sale of the company resulting in the repayment of all of its outstanding debt.
Investment Process
Our investment process consists of the following five distinct stages.
investment opportunities and that we are well-positioned for difficult and complex transactions. In 2016, Oaktree’s Strategic Credit team evaluated more than 200 potential direct lending opportunities with total transaction value of approximately $30 billion. More than 85% of these potential direct lending opportunities were for transactions of $50 million or larger, and Oaktree’s Strategic Credit team continues to see a meaningful pipeline of sizeable transactions.
Screen Using Investment Criteria.Criteria
We expect to be highly selective in making new investments. The initial screening process will typically include a review of the proposed capital structure of the portfolio company, including level of assets or enterprise value coverage, an assessment by our Investment Adviser of the company’s management team and its equity ownership levels as well as the viability of its long-term business model, and a review of forecasted financial statements and liquidity profile. In addition, our Investment Adviser may assess the prospect of industry or macroeconomic catalysts that may create enhanced value in the investment as well as the potential ability to enforce creditor rights, particularly where collateral is located outside of the United States.
5
Research
Prior to making any new investment, our Investment Adviser intends to engage in an extensive due diligence process led by investment analysts assigned to each transaction. The analysts will assess a company’s management team, products, services, competitive position in its markets, barriers to entry and operating and financial performance, as well as the growth potential of its markets. In performing this evaluation, the analysts may use financial, descriptive and other due diligence materials provided by the target company, commissioned third party reports and internal sources, including members of the investment team, industry participants and experts with whom our Investment Adviser has relationships. As part of the research process, our Investment Adviser’s analysts typically perform a “what-if” analysis that explores a range of values for each proposed investment and a range of potential credit events.
Our Investment Adviser assesses each potential investment through a robust,rigorous, collaborative decision-making process. Our Investment Adviser applies disciplined investment criteria and evaluates potential risk and reward of each investment with significant focus on downside risk. Our Investment Adviser sizes investments at the portfolio level across a variety of characteristics, including based on the investment criteria described above.
Our Investment Adviser prioritizes managing risk. In managing our portfolio, our Investment Adviser intends to closely monitormonitors each portfolio company andto be well-positioned to make hold and exit decisions when credit events occur, our collateral becomes overvalued or opportunities with more attractive risk/reward profiles are identified. Investment analysts will beare assigned to each investment to monitor industry developments, review company financial statements, attend company presentations and regularly speak with company management. Based on their monitoring, the Investment Professionals seek to determine the optimal time and strategy for exiting and maximizing the return on the investment, typically when prices or yields reach target valuations. In circumstances where a particular investment is underperforming, our Investment Adviser intends to employ a variety of strategies to maximize its recovery based on the specific facts and circumstances of the underperforming investment, including actively working with the management to restructure all or a portion of the business, explore the possibility of a sale or merger of all or a portion of the assets, recapitalize or refinance the balance sheet, negotiate deferrals or other concessions from existing creditors and arrange new liquidity or new equity contributions. We believe that our Investment Adviser’s experience with restructurings and our access to our Investment Adviser’s deep knowledge, expertise and contacts in the distressed debt area will help us preserve the value of our investments.
Investments
Debt Investments
We intend to tailor the terms of each investment by negotiating a structure that seeks to protect our rights and manage our risk while creating incentives for the portfolio company to achieve its business plan. Our Adviser is generally focused on middle-market companies. A substantial source of return is monthly or quarterly cash interest that we collect on our debt investments. We expectinvestments, including payment-in-kind, or PIK, interest which represents contractual interest accrued and added to the principal that our Investment Adviser will focus on middle-market companies, which we define as companies with enterprise valuesgenerally becomes due at maturity. Our debt investments generally consist of between $100 and $750 million. Going forward, we expect our portfolio to include primarily first lien senior secured floating rate loans although we may also make other investments.the following:
6
•First Lien Loans. Our first lien loans generally have terms of three to seven years, provide for a variable or fixed interest rate, contain prepayment penalties and are secured by a first priority security interest in all existing and future assets of the borrower. We target first lien loans where interest is paid on a floating rate basis, often with a floor, based on the LIBOR rate. Our first lien loans may take many forms, including revolving lines of credit, term loans and acquisition lines of credit.
•Unitranche Loans. Our unitranche loans generally have terms of five to seven years and provide for a variable or fixed interest rate, contain prepayment penalties and are generally secured by a first priority security interest in all existing and future assets of the borrower. Our unitranche loans may take many forms, including revolving lines of credit, term loans and acquisition lines of credit. Unitranche loans typically provide a borrower with all of its capital except for common equity often with higher interest rates than those associated with traditional first lien loans.
•Second Lien Loans. Our second lien loans generally have terms of five to eight years, provide for a variable or fixed interest rate, contain prepayment penalties and are secured by a second priority security interest in all existing and future assets of the borrower. Our second lien loans may include payment-in-kind, or PIK, interest, which represents contractual interest accrued and added to the principal that generally becomes due at maturity.
Equity Investments
When we make a debt investment, we may also be granted equity, such as warrants to purchase common stock in the company in the same class of security as the sponsor receives upon funding. In addition, from time to timea portfolio company. To a lesser extent, we may also make preferred and/or common equity investments, which are usually in conjunction with a concurrent debt investment or the result of an investment restructuring. For non-control equity co-investments in connection with private equity sponsors. Weinvestments, we generally seek to structure our non-control equity investments such as direct equity co-investments, to provide us with minority rights provisions and event-driven put rights. We also seek to obtain limited registration rights in connection with these investments, which may include “piggyback” registration rights.
We have invested in FSFRand GF Equity Funding co-invest through the OCSI Glick JV, whichan unconsolidated Delaware limited liability company. The OCSI Glick JV was formed in October 2014 and began investing in April 2015 primarily in senior secured loans of middle market companies. We co-invest in these securities with GF Equity Funding through our investment in the OCSI Glick JV. The OCSI Glick JV is managed by a four person Board of Directors, two of whom are selected by us and two of whom are selected by GF Equity Funding. The OCSI Glick JV is capitalized as transactions are completed, and all portfolio decisions and investment decisions in respect of the OCSI Glick JV must be approved by its investment committee consisting of one representative selected by us and one representative selected by GF Equity Funding (with approval of each required). The members provide capital to the OCSI Glick JV in exchange for LLC equity interests, and we and GF Debt Funding 2014 LLC, or GF Debt Funding, an entity advised by affiliates of GF Equity Funding, provide capital to the OCSI Glick JV in exchange for subordinated notes, or the Subordinated Notes. Additionally, the OCSI Glick JV has a senior revolving credit facility with Deutsche Bank AG, New York Branch, or the JV Deutsche Bank Facility, with a reinvestment period end date and maturity date of September 30, 2021 and March 31, 2025, respectively, and, as of September 30, 2017, consisted2020, permits up to $90.0 million of borrowings. As of September 30, 2020 and September 30, 2019, the OCSI Glick JV had total capital commitments of $100.0 million, $87.5 million of which was from us and the remaining $12.5 million from GF Equity Funding and GF Debt Funding. At September 30, 2020, we had funded approximately $84.0 million of our commitment. As of September 30, 2020, our investment in the OCSI Glick JV was approximately $49.4 million at fair value. We do not consolidate the OCSI Glick JV in our Consolidated Financial Statements. As of September 30, 2020, OCSI Glick JV was invested in a portfolio of senior secured loans to 23 different borrowers40 portfolio companies in industries similar to the companies in our portfolio. FSFR Glick JV invests in middle-market and other corporate debt securities, including traditional senior debt that are secured by some or all of the company’s assets.
As a business development company, we are obligated to offer to provide significant managerial assistance to our portfolio companies and to provide it if requested. We provide managerial assistance to most of our portfolio companies as a general practice and we seek investments where such assistance is appropriate. We monitor the financial trends of each portfolio company to assess the appropriate course of action for each company and to evaluate overall portfolio quality. We have several methods of evaluating and monitoring the performance of our investments, including the following:
The following is a description of the New Investment Advisory Agreement, which has been in effect sinceAgreement. From October 17, 2017.2017 through May 3, 2020, we were externally managed by OCM pursuant to an investment advisory agreement. On May 4, 2020, OCM effected the novation of such investment advisory agreement to Oaktree. Immediately following such novation, we and Oaktree entered into a new investment advisory agreement with the same terms, including fee structure, as the investment advisory agreement with OCM. The term “Investment Advisory Agreement” refers collectively to the agreements with Oaktree and, prior to its novation, with OCM.
7
Management Services
•determines the composition of our portfolio, the nature and timing of the changes to our portfolio and the manner of implementing such changes;
•identifies, evaluates and negotiates the structure of the investments we make;
•executes, closes, monitors and services the investments we make;
•determines what securities and other assets we purchase, retain or sell; and
•performs due diligence on prospective portfolio companies.companies; and
•provides us with such other investment advisory, research and related services as we may, from time to time, reasonably required for the investment of our funds.
The New Investment Advisory Agreement provides that Oaktree’s services are not exclusive to us and Oaktree is generally free to furnish similar services to other entities so long as its services to us are not impaired.
Management Fee
Under the New Investment Advisory Agreement, we pay Oaktree a fee for its services under the investment advisory agreement consisting of two components: a base management fee and an incentive fee. The cost of both the base management fee payable to Oaktree and any incentive fees earned by Oaktree is ultimately borne by our common stockholders.
Base Management Fee
Under the New Investment Advisory Agreement, the base management fee onis calculated at an annual rate of 1.00% of total gross assets, including any investment made with borrowings, but excluding cash and cash equivalents, is 1.00%.equivalents.
Incentive Fee
The incentive fee consists of two parts. Under the New Investment Advisory Agreement, the first part of the incentive fee, which is referred to as the incentive fee on income or the Part I incentive fee, is calculated and payable quarterly in arrears based upon our “pre-incentive fee net investment income” for the immediately preceding quarter. The payment of the incentive fee on income is subject to payment of a preferred return to investors each quarter (i.e., a “hurdle rate”), expressed as a rate of return on the value of our net assets at the end of the most recently completed quarter, of 1.50%, subject to a “catch up” feature.
For this purpose, “pre-incentive fee net investment income” means interest income, dividend income and any other income (including any other fees such as commitment, origination, structuring, diligence and consulting fees or other fees that we receive from portfolio companies, other than fees for providing managerial assistance) accrued during the fiscal quarter, minus our operating expenses for the quarter (including the base management fee, expenses payable under the New Administration Agreement and any interest expense and dividends paid on any issued and outstanding preferred stock, but excluding the incentive fee). Pre-incentive fee net investment income includes, in the case of investments with a deferred interest feature (such as original issue discount, or OID debt instruments with PIK interest and zero coupon securities), accrued income that we have not yet received in cash. Pre-incentive fee net investment income does not include any realized capital gains, realized capital losses or unrealized capital appreciation or depreciation.
Under the New Investment Advisory Agreement, the calculation of the incentive fee on income for each quarter is as follows:
•No incentive fee is payable to Oaktree in any quarter in which our pre-incentive fee net investment income does not exceed the preferred return rate of 1.50% (the “preferred return”) on net assets.
•100% of our pre-incentive fee net investment income, if any, that exceeds the preferred return but is less than or equal to 1.8182% in any fiscal quarter is payable to Oaktree. We refer to this portion of the incentive fee on income as the “catch-up” provision, and it is intended to provide Oaktree with an incentive fee of 17.5% on all of our pre-incentive fee net investment income when our pre-incentive fee net investment income reaches 1.8182% on net assets in any fiscal quarter.
•For any quarter in which our pre-incentive fee net investment income exceeds 1.8182% on net assets, the subordinated incentive fee on income is equal to 17.5% of the amount of our pre-incentive fee net investment income, as the preferred return and catch-up will have been achieved.
There is no accumulation of amounts on the hurdle rate from quarter to quarter and accordingly there is no clawback of amounts previously paid if subsequent quarters are below the quarterly hurdle.
8
The following is a graphical representation of the calculation of the incentive fee on income under the New Investment Advisory Agreement:
Quarterly Incentive Fee on Income
Pre-incentive fee net investment income
(expressed as a percentage of net assets)
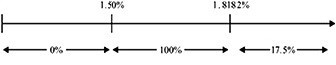
Percentage of pre-incentive fee net investment income
allocated to theincome-related portion of incentive fee on income
Under the New Investment Advisory Agreement, the second part of the incentive fee will beis determined and payable in arrears as of the end of each fiscal year (or upon termination of the investment advisory agreement,Investment Advisory Agreement, as of the termination date) commencing with the fiscal year endingended September 30, 2019 and will equalequals 17.5% of our realized capital gains, if any, on a cumulative basis from the beginning of the fiscal year endingended September 30, 2019 through the end of each subsequent fiscal year, computed net of all realized capital losses and unrealized capital depreciation on a cumulative basis, less the aggregate amount of any previously paid capital gain incentive fees under the New Investment Advisory Agreement. Any realized capital gains, realized capital losses, unrealized capital appreciation and unrealized capital depreciation with respect to the Company’sour portfolio as of the end of the fiscal year endingended September 30, 2018 will beare excluded from the calculations of the second part of the incentive fee.
Examples of Quarterly Incentive Fee Calculation under the New Investment Advisory Agreement (A)
Example 1: Incentive Fee on Income for Each Quarter
Alternative 1
Assumptions
Investment income (including interest, dividends, fees, etc.) = 1.75%
Preferred return under the New Investment Advisory Agreement1 = 1.50%
Management fee under the New Investment Advisory Agreement2 = 0.25%
Other expenses (legal, accounting, custodian, transfer agent, etc.) = 0.20%
Pre-incentive fee net investment income
Pre-incentive fee net investment income does not exceed the preferred return under the New Investment Advisory Agreement, therefore there is no incentive fee on income under the New Investment Advisory Agreement.
Alternative 2
Assumptions
Investment income (including interest, dividends, fees, etc.) = 2.25%
Preferred return under the New Investment Advisory Agreement1 = 1.50%
Management fee under the New Investment Advisory Agreement2 = 0.25%
Other expenses (legal, accounting, custodian, transfer agent, etc.) = 0.20%
Pre-incentive fee net investment income
Incentive fee = 17.5% × pre-incentive fee net investment income, subject to “catch-up”3
= 100% × (1.80% - 1.50%)
= 0.30%
9
Alternative 3
Assumptions
Investment income (including interest, dividends, fees, etc.) = 3.5%
Preferred return under the New Investment Advisory Agreement1 = 1.50%
Management fee under the New Investment Advisory Agreement2 = 0.25%
Other expenses (legal, accounting, custodian, transfer agent, etc.) = 0.20%
Pre-incentive fee net investment income
Incentive fee = 17.5% × pre-incentive fee net investment income, subject to “catch-up”3
Incentive fee = 100% × “catch-up” + (17.5% × (pre-incentive fee net investment income - 1.8182%))
Catch-up = 1.8182% - 1.50% = 0.3182%
Incentive fee = (100% × 0.3182%) + (17.5% × (3.05% - 1.8182%))
= 0.3182% + (17.5% × 1.2318%)
= 0.3182% + 0.2158%
= 0.534%
__________
(A) Solely for purposes of these illustrative examples, we have assumed that we have not incurred any leverage. However, we have in the past and expect to continue in the future to use leverage to partially finance our investments.
1.Represents 6.0% annualized preferred return.
2.Represents 1.0% annualized management fee.
3.The “catch-up” provision is intended to provide our Adviser with an incentive fee of 17.5% on all of our pre-incentive fee net investment income as if a preferred return did not apply when our net investment income exceeds 1.50% in any calendar quarter and is not applied once our Adviser has received 17.5% of investment income in a quarter. The “catch-up” portion of our pre-incentive fee net investment income is the portion that exceeds the 1.50% preferred return but is less than or equal to approximately 1.8182% (that is, 1.50% divided by (1 - 0.175)) in any fiscal quarter.
Example 2: Incentive Fee on Capital Gains under the New Investment Advisory Agreement
Assumptions
•Year 1: $10 million investment made in Company A (“Investment A”), $10 million investment made in Company B (“Investment B”), $10 million investment made in Company C (“Investment C”), $10 million investment made in Company D (“Investment D”) and $10 million investment made in Company E (“Investment E”).
•Year 2: Investment A sold for $20 million, fair market value (“FMV”) of Investment B determined to be $8 million, FMV of Investment C determined to be $12 million, and FMV of Investments D and E each determined to be $10 million.
•Year 3: FMV of Investment B determined to be $8 million, FMV of Investment C determined to be $14 million, FMV of Investment D determined to be $14 million and FMV of Investment E determined to be $16 million.
•Year 4: Investment D sold for $12 million, FMV of Investment B determined to be $10 million, FMV of Investment C determined to be $16 million and FMV of Investment E determined to be $14 million.
•Year 5: Investment C sold for $20 million, FMV of Investment B determined to be $14 million and FMV of Investment E determined to be $10 million.
•Year 6: Investment B sold for $16 million and FMV of Investment E determined to be $8 million.
•Year 7: Investment E sold for $8 million and FMV.
10
These assumptions are summarized in the following chart:
| Investment A | Investment B | Investment C | Investment D | Investment E | Cumulative Unrealized Capital Depreciation | Cumulative Realized Capital Losses | Cumulative Realized Capital Gains | |||||||||||||||||||
| Year 1 | $10 million (cost basis) | $10 million (cost basis) | $10 million (cost basis) | $10 million (cost basis) | $10 million (cost basis) | -- | -- | -- | ||||||||||||||||||
| Year 2 | $20 million (sale price) | $8 million FMV | $12 million FMV | $10 million FMV | $10 million FMV | $2 million | -- | $10 million | ||||||||||||||||||
| Year 3 | -- | $8 million FMV | $14 million FMV | $14 million FMV | $16 million FMV | $2 million | -- | $10 million | ||||||||||||||||||
| Year 4 | -- | $10 million FMV | $16 million FMV | $12 million (sale price) | $14 million FMV | -- | -- | $12 million | ||||||||||||||||||
| Year 5 | -- | $14 million FMV | $20 million (sale price) | -- | $10 million FMV | -- | -- | $22 million | ||||||||||||||||||
| Year 6 | -- | $16 million (sale price) | -- | -- | $8 million FMV | $2 million | -- | $28 million | ||||||||||||||||||
| Year 7 | -- | -- | -- | -- | $8 million (sale price) | -- | $2 million | $28 million | ||||||||||||||||||
The Incentive Fee on Capital Gains under the New Investment Advisory Agreement would be:
•Year 1: None
•Year 2: Capital Gains Fee = 17.5% multiplied by ($10 million realized capital gains on sale of Investment A less $2 million cumulative capital depreciation) = $1.4 million
•Year 3: Capital Gains Fee = (17.5% multiplied by ($10 million cumulative realized capital gains less $2 million cumulative capital depreciation)) less $1.4 million cumulative Capital Gains Fee previously paid = $1.4 million less $1.4 million = $0.00 million
•Year 4: Capital Gains Fee = (17.5% multiplied by ($12 million cumulative realized capital gains)) less $1.4 million cumulative Capital Gains Fee previously paid = $2.1 million less $1.4 million = $0.7 million
•Year 5: Capital Gains Fee = (17.5% multiplied by ($22 million cumulative realized capital gains)) less $2.1 million cumulative Capital Gains Fee previously paid = $3.85 million less $2.1 million = $1.75 million
•Year 6: Capital Gains Fee = (17.5% multiplied by ($28 million cumulative realized capital gains less $2 million cumulative capital depreciation)) less $3.85 million cumulative Capital Gains Fee previously paid = $4.55 million less $3.85 million = $0.70 million
•Year 7: Capital Gains Fee = (17.5% multiplied by ($28 million cumulative realized capital gains less $2 million cumulative realized capital losses)) less $4.55 million cumulative Capital Gains Fee previously paid = $4.55 million less $4.55 million = $0.00 million
Collection and Disbursement of Fees Owed to Our Former Adviser
Under the Former Investment Advisory Agreement described below, both the base management fee and incentive fee on income were calculated and paid to our Former Adviser (as defined below) at the end of each quarter. In order to ensure that our Former Adviser receivesreceived any compensation earned during the quarter endingended December 31, 2017, the initial payment of the base management fee and incentive fee on income under the New Investment Advisory Agreement will covercovered the entire quarter in which the New Investment Advisory Agreement became effective, and bewas calculated at a blended rate that will reflectreflected fee rates under the respective investment advisory agreements for the portion of the quarter in which our Former Adviser and OaktreeOCM were serving as investment adviser. This structure will allow Oaktreeallowed OCM to pay our Former Adviser in early 2018, the pro rata portion of the fees that were earned by, but not paid to, our Former Adviser for services rendered to us prior to October 17, 2017.2017 of $0.3 million.
Duration and Termination
Unless earlier terminated as described below, the New Investment Advisory Agreement will remain in effect until October 17, 2019September 30, 2021 and thereafter from year-to-year if approved annually by our Board or by the affirmative vote of the holders of a majority of our outstanding voting securities, including, in either case, approval by a majority of our directors who are not interested persons. The New Investment Advisory Agreement will automatically terminate in the event of its assignment. The New Investment Advisory Agreement may be terminated by either party without penalty upon 60 days’ written notice to the other.
11
The New Investment Advisory Agreement may also be terminated, without penalty, upon the vote of a majority of our outstanding voting securities.
Indemnification
The New Investment Advisory Agreement provides that, absent willful misfeasance, bad faith or gross negligence in the performance of their respective duties or by reason of the reckless disregard of their respective duties and obligations, Oaktree and its officers, managers, partners, members (and their members, including the owners of their members), agents, employees, controlling persons members (or their owners) and any other person or entity affiliated with it, are entitled to indemnification from us for any damages, liabilities, costs and expenses (including reasonable attorneys’ fees and amounts reasonably paid in settlement) arising from the rendering of Oaktree’s services under the New Investment Advisory Agreement or otherwise as our investment adviser.
Fee Waiver
For the two-year period commencing on October 17, 2017, Oaktree will waive, to the extent necessary, anyOCM waived management orand incentive fees payable under the New Investment Advisory Agreement that exceedexceeded what would have been paid to the Former Adviser in the aggregate under the Former Investment Advisory Agreement.
Organization of our Investment Adviser
Our Investment Adviser is a Delaware limited partnershipliability company that is registered as an investment adviser under the Advisers Act. The principal address of our Investment Adviser is 333 South Grand Avenue, 28th Floor, Los Angeles, CA 90071.
Board Approval of the New Investment Advisory Agreement
•the nature, extent and quality of services to be performed by Oaktree;OCM;
•the investment performance of us and funds managed by Oaktree;OCM with a similar investment objective to us;
•the expected costs of services to be provided and the anticipated profits to be realized by OaktreeOCM and its affiliates from their relationship with us;
•the possible economies of scale that would be realized due to our growth;
•whether fee levels reflect such economies of scale for the benefit of investors; and
•comparisons of services to be rendered to and fees to be paid by us with the services provided by and the fees paid to other investment advisers and the services provided to and the fees paid by other Oaktree clients.OCM clients; and
No single factor was determinative of the decision of theour Board of Directors, including all of the then-current independent directors, to approve the New Investment Advisory Agreement and individual directors may have weighed certain factors differently. Throughout the process, the independent directors were advised by independent counsel. Following this process, the then-current members of theour Board of Directors, including all of the then-current independent directors, unanimously voted to approve the New Investment Advisory Agreement subject to stockholder approval. Our stockholders approved the New Investment Advisory Agreement aton June 28, 2019.
Our Board of Directors met with Oaktree and OCM to consider to the Special Meeting.approval of the novation and assumption of the Investment Advisory Agreement by OCM and Oaktree, respectively, and of the new Investment Advisory Agreement between the Company and Oaktree. On April 30, 2020, our Board of Directors, including all of the independent directors, unanimously approved the novation and assumption of the Investment Advisory Agreement with OCM and entry into the Investment Advisory Agreement with Oaktree. In reaching such decision, our Board of Directors considered, among other items, that the level and quality of services and the personnel providing such services would remain unchanged, that Oaktree and OCM are under common control and that the terms and conditions of the Investment Advisory Agreement (other than the parties) would remain unchanged.
12
Payment of Our Expenses
Our primary operating expenses are the payment of (i) a base management fee and any incentive fees as described below in “-Former Investment Advisory Agreement” with respect to the period prior to October 17, 2017 and as described above in “-New Investment Advisory Agreement” with respect to the period subsequent to that date and (ii) the allocable portion of overhead and other expenses incurred by our Former Administrator or Oaktree Administrator as applicable, in performing its obligations under the Former Administration Agreement or New Administration Agreement, as applicable.Agreement. Our management fee compensates our investment adviserAdviser for its work in identifying, evaluating, negotiating, executing and servicing our investments. We generally bear all other expenses of our operations and transactions, including (without limitation) fees and expenses relating to:
•expenses of offering our debt and equity securities;
•the investigation and monitoring of our investments;
•the cost of calculating our net asset value;
•the cost of effecting sales and repurchases of shares of our common stock and other securities;
•management and incentive fees payable pursuant to the investment advisory agreement;Investment Advisory Agreement;
•fees payable to third parties relating to, or associated with, making investments and valuing investments (including third-party valuation firms);
•transfer agent, trustee and custodial fees;
•interest payments and other costs related to our borrowings;
•fees and expenses associated with marketing efforts (including attendance at investment conferences and similar events);
•federal and state registration fees;
•any exchange listing fees;
•federal, state and local taxes;
•independent directors’ fees and expenses;
•brokerage commissions;
•costs of mailing proxy statements, stockholders’ reports and notices;
•costs of preparing government filings, including periodic and current reports with the SEC;
•fidelity bond, liability insurance and other insurance premiums; and
•printing, mailing, independent accountants and outside legal costs and all other direct expenses incurred by either our administrator or us in connection with administering our business, including payments under the administration agreement.Administration Agreement.
Former Investment Advisory Agreement
Prior to October 17, 2017, we were externally managed and advised by Fifth Street Management LLC, which we refer to as our “Former Adviser”. The following is a description of the Former Investment Advisory Agreement, which was terminated on October 17, 2017. The Former Investment Advisory Agreement, dated June 27, 2013, was most recently approved by our Board of Directors on August 7, 2017, and was effective June 27, 2013 through its termination on October 17, 2017.
Management Fee
Through October 17, 2017, we paid our Former Adviser a fee for its services under the Former Investment Advisory Agreement consisting of two components: a base management fee and an incentive fee. The cost of both the base management fee paid to our Former Adviser and any incentive fees earned by our Former Adviser were ultimately borne by our common stockholders.
Base Management Fee
The base management fee was calculated at an annual rate of 1.0% of our gross assets, including any borrowings for investment purposes but excluding cash and cash equivalents. The base management fee was payable quarterly in arrears and the fee for any partial month or quarter was appropriately prorated.
Incentive Fee
The incentive fee paid to our Former Adviser had two parts. The first part was calculated and payable quarterly in arrears based on our pre-incentive fee net investment income for the immediately preceding fiscal quarter. Pre-incentive fee net investment income, expressed as a rate of return on the value of our net assets at the end of the immediately preceding quarter was comparedsubject to a “hurdle rate” of 1.5% per quarter, subject toand a “catch-up” provision measured as of the end of each quarter.provision. Our net investment income used to calculate this part of the incentive fee was also included in the amount of our gross assets used to calculate the 1.0% base management fee. The operation of the incentive fee with respect to our pre-incentive fee net investment income for each quarter was as follows:
There was no accumulation of amounts on the hurdle rate from quarter to quarter and accordingly there was no clawback of amounts previously paid if subsequent quarters were below the quarterly hurdle and there was no delay of payment if prior quarters were below the quarterly hurdle.

The second part of the incentive fee was determined and payable in arrears as of the end of each fiscal year (or upon termination of the Former Investment Advisory Agreement, as of the termination date) commencing on September 30, 2013 and equaled 20% of our realized capital gains, if any, on a cumulative basis from inception through the end of each fiscal year, computed net of all realized capital losses and unrealized capital depreciation on a cumulative basis, less the aggregate amount of any previously paid capital gain incentive fees.
13
Effective October 17, 2017.
Oaktree Administrator will also provideprovides portfolio collection functions for interest income, fees and warrants and is responsible for the financial and other records that we are required to maintain, and prepares, prints and disseminates reports to our stockholders and all other materials filed with the SEC. In addition, Oaktree Administrator will assistassists us in determining and publishing our net asset value, overseeing the preparation and filing of our tax returns, and generally overseeing the payment of our expenses and the performance of administrative and professional services rendered to us by others. Oaktree Administrator may also offer to provide, on our behalf, managerial assistance to our portfolio companies.
For providing these services, facilities and personnel, we will reimburse Oaktree Administrator the allocable portion of overhead and other expenses incurred by Oaktree Administrator in performing its obligations under the New Administration Agreement, including our allocable portion of the rent of the Company’sour principal executive offices (which are located in a building owned by a Brookfield affiliate) at market rates and the Company’sour allocable portion of the costs of compensation and related expenses of our Chief Financial Officer, Chief Compliance Officer, their staffs and other non-investment professionals at Oaktree that perform duties for us. Such reimbursement is at cost, with no profit to, or markup by, Oaktree Administrator.
The New Administration Agreement provides that, absent willful misfeasance, bad faith or gross negligence in the performance of their respective duties or by reason of the reckless disregard of their respective duties and obligations, Oaktree Administrator and its officers, managers, partners, agents, employees, controlling persons, members (or their owners) and any other person or entity affiliated with it, are entitled to indemnification from us for any damages, liabilities, costs and expenses (including reasonable attorneys’ fees and amounts reasonably paid in settlement) arising from the rendering of Oaktree Administrator’s services under the New Administration Agreement or otherwise as our administrator. Unless earlier terminated as described below, the New Administration Agreement will remain in effect until October 17, 2019September 30, 2021 and thereafter from year-to-year if approved annually by our Board of Directors or by the affirmative vote of the holders of a majority of our outstanding voting securities, including, in either case, approval by a majority of our directors who are not interested persons. The New Administration Agreement may be terminated by either party without penalty upon 60 days’ written notice to the other. The New Administration Agreement may also be terminated, without penalty, upon the vote of a majority of our outstanding voting securities.
Former Administration Agreement
Competition
We operate in a highly competitive market for investment opportunities. We compete for investments with various other investors, such as other public and private funds, other Business Development Companies, commercial and investment banks, commercial finance companies and to the extent they provide an alternative form of financing, private equity funds, some of which may be our affiliates. Other Oaktree funds may have investment objectives that overlap with ours, which may create competition for investment opportunities. Many competitors are substantially larger and have considerably greater financial, technical and marketing resources than we do. For example, some competitors may have a lower cost of funds and access to
14
funding sources that will not be available to us. In addition, some of our competitors may have higher risk tolerances or different risk assessments than we do, which could allow them to consider a wider variety of investments and establish more relationships than us. Furthermore, many of our competitors are not subject to the regulatory restrictions that the Investment Company Act and the Code impose on us. The Formercompetitive pressures could impair our business, financial condition and results of operations. As a result of this competition, we may not be able to take advantage of attractive investment opportunities. See “Item 1A. Risk Factors – Risks Relating to Our Business and Structure – We may face increasing competition for investment opportunities, which could reduce returns and result in losses."
Staffing
We do not currently have any employees and do not expect to have any employees. Services necessary for our business are provided through the Administration Agreement provided indemnification similar to that described under "- New Administrative Servicesand the Investment Advisory Agreement."
Our executive officers and directors, and certain members of our Investment Adviser, serve or may serve as officers, directors or principals of entities that operate in the same or a related line of business as we do or of investment funds managed by our affiliates. For example, Oaktree presently serves as the investment adviser to OCSL, a publicly-traded business development company withBusiness Development Company, and Oaktree Strategic Income II, Inc., or OSI II, a portfolioprivate Business Development Company. All of approximately $1.5 billion at fair valueour executive officers serve in substantially similar capacities for OCSL and OSI II, all of our independent directors serve as independent directors of September 30, 2017.OCSL, and one of our independent directors serves as an independent director of OSI II. OCSL has historically invested in senior secured loans, including first lien, unitranche and second lien debt and equityinstruments that pay interest at rates which are determined periodically on the basis of small and mid-sizeda floating base lending rate, made to private middle-market companies primarily in connection with investments by private equity sponsors, including in middle-market leveraged companieswhose debt is rated below investment grade, similar to those we target for investment. In addition, though not the primary focus of its investment portfolio, OCSL’s investmentsOSI II also include floating rate senior loans. Therefore, there may be certain investment opportunities that satisfy the investment criteria for both OCSL and us. OCSL operates as a distinct and separate public company and any investment in our common stock will not be an investment in OCSL. In addition, all of
For example, the personnel of our Investment Adviser may face conflicts of interest in the allocation of investment opportunities to us and such other funds and accounts.
Oaktree has investment allocation guidelines that govern the allocation of investment opportunities among the investment funds and accounts managed or sub-advised by Oaktree and its affiliates. To the extent an investment opportunity is appropriate for us or OCSL, OSI II or any other investment fund or account managed or sub-advised by Oaktree or its affiliates, Oaktree will adhere to its investment allocation guidelines in order to determine a fair and equitable allocation.
We may invest alongside funds and accounts managed or sub-advised by our Investment Adviser and its affiliates in certain circumstances where doing so is consistent with applicable law and SEC staff interpretations. For example, we may invest alongside such accounts consistent with guidance promulgated by the staff of the SEC permitting us and such other accounts to purchase interests in a single class of privately placed securities so long as certain conditions are met, including that our Investment Adviser, acting on our behalf and on behalf of other clients, negotiates no term other than price or terms related to price.
In addition, on October 18, 2017, affiliates of our Investment Adviser received exemptive relief from the SEC to allow certain managed funds and accounts, each of whose investment adviser is OaktreeOCM or an investment adviser controlling, controlled by or under common control with Oaktree,OCM, such as our Adviser, to participate in negotiated co-investment transactions where doing so is consistent with the applicable registered fund’s or business development company’sBusiness Development Company’s investment objective and strategies as well as regulatory requirements and other pertinent factors, and pursuant to the conditions of the exemptive relief. Each potential co-investment opportunity that falls under the terms of the exemptive relief and is appropriate for us and any affiliated fund or account, and satisfies the then-current board-established criteria, will be offered to us and such other eligible funds and accounts. If there is a sufficient amount of securities to satisfy all participants, the securities will be allocated among the participants in accordance with their proposed order size and if there is an insufficient amount of securities to satisfy all participants, the securities will be allocated pro rata based on the investment proposed by the applicable investment adviser to such participant, up to the amount proposed to be invested by each, which is reviewed and approved by an independent committee of legal, compliance and accounting professionals at our Investment Adviser. We, with our Adviser and certain other affiliates, have submitted an application to the SEC for exemptive relief that would modify the terms of our existing exemptive relief to allow proprietary accounts to participate in co-investment transactions subject to certain conditions. We may also invest alongside funds managed by our Adviser and its affiliates in certain circumstances where doing so is consistent with applicable law and SEC staff interpretations. For example, we may invest alongside such accounts consistent with guidance promulgated
15
by the staff of the SEC permitting us and such other accounts to purchase interests in a single class of privately placed securities so long as certain conditions are met, including that our Adviser, acting on our behalf and on behalf of other clients, negotiates no term other than price.
Although Oaktree will endeavor to allocate investment opportunities in a fair and equitable manner, we and our common stockholders could be adversely affected to the extent investment opportunities are allocated among us and other investment vehicles managed or sponsored by, or affiliated with, our executive officers, directors and members of our Investment Adviser. We might not participate in each individual opportunity, but will, on an overall basis, be entitled to participate equitably with other entities managed by Oaktree and its affiliates. Oaktree seeksis committed to treattreating all clients fairly and equitably over time such that none receive preferential treatment vis-à-vis the others over time, in a manner consistent with its fiduciary duty to each of them; however, in some instances, especially in instances of limited liquidity, the factors may not result in pro rata allocations or may result in situations where certain funds or accounts receive allocations where others do not.
Pursuant to the New Investment Advisory Agreement, our Investment Adviser’s liability is limited and we are required to indemnify our Investment Adviser against certain liabilities. This may lead our Investment Adviser to act in a riskier manner in performing its duties and obligations under the New Investment Advisory Agreement than it would if it were acting for its own account, and creates a potential conflict of interest.
Pursuant to the New Administration Agreement, the Oaktree Administrator furnishes us with the facilities, including our principal executive office, and administrative services necessary to conduct our day-to-day operations. We pay the Oaktree Administrator its allocable portion of overhead and other expenses incurred by the Oaktree Administrator in performing its obligations under the New Administration Agreement, including, without limitation, a portion of the rent at market rates and compensation of our Chief Financial Officer, Chief Compliance Officer, their respective staffs and other non-investment professionals at Oaktree that perform duties for us.
We maintainhave elected to be treated, and intend to qualify annually, as a website at www.oaktreestrategicincome.com. The informationRIC for U.S. federal income tax purposes under Subchapter M of the Code. As a RIC, we generally will not be required to pay corporate-level federal income taxes on our website is not incorporated by reference in this annual report on Form 10-K. We make available onany ordinary income or through our website certain reports and amendments to those reportscapital gains that we file withdistribute to our stockholders as dividends. To continue to qualify as a RIC, we must, among other things, meet certain source-of-income and asset diversification requirements (as described below). In addition, to qualify for RIC tax treatment we must distribute to our stockholders, for each taxable year, at least 90% of the Company’s “investment company taxable income” for that year, which is generally its ordinary income plus the excess of its realized net short-term capital gains over its realized net long-term capital losses, or furnishthe Annual Distribution Requirement.
If we:
•qualify as a RIC; and
•satisfy the Annual Distribution Requirement;
then we will not be subject to federal income tax on the portion of our investment company taxable income and net capital gain (i.e., realized net long-term capital gains in excess of realized net short-term capital losses) we distribute to stockholders. We are subject to U.S. federal income tax at the regular corporate rates on any income or capital gain not distributed (or deemed distributed) to our stockholders.
We will be subject to a 4% nondeductible federal excise tax on certain undistributed income unless we distribute in a timely manner an amount at least equal to the SECsum of (1) 98% of our ordinary income for each calendar year, (2) 98.2% of our capital gain net income for the one-year period ending October 31 in accordancethat calendar year and (3) any income realized, but not distributed, and on which we paid no federal income tax, in preceding years.
In order to maintain our qualification as a RIC for federal income tax purposes, we must, among other things:
•at all times during each taxable year, have in effect an election to be treated as a Business Development Company under the Investment Company Act;
•derive in each taxable year at least 90% of our gross income from (a) dividends, interest, payments with respect to certain securities (including loans), gains from the Securities Exchangesale of stock or other securities or currencies, or other income derived with respect to our business of investing in such stock, securities or currencies and (b) net income derived from an interest in a “qualified publicly traded partnership;” (the “90% Gross Income Test”) and
•diversify our holdings so that at the end of each quarter of the taxable year:
16
◦(i) at least 50% of the value of our assets consists of cash, cash equivalents, U.S. government securities, securities of other RICs, and other securities if such other securities of any one issuer do not represent more than 5% of the value of its assets or more than 10% of the outstanding voting securities of the issuer; and
◦(ii) no more than 25% of the value of our assets is invested in (a) the securities, other than U.S. government securities or securities of other RICs, of one issuer, (b) the securities of two or more issuers that are controlled, as determined under applicable tax rules, by us and that are engaged in the same or similar or related trades or businesses or (c) the securities of one or more “qualified publicly traded partnerships” ((i) and (ii) collectively, the “Diversification Tests”).
We may be required to recognize taxable income in circumstances in which we do not receive cash. For example, if we hold debt obligations that are treated under applicable tax rules as having OID (such as debt instruments with increasing interest rates or debt instruments issued with warrants), we must include in income each year a portion of the OID that accrues over the life of the obligation, regardless of whether cash representing such income is received by us in the same taxable year. Because any OID accrued will be included in our investment company taxable income for the year of accrual, we may be required to make a distribution to our stockholders in order to satisfy the Annual Distribution Requirement, even though we will not have received any corresponding cash amount.
Because we use debt financing, we are subject to certain asset coverage ratio requirements under the Investment Company Act described above and financial covenants under loan and credit agreements that could, under certain circumstances, restrict us from making distributions necessary to satisfy the Annual Distribution Requirement. If we are unable to obtain cash from other sources or are otherwise limited in our ability to make distributions, we could fail to qualify for RIC tax treatment and thus become subject to corporate-level income tax.
Certain of 1934,our investment practices may be subject to special and complex U.S. federal income tax provisions that may, among other things: (a) disallow, suspend or otherwise limit the allowance of certain losses or deductions; (b) convert lower taxed long-term capital gain into higher taxed short-term capital gain or ordinary income; (c) convert an ordinary loss or a deduction into a capital loss (the deductibility of which is more limited); (d) cause us to recognize income or gain without a corresponding receipt of cash; (e) adversely affect the time as amended,to when a purchase or sale of securities is deemed to occur; (f) adversely alter the Exchange Act. These includecharacterization of certain complex financial transactions; or (g) produce income that will not be qualifying income for purposes of the 90% gross income test described above. We will monitor our annual reports on Form 10-K,transactions and may make certain tax elections in order to mitigate the potential adverse effect of these provisions.
If, in any particular taxable year, we do not qualify as a RIC, all of our quarterly reports on Form 10-Qtaxable income (including our net capital gains) will be subject to tax at regular corporate rates without any deduction for distributions to stockholders, and distributions will be taxable to the stockholders as ordinary dividends to the extent of our current reports
Business Development Company Regulations
We have elected to be regulated as a business development companyBusiness Development Company under the 1940Investment Company Act. As with other companies regulated by the Investment Company Act, a Business Development Company must adhere to certain substantive regulatory requirements. The 1940Investment Company Act contains prohibitions and restrictions relating to transactions between business development companiesBusiness Development Companies and their affiliates (including any investment advisers), principal underwriters and affiliates of those affiliates or underwriters.
The 1940Investment Company Act further requires that a majority of our directors be persons other than “interested persons,” as that term is defined in the 1940Investment Company Act. In addition, the 1940 Act provides that we may not change the nature of our business so as to cease to be, or to withdraw our election as, a business development companyBusiness Development Company unless approvedauthorized by a majorityvote of our outstanding voting securities.
We are not generally able to issue and sell our common stock at a price below net asset value per share. We may, invest uphowever, sell our common stock, warrants, options or rights to 100%acquire our common stock, at a price below the current net asset value of our assets in securities acquired directly from issuers in privately negotiated transactions. With respect to such securities, we may, for the purpose of public resale, be deemed an “underwriter” as that term is defined in the Securities Act of 1933, as amended, or the Securities Act. Our intention is to not write (sell) or buy put or call options to manage risks associated with the publicly traded securities of our portfolio companies, except that we may enter into hedging transactions to manage the risks associated with interest rate and foreign exchange fluctuations. However, we may purchase or otherwise receive warrants to purchase the common stock if our Board of Directors determines that such sale is in our best interests and that of our portfolio companiesstockholders, and our stockholders approve such sale. In any such case, the price at which our securities are to be issued and sold may not be less than a price which, in connection with acquisition financing or other investments. Similarly, in connection with an acquisition, we may acquire rights to require the issuersdetermination of acquired securities or their affiliates to repurchaseour Board of Directors, closely approximates the market value
17
of such securities under certain circumstances.(less any distributing commission or discount). We may also make rights offerings to our stockholders at prices per share less than the net asset value per share, subject to applicable requirements of the Investment Company Act.
Investment Restrictions
We do not intend to acquire securities issued by any investment company that exceed the limits imposed by the 1940Investment Company Act. Under thesesuch limits, except for registered money market funds, we generally cannot acquire more than three percent3% of the voting stock of any registered investment company, invest more than five percent5% of the value of our total assets in the securities of one registered investment company or invest more than 10% of the value of our total assets in the securities of registered investment companies. With regard to thatcompanies in the aggregate. The portion of our portfolio invested in securities issued by investment companies it should be noted that such investments mightordinarily will subject our stockholders to additional indirect expenses. None of thesethe policies described above is fundamental and alleach such policy may be changed without stockholder approval.approval, subject to any limitations imposed by the Investment Company Act.
Qualifying Assets
Under the 1940Investment Company Act, a business development companyBusiness Development Company may not acquire any asset other than assets of the type listed in Section 55(a) of the 1940Investment Company Act, which are referred to as qualifying assets, unless, at the time the acquisition is made, qualifying assets represent at least 70% of the company’s total assets. The principal categories of qualifying assets relevant to our business are any of the following:
(1) Securities purchased in transactions not involving any public offering from the issuer of such securities, which issuer (subject to certain limited exceptions) is an eligible portfolio company, or from any person who is, or has been during the preceding 13 months, an affiliated person of an eligible portfolio company, or from any other person, subject to such rules as may be prescribed by the SEC. An eligible portfolio company is defined in the 1940Investment Company Act as any issuer which:
(a) is organized under the laws of, and has its principal place of business in, the United States;
(b) is not an investment company (other than a small business investment company wholly owned by the business development company)Business Development Company) or a company that would be an investment company but for certain exclusions under the 1940Investment Company Act; and
(c) satisfies any of the following:
(i) does not have any class of securities that is traded on a national securities exchange;
(ii) has a class of securities listed on a national securities exchange, but has an aggregate market value of outstanding voting and non-voting common equity of less than $250 million;
(iii) is controlled by a business development companyBusiness Development Company or a group of companies including a business development companyBusiness Development Company and the business development companyBusiness Development Company has an affiliated person who is a director of the eligible portfolio company; or
(iv) is a small and solvent company having total assets of not more than $4 million and capital and surplus of not less than $2 million;
(2) Securities of any eligible portfolio company that we control;
(3) Securities purchased in a private transaction from a U.S. issuer that is not an investment company or from an affiliated person of the issuer, or in transactions incident thereto, if the issuer is in bankruptcy and subject to reorganization or if the issuer, immediately prior to the purchase of its securities was unable to meet its obligations as they came due without material assistance other than conventional lending or financing arrangements;
(4) Securities of an eligible portfolio company purchased from any person in a private transaction if there is no ready market for such securities and we already own 60% of the outstanding equity of the eligible portfolio company;
(5) Securities received in exchange for or distributed on or with respect to securities described in (1) through (4) above, or pursuant to the exercise of warrants or rights relating to such securities; or
(6) Cash, cash equivalents, U.S. government securities or high-quality debt securities maturing in one year or less from the time of investment.
18
Managerial Assistance to Portfolio Companies
A Business Development Company must be operated for the purpose of making investments in the types of securities described in (1), (2) or (3) above. However, in order to count portfolio securities as qualifying assets for the purpose of the 70% test, a Business Development Company must either control the issuer of the securities or must offer to make available to the issuer of the securities (other than small and solvent companies described above) significant managerial assistance. However, when a Business Development Company purchases securities in conjunction with one or more other persons acting together, one of the other persons in the group may make available such managerial assistance. Making available managerial assistance includes any arrangement whereby a Business Development Company, through its directors, officers or employees, offers to provide, and, if accepted, does so provide, significant guidance and counsel concerning the management, operations or business objectives and policies of a portfolio company.
Temporary Investments
Pending investment in other types of “qualifying"qualifying assets,”" as described above, our investments may consist of cash, cash equivalents, U.S. government securities or high-quality debt securities maturing in one year or less from the time of investment which we refer to, collectively, as temporary investments,(collectively, “temporary investments”) so that 70% of our assets are qualifying assets. We may also invest in U.S. Treasury bills or in repurchase agreements, provided that such agreements are fully collateralized by cash or securities issued by the U.S. government or its agencies. A repurchase agreement (which is substantially similar to a secured loan) involves the purchase by an investor, such as us,the Company, of a specified security and the simultaneous agreement by the seller to repurchase it at an agreed-upon future date and at a price thatwhich is greater than the purchase price by an amount that reflects an agreed-upon interest rate. There is no percentage restriction on the proportion of our assets that may be invested in such repurchase agreements. However, if more than 25% of our totalgross assets constitute repurchase agreements from a single counterparty, we would generally not meet the diversification tests in order to qualify as a RIC for U.S. federal income tax purposes.Diversification Tests. Thus, we do not intend to enter into repurchase agreements with a single counterparty in excess of this limit. Our Investment Adviser will monitor the creditworthiness of the counterparties with which we enter into repurchase agreement transactions.
Consistent with applicable legal and if accepted, does so provide, significant guidance and counsel concerning the management, operations or business objectives and policies of a portfolio company.
We are not generally ablesubject to issueperiodic examination by the SEC for compliance with the Investment Company Act.
We are required to provide and sellmaintain a bond issued by a reputable fidelity insurance company to protect us against larceny and embezzlement. Furthermore, as a Business Development Company, we are prohibited from protecting any director or officer against any liability to us or our common stock at a price below net asset value per share. We may, however, sell our common stock, warrants, optionsstockholders arising from willful misfeasance, bad faith, gross negligence or rights to acquire our common stock, at a price below the current net asset valuereckless disregard of the common stock if our Boardduties involved in the conduct of Directors determines that such sale is in our best interests and that of our stockholders,person’s office.
We and our stockholders approve such sale. In any such case,Adviser are each required to adopt and implement written policies and procedures reasonably designed to prevent violation of the price at which ourU.S. federal securities arelaws, review these policies and procedures annually for their adequacy and the effectiveness of their implementation, and designate a Chief Compliance Officer to be issuedresponsible for administering the policies and sold may not be less than a price which, in the determination of our Board of Directors, closely approximates the market value of such securities (less any distributing commission or discount). We may also make rights offerings to our stockholders at prices per share less than the net asset value per share, subject to applicable requirements of the 1940 Act. See “Risk Factors — Risks Relating to Our Business and Structure — Regulations governing our operation as a business development company and RIC affect our ability to raise, and the way in which we raise, additional capital or borrow for investment purposes, which may have a negative effect on our growth.”procedures.
Code of Ethics
We have adopted a joint code of ethics with OCSL pursuant to Rule 17j-1 under the 1940Investment Company Act and we have also approved the investment adviser’sOaktree’s code of ethics that was adopted by it under Rule 17j-1 under the 1940Investment Company Act and Rule 204A-1 under the Advisers Act. These codes establish procedures for personal investments and restrict certain personal
19
securities transactions. Personnel subject to the code may invest in securities for their personal investment accounts, including securities that may be purchased or held by us, so long as such investments are made in accordance with the code’s requirements. You may read and copy the codes of ethics at the SEC’s Public Reference Room located at 100 F Street, NE, Washington, DC 20549. You may obtain information on the operation of the Public Reference Room by calling the SEC at 1-800-SEC-0330. In addition, the codes of ethics are available on the EDGAR Database on the SEC’s website at http://www.sec.gov and are available at the Investors: Corporate Governance portion of our website at www.oaktreestrategicincome.com.
Proxy Voting Policies and Procedures
We have delegated our proxy voting responsibility to our Investment Adviser. The proxy voting policies and procedures of our investment adviserAdviser are set forth below. TheThese guidelines are reviewed periodically by our Investment Adviser and our non-interestedindependent directors, and, accordingly, are subject to change.
These policies and procedures for voting proxies for the investment advisory clients of our Investment Adviser are intended to comply with Section 206 of, and Rule 206(4)-6 under, the Advisers Act.
Our Investment Adviser will vote proxies relating to our portfolio securities, if any, in what it perceives to be the best interest of our stockholders. ItOur Adviser will review on a case-by-case basis each proposal submitted forto a stockholdershareholder vote to determine its impact on the portfolio securities held by us. TheAlthough our Adviser will generally vote against proposals that may have a negative impact on our portfolio securities, it may vote for such a proposal if there are compelling long-term reasons to do so.
Our Adviser’s proxy voting decisions of our Investment Adviser with respect to any of our investments arewill be made by the investment professionalsofficers who are responsible for monitoring such investment.each of our investments. To ensure that itsthe vote is not the product of a conflict of interest, our Investment Adviser requireswill require that: (a)(1) anyone involved in the decision-making process disclose to its legal and compliance personnelthe Chief Compliance Officer any potential conflict that he or she is aware of and any contact that he or she has had with any interested party regarding a proxy vote; and (b)(2) employees involved in the decision makingdecision-making process or vote administration are prohibited from revealing how our Investment Adviser intends to vote on a proposal, in order to reduce any attempted influence from interested parties.
We are subjectfile annual reports containing audited financial statements, quarterly reports, and such other periodic reports as we determine to periodic examinationbe appropriate or as may be required by the SEC for compliance with the 1940 Act.
law. We are required to providecomply with all periodic reporting, proxy solicitation and maintain a bond issued by a reputable fidelity insurance company to protect us against larceny and embezzlement. Furthermore, as a business development company, we are prohibited from protecting any director or officer against any liability to us or our stockholders arising from willful misfeasance, bad faith, gross negligence or reckless disregard ofother applicable requirements under the duties involved in the conduct of such person’s office.
Securities Exchange Act of 1934, as amended, or the Exchange Act.
We make available on or through our website certain reports and amendments to those reports that we file with or furnish to the SEC in accordance with the Exchange Act. These include our annual reports on Form 10-K, our quarterly reports on Form 10-Q and our current reports on Form 8-K. We make this information available on our website free of charge as soon as reasonably practicable after we electronically file the information with, or furnish it to, the SEC. The SEC also maintains a website that contains reports, proxy and information statements and other information we file with the SEC at www.sec.gov.
We maintain a website at www.oaktreestrategicincome.com. The information on our website is not incorporated by reference in this annual report on Form 10-K.
Sarbanes-Oxley Act Compliance
We are subject to the reporting and disclosure requirements of the Exchange Act, including the filing of quarterly, annual and current reports, proxy statements and other required items. In addition, we are subject to the Sarbanes-Oxley Act of 2002, or the Sarbanes-Oxley Act, which imposes a wide variety of regulatory requirements on publicly-heldpublic companies and their insiders. For example:
•pursuant to Rule 13a-14 under the Exchange Act, our chief executive officer and chief financial officer are required to certify the accuracy of the financial statements contained in our periodic reports;
•pursuant to Item 307 of Regulation S-K, our periodic reports are required to disclose our conclusions about the effectiveness of our disclosure controls and procedures; and
20
•pursuant to Rule 13a-15 under the Exchange Act, our management is required to prepare a report regarding its assessment of our internal control over financial reporting. Our independent registered public accounting firm is required to audit our internal control over financial reporting. WhenIf we are no longerbecome an emerging growth company"accelerated filer" as defined in the rules promulgated under the JOBSExchange Act, our independent registered public accounting firm will be required to audit our internal control over financial reporting.
The Sarbanes-Oxley Act requires us to review our current policies and procedures to determine whether we comply with the Sarbanes-Oxley Act and the regulations promulgated thereunder. We will remain an “emerging growth company,” as definedcontinue to monitor compliance with all regulations that are adopted under the Sarbanes-Oxley Act and will take actions necessary to ensure that we are in the JOBS Act until the earliest of:compliance therewith.
Stock Exchange Corporate Governance Regulations
The NASDAQNasdaq Global Select Market has adopted corporate governance regulations that listed companies must comply with. We are in compliance with such corporate governance regulations as applicable to business development companies.us.
Item 1A. Risk Factors
Investing in our securities involves a number of significant risks. In addition to the other information contained in this annual report on Form 10-K, you should consider carefully the following information before making an investment in our securities. The risks set out below are not the only risks we or other business development companies face. Additional risks and uncertainties not presently known to us or not presently deemed material by us might also impair our operations and performance. If any of the following events occur, our business, financial condition and results of operations could be materially and adversely affected. In such case, our net asset value and the trading price of our securities could decline, and you may lose part or all of your investment. This section also describesThe risk factors described below are the specialprincipal risk factors associated with an investment in us as well as those factors generally associated with an investment company with investment objectives, investment policies, capital structure or trading markets similar to ours.
An investment in our securities involves risks. The following is a summary of the principal risks that you should carefully consider before investing in our securities.
•As a result of the COVID-19 pandemic and related government actions, certain of our portfolio companies are distressed, and we have opportunistically acquired the securities and obligations of distressed companies. These and future investments in distressed companies are subject to significant risks, including lack of income, extraordinary expenses, uncertainty with respect to satisfaction of debt, lower-than-expected investment values or income potentials and resale restrictions.
•Global economic, political and market conditions, including those caused by the current public health crisis, have (and in the future, could further) adversely affect our business, results of operations and financial condition and those of our portfolio companies.
•Changes in interest rates, changes in the method for determining LIBOR and the potential replacement of LIBOR may affect our cost of capital and net investment income.
•A significant portion of our investment portfolio is and will continue to be recorded at fair value as determined in good faith by our Board of Directors and, as a result, there is and will continue to be uncertainty as to the value of our portfolio investments.
•Our ability to achieve our investment objective depends on our Adviser’s ability to support our investment process; if our Adviser were to lose key personnel or they were to resign, our ability to achieve our investment objective could be significantly harmed.
•Because we borrow money, the potential for loss on amounts invested in us will be magnified and may increase the risk of investing in business developmentus.
•There are significant potential conflicts of interest that could adversely impact our investment returns.
•Regulations governing our operation as a Business Development Company and RIC affect our ability to raise, and the way in which we raise, additional capital or borrow for investment purposes, which may have a negative effect on our growth.
•Our investments in portfolio companies may be risky, and we could lose all or parts of our investments.
•Shares of closed-end investment companies, including Business Development Companies, may trade at a discount to their net asset value.
•The market price of our common stock may fluctuate significantly.
•There are risks related to the risks associated with investing in a portfolio of small and developingMergers that could adversely affect us or financially troubled businesses.our stockholders.
21
•Economic recessions or downturns may have a material adverse effect on our business, financial condition and results of operations, and could impair the ability of our portfolio companies to repay debt or pay interest.
Global economic, political and market conditions caused by the current public health crisis have (and in a prolonged period of market illiquidity whichthe future, could have a material adverse effect onfurther) adversely affect our business, results of operations and financial condition and resultsthose of operations. Unfavorableour portfolio companies.
A novel strain of coronavirus initially appeared in China in late 2019 and rapidly spread to other countries, including the United States. In an attempt to slow the spread of the coronavirus, governments around the world, including the United States, placed restrictions on travel, issued “stay at home” orders and ordered the temporary closure of certain businesses, such as factories and retail stores. Such restrictions and closures impacted supply chains, consumer demand and/or the operations of many businesses. As jurisdictions around the United States and the world continue to experience surges in cases of COVID-19 and governments consider pausing the lifting of or re-imposing restrictions, there is considerable uncertainty surrounding the full economic impact of the coronavirus pandemic and the long-term effects on the U.S. and global financial markets.
Any disruptions in the capital markets, as a result of the COVID-19 pandemic or otherwise, may increase the spread between the yields realized on risk-free and higher risk securities and can result in illiquidity in parts of the capital markets, significant write-offs in the financial sector and re-pricing of credit risk in the broadly syndicated market. These and any other unfavorable economic conditions also could increase our funding costs, limit our access to the capital markets or result in a decision by lenders not to extend credit to us. TheseDuring the spring of 2020, the occurrence of these events negatively impacted the fair value of the investments that we held and, if they were to occur again in the future, could limit our investment originations (including as a result of the investment professionals of our Adviser diverting their time to the restructuring of certain investments), negatively impact our operating results and limit our ability to grow and negatively impact our operating results.grow. In addition, uncertainty with regardour success depends in substantial part on the management, skill and acumen of our Adviser, whose operations may be adversely impacted, including through quarantine measures and travel restrictions imposed on its investment professionals or service providers, or any related health issues of such investment professionals or service providers.
In addition, the restrictions and closures and related market conditions resulted in, and if re-imposed in the future, could further result in certain of our portfolio companies halting or significantly curtailing operations and negative impacts to economic recovery from recessions or downturns could also have a negative impact onthe supply chains of certain of our business, financial condition and results of operations.
As the potential impact of the U.S. credit rating, may adverselycoronavirus remains difficult to predict, the extent to which the coronavirus could negatively affect our and our portfolio companies’ operating results or the duration or reoccurrence of any potential business or supply-chain disruption is uncertain. Any potential impact to our results of operations will depend to a large extent on future developments regarding the duration and financial condition, including our revenue growthseverity of the coronavirus and profitability.
As a result of the COVID-19 pandemic and related government actions, certain of our portfolio companies are distressed, and we have negative long-term effects foropportunistically acquired the economiessecurities and obligations of those countriesdistressed companies. These and other EU countries. There is continued concern about national-level support for the Eurofuture investments in distressed companies are subject to significant risks, including lack of income, extraordinary expenses, uncertainty with respect to satisfaction of debt, lower-than-expected investment values or income potentials and the accompanying coordination of fiscalresale restrictions.
We have acquired, and wage policy among European Economic and Monetary Union member countries. In addition, the fiscal policy of foreign nations, such as Russia and China, may have a severe impact on the worldwide and U.S. financial markets. The decision made in the United Kingdom referendum to leave the EU (the so-called "Brexit") has led to volatility in global financial markets and may lead to weakening in consumer, corporate and financial confidence in the United Kingdom and Europe. The extent and process by which the United Kingdom will exit the EU remain unclear at this time and could lead to political and economic uncertainty and periods of exacerbated volatility in both the United Kingdom and in wider European markets. Additionally, volatility in the Chinese stock markets and global markets for commodities may affect other financial markets worldwide. We cannot predict the effects of these or similar events in the future onacquire, the U.S.securities and global economiesother obligations of distressed or bankrupt companies, including opportunistic acquisitions during the COVID-19 pandemic. At times, distressed debt obligations may not produce income and may require us to bear certain extraordinary expenses (including legal, accounting, valuation and transaction
22
expenses) in order to protect and recover our investment. Therefore, when we invest in distressed debt, our ability to achieve current income for our stockholders may be diminished, particularly where the portfolio company has negative EBITDA.
We also are subject to significant uncertainty as to when and in what manner and for what value the distressed debt we acquire will eventually be satisfied whether through a refinancing, restructuring, liquidation, an exchange offer or plan of reorganization involving the distressed debt securities markets or on our investments. We monitor developments and seeka payment of some amount in satisfaction of the obligation. In addition, even if an exchange offer is made or plan of reorganization is adopted with respect to manage our investments in a manner consistent with achieving our investment objective, butdistressed debt held by us, there can be no assurance that the securities or other assets received by us in connection with such exchange offer or plan of reorganization will not have a lower value or income potential than may have been anticipated when the investment was made.
Moreover, any securities received by us upon completion of an exchange offer or plan of reorganization may be restricted as to resale. As a result of our participation in negotiations with respect to any exchange offer or plan of reorganization with respect to an issuer of distressed debt, we willmay be successful in doing so.restricted from disposing of such securities.
Risks Relating to Our Business and Structure
Changes in interest rates, changes in the method for determining LIBOR and the potential replacement of LIBOR may affect our cost of capital and net investment income.
General interest rate fluctuations and changes in credit spreads on floating rate loans may have a substantial negative impact on our investments and investment opportunities and, accordingly, may have a material adverse effect on our rate of return on invested capital, our net investment income, our net asset value and the market price of our common stock. The majority of our debt investments have, and are expected to have, variable interest rates that reset periodically based on benchmarks such as the London Interbank Offered Rate, or LIBOR, or the federal funds rate or prime rate, so anrate. An increase in interest rates may make it more difficult for our portfolio companies to service their obligations under the debt investments that we will hold and increase defaults even where our investment income increases. In addition, any increase inRising interest rates would make it more expensivecould also cause borrowers to use debtshift cash from other productive uses to finance our investments.the payment of interest, which may have a material adverse effect on their business and operations and could, over time, lead to increased defaults. Additionally, as interest rates increase and the corresponding risk of a default by borrowers increases, the liquidity of higher interest rate loans may decrease as fewer investors may be willing to purchase such loans in the secondary market in light of the increased risk of a default by the borrower and the heightened risk of a loss of an investment in such loans. Decreases in credit spreads on debt that pays a floating rate of return would have an impact on the income generation of our floating rate assets. Trading prices for debt that pays a fixed rate of return tend to fall as interest rates rise. Trading prices tend to fluctuate more for fixed rate securities that have longer maturities.
Conversely, if interest rates decline, borrowers may refinance their loans at lower interest rates, which could shorten the average life of the loans and reduce the associated returns on the investment, as well as require our Adviser and the Investment Professionals to incur management time and expense to re-deploy such proceeds, including on terms that may not be as favorable as our existing loans.
In addition, because we borrow to fund our investments, a portion of our net investment income is dependent upon the difference between the interest rate at which we borrow funds and the interest rate at which we invest these funds. Portions of our investment portfolio and our borrowings have floating rate components. As a result, a significant change in market interest rates could have a material adverse effect on our net investment income. In periods of rising interest rates, our cost of funds could increase, which would reduce our net investment income. We may hedge against interest rate fluctuations by using standard hedging instruments such as interest rate swap agreements, futures, options and forward contracts, subject to applicable legal requirements, including all necessary registrations (or exemptions from registration) with the Commodity Futures Trading Commission. These activities may limit our ability to participate in the benefits of lower interest rates with respect to the hedged borrowings. Adverse developments resulting from changes in interest rates or hedging transactions could have a material adverse effect on our business, financial condition and results of operations.
As a result of concerns about the accuracy of the calculation of LIBOR, a number of British Bankers’ Association, or BBA, member banks entered into settlements with certain regulators and law enforcement agencies with respect to the alleged manipulation of LIBOR. Actions by the BBA, regulators or law enforcement agencies as a result of these or future events, may result in changes to the manner in which LIBOR is determined.determined (to the extent it continues beyond 2021). Potential changes, or uncertainty related to such potential changes may adversely affect the market for LIBOR-based securities, including our portfolio of LIBOR-indexed, floating-rate debt securities and our borrowings. In addition, changes or reforms to the determination or supervision of LIBOR may result in a sudden or prolonged increase or decrease in reported LIBOR, which could have an adverse impact on the market for LIBOR-based securities or the value of our portfolio of LIBOR-indexed, floating-rate debt securities and our borrowings.
In July 2017, the head of the United Kingdom Financial Conduct Authority announced the desire to phase out the use of LIBOR by the end of 2021. ThereThe U.S. Federal Reserve, in conjunction with the Alternative Reference Rates Committee, a steering committee comprised of large U.S. financial institutions, is currently no definitive informationconsidering replacing U.S.-dollar LIBOR with the Secured Overnight Financing Rate, or SOFR, a new index calculated by short-term repurchase agreements, backed by Treasury
23
securities. Although there have been a few issuances utilizing SOFR or the Sterling Over Night Index Average, an alternative reference rate that is based on transactions, it is unknown whether these alternative reference rates will attain market acceptance as replacements for LIBOR. Any transition away from LIBOR to alternative reference rates is complex and could have a material adverse effect on our business, financial condition and results of operations, including as a result of any changes in the pricing of our investments, changes to the documentation for certain of our investments and the pace of such changes, disputes and other actions regarding the future utilizationinterpretation of current and prospective loan documentation or modifications to processes and systems.
It remains unclear whether the cessation of LIBOR will be delayed due to COVID-19 or what form any delay may take, and there are no assurances that there will be a delay. It is also unclear what the duration and severity of COVID-19 will be, and whether this will impact LIBOR transition planning. COVID-19 may also slow regulators’ and others’ efforts to develop and implement alternative reference rates, which could make LIBOR transition planning more difficult, particularly if the cessation of LIBOR is not delayed but an alternative reference rate does not emerge as industry standard. In anticipation of the cessation of LIBOR, we may need to renegotiate our credit facilities and any particular replacement rate. Ascredit agreements extending beyond 2021 with our prospective portfolio companies that utilize LIBOR as a factor in determining the interest rate or rely on certain fallback provision that cause the interest rate to shift to the base rate plus a margin. Any such the potentialrenegotiations may have a material adverse effect of any such event on our costbusiness, financial condition and results of capital and net investment income cannot yet be determined.operations, including as a result of changes in interest rates payable to us by our portfolio companies or payable by us under our credit facilities.
A general increase in interest rates will likely have the effect of increasing our net investment income, which would make it easier for our Investment Adviser to receive incentive fees.
Any general increase in interest rates would likely have the effect of increasing the interest rate that we receive on many of our debt investments. Accordingly, a general increase in interest rates may make it easier for our Investment Adviser to meet the quarterly hurdle rate for payment of income incentive fees under the New Investment Advisory Agreement and may result in a substantial increase in the amount of the income-based incentive fee on income payable to our New Investment Adviser.
A significant portion of our investment portfolio is and will continue to be recorded at fair value as determined in good faith by our Board of Directors and, as a result, there is and will continue to be uncertainty as to the value of our portfolio investments.
Under the 1940Investment Company Act, we are required to carry our portfolio investments at market value or, if there is no readily available market value, at fair value as determined in good faith by our Board of Directors. Typically, there is not a public market for the securities of the privately held companies in which we have invested and will generally continue to invest. As a result, we value these securities quarterly at fair value as determined in good faith by our Board of Directors. The fair value of such securities may change, potentially materially, between the date of the fair value determination by our Board of Directors and the release of the financial results for the corresponding period or the next date at which fair value is determined.
Certain factors that may be considered in determining the fair value of our investments include the nature and realizable value of any collateral, the portfolio company’s earnings and its ability to make payments on its indebtedness, the markets in which the portfolio company does business, comparison to comparable publicly-traded companies, discounted cash flow and
other relevant factors. Because such valuations, and particularly valuations of private securities and private companies, are inherently uncertain, may fluctuate over short periods of time and may be based on estimates, our determinations of fair value may differ materially from the values that would have been used if a ready market for these securities existed. In addition, any investments that include OID or PIK interest may have unreliable valuations because their continuing accruals require ongoing judgments about the collectability of their deferred payments and the value of their underlying collateral. Due to these uncertainties, our fair value determinations may cause our net asset value on a given date to materially understate or overstate the value that we may ultimately realize upon the sale of one or more of our investments. As a result, investors purchasing our common stock based on an overstated net asset value would pay a higher price than the realizable value of our investments might warrant.
In addition, the participation of the Investment Professionals in the valuation process, and the indirect pecuniary interest of John B. Frank, an interested member of our Board of Directors, in the Adviser could result in a conflict of interest as the management fee payable to our Adviser is based on our gross assets and the incentive fees earned by the Adviser will be based, in part, on unrealized gains and losses.
Our ability to achieve our investment objective depends on our Investment Adviser’s ability to support our investment process; if our Investment Adviser were to lose any of its key personnel or they were to resign, our ability to achieve our investment objective could be significantly harmed.
We depend on the investment expertise, skill and network of business contacts of the senior personnel of our Investment Adviser. Our Investment Adviser evaluates, negotiates, structures, executes, monitors and services our investments. Key personnel of our Investment Adviser have departed in the past and current key personnel could depart at any time. Our Investment Adviser’s capabilities in structuring the
24
investment process, providing competent, attentive and efficient services to us, and facilitating access to financing on acceptable terms depend on the employment of investment professionals in adequate number and of adequate sophistication to match the corresponding flow of transactions. The departure of key personnel or of a significant number of the investment professionals or partners of our Investment Adviser could have a material adverse effect on our ability to achieve our investment objective. Our Investment Adviser may need to hire, train, supervise and manage new investment professionals to participate in our investment selection and monitoring process and may not be able to find investment professionals in a timely manner or at all.
In addition, our Adviser may resign on 60 days’ notice. If we are unable to quickly find a new investment adviser or hire internal management with similar expertise and ability to provide the same or equivalent services on acceptable terms, our operations are likely to experience a disruption and our ability to achieve our investment objective and pay distributions would likely be materially and adversely affected.
Our business model depends to a significant extent upon strong referral relationships, and the inability of the personnel associated with our Investment Adviser to maintain or develop these relationships, or the failure of these relationships to generate investment opportunities, could adversely affect our business.
We expect that personnel associated with our Investment Adviser will maintain and develop their relationships with intermediaries, banks and other sources, and we will rely to a significant extent upon these relationships to provide us with potential investment opportunities. If these individuals fail to maintain their existing relationships or develop new relationships with other sources of investment opportunities, we may not be able to grow or maintain our investment portfolio. In addition, individuals with whom the personnel associated with our Investment Adviser have relationships are not obligated to provide us with investment opportunities, and, therefore, there is no assurance that such relationships will generate investment opportunities for us. The failure of the personnel associated with our Investment Adviser to maintain existing relationships, grow new relationships, or for those relationships to generate investment opportunities could have an adverse effect on our business, financial condition and results of operations.
We may face increasing competition for investment opportunities, which could reduce returns and result in losses.
We compete for investments with other business development companies,Business Development Companies, public and private funds (including hedge funds, mezzanine funds and collateralized loan obligations)CLOs) and private equity funds (to the extent they provide an alternative form of financing), as well as traditional financial services companies such as commercial and investment banks, commercial financing companies and other sources of financing. Many of our competitors are substantially larger and have considerably greater financial, technical and marketing resources than we do. For example, some competitors may have a lower cost of capital and access to funding sources that are not available to us. In addition, some of our competitors may have higher risk tolerances or different risk assessments than we have. These characteristics could allow our competitors to consider a wider variety of investments, establish more relationships and offer better pricing and more flexible structuring than we are able to do. We may lose investment opportunities if we do not match our competitors’ pricing, terms and structure. If we are forced to match our competitors’ pricing, terms and structure, we may not be able to achieve acceptable returns on our investments or may bear substantial risk of capital loss. A significant increase in the number and/or the size of our competitors in this target market could force us to accept less attractive investment terms. Furthermore, many of our competitors are not subject to, the regulatory restrictions that the 1940Investment Company Act imposes on us as a business development company.
The incentive fee we pay to our Investment Adviser relating to capital gains may be effectively greater than 17.5%.
| Assumed Return on Portfolio (Net of Expenses) | - 10% | - 5% | 0% | 5% | 10% | ||||||||||
| Corresponding net return to common stockholder | -23.82% | -13.46% | -3.10% | 7.27% | 17.63% | ||||||||||
Our ability to enter into transactions with our affiliates is restricted.
We are prohibited under the 1940Investment Company Act from participating in certain transactions with certain of our affiliates without the prior approval of the members of our independent directors and, in some cases, the SEC. Any person that owns, directly or indirectly, 5% or more of our outstanding voting securities is our affiliate for purposes of the 1940Investment Company Act, and we are generally prohibited from buying or selling any securities (other than our securities) from or to such affiliate, absent the prior approval of our independent directors. The 1940Investment Company Act also prohibits certain “joint” transactions with certain of our affiliates, which could include investments in the same portfolio company (whether at the same or different times), without prior approval of our independent directors and, in some cases, the SEC. If a person acquires more than 25% of our voting securities, we will be prohibited from buying or selling any security (other than any security of which we are the
25
issuer) from or to such person or certain of that person’s affiliates, or entering into prohibited joint transactions with such person, absent the prior approval of the SEC. Similar restrictions limit our ability to transact business with our officers or directors or their affiliates. As a result of these restrictions, except in situations described below, we may be prohibited from buying or selling any security (other than any security of which we are the issuer) from or to any portfolio company of a private equity fund managed by our Investment Adviser without the prior approval of the SEC, which may limit the scope of investment opportunities that would otherwise be available to us.
A failure on our part to maintain our qualification as a business development companyBusiness Development Company would significantly reduce our operating flexibility.
If we fail to continuously qualify as a business development company,Business Development Company, we might be subject to regulation as a registered closed-end investment company under the 1940Investment Company Act, which would significantly decrease our operating flexibility. In addition, failure to comply with the requirements imposed on business development companiesBusiness Development Companies by the 1940Investment Company Act could cause the SEC to bring an enforcement action against us. See “ -Business Development Company Regulations.”
Regulations governing our operation as a business development companyBusiness Development Company and RIC affect our ability to raise, and the way in which we raise, additional capital or borrow for investment purposes, which may have a negative effect on our growth.
In order to qualify for the tax benefits available to RICs and to minimize corporate-level U.S. federal income taxes, we intend to distribute to our stockholders at least 90% of our taxable income each taxable year, except that we may retain certain net capital gains for investment, and treat such amounts as deemed distributions to our stockholders. If we elect to treat any amounts as deemed distributions, we would be subject to income taxes at the corporate rate on such deemed distributions on behalf of our stockholders.
As a business development company,Business Development Company, we are required to invest at least 70% of our total assets primarily in securities of U.S. private or thinly-traded public companies, cash, cash equivalents, U.S. government securities and other high-quality debt instruments that mature in one year or less from the date of investment.
As a Business Development Company, we may issue “senior securities,” including borrowing money from banks or other financial institutions only in amounts such that our asset coverage, as defined in the 1940Investment Company Act, equals at least 200%150% after such incurrence or issuance. These requirements limit the amount that we may borrow, may unfavorably limit our investment opportunities and may reduce our ability in comparison to other companies to profit from favorable spreads between the rates at which we can borrow and the rates at which we can lend. If the value of our assets declines, we may be unable to satisfy the asset coverage test, which could prohibit us from paying distributions and could prevent us from being subject to tax as a RIC. If we cannot satisfy the asset coverage test, we may be required to sell a portion of our investments and, depending on the nature of our debt financing, repay a portion of our indebtedness at a time when such sales may be disadvantageous.
Because we will continue to need capital to grow our investment portfolio, these limitations may prevent us from incurring debt and require us to raise additional equity at a time when it may be disadvantageous to do so. As a result of these requirements we need to periodically access the capital markets to raise cash to fund new investments at a more frequent pace than our privately owned competitors. We generally are not able to issue or sell our common stock at a price below net asset value per share, which may be a disadvantage as compared with other public companies or private investment funds. IfWhen our common stock trades at a discount to net asset value, this restriction could adversely affect our ability to raise capital. We may, however, sell our common stock, or warrants, options or rights to acquire our common stock, at a price below the current net asset value of the common stock if our Board of Directors and independent directors determine that such sale is in our best interests and the best interests of our stockholders, and our stockholders as well as those stockholders that are not affiliated with us approve such sale in accordance with the requirements of the 1940Investment Company Act. In any such case, the price at which our securities are to be issued and sold may not be less than a price that, in the determination of our Board of Directors, closely approximates the market value of such securities (less any underwriting commission or discount). We cannot assure you that equity financing will be available to us on favorable terms, or at all. If additional funds are not available to us, we could be forced to curtail or cease new investment activities.
We also may make rights offerings to our stockholders at prices less than net asset value, subject to applicable requirements of the 1940Investment Company Act. If we raise additional funds by issuing more shares of our common stock or issuing senior securities convertible into, or exchangeable for, our common stock, the percentage ownership of our stockholders
26
may decline at that time and such stockholders may experience dilution. Moreover, we can offer no assurance that we will be able to issue and sell additional equity securities in the future, on terms favorable to us or at all.
In addition, we may in the future seek to securitize our portfolio securities to generate cash for funding new investments. To securitize loans, we would likely create a wholly-owned subsidiary and contribute a pool of loans to the subsidiary. We would then sell interests in the subsidiary on a non-recourse basis to purchasers and we would retain all or a portion of the equity in the subsidiary. An inability to successfully securitize our loan portfolio could limit our ability to grow our business or fully execute our business strategy and may decrease our earnings, if any. The securitization market is subject to changing market conditions and we may not be able to access this market when we would otherwise deem appropriate. Moreover, the successful securitization of our portfolio might expose us to losses as the residual investments in which we do not sell interests will tend to be those that are riskier and more apt to generate losses. The 1940Investment Company Act also may impose restrictions on the structure of any securitization.
Our Board of Directors may change our investment objective, operating policies and strategies without prior notice or stockholder approval, the effects of which may be adverse.
Our Board of Directors has the authority to modify or waive our current investment objective, operating policies and strategies without prior notice and without stockholder approval. We cannot predict the effect any changes to our current investment objective, operating policies and strategies would have on our business, net asset value, operating results and value of our stock. However, the effects might be adverse, which could negatively impact our ability to pay you distributions and cause you to lose part or all of your investment.
Changes in laws or regulations governing our operations may adversely affect our business or cause us to alter our business strategy.
We and our portfolio companies are subject to regulation at the local, state and federal level. New legislation may be enacted or new interpretations, rulings or regulations could be adopted, including those governing the types of investments we are permitted to make or that impose limits on our ability to pledge a significant amount of our assets to secure loans or that restrict the operations of a portfolio company, any of which could harm us and our stockholders and the value of our investments, potentially with retroactive effect. For example, certain provisions of the Dodd-Frank Act, which influences many aspects of the financial services industry, have been amended or repealed and the Code has been substantially amended and reformed. Any amendment or repeal of legislation, or changes in regulations or regulatory interpretations thereof, could create uncertainty in the near term, which could have a material adverse impact on our business, financial condition and results of operations.
Additionally, any changes to the laws and regulations governing our operations relating to permitted investments may cause us to alter our investment strategy in order to avail ourselves of new or different opportunities. Such changes could result in material differences to the strategies and plans set forth herein and may result in our investment focus shifting from the areas of expertise of our Adviser to other types of investments in which our Adviser may have less expertise or little or no experience. Thus, any such changes, if they occur, could have a material adverse effect on our results of operations and the value of your investment.
We are subject to risks associated with communications and information systems.
We depend on the communications and information systems of our Adviser and its affiliates as well as certain third-party service providers. As these systems became more important to our business, the risks posed to these communications and information systems have continued to increase. Any failure or interruption in these systems could cause disruptions in our activities, including because we do not maintain any such systems of our own. In addition, these systems are subject to potential attacks, including through adverse events that threaten the confidentiality, integrity or availability of our information resources. These attacks, which may include cyber incidents, may involve a third party gaining unauthorized access to our communications or information systems for purposes of misappropriating assets, stealing confidential information related to our operations or portfolio companies, corrupting data or causing operational disruption. Any such attack could result in disruption to our business, misstated or unreliable financial data, liability for stolen assets or information, increased cybersecurity protection and insurance costs, litigation and damage to our business relationships, any of which could have a material adverse effect on our business, financial condition and results of operations.
27
We may be unable to invest a significant portion of the net proceeds from an offering of our securities on acceptable terms within an attractive timeframe.
Delays in investing the net proceeds raised in an offering of our securities may cause our performance to be worse than that of fully invested Business Development Companies or other lenders or investors pursuing comparable investment strategies. We cannot assure you that we will be able to identify any investments that meet our investment objective or that any investment that we make will produce a positive return. We may be unable to invest the net proceeds of any offering on acceptable terms within the time period that we anticipate or at all, which could harm our financial condition and operating results.
We anticipate that, depending on market conditions, it may take us a substantial period of time to invest substantially all of the net proceeds of any offering in securities meeting our investment objective. During this period, we may use the net proceeds to pay down outstanding debt or we may invest the net proceeds of an offering primarily in cash, cash equivalents, U.S. government securities, repurchase agreements and high-quality debt instruments maturing in one year or less from the time of investment, which may produce returns that are significantly lower than the returns which we expect to achieve when our portfolio is fully invested in securities meeting our investment objective. As a result, any distributions that we pay during this period may be substantially lower than the distributions that we may be able to pay when our portfolio is fully invested in securities meeting our investment objective. In addition, until such time as the net proceeds of an offering are invested in securities meeting our investment objective, the market price for our common stock may decline. Thus, the return on your investment may be lower than when, if ever, our portfolio is fully invested in securities meeting our investment objective.
We may allocate the net proceeds from an offering in ways with which you may not agree.
We have significant flexibility in investing the net proceeds of an offering, and may do so in a way with which you may not agree. Additionally, our Adviser will select our investments subsequent to the closing of an offering, and our stockholders will have no input with respect to such investment decisions. Further, other than general limitations that may be included in a future credit facility, the holders of our debt securities will generally not have veto power or a vote in approving any changes to our investment or operational policies. These factors increase the uncertainty, and thus the risk, of investing in our securities. In addition, pending such investments, we will invest the net proceeds from an offering primarily in high quality, short-term debt securities, consistent with our Business Development Company election and our election to be taxed as a RIC, at yields significantly below the returns which we expect to achieve when our portfolio is fully invested in securities meeting our investment objective. If we are not able to identify or gain access to suitable investments, our income may be limited.
Risks Relating to Conflicts of Interest
Our base management fee may induce our Adviser to incur leverage.
Our base management fee is payable based upon our gross assets, which includes borrowings for investment purposes, which may encourage our Adviser to use leverage to make additional investments. Given the subjective nature of the investment decisions made by our Adviser on our behalf and the discretion related to incurring leverage in connection with any such investments, we will be unable to monitor this potential conflict of interest between us and our Adviser.
Our incentive fee may induce our Adviser to make speculative investments.
The incentive fee payable by us to our Adviser may create an incentive for it to make investments on our behalf that are risky or more speculative than would be the case in the absence of such compensation arrangement, which could result in higher investment losses, particularly during cyclical economic downturns. The incentive fee payable to our Adviser includes a component based on a percentage of our net investment income (subject to a hurdle rate), which may encourage our Adviser to use leverage to increase the return on our investments or otherwise manipulate our income so as to recognize income in quarters where the hurdle rate is exceeded and may result in an obligation for us to pay an incentive fee to the Adviser even if we have incurred a loss for an applicable period.
The incentive fee payable by us to our Adviser also may create an incentive for our Adviser to invest on our behalf in instruments that have a deferred interest feature. Under these investments, we would accrue the interest over the life of the investment but would not receive the cash income from the investment until the end of the investment’s term, if at all. Our net investment income used to calculate the income portion of our incentive fee, however, includes accrued interest. Thus, a portion of the incentive fee would be based on income that we have not yet received in cash and may never receive in cash if the portfolio company is unable to satisfy such interest payment obligation to us. While we may make incentive fee payments on income accruals that we may not collect in the future and with respect to which we do not have a formal “clawback” right against our Adviser, the amount of accrued income written off in any period will reduce the income in the period in which such write-off was taken and thereby reduce such period’s incentive fee payment.
In addition, our Adviser may be entitled to receive an incentive fee based upon net capital gains realized on our investments. Unlike the portion of the incentive fee based on income, there is no performance threshold applicable to the
28
portion of the incentive fee based on net capital gains. As a result, our Adviser may have a tendency to invest more in investments that are likely to result in capital gains as compared to income producing securities. Such a practice could result in our investing in more speculative securities than would otherwise be the case, which could result in higher investment losses, particularly during economic downturns.
Given the subjective nature of the investment decisions made by our Adviser on our behalf, we will be unable to monitor these potential conflicts of interest between us and our Adviser.
There are significant potential conflicts of interest that could adversely impact our investment returns.
Our executive officers and directors, and certain members of our Adviser, serve or may serve as officers, directors or principals of entities that operate in the same or a related line of business as we do or of investment funds managed by our affiliates. For example, Oaktree presently serves as the investment adviser to OCSL, a publicly-traded Business Development Company, and OSI II, a private Business Development Company. All of our executive officers serve in substantially similar capacities for OCSL and OSI II, all of our independent directors serve as independent directors of OCSL, and one of our independent directors serves as an independent director of OSI II. OCSL has historically invested in debt and equity of small and mid-sized companies, primarily in connection with investments by private equity sponsors, including in middle-market companies similar to those we target for investment. OSI II also makes similar investments. In addition, though not the primary focus of its investment portfolio, OCSL’s investments also include floating rate senior loans. Oaktree and its affiliates also manage and sub-advise private investment funds and accounts, and may manage other such funds and accounts in the future, which have investment mandates that are similar, in whole and in part, with ours. Therefore, there may be certain investment opportunities that satisfy the investment criteria for OCSL, OSI II and us as well as private investment funds and accounts advised or sub-advised by Oaktree or its affiliates. In addition, Oaktree and its affiliates may have obligations to investors in other entities that they advise or sub-advise, the fulfillment of which might not be in the best interests of us or our stockholders. An investment in us is not an investment in any of these other entities.
For example, the personnel of our Adviser may face conflicts of interest in the allocation of investment opportunities to us and such other funds and accounts. Moreover, the Adviser and the Investment Professionals are engaged in other business activities which divert their time and attention. The Investment Professionals will devote as much time to us as such professionals deem appropriate to perform their duties in accordance with the Investment Advisory Agreement. However, such persons may be committed to providing investment advisory and other services for other clients, and engage in other business ventures in which we have no interest. As a result of these separate business activities, the Adviser may have conflicts of interest in allocating management time, services and functions among us, other advisory clients and other business ventures.
Oaktree has investment allocation guidelines that govern the allocation of investment opportunities among the investment funds and accounts managed or sub-advised by Oaktree and its affiliates. To the extent an investment opportunity is appropriate for us or OCSL or any other investment fund or account managed or sub-advised by Oaktree or its affiliates, Oaktree will adhere to its investment allocation guidelines in order to determine a fair and equitable allocation.
In addition, on October 18, 2017, affiliates of our Adviser received exemptive relief from the SEC to allow certain managed funds and accounts, each of whose investment adviser is OCM or an investment adviser controlling, controlled by or under common control with OCM, such as our Adviser, to participate in negotiated co-investment transactions where doing so is consistent with the applicable registered fund’s or Business Development Company’s investment objective and strategies as well as regulatory requirements and other pertinent factors, and pursuant to the conditions of the exemptive relief. Each potential co-investment opportunity that falls under the terms of the exemptive relief and is appropriate for us and any affiliated fund or account, and satisfies the then-current board-established criteria, will be offered to us and such other eligible funds and accounts. If there is a sufficient amount of securities to satisfy all participants, the securities will be allocated among the participants in accordance with their proposed order size and if there is an insufficient amount of securities to satisfy all participants, the securities will be allocated pro rata based on the investment proposed by the applicable investment adviser to such participant, up to the amount proposed to be invested by each, which is reviewed and approved by an independent committee of legal, compliance and accounting professionals at our Adviser. We, with our Adviser and certain other affiliates, have submitted an application to the SEC for exemptive relief that would modify the terms of our existing exemptive relief to allow proprietary accounts to participate in co-investment transactions subject to certain conditions. We may also invest alongside funds managed by our Adviser and its affiliates in certain circumstances where doing so is consistent with applicable law and SEC staff interpretations. For example, we may invest alongside such accounts consistent with guidance promulgated by the staff of the SEC permitting us and such other accounts to purchase interests in a single class of privately placed securities so long as certain conditions are met, including that our Adviser, acting on our behalf and on behalf of other clients, negotiates no term other than price or terms related to price.
Although Oaktree will endeavor to allocate investment opportunities in a fair and equitable manner, we and our common stockholders could be adversely affected to the extent investment opportunities are allocated among us and other investment vehicles managed or sponsored by, or affiliated with, our executive officers, directors and members of our Adviser. We might
29
not participate in each individual opportunity, but will, on an overall basis, be entitled to participate equitably with other entities managed by Oaktree and its affiliates. Oaktree seeks to treat all clients fairly and equitably such that none receive preferential treatment vis-à-vis the others over time, in a manner consistent with its fiduciary duty to each of them; however, in some instances, especially in instances of limited liquidity, the factors may not result in pro rata allocations or may result in situations where certain funds or accounts receive allocations where others do not.
Pursuant to the Investment Advisory Agreement, our Adviser’s liability is limited and we are required to indemnify our Adviser against certain liabilities. This may lead our Adviser to act in a riskier manner in performing its duties and obligations under the Investment Advisory Agreement than it would if it were acting for its own account, and creates a potential conflict of interest.
Pursuant to the Administration Agreement, Oaktree Administrator furnishes us with the facilities, including our principal executive office, and administrative services necessary to conduct our day-to-day operations. We pay Oaktree Administrator its allocable portion of overhead and other expenses incurred by Oaktree Administrator in performing its obligations under the Administration Agreement, including, without limitation, a portion of the rent at market rates and the compensation of our Chief Financial Officer, Chief Compliance Officer, their respective staffs and other non-investment professionals at Oaktree that perform duties for us. This arrangement creates conflicts of interest that our Board of Directors must monitor.
Risks Relating to Our Use of Leverage and Our Credit Facilities
Because we borrow money, the potential for loss on amounts invested in us will be magnified and may increase the risk of investing in us.
Borrowings, also known as leverage, magnify the potential for loss on invested equity capital. We expect to continue to use leverage to partially finance our investments, through borrowings from banks and other lenders, which will increase the risks of investing in our common stock, including the likelihood of default. We borrow under our revolving credit facility with the lenders referred to therein, Citibank, N.A., as administrative agent, and Wells Fargo Bank, N.A., as collateral agent and custodian, or the Citibank Facility, and our wholly-owned subsidiary’s revolving credit facility with us as equityholder and as servicer, the lenders from time to time parties thereto, Deutsche Bank AG, New York Branch, as facility agent, the other agents parties thereto and Wells Fargo Bank, National Association, as collateral agent and as collateral custodian, or the Deutsche Bank Facility, and may issue other debt securities or enter into other types of borrowing arrangements in the future. If the value of our assets decreases, leveraging would cause net asset value to decline more sharply than it otherwise would have had we not leveraged. Similarly, any decrease in our income would cause net income to decline more sharply than it would have had we not borrowed. To the extent we incur additional leverage, these effects would be further magnified, increasing the risk of investing in us. Such a decline could negatively affect our ability to make common stock distributions or scheduled debt payments. Leverage is generally considered a speculative investment technique and we only intend to use leverage if expected returns will exceed the cost of borrowing.
As of September 30, 2020, we had $119.1 million of outstanding indebtedness under the Citibank Facility, $137.6 million outstanding indebtedness under the Deutsche Bank Facility and $10.9 million of secured borrowings. These debt instruments require periodic payments of interest. The weighted average interest rate charged on our borrowings as of September 30, 2020 was 2.6% (exclusive of deferred financing costs). We will need to generate sufficient cash flow to make these required interest payments. In order for us to cover our annual interest payments on indebtedness, we must achieve annual returns on our September 30, 2020 total assets of at least 1.31%. If we are unable to meet the financial obligations under our credit facilities, the lenders under the credit facilities will have a superior claim to our assets over our stockholders.
Historically, as a Business Development Company, under the Investment Company Act we generally were not permitted to incur indebtedness unless immediately after such borrowing we had an asset coverage for total borrowings of at least 200% (i.e., the amount of debt may not exceed 50% of the value of our assets). However, on March 23, 3018, the Small Business Credit Availability Act, or the SBCAA, was enacted into law. The SBCAA, among other things, amended Section 61(a) of the Investment Company Act to add a new Section 61(a)(2) that reduces the asset coverage requirement applicable to Business Development Companies from 200% to 150% (i.e., the amount of debt may not exceed 66.67% of the value of the Business Development Company’s assets) so long as the Business Development Company meets certain disclosure requirements and obtains certain approvals. At a special meeting of our stockholders held on July 10, 2018, our stockholders approved the application of the reduced asset coverage requirements in Section 61(a)(2) of the Investment Company Act to us, effective as of July 11, 2018. If we incur additional leverage in accordance with the reduced asset coverage requirements, our net asset value will decline more sharply if the value of our assets declines than if we had not incurred such additional leverage and the effects of leverage described above will be magnified.
30
Illustration. The following table illustrates the effect of leverage on returns from an investment in our common stock assuming various annual returns, net of expenses. The calculations in the table below are hypothetical and actual returns may be higher or lower than those appearing below.
| Assumed Return on Portfolio (Net of Expenses) | - 10% | - 5% | 0% | 5% | 10% | ||||||||||||
| Corresponding net return to common stockholder | -22.65% | -12.63% | -2.61% | 7.40% | 17.42% | ||||||||||||
For purposes of this table, we have assumed $534.3 million in total assets (less all liabilities and indebtedness not represented by senior securities), $267.6 million in debt outstanding, $266.7 million in net assets as of September 30, 2020, and a weighted average interest rate of 2.6% as of September 30, 2020 (exclusive of deferred financing costs). Actual interest payments may be different.
We are subject to certain risks associated with our credit facilities.
As of September 30, 2020, substantially all of our assets were pledged as collateral under our credit facilities and may be pledged as collateral under future credit facilities. If we default on our obligations under these facilities, the lenders may have the right to foreclose upon and sell, or otherwise transfer, the collateral subject to their security interests or their superior claim. In such event, we may be forced to sell our investments to raise funds to repay our outstanding borrowings in order to avoid foreclosure and these forced sales may be at times and at prices we would not consider advantageous. Moreover, such deleveraging of our company could significantly impair our ability to effectively operate our business in the manner in which we have historically operated. As a result, we could be forced to curtail or cease new investment activities and lower or eliminate the distributions that we have historically paid to our stockholders.
We own 100% of the equity interests in OCSI Senior Funding Ltd. and OCSI Senior Funding II LLC, the borrowers under the Deutsche Bank Facility and the Citibank Facility, respectively. We consolidate the financial statements of OCSI Senior Funding Ltd. and OCSI Senior Funding II LLC in our consolidated financial statements and treat the indebtedness of these entities as our leverage. Our interests in OCSI Senior Funding Ltd. and OCSI Senior Funding II LLC are subordinated in priority of payment to every other obligation of OCSI Senior Funding Ltd. and OCSI Senior Funding II LLC and are subject to certain payment restrictions set forth in the Deutsche Bank Facility and the Citibank Facility, respectively.
We receive cash distributions on our equity interests in these entities only if they have made all required cash interest payments to the lenders and no default exists. We cannot assure you that distributions on the assets held by OCSI Senior Funding Ltd. and OCSI Senior Funding II LLC will be sufficient to make any distributions to us or that such distributions will meet our expectations. We receive cash from OCSI Senior Funding Ltd. and OCSI Senior Funding II LLC only to the extent that we receive distributions on our equity interests in such entities. These entities may make distributions on their equity interests only to the extent permitted by the payment priority provisions of the Citibank Facility and the Deutsche Bank Facility, as applicable, which generally provide that payments on such interests may not be made on any payment date unless all amounts owing to the lenders and other secured parties are paid in full.
In addition, if the lenders exercise their right to sell the assets pledged under our credit facilities or future credit facilities, such sales may be completed at distressed sale prices, thereby diminishing or potentially eliminating the amount of cash available to us after repayment of the amounts outstanding under the credit facilities.
We may enter into reverse repurchase agreements, which are another form of leverage.
We may enter into reverse repurchase agreements as part of our management of our temporary investment portfolio. Our entry into any such reverse repurchase agreements would be subject to the Investment Company Act limitations on leverage. In connection with entry into a reverse repurchase agreement, we would effectively pledge our assets as collateral to secure a short-term loan. Generally, the other party to the agreement would make a loan to us in an amount equal to a percentage of the fair value of the collateral we have pledged. At the maturity of the reverse repurchase agreement, we will be required to repay the loan and then receive back our collateral. While used as collateral, the assets continue to pay principal and interest which are for the benefit of us.
Our use of reverse repurchase agreements, if any, involves many of the same risks involved in our use of leverage. For example, the market value of the securities acquired in the reverse repurchase agreement may decline below the price of the securities that we have sold but we would remain obligated to purchase those securities, meaning that we bear the risk of loss that the proceeds at settlement are less than the fair value of the securities pledged. In addition, the market value of the securities retained by us may decline. If a buyer of securities under a reverse repurchase agreement were to file for bankruptcy or experience insolvency, we would be adversely affected. In addition, due to the interest costs associated with reverse repurchase agreements, our net asset value would decline, and, in some cases, we may be worse off than if we had not used such agreements.
31
Risks Related to Distributions
Because we intend to distribute at least 90% of our taxable income each taxable year to our stockholders in connection with our election to be treated as a RIC, we will continue to need additional capital to finance our growth.
In order to qualify for the tax benefits available to RICs and to minimize corporate-level U.S. federal income taxes, we intend to distribute to our stockholders at least 90% of our taxable income each taxable year, except that we may retain certain net capital gains for investment, and treat such amounts as deemed distributions to our stockholders. If we elect to treat any amounts as deemed distributions, we would be subject to income taxes at the corporate rate applicable to net capital gains on such deemed distributions on behalf of our stockholders. As a result of these requirements, we will likely need to raise capital from other sources to grow our business. Because we will continue to need capital to grow our investment portfolio, these limitations together with the asset coverage requirements applicable to us may prevent us from incurring debt and require us to raise additional equity at a time when it may be disadvantageous to do so.
We may not be able to pay you distributions, our distributions may not grow over time and a portion of our distributions may be a return of capital.
We intend to pay distributions to our stockholders out of assets legally available for distribution. We cannot assure you that we will achieve investment results that will allow us to sustain a specified level of cash distributions or periodic increases in cash distributions. In addition, the inability to satisfy the asset coverage test applicable to us as a business development companyBusiness Development Company can limit our ability to pay distributions. All distributions will be paid at the discretion of our Board of Directors and will depend on our earnings, our financial condition, maintenance of our ability to be subject to tax as a RIC, compliance with applicable business development companyBusiness Development Company regulations and such other factors as our Board of Directors may deem relevant from time to time. We cannot assure you that we will continue to pay distributions to our stockholders at current levels, or at all.
When we make distributions, our distributions generally will be treated as dividends for U.S. federal income tax purposes to the extent such distributions are paid out of our current or accumulated earnings and profits. Distributions in excess of current and accumulated earnings and profits will be treated as a non-taxable return of capital to the extent of a stockholder's basis in our stock and, assuming that a stockholder holds our stock as a capital asset, thereafter as a capital gain. A return of capital generally is a return of a stockholder’s investment rather than a return of earnings or gains derived from our investment activities. Moreover, we may pay all or a substantial portion of our distributions from the proceeds of the sale of shares of our common stock or from borrowings in anticipation of future cash flow, which could constitute a return of stockholders’ capital and will lower such stockholders’ tax basis in our shares, which may result in increased tax liability to stockholders when they sell or otherwise dispose of such shares. The tax liability incurred by such stockholders upon the sale or other disposition of shares of our common stock may increase even if such shares are sold at a loss.
We will be subject to corporate-level U.S. federal income tax if we are unable to maintain our qualification as a RIC under Subchapter M of the Code or do not satisfy the Annual Distribution Requirement.
To maintain our tax status as a RIC and be relieved of U.S. federal taxes on income and gains distributed to our stockholders, we must meet the following annual distribution, income source and asset diversification requirements:
•The Annual Distribution Requirement will be satisfied if we distribute dividends to our stockholders each taxable year of an amount generally at least equal to 90% of the sum of our net taxable income plus realized net short-term capital gains in excess of realized net long-term capital losses, if any. Because we use debt financing, we are and may, in the future, be subject to certain financial covenants under our debt arrangements that could, under certain circumstances, restrict us from making distributions necessary to satisfy the Annual Distribution Requirement. If we are unable to obtain cash from other sources, we could fail to qualify for RIC tax treatment and thus could become subject to corporate-level income tax.
•The 90% Gross Income Test will be satisfied if we earn at least 90% of our gross income for each taxable year from dividends, interest, gains from the sale of stock or securities or similar sources.
•The Diversification Tests will be satisfied if, at the end of each quarter of our taxable year, at least 50% of the value of our assets consist of cash, cash equivalents, U.S. government securities, securities of other RICs, and other acceptable securities; and no more than 25% of the value of our assets can be invested in the securities, other than U.S. government securities or securities of other RICs, of one issuer, of two or more issuers that are controlled, as determined under applicable Code rules, by us and that are engaged in the same or similar or related trades or businesses or of certain “qualified publicly traded partnerships.” Failure to meet these requirements may result in our having to dispose of certain investments quickly in order to prevent the loss of RIC status. Because most of our investments will be in
private companies, and therefore will be relatively illiquid, any such dispositions could be made at disadvantageous prices and could cause us to incur substantial losses.
32
If we fail to be subject to tax as a RIC and are subject to entity-level U.S. federal corporate income tax, the resulting corporate taxes could substantially reduce our net assets, the amount of income available for distribution and the amount of our distributions.
We may have difficulty paying our required distributions if we are required to recognize income for U.S. federal income tax purposes before or without receiving cash representing such income.
For U.S. federal income tax purposes, we generally are required to include in income certain amounts that we have not yet received in cash, such as OID or certain income accruals on contingent payment debt instruments, which may occur if we receive warrants in connection with the origination of a loan or possibly in other circumstances. Such OID is generally required to be included in income before we receive any corresponding cash payments. In addition, our loans typically contain PIK interest provisions. Any PIK interest, computed at the contractual rate specified in each loan agreement, is generally required to be added to the principal balance of the loan and recorded as interest income. We also may be required to include in income certain other amounts that we do not receive, and may never receive, in cash. To avoid the imposition of corporate-level tax on us, this non-cash source of income may need to be distributed to our stockholders in cash or, in the event that we determine to do so, in shares of our common stock, even though we may have not yet collected and may never collect the cash relating to such income.
Since, in certain cases, we may recognize income before or without receiving cash representing such income, we may have difficulty meeting the Annual Distribution Requirement necessary to be relieved of entity-level U.S. federal taxes on income and gains distributed to our stockholders. Accordingly, we may have to sell or otherwise dispose of some of our investments at times and/or at prices we would not consider advantageous, raise additional debt or equity capital or forgo new investment opportunities for this purpose. If we are not able to obtain cash from other sources, we may fail to satisfy the Annual Distribution Requirement and thus become subject to corporate-level U.S. federal income tax.
We may in the future choose to pay distributions partly in our own stock, in which case you may be subject to tax in excess of the cash you receive.
We may distribute taxable distributions that are payable in part in our stock. In accordance with certain applicable Treasury regulations and other related administrative pronouncements issued by the Internal Revenue Service, or the IRS, a RIC may be eligible to treat a distribution of its own stock as fulfilling its RIC distribution requirements if each stockholder is permitted to elect to receive his or her entire distribution in either cash or stock of the RIC, subject to the satisfaction of certain guidelines. If too many stockholders elect to receive cash (which generally may not be less than 20% of the value of the overall distribution)distribution, or 10% for distributions declared on or after April 1, 2020 and on or before December 31, 2020), each stockholder electing to receive cash must receive a pro rata amount of cash (with the balance of the distribution paid in stock). If these and certain other requirements are met, for U.S. federal income tax purposes, the amount of the distribution paid in stock generally will be equal to the amount of cash that could have been received instead of stock. Taxable stockholders receiving such distributions will be required to include the full amount of the distribution as ordinary income (or as long-term capital gain to the extent such distribution is properly reported as a capital gain dividend) to the extent of their share of our current and accumulated earnings and profits for U.S. federal income tax purposes. As a result, a U.S. stockholder may be subject to tax with respect to such distributions in excess of any cash received. If a U.S. stockholder sells the stock it receives as a distribution in order to pay this tax, the sales proceeds may be less than the amount included in income with respect to the distribution, depending on the market price of our stock at the time of the sale. Furthermore, with respect to non-U.S. stockholders, we may be required to withhold U.S. tax with respect to such distribution, including in respect of all or a portion of such distribution that is payable in stock. In addition, if a significant number of our stockholders determine to sell shares of our stock in order to pay taxes owed on a distribution, such sales may put downward pressure on the trading price of our stock.
Risks Relating to Our Investments
Our investments in portfolio companies may be risky, and we could lose all or parts of our investments.
The companies in which we invest are typically highly leveraged, and, in most cases, our investments in such companies are not rated by any rating agency. If such investments were rated, we believe that they would likely receive a rating from a nationally recognized statistical rating organization of below investment grade (i.e., below BBB- or Baa), which is often referred to as "high yield" and “junk.” Exposure to below investment grade securities involves certain risks, and those securities are viewed as having predominately speculative characteristics with respect to the issuer's capacity to pay interest and repay principal. Investing in small and mid-sized companies involves a number of significant risks. As of September 30, 2017, 19.7%
33
Certain of our debt portfolio at fair value consistedinvestments consist of debt securities for which issuers wereare not required to make principal payments until the maturity of such debt securities, which could result in a substantial loss to us if such issuers are unable to refinance or repay their debt at maturity. Increases in interest rates may affect the ability of our portfolio companies to repay debt or pay interest, which may in turn affect the value of our portfolio investments, and our business, financial condition and results of operations.
Among other things, our portfolio companies:
•may have limited financial resources, may have limited or negative EBITDA and may be unable to meet their obligations under their debt instruments that we hold, which may be accompanied by a deterioration in the value of any collateral and a reduction in the likelihood of us realizing any guarantees from subsidiaries or affiliates of our portfolio companies that we may have obtained in connection with our investments, as well as a corresponding decrease in the value of the equity components of our investments;
•may have shorter operating histories, narrower product lines, smaller market shares and/or significant customer concentrations than larger businesses, which tend to render them more vulnerable to competitors’ actions and market conditions, as well as general economic downturns;
•may operate in regulated industries and/or provide services to federal, state or local governments, or operate in industries that provide services to regulated industries or federal, state or local governments, any of which could lead to delayed payments for services or subject the company to changing payment and reimbursement rates or other terms;
•may not have collateral sufficient to pay any outstanding interest or principal due to us in the event of a default by these companies;
•are more likely to depend on the management talents and efforts of a small group of people; therefore, the death, disability, resignation or termination of one or more of these persons could have a material adverse impact on our portfolio company and, in turn, on us;
•may have difficulty accessing the capital markets to fund capital needs, which may limit their ability to grow or repay outstanding indebtedness at maturity;
•may not have audited financial statements or be subject to the Sarbanes-Oxley Act and other rules that govern public companies;
•generally have less predictable operating results, may from time to time be parties to litigation, may be engaged in rapidly changing businesses with products subject to a substantial risk of obsolescence, and may require substantial additional capital to support their operations, finance expansion or maintain their competitive position; and
•generally have less publicly available information about their businesses, operations and financial condition. If we are unable to uncover all material information about these companies, we
These factors may not make a fully informed investment decision, and as a result may lose part or all of our investment.
Finally, as noted above, little public information generally exists about privately owned companies, and these companies may not have third-party debt ratings or audited financial statements. We must therefore rely on the ability of our Adviser to obtain adequate information through due diligence to evaluate the creditworthiness and potential returns from investing in these companies. Additionally, these companies and their financial information will not generally be subject to the Sarbanes-Oxley Act and other rules that govern public companies.
We may be exposed to higher risks with respect to our investments that include OID or PIK interest.
Our investments may include OID and contractual PIK interest, which typically represents contractual interest added to a loan balance and due at the end of such loan’s term. To the extent OID or PIK interest constitute a portion of our income, we are exposed to typical risks associated with such income being required to be included in taxable and accounting income prior to receipt of cash, including the following:
•OID and PIK instruments may have higher yields, which reflect the payment deferral and credit risk associated with these instruments;
•OID and PIK accruals may create uncertainty about the source of our distributions to stockholders;
•OID and PIK instruments may have unreliable valuations because their continuing accruals require continuing judgments about the collectability of the deferred payments and the value of the collateral; and
34
•OID and PIK instruments may represent a higher credit risk than coupon loans.
If we acquire the securities and obligations of distressed or bankrupt companies, such investments may be subject to significant risks, including lack of income, extraordinary expenses, uncertainty with respect to satisfaction of debt, lower-than-expected investment values or income potentials and resale restrictions.
We may acquire the securities and other obligations of distressed or bankrupt companies. At times, distressed debt obligations may not produce income and may require us to bear certain extraordinary expenses (including legal, accounting, valuation and transaction expenses) in order to protect and recover our investment. Therefore, to the extent we invest in distressed debt, our ability to achieve current income for our stockholders may be diminished, particularly where the portfolio company has negative EBITDA.
We also will be subject to significant uncertainty as to when and in what manner and for what value the distressed debt we invest in will eventually be satisfied whether through a liquidation, an exchange offer or plan of reorganization involving the distressed debt securities or a payment of some amount in satisfaction of the obligation. In addition, even if an exchange offer is made or plan of reorganization is adopted with respect to distressed debt held by us, there can be no assurance that the securities or other assets received by us in connection with such exchange offer or plan of reorganization will not have a lower value or income potential than may have been anticipated when the investment was made.
Moreover, any securities received by us upon completion of an exchange offer or plan of reorganization may be restricted as to resale. As a result of our participation in negotiations with respect to any exchange offer or plan of reorganization with respect to an issuer of distressed debt, we may be restricted from disposing of such securities.
Our portfolio companies may prepay loans, which may reduce our yields if capital returned cannot be invested in transactions with equal or greater expected yields.
The loans in our investment portfolio may be prepaid at any time, generally with little advance notice. Whether a loan is prepaid will depend both on the continued positive performance of the portfolio company and the existence of favorable financing market conditions that allow such company the ability to replace existing financing with less expensive capital. As market conditions change, we do not know when, and if, prepayment may be possible for each portfolio company. In some cases, the prepayment of a loan may reduce our achievable yield if the capital returned cannot be invested in transactions with equal or greater expected yields, which could have a material adverse effect on our business, financial condition and results of operations.
The lack of liquidity in our investments may adversely affect our business.
We invest, and will continue to invest, in companies whose securities are not publicly traded, and whose securities are subject to legal and other restrictions on resale or are otherwise less liquid than publicly traded securities. In fact, all of our assets may be invested in illiquid securities. The illiquidity of these investments may make it difficult for us to sell these investments when desired. In addition, if we are required to liquidate all or a portion of our portfolio quickly, we may realize significantly less than the value at which we had previously recorded these investments.investments and suffer losses. Our investments are usuallymay be subject to contractual or legal restrictions on resale or are otherwise illiquid because there is usually no established trading market for such investments. In addition, we may also face restrictions on our ability to liquidate our investments if our Investment Adviser or any of its affiliates have material nonpublic information regarding the portfolio company. The illiquidity of most of our investments may make it difficult for us to dispose of them at a favorable price, and, as a result, we may suffer losses.
We may not have the funds or ability to make additional investments in our portfolio companies.
After our initial investment in a portfolio company, we may be called upon from time to time to provide additional funds to such company or have the opportunity to increase our investment through a follow-on investment. There is no assurance that we will make, or will have sufficient funds to make, follow-on investments. Any decisions not to make a follow-on investment or any inability on our part to make such an investment may have a negative impact on a portfolio company in need of such an investment, may result in a missed opportunity for us to increase our participation in a successful operation, may reduce the expected yield on the investment or impair the value of our investment in any such portfolio company.
Our portfolio companies may be highly leveraged.
Our investments may include companies with significant leverage. Such investments are inherently more sensitive to declines in revenues and to increases in expenses and interest rates. The leveraged capital structure of such investments will increase the exposure of the portfolio companies to adverse economic factors, such as downturns in the economy or deterioration in the condition of the portfolio company or its industry. Additionally, the securities acquired by us may be the most junior in what will typically be a complex capital structure, and thus subject to the greatest risk of loss.
35
Our portfolio companies may incur debt that ranks equally with, or senior to, our investments in such companies.
We invest primarily in first lien loans issued by small and mid-sizedmiddle market companies. Our portfolio companies may have, or may be permitted to incur, other debt that ranks equally with, or senior to, the debt in which we invest. By their terms, such debt instruments may entitle the holders to receive payments of interest or principal on or before the dates on which we are entitled to receive payments with respect to the debt instruments in which we invest. Also, in the event of insolvency, liquidation, dissolution, reorganization or bankruptcy of a portfolio company, holders of debt instruments ranking senior to our investment in that portfolio company would typically be entitled to receive payment in full before we receive any distribution. After repaying such senior creditors, such portfolio company may not have any remaining assets to use for repaying its obligation to us. In the case of debt ranking equally with debt instruments in which we invest, we would have to share on an equal basis any distributions with other creditors holding such debt in the event of an insolvency, liquidation, dissolution, reorganization or bankruptcy of the relevant portfolio company.
The disposition of our investments may result in contingent liabilities.
In connection with the disposition of an investment in private securities, we may be required to make representations about the business and financial affairs of the portfolio company typical of those made in connection with the sale of a business. We may also be required to indemnify the purchasers of such investment to the extent that any such representations turn out to be inaccurate or with respect to certain potential liabilities. These arrangements may result in contingent liabilities that ultimately yield funding obligations that must be satisfied through our return of certain distributions previously made to us.
There may be circumstances where our debt investments could be subordinated to claims of other creditors or we could be subject to lender liability claims.
Even though we have structured some of our investments as senior loans, if one of our portfolio companies were to enter bankruptcy proceedings, a bankruptcy court might re-characterize our debt investment and subordinate all or a portion of our claim to that of other creditors, depending on the facts and circumstances, including the extent to which we actually provided managerial assistance to that portfolio company. We may also be subject to lender liability claims for actions taken by us with respect to a borrower’s business or instances where we exercise control over the borrower. It is possible that we could become subject to a lender’s liability claim, including as a result of actions taken in rendering significant managerial assistance.
Second priority liens on collateral securing loans that we make to our portfolio companies may be subject to control by senior creditors with first priority liens. If there is a default, the value of the collateral may not be sufficient to repay in full both the first priority creditors and us.
Certain loans that we make to portfolio companies will beare secured on a second priority basis by the same collateral securing senior secured debt of such companies. The first priority liens on the collateral will securesecures the portfolio company’s obligations under any outstanding senior debt and may secure certain other future debt that may be permitted to be incurred by the company under the agreements governing the loans. The holders of obligations secured by the first priority liens on the collateral will generally control the liquidation of and be entitled to receive proceeds from any realization of the collateral to repay their obligations in full before us. In addition, the value of the collateral in the event of liquidation will depend on market and economic conditions, the availability of buyers and other factors. There can be no assurance that the proceeds, if any, from the sale or sales of all of the collateral would be sufficient to satisfy the loan obligations secured by the second priority liens after payment in full of all obligations secured by the first priority liens on the collateral. If such proceeds are not sufficient to repay amounts outstanding under the loan obligations secured by the second priority liens, then we, to the extent not repaid from the proceeds of the sale of the collateral, will only have an unsecured claim against the company’s remaining assets, if any.
The rights we may have with respect to the collateral securing the loans we make to our portfolio companies with senior debt outstanding may also be limited pursuant to the terms of one or more inter-creditor agreements that we enter into with the holders of senior debt. Under such an inter-creditor agreement, at any time that obligations that have the benefit of the first priority liens are outstanding, any of the following actions may be taken with respect to the collateral and will be at the direction of the holders of the obligations secured by the first priority liens: the ability to cause the commencement of enforcement proceedings against the collateral; the ability to control the conduct of such proceedings; the approval of amendments to collateral documents; releases of liens on the collateral; and waivers of past defaults under collateral documents. We may not have the ability to control or direct such actions, even if our rights are adversely affected.
36
If we make unsecured debt investments, we may lack adequate protection in the event our portfolio companies become distressed or insolvent and will likely experience a lower recovery than more senior debtholders in the event such portfolio companies default on their indebtedness.
We have made, and may in the future make, unsecured debt investments in portfolio companies. Unsecured debt investments are unsecured and junior to other indebtedness of the portfolio company. As a consequence, the holder of an unsecured debt investment may lack adequate protection in the event the portfolio company becomes distressed or insolvent and will likely experience a lower recovery than more senior debtholders in the event the portfolio company defaults on its indebtedness. In addition, unsecured debt investments of small and mid-sized companies are often highly illiquid and in adverse market conditions may experience steep declines in valuation even if they are fully performing.
We may incur greater risk with respect to investments we acquire through assignments or participations of interests.
Although we originate a substantial portion of our loans, we may acquire loans through assignments or participations of interests in such loans. The purchaser of an assignment typically succeeds to all the rights and obligations of the assigning institution and becomes a lender under the credit agreement with respect to such debt obligation. However, the purchaser’s rights can be more restricted than those of the assigning institution, and we may not be able to unilaterally enforce all rights and remedies under an assigned debt obligation and with regard to any associated collateral. A participation typically results in a contractual relationship only with the institution participating out the interest and not directly with the borrower. Sellers of participations typically include banks, broker-dealers, other financial institutions and lending institutions. In purchasing participations, we generally will have no right to enforce compliance by the borrower with the terms of the loan agreement against the borrower, and we may not directly benefit from the collateral supporting the debt obligation in which we have purchased the participation. As a result, we will be exposed to the credit risk of both the borrower and the institution selling the participation. Further, in purchasing participations in lending syndicates, we will not be able to conduct the same level of due diligence on a borrower or the quality of the loan with respect to which we are buying a participation as we would conduct if we were investing directly in the loan. This difference may result in us being exposed to greater credit or fraud risk with respect to such loans than we expected when initially purchasing the participation.
We generally do not, and do not expect to, control our portfolio companies.
We do not, and do not expect to, control most of our portfolio companies. As a result, we are subject to the risk that a portfolio company in which we invest may make business decisions with which we disagree and the management of such company, as representatives of the holders of their common equity, may take risks or otherwise act in ways that do not serve our interests as a debt investor, including actions that could decrease the value of our investment. Due to the lack of liquidity for the majority of our investments, in non-traded companies, we may not be able to dispose of our interests in our portfolio companies as readily as we would like or at an appropriate valuation.
Defaults by our portfolio companies would harm our operating results.
A portfolio company’s failure to satisfy financial or operating covenants imposed by us or other lenders could lead to defaults and, potentially, termination of its loans and foreclosure on its secured assets, which could trigger cross-defaults under other agreements and jeopardize a portfolio company’s ability to meet its obligations under the debt or equity securities that we hold. We may incur expenses to the extent necessary to seek recovery upon default or to negotiate new terms, which may include the waiver of certain financial covenants, with a defaulting portfolio company. In addition, we may write-down the value of a portfolio company investment upon the worsening of the financial condition of the portfolio company or in anticipation of a default, which could also have a material adverse effect on our business, financial condition and results of operations.
Our portfolio companies may experience financial distress and our investments in such companies may be restructured.
Our portfolio companies may experience financial distress from time to time. Debt investments in such companies may cease to be income-producing, may require us to bear certain expenses to protect our investment and may subject us to uncertainty as to when, in what manner and for what value such distressed debt will eventually be satisfied, including through liquidation, reorganization or bankruptcy. Any restructuring can fundamentally alter the nature of the related investment, and restructurings may not be subject to the same underwriting standards that our Investment Adviser employs in connection with the origination of an investment. In addition, we may write-down the value of our investment in any such company to reflect the status of financial distress and future prospects of the business. Any restructuring could alter, reduce or delay the payment of interest or principal on any investment, which could delay the timing and reduce the amount of payments made to us. For example, if an exchange offer is made or plan of reorganization is adopted with respect to the debt securities we currently hold, there can be no assurance that the securities or other assets received by us in connection with such exchange offer or plan of reorganization will have a value or income potential similar to what we anticipated when our original investment was made or even at the time of restructuring. Restructurings of investments might also result in extensions of the term thereof, which could delay the timing of payments made to us, or we may receive equity securities, which may require significantly more of our
37
management’s time and attention or carry restrictions on their disposition. We cannot assure you that any particular restructuring strategy pursued by our Investment Adviser will maximize the value of or recovery on any investment.
We may not realize gains from our equity investments.
Certain investments that we have made in the past and may make in the future include warrants or other equity securities. In addition, we have made in the past and may make in the future direct equity investments in companies. Our goal is ultimately to realize gains upon our disposition of such equity interests. However, the equity interests we receive may not appreciate in value and, in fact, may decline in value. Accordingly, we may not be able to realize gains from our equity interests, and any gains that we do realize on the disposition of any equity interests may not be sufficient to offset any other losses we experience. We also may be unable to realize any value if a portfolio company does not have a liquidity event, such as a sale of the business, recapitalization or public offering, which would allow us to sell the underlying equity interests. We may seek puts or similar rights to give us the right to sell our equity securities back to the portfolio company issuer. We may be unable to exercise these put rights for the consideration provided in our investment documents if the issuer is in financial distress.
We are subject to certain risks associated with foreign investments.
We have made in the past and may make in the future investments in foreign companies. Investing in foreign companies may expose us to additional risks not typically associated with investing in U.S. companies. These risks include changes in foreign exchange rates, exchange control regulations, political and social instability, expropriation, imposition of foreign taxes, less liquid markets and less available information than is generally the case in the U.S., higher transaction costs, less government supervision of exchanges, brokers and issuers, less developed bankruptcy laws, difficulty in enforcing contractual obligations, lack of uniform accounting and auditing standards and greater price volatility. In addition, our foreign investments generally do not constitute "qualifying assets" under the 1940 Act, under which qualifying assets must represent at least 70% of our total assets. See “Business DevelopmentInvestment Company Regulations — Qualifying Assets.”Act.
Our success will depend, in part, on our ability to anticipate and effectively manage these and other risks. We cannot assure you that these and other factors will not have a material adverse effect on our business as a whole.
We may have foreign currency risks related to our investments denominated in currencies other than the U.S. dollar.
As of September 30, 2020, a portion of our investments are, and may continue to be, denominated in currencies other than the U.S. dollar. Changes in the rates of exchange between the U.S. dollar and other currencies will have an effect, which could be adverse, on our performance, amounts available for withdrawal and the value of securities distributed by us. Among the factors that may affect currency values are trade balances, the level of short-term interest rates, differences in relative values of similar assets in different currencies, long-term opportunities for investment and capital appreciation and political developments. Additionally, a particular foreign country may impose exchange controls, devalue its currency or take other measures relating to its currency which could adversely affect us. Finally, we could incur costs in connection with conversions between various currencies.
We may expose ourselves to risks if we engage in hedging transactions.
Subject to applicable provisions of the 1940Investment Company Act and applicable regulations promulgated by the CommoditiesCommodity Futures Trading Commission, we have in the past and may in the future enter into hedging transactions, which may expose us to risks associated with such transactions. Such hedging may utilize instruments such as forward contracts, currency options and interest rate swaps, caps, collars and floors to seek to hedge against fluctuations in the relative values of our portfolio positions and amounts due under ourany credit facilitiesfacility from changes in currency exchange rates and market interest rates. Use of these hedging instruments may include counterparty credit risk. Hedging against a decline in the values of our portfolio positions does not eliminate the possibility of fluctuations in the values of such positions and amounts due under our credit facilities or prevent losses if the values of such positions decline. However, such hedging can establish other positions designed to gain from those same developments, thereby offsetting the decline in the value of such portfolio positions. Such hedging transactions may also limit the opportunity for gain if the values of the underlying portfolio positions should increase. Moreover, it may not be possible to hedge against an exchange rate or interest rate fluctuation that is so generally anticipated that we are not able to enter into a hedging transaction at an acceptable price.
The success of any hedging transactions will depend on our ability to correctly predict movements in currencies and interest rates. Therefore, while we may enter into such transactions to seek to reduce currency exchange rate and interest rate risks, unanticipated changes in currency exchange rate or interest rates may result in poorer overall investment performance than if we had not engaged in any such hedging transactions. In addition, the degree of correlation between price movements of the instruments used in a hedging strategy and price movements in the portfolio positions being hedged may vary. Moreover, for a variety of reasons, we may not seek to (or be able to) establish a perfect correlation between such hedging instruments and the portfolio holdings or credit facilities being hedged. Any such imperfect correlation may prevent us from achieving the intended hedge and expose us to risk of loss. In addition, it may not be possible to hedge fully or perfectly against currency fluctuations affecting the value of securities denominated in non-U.S. currencies because the value of those securities is likely to fluctuate as a result of factors not related to currency fluctuations. See also “Risks Relating to Our Business and Structure- Changes in interest rates, changes in the method for determining LIBOR and the potential replacement of LIBOR may affect our cost of capital and net investment income.”
38
We are a non-diversified investment company within the meaning of the 1940Investment Company Act, and therefore have few restrictions with respect to the proportion of our assets that may be invested in securities of a single industry or issuer.
We are classified as a non-diversified investment company within the meaning of the 1940Investment Company Act, which means that we are not limited by the 1940Investment Company Act with respect to the proportion of our assets that we may invest in securities of a single industry or issuer, excluding limitations on investments in other investment companies. We cannot predict the industries or sectors in which our investment strategy may cause us to concentrate and cannot predict the level of our diversification among industries or issuers. To the extent that we assume large positions in a certain type of security or the securities of a small number of industries or issuers, our net asset value may fluctuate to a greater extent than that of a diversified investment company as a result of changes in the financial condition or the market’s assessment of the security, industry or issuer. We may also be more susceptible to any single economic or regulatory occurrence than a diversified investment company. Beyond RIC diversification requirements, we do not have fixed guidelines for diversification, and our investments could be concentrated in relatively few industries or issuers.
Our portfolio may be concentrated in a limited number of portfolio companies and industries, which will subject us to a risk of significant loss if any of these companies defaults on its obligations under any of its debt instruments or if there is a downturn in a particular industry.
Our portfolio may be concentrated in a limited number of portfolio companies and industries. As a result, the aggregate returns we realize may be significantly and adversely affected if a small number of investments perform poorly or if we need to write down the value of any one investment. Additionally, while we are not targeting any specific industries, our investments may be concentrated in relatively few industries, including the Internet and software industry. As a result, a downturn in any particular industry in which we are invested could also significantly impact the aggregate returns we realize.
Risks Relating to Our Common Stock
Shares of closed-end investment companies, including business development companies,Business Development Companies, may trade at a discount to their net asset value.
Shares of closed-end investment companies, including business development companies,Business Development Companies, may trade at a discount from net asset value. This characteristic of closed-end investment companies and business development companiesBusiness Development Companies is separate and distinct from the risk that our net asset value per share may decline. During the last two years, shares of our common stock have regularly traded below our net asset value. We cannot predict whether our common stock will trade at, above or below net asset value.
Investing in our common stock may involve an above average degree of risk.
The investments we make in accordance with our investment objective may result in a higher amount of risk than alternative investment options and a higher risk of volatility or loss of principal. Our investments in portfolio companies involve higher levels of risk, and therefore, an investment in our shares may not be suitable for someone with lower risk tolerance.
The market price of our common stock may fluctuate significantly.
The market price and liquidity of the market for shares of our common stock may be significantly affected by numerous factors, some of which are beyond our control and may not be directly related to our operating performance. These factors include:
•significant volatility in the market price and trading volume of securities of business development companiesBusiness Development Companies or other companies in our sector, which are not necessarily related to the operating performance of these companies;
•inability to obtain any exemptive relief that may be required by us from the SEC;
•changes in regulatory policies, accounting pronouncements or tax guidelines, particularly with respect to RICs and business development companies;Business Development Companies;
•loss of our business development companyBusiness Development Company or RIC status;
•changes in earnings or variations in operating results;results or distributions that exceed our net investment income;
•increases in expenses associated with defense of litigation and responding to SEC inquiries;
•changes in accounting guidelines governing valuation of our investments;
•changes in the value of our portfolio of investments;investments and any derivative instruments, including as a result of general economic conditions, interest rate shifts and changes in the performance of our portfolio companies;
•any shortfall in revenueinvestment income or net investment income or any increase in losses from levels expected by investors or securities analysts;
39
•departure of our Investment Adviser’s key personnel; and
•general economic trends and other external factors.factors, including those related to the COVID-19 pandemic.
Sales of substantial amounts of our common stock in the public market may have an adverse effect on the market price of our common stock.
Sales of substantial amounts of our common stock, including by large stockholders, or the availability of such common stock for sale, could adversely affect the prevailing market prices for our common stock. If this occurs and continues for a sustained period of time, it could impair our ability to raise additional capital through the sale of securities should we desire to do so.
Certain provisions of our restated certificate of incorporation and our bylaws as well as the Delaware General Corporation Law could deter takeover attempts and have an adverse impact on the price of our common stock.
Our restated certificate of incorporation and our bylaws as well as the Delaware General Corporation Law contain provisions that may have the effect of discouraging a third party from making an acquisition proposal for us. These anti-takeover provisions may inhibit a change in control in circumstances that could give the holders of our common stock the opportunity to realize a premium over the market price for our common stock.
Stockholders may incur dilution if we issue securities to subscribe to, convert to or purchase shares of our common stock.
The 1940Investment Company Act prohibits us from selling shares of our common stock at a price below the current net asset value per share of such stock with certain exceptions. One such exception is prior stockholder approval of issuances of securities to subscribe to, convert to or purchase shares of our common stock even if the subscription, conversion or purchase price per share of our common stock is below the net asset value per share of our common stock at the time of any such subscription, conversion or purchase. Any decision to sell securities to subscribe to, convert to, or purchase shares of our common stock will be subject to the determination by our boardBoard of directorsDirectors that such issuance is in our and our stockholders’ best interests. If we issue securities to subscribe to, convert to or purchase shares of common stock, the exercise or conversion of such securities would increase the number of outstanding shares of our common stock. Any such exercise or conversion would be dilutive on the voting power of existing stockholders, and could be dilutive with regard to distributions and our net asset value, and other economic aspects of the common stock.
Because the number of shares of common stock that could be so issued and the timing of any issuance is not currently known, the actual dilutive effect cannot be predicted; however, the table below illustrates the impact on the net asset value per common share of a business development companyBusiness Development Company that would be experienced upon the exercise of a subscription right to acquire shares of common stock of the business development company.Business Development Company.
Example of Impact of Exercise of Subscription Right to Acquire Common Stock on Net Asset Value Per Share
The example assumes that the business development companyBusiness Development Company has 1,000,000 shares of common stock outstanding, $15,000,000 in total assets and $5,000,000 in total liabilities at the time of the exercise of the subscription right. As a result, the net asset value and net asset value per common share of the business development companyBusiness Development Company are $10,000,000 and $10.00, respectively.
Further, the example assumes that the subscription right permits the holder thereof to acquire 250,000 common shares under the following three different scenarios: (i) with an exercise price equal to a 10% premium to the business development company’sBusiness Development Company’s net asset value per share at the time of exercise, or $11.00 per share, (ii) with an exercise price equal to the business development company’sBusiness Development Company’s net asset value per share at the time of exercise, or $10.00 per share, and (iii) with an exercise price equal to a 10% discount to the business development company’sBusiness Development Company’s net asset value per share at the time of exercise, or $9.00 per
share.
| Subscription Rights Exercise Price | Net Asset Value Per Share Prior To Exercise | Net Asset Value Per Share After Exercise | ||||||||||||
| 10% premium to net asset value per common share | $ | 10.00 | $ | 10.20 | ||||||||||
| Net asset value per common share | $ | 10.00 | $ | 10.00 | ||||||||||
| 10% discount to net asset value per common share | $ | 10.00 | $ | 9.80 | ||||||||||
Although have we chosen to demonstrate the impact on the net asset value per common share of a business development companyBusiness Development Company that would be experienced by existing stockholders of the business development companyBusiness Development Company upon the exercise of a subscription right to acquire shares of common stock of the business development company,Business Development Company, the results noted above would be similar in connection with the exercise or conversion of other securities exercisable or convertible into shares of the business development company’sBusiness Development Company’s common stock. In addition, the example does not take into account the impact of other securities that
40
may be issued in connection with the issuance of exercisable or convertible securities (e.g., the issuance of shares of common stock in conjunction with the issuance of subscription rights to acquire shares of common stock).
Risks RelatedRelating to Our Debt Securitizationthe Mergers
At the effective time of the Merger, or the Effective Time, each share of our common stock issued and outstanding immediately prior to the Effective Time (other than shares owned by OCSL or any of its consolidated subsidiaries, or the Cancelled Shares) will be converted into the right to receive a number of shares of common stock, par value $0.01 per share, of OCSL, or OCSL Common Stock, equal to the Exchange Ratio (as defined below), plus any cash (without interest) in lieu of fractional shares. The market value of such consideration to be received by our stockholders upon completion of the Mergers, or the Merger Consideration, may vary from the closing price of our common stock and OCSL Common Stock, respectively, on the date the Mergers were announced, on the date of the special meeting of our stockholders to consider the adoption of the Merger Agreement and approval of the Mergers, or the Special Meeting, and on the date the Mergers are subjectcompleted. Any change in the market price of OCSL Common Stock prior to riskscompletion of the Mergers will affect the market value of the Merger Consideration that our stockholders will receive upon completion of the Mergers. Additionally, the Exchange Ratio will fluctuate as our and OCSL’s respective net asset values change prior to the closing date of the Mergers.
Accordingly, at the time of the Special Meeting, our stockholders will not know or be able to calculate the market value of the Merger Consideration they would receive upon completion of the Mergers. Neither we nor OCSL is permitted to terminate the Merger Agreement or resolicit the vote of our respective stockholders solely because of changes in the market price of shares of OCSL Common Stock. There will be no adjustment to the Merger Consideration for changes in the market price of shares of OCSL Common Stock.
Changes in the market price of OCSL Common Stock may result from a variety of factors, including, among other things:
•significant volatility in the market price and trading volume of securities of Business Development Companies or other companies in OCSL’s sector, which are not necessarily related to the operating performance of these companies;
•inability to obtain any exemptive relief that may be required by OCSL from the SEC;
•changes in regulatory policies, accounting pronouncements or tax guidelines, particularly with respect to RICs and Business Development Companies;
•loss of OCSL’s Business Development Company or RIC status;
•changes in earnings or variations in operating results or distributions that exceed OCSL’s net investment income;
•increases in expenses associated with defense of litigation and responding to SEC inquiries;
•changes in accounting guidelines governing valuation of OCSL’s investments;
•changes in the 2015 Debt Securitization.value of OCSL’s portfolio of investments and any derivative instruments, including as a result of general economic conditions, interest rate shifts and changes in the performance of OCSL’s portfolio companies;
•departure of Oaktree’s key personnel; and
•general economic trends and other external factors, including those related to the COVID-19 pandemic.
These factors are generally beyond the control of OCSL. The range of high and low closing sales prices per share of OCSL Common Stock as reported on Nasdaq for the three months ended September 30, 2020 was a low of $4.29 and a high of $5.23. However, historical trading prices are not necessarily indicative of future performance. You should obtain current market quotations for shares of OCSL Common Stock prior to the Special Meeting.
Sales of shares of OCSL Common Stock after the completion of the Mergers may cause the trading price of OCSL Common Stock to decline.
For illustrative purposes, based on September 30, 2020 net asset values and excluding transaction costs and other tax-related distributions, OCSL would issue approximately 1.394 shares of OCSL Common Stock pursuant to the Merger Agreement for each share of our common stock outstanding, resulting in pro forma ownership of 22.6% for our current stockholders and 77.4% for current OCSL stockholders. Following completion of the Mergers, certain of our former stockholders may be required to or decide to sell the shares of OCSL Common Stock that they receive pursuant to the Merger Agreement. In addition, OCSL’s stockholders may decide not to hold their shares of OCSL Common Stock after completion of the Mergers. In each case, such sales of OCSL Common Stock could have the effect of depressing the trading price for OCSL
41
Common Stock and may take place promptly following the completion of the Mergers. If this occurs, it could impair OCSL’s ability to raise additional capital through the sale of equity securities should OCSL desire to do so.
Most of our stockholders will experience a reduction in percentage ownership and voting power in the combined company as a result of the 2015 Debt Securitization,Mergers.
Our stockholders will experience a substantial reduction in their percentage ownership interests and effective voting power in respect of the combined company relative to their percentage ownership interests in us prior to the Mergers unless they hold a comparable or greater percentage ownership in OCSL as they do in us prior to the Mergers. Consequently, our stockholders should generally expect to exercise less influence over the management and policies of the combined company following the Mergers than they currently exercise over our management and policies. In addition, prior to completion of the Mergers, subject to certain restrictions in the Merger Agreement, we and OCSL may issue additional shares of our common stock and OCSL Common Stock, respectively, which would further reduce the percentage ownership of the combined company to be held by our current stockholders.
OCSL may be unable to realize the benefits anticipated by the Mergers, including estimated cost savings, or it may take longer than anticipated to achieve such benefits.
The realization of certain benefits anticipated as a result of the Mergers will depend in part on the integration of our investment portfolio with OCSL’s investment portfolio, the integration of our business with OCSL’s business and the ability to rotate certain of our current investments into higher yielding assets. There can be no assurance that our investment portfolio or business can be operated profitably or integrated successfully into OCSL’s operations in a timely fashion or at all. The dedication of management resources to such integration may detract attention from the day-to-day business of the combined company and there can be no assurance that there will not be substantial costs associated with the transition process or there will not be other material adverse effects as a result of these integration efforts. Such effects, including incurring unexpected costs or delays in connection with such integration and failure of our investment portfolio to perform as expected, could have a material adverse effect on the financial results of the combined company.
OCSL also expects to achieve certain synergies and cost savings from the Mergers when the two companies have fully integrated their portfolios. It is possible that the estimates of these potential synergies and cost savings could ultimately be incorrect. The cost savings estimates also assume OCSL will be able to combine our operations and OCSL’s operations in a manner that permits those cost savings to be fully realized. If the estimates turn out to be incorrect or if OCSL is not able to successfully combine our investment portfolio or business with OCSL’s operations, the anticipated synergies and cost savings may not be fully realized or realized at all or may take longer to realize than expected.
The opinion delivered to the Special Committee and our Board of Directors from the financial advisor to the Special Committee will not reflect changes in circumstances between the signing of the Merger Agreement and completion of the Mergers.
The opinion of the financial advisor to a special committee comprised solely of certain of our independent directors, or the Special Committee, was delivered to the Special Committee and our Board of Directors on, and was dated, October 28, 2020. Changes in our or OCSL’s operations and prospects, general market and economic conditions and other factors that may be beyond the control of us or OCSL may significantly alter our value or the price of shares of OCSL Common Stock by the time the Mergers are completed. The opinion does not speak as of the time the Mergers will be completed or as of any date other than the date of such opinion.
If the Mergers do not close, we will not benefit from the expenses incurred in pursuit of the Mergers.
The Mergers may not be completed. If the Mergers are not completed, we will have incurred substantial expenses for which no ultimate benefit will have been received. We have incurred out-of-pocket expenses in connection with the Mergers for investment banking, legal and accounting fees and financial printing and other related charges, much of which will be incurred even if the Mergers are not completed.
The termination of the Merger Agreement could negatively impact us.
If the Merger Agreement is terminated, there may be various consequences, including:
•our business may have been adversely impacted by the failure to pursue other beneficial opportunities due to the focus of management on the Mergers, without realizing any of the anticipated benefits of completing the Mergers;
•the market price of our common stock might decline to the extent that the market price prior to termination reflects a market assumption that the Mergers will be completed; and
•we may not be able to find a party willing to pay an equivalent or more attractive price than the price OCSL agreed to pay in the Mergers.
42
The Merger Agreement limits our ability to pursue alternatives to the Mergers.
The Merger Agreement contains provisions that limit our ability to discuss, facilitate or commit to competing third party proposals to acquire all or a significant part of us. These provisions, which are typical for transactions of this type, include a termination fee of $5.7 million payable by third parties to OCSL under certain circumstances, might discourage a potential competing acquirer that might have an interest in acquiring all or a significant part of us from considering or proposing that acquisition even if it were prepared to pay consideration with a higher per share market price than that proposed in the Mergers or might result in a potential competing acquirer proposing to pay a lower per share price to acquire us than it might otherwise have proposed to pay.
The Mergers are subject to closing conditions, including stockholder approvals, that, if not satisfied or (to the extent legally allowed) waived, will result in the Mergers not being completed, which may result in material adverse consequences to our business and operations.
The Mergers are subject to closing conditions, including certain approvals of our and OCSL’s respective stockholders that, if not satisfied, will prevent the Mergers from being completed. The closing condition that our stockholders adopt the Merger Agreement and approve the Mergers may not be waived under applicable law and must be satisfied for the Mergers to be completed. If our stockholders do not adopt the Merger Agreement and approve the Mergers and the Mergers are not completed, the resulting failure of the Mergers could have a material adverse impact on our business and operations. In addition, the closing condition that OCSL’s stockholders approve the issuance of shares of OCSL Common Stock pursuant to the Merger Agreement may not be waived and must be satisfied for the Mergers to be completed. If OCSL’s stockholders do not approve the issuance of shares of OCSL Common Stock pursuant to the Merger Agreement and the Mergers are not completed, the resulting failure of the Mergers could have a material adverse impact on our business and operations. In addition to the required approvals of our and OCSL’s stockholders, the Mergers are subject to a varietynumber of risks, includingother conditions beyond our control that may prevent, delay or otherwise materially adversely affect completion of the Mergers. We cannot predict whether and when these other conditions will be satisfied.
We may, to the extent legally allowed, waive one or more conditions to the Mergers without resoliciting stockholder approval.
Certain conditions to our obligations to complete the Mergers may be waived, in whole or in part, to the extent legally allowed, either unilaterally or by agreement with OCSL. In the event that any such waiver does not require resolicitation of stockholders, we will have the discretion to complete the Mergers without seeking further stockholder approval. The conditions requiring the approval of our and OCSL’s stockholders, however, cannot be waived.
We will be subject to operational uncertainties and contractual restrictions while the Mergers are pending.
Uncertainty about the effect of the Mergers may have an adverse effect on us and, consequently, on the combinedcompany following completion of the Mergers. These uncertainties may cause those set forth below. We usethat deal with us to seek to change theirexisting business relationships with us. In addition, the term “debt securitization”Merger Agreement restricts us from taking actions that we might otherwise consider to describe a formbe in our best interests. These restrictions may prevent us frompursuing certain business opportunities that may arise prior to the completion of secured borrowing under which an operatingthe Mergers.
The market price of OCSL Common Stock after the Mergers may be affected by factors different from those affecting OCSL Common Stock currently.
Our business and OCSL’s business differ in some respects and, accordingly, the results of operations of the combined company (sometimes referred to as an “originator” or “sponsor”) acquires or originates mortgages, receivables, loans or other assets that earn income, whether on a one-time or recurring basis (collectively, “income producing assets”), and borrows money on a non-recourse basis against a legally separate poolthe market price of loans or other income producing assets. In a typical debt securitization,OCSL Common Stock after the originator transfersMergers may be affected by factors different from those currently affecting the loans or income producing assets to a single-purpose, bankruptcy-remote subsidiary (also referred toindependent results of operations and trading price of each of us and OCSL, such as a “special purpose entity”), which is established solelylarger stockholder base, a different portfolio composition and a different capital structure.
Accordingly, OCSL’s historical trading prices and financial results may not be indicative of such matters for the purpose of holding loans and income producing assets and issuing debt secured by these income producing assets. The special purpose entity completescombined company following the borrowing throughMergers.
General Risk Factors
Economic recessions or downturns, such as the issuance of notes secured by the loans or other assets. The special purpose entitycurrent recession, may issue the notes in the capital markets to a variety of investors, including banks, non-bank financial institutions and other investors. In the 2015 Debt Securitization, institutional investors purchased $222.6 million long-term secured notes, or the 2015 Notes, issued by FS Senior Funding Ltd., our wholly-owned subsidiary, or the 2015 Issuer, in a private placement.
Economic recessions or downturns may result in a prolonged period of holders of the 2015 Notes or the Subordinated 2015 Notes.
43
addition, uncertainty with regard to economic recovery from recessions or downturns could also have a negative impact on our business, financial condition and results of operations.
When recessionary conditions exist, such as current recession, the financial results of middle-market companies, like those in which we invest, typically experience deterioration, which could ultimately lead to difficulty in meeting debt service requirements and an increase in defaults. Additionally, there can be reduced demand for certain of our portfolio companies’ products and services and/or other economic consequences, such as decreased margins or extended payment terms. Further, adverse economic conditions may decrease the value of collateral securing some of our loans and the value of our equity investments. Such conditions may require us to modify the payment terms of our investments, including changes in PIK interest provisions and/or cash interest rates. The performance of certain of our portfolio companies has been, and in the future may be, negatively impacted by these economic or other conditions, which may result in our receipt of reduced interest income from our portfolio companies and/or realized and unrealized losses related to our investments, and, in turn, may adversely affect distributable income and have a material adverse effect on our results of operations.
Global economic, political and market conditions, including downgrades of the U.S. credit rating, may adversely affect our business, results of operations and cash flowsfinancial condition.
The current global financial market situation, as well as various social and political tensions in the United States and around the world, may contribute to increased market volatility, may have long-term effects on the United States and worldwide financial markets and may resultcause economic uncertainties or deterioration in an inabilitythe U.S. and worldwide. The impact of us to make distributions sufficient to maintain our status as a RIC.
EU on January 31, 2020, the transition and its surrounding negotiations are ongoing, which creates uncertainty, which may lead to continued volatility. Additionally, trade wars and volatility in the U.S. repo market, the U.S. high yield bond markets, the Chinese stock markets and global markets for commodities may affect other financial markets worldwide. In addition, while recent government stimulus measures worldwide have reduced volatility in the financial markets, volatility may return as such measures are phased out, and the long-term impacts of such stimulus on fiscal policy and inflation remain unknown. We receive cash fromcannot predict the 2015 Issuer only toeffects of these or similar events in the extent of paymentsfuture on the Class C NotesU.S. and distributions, if any, with respect to the membership interests of the 2015 Issuer as permitted under the 2015 Debt Securitization. The 2015 Issuer may only make payments on suchglobal economies and securities to the extent permitted by the payment priority provisions of the indenture governing the 2015 Debt Securitization, which generally provide that principal payments on the Class C Notes may not be made on any payment date unless all amounts owing under the Class A Notes and Class B Notes are paid in full. If the 2015 Issuer does not meet the asset coverage testsmarkets or the interest coverage test set forth in the documents governing the 2015 Debt Securitization, cash would be diverted from the Class C Notes to first pay the Class A Notes and Class B Notes in amounts sufficient to cause such tests to be satisfied. In the event that we fail to receive cash indirectly from the 2015 Issuer, we could be unable to make such distributions in amounts sufficient to maintain our status as a RIC, or at all.
Future control deficiencies could prevent us from accurately and timely reporting our financial results.
We may identify deficiencies in our internal control over financial reporting in the future, including significant deficiencies and material weaknesses. A “significant deficiency” is a deficiency, or a combination of deficiencies, in internal control over financial reporting that is less severe than a material weakness, yet important enough to merit attention by those responsible for oversight of a company’s financial reporting. A "material weakness" is a deficiency, or a combination of deficiencies, in internal control over financial reporting such investment professionals will continue to serve in their current positions or continue to be authorized personsthat there is a reasonable possibility that a material misstatement of the Investment Adviser. Although suchcompany’s annual or interim financial statements will not be prevented or detected on a timely basis. A deficiency in internal control exists when the design or operation of a control does not allow management or employees, in the normal course of performing their assigned functions, to prevent or detect misstatements on a timely basis.
Our failure to identify deficiencies in our internal control over financial reporting in a timely manner or remediate any deficiencies, or the identification of material weaknesses or significant deficiencies in the future could prevent us from accurately and timely reporting our financial results.
We may experience fluctuations in our quarterly results.
We could experience fluctuations in our quarterly results due to a number of factors, including our ability or inability to make investments in companies that meet our investment professionals will devote such timecriteria, the interest rate payable on the debt securities we acquire, changes in accrual status of our portfolio company investments, distributions, the level of our expenses, variations in and the timing of the recognition of realized and unrealized gains or losses, the degree to which we encounter competition in our market and general economic conditions. As a result of these factors, results for any period should not be relied upon as they determinebeing indicative of performance in their discretion is reasonably necessaryfuture periods.
44
We incur significant costs as a result of being a publicly traded company.
As a publicly-traded company, we incur legal, accounting and other expenses, including costs associated with the periodic reporting requirements applicable to fulfill the obligationsa company whose securities are registered under the collateral management sub-advisory services agreement toExchange Act, as well as additional corporate governance requirements, including requirements under the 2015 Debt Securitization effectively, they will not devote all of their professional time toSarbanes-Oxley Act, and other rules implemented by the affairsSEC and the listing standards of the 2015 Debt Securitization.Nasdaq Global Select Market.
We may be the target of litigation or similar proceedings in the future.
Item 1B. Unresolved Staff Comments
None.
Item 2. Properties
We do not own any real estate or other physical properties material to our operations. Our administrative and principal executive offices are located at 333 South Grand Avenue, 28th Floor, Los Angeles, CA 90071. We believe that our office facilities are suitable and adequate for our business as it is presently conducted.
Item 3. Legal Proceedings
Although we may, from time to time, be involved in litigation arising out of our operations in the normal course of business or otherwise, we are currently not a party to any pending material legal proceedings except as described below.proceedings.
Item 4. Mine Safety Disclosures
Not applicable.
PART II — OTHER INFORMATION
PART II
Item 5. Market for Registrant’s Common Equity, Related Stockholder Matters and Issuer Purchases of Equity Securities
Price Range of Common Stock
Our common stock currently trades on the NASDAQNasdaq Global Select Market under the symbol “OCSI.” Through October 17, 2017, our common stock traded under the symbol “FSFR.” The following table sets forth, for each fiscal quarter during the last two most recently completed fiscal years and for the current fiscal year, the range of high and low sales prices of our common stock as reported on the NASDAQNasdaq Global Select Market:Market, the premium (discount) of sales price to our net asset value, or NAV, and the distributions declared by us for each fiscal quarter:
| Sale Price | |||||||||||||||||||||||||||||||||||
| NAV (1) | High | Low | Premium (Discount) of High Sales Price to NAV (2) | Premium (Discount) of Low Sales Price to NAV (2) | Cash Distribution per Share (3) | ||||||||||||||||||||||||||||||
| Year ended September 30, 2019 | |||||||||||||||||||||||||||||||||||
| First quarter | $ | 9.43 | $ | 8.68 | $ | 7.52 | (8.0) | % | (20.3) | % | $ | 0.155 | |||||||||||||||||||||||
| Second quarter | $ | 9.74 | $ | 8.67 | $ | 7.66 | (11.0) | % | (21.4) | % | $ | 0.155 | |||||||||||||||||||||||
| Third quarter | $ | 9.71 | $ | 8.81 | $ | 8.10 | (9.3) | % | (16.6) | % | $ | 0.155 | |||||||||||||||||||||||
| Fourth quarter | $ | 9.65 | $ | 8.50 | $ | 7.54 | (11.9) | % | (21.9) | % | $ | 0.155 | |||||||||||||||||||||||
| Year ended September 30, 2020 | |||||||||||||||||||||||||||||||||||
| First quarter | $ | 9.71 | $ | 8.40 | $ | 8.00 | (13.5) | % | (17.6) | % | $ | 0.155 | |||||||||||||||||||||||
| Second quarter | $ | 7.17 | $ | 8.50 | $ | 4.28 | 18.5 | % | (40.3) | % | $ | 0.155 | |||||||||||||||||||||||
| Third quarter | $ | 8.47 | $ | 6.70 | $ | 4.88 | (20.9) | % | (42.4) | % | $ | 0.125 | |||||||||||||||||||||||
| Fourth quarter | $ | 9.05 | $ | 7.00 | $ | 6.10 | (22.7) | % | (32.6) | % | $ | 0.125 | |||||||||||||||||||||||
| Year ending September 30, 2021 | |||||||||||||||||||||||||||||||||||
| First quarter (through November 17, 2020) | * | $ | 7.27 | $ | 6.32 | * | * | $0.145 (4) | |||||||||||||||||||||||||||
| High | Low | |||||||
| Fiscal year ended September 30, 2017 | ||||||||
| First quarter | $ | 9.53 | $ | 8.30 | ||||
| Second quarter | $ | 10.37 | $ | 8.50 | ||||
| Third quarter | $ | 8.88 | $ | 7.30 | ||||
| Fourth quarter | $ | 9.09 | $ | 7.89 | ||||
| Fiscal year ended September 30, 2016 | ||||||||
| First quarter | $ | 9.10 | $ | 7.34 | ||||
| Second quarter | $ | 8.68 | $ | 6.53 | ||||
| Third quarter | $ | 8.35 | $ | 7.25 | ||||
| Fourth quarter | $ | 8.99 | $ | 7.94 | ||||
* Not determinable at the time of filing.
(1)NAV per share is determined as of the last day in the relevant quarter and therefore may not reflect the NAV per share on the date of the high and low sales prices. The NAVs shown are based on outstanding shares at the end of each period.
(2)Calculated as the respective high or low sales price less NAV, divided by NAV.
(3)Represents the distribution declared in the specified quarter. We have adopted an “opt out” dividend reinvestment plan for our common stockholders. Distributions by us are generally taxable to U.S. stockholders as ordinary income or capital gains.
(4)On November 13, 2020, our Board of Directors declared a distribution of $0.145 per share payable on December 31, 2020 to stockholders of record on December 15, 2020.
The last reported price for our common stock on December 7, 2017November 17, 2020 was $8.32$7.19 per share.share, which represented a 20.6% discount to our NAV as of September 30, 2020. As of December 7, 2017,November 17, 2020, we had fivesix stockholders of record, which did not include stockholders for whom shares are held in nominee or “street” name.
Sales of Unregistered Securities
We did not engage in any sales of unregistered securities during the fiscal year ended September 30, 2017.
| Frequency | Date Declared | Record Date | Payment Date | Amount per Share | Total Distribution | DRIP Shares Issued (1) | DRIP Shares Value | |||||||
| Monthly | July 10, 2015 | October 6, 2015 | October 15, 2015 | 0.075 | 2,210,008 | 12,080 | 108,563 | |||||||
| Monthly | July 10, 2015 | November 5, 2015 | November 16, 2015 | 0.075 | 2,210,008 | 13,269 | 116,730 | |||||||
| Monthly | November 30, 2015 | December 11, 2015 | December 22, 2015 | 0.075 | 2,210,007 | 11,103 | 94,563 | |||||||
| Monthly | November 30, 2015 | January 4, 2016 | January 15, 2016 | 0.075 | 2,210,007 | 8,627 | 61,079 | |||||||
| Monthly | November 30, 2015 | February 5, 2016 | February 16, 2016 | 0.075 | 2,210,008 | 4,542 | 32,923 | |||||||
| Monthly | February 8, 2016 | March 15, 2016 | March 31, 2016 | 0.075 | 2,210,008 | 4,383 | 34,578 | |||||||
| Monthly | February 8, 2016 | April 15, 2016 | April 29, 2016 | 0.075 | 2,210,008 | 4,452 | 35,033 | |||||||
| Monthly | February 8, 2016 | May 13, 2016 | May 31, 2016 | 0.075 | 2,210,007 | 4,256 | 33,494 | |||||||
| Monthly | May 6, 2016 | June 15, 2016 | June 30, 2016 | 0.075 | 2,210,007 | 5,822 | 46,881 | |||||||
| Monthly | May 6, 2016 | July 15, 2016 | July 29, 2016 | 0.075 | 2,210,008 | 3,627 | 30,745 | |||||||
| Monthly | May 6, 2016 | August 15, 2016 | August 31, 2016 | 0.075 | 2,210,008 | 3,260 | 29,002 | |||||||
| Monthly | August 4, 2016 | September 15, 2016 | September 30, 2016 | 0.075 | 2,210,008 | 3,078 | 26,811 | |||||||
| Monthly | August 4, 2016 | October 14, 2016 | October 31, 2016 | 0.075 | 2,210,008 | 3,146 | 26,985 | |||||||
| Monthly | August 4, 2016 | November 15, 2016 | November 30, 2016 | 0.075 | 2,210,008 | 2,986 | 26,909 | |||||||
| Monthly | October 19, 2016 | December 15, 2016 | December 30, 2016 | 0.075 | 2,210,008 | 3,438 | 30,586 | |||||||
| Monthly | October 19, 2016 | January 31, 2017 | January 31, 2017 | 0.075 | 2,210,008 | 2,905 | 29,363 | |||||||
| Monthly | October 19, 2016 | February 15, 2017 | February 28, 2017 | 0.075 | 2,210,008 | 2,969 | 26,427 | |||||||
| Monthly | February 6, 2017 | March 15, 2017 | March 31, 2017 | 0.040 | 1,178,671 | 1,508 | 13,253 | |||||||
| Quarterly | February 6, 2017 | June 15, 2017 | June 30, 2017 | 0.190 | 5,598,686 | 6,840 | 55,221 | |||||||
| Quarterly | August 7, 2017 | September 15, 2017 | September 29, 2017 | 0.190 | 5,598,686 | 6,991 | 61,887 | |||||||
| Quarterly | August 7, 2017 | December 15, 2017 | December 29, 2017 | 0.190 | ||||||||||
2020.
Stock Performance Graph
The following graph compares the cumulative 5-year total return provided to shareholders on Oaktree Strategic Income Corporation’s common stock relative to the cumulative total returns of the NYSE Composite index,Standard & Poor’s 500 Index, the NASDAQRussell 2000 Financial indexServices Index and a customized peer group of our two direct competitors, Solar Senior Capital Ltd. and PennantPark Floating Rate Capital Ltd.the Wells Fargo BDC Total Return Index. An investment of $100 (with reinvestment of all dividends) is assumed to have been made in our common stock on July 12, 2013, the date our common stock was listed, and in each index and in the peer group at Juneon September 30, 2013,2015 and its relative performance is tracked through September 30, 2017.2020. The stock performance graph shows returns during management by the Former Adviser.Adviser for the period from September 30, 2015 through October 16, 2017 and during management by Oaktree and its affiliates for the period from October 17, 2017 through September 30, 2020.
46
| 7/12/13 | 9/13 | 12/13 | 3/14 | 6/14 | 9/14 | 12/14 | 3/15 | 6/15 | ||||||||||
| Oaktree Strategic Income Corporation | 100.00 | 95.69 | 95.04 | 104.85 | 104.23 | 90.00 | 80.14 | 85.71 | 76.59 | |||||||||
| NYSE Composite | 100.00 | 105.64 | 114.82 | 116.93 | 122.75 | 120.34 | 122.57 | 123.97 | 123.72 | |||||||||
| NASDAQ Financial | 100.00 | 104.75 | 117.25 | 118.72 | 117.66 | 114.96 | 124.17 | 126.50 | 131.77 | |||||||||
| Peer Group | 100.00 | 96.46 | 98.55 | 97.72 | 100.79 | 96.61 | 97.25 | 103.96 | 104.49 | |||||||||
| 9/15 | 12/15 | 3/16 | 6/16 | 9/16 | 12/16 | 3/17 | 6/17 | 9/17 | ||||||||||
| Oaktree Strategic Income Corporation | 73.94 | 75.19 | 70.94 | 73.29 | 80.95 | 84.47 | 87.36 | 82.74 | 91.28 | |||||||||
| NYSE Composite | 112.91 | 117.55 | 119.12 | 123.31 | 126.85 | 131.59 | 137.62 | 141.83 | 148.09 | |||||||||
| NASDAQ Financial | 122.67 | 128.11 | 124.96 | 127.04 | 137.93 | 161.48 | 160.89 | 169.33 | 180.84 | |||||||||
| Peer Group | 94.94 | 95.11 | 99.33 | 109.35 | 116.81 | 124.87 | 131.45 | 131.22 | 137.57 | |||||||||
| September 30, 2015 | September 30, 2016 | September 30, 2017 | September 30, 2018 | September 30, 2019 | September 30, 2020 | |||||||||||||||
| Oaktree Strategic Income Corporation | 100.00 | 109.48 | 123.46 | 130.83 | 134.48 | 114.79 | ||||||||||||||
| S&P 500 | 100.00 | 115.43 | 136.91 | 161.43 | 168.30 | 193.80 | ||||||||||||||
| Russell 2000 Financial Services | 100.00 | 115.91 | 141.96 | 151.60 | 149.55 | 115.08 | ||||||||||||||
| Wells Fargo BDC Total Return Index | 100.00 | 121.53 | 133.53 | 137.98 | 148.03 | 114.90 | ||||||||||||||
We did not repurchase shares of our common stock during the years ended September 30, 2017, 2016,2020 and 2015, are below:2019.
47
| For the three months ended | ||||||||||||||||||||||||||||||||||||
| (dollars in thousands, except per share amounts) | September 30, 2017 | June 30, 2017 | March 31, 2017 | December 31, 2016 | September 30, 2016 | June 30, 2016 | March 31, 2016 | December 31, 2015 | September 30, 2015 | June 30, 2015 | March 31, 2015 | December 31, 2014 | ||||||||||||||||||||||||
| Total investment income | $ | 11,820 | $ | 12,171 | $ | 11,020 | $ | 11,561 | $ | 13,203 | $ | 13,114 | $ | 13,195 | $ | 13,914 | $ | 14,068 | $ | 14,140 | $ | 11,341 | $ | 11,923 | ||||||||||||
| Net investment income | 5,521 | 5,930 | 5,086 | 5,884 | 6,342 | 6,164 | 5,785 | 7,002 | 7,402 | 7,086 | 6,294 | 7,496 | ||||||||||||||||||||||||
| Net realized and unrealized gain (loss) | (19,984 | ) | (5,791 | ) | (254 | ) | (5,159 | ) | 2,251 | (5,248 | ) | (6,445 | ) | (20,308 | ) | (7,115 | ) | (4,632 | ) | 393 | (1,012 | ) | ||||||||||||||
| Net increase (decrease) in net assets resulting from operations | (14,463 | ) | 139 | 4,832 | 725 | 8,593 | 916 | (660 | ) | (13,306 | ) | 287 | 2,454 | 6,687 | 6,484 | |||||||||||||||||||||
| Net assets | 293,636 | 313,698 | 319,158 | 319,924 | 325,829 | 323,866 | 329,580 | 334,661 | 356,807 | 361,782 | 368,168 | 370,322 | ||||||||||||||||||||||||
| Total investment income per common share | $ | 0.40 | $ | 0.41 | $ | 0.37 | $ | 0.39 | $ | 0.45 | $ | 0.45 | $ | 0.45 | $ | 0.47 | $ | 0.48 | $ | 0.48 | $ | 0.38 | $ | 0.40 | ||||||||||||
| Net investment income per common share | 0.19 | 0.20 | 0.17 | 0.20 | 0.22 | 0.21 | 0.20 | 0.24 | 0.25 | 0.24 | 0.21 | 0.25 | ||||||||||||||||||||||||
| Earnings (loss) per common share | (0.49 | ) | — | 0.16 | 0.02 | 0.29 | 0.03 | (0.02 | ) | (0.45 | ) | 0.01 | 0.08 | 0.23 | 0.22 | |||||||||||||||||||||
| Net asset value per common share at period end | 9.97 | 10.65 | 10.83 | 10.86 | 11.06 | 10.99 | 11.18 | 11.36 | 12.11 | 12.28 | 12.49 | 12.57 | ||||||||||||||||||||||||
The following table is intended to assist stockholders in understanding the costs and expenses that an investor in shares of our common stock will bear directly or indirectly. We caution you that some of the percentages indicated in the table below are estimates and may vary. Except where the context suggests otherwise, whenever this Form 10-K contains a reference to fees or expenses paid by “you” or “us”, or that “we” will pay fees or expenses, stockholders will indirectly bear such fees or expenses as investors in us. Such expenses also include those of our consolidated subsidiaries.
| Stockholder transaction expenses: | ||||||||||||||||||||||||||||||||||||||
| Sales load (as a percentage of offering price) | —% | (1) | ||||||||||||||||||||||||||||||||||||
| Offering expenses (as a percentage of offering price) | —% | (2) | ||||||||||||||||||||||||||||||||||||
| Dividend reinvestment plan fees | Up to $15 | (3) | ||||||||||||||||||||||||||||||||||||
| Total stockholder transaction expenses (as a percentage of offering price) | —% | (4) | ||||||||||||||||||||||||||||||||||||
| Annual expenses (as a percentage of net assets attributable to common stock): | ||||||||||||||||||||||||||||||||||||||
| Base management fees | 1.93% | (5) | ||||||||||||||||||||||||||||||||||||
| Incentive fees (17.5%) | 0.70% | (6) | ||||||||||||||||||||||||||||||||||||
| Interest payments on borrowed funds (including other costs of servicing and offering debt securities) | 3.15% | (7) | ||||||||||||||||||||||||||||||||||||
| Other expenses | 1.39% | (8) | ||||||||||||||||||||||||||||||||||||
| Acquired fund fees and expenses | 1.62% | (9) | ||||||||||||||||||||||||||||||||||||
| Total annual expenses | 8.79% | (10) | ||||||||||||||||||||||||||||||||||||
__________
(1)If applicable, the prospectus or prospectus supplement relating to an offering of our common stock will disclose the applicable sales load.
(2)In the event that we conduct an offering of our securities, a corresponding prospectus supplement will disclose the estimated offering expenses.
(3)The expenses of administering our dividend reinvestment plan are included in “Other expenses.” The plan administrator’s fees under the plan are paid by us. If a participant elects by notice to the plan administrator in advance of termination to have the plan administrator sell part or all of the shares held by the plan administrator in the participant’s account and remit the proceeds to the participant, the plan administrator is authorized to deduct a transaction fee of up to $15 plus a $0.10 per share fee from the proceeds.
(4)Total stockholder transaction expenses may include sales load and will be disclosed in a future prospectus supplement, if any.
(5)Under the Investment Advisory Agreement, the base management fee is calculated at an annual rate of 1.00% of the average value of our total gross assets at the end of the two most recently completed quarters, including any investment made with borrowings, but excluding cash and cash equivalents. For purposes of this table, we have assumed $514.9
million of total gross assets (excluding cash and cash equivalents), which was the actual amount of our total gross assets as of September 30, 2020. See “Item 1. Business - Investment Advisory and Management Agreement - Management Fee” for additional information.
(6)The incentive fee consists of two parts. Under the Investment Advisory Agreement, the incentive fee on income is calculated and payable quarterly in arrears based upon our pre-incentive fee net investment income for the immediately preceding quarter. The payment of the incentive fee on income is subject to payment of a preferred return to investors each quarter (i.e., a “hurdle rate”), expressed as a rate of return on the value of our net assets at the end of the most recently completed quarter, of 1.50%, subject to a “catch up” feature. See “Item 1. Business - Investment Advisory and Management Agreement - Management Fee” for additional information.
Under the Investment Advisory Agreement, the second part of the incentive fee (the “capital gains incentive fee”) is determined and payable in arrears as of the end of each fiscal year (or upon termination of the Investment Advisory Agreement, as of the termination date) commencing with the fiscal year ended September 30, 2019 and equals 17.5% of our realized capital gains, if any, on a cumulative basis from the beginning of the fiscal year ended September 30, 2019 through the end of each fiscal year, computed net of all realized capital losses and unrealized capital depreciation on a cumulative basis, less the aggregate amount of any previously paid capital gains incentive fees under the Investment Advisory Agreement. Any realized capital gains or losses and unrealized capital depreciation with respect to our portfolio as of the end of the fiscal year ended September 30, 2018 are excluded from the calculations of the second part of the incentive fee.
48
For the two-year period commencing on October 17, 2017, OCM agreed to waive, to the extent necessary, any management or incentive fees payable to OCM that exceed what would have been paid to the Former Adviser in the aggregate under the Former Investment Advisory Agreement. For illustrative purposes, however, the table above assumes that no management or incentive fees payable to OCM were waived by OCM pursuant to this waiver.
The incentive fee referenced in the table above is based on actual amounts of the incentive fee on income incurred during the year ended September 30, 2020 and the capital gains incentive fee payable under the Investment Advisory Agreement as of September 30, 2020.
(7)“Interest payments on borrowed funds (including other costs of servicing and offering debt securities)” is calculated as the weighted average interest rate in effect as of September 30, 2020 multiplied by the actual debt outstanding as of September 30, 2020 of $267.6 million. The weighted average interest rate for our borrowings as of September 30, 2020 was 2.6% (exclusive of deferred financing costs). The amount of leverage that we employ at any particular time will depend on, among other things, our Board of Directors’ assessment of market and other factors at the time of any proposed borrowing.
(8)“Other expenses” are based on estimated amounts for the current fiscal year. These expenses include certain expenses allocated to us under the Investment Advisory Agreement, including travel expenses incurred by the Adviser’s personnel in connection with investigating and monitoring our investments, such as investment due diligence.
(9)Our stockholders indirectly bear the expenses of underlying funds or other investment vehicles that would be an investment company under section 3(a) of the Investment Company Act but for the exceptions to that definition provided for in sections 3(c)(1) and 3(c)(7) of the Investment Company Act ("Acquired Funds") in which we invest. This amount includes the annual expenses of the OCSI Glick JV. There are no fees paid by the OCSI Glick JV to the Adviser. See "Management Discussion and Analysis - OCSI Glick JV LLC" and Note 3 to our Consolidated Financial Statements in this Form 10-K for more information on the OCSI Glick JV. The annual expenses of the OCSI Glick JV include interest payments on the Subordinated Notes held by GF Debt Funding, which represented 4.8% of such expenses, and exclude interest payments on the Subordinated Notes held by us. During the year ended September 30, 2020, the Subordinated Notes did not pay interest during the March 31, 2020, June 30, 2020 and September 30, 2020 quarters and was on non-accrual status as of September 30, 2020.
(10)“Total annual expenses” is presented as a percentage of net assets attributable to common stockholders because our common stockholders bear all of our fees and expenses and includes all fees and expenses of our consolidated subsidiaries. “Total annual expenses” does not reflect any potential provision (benefit) for income taxes because of the uncertainties associated with determining such amounts in future periods.
Example
The following example demonstrates the projected dollar amount of total cumulative expenses that would be incurred over various periods with respect to a hypothetical investment in our common stock assuming that we hold no cash or liabilities other than debt. In calculating the following expense amounts, we have assumed that our annual operating expenses remain at the levels set forth in the table above. The example does not include any sales load or offering expenses.
| An investor would pay the following expenses on a $1,000 investment | 1 Year | 3 Years | 5 Years | 10 Years | |||||||||||||||||||
| Assuming a 5% annual return (assumes no return from net realized capital gains) | $ | 81 | $ | 244 | $ | 411 | $ | 840 | |||||||||||||||
| Assuming a 5% annual return (assumes return entirely from net realized capital gains) | $ | 98 | $ | 293 | $ | 489 | $ | 978 | |||||||||||||||
The example and the expenses in the tables above should not be considered a representation of our future expenses, and actual expenses may be greater or less than those shown. While the example assumes, as required by the SEC, a 5% annual return, our performance will vary and may result in a return greater or less than 5%. The incentive fee based on pre-incentive fee net investment income under the Investment Advisory Agreement, which, assuming a 5% annual return, would either not be payable or would have an insignificant impact on the expense amounts shown above, is not included in the example. If we achieve sufficient returns on our investments, including through the realization of capital gains, to trigger a greater incentive fee, our expenses, and returns to our investors, would be higher. For purposes of this example, we have assumed that as of October 1, 2020, the sum of our realized capital losses and unrealized capital depreciation on a cumulative basis since October 1, 2018 equals zero. In addition, while the example assumes reinvestment of all distributions at NAV, participants in our dividend reinvestment plan will receive a number of shares of our common stock, determined by dividing the total dollar amount of the cash distribution payable to a participant by either (i) the greater of (a) the current NAV per share of our common stock and (b) 95% of the market price per share of our common stock at the close of trading on the payment date fixed by our Board of Directors in the event that we use newly issued shares to satisfy the share requirements of the dividend reinvestment plan or (ii) the average purchase price, excluding any brokerage charges or other charges, of all shares of common
49
stock purchased by the administrator of the dividend reinvestment plan in the event that shares are purchased in the open market to satisfy the share requirements of the dividend reinvestment plan, which may be at, above or below NAV.
Financial Highlights
| Year ended September 30, 2020 | Year ended September 30, 2019 | Year ended September 30, 2018 (1) | Year ended September 30, 2017 | Year ended September 30, 2016 | Year ended September 30, 2015 | Year ended September 30, 2014 | Period from June 29, 2013 (commencement of operations) through September 30, 2013 | |||||||||||||||||||||||||||||||||||||||||||
| Net asset value per share at beginning of period | $ | 9.65 | $ | 10.04 | $ | 9.97 | $ | 11.06 | $ | 12.11 | $ | 12.65 | $ | 15.11 | $ | — | ||||||||||||||||||||||||||||||||||
| Net investment income (2) | 0.55 | 0.72 | 0.67 | 0.76 | 0.86 | 0.96 | 0.62 | — | ||||||||||||||||||||||||||||||||||||||||||
| Net unrealized appreciation (depreciation) (2) | (0.24) | (0.47) | 0.97 | (0.60) | (0.58) | (0.43) | 0.24 | 0.12 | ||||||||||||||||||||||||||||||||||||||||||
| Net realized gains (losses) (2) | (0.35) | (0.02) | (0.94) | (0.45) | (0.43) | 0.01 | 0.14 | 0.01 | ||||||||||||||||||||||||||||||||||||||||||
| Distributions of net investment income to stockholders | (0.56) | (0.62) | (0.56) | (0.80) | (0.90) | (1.07) | (0.62) | — | ||||||||||||||||||||||||||||||||||||||||||
| Tax return of capital | — | — | (0.07) | — | — | — | (0.39) | — | ||||||||||||||||||||||||||||||||||||||||||
| Net issuance of common stock | — | — | — | — | — | (0.01) | (2.45) | 14.98 | ||||||||||||||||||||||||||||||||||||||||||
| Net asset value per share at end of period | $ | 9.05 | $ | 9.65 | $ | 10.04 | $ | 9.97 | $ | 11.06 | $ | 12.11 | $ | 12.65 | $ | 15.11 | ||||||||||||||||||||||||||||||||||
| Per share market value at beginning of period | $ | 8.25 | $ | 8.65 | $ | 8.80 | $ | 8.56 | $ | 8.73 | $ | 11.82 | $ | 13.54 | $ | 15.00 | ||||||||||||||||||||||||||||||||||
| Per share market value at end of period | $ | 6.51 | $ | 8.25 | $ | 8.65 | $ | 8.80 | $ | 8.56 | $ | 8.73 | $ | 11.82 | $ | 13.54 | ||||||||||||||||||||||||||||||||||
| Total return (3) | (13.98) | % | 2.83 | % | 5.90 | % | 12.51 | % | 9.44 | % | (15.76) | % | (8.20) | % | (9.73) | % | ||||||||||||||||||||||||||||||||||
| Common shares outstanding at beginning of period | 29,466,768 | 29,466,768 | 29,466,768 | 29,466,768 | 29,466,768 | 29,466,768 | 6,666,768 | 100 | ||||||||||||||||||||||||||||||||||||||||||
| Common shares outstanding at end of period | 29,466,768 | 29,466,768 | 29,466,768 | 29,466,768 | 29,466,768 | 29,466,768 | 29,466,768 | 6,666,768 | ||||||||||||||||||||||||||||||||||||||||||
| Net assets at beginning of period | $ | 284,450,006 | $ | 295,745,420 | $ | 293,636,434 | $ | 325,829,394 | $ | 356,807,103 | $ | 372,677,678 | $ | 100,705,269 | $ | 1,500 | ||||||||||||||||||||||||||||||||||
| Net assets at end of period | $ | 266,681,411 | $ | 284,450,006 | $ | 295,745,420 | $ | 293,636,434 | $ | 325,829,394 | $ | 356,807,103 | $ | 372,677,678 | $ | 100,705,269 | ||||||||||||||||||||||||||||||||||
| Average net assets (4) | $ | 257,184,310 | $ | 286,712,068 | $ | 294,285,497 | $ | 316,440,902 | $ | 332,486,362 | $ | 368,839,422 | $ | 132,873,801 | $ | 80,133,138 | ||||||||||||||||||||||||||||||||||
| Ratio of net investment income to average net assets | 6.30 | % | 7.37 | % | 6.72 | % | 7.09 | % | 7.59 | % | 7.67 | % | 4.34 | % | 0.08 | % | ||||||||||||||||||||||||||||||||||
| Ratio of total expenses to average net assets | 9.20 | % | 10.11 | % | 9.72 | % | 7.71 | % | 8.44 | % | 6.29 | % | 5.20 | % | 2.14 | % | ||||||||||||||||||||||||||||||||||
| Ratio of net expenses to average net assets | 9.07 | % | 9.94 | % | 9.48 | % | 7.63 | % | 8.44 | % | 6.29 | % | 5.08 | % | 2.14 | % | ||||||||||||||||||||||||||||||||||
| Ratio of portfolio turnover to average investments at fair value | 41.25 | % | 34.11 | % | 74.88 | % | 46.80 | % | 28.02 | % | 21.48 | % | 78.96 | % | 16.44 | % | ||||||||||||||||||||||||||||||||||
| Weighted average outstanding debt (5) | $ | 306,450,172 | $ | 290,086,937 | $ | 269,760,689 | $ | 267,608,526 | $ | 303,204,218 | $ | 243,240,691 | $ | 49,833,018 | $ | — | ||||||||||||||||||||||||||||||||||
| Average debt per share (2) | $ | 10.40 | $ | 9.84 | $ | 9.15 | $ | 9.08 | $ | 10.29 | $ | 8.25 | $ | 5.36 | $ | — | ||||||||||||||||||||||||||||||||||
| Asset coverage ratio at end of period (6) | 199.66 | % | 196.54 | % | 207.52 | % | 211.67 | % | 211.43 | % | 210.46 | % | — | — | ||||||||||||||||||||||||||||||||||||
| (1) | Beginning on October 17, 2017, the Company is externally managed by Oaktree or its affiliates. Prior to October 17, 2017, the Company was externally managed by the Former Adviser. | ||||
| (2) | Calculated based upon weighted average shares outstanding for the period. | ||||
| (3) | Total return equals the increase or decrease of ending market value over beginning market value, plus distributions, divided by the beginning market value, assuming dividend reinvestment prices obtained under the Company's DRIP. Total return does not include sales load. | ||||
| (4) | Calculated based upon the weighted average net assets for the period. | ||||
| (5) | Calculated based upon the weighted average outstanding debt for the period. | ||||
| (6) | Based on outstanding senior securities of $267.6 million, $294.7 million, $275.1 million, $263.0 million, $292.4 million and $323.0 million as of September 30, 2020, 2019, 2018, 2017, 2016 and 2015, respectively. As of September 30, 2014 and 2013, the Company did not have any outstanding senior securities. | ||||
50
Item 6. Selected Financial Data
The table below sets forth our selected historical financial data for the periods indicated. Our historical results are not necessarily indicative of future results. The selected financial data in this section is not intended to replace the financial statements and is qualified in its entirety by the financial statements and related notes included in this filing.
The following selected financial data should be read together with our Consolidated Financial Statements and the related notes and the discussion under “Management’sinformation contained in Part II, Item 7 of this Form 10-K, “Management’s Discussion and Analysis of Financial Condition and Results of Operations” which is included elsewhereOperations,” and the audited financial statements and the notes thereto in Part II, Item 8 of this annual report on Form 10-K.10-K, "Consolidated Financial Statements and Supplementary Data." The financial information as of and for the fiscal years ended September 30, 2020, 2019, 2018, 2017 2016, 2015 and 2014 and as of September 30, 2013 and for the period from the commencement of operations, June 29, 2013, through September 30, 20132016 set forth below was derived from our audited financial statements and related notes, for Oaktree Strategic Income Corporation.which are included in "Consolidated Financial Statements and Supplementary Data" in Part II, Item 8 of this Form 10-K.
| As of and for the Years Ended | ||||||||||||||||||||||||||||||||
September 30, 2020 | September 30, 2019 | September 30, 2018 | September 30, 2017 | September 30, 2016 | ||||||||||||||||||||||||||||
| Statement of Operations data: | ||||||||||||||||||||||||||||||||
| Total investment income | $ | 39,534,044 | $ | 49,627,470 | $ | 47,670,547 | $ | 46,571,856 | $ | 53,426,234 | ||||||||||||||||||||||
| Base management fee | 5,642,982 | 5,875,236 | 5,657,786 | 5,654,699 | 6,134,304 | |||||||||||||||||||||||||||
| Part I incentive fee | 1,873,858 | 4,293,999 | 2,923,076 | 3,236,320 | 5,211,729 | |||||||||||||||||||||||||||
| Part II incentive fee | — | — | — | — | — | |||||||||||||||||||||||||||
| Fees waived | (322,121) | (489,275) | (702,261) | (6,232) | (6,232) | |||||||||||||||||||||||||||
| All other expenses | 16,135,825 | 18,807,259 | 20,020,614 | 15,265,376 | 16,793,749 | |||||||||||||||||||||||||||
| Net investment income | 16,203,500 | 21,140,251 | 19,771,332 | 22,421,693 | 25,292,684 | |||||||||||||||||||||||||||
| Net unrealized appreciation (depreciation) | (7,158,267) | (13,705,282) | 28,615,535 | (17,803,657) | (16,980,524) | |||||||||||||||||||||||||||
| Net realized gains (losses) | (10,312,436) | (460,987) | (27,713,818) | (13,384,915) | (12,769,777) | |||||||||||||||||||||||||||
| Net increase (decrease) in net assets resulting from operations | (1,267,203) | 6,973,982 | 20,673,049 | (8,766,879) | (4,457,617) | |||||||||||||||||||||||||||
| Per share data: | ||||||||||||||||||||||||||||||||
| Net asset value per common share at period end | $ | 9.05 | $ | 9.65 | $ | 10.04 | $ | 9.97 | $ | 11.06 | ||||||||||||||||||||||
| Market price at period end | 6.51 | 8.25 | 8.65 | 8.80 | 8.56 | |||||||||||||||||||||||||||
| Net investment income | 0.55 | 0.72 | 0.67 | 0.76 | 0.86 | |||||||||||||||||||||||||||
| Net realized and unrealized gains (losses) | (0.59) | (0.48) | 0.03 | (1.06) | (1.01) | |||||||||||||||||||||||||||
| Net increase (decrease) in net assets resulting from operations | (0.04) | 0.24 | 0.70 | (0.30) | (0.15) | |||||||||||||||||||||||||||
| Distributions per common share | 0.56 | 0.62 | 0.63 | 0.80 | 0.90 | |||||||||||||||||||||||||||
| Balance Sheet data at period end: | ||||||||||||||||||||||||||||||||
| Total investments at fair value | $ | 502,293,365 | $ | 597,104,447 | $ | 556,841,828 | $ | 560,436,660 | $ | 573,604,381 | ||||||||||||||||||||||
| Cash, cash equivalents and restricted cash | 29,500,427 | 14,051,632 | 16,431,787 | 43,012,387 | 28,815,679 | |||||||||||||||||||||||||||
| Other assets | 12,575,852 | 12,177,635 | 11,858,255 | 5,213,604 | 19,997,081 | |||||||||||||||||||||||||||
| Total assets | 544,369,644 | 623,333,714 | 585,131,870 | 608,662,651 | 622,417,141 | |||||||||||||||||||||||||||
| Total liabilities | 277,688,233 | 338,883,708 | 289,386,450 | 315,026,217 | 296,587,747 | |||||||||||||||||||||||||||
| Total net assets | 266,681,411 | 284,450,006 | 295,745,420 | 293,636,434 | 325,829,394 | |||||||||||||||||||||||||||
| Other data: | ||||||||||||||||||||||||||||||||
| Weighted average yield on debt investments (1) | 6.30 | % | 7.42 | % | 7.70 | % | 7.52 | % | 8.58 | % | ||||||||||||||||||||||
| Number of portfolio companies at period end | 78 | 84 | 75 | 67 | 63 | |||||||||||||||||||||||||||
(1)Weighted average yield is calculated based upon our debt investments at fair value at the end of the period.
51
| As of and for the Year Ended September 30, 2017 | As of and for the Year Ended September 30, 2016 | As of and for the Year Ended September 30, 2015 | As of and for the Year Ended September 30, 2014 | As of September 30 and for the period from June 29, 2013 through September 30, 2013 | ||||||||||||||||
| Statement of Operations data: | ||||||||||||||||||||
| Total investment income | $ | 46,571,856 | $ | 53,426,234 | $ | 51,472,531 | $ | 12,516,674 | $ | 456,417 | ||||||||||
| Base management fee, net | 5,648,467 | 6,128,072 | 5,931,155 | 1,602,617 | 61,379 | |||||||||||||||
| Part I incentive fee | 3,236,320 | 5,211,729 | 5,689,371 | 708,235 | — | |||||||||||||||
| Part II incentive fee | — | — | (766,552 | ) | 774,841 | 137,609 | ||||||||||||||
| All other expenses | 15,265,376 | 16,793,749 | 12,340,527 | 3,667,100 | 241,723 | |||||||||||||||
| Net investment income | 22,421,693 | 25,292,684 | 28,278,030 | 5,763,881 | 15,706 | |||||||||||||||
| Net realized and unrealized gain (loss) on investments | (31,188,572 | ) | (29,750,301 | ) | (12,365,948 | ) | 3,600,076 | 688,043 | ||||||||||||
| Net increase (decrease) in net assets resulting from operations | (8,766,879 | ) | (4,457,617 | ) | 15,912,082 | 9,363,957 | 703,749 | |||||||||||||
| Per share data: | ||||||||||||||||||||
| Net asset value per common share at period end | $ | 9.97 | $ | 11.06 | $ | 12.11 | $ | 12.65 | $ | 15.11 | ||||||||||
| Market price at period end | 8.80 | 8.56 | 8.73 | 11.82 | 13.54 | |||||||||||||||
| Net investment income (2) | 0.76 | 0.86 | 0.96 | 0.62 | — | |||||||||||||||
| Net realized and unrealized gain (loss) on investments (2) | (1.06 | ) | (1.01 | ) | (0.42 | ) | 0.39 | 0.13 | ||||||||||||
| Net increase (decrease) in net assets resulting from operations (2) | (0.30 | ) | (0.15 | ) | 0.54 | 1.01 | 0.13 | |||||||||||||
| Distributions per common share | 0.80 | 0.90 | 1.07 | 1.01 | — | |||||||||||||||
| Balance Sheet data at period end: | ||||||||||||||||||||
| Total investments at fair value | $ | 560,436,660 | $ | 573,604,381 | $ | 623,647,474 | $ | 300,001,397 | $ | 48,653,617 | ||||||||||
| Cash, cash equivalents and restricted cash | 43,012,387 | 28,815,679 | 52,692,097 | 109,557,165 | 52,346,831 | |||||||||||||||
| Other assets | 5,213,604 | 19,997,081 | 21,370,913 | 2,946,782 | 449,596 | |||||||||||||||
| Total assets | 608,662,651 | 622,417,141 | 697,710,484 | 412,505,344 | 101,450,044 | |||||||||||||||
| Total liabilities | 315,026,217 | 296,587,747 | 340,903,381 | 39,827,666 | 744,775 | |||||||||||||||
| Total net assets | 293,636,434 | 325,829,394 | 356,807,103 | 372,677,678 | 100,705,269 | |||||||||||||||
| Other data: | ||||||||||||||||||||
| Weighted average yield on debt investments(1) | 7.52 | % | 8.58 | % | 8.22 | % | 7.27 | % | 6.81 | % | ||||||||||
| Number of portfolio companies at period end | 67 | 63 | 64 | 48 | 8 | |||||||||||||||
Item 7. Management's Discussion and Analysis of Financial Condition and Results of Operations
The following discussion and analysis should be read in conjunctionconnection with theour Consolidated Financial Statements and the notes thereto included elsewhere in this annual report on Form 10-K.
Some of the statements in this annual report on Form 10-K constitute forward-looking statements because they relate to future events or our future performance or financial condition. The forward-looking statements contained in this annual report on Form 10-K may include statements as to:
•our future operating results and distribution projections;
•the ability of our Investment AdviserOaktree to reposition our portfolio and to implement our Investment Adviser’sOaktree’s future plans with respect to our business;
•the ability of Oaktree and its affiliates to attract and retain highly talented professionals;
•our business prospects and the prospects of our portfolio companies;
•the impact of the investments that we expect to make;
•the ability of our portfolio companies to achieve their objectives;
•our expected financings and investments;investments and additional leverage we may seek to incur in the future;
•the adequacy of our cash resources and working capital;
•the timing of cash flows, if any, from the operations of our portfolio companies; and
•the cost or potential outcome of any litigation to which we may be a party.
In addition, words such as “anticipate,” “believe,” “expect,” “seek,” “plan,” “should,” “estimate,” “project” and “intend” indicate forward-looking statements, although not all forward-looking statements include these words. The forward-looking statements contained in this annual report on Form 10-K involve risks and uncertainties. Our actual results could differ materially from those implied or expressed in the forward-looking statements for any reason, including the factors set forth in “Item“Item 1A. Risk Factors” and elsewhereFactors” in this annual report on Form 10-K.
Other factors that could cause actual results to differ materially include:
•changes or potential disruptions in our operations, the economy, financial markets andor political environment;
•risks associated with possible disruptiondisruptions in our operations or the economy generally due to terrorism, natural disasters or natural disasters;the COVID-19 pandemic;
•future changes in laws or regulations (including the interpretation of these laws and regulations by regulatory authorities) and conditions in our operating areas, particularly with respect to business development companiesBusiness Development Companies or RICs;
•general considerations associated with the COVID-19 pandemic;
•the ability of the parties to consummate the Mergers on the expected timeline, or at all;
•the ability of the parties to consummate the Mergers on the expected timeline, or at all;
•the effects of disruption on our business from the proposed Mergers;
•the combined company’s plans, expectations, objectives and intentions, as a result of the Mergers;
•any potential termination of the Merger Agreement;
•the actions of our stockholders or the stockholders of OCSL with respect to the proposals submitted for their approval in connection with the Mergers; and
•other considerations that may be disclosed from time to time in our publicly disseminated documents and filings.
We have based the forward-looking statements included in this annual report on Form 10-K on information available to us on the date of this annual report, and we assume no obligation to update any such forward-looking statements. Although we undertake no obligation to revise or update any forward-looking statements, whether as a result of new information, future events or otherwise, you are advised to consult any additional disclosures that we may make directly to you or through reports that we in the future may file with the SEC, including annual reports on Form 10-K, quarterly reports on Form 10-Q and current reports on Form 8-K.
Business Overview
We are a specialty finance company dedicatedthat looks to providingprovide customized capital solutions for middle-market companies in both the syndicated and private placement markets. We are a closed-end, externally managed, non-diversified management investment company that has elected to be regulated as a business development companyBusiness Development Company under the Investment Company Act of 1940, as amended, or the Investment Company Act. In addition, we have qualified and elected to be treated as a RIC under the Code for tax purposes.
52
Our investment objective is to generate a stable source of current income while minimizing the risk of principal loss and, to a lesser extent, capital appreciation by providing middle-marketinnovative first-lien financing solutions to companies with primarily first lien secured debt financings that pay us interest at rates which are determined periodically on the basisacross a wide variety of a floating base lending rate.industries. We invest in companies across a variety of industries that typically possess resilient business models with strong underlying fundamentals. We intend to deploy capital across credit and economic cycles with a focus on long-term results, which enableswe believe will enable us to build lasting partnerships with financial sponsors and management teams. Under normal market conditions, through January 18, 2018, at least 80% of the value of our net assets plus borrowings for investment purposes will be invested
Oaktree has performed a comprehensive review of our portfolio and categorized our portfolio into core investments, non-core performing investments and non-accrual investments. Certain additional information on such categorization and our portfolio composition is included in investor presentations that we file with the SEC. Since an Oaktree affiliate became our investment adviser in October 2017, Oaktree and its affiliates have reduced the investments identified as non-core by over $250 million, at fair value. Over time, Oaktree intends to rotate us out of the remaining non-core investments, which were approximately $37 million at fair value as of September 30, 2020.
Business Environment and Developments
As of September 30, 2020, 98.1% of our debt investment portfolio (at fair value) and 98.3% of our debt portfolio (at cost) bore interest at floating rates indexed to LIBOR and/or an alternate base rate (e.g., prime rate), which typically resets semi-annually, quarterly or monthly at the borrower’s option. As a result of the COVID-19 pandemic and the related decision of the U.S. Federal Reserve to reduce certain interest rates, LIBOR decreased beginning in March 2020. A prolonged reduction in interest rates will result in a decreases in our total investment income and could result in a decrease in our net investment income to the extent the decreases are not offset by an increase in the spread on October 17,our floating rate investments, a decrease in our interest expense or a reduction or waiver of our incentive fee on income. In July 2017, Oaktree became the investment adviserhead of the United Kingdom Financial Conduct Authority announced the desire to phase out the use of LIBOR by the end of 2021. In anticipation of the cessation of LIBOR, we may need to renegotiate any credit agreements extending beyond 2021 with our prospective portfolio companies that utilize LIBOR as a factor in determining the interest rate. The reinvestment period of each of OCSL and us, and Oaktree paid gross cash considerationour borrowing facilities in place as of $320 millionSeptember 30, 2020 ends prior to our Former Adviser. The closingthe end of 2021 (and therefore prior to any phase out of LIBOR); however, we expect that any refinancings or future borrowing facilities that bear interest at floating rates indexed to LIBOR (or certain amendments to current borrowing facilities) would include procedures for the selection of a replacement reference rate following any phase out of LIBOR. Certain of the Transaction resultedloan agreements with our portfolio companies have included fallback language in an assignment for purposesthe event that LIBOR becomes unavailable. This language generally provides that the administrative agent may identify a replacement reference rate, typically with the consent of (or prior consultation with) the borrower. In certain cases, the administrative agent will be required to obtain the consent of either a majority of the 1940 Actlenders under the facility, or the consent of each lender, prior to identifying a replacement reference rate. Alternatively, certain of the Former Investment Advisory Agreementloan agreements with our portfolio companies do not include any fallback language providing a mechanism for the parties to negotiate a new reference interest rate and will instead revert to the base rate in the event LIBOR ceases to exist. It remains unclear whether the cessation of LIBOR will be delayed due to COVID-19 or what form any delay may take, and there are no assurances that there will be a delay. It is also unclear what the duration and severity of COVID-19 will be, and whether this will impact
53
LIBOR transition planning. COVID-19 may also slow regulators’ and others’ efforts to develop and implement alternative reference rates, which could make LIBOR transition planning more difficult, particularly if the cessation of LIBOR is not delayed but an alternative reference rate does not emerge as a result, its immediate termination. The material terms of the services to be provided under the New Investment Advisory Agreement, other than the fee structure, are substantially the same as the Former Investment Advisory Agreement, except that services are provided by Oaktree. See “Business-The Investment Adviser” and “-New Investment Advisory Agreement.”industry standard.
Critical Accounting Policies
Basis of Presentation
Our Consolidated Financial Statements have been prepared in accordance with accounting principles generally accepted in the United States of America, or GAAP, and pursuant to the requirements for reporting on Form 10-K and Regulation S-X. All intercompany balances and transactions have been eliminated. We are an investment company following the accounting and reporting guidance in Financial Accounting Standards Board, or FASB, Accounting Standards Codification, or ASC, Topic 946, Financial Services-Investment Companies, or ASC 946.
Investment Valuation
Hierarchical levels, defined by ASC 820 and directly related to the amount of subjectivity associated with the inputs to fair valuation of these assets and liabilities, are as follow:follows:
•Level 1 - Unadjusted, quoted prices in active markets for identical assets or liabilities atas of the measurement date.
•Level 2 - Observable inputs other than Level 1 prices, such as quoted prices for similar assets or liabilities; quoted prices in markets that are not active; or other inputs that are observable or can be corroborated by observable market data at the measurement date for substantially the full term of the assets or liabilities.
•Level 3 - Unobservable inputs that reflect management's best estimate of what market participants would use in pricing the asset or liability at the measurement date. Consideration is given to the risk inherent in the valuation technique and the risk inherent in the inputs to the model.
If inputs used to measure fair value fall into different levels of the fair value hierarchy, an investment's level is based on the lowest level of input that is significant to the fair value measurement. Our assessment of the significance of a particular input to the fair value measurement in its entirety requires judgment and considers factors specific to the investment. This includes investment securities that are valued using "bid" and "ask" prices obtained from independent third party pricing services or directly from brokers. These investments may be classified as Level 3 because the quoted prices may be indicative in nature for securities that are in an inactive market, may be for similar securities or may require adjustments for investment-specific factors or restrictions.
Financial instruments with readily available quoted prices generally will have a higher degree of market price observability and a lesser degree of judgment inherent in measuring fair value. As such, our Investment AdviserOaktree obtains and analyzes readily available market quotations provided by independent pricing servicesvendors and brokers for all of our senior secured debt investments for which quotations are available. In determining the fair value of a particular investment, pricing servicesvendors and brokers use observable market information, including both binding and non-binding indicative quotations.
If the quotations obtained from pricing vendors or brokers are representative of fair value, including the source and nature of the quotations. Our Investment Adviser doesdetermined to not adjust the prices unless it has a reason to believe market quotationsbe reliable or are not reflective of the fair value of an investment. Examples of events that would cause market quotations to not reflect fair value could include cases when a security trades infrequently causing a quoted purchase or sale price to become stale or in the event of a "fire sale" by a distressed seller. In these instances,readily available, we value such investments by using the valuation procedure that we use with respect to assets for which market quotations are not readily available (as discussed below).
54
valuation technique is an analysis of the enterprise value, or EV, of the portfolio company. EV means the entire value of the portfolio company to a market participant, including the sum of the values of debt and equity securities used to capitalize the enterprise at a point in time. The EV analysis is typically performed to determine (i) the value of equity investments, to determine if(ii) whether there is credit impairment for debt investments and to determine(iii) the value for debt investments that we are deemed to control under the 1940Investment Company Act. To estimate the EV of a portfolio company, the Investment AdviserOaktree analyzes various factors, including the portfolio company’s historical and projected financial results, macroeconomic impacts on the company, and competitive dynamics in the company’s industry. The Investment AdviserOaktree also utilizes some or all of the following information based on the individual circumstances of the portfolio company, including:company: (i) valuations of comparable public companies, (ii) recent sales of private and public comparable companies in similar industries or having similar business or earnings characteristics, (iii) purchase price multiplesprices as a multiple of their earnings or cash flow, (iv) the portfolio company’s ability to meet its forecasts and its business prospects, (v) a discounted cash flow analysis, (vi) estimated liquidation or collateral value of the portfolio company's assets and (vii) offers from third parties to buy the portfolio company. We may probability weight potential sale outcomes with respect to a portfolio company due to thewhen uncertainty that exists as of the valuation date. The third valuation technique is a market yield technique, which is typically performed for non-credit impaired debt investments. To determine fair value using aIn the market yield technique, a current price is imputed for the investment based upon an assessment of the expected market yield for a similarly structured investment with a similar level of risk. In the market yield technique,risk, and we consider the current contractual interest rate, the capital structure and other terms of the investment relative to risk of the company and the specific investment. A key determinant of risk, among other things, is the leverage through the investment relative to the EV of the portfolio company. As debt investments held by us are substantially illiquid with no active transaction market, we depend on primary market data, including newly funded transactions and industry specific market movements, as well as secondary market data with respect to high yield debt instruments and syndicated loans, as inputs in determining the appropriate market yield, as applicable.
In accordance with ASC 820-10, certain investments that qualify as investment companies in accordance with ASC 946 may be valued using net asset value as a practical expedient for fair value. Consistent with FASB guidance under ASC 820, these investments are excluded from the hierarchical levels.
These investments are generally not redeemable.
We estimate the fair value of privately held warrants using a Black Scholes pricing model, which includes an analysis of various factors and subjective assumptions, including the current stock price (by using an EV analysis as described above), the expected period until exercise, expected volatility of the underlying stock price, expected dividends and the risk-free rate. Changes in the subjective input assumptions can materially affect the fair value estimates.
Our Board of Directors undertakes a multi-step valuation process each quarter in connection with determining the fair value of our investments:
•The quarterly valuation process begins with each portfolio company or investment being initially valued by our Investment Adviser’sOaktree’s valuation team in conjunction with the Investment Adviser’sOaktree’s portfolio management team and investment professionals responsible for each portfolio investment;
•Preliminary valuations are then reviewed and discussed with management of our Investment Adviser;Oaktree;
•Separately, independent valuation firms engaged by our Board of Directors prepare valuations of our investments, on a selected basis, for which market quotations are not readily available or are readily available but deemed not reflective of the fair value of the investment, and submit the reports to us and provide such reports to our Investment AdviserOaktree and the Audit Committee of our Board of Directors;
•The Audit Committee of our Board of Directors reviews the preliminary valuations with our Investment Adviser,Oaktree, and our Investment AdviserOaktree responds and supplements the preliminary valuations to reflect any discussions between our Investment AdviserOaktree and the Audit Committee;
•The Audit Committee of our Board of Directors makes a recommendation to our full Board of Directors regarding the fair value of the investments in our portfolio; and
•Our Board of Directors discusses valuations and determines the fair value of each investment in our portfolio.
The fair value of our investments atas of September 30, 20172020 and September 30, 20162019 was determined in good faith by our Board of Directors. Our Board of Directors has authorized the engagement of independent valuation firms to provide valuation assistance. Weand will continue to engage independent valuation firms to provide assistance regarding the determination of the fair value of a portion of our portfolio securities for which market quotations are not readily available or are readily available but deemed not reflective of the fair value of the investment each quarter, and the Board of Directors may reasonably rely on that assistance. The percentageAs of September 30, 2020, 94.9% of our portfolio at fair value was valued either based on market quotations, the transactions precedent approach or corroborated by independent valuation firms may vary from period to period based on the availability of market quotations for our portfolio investments during the respective periods. Typically, a higher percentage of our portfolio is valued by independent valuation firms in our fiscal fourth quarter due to additional year-end procedures.firms. However, our Board of Directors is responsible for the ultimate valuation of the portfolio investments at fair value as determined in good faith pursuant to our valuation policy and a consistently applied valuation process.
55
Due to the inherent uncertainty of determining the fair value of investments that do not have a readily available market value, the fair value of our portfolio, at fair value, valued by independent valuation firms asinvestments may fluctuate from period to period. Because of the endinherent uncertainty of each period duringvaluation, these estimated values may differ significantly from the currentvalues that would have been reported had a ready market for the investments existed, and two preceding fiscal years were as follows:
difference could be material.
As of September 30, 20172020 and September 30, 2016,2019, approximately 92.1%92.3% and 92.2%95.8%, respectively, of our total assets represented investments in portfolio companies valued at prices equal to fair value.
Revenue Recognition
Interest and Dividend Income
Interest income, adjusted for accretion of OID is recorded on thean accrual basis to the extent that such amounts are expected to be collected. We stop accruing interest on investments when it is determined that interest is no longer collectible. Investments that are expected to pay regularly scheduled interest in cash are generally placed on non-accrual status when there is reasonable doubt that principal or interest cash payments will be collected. Cash interest payments received on investments may be recognized as income or a return of capital depending upon management’s judgment. SuchA non-accrual investments areinvestment is restored to accrual status if past due principal and interest are paid in cash, and the portfolio companies,company, in management’s judgment, areis likely to continue timely payment of theirits remaining interest. obligations.
As of September 30, 2017,2020, there were three investmentswas one investment on which we had stopped accruing cash and/or PIK interest or OID income. During the year ended September 30, 2020, we restructured our investment in the Subordinated Notes to provide, among other things, that the Subordinated Notes will not pay interest beginning on the April 15, 2020 scheduled coupon date through the January 15, 2021 scheduled coupon date. Given that the Subordinated Notes will not pay interest for four consecutive quarters, our investment in the Subordinated Notes was on cash non-accrual status and we did not recognize any interest income from the OCSI Glick JV during the nine months ended September 30, 2020.
In connection with our investment in a portfolio company, we sometimes receive nominal cost equity that is valued as part of the negotiation process with the portfolio company. When we receive nominal cost equity, we allocate our cost basis in the investment between debt securities and the nominal cost equity at the time of origination. Any resulting discount from recording the loan, or otherwise purchasing a security at a discount, is accreted into interest income over the life of the loan.
PIK Interest Income
Our loansinvestments in debt securities may contain contractual PIK interest provisions. The PIK interest, which typically represents contractually deferred interest added to the loan balance that is generally due at the end of the loan term, is generally recorded on the accrual basis to the extent such amounts are expected to be collected. We generally cease accruing PIK interest if there is insufficient value to support the accrual or if we do not expect the portfolio company to be able to pay all principal and interest due. Our decision to cease accruing PIK interest on a loan or debt security involves subjective judgments and determinations based on available information about a particular portfolio company, including whether the portfolio company is current with respect to its payment of principal and interest on its loans and debt securities; financial statements and financial projections for the portfolio company; our assessment of the portfolio company's business development success; information obtained by us in connection with periodic formal update interviews with the portfolio company's management and, if appropriate, the private equity sponsor; and information about the general economic and market conditions in which the portfolio company operates. Based on this and other information, we determine whether to cease accruing PIK interest on a loan or debt security when it is determined that PIK interest is no longer collectible. Our determination to cease accruing PIK interest on a loan or debt security is generally made well before our full write-down of sucha loan or debt security. In addition, if it is subsequently determined that we will not be able to collect any previously accrued PIK interest, the fair value of ourthe loans or debt securities would be reduced by the amount of such previously accrued, but uncollectible, PIK interest. The accrual of PIK interest on our debt investments increases the recorded cost bases of these investments in our Consolidated Financial Statements and, as a result, increases the cost bases of these investmentsincluding for purposes of computing the capital gains incentive fee payable by us to our Investment Adviser.
Fee Income
Oaktree or its affiliates may provide financial advisory services to portfolio companies and, in return, we may receive fees for capital structuring services. These fees are generally nonrecurring and are recognized by us upon the cash relatinginvestment closing date. We may also receive additional fees in the ordinary course of business, including servicing, amendment and prepayment fees, which are classified as fee income and recognized as they are earned or the services are rendered.
We have also structured exit fees across certain of our portfolio investments to be received upon the future exit of those investments. These fees are typically paid to us upon the earliest to occur of (i) a sale of the borrower or substantially all of the assets of the borrower, (ii) the maturity date of the loan or (iii) the date when full prepayment of the loan occurs. The receipt of such fees is contingent upon the
56
occurrence of one of the events listed above for each of the investments. These fees are included in net investment income over the life of the loan.
Dividend Income
We generally recognize dividend income on the ex-dividend date for public securities and the record date for private equity investments. Distributions received from private equity investments are evaluated to determine if the distribution should be recorded as dividend income or a return of capital. Generally, we will not record distributions from private equity investments as dividend income unless there are sufficient earnings at the portfolio company prior to the PIK interest. Accumulated PIK interest was $0.5 million and $0.1 million as of September 30, 2017 and September 30, 2016, respectively. The net increases in loan balancesdistribution. Distributions that are classified as a resultreturn of contractual PIK arrangementscapital are separately identifiedrecorded as a reduction in our Consolidated Statementsthe cost basis of Cash Flows.
the investment.
Portfolio Composition
Our investments principally consist of senior loans in private middle-market companies and investments in FSFROCSI Glick JV. As of September 30, 2017,2020, our senior loans were typically secured by a first or second lien on the assets of the portfolio company and generally havehad terms of up to ten years (but an expected average life of between three and four years). We believe the environment for direct lending remains active, and, as a result, a number of our portfolio companies were able to refinance and repay their loans during the fiscal year ended September 30, 2017.
During the year ended September 30, 2017,2020, we originated $290.8$224.5 million of investment commitments in 3643 new and 1216 existing portfolio companies and funded $290.6$226.0 million of investments.
During the year ended September 30, 2017,2020, we received $215.3$292.1 million in connection with the full repayments andof proceeds from prepayments, exits, of 27 of our investments and an additional $61.7 million in connection with other paydowns and sales of investments.and exited 48 portfolio companies.
A summary of the composition of our investment portfolio at cost and fair value as a percentage of total investments is shown in the following tables:
| September 30, 2020 | September 30, 2019 | |||||||||||||
| Cost: | ||||||||||||||
| Senior secured loans | 86.16 | % | 88.33 | % | ||||||||||
| OCSI Glick JV subordinated notes | 12.07 | 10.54 | ||||||||||||
| OCSI Glick JV equity interests | 1.32 | 1.13 | ||||||||||||
| Equity securities, excluding the OCSI Glick JV | 0.45 | — | ||||||||||||
| Total | 100.00 | % | 100.00 | % | ||||||||||
| September 30, 2020 | September 30, 2019 | |||||||||||||
| Fair value: | ||||||||||||||
| Senior secured loans | 89.69 | % | 90.85 | % | ||||||||||
| OCSI Glick JV subordinated notes | 9.84 | 9.10 | ||||||||||||
| Equity securities, excluding the OCSI Glick JV | 0.47 | 0.05 | ||||||||||||
| OCSI Glick JV equity interests | — | — | ||||||||||||
| Total | 100.00 | % | 100.00 | % | ||||||||||
57
| September 30, 2017 | September 30, 2016 | |||||
| Cost: | ||||||
| Senior secured debt | 86.50 | % | 86.40 | % | ||
| Subordinated notes of FSFR Glick JV | 10.61 | 10.66 | ||||
| LLC equity interests of FSFR Glick JV | 1.18 | 1.18 | ||||
| Purchased equity | 1.71 | 1.76 | ||||
| Equity grants | — | — | ||||
| Total | 100.00 | % | 100.00 | % | ||
| September 30, 2017 | September 30, 2016 | |||||
| Fair value: | ||||||
| Senior secured debt | 89.53 | % | 87.58 | % | ||
| Subordinated notes of FSFR Glick JV | 10.28 | 9.92 | ||||
| LLC equity interests of FSFR Glick JV | — | 1.12 | ||||
| Purchased equity | 0.19 | 1.36 | ||||
| Equity grants | — | 0.02 | ||||
| Total | 100.00 | % | 100.00 | % | ||
The industry composition of our portfolio at cost and fair value as a percentage of total investments was as follows:
| September 30, 2020 | September 30, 2019 | |||||||||||||
| Cost: | ||||||||||||||
| Multi-Sector Holdings (1) | 13.36 | % | 11.68 | % | ||||||||||
| Application Software | 10.43 | 12.98 | ||||||||||||
| Aerospace & Defense | 5.68 | 5.24 | ||||||||||||
| Diversified Support Services | 4.89 | 4.38 | ||||||||||||
| Advertising | 4.48 | 3.84 | ||||||||||||
| Movies & Entertainment | 3.09 | 1.54 | ||||||||||||
| Integrated Telecommunication Services | 2.87 | 2.78 | ||||||||||||
| Commercial Printing | 2.84 | 2.47 | ||||||||||||
| Data Processing & Outsourced Services | 2.61 | 2.66 | ||||||||||||
| Industrial Machinery | 2.55 | 1.49 | ||||||||||||
| Health Care Supplies | 2.50 | — | ||||||||||||
| Personal Products | 2.49 | 0.48 | ||||||||||||
| Pharmaceuticals | 2.47 | 2.01 | ||||||||||||
| Health Care Services | 2.43 | 2.74 | ||||||||||||
| Biotechnology | 2.28 | 1.27 | ||||||||||||
| Health Care Technology | 2.18 | 1.74 | ||||||||||||
| Oil & Gas Storage & Transportation | 2.04 | 0.09 | ||||||||||||
| Specialty Chemicals | 1.86 | 0.75 | ||||||||||||
| Systems Software | 1.84 | 2.48 | ||||||||||||
| Real Estate Services | 1.81 | 1.57 | ||||||||||||
| Publishing | 1.79 | 1.64 | ||||||||||||
| Leisure Facilities | 1.74 | 1.43 | ||||||||||||
| Internet Services & Infrastructure | 1.66 | 4.54 | ||||||||||||
| Trading Companies & Distributors | 1.64 | 1.43 | ||||||||||||
| Distributors | 1.63 | — | ||||||||||||
| Specialized Finance | 1.55 | 2.43 | ||||||||||||
| Alternative Carriers | 1.55 | 2.70 | ||||||||||||
| Fertilizers & Agricultural Chemicals | 1.51 | — | ||||||||||||
| Research & Consulting Services | 1.38 | 1.58 | ||||||||||||
| Electrical Components & Equipment | 1.17 | 1.02 | ||||||||||||
| Auto Parts & Equipment | 1.06 | 0.92 | ||||||||||||
| Internet & Direct Marketing Retail | 1.00 | — | ||||||||||||
| Oil & Gas Refining & Marketing | 0.99 | 1.89 | ||||||||||||
| Metal & Glass Containers | 0.98 | 1.41 | ||||||||||||
| Insurance Brokers | 0.95 | — | ||||||||||||
| Hotels, Resorts & Cruise Lines | 0.86 | — | ||||||||||||
| Environmental & Facilities Services | 0.72 | 0.67 | ||||||||||||
| Restaurants | 0.63 | — | ||||||||||||
| Household Products | 0.62 | 0.80 | ||||||||||||
| Independent Power Producers & Energy Traders | 0.61 | — | ||||||||||||
| Managed Health Care | 0.55 | — | ||||||||||||
| Electric Utilities | 0.36 | — | ||||||||||||
| General Merchandise Stores | 0.30 | 0.25 | ||||||||||||
| Specialized REITs | 0.05 | 1.38 | ||||||||||||
| Oil & Gas Exploration & Production | — | 2.34 | ||||||||||||
| Interactive Media & Services | — | 1.89 | ||||||||||||
| Computer & Electronics Retail | — | 1.72 | ||||||||||||
| Communications Equipment | — | 1.55 | ||||||||||||
| IT Consulting & Other Services | — | 1.54 | ||||||||||||
| Health Care Equipment | — | 1.42 | ||||||||||||
| Human Resource & Employment Services | — | 1.29 | ||||||||||||
| Household Appliances | — | 1.09 | ||||||||||||
| Commodity Chemicals | — | 0.78 | ||||||||||||
| Oil & Gas Equipment & Services | — | 0.10 | ||||||||||||
| 100.00 | % | 100.00 | % | |||||||||||
58
| September 30, 2017 | September 30, 2016 | |||||
| Cost: | ||||||
| Internet software & services | 21.46 | % | 22.07 | % | ||
| Multi-sector holdings (1) | 11.79 | 11.84 | ||||
| Healthcare services | 8.41 | 14.80 | ||||
| Advertising | 7.19 | 8.06 | ||||
| Application software | 5.59 | 5.35 | ||||
| Diversified support services | 4.00 | 3.28 | ||||
| IT consulting & other services | 3.39 | 1.47 | ||||
| Human resources & employment services | 3.33 | — | ||||
| Specialized finance | 2.54 | — | ||||
| Environmental & facilities services | 2.34 | 1.06 | ||||
| Oil & gas equipment & services | 2.32 | 0.70 | ||||
| Distributors | 2.14 | — | ||||
| Industrial machinery | 2.06 | 0.64 | ||||
| Real estate services | 2.02 | — | ||||
| Commercial printing | 1.96 | 0.98 | ||||
| Integrated telecommunication services | 1.87 | 4.06 | ||||
| Food retail | 1.66 | 1.15 | ||||
| Data processing & outsourced services | 1.62 | 1.64 | ||||
| Pharmaceuticals | 1.50 | 1.53 | ||||
| Specialty Stores | 1.38 | — | ||||
| Security & alarm services | 1.33 | 2.97 | ||||
| Computer & Electronics Retail | 1.22 | — | ||||
| Research & consulting services | 1.14 | 2.85 | ||||
| Personal products | 1.08 | 0.21 | ||||
| Aerospace & defense | 1.07 | — | ||||
| Auto parts & equipment | 0.97 | — | ||||
| Healthcare distributors | 0.82 | — | ||||
| Casinos & gaming | 0.82 | — | ||||
| Housewares & specialties | 0.79 | — | ||||
| Trucking | 0.67 | — | ||||
| Fertilizers & agricultural chemicals | 0.54 | 0.59 | ||||
| Hypermarkets & super centers | 0.50 | — | ||||
| Specialized consumer services | 0.27 | 3.76 | ||||
| Computer hardware | 0.21 | 0.66 | ||||
| Education services | — | 2.54 | ||||
| Electronic equipment & instruments | — | 1.82 | ||||
| Diversified capital markets | — | 1.45 | ||||
| Construction and engineering | — | 0.98 | ||||
| Wireless telecommunication services | — | 0.95 | ||||
| Food distributors | — | 0.95 | ||||
| Restaurants | — | 0.83 | ||||
| Healthcare technology | — | 0.81 | ||||
| 100.00 | % | 100.00 | % | |||
| September 30, 2017 | September 30, 2016 | |||||
Fair value: | ||||||
| Internet software & services | 21.72 | % | 20.82 | % | ||
| Multi-sector holdings (1) | 10.28 | 11.04 | ||||
| Advertising | 7.34 | 8.49 | ||||
| Application software | 6.06 | 5.65 | ||||
| Healthcare services | 5.27 | 14.64 | ||||
| Diversified support services | 4.40 | 3.42 | ||||
| IT consulting & other services | 3.66 | 1.55 | ||||
| Human resources & employment services | 3.59 | — | ||||
| Specialized finance | 2.79 | — | ||||
| Environmental & facilities services | 2.55 | 1.14 | ||||
| Oil & gas equipment & services | 2.51 | 0.71 | ||||
| Distributors | 2.31 | — | ||||
| Industrial machinery | 2.22 | 0.66 | ||||
| Real estate services | 2.19 | — | ||||
| Commercial printing | 2.13 | 1.03 | ||||
| Integrated telecommunication services | 2.03 | 4.30 | ||||
| Food retail | 1.82 | 1.22 | ||||
| Data processing & outsourced services | 1.76 | 1.71 | ||||
| Pharmaceuticals | 1.61 | 1.57 | ||||
| Specialty Stores | 1.46 | — | ||||
| Security & alarm services | 1.42 | 3.11 | ||||
| Computer & Electronics Retail | 1.34 | — | ||||
| Research & consulting services | 1.25 | 2.99 | ||||
| Personal products | 1.18 | 0.22 | ||||
| Aerospace & defense | 1.17 | — | ||||
| Auto parts & equipment | 1.03 | — | ||||
| Casinos & gaming | 0.90 | — | ||||
| Healthcare distributors | 0.88 | — | ||||
| Housewares & specialties | 0.85 | — | ||||
| Trucking | 0.73 | — | ||||
| Hypermarkets & super centers | 0.51 | — | ||||
| Fertilizers & agricultural chemicals | 0.50 | 0.59 | ||||
| Specialized consumer services | 0.30 | 3.93 | ||||
| Computer hardware | 0.24 | 0.68 | ||||
| Education services | — | 2.67 | ||||
| Electronic equipment & instruments | — | 1.90 | ||||
| Diversified capital markets | — | 1.53 | ||||
| Construction and engineering | — | 1.01 | ||||
| Food distributors | — | 0.98 | ||||
| Restaurants | — | 0.87 | ||||
| Healthcare technology | — | 0.83 | ||||
| Wireless telecommunication services | — | 0.74 | ||||
| 100.00 | % | 100.00 | % | |||
| September 30, 2020 | September 30, 2019 | |||||||||||||
| Fair value: | ||||||||||||||
| Application Software | 11.13 | % | 13.52 | % | ||||||||||
| Multi-Sector Holdings (1) | 9.84 | 9.10 | ||||||||||||
| Aerospace & Defense | 5.67 | 5.44 | ||||||||||||
| Diversified Support Services | 4.96 | 4.57 | ||||||||||||
| Advertising | 4.44 | 3.51 | ||||||||||||
| Movies & Entertainment | 3.26 | 1.61 | ||||||||||||
| Commercial Printing | 2.94 | 2.58 | ||||||||||||
| Integrated Telecommunication Services | 2.91 | 2.87 | ||||||||||||
| Personal Products | 2.72 | 0.51 | ||||||||||||
| Data Processing & Outsourced Services | 2.70 | 2.81 | ||||||||||||
| Health Care Supplies | 2.68 | — | ||||||||||||
| Pharmaceuticals | 2.67 | 2.02 | ||||||||||||
| Health Care Services | 2.54 | 2.88 | ||||||||||||
| Biotechnology | 2.48 | 1.35 | ||||||||||||
| Industrial Machinery | 2.37 | 1.54 | ||||||||||||
| Health Care Technology | 2.34 | 1.85 | ||||||||||||
| Oil & Gas Storage & Transportation | 2.11 | 0.09 | ||||||||||||
| Systems Software | 1.95 | 2.59 | ||||||||||||
| Specialty Chemicals | 1.94 | 0.62 | ||||||||||||
| Publishing | 1.93 | 1.75 | ||||||||||||
| Real Estate Services | 1.88 | 1.65 | ||||||||||||
| Distributors | 1.73 | — | ||||||||||||
| Trading Companies & Distributors | 1.73 | 1.50 | ||||||||||||
| Internet Services & Infrastructure | 1.65 | 4.77 | ||||||||||||
| Specialized Finance | 1.64 | 2.42 | ||||||||||||
| Fertilizers & Agricultural Chemicals | 1.62 | — | ||||||||||||
| Alternative Carriers | 1.62 | 2.84 | ||||||||||||
| Research & Consulting Services | 1.45 | 1.72 | ||||||||||||
| Leisure Facilities | 1.45 | 1.50 | ||||||||||||
| Electrical Components & Equipment | 1.22 | 1.01 | ||||||||||||
| Internet & Direct Marketing Retail | 1.10 | — | ||||||||||||
| Auto Parts & Equipment | 1.10 | 0.90 | ||||||||||||
| Insurance Brokers | 1.05 | — | ||||||||||||
| Metal & Glass Containers | 1.03 | 1.40 | ||||||||||||
| Hotels, Resorts & Cruise Lines | 1.03 | — | ||||||||||||
| Oil & Gas Refining & Marketing | 1.02 | 2.00 | ||||||||||||
| Environmental & Facilities Services | 0.75 | 0.67 | ||||||||||||
| Restaurants | 0.71 | — | ||||||||||||
| Household Products | 0.66 | 0.80 | ||||||||||||
| Independent Power Producers & Energy Traders | 0.63 | — | ||||||||||||
| Managed Health Care | 0.58 | — | ||||||||||||
| Electric Utilities | 0.39 | — | ||||||||||||
| General Merchandise Stores | 0.30 | 0.24 | ||||||||||||
| Specialized REITs | 0.08 | 1.45 | ||||||||||||
| Oil & Gas Exploration & Production | — | 2.34 | ||||||||||||
| Interactive Media & Services | — | 1.99 | ||||||||||||
| Computer & Electronics Retail | — | 1.81 | ||||||||||||
| Communications Equipment | — | 1.57 | ||||||||||||
| Health Care Equipment | — | 1.51 | ||||||||||||
| Human Resource & Employment Services | — | 1.34 | ||||||||||||
| IT Consulting & Other Services | — | 1.34 | ||||||||||||
| Household Appliances | — | 1.12 | ||||||||||||
| Commodity Chemicals | — | 0.83 | ||||||||||||
| Oil & Gas Equipment & Services | — | 0.07 | ||||||||||||
| 100.00 | % | 100.00 | % | |||||||||||
___________________
(1)This industry includes our investment in the OCSI Glick JV.
59
| September 30, 2017 | September 30, 2016 | September 30, 2015 | ||||||||||||||||||||||||||||||||||||||||
| Cost | % of Debt Portfolio | Fair Value | % of Debt Portfolio | Cost | % of Debt Portfolio | Fair Value | % of Debt Portfolio | Cost | % of Debt Portfolio | Fair Value | % of Debt Portfolio | |||||||||||||||||||||||||||||||
| Accrual | $ | 564,231,285 | 96.02 | % | $ | 553,084,120 | 98.88 | % | $ | 563,757,229 | 96.74 | % | $ | 552,114,644 | 98.72 | % | $ | 619,529,324 | 98.79 | % | $ | 613,701,960 | 99.28 | % | ||||||||||||||||||
| PIK non-accrual (paying) (1) | — | — | — | — | — | — | — | — | 7,605,257 | 1.21 | 4,427,839 | 0.72 | ||||||||||||||||||||||||||||||
| Cash non-accrual (nonpaying) (2) | 23,381,863 | 3.98 | 6,292,551 | 1.12 | 19,027,017 | 3.26 | 7,156,160 | 1.28 | — | — | — | — | ||||||||||||||||||||||||||||||
| Total | $ | 587,613,148 | 100.00 | % | $ | 559,376,671 | 100.00 | % | $ | 582,784,246 | 100.00 | % | $ | 559,270,804 | 100.00 | % | $ | 627,134,581 | 100.00 | % | $ | 618,129,799 | 100.00 | % | ||||||||||||||||||
| Year ended September 30, 2017 | Year ended September 30, 2016 | Year ended September 30, 2015 | ||||||||||
| Cash interest income | $ | 1,291,399 | $ | 1,136,652 | $ | — | ||||||
| PIK interest income | 351,323 | — | — | |||||||||
| OID income | 89,553 | 57,735 | 13,816 | |||||||||
| Total | $ | 1,732,275 | $ | 1,194,387 | $ | 13,816 | ||||||
In October 2014, we entered into an LLC agreement with GF Equity Funding to form FSFRthe OCSI Glick JV. On April 21, 2015, FSFRthe OCSI Glick JV began investing in senior secured loans of middle-market companies. We co-invest in these securities with GF Equity Funding through FSFRthe OCSI Glick JV. FSFRThe OCSI Glick JV is managed by a four person Board of Directors, two of whom are selected by us and two of whom are selected by GF Equity Funding. FSFRThe OCSI Glick JV is capitalized as transactions are completed, and portfolio decisions and investment decisions in respect of FSFRthe OCSI Glick JV must be approved by the FSFROCSI Glick JV investment committee, consisting of one representative selected by us and one representative selected by GF Equity Funding (with approval from a representative of each required). The members provide capital to FSFRthe OCSI Glick JV in exchange for LLC equity interests, and we and GF Debt Funding, an entity advised by affiliates of GF Equity Funding, provide capital to FSFRthe OCSI Glick JV in exchange for the Subordinated Notes. As of September 30, 20172020 and September 30, 2016,2019, we and GF Equity Funding owned 87.5% and 12.5%, respectively, of the outstanding LLC equity interests, and we and GF Debt Funding owned 87.5% and 12.5%, respectively, of the Subordinated Notes. FSFRThe OCSI Glick JV is not an "eligible portfolio company" as defined in section 2(a)(46) of the 1940Investment Company Act.
As of September 30, 20172020, the JV Deutsche Bank Facility includes a waiver period (which extends through January 3, 2021) during which the facility agent is restricted from revaluing certain collateral obligations where the change in valuation is caused by or results from a business disruption due primarily to the COVID-19 pandemic (subject to OCSI Glick JV’s ability to earlier terminate such period in certain circumstances).
As of September 30, 2020 and September 30, 2016, FSFR2019, the OCSI Glick JV had total assets of $126.7$137.9 million and $201.1$179.7 million, respectively. Our investment in FSFRthe OCSI Glick JV consisted of LLC equity interests and Subordinated Notes of $57.6$49.4 million and $54.3 million in the aggregate at fair value as of September 30, 2017. As of2020 and September 30, 2016, our investment consisted of LLC equity interests and Subordinated Notes of $63.3 million in the aggregate at fair value.2019, respectively. The Subordinated Notes are junior in right of payment to the repayment of temporary contributions made by us to fund investments of FSFRthe OCSI Glick JV that are repaid when GF Equity Funding and GF Debt Funding make their capital contributions and fund their Subordinated Notes, respectively.
As of September 30, 20172020 and September 30, 2016, FSFR2019, the OCSI Glick JV had total capital commitments of $100.0 million.million, $87.5 million of which was from us and the remaining $12.5 million from GF Equity Funding and GF Debt Funding. Approximately $81.6 million and $81.3$84.0 million in aggregate commitments was funded as of each of September 30, 20172020 and September 30, 2016, respectively,2019, of which $71.4$73.5 million and $71.1 million, respectively, was from us. As of each of September 30, 20172020 and September 30, 2016,2019, we had commitments to fund Subordinated Notes to FSFRthe OCSI Glick JV of $78.8 million, of which $14.5$12.4 million and $14.7 million, respectively, was unfunded. As of each of September 30, 20172020 and September 30, 2016,2019, we had commitments to fund LLC equity interests in FSFRthe OCSI Glick JV of $8.7 million, of which $1.6 million was unfunded.unfunded as of each such date.
Below is a summary of FSFRthe OCSI Glick JV's portfolio, followed by a listing of the individual loans in FSFRthe OCSI Glick JV's portfolio as of September 30, 20172020 and September 30, 2016:2019:
| September 30, 2017 | September 30, 2016 | September 30, 2020 | September 30, 2019 | |||||||||||||||
| Senior secured loans (1) | $115,964,537 | $194,346,557 | Senior secured loans (1) | $143,138,964 | $177,911,560 | |||||||||||||
| Weighted average current interest rate on senior secured loans (2) | 6.92% | 7.08% | Weighted average current interest rate on senior secured loans (2) | 5.56% | 6.92% | |||||||||||||
| Number of borrowers in FSFR Glick JV | 23 | 36 | ||||||||||||||||
| Number of borrowers in the OCSI Glick JV | Number of borrowers in the OCSI Glick JV | 40 | 39 | |||||||||||||||
| Largest loan exposure to a single borrower (1) | $11,267,524 | $12,641,009 | Largest loan exposure to a single borrower (1) | $6,994,829 | $7,425,000 | |||||||||||||
| Total of five largest loan exposures to borrowers (1) | $42,833,696 | $49,318,344 | Total of five largest loan exposures to borrowers (1) | $31,371,046 | $34,662,500 | |||||||||||||
__________
(1) At principal amount.
(2) Computed using the weighted average annual interest rate on accruing senior secured loans.loans at fair value.
60
| Portfolio Company | Investment Type | Cash Interest Rate (1)(2) | Industry | Principal | Cost | Fair Value (3) | Notes | ||||||||||||||||||||||
| AI Ladder (Luxembourg) Subco S.a.r.l. | First Lien Term Loan, LIBOR+4.50% cash due 7/9/2025 | 4.65% | Electrical Components & Equipment | $ | 2,671,716 | $ | 2,616,725 | $ | 2,558,168 | (4) | |||||||||||||||||||
| Alvogen Pharma US, Inc. | First Lien Term Loan, LIBOR+5.25% cash due 12/31/2023 | 6.25% | Pharmaceuticals | 6,994,829 | 6,808,979 | 6,773,337 | |||||||||||||||||||||||
| Amplify Finco Pty Ltd. | First Lien Term Loan, LIBOR+4.00% cash due 11/26/2026 | 4.75% | Movies & Entertainment | 2,985,000 | 2,955,150 | 2,567,100 | (4) | ||||||||||||||||||||||
| Anastasia Parent, LLC | First Lien Term Loan, LIBOR+3.75% cash due 8/11/2025 | Personal Products | 1,684,513 | 1,352,429 | 743,814 | (6) | |||||||||||||||||||||||
| Ancile Solutions, Inc. | First Lien Term Loan, LIBOR+7.00% cash due 6/30/2021 | 8.00% | Application Software | 3,201,353 | 3,194,577 | 3,178,943 | (4) | ||||||||||||||||||||||
| Aurora Lux Finco S.À.R.L. | First Lien Term Loan, LIBOR+6.00% cash due 12/24/2026 | 7.00% | Airport Services | 3,731,250 | 3,648,256 | 3,470,063 | |||||||||||||||||||||||
| Brazos Delaware II, LLC | First Lien Term Loan, LIBOR+4.00% cash due 5/21/2025 | 4.16% | Oil & Gas Equipment & Services | 4,887,066 | 4,870,862 | 3,733,376 | |||||||||||||||||||||||
| California Pizza Kitchen, Inc. | First Lien Term Loan, LIBOR+8.00% cash due 8/23/2022 | Restaurants | 5,004,489 | 4,813,378 | 1,526,369 | (6) | |||||||||||||||||||||||
| Carrols Restaurant Group, Inc. | First Lien Term Loan, LIBOR+6.25% cash due 4/30/2026 | 7.25% | Restaurants | 1,118,198 | 1,062,723 | 1,109,811 | (4) | ||||||||||||||||||||||
| CITGO Petroleum Corp. | First Lien Term Loan, LIBOR+5.00% cash due 3/28/2024 | 6.00% | Oil & Gas Refining & Marketing | 3,591,768 | 3,555,850 | 3,421,159 | (4) | ||||||||||||||||||||||
| Connect U.S. Finco LLC | First Lien Term Loan, LIBOR+4.50% cash due 12/11/2026 | 5.50% | Alternative Carriers | 4,582,107 | 4,482,733 | 4,453,258 | (4) | ||||||||||||||||||||||
| Curium Bidco S.à.r.l. | First Lien Term Loan, LIBOR+3.75% cash due 7/9/2026 | 3.97% | Biotechnology | 4,950,000 | 4,912,875 | 4,912,875 | (4) | ||||||||||||||||||||||
| eResearch Technology, Inc. | First Lien Term Loan, LIBOR+4.50% cash due 2/4/2027 | 5.50% | Application Software | 2,493,750 | 2,468,813 | 2,486,992 | (4) | ||||||||||||||||||||||
| Gigamon, Inc. | First Lien Term Loan, LIBOR+4.25% cash due 12/27/2024 | 5.25% | Systems Software | 5,835,900 | 5,800,375 | 5,762,951 | |||||||||||||||||||||||
| Guidehouse LLP | Second Lien Term Loan, LIBOR+8.00% cash due 5/1/2026 | 8.15% | Research & Consulting Services | 5,000,000 | 4,982,443 | 4,825,000 | (4) | ||||||||||||||||||||||
| Helios Software Holdings, Inc. | First Lien Term Loan, LIBOR+4.25% cash due 10/24/2025 | 4.52% | Systems Software | 992,422 | 982,498 | 980,642 | (4) | ||||||||||||||||||||||
| Houghton Mifflin Harcourt Publishers Inc. | First Lien Term Loan, LIBOR+6.25% cash due 11/22/2024 | 7.25% | Education Services | 2,887,500 | 2,790,416 | 2,699,813 | |||||||||||||||||||||||
| Integro Parent, Inc. | First Lien Term Loan, LIBOR+5.75% cash due 10/31/2022 | 6.75% | Insurance Brokers | 3,277,221 | 3,249,274 | 3,011,753 | |||||||||||||||||||||||
| Intelsat Jackson Holdings S.A. | First Lien Delayed Draw Term Loan, LIBOR+5.50% cash due 7/13/2022 | 6.50% | Alternative Carriers | 398,251 | 328,422 | 414,511 | (5) | ||||||||||||||||||||||
| LTI Holdings, Inc. | First Lien Term Loan, LIBOR+3.50% cash due 9/6/2025 | 3.65% | Electronic Components | 1,386,341 | 1,100,748 | 1,294,496 | |||||||||||||||||||||||
| MHE Intermediate Holdings, LLC | First Lien Term Loan, LIBOR+5.00% cash due 3/8/2024 | 6.00% | Diversified Support Services | 4,101,250 | 4,058,056 | 3,991,747 | (4) | ||||||||||||||||||||||
| MHE Intermediate Holdings, LLC | First Lien Delayed Draw Term Loan, LIBOR+5.00% cash due 3/8/2024 | 6.00% | Diversified Support Services | 828,579 | 818,379 | 806,456 | (4) | ||||||||||||||||||||||
| Total MHE Intermediate Holdings, LLC | 4,929,829 | 4,876,435 | 4,798,203 | ||||||||||||||||||||||||||
| MRI Software LLC | First Lien Term Loan, LIBOR+5.50% cash due 2/10/2026 | 6.50% | Application Software | 1,614,980 | 1,601,301 | 1,575,954 | (4) | ||||||||||||||||||||||
| MRI Software LLC | First Lien Revolver, LIBOR+5.50% cash due 2/10/2026 | Application Software | — | (1,429) | (3,454) | (4)(5) | |||||||||||||||||||||||
| MRI Software LLC | First Lien Delayed Draw Term Loan, LIBOR+5.50% cash due 2/10/2026 | Application Software | — | (763) | (1,568) | (4)(5) | |||||||||||||||||||||||
| Total MRI Software LLC | 1,614,980 | 1,599,109 | 1,570,932 | ||||||||||||||||||||||||||
| Navicure, Inc. | First Lien Term Loan, LIBOR+4.00% cash due 10/22/2026 | 4.15% | Health Care Technology | 3,980,000 | 3,960,100 | 3,899,584 | |||||||||||||||||||||||
| Northern Star Industries Inc. | First Lien Term Loan, LIBOR+4.75% cash due 3/31/2025 | 5.75% | Electrical Components & Equipment | 5,362,500 | 5,345,242 | 5,121,188 | |||||||||||||||||||||||
| Northwest Fiber, LLC | First Lien Term Loan, LIBOR+5.50% cash due 4/30/2027 | 5.66% | Integrated Telecommunication Services | 985,530 | 950,121 | 986,762 | (4) | ||||||||||||||||||||||
61
| Portfolio Company | Industry | Investment Type | Maturity Date | Current Interest Rate (1)(4) | Cash Interest Rate (1) | Principal | Cost | Fair Value (2) | |||||||||||||||
| Ameritox Ltd. (3)(5) | Healthcare services | First Lien Term Loan | 4/11/2021 | LIBOR+5% (1% floor) cash 3% PIK | 6.33 | % | $ | 2,287,177 | $ | 2,243,202 | $ | 265,211 | |||||||||||
| Healthcare services | 119,910.76 Class B Preferred Units | 119,911 | — | ||||||||||||||||||||
| Healthcare services | 368.96 Class A Common Units | 2,174,034 | — | ||||||||||||||||||||
| Total Ameritox Ltd. | 2,287,177 | 4,537,147 | 265,211 | ||||||||||||||||||||
| Beyond Trust Software, Inc. (3) | Application software | First Lien Term Loan | 9/25/2019 | LIBOR+7% (1% floor) cash | 8.33 | % | 11,267,524 | 11,220,478 | 11,267,116 | ||||||||||||||
| Compuware Corporation (3) | Internet software & services | First Lien Term Loan B3 | 12/15/2021 | LIBOR+4.25% (1% floor) cash | 5.49 | % | 6,279,920 | 6,225,992 | 6,358,419 | ||||||||||||||
| Metamorph US 3, LLC (3)(5) | Internet software & services | First Lien Term Loan | 12/1/2020 | LIBOR+5.5% (1% floor) cash 2% PIK | 6.74 | % | 6,825,900 | 6,477,372 | 2,592,115 | ||||||||||||||
| Motion Recruitment Partners LLC (3) | Human resources & employment services | First Lien Term Loan | 2/13/2020 | LIBOR+6% (1% floor) cash | 7.24 | % | 8,659,650 | 8,659,650 | 8,659,223 | ||||||||||||||
| NAVEX Global, Inc. | Internet software & services | First Lien Term Loan | 11/19/2021 | LIBOR+4.25% (1% floor) cash | 5.49 | % | 2,977,041 | 2,967,620 | 2,988,205 | ||||||||||||||
| Air Newco LLC | IT consulting & other services | First Lien Term Loan B | 3/20/2022 | LIBOR+5.5% (1% floor) cash | 6.82 | % | 8,160,622 | 8,141,224 | 8,099,417 | ||||||||||||||
| CM Delaware LLC | Advertising | First Lien Term Loan | 3/18/2021 | LIBOR+5.25% (1% floor) cash | 6.58 | % | 2,075,162 | 2,073,617 | 2,064,786 | ||||||||||||||
| New Trident Holdcorp, Inc. (3) | Healthcare services | First Lien Term Loan B | 7/31/2019 | LIBOR+5.75% (1.25% floor) cash | 7.08 | % | 2,018,206 | 2,000,877 | 1,453,109 | ||||||||||||||
| Central Security Group, Inc. (3) | Specialized consumer services | First Lien Term Loan | 10/6/2021 | LIBOR+5.625% (1% floor) cash | 6.86 | % | 3,876,067 | 3,880,408 | 3,892,211 | ||||||||||||||
| Aptos, Inc. (3) | Data processing & outsourced services | First Lien Term Loan B | 9/1/2022 | LIBOR+6.75% (1% floor) cash | 8.08 | % | 7,920,000 | 7,790,262 | 7,840,800 | ||||||||||||||
| Vubiquity, Inc. | Application software | First Lien Term Loan | 8/12/2021 | LIBOR+5.5% (1% floor) cash | 6.83 | % | 4,126,500 | 4,099,195 | 4,095,551 | ||||||||||||||
| Poseidon Merger Sub, Inc. (3) | Advertising | Second Lien Term Loan | 8/15/2023 | LIBOR+8.5% (1% floor) cash | 9.81 | % | 3,000,000 | 2,933,633 | 3,030,000 | ||||||||||||||
| Novetta Solutions, LLC | Diversified support services | First Lien Term Loan | 10/16/2022 | LIBOR+5% (1% floor) cash | 6.34 | % | 5,990,978 | 5,932,073 | 5,826,226 | ||||||||||||||
| SHO Holding I Corporation | Footwear | First Lien Term Loan | 10/27/2022 | LIBOR+5% (1% floor) cash | 6.24 | % | 6,386,250 | 6,338,479 | 6,306,422 | ||||||||||||||
| Valet Merger Sub, Inc. (3) | Environmental & facilities services | First Lien Term Loan | 9/24/2021 | LIBOR+7% (1% floor) cash | 8.24 | % | 3,920,000 | 3,877,655 | 3,919,865 | ||||||||||||||
| Environmental & facilities services | Incremental Term Loan | 9/24/2021 | LIBOR+7% (1% floor) cash | 8.24 | % | 1,027,425 | 1,006,080 | 1,027,390 | |||||||||||||||
| Total Valet Merger Sub, Inc. (3) | 4,947,425 | 4,883,735 | 4,947,255 | ||||||||||||||||||||
| RSC Acquisition, Inc. | Insurance brokers | First Lien Term Loan | 11/30/2022 | LIBOR+5.25% (1% floor) cash | 6.58 | % | 3,930,134 | 3,912,198 | 3,890,832 | ||||||||||||||
| Integro Parent Inc. | Insurance brokers | First Lien Term Loan | 10/31/2022 | LIBOR+5.75% (1% floor) cash | 7.06 | % | 4,913,924 | 4,790,511 | 4,901,639 | ||||||||||||||
| TruckPro, LLC | Auto parts & equipment | First Lien Term Loan | 8/6/2018 | LIBOR+5% (1% floor) cash | 6.24 | % | 1,823,268 | 1,821,822 | 1,825,054 | ||||||||||||||
| Falmouth Group Holdings Corp. | Specialty chemicals | First Lien Term Loan | 12/13/2021 | LIBOR+6.75% (1% floor) cash | 8.08 | % | 4,610,174 | 4,572,990 | 4,610,400 | ||||||||||||||
| Ancile Solutions, Inc. (3) | Internet software & services | First Lien Term Loan | 6/30/2021 | LIBOR+7% (1% floor) cash | 8.33 | % | 4,042,355 | 3,995,621 | 4,010,198 | ||||||||||||||
| California Pizza Kitchen, Inc. | Restaurants | First Lien Term Loan | 8/23/2022 | LIBOR+6% (1% floor) cash | 7.24 | % | 4,950,000 | 4,938,077 | 4,917,008 | ||||||||||||||
| MHE Intermediate Holdings, LLC (3) | Diversified support services | First Lien Term Loan B | 3/11/2024 | LIBOR+5% (1% floor) cash | 6.33 | % | 4,228,750 | 4,150,304 | 4,228,752 | ||||||||||||||
| Diversified support services | Delayed Draw Term Loan | 3/11/2024 | LIBOR+5% (1% floor) cash | 6.33 | % | 667,510 | 635,208 | 667,510 | |||||||||||||||
| Total MHE Intermediate Holdings, LLC | 4,896,260 | 4,785,512 | 4,896,262 | ||||||||||||||||||||
| Total Portfolio Investments | $ | 115,964,537 | $ | 116,978,493 | $ | 108,737,459 | |||||||||||||||||
| Portfolio Company | Investment Type | Cash Interest Rate (1)(2) | Industry | Principal | Cost | Fair Value (3) | Notes | ||||||||||||||||||||||
| Novetta Solutions, LLC | First Lien Term Loan, LIBOR+5.00% cash due 10/17/2022 | 6.00% | Application Software | $ | 5,807,651 | $ | 5,770,724 | $ | 5,706,017 | ||||||||||||||||||||
| OEConnection LLC | First Lien Term Loan, LIBOR+4.00% cash due 9/25/2026 | 4.15% | Application Software | 3,727,256 | 3,709,171 | 3,685,325 | (4) | ||||||||||||||||||||||
| OEConnection LLC | First Lien Delayed Draw Term Loan, LIBOR+4.00% cash due 9/25/2026 | Application Software | — | (1,048) | (2,654) | (4)(5) | |||||||||||||||||||||||
| Total OEConnection LLC | 3,727,256 | 3,708,123 | 3,682,671 | ||||||||||||||||||||||||||
| Olaplex, Inc. | First Lien Term Loan, LIBOR+6.50% cash due 1/8/2026 | 7.50% | Personal Products | 2,962,500 | 2,910,467 | 2,962,500 | (4) | ||||||||||||||||||||||
| Olaplex, Inc. | First Lien Revolver, LIBOR+6.50% cash due 1/8/2025 | 7.50% | Personal Products | 162,000 | 156,467 | 162,000 | (4)(5) | ||||||||||||||||||||||
| Total Olaplex, Inc. | 3,124,500 | 3,066,934 | 3,124,500 | ||||||||||||||||||||||||||
| Sabert Corporation | First Lien Term Loan, LIBOR+4.50% cash due 12/10/2026 | 5.50% | Metal & Glass Containers | 1,885,500 | 1,866,645 | 1,860,366 | (4) | ||||||||||||||||||||||
| SHO Holding I Corporation | First Lien Term Loan, LIBOR+3.00% cash PIK 2.25% due 4/27/2024 | 4.00% | Footwear | 6,239,067 | 6,212,276 | 4,382,944 | |||||||||||||||||||||||
| Signify Health, LLC | First Lien Term Loan, LIBOR+4.50% cash due 12/23/2024 | 5.50% | Health Care Services | 5,850,000 | 5,813,914 | 5,645,250 | (4) | ||||||||||||||||||||||
| Sunshine Luxembourg VII SARL | First Lien Term Loan, LIBOR+4.25% cash due 10/1/2026 | 5.25% | Personal Products | 6,451,250 | 6,418,993 | 6,427,573 | |||||||||||||||||||||||
| Supermoose Borrower, LLC | First Lien Term Loan, LIBOR+3.75% cash due 8/29/2025 | 3.90% | Application Software | 2,878,863 | 2,692,385 | 2,595,483 | (4) | ||||||||||||||||||||||
| Surgery Center Holdings, Inc. | First Lien Term Loan, LIBOR+3.25% cash due 9/3/2024 | 4.25% | Health Care Facilities | 4,961,637 | 4,942,580 | 4,690,806 | |||||||||||||||||||||||
| Tribe Buyer LLC | First Lien Term Loan, LIBOR+4.50% cash due 2/16/2024 | 5.50% | Human Resource & Employment Services | 1,616,127 | 1,613,862 | 1,224,798 | |||||||||||||||||||||||
| UFC Holdings, LLC | First Lien Term Loan, LIBOR+3.25% cash due 4/29/2026 | 4.25% | Movies & Entertainment | 1,557,649 | 1,540,707 | 1,534,775 | (4) | ||||||||||||||||||||||
| Verscend Holding Corp. | First Lien Term Loan, LIBOR+4.50% cash due 8/27/2025 | 4.65% | Health Care Technology | 1,733,723 | 1,720,364 | 1,722,238 | (4) | ||||||||||||||||||||||
| VM Consolidated, Inc. | First Lien Term Loan, LIBOR+3.25% cash due 2/28/2025 | 3.40% | Data Processing & Outsourced Services | 4,771,728 | 4,756,892 | 4,682,258 | |||||||||||||||||||||||
| Windstream Services II, LLC | First Lien Term Loan, LIBOR+6.25% cash due 9/21/2027 | 7.25% | Integrated Telecommunication Services | 4,987,500 | 4,788,469 | 4,839,970 | (4) | ||||||||||||||||||||||
| WP CPP Holdings, LLC | Second Lien Term Loan, LIBOR+7.75% cash due 4/30/2026 | 8.75% | Aerospace & Defense | 3,000,000 | 2,978,243 | 2,340,000 | (4) | ||||||||||||||||||||||
| Total Portfolio Investments | $ | 143,138,964 | $ | 140,599,644 | $ | 130,760,749 | |||||||||||||||||||||||
__________
(1) Represents the current interest rate as of September 30, 2017.2020. All interest rates are payable in cash, unless otherwise noted.
(2) Represents the current determination of fair value as of September 30, 2017 utilizing a similar technique as us in accordance with ASC 820. However, the determination of such fair value is not included in our Board of Directors' valuation process described elsewhere herein.
| Portfolio Company | Industry | Investment Type | Maturity Date | Current Interest Rate (1)(4) | Cash Interest Rate (1) | Principal | Cost | Fair Value (2) | |||||||||||||||
| Ameritox Ltd. (3) | Healthcare services | First Lien Term Loan | 4/11/2021 | LIBOR+5% (1% floor) cash 3% PIK | 6.00 | % | $ | 2,339,146 | $ | 2,336,840 | $ | 2,322,917 | |||||||||||
| Healthcare services | 119,910.76 Class B Preferred Units | — | 119,911 | 131,369 | |||||||||||||||||||
| Healthcare services | 368.96 Class A Common Units | — | 2,174,034 | 981,348 | |||||||||||||||||||
| Total Ameritox Ltd. | 2,339,146 | 4,630,785 | 3,435,634 | ||||||||||||||||||||
| Answers Corporation (3) (5) | Internet software & services | First Lien Term Loan | 10/3/2021 | LIBOR+5.25% (1% floor) cash | 6.25 | % | 7,899,749 | 7,636,708 | 4,265,865 | ||||||||||||||
| Beyond Trust Software, Inc. (3) | Application software | First Lien Term Loan | 9/25/2019 | LIBOR+7% (1% floor) cash | 8.00 | % | 12,641,009 | 12,554,571 | 12,538,499 | ||||||||||||||
| Compuware Corporation (3) | Internet software & services | First Lien Term Loan B1 | 12/15/2019 | LIBOR+5.25% (1% floor) cash | 6.25 | % | 7,392,405 | 7,306,444 | 7,420,127 | ||||||||||||||
| Metamorph US 3, LLC (3) | Internet software & services | First Lien Term Loan | 12/1/2020 | LIBOR+6.5% (1% floor) cash | 7.50 | % | 6,900,283 | 6,808,009 | 5,744,139 | ||||||||||||||
| Motion Recruitment Partners LLC (3) | Human resources & employment services | First Lien Term Loan | 2/13/2020 | LIBOR+6% (1% floor) cash | 7.00 | % | 9,125,000 | 9,125,000 | 9,099,254 | ||||||||||||||
| NAVEX Global, Inc. (3) | Internet software & services | First Lien Term Loan | 11/19/2021 | LIBOR+4.75% (1% floor) cash | 5.99 | % | 1,793,550 | 1,779,633 | 1,784,582 | ||||||||||||||
| Teaching Strategies, LLC | Education services | First Lien Term Loan (3) | 10/1/2019 | LIBOR+5.5% (0.5% floor) cash | 6.34 | % | 2,570,471 | 2,567,575 | 2,556,891 | ||||||||||||||
| Education services | First Lien Delayed Draw Term Loan | 10/1/2019 | LIBOR+5.5% (0.5% floor) cash | 6.34 | % | 6,840,000 | 6,832,715 | 6,803,695 | |||||||||||||||
| Total Teaching Strategies, LLC | 9,410,471 | 9,400,290 | 9,360,586 | ||||||||||||||||||||
| TrialCard Incorporated (3) | Healthcare services | First Lien Term Loan | 12/31/2019 | LIBOR+4.5% (1% floor) cash | 5.50 | % | 7,179,097 | 7,144,396 | 7,144,248 | ||||||||||||||
| Air Newco LLC | IT consulting & other services | First Lien Term Loan B | 3/20/2022 | LIBOR+5.5% (1% floor) cash | 6.50 | % | 8,291,864 | 8,267,671 | 7,960,189 | ||||||||||||||
| Fineline Technologies, Inc. (3) | Electronic equipment & instruments | First Lien Term Loan | 5/5/2017 | LIBOR+5.5% (1% floor) cash | 6.50 | % | 7,034,441 | 7,010,963 | 7,015,051 | ||||||||||||||
| LegalZoom.com, Inc. (3) | Specialized consumer services | First Lien Term Loan | 5/13/2020 | LIBOR+7% (1% floor) cash | 8.00 | % | 9,850,000 | 9,672,034 | 9,772,706 | ||||||||||||||
| GK Holdings, Inc. | IT consulting & other services | First Lien Term Loan | 1/20/2021 | LIBOR+5.5% (1% floor) cash | 6.50 | % | 3,438,750 | 3,452,038 | 3,412,959 | ||||||||||||||
| Vitera Healthcare Solutions, LLC | Healthcare technology | Second Lien Term Loan | 11/4/2021 | LIBOR+8.25% (1% floor) cash | 9.25 | % | 3,000,000 | 2,958,409 | 2,782,500 | ||||||||||||||
| TIBCO Software, Inc. (3) | Internet software & services | First Lien Term Loan | 12/4/2020 | LIBOR+5.5% (1% floor) cash | 6.50 | % | 2,304,900 | 2,308,815 | 2,277,114 | ||||||||||||||
| CM Delaware LLC | Advertising | First Lien Term Loan | 3/18/2021 | LIBOR+5.25% (1% floor) cash | 6.25 | % | 2,096,666 | 2,094,658 | 1,978,729 | ||||||||||||||
| New Trident Holdcorp, Inc. (3) | Healthcare services | First Lien Term Loan B | 7/31/2019 | LIBOR+5.25% (1.25% floor) cash | 6.50 | % | 2,041,357 | 2,014,233 | 1,755,567 | ||||||||||||||
| Central Security Group, Inc. (3) | Specialized consumer services | First Lien Term Loan | 10/6/2020 | LIBOR+5.625% (1% floor) cash | 6.63 | % | 5,909,774 | 5,915,626 | 5,776,805 | ||||||||||||||
| Auction.com, LLC | Internet software & services | First Lien Term Loan | 5/12/2019 | LIBOR+5% (1% floor) cash | 6.00 | % | 3,940,000 | 3,926,700 | 3,959,700 | ||||||||||||||
| Aptos, Inc. (3) | Data processing & outsourced services | First Lien Term Loan B | 9/1/2022 | LIBOR+6.75% (1% floor) cash | 7.75 | % | 8,000,000 | 7,842,222 | 7,920,000 | ||||||||||||||
| Vubiquity, Inc. | Application software | First Lien Term Loan | 8/12/2021 | LIBOR+5.5% (1% floor) cash | 6.50 | % | 4,168,500 | 4,133,700 | 4,147,658 | ||||||||||||||
| Too Faced Cosmetics, LLC (3) | Personal products | First Lien Term Loan B | 7/7/2021 | LIBOR+5% (1% floor) cash | 6.00 | % | 642,692 | 581,620 | 645,155 | ||||||||||||||
| American Seafoods Group LLC (3) | Food distributors | First Lien Term Loan | 8/19/2021 | LIBOR+5% (1% floor) cash | 6.00 | % | 3,853,704 | 3,837,366 | 3,844,069 | ||||||||||||||
| Worley Claims Services, LLC | Internet software & services | First Lien Term Loan | 10/31/2020 | LIBOR+8% (1% floor) cash | 9.00 | % | 5,730,937 | 5,707,511 | 5,702,282 | ||||||||||||||
| Poseidon Merger Sub, Inc. (3) | Advertising | Second Lien Term Loan | 8/15/2023 | LIBOR+8.5% (1% floor) cash | 9.50 | % | 3,000,000 | 2,922,316 | 3,039,954 | ||||||||||||||
| AccentCare, Inc. | Healthcare services | First Lien Term Loan | 9/3/2021 | LIBOR+5.75% (1% floor) cash | 6.75 | % | 7,850,000 | 7,773,386 | 7,727,344 | ||||||||||||||
| Novetta Solutions, LLC | Diversified support services | First Lien Term Loan | 10/17/2022 | LIBOR+5.75% (1% floor) cash | 6.00 | % | 6,477,948 | 6,392,100 | 6,226,928 | ||||||||||||||
| SHO Holding I Corporation | Footwear | First Lien Term Loan | 10/27/2022 | LIBOR+5% (1% floor) cash | 6.00 | % | 6,451,250 | 6,393,472 | 6,443,186 | ||||||||||||||
| Valet Merger Sub, Inc. (3) | Environmental & facilities services | First Lien Term Loan | 9/24/2021 | LIBOR+7% (1% floor) cash | 8.00 | % | 3,960,000 | 3,906,498 | 4,026,826 | ||||||||||||||
| RSC Acquisition, Inc. | Insurance brokers | First Lien Term Loan | 11/30/2022 | LIBOR+5.25% (1% floor) cash | 6.25 | % | 3,970,390 | 3,948,754 | 3,950,538 | ||||||||||||||
| Integro Parent Inc. | Insurance brokers | First Lien Term Loan | 10/31/2022 | LIBOR+5.75% (1% floor) cash | 6.75 | % | 4,963,924 | 4,814,658 | 4,889,465 | ||||||||||||||
| TruckPro, LLC | Auto parts & equipment | First Lien Term Loan | 8/6/2018 | LIBOR+5% (1% floor) cash | 6.00 | % | 1,920,000 | 1,916,612 | 1,919,232 | ||||||||||||||
| Falmouth Group Holdings Corp. | Specialty chemicals | First Lien Term Loan | 12/13/2021 | LIBOR+6.75% (1% floor) cash | 7.75 | % | 4,962,500 | 4,912,596 | 4,967,689 | ||||||||||||||
| Sundial Group Holdings LLC | Personal products | First Lien Term Loan | 10/19/2021 | LIBOR+6.25% (1% floor) cash | 7.25 | % | 3,900,000 | 3,839,938 | 3,954,402 | ||||||||||||||
| Onvoy, LLC (3) | Integrated telecommunication services | First Lien Term Loan | 4/29/2021 | LIBOR+6.25% (1% floor) cash | 7.25 | % | 7,406,250 | 7,261,422 | 7,386,738 | ||||||||||||||
| Ancile Solutions, Inc. (3) | Internet software & services | First Lien Term Loan | 6/30/2021 | LIBOR+7% (1% floor) cash | 8.00 | % | 4,500,000 | 4,433,644 | 4,432,500 | ||||||||||||||
| Total Portfolio Investments | $ | 194,346,557 | $ | 194,624,798 | $ | 188,708,220 | |||||||||||||||||
(6) This investment was on cash non-accrual status as of September 30, 2020. Cash non-accrual is inclusive of PIK and other non-cash income where applicable.
62
OCSI Glick JV Portfolio as of September 30, 2019
| Portfolio Company | Investment Type | Cash Interest Rate (1)(2) | Industry | Principal | Cost | Fair Value (3) | Notes | ||||||||||||||||||||||
| AI Ladder (Luxembourg) Subco S.a.r.l. | First Lien Term Loan, LIBOR+4.50% cash due 7/9/2025 | 6.60% | Electrical components & equipment | $ | 2,718,993 | $ | 2,651,270 | $ | 2,504,016 | (4) | |||||||||||||||||||
| Air Newco LP | First Lien Term Loan, LIBOR+4.75% cash due 5/31/2024 | 6.79% | IT consulting & other services | 7,425,000 | 7,406,438 | 7,437,400 | |||||||||||||||||||||||
| AL Midcoast Holdings LLC | First Lien Term Loan, LIBOR+5.50% cash due 8/1/2025 | 7.60% | Oil & gas storage & transportation | 6,930,000 | 6,860,699 | 6,834,712 | (4) | ||||||||||||||||||||||
| Altice France S.A. | First Lien Term Loan, LIBOR+4.00% cash due 8/14/2026 | 6.03% | Integrated telecommunication services | 2,977,500 | 2,912,809 | 2,975,639 | |||||||||||||||||||||||
| Alvogen Pharma US, Inc. | First Lien Term Loan, LIBOR+4.75% cash due 4/1/2022 | 6.79% | Pharmaceuticals | 5,359,286 | 5,359,286 | 4,874,270 | |||||||||||||||||||||||
| Ancile Solutions, Inc. | First Lien Term Loan, LIBOR+7.00% cash due 6/30/2021 | 9.10% | Application software | 3,395,374 | 3,377,463 | 3,327,467 | (4) | ||||||||||||||||||||||
| Aptos, Inc. | First Lien Term Loan, LIBOR+5.50% cash due 7/23/2025 | 7.70% | Computer & electronics retail | 2,977,500 | 2,947,725 | 2,940,281 | (4) | ||||||||||||||||||||||
| Brazos Delaware II, LLC | First Lien Term Loan, LIBOR+4.00% cash due 5/21/2025 | 6.05% | Oil & gas equipment & services | 4,937,500 | 4,917,589 | 4,570,273 | |||||||||||||||||||||||
| California Pizza Kitchen, Inc. | First Lien Term Loan, LIBOR+6.00% cash due 8/23/2022 | 8.53% | Restaurants | 4,850,000 | 4,838,318 | 4,349,868 | |||||||||||||||||||||||
| CITGO Petroleum Corp. | First Lien Term Loan, LIBOR+5.00% cash due 3/28/2024 | 7.10% | Oil & gas refining & marketing | 3,980,000 | 3,940,200 | 4,004,875 | (4) | ||||||||||||||||||||||
| Connect U.S. Finco LLC | First Lien Term Loan, LIBOR+4.50% cash due 9/23/2026 | 7.10% | Alternative Carriers | 5,000,000 | 4,900,000 | 4,930,075 | (4) | ||||||||||||||||||||||
| Covia Holdings Corporation | First Lien Term Loan, LIBOR+4.00% cash due 6/1/2025 | 6.31% | Oil & gas equipment & services | 6,912,500 | 6,912,500 | 5,673,745 | |||||||||||||||||||||||
| Curium Bidco S.à r.l. | First Lien Term Loan, LIBOR+4.00% cash due 7/9/2026 | 6.10% | Biotechnology | 5,000,000 | 4,962,500 | 5,025,000 | (4) | ||||||||||||||||||||||
| Ellie Mae, Inc. | First Lien Term Loan, LIBOR+4.00% cash due 4/17/2026 | 6.04% | Application software | 1,000,000 | 995,000 | 1,002,920 | (4) | ||||||||||||||||||||||
| Falmouth Group Holdings Corp. | First Lien Term Loan, LIBOR+6.75% cash due 12/14/2021 | 8.95% | Specialty chemicals | 4,658,544 | 4,626,032 | 4,632,004 | |||||||||||||||||||||||
| Frontier Communications Corporation | First Lien Term Loan, LIBOR+3.75% cash due 6/15/2024 | 5.80% | Integrated telecommunications services | 5,468,222 | 5,365,594 | 5,466,281 | (4) | ||||||||||||||||||||||
| Gigamon, Inc. | First Lien Term Loan, LIBOR+4.25% cash due 12/27/2024 | 6.29% | Systems software | 5,895,000 | 5,850,631 | 5,732,888 | |||||||||||||||||||||||
| Guidehouse LLP | Second Lien Term Loan, LIBOR+7.50% cash due 5/1/2026 | 9.54% | Research & consulting services | 5,000,000 | 4,979,290 | 4,937,500 | (4) | ||||||||||||||||||||||
| Indivior Finance S.a.r.l. | First Lien Term Loan, LIBOR+4.50% cash due 12/19/2022 | 6.76% | Pharmaceuticals | 4,340,941 | 4,326,851 | 3,997,290 | (4) | ||||||||||||||||||||||
| Integro Parent, Inc. | First Lien Term Loan, LIBOR+5.75% cash due 10/31/2022 | 7.80% | Insurance brokers | 4,813,924 | 4,744,243 | 4,681,541 | |||||||||||||||||||||||
| Intelsat Jackson Holdings S.A. | First Lien Term Loan, LIBOR+3.75% cash due 11/27/2023 | 5.80% | Alternative Carriers | 5,000,000 | 4,939,169 | 5,021,100 | |||||||||||||||||||||||
| McDermott Technology (Americas), Inc. | First Lien Term Loan, LIBOR+5.00% cash due 5/9/2025 | 7.10% | Oil & gas equipment & services | 1,429,306 | 1,406,187 | 913,565 | (4) | ||||||||||||||||||||||
| MHE Intermediate Holdings, LLC | First Lien Term Loan, LIBOR+5.00% cash due 3/8/2024 | 7.10% | Diversified support services | 4,143,750 | 4,089,029 | 4,060,875 | (4) | ||||||||||||||||||||||
| First Lien Delayed Draw Term Loan, LIBOR+5.00% cash due 3/8/2024 | 7.10% | Diversified support services | 837,128 | 826,823 | 820,385 | (4) | |||||||||||||||||||||||
| Total MHE Intermediate Holdings, LLC | 4,980,878 | 4,915,852 | 4,881,260 | ||||||||||||||||||||||||||
| Navicure, Inc. | First Lien Term Loan, LIBOR+4.00% cash due 9/18/2026 | 6.13% | Healthcare technology | 4,000,000 | 3,980,000 | 4,005,000 | |||||||||||||||||||||||
| Northern Star Industries Inc. | First Lien Term Loan, LIBOR+4.50% cash due 3/31/2025 | 6.56% | Electrical components & equipment | 5,417,500 | 5,396,178 | 5,336,238 | |||||||||||||||||||||||
| Novetta Solutions, LLC | First Lien Term Loan, LIBOR+5.00% cash due 10/17/2022 | 7.05% | Application software | 5,868,628 | 5,824,577 | 5,760,440 | |||||||||||||||||||||||
63
| Portfolio Company | Investment Type | Cash Interest Rate (1)(2) | Industry | Principal | Cost | Fair Value (3) | Notes | ||||||||||||||||||||||
| OCI Beaumont LLC | First Lien Term Loan, LIBOR+4.00% cash due 3/13/2025 | 6.10% | Commodity chemicals | $ | 6,895,000 | $ | 6,888,231 | $ | 6,903,619 | (4) | |||||||||||||||||||
| OEConnection LLC | First Lien Term Loan, LIBOR+4.00% cash due 9/24/2026 | 6.13% | Application software | 3,655,914 | 3,637,634 | 3,649,059 | (4) | ||||||||||||||||||||||
| First Lien Delayed Draw Term Loan, LIBOR+4.00% cash due 9/24/2026 | Application software | — | (1,720) | (645) | (4)(5) | ||||||||||||||||||||||||
| Total OEConnection LLC | 3,655,914 | 3,635,914 | 3,648,414 | ||||||||||||||||||||||||||
| Red Ventures, LLC | First Lien Term Loan, LIBOR+3.00% cash due 11/8/2024 | 5.04% | Interactive media & services | 3,989,924 | 3,970,677 | 4,010,712 | |||||||||||||||||||||||
| RSC Acquisition, Inc. | First Lien Term Loan, LIBOR+4.25% cash due 11/30/2022 | 6.29% | Trading companies & distributors | 3,849,574 | 3,835,594 | 3,820,702 | |||||||||||||||||||||||
| Servpro Borrower, LLC | First Lien Term Loan, PRIME+2.50% cash due 3/26/2026 | 7.50% | Specialized consumer services | 3,980,000 | 3,970,050 | 3,984,975 | |||||||||||||||||||||||
| SHO Holding I Corporation | First Lien Term Loan, LIBOR+5.00% cash due 10/27/2022 | 7.26% | Footwear | 6,256,250 | 6,227,881 | 5,943,438 | |||||||||||||||||||||||
| Signify Health, LLC | First Lien Term Loan, LIBOR+4.50% cash due 12/23/2024 | 6.60% | Healthcare services | 5,910,000 | 5,864,902 | 5,902,613 | (4) | ||||||||||||||||||||||
| Sunshine Luxembourg VII SARL | First Lien Term Loan, LIBOR+4.25% cash due 9/25/2026 | 6.59% | Personal products | 6,500,000 | 6,467,500 | 6,538,610 | (4) | ||||||||||||||||||||||
| Tribe Buyer LLC | First Lien Term Loan, LIBOR+4.50% cash due 2/16/2024 | 6.54% | Human resources & employment services | 3,114,779 | 3,109,120 | 2,907,133 | (4) | ||||||||||||||||||||||
| Triple Royalty Sub LLC | Fixed Rate Bond 144A 9.0% Toggle PIK cash due 4/15/2033 | Pharmaceuticals | 3,000,000 | 3,000,000 | 3,105,000 | ||||||||||||||||||||||||
| UFC Holdings, LLC | First Lien Term Loan, LIBOR+3.25% cash due 4/29/2026 | 5.30% | Movies & entertainment | 2,493,573 | 2,493,573 | 2,503,099 | (4) | ||||||||||||||||||||||
| Verra Mobility, Corp. | First Lien Term Loan, LIBOR+3.75% cash due 2/28/2025 | 5.79% | Data processing & outsourced services | 4,929,950 | 4,913,436 | 4,956,645 | (4) | ||||||||||||||||||||||
| WP CPP Holdings, LLC | Second Lien Term Loan, LIBOR+7.75% cash due 4/30/2026 | 10.01% | Aerospace & defense | 3,000,000 | 2,974,333 | 2,987,490 | (4) | ||||||||||||||||||||||
| Total Portfolio Investments | $ | 177,911,560 | $ | 176,687,612 | $ | 173,028,098 | |||||||||||||||||||||||
__________
(1) Represents the interest rate as of September 30, 2019. All interest rates are payable in cash, unless otherwise noted.
(2) The interest rate on the principal balance outstanding for all floating rate loans is indexed to LIBOR and/or an alternate base rate (e.g., prime rate), which typically resets semi-annually, quarterly, or monthly at the borrower's option. The borrower may also elect to have multiple interest reset periods for each loan. For each of these loans, we have provided the applicable margin over LIBOR or the alternate base rate based on each respective credit agreement.agreement and the cash interest rate as of period end. All LIBOR shown above is in U.S. dollars. As of September 30, 2019, the reference rates for the OCSI Glick JV's variable rate loans were the 30-day LIBOR at 2.04%, the 60-day LIBOR at 2.09%, the 90-day LIBOR at 2.10%, the 180-day LIBOR at 2.06% and the PRIME at 5.00%. Most loans include an interest floor, which generally ranges from 0% to 1%.
(4) This investment is held by both us and the OCSI Glick JV as of September 30, 2019.
(5) Investment has undrawn commitments. Unamortized fees are classified as unearned income which reduces cost basis, which may result in a negative cost basis. A negative fair value may result from the unfunded commitment being valued below par.
The cost and fair value of our aggregate investment in FSFRthe OCSI Glick JV held by us was $71.3$72.2 million and $57.6$49.4 million, respectively, as of September 30, 20172020 and $71.1$73.2 million and $63.3$54.3 million, respectively, as of September 30, 2016. The2019. As of September 30, 2020, our investment in the Subordinated Notes pay a weighted average interest rate of LIBOR plus 8.0% per annum.was on cash non-accrual status. For the yearyears ended September 30, 20172020, 2019 and September 30, 2016,2018, we earned interest income of $5.8$1.4 million, 5.9 million and $5.1$6.1 million, respectively, on our investment in the Subordinated Notes, of which $0.0 million, $0.0 million and $2.2 million was PIK interest income, respectively. We reversed $0.6 million ofdid not earn any dividend income previously recordedfor the years ended September 30, 2020, 2019 and 2018 with respect to our investment in prior periods duringthe LLC equity interests of the OCSI Glick JV.
During the year ended September 30, 2017 with respect2020, in order to our LLC equity interests sincerealign the OCSI Glick JV for current market conditions, we determinedand GF Debt Funding amended the Subordinated Notes to (1) decrease the interest rate to 1-month LIBOR plus 4.5% per annum, (2) extend the maturity date from October 20, 2021 to October 20, 2028 and (3) provide that such dividend payments may no longer be collectible. We earned dividend incomethe Subordinated Notes will not pay interest on its previously scheduled April 15, 2020, July 15, 2020, October 15, 2020 or January 15, 2021 coupon dates. As of $2.7 million for the year ended September 30, 2016 with respect to its LLC equity interests. The LLC equity interests are dividend producing to2019, the extent FSFR Glick JV has residual cash to be distributed on a quarterly basis.Subordinated Notes bore an interest rate of 1-month LIBOR plus 6.5% per annum.
64
Below is certain summarized financial information for FSFRthe OCSI Glick JV as of September 30, 20172020 and September 30, 20162019 and for the years ended September 30, 20172020, 2019 and September 30, 2016:2018:
| September 30, 2020 | September 30, 2019 | |||||||||||||
| Selected Balance Sheet Information: | ||||||||||||||
| Investments at fair value (cost September 30, 2020: $140,599,644; cost September 30, 2019: $176,687,612) | $ | 130,760,749 | $ | 173,028,098 | ||||||||||
| Cash and cash equivalents | 3,574,960 | 1,096,498 | ||||||||||||
| Restricted cash | 1,106,829 | 2,616,125 | ||||||||||||
| Other assets | 2,475,078 | 2,937,681 | ||||||||||||
| Total assets | $ | 137,917,616 | $ | 179,678,402 | ||||||||||
| Senior credit facility payable | $ | 80,681,939 | $ | 91,881,939 | ||||||||||
| Subordinated notes payable at fair value (proceeds September 30, 2020: $74,337,772; proceeds September 30, 2019: $75,517,614) | 56,469,250 | 62,087,348 | ||||||||||||
| Other liabilities | 766,427 | 25,709,115 | ||||||||||||
| Total liabilities | $ | 137,917,616 | $ | 179,678,402 | ||||||||||
| Members' equity | — | — | ||||||||||||
| Total liabilities and members' equity | $ | 137,917,616 | $ | 179,678,402 | ||||||||||
| September 30, 2017 | September 30, 2016 | |||||||
| Selected Balance Sheet Information: | ||||||||
| Investments in loans at fair value (cost September 30, 2017: $116,978,493; cost September 30, 2016: $194,624,798) | $ | 108,737,459 | $ | 188,708,220 | ||||
| Receivable from secured financing arrangement at fair value (September 30, 2016 cost: $5,000,000) | — | 4,985,425 | ||||||
| Cash and cash equivalents | 13,891,899 | 980,605 | ||||||
| Restricted cash | 2,249,575 | 3,343,303 | ||||||
| Receivable from unsettled transactions | — | 952,591 | ||||||
| Due from portfolio companies | 7,653 | — | ||||||
| Other assets | 1,791,077 | 2,162,942 | ||||||
| Total assets | $ | 126,677,663 | $ | 201,133,086 | ||||
| Senior credit facility payable | $ | 56,881,939 | $ | 124,615,636 | ||||
| Subordinated notes payable at fair value (proceeds September 30, 2017: $73,404,435; cost September 30, 2016: $73,149,434) | 65,836,199 | 65,012,167 | ||||||
| Other liabilities | 3,959,525 | 4,196,688 | ||||||
| Total liabilities | $ | 126,677,663 | $ | 193,824,491 | ||||
| Members' equity | — | 7,308,595 | ||||||
| Total liabilities and members' equity | $ | 126,677,663 | $ | 201,133,086 | ||||
| Year ended September 30, 2017 | Year ended September 30, 2016 | Year ended September 30, 2020 | Year ended September 30, 2019 | Year ended September 30, 2018 | ||||||||||||||||||||||||
| Selected Statements of Operations Information: | Selected Statements of Operations Information: | |||||||||||||||||||||||||||
| Interest income | $ | 11,148,203 | $ | 14,109,946 | Interest income | $ | 9,994,321 | $ | 12,446,772 | $ | 9,823,972 | |||||||||||||||||
| PIK interest income | 53,620 | 33,170 | ||||||||||||||||||||||||||
| Fee income | 160,984 | 95,756 | Fee income | 301,288 | 29,999 | 77,999 | ||||||||||||||||||||||
| Total investment income | 11,362,807 | 14,238,872 | Total investment income | 10,295,609 | 12,476,771 | 9,901,971 | ||||||||||||||||||||||
| Interest expense | $ | 11,055,880 | $ | 10,780,919 | Interest expense | 5,585,942 | 11,597,998 | 11,433,877 | ||||||||||||||||||||
| Other expenses | 224,559 | 283,267 | Other expenses | 159,836 | 176,358 | 211,874 | ||||||||||||||||||||||
| Total expenses (1) | 11,280,439 | 11,064,186 | Total expenses (1) | 5,745,778 | 11,774,356 | 11,645,751 | ||||||||||||||||||||||
| Net unrealized appreciation (depreciation) | $ | (2,893,408 | ) | $ | 3,832,274 | Net unrealized appreciation (depreciation) | (382,788) | (183,384) | 10,626,928 | |||||||||||||||||||
| Realized loss on investments | (3,873,454 | ) | (3,119,735 | ) | ||||||||||||||||||||||||
| Realized gain (loss) | Realized gain (loss) | (4,167,043) | (519,031) | (8,883,148) | ||||||||||||||||||||||||
| Net income (loss) | $ | (6,684,494 | ) | $ | 3,887,225 | Net income (loss) | $ | — | $ | — | $ | — | ||||||||||||||||
__________
(1) There are no management fees or incentive fees charged at FSFRthe OCSI Glick JV.
During the yearyears ended September 30, 2017,2020, 2019 and 2018, we did not sell any senior secured debt investments to FSFRthe OCSI Glick JV. During the year ended September 30, 2016, we sold $48.9 million of senior secured debt investments at fair value to FSFR Glick JV in exchange for $47.6 million cash consideration, $1.2 million of subordinated notes in FSFR Glick JV and $0.1 million of LLC equity interests in FSFR Glick JV. We realized aloss of $0.5 million on these transactions.
Discussion and Analysis of Results and Operations
Results of Operations
65
Comparison of Years endedEnded September 30, 20172020 and September 30, 20162019
Total Investment Income
Total investment income includes interest on our investments, fee income and other investmentdividend income.
Total investment income for the years ended September 30, 20172020 and September 30, 20162019 was $46.6$39.5 million and $53.4$49.6 million, respectively. For the year ended September 30, 2017,2020, this amount primarily consisted of $44.9$38.4 million of interest income from portfolio investments (which included $0.4$2.0 million of PIK interest) and $2.2$1.2 million of fee income. For the year ended September 30, 2016,2019, this amount primarily consisted of $47.6$49.0 million of interest income from portfolio investments (which included $0.2and $0.6 million of PIK interest), $3.1 million of fee income and $2.7 million of dividend income. The decrease of $6.9$10.1 million in our total investment income for the year ended September 30, 2017,2020, as compared to the year ended September 30, 2016,2019, was primarily attributabledue to a $10.6 million decrease in interest income, which was the result of a lower weighted average annual yield on our debt investments and lower dividend income earned ondue to decreases in LIBOR, our investment in FSFR Glick JV. The weighted average annual yield on our debt investments as of September 30, 2017, including the return on our subordinated note investment in FSFROCSI Glick JV being on cash non-accrual status and a smaller overall portfolio size, partially offset by a $0.5 million increase in fee income, which was approximately 7.52%, as comparedattributable to 8.58% as of September 30, 2016.higher amendment fees and structuring fees earned.
Expenses
Net expenses (expenses net of base management fee waivers and insurance recoveries)waivers) for the yearsyear ended September 30, 20172020 and September 30, 20162019 were $24.2$23.3 million and $28.1$28.5 million, respectively. The decrease of $3.9$5.2 million in our net expenses for the year ended September 30, 2017,2020, as compared to the year ended September 30, 2016,2019, was primarily due to a $2.9 million decrease in professional fees (net of insurance recoveries) incurred in connection with proxy-related matters, a $2.0$2.3 million decrease in Part I incentiveincentives fees payable to our investment adviser,(net of waivers), which was primarily attributable to lower pre-incentive fee net investment income, for the year-over-year period, partially offset by a $1.2$2.1 million increasedecrease in interest expense attributable to higher interest ratesresulting from decreases in the current year.LIBOR and a $0.6 million decrease in professional fees, general and administrative expenses and administrator expenses.
Net Investment Income
As a result of the $6.9$10.1 million decrease in total investment income offset byand the $3.9$5.2 million decrease in net expenses, net investment income for the year ended September 30, 2017 reflected an approximate $2.92020 decreased by approximately $4.9 million, decrease, as compared to the year ended September 30, 2016.2019.
Realized Gain (Loss) on Investments
Realized gains or losses are measured by the difference between the net proceeds from the sale or redemption of portfolio investments and foreign currency and the cost basis of the investments without regard to unrealized appreciation or depreciation previously recognized and includes investments written-off during the period, net of recoveries. Realized losses may also be recorded in connection with our determination that certain investments are considered worthless securities and/or meet the conditions for loss recognition per the applicable tax rules.
various investments. See “Note“Note 9. Realized Gains or Losses and Net Unrealized Appreciation or Depreciation on Investments”” in the notes to the accompanying Consolidated Financial Statements for more details regarding investment realization events for the years ended September 30, 20172020 and September 30, 2016.2019.
Net Unrealized Appreciation (Depreciation) on Investments and Secured Borrowings
Net unrealized appreciation or depreciation is the net change in the fair value of our investments and secured borrowingsforeign currency during the reporting period, including the reversal of previously recorded unrealized appreciation or depreciation when gains or losses are realized.
Comparison of Years Ended September 30, 2019 and September 30, 2018
The increasecomparison of $2.0 million inthe fiscal years ended September 30, 2019 and 2018 can be found within Part II, Item 7. Management's Discussion and Analysis of Financial Condition and Results of Operations of our total investment incomeannual report on Form 10-K for the fiscal year ended September 30, 2016, as compared to the year ended September 30, 2015, was primarily attributable to higher average levels of outstanding debt investments and higher dividend income from our investment in FSFR Glick JV, partially offset2019 which is incorporated by lower fee income as a result of a lower level of investment purchases.reference herein.
66
Financial Condition, Liquidity and Capital Resources
We have a number of alternatives available to fund our investment portfolio and our operations, including raising equity, increasing or refinancing debt and funding from operational cash flow. Additionally,We generally expect to generate liquidity wefund the growth of our investment portfolio through additional debt and equity capital, which may reduce investment size by syndicatinginclude securitizing a portion of any given transaction.our investments. We cannot assure you, however, that our efforts to grow our portfolio will be successful. For example, our common stock has generally traded at prices below net asset value for the past several years, and we are currently limited in our ability to raise additional equity at prices below the then-current net asset value per share. We intend to continue to generate cash primarily from cash flows from operations, including interest earned, and future borrowings. We may also from time to time issue securities in public or private offerings, which offerings will depend on future market conditions, funding needs and other factors. We intend to fund our future distribution obligations through operating cash flow or with funds obtained through future equity and debt offerings or credit facilities, as we deem appropriate.
For the year ended September 30, 2017,2020, we experienced a net increase in cash and cash equivalents and restricted cash of $15.8$15.4 million. During that period, $68.8$59.6 million of cash was provided by operating activities, primarily consisting of $276.9$304.7 million of principal payments and proceeds from the sale of investments and the cash activities related to $22.4$16.2 million of net investment income, partially offset by cash used to fund $290.6$224.0 million of investments and a decrease in net revolvers.payables from unsettled transactions of $36.3 million. During the same period, cash used byin financing activities was $53.0$44.3 million, primarily consisting of $24.5$38.0 million of net repayments under our credit facilities $23.2and $16.2 million of cash distributions paid to our stockholders, and $5.0 millionpartially offset by proceeds from secured borrowings of repayments of secured borrowings.$10.9 million.
For the year ended September 30, 2016,2019, we experienced a net decrease in cash and cash equivalents and restricted cash of $21.7$2.4 million. During that period, $40.9$3.7 million of cash was providedused by operating activities, primarily consisting of $308.4cash used to fund $249.1 million of investment purchases, partially offset by $197.0 million of principal payments and proceeds from the sale of investments, an increase in net payables from unsettled transactions of $28.8 million and the cash activities related to $25.3 million of net investment income, partially offset by cash used to fund $286.1 million of investments and net revolvers. During the same period, cash used by financing activities was $62.6 million, primarily consisting of $29.2 millionof net repayments under our credit facilities, $6.4 million of net repayments under the 2015 Debt Securitization and $25.9 million of cash distributions paid to our shareholders.
For the year ended September 30, 2018, we experienced a net decrease in cash and $6.1cash equivalents and restricted cash of $26.6 million. During that period, $18.3 million of cash was used in operating activities, primarily consisting of cash used to fund $455.0 million of investment purchases and a $44.7 million decrease in net payables from unsettled transactions, partially offset by $464.3 million of principal payments and proceeds from the sale of investments and the cash activities related to $19.8 million of net investment income. During the same period, cash used in financing activities was $8.2 million, primarily consisting of $192.1 millionof net borrowings under our credit facilities, $180 million of net repayments of notes under our $309.0 million debt securitization completed on May 28, 2015, or the 2015 Debt Securitization, and $18.3 million of cash distributions paid to our stockholders and $1.8 million of deferred financing costs paid.
As of September 30, 2017,2020, we had $43.0$29.5 million of cash and cash equivalents (including $7.4$4.4 million of restricted cash), portfolio investments (at fair value) of $560.4$502.3 million, $3.0$1.3 million of interest, dividends and fees receivable, $48.5$83.3 million of undrawn capacity under our credit facilities (subject to borrowing base and other limitations), $3.7 million of net payablesreceivables from unsettled transactions, $83.0$256.7 million of borrowings outstanding under our revolving credit facilities, $177.8$10.9 million of secured borrowings outstanding under our 2015 Debt Securitization (net of unamortized financing costs) and unfunded commitments of $43.5$33.7 million. Pursuant to the terms of the Citibank facility,Facility, we arewere restricted in terms of access to $2.0 million of cash until such time as we submitthe occurrence of the periodic distribution dates and, in connection therewith, our submission of our required monthlyperiodic reporting schedules.schedules and verifications of our compliance with the terms of the credit agreement. As of September 30, 2017, $5.42020, $2.1 million of cash was restricted due to the obligation to pay interest under the terms of the Deutsche Bank Facility, and $0.3 million was held at U.S. Bank National Association as collateral in connection with the 2015 Debt Securitization was restricted.ISDA Master Agreement with JPMorgan Chase Bank N.A. As of September 30, 2020, we have analyzed cash and cash equivalents, availability under our credit facilities, the ability to rotate out of certain assets and amounts of unfunded commitments that could be drawn and believe our liquidity and capital resources are sufficient to take advantage of market opportunities in the current economic climate.
67
As of September 30, 2016,2019, we had $28.8$14.1 million of cash and cash equivalents (including $9.0$8.4 million of restricted cash), portfolio investments (at fair value) of $573.6$597.1 million, $4.6$3.8 million of interest, dividends and fees receivable, $12.9$160.3 million receivablesof undrawn capacity under our credit facilities (subject to borrowing base and other limitations), $32.6 million of net payables from unsettled transactions, $107.4$294.7 million of borrowings outstanding under our revolving credit facilities $177.5 million of borrowings outstanding under our 2015 Debt Securitization (net of unamortized financing costs) and unfunded commitments of $52.8$24.2 million. Pursuant to the terms of the Citibank facility,Facility, we arewere restricted in terms of access to $3.5$3.4 million of cash until such time as we submitthe occurrence of the periodic distribution dates and, in connection therewith, our submission of our required monthlyperiodic reporting schedules.schedules and verifications of our compliance with the terms of the credit agreement. As of September 30, 2016, $5.52019, $4.3 million of cash held in connection withwas restricted due to the 2015 Debt Securitizationobligation to pay interest under the terms of the Deutsche Bank Facility. As of September 30, 2019, $0.8 million was restricted.
restricted due to minimum balance requirements under the East West Bank Facility (as defined below).
Significant Capital Transactions
The following table reflects the quarterly distributions per share that our Board of Directors has declared,we have paid, including shares issued under our dividend reinvestment plan, or DRIP, on our common stock since October 1, 2015:2017:
| Frequency | Date Declared | Record Date | Payment Date | Amount per Share | Cash Distribution | DRIP Shares Issued (1) | DRIP Shares Value | |||||||||||||
| Monthly | July 10, 2015 | October 6, 2015 | October 15, 2015 | $ | 0.075 | $ | 2,101,445 | 12,080 | $ | 108,563 | ||||||||||
| Monthly | July 10, 2015 | November 5, 2015 | November 16, 2015 | 0.075 | 2,093,278 | 13,269 | 116,730 | |||||||||||||
| Monthly | November 30, 2015 | December 11, 2015 | December 22, 2015 | 0.075 | 2,115,444 | 11,103 | 94,563 | |||||||||||||
| Monthly | November 30, 2015 | January 4, 2016 | January 15, 2016 | 0.075 | 2,148,928 | 8,627 | 61,079 | |||||||||||||
| Monthly | November 30, 2015 | February 5, 2016 | February 16, 2016 | 0.075 | 2,177,085 | 4,542 | 32,923 | |||||||||||||
| Monthly | February 8, 2016 | March 15, 2016 | March 31, 2016 | 0.075 | 2,175,431 | 4,383 | 34,577 | |||||||||||||
| Monthly | February 8, 2016 | April 15, 2016 | April 29, 2016 | 0.075 | 2,174,974 | 4,452 | 35,033 | |||||||||||||
| Monthly | February 8, 2016 | May 13, 2016 | May 31, 2016 | 0.075 | 2,176,513 | 4,256 | 33,494 | |||||||||||||
| Monthly | May 6, 2016 | June 15, 2016 | June 30, 2016 | 0.075 | 2,163,126 | 5,822 | 46,881 | |||||||||||||
| Monthly | May 6, 2016 | July 15, 2016 | July 29, 2016 | 0.075 | 2,179,263 | 3,627 | 30,745 | |||||||||||||
| Monthly | May 6, 2016 | August 15, 2016 | August 31, 2016 | 0.075 | 2,181,006 | 3,260 | 29,002 | |||||||||||||
| Monthly | August 4, 2016 | September 15, 2016 | September 30, 2016 | 0.075 | 2,183,197 | 3,078 | 26,811 | |||||||||||||
| Monthly | August 4, 2016 | October 14, 2016 | October 31, 2016 | 0.075 | 2,183,023 | 3,146 | 26,985 | |||||||||||||
| Monthly | August 4, 2016 | November 15, 2016 | November 30, 2016 | 0.075 | 2,183,100 | 2,986 | 26,908 | |||||||||||||
| Monthly | October 19, 2016 | December 15, 2016 | December 30, 2016 | 0.075 | 2,179,421 | 3,438 | 30,586 | |||||||||||||
| Monthly | October 19, 2016 | January 31, 2017 | January 31, 2017 | 0.075 | 2,180,645 | 2,905 | 29,363 | |||||||||||||
| Monthly | October 19, 2016 | February 15, 2017 | February 28, 2017 | 0.075 | 2,183,581 | 2,969 | 26,427 | |||||||||||||
| Monthly | February 6, 2017 | March 15, 2017 | March 31, 2017 | 0.04 | 1,165,417 | 1,508 | 13,253 | |||||||||||||
| Quarterly | February 6, 2017 | June 15, 2017 | June 30, 2017 | 0.19 | 5,543,465 | 6,840 | 55,221 | |||||||||||||
| Quarterly | August 7, 2017 | September 15, 2017 | September 29, 2017 | 0.19 | 5,536,798 | 6,991 | 61,888 | |||||||||||||
| Quarterly | August 7, 2017 | December 15, 2017 | December 29, 2017 | 0.19 | ||||||||||||||||
| Date Declared | Record Date | Payment Date | Amount per Share | Cash Distribution | DRIP Shares Issued (1) | DRIP Shares Value | ||||||||||||||||||||||||||||||||
| August 7, 2017 | December 15, 2017 | December 29, 2017 | $ | 0.19 | $ | 5,439,519 | 18,809 | $ | 159,167 | |||||||||||||||||||||||||||||
| February 5, 2018 | March 15, 2018 | March 30, 2018 | 0.14 | 4,091,583 | 4,204 | 33,764 | ||||||||||||||||||||||||||||||||
| May 3, 2018 | June 15, 2018 | June 29, 2018 | 0.145 | 4,232,547 | 4,829 | 40,134 | ||||||||||||||||||||||||||||||||
| August 1, 2018 | September 15, 2018 | September 28, 2018 | 0.155 | 4,518,677 | 5,620 | 48,672 | ||||||||||||||||||||||||||||||||
| November 19, 2018 | December 17, 2018 | December 28, 2018 | 0.155 | 4,513,238 | 6,888 | 54,111 | ||||||||||||||||||||||||||||||||
| February 1, 2019 | March 15, 2019 | March 29, 2019 | 0.155 | 4,516,806 | 6,187 | 50,543 | ||||||||||||||||||||||||||||||||
| May 3, 2019 | June 14, 2019 | June 28, 2019 | 0.155 | 4,514,262 | 6,314 | 53,088 | ||||||||||||||||||||||||||||||||
| August 2, 2019 | September 13, 2019 | September 30, 2019 | 0.155 | 4,510,023 | 6,961 | 57,325 | ||||||||||||||||||||||||||||||||
| November 12, 2019 | December 13, 2019 | December 31, 2019 | 0.155 | 4,503,016 | 7,793 | 64,334 | ||||||||||||||||||||||||||||||||
| January 31, 2020 | March 13, 2020 | March 31, 2020 | 0.155 | 4,489,700 | 14,852 | 77,648 | ||||||||||||||||||||||||||||||||
| April 30, 2020 | June 15, 2020 | June 30, 2020 | 0.125 | 3,589,622 | 14,977 | 93,725 | ||||||||||||||||||||||||||||||||
| July 31, 2020 | September 15, 2020 | September 30, 2020 | 0.125 | 3,627,206 | 8,490 | 56,141 | ||||||||||||||||||||||||||||||||
______________
(1) Shares were purchased on the open market and distributed.
Indebtedness
See “Note“Note 6. Borrowings”Borrowings” in the Consolidated Financial Statements for more details regarding our indebtedness and secured borrowings.indebtedness.
Citibank Facility
As of September 30, 2017, the Citibank facility permitted up2020 and September 30, 2019, we were able to $125.0borrow $180 million of borrowings. Borrowings(subject to borrowing base and other limitations) under the Citibank facilityFacility. As of September 30, 2020, the reinvestment period under the Citibank Facility is scheduled to expire on July 19, 2021 and the maturity date for the Citibank Facility is July 18, 2023.
As of September 30, 2020, borrowings under the Citibank Facility are subject to certain customary advance rates and accrue interest at a rate equal to LIBOR plus 2.00%1.70% per annum on broadly syndicated loans and LIBOR plus 2.25% per annum on all other eligible loans during the reinvestment period. Following termination of the reinvestment period, andborrowings under the Citibank Facility will accrue interest at rates equal to LIBOR plus 3.50% per annum during the first year after the reinvestment period and LIBOR plus 4.00% per annum during the subsequent two years, respectively. In addition, as of September 30, 2020, for the duration of the reinvestment period there is a commitmentnon-usage fee payable of 0.50% per annum on the undrawn amount under the Citibank Facility. As of September 30, 2020, the minimum asset coverage ratio applicable to us under the Citibank Facility is 150% as determined in accordance with the requirements of the Investment Company Act.
As of September 30, 2020 and September 30, 2019, we had $119.1 million and $126.1 million outstanding under the Citibank Facility, respectively. Our borrowings under the Citibank Facility bore interest at a weighted average interest rate of 3.052%, 4.463% and 4.264% for the years ended September 30, 2020, 2019 and 2018, respectively. For the years ended September 30, 2020, 2019 and 2018, we recorded interest expense (inclusive of fees) of $4.6 million, $6.4 million and $4.2 million, respectively, related to the Citibank Facility.
Deutsche Bank Facility
On September 24, 2018, OCSI Senior Funding Ltd., our wholly-owned subsidiary, entered into the Deutsche Bank Facility. As of September 30, 2020, (a) OCSI Senior Funding Ltd. may request drawdowns under the under the Deutsche Bank Facility until September 30, 2021 (the "revolving period") unless there is an earlier termination or event of default, (b) the maturity date of the Deutsche Bank Facility is the earliest of March 30, 2022, the occurrence of an event of default or completion of a securitization transaction, (c) the size of
68
the Deutsche Bank Facility is $160 million (subject to borrowing base and other limitations) and (d) the interest rate is three-month LIBOR plus 2.65% through September 30, 2021, following which the interest rate will reset to three-month LIBOR plus 2.80% for the remaining term of the Deutsche Bank Facility, in each case with a 0.25% LIBOR floor. There is a non-usage fee of 0.50% per annum payable on the undrawn amount under the CitibankDeutsche Bank Facility, and, as of September 30, 2020, a minimum utilization fee should the drawn amount under the Deutsche Bank Facility fall below 80%.
As of September 30, 2020, the Deutsche Bank Facility includes a waiver period (which extends through January 3, 2021) during which the facility agent is restricted from revaluing certain collateral obligations where the change in valuation is caused by or results from a business disruption due primarily to the COVID-19 pandemic (subject to our ability to earlier terminate such period in certain circumstances).
The Deutsche Bank Facility is secured by all of the assets held by OCSI Senior Funding Ltd. OCSI Senior Funding Ltd. has made customary representations and warranties and is required to comply with various affirmative and negative covenants, reporting requirements and other customary requirements for similar credit facilities. Our borrowings, including indirectly under the Deutsche Bank Facility, are subject to the leverage restrictions contained in the Investment Company Act.
As of September 30, 2020 and September 30, 2019, we had $137.6 million and $157.6 million outstanding under the Deutsche Bank Facility, respectively. For the years ended September 30, 2020, 2019 and for the period from September 24, 2018 through September 30, 2018, our borrowings under the Deutsche Bank Facility bore interest at a weighted average interest rate of 3.634%, 4.524%, and 4.266%, respectively. For the years ended September 30, 2020 and 2019 and for the period from September 24, 2018 through September 30, 2018, we recorded interest expense (inclusive of fees) of $7.1 million, $7.5 million and $0.1 million, respectively.
East West Bank Facility
On January 6, 2016, we entered into a five-year, $25 million senior secured revolving credit facility (subject to borrowing base and other limitations) with the lenders referenced therein, U.S. Bank National Association, as custodian, and East West Bank as secured lender, or, as amended, the East West Bank Facility. On September 30, 2020, we repaid all amounts outstanding under the East West Bank Facility, following which the facility was terminated. Prior to its termination on September 30, 2020, borrowings under the East West Bank Facility bore an interest rate of either 0.50%(i) LIBOR plus 2.85% per annum or (ii) East West Bank’s prime rate, in each case with a 3.5% floor. The East West Bank Facility would have otherwise matured on January 6, 2021. Prior to its termination on September 30, 2020, the unused amountminimum asset coverage ratio applicable to us under the East West Bank Facility was 150% as determined in accordance with the requirements of the Citibank facility (if the advances outstanding on the Citibank facility exceed 50% of the aggregate commitments by lenders to make advances on such day) or 0.75% per annum on the unused amount of the Citibank facility (if the advances outstanding on the Citibank facility do not exceed 50% of the aggregate commitments by lenders to make advances on such day) for the duration of the reinvestment period. Interest and commitment fees are payable quarterly in arrears.Investment Company Act. The reinvestment period under the Citibank facility ends January 15, 2018 and the final maturity date is January 15, 2020. The Citibank facility requiresEast West Bank Facility required us to comply with certain affirmative and negative covenants and other customary requirements for similar credit facilities.
As of September 30, 2017 and September 30, 2016,2020, we had $76.5 million and $107.4 millionno borrowings outstanding under the Citibank facility, respectively.East West Bank Facility. As of September 30, 2019, we had $11.0 million of borrowings outstanding under the East West Bank Facility. Our borrowings under the Citibank facilityEast West Bank Facility bore interest at a weighted average interest rate of 3.559%4.059%, 2.838%5.407% and 2.516%4.949% for the years ended September 30, 2017, September 30, 20162020, 2019 and September 30, 2015,2018, respectively. For the years ended September 30, 2017, September 30, 20162020, 2019 and September 30, 2015,2018, we recorded interest expense of $4.2$0.7 million, $4.1$0.6 million and $2.6 million, respectively, related to the Citibank facility.
2015 Debt Securitization
Prior to September 24, 2018, the 2015 Debt Securitization consisted of $126.0 million Class A-T Senior Secured 2015 Notes which bearbore interest at three-month LIBOR plus 1.80%; $29.0 million Class A-S Senior Secured 2015 Notes which bore interest at a rate of three-month LIBOR plus 1.55%, until a step-up in spread to 2.10% occurred in October 2016; $20.0 million Class A-R Senior Secured Revolving 2015 Notes which bearbore interest at a rate of commercial paper, or CP, plus 1.80%, or, collectively, the Class A 2015 Notes; and $25.0 million Class B Senior Secured 2015 Notes which bearbore interest at a rate of three-month LIBOR plus 2.65% per annum, which were issued in a private placement. We currently retainPrior to September 24, 2018, we retained the entire $22.6 million of the Class C Senior Secured 2015 Notes (which we purchased at 98.0% of par value) and the entire $86.4 million of the Subordinated 2015 Notes. The 2015 Debt Securitization requires us to comply with certain monthly financial covenants, including overcollateralization and interest coverage tests.
For the yearsyear ended September 30, 2017, September 30, 2016 and September 30, 2015,2018, the components of interest expense, cash paid for interest, average interest rates and average outstanding balances for the 2015 Debt Securitization were as follows:
69
| Year ended September 30, 2017 | Year ended September 30, 2016 | Year ended September 30, 2015 | ||||||||||
| Interest expense | $ | 5,741,534 | $ | 4,668,947 | $ | 1,476,995 | ||||||
| Loan administration fees | 69,514 | 79,882 | — | |||||||||
| Amortization of debt issuance costs | 290,104 | 290,104 | 120,877 | |||||||||
| Total interest and other debt financing expenses | $ | 6,101,152 | $ | 5,038,933 | $ | 1,597,872 | ||||||
| Cash paid for interest expense | $ | 5,449,738 | $ | 5,136,063 | $ | — | ||||||
| Annualized average interest rate | 3.425 | % | 2.466 | % | 2.39 | % | ||||||
| Average outstanding balance | $ | 180,462,192 | $ | 181,782,413 | $ | 61,900,170 | ||||||
| Year ended September 30, 2018 | ||||||||
| Interest expense | $ | 7,123,152 | ||||||
| Loan administration fees | 93,209 | |||||||
| Amortization of debt issuance costs | 2,224,132 | |||||||
| Total interest and other debt financing expenses | $ | 9,440,493 | ||||||
| Cash paid for interest expense | $ | 8,469,735 | ||||||
| Annualized average interest rate | 4.170 | % | ||||||
| Average outstanding balance | $ | 176,875,000 | ||||||
Secured Borrowings
As of September 30, 2020, we had $10.9 million of secured borrowings outstanding, which were recorded as a result of certain securities that were sold and simultaneously repurchased at a premium, with amounts payable to the counterparty due on the repurchase settlement date, which is generally within 60 days of the trade date. We had no secured borrowings outstanding as of September 30, 2019. For the year ended September 30, 2020, we recorded less than $0.1 million of interest expense and note discount expensein connection with secured borrowings. Our secured borrowings bore interest at a weighted average rate of each of the Class A-T, A-S, A-R, B and C 2015 Notes3.27% for the year ended September 30, 2017 is as follows:2020.
| Year ended September 30, 2017 | ||||||||||||
| Stated Interest Rate | LIBOR Spread (basis points) | Cash Paid for Interest | Interest Expense | |||||||||
| Class A-T Notes | 3.1035% | 180 | $ | 3,487,268 | $ | 3,664,619 | ||||||
| Class A-S Notes | 3.4035% | 210 | (1) | 850,073 | 926,401 | |||||||
| Class A-R Notes | 2.9551% | 180 | (2) | 205,027 | 207,900 | |||||||
| Class B Notes | 3.9535% | 265 | 907,370 | 942,614 | ||||||||
| Class C Notes | 4.5535% | 325 | (3) | — | — | |||||||
| Total | $ | 5,449,738 | $ | 5,741,534 | ||||||||
| Description | Class A-T Notes | Class A-S Notes | Class A-R Notes | Class B Notes | Class C Notes | Subordinated Notes | ||||||
| Type | Senior Secured Floating Rate Term Debt | Senior Secured Floating Rate Term Debt | Senior Secured Floating Rate Revolver | Senior Secured Floating Rate Term Debt | Senior Secured Floating Rate Term Debt | Subordinated Term Notes | ||||||
| Amount Outstanding | $126,000,000 | $29,000,000 | $— | $25,000,000 | $22,575,680 | $86,400,000 | ||||||
| Moody's Rating | "Aaa" | "Aaa" | "Aaa" | "Aa2" | "Aa2" | NR | ||||||
| S&P Rating | "AAA" | "AAA" | "AAA" | NR | NR | NR | ||||||
| Interest Rate | LIBOR + 1.80% | LIBOR + 2.10%* | CP + 1.80% ** | LIBOR + 2.65% | LIBOR + 3.25% | NA | ||||||
| Stated Maturity | May 28, 2025 | May 28, 2025 | May 28, 2025 | May 28, 2025 | May 28, 2025 | May 28, 2025 | ||||||
Off-Balance Sheet Arrangements
We may be a party to financial instruments with off-balance sheet risk in the normal course of business to meet the financial needs of our portfolio companies. As of September 30, 20172020 and September 30, 2016,2019, our only off-balance sheet arrangements consisted of $43.5$33.7 million and $52.8$24.2 million, respectively, of unfunded commitments to provide debt and equity financing to certain of our portfolio companies. Such commitments are subject to our portfolio companies' satisfaction of certain financial and nonfinancial covenants and may involve, to varying degrees, elements of credit risk in excess of the amount recognized in our Consolidated Statements of Assets and Liabilities.
A list of unfunded commitments by investment (consisting of revolvers, term loans with delayed draw components and FSFR Glick JV Subordinated Notes and LLC equity interests)interests of the OCSI Glick JV) as of September 30, 20172020 and September 30, 20162019 is shown in the table below:
| September 30, 2020 | September 30, 2019 | |||||||||||||
| OCSI Glick JV LLC (1) | $ | 13,998,029 | $ | 13,998,029 | ||||||||||
| Athenex, Inc. | 5,316,815 | — | ||||||||||||
| MHE Intermediate Holdings, LLC | 5,254,516 | 4,466,338 | ||||||||||||
| MRI Software LLC | 2,721,132 | — | ||||||||||||
| NeuAG, LLC | 1,059,000 | — | ||||||||||||
| Ardonagh Midco 3 PLC | 1,002,320 | — | ||||||||||||
| Mindbody, Inc. | 952,381 | 952,381 | ||||||||||||
| Accupac, Inc. | 716,984 | — | ||||||||||||
| Apptio, Inc. | 692,308 | 692,308 | ||||||||||||
| OEConnection LLC | 501,353 | 731,183 | ||||||||||||
| Olaplex, Inc. | 486,000 | — | ||||||||||||
| Coyote Buyer, LLC | 391,267 | — | ||||||||||||
| iCIMs, Inc. | 294,118 | 294,118 | ||||||||||||
| Immucor, Inc. | 189,438 | — | ||||||||||||
| GKD Index Partners, LLC | 88,889 | 444,444 | ||||||||||||
| Ministry Brands, LLC | 42,500 | 80,000 | ||||||||||||
| PaySimple, Inc. | — | 2,450,000 | ||||||||||||
| 4 Over International, LLC | — | 60,629 | ||||||||||||
| Total | $ | 33,707,050 | $ | 24,169,430 | ||||||||||
| September 30, 2017 | September 30, 2016 | |||||||
| FSFR Glick JV LLC | $ | 16,159,368 | $ | 16,382,494 | ||||
| MHE Intermediate Holdings | 6,749,698 | — | ||||||
| Triple Point Group Holdings, Inc. | 4,968,590 | 4,968,590 | ||||||
| BeyondTrust Software, Inc. | 3,605,000 | 3,605,000 | ||||||
| Motion Recruitment Partners LLC | 2,900,000 | 2,900,000 | ||||||
| PowerPlan, Inc. | 2,100,000 | 2,100,000 | ||||||
| Ministry Brands, LLC | 1,857,967 | — | ||||||
| Impact Sales, LLC | 1,078,125 | — | ||||||
| Valet Merger Sub, Inc. | 833,333 | 333,333 | ||||||
| Executive Consulting Group, Inc. | 800,000 | 800,000 | ||||||
| Internet Pipeline, Inc. | 800,000 | 800,000 | ||||||
| Metamorph US 3, LLC (1) | 720,000 | 1,800,000 | ||||||
| Systems, Inc. | 600,000 | — | ||||||
| Sailpoint Technologies, Inc. | 300,000 | 200,000 | ||||||
| 4 Over International, LLC | 68,452 | 68,452 | ||||||
| TIBCO Software, Inc. | — | 5,300,000 | ||||||
| All Web Leads, Inc. | — | 3,458,537 | ||||||
| Legalzoom.com, Inc. | — | 2,607,018 | ||||||
| Teaching Strategies, LLC | — | 2,400,000 | ||||||
| Dynatect Group Holdings, Inc. | — | 1,800,000 | ||||||
| My Alarm Center, LLC | — | 1,212,472 | ||||||
| Baart Programs, Inc. | — | 1,000,000 | ||||||
| TrialCard Incorporated | — | 850,000 | ||||||
| OBHG Management Services, LLC | — | 100,000 | ||||||
| Accruent, LLC | — | 85,000 | ||||||
| Total | $ | 43,540,533 | $ | 52,770,896 | ||||
(1) This investment was on cash non-accrual status as of September 30, 2017.2020.
70
Contractual Obligations
The following table reflects information pertaining to our debt outstanding under the Citibank facility,Facility, the East West Bank Facility, the 2015 Debt SecuritizationDeutsche Bank Facility and our secured borrowings:Secured Borrowings:
| Debt Outstanding as of September 30, 2019 | Debt Outstanding as of September 30, 2020 | Weighted average debt outstanding for the year ended September 30, 2020 | Maximum debt outstanding for the year ended September 30, 2020 | |||||||||||||||||||||||
| Citibank Facility | $ | 126,056,800 | $ | 119,056,800 | $ | 125,133,304 | $ | 129,056,800 | ||||||||||||||||||
| Deutsche Bank Facility | 157,600,000 | 137,600,000 | 167,188,798 | 181,600,000 | ||||||||||||||||||||||
| East West Bank Facility | 11,000,000 | — | 13,959,016 | 22,500,000 | ||||||||||||||||||||||
| Secured Borrowings | — | 10,929,578 | 169,055 | 10,929,578 | ||||||||||||||||||||||
| Total debt | $ | 294,656,800 | $ | 267,586,378 | $ | 306,450,173 | ||||||||||||||||||||
| Debt Outstanding as of September 30, 2016 | Debt Outstanding as of September 30, 2017 | Weighted average debt outstanding for the year ended September 30, 2017 | Maximum debt outstanding for the year ended September 30, 2017 | |||||||||||||
| Citibank facility | $ | 107,426,800 | $ | 76,456,800 | $ | 80,785,238 | $ | 107,426,800 | ||||||||
| 2015 Debt Securitization | 180,000,000 | 180,000,000 | 180,462,192 | 187,500,000 | ||||||||||||
| East West Bank Facility | — | 6,500,000 | 6,306,301 | 19,500,000 | ||||||||||||
| Secured borrowings | 5,000,000 | — | 54,795 | 5,000,000 | ||||||||||||
| Total debt | $ | 292,426,800 | $ | 262,956,800 | $ | 267,608,526 | ||||||||||
The following table reflects our contractual obligations arising from the Citibank facility, 2015 Debt SecuritizationFacility, Deutsche Bank Facility and East West Bank Facility:Secured Borrowings:
| Payments due by period as of September 30, 2017 | ||||||||||||||||||||
| Total | < 1 year | 1-3 years | 3-5 years | > 5 years | ||||||||||||||||
| Citibank facility | $ | 76,456,800 | $ | — | $ | 76,456,800 | $ | — | $ | — | ||||||||||
| Interest due on Citibank facility | 6,636,652 | 2,894,119 | 3,742,533 | — | — | |||||||||||||||
| 2015 Debt Securitization | 180,000,000 | — | — | — | 180,000,000 | |||||||||||||||
| Interest due on 2015 Debt Securitization | 45,102,966 | 5,885,800 | 11,771,600 | 11,771,600 | 15,673,966 | |||||||||||||||
| East West Bank Facility | 6,500,000 | — | — | 6,500,000 | — | |||||||||||||||
| Interest due on East West Bank Facility | 1,009,993 | 308,750 | 617,500 | 83,743 | — | |||||||||||||||
| Total | $ | 315,706,411 | $ | 9,088,669 | $ | 92,588,433 | $ | 18,355,343 | $ | 195,673,966 | ||||||||||
| Payments due by period as of September 30, 2020 | ||||||||||||||||||||||||||||||||
| Total | < 1 year | 1-3 years | 3-5 years | |||||||||||||||||||||||||||||
| Citibank Facility | $ | 119,056,800 | $ | — | $ | 119,056,800 | $ | — | ||||||||||||||||||||||||
| Interest due on Citibank Facility | 7,248,110 | 2,591,146 | 4,656,964 | — | ||||||||||||||||||||||||||||
| Deutsche Bank Facility | 137,600,000 | — | 137,600,000 | — | ||||||||||||||||||||||||||||
| Interest due on Deutsche Bank Facility | 6,020,660 | 4,024,800 | 1,995,860 | — | ||||||||||||||||||||||||||||
| Secured Borrowings | 10,929,578 | 10,929,578 | — | — | ||||||||||||||||||||||||||||
| Interest due on Secured Borrowings | 50,557 | 50,557 | — | — | ||||||||||||||||||||||||||||
| Total | $ | 280,905,705 | $ | 17,596,081 | $ | 263,309,624 | $ | — | ||||||||||||||||||||||||
Regulated Investment Company Status and Distributions
We have qualified and elected to be treated as a RIC under Subchapter M of the Code.Code for tax purposes. As long as we continue to qualify as a RIC, we will not be subject to tax on our investment company taxable income (determined without regard to any deduction for dividends paid) or realized net capital gains, to the extent that such taxable income or gains is distributed, or deemed to be distributed as dividends, to stockholders on a timely basis.
Taxable income generally differs from net income for financial reporting purposes due to temporary and permanent differences in the recognition of income and expenses, and generally excludes net unrealized appreciation or depreciation. Distributions declared and paid by us in a taxable year may differ from taxable income for that taxable year as such distributions may include the distribution of taxable income derived from the current taxable year or the distribution of taxable income derived from the prior taxable year carried forward into and distributed in the current taxable year. Distributions also may include returns of capital.
To maintain RIC tax treatment, we must, among other things, distribute dividends, with respect to each taxable year, of an amount at least equal to 90% of our investment company taxable income (i.e., our net ordinary income and our realized net short-term capital gains in excess of realized net long-term capital losses, if any) determined without regard to any deduction for dividends paid. As a RIC, we are also subject to a federal excise tax, based on distribution requirements of our taxable income on a calendar year basis. We anticipate timely distribution of our taxable income in accordance with tax rules. We did not incur a U.S. federal excise tax for calendar years 20152018 and 2016 and do not expect to incur a U.S. federal excise tax for the calendar year 2017.2019. We may incur a federal excise tax in future years.
We intend to distribute at least 90% of our annual taxable income (which includes our taxable interest and fee income) to our stockholders. The covenants under the respective documents governing the Citibank facility, the East West Bank facilityFacility and the 2015 Debt SecuritizationDeutsche Bank Facility could, under certain circumstances, hinder our ability to satisfy the distribution requirement associated with our ability to be subject to tax as a RIC. In addition, we may retain for investment some or all of our net capital gains (i.e., realized net long-term capital gains in excess of realized net short-term capital losses) and treat such amounts as deemed distributions to our stockholders. If we do this, our stockholders will be treated as if they received actual distributions of the capital gains we retained and then reinvested the net after-tax proceeds in our common stock. Our stockholders also may be eligible to claim tax credits (or, in certain circumstances, tax refunds) equal to their allocable share of the tax we paid on the capital gains deemed distributed to them. To the extent our taxable earnings for a fiscal and taxable year fall below the total amount of our dividend distributions for that fiscal and taxable year, a portion of those distributions may be deemed a return of capital to our stockholders.
71
We may not be able to achieve operating results that will allow us to make distributions at a specific level or to increase the amount of these distributions from time to time. In addition, we may be limited in our ability to make distributions due to the asset coverage test
for borrowings applicable to us as a business development companyBusiness Development Company under the 1940Investment Company Act and due to provisions in our credit facilities and debt instruments. If we do not distribute a certain percentage of our taxable income annually, we will suffer adverse tax consequences, including possible loss of our ability to be subject to tax as a RIC. We cannot assure stockholders that they will receive any distributions or distributions at a particular level.
A RIC may treat a distribution of its own stock as fulfilling its RIC distribution requirements if each stockholder elects to receive his or her entire distribution in either cash or stock of the RIC, subject to certain limitations regarding the aggregate amount of cash to be distributed to all stockholders. If these and certain other requirements are met, for U.S federal income tax purposes, the amount of the dividend paid in stock will be equal to the amount of cash that could have been received instead of stock. We have no current intention of paying dividends in shares of our stock in accordance with these guidelines.
We may generate qualified net interest income or qualified net short-term capital gains that may be exempt from U.S. withholding tax when distributed to foreign stockholders. A RIC is permitted to designate distributions of qualified net interest income and qualified short-term capital gains as exempt from U.S. withholding tax when paid to non-U.S. shareholders with proper documentation. The following table, which may be subject to change as we finalize our annual tax filings, lists the percentage of qualified net interest income and qualified short-term capital gains for the year ended September 30, 2017.
2020, our last tax year end.
| Year Ended | Qualified Net Interest Income | Qualified Short-Term Capital Gains | |||||||||
| September 30, | % | — | |||||||||
We have adopted a DRIP that provides for the reinvestment of any distributions that we declare in cash on behalf of our stockholders, unless a stockholder elects to receive cash. As a result, if our Board of Directors declares a cash distribution, then our stockholders who have not “opted out” of the DRIP will have their cash distributions automatically reinvested in additional shares of our common stock, rather than receiving a cash distribution. If our shares are trading at a premium to net asset value, we typically issue new shares to implement the DRIP, with such shares issued at the greater of the most recently computed net asset value per share of our common stock or 95% of the current market value per share of our common stock on the payment date for such distribution. If our shares are trading at a discount to net asset value, we typically purchase shares in the open market in connection with our obligations under the DRIP.
Related Party Transactions
We have entered into the New Investment Advisory Agreement with our Investment AdviserOaktree and the New Administration Agreement with Oaktree Administrator, a wholly-owned subsidiaryan affiliate of the Investment Adviser.Oaktree. Mr. John B. Frank, an interested member of our Board of Directors, has an indirect pecuniary interest in our Investment Adviser. The Investment AdviserOaktree. Oaktree is a registered investment adviser under the Advisers Act of 1940,that is partially and indirectly owned by OCG. See “Item 1. Business-The Investment Adviser” and “-New“Note 11. Related Party Transactions - Investment Advisory Agreement.Agreement” and “– Administrative Services” in the notes to the accompanying Consolidated Financial Statements.
Distribution Declaration
On November 13, 2020, our Board of Directors priordeclared a quarterly distribution of $0.145 per share, payable in cash on December 31, 2020 to stockholders of record on December 15, 2020.
Merger Agreement
On October 17, 2017, had a direct or indirect pecuniary interest in our Former Adviser. See “Item 1. Business-Our Former Adviser and Administrator.”
At the Effective Time, each share of our common stock issued and outstanding immediately prior to the Effective Time (other than Cancelled Shares) will be converted into the right to receive a number of shares of OCSL Common Stock equal to the Exchange Ratio (as defined below), plus any cash (without interest) in lieu of fractional shares.
As of a mutually agreed date no earlier than 48 hours (excluding Sundays and holidays) prior to the Effective Time, which we refer as the “Determination Date”, each of us and OCSL will deliver to the other a calculation of its net asset value as of such date, in each case
72
using a pre-agreed set of assumptions, methodologies and adjustments. We refer to such calculation with respect to us as the “Closing OCSI Net Asset Value” and with respect to OCSL as the “Closing OCSL Net Asset Value”. Based on such calculations, the parties will calculate the “OCSI Per Share NAV”, which will be equal to (i) the Closing OCSI Net Asset Value divided by (ii) the number of shares of our common stock issued and outstanding as of the Determination Date (excluding any Cancelled Shares), and the “OCSL Per Share NAV”, which will be equal to (A) the Closing OCSL Net Asset Value divided by (B) the number of shares of OCSL Common Stock issued and outstanding as of the Determination Date. The “Exchange Ratio” will be equal to the quotient (rounded to four decimal places) of (i) the OCSI Per Share NAV divided by (ii) the OCSL Per Share NAV.
We and OCSL will update and redeliver the Closing OCSI Net Asset Value or the Closing OCSL Net Asset Value, respectively, in the event of a material change to such calculation between the Determination Date and the closing of the Mergers and if needed to ensure that the calculation is determined within 48 hours (excluding Sundays and holidays) prior to the Effective Time.
The Merger Agreement contains customary representations and warranties by each of us, OCSL and Oaktree. The Merger Agreement also contains customary covenants, including, among others, covenants relating to the operation of each of our investment policies and effective January 19, 2018, we will no longerOCSL’s businesses during the period prior to the closing of the Mergers.
Consummation of the Mergers, which is currently anticipated to occur during the first half of calendar year 2021, is subject to certain closing conditions, including requisite approvals of our and OCSL’s stockholders and certain other closing conditions.
The Merger Agreement also contains certain termination rights in favor of us and OCSL, including if the Mergers are not completed on or before July 28, 2021 or if the requisite approvals of our or OCSL’s stockholders are not obtained. The Merger Agreement provides that, upon the termination of the Merger Agreement under certain circumstances, a third party acquiring us may be required to pay OCSL a termination fee of approximately $5.7 million. The Merger Agreement provides that, upon the termination of the Merger Agreement under certain circumstances, a third party acquiring OCSL may be required to pay to us a termination fee of approximately $20.0 million.
The foregoing description of the Merger Agreement does not purport to be complete and is qualified in its entirety by reference to the full text of the Merger Agreement. The representations, warranties, covenants and agreements contained in the Merger Agreement were made only for purposes of the Merger Agreement and as of specific dates; were solely for the benefit of the parties to the Merger Agreement (except as may be expressly set forth in the Merger Agreement); may be subject to our current policylimitations agreed upon by the parties, including being qualified by confidential disclosures made for the purposes of allocating contractual risk between the parties to invest, under normal market conditions, at least 80%the Merger Agreement instead of establishing these matters as facts; and may be subject to standards of materiality applicable to the contracting parties that differ from those applicable to investors. Investors and security holders should not rely on such representations, warranties, covenants or agreements, or any descriptions thereof, as characterizations of the valueactual state of our net assets (plus borrowings for investment purposes)facts or condition of any of the parties to the Merger Agreement or any of their respective subsidiaries or affiliates. Moreover, information concerning the subject matter of the representations, warranties, covenants and agreements may change after the date of the Merger Agreement, which subsequent information may or may not be fully reflected in floating rate senior loans.public disclosures by the parties to the Merger Agreement.
Citibank Facility Amendment
On December 6, 2017, weOctober 27, 2020, OCSI Senior Funding II LLC, our wholly owned subsidiary, entered into an amendment to the documents governing the Citibank facility to remove Citibank, N.A.’s approval rights regarding our ability to purchase assets using proceeds fromFacility, which provides that (1) consummation of the Mergers will not cause a change of control under the Citibank facility, subject to a mark-to-market valuation protocol for broadly syndicated loansFacility or violate the no merger covenant in the Citibank Facility and a revised valuation dispute mechanism.(2) OCSL will become the collateral manager under the Citibank Facility upon closing of the Mergers. The other material terms of the Citibank facility did not change as a result of this amendment. We are in discussions to further amend and/or restate the Citibank facility to extend the reinvestment period and final maturity date, among other changes. Although we cannot assure you that we will successfully amend and/or restate the Citibank facility, we currently expect the facility to be of a similar sizeFacility were unchanged.
Deutsche Bank Facility Amendment
On October 27, 2020, OCSI Senior Funding Ltd., our wholly owned subsidiary, entered into an amendment to the existing facility and to include certain affirmative and negative covenants and other customary requirements for similar credit facilities. The new facility isdocuments governing the Deutsche Bank Facility that provides that consummation of the Mergers will not committed, andcause a change of control under the terms, including pricing, remain subject to change.
73
Item 7A. Quantitative and Qualitative Disclosures about Market Risk
We are subject to financial market risks, including changes in the valuations of our investment portfolio and interest rates.
Valuation Risk
Our investments may not have a readily available market price, and we value these investments at fair value as determined in good faith by our Board of Directors, with the assistance of the Audit Committee and Oaktree. There is no single standard for determining fair value in good faith and valuation methodologies involve a significant degree of management judgment. In addition, our valuation methodology utilizes discount rates in part in valuing our investments, and changes in those discount rates may have an impact on the valuation of our investments. Accordingly, valuations by us do not necessarily represent the amounts which may eventually be realized from sales or other dispositions of investments. Estimated fair values may differ from the values that would have been used had a ready market for the investment existed, and the differences could be material to the financial statements.
Interest Rate Risk
We are subject to financial market risks, including changes in interest rates. Changes in interest rates may affect both our cost of funding and our interest income from portfolio investments, cash and cash equivalents and idle fundsfund investments. Our risk management systems and procedures are designed to identify and analyze our risk, to set appropriate policies and limits and to continually monitor these risks and limits by means of reliable administrative and information systems and other policies and programs. Our investment income will be affected by changes in various interest rates, including LIBOR and prime rates, to the extent our debt investments include floating interest rates. In addition, our investments are carried at fair value as determined in good faith by our Board of Directors in accordance with the 1940 Act. Our valuation methodology utilizes discount rates in part in valuing our investments, and changes in those discount rates may have an impact on the valuation of our investments.
As of September 30, 2017,2020, 98.1% of our debt investment portfolio (at fair value) and 98.3% of our debt investment portfolio (at cost) bore interest at floating rates. As of September 30, 2019, 100% of our debt investment portfolio (at cost and fair value) bore interest at floating rates and hadrates. The composition of our floating rate debt investments by interest rate floors between 0%floor as of September 30, 2020 and 2%.September 30, 2019 was as follows:
| September 30, 2020 | September 30, 2019 | |||||||||||||||||||||||||||||||||||||
| Fair Value | % of Floating Rate Portfolio | Fair Value | % of Floating Rate Portfolio | |||||||||||||||||||||||||||||||||||
| 0% | $ | 202,763,547 | 41.34 | % | $ | 178,473,379 | 29.90 | % | ||||||||||||||||||||||||||||||
| >0% and <1% | 15,410,808 | 3.14 | 9,012,119 | 1.51 | ||||||||||||||||||||||||||||||||||
| 1% | 257,823,936 | 52.56 | 409,325,610 | 68.59 | ||||||||||||||||||||||||||||||||||
| >1% | 14,508,599 | 2.96 | — | — | ||||||||||||||||||||||||||||||||||
| Total Floating Rate Investments | $ | 490,506,890 | 100.00 | % | $ | 596,811,108 | 100.00 | % | ||||||||||||||||||||||||||||||
Based on our Consolidated Statement of Assets and Liabilities as of September 30, 2017,2020, the following table shows the approximate annualized net increase (decrease) in net interest incomeassets resulting from operations of hypothetical base rate changes in interest rates, assuming no changes in our investment and capital structure. However, there can be no assurances our portfolio companies will be able to meet their contractual obligations at any or all levels ofon increases in interest rates.
| Basis point increase | Increase in Interest Income | (Increase) in Interest Expense | Net increase (decrease) in net assets resulting from operations | |||||||||||||||||
| 250 | $ | 8,795,994 | $ | (6,416,420) | $ | 2,379,574 | ||||||||||||||
| 200 | 6,584,400 | (5,133,136) | 1,451,264 | |||||||||||||||||
| 150 | 4,372,805 | (3,849,852) | 522,953 | |||||||||||||||||
| 100 | 2,187,088 | (2,566,568) | (379,480) | |||||||||||||||||
| 50 | 791,211 | (1,283,284) | (492,073) | |||||||||||||||||
The net effect of any decrease in interest rates is limited and would not be of significance due to interest rate floors on investments and borrowings outstanding.
| Basis point increase | Interest Income | Interest Expense | Net increase (decrease) | |||||||||
| 500 | $ | 23,202,957 | $ | (13,147,840 | ) | $ | 10,055,117 | |||||
| 400 | 18,562,365 | (10,518,272 | ) | 8,044,093 | ||||||||
| 300 | 13,921,774 | (7,888,704 | ) | 6,033,070 | ||||||||
| 200 | 9,281,183 | (5,259,136 | ) | 4,022,047 | ||||||||
| 100 | 4,640,591 | (2,629,568 | ) | 2,011,023 | ||||||||
| Basis point decrease (1) | Interest Income | Interest Expense | Net increase (decrease) | ||||||
| 100 | (1,158,703 | ) | 2,629,568 | 1,470,865 | |||||
We regularly measure exposure to interest rate risk. We assess interest rate risk and manage our interest rate exposure on an ongoing basis by comparing our interest rate sensitive assets to our interest rate sensitive liabilities. Based on this review, we determine whether or not any hedging transactions are necessary to mitigate exposure to changes in interest rates. The following table shows a comparison of the interest rate base for our interest-bearing cash and outstanding investments, at principal, and our outstanding borrowings as of September 30, 20172020 and September 30, 2016:
2019:
74
| September 30, 2017 | September 30, 2016 | |||||||||||||||
| Interest Bearing Cash and Investments | Borrowings | Interest Bearing Cash and Investments | Borrowings | |||||||||||||
| Money market rate | $ | 43,012,387 | $ | — | $ | 28,815,679 | $ | — | ||||||||
| Prime rate | 490,693 | — | 543,445 | — | ||||||||||||
| LIBOR: | ||||||||||||||||
| 30 day | 218,782,104 | 6,500,000 | — | — | ||||||||||||
| 60 day | 32,508,060 | — | — | |||||||||||||
| 90 day | 340,420,366 | 256,456,800 | 588,697,358 | 180,000,000 | ||||||||||||
| 180 day | — | — | — | 107,426,800 | ||||||||||||
| Fixed rate | — | — | — | — | ||||||||||||
| Total | $ | 635,213,610 | $ | 262,956,800 | $ | 618,056,482 | $ | 287,426,800 | ||||||||
| September 30, 2020 | September 30, 2019 | |||||||||||||||||||||||||
| Interest Bearing Cash and Investments | Borrowings | Interest Bearing Cash and Investments | Borrowings | |||||||||||||||||||||||
| Money market rate | $ | 26,717,032 | $ | — | $ | 13,063,815 | $ | — | ||||||||||||||||||
| Prime rate | — | — | 7,392,651 | — | ||||||||||||||||||||||
| LIBOR: | ||||||||||||||||||||||||||
| 30 day | 280,596,064 | — | 408,142,675 | 11,000,000 | ||||||||||||||||||||||
| 60 day | 6,346,250 | — | 2,000,000 | — | ||||||||||||||||||||||
| 90 day | 183,287,520 | 256,656,800 | 179,653,417 | 283,656,800 | ||||||||||||||||||||||
| 180 day | 43,070,281 | — | 20,311,944 | — | ||||||||||||||||||||||
| 360 day | 8,289,847 | — | — | — | ||||||||||||||||||||||
| EURIBOR | ||||||||||||||||||||||||||
| 180 day | 562,872 | — | — | — | ||||||||||||||||||||||
| UK LIBOR: | ||||||||||||||||||||||||||
| 30 day | — | — | 6,161,500 | — | ||||||||||||||||||||||
| 180 day | 4,870,718 | — | — | — | ||||||||||||||||||||||
| Fixed rate | 9,659,018 | 10,929,578 | — | — | ||||||||||||||||||||||
| Total | $ | 563,399,602 | $ | 267,586,378 | $ | 636,726,002 | $ | 294,656,800 | ||||||||||||||||||
75
| Item 8. | Financial Statements and Supplementary Data | ||||
Index to Consolidated Financial Statements
76
Report of Independent Registered Public Accounting Firm
To the Shareholders and Board of Directors and Shareholders of Oaktree Strategic Income Corporation
We have audited the accompanying consolidated statements of assets and liabilities of Oaktree Strategic Income Corporation (the Company), including the scheduleconsolidated schedules of investments, as of September 30, 2020 and 2019, the related consolidated statements of operations, of changes in net assets, and of cash flows present fairly, in all material respects, the financial position of Oaktree Strategic Income Corporation (formerly known as Fifth Street Senior Floating Rate Corp.) and its subsidiaries as of September 30, 2017 and 2016, and the results of their operations, the changes in their net assets and their cash flows for each of the three years in the period ended September 30, 2017 in conformity with accounting principles generally accepted in2020, and the United States of America.related notes (collectively referred to as the “consolidated financial statements”). In addition, in our opinion, the consolidated financial statement schedule listed in the accompanying index presentsstatements present fairly, in all material respects, the information set forth therein when readfinancial position of the Company at September 30, 2020 and 2019, and the results of its operations, changes in conjunctionits net assets, and its cash flows for each of the three years in the period ended September 30, 2020, in conformity with the related consolidated financial statements. U.S. generally accepted accounting principles.
Basis for Opinion
These financial statements and financial statement schedule are the responsibility of the Company'sCompany’s management. Our responsibility is to express an opinion on thesethe Company’s financial statements and financial statement schedule based on our audits. We are a public accounting firm registered with the PCAOB and are required to be independent with respect to the Company in accordance with the U.S. federal securities laws and the applicable rules and regulations of the Securities and Exchange Commission and the PCAOB.
We conducted our audits of these financial statements in accordance with the standards of the Public Company Accounting Oversight Board (United States).PCAOB. Those standards require that we plan and perform the audit to obtain reasonable assurance about whether the financial statements are free of material misstatement. An audit includesmisstatement, whether due to error or fraud. Our audits included performing procedures to assess the risks of material misstatement of the financial statements, whether due to error or fraud, and performing procedures that respond to those risks. Such procedures included examining, on a test basis, evidence supportingregarding the amounts and disclosures in the financial statements, assessingstatements. Our procedures included confirmation of investments owned as of September 30, 2020 and 2019 by correspondence with the custodians, syndication agents and underlying investee companies, and by other appropriate auditing procedures where confirmation was not received. Our audits also included evaluating the accounting principles used and significant estimates made by management, andas well as evaluating the overall presentation of the financial statement presentation.statements. We believe that our audits which included confirmation of securities as of September 30, 2017 by correspondence with the custodian, transfer agent and brokers and the application of alternative auditing procedures where confirmation had not been received, provide a reasonable basis for our opinion.
/s/ PricewaterhouseCoopersErnst & Young LLP
We have served as the Company’s auditor since 2018.
77
Oaktree Strategic Income Corporation
Consolidated Statements of Assets and Liabilities
| September 30, 2017 | September 30, 2016 | September 30, 2020 | September 30, 2019 | |||||||||||||||||||
| ASSETS | ASSETS | ASSETS | ||||||||||||||||||||
| Investments at fair value: | Investments at fair value: | |||||||||||||||||||||
| Control investments (cost September 30, 2017: $71,340,632; cost September 30, 2016: $71,117,506) | $ | 57,606,674 | $ | 63,316,667 | ||||||||||||||||||
| Affiliate investments (cost September 30, 2017: $17,479,053; cost September 30, 2016: $15,953,798) | 935,913 | 13,006,458 | ||||||||||||||||||||
| Non-control/Non-affiliate investments (cost September 30, 2017: $516,270,639; cost September 30, 2016: $513,397,659) | 501,894,073 | 497,281,256 | ||||||||||||||||||||
| Total investments at fair value (cost September 30, 2017: $605,090,324; cost September 30, 2016: $600,468,963) | 560,436,660 | 573,604,381 | ||||||||||||||||||||
| Control investments (cost September 30, 2020: $72,157,302; cost September 30, 2019: $73,189,664) | Control investments (cost September 30, 2020: $72,157,302; cost September 30, 2019: $73,189,664) | $ | 49,409,901 | $ | 54,326,418 | |||||||||||||||||
| Non-control/Non-affiliate investments (cost September 30, 2020: $466,907,805; cost September 30, 2019: $553,679,070) | Non-control/Non-affiliate investments (cost September 30, 2020: $466,907,805; cost September 30, 2019: $553,679,070) | 452,883,464 | 542,778,029 | |||||||||||||||||||
| Total investments at fair value (cost September 30, 2020: $539,065,107; cost September 30, 2019: $626,868,734) | Total investments at fair value (cost September 30, 2020: $539,065,107; cost September 30, 2019: $626,868,734) | 502,293,365 | 597,104,447 | |||||||||||||||||||
| Cash and cash equivalents | 35,604,127 | 19,778,841 | Cash and cash equivalents | 25,072,749 | 5,646,899 | |||||||||||||||||
| Restricted cash | 7,408,260 | 9,036,838 | Restricted cash | 4,427,678 | 8,404,733 | |||||||||||||||||
| Interest, dividends and fees receivable | 3,014,075 | 4,579,935 | Interest, dividends and fees receivable | 1,273,014 | 3,813,730 | |||||||||||||||||
| Due from portfolio companies | 286,260 | 336,429 | Due from portfolio companies | 527,064 | 350,597 | |||||||||||||||||
| Receivables from unsettled transactions | 505,000 | 12,869,092 | Receivables from unsettled transactions | 7,966,668 | 5,091,671 | |||||||||||||||||
| Deferred financing costs | 1,222,933 | 2,063,133 | Deferred financing costs | 2,130,020 | 2,139,299 | |||||||||||||||||
| Deferred offering costs | Deferred offering costs | 121,310 | — | |||||||||||||||||||
| Derivative asset at fair value | Derivative asset at fair value | — | 20,876 | |||||||||||||||||||
| Other assets | 185,336 | 148,492 | Other assets | 557,776 | 761,462 | |||||||||||||||||
| Total assets | $ | 608,662,651 | $ | 622,417,141 | Total assets | $ | 544,369,644 | $ | 623,333,714 | |||||||||||||
| LIABILITIES AND NET ASSETS | LIABILITIES AND NET ASSETS | LIABILITIES AND NET ASSETS | ||||||||||||||||||||
| Liabilities: | Liabilities: | |||||||||||||||||||||
| Accounts payable, accrued expenses and other liabilities | $ | 482,877 | $ | 1,246,286 | Accounts payable, accrued expenses and other liabilities | $ | 1,401,709 | $ | 901,410 | |||||||||||||
| Base management fee and incentive fee payable | 2,236,187 | 2,987,721 | Base management fee and incentive fee payable | 1,663,660 | 1,368,431 | |||||||||||||||||
| Due to FSC CT | 450,517 | 402,073 | ||||||||||||||||||||
| Due to affiliate | Due to affiliate | 1,165,838 | 1,457,007 | |||||||||||||||||||
| Interest payable | 1,996,171 | 1,798,653 | Interest payable | 1,486,077 | 2,750,587 | |||||||||||||||||
| Payables from unsettled transactions | 49,029,789 | — | Payables from unsettled transactions | 4,254,635 | 37,724,473 | |||||||||||||||||
| Amounts payable to syndication partners | — | 18,750 | ||||||||||||||||||||
| Derivative liability at fair value | Derivative liability at fair value | 129,936 | — | |||||||||||||||||||
| Director fees payable | 98,008 | 236,275 | Director fees payable | — | 25,000 | |||||||||||||||||
| Credit facilities payable | 82,956,800 | 107,426,800 | Credit facilities payable | 256,656,800 | 294,656,800 | |||||||||||||||||
| Notes payable (net of $2,224,132 and $2,514,236 of unamortized financing costs as of September 30, 2017 and September 30, 2016, respectively) | 177,775,868 | 177,485,764 | ||||||||||||||||||||
| Secured borrowings at fair value (proceeds September 30, 2016: $5,000,000) | — | 4,985,425 | ||||||||||||||||||||
| Secured borrowings | Secured borrowings | 10,929,578 | — | |||||||||||||||||||
| Total liabilities | 315,026,217 | 296,587,747 | Total liabilities | 277,688,233 | 338,883,708 | |||||||||||||||||
| Commitments and contingencies (Note 13) | ||||||||||||||||||||||
| Commitments and contingencies (Note 14) | Commitments and contingencies (Note 14) | |||||||||||||||||||||
| Net assets: | Net assets: | |||||||||||||||||||||
| Common stock, $0.01 par value, 150,000,000 shares authorized; 29,466,768 shares issued and outstanding at September 30, 2017 and September 30, 2016 | 294,668 | 294,668 | ||||||||||||||||||||
| Common stock, $0.01 par value per share, 150,000,000 shares authorized; 29,466,768 shares issued and outstanding as of September 30, 2020 and September 30, 2019 | Common stock, $0.01 par value per share, 150,000,000 shares authorized; 29,466,768 shares issued and outstanding as of September 30, 2020 and September 30, 2019 | 294,668 | 294,668 | |||||||||||||||||||
| Additional paid-in-capital | 373,995,934 | 373,995,934 | Additional paid-in-capital | 369,199,332 | 369,199,332 | |||||||||||||||||
| Net unrealized depreciation on investments and secured borrowings | (44,653,664 | ) | (26,850,007 | ) | ||||||||||||||||||
| Net realized loss on investments | (24,354,622 | ) | (10,969,707 | ) | ||||||||||||||||||
| Accumulated overdistributed net investment income | (11,645,882 | ) | (10,641,494 | ) | ||||||||||||||||||
| Total net assets (equivalent to $9.97 and $11.06 per common share at September 30, 2017 and September 30, 2016, respectively) (Note 12) | 293,636,434 | 325,829,394 | ||||||||||||||||||||
| Accumulated overdistributed earnings | Accumulated overdistributed earnings | (102,812,589) | (85,043,994) | |||||||||||||||||||
| Total net assets (equivalent to $9.05 and $9.65 per common share as of September 30, 2020 and September 30, 2019, respectively) (Note 12) | Total net assets (equivalent to $9.05 and $9.65 per common share as of September 30, 2020 and September 30, 2019, respectively) (Note 12) | 266,681,411 | 284,450,006 | |||||||||||||||||||
| Total liabilities and net assets | $ | 608,662,651 | $ | 622,417,141 | Total liabilities and net assets | $ | 544,369,644 | $ | 623,333,714 | |||||||||||||
See notes to Consolidated Financial Statements.
78
Oaktree Strategic Income Corporation
Consolidated Statements of Operations
| Year ended September 30, 2020 | Year ended September 30, 2019 | Year ended September 30, 2018 | ||||||||||||||||||
| Interest income: | ||||||||||||||||||||
| Control investments | $ | 1,436,726 | $ | 5,945,194 | $ | 3,970,056 | ||||||||||||||
| Non-control/Non-affiliate investments | 34,892,600 | 42,847,646 | 39,139,739 | |||||||||||||||||
| Interest on cash and cash equivalents | 61,971 | 202,213 | 273,552 | |||||||||||||||||
| Total interest income | 36,391,297 | 48,995,053 | 43,383,347 | |||||||||||||||||
| PIK interest income: | ||||||||||||||||||||
| Control investments | — | — | 2,161,339 | |||||||||||||||||
| Non-control/Non-affiliate investments | 1,983,129 | 26,220 | 26,059 | |||||||||||||||||
| Total PIK interest income | 1,983,129 | 26,220 | 2,187,398 | |||||||||||||||||
| Fee income: | ||||||||||||||||||||
| Affiliate investments | — | — | 14,822 | |||||||||||||||||
| Non-control/Non-affiliate investments | 1,153,610 | 606,197 | 2,084,980 | |||||||||||||||||
| Total fee income | 1,153,610 | 606,197 | 2,099,802 | |||||||||||||||||
| Dividend income: | ||||||||||||||||||||
| Non-control/Non-affiliate investments | 6,008 | — | — | |||||||||||||||||
| Total dividend income | 6,008 | — | — | |||||||||||||||||
| Total investment income | 39,534,044 | 49,627,470 | 47,670,547 | |||||||||||||||||
| Expenses: | ||||||||||||||||||||
| Base management fee | 5,642,982 | 5,875,236 | 5,657,786 | |||||||||||||||||
| Part I incentive fee | 1,873,858 | 4,293,999 | 2,923,076 | |||||||||||||||||
| Professional fees | 1,316,387 | 1,534,958 | 2,691,950 | |||||||||||||||||
| Directors fees | 420,000 | 420,278 | 479,093 | |||||||||||||||||
| Interest expense | 12,431,910 | 14,528,318 | 14,379,881 | |||||||||||||||||
| Administrator expense | 911,612 | 1,121,984 | 1,085,819 | |||||||||||||||||
| General and administrative expenses | 1,055,916 | 1,201,721 | 1,383,871 | |||||||||||||||||
| Total expenses | 23,652,665 | 28,976,494 | 28,601,476 | |||||||||||||||||
| Fees waived | (322,121) | (489,275) | (702,261) | |||||||||||||||||
| Net expenses | 23,330,544 | 28,487,219 | 27,899,215 | |||||||||||||||||
| Net investment income | 16,203,500 | 21,140,251 | 19,771,332 | |||||||||||||||||
| Unrealized appreciation (depreciation): | ||||||||||||||||||||
| Control investments | (3,884,155) | (3,873,446) | (1,255,842) | |||||||||||||||||
| Affiliate investments | — | — | 16,543,140 | |||||||||||||||||
| Non-control/Non-affiliate investments | (3,123,300) | (9,806,905) | 13,282,430 | |||||||||||||||||
| Foreign currency forward contract | (150,812) | (24,931) | 45,807 | |||||||||||||||||
| Net unrealized appreciation (depreciation) | (7,158,267) | (13,705,282) | 28,615,535 | |||||||||||||||||
| Realized gains (losses): | ||||||||||||||||||||
| Affiliate investments | — | — | (15,914,916) | |||||||||||||||||
| Non-control/Non-affiliate investments | (10,326,109) | (943,588) | (11,675,522) | |||||||||||||||||
| Foreign currency forward contract | 13,673 | 482,601 | (123,380) | |||||||||||||||||
| Net realized gains (losses) | (10,312,436) | (460,987) | (27,713,818) | |||||||||||||||||
| Net realized and unrealized gains (losses) | (17,470,703) | (14,166,269) | 901,717 | |||||||||||||||||
| Net increase (decrease) in net assets resulting from operations | $ | (1,267,203) | $ | 6,973,982 | $ | 20,673,049 | ||||||||||||||
| Net investment income per common share — basic and diluted | $ | 0.55 | $ | 0.72 | $ | 0.67 | ||||||||||||||
| Earnings (loss) per common share — basic and diluted (Note 5) | $ | (0.04) | $ | 0.24 | $ | 0.70 | ||||||||||||||
| Weighted average common shares outstanding — basic and diluted | 29,466,768 | 29,466,768 | 29,466,768 | |||||||||||||||||
| Year ended September 30, 2017 | Year ended September 30, 2016 | Year ended September 30, 2015 | |||||||||||
| Interest income: | |||||||||||||
| Control investments | $ | 5,541,299 | $ | 5,065,350 | $ | 1,770,130 | |||||||
| Affiliate investments | 331,804 | 182,194 | — | ||||||||||
| Non-control/Non-affiliate investments | 38,489,924 | 42,152,565 | 39,269,556 | ||||||||||
| Interest on cash and cash equivalents | 166,896 | 68,630 | 28,571 | ||||||||||
| Total interest income | 44,529,923 | 47,468,739 | 41,068,257 | ||||||||||
| PIK interest income: | |||||||||||||
| Control investments | 223,125 | — | — | ||||||||||
| Affiliate investments | 164,331 | 91,097 | — | ||||||||||
| Non-control/Non-affiliate investments | 20,965 | 75,968 | — | ||||||||||
| Total PIK interest income | 408,421 | 167,065 | — | ||||||||||
| Fee income: | |||||||||||||
| Affiliate investments | 9,647 | 6,296 | — | ||||||||||
| Non-control/Non-affiliate investments | 2,199,909 | 3,071,634 | 9,673,649 | ||||||||||
| Total fee income | 2,209,556 | 3,077,930 | 9,673,649 | ||||||||||
| Dividend and other income: | |||||||||||||
| Control investments | (576,044 | ) | 2,712,500 | 730,625 | |||||||||
| Total dividend and other income | (576,044 | ) | 2,712,500 | 730,625 | |||||||||
| Total investment income | 46,571,856 | 53,426,234 | 51,472,531 | ||||||||||
| Expenses: | |||||||||||||
| Base management fee | 5,654,699 | 6,134,304 | 5,931,155 | ||||||||||
| Part I incentive fee | 3,236,320 | 5,211,729 | 5,689,371 | ||||||||||
| Part II incentive fee | — | — | (766,552 | ) | |||||||||
| Professional fees | 1,515,536 | 4,193,532 | 985,607 | ||||||||||
| Board of Directors fees | 538,072 | 546,300 | 359,700 | ||||||||||
| Interest expense | 10,769,842 | 9,594,441 | 8,950,703 | ||||||||||
| Administrator expense | 661,170 | 504,299 | 794,725 | ||||||||||
| General and administrative expenses | 2,030,756 | 1,955,177 | 1,249,792 | ||||||||||
| Total expenses | 24,406,395 | 28,139,782 | 23,194,501 | ||||||||||
| Base management fee waived | (6,232 | ) | (6,232 | ) | — | ||||||||
| Insurance recoveries | (250,000 | ) | — | — | |||||||||
| Net expenses | 24,150,163 | 28,133,550 | 23,194,501 | ||||||||||
| Net investment income | 22,421,693 | 25,292,684 | 28,278,030 | ||||||||||
| Unrealized appreciation (depreciation) on investments: | |||||||||||||
| Control investments | (5,933,119 | ) | (5,979,787 | ) | (1,821,052 | ) | |||||||
| Affiliate investments | (13,595,800 | ) | (2,947,340 | ) | — | ||||||||
| Non-control/Non-affiliate investments | 1,739,837 | (8,067,972 | ) | (10,951,116 | ) | ||||||||
| Net unrealized depreciation on investments | (17,789,082 | ) | (16,995,099 | ) | (12,772,168 | ) | |||||||
| Net unrealized (appreciation) depreciation on secured borrowings | (14,575 | ) | 14,575 | — | |||||||||
| Realized gain (loss) on investments and secured borrowings: | |||||||||||||
| Non-control/Non-affiliate investments | (13,384,915 | ) | (12,769,777 | ) | 406,220 | ||||||||
| Net realized gain (loss) on investments and secured borrowings | (13,384,915 | ) | (12,769,777 | ) | 406,220 | ||||||||
| Net increase (decrease) in net assets resulting from operations | $ | (8,766,879 | ) | $ | (4,457,617 | ) | $ | 15,912,082 | |||||
| Net investment income per common share — basic and diluted | $ | 0.76 | $ | 0.86 | $ | 0.96 | |||||||
| Earnings (loss) per common share — basic and diluted (Note 5) | $ | (0.30 | ) | $ | (0.15 | ) | $ | 0.54 | |||||
| Weighted average common shares outstanding — basic and diluted | 29,466,768 | 29,466,768 | 29,466,768 | ||||||||||
| Distributions per common share | $ | 0.80 | $ | 0.90 | $ | 1.07 | |||||||
See notes to Consolidated Financial Statements.
79
Oaktree Strategic Income Corporation
Consolidated Statements of Changes in Net Assets
| Year ended September 30, 2020 | Year ended September 30, 2019 | Year ended September 30, 2018 | ||||||||||||||||||
| Operations: | ||||||||||||||||||||
| Net investment income | $ | 16,203,500 | $ | 21,140,251 | $ | 19,771,332 | ||||||||||||||
| Net unrealized appreciation (depreciation) | (7,158,267) | (13,705,282) | 28,615,535 | |||||||||||||||||
| Net realized gains (losses) | (10,312,436) | (460,987) | (27,713,818) | |||||||||||||||||
| Net increase (decrease) in net assets resulting from operations | (1,267,203) | 6,973,982 | 20,673,049 | |||||||||||||||||
| Stockholder transactions: | ||||||||||||||||||||
| Distributions to stockholders | (16,501,392) | (18,269,396) | (16,452,988) | |||||||||||||||||
| Tax return of capital | — | — | (2,111,075) | |||||||||||||||||
| Net increase (decrease) in net assets from stockholder transactions | (16,501,392) | (18,269,396) | (18,564,063) | |||||||||||||||||
| Capital share transactions: | ||||||||||||||||||||
| Issuance of common stock under dividend reinvestment plan | 291,848 | 215,067 | 281,737 | |||||||||||||||||
| Repurchases of common stock under dividend reinvestment plan | (291,848) | (215,067) | (281,737) | |||||||||||||||||
| Net change in net assets from capital share transactions | — | — | — | |||||||||||||||||
| Total increase (decrease) in net assets | (17,768,595) | (11,295,414) | 2,108,986 | |||||||||||||||||
| Net assets at beginning of period | 284,450,006 | 295,745,420 | 293,636,434 | |||||||||||||||||
| Net assets at end of period | $ | 266,681,411 | $ | 284,450,006 | $ | 295,745,420 | ||||||||||||||
| Net asset value per common share | $ | 9.05 | $ | 9.65 | $ | 10.04 | ||||||||||||||
| Common shares outstanding at end of period | 29,466,768 | 29,466,768 | 29,466,768 | |||||||||||||||||
| Year ended September 30, 2017 | Year ended September 30, 2016 | Year ended September 30, 2015 | ||||||||||
| Operations: | ||||||||||||
| Net investment income | $ | 22,421,693 | $ | 25,292,684 | $ | 28,278,030 | ||||||
| Net unrealized depreciation on investments | (17,789,082 | ) | (16,995,099 | ) | (12,772,168 | ) | ||||||
| Net unrealized (appreciation) depreciation on secured borrowings | (14,575 | ) | 14,575 | — | ||||||||
| Net realized gain (loss) on investments and secured borrowings | (13,384,915 | ) | (12,769,777 | ) | 406,220 | |||||||
| Net increase (decrease) in net assets resulting from operations | (8,766,879 | ) | (4,457,617 | ) | 15,912,082 | |||||||
| Stockholder transactions: | ||||||||||||
| Distributions to stockholders | (23,426,081 | ) | (26,520,092 | ) | (31,676,775 | ) | ||||||
| Net decrease in net assets from stockholder transactions | (23,426,081 | ) | (26,520,092 | ) | (31,676,775 | ) | ||||||
| Capital share transactions: | ||||||||||||
| Issuance of common stock, net | — | — | (105,882 | ) | ||||||||
| Issuance of common stock under dividend reinvestment plan | 270,630 | 650,402 | 889,511 | |||||||||
| Repurchases of common stock under dividend reinvestment plan | (270,630 | ) | (650,402 | ) | (889,511 | ) | ||||||
| Net decrease in net assets from capital share transactions | — | — | (105,882 | ) | ||||||||
| Total decrease in net assets | (32,192,960 | ) | (30,977,709 | ) | (15,870,575 | ) | ||||||
| Net assets at beginning of period | 325,829,394 | 356,807,103 | 372,677,678 | |||||||||
| Net assets at end of period | $ | 293,636,434 | $ | 325,829,394 | $ | 356,807,103 | ||||||
| Net asset value per common share | $ | 9.97 | $ | 11.06 | $ | 12.11 | ||||||
| Common shares outstanding at end of period | 29,466,768 | 29,466,768 | 29,466,768 | |||||||||
See notes to Consolidated Financial Statements.
Oaktree Strategic Income Corporation
Consolidated Statements of Cash Flows
| Year ended September 30, 2020 | Year ended September 30, 2019 | Year ended September 30, 2018 | ||||||||||||||||||
| Operating activities: | ||||||||||||||||||||
| Net increase (decrease) in net assets resulting from operations | $ | (1,267,203) | $ | 6,973,982 | $ | 20,673,049 | ||||||||||||||
| Adjustments to reconcile net increase (decrease) in net assets resulting from operations to net cash provided by (used in) operating activities: | ||||||||||||||||||||
| Net unrealized (appreciation) depreciation | 7,158,267 | 13,705,282 | (28,615,535) | |||||||||||||||||
| Net realized (gains) losses | 10,312,436 | 460,987 | 27,713,818 | |||||||||||||||||
| PIK interest income | (1,983,129) | (26,220) | (2,187,398) | |||||||||||||||||
| Deferred fee income | — | — | 182,004 | |||||||||||||||||
| Accretion of original issue discount on investments | (1,488,128) | (2,226,783) | (2,846,469) | |||||||||||||||||
| Amortization of deferred financing costs | 1,283,258 | 618,376 | 2,745,365 | |||||||||||||||||
| Purchases of investments | (223,983,589) | (249,144,958) | (455,031,026) | |||||||||||||||||
| Proceeds from the sales and repayments of investments | 304,685,202 | 196,995,385 | 464,333,631 | |||||||||||||||||
| Changes in operating assets and liabilities: | ||||||||||||||||||||
| (Increase) decrease in interest, dividends and fees receivable | 2,658,062 | (674,396) | (125,259) | |||||||||||||||||
| (Increase) decrease in due from portfolio companies | (176,467) | (182,651) | 118,314 | |||||||||||||||||
| (Increase) decrease in receivables from unsettled transactions | (2,874,997) | 51,862 | (4,638,533) | |||||||||||||||||
| (Increase) decrease in other assets | 203,686 | 130,498 | (706,624) | |||||||||||||||||
| Increase (decrease) in accounts payable, accrued expenses and other liabilities | (127,501) | (26,371) | 166,904 | |||||||||||||||||
| Increase (decrease) in base management fee and incentive fee payable | 295,229 | (547,251) | (320,505) | |||||||||||||||||
| Increase (decrease) in due to affiliate | (291,169) | (243,945) | 1,250,435 | |||||||||||||||||
| Increase (decrease) in interest payable | (1,264,510) | 1,619,852 | (865,436) | |||||||||||||||||
| Increase (decrease) in payables from unsettled transactions | (33,469,838) | 28,791,973 | (40,097,289) | |||||||||||||||||
| Increase (decrease) in director fees payable | (25,000) | 25,000 | (98,008) | |||||||||||||||||
| Net cash provided by (used in) operating activities | 59,644,609 | (3,699,378) | (18,348,562) | |||||||||||||||||
| Financing activities: | ||||||||||||||||||||
| Distributions paid in cash | (16,209,544) | (18,054,329) | (18,282,326) | |||||||||||||||||
| Borrowings under credit facilities | 79,500,000 | 122,100,000 | 311,000,000 | |||||||||||||||||
| Repayments of borrowings under credit facilities | (117,500,000) | (102,500,000) | (118,900,000) | |||||||||||||||||
| Proceeds from secured borrowings | 10,929,578 | — | — | |||||||||||||||||
| Proceeds from issuance of notes payable | — | — | 3,000,000 | |||||||||||||||||
| Repayments of notes payable | — | — | (183,000,000) | |||||||||||||||||
| Repurchases of common stock under dividend reinvestment plan | (291,848) | (215,067) | (281,737) | |||||||||||||||||
| Deferred financing costs paid | (646,179) | (10,000) | (1,767,975) | |||||||||||||||||
| Offering costs paid | (121,310) | — | — | |||||||||||||||||
| Net cash provided by (used in) financing activities | (44,339,303) | 1,320,604 | (8,232,038) | |||||||||||||||||
| Effect of exchange rate changes on foreign currency | 143,489 | (1,381) | — | |||||||||||||||||
| Net increase (decrease) in cash and cash equivalents and restricted cash | 15,448,795 | (2,380,155) | (26,580,600) | |||||||||||||||||
| Cash and cash equivalents and restricted cash, beginning of period | 14,051,632 | 16,431,787 | 43,012,387 | |||||||||||||||||
| Cash and cash equivalents and restricted cash, end of period | $ | 29,500,427 | $ | 14,051,632 | $ | 16,431,787 | ||||||||||||||
| Supplemental information: | ||||||||||||||||||||
| Cash paid for interest | $ | 12,413,162 | $ | 12,290,090 | $ | 12,499,952 | ||||||||||||||
| Non-cash financing activities: | ||||||||||||||||||||
| Issuance of shares of common stock under dividend reinvestment plan | $ | 291,848 | $ | 215,067 | $ | 281,737 | ||||||||||||||
| Deferred financing costs incurred | (627,800) | (278,000) | — | |||||||||||||||||
| Reconciliation to the Consolidated Statements of Assets and Liabilities | September 30, 2020 | September 30, 2019 | September 30, 2018 | |||||||||||||||||
| Cash and cash equivalents | $ | 25,072,749 | $ | 5,646,899 | $ | 10,439,023 | ||||||||||||||
| Restricted cash | 4,427,678 | 8,404,733 | 5,992,764 | |||||||||||||||||
| Total cash and cash equivalents and restricted cash | $ | 29,500,427 | $ | 14,051,632 | $ | 16,431,787 | ||||||||||||||
| See notes to Consolidated Financial Statements. | ||||||||||||||||||||
81
| Year ended September 30, 2017 | Year ended September 30, 2016 | Year ended September 30, 2015 | ||||||||||
| Operating activities: | ||||||||||||
| Net increase (decrease) in net assets resulting from operations | $ | (8,766,879 | ) | $ | (4,457,617 | ) | $ | 15,912,082 | ||||
| Adjustments to reconcile net increase (decrease) in net assets resulting from operations to net cash provided (used) by operating activities: | ||||||||||||
| Net unrealized depreciation on investments | 17,789,082 | 16,995,099 | 12,772,168 | |||||||||
| Net unrealized appreciation (depreciation) on secured borrowings | 14,575 | (14,575 | ) | — | ||||||||
| Net realized (gain) loss on investments and secured borrowings | 13,384,915 | 12,769,777 | (406,220 | ) | ||||||||
| PIK interest income | (408,421 | ) | (167,065 | ) | — | |||||||
| Recognition of fee income | (2,209,556 | ) | (3,077,930 | ) | (9,673,649 | ) | ||||||
| Accretion of original issue discount on investments | (3,945,886 | ) | (1,924,087 | ) | (1,634,191 | ) | ||||||
| Amortization of deferred financing costs | 1,255,304 | 874,680 | 2,768,573 | |||||||||
| Changes in operating assets and liabilities: | ||||||||||||
| Fee income received | 2,190,276 | 3,060,760 | 9,767,645 | |||||||||
| (Increase) decrease in restricted cash | 1,628,578 | 2,221,958 | (9,131,391 | ) | ||||||||
| (Increase) decrease in interest, dividends and fees receivable | 1,565,860 | (1,796,556 | ) | (1,663,369 | ) | |||||||
| (Increase) decrease in due from portfolio companies | 50,169 | (324,842 | ) | 189,253 | ||||||||
| (Increase) decrease in receivables from unsettled transactions | 12,364,092 | 5,671,964 | (13,541,056 | ) | ||||||||
| Increase in other assets | (36,844 | ) | (115,276 | ) | (33,216 | ) | ||||||
| Increase (decrease) in accounts payable, accrued expenses and other liabilities | (763,409 | ) | (665,313 | ) | 697,916 | |||||||
| Increase (decrease) in base management fee and incentive fee payable | (751,534 | ) | 932,542 | 589,489 | ||||||||
| Increase in due to FSC CT | 48,444 | 22,432 | 140,024 | |||||||||
| Increase in interest payable | 197,518 | 129,641 | 1,463,366 | |||||||||
| Increase (decrease) in payables from unsettled transactions | 49,029,789 | (11,809,500 | ) | (16,053,500 | ) | |||||||
| Increase (decrease) in amounts payable to syndication partners | (18,750 | ) | 18,750 | — | ||||||||
| Increase (decrease) in director fees payable | (138,267 | ) | 183,625 | 52,650 | ||||||||
| Purchases of investments and net revolver activity | (290,578,883 | ) | (286,134,332 | ) | (886,999,491 | ) | ||||||
| Principal payments received on investments (scheduled payments) | 16,222,229 | 12,221,079 | 11,677,139 | |||||||||
| Principal payments received on investments (payoffs) | 215,278,210 | 132,931,016 | 60,488,532 | |||||||||
| PIK interest income received in cash | — | 78,226 | — | |||||||||
| Proceeds from the sale of investments | 45,445,755 | 163,290,550 | 480,361,990 | |||||||||
| Net cash provided (used) by operating activities | 68,846,367 | 40,915,006 | (342,255,256 | ) | ||||||||
| Financing activities: | ||||||||||||
| Distributions paid in cash | (23,155,451 | ) | (25,869,690 | ) | (39,436,200 | ) | ||||||
| Borrowings under credit facilities | 55,500,000 | 16,267,000 | 428,509,800 | |||||||||
| Repayments of borrowings under credit facilities | (79,970,000 | ) | (45,500,000 | ) | (291,850,000 | ) | ||||||
| Repayments of secured borrowings | (5,000,000 | ) | — | — | ||||||||
| Proceeds from issuance of notes payable | 7,500,000 | 29,715,000 | 186,366,000 | |||||||||
| Repayments of notes payable | (7,500,000 | ) | (36,081,000 | ) | — | |||||||
| Repurchases of common stock under dividend reinvestment plan | (270,630 | ) | (650,402 | ) | (1,080,605 | ) | ||||||
| Deferred financing costs paid | (125,000 | ) | (450,374 | ) | (6,144,316 | ) | ||||||
| Offering costs paid | — | — | (105,882 | ) | ||||||||
| Net cash provided (used) by financing activities | (53,021,081 | ) | (62,569,466 | ) | 276,258,797 | |||||||
| Net increase (decrease) in cash and cash equivalents | 15,825,286 | (21,654,460 | ) | (65,996,459 | ) | |||||||
| Cash and cash equivalents, beginning of period | 19,778,841 | 41,433,301 | 107,429,760 | |||||||||
| Cash and cash equivalents, end of period | $ | 35,604,127 | $ | 19,778,841 | $ | 41,433,301 | ||||||
| Year ended September 30, 2017 | Year ended September 30, 2016 | Year ended September 30, 2015 | ||||||||||
| Supplemental information: | ||||||||||||
| Cash paid for interest | $ | 9,317,020 | $ | 8,590,120 | $ | 4,718,763 | ||||||
| Non-cash operating activities: | ||||||||||||
| Purchase of investment from restructuring | $ | — | $ | (12,559,122 | ) | $ | — | |||||
| Proceeds from investment restructuring | $ | — | $ | 12,559,122 | $ | — | ||||||
| Exchange of investments | $ | — | $ | 1,325,000 | $ | 58,823,756 | ||||||
| Non-cash financing activities: | ||||||||||||
| Proceeds from unsettled secured borrowings | $ | — | $ | 5,000,000 | $ | — | ||||||
| Issuance of shares of common stock under dividend reinvestment plan | $ | 270,630 | $ | 650,402 | $ | 1,080,605 | ||||||
Oaktree Strategic Income Corporation
Consolidated Schedule of Investments
September 30, 20172020
| Portfolio Company/Type of Investment (1)(2)(3)(4)(5) | Cash Interest Rate (6) | Industry | Principal (7) | Cost | Fair Value | Notes | |||||||||||||||||||||||
| Control Investments | (8) | ||||||||||||||||||||||||||||
| OCSI Glick JV LLC | Multi-Sector Holdings | (10)(11) | |||||||||||||||||||||||||||
| Subordinated Note, LIBOR+4.50% cash due 10/20/2028 | $ | 65,045,551 | $ | 65,045,551 | $ | 49,409,901 | (6)(9)(14)(15) (16) | ||||||||||||||||||||||
| 87.5% equity interest | 7,111,751 | — | (9)(12)(14) | ||||||||||||||||||||||||||
| 72,157,302 | 49,409,901 | ||||||||||||||||||||||||||||
| Total Control Investments (18.5% of net assets) | $ | 72,157,302 | $ | 49,409,901 | |||||||||||||||||||||||||
| Non-Control/Non-Affiliate Investments | (13) | ||||||||||||||||||||||||||||
| 4 Over International, LLC | Commercial Printing | ||||||||||||||||||||||||||||
| First Lien Term Loan, LIBOR+6.00% cash due 6/7/2022 | 7.00% | $ | 5,492,885 | $ | 5,432,331 | $ | 5,094,651 | (6)(15) | |||||||||||||||||||||
| First Lien Revolver, LIBOR+6.00% cash due 6/7/2021 | 7.00% | 68,452 | 67,950 | 63,489 | (6)(15) | ||||||||||||||||||||||||
| 5,500,281 | 5,158,140 | ||||||||||||||||||||||||||||
| 99 Cents Only Stores LLC | General Merchandise Stores | ||||||||||||||||||||||||||||
| First Lien Term Loan, LIBOR+5.00% cash 1.50% PIK due 1/13/2022 | 6.00% | 1,635,810 | 1,593,419 | 1,504,945 | (6) | ||||||||||||||||||||||||
| 1,593,419 | 1,504,945 | ||||||||||||||||||||||||||||
| Access CIG, LLC | Diversified Support Services | ||||||||||||||||||||||||||||
| First Lien Term Loan, LIBOR+3.75% cash due 2/27/2025 | 3.91% | 5,406,946 | 5,370,428 | 5,303,052 | (6) | ||||||||||||||||||||||||
| 5,370,428 | 5,303,052 | ||||||||||||||||||||||||||||
| Accupac, Inc. | Personal Products | ||||||||||||||||||||||||||||
| First Lien Term Loan, LIBOR+6.00% cash due 1/17/2026 | 7.00% | 3,816,685 | 3,757,755 | 3,816,685 | (6)(15) | ||||||||||||||||||||||||
| First Lien Delayed Draw Term Loan, LIBOR+6.00% cash due 1/17/2026 | — | (11,070) | — | (6)(14)(15) | |||||||||||||||||||||||||
| First Lien Revolver, LIBOR+6.00% cash due 1/17/2026 | 7.00% | 477,989 | 470,609 | 477,989 | (6)(15) | ||||||||||||||||||||||||
| 4,217,294 | 4,294,674 | ||||||||||||||||||||||||||||
| AI Ladder (Luxembourg) Subco S.a.r.l. | Electrical Components & Equipment | ||||||||||||||||||||||||||||
| First Lien Term Loan, LIBOR+4.50% cash due 7/9/2025 | 4.65% | 6,412,119 | 6,280,139 | 6,139,604 | (6)(9) | ||||||||||||||||||||||||
| 6,280,139 | 6,139,604 | ||||||||||||||||||||||||||||
| Airbnb, Inc. | Hotels, Resorts & Cruise Lines | ||||||||||||||||||||||||||||
| First Lien Term Loan, LIBOR+7.50% cash due 4/17/2025 | 8.50% | 4,755,083 | 4,645,028 | 5,159,265 | (6) | ||||||||||||||||||||||||
| 4,645,028 | 5,159,265 | ||||||||||||||||||||||||||||
| Aldevron, L.L.C. | Biotechnology | ||||||||||||||||||||||||||||
| First Lien Term Loan, LIBOR+4.25% cash due 10/12/2026 | 5.25% | 5,493,198 | 5,449,615 | 5,504,624 | (6) | ||||||||||||||||||||||||
| 5,449,615 | 5,504,624 | ||||||||||||||||||||||||||||
| All Web Leads, Inc. | Advertising | ||||||||||||||||||||||||||||
| First Lien Term Loan, LIBOR+5.50% cash 2.0% PIK due 12/29/2023 | 6.50% | 24,174,889 | 24,174,863 | 22,317,000 | (6)(15)(18) | ||||||||||||||||||||||||
| 24,174,863 | 22,317,000 | ||||||||||||||||||||||||||||
| Amplify Finco Pty Ltd. | Movies & Entertainment | ||||||||||||||||||||||||||||
| First Lien Term Loan, LIBOR+4.00% cash due 11/26/2026 | 4.75% | 5,970,000 | 5,910,300 | 5,134,200 | (6)(9)(15) | ||||||||||||||||||||||||
| 5,910,300 | 5,134,200 | ||||||||||||||||||||||||||||
| Ancile Solutions, Inc. | Application Software | ||||||||||||||||||||||||||||
| First Lien Term Loan, LIBOR+7.00% cash due 6/30/2021 | 8.00% | 7,825,529 | 7,747,218 | 7,770,750 | (6)(15) | ||||||||||||||||||||||||
| 7,747,218 | 7,770,750 | ||||||||||||||||||||||||||||
| Apptio, Inc. | Application Software | ||||||||||||||||||||||||||||
| First Lien Term Loan, LIBOR+7.25% cash due 1/10/2025 | 8.25% | 10,693,944 | 10,539,199 | 10,483,861 | (6)(15) | ||||||||||||||||||||||||
| First Lien Revolver, LIBOR+7.25% cash due 1/10/2025 | — | (9,867) | (13,600) | (6)(14)(15) | |||||||||||||||||||||||||
| 10,529,332 | 10,470,261 | ||||||||||||||||||||||||||||
| Ardonagh Midco 3 PLC | Insurance Brokers | ||||||||||||||||||||||||||||
| First Lien Term Loan, EURIBOR+7.50% cash due 7/14/2026 | 8.50% | € | 480,000 | 531,300 | 546,549 | (6)(9)(15) | |||||||||||||||||||||||
| First Lien Term Loan, UK LIBOR+7.50% cash due 7/14/2026 | 8.25% | £ | 3,767,573 | 4,584,049 | 4,729,468 | (6)(9)(15)(18) | |||||||||||||||||||||||
| First Lien Delayed Draw Term Loan, UK LIBOR+7.50% cash due 7/14/2026 | £ | — | — | — | (6)(9)(14)(15) | ||||||||||||||||||||||||
| 5,115,349 | 5,276,017 | ||||||||||||||||||||||||||||
82
| Portfolio Company/Type of Investment (1)(2)(9)(10)(14) | Cash Interest Rate (8) | Industry | Principal (5) | Cost | Fair Value | |||||||||||
| Control Investments (3) | ||||||||||||||||
| FSFR Glick JV LLC (7)(12)(15) | Multi-sector holdings | |||||||||||||||
| Subordinated Note, LIBOR+8% cash due 10/20/2021 (8) | 9.23% | $ | 64,228,881 | $ | 64,228,881 | $ | 57,606,674 | |||||||||
| 87.5% equity interest | 7,111,751 | — | ||||||||||||||
| 71,340,632 | 57,606,674 | |||||||||||||||
| Total Control Investments (19.6% of net assets) | $ | 71,340,632 | $ | 57,606,674 | ||||||||||||
| Affiliate Investments (4) | ||||||||||||||||
| Ameritox Ltd. | Healthcare services | |||||||||||||||
| First Lien Term Loan, LIBOR+5% (1% floor) cash 3% PIK due 4/11/2021 (8)(13) | 6.33% | 8,071,313 | $ | 7,906,087 | $ | 935,913 | ||||||||||
| 3,309,873.6 Class A Preferred Units in Ameritox Holdings II, LLC | 3,309,874 | — | ||||||||||||||
| 327,393.6 Class B Preferred Units in Ameritox Holdings II, LLC | 327,394 | — | ||||||||||||||
| 1,007.36 Class A Units in Ameritox Holdings II, LLC | 5,935,698 | — | ||||||||||||||
| 17,479,053 | 935,913 | |||||||||||||||
| Total Affiliate Investments (0.3% of net assets) | $ | 17,479,053 | $ | 935,913 | ||||||||||||
| Non-Control/Non-Affiliate Investments (6) | ||||||||||||||||
| Triple Point Group Holdings, Inc. | Application software | |||||||||||||||
| First Lien Revolver, LIBOR+4.25% (1% floor) cash due 7/10/2018 (8)(11) | 5.25% | $ | — | $ | (437,932 | ) | ||||||||||
| — | (437,932 | ) | ||||||||||||||
| New Trident Holdcorp, Inc. | Healthcare services | |||||||||||||||
| First Lien Term Loan B, LIBOR+5.75% (1.25% floor) cash due 7/31/2019 (8)(13)(16) | 7.08% | 13,552,077 | 13,285,041 | 9,757,495 | ||||||||||||
| Second Lien Term Loan, LIBOR+9.5% (1.25% floor) cash due 7/31/2020 (8)(16) | 10.83% | 1,000,000 | 950,590 | 50,000 | ||||||||||||
| 14,235,631 | 9,807,495 | |||||||||||||||
| Survey Sampling International, LLC | Research & consulting services | |||||||||||||||
| First Lien Term Loan, LIBOR+5% (1% floor) cash due 12/16/2020 (8)(13) | 6.27% | 5,668,523 | 5,642,223 | 5,583,495 | ||||||||||||
| Second Lien Term Loan, LIBOR+9% (1% floor) cash due 12/16/2021 (8) | 10.27% | 1,000,000 | 988,095 | 990,000 | ||||||||||||
| 6,630,318 | 6,573,495 | |||||||||||||||
| Maxor National Pharmacy Services, LLC | Pharmaceuticals | |||||||||||||||
| First Lien Term Loan, LIBOR+4.75% (1.25% floor) cash due 1/31/2020 (8)(13) | 6.08% | 9,068,650 | 9,068,650 | 9,038,634 | ||||||||||||
| 9,068,650 | 9,038,634 | |||||||||||||||
| NextCare, Inc. | Healthcare services | |||||||||||||||
| Senior Term Loan, LIBOR+6% (1% floor) cash due 7/31/2018 (8)(13) | 7.24% | 6,957,971 | 6,957,970 | 6,667,987 | ||||||||||||
| Delayed Draw Term Loan, LIBOR+6% (1% floor) cash due 7/31/2018 (8) | 7.24% | 1,393,853 | 1,393,853 | 1,322,900 | ||||||||||||
| 8,351,823 | 7,990,887 | |||||||||||||||
| Aptean, Inc. | Application software | |||||||||||||||
| First Lien Term Loan, LIBOR+4.25% (1% floor) cash due 12/20/2022 (8)(13) | 5.59% | 11,243,500 | 11,170,440 | 11,323,161 | ||||||||||||
| Second Lien Term Loan, LIBOR+9.5% (1% floor) cash due 12/20/2023 (8) | 10.84% | 200,000 | 197,320 | 201,750 | ||||||||||||
| 11,367,760 | 11,524,911 | |||||||||||||||
| Stratus Technologies, Inc. | Computer hardware | |||||||||||||||
| First Lien Term Loan, LIBOR+5% (1% floor) cash due 4/28/2021 (8)(13) | 6.24% | 1,315,119 | 1,279,988 | 1,324,983 | ||||||||||||
| 1,279,988 | 1,324,983 | |||||||||||||||
Oaktree Strategic Income Corporation
Consolidated Schedule of Investments
September 30, 20172020
| Portfolio Company/Type of Investment (1)(2)(3)(4)(5) | Cash Interest Rate (6) | Industry | Principal (7) | Cost | Fair Value | Notes | |||||||||||||||||||||||
| Athenex, Inc. | Pharmaceuticals | ||||||||||||||||||||||||||||
| First Lien Term Loan, 11.00% cash due 6/19/2026 | $ | 5,316,814 | $ | 5,094,543 | $ | 5,276,938 | (9)(15) | ||||||||||||||||||||||
| First Lien Delayed Draw Term Loan, 11.00% cash due 6/19/2026 | 1,329,204 | 1,198,792 | 1,279,359 | (9)(14)(15) | |||||||||||||||||||||||||
| 62,097 Common Stock Warrants (exercise price $12.63) expiration date 6/19/2027 | 213,614 | 183,186 | (9)(15) | ||||||||||||||||||||||||||
| 6,506,949 | 6,739,483 | ||||||||||||||||||||||||||||
| Ball Metalpack Finco, LLC | Metal & Glass Containers | ||||||||||||||||||||||||||||
| First Lien Term Loan, LIBOR+4.50% cash due 7/31/2025 | 4.76% | 3,424,981 | 3,413,060 | 3,308,532 | (6)(15) | ||||||||||||||||||||||||
| 3,413,060 | 3,308,532 | ||||||||||||||||||||||||||||
| Blackhawk Network Holdings, Inc. | Data Processing & Outsourced Services | ||||||||||||||||||||||||||||
| Second Lien Term Loan, LIBOR+7.00% cash due 6/15/2026 | 7.19% | 4,375,000 | 4,341,470 | 4,025,000 | (6) | ||||||||||||||||||||||||
| 4,341,470 | 4,025,000 | ||||||||||||||||||||||||||||
| Boxer Parent Company Inc. | Systems Software | ||||||||||||||||||||||||||||
| First Lien Term Loan, LIBOR+4.25% cash due 10/2/2025 | 4.40% | 6,057,113 | 5,992,780 | 5,895,357 | (6) | ||||||||||||||||||||||||
| 5,992,780 | 5,895,357 | ||||||||||||||||||||||||||||
| Cadence Aerospace, LLC | Aerospace & Defense | ||||||||||||||||||||||||||||
| First Lien Term Loan, LIBOR+3.25% cash 5.25% PIK due 11/14/2023 | 4.25% | 13,590,961 | 13,499,354 | 12,481,939 | (6)(15) | ||||||||||||||||||||||||
| 13,499,354 | 12,481,939 | ||||||||||||||||||||||||||||
| Carrols Restaurant Group, Inc. | Restaurants | ||||||||||||||||||||||||||||
| First Lien Term Loan, LIBOR+6.25% cash due 4/30/2026 | 7.25% | 3,577,035 | 3,398,183 | 3,550,207 | (6) | ||||||||||||||||||||||||
| 3,398,183 | 3,550,207 | ||||||||||||||||||||||||||||
| Chief Power Finance II, LLC | Independent Power Producers & Energy Traders | ||||||||||||||||||||||||||||
| First Lien Term Loan, LIBOR+6.50% cash due 12/31/2022 | 7.50% | 3,325,000 | 3,265,964 | 3,167,063 | (6)(15) | ||||||||||||||||||||||||
| 3,265,964 | 3,167,063 | ||||||||||||||||||||||||||||
| CircusTrix Holdings LLC | Leisure Facilities | ||||||||||||||||||||||||||||
| First Lien Term Loan, LIBOR+6.75% PIK due 12/16/2021 | 9,434,200 | 9,402,902 | 7,260,560 | (6)(15) | |||||||||||||||||||||||||
| 9,402,902 | 7,260,560 | ||||||||||||||||||||||||||||
| CITGO Petroleum Corp. | Oil & Gas Refining & Marketing | ||||||||||||||||||||||||||||
| First Lien Term Loan, LIBOR+5.00% cash due 3/28/2024 | 6.00% | 5,387,652 | 5,333,776 | 5,131,738 | (6) | ||||||||||||||||||||||||
| 5,333,776 | 5,131,738 | ||||||||||||||||||||||||||||
| Connect U.S. Finco LLC | Alternative Carriers | ||||||||||||||||||||||||||||
| First Lien Term Loan, LIBOR+4.50% cash due 12/11/2026 | 5.50% | 1,340,037 | 1,278,156 | 1,302,355 | (6)(9) | ||||||||||||||||||||||||
| 1,278,156 | 1,302,355 | ||||||||||||||||||||||||||||
| Continental Intermodal Group LP | Oil & Gas Storage & Transportation | ||||||||||||||||||||||||||||
| First Lien Term Loan, LIBOR+9.50% PIK due 1/28/2025 | 10,224,899 | 10,224,899 | 8,989,731 | (6)(15) | |||||||||||||||||||||||||
| Common Stock Warrants expiration date 7/28/2025 | — | 690,993 | |||||||||||||||||||||||||||
| 10,224,899 | 9,680,724 | ||||||||||||||||||||||||||||
| Coyote Buyer, LLC | Specialty Chemicals | ||||||||||||||||||||||||||||
| First Lien Term Loan, LIBOR+6.00% cash due 2/6/2026 | 7.00% | 5,450,344 | 5,395,841 | 5,395,841 | (6)(15) | ||||||||||||||||||||||||
| First Lien Revolver, LIBOR+6.00% cash due 2/6/2025 | — | (3,913) | (3,913) | (6)(14)(15) | |||||||||||||||||||||||||
| 5,391,928 | 5,391,928 | ||||||||||||||||||||||||||||
| CPI Holdco, LLC | Health Care Supplies | ||||||||||||||||||||||||||||
| First Lien Term Loan, LIBOR+4.25% cash due 11/4/2026 | 4.40% | 5,894,380 | 5,869,505 | 5,875,960 | (6) | ||||||||||||||||||||||||
| 5,869,505 | 5,875,960 | ||||||||||||||||||||||||||||
| CTOS, LLC | Trading Companies & Distributors | ||||||||||||||||||||||||||||
| First Lien Term Loan, LIBOR+4.25% cash due 4/18/2025 | 4.40% | 8,731,138 | 8,827,767 | 8,671,111 | (6) | ||||||||||||||||||||||||
| 8,827,767 | 8,671,111 | ||||||||||||||||||||||||||||
83
| Portfolio Company/Type of Investment (1)(2)(9)(10)(14) | Cash Interest Rate (8) | Industry | Principal (5) | Cost | Fair Value | |||||||||||
| TravelCLICK, Inc. | Internet software & services | |||||||||||||||
| Second Lien Term Loan, LIBOR+7.75% (1% floor) cash due 11/6/2021 (8)(13) | 8.99% | $ | 2,048,485 | $ | 2,010,607 | $ | 2,058,727 | |||||||||
| 2,010,607 | 2,058,727 | |||||||||||||||
| Verdesian Life Sciences, LLC | Fertilizers & agricultural chemicals | |||||||||||||||
| First Lien Term Loan, LIBOR+5% (1% floor) cash due 7/1/2020 (8)(13) | 6.31% | 3,295,860 | 3,273,753 | 2,801,481 | ||||||||||||
| 3,273,753 | 2,801,481 | |||||||||||||||
| TV Borrower US, LLC (7) | Integrated telecommunication services | |||||||||||||||
| First Lien Dollar Term B-1 Loan, LIBOR+4.75% (1% floor) cash due 2/22/2024 (8) | 6.08% | 3,383,000 | 3,367,510 | 3,406,258 | ||||||||||||
| 3,367,510 | 3,406,258 | |||||||||||||||
| BeyondTrust Software, Inc. | Application software | |||||||||||||||
| First Lien Term Loan, LIBOR+7% (1% floor) cash due 9/25/2019 (8)(13) | 8.33% | 16,384,644 | 16,255,828 | 16,384,050 | ||||||||||||
| First Lien Revolver, LIBOR+7% (1% floor) cash due 9/25/2019 (8)(11) | 8.33% | (21,305 | ) | (130 | ) | |||||||||||
| 500,000 Class A membership interests in BeyondTrust Holdings LLC | 500,000 | 628,846 | ||||||||||||||
| 16,734,523 | 17,012,766 | |||||||||||||||
| Dynatect Group Holdings, Inc. | Industrial machinery | |||||||||||||||
| First Lien Term Loan, LIBOR+4.5% (1% floor) cash due 9/30/2020 (8) | 5.83% | 3,786,203 | 3,786,203 | 3,672,617 | ||||||||||||
| 3,786,203 | 3,672,617 | |||||||||||||||
| Idera, Inc. | Internet software & services | |||||||||||||||
| First Lien Term Loan B, LIBOR+5% (1% floor) cash due 6/27/2024 (8) | 6.24% | 3,457,698 | 3,424,359 | 3,483,630 | ||||||||||||
| 3,424,359 | 3,483,630 | |||||||||||||||
| Central Security Group, Inc. | Specialized consumer services | |||||||||||||||
| First Lien Term Loan, LIBOR+5.625% (1% floor) cash due 10/6/2021 (8) | 6.86% | 1,665,740 | 1,660,679 | 1,672,677 | ||||||||||||
| 1,660,679 | 1,672,677 | |||||||||||||||
| Kellermeyer Bergensons Services, LLC | Diversified support services | |||||||||||||||
| First Lien Term Loan, LIBOR+5% (1% floor) cash due 10/29/2021 (8)(13) | 6.32% | 5,251,500 | 5,208,454 | 5,248,218 | ||||||||||||
| Second Lien Term Loan, LIBOR+8.5% (1% floor) cash due 4/29/2022 (8)(13) | 9.81% | 280,000 | 280,000 | 274,400 | ||||||||||||
| 5,488,454 | 5,522,618 | |||||||||||||||
| GOBP Holdings Inc. | Food retail | |||||||||||||||
| Second Lien Term Loan, LIBOR+8.25% (1% floor) cash due 10/21/2022 (8)(13) | 9.58% | 3,685,714 | 3,644,031 | 3,717,983 | ||||||||||||
| 3,644,031 | 3,717,983 | |||||||||||||||
| Executive Consulting Group, LLC | Healthcare services | |||||||||||||||
| First Lien Term Loan, LIBOR+4.75% (1% floor) cash due 11/21/2019 (8)(13) | 5.99% | 7,000,000 | 7,000,000 | 6,999,745 | ||||||||||||
| Delayed Draw Term Loan, LIBOR+4.75% (1% floor) cash due 11/21/2019 (8) | 5.99% | 3,791,650 | 3,791,650 | 3,791,657 | ||||||||||||
| 10,791,650 | 10,791,402 | |||||||||||||||
| Metamorph US 3, LLC | Internet software & services | |||||||||||||||
| First Lien Term Loan, LIBOR+5.5% (1% floor) cash 2% PIK due 12/1/2020 (8)(13) | 6.74% | 14,070,138 | 13,488,111 | 5,343,093 | ||||||||||||
| First Lien Revolver, LIBOR+6.5% (1% floor) cash due 12/1/2020 (8)(11)(13) | 7.74% | 1,080,000 | 1,037,075 | (36,455 | ) | |||||||||||
| 14,525,186 | 5,306,638 | |||||||||||||||
Oaktree Strategic Income Corporation
Consolidated Schedule of Investments
September 30, 20172020
| Portfolio Company/Type of Investment (1)(2)(3)(4)(5) | Cash Interest Rate (6) | Industry | Principal (7) | Cost | Fair Value | Notes | |||||||||||||||||||||||
| Curium Bidco S.à.r.l. | Biotechnology | ||||||||||||||||||||||||||||
| First Lien Term Loan, LIBOR+3.75% cash due 7/9/2026 | 3.97% | $ | 3,960,000 | $ | 3,930,300 | $ | 3,930,300 | (6)(9) | |||||||||||||||||||||
| 3,930,300 | 3,930,300 | ||||||||||||||||||||||||||||
| Dealer Tire, LLC | Distributors | ||||||||||||||||||||||||||||
| First Lien Term Loan, LIBOR+4.25% cash due 12/12/2025 | 4.40% | 8,851,404 | 8,760,175 | 8,674,375 | (6) | ||||||||||||||||||||||||
| 8,760,175 | 8,674,375 | ||||||||||||||||||||||||||||
| EnergySolutions LLC | Environmental & Facilities Services | ||||||||||||||||||||||||||||
| First Lien Term Loan, LIBOR+3.75% cash due 5/9/2025 | 4.75% | 3,910,000 | 3,897,041 | 3,753,600 | (6) | ||||||||||||||||||||||||
| 3,897,041 | 3,753,600 | ||||||||||||||||||||||||||||
| eResearch Technology, Inc. | Application Software | ||||||||||||||||||||||||||||
| First Lien Term Loan, LIBOR+4.50% cash due 2/4/2027 | 5.50% | 3,990,000 | 3,950,100 | 3,979,187 | (6) | ||||||||||||||||||||||||
| 3,950,100 | 3,979,187 | ||||||||||||||||||||||||||||
| Firstlight Holdco, Inc. | Alternative Carriers | ||||||||||||||||||||||||||||
| First Lien Term Loan, LIBOR+3.50% cash due 7/23/2025 | 3.65% | 7,084,337 | 7,059,645 | 6,827,530 | (6) | ||||||||||||||||||||||||
| 7,059,645 | 6,827,530 | ||||||||||||||||||||||||||||
| Fortress Biotech, Inc. | Biotechnology | ||||||||||||||||||||||||||||
| First Lien Term Loan, 11.00% cash due 8/27/2025 | 3,013,000 | 2,831,219 | 2,854,818 | (9)(15)(18) | |||||||||||||||||||||||||
| 87,852 Common Stock Warrants (exercise price $3.20) expiration date 8/27/2030 | 93,123 | 151,105 | (9)(15) | ||||||||||||||||||||||||||
| 2,924,342 | 3,005,923 | ||||||||||||||||||||||||||||
| GI Chill Acquisition LLC | Managed Health Care | ||||||||||||||||||||||||||||
| First Lien Term Loan, LIBOR+4.00% cash due 8/6/2025 | 4.22% | 2,969,697 | 2,947,424 | 2,917,727 | (6)(15) | ||||||||||||||||||||||||
| 2,947,424 | 2,917,727 | ||||||||||||||||||||||||||||
| GKD Index Partners, LLC | Specialized Finance | ||||||||||||||||||||||||||||
| First Lien Term Loan, LIBOR+7.00% cash due 6/29/2023 | 8.00% | 8,051,177 | 8,007,041 | 7,914,307 | (6)(15) | ||||||||||||||||||||||||
| First Lien Revolver, LIBOR+7.00% cash due 6/29/2023 | 8.00% | 355,556 | 352,069 | 347,556 | (6)(14)(15) | ||||||||||||||||||||||||
| 8,359,110 | 8,261,863 | ||||||||||||||||||||||||||||
| Global Medical Response | Health Care Services | ||||||||||||||||||||||||||||
| First Lien Term Loan, LIBOR+4.25% cash due 3/14/2025 | 5.25% | 2,463,340 | 2,422,270 | 2,395,598 | (6) | ||||||||||||||||||||||||
| 2,422,270 | 2,395,598 | ||||||||||||||||||||||||||||
| Guidehouse LLP | Research & Consulting Services | ||||||||||||||||||||||||||||
| First Lien Term Loan, LIBOR+4.50% cash due 5/1/2025 | 4.65% | 2,474,683 | 2,453,364 | 2,456,135 | (6) | ||||||||||||||||||||||||
| Second Lien Term Loan, LIBOR+8.00% cash due 5/1/2026 | 8.15% | 5,000,000 | 4,982,443 | 4,825,000 | (6)(15) | ||||||||||||||||||||||||
| 7,435,807 | 7,281,135 | ||||||||||||||||||||||||||||
| Gulf Operating, LLC | Oil & Gas Storage & Transportation | ||||||||||||||||||||||||||||
| First Lien Term Loan, LIBOR+5.25% cash due 8/25/2023 | 6.25% | 1,316,869 | 751,248 | 934,430 | (6) | ||||||||||||||||||||||||
| 751,248 | 934,430 | ||||||||||||||||||||||||||||
| Helios Software Holdings, Inc. | Systems Software | ||||||||||||||||||||||||||||
| First Lien Term Loan, LIBOR+4.25% cash due 10/24/2025 | 4.52% | 3,969,690 | 3,929,993 | 3,922,570 | (6) | ||||||||||||||||||||||||
| 3,929,993 | 3,922,570 | ||||||||||||||||||||||||||||
| iCIMs, Inc. | Application Software | ||||||||||||||||||||||||||||
| First Lien Term Loan, LIBOR+6.50% cash due 9/12/2024 | 7.50% | 5,572,549 | 5,497,575 | 5,527,968 | (6)(15) | ||||||||||||||||||||||||
| First Lien Revolver, LIBOR+6.50% cash due 9/12/2024 | — | (4,940) | (2,353) | (6)(14)(15) | |||||||||||||||||||||||||
| 5,492,635 | 5,525,615 | ||||||||||||||||||||||||||||
| Immucor, Inc. | Health Care Supplies | ||||||||||||||||||||||||||||
| First Lien Term Loan, LIBOR+5.75% cash due 7/2/2025 | 6.75% | 2,267,567 | 2,224,475 | 2,222,215 | (6)(15) | ||||||||||||||||||||||||
| First Lien Revolver, LIBOR+5.75% cash due 7/2/2025 | — | (3,600) | (3,789) | (6)(14)(15) | |||||||||||||||||||||||||
| Second Lien Term Loan, LIBOR+8.00% cash 3.50% PIK due 10/2/2025 | 9.00% | 5,465,318 | 5,362,101 | 5,356,011 | (6)(15) | ||||||||||||||||||||||||
| 7,582,976 | 7,574,437 | ||||||||||||||||||||||||||||
| KIK Custom Products Inc. | Household Products | ||||||||||||||||||||||||||||
| First Lien Term Loan, LIBOR+4.00% cash due 5/15/2023 | 5.00% | 3,326,063 | 3,338,452 | 3,313,557 | (6)(9) | ||||||||||||||||||||||||
| 3,338,452 | 3,313,557 | ||||||||||||||||||||||||||||
84
| Portfolio Company/Type of Investment (1)(2)(9)(10)(14) | Cash Interest Rate (8) | Industry | Principal (5) | Cost | Fair Value | |||||||||||
| Compuware Corporation | Internet software & services | |||||||||||||||
| First Lien Term Loan B3, LIBOR+4.25% (1% floor) cash due 12/15/2021 (8)(13) | 5.49% | $ | 8,423,623 | $ | 8,345,374 | $ | 8,528,918 | |||||||||
| 8,345,374 | 8,528,918 | |||||||||||||||
| Motion Recruitment Partners LLC | Diversified support services | |||||||||||||||
| First Lien Term Loan, LIBOR+6% (1% floor) cash due 2/13/2020 (8)(13) | 7.24% | 13,509,054 | 13,498,295 | 13,508,389 | ||||||||||||
| First Lien Revolver, LIBOR+6% (1% floor) cash due 2/13/2020 (8)(11) | 7.24% | — | (960 | ) | (143 | ) | ||||||||||
| 13,497,335 | 13,508,246 | |||||||||||||||
| PowerPlan, Inc. | Internet software & services | |||||||||||||||
| First Lien Term Loan, LIBOR+5.25% (1% floor) cash due 2/23/2022 (8)(13) | 6.49% | 17,839,352 | 17,800,018 | 17,839,013 | ||||||||||||
| First Lien Revolver, LIBOR+5.25% (1% floor) cash due 2/23/2021 (8)(11) | 6.49% | — | (40 | ) | ||||||||||||
| 17,800,018 | 17,838,973 | |||||||||||||||
| Digital River, Inc. | Internet software & services | |||||||||||||||
| First Lien Term Loan, LIBOR+6.5% (1% floor) cash due 2/12/2021 (8)(13) | 7.82% | 4,723,868 | 4,681,840 | 4,747,488 | ||||||||||||
| 4,681,840 | 4,747,488 | |||||||||||||||
| Research Now Group, Inc. | Data processing & outsourced services | |||||||||||||||
| Second Lien Term Loan, LIBOR+8.75% (1% floor) cash due 3/18/2022 (8) | 10.08% | 4,000,000 | 3,962,143 | 3,960,000 | ||||||||||||
| 3,962,143 | 3,960,000 | |||||||||||||||
| Staples, Inc. | Distributors | |||||||||||||||
| First Lien Term Loan, LIBOR+4% (1% floor) cash due 9/12/2024 (8)(16) | 5.31% | 13,000,000 | 12,967,500 | 12,957,035 | ||||||||||||
| 12,967,500 | 12,957,035 | |||||||||||||||
| Raley's | Food retail | |||||||||||||||
| First Lien Term Loan, LIBOR+5.25% (1% floor) cash due 5/18/2022 (8)(13) | 6.49% | 3,209,821 | 3,164,432 | 3,209,821 | ||||||||||||
| 3,164,432 | 3,209,821 | |||||||||||||||
| Aptos, Inc. | Data processing & outsourced services | |||||||||||||||
| First Lien Term Loan, LIBOR+6.75% (1% floor) cash due 9/1/2022 (8)(13) | 8.08% | 5,940,000 | 5,842,031 | 5,880,600 | ||||||||||||
| 5,842,031 | 5,880,600 | |||||||||||||||
| Zep Inc. | Housewares & specialties | |||||||||||||||
| First Lien Term Loan, LIBOR+4% (1% floor) cash due 8/12/2024 (8) | 5.24% | 4,750,000 | 4,795,075 | 4,771,779 | ||||||||||||
| 4,795,075 | 4,771,779 | |||||||||||||||
| All Web Leads, Inc. | Advertising | |||||||||||||||
| First Lien Term Loan, LIBOR+7.5% (1% floor) cash due 12/29/2020 (8)(13) | 8.77% | 25,839,538 | 25,839,538 | 23,192,266 | ||||||||||||
| 25,839,538 | 23,192,266 | |||||||||||||||
| Allied Universal Holdco, LLC (f/k/a USAGM Holdco, LLC) | Security & alarm services | |||||||||||||||
| First Lien Term Loan, LIBOR+3.75% (1% floor) cash due 7/28/2022 (8)(16) | 5.08% | 7,979,747 | 8,018,318 | 7,972,286 | ||||||||||||
| 8,018,318 | 7,972,286 | |||||||||||||||
| Internet Pipeline, Inc. | Internet software & services | |||||||||||||||
| First Lien Term Loan, LIBOR+7.25% (1% floor) cash due 8/4/2022 (8)(13) | 8.49% | 13,081,433 | 13,068,115 | 13,212,714 | ||||||||||||
| First Lien Revolver, LIBOR+7.25% (1% floor) cash due 8/4/2021 (8) | 8.49% | — | 8,029 | |||||||||||||
| 13,068,115 | 13,220,743 | |||||||||||||||
Oaktree Strategic Income Corporation
Consolidated Schedule of Investments
September 30, 20172020
| Portfolio Company/Type of Investment (1)(2)(3)(4)(5) | Cash Interest Rate (6) | Industry | Principal (7) | Cost | Fair Value | Notes | |||||||||||||||||||||||
| Lannett Company, Inc. | Pharmaceuticals | ||||||||||||||||||||||||||||
| First Lien Term Loan, LIBOR+5.38% cash due 11/25/2022 | 6.38% | $ | 6,794,491 | $ | 6,802,553 | $ | 6,692,574 | (6)(9) | |||||||||||||||||||||
| 6,802,553 | 6,692,574 | ||||||||||||||||||||||||||||
| Lightbox Intermediate, L.P. | Real Estate Services | ||||||||||||||||||||||||||||
| First Lien Term Loan, LIBOR+5.00% cash due 5/9/2026 | 5.15% | 9,875,000 | 9,755,743 | 9,430,625 | (6)(15) | ||||||||||||||||||||||||
| 9,755,743 | 9,430,625 | ||||||||||||||||||||||||||||
| LogMeIn, Inc. | Application Software | ||||||||||||||||||||||||||||
| First Lien Term Loan, LIBOR+4.75% cash due 8/31/2027 | 4.91% | 4,000,000 | 3,900,591 | 3,873,760 | (6) | ||||||||||||||||||||||||
| 3,900,591 | 3,873,760 | ||||||||||||||||||||||||||||
| MHE Intermediate Holdings, LLC | Diversified Support Services | ||||||||||||||||||||||||||||
| First Lien Term Loan, LIBOR+5.00% cash due 3/8/2024 | 6.00% | 11,419,753 | 11,305,654 | 11,114,846 | (6)(15) | ||||||||||||||||||||||||
| First Lien Revolver, LIBOR+5.00% cash due 3/10/2023 | — | (228,947) | (140,296) | (6)(14)(15) | |||||||||||||||||||||||||
| First Lien Delayed Draw Term Loan, LIBOR+5.00% cash due 3/8/2024 | 6.00% | 2,325,487 | 2,351,985 | 2,263,397 | (6)(15) | ||||||||||||||||||||||||
| 13,428,692 | 13,237,947 | ||||||||||||||||||||||||||||
| Mindbody, Inc. | Internet Services & Infrastructure | ||||||||||||||||||||||||||||
| First Lien Term Loan, LIBOR+7.00% cash 1.5% PIK due 2/14/2025 | 8.00% | 9,092,898 | 8,961,003 | 8,383,652 | (6)(15) | ||||||||||||||||||||||||
| First Lien Revolver, LIBOR+8.00% cash due 2/14/2025 | — | (13,884) | (75,238) | (6)(14)(15) | |||||||||||||||||||||||||
| 8,947,119 | 8,308,414 | ||||||||||||||||||||||||||||
| Ministry Brands, LLC | Application Software | ||||||||||||||||||||||||||||
| First Lien Revolver, LIBOR+5.00% cash due 12/2/2022 | 6.00% | 57,500 | 56,639 | 56,650 | (6)(14)(15) | ||||||||||||||||||||||||
| Second Lien Term Loan, LIBOR+9.25% cash due 6/2/2023 | 10.25% | 2,000,000 | 1,985,308 | 1,982,994 | (6)(15) | ||||||||||||||||||||||||
| 2,041,947 | 2,039,644 | ||||||||||||||||||||||||||||
| MRI Software LLC | Application Software | ||||||||||||||||||||||||||||
| First Lien Term Loan, LIBOR+5.50% cash due 2/10/2026 | 6.50% | 5,968,744 | 5,918,189 | 5,824,509 | (6)(15) | ||||||||||||||||||||||||
| First Lien Delayed Draw Term Loan, LIBOR+5.50% cash due 2/10/2026 | — | (22,352) | (52,991) | (6)(14)(15) | |||||||||||||||||||||||||
| First Lien Revolver, LIBOR+5.50% cash due 2/10/2026 | — | (5,283) | (12,765) | (6)(14)(15) | |||||||||||||||||||||||||
| 5,890,554 | 5,758,753 | ||||||||||||||||||||||||||||
| NeuAG, LLC | Fertilizers & Agricultural Chemicals | ||||||||||||||||||||||||||||
| First Lien Term Loan, LIBOR+5.50% cash 7.0% PIK due 9/11/2024 | 7.00% | 8,529,688 | 8,194,410 | 8,188,501 | (6)(15) | ||||||||||||||||||||||||
| First Lien Delayed Draw Term Loan, LIBOR+5.50% cash 7.0% PIK due 9/11/2024 | (42,360) | (42,360) | (6)(14)(15) | ||||||||||||||||||||||||||
| 8,152,050 | 8,146,141 | ||||||||||||||||||||||||||||
| Northwest Fiber, LLC | Integrated Telecommunication Services | ||||||||||||||||||||||||||||
| First Lien Term Loan, LIBOR+5.50% cash due 4/30/2027 | 5.66% | 4,200,473 | 4,049,552 | 4,205,723 | (6) | ||||||||||||||||||||||||
| 4,049,552 | 4,205,723 | ||||||||||||||||||||||||||||
| OEConnection LLC | Application Software | ||||||||||||||||||||||||||||
| First Lien Term Loan, LIBOR+4.00% cash due 9/25/2026 | 4.15% | 7,920,420 | 7,881,988 | 7,831,315 | (6) | ||||||||||||||||||||||||
| First Lien Delayed Draw Term Loan, LIBOR+4.00% cash due 9/25/2026 | — | (2,227) | (5,640) | (6)(14) | |||||||||||||||||||||||||
| 7,879,761 | 7,825,675 | ||||||||||||||||||||||||||||
| Olaplex, Inc. | Personal Products | ||||||||||||||||||||||||||||
| First Lien Term Loan, LIBOR+6.50% cash due 1/8/2026 | 7.50% | 8,887,500 | 8,731,401 | 8,887,500 | (6)(15) | ||||||||||||||||||||||||
| First Lien Revolver, LIBOR+6.50% cash due 1/8/2025 | 7.50% | 486,000 | 469,401 | 486,000 | (6)(14)(15) | ||||||||||||||||||||||||
| 9,200,802 | 9,373,500 | ||||||||||||||||||||||||||||
| Onvoy, LLC | Integrated Telecommunication Services | ||||||||||||||||||||||||||||
| First Lien Term Loan, LIBOR+4.50% cash due 2/10/2024 | 5.50% | 3,821,010 | 3,811,810 | 3,668,571 | (6) | ||||||||||||||||||||||||
| 3,811,810 | 3,668,571 | ||||||||||||||||||||||||||||
85
| Portfolio Company/Type of Investment (1)(2)(9)(10)(14) | Cash Interest Rate (8) | Industry | Principal (5) | Cost | Fair Value | |||||||||||
| Poseidon Merger Sub, Inc. | Advertising | |||||||||||||||
| Second Lien Term Loan, LIBOR+8.5% (1% floor) cash due 8/15/2023 (8) | 9.81% | $ | 7,000,000 | $ | 6,980,121 | $ | 7,070,000 | |||||||||
| 6,980,121 | 7,070,000 | |||||||||||||||
| Valet Merger Sub, Inc. | Environmental & facilities services | |||||||||||||||
| First Lien Term Loan, LIBOR+7% (1% floor) cash due 9/24/2021 (8)(13) | 8.24% | 5,880,000 | 5,852,065 | 5,879,798 | ||||||||||||
| First Lien Revolver, LIBOR+7% (1% floor) cash due 9/24/2021 (8)(11) | 8.24% | — | (10,697 | ) | (29 | ) | ||||||||||
| Incremental Term Loan , LIBOR+7% (1% floor) cash due 9/24/2021 (8) | 8.24% | 8,407,683 | 8,328,663 | 8,407,394 | ||||||||||||
| 14,170,031 | 14,287,163 | |||||||||||||||
| DigiCert, Inc. | Internet software & services | |||||||||||||||
| Second Lien Term Loan, LIBOR+9% (1% floor) cash due 10/21/2022 (8)(13) | 10.24% | 2,000,000 | 1,984,880 | 2,000,000 | ||||||||||||
| First Lien Term Loan, LIBOR+4.75% (1% floor) cash due 10/21/2021 (8) | 5.99% | 11,000,000 | 10,945,000 | 11,000,000 | ||||||||||||
| 12,929,880 | 13,000,000 | |||||||||||||||
| Lytx, Inc. | Research & consulting services | |||||||||||||||
| 500 Class B Units in Lytx Holdings, LLC | — | 351,355 | ||||||||||||||
| 500 Class A Units in Lytx Holdings, LLC | 292,459 | 79,788 | ||||||||||||||
| 292,459 | 431,143 | |||||||||||||||
| 4 Over International, LLC | Commercial printing | |||||||||||||||
| First Lien Term Loan, LIBOR+6.0% (1% floor) cash due 6/7/2022 (8)(13) | 7.24% | 5,850,412 | 5,804,485 | 5,850,463 | ||||||||||||
| First Lien Revolver, LIBOR+6.0% (1% floor) cash due 6/7/2021 (8)(11) | 7.24% | (502 | ) | — | ||||||||||||
| 5,803,983 | 5,850,463 | |||||||||||||||
| Ancile Solutions, Inc. | Internet software & services | |||||||||||||||
| First Lien Term Loan, LIBOR+7% (1% floor) cash due 6/30/2021 (8)(13) | 8.33% | 9,881,312 | 9,664,392 | 9,802,707 | ||||||||||||
| 9,664,392 | 9,802,707 | |||||||||||||||
| Pomeroy Group Holdings, Inc. | IT consulting & other services | |||||||||||||||
| First Lien Term Loan, LIBOR+6% (1% floor) cash due 11/30/2021 (8)(13) | 7.59% | 4,443,467 | 4,339,309 | 4,443,467 | ||||||||||||
| 4,339,309 | 4,443,467 | |||||||||||||||
| Sailpoint Technologies, Inc. | Application software | |||||||||||||||
| First Lien Term Loan, LIBOR+7% (1% floor) cash due 8/16/2021 (8) | 8.33% | 17,391,304 | 17,070,160 | 17,391,307 | ||||||||||||
| First Lien Revolver, LIBOR+7% (1% floor) cash due 8/16/2021 (8)(11) | 8.33% | (3,067 | ) | — | ||||||||||||
| 17,067,093 | 17,391,307 | |||||||||||||||
| Curvature, Inc. | IT consulting & other services | |||||||||||||||
| First Lien Term Loan B, LIBOR+5% (1% floor) cash due 10/30/2023 (8)(13) | 6.24% | 9,925,000 | 9,871,624 | 9,701,688 | ||||||||||||
| 9,871,624 | 9,701,688 | |||||||||||||||
| Cardenas Markets LLC | Food retail | |||||||||||||||
| First Lien Term Loan, LIBOR+5.75% (1% floor) cash due 11/29/2023 (8)(13) | 7.08% | 3,275,250 | 3,246,405 | 3,254,780 | ||||||||||||
| 3,246,405 | 3,254,780 | |||||||||||||||
Oaktree Strategic Income Corporation
Consolidated Schedule of Investments
September 30, 20172020
| Portfolio Company/Type of Investment (1)(2)(3)(4)(5) | Cash Interest Rate (6) | Industry | Principal (7) | Cost | Fair Value | Notes | |||||||||||||||||||||||
| PaySimple, Inc. | Data Processing & Outsourced Services | ||||||||||||||||||||||||||||
| First Lien Term Loan, LIBOR+5.50% cash due 8/23/2025 | 5.65% | $ | 9,906,964 | $ | 9,742,150 | $ | 9,560,221 | (6)(15) | |||||||||||||||||||||
| 9,742,150 | 9,560,221 | ||||||||||||||||||||||||||||
| Peraton Corp. | Aerospace & Defense | ||||||||||||||||||||||||||||
| First Lien Term Loan, LIBOR+5.25% cash due 4/29/2024 | 6.25% | 6,288,750 | 6,272,774 | 6,241,584 | (6)(15) | ||||||||||||||||||||||||
| 6,272,774 | 6,241,584 | ||||||||||||||||||||||||||||
| PG&E Corporation | Electric Utilities | ||||||||||||||||||||||||||||
| First Lien Term Loan, LIBOR+4.50% cash due 6/23/2025 | 5.50% | 1,995,000 | 1,966,495 | 1,958,422 | (6) | ||||||||||||||||||||||||
| 1,966,495 | 1,958,422 | ||||||||||||||||||||||||||||
| ProFrac Services, LLC | Industrial Machinery | ||||||||||||||||||||||||||||
| First Lien Term Loan, LIBOR+7.50% cash due 9/15/2023 | 8.75% | 8,289,847 | 8,240,727 | 6,362,458 | (6)(15) | ||||||||||||||||||||||||
| 8,240,727 | 6,362,458 | ||||||||||||||||||||||||||||
| Project Boost Purchaser, LLC | Application Software | ||||||||||||||||||||||||||||
| Second Lien Term Loan, LIBOR+8.00% cash due 5/9/2027 | 8.15% | 1,500,000 | 1,500,000 | 1,350,000 | (6)(15) | ||||||||||||||||||||||||
| 1,500,000 | 1,350,000 | ||||||||||||||||||||||||||||
| Pug LLC | Internet & Direct Marketing Retail | ||||||||||||||||||||||||||||
| First Lien Term Loan, LIBOR+8.00% cash due 2/12/2027 | 8.75% | 5,704,000 | 5,363,954 | 5,547,140 | (6) | ||||||||||||||||||||||||
| 5,363,954 | 5,547,140 | ||||||||||||||||||||||||||||
| Recorded Books Inc. | Publishing | ||||||||||||||||||||||||||||
| First Lien Term Loan, LIBOR+4.00% cash due 8/29/2025 | 4.16% | 9,757,714 | 9,660,137 | 9,708,926 | (6) | ||||||||||||||||||||||||
| 9,660,137 | 9,708,926 | ||||||||||||||||||||||||||||
| RevSpring, Inc. | Commercial Printing | ||||||||||||||||||||||||||||
| First Lien Term Loan, LIBOR+4.25% cash due 10/11/2025 | 4.47% | 9,825,000 | 9,807,175 | 9,628,500 | (6)(15) | ||||||||||||||||||||||||
| 9,807,175 | 9,628,500 | ||||||||||||||||||||||||||||
| Sabert Corporation | Metal & Glass Containers | ||||||||||||||||||||||||||||
| First Lien Term Loan, LIBOR+4.50% cash due 12/10/2026 | 5.50% | 1,885,500 | 1,866,645 | 1,860,366 | (6) | ||||||||||||||||||||||||
| 1,866,645 | 1,860,366 | ||||||||||||||||||||||||||||
| Salient CRGT, Inc. | Aerospace & Defense | ||||||||||||||||||||||||||||
| First Lien Term Loan, LIBOR+6.50% cash due 2/28/2022 | 7.50% | 5,488,244 | 5,457,684 | 5,104,067 | (6)(15) | ||||||||||||||||||||||||
| 5,457,684 | 5,104,067 | ||||||||||||||||||||||||||||
| Signify Health, LLC | Health Care Services | ||||||||||||||||||||||||||||
| First Lien Term Loan, LIBOR+4.50% cash due 12/23/2024 | 5.50% | 10,725,000 | 10,658,741 | 10,349,625 | (6) | ||||||||||||||||||||||||
| 10,658,741 | 10,349,625 | ||||||||||||||||||||||||||||
| Sirva Worldwide, Inc. | Diversified Support Services | ||||||||||||||||||||||||||||
| First Lien Term Loan, LIBOR+5.50% cash due 8/4/2025 | 5.65% | 7,650,000 | 7,535,250 | 6,387,750 | (6) | ||||||||||||||||||||||||
| 7,535,250 | 6,387,750 | ||||||||||||||||||||||||||||
| Star US Bidco LLC | Industrial Machinery | ||||||||||||||||||||||||||||
| First Lien Term Loan, LIBOR+4.25% cash due 3/17/2027 | 5.25% | 5,826,911 | 5,529,350 | 5,564,700 | (6) | ||||||||||||||||||||||||
| 5,529,350 | 5,564,700 | ||||||||||||||||||||||||||||
| Supermoose Borrower, LLC | Application Software | ||||||||||||||||||||||||||||
| First Lien Term Loan, LIBOR+3.75% cash due 8/29/2025 | 3.90% | 1,483,087 | 1,401,939 | 1,337,099 | (6) | ||||||||||||||||||||||||
| 1,401,939 | 1,337,099 | ||||||||||||||||||||||||||||
| Trident Topco LLC | Health Care Services | ||||||||||||||||||||||||||||
| 58.99 Class A Warrants (exercise price $156.164) expiration date 3/20/2021 | — | — | (15) | ||||||||||||||||||||||||||
| — | — | ||||||||||||||||||||||||||||
| Truck Hero, Inc. | Auto Parts & Equipment | ||||||||||||||||||||||||||||
| First Lien Term Loan, LIBOR+3.75% cash due 4/22/2024 | 3.90% | 5,681,160 | 5,688,828 | 5,520,667 | (6) | ||||||||||||||||||||||||
| 5,688,828 | 5,520,667 | ||||||||||||||||||||||||||||
| UFC Holdings, LLC | Movies & Entertainment | ||||||||||||||||||||||||||||
| First Lien Term Loan, LIBOR+3.25% cash due 4/29/2026 | 4.25% | 2,887,362 | 2,819,945 | 2,844,961 | (6) | ||||||||||||||||||||||||
| 2,819,945 | 2,844,961 | ||||||||||||||||||||||||||||
86
| Portfolio Company/Type of Investment (1)(2)(9)(10)(14) | Cash Interest Rate (8) | Industry | Principal (5) | Cost | Fair Value | |||||||||||
| Ministry Brands, LLC | Internet software & services | |||||||||||||||
| First Lien Term Loan, LIBOR+5% (1% floor) cash due 12/2/2022 (8)(13) | 6.24% | $ | 9,648,871 | $ | 9,565,812 | $ | 9,648,874 | |||||||||
| First Lien Delayed Draw Term Loan, LIBOR+5% (1% floor) cash due 12/2/2022 (8)(13) | 6.24% | 3,354,904 | 3,314,185 | 3,354,905 | ||||||||||||
| Second Lien Term Loan, LIBOR+9.25% (1% floor) cash due 6/2/2023 (8)(13) | 10.49% | 1,568,067 | 1,547,561 | 1,568,067 | ||||||||||||
| Second Lien Delayed Draw Term Loan, LIBOR+9.25% (1% floor) cash due 6/2/2023 (8) | 10.49% | 431,933 | 426,285 | 431,933 | ||||||||||||
| First Lien Revolver, LIBOR+5% (1% floor) cash due 12/2/2022 (8)(11) | 6.24% | (861 | ) | — | ||||||||||||
| 14,852,982 | 15,003,779 | |||||||||||||||
| Impact Sales, LLC | Advertising | |||||||||||||||
| First Lien Term Loan B, LIBOR+7% (1% floor) cash due 12/30/2021 (8) | 8.30% | 3,721,875 | 3,628,868 | 3,715,131 | ||||||||||||
| First Lien Delayed Draw Term Loan, LIBOR+7% (1% floor) cash due 12/30/2021 (8) | 8.30% | 171,016 | 171,016 | 168,751 | ||||||||||||
| 3,799,884 | 3,883,882 | |||||||||||||||
| Empower Payments Acquisition, Inc. | Commercial printing | |||||||||||||||
| First Lien Term Loan B, LIBOR+5.5% (1% floor) cash due 11/30/2023 (8)(13) | 6.83% | 6,153,500 | 6,043,807 | 6,091,669 | ||||||||||||
| 6,043,807 | 6,091,669 | |||||||||||||||
| First American Payment Systems, L.P. | Diversified support services | |||||||||||||||
| First Lien Term Loan B, LIBOR+5.75% (1% floor) cash due 1/8/2024 (8)(13) | 6.98% | 4,143,750 | 4,106,872 | 4,131,319 | ||||||||||||
| 4,106,872 | 4,131,319 | |||||||||||||||
| DFT Intermediate LLC | Specialized finance | |||||||||||||||
| First Lien Term Loan, LIBOR+5.5% (1% floor) cash due 3/1/2023 (8)(13) | 6.74% | 14,962,500 | 14,624,842 | 14,864,020 | ||||||||||||
| First Lien Revolver, LIBOR+5.5% (1% floor) cash due 3/1/2022 (8) | 6.74% | 750,000 | 733,438 | 745,064 | ||||||||||||
| 15,358,280 | 15,609,084 | |||||||||||||||
| Systems, Inc. | Industrial machinery | |||||||||||||||
| First Lien Term Loan, LIBOR+5.25% (1% floor) cash due 3/3/2022 (8)(13) | 6.57% | 8,831,921 | 8,715,152 | 8,787,762 | ||||||||||||
| First Lien Revolver, LIBOR+5.5% (1% floor) cash due 3/3/2022 (8)(11) | 6.57% | (7,950 | ) | (7,920 | ) | |||||||||||
| 8,707,202 | 8,779,842 | |||||||||||||||
| Onvoy, LLC | Integrated telecommunication services | |||||||||||||||
| First Lien Term Loan, LIBOR+4.5% (1% floor) cash due 2/10/2024 (8)(13) | 5.83% | 7,960,000 | 7,923,563 | 7,962,507 | ||||||||||||
| 7,923,563 | 7,962,507 | |||||||||||||||
| Salient CRGT, Inc. | IT consulting & other services | |||||||||||||||
| First Lien Term Loan, LIBOR+5.75% (1% floor) cash due 2/28/2022 (8)(13) | 6.99% | 6,387,798 | 6,275,056 | 6,343,083 | ||||||||||||
| 6,275,056 | 6,343,083 | |||||||||||||||
| MHE Intermediate Holdings, LLC | Diversified support services | |||||||||||||||
| First Lien Term Loan B, LIBOR+5% (1% floor) cash due 3/11/2024 (8)(13) | 6.33% | 11,774,771 | 11,556,138 | 11,774,776 | ||||||||||||
| First Lien Revolver, LIBOR+5% (1% floor) cash due 3/10/2023 (8) | 6.33% | 1,353,038 | 1,255,454 | 1,353,038 | ||||||||||||
| Delayed Draw Term Loan, LIBOR+5% (1% floor) cash due 3/11/2024 (8) | 6.33% | 1,873,430 | 1,782,689 | 1,873,430 | ||||||||||||
| 14,594,281 | 15,001,244 | |||||||||||||||
Oaktree Strategic Income Corporation
Consolidated Schedule of Investments
September 30, 20172020
| Portfolio Company/Type of Investment (1)(2)(3)(4)(5) | Cash Interest Rate (6) | Industry | Principal (7) | Cost | Fair Value | Notes | |||||||||||||||||||||||
| Uniti Group Inc. | Specialized REITs | ||||||||||||||||||||||||||||
| 40,052 Shares of Common Stock | $ | 253,529 | $ | 421,948 | (9)(17) | ||||||||||||||||||||||||
| 253,529 | 421,948 | ||||||||||||||||||||||||||||
| Veritas US Inc. | Application Software | ||||||||||||||||||||||||||||
| First Lien Term Loan, LIBOR+5.50% cash due 9/1/2025 | 6.50% | $ | 6,000,000 | 5,880,994 | 5,885,010 | (6) | |||||||||||||||||||||||
| 5,880,994 | 5,885,010 | ||||||||||||||||||||||||||||
| Verscend Holding Corp. | Health Care Technology | ||||||||||||||||||||||||||||
| First Lien Term Loan, LIBOR+4.50% cash due 8/27/2025 | 4.65% | 11,830,827 | 11,732,318 | 11,752,447 | (6) | ||||||||||||||||||||||||
| 11,732,318 | 11,752,447 | ||||||||||||||||||||||||||||
| William Morris Endeavor Entertainment, LLC | Movies & Entertainment | ||||||||||||||||||||||||||||
| First Lien Term Loan, LIBOR+8.50% cash due 5/18/2025 | 9.50% | 8,371,098 | 7,942,825 | 8,371,098 | (6)(15) | ||||||||||||||||||||||||
| 7,942,825 | 8,371,098 | ||||||||||||||||||||||||||||
| Windstream Services II, LLC | Integrated Telecommunication Services | ||||||||||||||||||||||||||||
| First Lien Term Loan, LIBOR+6.25% cash due 9/21/2027 | 7.25% | 5,985,000 | 5,746,163 | 5,807,964 | (6) | ||||||||||||||||||||||||
| 11,903 Shares of Common Stock in Windstream Holdings II, LLC | 102,837 | 134,504 | (15) | ||||||||||||||||||||||||||
| 72,205 Warrants in Windstream Holdings II, LLC | 1,785,324 | 793,624 | (15) | ||||||||||||||||||||||||||
| 7,634,324 | 6,736,092 | ||||||||||||||||||||||||||||
| WP CPP Holdings, LLC | Aerospace & Defense | ||||||||||||||||||||||||||||
| First Lien Term Loan, LIBOR+3.50% cash due 4/30/2025 | 4.50% | 4,411,964 | 4,404,415 | 3,886,941 | (6) | ||||||||||||||||||||||||
| Second Lien Term Loan, LIBOR+7.75% cash due 4/30/2026 | 8.75% | 1,000,000 | 992,746 | 780,000 | (6)(15) | ||||||||||||||||||||||||
| 5,397,161 | 4,666,941 | ||||||||||||||||||||||||||||
| Zep Inc. | Specialty Chemicals | ||||||||||||||||||||||||||||
| First Lien Term Loan, LIBOR+4.00% cash due 8/12/2024 | 5.00% | 4,607,500 | 4,632,209 | 4,349,779 | (6) | ||||||||||||||||||||||||
| 4,632,209 | 4,349,779 | ||||||||||||||||||||||||||||
| Total Non-Control/Non-Affiliate Investments (169.8% of net assets) | $ | 466,907,805 | $ | 452,883,464 | |||||||||||||||||||||||||
| Total Portfolio Investments (188.3% of net assets) | $ | 539,065,107 | $ | 502,293,365 | |||||||||||||||||||||||||
| Cash and Cash Equivalents and Restricted Cash | |||||||||||||||||||||||||||||
| JP Morgan Prime Money Market Fund, Institutional Shares | $ | 7,052,674 | $ | 7,052,674 | |||||||||||||||||||||||||
| Other cash accounts | 22,447,753 | 22,447,753 | |||||||||||||||||||||||||||
| Cash and Cash Equivalents and Restricted Cash (11.1% of net assets) | $ | 29,500,427 | $ | 29,500,427 | |||||||||||||||||||||||||
| Total Portfolio Investments, Cash and Cash Equivalents and Restricted Cash (199.4% of net assets) | $ | 568,565,534 | $ | 531,793,792 | |||||||||||||||||||||||||
| Derivatives Instrument | Notional Amount Purchased / (Sold) in U.S. Dollars | Notional Amount Purchased / (Sold) in Local Currency | Maturity Date | Counterparty | Cumulative Unrealized Appreciation (Depreciation) | |||||||||||||||||||||||||||
| Foreign currency forward contract | $ | 529,015 | € | (465,600) | 11/12/2020 | JPMorgan Chase Bank, N.A. | $ | (17,450) | ||||||||||||||||||||||||
| Foreign currency forward contract | $ | 4,613,133 | £ | (3,654,546) | 11/12/2020 | JPMorgan Chase Bank, N.A. | $ | (112,486) | ||||||||||||||||||||||||
| $ | (129,936) | |||||||||||||||||||||||||||||||
(1)All debt investments are income producing unless otherwise noted. All equity investments are non-income producing unless otherwise noted.
| Portfolio Company/Type of Investment (1)(2)(9)(10)(14) | Cash Interest Rate (8) | Industry | Principal (5) | Cost | Fair Value | |||||||||||
| Paris Presents Incorporated | Personal Products | |||||||||||||||
| First Lien Term Loan B, LIBOR+5% (1% floor) cash due 12/31/2020 (8)(13) | 6.24% | $ | 3,134,006 | $ | 3,106,950 | $ | 3,134,006 | |||||||||
| Second Lien Term Loan, LIBOR+8.75% (1% floor) cash due 12/31/2021 (8)(13) | 9.99% | 3,500,000 | 3,437,500 | 3,465,000 | ||||||||||||
| 6,544,450 | 6,599,006 | |||||||||||||||
| PSI Services LLC | Human Resource & Employment Services | |||||||||||||||
| First Lien Term Loan B, LIBOR+5% (1% floor) cash due 1/20/2023 (8)(13) | 6.24% | 6,736,979 | 6,644,622 | 6,616,844 | ||||||||||||
| 6,644,622 | 6,616,844 | |||||||||||||||
| MHVC Acquisition Corp. | Aerospace & Defense | |||||||||||||||
| First Lien Term Loan B, LIBOR+5.25% (1% floor) cash due 4/25/2024 (8)(13) | 6.49% | 6,483,750 | 6,453,287 | 6,556,692 | ||||||||||||
| 6,453,287 | 6,556,692 | |||||||||||||||
| LSF9 Atlantis Holdings, LLC | Computer & Electronics Retail | |||||||||||||||
| First Lien Term Loan B, LIBOR+6% (1% floor) cash due 5/1/2023 (8)(13) | 7.24% | 7,453,125 | 7,383,862 | 7,498,142 | ||||||||||||
| 7,383,862 | 7,498,142 | |||||||||||||||
| Everi Payments Inc. | Casinos & gaming | |||||||||||||||
| First Lien Term Loan B, LIBOR+4.5% (1% floor) cash due 5/9/2024 (8)(13)(16) | 5.74% | 4,987,500 | 4,963,767 | 5,038,622 | ||||||||||||
| 4,963,767 | 5,038,622 | |||||||||||||||
| BJ's Wholesale Club, Inc. | Hypermarkets & super centers | |||||||||||||||
| First Lien Term Loan B, LIBOR+3.75% (1% floor) cash due 1/26/2024 (8)(16) | 4.98% | 2,992,500 | 2,996,051 | 2,876,002 | ||||||||||||
| 2,996,051 | 2,876,002 | |||||||||||||||
| Bass Pro Group, LLC | Specialty Stores | |||||||||||||||
| First Lien Term Loan B, LIBOR+5% (1% floor) cash due 12/15/2023 (8) | 6.24% | 6,000,000 | 5,877,353 | 5,667,480 | ||||||||||||
| 5,877,353 | 5,667,480 | |||||||||||||||
| Imagine! Print Solutions, LLC | Advertising | |||||||||||||||
| First Lien Term Loan B, LIBOR+4.75% (1% floor) cash due 6/21/2022 (8) | 6.09% | 6,965,000 | 6,898,900 | 6,999,825 | ||||||||||||
| 6,898,900 | 6,999,825 | |||||||||||||||
| MND Holdings III Corp. | Specialty Stores | |||||||||||||||
| First Lien Term Loan B, LIBOR+4.5% (1% floor) cash due 6/19/2024 (8)(13) | 5.83% | 2,493,750 | 2,481,733 | 2,526,480 | ||||||||||||
| 2,481,733 | 2,526,480 | |||||||||||||||
| Veritas US Inc. | Internet software & services | |||||||||||||||
| First Lien Term Loan B, LIBOR+4.5% (1% floor) cash due 1/27/2023 (8)(16) | 5.83% | 10,077,193 | 10,215,779 | 10,189,503 | ||||||||||||
| 10,215,779 | 10,189,503 | |||||||||||||||
| UOS, LLC | Trucking | |||||||||||||||
| First Lien Term Loan B, LIBOR+5.5% (1% floor) cash due 4/18/2023 (8) | 6.74% | 3,990,000 | 4,079,548 | 4,099,725 | ||||||||||||
| 4,079,548 | 4,099,725 | |||||||||||||||
| Accudyne Industries, LLC | Oil & gas equipment & services | |||||||||||||||
| First Lien Term Loan, LIBOR+3.75% (1% floor) cash due 8/18/2024 (8)(16) | 5.01% | 14,000,000 | 14,057,018 | 14,052,500 | ||||||||||||
| 14,057,018 | 14,052,500 | |||||||||||||||
(2)See notesNote 3 to the Consolidated Financial Statements.Statements for portfolio composition by geographic region.
(3)Interest rates may be adjusted from period to period on certain term loans and revolvers. These rate adjustments may be either temporary in nature due to tier pricing arrangements or financial or payment covenant violations in the original credit agreements or permanent in nature per loan amendment or waiver documents.
(4)Each of the Company's investments is pledged as collateral under one or more of its credit facilities. A single investment may be divided into parts that are individually pledged as collateral to separate credit facilities.
(5)Equity ownership may be held in shares or units of companies related to the portfolio companies.
(6)The interest rate on the principal balance outstanding for all floating rate loans is indexed to the London Interbank Offered Rate ("LIBOR") and/or an alternate base rate (e.g., prime rate), which typically resets semi-annually, quarterly, or monthly at the borrower's option. The borrower may also elect to have multiple interest reset periods for each loan. For each of these loans, the Company has provided the applicable margin over LIBOR or the alternate base rate based on each respective credit agreement and the cash interest rate as of period end. All LIBOR shown above is
87
Oaktree Strategic Income Corporation
Consolidated Schedule of Investments
September 30, 20172020
in U.S. dollars unless otherwise noted. As of September 30, 2020, the reference rates for the Company's variable rate loans were the 30-day LIBOR at 0.15%, the 60-day LIBOR at 0.19%, the 90-day LIBOR at 0.22%, the 180-day LIBOR at 0.27%, the 360-day LIBOR at 0.37%, the PRIME at 3.25%, the 180-day UK LIBOR at 0.22% and the 180-day EURIBOR at (0.36)%. Most loans include an interest floor, which generally ranges from 0% to 1%.
(7)Principal includes accumulated payment in kind ("PIK") interest and is net of repayments, if any. “£” signifies the investment is denominated in British Pounds. "€" signifies the investment is denominated in Euros. All other investments are denominated in U.S. dollars.
| Portfolio Company/Type of Investment (1)(2)(9)(10)(14) | Cash Interest Rate (8) | Industry | Principal (5) | Cost | Fair Value | |||||||||||
| DTZ U.S. Borrower, LLC | Real Estate Services | |||||||||||||||
| First Lien Term Loan, LIBOR+3.25% (1% floor) cash due 11/4/2021 (8)(16) | 4.57% | $ | 12,211,343 | $ | 12,247,424 | $ | 12,256,098 | |||||||||
| 12,247,424 | 12,256,098 | |||||||||||||||
| Truck Hero, Inc. | Auto parts & equipment | |||||||||||||||
| First Lien Term Loan, LIBOR+4% (1% floor) cash due 4/22/2024 (8) | 5.33% | 5,857,320 | 5,871,777 | 5,798,747 | ||||||||||||
| 5,871,777 | 5,798,747 | |||||||||||||||
| Alphabet Holding Company, Inc. | Healthcare distributors | |||||||||||||||
| First Lien Term Loan, LIBOR+3.5% (1% floor) cash due 9/26/2024 (8) | 4.83% | 5,000,000 | 4,975,000 | 4,948,950 | ||||||||||||
| 4,975,000 | 4,948,950 | |||||||||||||||
| McAfee, LLC | Internet software & services | |||||||||||||||
| First Lien Term Loan, LIBOR+4.5% (1% floor) cash due 9/30/2024 (8) | 5.83% | 7,000,000 | 6,930,000 | 7,072,905 | ||||||||||||
| 6,930,000 | 7,072,905 | |||||||||||||||
| Total Non-Control/Non-Affiliate Investments (170.9% of net assets) | $ | 516,270,639 | $ | 501,894,073 | ||||||||||||
| Total Portfolio Investments (190.9% of net assets) | $ | 605,090,324 | $ | 560,436,660 | ||||||||||||
| Cash and Cash Equivalents | ||||||||||||||||
| Wells Fargo Bank Institutional Money Market Fund | $ | 32,214,184 | $ | 32,214,184 | ||||||||||||
| JP Morgan Prime Money Market Fund | 3,118,675 | 3,118,675 | ||||||||||||||
| Other cash accounts | 271,268 | 271,268 | ||||||||||||||
| Total Cash and Cash Equivalents (12.1% of net assets) | $ | 35,604,127 | $ | 35,604,127 | ||||||||||||
| Total Portfolio Investments, Cash and Cash Equivalents (203.0% of net assets) | $ | 640,694,451 | $ | 596,040,787 | ||||||||||||
(9)Investment is not a "qualifying asset" as defined under Section 55(a) of the Investment Company Act. Under the Investment Company Act, the Company may not acquire any non-qualifying asset unless, at the time the acquisition is made, qualifying assets represent at least 70% of the Company's total assets. As of September 30, 2020, qualifying assets represented 83.1% of the Company's total assets and non-qualifying assets represented 16.9% of the Company's total assets.
(10)As defined in the Investment Company Act, the Company is deemed to be both an "Affiliated Person" of and to "Control" this portfolio company as the Company owns more than 25% of the portfolio company's outstanding voting securities or has the power to exercise control over management or policies of such portfolio company (including through a management agreement). See Schedule 12-14 in the accompanying notes to the Consolidated Financial Statements for transactions during the year ended September 30, 2020 in which the issuer was both an Affiliated Person and a portfolio company that the Company is deemed to control.
(11)See Note 3 to the Consolidated Financial Statements for portfolio composition.
(12)This investment was valued using net asset value as a practical expedient for fair value. Consistent with Financial Accounting Standards Board ("FASB") guidance under Accounting Standards Codification ("ASC") Topic 820, Fair Value Measurements and Disclosure ("ASC 820"), these investments are excluded from the hierarchical levels.
(13)Non-Control/Non-Affiliate Investments are investments that are neither Control Investments nor Affiliate Investments. Affiliate Investments generally are defined by the Investment Company Act as investments in companies in which the Company owns between 5% and 25% of the voting securities.
(14)Investment has undrawn commitments. Unamortized fees are classified as unearned income which reduces cost basis, which may result in a negative cost basis. A negative fair value may result from the unfunded commitment being valued below par.
(15)As of September 30, 2020, these investments are categorized as Level 3 within the fair value hierarchy established by ASC 820.
(16)This investment was on cash non-accrual status as of September 30, 2020. Cash non-accrual is inclusive of PIK and other non-cash income, where applicable.
(17) Income producing through payment of dividends or distributions.
(18) The sale of all or a portion of this investment did not qualify for sale accounting under FASB ASC Topic 860, Transfers and Servicing ("ASC 860"), and therefore the investment remains on the Company's Consolidated Schedule of Investments as of September 30, 2020. See Note 6 in the Consolidated Financial Statements for further details.
See notes to Consolidated Financial Statements.
88
Oaktree Strategic Income Corporation
Consolidated Schedule of Investments
September 30, 2017
2019
| Portfolio Company/Type of Investment (1)(2)(3)(4)(5) | Cash Interest Rate (6) | Industry | Principal (7) | Cost | Fair Value | Notes | |||||||||||||||||||||||
| Control Investments | (8) | ||||||||||||||||||||||||||||
| OCSI Glick JV LLC | Multi-sector holdings | (10)(11) | |||||||||||||||||||||||||||
| Subordinated Note, LIBOR+6.50% cash due 10/20/2021 | 8.89% | $ | 66,077,912 | $ | 66,077,913 | $ | 54,326,418 | (6)(9)(14)(15) | |||||||||||||||||||||
| 87.5% equity interest | 7,111,751 | — | (9)(12)(14) | ||||||||||||||||||||||||||
| 73,189,664 | 54,326,418 | ||||||||||||||||||||||||||||
| Total Control Investments (19.1% of net assets) | $ | 73,189,664 | $ | 54,326,418 | |||||||||||||||||||||||||
| Non-Control/Non-Affiliate Investments | (13) | ||||||||||||||||||||||||||||
| 4 Over International, LLC | Commercial printing | ||||||||||||||||||||||||||||
| First Lien Term Loan, LIBOR+6.00% cash due 6/7/2022 | 8.04% | $ | 5,612,060 | $ | 5,547,000 | $ | 5,504,869 | (6)(15) | |||||||||||||||||||||
| First Lien Revolver, PRIME+5.00% cash due 6/7/2021 | 10.00% | 7,823 | 7,321 | 6,516 | (6)(14)(15) | ||||||||||||||||||||||||
| 5,554,321 | 5,511,385 | ||||||||||||||||||||||||||||
| 99 Cents Only Stores LLC | General merchandise stores | ||||||||||||||||||||||||||||
| First Lien Term Loan, LIBOR+5.00% cash 1.50% PIK due 1/13/2022 | 7.10% | 1,626,953 | 1,549,641 | 1,425,618 | (6) | ||||||||||||||||||||||||
| 1,549,641 | 1,425,618 | ||||||||||||||||||||||||||||
| Access CIG, LLC | Diversified support services | ||||||||||||||||||||||||||||
| First Lien Term Loan, LIBOR+3.75% cash due 2/27/2025 | 6.07% | 5,462,360 | 5,417,080 | 5,404,350 | (6) | ||||||||||||||||||||||||
| 5,417,080 | 5,404,350 | ||||||||||||||||||||||||||||
| AI Ladder (Luxembourg) Subco S.a.r.l. | Electrical components & equipment | ||||||||||||||||||||||||||||
| First Lien Term Loan, LIBOR+4.50% cash due 7/9/2025 | 6.60% | 6,525,584 | 6,363,049 | 6,009,639 | (6)(9) | ||||||||||||||||||||||||
| 6,363,049 | 6,009,639 | ||||||||||||||||||||||||||||
| Air Medical Group Holdings, Inc. | Healthcare services | ||||||||||||||||||||||||||||
| First Lien Term Loan, LIBOR+4.25% cash due 3/14/2025 | 6.29% | 2,488,670 | 2,437,830 | 2,337,272 | (6) | ||||||||||||||||||||||||
| 2,437,830 | 2,337,272 | ||||||||||||||||||||||||||||
| Airxcel, Inc. | Household appliances | ||||||||||||||||||||||||||||
| First Lien Term Loan, LIBOR+4.50% cash due 4/28/2025 | 6.54% | 6,912,500 | 6,857,242 | 6,661,922 | (6) | ||||||||||||||||||||||||
| 6,857,242 | 6,661,922 | ||||||||||||||||||||||||||||
| AL Midcoast Holdings LLC | Oil & gas storage & transportation | ||||||||||||||||||||||||||||
| First Lien Term Loan, LIBOR+5.50% cash due 8/1/2025 | 7.60% | 564,300 | 558,657 | 556,541 | (6) | ||||||||||||||||||||||||
| 558,657 | 556,541 | ||||||||||||||||||||||||||||
| Aldevron, L.L.C. | Biotechnology | ||||||||||||||||||||||||||||
| First Lien Term Loan, LIBOR+4.25% cash due 9/20/2026 | 6.36% | 4,000,000 | 3,960,000 | 4,020,000 | (6) | ||||||||||||||||||||||||
| 3,960,000 | 4,020,000 | ||||||||||||||||||||||||||||
| All Web Leads, Inc. | Advertising | ||||||||||||||||||||||||||||
| First Lien Term Loan, LIBOR+7.50% cash due 12/29/2020 | 9.62% | 24,102,647 | 24,102,621 | 20,960,795 | (6)(15) | ||||||||||||||||||||||||
| 24,102,621 | 20,960,795 | ||||||||||||||||||||||||||||
| Allen Media, LLC | Movies & entertainment | ||||||||||||||||||||||||||||
| First Lien Term Loan, LIBOR+6.50% cash due 8/30/2023 | 8.60% | 4,809,488 | 4,714,403 | 4,653,180 | (6)(15) | ||||||||||||||||||||||||
| 4,714,403 | 4,653,180 | ||||||||||||||||||||||||||||
| Ancile Solutions, Inc. | Application software | ||||||||||||||||||||||||||||
| First Lien Term Loan, LIBOR+7.00% cash due 6/30/2021 | 9.10% | 8,299,803 | 8,184,777 | 8,133,807 | (6)(15) | ||||||||||||||||||||||||
| 8,184,777 | 8,133,807 | ||||||||||||||||||||||||||||
| Apptio, Inc. | Application software | ||||||||||||||||||||||||||||
| First Lien Term Loan, LIBOR+7.25% cash due 1/10/2025 | 9.56% | 10,693,944 | 10,502,939 | 10,496,106 | (6)(15) | ||||||||||||||||||||||||
| First Lien Revolver, LIBOR+7.25% cash due 1/10/2025 | — | (12,179) | (12,808) | (6)(14)(15) | |||||||||||||||||||||||||
| 10,490,760 | 10,483,298 | ||||||||||||||||||||||||||||
89
Oaktree Strategic Income Corporation
Consolidated Schedule of Investments
September 30, 20162019
| Portfolio Company/Type of Investment (1)(2)(3)(4)(5) | Cash Interest Rate (6) | Industry | Principal (7) | Cost | Fair Value | Notes | |||||||||||||||||||||||
| Aptos, Inc. | Computer & electronics retail | ||||||||||||||||||||||||||||
| First Lien Term Loan, LIBOR+5.50% cash due 7/23/2025 | 7.70% | $ | 10,917,500 | $ | 10,808,325 | $ | 10,781,031 | (6)(15) | |||||||||||||||||||||
| 10,808,325 | 10,781,031 | ||||||||||||||||||||||||||||
| Avaya, Inc. | Communications equipment | ||||||||||||||||||||||||||||
| First Lien Term Loan, LIBOR+4.25% cash due 12/15/2024 | 6.28% | 9,825,000 | 9,740,555 | 9,361,407 | (6) | ||||||||||||||||||||||||
| 9,740,555 | 9,361,407 | ||||||||||||||||||||||||||||
| Ball Metalpack Finco, LLC | Metal & glass containers | ||||||||||||||||||||||||||||
| First Lien Term Loan, LIBOR+4.50% cash due 7/31/2025 | 6.62% | 8,887,500 | 8,850,147 | 8,387,578 | (6)(15) | ||||||||||||||||||||||||
| 8,850,147 | 8,387,578 | ||||||||||||||||||||||||||||
| Blackhawk Network Holdings, Inc. | Data processing & outsourced services | ||||||||||||||||||||||||||||
| Second Lien Term Loan, LIBOR+7.00% cash due 6/15/2026 | 9.06% | 4,375,000 | 4,335,578 | 4,380,491 | (6) | ||||||||||||||||||||||||
| 4,335,578 | 4,380,491 | ||||||||||||||||||||||||||||
| Boxer Parent Company Inc. | Systems software | ||||||||||||||||||||||||||||
| First Lien Term Loan, LIBOR+4.25% cash due 10/2/2025 | 6.29% | 6,118,763 | 6,051,218 | 5,899,007 | (6) | ||||||||||||||||||||||||
| 6,051,218 | 5,899,007 | ||||||||||||||||||||||||||||
| Cadence Aerospace LLC | Aerospace & defense | ||||||||||||||||||||||||||||
| First Lien Term Loan, LIBOR+6.50% cash due 11/14/2023 | 8.54% | 13,514,012 | 13,406,773 | 13,277,761 | (6)(15) | ||||||||||||||||||||||||
| 13,406,773 | 13,277,761 | ||||||||||||||||||||||||||||
| Canyon Buyer, Inc. | Application software | ||||||||||||||||||||||||||||
| First Lien Term Loan, LIBOR+4.25% cash due 2/15/2025 | 6.36% | 8,931,990 | 8,834,396 | 8,887,330 | (6) | ||||||||||||||||||||||||
| 8,834,396 | 8,887,330 | ||||||||||||||||||||||||||||
| Cast & Crew Payroll, LLC | Application software | ||||||||||||||||||||||||||||
| First Lien Term Loan, LIBOR+4.00% cash due 2/9/2026 | 6.05% | 4,975,000 | 4,925,250 | 5,018,531 | (6) | ||||||||||||||||||||||||
| 4,925,250 | 5,018,531 | ||||||||||||||||||||||||||||
| Cincinnati Bell Inc. | Integrated telecommunication services | ||||||||||||||||||||||||||||
| First Lien Term Loan, LIBOR+3.25% cash due 10/2/2024 | 5.29% | 4,893,420 | 4,879,432 | 4,888,649 | (6)(9) | ||||||||||||||||||||||||
| 4,879,432 | 4,888,649 | ||||||||||||||||||||||||||||
| CircusTrix Holdings LLC | Leisure facilities | ||||||||||||||||||||||||||||
| First Lien Term Loan, LIBOR+5.50% cash due 12/16/2021 | 7.54% | 8,072,229 | 8,025,765 | 8,014,503 | (6)(15) | ||||||||||||||||||||||||
| First Lien Delayed Draw Term Loan, LIBOR+5.50% cash due 12/16/2021 | 7.54% | 971,967 | 966,372 | 965,016 | (6)(15) | ||||||||||||||||||||||||
| 8,992,137 | 8,979,519 | ||||||||||||||||||||||||||||
| CITGO Petroleum Corp. | Oil & gas refining & marketing | ||||||||||||||||||||||||||||
| First Lien Term Loan, LIBOR+4.50% cash due 7/29/2021 | 6.60% | 5,937,500 | 5,921,943 | 5,963,505 | (6) | ||||||||||||||||||||||||
| First Lien Term Loan, LIBOR+5.00% cash due 3/28/2024 | 7.10% | 5,970,000 | 5,910,301 | 6,007,313 | (6) | ||||||||||||||||||||||||
| 11,832,244 | 11,970,818 | ||||||||||||||||||||||||||||
| Connect U.S. Finco LLC | Alternative carriers | ||||||||||||||||||||||||||||
| First Lien Term Loan, LIBOR+4.50% cash due 9/23/2026 | 7.10% | 10,000,000 | 9,800,000 | 9,860,150 | (6)(9) | ||||||||||||||||||||||||
| 9,800,000 | 9,860,150 | ||||||||||||||||||||||||||||
| Curium Bidco S.à r.l. | Biotechnology | ||||||||||||||||||||||||||||
| First Lien Term Loan, LIBOR+4.00% cash due 7/9/2026 | 6.10% | 4,000,000 | 3,970,000 | 4,020,000 | (6)(9) | ||||||||||||||||||||||||
| 3,970,000 | 4,020,000 | ||||||||||||||||||||||||||||
| Curvature, Inc. | IT consulting & other services | ||||||||||||||||||||||||||||
| First Lien Term Loan, LIBOR+5.00% cash due 10/30/2023 | 7.04% | 9,725,000 | 9,683,496 | 7,974,500 | (6) | ||||||||||||||||||||||||
| 9,683,496 | 7,974,500 | ||||||||||||||||||||||||||||
90
| Portfolio Company/Type of Investment (1)(2)(9)(10)(17)(19) | Cash Interest Rate (8) | Industry | Principal (5) | Cost | Fair Value | |||||||||||
| Control Investments (3) | ||||||||||||||||
| FSFR Glick JV LLC (7)(12)(18) | Multi-sector holdings | |||||||||||||||
| Subordinated Note, LIBOR+8% cash due 10/20/2021 (8) | 8.47% | $ | 64,005,755 | $ | 64,005,755 | $ | 56,885,646 | |||||||||
| 87.5% equity interest (14) | 7,111,751 | 6,431,021 | ||||||||||||||
| 71,117,506 | 63,316,667 | |||||||||||||||
| Total Control Investments (19.4% of net assets) | $ | 71,117,506 | $ | 63,316,667 | ||||||||||||
| Affiliate Investments (4) | ||||||||||||||||
| Ameritox Ltd. (15) | Healthcare services | |||||||||||||||
| First Lien Term Loan, LIBOR+5% (1% floor) cash 3% PIK due 4/11/2021 (8)(13) | 6.00% | 6,387,128 | $ | 6,380,832 | $ | 6,342,286 | ||||||||||
| 3,309,873.6 Class A Preferred Units in Ameritox Holdings II, LLC | 3,309,874 | 3,626,150 | ||||||||||||||
| 327,393.6 Class B Preferred Units in Ameritox Holdings II, LLC | 327,394 | 358,679 | ||||||||||||||
| 1,007.36 Class A Units in Ameritox Holdings II, LLC | 5,935,698 | 2,679,343 | ||||||||||||||
| 15,953,798 | 13,006,458 | |||||||||||||||
| Total Affiliate Investments (4.0% of net assets) | $ | 15,953,798 | $ | 13,006,458 | ||||||||||||
| Non-Control/Non-Affiliate Investments (6) | ||||||||||||||||
| Triple Point Group Holdings, Inc. | Application software | |||||||||||||||
| First Lien Revolver, LIBOR+4.25% (1% floor) cash due 7/10/2018 (8) | 5.25% | — | — | |||||||||||||
| — | — | |||||||||||||||
| Blackhawk Specialty Tools, LLC | Oil & gas equipment & services | |||||||||||||||
| First Lien Term Loan, LIBOR+5.25% (1.25% floor) cash due 8/1/2019 (8)(13) | 6.50% | 4,249,996 | 4,177,081 | 4,090,429 | ||||||||||||
| 4,177,081 | 4,090,429 | |||||||||||||||
| New Trident Holdcorp, Inc. | Healthcare services | |||||||||||||||
| First Lien Term Loan B, LIBOR+5.25% (1.25% floor) cash due 7/31/2019 (8)(13) | 6.50% | 13,707,532 | 13,289,778 | 11,788,478 | ||||||||||||
| Second Lien Term Loan, LIBOR+9% (1.25% floor) cash due 7/31/2020 (8) | 10.25% | 1,000,000 | 972,500 | 820,000 | ||||||||||||
| 14,262,278 | 12,608,478 | |||||||||||||||
| NXT Capital, LLC | Diversified capital markets | |||||||||||||||
| First Lien Term Loan, LIBOR+5.25% (1% floor) cash due 9/4/2018 (8)(13) | 6.25% | 8,719,887 | 8,685,189 | 8,763,486 | ||||||||||||
| 8,685,189 | 8,763,486 | |||||||||||||||
| Vitera Healthcare Solutions, LLC | Healthcare technology | |||||||||||||||
| First Lien Term Loan, LIBOR+5% (1% floor) cash due 11/4/2020 (8)(13) | 6.00% | 4,862,500 | 4,856,420 | 4,747,016 | ||||||||||||
| 4,856,420 | 4,747,016 | |||||||||||||||
| The Active Network, Inc. | Internet software & services | |||||||||||||||
| Second Lien Term Loan, LIBOR+8.5% (1% floor) cash due 11/15/2021 (8)(13) | 9.50% | 2,400,000 | 2,314,573 | 2,370,000 | ||||||||||||
| 2,314,573 | 2,370,000 | |||||||||||||||
| Accruent, LLC | Internet software & services | |||||||||||||||
| First Lien Term Loan, LIBOR+5.25% (1% floor) cash due 5/16/2022 (8) | 6.25% | 9,975,000 | 9,881,944 | 9,994,012 | ||||||||||||
| First Lien Revolver, LIBOR+5.25% (1% floor) cash due 5/16/2022 (8)(11) | 6.25% | (791 | ) | — | ||||||||||||
| 9,881,153 | 9,994,012 | |||||||||||||||
Oaktree Strategic Income Corporation
Consolidated Schedule of Investments
September 30, 20162019
| Portfolio Company/Type of Investment (1)(2)(3)(4)(5) | Cash Interest Rate (6) | Industry | Principal (7) | Cost | Fair Value | Notes | |||||||||||||||||||||||
| Dcert Buyer, Inc. | Internet services & infrastructure | ||||||||||||||||||||||||||||
| First Lien Term Loan, LIBOR+4.00% cash due 8/8/2026 | 6.26% | $ | 9,000,000 | $ | 8,977,500 | $ | 8,983,125 | (6) | |||||||||||||||||||||
| 8,977,500 | 8,983,125 | ||||||||||||||||||||||||||||
| DigiCert, Inc. | Internet services & infrastructure | ||||||||||||||||||||||||||||
| First Lien Term Loan, LIBOR+4.00% cash due 10/31/2024 | 6.04% | 10,631,986 | 10,611,348 | 10,629,753 | (6) | ||||||||||||||||||||||||
| 10,611,348 | 10,629,753 | ||||||||||||||||||||||||||||
| Ellie Mae, Inc. | Application software | ||||||||||||||||||||||||||||
| First Lien Term Loan, LIBOR+4.00% cash due 4/17/2026 | 6.04% | 6,500,000 | 6,467,500 | 6,518,980 | (6) | ||||||||||||||||||||||||
| 6,467,500 | 6,518,980 | ||||||||||||||||||||||||||||
| EnergySolutions LLC | Environmental & facilities services | ||||||||||||||||||||||||||||
| First Lien Term Loan, LIBOR+3.75% cash due 5/9/2025 | 5.85% | 3,950,000 | 3,934,058 | 3,703,125 | (6) | ||||||||||||||||||||||||
| 3,934,058 | 3,703,125 | ||||||||||||||||||||||||||||
| Femur Buyer, Inc. | Healthcare equipment | ||||||||||||||||||||||||||||
| First Lien Term Loan, LIBOR+4.25% cash due 3/5/2026 | 6.38% | 8,977,500 | 8,887,725 | 8,994,333 | (6) | ||||||||||||||||||||||||
| 8,887,725 | 8,994,333 | ||||||||||||||||||||||||||||
| Firstlight Holdco, Inc. | Alternative carriers | ||||||||||||||||||||||||||||
| First Lien Term Loan, LIBOR+3.50% cash due 7/23/2025 | 5.54% | 7,156,627 | 7,126,483 | 7,098,479 | (6) | ||||||||||||||||||||||||
| 7,126,483 | 7,098,479 | ||||||||||||||||||||||||||||
| Frontier Communications Corporation | Integrated telecommunication services | ||||||||||||||||||||||||||||
| First Lien Term Loan, LIBOR+3.75% cash due 6/15/2024 | 5.80% | 1,488,579 | 1,450,620 | 1,488,050 | (6)(9) | ||||||||||||||||||||||||
| 1,450,620 | 1,488,050 | ||||||||||||||||||||||||||||
| Gentiva Health Services, Inc. | Healthcare services | ||||||||||||||||||||||||||||
| First Lien Term Loan, LIBOR+3.75% cash due 7/2/2025 | 5.81% | 3,989,924 | 3,985,062 | 4,017,355 | (6) | ||||||||||||||||||||||||
| 3,985,062 | 4,017,355 | ||||||||||||||||||||||||||||
| GKD Index Partners, LLC | Specialized finance | ||||||||||||||||||||||||||||
| First Lien Term Loan, LIBOR+7.25% cash due 6/29/2023 | 9.35% | 8,616,315 | 8,551,811 | 8,503,011 | (6)(15) | ||||||||||||||||||||||||
| First Lien Revolver, LIBOR+7.25% cash due 6/29/2023 | — | (3,327) | (5,844) | (6)(14)(15) | |||||||||||||||||||||||||
| 8,548,484 | 8,497,167 | ||||||||||||||||||||||||||||
| GoodRx, Inc. | Interactive media & services | ||||||||||||||||||||||||||||
| First Lien Term Loan, LIBOR+2.75% cash due 10/10/2025 | 4.81% | 3,925,963 | 3,917,442 | 3,930,871 | (6) | ||||||||||||||||||||||||
| 3,917,442 | 3,930,871 | ||||||||||||||||||||||||||||
| Guidehouse LLP | Research & consulting services | ||||||||||||||||||||||||||||
| Second Lien Term Loan, LIBOR+7.50% cash due 5/1/2026 | 9.54% | 5,000,000 | 4,979,290 | 4,937,500 | (6) | ||||||||||||||||||||||||
| 4,979,290 | 4,937,500 | ||||||||||||||||||||||||||||
| iCIMs, Inc. | Application software | ||||||||||||||||||||||||||||
| First Lien Term Loan, LIBOR+6.50% cash due 9/12/2024 | 8.56% | 5,572,549 | 5,478,546 | 5,479,203 | (6)(15) | ||||||||||||||||||||||||
| First Lien Revolver, LIBOR+6.50% cash due 9/12/2024 | — | (4,852) | (4,927) | (6)(14)(15) | |||||||||||||||||||||||||
| 5,473,694 | 5,474,276 | ||||||||||||||||||||||||||||
| Indivior Finance S.a.r.l. | Pharmaceuticals | ||||||||||||||||||||||||||||
| First Lien Term Loan, LIBOR+4.50% cash due 12/19/2022 | 6.76% | 5,368,935 | 5,344,971 | 4,943,903 | (6)(9) | ||||||||||||||||||||||||
| 5,344,971 | 4,943,903 | ||||||||||||||||||||||||||||
| Kellermeyer Bergensons Services, LLC | Environmental & facilities services | ||||||||||||||||||||||||||||
| Second Lien Term Loan, LIBOR+8.50% cash due 4/29/2022 | 10.77% | 280,000 | 280,000 | 272,300 | (6)(15) | ||||||||||||||||||||||||
| 280,000 | 272,300 | ||||||||||||||||||||||||||||
| KIK Custom Products Inc. | Household products | ||||||||||||||||||||||||||||
| First Lien Term Loan, LIBOR+4.00% cash due 5/15/2023 | 6.26% | 5,000,000 | 5,025,753 | 4,756,250 | (6)(9) | ||||||||||||||||||||||||
| 5,025,753 | 4,756,250 | ||||||||||||||||||||||||||||
| Lannett Company, Inc. | Pharmaceuticals | ||||||||||||||||||||||||||||
| First Lien Term Loan, LIBOR+5.38% cash due 11/25/2022 | 7.42% | 7,269,303 | 7,281,949 | 7,138,455 | (6)(9) | ||||||||||||||||||||||||
| 7,281,949 | 7,138,455 | ||||||||||||||||||||||||||||
91
| Portfolio Company/Type of Investment (1)(2)(9)(10)(17)(19) | Cash Interest Rate (8) | Industry | Principal (5) | Cost | Fair Value | |||||||||||
| Survey Sampling International, LLC | Research & consulting services | |||||||||||||||
| First Lien Term Loan, LIBOR+5% (1% floor) cash due 12/16/2020 (8)(13) | 6.00% | $ | 5,726,682 | $ | 5,691,793 | $ | 5,726,682 | |||||||||
| Second Lien Term Loan, LIBOR+9% (1% floor) cash due 12/16/2021 (8) | 10.00% | 1,000,000 | 985,238 | 980,000 | ||||||||||||
| 6,677,031 | 6,706,682 | |||||||||||||||
| Answers Corporation | Internet software & services | |||||||||||||||
| First Lien Term Loan, LIBOR+5.25% (1% floor) cash due 10/3/2021 (8)(13) | 6.25% | 11,820,000 | 11,421,760 | 6,382,800 | ||||||||||||
| Second Lien Term Loan, LIBOR+9% (1% floor) cash due 10/3/2022 (8) | 10.00% | 8,000,000 | 7,605,257 | 773,360 | ||||||||||||
| 19,027,017 | 7,156,160 | |||||||||||||||
| Maxor National Pharmacy Services, LLC | Pharmaceuticals | |||||||||||||||
| First Lien Term Loan, LIBOR+5.25% (1.25% floor) cash due 1/31/2020 (8)(13) | 6.50% | 9,162,870 | 9,162,870 | 9,033,850 | ||||||||||||
| 9,162,870 | 9,033,850 | |||||||||||||||
| NextCare, Inc. | Healthcare services | |||||||||||||||
| Senior Term Loan, LIBOR+7.5% (1% floor) cash due 7/31/2018 (8)(13) | 8.50% | 7,029,160 | 7,029,160 | 6,744,944 | ||||||||||||
| Delayed Draw Term Loan, LIBOR+7.5% (1% floor) cash due 7/31/2018 (8) | 8.50% | 1,407,969 | 1,407,969 | 1,330,269 | ||||||||||||
| 8,437,129 | 8,075,213 | |||||||||||||||
| Aptean, Inc. | Application software | |||||||||||||||
| Second Lien Term Loan, LIBOR+7.5% (1% floor) cash due 2/26/2021 (8) | 8.50% | 1,250,000 | 1,240,179 | 1,232,038 | ||||||||||||
| 1,240,179 | 1,232,038 | |||||||||||||||
| Stratus Technologies, Inc. | Computer hardware | |||||||||||||||
| First Lien Term Loan, LIBOR+5% (1% floor) cash due 4/28/2021 (8)(13) | 6.00% | 4,003,658 | 3,956,802 | 3,903,567 | ||||||||||||
| 3,956,802 | 3,903,567 | |||||||||||||||
| TravelCLICK, Inc. | Internet software & services | |||||||||||||||
| Second Lien Term Loan, LIBOR+7.75% (1% floor) cash due 11/6/2021 (8)(13) | 8.75% | 3,380,000 | 3,299,165 | 3,027,128 | ||||||||||||
| 3,299,165 | 3,027,128 | |||||||||||||||
| GTCR Valor Companies, Inc. | Advertising | |||||||||||||||
| First Lien Term Loan, LIBOR+6% (1% floor) cash due 6/16/2023 (8)(13) | 7.00% | 12,219,375 | 11,607,301 | 11,688,626 | ||||||||||||
| 11,607,301 | 11,688,626 | |||||||||||||||
| ConvergeOne Holdings Corp. | Integrated telecommunication services | |||||||||||||||
| First Lien Term Loan, LIBOR+5% (1% floor) cash due 6/17/2020 (8)(13) | 6.00% | 5,343,010 | 5,316,746 | 5,322,974 | ||||||||||||
| 5,316,746 | 5,322,974 | |||||||||||||||
| Verdesian Life Sciences, LLC | Fertilizers & agricultural chemicals | |||||||||||||||
| First Lien Term Loan, LIBOR+5% (1% floor) cash due 7/1/2020 (8)(13) | 6.00% | 3,554,890 | 3,522,668 | 3,377,146 | ||||||||||||
| 3,522,668 | 3,377,146 | |||||||||||||||
| PR Wireless, Inc. | Wireless telecommunication services | |||||||||||||||
| First Lien Term Loan, LIBOR+9% (1% floor) cash due 6/29/2020 (7)(8) | 10.00% | 5,836,771 | 5,719,729 | 4,111,317 | ||||||||||||
| 35.5263 Common Stock Warrants (exercise price $0.01) expiration date 6/27/2024 (7) | — | 120,342 | ||||||||||||||
| 5,719,729 | 4,231,659 | |||||||||||||||
Oaktree Strategic Income Corporation
Consolidated Schedule of Investments
September 30, 20162019
| Portfolio Company/Type of Investment (1)(2)(3)(4)(5) | Cash Interest Rate (6) | Industry | Principal (7) | Cost | Fair Value | Notes | |||||||||||||||||||||||
| Lightbox Intermediate, L.P. | Real estate services | ||||||||||||||||||||||||||||
| First Lien Term Loan, LIBOR+5.00% cash due 5/9/2026 | 7.05% | $ | 9,975,000 | $ | 9,832,986 | $ | 9,875,250 | (6)(15) | |||||||||||||||||||||
| 9,832,986 | 9,875,250 | ||||||||||||||||||||||||||||
| Lytx Holdings, LLC | Research & consulting services | ||||||||||||||||||||||||||||
| 500 Class B Units | — | 293,339 | (15) | ||||||||||||||||||||||||||
| — | 293,339 | ||||||||||||||||||||||||||||
| McAfee, LLC | Systems software | ||||||||||||||||||||||||||||
| First Lien Term Loan, LIBOR+3.75% cash due 9/30/2024 | 5.79% | 8,138,690 | 8,082,911 | 8,166,891 | (6) | ||||||||||||||||||||||||
| 8,082,911 | 8,166,891 | ||||||||||||||||||||||||||||
| McDermott Technology (Americas), Inc. | Oil & gas equipment & services | ||||||||||||||||||||||||||||
| First Lien Term Loan, LIBOR+5.00% cash due 5/9/2025 | 7.10% | 642,238 | 631,923 | 410,497 | (6)(9) | ||||||||||||||||||||||||
| 631,923 | 410,497 | ||||||||||||||||||||||||||||
| MHE Intermediate Holdings, LLC | Diversified support services | ||||||||||||||||||||||||||||
| First Lien Term Loan, LIBOR+5.00% cash due 3/8/2024 | 7.10% | 11,538,092 | 11,389,771 | 11,307,331 | (6)(15) | ||||||||||||||||||||||||
| First Lien Revolver, LIBOR+5.00% cash due 3/10/2023 | 7.09% | 788,177 | 559,231 | 683,087 | (6)(14)(15) | ||||||||||||||||||||||||
| First Lien Delayed Draw Term Loan, LIBOR+5.00% cash due 3/8/2024 | 7.10% | 2,349,480 | 2,376,251 | 2,302,490 | (6)(15) | ||||||||||||||||||||||||
| 14,325,253 | 14,292,908 | ||||||||||||||||||||||||||||
| Mindbody, Inc. | Internet services & infrastructure | ||||||||||||||||||||||||||||
| First Lien Term Loan, LIBOR+7.00% cash due 2/14/2025 | 9.06% | 9,047,619 | 8,885,497 | 8,875,714 | (6)(15) | ||||||||||||||||||||||||
| First Lien Revolver, LIBOR+7.00% cash due 2/14/2025 | — | (17,065) | (18,095) | (6)(14)(15) | |||||||||||||||||||||||||
| 8,868,432 | 8,857,619 | ||||||||||||||||||||||||||||
| Ministry Brands, LLC | Application software | ||||||||||||||||||||||||||||
| Second Lien Term Loan, LIBOR+9.25% cash due 6/2/2023 | 11.34% | 1,568,067 | 1,554,797 | 1,568,067 | (6)(15) | ||||||||||||||||||||||||
| Second Lien Delayed Draw Term Loan, LIBOR+9.25% cash due 6/2/2023 | 11.34% | 431,933 | 428,278 | 431,933 | (6)(15) | ||||||||||||||||||||||||
| First Lien Revolver, LIBOR+5.00% cash due 12/2/2022 | 7.04% | 20,000 | 19,139 | 20,000 | (6)(14)(15) | ||||||||||||||||||||||||
| 2,002,214 | 2,020,000 | ||||||||||||||||||||||||||||
| New Trident Holdcorp, Inc. | Healthcare services | ||||||||||||||||||||||||||||
| 58.99 Class A Warrants (exercise price $156.164) expiration date 3/20/2021 | — | — | (15) | ||||||||||||||||||||||||||
| — | — | ||||||||||||||||||||||||||||
| OCI Beaumont LLC | Commodity chemicals | ||||||||||||||||||||||||||||
| First Lien Term Loan, LIBOR+4.00% cash due 3/13/2025 | 6.10% | 4,925,000 | 4,920,165 | 4,931,156 | (6)(9) | ||||||||||||||||||||||||
| 4,920,165 | 4,931,156 | ||||||||||||||||||||||||||||
| OEConnection LLC | Application software | ||||||||||||||||||||||||||||
| First Lien Term Loan, LIBOR+4.00% cash due 9/24/2026 | 6.13% | 7,768,817 | 7,729,973 | 7,754,251 | (6) | ||||||||||||||||||||||||
| First Lien Delayed Draw Term Loan, LIBOR+4.00% cash due 9/24/2026 | — | (3,656) | (1,371) | (6)(14) | |||||||||||||||||||||||||
| 7,726,317 | 7,752,880 | ||||||||||||||||||||||||||||
| Onvoy, LLC | Integrated telecommunication services | ||||||||||||||||||||||||||||
| First Lien Term Loan, LIBOR+4.50% cash due 2/10/2024 | 6.54% | 3,860,606 | 3,848,514 | 3,238,083 | (6) | ||||||||||||||||||||||||
| 3,848,514 | 3,238,083 | ||||||||||||||||||||||||||||
| PaySimple, Inc. | Data processing & outsourced services | ||||||||||||||||||||||||||||
| First Lien Term Loan, LIBOR+5.50% cash due 8/23/2025 | 7.55% | 7,550,000 | 7,400,733 | 7,436,750 | (6)(15) | ||||||||||||||||||||||||
| First Lien Delayed Draw Term Loan, LIBOR+5.50% cash due 8/23/2025 | — | (48,438) | (36,750) | (6)(14)(15) | |||||||||||||||||||||||||
| 7,352,295 | 7,400,000 | ||||||||||||||||||||||||||||
| Peraton Corp. | Aerospace & defense | ||||||||||||||||||||||||||||
| First Lien Term Loan, LIBOR+5.25% cash due 4/29/2024 | 7.30% | 6,353,750 | 6,333,030 | 6,306,097 | (6) | ||||||||||||||||||||||||
| 6,333,030 | 6,306,097 | ||||||||||||||||||||||||||||
92
| Portfolio Company/Type of Investment (1)(2)(9)(10)(17)(19) | Cash Interest Rate (8) | Industry | Principal (5) | Cost | Fair Value | |||||||||||
| TV Borrower US, LLC | Integrated telecommunication services | |||||||||||||||
| First Lien Term Loan, LIBOR+5% (1% floor) cash due 1/8/2021 (7)(8)(13) | 6.00% | $ | 6,086,385 | $ | 5,973,885 | $ | 6,063,561 | |||||||||
| Second Lien Term Loan, LIBOR+8.5% (1% floor) cash due 7/8/2021 (7)(8)(13) | 9.50% | 3,000,000 | 2,921,780 | 2,910,000 | ||||||||||||
| 8,895,665 | 8,973,561 | |||||||||||||||
| American Dental Partners, Inc. | Healthcare services | |||||||||||||||
| First Lien Term Loan, LIBOR+4.75% (1% floor) cash due 8/30/2021 (8)(13) | 5.75% | 5,880,000 | 5,860,000 | 5,791,800 | ||||||||||||
| 5,860,000 | 5,791,800 | |||||||||||||||
| BeyondTrust Software, Inc. | Application software | |||||||||||||||
| First Lien Term Loan, LIBOR+7% (1% floor) cash due 9/25/2019 (8)(13) | 8.00% | 18,381,895 | 18,136,331 | 18,309,259 | ||||||||||||
| First Lien Revolver, LIBOR+7% (1% floor) cash due 9/25/2019 (8)(11) | 8.00% | (30,304 | ) | — | ||||||||||||
| 500,000 Class A membership interests in BeyondTrust Holdings LLC | 500,000 | 613,869 | ||||||||||||||
| 18,606,027 | 18,923,128 | |||||||||||||||
| Hill International, Inc. | Construction & engineering | |||||||||||||||
| First Lien Term Loan, LIBOR+6.75% (1% floor) cash due 9/26/2020 (8)(13) | 7.75% | 5,978,000 | 5,907,850 | 5,768,770 | ||||||||||||
| 5,907,850 | 5,768,770 | |||||||||||||||
| Teaching Strategies, LLC | Education services | |||||||||||||||
| First Lien Term Loan, LIBOR+5.5% (0.5% floor) cash due 10/1/2019 (8)(13) | 6.34% | 15,252,341 | 15,262,322 | 15,293,164 | ||||||||||||
| First Lien Revolver, LIBOR+5.5% (0.5% floor) cash due 10/1/2019 (8) | 6.34% | — | — | |||||||||||||
| 15,262,322 | 15,293,164 | |||||||||||||||
| Dynatect Group Holdings, Inc. | Industrial machinery | |||||||||||||||
| First Lien Term Loan, LIBOR+4.5% (1% floor) cash due 9/30/2020 (8) | 5.50% | 3,826,203 | 3,826,203 | 3,778,376 | ||||||||||||
| First Lien Delayed Draw Term Loan, LIBOR+4.5% (1% floor) cash due 9/30/2020 (8) | 5.50% | — | — | |||||||||||||
| 3,826,203 | 3,778,376 | |||||||||||||||
| Idera, Inc. | Internet software & services | |||||||||||||||
| First Lien Term Loan, LIBOR+5.5% (1% floor) cash due 4/9/2021 (8)(13) | 6.50% | 17,356,053 | 16,490,668 | 16,878,761 | ||||||||||||
| 16,490,668 | 16,878,761 | |||||||||||||||
| Central Security Group, Inc. | Specialized consumer services | |||||||||||||||
| First Lien Term Loan, LIBOR+5.625% (1% floor) cash due 10/6/2020 (8) | 6.63% | 2,539,726 | 2,532,917 | 2,482,582 | ||||||||||||
| 2,532,917 | 2,482,582 | |||||||||||||||
| Kellermeyer Bergensons Services, LLC | Diversified support services | |||||||||||||||
| First Lien Term Loan, LIBOR+5% (1% floor) cash due 10/29/2021 (8)(13) | 6.00% | 5,265,325 | 5,211,587 | 5,081,038 | ||||||||||||
| Second Lien Term Loan, LIBOR+8.5% (1% floor) cash due 4/29/2022 (8)(13) | 9.50% | 280,000 | 280,000 | 266,000 | ||||||||||||
| 5,491,587 | 5,347,038 | |||||||||||||||
| GOBP Holdings Inc. | Food retail | |||||||||||||||
| Second Lien Term Loan, LIBOR+8.25% (1% floor) cash due 10/21/2022 (8)(13) | 9.25% | 3,685,714 | 3,635,831 | 3,685,714 | ||||||||||||
| 3,635,831 | 3,685,714 | |||||||||||||||
Oaktree Strategic Income Corporation
Consolidated Schedule of Investments
September 30, 20162019
| Portfolio Company/Type of Investment (1)(2)(3)(4)(5) | Cash Interest Rate (6) | Industry | Principal (7) | Cost | Fair Value | Notes | |||||||||||||||||||||||
| ProFrac Services, LLC | Industrial machinery | ||||||||||||||||||||||||||||
| First Lien Term Loan, LIBOR+6.25% cash due 9/15/2023 | 8.66% | $ | 9,394,444 | $ | 9,319,898 | $ | 9,206,556 | (6)(15) | |||||||||||||||||||||
| 9,319,898 | 9,206,556 | ||||||||||||||||||||||||||||
| Project Boost Purchaser, LLC | Application software | ||||||||||||||||||||||||||||
| First Lien Term Loan, LIBOR+3.50% cash due 6/1/2026 | 5.54% | 2,800,000 | 2,772,000 | 2,785,650 | (6) | ||||||||||||||||||||||||
| Second Lien Term Loan, LIBOR+8.00% cash due 5/9/2027 | 10.14% | 1,500,000 | 1,500,000 | 1,500,000 | (6)(15) | ||||||||||||||||||||||||
| 4,272,000 | 4,285,650 | ||||||||||||||||||||||||||||
| PSI Services LLC | Human resource & employment services | ||||||||||||||||||||||||||||
| First Lien Term Loan, LIBOR+5.00% cash due 1/20/2023 | 7.04% | 6,601,580 | 6,545,627 | 6,555,342 | (6)(15) | ||||||||||||||||||||||||
| 6,545,627 | 6,555,342 | ||||||||||||||||||||||||||||
| Recorded Books Inc. | Publishing | ||||||||||||||||||||||||||||
| First Lien Term Loan, LIBOR+4.50% cash due 8/29/2025 | 6.54% | 10,395,000 | 10,291,050 | 10,421,039 | (6) | ||||||||||||||||||||||||
| 10,291,050 | 10,421,039 | ||||||||||||||||||||||||||||
| RevSpring, Inc. | Commercial printing | ||||||||||||||||||||||||||||
| First Lien Term Loan, LIBOR+4.00% cash due 10/11/2025 | 6.04% | 9,925,000 | 9,903,404 | 9,866,095 | (6)(15) | ||||||||||||||||||||||||
| 9,903,404 | 9,866,095 | ||||||||||||||||||||||||||||
| Salient CRGT, Inc. | Aerospace & defense | ||||||||||||||||||||||||||||
| First Lien Term Loan, LIBOR+6.00% cash due 2/28/2022 | 8.05% | 5,731,994 | 5,676,942 | 5,445,395 | (6)(15) | ||||||||||||||||||||||||
| 5,676,942 | 5,445,395 | ||||||||||||||||||||||||||||
| Signify Health, LLC | Healthcare services | ||||||||||||||||||||||||||||
| First Lien Term Loan, LIBOR+4.50% cash due 12/23/2024 | 6.60% | 10,835,000 | 10,752,193 | 10,821,456 | (6) | ||||||||||||||||||||||||
| 10,752,193 | 10,821,456 | ||||||||||||||||||||||||||||
| Sirva Worldwide, Inc. | Diversified support services | ||||||||||||||||||||||||||||
| First Lien Term Loan, LIBOR+5.50% cash due 8/4/2025 | 7.54% | 7,850,000 | 7,732,250 | 7,614,500 | (6) | ||||||||||||||||||||||||
| 7,732,250 | 7,614,500 | ||||||||||||||||||||||||||||
| Sophia, L.P. | Systems software | ||||||||||||||||||||||||||||
| First Lien Term Loan, LIBOR+3.25% cash due 9/30/2022 | 5.35% | 1,398,788 | 1,396,201 | 1,400,830 | (6) | ||||||||||||||||||||||||
| 1,396,201 | 1,400,830 | ||||||||||||||||||||||||||||
| StandardAero Aviation Holdings Inc. | Aerospace & defense | ||||||||||||||||||||||||||||
| First Lien Term Loan, LIBOR+4.00% cash due 4/6/2026 | 6.10% | 2,000,000 | 1,997,545 | 2,011,870 | (6) | ||||||||||||||||||||||||
| 1,997,545 | 2,011,870 | ||||||||||||||||||||||||||||
| Sunshine Luxembourg VII SARL | Personal products | ||||||||||||||||||||||||||||
| First Lien Term Loan, LIBOR+4.25% cash due 9/25/2026 | 6.59% | 3,000,000 | 2,985,000 | 3,017,820 | (6)(9) | ||||||||||||||||||||||||
| 2,985,000 | 3,017,820 | ||||||||||||||||||||||||||||
| The Dun & Bradstreet Corporation | Research & consulting services | ||||||||||||||||||||||||||||
| First Lien Term Loan, LIBOR+5.00% cash due 2/6/2026 | 7.05% | 5,000,000 | 4,908,337 | 5,037,050 | (6) | ||||||||||||||||||||||||
| 4,908,337 | 5,037,050 | ||||||||||||||||||||||||||||
| TIBCO Software Inc. | Application software | ||||||||||||||||||||||||||||
| First Lien Term Loan, LIBOR+4.00% cash due 6/30/2026 | 6.07% | 7,989,795 | 7,979,663 | 8,011,448 | (6) | ||||||||||||||||||||||||
| 7,979,663 | 8,011,448 | ||||||||||||||||||||||||||||
| Tribe Buyer LLC | Human resources & employment services | ||||||||||||||||||||||||||||
| First Lien Term Loan, LIBOR+4.50% cash due 2/16/2024 | 6.54% | 1,556,998 | 1,554,180 | 1,453,201 | (6)(15) | ||||||||||||||||||||||||
| 1,554,180 | 1,453,201 | ||||||||||||||||||||||||||||
| Truck Hero, Inc. | Auto parts & equipment | ||||||||||||||||||||||||||||
| First Lien Term Loan, LIBOR+3.75% cash due 4/22/2024 | 5.79% | 5,739,880 | 5,749,771 | 5,385,930 | (6) | ||||||||||||||||||||||||
| 5,749,771 | 5,385,930 | ||||||||||||||||||||||||||||
93
| Portfolio Company/Type of Investment (1)(2)(9)(10)(17)(19) | Cash Interest Rate (8) | Industry | Principal (5) | Cost | Fair Value | |||||||||||
| NAVEX Global, Inc. | Internet software & services | |||||||||||||||
| First Lien Term Loan, LIBOR+4.75% (1% floor) cash due 11/19/2021 (8)(13) | 5.99% | $ | 3,450,918 | $ | 3,440,820 | $ | 3,433,662 | |||||||||
| Second Lien Term Loan, LIBOR+9.5% (1% floor) cash due 11/18/2022 (8) | 10.31% | 1,438,468 | 1,438,468 | 1,395,314 | ||||||||||||
| 4,879,288 | 4,828,976 | |||||||||||||||
| Executive Consulting Group, LLC | Healthcare services | |||||||||||||||
| First Lien Term Loan, LIBOR+4.75% (1% floor) cash due 11/21/2019 (8)(13) | 5.75% | 7,000,000 | 7,000,000 | 6,960,668 | ||||||||||||
| Delayed Draw Term Loan, LIBOR+4.75% (1% floor) cash due 11/21/2019 (8) | 5.75% | 4,000,000 | 4,000,000 | 3,979,448 | ||||||||||||
| 11,000,000 | 10,940,116 | |||||||||||||||
| TIBCO Software, Inc. | Internet software & services | |||||||||||||||
| First Lien Term Loan, LIBOR+5.5% (1% floor) cash due 12/4/2020 (8) | 6.50% | 7,919,400 | 7,590,582 | 7,823,932 | ||||||||||||
| First Lien Revolver, LIBOR+4% cash due 11/25/2020 (8) | 4.24% | — | — | |||||||||||||
| 7,590,582 | 7,823,932 | |||||||||||||||
| Metamorph US 3, LLC | Internet software & services | |||||||||||||||
| First Lien Term Loan, LIBOR+6.5% (1% floor) cash due 12/1/2020 (8)(13) | 7.50% | 14,223,467 | 14,181,149 | 11,840,322 | ||||||||||||
| First Lien Revolver, LIBOR+6.5% (1% floor) cash due 12/1/2020 (8)(13) | 7.50% | 600,000 | 573,856 | 600,000 | ||||||||||||
| 14,755,005 | 12,440,322 | |||||||||||||||
| Compuware Corporation | Internet software & services | |||||||||||||||
| First Lien Term Loan B1, LIBOR+5.25% (1% floor) cash due 12/15/2019 (8)(13) | 6.25% | 7,825,554 | 7,720,514 | 7,854,900 | ||||||||||||
| First Lien Term Loan B2, LIBOR+5.25% (1% floor) cash due 12/15/2021 (8) | 6.25% | 905,896 | 889,191 | 904,198 | ||||||||||||
| 8,609,705 | 8,759,098 | |||||||||||||||
| AF Borrower, LLC | IT consulting & other services | |||||||||||||||
| First Lien Term Loan, LIBOR+5.25% (1% floor) cash due 1/28/2022 (8)(13) | 6.25% | 1,036,642 | 1,020,406 | 1,041,612 | ||||||||||||
| 1,020,406 | 1,041,612 | |||||||||||||||
| TrialCard Incorporated | Healthcare services | |||||||||||||||
| First Lien Term Loan, LIBOR+4.5% (1% floor) cash due 12/31/2019 (8)(13) | 5.50% | 9,874,962 | 9,869,718 | 9,827,027 | ||||||||||||
| First Lien Revolver, LIBOR+4.5% (1% floor) cash due 12/31/2019 (8)(11) | 5.50% | (375 | ) | — | ||||||||||||
| 9,869,343 | 9,827,027 | |||||||||||||||
| Motion Recruitment Partners LLC | Diversified support services | |||||||||||||||
| First Lien Term Loan, LIBOR+6% (1% floor) cash due 2/13/2020 (8)(13) | 7.00% | 14,235,000 | 14,224,241 | 14,250,584 | ||||||||||||
| First Lien Revolver, LIBOR+6% (1% floor) cash due 2/13/2020 (8)(11) | 7.00% | (960 | ) | — | ||||||||||||
| 14,223,281 | 14,250,584 | |||||||||||||||
| PowerPlan, Inc. | Internet software & services | |||||||||||||||
| First Lien Term Loan, LIBOR+4.75% (1% floor) cash due 2/23/2022 (8)(13) | 5.75% | 16,737,833 | 16,710,709 | 16,731,213 | ||||||||||||
| First Lien Revolver, LIBOR+4.75% (1% floor) cash due 2/23/2021 (8) | 5.75% | — | — | |||||||||||||
| 16,710,709 | 16,731,213 | |||||||||||||||
Oaktree Strategic Income Corporation
Consolidated Schedule of Investments
September 30, 20162019
| Portfolio Company/Type of Investment (1)(2)(3)(4)(5) | Cash Interest Rate (6) | Industry | Principal (7) | Cost | Fair Value | Notes | |||||||||||||||||||||||
| Uber Technologies, Inc. | Application software | ||||||||||||||||||||||||||||
| First Lien Term Loan, LIBOR+4.00% cash due 4/4/2025 | 6.03% | $ | 2,239,323 | $ | 2,224,436 | $ | 2,230,467 | (6) | |||||||||||||||||||||
| 2,224,436 | 2,230,467 | ||||||||||||||||||||||||||||
| UFC Holdings, LLC | Movies & entertainment | ||||||||||||||||||||||||||||
| First Lien Term Loan, LIBOR+3.25% cash due 4/29/2026 | 5.30% | 4,944,058 | 4,941,992 | 4,962,945 | (6) | ||||||||||||||||||||||||
| 4,941,992 | 4,962,945 | ||||||||||||||||||||||||||||
| Uniti Group LP | Specialized REITs | ||||||||||||||||||||||||||||
| First Lien Term Loan, LIBOR+5.00% cash due 10/24/2022 | 7.04% | 8,848,483 | 8,642,094 | 8,648,021 | (6)(9) | ||||||||||||||||||||||||
| 8,642,094 | 8,648,021 | ||||||||||||||||||||||||||||
| UOS, LLC | Trading companies & distributors | ||||||||||||||||||||||||||||
| First Lien Term Loan, LIBOR+5.50% cash due 4/18/2023 | 7.54% | 8,819,673 | 8,943,835 | 8,929,919 | (6) | ||||||||||||||||||||||||
| 8,943,835 | 8,929,919 | ||||||||||||||||||||||||||||
| Veritas US Inc. | Application software | ||||||||||||||||||||||||||||
| First Lien Term Loan, LIBOR+4.50% cash due 1/27/2023 | 6.60% | 12,811,879 | 12,902,946 | 12,142,266 | (6) | ||||||||||||||||||||||||
| 12,902,946 | 12,142,266 | ||||||||||||||||||||||||||||
| Verra Mobility, Corp. | Data processing & outsourced services | ||||||||||||||||||||||||||||
| First Lien Term Loan, LIBOR+3.75% cash due 2/28/2025 | 5.79% | 4,949,749 | 4,960,502 | 4,976,552 | (6)(9) | ||||||||||||||||||||||||
| 4,960,502 | 4,976,552 | ||||||||||||||||||||||||||||
| Verscend Holding Corp. | Healthcare technology | ||||||||||||||||||||||||||||
| First Lien Term Loan, LIBOR+4.50% cash due 8/27/2025 | 6.54% | 10,975,140 | 10,897,989 | 11,032,320 | (6) | ||||||||||||||||||||||||
| 10,897,989 | 11,032,320 | ||||||||||||||||||||||||||||
| WeddingWire, Inc. | Interactive media & services | ||||||||||||||||||||||||||||
| First Lien Term Loan, LIBOR+4.50% cash due 12/19/2025 | 6.54% | 7,940,000 | 7,904,378 | 7,949,925 | (6) | ||||||||||||||||||||||||
| 7,904,378 | 7,949,925 | ||||||||||||||||||||||||||||
| Windstream Services, LLC | Integrated telecommunication services | ||||||||||||||||||||||||||||
| First Lien Term Loan, PRIME+5.00% cash due 3/29/2021 | 10.00% | 7,384,828 | 7,227,936 | 7,524,069 | (6)(9) | ||||||||||||||||||||||||
| 7,227,936 | 7,524,069 | ||||||||||||||||||||||||||||
| Woodford Express LLC | Oil & gas exploration & production | ||||||||||||||||||||||||||||
| First Lien Term Loan, LIBOR+5.00% cash due 1/27/2025 | 7.04% | 14,775,000 | 14,662,039 | 13,947,600 | (6) | ||||||||||||||||||||||||
| 14,662,039 | 13,947,600 | ||||||||||||||||||||||||||||
| WP CPP Holdings, LLC | Aerospace & defense | ||||||||||||||||||||||||||||
| First Lien Term Loan, LIBOR+3.75% cash due 4/30/2025 | 6.01% | 4,455,000 | 4,445,709 | 4,467,541 | (6) | ||||||||||||||||||||||||
| Second Lien Term Loan, LIBOR+7.75% cash due 4/30/2026 | 10.01% | 1,000,000 | 991,442 | 995,830 | (6) | ||||||||||||||||||||||||
| 5,437,151 | 5,463,371 | ||||||||||||||||||||||||||||
| Zep Inc. | Specialty chemicals | ||||||||||||||||||||||||||||
| First Lien Term Loan, LIBOR+4.00% cash due 8/12/2024 | 6.04% | 4,655,000 | 4,686,365 | 3,687,132 | (6) | ||||||||||||||||||||||||
| 4,686,365 | 3,687,132 | ||||||||||||||||||||||||||||
| Zephyr Bidco Limited | Specialized finance | ||||||||||||||||||||||||||||
| First Lien Term Loan, UK LIBOR+4.50% cash due 7/23/2025 | 5.21% | £ | 5,000,000 | 6,667,495 | 5,976,039 | (6)(9) | |||||||||||||||||||||||
| 6,667,495 | 5,976,039 | ||||||||||||||||||||||||||||
| Total Non-Control/Non-Affiliate Investments (190.8% of net assets) | $ | 553,679,070 | $ | 542,778,029 | |||||||||||||||||||||||||
| Total Portfolio Investments (209.9% of net assets) | $ | 626,868,734 | $ | 597,104,447 | |||||||||||||||||||||||||
| Cash and Cash Equivalents and Restricted Cash | |||||||||||||||||||||||||||||
| JP Morgan Prime Money Market Fund, Institutional Shares | $ | 228,653 | $ | 228,653 | |||||||||||||||||||||||||
| Other cash accounts | 13,822,979 | 13,822,979 | |||||||||||||||||||||||||||
| Total Cash and Cash Equivalents and Restricted Cash (4.9% of net assets) | $ | 14,051,632 | $ | 14,051,632 | |||||||||||||||||||||||||
| Total Portfolio Investments, Cash and Cash Equivalents and Restricted Cash (214.9% of net assets) | $ | 640,920,366 | $ | 611,156,079 | |||||||||||||||||||||||||
94
| Portfolio Company/Type of Investment (1)(2)(9)(10)(17)(19) | Cash Interest Rate (8) | Industry | Principal (5) | Cost | Fair Value | |||||||||||
| Digital River, Inc. | Internet software & services | |||||||||||||||
| First Lien Term Loan, LIBOR+6.5% (1% floor) cash due 2/12/2021 (8)(13) | 7.50% | $ | 4,523,868 | $ | 4,349,859 | $ | 4,515,386 | |||||||||
| 4,349,859 | 4,515,386 | |||||||||||||||
| Research Now Group, Inc. | Data processing & outsourced services | |||||||||||||||
| Second Lien Term Loan, LIBOR+8.75% (1% floor) cash due 3/18/2022 (8) | 9.75% | 4,000,000 | 3,953,571 | 3,880,000 | ||||||||||||
| 3,953,571 | 3,880,000 | |||||||||||||||
| Fineline Technologies, Inc. | Electronic equipment & instruments | |||||||||||||||
| First Lien Term Loan, LIBOR+5.5% (1% floor) cash due 5/5/2017 (8)(13) | 6.50% | 10,942,464 | 10,942,464 | 10,912,302 | ||||||||||||
| 10,942,464 | 10,912,302 | |||||||||||||||
| My Alarm Center, LLC | Security & alarm services | |||||||||||||||
| First Lien Term Loan A, LIBOR+8% (1% floor) cash due 1/9/2019 (8)(13) | 9.00% | 16,047,619 | 16,047,619 | 16,075,921 | ||||||||||||
| First Lien Term Loan B, LIBOR+8% (1% floor) cash due 1/9/2019 (8) | 9.00% | 909,936 | 909,936 | 911,452 | ||||||||||||
| First Lien Term Loan C, LIBOR+8% (1% floor) cash due 1/9/2019 (8) | 9.00% | 757,592 | 757,592 | 757,750 | ||||||||||||
| First Lien Term Revolver, LIBOR+8% (1% floor) cash due 1/9/2019 (8) | 9.00% | 120,000 | 120,000 | 120,000 | ||||||||||||
| 17,835,147 | 17,865,123 | |||||||||||||||
| Legalzoom.com, Inc. | Specialized consumer services | |||||||||||||||
| First Lien Term Loan, LIBOR+7% (1% floor) cash due 5/13/2020 (8)(13) | 8.00% | 19,700,000 | 19,690,068 | 19,659,526 | ||||||||||||
| First Lien Revolver, LIBOR+7% (1% floor) cash due 5/13/2020 (8)(11) | 8.00% | (17,714 | ) | — | ||||||||||||
| First Lien Delayed Draw Term Loan, LIBOR+7% (1% floor) cash due 5/13/2020 (8) | 8.00% | 400,000 | 400,000 | 396,683 | ||||||||||||
| 20,072,354 | 20,056,209 | |||||||||||||||
| Raley's | Food retail | |||||||||||||||
| First Lien Term Loan, LIBOR+6.25% (1% floor) cash due 5/18/2022 (8)(13) | 7.25% | 3,319,504 | 3,254,099 | 3,325,728 | ||||||||||||
| 3,254,099 | 3,325,728 | |||||||||||||||
| Aptos, Inc. | Data processing & outsourced services | |||||||||||||||
| First Lien Term Loan, LIBOR+6.75% (1% floor) cash due 9/1/2022 (8)(13) | 7.75% | 6,000,000 | 5,881,667 | 5,940,000 | ||||||||||||
| 5,881,667 | 5,940,000 | |||||||||||||||
| All Web Leads, Inc. | Advertising | |||||||||||||||
| First Lien Term Loan, LIBOR+6.5% (1% floor) cash due 6/30/2020 (8)(13) | 7.50% | 29,808,067 | 29,808,066 | 29,983,454 | ||||||||||||
| First Lien Revolver, LIBOR+6.5% (1% floor) cash due 6/30/2020 (8) | 7.50% | — | — | |||||||||||||
| 29,808,066 | 29,983,454 | |||||||||||||||
| Too Faced Cosmetics, LLC | Personal products | |||||||||||||||
| First Lien Term Loan, LIBOR+5% (1% floor) cash due 7/7/2021 (8)(13) | 6.00% | 1,285,383 | 1,285,383 | 1,290,310 | ||||||||||||
| 1,285,383 | 1,290,310 | |||||||||||||||
| Internet Pipeline, Inc. | Internet software & services | |||||||||||||||
| First Lien Term Loan, LIBOR+7.25% (1% floor) cash due 8/4/2022 (8)(13) | 8.25% | 11,880,000 | 11,880,000 | 12,045,801 | ||||||||||||
| First Lien Revolver, LIBOR+7.25% (1% floor) cash due 8/4/2021 (8) | 8.25% | — | — | |||||||||||||
| 11,880,000 | 12,045,801 | |||||||||||||||
Oaktree Strategic Income Corporation
Consolidated Schedule of Investments
September 30, 20162019
| Derivatives Instrument | Notional Amount Purchased / (Sold) in U.S. Dollars | Notional Amount Purchased / (Sold) in Local Currency | Maturity Date | Counterparty | Cumulative Unrealized Appreciation (Depreciation) | |||||||||||||||||||||||||||
| Foreign currency forward contract | $ | 6,106,199 | £ | (4,934,900) | 10/15/2019 | JPMorgan Chase Bank, N.A. | $ | 20,876 | ||||||||||||||||||||||||
| Portfolio Company/Type of Investment (1)(2)(9)(10)(17)(19) | Cash Interest Rate (8) | Industry | Principal (5) | Cost | Fair Value | |||||||||||
| Poseidon Merger Sub, Inc. | Advertising | |||||||||||||||
| Second Lien Term Loan, LIBOR+8.5% (1% floor) cash due 8/15/2023 (8) | 9.50% | $ | 7,000,000 | $ | 6,980,768 | $ | 7,012,868 | |||||||||
| 6,980,768 | 7,012,868 | |||||||||||||||
| American Seafoods Group LLC | Food distributors | |||||||||||||||
| First Lien Term Loan, LIBOR+5% (1% floor) cash due 8/19/2021 (8)(13) | 6.00% | 2,780,556 | 2,736,111 | 2,773,604 | ||||||||||||
| Second Lien Term Loan, LIBOR+9% (1% floor) cash due 2/19/2022 (8) | 10.00% | 3,000,000 | 2,975,385 | 2,850,000 | ||||||||||||
| 5,711,496 | 5,623,604 | |||||||||||||||
| CRGT Inc. | IT consulting & other services | |||||||||||||||
| First Lien Term Loan, LIBOR+6.5% (1% floor) cash due 12/19/2020 (8)(13) | 7.50% | 3,440,713 | 3,433,096 | 3,449,315 | ||||||||||||
| 3,433,096 | 3,449,315 | |||||||||||||||
| Valet Merger Sub, Inc. | Environmental & facilities services | |||||||||||||||
| First Lien Term Loan, LIBOR+7% (1% floor) cash due 9/24/2021 (8)(13) | 8.00% | 5,940,000 | 5,905,025 | 6,040,239 | ||||||||||||
| First Lien Revolver, LIBOR+7% (1% floor) cash due 9/24/2021 (8) | 8.00% | 500,000 | 486,811 | 500,000 | ||||||||||||
| 6,391,836 | 6,540,239 | |||||||||||||||
| Baart Programs, Inc. | Healthcare services | |||||||||||||||
| First Lien Term Loan, LIBOR+7.75% cash due 10/9/2021 (8)(13) | 8.42% | 7,661,077 | 7,377,745 | 7,647,291 | ||||||||||||
| First Lien Revolver, LIBOR+7.75% cash due 10/9/2021 (8)(11) | 8.42% | (12,500 | ) | — | ||||||||||||
| 7,365,245 | 7,647,291 | |||||||||||||||
| DigiCert, Inc. | Internet software & services | |||||||||||||||
| Second Lien Term Loan, LIBOR+9% (1% floor) cash due 10/21/2022 (8) | 10.00% | 2,000,000 | 1,982,857 | 2,032,529 | ||||||||||||
| 1,982,857 | 2,032,529 | |||||||||||||||
| Lytx, Inc. | Research & consulting services | |||||||||||||||
| First Lien Term Loan, LIBOR+8.5% (1% floor) cash due 3/15/2023 (8) | 9.50% | 9,951,389 | 9,951,389 | 9,951,389 | ||||||||||||
| 500 Class A Units in Lytx Holdings, LLC | 500,000 | 504,173 | ||||||||||||||
| 10,451,389 | 10,455,562 | |||||||||||||||
| Onvoy, LLC | Integrated telecommunication services | |||||||||||||||
| First Lien Term Loan, LIBOR+6.25% (1% floor) cash due 4/29/2021 (8)(13) | 7.25% | 10,368,750 | 10,173,233 | 10,341,433 | ||||||||||||
| 10,173,233 | 10,341,433 | |||||||||||||||
| 4 Over International, LLC | Commercial printing | |||||||||||||||
| First Lien Term Loan, LIBOR+6.0% (1% floor) cash due 6/7/2022 (8)(13) | 7.00% | 5,970,000 | 5,913,333 | 5,929,733 | ||||||||||||
| First Lien Revolver LIBOR+6.0% (1% floor) cash due 6/7/2021 (8)(11) | 7.00% | (639 | ) | — | ||||||||||||
| 5,912,694 | 5,929,733 | |||||||||||||||
| OBHG Management Services, LLC | Healthcare services | |||||||||||||||
| First Lien Term Loan, LIBOR+5.25% (1% floor) cash due 6/28/2022 (8)(13) | 6.25% | 16,123,227 | 16,117,309 | 16,076,397 | ||||||||||||
| First Lien Revolver, LIBOR+5.25% (1% floor) cash due 6/28/2021 (8)(11) | 6.25% | (39 | ) | — | ||||||||||||
| 16,117,270 | 16,076,397 | |||||||||||||||
| Ancile Solutions, Inc. | Internet software & services | |||||||||||||||
| First Lien Term Loan, LIBOR+7% (1% floor) cash due 6/30/2021 (8)(13) | 8.00% | 11,000,000 | 10,692,000 | 10,835,000 | ||||||||||||
| 10,692,000 | 10,835,000 | |||||||||||||||
| See notes to Consolidated Financial Statements. | ||||||||||||||||
(4)Each of Investmentsthe Company's investments is pledged as collateral under one or more of its credit facilities. A single investment may be divided into parts that are individually pledged as collateral to separate credit facilities.
(5)Equity ownership may be held in shares or units of companies related to the portfolio companies.
(6)The interest rate on the principal balance outstanding for all floating rate loans is indexed to LIBOR and/or an alternate base rate (e.g., prime rate), which typically resets semi-annually, quarterly, or monthly at the borrower's option. The borrower may also elect to have multiple interest reset periods for each loan. For each of these loans, the Company has provided the applicable margin over LIBOR or the alternate base rate based on each respective credit agreement and the cash interest rate as of period end. All LIBOR shown above is in U.S. dollars unless otherwise noted. As of September 30, 2016
2019, the reference rates for the Company's variable rate loans were the 30-day LIBOR at 2.04%, the 60-day LIBOR at 2.09%, the 90-day LIBOR at 2.10%, the 180-day LIBOR at 2.06%, the PRIME at 5.00% and the 30-day UK LIBOR at 0.71%. Most loans include an interest floor, which generally ranges from 0% to 1%.(7)Principal includes accumulated PIK interest and is net of repayments, if any. “£” signifies the investment is denominated in British Pounds. All other investments are denominated in U.S. dollars.
(8)Control Investments generally are defined by the Investment Company Act as investments in companies in which the Company owns more than 25% of the voting securities or maintains greater than 50% of the board representation.
| Portfolio Company/Type of Investment (1)(2)(9)(10)(17)(19) | Cash Interest Rate (8) | Industry | Principal (5) | Cost | Fair Value | |||||||||||
| Pomeroy Group Holdings, Inc. | IT consulting & other services | |||||||||||||||
| First Lien Term Loan, LIBOR+6% (1% floor) cash due 11/30/2021 (8)(13) | 7.00% | $ | 4,488,693 | $ | 4,357,979 | $ | 4,393,309 | |||||||||
| 4,357,979 | 4,393,309 | |||||||||||||||
| Sailpoint Technologies, Inc. | Application software | |||||||||||||||
| First Lien Term Loan, LIBOR+8% (1% floor) cash due 8/16/2021 (8) | 9.00% | 12,500,000 | 12,258,333 | 12,250,000 | ||||||||||||
| First Lien Revolver, LIBOR+8% (1% floor) cash due 8/16/2021 (8)(11) | 9.00% | (3,867 | ) | — | ||||||||||||
| 12,254,466 | 12,250,000 | |||||||||||||||
| California Pizza Kitchen, Inc. (16) | Restaurants | |||||||||||||||
| First Lien Term Loan, LIBOR+6% (1% floor) cash due 8/23/2022 (8) | 7.00% | 5,000,000 | 5,000,000 | 4,985,425 | ||||||||||||
| 5,000,000 | 4,985,425 | |||||||||||||||
| Total Non-Control/Non-Affiliate Investments (152.6% of net assets) | $ | 513,397,659 | $ | 497,281,256 | ||||||||||||
| Total Portfolio Investments (176.0% of net assets) | $ | 600,468,963 | $ | 573,604,381 | ||||||||||||
| Cash and Cash Equivalents | ||||||||||||||||
Wells Fargo Bank Institutional Money Market Fund | $ | 18,856,559 | $ | 18,856,559 | ||||||||||||
| Other cash accounts | 922,282 | 922,282 | ||||||||||||||
| Total Cash and Cash Equivalents (6.1% of net assets) | $ | 19,778,841 | $ | 19,778,841 | ||||||||||||
| Total Portfolio Investments, Cash and Cash Equivalents (182.1% of net assets) | $ | 620,247,804 | $ | 593,383,222 | ||||||||||||
(10)As defined in the Investment Company Act, the Company is deemed to be both an "Affiliated Person" of and to "Control" this portfolio company as the Company owns more than 25% of the portfolio company's outstanding voting securities or has the power to exercise control over management or policies of such portfolio company (including through a management agreement). See Schedule 12-14 in the accompanying notes to the Consolidated Financial Statements for transactions in which the issuer was both an Affiliated Person and a portfolio company that the Company is deemed to control.
(11)See Note 3 to the Consolidated Financial Statements for portfolio composition.
(12)This investment was valued using net asset value as a practical expedient for fair value. Consistent with ASC 820, these investments are excluded from the hierarchical levels.
(13)Non-Control/Non-Affiliate Investments are investments that are neither Control Investments nor Affiliate Investments. Affiliate Investments generally are defined by the Investment Company Act as investments in companies in which the Company owns between 5% and 25% of the voting securities.
(14)Investment has undrawn commitments. Unamortized fees are classified as unearned income which reduces cost basis, which may result in a negative cost basis. A negative fair value may result from the unfunded commitment being valued below par.
(15)As of September 30, 2019, these investments are categorized as Level 3 within the fair value hierarchy established by ASC 820.
See notes to Consolidated Financial Statements.
OAKTREE STRATEGIC INCOME CORPORATION
NOTES TO CONSOLIDATED FINANCIAL STATEMENTS
Note 1. Organization
Oaktree Strategic Income Corporation (formerly known as Fifth Street Senior Floating Rate Corp. through October 17, 2017), (together with its consolidated subsidiaries, the "Company") is a specialty finance company that islooks to provide customized capital solutions for middle-market companies in both the syndicated and private placement markets. The Company was formed in May 2013 and operates as a closed-end, externally managed, non-diversified management investment company that has elected to be regulated as a business development companyBusiness Development Company ("BDC") under the 1940Investment Company Act. The Company has qualified and elected to be treated as a regulated investment company ("RIC") under the Internal Revenue Code of 1986, as amended (the "Code"), for tax purposes.
Note 2. Significant Accounting Policies
Basis of Presentation:
The Consolidated Financial Statements of the Company have been prepared in accordance with accounting principles generally accepted in the United States of America ("GAAP") and pursuant to the requirements for reporting on Form 10-K and Regulation S-X. All intercompany balances and transactions have been eliminated. The Company is an investment company following the accounting and reporting guidance in FASB ASC Topic 946, Financial Services - Investment Companies ("ASC 946").
Use of Estimates:
The preparation of the financial statements in conformity with GAAP requires management to make certain estimates and assumptions affecting amounts reported in the financial statements and accompanying notes. These estimates are based on the information that is currently available to the Company and on various other assumptions that the Company believes to be reasonable under the circumstances. Changes in the economic and political environments, financial markets and any other parameters used in determining these estimates could cause actual results to differ and such differences could be material. Significant estimates include the valuation of investments and revenue recognition.
Consolidation:
The accompanying Consolidated Financial Statements include the accounts of Oaktree Strategic Income Corporation and its consolidated subsidiaries. Each consolidated subsidiary is wholly-owned and, as such, consolidated into the Consolidated Financial Statements. Certain subsidiaries that hold investments are treated as pass through entities for tax purposes. The assets of certain of the Company's consolidated subsidiaries are not directly available to satisfy the claims of the creditors of the CompanyOaktree Strategic Income Corporation or any of its other subsidiaries.
96
OAKTREE STRATEGIC INCOME CORPORATION
NOTES TO CONSOLIDATED FINANCIAL STATEMENTS
Fair Value Measurements:
Hierarchical levels, defined by ASC 820 and directly related to the amount of subjectivity associated with the inputs to fair valuation of these assets and liabilities, are as follows:
•Level 1 — Unadjusted, quoted prices in active markets for identical assets or liabilities atas of the measurement date.
•Level 2 — Observable inputs other than Level 1 prices, such as quoted prices for similar assets or liabilities; quoted prices in markets that are not active; or other inputs that are observable or can be corroborated by observable market data at the measurement date for substantially the full term of the assets or liabilities.
•Level 3 — Unobservable inputs that reflect management's best estimate of what market participants would use in pricing the asset or liability at the measurement date. Consideration is given to the risk inherent in the valuation technique and the risk inherent in the inputs to the model.
If inputs used to measure fair value fall into different levels of the fair value hierarchy, an investment's level is based on the lowest level of input that is significant to the fair value measurement. The Company's assessment of the significance of a particular input to the fair value measurement in its entirety requires judgment and considers factors specific to the investment. This includes investment securities that are valued using "bid" and "ask" prices obtained from independent third party pricing services or directly from brokers. These investments may be classified as Level 3 because the quoted prices may be indicative in nature for securities that are in an inactive market, may be for similar securities or may require adjustments for investment-specific factors or restrictions.
Financial instruments with readily available quoted prices generally will have a higher degree of market price observability and a lesser degree of judgment inherent in measuring fair value. As such, the Investment AdviserOaktree obtains and analyzes readily available market quotations provided by independent pricing servicesvendors and brokers for all of the Company's first lien and second lien ("senior secured") debt investments for which quotations are available. In determining the fair value of a particular investment, pricing servicesvendors and brokers use observable market information, including both binding and non-binding indicative quotations.
The Investment Adviser evaluatesCompany seeks to obtain at least two quotations for the subject or similar securities, typically from pricing vendors. If the Company is unable to obtain two quotes from pricing vendors, or if the prices obtained from independent pricing servicesvendors are not within the Company's set threshold, the Company seeks to obtain a quote directly from a broker making a market for the asset. Oaktree evaluates the quotations provided by pricing vendors and company specific data that could affect the credit quality and/or fair valuebrokers based on available market information, including trading activity of the investment. Investments for which market quotationssubject or similar securities, or by performing a comparable security analysis to ensure that fair values are readily available may be valued at such market quotations.reasonably estimated. Oaktree also performs back-testing of valuation information obtained from pricing vendors and brokers against actual prices received in transactions. In orderaddition to validate market quotations,ongoing monitoring and back-testing, Oaktree performs due diligence procedures over pricing vendors to understand their methodology and controls to support their use in the Investment Adviser looks at a number of factors to determine ifvaluation process. Generally, the quotations are representative of fair value, including the source and nature of the quotations. The Investment AdviserCompany does not adjust any of the prices unless it has a reasonreceived from these sources.
If the quotations obtained from pricing vendors or brokers are determined to believe market quotationsnot be reliable or are not reflective of the fair value of an investment. Examples of events that would cause market quotations to not reflect fair value could include cases when a security trades infrequently causing a quoted purchase or sale price to become stale or in the event of a "fire sale" by a distressed seller. In these instances,readily available, the Company values such investments by using the valuation procedure that it uses with respect to assets for which market quotations are not readily available (as discussed below).
("EV") of the portfolio company. EV means the entire value of the portfolio company to a market participant, including the sum of the values of debt and equity securities used to capitalize the enterprise at a point in time. The EV analysis is typically performed to determine (i) the value of equity investments, to determine if(ii) whether there is credit impairment for debt investments and to determine(iii) the value for debt investments that the Company is deemed to control under the 1940Investment Company Act. To estimate the EV of a portfolio company, the Investment AdviserOaktree analyzes various factors, including the portfolio company’s historical and projected financial results, macroeconomic impacts on the company and competitive dynamics in the company’s industry. The Investment AdviserOaktree also utilizes some or all of the following information based on the individual circumstances of the portfolio company, including:company: (i) valuations of comparable public companies, (ii) recent sales of private and public comparable companies in similar industries or having similar business or earnings characteristics, (iii) purchase price multiplesprices as a multiple of their earnings or cash flow, (iv) the portfolio company’s ability to meet its forecasts and its business prospects, (v) a discounted cash flow analysis, (vi) estimated liquidation or collateral value of the portfolio company's assets and (vii) offers from third parties to buy the portfolio company. The Company may probability weight potential sale outcomes with respect to a portfolio company due to thewhen uncertainty that exists as of the valuation date. The third valuation technique is a market yield technique, which is typically performed for non-credit impaired debt investments. To determine fair value using aIn the market
97
OAKTREE STRATEGIC INCOME CORPORATION
NOTES TO CONSOLIDATED FINANCIAL STATEMENTS
yield technique, a current price is imputed for the investment based upon an assessment of the expected market yield for a similarly structured investment with a similar level of risk. In the market yield technique,risk, and the Company considers the current contractual interest rate, the capital structure and other terms of the investment relative to risk of the company and the specific investment. A key determinant of risk, among other things, is the leverage through the investment relative to the EV of the portfolio company. As debt investments held by the Company are substantially illiquid with no active transaction market, the Company depends on primary market data, including newly funded transactions and industry specific market movements, as well as secondary market data with respect to high yield debt instruments and syndicated loans, as inputs in determining the appropriate market yield, as applicable.
In accordance with ASC 820-10, certain investments that qualify as investment companies in accordance with ASC 946 may be valued using net asset value as a practical expedient for fair value. Consistent with FASB guidance under ASC 820, these investments are excluded from the hierarchical levels. These investments are generally not redeemable.
The Company estimates the fair value of privately held warrants using a Black Scholes pricing model, which includes an analysis of various factors and subjective assumptions, including the current stock price (by using an EV analysis as described above), the expected period until exercise, expected volatility of the underlying stock price, expected dividends and the risk free rate. Changes in the subjective input assumptions can materially affect the fair value estimates.
The Company's Board of Directors undertakes a multi-step valuation process each quarter in connection with determining the fair value of the Company's investments:
•The quarterly valuation process begins with each portfolio company or investment being initially valued by the Investment Adviser'sOaktree's valuation team in conjunction with the Investment Adviser'sOaktree's portfolio management team and investment professionals responsible for each portfolio investment;
•Preliminary valuations are then reviewed and discussed with management of the Investment Adviser;Oaktree;
•Separately, independent valuation firms engaged by the Board of Directors prepare valuations of the Company's investments, on a selected basis, for which market quotations are not readily available or are readily available but deemed not reflective of the fair value of the investment, and submit the reports to the Company and provide such reports to the Investment AdviserOaktree and the Audit Committee of the Board of Directors;
•The Audit Committee of the Board of Directors reviews the preliminary valuations with the Investment Adviser,Oaktree, and the Investment AdviserOaktree responds and supplements the preliminary valuations to reflect any discussions between the Investment AdviserOaktree and the Audit Committee;
•The Audit Committee of the Board of Directors makes a recommendation to the full Board of Directors regarding the fair value of the investments in the Company's portfolio; and
•The Board of Directors discusses valuations and determines the fair value of each investment in the Company's portfolio.
The fair value of the Company's investments atas of September 30, 20172020 and September 30, 20162019 was determined in good faith by the Board of Directors. The Board of Directors has authorized the engagement of independent valuation firms to provide valuation assistance. The Companyand will continue to engage independent valuation firms to provide assistance regarding the determination of the fair value of a portion of the Company's portfolio securities for which market quotations are not readily available or are readily available but deemed not reflective of the fair value of the investment each quarter, and the Board of Directors may reasonably rely on that assistance. As of September 30, 2017, 84.5% of the Company's portfolio at fair value was valued either using market quotations or
Due to the inherent uncertainty of determining the fair value of investments that do not have a readily available market value, the fair value of the Company’s investments may fluctuate from period to period. Because of the inherent uncertainty of valuation, these estimated values may differ significantly from the values that would have been reported had a ready market for the investments existed, and it is reasonably possible that the difference could be material.
With the exception of the line items entitled "deferred financing costs," "deferred offering costs," "other assets," "credit facilities payable" and "secured borrowings" which are reported at amortized cost, all assets and liabilities approximate fair value on the Consolidated Statements of Assets and Liabilities. The carrying value of the line items titled "interest, dividends and fees receivable," "due from portfolio companies," "receivables from unsettled transactions," "accounts payable, accrued expenses and other liabilities," "base management fee and incentive fee payable," "due to affiliate," "interest payable," "payables from unsettled transactions" and "director fees payable" approximate fair value due to their short maturities.
98
OAKTREE STRATEGIC INCOME CORPORATION
NOTES TO CONSOLIDATED FINANCIAL STATEMENTS
Foreign Currency Translation:
The accounting records of the Company are maintained in U.S. dollars. All assets and liabilities denominated in foreign currencies are translated into U.S. dollars based on the prevailing foreign exchange rate on the reporting date. The Company does not isolate that portion of the results of operations resulting from changes in foreign exchange rates on investments from the fluctuations arising from changes in market prices of securities held. The Company’s investments in foreign securities may involve certain risks, including foreign exchange restrictions, expropriation, taxation or other political, social or economic risks, all of which could affect the market and/or credit risk of the investment. In addition, changes in the relationship of foreign currencies to the U.S. dollar can significantly affect the value of these investments and therefore the earnings of the Company.
Derivative Instruments:
The Company does not utilize hedge accounting and as such values its derivative instruments at fair value with the unrealized gains or losses recorded in “net unrealized appreciation (depreciation)” in the Company’s Consolidated Statements of Operations.
Secured Borrowings:
Securities sold and simultaneously repurchased at a premium are reported as financing transactions in accordance with ASC 860. Amounts payable to the counterparty are due on the repurchase settlement date and, excluding accrued interest, such amounts are presented in the accompanying Statements of Assets and Liabilities as secured borrowings. Premiums payable are separately reported as accrued interest.
Investment Income:
Interest Income
Interest income, adjusted for accretion of original issue discount ("OID"), is recorded on an accrual basis to the extent that such amounts are expected to be collected. The Company stops accruing interest on investments when it is determined that interest is no longer collectible. Investments that are expected to pay regularly scheduled interest in cash are generally placed on non-accrual status when there is reasonable doubt that principal or interest cash payments will be collected. Cash interest payments received on investments may be recognized as income or a return of capital depending upon management’s judgment. SuchA non-accrual investments areinvestment is restored to accrual status if past due principal and interest are paid in cash and the portfolio companies,company, in management's judgment, areis likely to continue timely payment of theirits remaining interest.obligations.
In connection with its investment in a portfolio company, the Company sometimes receives nominal cost equity that is valued as part of the negotiation process with the portfolio company. When the Company receives nominal cost equity, the Company allocates its cost basis in the investment between debt securities and the nominal cost equity at the time of origination. Any resulting discount from recording the loan, or otherwise purchasing a security at a discount, is accreted into interest income over the life of the loan.
For the Company’sCompany's secured borrowings, the interest earned on the entire loan balance is recorded within interest income and the interest earned by the buyer from the partial loan salescounterparty is recorded within interest expense in the Consolidated Statements of Operations.
PIK Interest Income
The Company's investments in debt securities may contain PIK interest provisions. PIK interest, which generally represents contractually deferred interest added to the loan balance that is generally due at the end of the loan term, is generally recorded on the accrual basis to the extent such amounts are expected to be collected. The Company generally ceases accruing PIK interest if there is insufficient value to support the accrual or if the Company does not expect the portfolio company to be able to pay all principal and interest due. The Company's decision to cease accruing PIK interest on a loan or debt security involves subjective judgments and determinations based on available information about a particular portfolio company, including whether the portfolio company is current with respect to its payment of principal and interest on its loans and debt securities; financial statements and financial projections for the portfolio company; the Company's assessment of the portfolio company's business development success; information obtained by the Company in connection with periodic formal update interviews with the portfolio company's management and, if appropriate, the private equity sponsor; and information about the general economic and market conditions in which the portfolio company operates. Based on this and other information, the Company determines whether to cease accruing PIK interest on a loan or debt security. The Company's determination to cease accruing PIK interest on a loan or debt security is generally made well before the Company's full write-down of sucha loan or debt security. In addition, if it is subsequently determined that the Company will not be able to collect any previously accrued PIK interest, the fair value of the loans or debt securities would be reduced by the amount of such previously accrued, but uncollectible, PIK interest. The accrual of PIK interest on the Company’s debt investments increases the recorded cost bases of these investments in the consolidated financial statements and, as a result, increases the cost bases of these investmentsConsolidated Financial Statements including for purposes of computing the capital gaingains incentive fee payable by the Company to the Investment Adviser.Oaktree. To maintain
99
OAKTREE STRATEGIC INCOME CORPORATION
NOTES TO CONSOLIDATED FINANCIAL STATEMENTS
its status as a RIC, certain income from PIK interest mustmay be paid outrequired to be distributed to the Company’s stockholders, as distributions, even though the Company has not yet collected the cash and may never collect the cash relating to the PIK interest.do so.
Fee Income
Oaktree or its affiliates may provide financial advisory services to portfolio companies, and in return, the Company may receive fees for capital structuring services. These fees are generally nonrecurring and are recognized by the Company upon the investment closing date. The Company receives a variety ofmay also receive additional fees in the ordinary course of business, including servicing, advisory, amendment, structuring and prepayment fees, which are classified as fee income and recognized as they are earned.earned or the services are rendered.
The Company has also structured exit fees across certain of its portfolio investments to be received upon the future exit of those investments. These fees are typically paid to the Company upon the earliest to occur of (i) a sale of the borrower or substantially all of the assets of the borrower, (ii) the maturity date of the loan or (iii) the date when full prepayment of the loan occurs. The receipt of such fees is contingent upon the occurrence of one of the events listed above for each of the investments. These fees are included in net investment income over the life of the loan.
Dividend Income
The Company generally recognizes dividend income on the ex-dividend date.date for public securities and the record date for private equity investments. Distributions received from private equity investments are evaluated to determine if the distribution should be recorded as dividend income or a return of capital. Generally, the Company will not record distributions from suchprivate equity investments as dividend income unless there are sufficient earnings at the portfolio company prior to the distribution. Distributions that are classified as a return of capital are recorded as a reduction in the cost basis of the investment.
Cash and Cash Equivalents and Restricted Cash:
Cash and cash equivalents and restricted cash consist of demand deposits and highly liquid investments with maturities of three months or less when acquired. The Company places its cash and cash equivalents and restricted cash with financial institutions and, at times, cash held in bank accounts may exceed the Federal Deposit Insurance Corporation ("FDIC") insurance limit. Cash and cash equivalents are classified as Level 1 assets and restricted cash are included on the Company's Consolidated Schedule of Investments.Investments and cash equivalents are classified as Level 1 assets.
As of September 30, 2017,2020, included in restricted cash was $7.4$4.1 million that was held at Wells Fargo Bank, N.A. in connection with the Company's Citibank facilityFacility and 2015 Debt Securitization (asDeutsche Bank Facility (each as defined in Note 6 —– Borrowings). Pursuant, and $0.3 million that was held at U.S. Bank National Association as collateral in connection with the ISDA Master Agreement (as defined in Note 13 - Derivative Instruments) with JPMorgan Chase Bank N.A. Of the $4.1 million of restricted cash held at Wells Fargo Bank, N.A., pursuant to the terms of the Citibank facility,Facility, the Company was restricted in terms of access to $2.0 million of that amount until such time asthe occurrence of the Company submitsperiodic distribution dates and, in connection therewith, the Company’s submission of its required monthlyperiodic reporting schedules.schedules and verifications of the Company’s compliance with the terms of the credit agreement. As of September 30, 2017, $5.42020, the remaining $2.1 million of cash held in connection with the 2015 Debt Securitizationat Wells Fargo Bank, N.A. was restricted due to the obligation to pay interest on the notes under the terms of the 2015 Debt Securitization.Deutsche Bank Facility.
As of September 30, 2016,2019, included in restricted cash was $9.0$7.6 million that was held at Wells Fargo Bank, N.A. in connection with the Company's Citibank facilityFacility and 2015 Debt Securitization. PursuantDeutsche Bank Facility and $0.8 million held at East West Bank in connection with the Company's East West Bank Facility (as defined in Note 6 – Borrowings). Of the $7.6 million of restricted cash held at Wells Fargo Bank, N.A., pursuant to the terms of the Citibank facility,Facility, the Company was restricted in terms of access to $3.5$3.4 million of that amount until such time asthe occurrence of the Company submitsperiodic distribution dates and, in connection therewith, the Company’s submission of its required monthlyperiodic reporting schedules.schedules and verifications of the Company’s compliance with the terms of the credit agreement. As of September 30, 2016, $5.52019, the remaining $4.3 million of cash held in connection with the 2015 Debt Securitizationat Wells Fargo Bank, N.A. was restricted due to the obligation to pay interest on the notes under the terms of the 2015 Debt Securitization.Deutsche Bank Facility. As of September 30, 2019, $0.8 million held at East West Bank was restricted due to minimum balance requirements under the East West Bank Facility.
Due from Portfolio Companies:
Due from portfolio companies consists of amounts payable to the Company from its portfolio companies, including proceeds from the sale of portfolio companies not yet received or being held in escrow, and excluding those amounts attributable to interest, dividends or fees receivable. These amounts are recognized as they become payable to the Company (e.g., principal payments on the scheduled amortization payment date).
100
OAKTREE STRATEGIC INCOME CORPORATION
NOTES TO CONSOLIDATED FINANCIAL STATEMENTS
Receivables/Payables Fromfrom Unsettled Transactions:
Receivables/payables from unsettled transactions consistsconsist of amounts receivable to or payable by the Company for transactions that have not settled at the reporting date.
Deferred Financing Costs:
Deferred financing costs consist of fees and expenses paid in connection with the closing or amending of credit facilities and debt offerings. Deferred financing costs in connection with credit facilities are capitalized as an asset at the time of payment.when incurred. Deferred financing costs in connection with all other debt arrangements are a direct deduction from the related debt liability at the time of payment.when incurred. Deferred financing costs are amortized either using the straight line method or effective interest method over the termsterm of the respective debt arrangement, as appropriate.arrangement. This amortization expense is included in interest expense in the Company's Consolidated Statements of Operations. Upon early termination or modification of a credit facility, all or a portion of unamortized fees related to such facility may be accelerated into interest expense.
Deferred Offering Costs:
Income Taxes:
The Company has elected to be subject to tax as a RIC under Subchapter M of the Code and operates in a manner so as to qualify for the tax treatment applicable to RICs. In order to be subject to tax as a RIC, among other things, the Company is required to meet certain source of income and asset diversification requirements and timely distribute dividends to its stockholders of an amount generally at least equal to 90% of investment company taxable income, as defined by the Code and determined without regard to any deduction for dividends paid, for each taxable year. As a RIC, the Company is not subject to federal income tax on the portion of its taxable income and gains distributed currently to stockholders as a dividend. Depending on the level of taxable income earned during a taxable year, the Company may choose to retain taxable income in excess of current year dividend distributions and would distribute such taxable income in the next taxable year. The Company would then incur a 4% excise tax on such income, as required. To the extent that the Company determines that its estimated current year annual taxable income, determined on a calendar year basis, could exceed estimated current calendar year dividend distributions, the Company accrues excise tax, if any, on estimated excess taxable income as taxable income is earned. The Company anticipates timely distribution of its taxable income within the tax rules under Subchapter M of the Code. The Company did not incur a U.S. federal excise tax for calendar years 20152018 and 20162019, and does not expect to incur a U.S. federal excise tax for calendar year 2017. 2020.
The Company may incur a U.S. federal excise tax in future years.
assets and liabilities using the enacted tax rates expected to apply to taxable income in the years in which it expects to recover or settle those temporary differences.
FASB ASC Topic 740, Accounting for Uncertainty in Income Taxes ("ASC 740"), provides guidance for how uncertain tax positions should be recognized, measured, presented, and disclosed in the Company's Consolidated Financial Statements. ASC 740 requires the evaluation of tax positions taken or expected to be taken in the course of preparing the Company's tax returns to determine whether the tax positions are "more-likely-than-not" of being sustained by the applicable tax authority. Tax positions not deemed to meet the more-likely-than-not threshold are recorded as a tax benefit or expense in the current year. Management's determinations regarding ASC 740 may be subject to review and adjustment at a later date based upon factors including but not limited to, an ongoing analysis of tax laws, regulations and interpretations thereof. The Company recognizes the tax benefits of uncertain tax positions only where the position is "more likely than not" to be sustained assuming examination by tax authorities. Management has analyzed the Company's tax positions, and has concluded that no liability for unrecognized tax benefits should be recorded related to uncertain tax positions taken on returns
101
OAKTREE STRATEGIC INCOME CORPORATION
NOTES TO CONSOLIDATED FINANCIAL STATEMENTS
filed for open tax years 2014, 20152017, 2018 or 2016.2019. The Company identifies its major tax jurisdictions as U.S. Federal and Connecticut,California, and the Company is not aware of any tax positions for which it is reasonably possible that the total amounts of unrecognized tax benefits will change materially in the next 12 months.
Recent Accounting Pronouncements:
Note 3. Portfolio Investments
As of September 30, 2020 and September 30, 2019, the Company's equity investments consisted of investments in the LLC equity interests, of FSFR Glick JVcommon stock and 1.4% consisted of equity investmentswarrants in other portfolio companies. These instruments generally do not produce a current return but are held for potential investment appreciation and capital gain.
During the years ended September 30, 2017, 20162020, 2019 and 2015,2018, the Company recorded net realized gain (loss) on investments and secured borrowingslosses of $(13.4)$10.3 million, $(12.8)$0.5 million, and $0.4$27.7 million, respectively. During the years ended September 30, 2017, 20162020, 2019 and 2015,2018, the Company recorded net unrealized depreciation on investments and secured borrowingsappreciation (depreciation) of $17.8$(7.2) million, $17.0$(13.7) million, and $12.8$28.6 million, respectively.
The composition of the Company's investments as of September 30, 20172020 and September 30, 20162019 at cost and fair value was as follows:
| September 30, 2020 | September 30, 2019 | |||||||||||||||||||||||||
| Cost | Fair Value | Cost | Fair Value | |||||||||||||||||||||||
| Senior secured loans | $ | 464,459,378 | $ | 450,508,104 | $ | 553,679,070 | $ | 542,484,690 | ||||||||||||||||||
| OCSI Glick JV subordinated notes | 65,045,551 | 49,409,901 | 66,077,913 | 54,326,418 | ||||||||||||||||||||||
| OCSI Glick JV equity interests | 7,111,751 | — | 7,111,751 | — | ||||||||||||||||||||||
| Equity securities, excluding the OCSI Glick JV | 2,448,427 | 2,375,360 | — | 293,339 | ||||||||||||||||||||||
| Total | $ | 539,065,107 | $ | 502,293,365 | $ | 626,868,734 | $ | 597,104,447 | ||||||||||||||||||
102
| September 30, 2017 | September 30, 2016 | |||||||||||||||
| Cost | Fair Value | Cost | Fair Value | |||||||||||||
| Investments in debt securities (senior secured) | $ | 523,384,267 | $ | 501,769,997 | $ | 518,778,491 | $ | 502,385,158 | ||||||||
| Investments in equity securities (common stock, preferred stock and warrants) | 10,365,425 | 1,059,989 | 10,572,966 | 7,902,556 | ||||||||||||
| Debt investment in FSFR Glick JV | 64,228,881 | 57,606,674 | 64,005,755 | 56,885,646 | ||||||||||||
| Equity investment in FSFR Glick JV | 7,111,751 | — | 7,111,751 | 6,431,021 | ||||||||||||
| Total | $ | 605,090,324 | $ | 560,436,660 | $ | 600,468,963 | $ | 573,604,381 | ||||||||
OAKTREE STRATEGIC INCOME CORPORATION
NOTES TO CONSOLIDATED FINANCIAL STATEMENTS
The following table presents the composition of the Company's debt investments as of September 30, 2020 and September 30, 2019 at floating rates and fixed rates:
| September 30, 2020 | September 30, 2019 | |||||||||||||||||||||||||
| Fair Value | % of Debt Portfolio | Fair Value | % of Debt Portfolio | |||||||||||||||||||||||
| Floating rate debt securities, including debt investments in the OCSI Glick JV | $ | 490,506,890 | 98.12 | % | $ | 596,811,108 | 100.00 | % | ||||||||||||||||||
| Fixed rate debt securities | 9,411,115 | 1.88 | % | — | — | % | ||||||||||||||||||||
| Total | $ | 499,918,005 | 100.00 | % | $ | 596,811,108 | 100.00 | % | ||||||||||||||||||
The following table presents the financial instruments carried at fair value as of September 30, 20172020 on the Company's Consolidated Statement of Assets and Liabilities for each of the three levels of hierarchy established by ASC 820:
| Level 1 | Level 2 | Level 3 | Total | |||||||||||||||||||||||
| Senior secured loans | $ | — | $ | 207,278,600 | $ | 243,229,504 | $ | 450,508,104 | ||||||||||||||||||
| OCSI Glick JV subordinated notes | — | — | 49,409,901 | 49,409,901 | ||||||||||||||||||||||
| Equity securities | 421,948 | — | 1,953,412 | 2,375,360 | ||||||||||||||||||||||
| Total investments at fair value | 421,948 | 207,278,600 | 294,592,817 | 502,293,365 | ||||||||||||||||||||||
| Cash equivalents | 7,052,674 | — | — | 7,052,674 | ||||||||||||||||||||||
| Total assets at fair value | $ | 7,474,622 | $ | 207,278,600 | $ | 294,592,817 | $ | 509,346,039 | ||||||||||||||||||
| Derivative liability | $ | — | $ | 129,936 | $ | — | $ | 129,936 | ||||||||||||||||||
| Total liabilities at fair value | $ | — | $ | 129,936 | $ | — | $ | 129,936 | ||||||||||||||||||
| Level 1 | Level 2 | Level 3 | Measured at Net Asset Value (a) | Total | ||||||||||||||||
| Investments in debt securities (senior secured) | $ | — | $ | 75,149,541 | $ | 426,620,456 | $ | — | $ | 501,769,997 | ||||||||||
| Investments in debt securities (subordinated notes of FSFR Glick JV) | — | — | 57,606,674 | — | 57,606,674 | |||||||||||||||
| Investment in equity securities (common stock, preferred stock and warrants, including LLC equity interests of FSFR Glick JV) | — | — | 1,059,989 | — | 1,059,989 | |||||||||||||||
| Total investments at fair value | — | 75,149,541 | 485,287,119 | — | 560,436,660 | |||||||||||||||
| Cash and cash equivalents | 35,604,127 | — | — | — | 35,604,127 | |||||||||||||||
| Total assets at fair value | $ | 35,604,127 | $ | 75,149,541 | $ | 485,287,119 | $ | — | $ | 596,040,787 | ||||||||||
The following table presents the financial instruments carried at fair value as of September 30, 20162019 on the Company's Consolidated Statement of Assets and Liabilities for each of the three levels of hierarchy established by ASC 820:
| Level 1 | Level 2 | Level 3 | Total | |||||||||||||||||||||||
| Senior secured loans | $ | — | $ | 360,600,227 | $ | 181,884,463 | $ | 542,484,690 | ||||||||||||||||||
| OCSI Glick JV subordinated notes | — | — | 54,326,418 | 54,326,418 | ||||||||||||||||||||||
| Equity securities | — | — | 293,339 | 293,339 | ||||||||||||||||||||||
| Total investments at fair value | — | 360,600,227 | 236,504,220 | 597,104,447 | ||||||||||||||||||||||
| Cash equivalents | 228,653 | — | — | 228,653 | ||||||||||||||||||||||
| Derivative asset | — | 20,876 | — | 20,876 | ||||||||||||||||||||||
| Total assets at fair value | $ | 228,653 | $ | 360,621,103 | $ | 236,504,220 | $ | 597,353,976 | ||||||||||||||||||
| Level 1 | Level 2 | Level 3 | Measured at Net Asset Value (a) | Total | ||||||||||||||||
| Investments in debt securities (senior secured) | $ | — | $ | — | $ | 502,385,158 | $ | — | $ | 502,385,158 | ||||||||||
| Investments in debt securities (subordinated notes of FSFR Glick JV) | — | — | 56,885,646 | — | 56,885,646 | |||||||||||||||
| Investment in equity securities (common stock, preferred stock and warrants, including LLC equity interests of FSFR Glick JV) | — | — | 7,902,556 | 6,431,021 | 14,333,577 | |||||||||||||||
| Total investments at fair value | — | — | 567,173,360 | 6,431,021 | 573,604,381 | |||||||||||||||
| Cash and cash equivalents | 19,778,841 | — | — | — | 19,778,841 | |||||||||||||||
| Total assets at fair value | $ | 19,778,841 | $ | — | $ | 567,173,360 | $ | 6,431,021 | $ | 593,383,222 | ||||||||||
| Secured borrowings | — | — | 4,985,425 | — | 4,985,425 | |||||||||||||||
| Total liabilities at fair value | $ | — | $ | — | $ | 4,985,425 | $ | — | $ | 4,985,425 | ||||||||||
When a determination is made to classify a financial instrument within Level 3 of the valuation hierarchy, the determination is based upon the fact that the unobservable factors are significant to the overall fair value measurement. However, Level 3 financial instruments typically include, in addition to thehave both unobservable or Level 3 components and observable components (i.e. components that are actively quoted and can be validated by external sources). Accordingly, the appreciation (depreciation) in the tables below includes changes in fair value due in part to observable factors that are part of the valuation methodology. Transfers between levels are recognized at the beginning of the reporting period.
103
OAKTREE STRATEGIC INCOME CORPORATION
NOTES TO CONSOLIDATED FINANCIAL STATEMENTS
The following table provides a roll-forward in the changes in fair value from September 30, 20162019 to September 30, 2017,2020 for all investments and secured borrowings for which the Company determined fair value using unobservable (Level 3) factors:
| Investments | Liabilities | |||||||||||||||||||
| Senior Secured Debt | Subordinated notes of FSFR Glick JV | Common stock, preferred stock and warrants | Total | Secured Borrowings | ||||||||||||||||
| Fair value as of September 30, 2016 | $ | 502,385,158 | $ | 56,885,646 | $ | 7,902,556 | $ | 567,173,360 | $ | 4,985,425 | ||||||||||
| New investments & net revolver activity | 225,012,781 | — | 14,743 | 225,027,524 | — | |||||||||||||||
| Redemptions/repayments/sales | (276,479,425 | ) | — | (222,284 | ) | (276,701,709 | ) | (5,000,000 | ) | |||||||||||
| Transfers out (a) | (12,608,478 | ) | — | — | (12,608,478 | ) | — | |||||||||||||
| Net accrual of PIK interest income | 185,296 | 223,125 | — | 408,421 | — | |||||||||||||||
| Accretion of original issue discount | 3,794,604 | — | — | 3,794,604 | — | |||||||||||||||
| Net change in unearned income | 19,280 | — | — | 19,280 | — | |||||||||||||||
| Net unrealized appreciation (depreciation) on investments | (2,303,845 | ) | 497,903 | (6,635,026 | ) | (8,440,968 | ) | — | ||||||||||||
| Net unrealized appreciation on secured borrowings | — | — | — | — | 14,575 | |||||||||||||||
| Net realized loss on investments | (13,384,915 | ) | — | — | (13,384,915 | ) | — | |||||||||||||
| Fair value as of September 30, 2017 | $ | 426,620,456 | $ | 57,606,674 | $ | 1,059,989 | $ | 485,287,119 | $ | — | ||||||||||
| Net unrealized appreciation (depreciation) relating to Level 3 assets and liabilities still held at September 30, 2017 and reported within net unrealized appreciation (depreciation) on investments and net unrealized appreciation on secured borrowings in the Consolidated Statement of Operations for the year ended September 30, 2017 | $ | (15,458,340 | ) | $ | 497,902 | $ | 149,488 | $ | (14,810,950 | ) | $ | — | ||||||||
| Investments | ||||||||||||||||||||||||||
| Senior Secured Loans | OCSI Glick JV Subordinated Notes | Equity Securities | Total Investments | |||||||||||||||||||||||
| Fair value as of September 30, 2019 | $ | 181,884,463 | $ | 54,326,418 | $ | 293,339 | $ | 236,504,220 | ||||||||||||||||||
| Purchases | 106,044,210 | — | 1,008,393 | 107,052,603 | ||||||||||||||||||||||
| Sales and repayments | (59,618,644) | (1,032,362) | (736,493) | (61,387,499) | ||||||||||||||||||||||
| Transfers in (a)(b) | 21,631,700 | — | 1,183,057 | 22,814,757 | ||||||||||||||||||||||
| Transfer out (b) | (1,183,057) | — | — | (1,183,057) | ||||||||||||||||||||||
| PIK interest income | 1,889,489 | — | — | 1,889,489 | ||||||||||||||||||||||
| Accretion of OID | 762,072 | — | — | 762,072 | ||||||||||||||||||||||
| Net unrealized appreciation (depreciation) | (6,365,959) | (3,884,155) | (531,377) | (10,781,491) | ||||||||||||||||||||||
| Net realized gains (losses) | (1,814,770) | — | 736,493 | (1,078,277) | ||||||||||||||||||||||
| Fair value as of September 30, 2020 | $ | 243,229,504 | $ | 49,409,901 | $ | 1,953,412 | $ | 294,592,817 | ||||||||||||||||||
| Net unrealized appreciation (depreciation) relating to Level 3 assets still held as of September 30, 2020 and reported within net unrealized appreciation (depreciation) in the Consolidated Statement of Operations for the year ended September 30, 2020 | $ | (6,745,313) | $ | (3,884,155) | $ | (238,038) | $ | (10,867,506) | ||||||||||||||||||
__________
The following table provides a roll-forward in the changes in fair value from September 30, 20152018 to September 30, 20162019 for all investments for which the Company determined fair value using unobservable (Level 3) factors:
| Investments | ||||||||||||||||||||||||||
| Senior Secured Debt | OCSI Glick JV Subordinated Notes | Equity Securities | Total Investments | |||||||||||||||||||||||
| Fair value as of September 30, 2018 | $ | 182,756,067 | $ | 58,512,170 | $ | 1,962,245 | $ | 243,230,482 | ||||||||||||||||||
| Purchases | 68,133,733 | — | — | 68,133,733 | ||||||||||||||||||||||
| Sales and repayments | (85,294,241) | (312,307) | (1,875,587) | (87,482,135) | ||||||||||||||||||||||
| Transfers in (a) | 29,045,393 | — | — | 29,045,393 | ||||||||||||||||||||||
| Transfers out (a) | (10,618,125) | — | — | (10,618,125) | ||||||||||||||||||||||
| Accretion of OID | 1,535,926 | — | — | 1,535,926 | ||||||||||||||||||||||
| Net unrealized appreciation (depreciation) | (2,886,044) | (3,873,445) | (1,168,906) | (7,928,395) | ||||||||||||||||||||||
| Net realized gains (losses) | (788,246) | — | 1,375,587 | 587,341 | ||||||||||||||||||||||
| Fair value as of September 30, 2019 | $ | 181,884,463 | $ | 54,326,418 | $ | 293,339 | $ | 236,504,220 | ||||||||||||||||||
| Net unrealized appreciation (depreciation) relating to Level 3 assets still held as of September 30, 2019 and reported within net unrealized appreciation (depreciation) in the Consolidated Statement of Operations for the year ended September 30, 2019 | $ | (3,101,771) | $ | (3,873,445) | $ | 90,044 | $ | (6,885,172) | ||||||||||||||||||
__________
(a)There were transfers in/out of Level 3 from/to Level 2 for certain investments during the year ended September 30, 2019 as a result of a change in the number of market quotes available and/or a change in market liquidity.
104
| Investments | Liabilities | |||||||||||||||||||
| Senior Secured Debt | Subordinated notes of FSFR Glick JV | Common stock, preferred stock and warrants | Total | Secured Borrowings | ||||||||||||||||
| Fair value as of September 30, 2015 | $ | 565,526,453 | $ | 52,603,346 | $ | 964,100 | $ | 619,093,899 | $ | — | ||||||||||
| New investments & net revolver activity | 276,326,738 | 11,064,375 | 10,072,966 | 297,464,079 | 5,000,000 | |||||||||||||||
| Redemptions/repayments/sales | (320,847,550 | ) | (154,217 | ) | — | (321,001,767 | ) | — | ||||||||||||
| Net accrual of PIK interest income | 88,839 | — | — | 88,839 | — | |||||||||||||||
| Accretion of original issue discount | 1,924,087 | — | — | 1,924,087 | — | |||||||||||||||
| Net change in unearned income | 17,170 | — | — | 17,170 | — | |||||||||||||||
| Net unrealized depreciation on investments | (7,880,802 | ) | (6,627,858 | ) | (3,134,510 | ) | (17,643,170 | ) | — | |||||||||||
| Net unrealized depreciation on secured borrowings | — | — | — | — | (14,575 | ) | ||||||||||||||
| Net realized loss on investments | (12,769,777 | ) | — | — | (12,769,777 | ) | — | |||||||||||||
| Fair value as of September 30, 2016 | $ | 502,385,158 | $ | 56,885,646 | $ | 7,902,556 | $ | 567,173,360 | $ | 4,985,425 | ||||||||||
| Net unrealized depreciation relating to Level 3 assets and liabilities still held at September 30, 2016 and reported within net unrealized appreciation (depreciation) on investments and net unrealized depreciation on secured borrowings in the Consolidated Statement of Operations for the year ended September 30, 2016 | $ | (10,913,833 | ) | $ | (6,627,858 | ) | $ | (2,486,439 | ) | $ | (20,028,130 | ) | $ | (14,575 | ) | |||||
OAKTREE STRATEGIC INCOME CORPORATION
NOTES TO CONSOLIDATED FINANCIAL STATEMENTS
Significant Unobservable Inputs for Level 3 Investments
The following table provides quantitative information related to the significant unobservable inputs for Level 3 investments, which are carried at fair value as of September 30, 2017:2020:
| Asset | Fair Value | Valuation Technique | Unobservable Input | Range | Weighted Average (a) | ||||||||||||||||||||||||||||||||||||
| Senior Secured Loans | $ | 157,196,179 | Market Yield | Market Yield | (b) | 6.6% | - | 16.0% | 11.0% | ||||||||||||||||||||||||||||||||
| 78,772,765 | Broker Quotations | Broker Quoted Price | (c) | N/A | - | N/A | N/A | ||||||||||||||||||||||||||||||||||
| 7,260,560 | Enterprise Value | EBITDA Multiple | (d) | 7.0x | - | 9.0x | 8.0x | ||||||||||||||||||||||||||||||||||
| OCSI Glick JV Subordinated Notes | 49,409,901 | Enterprise Value | N/A | (e) | N/A | - | N/A | N/A | |||||||||||||||||||||||||||||||||
| Equity Securities | 1,953,412 | Transactions Precedent | Transaction Price | (f) | N/A | - | N/A | N/A | |||||||||||||||||||||||||||||||||
| Total | $ | 294,592,817 | |||||||||||||||||||||||||||||||||||||||
| Asset | Fair Value | Valuation Technique | Unobservable Input | Range | Weighted Average (c) | ||||||||||
| Senior secured debt | $ | 208,118,444 | Market yield technique | Capital structure premium | (a) | 0.0% | - | 2.0% | 0.2% | ||||||
| Tranche specific risk premium / (discount) | (a) | (3.1)% | - | 8.0% | 0.2% | ||||||||||
| Size premium | (a) | 0.0% | - | 1.5% | 0.7% | ||||||||||
| Industry premium / (discount) | (a) | (1.1)% | - | 2.6% | 0.0% | ||||||||||
| 23,192,266 | Enterprise value technique | EBITDA multiple | (b) | 6.4x | - | 6.4x | 6.4x | ||||||||
| 6,242,550 | Enterprise value technique | Revenue multiple | (b) | 0.2x | - | 0.6x | 0.5x | ||||||||
| 20,070,000 | Transactions precedent technique | Transaction price | (d) | N/A | - | N/A | N/A | ||||||||
| 168,997,196 | Market quotations | Broker quoted price | (e) | N/A | - | N/A | N/A | ||||||||
| FSFR Glick JV subordinated notes | 57,606,674 | Enterprise value technique | N/A | (f) | N/A | - | N/A | N/A | |||||||
| Preferred & Common Equity | 1,059,989 | Enterprise value technique | EBITDA multiple | (b) | 0.2x | - | 15.5x | 8.1x | |||||||
| Total | $ | 485,287,119 | |||||||||||||
_____________________
(a) Used when market participant would take into account this premium or discount when pricing the investment.
(d) Used when market participants would use such multiples when pricing the Investment Adviser, including financial performance, recent business developments and various other factors.investment.
(f) Used when there is an observable transaction or pending event for the investment.
The following table provides quantitative information related to the significant unobservable inputs for Level 3 investments, and secured borrowings, which are carried at fair value as of September 30, 2016:2019:
| Asset | Fair Value | Valuation Technique | Unobservable Input | Range | Weighted Average (a) | ||||||||||||||||||||||||||||||||||||
| Senior Secured Loans | $ | 92,083,082 | Market Yield | Market Yield | (b) | 6.7% | - | 13.0% | 8.9% | ||||||||||||||||||||||||||||||||
| 67,340,586 | Broker Quotations | Broker Quoted Price | (c) | N/A | - | N/A | N/A | ||||||||||||||||||||||||||||||||||
| 20,960,795 | Enterprise Value | EBITDA Multiple | (d) | 4.2x | - | 6.2x | 5.2x | ||||||||||||||||||||||||||||||||||
| 1,500,000 | Transactions Precedent | Transaction Price | (e) | N/A | - | N/A | N/A | ||||||||||||||||||||||||||||||||||
| OCSI Glick JV Subordinated Notes | 54,326,418 | Enterprise Value | N/A | (f) | N/A | - | N/A | N/A | |||||||||||||||||||||||||||||||||
| Equity Securities | 293,339 | Enterprise Value | EBITDA Multiple | (d) | 16.0x | - | 18.0x | 17.0x | |||||||||||||||||||||||||||||||||
| Total | $ | 236,504,220 | |||||||||||||||||||||||||||||||||||||||
| Asset | Fair Value | Valuation Technique | Unobservable Input | Range | Weighted Average (c) | ||||||||||
| Senior secured debt | $ | 270,620,843 | Market yield technique | Capital structure premium | (a) | 0.0% | - | 2.0% | 0.1% | ||||||
| Tranche specific risk premium / (discount) | (a) | (4.5)% | - | 5.3% | (1.4)% | ||||||||||
| Size premium | (a) | 0.0% | - | 1.5% | 0.8% | ||||||||||
| Industry premium / (discount) | (a) | (1.3)% | - | 5.4% | 0.3% | ||||||||||
| 12,440,322 | Enterprise value technique | Weighted average cost of capital | 23.0% | - | 23.0% | 23.0% | |||||||||
| Company specific risk premium | (a) | 15.0% | - | 15.0% | 15.0% | ||||||||||
| Revenue growth rate | 6.0% | - | 6.0% | 6.0% | |||||||||||
| Revenue multiple | (b) | 1.1x | - | 1.1x | 1.1x | ||||||||||
| 33,036,389 | Transactions precedent technique | Transaction price | (d) | N/A | - | N/A | N/A | ||||||||
| 186,287,604 | Market quotations | Broker quoted price | (e) | N/A | - | N/A | N/A | ||||||||
| FSFR Glick JV subordinated notes | 56,885,646 | Market yield technique | Capital structure premium | (a) | 2.0% | - | 2.0% | 2.0% | |||||||
| Tranche specific risk premium / (discount) | (a) | (1.4)% | - | (1.4)% | (1.4)% | ||||||||||
| Size premium | (a) | 2.0% | - | 2.0% | 2.0% | ||||||||||
| Industry premium / (discount) | (a) | 1.9% | - | 1.9% | 1.9% | ||||||||||
| Preferred & Common Equity | 7,902,556 | Enterprise value technique | Weighted average cost of capital | 14.0% | - | 18.0% | 14.5% | ||||||||
| Company specific risk premium | (a) | 1.0% | - | 2.0% | 1.9% | ||||||||||
| Revenue growth rate | (21.6)% | - | 57.8% | (12.0)% | |||||||||||
| Revenue multiple | 1.0x | - | 1.0x | 1.0x | |||||||||||
| EBITDA multiple | (b) | 13.7x | - | 18.0x | 15.6x | ||||||||||
| Total | $ | 567,173,360 | |||||||||||||
| Liabilities | Fair Value | Valuation Technique | Unobservable Input | Range | Weighted Average | ||||||||||
| Secured borrowings | $ | 4,985,425 | Market quotations | Broker quoted price | (e) | N/A | - | N/A | N/A | ||||||
| Total | $ | 4,985,425 | |||||||||||||
_____________________
(a) Used when market participant would take into account this premium or discount when pricing the investment.
105
OAKTREE STRATEGIC INCOME CORPORATION
NOTES TO CONSOLIDATED FINANCIAL STATEMENTS
(d) Used when market participants would use such multiples when pricing the investment.
(e) Used when there is an observable transaction or pending event for the investment.
(f) The Company including financial performance, recent business developments and various other factors.determined the value of its subordinated notes of the OCSI Glick JV based on the total assets less the total liabilities senior to the subordinated notes held at the OCSI Glick JV in an amount not exceeding par under the EV technique.
Under the market yield technique, the significant unobservable inputsinput used in the fair value measurement of the Company's investments in debt securities and secured borrowings are capital structure premium, tranche specific risk premium (discount), size premium and industry premium (discount).is the market yield. Increases or decreases in any of those inputs in isolationthe market yield may result in a lower or higher fair value measurement, respectively.
Under the enterprise valueEV technique, the significant unobservable input used in the fair value measurement of the Company's investments in debt or equity securities is the EBITDA/Revenue multiple.earnings before interest, taxes, depreciation and amortization ("EBITDA"), revenue or asset multiple, as applicable. Increases or decreases in the valuation multiples in isolation may result in a higher or lower fair value measurement, respectively.
Financial Instruments Disclosed, But Not Carried, At Fair Value
The following table presents the carrying value and fair value of the Company’s financial liabilities disclosed, but not carried, at fair value as of September 30, 20172020 and the level of each financial liability within the fair value hierarchy:
Carrying Value | Fair Value | Level 1 | Level 2 | Level 3 | ||||||||||||||||
| Citibank facility payable | $ | 76,456,800 | $ | 76,456,800 | $ | — | $ | — | $ | 76,456,800 | ||||||||||
| East West Bank facility payable | 6,500,000 | 6,500,000 | — | — | 6,500,000 | |||||||||||||||
| Notes payable (net of unamortized financing costs) | 177,775,868 | 180,000,000 | — | — | 180,000,000 | |||||||||||||||
| Total | $ | 260,732,668 | $ | 262,956,800 | $ | — | $ | — | $ | 262,956,800 | ||||||||||
| Carrying Value | Fair Value | Level 1 | Level 2 | Level 3 | ||||||||||||||||||||||||||||
| Citibank Facility payable | $ | 119,056,800 | $ | 119,056,800 | $ | — | $ | — | $ | 119,056,800 | ||||||||||||||||||||||
| Deutsche Bank Facility payable | 137,600,000 | 137,600,000 | — | — | 137,600,000 | |||||||||||||||||||||||||||
| Secured Borrowings payable | 10,929,578 | 10,929,578 | — | — | 10,929,578 | |||||||||||||||||||||||||||
| Total | $ | 267,586,378 | $ | 267,586,378 | $ | — | $ | — | $ | 267,586,378 | ||||||||||||||||||||||
The following table presents the carrying value and fair value of the Company’s financial liabilities disclosed, but not carried, at fair value as of September 30, 20162019 and the level of each financial liability within the fair value hierarchy:
Carrying Value | Fair Value | Level 1 | Level 2 | Level 3 | ||||||||||||||||
| Citibank facility payable | $ | 107,426,800 | $ | 107,426,800 | $ | — | $ | — | $ | 107,426,800 | ||||||||||
| Notes payable (net of unamortized financing costs) | 177,485,764 | 180,000,000 | — | — | 180,000,000 | |||||||||||||||
| Total | $ | 284,912,564 | $ | 287,426,800 | $ | — | $ | — | $ | 287,426,800 | ||||||||||
| Carrying Value | Fair Value | Level 1 | Level 2 | Level 3 | ||||||||||||||||||||||||||||
| Citibank Facility payable | $ | 126,056,800 | $ | 126,056,800 | $ | — | $ | — | $ | 126,056,800 | ||||||||||||||||||||||
| East West Bank Facility payable | 11,000,000 | 11,000,000 | — | — | 11,000,000 | |||||||||||||||||||||||||||
| Deutsche Bank Facility payable | 157,600,000 | 157,600,000 | — | — | 157,600,000 | |||||||||||||||||||||||||||
| Total | $ | 294,656,800 | $ | 294,656,800 | $ | — | $ | — | $ | 294,656,800 | ||||||||||||||||||||||
The principal values of the credit facilities payable and notes payable approximate their fair values due to their variable interest rates and are included in Level 3 of the hierarchy. The principal value of the secured borrowings payable approximates fair value due to its short-term nature and is included in Level 3 of the hierarchy.
Portfolio Composition
Summaries of the composition of the Company's investment portfolio at cost as a percentage of total investments and at fair value as a percentage of total investments and total net assets are shown in the following tables:
| September 30, 2020 | September 30, 2019 | |||||||||||||||||||||||||
| Cost: | % of Total Investments | % of Total Investments | ||||||||||||||||||||||||
| Senior secured loans | $ | 464,459,378 | 86.16 | % | $ | 553,679,070 | 88.33 | % | ||||||||||||||||||
| OCSI Glick JV subordinated notes | 65,045,551 | 12.07 | % | 66,077,913 | 10.54 | % | ||||||||||||||||||||
| OCSI Glick JV equity interests | 7,111,751 | 1.32 | % | 7,111,751 | 1.13 | % | ||||||||||||||||||||
| Equity securities, excluding the OCSI Glick JV | 2,448,427 | 0.45 | % | — | — | |||||||||||||||||||||
| Total | $ | 539,065,107 | 100.00 | % | $ | 626,868,734 | 100.00 | % | ||||||||||||||||||
106
| September 30, 2017 | September 30, 2016 | |||||||||||||
| Cost: | % of Total Investments | % of Total Investments | ||||||||||||
| Senior secured debt | $ | 523,384,267 | 86.50 | % | $ | 518,778,491 | 86.40 | % | ||||||
| Subordinated notes of FSFR Glick JV | 64,228,881 | 10.61 | % | 64,005,755 | 10.66 | % | ||||||||
| LLC equity interests of FSFR Glick JV | 7,111,751 | 1.18 | % | 7,111,751 | 1.18 | % | ||||||||
| Purchased equity | 10,365,425 | 1.71 | % | 10,572,966 | 1.76 | % | ||||||||
| Equity grants | — | — | — | — | ||||||||||
| Total | $ | 605,090,324 | 100.00 | % | $ | 600,468,963 | 100.00 | % | ||||||
OAKTREE STRATEGIC INCOME CORPORATION
NOTES TO CONSOLIDATED FINANCIAL STATEMENTS
| September 30, 2020 | September 30, 2019 | |||||||||||||||||||||||||||||||||||||
| Fair Value: | % of Total Investments | % of Net Assets | % of Total Investments | % of Net Assets | ||||||||||||||||||||||||||||||||||
| Senior secured loans | $ | 450,508,104 | 89.69% | 168.89% | $ | 542,484,690 | 90.85% | 190.70% | ||||||||||||||||||||||||||||||
| OCSI Glick JV subordinated notes | 49,409,901 | 9.84% | 18.53% | 54,326,418 | 9.10% | 19.10% | ||||||||||||||||||||||||||||||||
| Equity securities, excluding the OCSI Glick JV | 2,375,360 | 0.47% | 0.90% | 293,339 | 0.05% | 0.10% | ||||||||||||||||||||||||||||||||
| OCSI Glick JV equity interests | — | — | — | — | — | — | ||||||||||||||||||||||||||||||||
| Total | $ | 502,293,365 | 100.00 | % | 188.32% | $ | 597,104,447 | 100.00 | % | 209.90% | ||||||||||||||||||||||||||||
| September 30, 2017 | September 30, 2016 | |||||||||||||||||||
| Fair Value: | % of Total Investments | % of Total Net Assets | % of Total Investments | % of Total Net Assets | ||||||||||||||||
| Senior secured debt | $ | 501,769,997 | 89.53 | % | 170.87 | % | $ | 502,385,158 | 87.58 | % | 154.18 | % | ||||||||
| Subordinated notes of FSFR Glick JV | 57,606,674 | 10.28 | % | 19.62 | % | 56,885,646 | 9.92 | % | 17.46 | % | ||||||||||
| LLC equity interests of FSFR Glick JV | — | — | — | 6,431,021 | 1.12 | % | 1.97 | % | ||||||||||||
| Purchased equity | 1,059,989 | 0.19 | % | 0.36 | % | 7,782,214 | 1.36 | % | 2.39 | % | ||||||||||
| Equity grants | — | — | — | 120,342 | 0.02 | % | 0.04 | % | ||||||||||||
| Total | $ | 560,436,660 | 100.00 | % | 190.85 | % | $ | 573,604,381 | 100.00 | % | 176.04 | % | ||||||||
| September 30, 2020 | September 30, 2019 | |||||||||||||||||||||||||
| Cost: | % of Total Investments | % of Total Investments | ||||||||||||||||||||||||
| Northeast | $ | 175,000,822 | 32.46% | $ | 163,840,735 | 26.13% | ||||||||||||||||||||
| West | 107,100,584 | 19.87% | 156,427,384 | 24.95% | ||||||||||||||||||||||
| Midwest | 88,346,293 | 16.39% | 90,085,074 | 14.37% | ||||||||||||||||||||||
| Southwest | 60,351,662 | 11.20% | 94,396,340 | 15.06% | ||||||||||||||||||||||
| Southeast | 43,464,437 | 8.06% | 65,420,955 | 10.44% | ||||||||||||||||||||||
| International | 25,852,696 | 4.80% | 40,156,268 | 6.41% | ||||||||||||||||||||||
| South | 24,369,729 | 4.52% | 6,051,218 | 0.97% | ||||||||||||||||||||||
| Northwest | 14,578,884 | 2.70% | 10,490,760 | 1.67% | ||||||||||||||||||||||
| Total | $ | 539,065,107 | 100.00% | $ | 626,868,734 | 100.00% | ||||||||||||||||||||
| September 30, 2017 | September 30, 2016 | |||||||||||||
| Cost: | % of Total Investments | % of Total Investments | ||||||||||||
| Northeast U.S. | $ | 217,508,260 | 35.94 | % | $ | 223,662,953 | 37.25 | % | ||||||
| Midwest U.S. | 115,147,194 | 19.03 | % | 77,086,840 | 12.84 | % | ||||||||
| Southwest U.S. | 101,583,440 | 16.79 | % | 123,909,372 | 20.64 | % | ||||||||
| Southeast U.S. | 89,214,997 | 14.74 | % | 76,201,785 | 12.69 | % | ||||||||
| West U.S. | 74,469,039 | 12.31 | % | 84,992,619 | 14.15 | % | ||||||||
| Northwest | 3,799,884 | 0.63 | % | — | — | |||||||||
| International | 3,367,510 | 0.56 | % | 14,615,394 | 2.43 | % | ||||||||
| Total | $ | 605,090,324 | 100.00 | % | $ | 600,468,963 | 100.00 | % | ||||||
| September 30, 2020 | September 30, 2019 | |||||||||||||||||||||||||||||||||||||
| Fair Value: | % of Total Investments | % of Net Assets | % of Total Investments | % of Net Assets | ||||||||||||||||||||||||||||||||||
| Northeast | $ | 150,734,661 | 30.00% | 56.52% | $ | 145,176,830 | 24.31% | 51.04% | ||||||||||||||||||||||||||||||
| West | 104,906,992 | 20.89% | 39.33% | 154,984,247 | 25.95% | 54.46% | ||||||||||||||||||||||||||||||||
| Midwest | 85,420,874 | 17.01% | 32.04% | 88,834,091 | 14.88% | 31.24% | ||||||||||||||||||||||||||||||||
| Southwest | 55,716,384 | 11.09% | 20.89% | 90,401,243 | 15.14% | 31.78% | ||||||||||||||||||||||||||||||||
| Southeast | 42,020,215 | 8.37% | 15.75% | 62,741,930 | 10.51% | 22.06% | ||||||||||||||||||||||||||||||||
| International | 25,096,033 | 5.00% | 9.40% | 38,583,801 | 6.46% | 13.56% | ||||||||||||||||||||||||||||||||
| South | 23,722,222 | 4.72% | 8.89% | 5,899,007 | 0.99% | 2.07% | ||||||||||||||||||||||||||||||||
| Northwest | 14,675,984 | 2.92% | 5.50% | 10,483,298 | 1.76% | 3.69% | ||||||||||||||||||||||||||||||||
| Total | $ | 502,293,365 | 100.00% | 188.32% | $ | 597,104,447 | 100.00% | 209.90% | ||||||||||||||||||||||||||||||
107
| September 30, 2017 | September 30, 2016 | |||||||||||||||||||
| Fair Value: | % of Total Investments | % of Total Net Assets | % of Total Investments | % of Total Net Assets | ||||||||||||||||
| Northeast U.S. | $ | 173,667,526 | 30.99 | % | 59.14 | % | $ | 208,857,837 | 36.41 | % | 64.10 | % | ||||||||
| Midwest U.S. | 115,780,284 | 20.66 | % | 39.43 | % | 65,672,577 | 11.45 | % | 20.16 | % | ||||||||||
| Southwest U.S. | 99,398,397 | 17.74 | % | 33.85 | % | 124,470,758 | 21.70 | % | 38.20 | % | ||||||||||
| Southeast U.S. | 89,246,247 | 15.92 | % | 30.39 | % | 76,053,964 | 13.26 | % | 23.34 | % | ||||||||||
| West U.S. | 75,054,066 | 13.39 | % | 25.56 | % | 85,344,025 | 14.88 | % | 26.19 | % | ||||||||||
| Northwest | 3,883,882 | 0.69 | % | 1.32 | % | — | — | — | ||||||||||||
| International | 3,406,258 | 0.61 | % | 1.16 | % | 13,205,220 | 2.30 | % | 4.05 | % | ||||||||||
| Total | $ | 560,436,660 | 100.00 | % | 190.85 | % | $ | 573,604,381 | 100.00 | % | 176.04 | % | ||||||||
OAKTREE STRATEGIC INCOME CORPORATION
NOTES TO CONSOLIDATED FINANCIAL STATEMENTS
The following tables show the composition of the Company's portfolio by industry at cost as a percentage of total investments and at fair value as a percentage of total investments and total net assets as of September 30, 20172020 and September 30, 2016 was as follows:2019:
| September 30, 2020 | September 30, 2019 | ||||||||||||||||||||||||||||
| Cost: | % of Total Investments | % of Total Investments | |||||||||||||||||||||||||||
| Multi-Sector Holdings (1) | $ | 72,157,302 | 13.36 | % | $ | 73,189,664 | 11.68 | % | |||||||||||||||||||||
| Application Software | 56,215,071 | 10.43 | 81,483,953 | 12.98 | |||||||||||||||||||||||||
| Aerospace & Defense | 30,626,973 | 5.68 | 32,851,441 | 5.24 | |||||||||||||||||||||||||
| Diversified Support Services | 26,334,370 | 4.89 | 27,474,583 | 4.38 | |||||||||||||||||||||||||
| Advertising | 24,174,863 | 4.48 | 24,102,621 | 3.84 | |||||||||||||||||||||||||
| Movies & Entertainment | 16,673,070 | 3.09 | 9,656,395 | 1.54 | |||||||||||||||||||||||||
| Integrated Telecommunication Services | 15,495,686 | 2.87 | 17,406,502 | 2.78 | |||||||||||||||||||||||||
| Commercial Printing | 15,307,456 | 2.84 | 15,457,725 | 2.47 | |||||||||||||||||||||||||
| Data Processing & Outsourced Services | 14,083,620 | 2.61 | 16,648,375 | 2.66 | |||||||||||||||||||||||||
| Industrial Machinery | 13,770,077 | 2.55 | 9,319,898 | 1.49 | |||||||||||||||||||||||||
| Health Care Supplies | 13,452,481 | 2.50 | — | — | |||||||||||||||||||||||||
| Personal Products | 13,418,096 | 2.49 | 2,985,000 | 0.48 | |||||||||||||||||||||||||
| Pharmaceuticals | 13,309,502 | 2.47 | 12,626,920 | 2.01 | |||||||||||||||||||||||||
| Health Care Services | 13,081,011 | 2.43 | 17,175,085 | 2.74 | |||||||||||||||||||||||||
| Biotechnology | 12,304,257 | 2.28 | 7,930,000 | 1.27 | |||||||||||||||||||||||||
| Health Care Technology | 11,732,318 | 2.18 | 10,897,989 | 1.74 | |||||||||||||||||||||||||
| Oil & Gas Storage & Transportation | 10,976,147 | 2.04 | 558,657 | 0.09 | |||||||||||||||||||||||||
| Specialty Chemicals | 10,024,137 | 1.86 | 4,686,365 | 0.75 | |||||||||||||||||||||||||
| Systems Software | 9,922,773 | 1.84 | 15,530,330 | 2.48 | |||||||||||||||||||||||||
| Real Estate Services | 9,755,743 | 1.81 | 9,832,986 | 1.57 | |||||||||||||||||||||||||
| Publishing | 9,660,137 | 1.79 | 10,291,050 | 1.64 | |||||||||||||||||||||||||
| Leisure Facilities | 9,402,902 | 1.74 | 8,992,137 | 1.43 | |||||||||||||||||||||||||
| Internet Services & Infrastructure | 8,947,119 | 1.66 | 28,457,280 | 4.54 | |||||||||||||||||||||||||
| Trading Companies & Distributors | 8,827,767 | 1.64 | 8,943,835 | 1.43 | |||||||||||||||||||||||||
| Distributors | 8,760,175 | 1.63 | — | — | |||||||||||||||||||||||||
| Specialized Finance | 8,359,110 | 1.55 | 15,215,979 | 2.43 | |||||||||||||||||||||||||
| Alternative Carriers | 8,337,801 | 1.55 | 16,926,483 | 2.70 | |||||||||||||||||||||||||
| Fertilizers & Agricultural Chemicals | 8,152,050 | 1.51 | — | — | |||||||||||||||||||||||||
| Research & Consulting Services | 7,435,807 | 1.38 | 9,887,627 | 1.58 | |||||||||||||||||||||||||
| Electrical Components & Equipment | 6,280,139 | 1.17 | 6,363,049 | 1.02 | |||||||||||||||||||||||||
| Auto Parts & Equipment | 5,688,828 | 1.06 | 5,749,771 | 0.92 | |||||||||||||||||||||||||
| Internet & Direct Marketing Retail | 5,363,954 | 1.00 | — | — | |||||||||||||||||||||||||
| Oil & Gas Refining & Marketing | 5,333,776 | 0.99 | 11,832,244 | 1.89 | |||||||||||||||||||||||||
| Metal & Glass Containers | 5,279,705 | 0.98 | 8,850,147 | 1.41 | |||||||||||||||||||||||||
| Insurance Brokers | 5,115,349 | 0.95 | — | — | |||||||||||||||||||||||||
| Hotels, Resorts & Cruise Lines | 4,645,028 | 0.86 | — | — | |||||||||||||||||||||||||
| Environmental & Facilities Services | 3,897,041 | 0.72 | 4,214,058 | 0.67 | |||||||||||||||||||||||||
| Restaurants | 3,398,183 | 0.63 | — | — | |||||||||||||||||||||||||
| Household Products | 3,338,452 | 0.62 | 5,025,753 | 0.80 | |||||||||||||||||||||||||
| Independent Power Producers & Energy Traders | 3,265,964 | 0.61 | — | — | |||||||||||||||||||||||||
| Managed Health Care | 2,947,424 | 0.55 | — | — | |||||||||||||||||||||||||
| Electric Utilities | 1,966,495 | 0.36 | — | — | |||||||||||||||||||||||||
| General Merchandise Stores | 1,593,419 | 0.30 | 1,549,641 | 0.25 | |||||||||||||||||||||||||
| Specialized REITs | 253,529 | 0.05 | 8,642,094 | 1.38 | |||||||||||||||||||||||||
| Oil & Gas Exploration & Production | — | — | 14,662,039 | 2.34 | |||||||||||||||||||||||||
| Interactive Media & Services | — | — | 11,821,820 | 1.89 | |||||||||||||||||||||||||
| Computer & Electronics Retail | — | — | 10,808,325 | 1.72 | |||||||||||||||||||||||||
| Communications Equipment | — | — | 9,740,555 | 1.55 | |||||||||||||||||||||||||
| IT Consulting & Other Services | — | — | 9,683,496 | 1.54 | |||||||||||||||||||||||||
| Health Care Equipment | — | — | 8,887,725 | 1.42 | |||||||||||||||||||||||||
| Human Resource & Employment Services | — | — | 8,099,807 | 1.29 | |||||||||||||||||||||||||
| Household Appliances | — | — | 6,857,242 | 1.09 | |||||||||||||||||||||||||
| Commodity Chemicals | — | — | 4,920,165 | 0.78 | |||||||||||||||||||||||||
| Oil & Gas Equipment & Services | — | — | 631,923 | 0.10 | |||||||||||||||||||||||||
| Total | $ | 539,065,107 | 100.00 | % | $ | 626,868,734 | 100.00 | % | |||||||||||||||||||||
108
| September 30, 2017 | September 30, 2016 | ||||||||||||
| Cost: | % of Total Investments | % of Total Investments | |||||||||||
| Internet software & services | $ | 129,816,292 | 21.46 | % | $ | 132,462,581 | 22.07 | % | |||||
| Multi-sector holdings (1) | 71,340,632 | 11.79 | 71,117,506 | 11.84 | |||||||||
| Healthcare services | 50,858,157 | 8.41 | 88,865,063 | 14.80 | |||||||||
| Advertising | 43,518,443 | 7.19 | 48,396,135 | 8.06 | |||||||||
| Application software | 33,801,616 | 5.59 | 32,100,672 | 5.35 | |||||||||
| Diversified support services | 24,189,607 | 4.00 | 19,714,868 | 3.28 | |||||||||
| IT consulting & other services | 20,485,989 | 3.39 | 8,811,481 | 1.47 | |||||||||
| Human resources & employment services | 20,141,957 | 3.33 | — | — | |||||||||
| Specialized finance | 15,358,280 | 2.54 | — | — | |||||||||
| Environmental & facilities services | 14,170,031 | 2.34 | 6,391,836 | 1.06 | |||||||||
| Oil & gas equipment & services | 14,057,018 | 2.32 | 4,177,081 | 0.70 | |||||||||
| Distributors | 12,967,500 | 2.14 | — | — | |||||||||
| Industrial machinery | 12,493,405 | 2.06 | 3,826,203 | 0.64 | |||||||||
| Real estate services | 12,247,424 | 2.02 | — | — | |||||||||
| Commercial printing | 11,847,790 | 1.96 | 5,912,694 | 0.98 | |||||||||
| Integrated telecommunication services | 11,291,073 | 1.87 | 24,385,644 | 4.06 | |||||||||
| Food retail | 10,054,868 | 1.66 | 6,889,930 | 1.15 | |||||||||
| Data processing & outsourced services | 9,804,174 | 1.62 | 9,835,238 | 1.64 | |||||||||
| Pharmaceuticals | 9,068,650 | 1.50 | 9,162,870 | 1.53 | |||||||||
| Specialty Stores | 8,359,086 | 1.38 | — | — | |||||||||
| Security & alarm services | 8,018,318 | 1.33 | 17,835,147 | 2.97 | |||||||||
| Computer & Electronics Retail | 7,383,862 | 1.22 | — | — | |||||||||
| Research & consulting services | 6,922,777 | 1.14 | 17,128,420 | 2.85 | |||||||||
| Personal products | 6,544,450 | 1.08 | 1,285,383 | 0.21 | |||||||||
| Aerospace & defense | 6,453,287 | 1.07 | — | — | |||||||||
| Auto parts & equipment | 5,871,777 | 0.97 | — | — | |||||||||
| Healthcare distributors | 4,975,000 | 0.82 | — | — | |||||||||
| Casinos & gaming | 4,963,767 | 0.82 | — | — | |||||||||
| Housewares & specialties | 4,795,075 | 0.79 | — | — | |||||||||
| Trucking | 4,079,548 | 0.67 | — | — | |||||||||
| Fertilizers & agricultural chemicals | 3,273,753 | 0.54 | 3,522,668 | 0.59 | |||||||||
| Hypermarkets & super centers | 2,996,051 | 0.50 | — | — | |||||||||
| Specialized consumer services | 1,660,679 | 0.27 | 22,605,271 | 3.76 | |||||||||
| Computer hardware | 1,279,988 | 0.21 | 3,956,802 | 0.66 | |||||||||
| Education services | — | — | 15,262,322 | 2.54 | |||||||||
| Electronic equipment & instruments | — | — | 10,942,464 | 1.82 | |||||||||
| Diversified capital markets | — | — | 8,685,189 | 1.45 | |||||||||
| Construction and engineering | — | — | 5,907,850 | 0.98 | |||||||||
| Wireless telecommunication services | — | — | 5,719,729 | 0.95 | |||||||||
| Food distributors | — | — | 5,711,496 | 0.95 | |||||||||
| Restaurants | — | — | 5,000,000 | 0.83 | |||||||||
| Healthcare technology | 4,856,420 | 0.81 | |||||||||||
| Total | $ | 605,090,324 | 100.00 | % | $ | 600,468,963 | 100.00 | % | |||||
OAKTREE STRATEGIC INCOME CORPORATION
NOTES TO CONSOLIDATED FINANCIAL STATEMENTS
| September 30, 2017 | September 30, 2016 | ||||||||||||||||||
| Fair Value: | % of Total Investments | % of Total Net Assets | % of Total Investments | % of Total Net Assets | |||||||||||||||
| Internet software & services | $ | 121,778,922 | 21.72 | % | 41.43 | % | $ | 119,438,318 | 20.82 | % | 36.64 | % | |||||||
| Multi-sector holdings (1) | 57,606,674 | 10.28 | 19.62 | 63,316,667 | 11.04 | 19.43 | |||||||||||||
| Advertising | 41,145,973 | 7.34 | 14.01 | 48,684,948 | 8.49 | 14.94 | |||||||||||||
| Application software | 33,966,141 | 6.06 | 11.57 | 32,405,166 | 5.65 | 9.95 | |||||||||||||
| Healthcare services | 29,525,697 | 5.27 | 10.06 | 83,972,780 | 14.64 | 25.77 | |||||||||||||
| Diversified support services | 24,655,181 | 4.40 | 8.40 | 19,597,622 | 3.42 | 6.01 | |||||||||||||
| IT consulting & other services | 20,488,238 | 3.66 | 6.98 | 8,884,236 | 1.55 | 2.73 | |||||||||||||
| Human resources & employment services | 20,125,090 | 3.59 | 6.85 | — | — | — | |||||||||||||
| Specialized finance | 15,609,084 | 2.79 | 5.32 | — | — | — | |||||||||||||
| Environmental & facilities services | 14,287,163 | 2.55 | 4.87 | 6,540,239 | 1.14 | 2.01 | |||||||||||||
| Oil & gas equipment & services | 14,052,500 | 2.51 | 4.79 | 4,090,429 | 0.71 | 1.26 | |||||||||||||
| Distributors | 12,957,035 | 2.31 | 4.41 | — | — | — | |||||||||||||
| Industrial machinery | 12,452,459 | 2.22 | 4.24 | 3,778,376 | 0.66 | 1.16 | |||||||||||||
| Real estate services | 12,256,098 | 2.19 | 4.17 | — | — | — | |||||||||||||
| Commercial printing | 11,942,132 | 2.13 | 4.07 | 5,929,733 | 1.03 | 1.82 | |||||||||||||
| Integrated telecommunication services | 11,368,765 | 2.03 | 3.87 | 24,637,968 | 4.30 | 7.56 | |||||||||||||
| Food retail | 10,182,584 | 1.82 | 3.47 | 7,011,442 | 1.22 | 2.15 | |||||||||||||
| Data processing & outsourced services | 9,840,600 | 1.76 | 3.35 | 9,820,000 | 1.71 | 3.01 | |||||||||||||
| Pharmaceuticals | 9,038,634 | 1.61 | 3.08 | 9,033,850 | 1.57 | 2.77 | |||||||||||||
| Specialty Stores | 8,193,960 | 1.46 | 2.79 | — | — | — | |||||||||||||
| Security & alarm services | 7,972,286 | 1.42 | 2.72 | 17,865,123 | 3.11 | 5.48 | |||||||||||||
| Computer & Electronics Retail | 7,498,142 | 1.34 | 2.55 | — | — | — | |||||||||||||
| Research & consulting services | 7,004,638 | 1.25 | 2.39 | 17,162,244 | 2.99 | 5.27 | |||||||||||||
| Personal products | 6,599,006 | 1.18 | 2.25 | 1,290,310 | 0.22 | 0.40 | |||||||||||||
| Aerospace & defense | 6,556,692 | 1.17 | 2.23 | — | — | — | |||||||||||||
| Auto parts & equipment | 5,798,747 | 1.03 | 1.97 | — | — | — | |||||||||||||
| Casinos & gaming | 5,038,622 | 0.90 | 1.72 | — | — | — | |||||||||||||
| Healthcare distributors | 4,948,950 | 0.88 | 1.69 | — | — | — | |||||||||||||
| Housewares & specialties | 4,771,779 | 0.85 | 1.63 | — | — | — | |||||||||||||
| Trucking | 4,099,725 | 0.73 | 1.40 | — | — | — | |||||||||||||
| Hypermarkets & super centers | 2,876,002 | 0.51 | 0.98 | — | — | — | |||||||||||||
| Fertilizers & agricultural chemicals | 2,801,481 | 0.50 | 0.95 | 3,377,146 | 0.59 | 1.04 | |||||||||||||
| Specialized consumer services | 1,672,677 | 0.30 | 0.57 | 22,538,791 | 3.93 | 6.92 | |||||||||||||
| Computer hardware | 1,324,983 | 0.24 | 0.45 | 3,903,567 | 0.68 | 1.20 | |||||||||||||
| Education services | — | — | — | 15,293,164 | 2.67 | 4.69 | |||||||||||||
| Electronic equipment & instruments | — | — | — | 10,912,302 | 1.90 | 3.35 | |||||||||||||
| Diversified capital markets | — | — | — | 8,763,486 | 1.53 | 2.69 | |||||||||||||
| Construction and engineering | — | — | — | 5,768,770 | 1.01 | 1.77 | |||||||||||||
| Food distributors | — | — | — | 5,623,604 | 0.98 | 1.73 | |||||||||||||
| Restaurants | — | — | — | 4,985,425 | 0.87 | 1.53 | |||||||||||||
| Healthcare technology | — | — | — | 4,747,016 | 0.83 | 1.46 | |||||||||||||
| Wireless telecommunication services | — | — | — | 4,231,659 | 0.74 | 1.30 | |||||||||||||
| Total | $ | 560,436,660 | 100.00 | % | 190.85 | % | $ | 573,604,381 | 100.00 | % | 176.04 | % | |||||||
| September 30, 2020 | September 30, 2019 | ||||||||||||||||||||||||||||||||||
| Fair Value: | % of Total Investments | % of Net Assets | % of Total Investments | % of Net Assets | |||||||||||||||||||||||||||||||
| Application Software | $ | 55,815,754 | 11.13 | % | 20.92 | % | $ | 80,958,933 | 13.52 | % | 28.46 | % | |||||||||||||||||||||||
| Multi-Sector Holdings (1) | 49,409,901 | 9.84 | 18.53 | 54,326,418 | 9.10 | 19.10 | |||||||||||||||||||||||||||||
| Aerospace & Defense | 28,494,531 | 5.67 | 10.68 | 32,504,494 | 5.44 | 11.42 | |||||||||||||||||||||||||||||
| Diversified Support Services | 24,928,749 | 4.96 | 9.36 | 27,311,758 | 4.57 | 9.62 | |||||||||||||||||||||||||||||
| Advertising | 22,317,000 | 4.44 | 8.37 | 20,960,795 | 3.51 | 7.37 | |||||||||||||||||||||||||||||
| Movies & Entertainment | 16,350,259 | 3.26 | 6.14 | 9,616,125 | 1.61 | 3.38 | |||||||||||||||||||||||||||||
| Commercial Printing | 14,786,640 | 2.94 | 5.54 | 15,377,480 | 2.58 | 5.41 | |||||||||||||||||||||||||||||
| Integrated Telecommunication Services | 14,610,386 | 2.91 | 5.49 | 17,138,851 | 2.87 | 6.03 | |||||||||||||||||||||||||||||
| Personal Products | 13,668,174 | 2.72 | 5.12 | 3,017,820 | 0.51 | 1.06 | |||||||||||||||||||||||||||||
| Data Processing & Outsourced Services | 13,585,221 | 2.70 | 5.09 | 16,757,043 | 2.81 | 5.89 | |||||||||||||||||||||||||||||
| Health Care Supplies | 13,450,397 | 2.68 | 5.04 | — | — | — | |||||||||||||||||||||||||||||
| Pharmaceuticals | 13,432,057 | 2.67 | 5.04 | 12,082,358 | 2.02 | 4.25 | |||||||||||||||||||||||||||||
| Health Care Services | 12,745,223 | 2.54 | 4.78 | 17,176,083 | 2.88 | 6.03 | |||||||||||||||||||||||||||||
| Biotechnology | 12,440,847 | 2.48 | 4.66 | 8,040,000 | 1.35 | 2.82 | |||||||||||||||||||||||||||||
| Industrial Machinery | 11,927,158 | 2.37 | 4.48 | 9,206,556 | 1.54 | 3.24 | |||||||||||||||||||||||||||||
| Health Care Technology | 11,752,447 | 2.34 | 4.41 | 11,032,320 | 1.85 | 3.88 | |||||||||||||||||||||||||||||
| Oil & Gas Storage & Transportation | 10,615,154 | 2.11 | 3.98 | 556,541 | 0.09 | 0.20 | |||||||||||||||||||||||||||||
| Systems Software | 9,817,927 | 1.95 | 3.68 | 15,466,728 | 2.59 | 5.43 | |||||||||||||||||||||||||||||
| Specialty Chemicals | 9,741,707 | 1.94 | 3.65 | 3,687,132 | 0.62 | 1.30 | |||||||||||||||||||||||||||||
| Publishing | 9,708,926 | 1.93 | 3.64 | 10,421,039 | 1.75 | 3.66 | |||||||||||||||||||||||||||||
| Real Estate Services | 9,430,625 | 1.88 | 3.54 | 9,875,250 | 1.65 | 3.47 | |||||||||||||||||||||||||||||
| Distributors | 8,674,375 | 1.73 | 3.25 | — | — | — | |||||||||||||||||||||||||||||
| Trading Companies & Distributors | 8,671,111 | 1.73 | 3.25 | 8,929,919 | 1.50 | 3.14 | |||||||||||||||||||||||||||||
| Internet Services & Infrastructure | 8,308,414 | 1.65 | 3.11 | 28,470,497 | 4.77 | 10.01 | |||||||||||||||||||||||||||||
| Specialized Finance | 8,261,863 | 1.64 | 3.10 | 14,473,206 | 2.42 | 5.09 | |||||||||||||||||||||||||||||
| Fertilizers & Agricultural Chemicals | 8,146,141 | 1.62 | 3.05 | — | — | — | |||||||||||||||||||||||||||||
| Alternative Carriers | 8,129,885 | 1.62 | 3.05 | 16,958,629 | 2.84 | 5.97 | |||||||||||||||||||||||||||||
| Research & Consulting Services | 7,281,135 | 1.45 | 2.73 | 10,267,889 | 1.72 | 3.61 | |||||||||||||||||||||||||||||
| Leisure Facilities | 7,260,560 | 1.45 | 2.72 | 8,979,519 | 1.50 | 3.16 | |||||||||||||||||||||||||||||
| Electrical Components & Equipment | 6,139,604 | 1.22 | 2.30 | 6,009,639 | 1.01 | 2.11 | |||||||||||||||||||||||||||||
| Internet & Direct Marketing Retail | 5,547,140 | 1.10 | 2.08 | — | — | — | |||||||||||||||||||||||||||||
| Auto Parts & Equipment | 5,520,667 | 1.10 | 2.07 | 5,385,930 | 0.90 | 1.89 | |||||||||||||||||||||||||||||
| Insurance Brokers | 5,276,017 | 1.05 | 1.97 | — | — | — | |||||||||||||||||||||||||||||
| Metal & Glass Containers | 5,168,898 | 1.03 | 1.94 | 8,387,578 | 1.40 | 2.95 | |||||||||||||||||||||||||||||
| Hotels, Resorts & Cruise Lines | 5,159,265 | 1.03 | 1.93 | — | — | — | |||||||||||||||||||||||||||||
| Oil & Gas Refining & Marketing | 5,131,738 | 1.02 | 1.92 | 11,970,818 | 2.00 | 4.21 | |||||||||||||||||||||||||||||
| Environmental & Facilities Services | 3,753,600 | 0.75 | 1.41 | 3,975,425 | 0.67 | 1.40 | |||||||||||||||||||||||||||||
| Restaurants | 3,550,207 | 0.71 | 1.33 | — | — | — | |||||||||||||||||||||||||||||
| Household Products | 3,313,557 | 0.66 | 1.24 | 4,756,250 | 0.80 | 1.67 | |||||||||||||||||||||||||||||
| Independent Power Producers & Energy Traders | 3,167,063 | 0.63 | 1.19 | — | — | — | |||||||||||||||||||||||||||||
| Managed Health Care | 2,917,727 | 0.58 | 1.09 | — | — | — | |||||||||||||||||||||||||||||
| Electric Utilities | 1,958,422 | 0.39 | 0.73 | — | — | — | |||||||||||||||||||||||||||||
| General Merchandise Stores | 1,504,945 | 0.30 | 0.56 | 1,425,618 | 0.24 | 0.50 | |||||||||||||||||||||||||||||
| Specialized REITs | 421,948 | 0.08 | 0.16 | 8,648,021 | 1.45 | 3.04 | |||||||||||||||||||||||||||||
| Oil & Gas Exploration & Production | — | — | — | 13,947,600 | 2.34 | 4.90 | |||||||||||||||||||||||||||||
| Interactive Media & Services | — | — | — | 11,880,796 | 1.99 | 4.17 | |||||||||||||||||||||||||||||
| Computer & Electronics Retail | — | — | — | 10,781,031 | 1.81 | 3.79 | |||||||||||||||||||||||||||||
| Communications Equipment | — | — | — | 9,361,407 | 1.57 | 3.29 | |||||||||||||||||||||||||||||
| Health Care Equipment | — | — | — | 8,994,333 | 1.51 | 3.16 | |||||||||||||||||||||||||||||
| Human Resource & Employment Services | — | — | — | 8,008,543 | 1.34 | 2.81 | |||||||||||||||||||||||||||||
| IT Consulting & Other Services | — | — | — | 7,974,500 | 1.34 | 2.80 | |||||||||||||||||||||||||||||
| Household Appliances | — | — | — | 6,661,922 | 1.12 | 2.34 | |||||||||||||||||||||||||||||
| Commodity Chemicals | — | — | — | 4,931,156 | 0.83 | 1.73 | |||||||||||||||||||||||||||||
| Oil & Gas Equipment & Services | — | — | — | 410,497 | 0.07 | 0.14 | |||||||||||||||||||||||||||||
| Total | $ | 502,293,365 | 100.00 | % | 188.32 | % | $ | 597,104,447 | 100.00 | % | 209.90 | % | |||||||||||||||||||||||
___________________
(1)This industry includes the Company's investment in the OCSI Glick JV.
109
OAKTREE STRATEGIC INCOME CORPORATION
NOTES TO CONSOLIDATED FINANCIAL STATEMENTS
| September 30, 2017 | September 30, 2016 | |||||
| FSFR Glick JV LLC | 10.3 | % | 11.0 | % | ||
value. Income, consisting of interest, dividends, fees, other investment income and realization of gains or losses, canmay fluctuate upon repayment or sale of an investment and in any given yearperiod can be highly concentrated among several investments. Details of investment income of FSFR
OCSI Glick JV LLC for the years ended September 30, 2017 and September 30, 2016 are as follows:
| Year ended September 30, 2017 | Year ended September 30, 2016 | |||||||||||||
| Investment Income | Percent of Total Investment Income | Investment Income | Percent of Total Investment Income | |||||||||||
| FSFR Glick JV LLC | $ | 5,188,380 | 11.1 | % | $ | 7,777,850 | 14.6 | % | ||||||
In October 2014, the Company entered into an LLC agreement with GF Equity Funding 2014 LLC ("GF Equity Funding") to form FSFRthe OCSI Glick JV. On April 21, 2015, FSFRthe OCSI Glick JV began investing primarily in senior secured loans of middle-market companies. The Company co-invests in these securities with GF Equity Funding through FSFRthe OCSI Glick JV. FSFRThe OCSI Glick JV is managed by a four person Board of Directors, two of whom are selected by the Company and two of whom are selected by GF Equity Funding. FSFRThe OCSI Glick JV is capitalized as transactions are completed, and portfolio decisions and investment decisions in respect of FSFRthe OCSI Glick JV must be approved by the FSFROCSI Glick JV investment committee, which consists of one representative selected by the Company and one representative selected by GF Equity Funding (with approval from a representative of each required). Since the Company does not have a controlling financial interest in the OCSI Glick JV, the Company does not consolidate the OCSI Glick JV. The members provide capital to FSFRthe OCSI Glick JV in exchange for LLC equity interests, and the Company and GF Debt Funding 2014 LLC ("GF Debt Funding"), an entity advised by affiliates of GF Equity Funding, provide capital to FSFRthe OCSI Glick JV in exchange for subordinated notes (the "Subordinated Notes"). As of September 30, 20172020 and September 30, 2016,2019, the Company and GF Equity Funding owned 87.5% and 12.5%, respectively, of the outstanding LLC equity interests, and the Company and GF Debt Funding owned 87.5% and 12.5%, respectively, of the Subordinated Notes. FSFRThe OCSI Glick JV is not an "eligible portfolio company" as defined in section 2(a)(46) of the 1940Investment Company Act.
As of September 30, 20172020, the JV Deutsche Bank Facility includes a waiver period (which extends through January 3, 2021) during which the facility agent is restricted from revaluing certain collateral obligations where the change in valuation is caused by or results from a business disruption due primarily to the COVID-19 pandemic (subject to OCSI Glick JV’s ability to earlier terminate such period in certain circumstances).
As of September 30, 2020 and September 30, 2016, FSFR2019, the OCSI Glick JV had total assets of $126.7$137.9 million and $201.1$179.7 million, respectively. As of September 30, 2017, theThe Company's investment in FSFRthe OCSI Glick JV consisted of LLC equity interests and Subordinated Notes of $57.6$49.4 million and $54.3 million in the aggregate at fair value. Asvalue as of September 30, 2016, the Company's investment in FSFR Glick JV consisted of LLC equity interests2020 and Subordinated Notes of $63.3 million in the aggregate at fair value.September 30, 2019, respectively. The Subordinated Notes are junior in right of payment to the repayment of temporary contributions made by the Company to fund investments of FSFRthe OCSI Glick JV that are repaid when GF Equity Funding and GF Debt Funding make their capital contributions and fund their Subordinated Notes, respectively.
As of September 30, 20172020 and September 30, 2016, FSFR2019, the OCSI Glick JV had total capital commitments of $100.0 million, $87.5 million of which was from the Company and the remaining $12.5 million of which was from GF Equity Funding and GF Debt Funding. Approximately $84.0 million in aggregate commitments were funded as of each of September 30, 2020 and September 30, 2019, of which $73.5 million was from the Company. As of each of September 30, 2020 and September 30, 2019, the Company had commitments to fund Subordinated Notes to the OCSI Glick JV of $78.8 million, of which $12.4 million were unfunded as of each such date. As of each of September 30, 2020 and September 30, 2019, the Company had commitments to fund LLC equity interests in the OCSI Glick JV of $8.7 million, of which $1.6 million were unfunded.
110
OAKTREE STRATEGIC INCOME CORPORATION
NOTES TO CONSOLIDATED FINANCIAL STATEMENTS
Below is a summary of FSFRthe OCSI Glick JV's portfolio, followed by a listing of the individual loans in FSFRthe OCSI Glick JV's portfolio as of September 30, 20172020 and September 30, 2016:2019:
| September 30, 2020 | September 30, 2019 | |||||||||||||
| Senior secured loans (1) | $143,138,964 | $177,911,560 | ||||||||||||
| Weighted average current interest rate on senior secured loans (2) | 5.56% | 6.92% | ||||||||||||
| Number of borrowers in the OCSI Glick JV | 40 | 39 | ||||||||||||
| Largest loan exposure to a single borrower (1) | $6,994,829 | $7,425,000 | ||||||||||||
| Total of five largest loan exposures to borrowers (1) | $31,371,046 | $34,662,500 | ||||||||||||
| September 30, 2017 | September 30, 2016 | |||
| Senior secured loans (1) | $115,964,537 | $194,346,557 | ||
| Weighted average current interest rate on senior secured loans (2) | 6.92% | 7.08% | ||
| Number of borrowers in FSFR Glick JV | 23 | 36 | ||
| Largest loan exposure to a single borrower (1) | $11,267,524 | $12,641,009 | ||
| Total of five largest loan exposures to borrowers (1) | $42,833,696 | $49,318,344 | ||
(1) At principal amount.
(2) Computed using the weighted average annual interest rate on accruing senior secured loans.loans at fair value.
OCSI Glick JV Portfolio as of September 30, 2020
| Portfolio Company | Investment Type | Cash Interest Rate (1)(2) | Industry | Principal | Cost | Fair Value (3) | Notes | ||||||||||||||||||||||
| AI Ladder (Luxembourg) Subco S.a.r.l. | First Lien Term Loan, LIBOR+4.50% cash due 7/9/2025 | 4.65% | Electrical Components & Equipment | $ | 2,671,716 | $ | 2,616,725 | $ | 2,558,168 | (4) | |||||||||||||||||||
| Alvogen Pharma US, Inc. | First Lien Term Loan, LIBOR+5.25% cash due 12/31/2023 | 6.25% | Pharmaceuticals | 6,994,829 | 6,808,979 | 6,773,337 | |||||||||||||||||||||||
| Amplify Finco Pty Ltd. | First Lien Term Loan, LIBOR+4.00% cash due 11/26/2026 | 4.75% | Movies & Entertainment | 2,985,000 | 2,955,150 | 2,567,100 | (4) | ||||||||||||||||||||||
| Anastasia Parent, LLC | First Lien Term Loan, LIBOR+3.75% cash due 8/11/2025 | Personal Products | 1,684,513 | 1,352,429 | 743,814 | (6) | |||||||||||||||||||||||
| Ancile Solutions, Inc. | First Lien Term Loan, LIBOR+7.00% cash due 6/30/2021 | 8.00% | Application Software | 3,201,353 | 3,194,577 | 3,178,943 | (4) | ||||||||||||||||||||||
| Aurora Lux Finco S.À.R.L. | First Lien Term Loan, LIBOR+6.00% cash due 12/24/2026 | 7.00% | Airport Services | 3,731,250 | 3,648,256 | 3,470,063 | |||||||||||||||||||||||
| Brazos Delaware II, LLC | First Lien Term Loan, LIBOR+4.00% cash due 5/21/2025 | 4.16% | Oil & Gas Equipment & Services | 4,887,066 | 4,870,862 | 3,733,376 | |||||||||||||||||||||||
| California Pizza Kitchen, Inc. | First Lien Term Loan, LIBOR+8.00% cash due 8/23/2022 | Restaurants | 5,004,489 | 4,813,378 | 1,526,369 | (6) | |||||||||||||||||||||||
| Carrols Restaurant Group, Inc. | First Lien Term Loan, LIBOR+6.25% cash due 4/30/2026 | 7.25% | Restaurants | 1,118,198 | 1,062,723 | 1,109,811 | (4) | ||||||||||||||||||||||
| CITGO Petroleum Corp. | First Lien Term Loan, LIBOR+5.00% cash due 3/28/2024 | 6.00% | Oil & Gas Refining & Marketing | 3,591,768 | 3,555,850 | 3,421,159 | (4) | ||||||||||||||||||||||
| Connect U.S. Finco LLC | First Lien Term Loan, LIBOR+4.50% cash due 12/11/2026 | 5.50% | Alternative Carriers | 4,582,107 | 4,482,733 | 4,453,258 | (4) | ||||||||||||||||||||||
| Curium Bidco S.à.r.l. | First Lien Term Loan, LIBOR+3.75% cash due 7/9/2026 | 3.97% | Biotechnology | 4,950,000 | 4,912,875 | 4,912,875 | (4) | ||||||||||||||||||||||
| eResearch Technology, Inc. | First Lien Term Loan, LIBOR+4.50% cash due 2/4/2027 | 5.50% | Application Software | 2,493,750 | 2,468,813 | 2,486,992 | (4) | ||||||||||||||||||||||
| Gigamon, Inc. | First Lien Term Loan, LIBOR+4.25% cash due 12/27/2024 | 5.25% | Systems Software | 5,835,900 | 5,800,375 | 5,762,951 | |||||||||||||||||||||||
| Guidehouse LLP | Second Lien Term Loan, LIBOR+8.00% cash due 5/1/2026 | 8.15% | Research & Consulting Services | 5,000,000 | 4,982,443 | 4,825,000 | (4) | ||||||||||||||||||||||
| Helios Software Holdings, Inc. | First Lien Term Loan, LIBOR+4.25% cash due 10/24/2025 | 4.52% | Systems Software | 992,422 | 982,498 | 980,642 | (4) | ||||||||||||||||||||||
| Houghton Mifflin Harcourt Publishers Inc. | First Lien Term Loan, LIBOR+6.25% cash due 11/22/2024 | 7.25% | Education Services | 2,887,500 | 2,790,416 | 2,699,813 | |||||||||||||||||||||||
| Integro Parent, Inc. | First Lien Term Loan, LIBOR+5.75% cash due 10/31/2022 | 6.75% | Insurance Brokers | 3,277,221 | 3,249,274 | 3,011,753 | |||||||||||||||||||||||
| Intelsat Jackson Holdings S.A. | First Lien Delayed Draw Term Loan, LIBOR+5.50% cash due 7/13/2022 | 6.50% | Alternative Carriers | 398,251 | 328,422 | 414,511 | (5) | ||||||||||||||||||||||
| LTI Holdings, Inc. | First Lien Term Loan, LIBOR+3.50% cash due 9/6/2025 | 3.65% | Electronic Components | 1,386,341 | 1,100,748 | 1,294,496 | |||||||||||||||||||||||
| MHE Intermediate Holdings, LLC | First Lien Term Loan, LIBOR+5.00% cash due 3/8/2024 | 6.00% | Diversified Support Services | 4,101,250 | 4,058,056 | 3,991,747 | (4) | ||||||||||||||||||||||
| MHE Intermediate Holdings, LLC | First Lien Delayed Draw Term Loan, LIBOR+5.00% cash due 3/8/2024 | 6.00% | Diversified Support Services | 828,579 | 818,379 | 806,456 | (4) | ||||||||||||||||||||||
| Total MHE Intermediate Holdings, LLC | 4,929,829 | 4,876,435 | 4,798,203 | ||||||||||||||||||||||||||
111
OAKTREE STRATEGIC INCOME CORPORATION
NOTES TO CONSOLIDATED FINANCIAL STATEMENTS
| Portfolio Company | Industry | Investment Type | Maturity Date | Current Interest Rate (1)(4) | Cash Interest Rate (1) | Principal | Cost | Fair Value (2) | |||||||||||||||
| Ameritox Ltd. (3)(5) | Healthcare services | First Lien Term Loan | 4/11/2021 | LIBOR+5% (1% floor) cash 3% PIK | 6.33 | % | $2,287,177 | $2,243,202 | $265,211 | ||||||||||||||
| Healthcare services | 119,910.76 Class B Preferred Units | 119,911 | — | ||||||||||||||||||||
| Healthcare services | 368.96 Class A Common Units | 2,174,034 | — | ||||||||||||||||||||
| Total Ameritox Ltd | 2,287,177 | 4,537,147 | 265,211 | ||||||||||||||||||||
| Beyond Trust Software, Inc. (3) | Application software | First Lien Term Loan | 9/25/2019 | LIBOR+7% (1% floor) cash | 8.33 | % | 11,267,524 | 11,220,478 | 11,267,116 | ||||||||||||||
| Compuware Corporation (3) | Internet software & services | First Lien Term Loan B3 | 12/15/2021 | LIBOR+4.25% (1% floor) cash | 5.49 | % | 6,279,920 | 6,225,992 | 6,358,419 | ||||||||||||||
| Metamorph US 3, LLC (3)(5) | Internet software & services | First Lien Term Loan | 12/1/2020 | LIBOR+5.5% (1% floor) cash 2% PIK | 6.74 | % | 6,825,900 | 6,477,372 | 2,592,115 | ||||||||||||||
| Motion Recruitment Partners LLC (3) | Human resources & employment services | First Lien Term Loan | 2/13/2020 | LIBOR+6% (1% floor) cash | 7.24 | % | 8,659,650 | 8,659,650 | 8,659,223 | ||||||||||||||
| NAVEX Global, Inc. | Internet software & services | First Lien Term Loan | 11/19/2021 | LIBOR+4.25% (1% floor) cash | 5.49 | % | 2,977,041 | 2,967,620 | 2,988,205 | ||||||||||||||
| Air Newco LLC | IT consulting & other services | First Lien Term Loan B | 3/20/2022 | LIBOR+5.5% (1% floor) cash | 6.82 | % | 8,160,622 | 8,141,224 | 8,099,417 | ||||||||||||||
| CM Delaware LLC | Advertising | First Lien Term Loan | 3/18/2021 | LIBOR+5.25% (1% floor) cash | 6.58 | % | 2,075,162 | 2,073,617 | 2,064,786 | ||||||||||||||
| New Trident Holdcorp, Inc. (3) | Healthcare services | First Lien Term Loan B | 7/31/2019 | LIBOR+5.75% (1.25% floor) cash | 7.08 | % | 2,018,206 | 2,000,877 | 1,453,109 | ||||||||||||||
| Central Security Group, Inc. (3) | Specialized consumer services | First Lien Term Loan | 10/6/2021 | LIBOR+5.625% (1% floor) cash | 6.86 | % | 3,876,067 | 3,880,408 | 3,892,211 | ||||||||||||||
| Aptos, Inc. (3) | Data processing & outsourced services | First Lien Term Loan B | 9/1/2022 | LIBOR+6.75% (1% floor) cash | 8.08 | % | 7,920,000 | 7,790,262 | 7,840,800 | ||||||||||||||
| Vubiquity, Inc. | Application software | First Lien Term Loan | 8/12/2021 | LIBOR+5.5% (1% floor) cash | 6.83 | % | 4,126,500 | 4,099,195 | 4,095,551 | ||||||||||||||
| Poseidon Merger Sub, Inc. (3) | Advertising | Second Lien Term Loan | 8/15/2023 | LIBOR+8.5% (1% floor) cash | 9.81 | % | 3,000,000 | 2,933,633 | 3,030,000 | ||||||||||||||
| Novetta Solutions, LLC | Diversified support services | First Lien Term Loan | 10/16/2022 | LIBOR+5% (1% floor) cash | 6.34 | % | 5,990,978 | 5,932,073 | 5,826,226 | ||||||||||||||
| SHO Holding I Corporation | Footwear | First Lien Term Loan | 10/27/2022 | LIBOR+5% (1% floor) cash | 6.24 | % | 6,386,250 | 6,338,479 | 6,306,422 | ||||||||||||||
| Valet Merger Sub, Inc. (3) | Environmental & facilities services | First Lien Term Loan | 9/24/2021 | LIBOR+7% (1% floor) cash | 8.24 | % | 3,920,000 | 3,877,655 | 3,919,865 | ||||||||||||||
| Environmental & facilities services | Incremental Term Loan | 9/24/2021 | LIBOR+7% (1% floor) cash | 8.24 | % | 1,027,425 | 1,006,080 | 1,027,390 | |||||||||||||||
| Total Valet Merger Sub, Inc. | 4,947,425 | 4,883,735 | 4,947,255 | ||||||||||||||||||||
| RSC Acquisition, Inc. | Insurance brokers | First Lien Term Loan | 11/30/2022 | LIBOR+5.25% (1% floor) cash | 6.58 | % | 3,930,134 | 3,912,198 | 3,890,832 | ||||||||||||||
| Integro Parent Inc. | Insurance brokers | First Lien Term Loan | 10/31/2022 | LIBOR+5.75% (1% floor) cash | 7.06 | % | 4,913,924 | 4,790,511 | 4,901,639 | ||||||||||||||
| TruckPro, LLC | Auto parts & equipment | First Lien Term Loan | 8/6/2018 | LIBOR+5% (1% floor) cash | 6.24 | % | 1,823,268 | 1,821,822 | 1,825,054 | ||||||||||||||
| Falmouth Group Holdings Corp. | Specialty chemicals | First Lien Term Loan | 12/13/2021 | LIBOR+6.75% (1% floor) cash | 8.08 | % | 4,610,174 | 4,572,990 | 4,610,400 | ||||||||||||||
| Ancile Solutions, Inc. (3) | Internet software & services | First Lien Term Loan | 6/30/2021 | LIBOR+7% (1% floor) cash | 8.33 | % | 4,042,355 | 3,995,621 | 4,010,198 | ||||||||||||||
| California Pizza Kitchen, Inc. | Restaurants | First Lien Term Loan | 8/23/2022 | LIBOR+6% (1% floor) cash | 7.24 | % | 4,950,000 | 4,938,077 | 4,917,008 | ||||||||||||||
| MHE Intermediate Holdings, LLC (3) | Diversified support services | First Lien Term Loan B | 3/11/2024 | LIBOR+5% (1% floor) cash | 6.33 | % | 4,228,750 | 4,150,304 | 4,228,752 | ||||||||||||||
| Diversified support services | Delayed Draw Term Loan | 3/11/2024 | LIBOR+5% (1% floor) cash | 6.33 | % | 667,510 | 635,208 | 667,510 | |||||||||||||||
| Total MHE Intermediate Holdings, LLC | 4,896,260 | 4,785,512 | 4,896,262 | ||||||||||||||||||||
| Total Portfolio Investments | $ | 115,964,537 | $ | 116,978,493 | $ | 108,737,459 | |||||||||||||||||
| Portfolio Company | Investment Type | Cash Interest Rate (1)(2) | Industry | Principal | Cost | Fair Value (3) | Notes | ||||||||||||||||||||||
| MRI Software LLC | First Lien Term Loan, LIBOR+5.50% cash due 2/10/2026 | 6.50% | Application Software | $ | 1,614,980 | $ | 1,601,301 | $ | 1,575,954 | (4) | |||||||||||||||||||
| MRI Software LLC | First Lien Revolver, LIBOR+5.50% cash due 2/10/2026 | Application Software | — | (1,429) | (3,454) | (4)(5) | |||||||||||||||||||||||
| MRI Software LLC | First Lien Delayed Draw Term Loan, LIBOR+5.50% cash due 2/10/2026 | Application Software | — | (763) | (1,568) | (4)(5) | |||||||||||||||||||||||
| Total MRI Software LLC | 1,614,980 | 1,599,109 | 1,570,932 | ||||||||||||||||||||||||||
| Navicure, Inc. | First Lien Term Loan, LIBOR+4.00% cash due 10/22/2026 | 4.15% | Health Care Technology | 3,980,000 | 3,960,100 | 3,899,584 | |||||||||||||||||||||||
| Northern Star Industries Inc. | First Lien Term Loan, LIBOR+4.75% cash due 3/31/2025 | 5.75% | Electrical Components & Equipment | 5,362,500 | 5,345,242 | 5,121,188 | |||||||||||||||||||||||
| Northwest Fiber, LLC | First Lien Term Loan, LIBOR+5.50% cash due 4/30/2027 | 5.66% | Integrated Telecommunication Services | 985,530 | 950,121 | 986,762 | (4) | ||||||||||||||||||||||
| Novetta Solutions, LLC | First Lien Term Loan, LIBOR+5.00% cash due 10/17/2022 | 6.00% | Application Software | 5,807,651 | 5,770,724 | 5,706,017 | |||||||||||||||||||||||
| OEConnection LLC | First Lien Term Loan, LIBOR+4.00% cash due 9/25/2026 | 4.15% | Application Software | 3,727,256 | 3,709,171 | 3,685,325 | (4) | ||||||||||||||||||||||
| OEConnection LLC | First Lien Delayed Draw Term Loan, LIBOR+4.00% cash due 9/25/2026 | Application Software | — | (1,048) | (2,654) | (4)(5) | |||||||||||||||||||||||
| Total OEConnection LLC | 3,727,256 | 3,708,123 | 3,682,671 | ||||||||||||||||||||||||||
| Olaplex, Inc. | First Lien Term Loan, LIBOR+6.50% cash due 1/8/2026 | 7.50% | Personal Products | 2,962,500 | 2,910,467 | 2,962,500 | (4) | ||||||||||||||||||||||
| Olaplex, Inc. | First Lien Revolver, LIBOR+6.50% cash due 1/8/2025 | 7.50% | Personal Products | 162,000 | 156,467 | 162,000 | (4)(5) | ||||||||||||||||||||||
| Total Olaplex, Inc. | 3,124,500 | 3,066,934 | 3,124,500 | ||||||||||||||||||||||||||
| Sabert Corporation | First Lien Term Loan, LIBOR+4.50% cash due 12/10/2026 | 5.50% | Metal & Glass Containers | 1,885,500 | 1,866,645 | 1,860,366 | (4) | ||||||||||||||||||||||
| SHO Holding I Corporation | First Lien Term Loan, LIBOR+3.00% cash PIK 2.25% due 4/27/2024 | 4.00% | Footwear | 6,239,067 | 6,212,276 | 4,382,944 | |||||||||||||||||||||||
| Signify Health, LLC | First Lien Term Loan, LIBOR+4.50% cash due 12/23/2024 | 5.50% | Health Care Services | 5,850,000 | 5,813,914 | 5,645,250 | (4) | ||||||||||||||||||||||
| Sunshine Luxembourg VII SARL | First Lien Term Loan, LIBOR+4.25% cash due 10/1/2026 | 5.25% | Personal Products | 6,451,250 | 6,418,993 | 6,427,573 | |||||||||||||||||||||||
| Supermoose Borrower, LLC | First Lien Term Loan, LIBOR+3.75% cash due 8/29/2025 | 3.90% | Application Software | 2,878,863 | 2,692,385 | 2,595,483 | (4) | ||||||||||||||||||||||
| Surgery Center Holdings, Inc. | First Lien Term Loan, LIBOR+3.25% cash due 9/3/2024 | 4.25% | Health Care Facilities | 4,961,637 | 4,942,580 | 4,690,806 | |||||||||||||||||||||||
| Tribe Buyer LLC | First Lien Term Loan, LIBOR+4.50% cash due 2/16/2024 | 5.50% | Human Resource & Employment Services | 1,616,127 | 1,613,862 | 1,224,798 | |||||||||||||||||||||||
| UFC Holdings, LLC | First Lien Term Loan, LIBOR+3.25% cash due 4/29/2026 | 4.25% | Movies & Entertainment | 1,557,649 | 1,540,707 | 1,534,775 | (4) | ||||||||||||||||||||||
| Verscend Holding Corp. | First Lien Term Loan, LIBOR+4.50% cash due 8/27/2025 | 4.65% | Health Care Technology | 1,733,723 | 1,720,364 | 1,722,238 | (4) | ||||||||||||||||||||||
| VM Consolidated, Inc. | First Lien Term Loan, LIBOR+3.25% cash due 2/28/2025 | 3.40% | Data Processing & Outsourced Services | 4,771,728 | 4,756,892 | 4,682,258 | |||||||||||||||||||||||
| Windstream Services II, LLC | First Lien Term Loan, LIBOR+6.25% cash due 9/21/2027 | 7.25% | Integrated Telecommunication Services | 4,987,500 | 4,788,469 | 4,839,970 | (4) | ||||||||||||||||||||||
| WP CPP Holdings, LLC | Second Lien Term Loan, LIBOR+7.75% cash due 4/30/2026 | 8.75% | Aerospace & Defense | 3,000,000 | 2,978,243 | 2,340,000 | (4) | ||||||||||||||||||||||
| Total Portfolio Investments | $ | 143,138,964 | $ | 140,599,644 | $ | 130,760,749 | |||||||||||||||||||||||
__________
(1) Represents the current interest rate as of September 30, 2017.2020. All interest rates are payable in cash, unless otherwise noted.
(2) Represents the current determination of fair value as of September 30, 2017 utilizing a similar technique as the Company in accordance with ASC 820. However, the determination of such fair value is not included in the Company's Board of Directors' valuation process described elsewhere herein.
| Portfolio Company | Industry | Investment Type | Maturity Date | Current Interest Rate (1)(4) | Cash Interest Rate (1) | Principal | Cost | Fair Value (2) | |||||||||||||||
| Ameritox Ltd. (3) | Healthcare services | First Lien Term Loan | 4/11/2021 | LIBOR+5% (1% floor) cash 3% PIK | 6.00 | % | $2,339,146 | $2,336,840 | $2,322,917 | ||||||||||||||
| Healthcare services | 119,910.76 Class B Preferred Units | — | 119,911 | 131,369 | |||||||||||||||||||
| Healthcare services | 368.96 Class A Common Units | — | 2,174,034 | 981,348 | |||||||||||||||||||
| Total Ameritox Ltd | 2,339,146 | 4,630,785 | 3,435,634 | ||||||||||||||||||||
| Answers Corporation (3) (5) | Internet software & services | First Lien Term Loan | 10/3/2021 | LIBOR+5.25% (1% floor) cash | 6.25 | % | 7,899,749 | 7,636,708 | 4,265,865 | ||||||||||||||
| Beyond Trust Software, Inc. (3) | Application software | First Lien Term Loan | 9/25/2019 | LIBOR+7% (1% floor) cash | 8.00 | % | 12,641,009 | 12,554,571 | 12,538,499 | ||||||||||||||
| Compuware Corporation (3) | Internet software & services | First Lien Term Loan B1 | 12/15/2019 | LIBOR+5.25% (1% floor) cash | 6.25 | % | 7,392,405 | 7,306,444 | 7,420,127 | ||||||||||||||
| Metamorph US 3, LLC (3) | Internet software & services | First Lien Term Loan | 12/1/2020 | LIBOR+6.5% (1% floor) cash | 7.50 | % | 6,900,283 | 6,808,009 | 5,744,139 | ||||||||||||||
| Motion Recruitment Partners LLC (3) | Diversified support services | First Lien Term Loan | 2/13/2020 | LIBOR+6% (1% floor) cash | 7.00 | % | 9,125,000 | 9,125,000 | 9,099,254 | ||||||||||||||
| NAVEX Global, Inc. (3) | Internet software & services | First Lien Term Loan | 11/19/2021 | LIBOR+4.75% (1% floor) cash | 5.99 | % | 1,793,550 | 1,779,633 | 1,784,582 | ||||||||||||||
| Teaching Strategies, LLC | Education services | First Lien Term Loan (3) | 10/1/2019 | LIBOR+5.5% (0.5% floor) cash | 6.34 | % | 2,570,471 | 2,567,575 | 2,556,891 | ||||||||||||||
| Education services | First Lien Delayed Draw Term Loan | 10/1/2019 | LIBOR+5.5% (0.5% floor) cash | 6.34 | % | 6,840,000 | 6,832,715 | 6,803,695 | |||||||||||||||
| Total Teaching Strategies, LLC | 9,410,471 | 9,400,290 | 9,360,586 | ||||||||||||||||||||
| TrialCard Incorporated (3) | Healthcare services | First Lien Term Loan | 12/31/2019 | LIBOR+4.5% (1% floor) cash | 5.50 | % | 7,179,097 | 7,144,396 | 7,144,248 | ||||||||||||||
| Air Newco LLC | IT consulting & other services | First Lien Term Loan B | 3/20/2022 | LIBOR+5.5% (1% floor) cash | 6.50 | % | 8,291,864 | 8,267,671 | 7,960,189 | ||||||||||||||
| Fineline Technologies, Inc. (3) | Electronic equipment & instruments | First Lien Term Loan | 5/5/2017 | LIBOR+5.5% (1% floor) cash | 6.50 | % | 7,034,441 | 7,010,963 | 7,015,051 | ||||||||||||||
| LegalZoom.com, Inc. (3) | Specialized consumer services | First Lien Term Loan | 5/13/2020 | LIBOR+7% (1% floor) cash | 8.00 | % | 9,850,000 | 9,672,034 | 9,772,706 | ||||||||||||||
| GK Holdings, Inc. | IT consulting & other services | First Lien Term Loan | 1/20/2021 | LIBOR+5.5% (1% floor) cash | 6.50 | % | 3,438,750 | 3,452,038 | 3,412,959 | ||||||||||||||
| Vitera Healthcare Solutions, LLC | Healthcare technology | Second Lien Term Loan | 11/4/2021 | LIBOR+8.25% (1% floor) cash | 9.25 | % | 3,000,000 | 2,958,409 | 2,782,500 | ||||||||||||||
| TIBCO Software, Inc. (3) | Internet software & services | First Lien Term Loan | 12/4/2020 | LIBOR+5.5% (1% floor) cash | 6.50 | % | 2,304,900 | 2,308,815 | 2,277,114 | ||||||||||||||
| CM Delaware LLC | Advertising | First Lien Term Loan | 3/18/2021 | LIBOR+5.25% (1% floor) cash | 6.25 | % | 2,096,666 | 2,094,658 | 1,978,729 | ||||||||||||||
| New Trident Holdcorp, Inc. (3) | Healthcare services | First Lien Term Loan B | 7/31/2019 | LIBOR+5.25% (1.25% floor) cash | 6.50 | % | 2,041,357 | 2,014,233 | 1,755,567 | ||||||||||||||
| Central Security Group, Inc. (3) | Specialized consumer services | First Lien Term Loan | 10/6/2020 | LIBOR+5.625% (1% floor) cash | 6.63 | % | 5,909,774 | 5,915,626 | 5,776,805 | ||||||||||||||
| Auction.com, LLC | Internet software & services | First Lien Term Loan | 5/12/2019 | LIBOR+5% (1% floor) cash | 6.00 | % | 3,940,000 | 3,926,700 | 3,959,700 | ||||||||||||||
| Aptos, Inc. (3) | Data processing & outsourced services | First Lien Term Loan B | 9/1/2022 | LIBOR+6.75% (1% floor) cash | 7.75 | % | 8,000,000 | 7,842,222 | 7,920,000 | ||||||||||||||
| Vubiquity, Inc. | Application software | First Lien Term Loan | 8/12/2021 | LIBOR+5.5% (1% floor) cash | 6.50 | % | 4,168,500 | 4,133,700 | 4,147,658 | ||||||||||||||
| Too Faced Cosmetics, LLC (3) | Personal products | First Lien Term Loan B | 7/7/2021 | LIBOR+5% (1% floor) cash | 6.00 | % | 642,692 | 581,620 | 645,155 | ||||||||||||||
| American Seafoods Group LLC (3) | Food distributors | First Lien Term Loan | 8/19/2021 | LIBOR+5% (1% floor) cash | 6.00 | % | 3,853,704 | 3,837,366 | 3,844,069 | ||||||||||||||
| Worley Claims Services, LLC | Internet software & services | First Lien Term Loan | 10/31/2020 | LIBOR+8% (1% floor) cash | 9.00 | % | 5,730,937 | 5,707,511 | 5,702,282 | ||||||||||||||
| Portfolio Company | Industry | Investment Type | Maturity Date | Current Interest Rate (1)(4) | Cash Interest Rate (1) | Principal | Cost | Fair Value (2) | |||||||||||||||
| Poseidon Merger Sub, Inc. (3) | Advertising | Second Lien Term Loan | 8/15/2023 | LIBOR+8.5% (1% floor) cash | 9.50 | % | $ | 3,000,000 | $ | 2,922,316 | $ | 3,039,954 | |||||||||||
| AccentCare, Inc. | Healthcare services | First Lien Term Loan | 9/3/2021 | LIBOR+5.75% (1% floor) cash | 6.75 | % | 7,850,000 | 7,773,386 | 7,727,344 | ||||||||||||||
| Novetta Solutions, LLC | Diversified support services | First Lien Term Loan | 10/17/2022 | LIBOR+5.75% (1% floor) cash | 6.00 | % | 6,477,948 | 6,392,100 | 6,226,928 | ||||||||||||||
| SHO Holding I Corporation | Footwear | First Lien Term Loan | 10/27/2022 | LIBOR+5% (1% floor) cash | 6.00 | % | 6,451,250 | 6,393,472 | 6,443,186 | ||||||||||||||
| Valet Merger Sub, Inc. (3) | Environmental & facilities services | First Lien Term Loan | 9/24/2021 | LIBOR+7% (1% floor) cash | 8.00 | % | 3,960,000 | 3,906,498 | 4,026,826 | ||||||||||||||
| RSC Acquisition, Inc. | Insurance brokers | First Lien Term Loan | 11/30/2022 | LIBOR+5.25% (1% floor) cash | 6.25 | % | 3,970,390 | 3,948,754 | 3,950,538 | ||||||||||||||
| Integro Parent Inc. | Insurance brokers | First Lien Term Loan | 10/31/2022 | LIBOR+5.75% (1% floor) cash | 6.75 | % | 4,963,924 | 4,814,658 | 4,889,465 | ||||||||||||||
| TruckPro, LLC | Auto parts & equipment | First Lien Term Loan | 8/6/2018 | LIBOR+5% (1% floor) cash | 6.00 | % | 1,920,000 | 1,916,612 | 1,919,232 | ||||||||||||||
| Falmouth Group Holdings Corp. | Specialty chemicals | First Lien Term Loan | 12/13/2021 | LIBOR+6.75% (1% floor) cash | 7.75 | % | 4,962,500 | 4,912,596 | 4,967,689 | ||||||||||||||
| Sundial Group Holdings LLC | Personal products | First Lien Term Loan | 10/19/2021 | LIBOR+6.25% (1% floor) cash | 7.25 | % | 3,900,000 | 3,839,938 | 3,954,402 | ||||||||||||||
| Onvoy, LLC (3) | Integrated telecommunication services | First Lien Term Loan | 4/29/2021 | LIBOR+6.25% (1% floor) cash | 7.25 | % | 7,406,250 | 7,261,422 | 7,386,738 | ||||||||||||||
| Ancile Solutions, Inc. (3) | Internet software & services | First Lien Term Loan | 6/30/2021 | LIBOR+7% (1% floor) cash | 8.00 | % | 4,500,000 | 4,433,644 | 4,432,500 | ||||||||||||||
| Total Portfolio Investments | $ | 194,346,557 | $ | 194,624,798 | $ | 188,708,220 | |||||||||||||||||
112
OAKTREE STRATEGIC INCOME CORPORATION
NOTES TO CONSOLIDATED FINANCIAL STATEMENTS
(4) This investment is held by both the Company and FSFRthe OCSI Glick JV as of September 30, 2016.2020.
(6) This investment was on cash non-accrual status as of September 30, 2020. Cash non-accrual is inclusive of PIK and other non-cash income where applicable.
OCSI Glick JV Portfolio as of September 30, 2019
| Portfolio Company | Investment Type | Cash Interest Rate (1)(2) | Industry | Principal | Cost | Fair Value (3) | Notes | ||||||||||||||||||||||
| AI Ladder (Luxembourg) Subco S.a.r.l. | First Lien Term Loan, LIBOR+4.50% cash due 7/9/2025 | 6.60% | Electrical components & equipment | $ | 2,718,993 | $ | 2,651,270 | $ | 2,504,016 | (4) | |||||||||||||||||||
| Air Newco LP | First Lien Term Loan, LIBOR+4.75% cash due 5/31/2024 | 6.79% | IT consulting & other services | 7,425,000 | 7,406,438 | 7,437,400 | |||||||||||||||||||||||
| AL Midcoast Holdings LLC | First Lien Term Loan, LIBOR+5.50% cash due 8/1/2025 | 7.60% | Oil & gas storage & transportation | 6,930,000 | 6,860,699 | 6,834,712 | (4) | ||||||||||||||||||||||
| Altice France S.A. | First Lien Term Loan, LIBOR+4.00% cash due 8/14/2026 | 6.03% | Integrated telecommunication services | 2,977,500 | 2,912,809 | 2,975,639 | |||||||||||||||||||||||
| Alvogen Pharma US, Inc. | First Lien Term Loan, LIBOR+4.75% cash due 4/1/2022 | 6.79% | Pharmaceuticals | 5,359,286 | 5,359,286 | 4,874,270 | |||||||||||||||||||||||
| Ancile Solutions, Inc. | First Lien Term Loan, LIBOR+7.00% cash due 6/30/2021 | 9.10% | Application software | 3,395,374 | 3,377,463 | 3,327,467 | (4) | ||||||||||||||||||||||
| Aptos, Inc. | First Lien Term Loan, LIBOR+5.50% cash due 7/23/2025 | 7.70% | Computer & electronics retail | 2,977,500 | 2,947,725 | 2,940,281 | (4) | ||||||||||||||||||||||
| Brazos Delaware II, LLC | First Lien Term Loan, LIBOR+4.00% cash due 5/21/2025 | 6.05% | Oil & gas equipment & services | 4,937,500 | 4,917,589 | 4,570,273 | |||||||||||||||||||||||
| California Pizza Kitchen, Inc. | First Lien Term Loan, LIBOR+6.00% cash due 8/23/2022 | 8.53% | Restaurants | 4,850,000 | 4,838,318 | 4,349,868 | |||||||||||||||||||||||
| CITGO Petroleum Corp. | First Lien Term Loan, LIBOR+5.00% cash due 3/28/2024 | 7.10% | Oil & gas refining & marketing | 3,980,000 | 3,940,200 | 4,004,875 | (4) | ||||||||||||||||||||||
| Connect U.S. Finco LLC | First Lien Term Loan, LIBOR+4.50% cash due 9/23/2026 | 7.10% | Alternative Carriers | 5,000,000 | 4,900,000 | 4,930,075 | (4) | ||||||||||||||||||||||
| Covia Holdings Corporation | First Lien Term Loan, LIBOR+4.00% cash due 6/1/2025 | 6.31% | Oil & gas equipment & services | 6,912,500 | 6,912,500 | 5,673,745 | |||||||||||||||||||||||
| Curium Bidco S.à r.l. | First Lien Term Loan, LIBOR+4.00% cash due 7/9/2026 | 6.10% | Biotechnology | 5,000,000 | 4,962,500 | 5,025,000 | (4) | ||||||||||||||||||||||
| Ellie Mae, Inc. | First Lien Term Loan, LIBOR+4.00% cash due 4/17/2026 | 6.04% | Application software | 1,000,000 | 995,000 | 1,002,920 | (4) | ||||||||||||||||||||||
| Falmouth Group Holdings Corp. | First Lien Term Loan, LIBOR+6.75% cash due 12/14/2021 | 8.95% | Specialty chemicals | 4,658,544 | 4,626,032 | 4,632,004 | |||||||||||||||||||||||
| Frontier Communications Corporation | First Lien Term Loan, LIBOR+3.75% cash due 6/15/2024 | 5.80% | Integrated telecommunications services | 5,468,222 | 5,365,594 | 5,466,281 | (4) | ||||||||||||||||||||||
| Gigamon, Inc. | First Lien Term Loan, LIBOR+4.25% cash due 12/27/2024 | 6.29% | Systems software | 5,895,000 | 5,850,631 | 5,732,888 | |||||||||||||||||||||||
| Guidehouse LLP | Second Lien Term Loan, LIBOR+7.50% cash due 5/1/2026 | 9.54% | Research & consulting services | 5,000,000 | 4,979,290 | 4,937,500 | (4) | ||||||||||||||||||||||
| Indivior Finance S.a.r.l. | First Lien Term Loan, LIBOR+4.50% cash due 12/19/2022 | 6.76% | Pharmaceuticals | 4,340,941 | 4,326,851 | 3,997,290 | (4) | ||||||||||||||||||||||
| Integro Parent, Inc. | First Lien Term Loan, LIBOR+5.75% cash due 10/31/2022 | 7.80% | Insurance brokers | 4,813,924 | 4,744,243 | 4,681,541 | |||||||||||||||||||||||
| Intelsat Jackson Holdings S.A. | First Lien Term Loan, LIBOR+3.75% cash due 11/27/2023 | 5.80% | Alternative Carriers | 5,000,000 | 4,939,169 | 5,021,100 | |||||||||||||||||||||||
| McDermott Technology (Americas), Inc. | First Lien Term Loan, LIBOR+5.00% cash due 5/9/2025 | 7.10% | Oil & gas equipment & services | 1,429,306 | 1,406,187 | 913,565 | (4) | ||||||||||||||||||||||
| MHE Intermediate Holdings, LLC | First Lien Term Loan, LIBOR+5.00% cash due 3/8/2024 | 7.10% | Diversified support services | 4,143,750 | 4,089,029 | 4,060,875 | (4) | ||||||||||||||||||||||
| First Lien Delayed Draw Term Loan, LIBOR+5.00% cash due 3/8/2024 | 7.10% | Diversified support services | 837,128 | 826,823 | 820,385 | (4) | |||||||||||||||||||||||
| Total MHE Intermediate Holdings, LLC | 4,980,878 | 4,915,852 | 4,881,260 | ||||||||||||||||||||||||||
| Navicure, Inc. | First Lien Term Loan, LIBOR+4.00% cash due 9/18/2026 | 6.13% | Healthcare technology | 4,000,000 | 3,980,000 | 4,005,000 | |||||||||||||||||||||||
113
OAKTREE STRATEGIC INCOME CORPORATION
NOTES TO CONSOLIDATED FINANCIAL STATEMENTS
| Portfolio Company | Investment Type | Cash Interest Rate (1)(2) | Industry | Principal | Cost | Fair Value (3) | Notes | ||||||||||||||||||||||
| Northern Star Industries Inc. | First Lien Term Loan, LIBOR+4.50% cash due 3/31/2025 | 6.56% | Electrical components & equipment | $ | 5,417,500 | $ | 5,396,178 | $ | 5,336,238 | ||||||||||||||||||||
| Novetta Solutions, LLC | First Lien Term Loan, LIBOR+5.00% cash due 10/17/2022 | 7.05% | Application software | 5,868,628 | 5,824,577 | 5,760,440 | |||||||||||||||||||||||
| OCI Beaumont LLC | First Lien Term Loan, LIBOR+4.00% cash due 3/13/2025 | 6.10% | Commodity chemicals | 6,895,000 | 6,888,231 | 6,903,619 | (4) | ||||||||||||||||||||||
| OEConnection LLC | First Lien Delayed Draw Term Loan, LIBOR+4.00% cash due 9/24/2026 | Application software | — | (1,720) | (645) | (4)(5) | |||||||||||||||||||||||
| First Lien Term Loan, LIBOR+4.00% cash due 9/24/2026 | 6.13% | Application software | 3,655,914 | 3,637,634 | 3,649,059 | (4) | |||||||||||||||||||||||
| Total OEConnection LLC | 3,655,914 | 3,635,914 | 3,648,414 | ||||||||||||||||||||||||||
| Red Ventures, LLC | First Lien Term Loan, LIBOR+3.00% cash due 11/8/2024 | 5.04% | Interactive media & services | 3,989,924 | 3,970,677 | 4,010,712 | |||||||||||||||||||||||
| RSC Acquisition, Inc. | First Lien Term Loan, LIBOR+4.25% cash due 11/30/2022 | 6.29% | Trading companies & distributors | 3,849,574 | 3,835,594 | 3,820,702 | |||||||||||||||||||||||
| Servpro Borrower, LLC | First Lien Term Loan, PRIME+2.50% cash due 3/26/2026 | 7.50% | Specialized consumer services | 3,980,000 | 3,970,050 | 3,984,975 | |||||||||||||||||||||||
| SHO Holding I Corporation | First Lien Term Loan, LIBOR+5.00% cash due 10/27/2022 | 7.26% | Footwear | 6,256,250 | 6,227,881 | 5,943,438 | |||||||||||||||||||||||
| Signify Health, LLC | First Lien Term Loan, LIBOR+4.50% cash due 12/23/2024 | 6.60% | Healthcare services | 5,910,000 | 5,864,902 | 5,902,613 | (4) | ||||||||||||||||||||||
| Sunshine Luxembourg VII SARL | First Lien Term Loan, LIBOR+4.25% cash due 9/25/2026 | 6.59% | Personal products | 6,500,000 | 6,467,500 | 6,538,610 | (4) | ||||||||||||||||||||||
| Tribe Buyer LLC | First Lien Term Loan, LIBOR+4.50% cash due 2/16/2024 | 6.54% | Human resources & employment services | 3,114,779 | 3,109,120 | 2,907,133 | (4) | ||||||||||||||||||||||
| Triple Royalty Sub LLC | Fixed Rate Bond 144A 9.0% Toggle PIK cash due 4/15/2033 | Pharmaceuticals | 3,000,000 | 3,000,000 | 3,105,000 | ||||||||||||||||||||||||
| UFC Holdings, LLC | First Lien Term Loan, LIBOR+3.25% cash due 4/29/2026 | 5.30% | Movies & entertainment | 2,493,573 | 2,493,573 | 2,503,099 | (4) | ||||||||||||||||||||||
| Verra Mobility, Corp. | First Lien Term Loan, LIBOR+3.75% cash due 2/28/2025 | 5.79% | Data processing & outsourced services | 4,929,950 | 4,913,436 | 4,956,645 | (4) | ||||||||||||||||||||||
| WP CPP Holdings, LLC | Second Lien Term Loan, LIBOR+7.75% cash due 4/30/2026 | 10.01% | Aerospace & defense | 3,000,000 | 2,974,333 | 2,987,490 | (4) | ||||||||||||||||||||||
| Total Portfolio Investments | $ | 177,911,560 | $ | 176,687,612 | $ | 173,028,098 | |||||||||||||||||||||||
________
(1) Represents the interest rate as of September 30, 2019. All interest rates are payable in cash, unless otherwise noted.
(2) The interest rate on the principal balance outstanding for all floating rate loans is indexed to LIBOR and/or an alternate base rate (e.g., prime rate), which typically resets semi-annually, quarterly, or monthly at the borrower's option. The borrower may also elect to have multiple interest reset periods for each loan. For each of these loans, the Company has provided the applicable margin over LIBOR or the alternate base rate based on each respective credit agreement.agreement and the cash interest rate as of period end. All LIBOR shown above is in U.S. dollars. As of September 30, 2019, the reference rates for the OCSI Glick JV's variable rate loans were the 30-day LIBOR at 2.04%, the 60-day LIBOR at 2.09%, the 90-day LIBOR at 2.10%, the 180-day LIBOR at 2.06% and the PRIME at 5.00%. Most loans include an interest floor, which generally ranges from 0% to 1%.
(4) This investment is held by both the Company and the OCSI Glick JV as of September 30, 2019.
(5) Investment had undrawn commitments. Unamortized fees are classified as unearned income which reduces cost basis, which may result in a negative cost basis. A negative fair value may result from the unfunded commitment being valued below par.
The cost and fair value of the Company's aggregate investment in FSFRthe OCSI Glick JV was $71.3$72.2 million and $57.6$49.4 million, respectively, as of September 30, 20172020 and $71.1$73.2 million and $63.3$54.3 million, respectively, as of September 30, 2016. The2019. As of September 30, 2020, the Company's investment in the Subordinated Notes pay a weighted average interest rate of LIBOR plus 8.0% per annum.was on cash non-accrual status. For the years ended September 30, 20172020, 2019 and September 30, 2016,2018, the Company earned interest income of $5.8$1.4 million, $5.9 million and $5.1$6.1 million, respectively, on its investment in the Subordinated Notes.Notes, of which $0.0 million, $0.0 million and $2.2 million was PIK interest income, respectively. The Company reversed $0.6 million ofdid not earn any dividend income previously recorded in prior periods duringfor the yearyears ended September 30, 20172020, 2019 and 2018 with respect to its investment in the LLC equity interests sinceof the Company determined that such dividend payments may no longer be collectible. The Company earned dividend income of $2.7 million for the year ended September 30, 2016 with respect to its LLC equity interests.OCSI Glick JV. The LLC equity interests of the OCSI Glick JV are dividendincome producing to the extent there is residual cash to be distributed on a quarterly basis.
114
OAKTREE STRATEGIC INCOME CORPORATION
NOTES TO CONSOLIDATED FINANCIAL STATEMENTS
During the year ended September 30, 2020, the Company and GF Debt Funding amended the Subordinated Notes to (1) decrease the interest rate to 1-month LIBOR plus 4.5% per annum, (2) extend the maturity date from October 20, 2021 to October 20, 2028 and (3) provide that the Subordinated Notes will not pay interest on its previously scheduled April 15, 2020, July 15, 2020, October 15, 2020 or January 15, 2021 coupon dates. As of September 30, 2019, the Subordinated Notes bore an interest rate of 1-month LIBOR plus 6.5% per annum.
Below is certain summarized financial information for FSFRthe OCSI Glick JV as of September 30, 20172020 and September 30, 20162019 and for the years ended September 30, 20172020, 2019 and September 30, 2016:2018:
| September 30, 2020 | September 30, 2019 | |||||||||||||
| Selected Balance Sheet Information: | ||||||||||||||
| Investments at fair value (cost September 30, 2020: $140,599,644; cost September 30, 2019: $176,687,612) | $ | 130,760,749 | $ | 173,028,098 | ||||||||||
| Cash and cash equivalents | 3,574,960 | 1,096,498 | ||||||||||||
| Restricted cash | 1,106,829 | 2,616,125 | ||||||||||||
| Other assets | 2,475,078 | 2,937,681 | ||||||||||||
| Total assets | $ | 137,917,616 | $ | 179,678,402 | ||||||||||
| Senior credit facility payable | $ | 80,681,939 | $ | 91,881,939 | ||||||||||
| Subordinated notes payable at fair value (proceeds September 30, 2020: $74,337,772; proceeds September 30, 2019: $75,517,614) | 56,469,250 | 62,087,348 | ||||||||||||
| Other liabilities | 766,427 | 25,709,115 | ||||||||||||
| Total liabilities | $ | 137,917,616 | $ | 179,678,402 | ||||||||||
| Members' equity | — | — | ||||||||||||
| Total liabilities and members' equity | $ | 137,917,616 | $ | 179,678,402 | ||||||||||
| September 30, 2017 | September 30, 2016 | |||||||
| Selected Balance Sheet Information: | ||||||||
| Investments in loans at fair value (cost September 30, 2017: $116,978,493; cost September 30, 2016: $194,624,798) | $ | 108,737,459 | $ | 188,708,220 | ||||
| Receivable from secured financing arrangement at fair value (September 30, 2016 cost: $5,000,000) | — | 4,985,425 | ||||||
| Cash and cash equivalents | 13,891,899 | 980,605 | ||||||
| Restricted cash | 2,249,575 | 3,343,303 | ||||||
| Receivable from unsettled transactions | — | 952,591 | ||||||
| Due from portfolio companies | 7,653 | — | ||||||
| Other assets | 1,791,077 | 2,162,942 | ||||||
| Total assets | $ | 126,677,663 | $ | 201,133,086 | ||||
| Senior credit facility payable | $ | 56,881,939 | $ | 124,615,636 | ||||
| Subordinated notes payable at fair value (proceeds September 30, 2017: $73,404,435; cost September 30, 2016: $73,149,434) | 65,836,199 | 65,012,167 | ||||||
| Other liabilities | 3,959,525 | 4,196,688 | ||||||
| Total liabilities | $ | 126,677,663 | $ | 193,824,491 | ||||
| Members' equity | — | 7,308,595 | ||||||
| Total liabilities and members' equity | $ | 126,677,663 | $ | 201,133,086 | ||||
| Year ended September 30, 2020 | Year ended September 30, 2019 | Year ended September 30, 2018 | ||||||||||||||||||
| Selected Statements of Operations Information: | ||||||||||||||||||||
| Interest income | $ | 9,994,321 | $ | 12,446,772 | $ | 9,823,972 | ||||||||||||||
| Fee income | 301,288 | 29,999 | 77,999 | |||||||||||||||||
| Total investment income | 10,295,609 | 12,476,771 | 9,901,971 | |||||||||||||||||
| Interest expense | 5,585,942 | 11,597,998 | 11,433,877 | |||||||||||||||||
| Other expenses | 159,836 | 176,358 | 211,874 | |||||||||||||||||
| Total expenses (1) | 5,745,778 | 11,774,356 | 11,645,751 | |||||||||||||||||
| Net unrealized appreciation (depreciation) | (382,788) | (183,384) | 10,626,928 | |||||||||||||||||
| Realized gain (loss) | (4,167,043) | (519,031) | (8,883,148) | |||||||||||||||||
| Net income (loss) | $ | — | $ | — | $ | — | ||||||||||||||
| Year ended September 30, 2017 | Year ended September 30, 2016 | |||||||
| Selected Statements of Operations Information: | ||||||||
| Interest income | $ | 11,148,203 | $ | 14,109,946 | ||||
| PIK interest income | 53,620 | 33,170 | ||||||
| Fee income | 160,984 | 95,756 | ||||||
| Total investment income | 11,362,807 | 14,238,872 | ||||||
| Interest expense | 11,055,880 | 10,780,919 | ||||||
| Other expenses | 224,559 | 283,267 | ||||||
| Total expenses (1) | 11,280,439 | 11,064,186 | ||||||
| Net unrealized appreciation (depreciation) | (2,893,408 | ) | 3,832,274 | |||||
| Realized loss on investments | (3,873,454 | ) | (3,119,735 | ) | ||||
| Net income (loss) | $ | (6,684,494 | ) | $ | 3,887,225 | |||
(1) There are no management fees or incentive fees charged at FSFRthe OCSI Glick JV.
During the yearyears ended September 30, 2017,2020, 2019 and 2018, the Company did not sell any senior secured debt investments to FSFRthe OCSI Glick JV. During the year ended September 30, 2016, the Company sold $48.9 million of senior secured debt investments at fair value to FSFR Glick JV in exchange for $47.6 million cash consideration, $1.2 million of subordinated notes in FSFR Glick JV and $0.1 million of LLC equity interests in FSFR Glick JV. The Company realized aloss of $0.5 million on these transactions.
Note 4. Fee Income
For the years ended September 30, 20172020, 2019 and September 30, 2016 under at least one of the significance conditions of Rule 4-08(g) of SEC Regulation S-X. The related summary financial information is presented in the "FSFR Glick JV LLC" heading above.
115
OAKTREE STRATEGIC INCOME CORPORATION
NOTES TO CONSOLIDATED FINANCIAL STATEMENTS
Note 5. Share Data and DistributionsNet Assets
Earnings per Share
The following table sets forth the computation of basic and diluted earnings per share, pursuant to FASB ASC Topic 260-10, Earnings per Share, for the years ended September 30, 2017, 20162020, 2019 and 2015:2018:
| Year ended September 30, 2020 | Year ended September 30, 2019 | Year ended September 30, 2018 | ||||||||||||||||||
| Earnings (loss) per common share — basic and diluted: | ||||||||||||||||||||
| Net increase (decrease) in net assets resulting from operations | $ | (1,267,203) | $ | 6,973,982 | $ | 20,673,049 | ||||||||||||||
| Weighted average common shares outstanding | 29,466,768 | 29,466,768 | 29,466,768 | |||||||||||||||||
| Earnings (loss) per common share — basic and diluted | $ | (0.04) | $ | 0.24 | $ | 0.70 | ||||||||||||||
116
OAKTREE STRATEGIC INCOME CORPORATION
NOTES TO CONSOLIDATED FINANCIAL STATEMENTS
| Year ended September 30, 2017 | Year ended September 30, 2016 | Year ended September 30, 2015 | |||||||||||
| Earnings (loss) per common share — basic and diluted: | |||||||||||||
| Net increase (decrease) in net assets resulting from operations | $ | (8,766,879 | ) | $ | (4,457,617 | ) | $ | 15,912,082 | |||||
| Weighted average common shares outstanding | 29,466,768 | 29,466,768 | 29,466,768 | ||||||||||
| Earnings (loss) per common share — basic and diluted | $ | (0.30 | ) | $ | (0.15 | ) | $ | 0.54 | |||||
The following table presents the changes in net assets for the years ended September 30, 2020, 2019 and 2018:
| Common Stock | ||||||||||||||||||||||||||||||||
| Shares | Par Value | Additional Paid-in-Capital | Accumulated Overdistributed Earnings | Total Net Assets | ||||||||||||||||||||||||||||
| Balance at September 30, 2017 | 29,466,768 | $ | 294,668 | $ | 373,995,934 | $ | (80,654,168) | $ | 293,636,434 | |||||||||||||||||||||||
| Net investment income | — | — | — | 19,771,332 | 19,771,332 | |||||||||||||||||||||||||||
| Net unrealized appreciation (depreciation) | — | — | — | 28,615,535 | 28,615,535 | |||||||||||||||||||||||||||
| Net realized gains (losses) | — | — | — | (27,713,818) | (27,713,818) | |||||||||||||||||||||||||||
| Distributions to stockholders | — | — | — | (16,452,988) | (16,452,988) | |||||||||||||||||||||||||||
| Tax return of capital | — | — | (2,111,075) | — | (2,111,075) | |||||||||||||||||||||||||||
| Reclassification of additional paid-in capital | — | — | (1,133,470) | 1,133,470 | — | |||||||||||||||||||||||||||
| Issuance of common stock under dividend reinvestment plan | 33,462 | 335 | 281,402 | — | 281,737 | |||||||||||||||||||||||||||
| Repurchases of common stock under dividend reinvestment plan | (33,462) | (335) | (281,402) | — | (281,737) | |||||||||||||||||||||||||||
| Balance at September 30, 2018 | 29,466,768 | $ | 294,668 | $ | 370,751,389 | $ | (75,300,637) | $ | 295,745,420 | |||||||||||||||||||||||
| Net investment income | — | $ | — | $ | — | $ | 21,140,251 | $ | 21,140,251 | |||||||||||||||||||||||
| Net unrealized appreciation (depreciation) | — | — | — | (13,705,282) | (13,705,282) | |||||||||||||||||||||||||||
| Net realized gains (losses) | — | — | — | (460,987) | (460,987) | |||||||||||||||||||||||||||
| Distributions to stockholders | — | — | — | (18,269,396) | (18,269,396) | |||||||||||||||||||||||||||
| Reclassification of additional paid-in capital | — | — | (1,552,057) | 1,552,057 | — | |||||||||||||||||||||||||||
| Issuance of common stock under dividend reinvestment plan | 26,350 | 263 | 214,804 | — | 215,067 | |||||||||||||||||||||||||||
| Repurchases of common stock under dividend reinvestment plan | (26,350) | (263) | (214,804) | — | (215,067) | |||||||||||||||||||||||||||
| Balance at September 30, 2019 | 29,466,768 | $ | 294,668 | $ | 369,199,332 | $ | (85,043,994) | $ | 284,450,006 | |||||||||||||||||||||||
| Net investment income | — | $ | — | $ | — | $ | 16,203,500 | $ | 16,203,500 | |||||||||||||||||||||||
| Net unrealized appreciation (depreciation) | — | — | — | (7,158,267) | (7,158,267) | |||||||||||||||||||||||||||
| Net realized gains (losses) | — | — | — | (10,312,436) | (10,312,436) | |||||||||||||||||||||||||||
| Distributions to stockholders | — | — | — | (16,501,392) | (16,501,392) | |||||||||||||||||||||||||||
| Issuance of common stock under dividend reinvestment plan | 46,112 | 461 | 291,387 | — | 291,848 | |||||||||||||||||||||||||||
| Repurchases of common stock under dividend reinvestment plan | (46,112) | (461) | (291,387) | — | (291,848) | |||||||||||||||||||||||||||
| Balance at September 30, 2020 | 29,466,768 | $ | 294,668 | $ | 369,199,332 | $ | (102,812,589) | $ | 266,681,411 | |||||||||||||||||||||||
Distributions
Distributions to common stockholders are recorded on the ex-dividend date. The Company is required to distribute dividends each taxable year to its stockholders of an amount generally at least equal to 90% of its investment company taxable income, determined without regard to any deduction for dividends paid, in order to be eligible for tax benefits allowed to a RIC under Subchapter M of the Code. The Company anticipates paying out as a distribution all or substantially all of those amounts. The amount to be paid out as a dividend is determined by the Board of Directors and is based on management’s estimate of the Company’s annual taxable income. Net realized capital gains, if any, are generallymay be distributed although the Company may decide to retain such net realized capital gainsstockholders or retained for investment.reinvestment.
The Company has adopted a dividend reinvestment plan (“DRIP”) that provides for reinvestment of any distributions the Company declares in cash on behalf of its stockholders, unless a stockholder elects to receive cash. As a result, if the Company’s Board of Directors authorizes, and the Company declares a cash distribution, then the Company’s stockholders who have not “opted out” of the Company’s DRIP will have their cash distribution automatically reinvested in additional shares of the Company’s common stock, rather than receiving the cash distribution. If the Company’s shares are trading at a premium to net asset value, the Company typically issues new shares to implement the DRIP.DRIP with such shares issued at the greater of the most recently computed net asset value per share of common stock or 95% of the current market price per share of common stock on the payment date for such distribution. If the Company’s shares are trading at a discount to net asset value, the Company typically purchases shares in the open market in connection with the Company’s obligations under the DRIP.
For income tax purposes, the Company estimates that its distributions for the 20172020 calendar year will be composed primarily of ordinary income and the actualincome. The character of such distributions will be appropriately reported to the Internal Revenue Service and stockholders for the 20172020 calendar year. To the extent that the Company’s taxable earnings for a fiscal and taxable year fall below the amount of distributions paid for the fiscal and taxable year, a portion of the total amount of the Company’s distributions for the fiscal and taxable year may beis deemed
117
OAKTREE STRATEGIC INCOME CORPORATION
NOTES TO CONSOLIDATED FINANCIAL STATEMENTS
a return of capital for tax purposes to the Company’s stockholders.
For the year ended September 30, 2020, no portion of the distributions were deemed a return of capital for tax purposes.
The following table reflects the distributions per share that the Company has paid, including shares issued under the DRIP, on its common stock during the years ended September 30, 2017, 20162020, 2019 and 2015:2018:
| Date Declared | Record Date | Payment Date | Amount per Share | Cash Distribution | DRIP Shares Issued (1) | DRIP Shares Value | ||||||||||||||||||||||||||||||||
| November 12, 2019 | December 13, 2019 | December 31, 2019 | $ | 0.155 | $ | 4,503,016 | 7,793 | $ | 64,334 | |||||||||||||||||||||||||||||
| January 31, 2020 | March 13, 2020 | March 31, 2020 | 0.155 | 4,489,700 | 14,852 | 77,648 | ||||||||||||||||||||||||||||||||
| April 30, 2020 | June 15, 2020 | June 30, 2020 | 0.125 | 3,589,622 | 14,977 | 93,725 | ||||||||||||||||||||||||||||||||
| July 31, 2020 | September 15, 2020 | September 30, 2020 | 0.125 | 3,627,206 | 8,490 | 56,141 | ||||||||||||||||||||||||||||||||
| Total for the year ended September 30, 2020 | $ | 0.56 | $ | 16,209,544 | 46,112 | $ | 291,848 | |||||||||||||||||||||||||||||||
| Frequency | Date Declared | Record Date | Payment Date | Amount per Share | Cash Distribution | DRIP Shares Issued (1) | DRIP Shares Value | |||||||||||||
| Monthly | August 4, 2016 | October 14, 2016 | October 31, 2016 | $ | 0.075 | $ | 2,183,023 | 3,146 | $ | 26,985 | ||||||||||
| Monthly | August 4, 2016 | November 15, 2016 | November 30, 2016 | 0.075 | 2,183,100 | 2,986 | 26,908 | |||||||||||||
| Monthly | October 19, 2016 | December 15, 2016 | December 30, 2016 | 0.075 | 2,179,421 | 3,438 | 30,586 | |||||||||||||
| Monthly | October 19, 2016 | January 31, 2017 | January 31, 2017 | 0.075 | 2,180,645 | 2,905 | 29,363 | |||||||||||||
| Monthly | October 19, 2016 | February 15, 2017 | February 28, 2017 | 0.075 | 2,183,581 | 2,969 | 26,427 | |||||||||||||
| Monthly | February 6, 2017 | March 15, 2017 | March 31, 2017 | 0.04 | 1,165,417 | 1,508 | 13,253 | |||||||||||||
| Quarterly | February 6, 2017 | June 15, 2017 | June 30, 2017 | 0.19 | 5,543,465 | 6,840 | 55,221 | |||||||||||||
| Quarterly | August 7, 2017 | September 15, 2017 | September 29, 2017 | 0.19 | 5,536,798 | 6,991 | 61,888 | |||||||||||||
| Total for the year ended September 30, 2017 | $ | 0.80 | $ | 23,155,451 | 30,783 | $ | 270,630 | |||||||||||||
| Date Declared | Record Date | Payment Date | Amount per Share | Cash Distribution | DRIP Shares Issued (1) | DRIP Shares Value | ||||||||||||||||||||||||||||||||
| November 19, 2018 | December 17, 2018 | December 28, 2018 | $ | 0.155 | $ | 4,513,238 | 6,888 | $ | 54,111 | |||||||||||||||||||||||||||||
| February 1, 2019 | March 15, 2019 | March 29, 2019 | 0.155 | 4,516,806 | 6,187 | 50,543 | ||||||||||||||||||||||||||||||||
| May 3, 2019 | June 14, 2019 | June 28, 2019 | 0.155 | 4,514,262 | 6,314 | 53,088 | ||||||||||||||||||||||||||||||||
| August 2, 2019 | September 13, 2019 | September 30, 2019 | 0.155 | 4,510,023 | 6,961 | 57,325 | ||||||||||||||||||||||||||||||||
| Total for the year ended September 30, 2019 | $ | 0.62 | $ | 18,054,329 | 26,350 | $ | 215,067 | |||||||||||||||||||||||||||||||
| Frequency | Date Declared | Record Date | Payment Date | Amount per Share | Cash Distribution | DRIP Shares Issued (1) | DRIP Shares Value (2) | |||||||||||||
| Monthly | July 10, 2015 | October 6, 2015 | October 15, 2015 | $ | 0.075 | $ | 2,101,445 | 12,080 | $ | 108,563 | ||||||||||
| Monthly | July 10, 2015 | November 5, 2015 | November 16, 2015 | 0.075 | 2,093,278 | 13,269 | 116,730 | |||||||||||||
| Monthly | November 30, 2015 | December 11, 2015 | December 22, 2015 | 0.075 | 2,115,444 | 11,103 | 94,563 | |||||||||||||
| Monthly | November 30, 2015 | January 4, 2016 | January 15, 2016 | 0.075 | 2,148,928 | 8,627 | 61,079 | |||||||||||||
| Monthly | November 30, 2015 | February 5, 2016 | February 16, 2016 | 0.075 | 2,177,085 | 4,542 | 32,923 | |||||||||||||
| Monthly | February 8, 2016 | March 15, 2016 | March 31, 2016 | 0.075 | 2,175,431 | 4,383 | 34,577 | |||||||||||||
| Monthly | February 8, 2016 | April 15, 2016 | April 29, 2016 | 0.075 | 2,174,974 | 4,452 | 35,033 | |||||||||||||
| Monthly | February 8, 2016 | May 13, 2016 | May 31, 2016 | 0.075 | 2,176,513 | 4,256 | 33,494 | |||||||||||||
| Monthly | May 6, 2016 | June 15, 2016 | June 30, 2016 | 0.075 | 2,163,126 | 5,822 | 46,881 | |||||||||||||
| Monthly | May 6, 2016 | July 15, 2016 | July 29, 2016 | 0.075 | 2,179,263 | 3,627 | 30,745 | |||||||||||||
| Monthly | May 6, 2016 | August 15, 2016 | August 31, 2016 | 0.075 | 2,181,006 | 3,260 | 29,002 | |||||||||||||
| Monthly | August 4, 2016 | September 15, 2016 | September 30, 2016 | 0.075 | 2,183,197 | 3,078 | 26,811 | |||||||||||||
| Total for the year ended September 30, 2016 | $ | 0.90 | $ | 25,869,690 | 78,499 | $ | 650,402 | |||||||||||||
| Frequency | Date Declared | Record Date | Payment Date | Amount per Share | Cash Distribution | DRIP Shares Issued (1) | DRIP Shares Value | |||||||||||||
| Quarterly | May 12, 2014 | September 15, 2014 | October 15, 2014 | 0.30 | 8,648,937 | 17,127 | 191,093 | |||||||||||||
| Quarterly | September 9, 2014 | December 15, 2014 | January 15, 2015 | 0.30 | 8,597,352 | 23,183 | 242,678 | |||||||||||||
| Quarterly | November 20, 2014 | April 2, 2015 | April 15, 2015 | 0.30 | 8,532,236 | 28,296 | 307,794 | |||||||||||||
| Monthly | February 4, 2015 | May 1, 2015 | May 15, 2015 | 0.10 | 2,895,847 | 5,045 | 50,830 | |||||||||||||
| Monthly | February 4, 2015 | June 1, 2015 | June 15, 2015 | 0.10 | 2,893,440 | 5,296 | 53,237 | |||||||||||||
| Monthly | February 4, 2015 | July 1, 2015 | July 15, 2015 | 0.10 | 2,809,213 | 14,572 | 137,464 | |||||||||||||
| Monthly | February 4, 2015 | August 3, 2015 | August 17, 2015 | 0.10 | 2,890,289 | 6,174 | 56,388 | |||||||||||||
| Monthly | July 10, 2015 | September 4, 2015 | September 15, 2015 | 0.07 | 2,168,886 | 4,575 | 41,121 | |||||||||||||
| Total for the year ended September 30, 2015 | $ | 1.37 | $ | 39,436,200 | 104,268 | $ | 1,080,605 | |||||||||||||
| Date Declared | Record Date | Payment Date | Amount per Share | Cash Distribution | DRIP Shares Issued (1) | DRIP Shares Value | ||||||||||||||||||||||||||||||||
| August 7, 2017 | December 15, 2017 | December 29, 2017 | $ | 0.190 | $ | 5,439,519 | 18,809 | $ | 159,167 | |||||||||||||||||||||||||||||
| February 5, 2018 | March 15, 2018 | March 30, 2018 | 0.140 | 4,091,583 | 4,204 | 33,764 | ||||||||||||||||||||||||||||||||
| May 3, 2018 | June 15, 2018 | June 29, 2018 | 0.145 | 4,232,547 | 4,829 | 40,134 | ||||||||||||||||||||||||||||||||
| August 1, 2018 | September 15, 2018 | September 28, 2018 | 0.155 | 4,518,677 | 5,620 | 48,672 | ||||||||||||||||||||||||||||||||
| Total for the year ended September 30, 2018 | $ | 0.63 | $ | 18,282,326 | 33,462 | $ | 281,737 | |||||||||||||||||||||||||||||||
__________
(1) Shares were purchased on the open market and distributed.
Common Stock Offering
There were no common stock offerings during the years ended September 30, 2017, September 30, 20162020, 2019 and September 30, 2015.2018.
Note 6. Borrowings
Citibank Facility
On January 15, 2015, OCSI Senior Funding II LLC (formerly FS Senior Funding II LLC,LLC), the Company's wholly-owned, special purpose financing subsidiary, entered into a $175 million revolving credit facility (as amended, the "Citibank facility"Facility") with the lenders referred to therein, Citibank, N.A., as administrative agent, and Wells Fargo Bank, N.A., as collateral agent and custodian.
As of September 30, 2020, borrowings under the Citibank facility as set forth in the Citibank Amendment.
118
OAKTREE STRATEGIC INCOME CORPORATION
NOTES TO CONSOLIDATED FINANCIAL STATEMENTS
As of September 30, 20172020 and September 30, 2016,2019, the Company had $76.5$119.1 million and $107.4$126.1 million outstanding under the Citibank facility,Facility, respectively. Borrowings under the Citibank facilityFacility are secured by all of the assets of FSOCSI Senior Funding II LLC and all of the Company's equity interests in FSOCSI Senior Funding II LLC. The Company may use the Citibank facilityFacility to fund a portion of its loan origination activities and for general corporate purposes. Each loan origination under the Citibank facilityFacility is subject to the satisfaction of certain conditions. The Company's borrowings under the Citibank facilityFacility bore interest at a weighted average interest rate of 3.559%3.052%, 2.838%4.463% and 2.516%4.264% for the years ended September 30, 2017, September 30, 20162020, 2019 and September 30, 2015,2018, respectively. For the years ended September 30, 2017, September 30, 20162020, 2019 and September 30, 2015,2018, the Company recorded interest expense (inclusive of $4.2fees) of $4.6 million, $4.1$6.4 million and $2.6$4.2 million, respectively, related to the Citibank facility.Facility.
Deutsche Bank Facility
On September 24, 2018, OCSI Senior Funding Ltd., a wholly-owned subsidiary of the Company, entered into a loan financing and servicing agreement (as amended, the “Deutsche Bank Facility”) with the Company as equityholder and as servicer, the lenders from time to time parties thereto, Deutsche Bank AG, New York Branch, as facility agent, the other agents parties thereto and Wells Fargo Bank, National Association, as collateral agent and as collateral custodian.
As of September 30, 2020, (a) OCSI Senior Funding Ltd. may request drawdowns under the Deutsche Bank Facility until September 30, 2021 (the "revolving period") unless there is an earlier termination or event of default, (b) the maturity date of the Deutsche Bank Facility is the earliest of March 30, 2022, the occurrence of an event of default or completion of a securitization transaction, (c) the size of the Deutsche Bank Facility is $160 million (subject to borrowing base and other limitations) and (d) the interest rate is three-month LIBOR plus 2.65% through September 30, 2021, following which the interest rate will reset to three-month LIBOR plus 2.80% for the remaining term of the Deutsche Bank Facility, in each case with a 0.25% LIBOR floor. There is a non-usage fee of 0.50% per annum payable on the undrawn amount under the Deutsche Bank Facility, and, as of September 30, 2020, a minimum utilization fee should the drawn amount under the Deutsche Bank Facility fall below 80%.
As of September 30, 2020, the Deutsche Bank Facility includes a waiver period (which extends through January 3, 2021) during which the facility agent is restricted from revaluing certain collateral obligations where the change in valuation is caused by or results from a business disruption due primarily to the COVID-19 pandemic (subject to the Company's ability to earlier terminate such period in certain circumstances).
The Deutsche Bank Facility is secured by all of the assets held by OCSI Senior Funding Ltd. OCSI Senior Funding Ltd. has made customary representations and warranties and is required to comply with various affirmative and negative covenants, reporting requirements and other customary requirements for similar credit facilities. The borrowings of the Company, including indirectly under the Deutsche Bank Facility, are subject to the leverage restrictions contained in the Investment Company Act.
As of September 30, 2020 and September 30, 2019, the Company had $137.6 million and $157.6 million outstanding under the Deutsche Bank Facility, respectively. For the years ended September 30, 2020, and 2019 and the period from September 24, 2018 through September 30, 2018, the Company’s borrowings under the Deutsche Bank Facility bore interest at a weighted average interest rate of 3.634%, 4.524% and 4.266%, respectively, and the Company recorded interest expense (inclusive of fees) of $7.1 million, $7.5 million and $0.1 million, respectively.
East West Bank Facility
On January 6, 2016, the Company entered into a five-year $25 million senior secured revolving credit facility (subject to borrowing base and other limitations) with the lenders referenced therein, U.S. Bank National Association, as Custodian, and East West Bank as Secured Lender (the(as amended, the "East West Bank facility"Facility"). TheAs of September 30, 2020, the commitments under the East West Bank facility bearsFacility were terminated. Prior to its termination on September 30, 2020, the East West Bank Facility bore an interest rate of either (i) LIBOR plus 3.75%2.85% per annum for borrowings in year one, 3.50% per annum for borrowings in year two, 3.25% per annum for borrowings in years three and four and 3.00% per annum for borrowings in year five, or (ii) East West Bank’s prime rate, plus 0.75% per annum for borrowings in year one, 0.50% per annum for borrowingseach case with a 3.5% floor. Prior to its termination on September 30, 2020, the minimum asset coverage ratio applicable to the Company under the East West Bank Facility was 150% as determined in year two, 0.25% per annum for borrowings in years three and four, and 0.00% per annum for borrowings in year five.accordance with the requirements of the Investment Company Act. The East West Bank facility maturesFacility would have otherwise matured on January 6, 2021. The East West Bank facility requiresFacility required the Company to comply with certain affirmative and negative covenants and other customary requirements for similar credit facilities.
As of September 30, 2017, the Company had $6.5 million outstanding under the East West Bank facility. As of September 30, 2016, the Company had2020, there were no borrowings outstanding under the East West Bank facility.Facility. As of September 30, 2019, the Company had $11.0 million outstanding under the East West Bank Facility. Borrowings under the East West Bank facility areFacility were secured by the loans pledged as collateral thereunder from time to time as well as certain other assets of the Company. The Company may useused the East West Bank facilityFacility to fund a portion of its loan origination activities and for general corporate purposes. The Company’s borrowings under the East West Bank facilityFacility bore interest at a weighted average interest rate of 4.633%4.059%, 5.407% and 4.949% for the yearyears ended September 30, 2017. The Company’s borrowings under2020, 2019 and 2018, respectively. For the years ended September 30, 2020, 2019 and 2018, the Company recorded interest expense (inclusive of fees) of $0.7 million, $0.6 million and $0.6 million, respectively, related to the East West Bank facility bore interest at a weighted average interest rate ofFacility.
119
OAKTREE STRATEGIC INCOME CORPORATION
NOTES TO CONSOLIDATED FINANCIAL STATEMENTS
2015 Debt Securitization
On May 28, 2015, the Company completed its $309.0 million debt securitization ("2015 Debt Securitization") consisting of $222.6 million in senior secured notes ("2015 Notes") and $86.4 million of unsecured subordinated notes ("Subordinated 2015 Notes"). The notes offered in the 2015 Debt Securitization were issued by the 2015 Issuer,FS Senior Funding Ltd., a wholly-owned subsidiary of the Company, through a private placement. The 2015 Notes arewere secured by the assets held by the 2015 Issuer.FS Senior Funding Ltd. The 2015 Debt Securitization consistsconsisted of $126.0 million Class A-T Senior Secured 2015 Notes, which bearbore interest at three-month LIBOR plus 1.80% per annum; $29.0 million Class A-S Senior Secured 2015 Notes, which bore interest at a rate of three-month LIBOR plus 1.55% per annum, until a step-up in spread to 2.10% occurred in October 2016; $20.0 million Class A-R Senior Secured Revolving 2015 Notes, which bearbore interest at a rate of Commercial Paper ("CP") plus 1.80% per annum (collectively, the "Class A Notes") and $25.0 million Class B Senior Secured 2015 Notes, which bearbore interest at a rate of three-month LIBOR plus 2.65% per annum (the "Class B Notes").
In partial consideration forconnection with entry into the loans transferred to theDeutsche Bank Facility, on September 24, 2018, FS Senior Funding Ltd. and FS Senior Funding CLO LLC redeemed all outstanding 2015 Issuer as part ofNotes issued in the 2015 Debt Securitization pursuant to the Company currently retains the entire $22.6 millionterms of the Class C Senior Securedindenture governing the 2015 Notes (which the Company purchased at 98.0% of par value) (the "Class C Notes") and the entire $86.4 million of the Subordinated 2015 Notes. The Class A Notes and Class B Notes are included in the Company's September 30, 2017 Consolidated Statements of Assets and Liabilities as notes payable. As of September 30, 2017, the Class C Notes and the Subordinatedrevocable notice issued by the Company on August 14, 2018. Following such redemption, the agreements governing the 2015 Debt Securitization were terminated and FS Senior Funding Ltd. was merged with and into OCSI Senior Funding Ltd. with OCSI Senior Funding Ltd. continuing as the surviving entity. The 2015 Notes were eliminated in consolidation.would have otherwise matured on May 28, 2025.
to a fee for its services as collateral manager. The Company has retained a sub-collateral manager, which as ofwas Oaktree from October 17, 2017 was the Investment Adviser and, prior to October 17, 2017, was FSM,September 24, 2018, to provide collateral management sub-advisory services to the Company pursuant to a sub-collateral management agreement. The sub-collateral manager iswas entitled to receive 100% of the collateral management fees paid to the Company under the collateral management agreement, but each of the Investment Adviser and FSMOaktree irrevocably waived and, in the case of the Investment Adviser, intends to continue to irrevocably waive its right to such sub-collateral management fees in respect of the 2015 Debt Securitization.
The collateral management agreement doesdid not include any incentive fee payable to the Company as collateral manager or payable to the sub-collateral manager as sub-advisor under the sub-collateral management agreement.
For the yearsyear ended September 30, 2017 and September 30, 2016,2018, the components of interest expense, cash paid for interest, average interest rates and average outstanding balances for the 2015 Debt Securitization were as follows:
| Year ended September 30, 2017 | Year ended September 30, 2016 | Year ended September 30, 2015 | |||||||||||
| Interest expense | $ | 5,741,534 | $ | 4,668,947 | $ | 1,476,995 | |||||||
| Loan administration fees | 69,514 | 79,882 | — | ||||||||||
| Amortization of debt issuance costs | 290,104 | 290,104 | 120,877 | ||||||||||
| Total interest and other debt financing expenses | $ | 6,101,152 | $ | 5,038,933 | $ | 1,597,872 | |||||||
| Cash paid for interest expense | $ | 5,449,738 | $ | 5,136,063 | $ | — | |||||||
| Annualized average interest rate | 3.425 | % | 2.466 | % | 2.390 | % | |||||||
| Average outstanding balance | $ | 180,462,192 | $ | 181,782,413 | $ | 61,900,170 | |||||||
| Year ended September 30, 2018 | ||||||||
| Interest expense | $ | 7,123,152 | ||||||
| Loan administration fees | 93,209 | |||||||
| Amortization of debt issuance costs | 2,224,132 | |||||||
| Total interest and other debt financing expenses | $ | 9,440,493 | ||||||
| Cash paid for interest expense | $ | 8,469,735 | ||||||
| Annualized average interest rate | 4.170 | % | ||||||
| Average outstanding balance | $ | 176,875,000 | ||||||
Secured Borrowings
As of September 30, 2020, the Company had $10.9 million of secured borrowings outstanding, which were recorded as a result of certain securities that were sold and simultaneously repurchased at a premium, with amounts payable to the counterparty due on the repurchase settlement date, which is generally within 60 days of the trade date. There were no secured borrowings outstanding as of September 30, 2019. The Company recorded less than $0.1 million of interest expense in connection with secured borrowings for the year ended September 30, 2020. The Company's secured borrowings bore interest at a weighted average rate of 3.27% for the year ended September 30, 2020.
120
OAKTREE STRATEGIC INCOME CORPORATION
NOTES TO CONSOLIDATED FINANCIAL STATEMENTS
| Year ended September 30, 2017 | ||||||||||||
| Stated Interest Rate | LIBOR Spread (basis points) | Cash Paid for Interest | Interest Expense | |||||||||
| Class A-T Notes | 3.1035% | 180 | $ | 3,487,268 | $ | 3,664,619 | ||||||
| Class A-S Notes | 3.4035% | 210 | (1) | 850,073 | 926,401 | |||||||
| Class A-R Notes | 2.9551% | 180 | (2) | 205,027 | 207,900 | |||||||
| Class B Notes | 3.9535% | 265 | 907,370 | 942,614 | ||||||||
| Class C Notes | 4.5535% | 325 | (3) | — | — | |||||||
| Total | $ | 5,449,738 | $ | 5,741,534 | ||||||||
| Description | Class A-T Notes | Class A-S Notes | Class A-R Notes | Class B Notes | Class C Notes | Subordinated Notes | ||||||
| Type | Senior Secured Floating Rate Term Debt | Senior Secured Floating Rate Term Debt | Senior Secured Floating Rate Revolver | Senior Secured Floating Rate Term Debt | Senior Secured Floating Rate Term Debt | Subordinated Term Notes | ||||||
| Amount Outstanding | $126,000,000 | $29,000,000 | $— | $25,000,000 | $22,575,680 | $86,400,000 | ||||||
| Moody's Rating | "Aaa" | "Aaa" | "Aaa" | "Aa2" | "Aa2" | NR | ||||||
| S&P Rating | "AAA" | "AAA" | "AAA" | NR | NR | NR | ||||||
| Interest Rate | LIBOR + 1.80% | LIBOR + 2.10%* | CP + 1.80% ** | LIBOR + 2.65% | LIBOR + 3.25% | NA | ||||||
| Stated Maturity | May 28, 2025 | May 28, 2025 | May 28, 2025 | May 28, 2025 | May 28, 2025 | May 28, 2025 | ||||||
Principal Payments
Scheduled principal payments for debt obligations atas of September 30, 20172020 are as follows:
| Payments due during fiscal years ended September 30, | ||||||||||||||||||||||||||||||||
| Total | 2021 | 2022 | 2023 | |||||||||||||||||||||||||||||
| Citibank Facility | $ | 119,056,800 | $ | — | $ | — | $ | 119,056,800 | ||||||||||||||||||||||||
| Deutsche Bank Facility | 137,600,000 | — | 137,600,000 | — | ||||||||||||||||||||||||||||
| Secured Borrowings | 10,929,578 | 10,929,578 | — | — | ||||||||||||||||||||||||||||
| Total | $ | 267,586,378 | $ | 10,929,578 | $ | 137,600,000 | $ | 119,056,800 | ||||||||||||||||||||||||
| Payments due during fiscal years ended September 30, | ||||||||||||||||||||||||
| Total | 2018 | 2019 | 2020 | 2021 | 2022 and Thereafter | |||||||||||||||||||
| Citibank facility | $ | 76,456,800 | $ | — | $ | — | $ | 76,456,800 | $ | — | $ | — | ||||||||||||
| Notes Payable | 180,000,000 | — | — | — | — | 180,000,000 | ||||||||||||||||||
| East West Bank facility | 6,500,000 | — | — | — | 6,500,000 | — | ||||||||||||||||||
| Total | $ | 262,956,800 | $ | — | $ | — | $ | 76,456,800 | $ | 6,500,000 | $ | 180,000,000 | ||||||||||||
Note 7. Interest and Dividend Income
| Year ended September 30, 2017 | Year ended September 30, 2016 | |||||||
| PIK balance at beginning of period | $ | 88,839 | $ | — | ||||
| Gross PIK interest accrued | 759,744 | 167,065 | ||||||
| PIK income reserves (1) | (351,323 | ) | — | |||||
| PIK interest received in cash | — | (78,226 | ) | |||||
| PIK balance at end of period | $ | 497,260 | $ | 88,839 | ||||
As of September 30, 2017, September 30, 2016 and September 30, 2015,2020, there were three,was one and one investments, respectively,investment on which the Company had stopped accruing cash and/or PIK interest or OID income.
The Company restructured its investment in the Subordinated Notes of the OCSI Glick JV to realign the vehicle for current market conditions. The Company and GF Debt Funding amended the Subordinated Notes to (1) decrease the interest rate to 1-month LIBOR plus 4.5% per annum, (2) extend the maturity date from October 20, 2021 to October 20, 2028 and (3) provide that the Subordinated Notes will not pay interest on its previously scheduled April 15, 2020, July 15, 2020, October 15, 2020 or January 15, 2021 coupon dates. Given that the Subordinated Notes will not pay interest for four consecutive quarters, the Company placed its investment in the Subordinated Notes of the OCSI Glick JV on cash non-accrual status and did not recognize any interest income from the OCSI Glick JV during the nine months ended September 30, 2020. The percentages of the Company's debt investments at cost and fair value by accrual status as of September 30, 2017, 2016 and 20152020 were as follows:
| September 30, 2017 | September 30, 2016 | September 30, 2015 | September 30, 2020 | |||||||||||||||||||||||||||||||||||||||||||||||||||||||||||||||||
| Cost | % of Debt Portfolio | Fair Value | % of Debt Portfolio | Cost | % of Debt Portfolio | Fair Value | % of Debt Portfolio | Cost | % of Debt Portfolio | Fair Value | % of Debt Portfolio | Cost | % of Debt Portfolio | Fair Value | % of Debt Portfolio | |||||||||||||||||||||||||||||||||||||||||||||||||||||
| Accrual | $ | 564,231,285 | 96.02 | % | $ | 553,084,120 | 98.88 | % | $ | 563,757,229 | 96.74 | % | $ | 552,114,644 | 98.72 | % | $ | 619,529,324 | 98.79 | % | $ | 613,701,960 | 99.28 | % | Accrual | $ | 464,459,378 | 87.72 | % | $ | 450,508,104 | 90.12 | % | |||||||||||||||||||||||||||||||||||
| PIK non-accrual (paying) (1) | — | — | — | — | — | — | — | — | 7,605,257 | 1.21 | 4,427,839 | 0.72 | ||||||||||||||||||||||||||||||||||||||||||||||||||||||||
| Cash non-accrual (nonpaying) (2) | 23,381,863 | 3.98 | 6,292,551 | 1.12 | 19,027,017 | 3.26 | 7,156,160 | 1.28 | — | — | — | — | ||||||||||||||||||||||||||||||||||||||||||||||||||||||||
| Cash non-accrual (1) | Cash non-accrual (1) | 65,045,551 | 12.28 | 49,409,901 | 9.88 | |||||||||||||||||||||||||||||||||||||||||||||||||||||||||||||||
| Total | $ | 587,613,148 | 100.00 | % | $ | 559,376,671 | 100.00 | % | $ | 582,784,246 | 100.00 | % | $ | 559,270,804 | 100.00 | % | $ | 627,134,581 | 100.00 | % | $ | 618,129,799 | 100.00 | % | Total | $ | 529,504,929 | 100.00 | % | $ | 499,918,005 | 100.00 | % | |||||||||||||||||||||||||||||||||||
___________________
| Cash |
As of September 30, 2017, 2016 and 2015 was as follows:
| Year ended September 30, 2017 | Year ended September 30, 2016 | Year ended September 30, 2015 | ||||||||||
| Cash interest income | $ | 1,291,399 | $ | 1,136,652 | $ | — | ||||||
| PIK interest income | 351,323 | — | — | |||||||||
| OID income | 89,553 | 57,735 | 13,816 | |||||||||
| Total | $ | 1,732,275 | $ | 1,194,387 | $ | 13,816 | ||||||
Note 8. Taxable/Distributable Income and Dividend Distributions
Taxable income differs from net increase (decrease) in net assets resulting from operations primarily due to: (1) unrealized appreciation (depreciation) on investments and secured borrowings,foreign currency, as gains and losses are not included in taxable income until they are realized; (2) exit fees received in connection with investments in portfolio companies; (3) origination fees received in connection with investments in portfolio companies; (3)(4) recognition of interest income on certain loans; and (4)(5) income or loss recognition on exited investments.
121
OAKTREE STRATEGIC INCOME CORPORATION
NOTES TO CONSOLIDATED FINANCIAL STATEMENTS
Listed below is a reconciliation of net decreaseincrease (decrease) in net assets resulting from operations to taxable income for the years ended September 30, 20172020, 2019 and 2018:
| Year ended September 30, 2020 | Year ended September 30, 2019 | Year ended September 30, 2018 | ||||||||||||||||||
| Net increase (decrease) in net assets resulting from operations | $ | (1,267,203) | $ | 6,973,982 | $ | 20,673,049 | ||||||||||||||
| Net unrealized (appreciation) depreciation | 7,158,267 | 13,705,282 | (28,615,535) | |||||||||||||||||
| Book/tax difference due to capital losses not recognized (recognized) | 11,957,395 | (1,511,618) | 23,225,073 | |||||||||||||||||
| Other book/tax differences | 259,242 | 614,614 | — | |||||||||||||||||
| Taxable/Distributable Income (1) | $ | 18,107,701 | $ | 19,782,260 | $ | 15,282,587 | ||||||||||||||
__________________
(1)The Company's taxable income for the year ended September 30, 2016:2020 is an estimate and will not be finally determined until the Company files its tax return for the fiscal year ended September 30, 2020. Therefore, the final taxable income may be different than the estimate.
| Year ended September 30, 2017 | Year ended September 30, 2016 | |||||||
| Net decrease in net assets resulting from operations | $ | (8,766,879 | ) | $ | (4,457,617 | ) | ||
| Net unrealized depreciation on investments and secured borrowings | 17,803,657 | 16,980,524 | ||||||
| Book/tax difference due to deferred loan fees | (1,438,850 | ) | (94,659 | ) | ||||
| Book/tax difference due to interest income on certain loans | 1,642,722 | 1,136,652 | ||||||
| Book/tax difference due to capital losses not recognized | 13,384,915 | 12,769,777 | ||||||
| Other book/tax differences | 557,519 | (79,467 | ) | |||||
| Taxable/Distributable Income (1) | $ | 23,183,084 | $ | 26,255,210 | ||||
As of September 30, 2017,2020, the Company had a net capital loss carryforward of $72,740,041, which can be used to offset future capital gains and is not subject to expiration. Of the net capital loss carryforward, $6,452,866 is available to offset future short-term capital gains and $66,287,175 is available to offset future long-term capital gains.
For the year ended September 30, 2019, the Company reclassified $1.6 million, respectively, of additional paid-in-capital to accumulated overdistributed earnings on the Consolidated Statement of Assets and Liabilities to reflect distributions that occurred prior to September 30, 2018, that were deemed to be a return of capital for income tax purposes. These reclassification entries did not impact total net assets.
As of September 30, 2020, the Company's last tax year end, the components of accumulated undistributed incomeoverdistributed earnings on a tax basis were as follows:
| Undistributed ordinary income, net | $ | 2,808,747 | |
| Net realized capital losses | 28,564,899 | ||
| Unrealized losses, net | (46,826,393 | ) | |
| Undistributed ordinary income, net | $ | 3,138,670 | |||
| Net realized capital losses | (72,740,041) | ||||
| Unrealized losses, net | (33,211,216) | ||||
The aggregate cost of investments for income tax purposes was $607.3 million$531,725,323 as of September 30, 2017. For the year ended2020. As of September 30, 2017,2020, the aggregate gross unrealized appreciation for all investments in which there was an excess of value over cost for income tax purposes was $4.6 million. For the year ended$41,676,913. As of September 30, 2017,2020, the aggregate gross unrealized depreciation for all investments in which there was an excess of cost for income tax purposes over value was $51.4 million.$74,888,129. Net unrealized depreciation based on the aggregate cost of investments for income tax purposes was $46.8 million.$33,211,216.
Note 9. Realized Gains or Losses and Net Unrealized Appreciation or Depreciation on Investments
Realized Gains or Losses
Realized gains or losses are measured by the difference between the net proceeds from the sale or redemption and the cost basis of the investment without regard to unrealized appreciation or depreciation previously recognized, and include investments written-off during the period, net of recoveries. Realized losses may also be recorded in connection with the Company's determination that certain investments are considered worthless securities and/or meet the conditions for loss recognition per the applicable tax rules.
122
OAKTREE STRATEGIC INCOME CORPORATION
NOTES TO CONSOLIDATED FINANCIAL STATEMENTS
During the year ended September 30, 2020, the Company recorded an aggregate net realized loss of $10.3 million, which consisted of the following:
| ($ in millions) | |||||
| Portfolio Company | Net Realized Gain (Loss) | ||||
| Woodford Express LLC | $ | (5.1) | |||
| Curvature, Inc. | (1.9) | ||||
| Zephyr Bidco Ltd | (1.7) | ||||
| Tallgrass Energy | (1.1) | ||||
| Other, net | (0.5) | ||||
| Total, net | $ | (10.3) | |||
During the year ended September 30, 2019, the Company recorded an aggregate net realized loss of $0.5 million in connection with the exit of various investments.
During the year ended September 30, 2018, the Company recorded an aggregate net realized loss of $27.7 million, which consisted of the following:
| ($ in millions) | |||||
| Portfolio Company | Net Realized Gain (Loss) | ||||
| Ameritox, Ltd. | $ | (15.9) | |||
| Metamorph US 3, LLC | (8.9) | ||||
| Other, net | (2.9) | ||||
| Total, net | $ | (27.7) | |||
Net Unrealized Appreciation or Depreciation
Net unrealized appreciation or depreciation reflects the net change in the valuation of the portfolio pursuant to the Company's valuation guidelines and the reclassification of any prior period unrealized appreciation or depreciation.
respectively. For the year ended September 30, 2017, the Company recorded net2020, this consisted of $10.8 million of unrealized depreciation of $17.8 million. This consisteddebt investments and $0.2 million of $14.1 millionof net unrealized depreciation on debt investments and $12.9foreign currency forward contracts, offset by $3.8 million of net unrealized depreciation on equityappreciation from exited investments offset by $9.2 million(a portion of net reclassificationswhich resulted in a reclassification to realized loss (resulting in unrealized appreciation)losses).
For the year ended September 30, 2016, the Company recorded net2019, this consisted of $12.4 million of unrealized depreciation of $17.0 million. This consisted of $17.5debt investments and $1.3 million of net unrealized depreciation on debtrelated to exited investments and $2.5 million(a portion of net unrealized depreciation on equity investments,which resulted in a reclassification to realized gains), offset by $3.0$0.1 millionof net reclassifications to realized loss (resulting in unrealized appreciation).
appreciation of equity investments. For the year ended September 30, 2015, the Company recorded net unrealized depreciation of $12.8 million. This2018, this consisted of $11.8$29.0 million of net unrealized depreciation on debtappreciation related to exited investments (a portion of which resulted in a reclassification to realized losses) and $1.0 million of net unrealized appreciation of equity investments, offset by $1.4 million of net unrealized depreciation on equityof debt investments.
Note 10. Concentration of Credit Risks
The Company deposits its cash with financial institutions and at times such balances may be in excess of the FDIC insurance limit. The Company limits its exposure to credit loss by depositing its cash with high credit quality financial institutions and monitoring their financial stability.
Note 11. Related Party Transactions
As of September 30, 2017,2020 and September 30, 2019, the Company washad a liability on its Consolidated Statements of Assets and Liabilities in the amount of $1.7 million and $1.4 million, respectively, reflecting the unpaid portion of the base management fees and incentive fees payable to Oaktree and OCM, as applicable.
Investment Advisory Agreement
The Company is party to an investment advisory agreement with FSM (the “Formerthe Investment Advisory Agreement”), which was the Company’s investment adviser through the closing of the Transaction.Agreement. Under the Former Investment Advisory Agreement, the Company paid FSMpays Oaktree a fee for its services under the Investment Advisory Agreement consisting of two components: a base management fee and an incentive fee. The cost of both the base management fee payable to Oaktree and any incentive fees earned by Oaktree is ultimately borne by common stockholders of the Company.
123
OAKTREE STRATEGIC INCOME CORPORATION
NOTES TO CONSOLIDATED FINANCIAL STATEMENTS
From October 17, 2017 through May 3, 2020, the Company was externally managed by OCM pursuant to an investment advisory agreement. On May 4, 2020, OCM effected the novation of such investment advisory agreement to Oaktree. Immediately following such novation, the Company and Oaktree entered into a new investment advisory agreement with the same terms, including fee structure, as the investment advisory agreement with OCM. The term “Investment Advisory Agreement” refers collectively to the agreements with Oaktree and, prior to its novation, with OCM. Prior to October 17, 2017, the Company was externally managed by Fifth Street Management LLC (the "Former Adviser”), an indirect, partially-owned subsidiary of Fifth Street Asset Management Inc., pursuant to an investment advisory agreement between the Company and the Former Adviser (the "Former Investment Advisory Agreement"), which was terminated on October 17, 2017.
Unless earlier terminated as described below, the Investment Advisory Agreement will remain in effect until September 30, 2021 and thereafter from year-to-year if approved annually by the Company's Board of Directors or by the affirmative vote of the holders of a majority of the outstanding voting securities of the Company, including, in either case, approval by a majority of the directors of the Company who are not interested persons. The Investment Advisory Agreement will automatically terminate in the event of its assignment. The Investment Advisory Agreement may be terminated by either party without penalty upon 60 days’ written notice to the other. The Investment Advisory Agreement may also be terminated, without penalty, upon the vote of a majority of the outstanding voting securities of the Company.
Base Management Fee
For the years ended September 30, 2017, 20162020, and 2015,2019 the base management fees (net of waivers, if any) werefee incurred under the Investment Advisory Agreement was $5.6 million, $6.1 million and $5.9 million, respectively.
Incentive Fee
The incentive fee consists of two parts. TheUnder the Investment Advisory Agreement, the first part ("Partof the incentive fee (the “incentive fee on income" or "Part I incentive fee") wasis calculated and payable quarterly in arrears based onupon the Company's "Pre-Incentive Fee Net Investment Income"“pre-incentive fee net investment income” of the Company for the immediately preceding fiscal quarter. The payment of the incentive fee on income is subject to payment of a preferred return to investors each quarter (i.e., a “hurdle rate”), expressed as a rate of return on the value of the Company’s net assets at the end of the most recently completed quarter, of 1.50%, subject to a “catch up” feature.
For this purpose, "Pre-Incentive Fee Net Investment Income" meant“pre-incentive fee net investment income” means interest income, dividend income and any other income (including any other fees (other than fees for providing managerial assistance), such as commitment, origination, structuring, diligence and consulting fees or other fees that the Company receivedreceives from portfolio companies)companies, other than fees for providing managerial assistance) accrued during the fiscal quarter, minus the Company'sCompany’s operating expenses for the quarter (including the base management fee, expenses payable under the Prior Administration Agreement and any interest expense and dividends paid on any issued and outstanding indebtedness or preferred stock, but excluding the incentive fee). Pre-Incentive Fee Net Investment Income included,Pre-incentive fee net investment income includes, in the case of investments with a deferred interest feature (such as OID, debt instruments with PIK interest and zero coupon securities), accrued income that the Company hadhas not yet received in cash. Pre-Incentive Fee Net Investment Income didPre-incentive fee net investment income does not include any realized capital gains, realized capital losses or unrealized capital appreciation or depreciation.
•No incentive fee wasis payable to the FSMOaktree in any fiscal quarter in which the Company's Pre-Incentive Fee Net Investment Income didCompany’s pre-incentive fee net investment income does not exceed the hurdlepreferred return rate of 1.5%1.50% (the "preferred return" or "hurdle"“preferred return”); on net assets;
•For any quarter in which the Company’s pre-incentive fee net investment income exceeds 1.8182% on net assets, the incentive fee on income is equal to 17.5% of the amount of the Company’s pre-incentive fee net investment income, as the preferred return and catch-up will have been achieved.
124
OAKTREE STRATEGIC INCOME CORPORATION
NOTES TO CONSOLIDATED FINANCIAL STATEMENTS
There wasis no accumulation of amounts on the hurdle rate from quarter to quarter and accordingly there wasis no clawback of amounts previously paid if subsequent quarters were below the quarterly hurdle and there was no delay of payment if prior quarters wereare below the quarterly hurdle.
OCM permanently waived $0.3 million of Part I incentive fees incurred during the three months ended March 31, 2020. For the years ended September 30, 2017, 20162020 and 2015,2019, the Part I incentive fee (net of waivers) incurred under the Investment Advisory Agreement was $3.2 million, $5.2$1.6 million and $5.7$3.8 million, respectively.
Under the Investment Advisory Agreement, the second part ("Part II incentive fee" or "capital gain incentive fee") of the incentive fee was(the "capital gains incentive fee") is determined and payable in arrears as of the end of each fiscal year (or upon termination of the Former Investment Advisory Agreement, as of the termination date) commencing with the fiscal year ended September 30, 2019 and equaled 20%equals 17.5% of the Company'sCompany’s realized capital gains, if any, on a cumulative basis from inceptionthe beginning of the fiscal year ended September 30, 2019 through the end of each subsequent fiscal year, computed net of all realized capital losses and unrealized capital depreciation on a cumulative basis, less the aggregate amount of any previously paid capital gaingains incentive fees. Forfees under the years ended September 30, 2017Investment Advisory Agreement. Any realized capital gains, realized capital losses, unrealized capital appreciation and 2016, there was no Part II incentive fee. Forunrealized capital depreciation with respect to the Company’s portfolio as of the end of the fiscal year ended September 30, 2015, $0.8 million2018 are excluded from the calculations of the Part IIsecond part of the incentive fee was reversed due to
GAAP requires that the Company to accrue for the theoretical capital gaingains incentive fee thataccrual consider the cumulative aggregate unrealized capital appreciation in the calculation, as a capital gains incentive fee would be payable after giving effect to the netif such unrealized capital appreciation.appreciation were realized on a theoretical "liquidation basis." A fee so calculated and accrued would not be payable under the Former Investment Advisory Agreement,applicable law and may never be paid based upon the computation of capital gaingains incentive fees in subsequent periods. Amounts ultimately paid under the Former Investment Advisory Agreement will be consistent with the formula reflected in the Investment Advisory Agreement. This GAAP accrual is calculated using the aggregate cumulative realized capital gains and losses and aggregate cumulative unrealized capital depreciation included in the calculation of the capital gains incentive fee plus the aggregate cumulative unrealized capital appreciation. Any realized capital gains and losses and cumulative unrealized capital appreciation and depreciation with respect to the Company’s portfolio as of the end of the fiscal year ended September 30, 2018 are excluded from the GAAP accrual. If such amount is positive at the end of a period, then GAAP requires the Company to record a capital gains incentive fee equal to 17.5% of such cumulative amount, less the aggregate amount of actual capital gains incentive fees paid or capital gains incentive fees accrued under GAAP in all prior periods. The resulting accrual for any capital gains incentive fee under GAAP in a given period may result in an additional expense if such cumulative amount is greater than in the prior period or a reversal of previously recorded expense if such cumulative amount is less than in the prior period. If such cumulative amount is negative, then there is no accrual. There can be no assurance that such unrealized capital appreciation will be realized in the future or any accrued capital gains incentive fee will become payable under the Investment Advisory Agreement. For the years ended September 30, 2020 and 2019, the Company did not accrue, and cumulatively has not accrued, any capital gains incentive fees.
To ensure compliance with Section 15(f) of the Investment Company Act, OCM entered into a two-year contractual fee waiver with the Company, which ended on October 17, 2019, pursuant to which OCM waived any management or incentive fees payable under the Investment Advisory Agreement that exceeded what would have been paid to the Former Adviser in the aggregate under the Former Investment Advisory Agreement. At the end of the two-year period, OCM permanently waived $1.2 million, of which $0.1 million was recorded for the year ended September 30, 2020.
Indemnification
The Investment Advisory Agreement provides that, absent willful misfeasance, bad faith or gross negligence in the performance of their respective duties or by reason of the reckless disregard of their respective duties and obligations, Oaktree and its officers, managers, partners, members (and their members, including the owners of their members), agents, employees, controlling persons and any other person or entity affiliated with it, are entitled to indemnification from the Company for any damages, liabilities, costs and expenses (including reasonable attorneys' fees and amounts reasonably paid in settlement) arising from the rendering of Oaktree's services under the Investment Advisory Agreement or otherwise as investment adviser.
Administrative Services
The Company did not accrue for capital gain incentive fees as of September 30, 2017 due to the accumulated realized and unrealized losses in the portfolio.
125
OAKTREE STRATEGIC INCOME CORPORATION
NOTES TO CONSOLIDATED FINANCIAL STATEMENTS
perform its obligations under the Administration Agreement. Oaktree Administrator may, on behalf of the Company, conduct relations and negotiate agreements with custodians, trustees, depositories, attorneys, underwriters, brokers and dealers, corporate fiduciaries, insurers, banks and such other persons in any such other capacity deemed to be necessary or desirable. Oaktree Administrator makes reports to the Company’s Board of Directors of its performance of obligations under the Administration Agreement FSC CT also performed or oversaw the performanceand furnishes advice and recommendations with respect to such other aspects of the Company'sCompany’s business and affairs, in each case, as it shall determine to be desirable or as reasonably required administrative services, which included beingby the Company’s Board of Directors; provided that Oaktree Administrator shall not provide any investment advice or recommendation.
Oaktree Administrator also provides portfolio collection functions for interest income, fees and warrants and is responsible for the financial and other records whichthat the Company is required to maintain and preparingprepares, prints and disseminates reports to the Company'sCompany’s stockholders and reportsall other materials filed with the U.S. Securities and Exchange Commission, or the SEC. In addition, FSC CT assistedOaktree Administrator assists the Company in determining and publishing the Company'sCompany’s net asset value, oversawoverseeing the preparation and filing of the Company'sCompany’s tax returns, and the printing and dissemination of reports to the Company's stockholders, and generally oversawoverseeing the payment of the Company'sCompany’s expenses and the performance of administrative and professional services rendered to the Company by others. FSC CTOaktree Administrator may also provided,offer to provide, on behalf of the Company,Company’s behalf, managerial assistance to itsthe Company’s portfolio companies.
For providing these services, facilities and personnel, the Company reimbursed FSC CTreimburses Oaktree Administrator the allocable portion of overhead and other expenses incurred by FSC CTOaktree Administrator in performing its obligations under the Prior Administration Agreement, including the Company’s allocable portion of the rent of the Company'sCompany’s principal executive offices (which are located in a building owned by a Brookfield affiliate) at market rates and the Company’s allocable portion of the costs of compensation and related expenses of the Company'sits Chief Financial Officer, and Chief Compliance Officer, their staffs and their staffs.other non-investment professionals at Oaktree that perform duties for the Company. Such reimbursement wasis at cost, with no profit to, or markup by, FSC CT. As of September 30, 2017, the Company utilized office space in Greenwich, CT that was leased by FSC CT from an entity controlled by the chief executive officer of FSM and FSC CT, Mr. Leonard M. Tannenbaum. As of September 30, 2017, the Company also utilized additional office space that was leased by affiliates of FSM and FSC CT in Chicago, IL. Any reimbursement for a portion of the rent at this location was at cost with no profit to, or markup by, FSC CT.Oaktree Administrator. The administration agreement was terminableAdministration Agreement may be terminated by either party without penalty upon 60 days'days’ written notice to the other party and wasother. The Administration Agreement may also be terminated, on October 17, 2017.without penalty, upon the vote of a majority of the Company’s outstanding voting securities.
For the year ended September 30, 2017,2020, the Company accrued administrative expenses of $1.9$1.1 million, including $1.2$0.2 million of general and administrative expenses, which was due to FSC CT.expenses. For each of the years ended September 30, 20162019 and September 30, 2015,2018, the Company accrued administrative expenses of $1.2$1.3 million, including $0.7$0.2 million of general and administrative expenses, and $1.3expenses. Of the amount accrued for the year ended September 30, 2018, $0.1 million including $0.5 million of general and administrative expenses, respectively, which was due to FSC CT. the Former Administrator for administrative expenses incurred prior to October 17, 2017 and $1.2 million was due to Oaktree Administrator.
As of September 30, 2020 and September 30, 2019, $1.2 million and $1.5 million, respectively, was included in “Due to affiliate” in the Consolidated Statements of Assets and Liabilities, reflecting the unpaid portion of administrative expenses and other reimbursable expenses payable to Oaktree Administrator.
126
OAKTREE STRATEGIC INCOME CORPORATION
NOTES TO CONSOLIDATED FINANCIAL STATEMENTS
Note 12. Financial Highlights
| Year ended September 30, 2017 | Year ended September 30, 2016 | Year ended September 30, 2015 | Year ended September 30, 2014 | Period from June 29, 2013 (commencement of operations) through September 30, 2013 | ||||||||||||||||
| Net asset value at beginning of period | $ | 11.06 | $ | 12.11 | $ | 12.65 | $ | 15.11 | $ | — | ||||||||||
| Net investment income (5) | 0.76 | 0.86 | 0.96 | 0.62 | — | |||||||||||||||
| Net unrealized appreciation (depreciation) on investments and secured borrowings (5) | (0.60 | ) | (0.58 | ) | (0.43 | ) | 0.24 | 0.12 | ||||||||||||
| Net realized gain (loss) on investments (5) | (0.45 | ) | (0.43 | ) | 0.01 | 0.14 | 0.01 | |||||||||||||
| Distributions to stockholders (5) | (0.80 | ) | (0.90 | ) | (1.07 | ) | (0.62 | ) | — | |||||||||||
| Tax return of capital (5) | — | — | — | (0.39 | ) | — | ||||||||||||||
| Net issuance of common stock (5) | — | — | (0.01 | ) | (2.45 | ) | 14.98 | |||||||||||||
| Net asset value at end of period | $ | 9.97 | $ | 11.06 | $ | 12.11 | $ | 12.65 | $ | 15.11 | ||||||||||
| Per share market value at beginning of period | $ | 8.56 | $ | 8.73 | $ | 11.82 | $ | 13.54 | $ | 15.00 | ||||||||||
| Per share market value at end of period | $ | 8.80 | $ | 8.56 | $ | 8.73 | $ | 11.82 | $ | 13.54 | ||||||||||
| Total return (1) | 12.51 | % | 9.44 | % | (15.76 | )% | (8.20 | )% | (9.73 | )% | ||||||||||
| Common shares outstanding at beginning of period | 29,466,768 | 29,466,768 | 29,466,768 | 6,666,768 | 100 | |||||||||||||||
| Common shares outstanding at end of period | 29,466,768 | 29,466,768 | 29,466,768 | 29,466,768 | 6,666,768 | |||||||||||||||
| Net assets at beginning of period | $ | 325,829,394 | $ | 356,807,103 | $ | 372,677,678 | $ | 100,705,269 | $ | 1,500 | ||||||||||
| Net assets at end of period | $ | 293,636,434 | $ | 325,829,394 | $ | 356,807,103 | $ | 372,677,678 | $ | 100,705,269 | ||||||||||
| Average net assets (2) | $ | 316,440,902 | $ | 332,486,362 | $ | 368,839,422 | $ | 132,873,801 | $ | 80,133,138 | ||||||||||
| Ratio of net investment income to average net assets (3) | 7.09 | % | 7.59 | % | 7.67 | % | 4.34 | % | 0.08 | % | ||||||||||
| Ratio of total expenses to average net assets (3) | 7.71 | % | 8.44 | % | 6.29 | % | 5.20 | % | 2.14 | % | ||||||||||
| Ratio of base management fee waiver to average net assets (3) | — | % | — | % | — % | (0.12 | )% | — % | ||||||||||||
| Ratio of insurance recoveries to average net assets (3) | (0.08 | )% | — | % | — | % | — | % | — | % | ||||||||||
| Ratio of net expenses to average net assets (3) | 7.63 | % | 8.44 | % | 6.29 | % | 5.08 | % | 2.14 | % | ||||||||||
| Ratio of portfolio turnover to average investments at fair value | 46.80 | % | 28.02 | % | 21.48 | % | 78.96 | % | 16.44 | % | ||||||||||
| Weighted average outstanding debt (4) | $ | 267,608,526 | $ | 303,204,218 | $ | 243,240,691 | $ | 49,833,018 | $ | — | ||||||||||
| Average debt per share (5) | $ | 9.08 | $ | 10.29 | $ | 8.25 | $ | 5.36 | $ | — | ||||||||||
| Year ended September 30, 2020 | Year ended September 30, 2019 | Year ended September 30, 2018 (1) | Year ended September 30, 2017 | Year ended September 30, 2016 | ||||||||||||||||||||||||||||
| Net asset value per share at beginning of period | $ | 9.65 | $ | 10.04 | $ | 9.97 | $ | 11.06 | $ | 12.11 | ||||||||||||||||||||||
| Net investment income (2) | 0.55 | 0.72 | 0.67 | 0.76 | 0.86 | |||||||||||||||||||||||||||
| Net unrealized appreciation (depreciation) (2) | (0.24) | (0.47) | 0.97 | (0.60) | (0.58) | |||||||||||||||||||||||||||
| Net realized gains (losses) (2) | (0.35) | (0.02) | (0.94) | (0.45) | (0.43) | |||||||||||||||||||||||||||
| Distributions of net investment income to stockholders | (0.56) | (0.62) | (0.56) | (0.80) | (0.90) | |||||||||||||||||||||||||||
| Tax return of capital | — | — | (0.07) | — | — | |||||||||||||||||||||||||||
| Net asset value per share at end of period | $ | 9.05 | $ | 9.65 | $ | 10.04 | $ | 9.97 | $ | 11.06 | ||||||||||||||||||||||
| Per share market value at beginning of period | $ | 8.25 | $ | 8.65 | $ | 8.80 | $ | 8.56 | $ | 8.73 | ||||||||||||||||||||||
| Per share market value at end of period | $ | 6.51 | $ | 8.25 | $ | 8.65 | $ | 8.80 | $ | 8.56 | ||||||||||||||||||||||
| Total return (3) | (13.98) | % | 2.83 | % | 5.90 | % | 12.51 | % | 9.44 | % | ||||||||||||||||||||||
| Common shares outstanding at beginning of period | 29,466,768 | 29,466,768 | 29,466,768 | 29,466,768 | 29,466,768 | |||||||||||||||||||||||||||
| Common shares outstanding at end of period | 29,466,768 | 29,466,768 | 29,466,768 | 29,466,768 | 29,466,768 | |||||||||||||||||||||||||||
| Net assets at beginning of period | $ | 284,450,006 | $ | 295,745,420 | $ | 293,636,434 | $ | 325,829,394 | $ | 356,807,103 | ||||||||||||||||||||||
| Net assets at end of period | $ | 266,681,411 | $ | 284,450,006 | $ | 295,745,420 | $ | 293,636,434 | $ | 325,829,394 | ||||||||||||||||||||||
| Average net assets (4) | $ | 257,184,310 | $ | 286,712,068 | $ | 294,285,497 | $ | 316,440,902 | $ | 332,486,362 | ||||||||||||||||||||||
| Ratio of net investment income to average net assets | 6.30 | % | 7.37 | % | 6.72 | % | 7.09 | % | 7.59 | % | ||||||||||||||||||||||
| Ratio of total expenses to average net assets | 9.20 | % | 10.11 | % | 9.72 | % | 7.71 | % | 8.44 | % | ||||||||||||||||||||||
| Ratio of net expenses to average net assets | 9.07 | % | 9.94 | % | 9.48 | % | 7.63 | % | 8.44 | % | ||||||||||||||||||||||
| Ratio of portfolio turnover to average investments at fair value | 41.25 | % | 34.11 | % | 74.88 | % | 46.80 | % | 28.02 | % | ||||||||||||||||||||||
| Weighted average outstanding debt (5) | $ | 306,450,172 | $ | 290,086,937 | $ | 269,760,689 | $ | 267,608,526 | $ | 303,204,218 | ||||||||||||||||||||||
| Average debt per share (2) | $ | 10.40 | $ | 9.84 | $ | 9.15 | $ | 9.08 | $ | 10.29 | ||||||||||||||||||||||
| Asset coverage ratio at end of period (6) | 199.66 | % | 196.54 | % | 207.52 | % | 211.67 | % | 211.43 | % | ||||||||||||||||||||||
| (1) | Beginning on October 17, 2017, the Company is externally managed by Oaktree or its affiliates. Prior to October 17, 2017, the Company was externally managed by the Former Adviser. | ||||
| (2) | Calculated based upon weighted average shares outstanding for the period. | ||||
| (3) | Total return equals the increase or decrease of ending market value over beginning market value, plus distributions, divided by the beginning market value, assuming dividend reinvestment prices obtained under the Company's DRIP. Total return | ||||
| Calculated based upon the weighted average net assets for the period. | |||||
| Calculated based upon the weighted average | |||||
127
OAKTREE STRATEGIC INCOME CORPORATION
NOTES TO CONSOLIDATED FINANCIAL STATEMENTS
Senior Securities
Information about our senior securities (including debt securities and other indebtedness) is shown in the following table as of the fiscal years ended September 30 for the years indicated below. We had no senior securities outstanding as of September 30 of any prior fiscal years prior to those indicated below.
| Class and Year | Total Amount Outstanding Exclusive of Treasury Securities(1) | Asset Coverage Per Unit(2) | Involuntary Liquidating Preference Per Unit(3) | Average Market Value Per Unit | ||||||||||
| Citibank Facility | ||||||||||||||
| Fiscal 2015 | $ | 136,659,800 | $ | 2,105 | — | N/A | ||||||||
| Fiscal 2016 | 107,426,800 | 2,114 | — | N/A | ||||||||||
| Fiscal 2017 | 76,456,800 | 2,117 | — | N/A | ||||||||||
| Fiscal 2018 | 110,056,800 | 2,075 | — | N/A | ||||||||||
| Fiscal 2019 | 126,056,800 | 1,965 | — | N/A | ||||||||||
| Fiscal 2020 | 119,056,800 | 1,997 | — | N/A | ||||||||||
| East West Bank Facility | ||||||||||||||
| Fiscal 2017 | $ | 6,500,000 | $ | 2,117 | — | N/A | ||||||||
| Fiscal 2018 | 8,000,000 | 2,075 | — | N/A | ||||||||||
| Fiscal 2019 | 11,000,000 | 1,965 | — | N/A | ||||||||||
| Deutsche Bank Facility | ||||||||||||||
| Fiscal 2018 | $ | 157,000,000 | $ | 2,075 | — | N/A | ||||||||
| Fiscal 2019 | 157,600,000 | 1,965 | — | N/A | ||||||||||
| Fiscal 2020 | 137,600,000 | 1,997 | — | N/A | ||||||||||
| Notes Payable | ||||||||||||||
| Fiscal 2015 | $ | 186,366,000 | $ | 2,105 | — | N/A | ||||||||
| Fiscal 2016 | 180,000,000 | 2,114 | — | N/A | ||||||||||
| Fiscal 2017 | 180,000,000 | 2,117 | — | N/A | ||||||||||
| Secured Borrowings | ||||||||||||||
| Fiscal 2016 | $ | 5,000,000 | $ | 2,114 | — | N/A | ||||||||
| Fiscal 2020 | 10,929,578 | 1,997 | — | N/A | ||||||||||
| Total Senior Securities | ||||||||||||||
| Fiscal 2015 | $ | 323,025,800 | $ | 2,105 | — | N/A | ||||||||
| Fiscal 2016 | 292,426,800 | 2,114 | — | N/A | ||||||||||
| Fiscal 2017 | 262,956,800 | 2,117 | — | N/A | ||||||||||
| Fiscal 2018 | 275,056,800 | 2,075 | — | N/A | ||||||||||
| Fiscal 2019 | 294,656,800 | 1,965 | — | N/A | ||||||||||
| Fiscal 2020 | 267,586,378 | 1,997 | — | N/A | ||||||||||
__________
(1)Total amount of each class of senior securities outstanding at the end of the periods.
(2)The asset coverage ratio for a class of senior securities representing indebtedness is calculated as the Company's consolidated total assets, less all liabilities and indebtedness not represented by senior securities, divided by total senior securities representing indebtedness. This asset coverage ratio is multiplied by $1,000 to determine the “Asset Coverage Per Unit.”
(3)The amount to which such class of senior security would be entitled upon the involuntary liquidation of the issuer in preference to any security junior to it. The “-” indicates information that the Securities and Exchange Commission expressly does not require to be disclosed for certain types of senior securities.
128
OAKTREE STRATEGIC INCOME CORPORATION
NOTES TO CONSOLIDATED FINANCIAL STATEMENTS
Note 13. Derivative Instruments
The Company enters into forward currency contracts from time to time to help mitigate the impact that an adverse change in foreign exchange rates would have on the value of the Company’s investments denominated in foreign currencies.
In order to better define its contractual rights and to secure rights that will help the Company mitigate its counterparty risk, the Company entered into an International Swaps and Derivatives Association, Inc. Master Agreement ("ISDA Master Agreement") with its derivative counterparty, JPMorgan Chase Bank, N.A. The ISDA Master Agreement permits a single net payment in the event of a default or similar event. As of September 30, 2020, $0.3 million has been pledged to cover obligations and no cash collateral has been received from the counterparty with respect to the Company's forward currency contracts.
Net unrealized gains or losses on foreign currency contracts are included in “net unrealized appreciation (depreciation)” and net realized gains or losses on forward currency contracts are included in “net realized gains (losses)” in the accompanying Consolidated Statements of Operations. Forward currency contracts are considered undesignated derivative instruments.
Certain information related to the Company’s foreign currency forward contracts is presented below as of September 30, 2020.
| Description | Notional Amount Purchased / (Sold) in U.S. Dollars | Notional Amount Purchased / (Sold) in Local Currency | Maturity Date | Gross Amount of Recognized Assets | Gross Amount of Recognized Liabilities | Balance Sheet Location of Net Amounts | ||||||||||||||||||||||||||||||||
| Foreign currency forward contract | $ | 529,015 | € | (465,600) | 11/12/2020 | $ | — | $ | 17,450 | Derivative liability | ||||||||||||||||||||||||||||
| Foreign currency forward contract | $ | 4,613,133 | £ | (3,654,546) | 11/12/2020 | $ | — | $ | 112,486 | Derivative liability | ||||||||||||||||||||||||||||
| $ | — | $ | 129,936 | |||||||||||||||||||||||||||||||||||
Certain information related to the Company’s foreign currency forward contracts is presented below as of September 30, 2019.
| Description | Notional Amount Purchased / (Sold) in U.S. Dollars | Notional Amount Purchased / (Sold) in Local Currency | Maturity Date | Gross Amount of Recognized Assets | Gross Amount of Recognized Liabilities | Balance Sheet Location of Net Amounts | ||||||||||||||||||||||||||||||||
| Foreign currency forward contract | $ | 6,106,199 | £ | (4,934,900) | 10/15/2019 | $ | 20,876 | $ | — | Derivative asset | ||||||||||||||||||||||||||||
Note 13.14. Commitments and Contingencies
Off-Balance Sheet Arrangements
The Company may be a party to financial instruments with off-balance sheet risk in the normal course of business to meet the financial needs of its portfolio companies. As of September 30, 20172020 and September 30, 2016,2019, off-balance sheet arrangements consisted of $43.5$33.7 million and $52.8$24.2 million, respectively, of unfunded commitments to provide debt and equity financing to certain of the Company's portfolio companies. Such commitments are subject to the portfolio companies' satisfaction of certain financial and nonfinancial covenants and may involve, to varying degrees, elements of credit risk in excess of the amount recognized in the Consolidated Statements of Assets and Liabilities.
129
OAKTREE STRATEGIC INCOME CORPORATION
NOTES TO CONSOLIDATED FINANCIAL STATEMENTS
A list of unfunded commitments by investment (consisting of revolvers, term loans and FSFRthe OCSI Glick JV Subordinated Notes and LLC equity interests) as of September 30, 20172020 and September 30, 20162019 is shown in the table below:
| September 30, 2017 | September 30, 2016 | |||||||
| FSFR Glick JV LLC | $ | 16,159,368 | $ | 16,382,494 | ||||
| MHE Intermediate Holdings | 6,749,698 | — | ||||||
| Triple Point Group Holdings, Inc. | 4,968,590 | 4,968,590 | ||||||
| BeyondTrust Software, Inc. | 3,605,000 | 3,605,000 | ||||||
| Motion Recruitment Partners LLC | 2,900,000 | 2,900,000 | ||||||
| PowerPlan, Inc. | 2,100,000 | 2,100,000 | ||||||
| Ministry Brands, LLC | 1,857,967 | — | ||||||
| Impact Sales, LLC | 1,078,125 | — | ||||||
| Valet Merger Sub, Inc. | 833,333 | 333,333 | ||||||
| Executive Consulting Group, Inc. | 800,000 | 800,000 | ||||||
| Internet Pipeline, Inc. | 800,000 | 800,000 | ||||||
| Metamorph US 3, LLC (1) | 720,000 | 1,800,000 | ||||||
| Systems, Inc. | 600,000 | — | ||||||
| Sailpoint Technologies, Inc. | 300,000 | 200,000 | ||||||
| 4 Over International, LLC | 68,452 | 68,452 | ||||||
| TIBCO Software, Inc. | — | 5,300,000 | ||||||
| All Web Leads, Inc. | — | 3,458,537 | ||||||
| Legalzoom.com, Inc. | — | 2,607,018 | ||||||
| Teaching Strategies, LLC | — | 2,400,000 | ||||||
| Dynatect Group Holdings, Inc. | — | 1,800,000 | ||||||
| My Alarm Center, LLC | — | 1,212,472 | ||||||
| Baart Programs, Inc. | — | 1,000,000 | ||||||
| TrialCard Incorporated | — | 850,000 | ||||||
| OBHG Management Services, LLC | — | 100,000 | ||||||
| Accruent, LLC | — | 85,000 | ||||||
| Total | $ | 43,540,533 | $ | 52,770,896 | ||||
| September 30, 2020 | September 30, 2019 | |||||||||||||
| OCSI Glick JV LLC (1) | $ | 13,998,029 | $ | 13,998,029 | ||||||||||
| Athenex, Inc. | 5,316,815 | — | ||||||||||||
| MHE Intermediate Holdings, LLC | 5,254,516 | 4,466,338 | ||||||||||||
| MRI Software LLC | 2,721,132 | — | ||||||||||||
| NeuAG, LLC | 1,059,000 | — | ||||||||||||
| Ardonagh Midco 3 PLC | 1,002,320 | — | ||||||||||||
| Mindbody, Inc. | 952,381 | 952,381 | ||||||||||||
| Accupac, Inc. | 716,984 | — | ||||||||||||
| Apptio, Inc. | 692,308 | 692,308 | ||||||||||||
| OEConnection LLC | 501,353 | 731,183 | ||||||||||||
| Olaplex, Inc. | 486,000 | — | ||||||||||||
| Coyote Buyer, LLC | 391,267 | — | ||||||||||||
| iCIMs, Inc. | 294,118 | 294,118 | ||||||||||||
| Immucor, Inc. | 189,438 | — | ||||||||||||
| GKD Index Partners, LLC | 88,889 | 444,444 | ||||||||||||
| Ministry Brands, LLC | 42,500 | 80,000 | ||||||||||||
| PaySimple, Inc. | — | 2,450,000 | ||||||||||||
| 4 Over International, LLC | — | 60,629 | ||||||||||||
| Total | $ | 33,707,050 | $ | 24,169,430 | ||||||||||
(1) This investment was on cash non-accrual status as of September 30, 2017.2020.
Note 14.15. Selected Quarterly Financial Data (unaudited)
Selected unaudited quarterly financial data for Oaktree Strategic Income Corporation for the years ended September 30, 2017, 20162020 and 20152019 are below:
| For or as of the three months ended | ||||||||||||||||||||||||||||||||||||||
| (dollars in thousands, except per share amounts) | September 30, 2020 | June 30, 2020 | March 31, 2020 | December 31, 2019 | September 30, 2019 | June 30, 2019 | March 31, 2019 | December 31, 2018 | ||||||||||||||||||||||||||||||
| Total investment income (1) | $ | 8,952 | $ | 8,636 | $ | 10,343 | $ | 11,603 | $ | 12,078 | $ | 13,809 | $ | 12,482 | $ | 11,259 | ||||||||||||||||||||||
| Net investment income (1) | 3,746 | 3,169 | 4,562 | 4,728 | 5,142 | 5,918 | 5,217 | 4,864 | ||||||||||||||||||||||||||||||
| Net realized and unrealized gain (loss) (1) | 16,910 | 38,990 | (74,777) | 1,407 | (2,145) | (2,435) | 8,479 | (18,064) | ||||||||||||||||||||||||||||||
| Net increase (decrease) in net assets resulting from operations (1) | 20,656 | 42,159 | (70,215) | 6,134 | 2,996 | 3,483 | 13,695 | (13,201) | ||||||||||||||||||||||||||||||
| Net assets | 266,681 | 249,709 | 211,234 | 286,017 | 284,450 | 286,021 | 287,105 | 277,977 | ||||||||||||||||||||||||||||||
| Total investment income per common share (1) | $ | 0.30 | $ | 0.29 | $ | 0.35 | $ | 0.39 | $ | 0.41 | $ | 0.47 | $ | 0.42 | $ | 0.38 | ||||||||||||||||||||||
| Net investment income per common share (1) | 0.13 | 0.11 | 0.15 | 0.16 | 0.17 | 0.20 | 0.18 | 0.17 | ||||||||||||||||||||||||||||||
| Earnings (loss) per common share (1) | 0.70 | 1.43 | (2.38) | 0.21 | 0.10 | 0.12 | 0.46 | (0.45) | ||||||||||||||||||||||||||||||
| Net asset value per common share at period end (1) | 9.05 | 8.47 | 7.17 | 9.71 | 9.65 | 9.71 | 9.74 | 9.43 | ||||||||||||||||||||||||||||||
__________
(1) The sum of quarterly amounts may not equal annual amounts due to rounding.
| For the three months ended | ||||||||||||||||||||||||||||||||||||
| (dollars in thousands, except per share amounts) | September 30, 2017 | June 30, 2017 | March 31, 2017 | December 31, 2016 | September 30, 2016 | June 30, 2016 | March 31, 2016 | December 31, 2015 | September 30, 2015 | June 30, 2015 | March 31, 2015 | December 31, 2014 | ||||||||||||||||||||||||
| Total investment income | $ | 11,820 | $ | 12,171 | $ | 11,020 | $ | 11,561 | $ | 13,203 | $ | 13,114 | $ | 13,195 | $ | 13,914 | $ | 14,068 | $ | 14,140 | $ | 11,341 | $ | 11,923 | ||||||||||||
| Net investment income | 5,521 | 5,930 | 5,086 | 5,884 | 6,342 | 6,164 | 5,785 | 7,002 | 7,402 | 7,086 | 6,294 | 7,496 | ||||||||||||||||||||||||
| Net realized and unrealized gain (loss) | (19,984 | ) | (5,791 | ) | (254 | ) | (5,159 | ) | 2,251 | (5,248 | ) | (6,445 | ) | (20,308 | ) | (7,115 | ) | (4,632 | ) | 393 | (1,012 | ) | ||||||||||||||
| Net increase (decrease) in net assets resulting from operations | (14,463 | ) | 139 | 4,832 | 725 | 8,593 | 916 | (660 | ) | (13,306 | ) | 287 | 2,454 | 6,687 | 6,484 | |||||||||||||||||||||
| Net assets | 293,636 | 313,698 | 319,158 | 319,924 | 325,829 | 323,866 | 329,580 | 334,661 | 356,807 | 361,782 | 368,168 | 370,322 | ||||||||||||||||||||||||
| Total investment income per common share | $ | 0.40 | $ | 0.41 | $ | 0.37 | $ | 0.39 | $ | 0.45 | $ | 0.45 | $ | 0.45 | $ | 0.47 | $ | 0.48 | $ | 0.48 | $ | 0.38 | $ | 0.40 | ||||||||||||
| Net investment income per common share | 0.19 | 0.20 | 0.17 | 0.20 | 0.22 | 0.21 | 0.20 | 0.24 | 0.25 | 0.24 | 0.21 | 0.25 | ||||||||||||||||||||||||
| Earnings (loss) per common share | (0.49 | ) | — | 0.16 | 0.02 | 0.29 | 0.03 | (0.02 | ) | (0.45 | ) | 0.01 | 0.08 | 0.23 | 0.22 | |||||||||||||||||||||
| Net asset value per common share at period end | 9.97 | 10.65 | 10.83 | 10.86 | 11.06 | 10.99 | 11.18 | 11.36 | 12.11 | 12.28 | 12.49 | 12.57 | ||||||||||||||||||||||||
Note 15.16. Subsequent Events
The Company's management evaluated subsequent events through the date of issuance of the Consolidated Financial Statements. There have been no subsequent events that occurred during such period that would require disclosure in, or would be required to be recognized in, the Consolidated Financial Statements as of and for the year ended September 30, 2017,2020, except as discussed below.
On JulyNovember 13, 2017, Oaktree, entered into the Purchase Agreement, with FSM, and, for certain limited purposes, FSAM, the indirect, partial owner of FSM, and Fifth Street Holdings L.P. (“FSH”), the direct, partial owner of FSM.
130
OAKTREE STRATEGIC INCOME CORPORATION
NOTES TO CONSOLIDATED FINANCIAL STATEMENTS
Merger Agreement
At the effective time of the Merger (the “Effective Time”), each share of the Company’s common stock issued and outstanding immediately prior to the Effective Time (other than shares owned by OCSL or any of its assignment. The New Investment Advisory Agreement mayconsolidated subsidiaries (the “Cancelled Shares”)) will be terminated by either party without penalty upon 60 days’ written noticeconverted into the right to receive a number of shares of common stock, par value $0.01 per share, of OCSL (“OCSL Common Stock”) equal to the other. The New Investment Advisory Agreement may also be terminated, without penalty, upon the voteExchange Ratio (as defined below), plus any cash (without interest) in lieu of fractional shares.
As of a majoritymutually agreed date no earlier than 48 hours (excluding Sundays and holidays) prior to the Effective Time (such date, the “Determination Date”), each of the outstanding voting securities of the Company.
The Company and OCSL will update and redeliver the Closing OCSI Net Asset Value or the Closing OCSL Net Asset Value, respectively, in the event of a material change to such calculation between the Determination Date and the closing of the Mergers and if needed to ensure that the calculation is determined within 48 hours (excluding Sundays and holidays) prior to the Effective Time.
The Merger Agreement contains customary representations and warranties by each of the Company, OCSL and Oaktree. The Merger Agreement also contains customary covenants, including, among others, covenants relating to the operation of each of the Company’s and OCSL’s businesses during the period prior to the closing of the Mergers.
Consummation of the Mergers, which FSH pledged such sharesis currently anticipated to occur during the first half of calendar year 2021, is subject to certain closing conditions, including requisite approvals of the Company’s and OCSL’s stockholders and certain other closing conditions.
The Merger Agreement also contains certain termination rights in favor of the Company and OCSL, including if the Mergers are not completed on or before July 28, 2021 or if the requisite approvals of the Company’s or OCSL’s stockholders are not obtained. The Merger Agreement provides that, upon the termination of the Merger Agreement under certain circumstances, a third party acquiring the Company may be required to pay to OCSL a termination fee of approximately $5.7 million. The Merger Agreement provides that, upon the termination of the Merger Agreement under certain circumstances, a third party acquiring OCSL may be required to pay to the Company to secure indemnification obligationsa termination fee of FSM and FSH under the Purchase Agreement relating to certain SEC investigation-related legal costs and expenses, if any, and certain fees, fines, monetary penalties, deductibles and
Citibank Facility Amendment
On December 6, 2017,October 27, 2020, OCSI Senior Funding II LLC, the CompanyCompany’s wholly owned subsidiary, entered into an amendment to the documents governing the Citibank facility to remove Citibank, N.A.’s approval rights regardingFacility, which provides that (1) consummation of the Company’s ability to purchase assets using proceeds fromMergers will not cause a change of control under the Citibank facility, subject to a mark-to-market valuation protocol for broadly syndicated loansFacility or violate the no merger covenant in the Citibank Facility and a revised valuation dispute mechanism.(2) OCSL will become the collateral manager under the Citibank Facility upon closing of the Mergers. The other material terms of the Citibank facility didFacility were unchanged.
Deutsche Bank Facility Amendment
On October 27, 2020, OCSI Senior Funding Ltd., our wholly owned subsidiary, entered into an amendment to the documents governing the Deutsche Bank Facility that provides that consummation of the Mergers will not cause a change as a result of this amendment.control under the Deutsche Bank Facility or violate the no merger covenant in the Deutsche Bank Facility. The other material terms of the Deutsche Bank Facility were unchanged.
131
Schedule 12-14
Oaktree Strategic Income Corporation
Schedule of Investments in and Advances to Affiliates
Year ended September 30, 20172020
| Portfolio Company/Type of Investment (1) | Cash Interest Rate | Industry | Principal | Net Realized Gain (Loss) | Amount of Interest, Fees or Dividends Credited in Income (2) | Fair Value at October 1, 2019 | Gross Additions (3) | Gross Reductions (4) | Fair Value at September 30, 2020 | % of Total Net Assets | ||||||||||||||||||||||||||||||||||||||||||||||||||||
| Control Investments | ||||||||||||||||||||||||||||||||||||||||||||||||||||||||||||||
| OCSI Glick JV LLC | Multi-sector holdings | |||||||||||||||||||||||||||||||||||||||||||||||||||||||||||||
| Subordinated Note, LIBOR+4.50% cash due 10/20/2028 (5) | $ | 65,045,551 | $ | — | $ | 1,436,726 | $ | 54,326,418 | $ | — | $ | (4,916,517) | $ | 49,409,901 | 18.5% | |||||||||||||||||||||||||||||||||||||||||||||||
| 87.5% LLC equity interest (6) | — | — | — | — | — | — | —% | |||||||||||||||||||||||||||||||||||||||||||||||||||||||
| Total Control Investments | $ | 65,045,551 | $ | — | $ | 1,436,726 | $ | 54,326,418 | $ | — | $ | (4,916,517) | $ | 49,409,901 | 18.5% | |||||||||||||||||||||||||||||||||||||||||||||||
| Portfolio Company/Type of Investment (1) | Cash Interest Rate | Industry | Principal | Net Realized Gain (Loss) | Net Unrealized Appreciation (Depreciation) | Amount of Interest, Fees or Dividends Credited in Income (2) | Fair Value at October 1, 2016 | Gross Additions (3) | Gross Reductions (4) | Fair Value at September 30, 2017 | % of Total Net Assets | |||||||||||||||||||||||||||
| Control Investments | ||||||||||||||||||||||||||||||||||||||
| FSFR Glick JV LLC | Multi-sector holdings | |||||||||||||||||||||||||||||||||||||
| Subordinated Note, LIBOR+8% cash due 10/20/2021 | 9.23% | $ | 64,228,881 | $ | — | $ | 497,902 | $ | 5,764,424 | $ | 56,885,646 | $ | 5,186,507 | $ | (4,465,479 | ) | $ | 57,606,674 | 19.6% | |||||||||||||||||||
| 87.5% LLC equity interest (5) | — | (6,431,021 | ) | (576,044 | ) | 6,431,021 | — | (6,431,021 | ) | — | —% | |||||||||||||||||||||||||||
| Total Control Investments | $ | 64,228,881 | $ | — | $ | (5,933,119 | ) | $ | 5,188,380 | $ | 63,316,667 | $ | 5,186,507 | $ | (10,896,500 | ) | $ | 57,606,674 | 19.6% | |||||||||||||||||||
| Affiliate Investments | ||||||||||||||||||||||||||||||||||||||
| Ameritox Ltd. (6) | Healthcare services | |||||||||||||||||||||||||||||||||||||
| First Lien Term Loan, LIBOR+5% (1% floor) cash 3% PIK due 4/11/2021 | 6.33% | $ | 8,071,313 | $ | — | $ | (6,931,628 | ) | $ | 505,782 | $ | 6,342,286 | $ | 2,118,166 | $ | (7,524,539 | ) | $ | 935,913 | 0.3% | ||||||||||||||||||
| 3,309,873.6 Class A Preferred Units | — | (3,626,150 | ) | — | 3,626,150 | 169,172 | (3,795,322 | ) | — | —% | ||||||||||||||||||||||||||||
| 327,393.6 Class B Preferred Units | — | (358,679 | ) | — | 358,679 | 198,597 | (557,276 | ) | — | —% | ||||||||||||||||||||||||||||
| 1,007.36 Class A Units | — | (2,679,343 | ) | — | 2,679,343 | — | (2,679,343 | ) | — | —% | ||||||||||||||||||||||||||||
| Total Affiliate Investments | $ | 8,071,313 | $ | — | $ | (13,595,800 | ) | $ | 505,782 | $ | 13,006,458 | $ | 2,485,935 | $ | (14,556,480 | ) | $ | 935,913 | 0.3% | |||||||||||||||||||
| Total Control & Affiliate Investments | $ | 72,300,194 | $ | — | $ | (19,528,919 | ) | $ | 5,694,162 | $ | 76,323,125 | $ | 7,672,442 | $ | (25,452,980 | ) | $ | 58,542,587 | 19.9% | |||||||||||||||||||
This schedule should be read in connection with the Company's Consolidated Financial Statements, including the Consolidated Schedules of Investments and Notes to the Consolidated Financial Statements.
______________________
(1)The principal amount and ownership detail are shown in the Company's Consolidated Schedules of Investments.
(2)Represents the total amount of interest (net of non-accrual amounts), fees and dividends credited to income for the portion of the period an investment was included in the Control or Affiliate categories. As of September 30, 2020, the OCSI Glick JV is on cash non-accrual status.
(3)Gross additions include increases in the cost basis of investments resulting from new portfolio investments, follow-on investments and accrued PIK interest (net of non-accrual amounts), and the exchange of one or more existing securities for one or more new securities. Gross additions also include net increases in unrealized appreciation or net decreases in unrealized depreciation as well as the movement of an existing portfolio company into this category or out of a different category.
(4)Gross reductions include decreases in the cost basis of investments resulting from principal payments or sales and exchanges of one or more existing securities for one or more new securities. Gross reductions also include net increases in unrealized depreciation or net decreases in unrealized appreciation as well as the movement of an existing portfolio company out of this category and into a different category.
(5)This investment was on cash non-accrual status as of September 30, 2020. Cash non-accrual is inclusive of PIK and other non-cash income, where applicable.
(6)Together with GF Equity Funding, the Company co-invests through the OCSI Glick JV. The OCSI Glick JV is capitalized as transactions are completed and all portfolio and investment decisions in respect to the OCSI Glick JV must be approved by the OCSI Glick JV investment committee consisting of representatives of the Company and GF Equity Funding (with approval from a representative of each required).
132
Schedule 12-14
Oaktree Strategic Income Corporation
Schedule of Investments in and Advances to Affiliates
Year ended September 30, 20162019
| Portfolio Company/Type of Investment (1) | Cash Interest Rate | Industry | Principal | Net Realized Gain (Loss) | Amount of Interest, Fees or Dividends Credited in Income (2) | Fair Value at October 1, 2018 | Gross Additions (3) | Gross Reductions (4) | Fair Value at June 30, 2019 | % of Total Net Assets | ||||||||||||||||||||||||||||||||||||||||||||||||||||
| Control Investments | ||||||||||||||||||||||||||||||||||||||||||||||||||||||||||||||
| OCSI Glick JV LLC | Multi-sector holdings | |||||||||||||||||||||||||||||||||||||||||||||||||||||||||||||
| Subordinated Note, LIBOR+6.50% cash due 10/20/2021 | 8.89% | $ | 66,077,912 | $ | — | $ | 5,945,194 | $ | 58,512,170 | $ | — | $ | (4,185,752) | $ | 54,326,418 | 19.1% | ||||||||||||||||||||||||||||||||||||||||||||||
| 87.5% LLC equity interest (5) | — | — | — | — | — | — | —% | |||||||||||||||||||||||||||||||||||||||||||||||||||||||
| Total Control Investments | $ | 66,077,912 | $ | — | $ | 5,945,194 | $ | 58,512,170 | $ | — | $ | (4,185,752) | $ | 54,326,418 | 19.1% | |||||||||||||||||||||||||||||||||||||||||||||||
| Portfolio Company/Type of Investment (1) | Cash Interest Rate | Industry | Principal | Net Realized Gain (Loss) | Net Unrealized Appreciation (Depreciation) | Amount of Interest, Fees or Dividends Credited in Income (2) | Fair Value at October 1, 2015 | Gross Additions (3) | Gross Reductions (4) | Fair Value at September 30, 2016 | % of Total Net Assets | |||||||||||||||||||||||||||
| Control Investments | ||||||||||||||||||||||||||||||||||||||
| FSFR Glick JV LLC | Multi-sector holdings | |||||||||||||||||||||||||||||||||||||
| Subordinated Note, LIBOR+8% cash due 10/20/2021 | 8.47% | $ | 64,005,755 | $ | — | $ | (6,627,858 | ) | $ | 5,065,350 | $ | 52,603,346 | $ | 10,910,158 | $ | (6,627,858 | ) | $ | 56,885,646 | 17.5% | ||||||||||||||||||
| 87.5% LLC equity interest (5) | — | 648,071 | 2,712,500 | 4,553,575 | 4,902,020 | (3,024,574 | ) | 6,431,021 | 2.0% | |||||||||||||||||||||||||||||
| Total Control Investments | $ | 64,005,755 | $ | — | $ | (5,979,787 | ) | $ | 7,777,850 | $ | 57,156,921 | $ | 15,812,178 | $ | (9,652,432 | ) | $ | 63,316,667 | 19.4% | |||||||||||||||||||
| Affiliate Investments | ||||||||||||||||||||||||||||||||||||||
| Ameritox Ltd. | Healthcare services | |||||||||||||||||||||||||||||||||||||
| First Lien Term Loan, LIBOR+5% (1% floor) cash 3% PIK due 4/11/2021 | 6.00% | $ | 6,387,128 | $ | — | $ | (38,546 | ) | $ | 279,587 | $ | — | $ | 6,402,868 | $ | (60,582 | ) | $ | 6,342,286 | 1.9% | ||||||||||||||||||
| 3,309,873.6 Class A Preferred Units | — | 316,276 | — | — | 3,626,150 | — | 3,626,150 | 1.1% | ||||||||||||||||||||||||||||||
| 327,393.6 Class B Preferred Units | — | 31,285 | — | — | 358,679 | — | 358,679 | 0.1% | ||||||||||||||||||||||||||||||
| 1,007.36 Class A Units | — | (3,256,355 | ) | — | — | 5,935,698 | (3,256,355 | ) | 2,679,343 | 0.8% | ||||||||||||||||||||||||||||
| Total Affiliate Investments | $ | 6,387,128 | $ | — | $ | (2,947,340 | ) | $ | 279,587 | $ | — | $ | 16,323,395 | $ | (3,316,937 | ) | $ | 13,006,458 | 4.0% | |||||||||||||||||||
| Total Control & Affiliate Investments | $ | 70,392,883 | $ | — | $ | (8,927,127 | ) | $ | 8,057,437 | $ | 57,156,921 | $ | 32,135,573 | $ | (12,969,369 | ) | $ | 76,323,125 | 23.4% | |||||||||||||||||||
This schedule should be read in connection with the Company's Consolidated Financial Statements, including the Consolidated Schedules of Investments and Notes to the Consolidated Financial Statements.
______________________
(1)The principal amount and ownership detail are shown in the Consolidated Schedules of Investments.
(2)Represents the total amount of interest (net of non-accrual amounts), fees and dividends credited to income for the portion of the period an investment was included in the Control or Affiliate categories.
(3)Gross additions include increases in the cost basis of investments resulting from new portfolio investments, follow-on investments and accrued PIK interest (net of non-accrual amounts), and the exchange of one or more existing securities for one or more new securities. Gross additions also include net increases in unrealized appreciation or net decreases in unrealized depreciation as well as the movement of an existing portfolio company into this category or out of a different category.
(4)Gross reductions include decreases in the cost basis of investment resulting from principal payments or sales and exchanges of one or more existing securities for one or more new securities. Gross reductions also include net increases in unrealized depreciation or net decreases in unrealized appreciation as well as the movement of an existing portfolio company out of this category and into a different category.
(5)Together with GF Equity Funding, the Company co-invests through the OCSI Glick JV. The OCSI Glick JV is capitalized as transactions are completed and all portfolio and investment decisions in respect to the OCSI Glick JV must be approved by the OCSI Glick JV investment committee consisting of representatives of the Company and GF Equity Funding (with approval from a representative of each required).
133
Item 9. Changes in and Disagreements with Accountants on Accounting and Financial Disclosure
Not applicable.
Item 9A. Controls and Procedures
Management, with the participation of the Company’sour Chief Executive Officer and Chief Financial Officer, evaluated the effectiveness of our disclosure controls and procedures as of September 30, 2017.2020. The term “disclosure controls and procedures,” as defined in Rules 13a-15(e) and 15d-15(e) under the Securities Exchange Act of 1934, as amended, (the “Exchange Act”),or the Exchange Act, means controls and other procedures of a company that are designed to ensure that information required to be disclosed by a company in the reports that it files or submits under the Exchange Act is recorded, processed, summarized and reported, within the time periods specified in the SEC’sSecurities and Exchange Commission’s rules and forms. Disclosure controls and procedures include, without limitation, controls and procedures designed to ensure that information required to be disclosed by a company in the reports that it files or submits under the Exchange Act is accumulated and communicated to the company’s management, including its chief executive officer and chief financial officer, as appropriate to allow timely decisions regarding required disclosure. Management recognizes that any controls and procedures, no matter how well designed and operated, can provide only reasonable assurance of achieving their objectives. Based on the evaluation of our disclosure controls and procedures as of September 30, 2017, our2020, the Chief Executive Officer and Chief Financial Officer concluded that as a result of the material weakness in internal control over financial reporting that is described below, our disclosure controls and procedures were not effective.effective, at the reasonable assurance level, in timely identifying, recording, processing, summarizing and reporting any material information relating to us that is required to be disclosed in the reports we file or submit under the Exchange Act.
(b) Management's Report on Internal Control Over Financial Reporting
Management is responsible for establishing and maintaining adequate internal control over financial reporting, as such term is defined in Exchange Act Rules 13a-15(f) and 15d-15(f). under the Exchange Act. A company’s internal control over financial reporting is a process designed by, or under the supervision of, its chief executive officer and chief financial officer, and effected by such company's boardBoard of directors,Directors, management and other personnel to provide reasonable assurance regarding the reliability of financial reporting and the preparation of financial statements for external purposes in accordance with GAAP and includes those policies and procedures that:
(i) pertain to the maintenance of records that, in reasonable detail, accurately and fairly reflect the transactions and dispositions of the assets of the company;
(ii) provide reasonable assurance that transactions are recorded as necessary to permit preparation of financial statements in accordance with generally accepted accounting principles, and that receipts and expenditures of the company are being made only in accordance with authorizations of management and directors of the company; and
(iii) provide reasonable assurance regarding prevention or timely detection of unauthorized acquisition, use, or disposition of the company’s assets that could have a material effect on the financial statements.
Because of its inherent limitations, internal control over financial reporting may not prevent or detect misstatements. Also, projections of any evaluation of effectiveness to future periods are subject to the risk that controls may become inadequate because of changes in conditions, or that the degree of compliance with the policies or procedures may deteriorate.
Management, with the participation of our Chief Executive Officer and Chief Financial Officer, has conducted an evaluation of the effectiveness of our internal control over financial reporting as of September 30, 2017,2020, based on the framework set forth in Internal Control-Integrated Framework (2013) issued by the Committee of Sponsoring Organizations of the Treadway Commission (COSO). A material weakness is a deficiency, or a combination of deficiencies, inBased on our evaluation, management concluded that our internal control over financial reporting such that there is a reasonable possibility that a material misstatement of a company's annual or interim financial statements will not be prevented or detected on a timely basis.
134
(c) Remediation of Material Weaknesses in Internal Control Over Financial Reporting
There were no changes in our internal control over financial reporting that occurred during the fourth fiscal quarter of 2017ended September 30, 2020 that have materially affected, or are reasonably likely to materially affect, our internal control over financial reporting.
Item 9B. Other Information
None.
135
PART III
Item 10. Directors, Executive Officers and Corporate Governance
The information required by Item 10 is hereby incorporated by reference from our definitive Proxy Statement relating to our 20182021 Annual Meeting of Stockholders, to be filed with the Securities and Exchange Commission within 120 days following the end of our fiscal year.
Item 11. Executive Compensation
The information required by Item 11 is hereby incorporated by reference from our definitive Proxy Statement relating to our 20182021 Annual Meeting of Stockholders, to be filed with the Securities and Exchange Commission within 120 days following the end of our fiscal year.
Item 12. Security Ownership of Certain Beneficial Owners and Management and Related Stockholder Matters
The information required by Item 12 is hereby incorporated by reference from our definitive Proxy Statement relating to our 20182021 Annual Meeting of Stockholders, to be filed with the Securities and Exchange Commission within 120 days following the end of our fiscal year.
Item 13. Certain Relationships and Related Transactions, and Director Independence
The information required by Item 13 is hereby incorporated by reference from our definitive Proxy Statement relating to our 20182021 Annual Meeting of Stockholders, to be filed with the Securities and Exchange Commission within 120 days following the end of our fiscal year.
Item 14. Principal Accountant Fees and Services
The information required by Item 14 is hereby incorporated by reference from our definitive Proxy Statement relating to our 20182021 Annual Meeting of Stockholders, to be filed with the Securities and Exchange Commission within 120 days following the end of our fiscal year.
PART IV
Item 15. Exhibits and Financial Statement Schedules
The following documents are filed or incorporated by reference as part of this Annual Report:
1. Consolidated Financial Statements
| Report of Independent Registered Public Accounting Firm | |||||
| Consolidated Statements of Assets and Liabilities as of September 30, | |||||
| Consolidated Statements of Operations for the Years Ended September 30, | |||||
| Consolidated Statements of Changes in Net Assets for the Years Ended September 30, | |||||
| Consolidated Statements of Cash Flows for the Years Ended September 30, | |||||
| Consolidated Schedule of Investments as of September 30, | |||||
| Consolidated Schedule of Investments as of September 30, | |||||
| Notes to Consolidated Financial Statements | |||||
2. Financial Statement Schedule
The following financial statement schedule is filed herewith:
| Schedule 12-14 — Investments in and advances to affiliates | |||||
3. Exhibits required to be filed by Item 601 of Regulation S-K
The following exhibits are filed as part of this report or hereby incorporated by reference to exhibits previously filed with the SEC:
| Agreement and Plan of Merger among the Registrant, Oaktree Specialty Lending Corporation, Lion Merger Sub, Inc. and Oaktree Fund Advisors LLC (for the limited purposes set forth therein), dated as of October 28, 2020 (Incorporated by reference to Exhibit 2.1 filed with the Registrant’s Current Report on Form 8-K (File No. 814-01013) filed on October 29, 2020). | ||||||||
| Amended and Restated Certificate of Incorporation of the Registrant (Incorporated by reference to Exhibit a filed with the Registrant’s Registration Statement on Form N-2 (File No. 333-188904) filed on July 8, 2013). | ||||||||
| Certificate of Amendment to the Amended and Restated Certificate of Incorporation of the | ||||||||
| Amended and Restated Bylaws of the Registrant (Incorporated by reference to Exhibit 3.1 filed with the Registrant’s Current Report on Form 8-K (File No. 814-01013) filed on | ||||||||
| Form of Common Stock Certificate (Incorporated by reference to Exhibit d filed with the Registrant’s Registration Statement on Form N-2 (File No. 333-188904) filed on July 8, 2013). | ||||||||
| Dividend Reinvestment Plan (Incorporated by reference to Exhibit e filed with the Registrant’s Registration Statement on Form N-2 (File No. 333-188904) filed on July 8, 2013). | ||||||||
| Investment Advisory Agreement, dated as of | ||||||||
| Form of Custody Agreement (Incorporated by reference to Exhibit j filed with the Registrant’s Registration Statement on Form N-2 (File No. 333-188904) filed on July 8, 2013). | ||||||||
| Administration Agreement, dated as of | ||||||||
137
| Loan Sale Agreement by and between Registrant and FS Senior Funding II LLC, dated as of January 15, 2015 (Incorporated by reference to Exhibit 10.2 filed with the Registrant’s Current Report on Form 8-K (File No. 814-01013) filed on January 21, 2015). | ||||||||
| First Amendment to the Amended and Restated Loan and Security Agreement by and among the Registrant, as collateral manager, OCSI Senior Funding II LLC, as borrower, and Citibank, N.A., as administrative agent and sole lender, dated as of May 14, 2018 (Incorporated by reference to Exhibit 10.1 filed with the Registrant’s Current Report on Form 8-K (File No. 814-01013) filed on May 16, 2018). | ||||||||
| Second Amendment to the Amended and Restated Loan and Security Agreement by and among Registrant, as collateral manager, OCSI Senior Funding II LLC, as borrower, and Citibank, N.A., as administrative agent and sole lender, dated as of July 18, 2018 (Incorporated by reference to Exhibit 10.1 filed with the Registrant’s Current Report on Form 8-K (File No. 814-01013) filed on July 19, 2018). | ||||||||
| Third Amendment to the Amended and Restated Loan and Security Agreement by and among Registrant, as collateral manager, OCSI Senior Funding II LLC, as borrower, and Citibank, N.A., as administrative agent and sole lender, dated as of September 17, 2018 (Incorporated by reference to Exhibit 10.15 filed with the Registrant’s Annual Report on Form 10-K (File No. 814-01013) filed on November 29, 2018). | ||||||||
| Amendment No. 1 to Loan Financing and Servicing Agreement, dated as of March 13, 2019, among OCSI Senior Funding Ltd., as borrower, Registrant, as servicer, and Deutsche Bank AG, New York Branch as facility agent and as committed lender (Incorporated by reference to Exhibit 10.1 filed with the Registrant’s Quarterly Report on Form 10-Q (File No. | ||||||||
| Amendment No. | ||||||||
| Amendment No. 3 to Loan Financing and Servicing Agreement, dated as of September 20, 2019, among OCSI Senior Funding Ltd., as borrower, Registrant, as servicer, and Deutsche Bank AG, New York Branch as facility agent and as committed lender (Incorporated by reference to Exhibit 10.18 filed with the Registrant's Form 10-K (File No. 814-01013) filed on November 19, 2019). | ||||||||
| Amendment No. 4 to Loan Financing and Servicing Agreement, dated as of March 22, 2020, among OCSI Senior Funding Ltd., as | ||||||||
| Amendment No. 5 to Loan Financing and Servicing Agreement, dated as of July 8, 2020, among OCSI Senior Funding Ltd., as borrower, the Company, as servicer, and Deutsche Bank AG, New York Branch as facility agent and as committed lender. | ||||||||
| Amendment No. 6 to Loan Financing and Servicing Agreement, dated as of September 29, 2020, among OCSI Senior Funding Ltd., as borrower, the Company, as servicer, and Deutsche Bank AG, New York Branch as facility agent and as committed lender. | ||||||||
| Fifth Amendment to the Amended and Restated Loan and Security Agreement | ||||||||
138
| Joint Code of Ethics of the Registrant, | ||||||||
| Code of Ethics of Oaktree | ||||||||
| Fund Advisors, LLC (Incorporated by reference to Exhibit 14.2 filed with the Registrant's Annual Report on Form 10-K (File No. 814-01013) filed on December 8, 2017). | ||||||||
| 21 | Subsidiaries of Registrant and jurisdiction of incorporation/organizations: OCSI Senior Funding II LLC - Delaware OCSI Senior Funding Ltd. - Cayman Islands | |||||||
| Consent of Registered Public Accounting Firm | ||||||||
| Power of Attorney (included on the signature page hereto). | ||||||||
| Certification of Chief Executive Officer Pursuant to Rule 13a-14(a) under the Securities Exchange Act of 1934. | ||||||||
| Certification of Chief Financial Officer Pursuant to Rule 13a-14(a) under the Securities Exchange Act of 1934. | ||||||||
| Certification of Chief Executive Officer Pursuant to Section 906 of the Sarbanes-Oxley Act of 2002 (18 U.S.C. 1350). | ||||||||
| Certification of Chief Financial Officer Pursuant to Section 906 of the Sarbanes-Oxley Act of 2002 (18 U.S.C. 1350). | ||||||||
| * | Filed herewith. | ||||
| ^ | Exhibits and schedules to Exhibit 2.1 have been omitted in accordance with Item 601 of Regulation S-K. The registrant agrees to furnish supplementally a copy of all omitted exhibits and schedules to the SEC upon its request. | ||||
139
SIGNATURES
Pursuant to the requirements of Section 13 or 15(d) of the Securities Exchange Act of 1934, the registrant has duly caused this report to be signed on its behalf by the undersigned, thereunto duly authorized.
| OAKTREE STRATEGIC INCOME CORPORATION | ||||||||
| By: | /s/ | |||||||
| Chief Executive Officer | ||||||||
| By: | /s/ Mel Carlisle | |||||||
Mel Carlisle | ||||||||
| Chief Financial Officer and Treasurer | ||||||||
Date: December 8, 2017November 18, 2020
POWER OF ATTORNEY
KNOW ALL MEN BY THESE PRESENTS, that each person whose signature appears below hereby constitutes and appoints Edgar Lee,Armen Panossian, Mel Carlisle and Mathew Pendo, and each of them (with full power to each of them to act alone), his true and lawful attorneys-in-fact and agents, with full power of substitution and re-substitution, for him and on his behalf and in his name, place and stead, in any and all capacities, to sign, execute and file this Annual Report on Form 10-K for the fiscal year ended September 30, 2017,2020, and any or all amendments to this Report, with all exhibits and any and all documents required to be filed with respect thereto, with the Securities and Exchange Commission or any other regulatory authority, granting unto such attorneys-in-fact and agents, and each of them, full power and authority to do and perform each and every act and thing appropriate or necessary to be done in order to effectuate the same, as fully to all intents and purposes as he himself might or could do in person, hereby ratifying and confirming all that such attorneys-in-fact and agents, or any of them, or their or his or her substitute or substitutes, may lawfully do or cause to be done by virtue hereof.
Pursuant to the requirements of the Securities Exchange Act of 1934, this report has been signed below by the following persons on behalf of the registrant and in the capacities and on the dates indicated.
140
| Signature | Title | Date | ||||||||||||
/s/ | Chief Executive Officer (principal executive officer) | |||||||||||||
/s/ MEL CARLISLE Mel Carlisle | Chief Financial Officer and Treasurer (principal financial officer and principal accounting officer) | |||||||||||||
/s/ JOHN B. FRANK John B. Frank | Director | |||||||||||||
/s/ | Director | |||||||||||||
/s/ CRAIG JACOBSON Craig Jacobson | Director | |||||||||||||
/s/ RICHARD G. RUBEN Richard G. Ruben | Director | |||||||||||||
/s/ BRUCE ZIMMERMAN Bruce Zimmerman | Director | |||||||||||||
141