UNITED STATES
SECURITIES AND EXCHANGE COMMISSION
Washington, D.C. 20549
FORM 10-K
|
| | | | |
X☒ | ANNUAL REPORT PURSUANT TO SECTION 13 OR 15(d) OF THE SECURITIES EXCHANGE ACT OF 1934 |
For the fiscal year ended December 31, 20172021
or
|
| | | | |
—☐ | TRANSITION REPORT PURSUANT TO SECTION 13 OR 15(d) OF THE SECURITIES EXCHANGE ACT OF 1934 |
For the transition period from to
Commission File No. 001-35971
ALLEGION PUBLIC LIMITED COMPANY
(Exact name of registrant as specified in its charter)charter)
|
| | | | | | | |
| Ireland | | 98-1108930 |
| (State or other jurisdiction of incorporation or organization) | | (I.R.S. Employer
Identification No.)
|
Block D
Iveagh Court
Harcourt Road
Dublin 2, D02 VH94, Ireland
(Address of principal executive offices)offices, including zip code)
+(353) (1) 2546200
(Registrant’s telephone number, including area code: +(353) (1) 2546200code)
Securities registered pursuant to Section 12(b) of the Act:
|
| | | | | | | |
| Title of each class | Trading symbols | Name of each exchange on which registered |
Ordinary Shares,shares, par value $0.01 per share | ALLE | New York Stock Exchange |
Par Value $0.01 per Share3.500% Senior Notes due 2029 | ALLE 3 ½ | New York Stock Exchange |
Securities registered pursuant to Section 12(g) of the Act: None
Indicate by check mark if the registrant is a well-known seasoned issuer, as defined in Rule 405 of the Securities Act. YES Yes x NO No ¨
Indicate by check mark if the registrant is not required to file reports pursuant to Section 13 or Section 15(d) of the Act. YES Yes ¨ NO No x
Indicate by check mark whether the registrant (1) has filed all reports required to be filed by Section 13 or 15(d) of the Securities Exchange Act of 1934 during the preceding 12 months (or for such shorter period that the registrant was required to file such reports), and (2) has been subject to such filing requirements for the past 90 days. YES Yes x NO No ¨
Indicate by check mark whether the registrant has submitted electronically and posted on its corporate Web site, if any, every Interactive Data File required to be submitted and posted pursuant to Rule 405 of Regulation S-T (§232.405 of this chapter) during the preceding 12 months (or for such shorter period that the registrant was required to submit and post such files). YES Yes x NO No ¨
Indicate by check mark if disclosure of delinquent filers pursuant to Item 405 of Regulation S-K (§229.405 of this chapter) is not contained herein, and will not be contained, to the best of registrant’s knowledge, in definitive proxy or information statements incorporated by reference in Part III of this Form 10-K or any amendment to this Form 10-K. YES x NO ¨
Indicate by check mark whether the registrant is a large accelerated filer, an accelerated filer, a non-accelerated filer, or a smaller reporting company, or an emerging growth company. See the definitions of "large accelerated filer," "accelerated filer"filer," "smaller reporting company," and "smaller reporting"emerging growth company" in Rule 12b-2 of the Exchange Act.:
| | | | | | | | | | | |
| Large accelerated filer | ☒ | Accelerated filer | ☐ |
| | | |
Large accelerated filer | x | Accelerated filer | ¨
|
| | | |
| Non-accelerated filer | ¨
☐ | Smaller reporting company | ¨
☐ |
(Do not check if a smaller reporting company) | | | |
| | Emerging growth company | ¨
☐ |
If an emerging growth company, indicate by check mark if the registrant has elected not to use the extended transition period for complying with any new or revised financial accounting standards provided pursuant to Section 13(a) of the Exchange Act. ¨☐
Indicate by check mark whether the registrant has filed a report on and attestation to its management’s assessment of the effectiveness of its internal control over financial reporting under Section 404(b) of the Sarbanes-Oxley Act (15 U.S.C. 7262(b)) by the registered public accounting firm that prepared or issued its audit report. ☒
Indicate by check mark whether the registrant is a shell company (as defined in Rule 12b-2 of the Act). YES ¨ NO x
Yes ☐ No ☒
The aggregate market value of ordinary shares held by non-affiliates on June 30, 20172021 was approximately $7.7$12.5 billion based on the closing price of such stock on the New York Stock Exchange.
The number of ordinary shares outstanding of Allegion plc as of February 16, 201810, 2022 was 95,185,418.88,230,442.
DOCUMENTS INCORPORATED BY REFERENCE
Portions of the registrant’s definitive proxy statement to be filed within 120 days of the close of the registrant’s fiscal year in connection with the registrant’s Annual General Meeting of Shareholders to be held June 5, 20182, 2022 (the "Proxy Statement") are incorporated by reference into Part II and Part III of this Form 10-K.10-K as described herein.
ALLEGION PLC
Form 10-K
For the Fiscal Year Ended December 31, 20172021
TABLE OF CONTENTS
| | | | | | | | | | | |
| | | Page |
| Part I | Item 1. | | |
| | | |
| | | Page |
Part I | Item 1.1A. | | |
| | | |
| Item 1A.1B. | | |
| | | |
| Item 1B. | | |
| | | |
| Item 2. | | |
| | | |
| Item 3. | | |
| | | |
| Item 4. | | |
| | | |
| Part II | Item 5. | | |
| | | |
| Item 6. | | |
| | | |
| Item 7. | | |
| | | |
| Item 7A. | | |
| | | |
| Item 8. | | |
| | | |
| Item 9. | | |
| | | |
| Item 9A. | | |
| | | |
| Item 9B. | | |
| | | |
| Item 9C. | | |
| | | |
| Part III | Item 10. | | |
| | | |
| Item 11. | | |
| | | |
| Item 12. | | |
| | | |
| Item 13. | | |
| | | |
| Item 14. | | |
| | | |
| Part IV | Item 15. | | |
| | | |
| Item 16. | | |
| | | |
| | | |
CAUTIONARY STATEMENT FOR FORWARD LOOKING STATEMENTS
Certain statements in this report, other than purely historical information, are "forward-looking statements" within the meaning of the Private Securities Litigation Reform Act of 1995, Section 27A of the Securities Act of 1933 and Section 21E of the Securities Exchange Act of 1934. These forward-looking statements generally are identified by the words "believe," "project," "expect," "anticipate," "estimate," "forecast," "outlook," "intend," "strategy," "future", "opportunity", "plan," "may," "should," "will," "would," "will be," "will continue," "will likely result," or the negative thereof or variations thereon or similar terminologyexpressions generally intended to identify forward-looking statements.
Forward-looking statements may relate to such matters asas: statements regarding the continued impacts of the global COVID-19 pandemic, supply chain constraints, electronic component and labor shortages, inflation, rising freight and material costs, projections of revenue, margins, expenses, tax provisions, earnings, cash flows, benefit obligations, dividends, share purchases or other financial items; any statements of the plans, strategies and objectives of management for future operations, including those relating to any statements concerning expected development, performance or market share relating to our products and services; any statements regarding future economic conditions or our performance; any statements regarding pending investigations, claims or disputes; any statements of expectation or belief; and any statements of assumptions underlying any of the foregoing. These statements are based on currently available information and our current assumptions, expectations and projections about future events. While we believe that our assumptions, expectations and projections are reasonable in view of the currently available information, you are cautioned not to place undue reliance on our forward-looking statements. You are advised to review any further disclosures we make on related subjects in materials we file with or furnish to the SEC.United States Securities and Exchange Commission ("SEC"). Forward-looking statements speak only as of the date they are made and are not guarantees of future performance. They are subject to future events, risks and uncertainties -– many of which are beyond our control -– as well as potentially inaccurate assumptions, that could cause actual results to differ materially from our expectations and projections. We do not undertake to update any forward-looking statements.
Factors that might affect our forward-looking statements include, among other things:
•adverse impacts to our business operations due to the global COVID-19 pandemic and our ability to predict the full extent of such impacts;
•competitive factors in the industry in which we compete, including technological developments and increased competition from private label brands;
•the development, commercialization and acceptance of new products and services that meet the varied and evolving needs of our customers;
•the demand for our products and services, including changes in customer and consumer preferences, and our ability to maintain beneficial relationships with large customers;
•our products or solutions fail to meet certification and specification requirements, are defective or otherwise fall short of customers’ needs and expectations;
•the ability to complete and integrate any acquisitions and/or losses related to our investments in external companies;
•business opportunities that diverge from our core business;
•our ability to operate efficiently and productively;
•our ability to effectively manage and implement restructuring initiatives or other organizational changes;
•the effects of global climate change or other unexpected events, including global health crises, that may disrupt our operations;
•our ability to manage risks related to our information technology and operational technology systems and cybersecurity, including implementation of new processes that may cause disruptions and be more difficult, costly or time consuming than expected;
•our reliance on third-party vendors for many of the critical elements of our global information and operational technology infrastructure and their failure to provide effective support for such infrastructure;
•disruption and breaches of our information systems;
•ability to recruit and retain a highly qualified and diverse workforce;
•disruptions in our global supply chain, including supply chain constraints, electronic component and labor shortages and product manufacturing and logistical services provided by our supplier partners;
•availability of and increased inflation impacting the prices of raw materials, parts and components, freight, packaging, labor and energy;
•economic, political and business conditions in the markets in which we operate;operate, including changes to trade agreements, sanctions, import and export regulations and custom duties;
•conditions of the demand for our productsinstitutional, commercial and services;residential construction and remodeling markets, including the impact of work-from-home trends;
competitive factors in the industry in which we compete;
the ability to protect and use intellectual property;
•fluctuations in currency exchange rates;
the ability to complete and integrate any acquisitions;•potential impairment of our goodwill, indefinite-lived intangible assets and/or our long-lived assets;
our ability to operate efficiently and productively;
our ability to manage risks related to our information technology and cyber-security;
changes in tax requirements (including tax rate changes, new tax laws and revised tax law interpretations);
the outcome of any litigation, governmental investigations or proceedings;
•interest rate fluctuations and other changes in borrowing costs;costs, in addition to risks associated with our outstanding and future indebtedness;
•the impact our outstanding indebtedness may have on our business and operations and other capital market conditions, including availability of funding sources and currency exchange rate fluctuations;
availability•risks related to corporate social responsibility and reputational matters;
•the ability to protect our brand reputation and trademarks;
•the outcome of and fluctuations in the pricesany litigation, governmental investigations or proceedings;
•claims of key commodities and the impactinfringement of higher energy prices;intellectual property rights by third parties;
potential further impairment•adverse publicity or improper conduct by any of our goodwill, indefinite-lived intangible assets and/employees, agents or business partners;
•changes to, or changes in interpretations of, current laws and regulations;
•uncertainty and inherent subjectivity related to transfer pricing regulations;
•changes in tax requirements, including tax rate changes, the adoption of new tax legislation or exposure to additional tax liabilities and revised tax law interpretations; and
•risks related to our long-lived assets;
incorporation in Ireland, including the possible effects on us of future legislation or interpretations in the U.S. that may limit or eliminate potential U.S. tax benefits resulting from our incorporation in a non-U.S. jurisdiction, such as Ireland, or deny U.S. government contracts to us based upon our incorporation in such non-U.S. jurisdiction; and
the impact our outstanding indebtedness may have on our business and operations.jurisdiction.
Some of the significant risks and uncertainties that could cause actual results to differ materially from our expectations and projections are described more fully in Item 1A1A. "Risk Factors." You should read that information in conjunction with "Management's Discussion and Analysis of Financial Condition and Results of Operations" in Item 7 of this report and our Consolidated Financial Statements and related notes in Item 8 of this report. We note such information for investors as permitted by the Private Securities Litigation Reform Act of 1995.
PART I
Item 1.BUSINESS
Overview
Allegion plc ("Allegion," "we," "us" or "the Company") is a leading global provider of security products and solutions that keep people and assets safe and secure and productive. We make the world safer as a company of experts, securingin the places where people thrive,they reside, work and wethrive. We create peace of mind by pioneering safety and security.security with a vision of seamless access and a safer world. Seamless access allows authorized, automated and safe passage and movement through spaces and places in the most efficient and frictionless manner possible. Central to our vision is partnering and developing ecosystems to create a flawless experience and enable an uninterrupted and secure flow of people and assets. We offer an extensive and versatile portfolio of mechanicalsecurity and electronic securityaccess control products and solutions across a range of market-leading brands. Our experts across the globe deliver high-quality security products, services and systems, and we use our deep expertise to serve as trusted partners to end-users who seek customized solutions to their security needs.
|
| | | | |
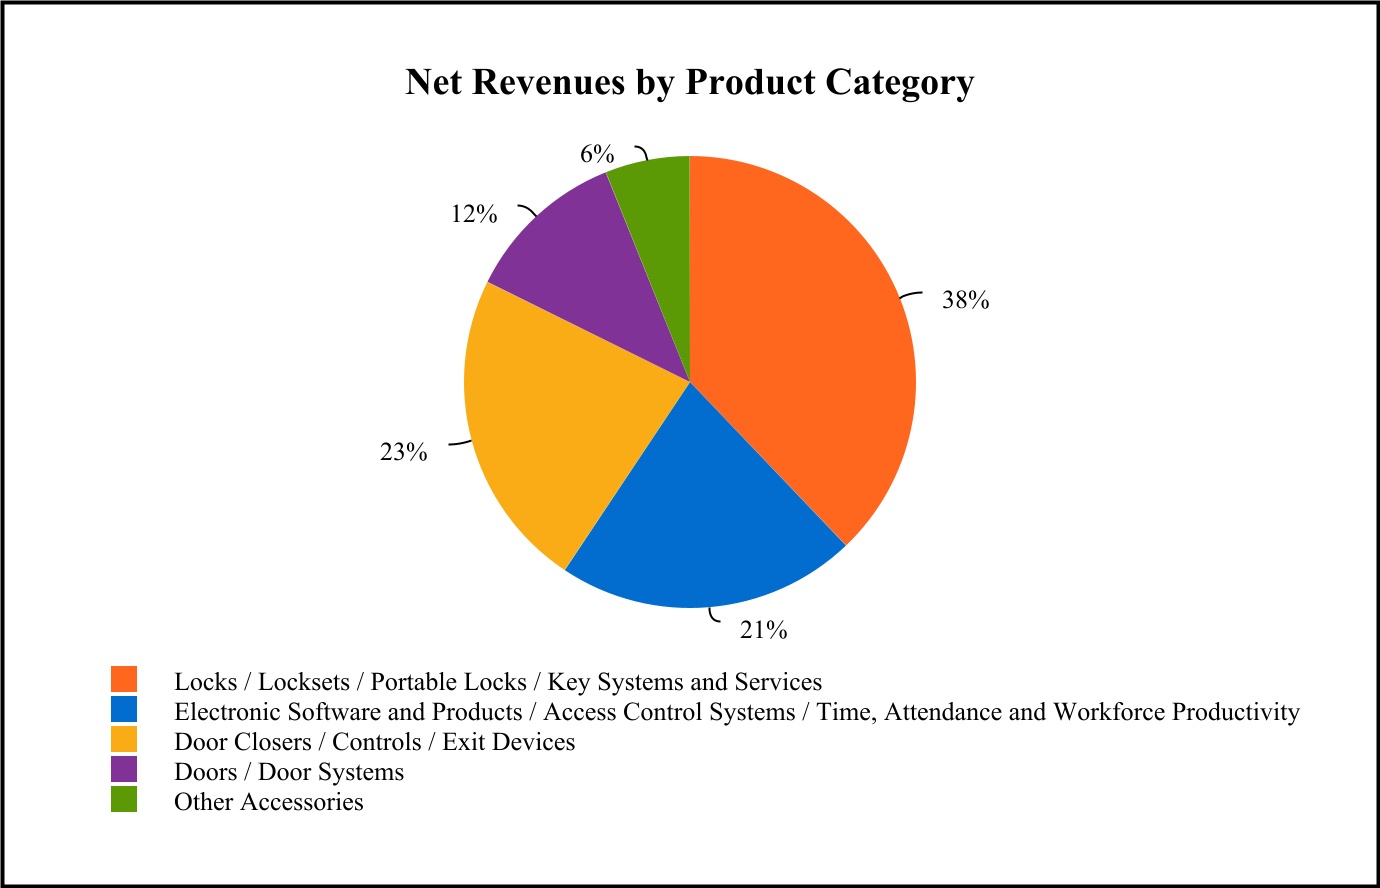
| Allegion Principal Products |
| Door closers and controls | Doors and door systems |
| Electronic security products | Electronic and biometricSoftware-enabled access control systems |
| Exit devices | Locks, locksets, portable locks, and key systems and services |
| Time, attendance and workforce productivity systems | Other accessories |
Access control security products and solutions are critical elements in every building and home. Many door openings are configured to maximize a room’s particular form and function while also meeting local and national building and safety code requirements and end-user security needs. Most buildings have multiple door openings, each serving its own purpose and requiring different specific access-controlaccess control solutions. Each door must fit exactly within its frame, be prepared precisely for its hinges, synchronize with its specific lockset and corresponding latch and align with a specific key to secure the door. Moreover, with the increasing adoption of the Internet of Things ("IoT"), security products – including keys – are increasingly linked electronically, integrated into software and popular consumer technology platforms and controlled with mobile applications, creating additional functionality and complexity. Seamless access capitalizes on the ability for multiple products and brands to work in tandem, allowing people and assets to move efficiently and safely by adapting access rights for various settings or use cases. These solutions can also provide insights on usage and traffic patterns to improve hygiene of high-traffic areas, boost efficiency and improve visitor, staff and tenant experiences.
We believe our ability to deliver a wide range of solutions that can be custom-configuredcustom configured to meet end-users’ security needs is a key driver of our success. We accomplish this with:
•Our extensive and versatile product portfolio, combined with our deep expertise, which enables us to deliver the right products and solutions to meet diverse security and functional specifications;specifications and to successfully and securely integrate into leading technology and systems;
•Our consultative approach and expertise, which enables us to develop the most efficient and appropriate building security and access-controlaccess control specifications to fulfill the unique needs of our end-users and their partners, including architects, contractors, home-buildershomebuilders and engineers;
•Our access to and management of key channels in the market, which is critical to delivering our products in an efficient and consistent manner; and
•Our enterprise excellence capabilities, including our global manufacturing operations and agile supply chain, which facilitate our ability to deliver specific product and system configurations to end-users and consumers worldwide, quickly and efficiently.
We believe that the security products industry is growing and will continue to benefit from several global macroeconomic and long-term demographic trends, including:
stabilization of construction markets in key North American markets;
the convergence of mechanical and electronic security products;
heightened awareness of security requirements;
increased global urbanization; and
the shift to a digital, interconnected environment.
We believe the security products industry will also benefit from continuedseveral global macroeconomic trends, including:
•Expected growth in institutional, commercial, and residential end-markets. We also expect growth in the global electronic product categories we serve to outperform the security products industry as end-users adopt newer technologies in their facilities.facilities and homes;
•Heightened awareness of security and privacy requirements;
•Increased focus on touchless solutions that help promote a healthy environment; and
•The shift to a digital, interconnected environment.
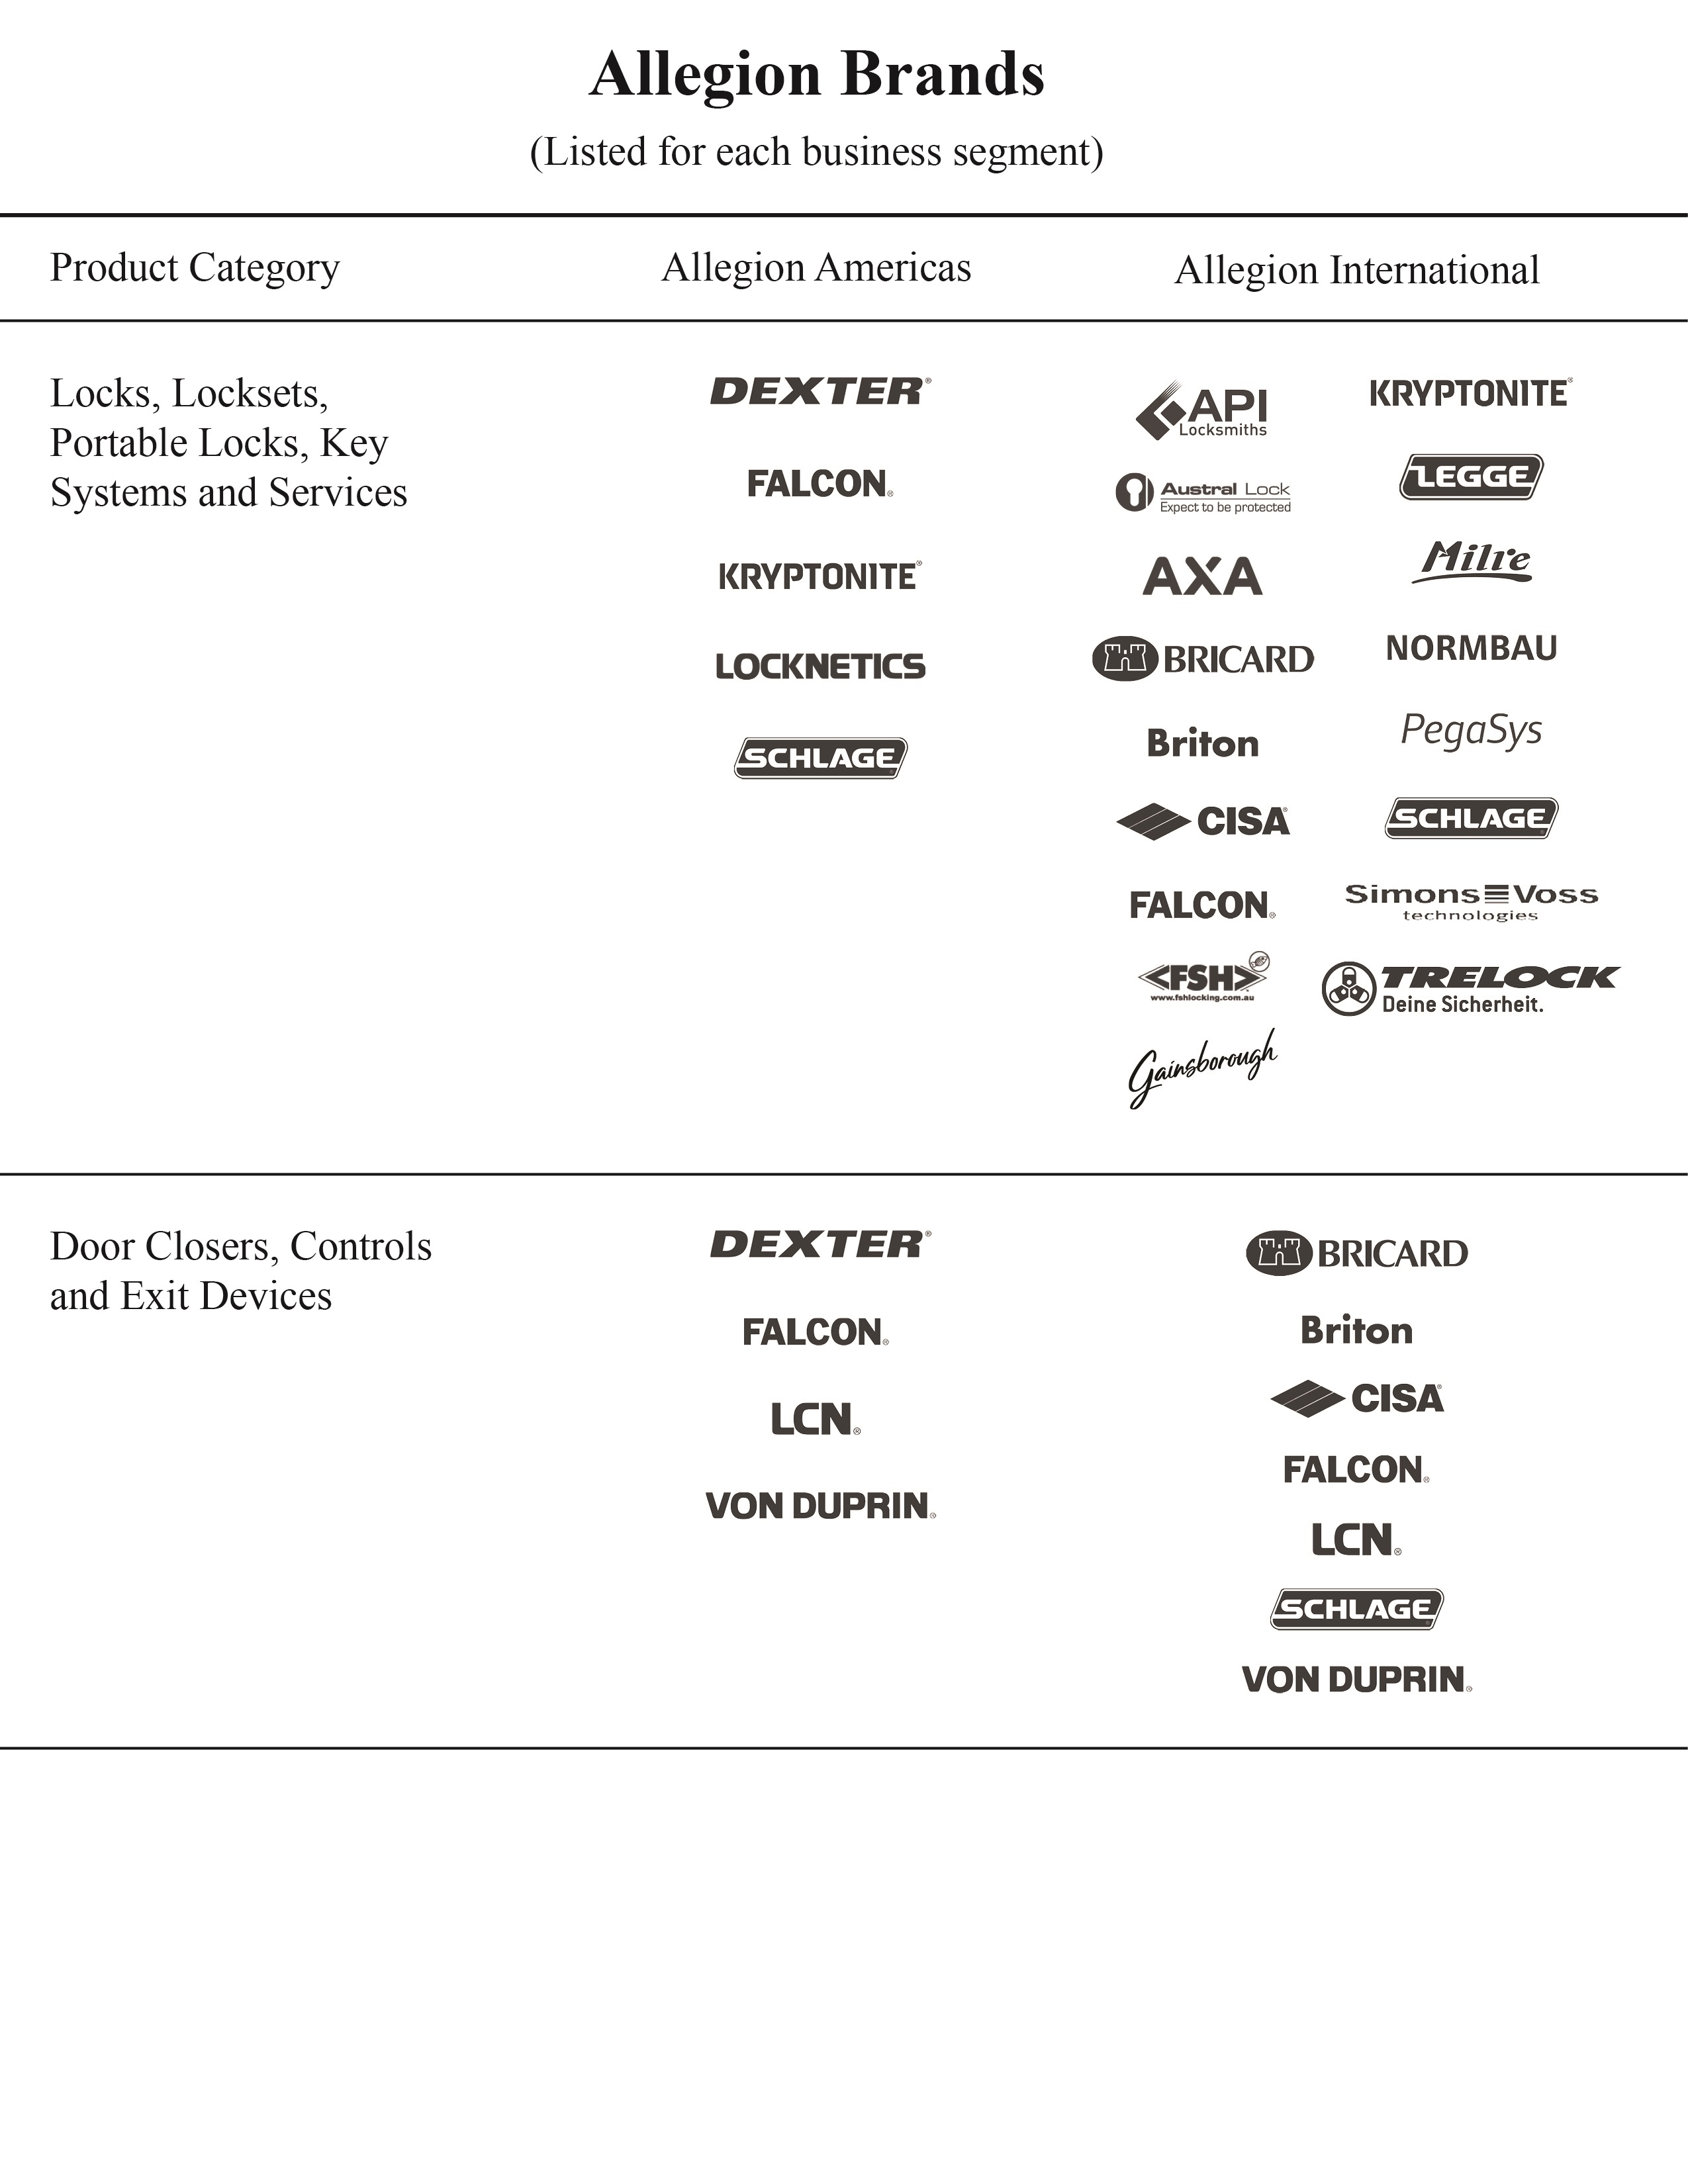
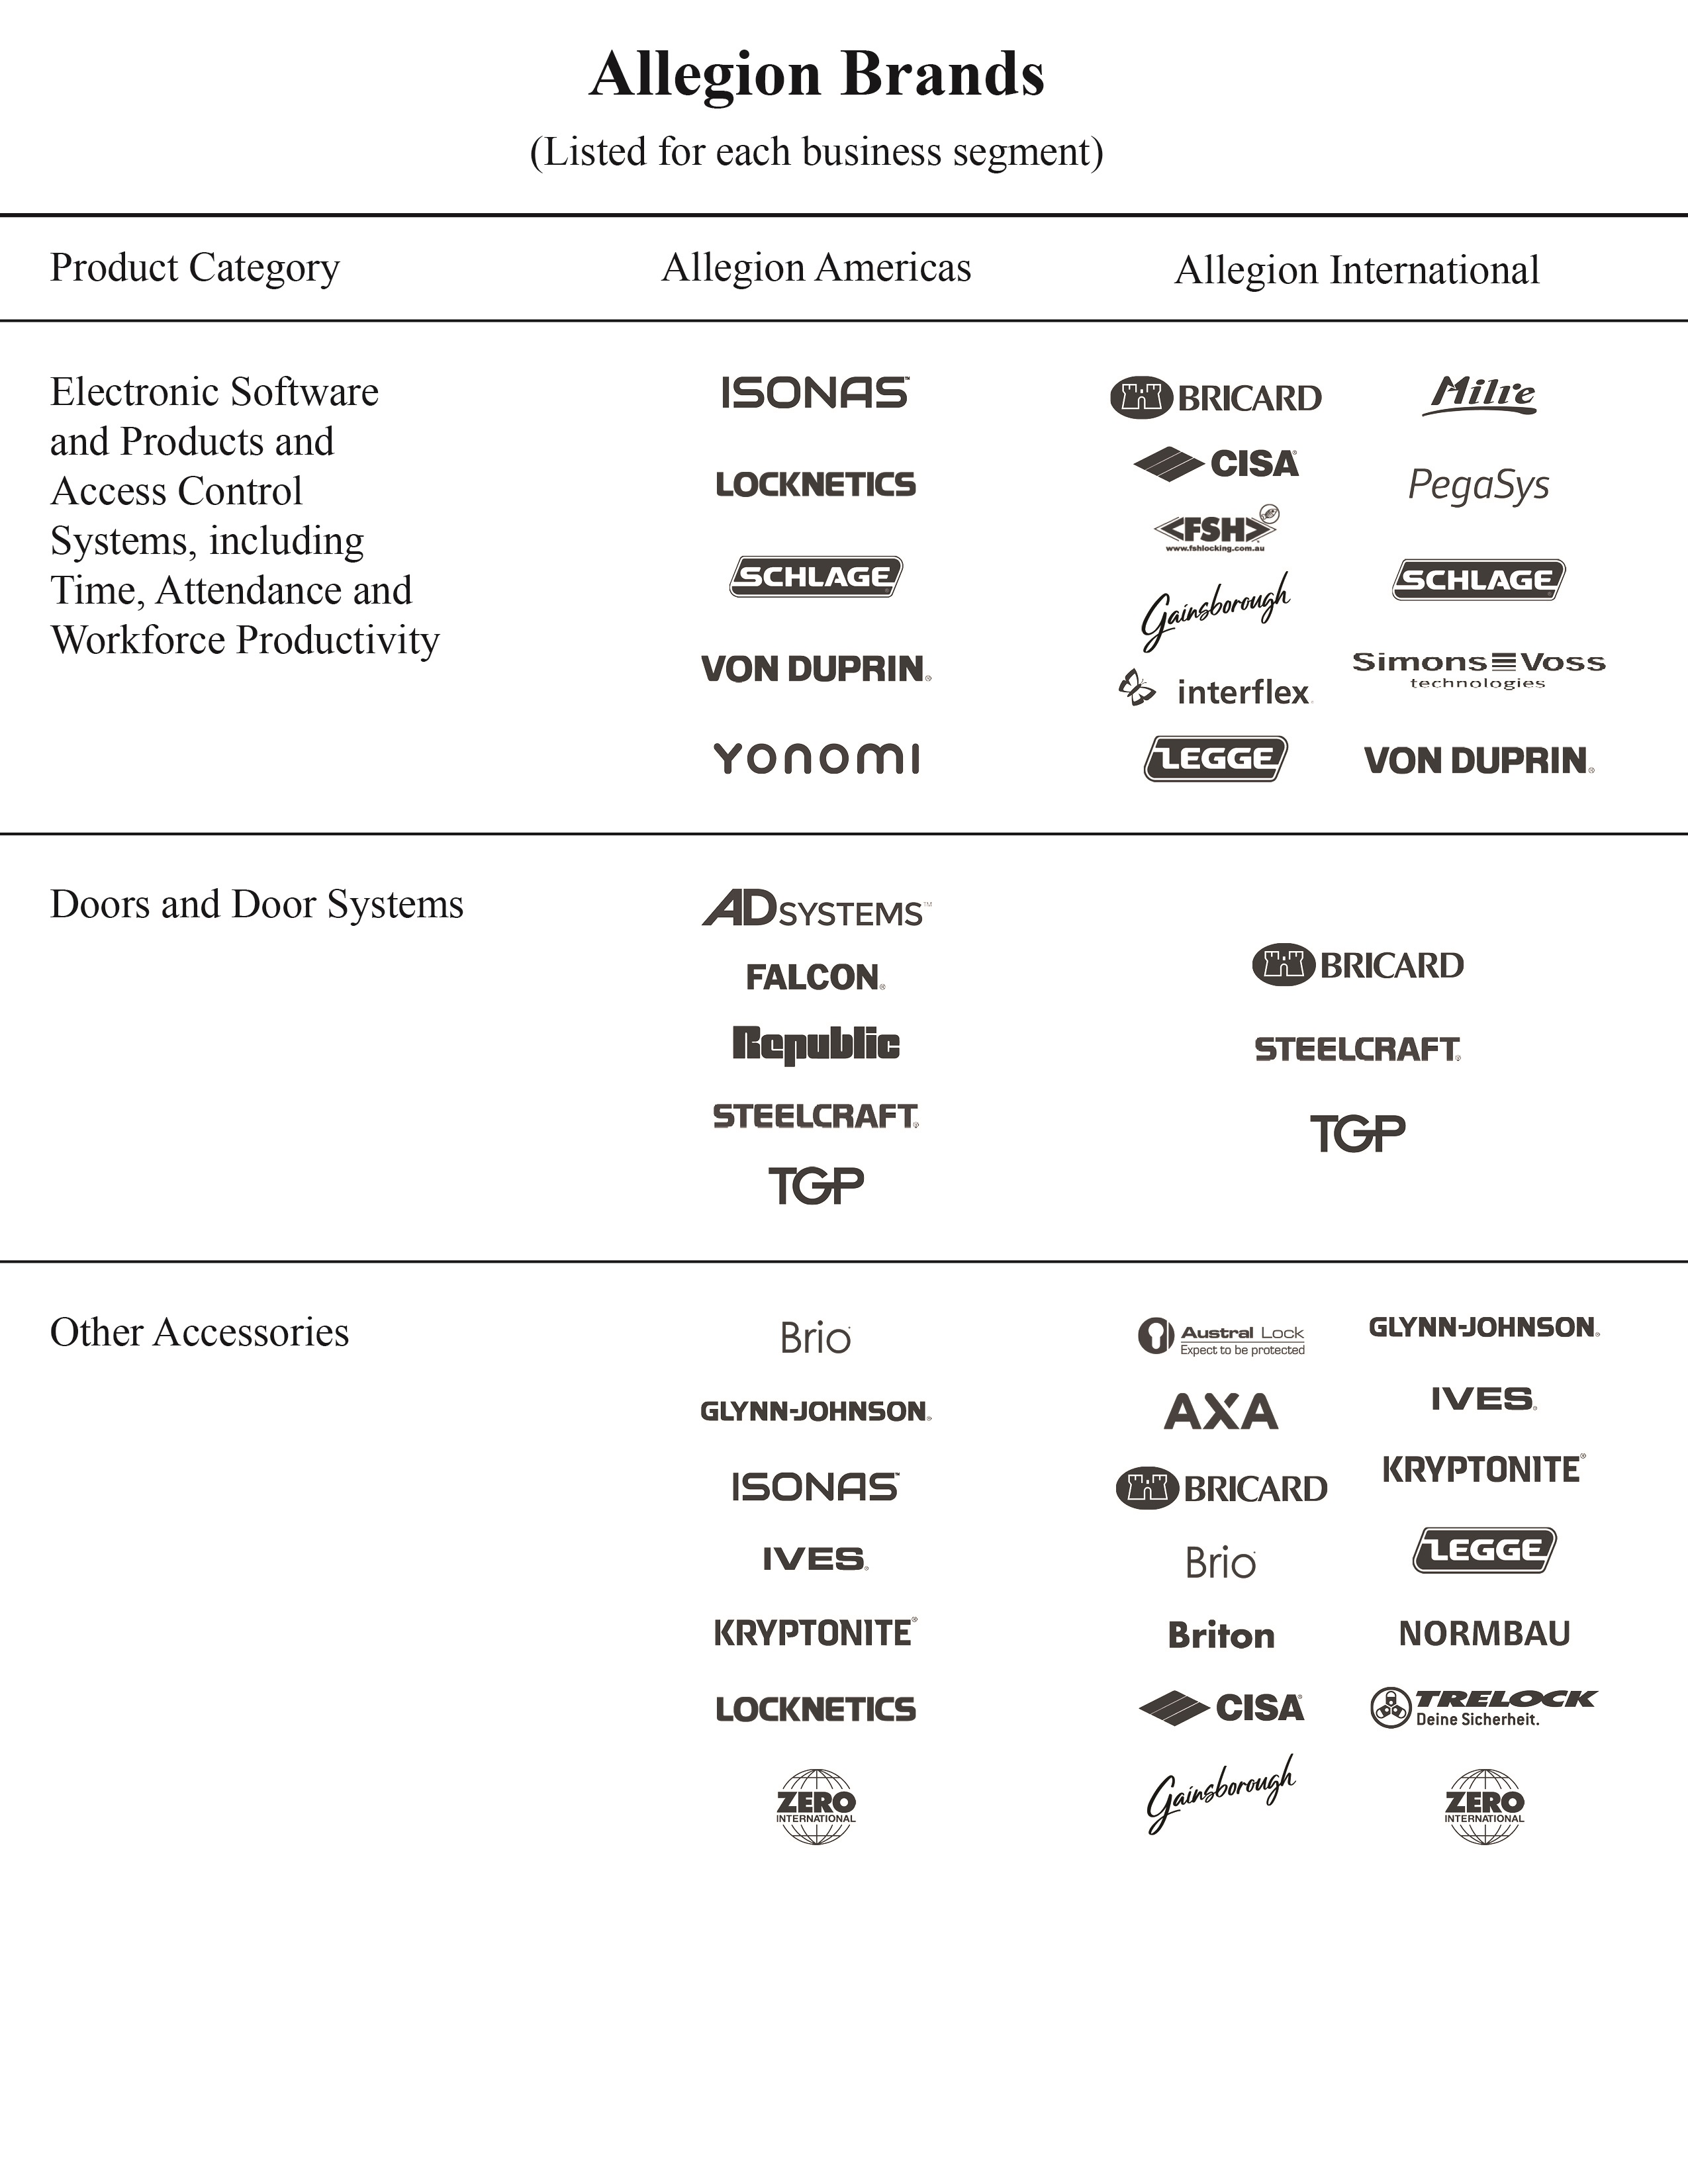
We operate in three geographic regions: Americas;and report financial results for two segments: Allegion Americas and Allegion International, the latter of which provides security products, services and solutions primarily throughout Europe, Middle East, IndiaAsia and Africa ("EMEIA"); and Asia Pacific.Oceania. We sell our products and solutions under the following brands:
|
| | | |
Allegion Brands |
(listed for each region) |
|
We sell a wide range of security products and access control solutions for end-users in commercial, institutional and residential facilities worldwide, including into the education, healthcare, government, hospitality, commercial office and single and multi-family residential markets. Our corporateleading brands areinclude CISA®, Interflex®, LCN®, Schlage®, SimonsVoss®, and Von Duprin®. We believe LCN, Schlage and Von Duprin hold the No. 1 or No. 2 position in their primary product categories in North America andwhile CISA, Interflex and SimonVossSimonsVoss hold the No.1No. 1 or No. 2 position in their primary product categories in certain European markets.
ForDuring the year ended December 31, 2017,2021, we generated Net revenues of $2,408.2$2,867.4 million and operatingOperating income of $488.2$530.2 million.
History and Developments
We were incorporated in Ireland on May 9, 2013, to hold the commercial and residential security businesses of what was then Ingersoll Rand plc ("Ingersoll Rand"). On December 1, 2013, we became a stand-alone public company after Ingersoll Rand completed the separation of these businesses from the rest of Ingersoll Rand via the transfer of these businesses from Ingersoll Rand to us and the issuance by us of ordinary shares directly to Ingersoll Rand’s shareholders (the "Spin-off"). Our security businesses have long and distinguished operating histories. Several of our brands were established more than 75100 years ago, and many of our brands originally created their categories:
•Von Duprin, established in 1908, was awarded the first exit device patent;
•Schlage, established in 1920, was awarded the first patents granted for the cylindrical lock and the push button lock;
•LCN, established in 1926, created the first door closer;
•CISA, established in 1926, devised the first electronically controlled lock; and
•SimonsVoss, established in 1995, created the first keyless digital transponder.
We have built upon these founding legacies since our entry into the security products market through the acquisition of Schlage, Von Duprin and LCN in 1974. Today, we continue to develop and introduce innovative and market-leading products. For example, in 2018, we announced the formation of Allegion Ventures, a corporate venture fund with an initial allocation of $50 million to invest in and help accelerate the growth of companies that have innovative, digital-first technologies and products such as touchless access and workspace monitoring solutions that complement our core business solutions. Building on this success, in December 2021, Allegion Ventures announced a second fund with an additional allocation of $100 million to focus on investing in technologies like artificial intelligence, machine learning and cybersecurity.
Recent examples of successful product launches by Allegion are illustrated in the table below:
|
| | | | | | | | | | | | | | | | | | | |
| Product | | Brands | | Year | | Innovation |
| Residential Locks, Cylinders and Levers | | Schlage Touch, Connect, Sense, Control, SEL, Custom | | 2015/2016/ 2017 | | New singleSchlage, Gainsborough,
CISA | | 2019/2020/ 2021 | | Schlage Primus® RP patented, restricted key systems, allowing the widely used, historic Schlage Obverse keyway family a path to Primus levels of security with patent coverage to 2029.
Next generation smart lock (Schlage Encode) is joined by one in Australia (Gainsborough Freestyle Trilock), which has passage, privacy or dead lock modes that can be operated using the built-in keypad, a key override or through the mobile app and multi-family residential electronic locking platforms that provide for keyless entry (Touch), connected locking (Connect), integrationoffers integrations with the Internet of Things (IoT) and Apple HomeKit, Amazon Alexa and Google AssistantAssistant. The optional WiFi bridge can be used to program and Android platforms (Sense), multi-family interconnected locking (Control), 4-in-1 locks, fingerprint sensors,operate the lock from anywhere in the world.
New flat key European cylinders for multiple entrance buildings (CISA Asix P8) and smart card or code access (SEL)high security connected solutions (CISA Domo Connexa).
A new range with universal functionality (Custom) allows homeowners to change from a doorknob to a lever and convert a non-locking door to lockable in minutes.
|
| Commercial Locks, Cylinders, Levers and Electronic Access Platforms | | Schlage, SimonsVoss, CISA SimonsVoss | | 2015/2016/ 20172019/2020/2021 | | Access control platforms and proximityRelease of mobile-enabled versions of locks, readers and smartcontrollers (Schlage NDE, LE, MTB and CTE), mobile credentials, upgradedBluetooth Low Energy ("BLE") and RFID technology and integrations between electronic locks and exit devices (Schlage, CISA). RC reader controller combines powerful ISONAS PureIP technology together with intelligent hardware (Schlage Mobile Access Solutions). New Digital Cylinder AX (SimonsVoss) supports active transponders, Mifare badges and BLE, a further step towards digitizing the door through the keyhole.
Mortice self-locking system with a mono-point motorized lock variant (CISA) and new platformed, modular replacement of cylindrical locks (Schlage ALX). New multipoint exit mortice self-locking system for improved strengthpanic exit doors with narrow profile (CISA).
Enhanced access control solutions for low-to-medium complexity applications offers a complete portfolio of IP and durability (Schlage)mobile-enabled devices across a variety of popular applications and openings (Schlage, ISONAS, Locknetics, Von Duprin, and Falcon). Comprehensive offerings featuring |
| Exit Devices and Closers | | LCN | | 2020/2021 | | New low-energy automatic operator (LCN 6400 Compact series), retrofit solution with actuators reduces the cost and complexity of touchless access and ADA accessibility, converting the popular LCN 4040XP mechanical wired electrifiedcloser and powered by a simple wall plug or an external power supply. Follows the introduction of a range of touchless solutions, including automatic operators, actuators and wireless electronic solutions for common aesthetic and consistent user experience throughout a building. Wireless locks able to be managed with ENGAGE™ web and mobile apps or with our Software Alliance Member (SAM) systems (Schlage LE and NDE).
Multipoint locking line (CISA) designed for high security European applications, correcting for heat distortion. MobileKey (SimonsVoss) provides facility managers highly secure and sophisticated access control with mobile phone technology.
transmitters. |
ClosersDoors and Door Systems | | LCN, Briton, CISA, ITO KilitTGP | | 2015/2016/ 20172021 | | Cast Aluminum Series closers (LCN) were specially designedNorth America's first fire-rated Full-Lite Door System, certified to deliver consistent, dependable and long-term performance.
New closers (Briton, CISA, ITO Kilit) significantly expanded the European standard portfolio in 2017, offering affordable quality and specialty applications.
meet forced entry standards (TGP ASTM E2395). |
Exit Devices | | Von Duprin, CISA | | 2016/2017 | | Concealed vertical cables (Von Duprin) give doors aesthetics, strength and security in an exit device system that is easy to install and maintain.
e-Fast motorized push bars (CISA) now include lighting features.
|
| Bike Lighting and Portable Locking Solutions | | AXA, Kryptonite, Trelock | | 20172019/2020/2021 | | Innovation in bike safety and security from each of our Global Portable Security brands (AXA, Kryptonite, Trelock); and Trelock), ranging from compact dynamo lightsnew ergonomic cable and e-bike lightschain locks (AXA). |
| Software, Mobile and Web Applications | | Schlage, CISA, Gainsborough | | 2019/2020/2021 | | Mobile apps for iOS and Android phones (Schlage, CISA, Gainsborough) lock, unlock, issue mobile keys and give status checks. Schlage Mobile Student ID allows university students, faculty and staff to USBadd student ID cards to Apple Wallet or Google Pay for door access, payments, attendance tracking and battery powered lights, as well as new lines of folding locks, integrated chains and electronic ring locksticketing). App and mobile applicationssolution (CISA Smart Access) allows guests to use their smartphone like a room key and also start a WhatsApp chat with the front desk with a single click, creating guest experiences beyond security and safety.
Cloud access management software (CISA AERO) expands with a new open software interface for bikes and motorcycles.property management systems. |
| | | | | | |
Industry and Competition
The global markets we serve encompass institutional, commercial institutional and residential construction and remodeling markets throughout North America, Europe, the Middle EastAsia and Asia-Pacific. In recent years, growth in electronic security products and solutions continues to outperform the industry as a whole as end-users adopt newer technologies in their facilities.Oceania. We expect the security products industry will continue to benefit from favorable long-term demographic trends such as continued urbanization of the global population, increased concerns about safety and security, new attention on touchless solutions that help promote a healthy environment and technology-driven innovation.innovation that enables seamless access and a better user experience as people and assets traverse multiple locations and facilities. Further, we also expect continued growth in connected security products and solutions as end-users continue to adopt newer technologies, including IoT, in their facilities and single and multi-family homes.
The security products markets are highly competitive and fragmented throughout the world, with a number of large multi-national companies and thousands of smaller regional and local companies. This high fragmentation primarily reflects local regulatory requirements and highly variable end-user needs. We believe our principal global competitors are Assa Abloy AB and dorma+kabadormakaba Group. We also face competition in various markets and product categories throughout the world, including from Spectrum Brands Holdings, Inc. in the North American residential market. As we move into more technologically-advancedtechnologically advanced product categories, we may also compete against new, more specialized competitors.
Our success depends on a variety of factors, including brand and reputation, product breadth, innovation, integration with popular technology platforms, quality and delivery capabilities, price and service capabilities. As many of our businesses sell through wholesale distribution, our success also depends on building and partnering with a strong channel network. Although price often serves as an important customer decision criterion,point, we also compete based on the breadth, innovation and quality of our products and solutions, our ability to custom-configure solutions to meet individual end-user requirements and our global supply chain.
Our Reporting Segments
We manufacture and sell mechanical and electronic security products and solutions in approximately 130 countries. Approximately 96% of our 2017 revenues were to customers in the North America, Western Europe and the Asia-Pacific regions.
The following table presents the relative percentages of total segment revenue attributable to each reporting segment for each of the last three fiscal years. See Note 20, "Business Segment Information," to our annual consolidated financial statements for information regarding net revenues, operating income, and total assets by reportable segment:
|
| | | | | |
| | For the Years Ended December 31 |
| | 2017 | | 2016 | | 2015 |
| Americas | 73% | | 74% | | 75% |
| EMEIA | 22% | | 21% | | 19% |
| Asia Pacific | 5% | | 5% | | 6% |
Our Americas segment provides security products and solutions in approximately 30 countries throughout North America, Central America, the Caribbean and South America. The segment offers a broad range of products and solutions including locks, locksets, portable locks, key systems, door closers, exit devices, doors and door systems, electronic products, and access control and time and attendance systems to end-users in the commercial, institutional and residential markets, including into the education, healthcare, government, commercial office and single and multi-family residential markets. This segment’s primary brands are LCN, Schlage, and Von Duprin.
Our EMEIA segment provides security products and solutions in approximately 85 countries throughout Europe, the Middle East, India and Africa. The segment offers the same portfolio of products as the Americas segment, as well as workforce productivity solutions. This segment’s primary brands are AXA, Bricard, CISA, Interflex and SimonsVoss. This segment also resells North American LCN, Schlage, and Von Duprin products, primarily in the Middle East.
Our Asia Pacific segment provides security products and solutions in approximately 15 countries throughout Asia Pacific. The segment offers the same portfolio of products as the Americas segment. This segment’s primary brands are Brio, FSH, Legge, Milre, and Schlage.
Products and Services
We offer an extensive and versatile portfolio of mechanicalsecurity and electronic securityaccess control products and solutions across a range of market-leading brands:
•Locks, locksets, portable locks and key systems and services: A broad array of cylindrical and mortise door locksets, security levers and master key systems that are used to protect and control access. We also offeraccess and a range of portable security products, including bicycle, small vehicle and travel locks.
We also offer locksmith services in select locations;•Door closers, controls and exit devices: An extensive portfolio of life-safety products and solutions generally installed on fire doors and facility entrances and exits. Door controls include both mechanical door closers are devices that automatically close doors after they are opened.and automatic door operators. Exit devices, are generally horizontal attachmentsalso known as panic hardware, provide rapid egress to doors and enable rapid egress.
allow building occupants to exit safely in an emergency;•Electronic security products and access control systems, including software solutions: A broad range of electrified locks, access control systems, biometric hand reader systems, key card and reader systems and accessories, including Internet of Things (IoT)IoT, BLE, Power over Ethernet and cloud-based solutions.
solutions;•Time, attendance and workforce productivity systems: Products and services designed to help business customers manage and monitor workforce access control parameters, attendance and employee scheduling. We also offer ongoing aftermarket services in addition to design and installation offerings.
offerings;•Doors and door systems: A portfolio of hollow metal, glass wood, and specialty doors and door systems.
systems; and•Other accessories: A variety of additional security and product components, including hinges, door levers,pulls, door stops, bike lights, louvers, weather stripping, thresholds and other accessories, as well as certain bathroom fittings.
fittings and accessibility aids.
Customers
We sell most of our products and solutions through distribution and retail channels, ranging fromincluding specialty distribution, toe-commerce and wholesalers. We have built a network of channel partners that help our customers choose the right solution to meet their security needs and help commercial and institutional end-users fulfill and install orders. We also sell through a variety of retail channels, ranging fromincluding large do-it-yourself home improvement centers, tomultiple online and e-commerce platforms, as well as small, specialty showroom outlets. We work with our retail partners on developing marketing and merchandising strategies to maximize their sales per square foot of shelf space. Through a few of our businesses, such as Interflex business and our Global Portable Security brands, we also provide products and solutionsservices directly to end-users.
Our 10 largest customers represented approximately 25% of our total Net revenues in 2017.2021. No single customer represented 10% or more of our total Net revenues in 2017.2021.
Sales and Marketing
In markets where we sell through commercial and institutional distribution channels, we employ sales professionals around the world who work with a combination of end-users, security professionals, architects, contractors, engineers and distribution partners to develop specific, custom-configured solutions for our end-users’ needs. Our field sales professionals are assisted by specification writers who work with architects, engineers and consultants to help design door openings and security systems to meet end-users’ functional, aesthetic and regulatory requirements. Both groups are supported by dedicated customer care and technical sales-support specialists worldwide. We also support our sales efforts with a variety of marketing efforts, including trade-specific advertising, cooperative distributor merchandising, digital marketing and marketing at a variety of industry trade shows.
In markets in which we sell through retail and home-builder distribution channels, we have teams of sales, merchandising and marketing professionals who help drive brand and product awareness through our channel partners and to consumers. We utilize a variety of advertising and marketing strategies, including traditional consumer media, retail merchandising, digital marketing, retail promotions and builder and consumer trade shows, to support these teams.
We also work actively with several industry bodies around the world to help promote effective and consistent safety and security standards. For example, we are members of Builders Hardware Manufacturers Association (BHMA), Connectivity Standards Alliance, Construction Specification Institute, Door and Hardware Institute (DHI), FiRa Consortium, Partner Alliance for Safer Schools (PASS), Physical Security Interoperability Alliance (PSIA), Security Industry Association, Smart CardSecurity Technology Alliance, American SocietyZ-Wave Alliance, The European Federation of Healthcare Engineering, American InstituteAssociations of Architects, Construction Specification Institute,Locks and Builders Hardware Manufacturers (ARGE), ASSOFERMA (Italy), BHE (Germany) and UNIQ (France). We also have established the Safety and Security Institute in China, which helps to educate government officials, architects and builders and advocates for consistent building codes and standards that address end-users’ safety and security.
Production and Distribution
We manufacture our products in our geographic markets around the world. We operate 3129 principal production and assembly facilities including– 14 in theour Allegion Americas region, 12segment and 15 in EMEIA and 5 in Asia Pacific.our Allegion International segment. We own 15 of these facilities and lease the others. Our
strategy is to produce in the region of use, wherever appropriate, to allow us to be closer to the end-user and increase efficiency and timely product delivery. Much of our United States (U.S.)U.S. based residential portfolio is manufactured in the Baja Regionregion of Mexico under a NAFTA Maquiladora.
the Maquiladora, Manufacturing and Export Services Industry ("IMMEX") program. In managing our network of production and assembly facilities, we focus on eliminating excess capacity, reducing cycle time through productivity, and harmonizing production practicescontinuous improvement in customer experience, employee health and safety, procedures.productivity, resource utilization and operational excellence.
We distribute our products through a broad network of channel partners. In addition, third-party manufacturing and logistics providers perform certain manufacturing, storage and distribution services for us to support certain parts of our manufacturing and distribution network.
Raw Materials
We support our region-of-use production strategy with corresponding region-of-use supplier partners, where available. Our global and regional commodity teams work with production leadership, product management and materials management teams to ensure adequateprocure materials are available for production. Where appropriate, we may enter into fixed-cost contracts to lower overall costs.
We purchase a wide range of raw materials, including steel, zinc, brass and other non-ferrous metals, as well as other parts and components, such as electronic components, to support our production facilities. Where appropriate,During 2021, especially in the second half of the year, we may enter into fixed-cost contractsexperienced an acceleration of several macroeconomic challenges, including supply chain disruptions and delays; shortages in materials, including reductions in allocations of electronic components and other parts from key suppliers; and increased material and other inflation. These trends had a negative impact on our results of operations in 2021, and while we currently anticipate these challenges to lower overall costs.continue in 2022, we are rapidly adapting to navigate these challenges. See "Part II, Item 7. Management’s Discussion and Analysis of Financial Condition and Results of Operations" for a more detailed discussion of these trends and challenges.
Intellectual Property
Intellectual property, inclusive of certain patents, trademarks, copyrights, know-how, trade secrets and other proprietary rights, is important to our business. We create, protect and enforce our intellectual property investments in a variety of ways. We work actively in the U.S. and internationally to try to ensure the protection and enforcement of our intellectual property rights. We use trademarks on nearly all of our products and believe that such distinctive marks are an important factor in creating a market for our goods, in identifying us and in distinguishing our products from others. We consider our CISA, Interflex, LCN, Schlage,
SimonsVoss, Von Duprin LCN, CISA, SimonsVoss, Interflex and other associated trademarks to be among our most valuable assets, and we have registered these trademarks in a number of countries. Although certain proprietary intellectual property rights are important to our success, we do not believe we are materially dependent on any particular patent or license, or any particular group of patents or licenses.
Facilities
We operate through a broad network of sales offices, engineering centers, 3129 principal production and assembly facilities and several distribution centers throughout the world. Our active properties represent approximately 7.06.3million square feet, of which approximately 47%40%is leased.
The following table shows the location of our principal worldwide production and assembly facilities:
|
| | | | | | | |
| Production and Assembly Facilities |
| Allegion Americas | | EMEIA | | Asia PacificAllegion International |
| Blue Ash, Ohio | | Clamecy, France | | Auckland, New Zealand |
Bogota, ColombiaChino, California | | Dubai, United Arab EmiratesBrooklyn, Australia |
| Ensenada, Mexico | | Blackburn, Australia |
| Everett, Washington | | Bucheon, South Korea |
Chino, CaliforniaIndianapolis, Indiana | | Durchhausen, Germany | | Jinshan, ChinaClamecy, France |
Ensenada, MexicoIrving, Texas | | Duzce, Turkey | | Melbourne, AustraliaDurchhausen, Germany |
Indianapolis, IndianaMcKenzie, Tennessee | | Faenza, Italy | | Sydney, Australia |
Irving, TexasMississauga, Ontario | | Feuquieres, France | | |
McKenzie, TennesseePerrysburg, Ohio | | Monsampolo, Italy | | Jinshan, China |
Perrysburg, OhioPrinceton, Illinois | | Muenster, Germany | | Monsampolo, Italy |
Princeton, IllinoisSecurity, Colorado | | Osterfeld, Germany | | |
Security, ColoradoSnoqualmie, Washington | | Renchen, Germany | | |
Snoqualmie, WashingtonTecate, Mexico | | Siewierz, Poland | | Sydney, Australia |
Tecate,Tijuana, Mexico | | Veenendaal, Netherlands | | |
Tijuana, Mexico | | | | |
Toronto, Ontario | | | | Zawiercie, Poland |
Research and Development
We are committed to investing in highly productiveour research and development capabilities particularly in electro-mechanical systems. Our research and development ("R&D") expenditures were approximately $48.3 million, $47.3 million and $45.2 million for the years ended December 31, 2017, 2016 and 2015, respectively.
We concentratewith a focus on developing technology innovations that will deliver growth through the introduction of new products and solutions, and also on driving continuoussolutions. In addition, we invest in initiatives that continuously drive improvements in product cost, quality, safety and sustainability.
We manage our R&DOur research and development team is managed as a global, group with an emphasis on a global collaborative approachgroup to identify and develop new technologies and worldwide product platforms. We are organized on a regional basis toOur regionally located resources leverage expertise in local standards and configurations. In additionconfigurations and apply those to regional engineering centers in each geographic region,adapt products for the benefit of our customers. Further, we also operate a global engineeringtechnology center of excellence in Bangalore, India.India, which augments and supports the regional engineering teams.
Seasonality
Our business experiences seasonality that varies by product line. Because more construction and do-it-yourself projects occur during the second and third calendar quarters of each year in the Northern Hemisphere, our security product sales related to those projects are typically are higher in those quarters than in the first and fourth calendar quarters. However, our Interflex businesscertain other businesses typically experiencesexperience higher sales in the fourth calendar quarter due to project timing. RevenueIn 2020, we experienced lower sales volumes during the second quarter, principally due to the economic challenges stemming from the COVID-19 pandemic; however, this is not anticipated to be a long-term trend in the seasonality of our businesses. Net revenues by quarter for the years ended December 31, 2017, 20162021, 2020 and 2015 are2019, were as follows:
| | | | | | | | | | | | | | | | | | | | | | | | | | |
| | First Quarter | | Second Quarter | | Third Quarter | | Fourth Quarter |
| 2021 | | 24% | | 26% | | 25% | | 25% |
| 2020 | | 25% | | 21% | | 27% | | 27% |
| 2019 | | 23% | | 26% | | 26% | | 25% |
|
| | | | |
| First Quarter | Second Quarter | Third Quarter | Fourth Quarter |
| 2017 | 23% | 26% | 25% | 26% |
| 2016 | 22% | 26% | 26% | 26% |
| 2015 | 22% | 25% | 26% | 27% |
EmployeesThe Company’s human capital strategy is based on our values and is foundational to achieving our business strategy. To ensure we attract and retain top talent, we strive for a diverse and inclusive culture that rewards performance, provides growth and development opportunities and supports employees and their families through competitive compensation, benefits and numerous volunteer and charitable giving opportunities.
As of December 31, 2021, we had approximately 11,000 employees around the world, the vast majority working full time. Our employee base is supplemented by contingent labor where demand fluctuates or we experience short-term needs for specialized skills.
Compensation and Benefits
Compensation and benefit programs are tailored to be competitive in the geographies where we work, including the total package (which varies by country/region) that includes hourly and salaried compensation, performance incentive and equity plans, retirement, insurance and government social welfare programs, disability and family leave, education benefits to pursue degrees and certifications and additional offerings to support financial stability and personal planning. Health and wellness programs are provided globally and contribute to a productive, sustainable workforce by empowering our employees to take personal responsibility for their health, safety and well-being. In addition, we maintain tobacco-free facilities and pursue strategies to incentivize healthy behaviors and outcome-driven rewards. Pay for performance strategies consider not only accomplishments, but how individuals achieve results. The Allegion Leadership Behaviors – be a pioneer, break boundaries, coach, champion change, be courageous and inspire – are used to identify key talent and to train and develop aspiring leaders. They also work in concert with our performance management system to reinforce our values and code of conduct in assessing how people lead and deliver top performance.
Talent Attraction
Our employer brand strength creates a differentiated employee experience that attracts and retains the right talent for Allegion, both now and in the future. Talent attraction efforts are focused on our unique employee value proposition and highlight a culture that reflects our core values and business objectives. These efforts begin well before people walk in our doors and begin to work for us. Around the world, our sites partner with schools and support teachers, providing mentoring, grants, scholarships, internships, co-op programs, classroom technology and on-site activities and full-time rotational programs after graduation. Our sites sponsor science, technology, engineering and math ("STEM") programs and robotics and engineering competitions. In the U.S., we also host an annual Manufacturing Day event at several of our production and assembly facilities. These programs expose students to careers in manufacturing and technology and provide educators with programming to encourage academic excellence and social development while building a pipeline of talent for Allegion.
Talent attraction efforts go beyond emerging talent strategies to span core capabilities that enable the business to run, grow and transform. Key capabilities have been identified for our long-term corporate business strategy: talent, customer focus, innovation, partnering, pace and agility and collaboration. We use a variety of recruitment tactics to ensure a strong base of labor for manufacturing operations and to build the base of talent with these capabilities. Throughout the process, there is a focus on driving a technology-enabled seamless experience for internal and external candidates and hiring managers throughout the recruitment cycle. These talent attraction efforts are complemented with a total reward framework, internal learning and development paths and career growth opportunities to secure Allegion as an employer of choice, where people want to come work, stay and thrive.
Talent Development and Succession Planning
Talent development and succession planning at all levels of the organization are instrumental in ensuring we have the key capabilities to deliver the value proposition expected by our customers and employees. Inclusive succession planning is supported through the Allegion Leadership Behaviors, individual career mapping, assessment of performance and talent pipeline planning up to and including the Chief Executive Officer ("CEO"). On a quarterly basis, the executive team reviews talent development, focusing on developing a diverse succession bench, as part of their quarterly business review and a key component of the Allegion Operating System, our system of annual operation to support governance, reporting processes and management of the business. These cross-functional reviews highlight individuals who are ready for new opportunities, individuals who are on a special assignment or project and individuals early in their career that demonstrate emerging leadership skills.
Learning and Development
Opportunities for on-going learning and development are delivered to employees through structured coursework, on-site and expert-led training and experiential, applied development. The Allegion Academy is offered globally, supporting multiple languages and providing more than 17,000 self-guided online courses, as well as community channels on targeted skills and inclusion and diversity. We offer programs to provide successive levels of development, including reskilling and upskilling existing employees, as well as strengths-based leadership curriculum. Enterprise excellence initiatives and sprint teams expand skills in lean manufacturing and quality principles and lead to redesigning workflow to boost productivity and reduce waste. Employee-led resource and affinity groups provide enrichment opportunities for women’s leadership, early-career professionals, creativity and innovation, health and fitness, community volunteering and philanthropy.
Engagement, Inclusion and Diversity
A commitment to engagement, inclusion and diversity is core to the Allegion Operating System. Engagement surveys provide team leaders with insights on potential areas of focus and help them prioritize and take action on their teams’ foundational, inclusion, growth and development needs. Strengths-based leadership is an element of our commitment to inclusion: the more employees understand their own strengths, the better equipped they are to add value and appreciate the contributions of diverse members of their teams.
Inclusion and diversity are topics for learning communities, employee roundtables and ongoing, regular analysis and dialogue among our people leaders, executive leadership and our Board of Directors. We believe in fundamental standards that support our employees, including a commitment to building and maintaining diverse and inclusive workplaces, safe and healthy practices and competitive wages and benefits. We embrace all differences and similarities among colleagues and within the relationships we foster with customers, suppliers and the communities where we live and work. Whatever background, experience, race, color, national origin, religion, age, gender, gender identity, disability status, sexual orientation, protected veteran status or any other characteristic protected by law, we make sure that potential and current employees have every opportunity for application and the opportunity to give their best at work because it’s the right thing to do.
The combined efforts of Allegion’s Inclusion and Diversity Steering Committee, our Executive Leadership Team ("ELT") and, as of June 2021, a new employee-led Inclusion Council, are driving expectations and accountability while creating role models and change champions. Our engagement, inclusion and diversity strategy has three core pillars:
•Learn & listen deeply: Learn to recognize biases and mitigate them. Seek to first understand the other person's perspective rather than respond or act;
•Unite widely: Create a workplace where all employees feel welcomed, respected and valued, enabling customers to more easily connect with our brands through our people; and
•Take action: Identify the unique things that impact our organization, our communities and our industry.
During 2021, we focused on four action priorities: establish the Inclusion Council; charter and expand employee resource groups; review business policies, processes and practices; and launch the Supplier Diversity Program. In 2021, Allegion was named the winner of the Jackson Lewis Diversity, Equity and Inclusion Champion, on the merits of our company’s proactive and intentional global efforts throughout 2021.
We currentlyare dedicated to fulfilling equal opportunity commitments in all decisions regarding all employment actions and at all levels of employment. In partnership with our Human Resources organization, our Equal Employment Opportunity Officer ensures that the applicable policy and procedures are appropriately established, implemented and disseminated, including those prohibiting discrimination, harassment, bullying and/or retaliation.
Civic Involvement
Civic involvement is part of the value proposition we offer employees and supports inclusion, diversity, growth and development. The Company and its employees provide multi-faceted support for our communities, guided by three philanthropic pillars: safety and security; wellness; and addressing the unique needs of the communities where we work, live and thrive. Corporate sponsorships and voluntary employee payroll deductions support a wide range of non-profits, including those that address housing and school security and safety; children and youth programs; education and scholarships for people of color and those who are economically disadvantaged and support for Historically Black Colleges and Universities; community safety nets for basic needs (e.g., food, shelter, transportation) for underserved people and to break the cycle of poverty; wellness, mental health, health research, emergency relief and blood supply initiatives; and programs to advance
equality, justice and address systemic bias. In addition to corporate sponsorships, site leaders and employees are encouraged to organize local volunteer and fundraising activities, provide grants to local organizations and serve on boards and committees.
Respect for Human Rights
Our respect for human rightsisexpressed instandards for our employees, our business partners, our customers and our communities. We have approximately 10,000 employees.adopted and continue to uphold our Global Human Rights Policy, with standards that align with basic working conditions and human rights concepts advanced by international organizations such as the International Labor Organization and the United Nations. This policy also represents our own minimum standards for working conditions and human rights in our business and supply chains. In addition, we conduct risk assessments and continue to have conversations with the suppliers and companies we work with about the importance of human rights.
Employee Health and Safety
Employee health and safety are top priorities, and we consistently rank as the safest among leading competitors on core measures such as the total recordable incident rate. ‘Be safe, be healthy’ is a core organizational value in our proactive safety culture and has guided our response to the COVID-19 pandemic throughout 2020 and 2021. We have adopted numerous health and safety measures in accordance with best-practice safe hygiene guidelines issued by recognized health experts like the U.S. Centers for Disease Control and Prevention (“CDC”), the European Centre for Disease Prevention and Control (“ECDC”) and the World Health Organization (“WHO”), as well as any applicable government mandates. We continue to adapt to changing health conditions at a local level and support a wide range of health and safety measures, including reduced density, remote and hybrid work options for appropriate roles, cleaning and hygiene protocols, visitor management and mask-wearing. We also encourage preventative measures, including COVID-19 and influenza vaccines and booster shots.
The CEO and senior executives have responsibility for risk management, employee accountability and safety hazard recognition and take a personal responsibility toward executing on safety initiatives. We monitor leading and lagging indicators related to health and safety as part of our ongoing management of the Allegion Operating System and regularly update the Corporate Governance and Nominating Committee of the Board of Directors on key accomplishments and employee health and safety topics. In recognition of our efforts over the past several years to integrate sound environmental, health and safety ("EHS") management with our business operations, in 2021, we received the renowned Robert W. Campbell Award from the National Safety Council.
Regulatory Matters
We are subject to a variety of federal, state and local laws and regulations, both within and outside the U.S., relating to environmental, health and safety concerns. We are committed to conducting our business in a safe, environmentally responsible and sustainable manner, in compliance with all applicable EHS laws and regulations, and in a manner that helps promote and protect the health and safety of our environment, associates, customers, contractors and members of our local communities worldwide.Environmental, Regulationsocial and governance ("ESG") matters are embedded into the Allegion Operating System and, in tandem with our values and Allegion leadership behaviors, create a workplace culture committed to doing the right thing in the right way. Our Board of Directors oversees the Company's ESG initiatives, strategies, goals and performance, and Company leaders and our employees all have a responsibility to uphold excellence, as we believe ESG helps advance engagement and business vitality. We operate with principles that support our proactive commitments, including:
•Integrating sound, EHS and sustainability strategies in all elements of our business functions, including objectives and measurements;
•Conducting periodic, formal evaluation of our compliance status and annual review of objectives and targets;
•Creating a workplace culture where all employees are responsible for safety;
•Making continuous improvements in EHS and sustainability management systems and performance, including the reduction in the usage of natural resources, waste minimization, prevention of pollution and prevention of workplace accidents, injuries and risks;
•Designing, operating and maintaining our facilities in a manner that minimizes negative EHS and sustainability impacts;
•Using materials responsibly, including, where feasible, the recycling and reuse of materials; and
•Acting in a way that shows sensitivity to community concerns about EHS and sustainability issues.
We recognize that these principles are critical to our future success. We have a dedicated environmental program that is designed to reduce the utilization and generation of hazardous materials during the manufacturing process as well asand to remediate any identified environmental concerns. As to the latter, we are currently engaged in site investigations and remediation activities to address environmental cleanup from past operations at current and former production facilities. The CompanyWe also regularly evaluates its remediation programs and considers alternative evaluate our
remediation methods that are in addition to, or in replacement of, those we currently utilized by the Companyutilize based upon enhanced technology and regulatory changes.
We are sometimes a party to environmental lawsuits and claims and have, from time to time, received notices of potential violations of environmental laws and regulations from the U.S. Environmental Protection Agency (the "EPA"("EPA") and similar state authorities. We have also been identified as a potentially responsible party ("PRP") for cleanup costs associated with off-site waste disposal at federal Superfund and state remediation sites. For all such sites, there are other PRPs and, in most instances, our involvement is minimal.
In estimating our liability, we have assumed that we will not bear the entire cost of remediation of any site to the exclusion of other PRPs who may be jointly and severally liable. The ability of other PRPs to participate has been taken into account, based on our understanding of the parties’ financial condition and probable contributions on a per site basis. Additional lawsuits and claims involving environmental matters are likely to arise from time to time in the future. For a further discussion of our potential environmental liabilities, see Notes 2 and 21 to the Consolidated Financial Statements.
We incurred $3.2 million, $23.3 million,Further, during 2021, we provided additional transparency on our sustainability priorities and $4.4 millionprogress by creating a new ESG section of expenses during the years ended December 31, 2017, 2016,corporate website (found under the ESG tab at www.allegion.com). The website highlights our ongoing progress and 2015, respectively, for environmental remediation at sites presentlyadvancements in ESG, including the development of the cross-functional ESG Council which was formed in 2020 and establishing Allegion’s materiality matrix of ESG priorities.
Throughout this Form 10-K, we may refer to additional information that is available on our websites. The information contained on, or formerly owned or leasedthat may be accessed through, the Company's websites is not incorporated by us. Asreference into, and is not part of, December 31, 2017 and 2016, we have recorded reserves for environmental matters of $28.9 million and $30.6 million. Of these amounts $8.9 million and $9.6 million, respectively, relate to remediation of sites previously disposed by us. Given the evolving nature of environmental laws, regulations and technology, the ultimate cost of future compliance is uncertain.this Form 10-K.
Available Information
We are required to file annual, quarterly and current reports, proxy statements and other documents with the U.S.SEC under the Securities and Exchange Commission ("SEC").Act of 1934. The public may read and copy any materials filed with the SEC at the SEC’s Public Reference Room at 100 F Street, N.E., Washington, D.C. 20549. The public may obtain information on the operation of the Public Reference Room by calling the SEC at 1-800-SEC-0330. Also, the SEC maintains an Internet website that contains reports, proxy and information statements and other information regarding issuers that file electronically with the SEC. The public can obtain any documents that are filed by us at http://www.sec.gov.
In addition, thisthe Company's Annual Report on Form 10-K, as well as future quarterly reports on Form 10-Q, current reports on Form 8-K and any amendments to all of the foregoing reports, are made available free of charge on our Internet website (http://www.allegion.com)www.allegion.com) as soon as reasonably practicable after such reports are electronically filed with or furnished to the SEC. The contents of our website are not incorporated by reference in this report.
Item 1A. RISK FACTORS
We discuss our expectations regarding future performance, events and outcomes in this Form 10-K, quarterly and annual reports, press releases and other written and oral communications. All statements except for historical and present factual information are “forward-looking statements” and are based on financial data and business plans available only as of the time the statements are made, which may become outdated or incomplete. Forward-looking statements are inherently uncertain, and investors must recognize that events could significantly differ from our expectations. You should carefully consider the risksrisk factors discussed below, together with all the other information included in this Form 10-K, in evaluating us, our ordinary shares and our senior notes. If any of the risks below actually occurs, our business, financial conditions,condition, results of operations and cash flows could be materially and adversely affected. Any such adverse effect may cause the trading price of our ordinary shares to decline, and as a result, you could lose all or part of your investment in us. Our business may also be adversely affected by risks and uncertainties not known to us or risks that we currently believe to be immaterial. We assume no obligation to update any forward-looking statements as a result of new information, future events or other factors.
Strategic and Operational Risks Related to Our Business
Our business operations have been, and are expected to continue to be, adversely impacted by the global operations subject us to economic risks.
COVID-19 pandemic. We are incorporatedunable to predict the full extent to which the pandemic and related impacts, including macroeconomic impacts and the pace of global economic recovery, will continue to adversely impact our business, results of operations and financial condition.
The COVID-19 pandemic and preventative measures taken to contain the spread of COVID-19 or mitigate this pandemic have caused, and are continuing to cause, business slowdowns or shutdowns in Irelandvarious countries around the world. This pandemic has also caused, and operatemay continue to cause, disruption to our global supply chain and business operations, in countries worldwide. Our global operations dependaddition to the various effects noted elsewhere within the risk factors contained in this Annual Report on products manufactured, purchasedForm 10-K. Numerous actions taken to help limit the spread of COVID-19, such as stay-at-home orders, quarantines, increased border controls and sold in the U.S. and internationally, including in Australia, China, Europe, Korea, Mexico, New Zealand and Turkey. The political, economic and regulatory environments in which we operate are becoming increasingly volatile and uncertain. Accordingly, we are subject to risks that are inherent in operating globally, including:
changes in laws and regulations or imposition of currency restrictionsclosures, business shutdowns, and other restraints in various jurisdictions;
limitation of ownership rights, including expropriation of assets by a localpublic health and government mandates that restrict business activities and limitation on the abilitytravel have impacted, and will likely continue to repatriate earnings;
sovereign debt crises and currency instability in developed and developing countries;
changes in applicable tax regulations and interpretations;
imposition of burdensome tariffs and quotas;
difficulty in staffing and managing global operations;
difficulty in enforcing agreements, collecting receivables and protecting assets through non-U.S. legal systems;
political unrest, national and international conflict, including war, civil disturbances and terrorist acts; and
economic downturns and social and political instability.
These risks could increase our cost of doing business in the U.S. and internationally, increase our counterparty risk, disrupt our operations, disrupt the ability of suppliers and customers to fulfill their obligations, increase our effective tax rate, increase the cost of our products, limit our ability to sell products in certain markets, reduce our operating margin and negatively impact our ability to compete.carry out business as usual, including the temporary suspension of some of our operations, shortages in materials, parts and components, fluctuations in customer demand, costs associated with operational changes and an extended period of remote work arrangements for some of our employees which could increase cybersecurity risks and other operational risks. Conversely, as some governments ease their restrictions and social interactions increase prior to the widespread global distribution and adoption of effective vaccines or treatments for COVID-19, and as the COVID-19 virus mutates into more contagious or severe variants, preventative and precautionary measures may not be sufficient to mitigate the risk of increased infection and could result in increased illness among our employees, business partners and others, and lead to further business interruption.
OurIn addition, our operations, as well as a significant number of our customers, suppliers, vendors and other business relies onpartners have been, and continue to be, adversely affected by the commercialCOVID-19 pandemic. In particular, shortages in commodities and residential constructionmaterials, including shortages and remodeling markets.
reductions in allocations of electronic and other components from key suppliers, labor shortages and elevated levels of employee absenteeism, freight delays and other supply chain constraints and disruptions have significantly delayed or disrupted, and may continue to adversely impact, both our suppliers’ and our ability to manufacture and deliver products to our customers. We primarily rely on the commercialhave also experienced a significant increase in commodity, parts and residential constructionmaterial component inflation in 2021, as well as inflation in other costs, such as packaging, freight, labor and remodeling markets, which are marked by cyclicality based on overall economic conditions. Weakness or instability in these markets may cause currentenergy prices. Continued supply chain disruptions and potential customersdelays, as well as continued heightened inflation, could lead to delay or choose not to make purchases, whichcontinued periodic production interruptions and other inefficiencies that could negatively impact our productivity, margin performance and our results of operations.
Further, we have experienced increased labor shortages at some of our production and distribution facilities. While we have historically experienced some level of ordinary course turnover of employees, the COVID-19 pandemic and resulting impacts have exacerbated labor shortages and increased employee turnover. A number of factors have had and may continue to have adverse effects on the labor force available to us, including reduced employment pools, increased competition for manufacturing employees, any unemployment subsidies, including unemployment benefits offered in response to the COVID-19 pandemic, and other government regulations, which include laws and regulations related to workers’ health and safety, wage and hour practices and immigration. It is also uncertain to what extent any COVID-19 vaccine mandates, if imposed or implemented, may result in further workforce attrition. Labor shortages and increased turnover rates within our Company have led to and could in the future lead to increased costs, such as increased overtime to meet demand forand increased wage rates to attract and retain employees and could negatively affect our productsability to efficiently operate our production facilities or otherwise operate at full capacity. An overall or prolonged labor shortage, lack of skilled labor, increased turnover or labor cost inflation could have a material adverse impact on our operations, results of operations, liquidity or cash flows.
Despite our best efforts to manage and services.mitigate the negative effects of the COVID-19 pandemic to the Company, their ultimate impact also depends on factors beyond our knowledge or control, including the duration and severity of this pandemic, the
emergence and spread of more contagious or severe variants of the COVID-19 virus, the continuing prevalence of severe, unconstrained or escalating rates of infection in certain countries and regions, the availability, adoption and efficacy of treatments and vaccines, future actions taken by public health and governmental authorities, including any unintended consequences of such actions, and the pace of global economic recovery. Further, to the extent our management is focused on mitigating the impacts of the COVID-19 pandemic which has required, and will continue to require, a large investment of time and resources, our attention and resources may be diverted from other business matters.
The impact of the COVID-19 pandemic continues to evolve, and its ultimate impact on our business is highly uncertain and difficult to predict. The continued spread of COVID-19 may have further adverse impacts on our business, operations, customer demand, supply chain, cash flow generation, financial position and liquidity and may also exacerbate other risks and uncertainties described in this Annual Report on Form 10-K.
Increased competition, including from technicaltechnological developments, could adversely affect our business.
The markets in which we operate include a large number of participants, including multi-national, companies, regional companies and small, local companies. We primarily compete on the basis of quality, innovation, expertise, effective channels to market, breadth of product offering and price. We may be unable to effectively compete on all these bases. Further, in a number of our product offerings, we compete with our retail customers and technology partners who use their own private labels. If we are unable to anticipate evolving trends in the market or the timing and scale of our competitors’ activities and initiatives, including increased competition from private label brands, the demand for our products and services could be negatively impacted.
In addition, we compete in a marketan industry that is experiencing the convergence of the mechanical, electronic and digital products. Technology and innovation play significant roles in the competitive landscape. Our success depends, in part, upon the research, development and implementation of new technologies and products.products including obtaining, maintaining and enforcing necessary intellectual property protections. Securing and maintaining key partnerships and alliances, as well asrecruiting and retaining highly skilled and qualified employee talent includingand having access to technologies, services, intellectual property and solutions developed by others will play a significant role in our ability to effectively compete. The continual development of new technologies by existing and new competitors, including non-traditional competitors with significant resources, could adversely affect our ability to sustain operating margins and desirable levels of sales volumes. To remain competitive, we must develop new products and respond to new technologies in a timely manner.
Our growth is dependent, in part, on the development, commercialization and acceptance of new products and services.
We must develop and commercialize new products and services that meet the varied and evolving needs of our customers and end-users in order to remain competitive in our current and future markets and in order to continue to grow our business. The speed of development by our competitors and new market entrants is increasing. We cannot provide any assurance that any new product or service will be successfully commercialized in a timely manner, if ever, or, if commercialized, will result in returns greater than our investment. Investment in a product or service could divert our attention and resources from other projects that become more commercially viable in the market. We also cannot provide any assurance that any new product or service will be accepted by the market.
Changes in customer and consumer preferences and the inability to maintain beneficial relationships with large customers could adversely affect our business.
We have significant customers, particularly major retailers, although no one customer represented 10% or more of our total Net revenues in any of the past three fiscal years. The loss or material reduction of business, either due to a reduction in demand from one or more of our significant customers, or our inability to timely meet the elevated level of customer demand for various reasons, the lack of success of sales initiatives or changes in customer preferences or loyalties for our products related to any such significant customer could have a material adverse impact on our business. In addition, major customers who are volume purchasers are much larger than us and have strong bargaining power with suppliers. This limits our ability to recover cost increases through higher selling prices. Furthermore, unanticipated inventory adjustments by these customers can have a negative impact on sales.
Our brandsWe also sell our products through various trade channels, including traditional retail and e-commerce channels. If we or our major customers are important assetsnot successful in navigating the shifting consumer preferences to distribution channels such as e-commerce, our expected future revenues may be negatively impacted.
If our businessesproducts or solutions fail to meet certification and violationspecification requirements, are defective, or otherwise fall short of end-users' needs and expectations, our trademark rights by imitators couldbusiness may be negatively impact revenuesimpacted.
The security and brand reputation.
Our brandsaccess control product markets we serve often have unique certification and trademarks enjoy a reputation for qualityspecification requirements, reflecting local regulatory requirements and valuehighly variable end-user needs. While we strive to meet all certification and are important to our success and competitive position. Unauthorized use of our trademarks may not only erode salesspecification requirements, if any of our products butor solutions do not meet such requirements, or contain, or are perceived to contain, defects or otherwise fall short of end-users' needs and expectations, we may also causeincur significant damagecosts and our business, results of operations or financial condition may be negatively impacted.
Additionally, as end-users have continued to adopt newer technologies in their facilities and homes, accelerated by the increasing adoption of IoT technologies, our brand nameindustry is seeing a shift in demand from mechanical security products to electronic security products and reputation, interfere with relationships with our customerssolutions, including connected devices. Electronic security products and increase litigation costs. Theresolutions are increasingly more sophisticated and technologically complex than the mechanical security products we sell and have an increased risk of design, cybersecurity or manufacturing defects, which could lead to product liability claims, recalls, product replacements or modifications, write-offs of inventory or other assets and significant warranty and other expenses. Product quality issues can be no assurance that our on-going effort to protect our brand and trademark rights will prevent all violations.
Currency exchange rate fluctuations mayalso adversely affect our results.
We are exposed to a varietythe end-user experience, resulting in reputational harm, loss of competitive advantage, poor market risks, including the effectsacceptance, reduced demand for products and solutions, delay in new product and service introductions and lost sales. Further, adverse publicity, whether or not justified, or allegations of changes in currency exchange rates. See "Management’s Discussion and Analysis of Financial Condition and Results of Operations - Quantitative and Qualitative Disclosure About Market Risk."
Approximately 30% of our 2017 net revenues were derived outside the U.S., and we expect sales to non-U.S. customers to continue to represent a significant portion of our consolidated net revenues. Although we may enter into currency exchange contracts to reduce our risk related to currency exchange fluctuations, changes in the relative fair values of currencies occur from time to time and may, in some instances, have a material impact on our results of operations. Because we do not hedge against all of our currency exposure our business will continue to be susceptible to currency fluctuations.
We also translate assets, liabilities, revenues and expenses denominated in non-U.S. dollar currencies into U.S. dollars for our consolidated financial statements based on applicable exchange rates. Consequently, fluctuations in the value of the U.S. dollar compared to other currencies will have a material impact on the value of these items in our consolidated financial statements,product or service quality issues, even if their value has not changed in their original currency.false or unfounded, could damage our reputation and negatively affect our sales.
Our business strategy includesand innovation strategies include making acquisitions of, and investments that complement our existing business.in, external companies. These acquisitions and investments could be unsuccessful or consume significant resources, which could adversely affect our operating and financial results.
We will continue to analyze and evaluate the acquisition of strategic businesses or product lines with the potential to strengthen our industry position or enhance our existing set of products and services offerings. We cannot assure youprovide assurance that we will identify or successfully complete transactionsacquisitions with suitable acquisition candidates in the future, nor can we assure youprovide assurance that completed acquisitions will be successful.successful, or otherwise result in efficient integration and creation of synergies.
Some of the businesses we may seek to acquire or invest in may be marginally profitable or unprofitable. For these businesses to achieve acceptable levels of profitability, we must improve their management, operations, products and market penetration. We may not be successful in this regard, and we may encounter other difficulties in integrating acquired businesses into our existing operations. Further, there may be difficulties in evaluating potential acquisitions, including the possibility that our due diligence may not reveal or fully assess valuation issues, potential liabilities or other acquisition risks.
Acquisitions and investments may involve significant cash expenditures, debt incurrence, operating losses and expenses. Acquisitions also involve numerous other risks, including:
diversion•Diversion of managementmanagement's time and attention from daily operations;
difficulties•Difficulties integrating acquired businesses, technologies and personnel into our business;
difficulties•Difficulties completing the transaction in a timely manner;
•Difficulties realizing synergies expected to result from acquisitions;
difficulties•Difficulties in obtaining and verifying the financial statements and other business information of acquired businesses;
inability•Inability to obtain regulatory approvals and/or required financing on favorable terms;
potential•Potential loss of key employees, key contractual relationships or key customers of acquired companies or of us;
assumption•Difficulties competing in the new markets we enter;
•Assumption of the liabilities and exposure to unforeseen liabilities of acquired companies;
dilution•Dilution of interests of holders of our ordinary shares through the issuance of equity securities or equity-linked securities; and
difficulty•Difficulty in integrating financial reporting systems and implementing controls, procedures and policies, including disclosure controls and procedures and internal control over financial reporting, appropriate for public companies of our size at companies that, prior to the acquisition, had lacked such controls, procedures and policies.
Further, as part of our innovation strategy, from time to time we invest in start-up companies and/or development stage technology or other companies. In evaluating these opportunities, we follow a structured evaluation process that considers factors such as potential financial returns, new expertise in emerging technology and business benefits. Despite our best efforts to calculate potential return and risk, some or all of the companies we invest in may be unprofitable at the time of, and
subsequent to, our investment. We may lose money in these investments, including the potential for future impairment charges on the investments, and the anticipated benefits of the technology and business relationships may be less than expected.
We continually look to expand our services and products into international markets. As we expand into new international markets, and as we do, we will have only limited experience in marketing and operating services and products in such markets. In othersome instances, we may rely on the efforts and abilities of third-party and foreign business partners in such markets. Certain international markets may be slower than domesticour established markets in adopting our services and products, and our operations in internationalsuch markets may not develop at a rate that supports our level of investment. In addition to the risks outlined above, expansion into internationalcertain new markets may require us to compete with local businesses with greater knowledge of the market, including the tastes and preferences of customers,end-users and businesses with dominant market shares.
It may be difficult for us to complete transactions quickly, integrate acquired operations efficiently into our current business operations or effectively compete in new markets we enter. Any acquisitions or investments may ultimately not be successful, may harm our business or financial condition as such acquisitions may not be successful and may ultimatelyand/or result in impairment charges.
We may pursue business opportunities that diverge from our core business.
We may pursue business opportunities that diverge from our core business, including expanding our products or service offerings, investing in new and unproven technologies and forming new alliances with companies to distribute our products and services. We can offer no assurance that any such business opportunities will prove to be successful. Among other negative effects, our investment in new business opportunities may exceed the returns we realize. Additionally, any new investments could have higher cost structures than our current business, which could reduce operating margins and require more working capital. In the event that working capital requirements exceed operating cash flow, we may be required to draw on our revolving credit facility or pursue other external financing, which may not be readily available.
Our enterprise excellence efforts may not achieve the improvements we expect.
We utilize a number of tools to improve efficiency and productivity. Implementation of new processes to our operations could cause disruptions and theremay prove to be more difficult, costly or time consuming than expected. There is no assurance that all of our planned enterprise excellence projects will be fully implemented, or if implemented, will realize the expected improvements.
Our periodic restructuring plansWe may not be successful.able to effectively manage and implement restructuring initiatives or other organizational changes.
We have, in the pastfrom time to time, restructured or made other adjustments to our workforce and manufacturing footprint in response to market changes,or product changes, performance issues, changechanges in strategies,strategy, acquisitions andand/or other internal and external considerations. Historically, these types ofThese restructuring have resultedactivities and other organizational changes often result in increased restructuring costs, diversion of management’s time and temporaryattention from daily operations and temporarily reduced productivity. In addition,If we are unable to successfully manage and implement restructuring and other organizational changes, we may not achieve or sustain the expected growth or cost savings benefits of these restructurings,activities or do so within the expected timeframe. These effects could recur in connection with future acquisitions and other restructuringsorganizational changes and our revenues and other results of operations could be negatively affected.
Material adverse legal judgments, fines, penaltiesThe effects of global climate change or settlementsother unexpected events, including global health crises, may disrupt our operations and have a negative impact on our business.
The effects of global climate change, such as extreme weather conditions and natural disasters occurring more frequently or with more intense effects, or the occurrence of unexpected events including wildfires, tornadoes, hurricanes, earthquakes, floods, tsunamis and other severe hazards or global health crises, such as the outbreak of Ebola or the global COVID-19 pandemic, or other actual or threatened epidemic, pandemic, outbreak and spread of a communicable disease or virus, in the countries where we operate or sell products and provide services, could adversely affect our business.
We are currentlyoperations and mayfinancial performance. Extreme weather, natural disasters, power outages, global health crises or other unexpected events could disrupt our operations by impacting the availability and cost of materials needed for manufacturing, causing physical damage and partial or complete closure of our manufacturing sites or distribution centers, loss of human capital, temporary or long-term disruption in the future become involved in legal proceedingsmanufacturing and disputes incidental to the operationsupply of our business. Our business may be adversely affected by the outcome of these proceedings and other contingencies (including, without limitation, environmental matters) that cannot be predicted with certainty. As required by U.S. generally accepted accounting principles ("GAAP"), we establish reserves based on our assessment of contingencies. Subsequent developments in legal
proceedings and other contingencies may affect our assessment and estimates of the loss contingency recorded as a reserve and we may be required to make additional material payments.
Allegations that we have infringed the intellectual property rights of third parties could negatively affect us.
We may be subject to claims of infringement of intellectual property rights by third parties. In particular, we often compete in areas having extensive intellectual property rights owned by others and we have become subject to claims alleging infringement of intellectual property rights of others. In general, if it is determined that one or more of our technologies, products or services infringes the intellectual property rights owned by others, we may be required to cease marketing those services, to obtain licenses from the holders of the intellectual property at a material cost or to take other actions to avoid infringing the intellectual property rights. The litigation process is costly and subject to inherent uncertainties, and we may not prevail in litigation matters regardless of the merits of our position. Adverse intellectual property litigation or claims of infringement against us may become extremely disruptive if the plaintiffs succeed in blocking the trade of our products and services and may have a material adverse effectdisruption in our ability to deliver products and services to customers. These events and disruptions could also adversely affect our customers’ and suppliers’ financial condition or ability to operate, resulting in reduced customer demand, delays in payments received or supply chain disruptions. Further, these events and disruptions could increase insurance and other operating costs, including impacting our decisions regarding construction of new facilities to select areas less prone to climate change risks and natural disasters, which could result in indirect financial risks passed through the supply chain or other price modifications to our products and services.
In particular, the ultimate extent of the impact of any epidemic, pandemic or other global health crisis on our business.
Our reputation, ability to do business, financial condition and results of operations could be impaired by improper conduct by any of our employees, agents or business partners.
We are subject to regulation under a variety of U.S. federal and state and non-U.S. laws, regulations and policies including laws related to anti-corruption, export and import compliance, anti-trust and money laundering, due to our global operations. We cannot provide assurance our internal controls will always protect us from the improper conduct of our employees, agents and business partners. Any improper conduct could damage our reputation and subject us to, among other things, civil and criminal penalties, material fines, equitable remedies (including profit disgorgement and injunctionsdepend on future conduct), securities litigationdevelopments which are highly uncertain and a general loss of investor confidence.
Disruptions in our global supply chain,cannot be predicted, including product manufacturingnew information that may emerge concerning the duration and logistical services provided by outsourcing partners, may negatively impact our business.
Our ability to meet our customers' needs and achieve cost targets depends on our ability to maintain key manufacturing and supply arrangements, including execution of supply chain optimizations and certain sole supplier or sole manufacturing arrangements. The loss or disruptionseverity of such manufacturingepidemic, pandemic or other global health crisis, actions taken to contain or prevent their further spread and supply arrangements could interrupt product supply and, if not effectively managed and remedied, have an adverse impact on our business.the pace of global economic recovery following containment of the spread.
We outsource certain manufacturing and logistical services to partners located throughout the world. Our reliance on these third parties reduces our control over the manufacturing and delivery process, exposing us to risks, including reduced control over quality assurance, product costs, product supply and delivery delays. If we are unable to manage these relationships, or if these third parties experience delays, disruptions, capacity constraints, regulatory issues or quality control problems in their operations or fail to meet our future requirements for timely delivery, our ability to ship and deliver certain of our hardware products to our customers could be impaired and our hardware business could be harmed.
We may be subject to risks relating to our information technology and operational technology systems.
We rely extensively on information technology and operational technology systems, networks and services including hardware, software, firmware and technological applications and platforms (collectively, "IT Systems") to manage and operate our business.business from end-to-end, including ordering and managing materials from suppliers, design and development, manufacturing, marketing, selling and shipping to customers, invoicing and billing, managing our banking and cash liquidity systems, managing our enterprise resource planning and other accounting and financial systems and complying with regulatory, legal and tax requirements. There can be no assurance that our current information technology systemsIT Systems will function properly. We have invested and will continue to invest in improving our information technology systems.IT Systems. Some of these investments are significant and impact many important operational processes and procedures. There is no assurance that any newly implemented information technology systemsIT Systems will improve our current systems, will improve our operations or will yield the expected returns on the investments. In addition, the implementation of new information technology systemsIT Systems may be more difficult, costly or time consuming than expected and cause disruptions in our operations and, if not properly implemented and maintained, negatively impact our business. If our information technology systemsIT Systems cease to function properly or if these systems do not provide the anticipated benefits, our ability to manage our operations could be impaired.
We currently rely on a single vendorthird-party service providers for many of the critical elements of our global information and operational technology infrastructure and itstheir failure to provide effective support for such infrastructure could negatively impact our business and financial results.
We have outsourced many of the critical elements of our global information and operational technology infrastructure to a third-party service providerproviders in order to achieve efficiencies. If thesuch service provider doesproviders do not perform or doesdo not perform effectively, we may not be able to achieve the expected efficiencies and may have to incur additional costs to address failures in providing service by the service provider.providers. Depending on the function involved, such non-performance, ineffective performance or failures of service may lead to business disruptions, processing inefficiencies or security breaches.
Disruptions or breaches of our information systems could adversely affect us.
Despite our implementation of network securitycybersecurity measures which have focused on prevention, mitigation, resilience and recovery, our network and products, including access solutions, may be vulnerable to cybersecurity attacks, computer viruses, malicious codes, malware, ransomware, phishing, social engineering, denial of service, hacking, break-ins and similar disruptions. Cybersecurity attacks and intrusion efforts are continuous and evolving, and in certain cases they have been successful at the most robust institutions. The scope and severity of risks that cyber threats present have increased dramatically and include, but are not limited to, malicious software, attempts to gain unauthorized access to data or premises, exploiting weaknesses related to vendors or other third parties that could be exploited to attack our systems, denials of service and other electronic security breaches that could lead to disruptions in systems, unauthorized release of confidential or otherwise protected information and corruption of data. Any such event could have a material adverse effect on our business, operating results and financial condition, as we face regulatory, reputational and litigation risks resulting from potential cyber incidents, as well as the potential of incurring significant remediation costs. Further, while we maintain insurance coverage that may, subject to policy terms and exclusions, cover certain aspects of our cyber risks, such insurance coverage may be insufficient to cover our losses or all types of claims that may arise in the continually evolving area of cyber risk.
Our daily business operations also require us to collect and/or retain sensitive data such as intellectual property, proprietary business information and data related to customers, employees, suppliers and business partners within our networking infrastructure. Theinfrastructure including data from individuals subject to the European Union's General Data Protection Regulation, that is subject to privacy and security laws, regulations and/or customer-imposed controls. Despite our efforts to protect such data, the loss or breach of such informationdata due to various causes including material security breaches, catastrophic events, extreme weather, natural disasters, power outages, system failures, computer viruses, improper data handling, programming errors, unauthorized access and employee error or malfeasance could result in wide reaching negative impacts to our business, and as such, the ongoing maintenance and security of this information is pertinent to the success of our business operations and our strategic goals.
In addition, we operate in an environment where there are different and potentially conflicting data privacy laws and regulations in effect or expected to go into effect in the future, including regulations related to devices connected through IoT, in the
various jurisdictions in which we operate, and we must understand and comply with such laws and regulations while ensuring our data is secure.
Our networking infrastructure and related assets may be subject to unauthorized access by hackers, employee errors,error or malfeasance or other unforeseen activities. Such issues could result in the disruption of business processes, network degradation and system downtime, along with the potential that a third party will exploit our critical assets such as intellectual property, proprietary business information and data related to our customers, suppliers and business partners. To the extent that such disruptions occur and our business continuity plans do not effectively address these disruptions in a timely manner, they may cause delays in the manufacture or shipment of our products and the cancellation of customer orders and, as a result, our business operating results and financial condition could be materially and adversely affected, resulting in a possible loss of business or brand reputation.
CommodityOur ability to successfully grow and expand our business depends on our ability to recruit and retain a highly qualified and diverse workforce.
Our ability to successfully grow and expand our business is dependent upon our ability to recruit and retain a workforce with the skills necessary to develop, manufacture and deliver the products and services desired by our customers. We need highly skilled and qualified personnel in multiple areas, including engineering, sales, manufacturing, information technology, cybersecurity, business development, strategy and management. We must therefore continue to effectively recruit, retain and motivate highly qualified, skilled and diverse personnel to maintain our current business and support our projected growth. A shortage of these employees for various reasons, including intense competition for skilled employees, labor shortages, price increasesincreased labor costs, candidates’ preference to work remotely, changes in laws and higher energy prices couldpolicies regarding immigration and work authorizations in jurisdictions where we have operations, or any government or public health mandates, such as vaccine mandates, that may result in workforce attrition and difficulty with recruiting, may jeopardize our ability to grow and expand our business.
Disruptions in our global supply chain, including product manufacturing and logistical services provided by our supplier partners, may negatively affectimpact our financial results.business.
We rely on suppliers to secureprocure certain products, including raw materials and other commodities, including steel, zinc, brass and other non-ferrous metals, required foras well as parts, components (including electronic components) and logistical services from supplier partners located throughout the manufacture ofworld. Our ability to meet our products. A disruption of deliveries from our suppliers or decreased availability of commodities could have an adverse effectcustomers' needs and achieve cost targets depends on our ability to maintain key manufacturing and supply arrangements, including execution of supply chain optimizations and certain sole supplier or sole manufacturing arrangements. Our reliance on these third parties reduces our control over the manufacturing and delivery process, exposing us to risks including reduced control over quality assurance, product costs, product supply and delivery delays. Additionally, because not all of our supply arrangements provide for guaranteed supply and some key parts and components may be available only from a single supplier or a limited group of suppliers, we are also subject to supply and pricing risks, which could negatively impact our margin performance and results of operations.
If we are unable to effectively manage these relationships, or if these third parties experience delays, disruptions, shortages of materials, labor, electronic and other components, capacity constraints, regulatory issues or quality control problems in their operations, freight delays and other supply chain constraints and disruptions, or otherwise fail to meet our commitmentsfuture requirements for timely delivery, our ability to ship and deliver certain of our products to our customers or increasecould be impaired and our operating costs. We believe that available sources of supply will generallybusiness could be sufficientharmed.
Economic, Market and Financial Risks
Increased prices and inflation could negatively impact our margin performance and our financial results.
Increased inflation, including rising prices for our needs for the foreseeable future. Nonetheless, the unavailability of some commodities could have a material adverse impact on our business.
Volatility in the prices of these commodities could increaseraw materials, parts and components, freight, packaging, labor and energy increases the costs ofto manufacture and distribute our products and services, and we may not be ableunable to pass on these costs on to our customers. We do not currently use financial derivatives to hedge against this volatility in commodity prices; however, we utilize firm purchase commitments, where possible, to help mitigate risk. The pricing of some commoditiesmaterials, parts and components we use is based on market prices. To mitigate this exposure, we may use annual price contracts to minimize the impact of inflation and to benefit from deflation.
Additionally, we are exposed to fluctuations in other costs such as packaging, freight, labor and energy prices. If inflation in these costs increases beyond our ability to control for them through measures such as implementing operating efficiencies, we
may not be able to increase prices due to sufficiently offset the effect of various cost increases without negatively impacting customer demand, thereby negatively impacting our margin performance and results of operations.
Our global operations subject us to economic risks.
We are incorporated in Ireland and operate in countries worldwide. Our global operations depend on products manufactured, purchased and sold in the U.S. and internationally, including in Australia, Canada, China, Europe, Korea, Mexico, New Zealand and the Middle East. The political, economic and regulatory environments in which we operate are becoming increasingly volatile and uncertain. Accordingly, we are subject to risks that are inherent in operating globally, including:
•Changes to trade agreements, sanctions, import and export regulations, including imposition of burdensome tariffs and quotas, and customs duties;
•Changes in applicable tax regulations and interpretations;
•Economic downturns;
•Social and political instability, civil strife and other geographical uncertainty;
•Changes in laws and regulations or imposition of current market prices. Higher energy costscurrency restrictions and other restraints in various jurisdictions;
•Limitation of ownership rights, including expropriation of assets by a local government, and limitation on the ability to repatriate earnings;
•Sovereign debt crises and currency instability in developed and developing countries;
•Difficulty in staffing and managing global operations;
•Difficulty in enforcing agreements, collecting receivables and protecting assets through non-U.S. legal systems;
•Political unrest, national and international conflict, including war, border closures, civil disturbances and terrorist acts; and
•Difficulty in transporting materials, components and products.
These risks could increase our operating costscost of doing business in the U.S. and internationally, increase our counterparty risk, disrupt our operations, disrupt the ability of suppliers and customers to fulfill their obligations, increase our effective tax rate, increase the cost of shippingour products, limit our ability to sell products in certain markets, reduce our operating margin, reduce cash flows and/or negatively impact our ability to compete.
Our business relies on the institutional, commercial and residential construction and remodeling markets.
Demand for our security products and solutions relies on the institutional, commercial and residential construction and remodeling markets, which are marked by cyclicality based on overall economic conditions, including consumer confidence and disposable income, corporate and government spending, work-from-home trends, availability of credit and demand for new housing and infrastructure. Weakness or instability in one or more of these markets may cause current and potential customers to delay or cancel major capital projects, or otherwise choose not to make purchases, which could negatively impact the demand for our products and supplying servicessolutions and erode average selling prices.
Currency exchange rate fluctuations may adversely affect our results.
We are exposed to a variety of market risks, including the effects of changes in currency exchange rates. See "Part II, Item 7A. Management’s Discussion and Analysis of Financial Condition and Results of Operations – Quantitative and Qualitative Disclosures About Market Risk."
Approximately 30% of our 2021 Net revenues were derived outside the U.S., and we expect sales to non-U.S. customers aroundto continue to represent a significant portion of our consolidated Net revenues. Although we may enter into currency exchange contracts to reduce our risk related to currency exchange fluctuations, changes in the world. Consequently, sharp price increases, the impositionrelative fair values of taxes or an interruption of supply, could cause uscurrencies occur from time to lose the ability to effectively manage the risk of rising energy pricestime and may, in some instances, have an adversea material impact on our results of operationsoperations. We do not hedge against all our currency exposure and cash flows.therefore, our business will continue to be susceptible to currency fluctuations.
We also translate assets, liabilities, revenues and expenses denominated in non-U.S. dollar currencies into U.S. dollars for our Consolidated Financial Statements based on applicable exchange rates. Consequently, fluctuations in the value of the U.S. dollar compared to other currencies may have a material impact on the value of these items in our Consolidated Financial Statements, even if their value has not changed in their original currency.
We may be required to recognize impairment charges for our goodwill, indefinite-lived intangible assets and other indefinite-lived intangiblelong-lived assets.
At December 31, 2017,2021, the net carrying value of our goodwill and other indefinite-lived intangible assets totaled approximately $761.2$803.8 million and $75.4$113.9 million, respectively. Pursuant to GAAP,U.S. generally accepted accounting principles ("GAAP"), we are required to annually assess our goodwill and indefinite-lived intangibles and other long-livedintangible assets to determine if they are impaired.for impairment. In addition, interim assessments must be performed for these and other long-lived assets whenever events or changes in circumstances indicate that an impairment may have occurred. If the testing performed indicates that impairment has occurred, we are required to record a non-cash impairment charge for the difference between the carrying value
of the goodwill or other intangible assets and the fair value of the goodwill or other intangible assets in the period the determination is made. DisruptionsSignificant disruptions to our business or end market conditions, and protracted economic weakness, unexpected significant declines in operating results of reporting units, divestitures andor market capitalization declines may result in additionalrecognition of impairment charges forto our goodwill, indefinite-lived intangible or other long-lived assets. Any charges relating to such impairments could have a material adverse impact on our results of operations in the periods when recognized.
The capital and other asset impairments. credit markets are important to our business.
Instability in U.S. and global capital and credit markets, including market disruptions, limited liquidity and interest rate volatility or reductions in the credit ratings assigned to us by independent ratings agencies, could reduce our access to capital markets or increase the cost of funding our short and long-term credit requirements. In particular, if we are unable to access capital and credit markets on terms that are acceptable to us, we may not be able to make certain investments or fully execute our business plans and strategy.
Our suppliers and customers are also dependent upon the capital and credit markets. Limitations on the ability of customers, suppliers or financial counterparties to access credit could lead to insolvencies of key suppliers and customers, limit or prevent customers from obtaining credit to finance purchases of our products and services and cause delays in the delivery of key products from suppliers.
There are risks associated with our outstanding and future indebtedness.
We have significant intangible assets, including goodwill withapproximately $1.45 billion of outstanding indebtedness at December 31, 2021. In addition, we have a senior unsecured revolving credit facility (the "2021 Revolving Facility") that permits borrowings of up to an indefinite life, which are susceptible to valuation adjustments as a result of changesadditional $500 million. Volatility in such factors and conditions.
The basis of the fair value for our impairment assessments is determined by projecting future cash flows using assumptions concerning future operating performance and economic conditions that may differ from actual cash flows. The financial and credit market volatility directly impacts our fair value measurement through our weighted average cost of capital that we use to determine our discount rate and through our stock price that we use to determine our market capitalization. Although our last analysis regarding the fair values of the goodwill and indefinite-lived intangible assets for our reporting units indicates that they exceed their respective carrying values, materially different assumptions regarding the future performance of our businesses or significant declines in our stock pricemarkets could result in additional goodwill and intangible impairment losses. Specifically, an unanticipated deterioration in net revenues and operating margins generated by our EMEIA and/or Asia Pacific segments could trigger future impairment in those segments. While we currently believe that our projected results will not result in future impairment, a deterioration in results or other factors could trigger a future impairment.
Successful sales and marketing efforts depend onadversely impact our ability to recruitobtain favorable financing terms in the future. A portion of our cash flows from operations is dedicated to servicing our indebtedness and retain qualified employees.will not be available for other purposes, including our operations, capital expenditures, payment of dividends, share repurchases or future business opportunities.
Our ability to successfully growmake scheduled payments or to refinance our debt obligations depends on our financial and operating performance, which is subject to prevailing economic and competitive conditions and to certain financial, business and other factors beyond our control. If our cash flows and capital resources are insufficient to fund our debt service obligations, we may be forced to reduce or delay capital expenditures, reduce or eliminate the payment of dividends, sell assets, seek additional capital or seek to restructure or refinance our indebtedness. These alternative measures may not be successful and may not permit us to meet our scheduled debt service obligations. In such event, we could face substantial liquidity problems and might be required to sell material assets or operations to attempt to meet our debt service and other obligations.
Additionally, at December 31, 2021, our borrowings included a variable rate term loan facility (the "2021 Term Facility", and together with the 2021 Revolving Facility, the "2021 Credit Facilities") with an outstanding balance of $250 million, which exposes us to variable interest rate risk. We are also exposed to the risk of rising interest rates to the extent that we fund our operations with short-term or variable-rate borrowings under our 2021 Revolving Facility. If variable base rates under our 2021 Credit Facilities increase in the future, our Interest expense could increase.
Legal and Compliance Risks
We are subject to risks related to corporate social responsibility and reputational matters.
Our reputation and the reputation of our brands, including the perception held by our customers, end-users, business partners, investors, other key stakeholders and the communities in which we do business are influenced by various factors. There is an increased focus from our stakeholders on ESG practices and disclosure – and if we fail, or are perceived to have failed, in any number of ESG matters, such as environmental stewardship, inclusion and diversity, workplace conduct and support for local communities, or to effectively respond to changes in, or new, legal or regulatory requirements concerning climate change or other sustainability concerns, our reputation or the reputation of our brands may suffer. Such damage to our reputation and the reputation of our brands may negatively impact our business, dependsfinancial condition and results of operations.
In addition, negative or inaccurate postings or comments on social media or networking websites about the contributionsCompany or our brands could generate adverse publicity that could damage our reputation or the reputation of our brands. If we are unable to effectively manage real or perceived issues, including concerns about product quality, safety, corporate social responsibility or other matters, sentiments toward the Company or our products could be negatively impacted, and abilitiesour financial results could suffer.
Our brands are important assets of key executives, our businesses, and violation of our trademark rights by imitators could negatively impact revenues and brand reputation.
Our brands and trademarks enjoy a reputation for quality and value and are important to our success and competitive position. Unauthorized use of our trademarks may not only erode sales forceof our products but may also cause significant damage to our brand name and reputation, interfere with relationships with our customers and increase litigation costs. There can be no assurance that our on-going effort to protect our brand and trademark rights will prevent all violations.
Material adverse legal judgments, fines, penalties or settlements could adversely affect our business.
We are currently and may in the future become involved in legal proceedings and disputes incidental to the operation of our business. Our business may be adversely affected by the outcome of these proceedings and other personnel, includingcontingencies (including, without limitation, environmental, product liability, antitrust, intellectual property, data protection, privacy and labor and employment matters) that cannot be predicted with certainty. As required by GAAP, we establish reserves based on our assessment of contingencies. Subsequent developments in legal proceedings and other contingencies may affect our assessment and estimates of the abilityloss contingency recorded as a reserve, and we may be required to make additional material payments.
Allegations that we have infringed the intellectual property rights of third parties could negatively affect us.
We may be subject to claims of infringement of intellectual property rights by third parties. In particular, we often compete in areas having extensive intellectual property rights owned by others and we have become subject to claims alleging infringement of intellectual property rights of others. In general, if it is determined that one or more of our sales forcetechnologies, products or services infringes the intellectual property rights owned by others, we may be required to adaptcease marketing those products or services, to any changes madeobtain licenses from the holders of the intellectual property at a material cost or to take other actions to avoid infringing such intellectual property rights. The litigation process is costly and subject to inherent uncertainties, and we may not prevail in litigation matters regardless of the sales organizationmerits of our position. Adverse intellectual property litigation or claims of infringement against us may become extremely disruptive if the plaintiffs succeed in blocking the trade of our products and achieve adequate customer coverage. We must therefore continueservices and may have a material adverse effect on our business.
Our reputation, ability to sufficiently recruit, retain and motivate management, sales and other personnel to maintain our currentdo business and supportresults of operations could be impaired by adverse publicity or improper conduct by any of our projected growth. A shortageemployees, agents or business partners.
We are subject to regulation under a variety of these keyU.S. federal and state and non-U.S. laws, regulations and policies including laws related to anti-corruption, export and import compliance, anti-trust and money laundering due to our global operations. We cannot provide assurance that our internal controls will always protect us from the improper conduct of our employees, might jeopardizeagents and business partners. Any improper conduct could damage our abilityreputation and subject us to, growamong other things, civil and expand our business.criminal penalties, material fines, equitable remedies (including profit disgorgement and injunctions on future conduct), securities litigation and a general loss of investor confidence.
Our operations are subject to regulatory risks.
Our U.S. and non-U.S. operations are subject to a number of laws and regulations, including fire and building codes and standards, environmental, and health and safety.safety standards. We have incurred, and will be required to continue to incur, significant expenditures to comply with these laws and regulations. Changes to, or changes in interpretations of, current laws and regulations, including climate change legislation or other environmental mandates, could require us to increase our compliance expenditures, cause us to significantly alter or discontinue offering existing products and services or cause us to develop new products and services. Altering current products and services or developing new products and services to comply with changes in the applicable laws and regulations could require significant research and development investments, increase the cost of providing the products and services and adversely affect the demand for our products and services.
We may not have been, or we may not at all times be, in full compliance with these laws and regulations. In the event a regulatory authority concludes that we are not or have not at all times been in full compliance with these laws or regulations, we could be fined, criminally charged or otherwise sanctioned.
Certain environmental laws assess liability on current or previous owners of real property or operators of manufacturing facilities for the costs of investigation, removal or remediation of hazardous substances or materials at such properties or at properties at which parties have disposed of hazardous substances. Liability for investigative, removal and remedial costs under certain U.S. federal and state laws and certain non-U.S. laws are retroactive, strict and joint and several. In addition to cleanup actions brought by governmental authorities, private parties could bring personal injury or other claims due to the presence of, or exposure to, hazardous substances. We have received notification from U.S. and non-U.S. governmental agencies, including the EPA and similar state environmental agencies, that conditions at a number of current and formerly owned sites where we and others have disposed of hazardous substances require investigation, cleanup and other possible remedial action. These agencies may require that we reimburse the government for its costs incurred at these sites or otherwise pay for the costs of investigation and cleanup of these sites, including by providing compensation for natural resource damage claims from such sites. For more information, see "Business - Environmental Regulation."Item 1. Business – Regulatory Matters."
While we have planned for future capital and operating expenditures to maintain compliance with environmental laws and have accrued for costs related to current remedial efforts, our costs of compliance, or our liabilities arising from past or future releases of, or exposures to, hazardous substances, may exceed our estimates. We may also be subject to additional environmental claims for personal injury or cost recovery actions for remediation of facilities in the future based on our past, present or future business activities.
The capital and credit markets are important to our business.
Instability in U.S. and global capital and credit markets, including market disruptions, limited liquidity and interest rate volatility, or reductions in the credit ratings assigned to us by independent ratings agencies could reduce our access to capital markets or increase the cost of funding our short and long term credit requirements. In particular, if we are unable to access capital and credit markets on terms that are acceptable to us, we may not be able to make certain investments or fully execute our business plans and strategy.
Our suppliers and customers are also dependent upon the capital and credit markets. Limitations on the ability of customers, suppliers or financial counterparties to access credit could lead to insolvencies of key suppliers and customers, limit or prevent customers from obtaining credit to finance purchases of our products and services and cause delays in the delivery of key products from suppliers.
As a global business, we have a relatively complex tax structure, and there is a risk that tax authorities will disagree with our tax positions.
Since we conduct operations worldwide through our subsidiaries, we are subject to complex transfer pricing regulations in the countries in which we operate. Transfer pricing regulations generally require that, for tax purposes, transactions between us and our affiliates be priced on a basis that would be comparable to an arm's length transaction and that contemporaneous documentation be maintained to support the tax allocation. Although uniform transfer pricing standards are emerging in many of the countries in which we operate, there is still a relatively high degree of uncertainty and inherent subjectivity in complying with these rules. To the extent that any tax authority disagrees with our transfer pricing policies, we could become subject to significant tax liabilities and penalties. Our tax returns are subject to review by taxing authorities in the jurisdictions in which we operate. Although we believe that we have provided for all tax exposures, the ultimate outcome of a tax review could differ materially from our provisions.
ChangesWe could be subject to changes in tax rates, the adoption of new tax legislation or exposure to additional tax liabilities.
Our future effective tax rate and cash tax obligations could be adversely affected by shifts in our effective incomemix of earnings in countries with varying statutory tax raterates, changes in the valuation of our deferred tax assets or liabilities or changes in tax laws, regulations, interpretations or accounting principles, as well as certain discrete items. In addition, we are subject to regular review and audit by tax authorities. As a result, we have received, and may in the future receive, assessments in multiple jurisdictions on various tax-related assertions. Any adverse outcome of such a review or audit could have an adversea negative effect on our operating results and financial condition. In addition, the determination of operations.
Weour worldwide provision for income taxes and other tax liabilities requires significant judgment, and there are subjectmany transactions and calculations where the ultimate tax determination is uncertain. Although we believe our estimates are reasonable, the ultimate tax outcome may differ from the amounts recorded in our financial statements and may materially affect our financial results in the period or periods for which such determination is made. Furthermore, due to taxes in Ireland, the U.S. and numerous other jurisdictions. Due toshifting economic and political conditions, tax policies, laws, interpretations and rates in various jurisdictions may be subject to significant change.
Our futurechange, which could materially affect our financial position and results of operations. For example, many countries in Europe, as well as a number of other countries and organizations, have recently proposed, recommended or implemented changes to existing tax laws or have enacted new laws that could significantly increase our effective tax rate may be adversely affected by a number of additional factors including:
or cash tax obligations in countries where we do business or require us to change the jurisdictionsmanner in which profits are determined to be earned and taxed;we operate our business.
the resolution of issues arising from tax audits with various tax authorities;
changes in the enforcement environment;
changes in the valuation of our deferred tax assets and liabilities;
changes in jurisdictional mix of profits;
changes in tax laws or the interpretation of such tax laws and changes in generally accepted accounting principles;
changes in foreign tax rates or agreed upon foreign taxable base; and/or
the repatriation of earnings from outside Ireland for which we have not previously provided for taxes.
There are risks associated with our outstanding and future indebtedness
We have approximately $1.5 billion of outstanding indebtedness at December 31, 2017. In addition, we have a senior unsecured revolving credit facility that permits borrowings of up to an additional $500 million. Volatility in the credit markets could adversely impact our ability to obtain favorable terms on financing in the future. A substantial portion of our cash flows from operations is dedicated to the payment of principal and interest on our indebtedness and will not be available for other purposes, including our operations, capital expenditures, payment of dividends, share repurchase programs and future business opportunities.
Our ability to make scheduled payments or to refinance our debt obligations depends on our financial and operating performance, which is subject to prevailing economic and competitive conditions and to certain financial, business and other factors beyond our control. If our cash flows and capital resources are insufficient to fund our debt service obligations, we may be forced to reduce or delay capital expenditures, reduce or eliminate the payment of dividends, sell assets, seek additional capital or seek to restructure or refinance our indebtedness. These alternative measures may not be successful and may not permit us to meet our scheduled debt service obligations. In the absence of such operating results and resources, we could face substantial liquidity problems and might be required to sell material assets or operations to attempt to meet our debt service and other obligations.
Additionally, a portion of our borrowings at December 31, 2017 include a term loan with a variable rate of interest which exposes us to interest rate risk. We are exposed to the risk of rising interest rates to the extent that we fund our operations with short-term
or variable-rate borrowings. At December 31, 2017, our $1.5 billion of aggregate debt outstanding includes $691 million of floating-rate term loans and $800 million of our fixed-rate senior notes. We have the ability to incur up to $500 million of additional floating-rate debt under our senior unsecured revolving credit facility. We have entered into interest rate swaps for $250 million of our floating-rate term loans to manage our interest rate risk. A 100 basis point increase in LIBOR would have resulted in incremental 2017 interest expense of approximately $5.6 million. If the LIBOR or other applicable base rates under our senior unsecured credit facilities increase in the future then the interest on floating-rate debt could have a material effect on our interest expense.
Risks Relating to the Spin-off
In connection with the Spin-off, Ingersoll Rand indemnified us for certain liabilities and we indemnified Ingersoll Rand for certain liabilities. If we are required to act on these indemnities to Ingersoll Rand, we may need to divert cash to meet those obligations and our financial results could be negatively impacted. The Ingersoll Rand indemnity may not be sufficient to insure us against the full amount of liabilities for which it will be allocated responsibility, and Ingersoll Rand may not be able to satisfy its indemnification obligations in the future.
Pursuant to the Separation and Distribution Agreement, the Employee Matters Agreement and the Tax Matters Agreement with Ingersoll Rand, Ingersoll Rand agreed to indemnify us for certain liabilities, and we agreed to indemnify Ingersoll Rand for certain liabilities, in each case for uncapped amounts. Such indemnities may be significant and could negatively impact our business, particularly indemnities relating to our actions that could impact the tax-free nature of the Spin-off. Third parties could also seek to hold us responsible for any of the liabilities that Ingersoll Rand retained. Further, the indemnity from Ingersoll Rand may not be sufficient to protect us against the full amount of such liabilities, and Ingersoll Rand may not be able to fully satisfy its indemnification obligations. Moreover, even if we ultimately succeed in recovering from Ingersoll Rand any amounts for which we are held liable, we may be temporarily required to bear these losses ourselves.
If the distribution or certain internal transactions undertaken in anticipation of the spin-off are determined to be taxable for U.S. federal income tax purposes, we, our shareholders that are subject to U.S. federal income tax and/or Ingersoll Rand could incur significant U.S. federal income tax liabilities and, in certain circumstances, we could be required to indemnify Ingersoll Rand for material taxes pursuant to indemnification obligations under the Tax Matters Agreement.
Ingersoll Rand has received an IRS ruling substantially to the effect that, among other things, the distribution of our ordinary shares, together with certain related transactions, qualify under Sections 355 and 368(a) of the Internal Revenue Code ("the Code"), with the result that Ingersoll Rand and Ingersoll Rand’s shareholders will not recognize any taxable income, gain or loss for U.S. federal income tax purposes as a result of the Spin-off, except to the extent of cash received in lieu of fractional shares (the "IRS Ruling"). The IRS Ruling also provided that certain internal transactions undertaken in anticipation of the distribution qualify for favorable treatment under the Code. In addition to obtaining the IRS Ruling, Ingersoll Rand received opinions from the law firm of Simpson Thacher & Bartlett LLP substantially to the effect that certain requirements, including certain requirements that the IRS did not rule on, necessary to obtain tax-free treatment have been satisfied, such that the distribution for U.S. federal income tax purposes and certain other matters relating to the distribution, including certain internal transactions undertaken in anticipation of the distribution, received tax-free treatment under Section 355 of the Code. The receipt and effectiveness of the IRS Ruling and the opinions were conditions to the distribution that were satisfied or waived by Ingersoll Rand. The IRS Ruling and the opinions rely on certain facts and assumptions and certain representations and undertakings from us and Ingersoll Rand regarding the past and future conduct of our respective businesses and other matters. Notwithstanding the IRS Ruling and the opinions, the IRS could determine on audit that the distribution or the internal transactions should be treated as taxable transactions if it determines that any of these facts, assumptions, representations or undertakings is not correct or has been violated, or that the distribution or the internal transactions should be taxable for other reasons, including as a result of significant changes in shares or asset ownership after the distribution. A legal opinion represents the tax adviser’s best legal judgment, is not binding on the IRS or the courts, and the IRS or the courts may not agree with the opinion. In addition, the opinion will be based on then current law, and cannot be relied upon if current law changes with retroactive effect. If the distribution is determined to be taxable, the distribution could be treated as a taxable dividend or capital gain for U.S. federal income tax purposes, and our shareholders could incur significant U.S. federal income tax liabilities. In addition, we or Ingersoll Rand could incur significant U.S. federal income tax liabilities if it is ultimately determined that certain internal transactions undertaken in anticipation of the distribution are taxable.
In addition, under the terms of the Tax Matters Agreement, in the event the distribution or the internal transactions were determined to be taxable as a result of actions taken after the distribution by us or Ingersoll Rand, the party responsible for such failure would be responsible for all taxes imposed on us or Ingersoll Rand as a result thereof. If such failure is not the result of actions taken after the distribution by us or Ingersoll Rand, then we would be responsible for any taxes imposed on us or Ingersoll Rand as a result of such determination. Such tax amounts could be significant.
If the distribution is determined to be taxable for Irish tax purposes, significant Irish tax liabilities may arise.
Ingersoll Rand has received an opinion of the Irish Revenue regarding the Irish tax consequences of the distribution to the effect that certain reliefs and exemptions for corporate reorganizations apply. In addition to obtaining the opinion from Irish Revenue, Ingersoll Rand received an opinion from the law firm of Arthur Cox confirming the applicability of the relevant exemptions and reliefs to the distribution and that certain internal transactions will not trigger tax costs. These opinions rely on certain facts and assumptions and certain representations and undertakings from us and Ingersoll Rand regarding the past and future conduct of our respective businesses and other matters. Notwithstanding the opinions, Irish Revenue could determine on audit that the distribution or the internal transactions do not qualify for the relevant exemptions or reliefs if it determines that any of these facts, assumptions, representations or undertakings is not correct or has been violated. A legal opinion represents the tax adviser’s best legal judgment, is not binding on Irish Revenue or the courts and Irish Revenue or the courts may not agree with the legal opinion. In addition, the legal opinion was based on then current law, and cannot be relied upon if current law changes with retroactive effect. If the distribution ultimately is determined not to fall within certain exemptions or reliefs, the distribution could result in our shareholders having an Irish tax liability as a result of the distribution (if a shareholder is an Irish resident or holds shares in Ingersoll Rand in an Irish branch or agency), or we or Ingersoll Rand could incur Irish tax liabilities.
In addition, under the terms of the Tax Matters Agreement, in the event the distribution does not qualify for certain reliefs or exemptions, then we would be responsible for any taxes imposed on us or Ingersoll Rand as a result of such determination. Such tax amounts could be significant.
Risks Related to Our Incorporation in Ireland
Irish law differs from the laws in effect in the United States and may afford less protection to holders of our securities.
The United StatesU.S. currently does not have a treaty with Ireland providing for the reciprocal recognition and enforcement of judgments in civil and commercial matters. As such, there is some uncertainty as to whether the courts of Ireland would recognize or enforce judgments of U.S. courts obtained against us or our directors or officers based on U.S. federal or state civil liability laws, including the civil liability provisions of the U.S. federal or state securities laws, or hear actions against us or those persons based on those laws.
As an Irish company, we are governed by the Irish Companies Act 2014 of Ireland, as amended, which differs in some material respects from laws generally applicable to U.S. corporations and shareholders, including, among others, differences relating to interested director and officer transactions and shareholder lawsuits. Likewise, the duties of directors and officers of an Irish company generally are owed to the company only. Shareholders of Irish companies generally do not have a personal right of action against directors or officers of the company and may exercise such rights of action on behalf of the company only in limited circumstances. Accordingly, holders of our securities may have more difficulty protecting their interests than would holders of securities of a corporation incorporated in a jurisdiction of the United States.U.S.
In addition, Irish law allows shareholders to authorize share capital which then can be issued by a board of directors without shareholder approval. Also, subject to specified exceptions, Irish law grants statutory preemptive rights to existing shareholders to subscribe for new issuances of shares for cash. However, we have opted outAt our annual meeting of shareholders, our shareholders authorized our Board of Directors to issue up to 33% of our issued ordinary shares and further authorized our Board of Directors to issue up to 5% of such shares for cash without first offering them to our existing shareholders. Both of these preemption rights in our Articles of Association as permitted under Irish company law. Irish law provides that this opt-out expiresauthorizations will expire after five yearsa certain period unless renewed by a special resolution of the shareholders. These authorizations must be renewed by theour shareholders, every five years and we cannot guarantee that the renewal of these authorizations will always be approved. If the Directors' authority to issue ordinary shares is not renewed, then we may be limited in our ability to use our shares, for example, as consideration for acquisitions.
Changes in tax laws, regulations or treaties, changes in our status under the tax laws of many jurisdictions or adverse determinations by taxing authorities could increase our tax burden or otherwise affect our financial condition or operating results, as well as subject our shareholders to additional taxes.
The realization of any tax benefit related to our incorporation and tax residence in Ireland could be impacted by changes in tax laws, tax treaties or tax regulations or the interpretation or enforcement thereof by the tax authorities of many jurisdictions. From time to time, proposals have been made and/or legislation has been introduced to change the tax laws of various jurisdictions or limit tax treaty benefits that if enacted could materially increase our tax burden and/or our effective tax rate. For instance, recent U.S. legislative proposals could modify or eliminate the tax deductibility of various currently deductible payments, which could materially and adversely affect our effective tax rate and cash tax position. Moreover, other U.S. legislative proposals could have a material adverse impact on us by overriding certain tax treaties and limiting the treaty benefits on certain payments, by our U.S. subsidiaries to our non-U.S. affiliates, which could increase our tax liability. We cannot predict the outcome of any specific legislation in any jurisdiction.
While we monitor proposals that would materially impact our tax burden and/or our effective tax rate and investigate our options, we could still be subject to increased taxation on a going forward basis no matter what action we undertake if certain legislative proposals are enacted, certain tax treaties are amended and/or our interpretation of applicable tax law is challenged and determined to be incorrect. In particular, any changes and/or differing interpretations of applicable tax law that have the effect of disregarding our incorporation in Ireland, limiting our ability to take advantage of tax treaties between jurisdictions, modifying or eliminating the deductibility of various currently deductible payments or increasing the tax burden of operating or being resident in a particular country, could subject us to increased taxation.
Dividends received by our shareholders may be subject to Irish dividend withholding tax.
In certain circumstances, we are required to deduct Irish dividend withholding tax (currently at the rate of 20%)25% from dividends paid to our shareholders. In the majority of cases, shareholders residing in the United StatesU.S. will not be subject to Irish withholding tax, and shareholders resident in a number of other countries will not be subject to Irish withholding tax provided that they complete certain Irish dividend withholding tax forms. However, some shareholders may be subject to withholding tax, which could discourage the investment in our stock and adversely impact the price of our shares.
Dividends received by our shareholders couldmay be subject to Irish income tax.
Dividends paid in respect of our shares generally are not subject to Irish income tax where the beneficial owner of these dividends is exempt from Irish dividend withholding tax, unless the beneficial owner of the dividend has some connection with Ireland other than his or her shareholding in Allegion.
Our shareholders who receive their dividends subject to Irish dividend withholding tax will generally have no further liability to Irish income tax on the dividends unless the beneficial owner of the dividend has some connection with Ireland other than his or her shareholding in Allegion.
Certain provisions in our Memorandum and Articles of Association, among other things, could prevent or delay an acquisition of us, which could decrease the trading price of our ordinary shares.
Our Memorandum and Articles of Association containcontains provisions to deter takeover practices, inadequate takeover bids and unsolicited offers. These provisions include, amongst others:
a•A provision of our Articles of Association which generally prohibits us from engaging in a business combination with an interested shareholder (being (i) the beneficial owner, directly or indirectly, of the relevant percentage10% or more of our voting shares or (ii) an affiliate or associate of us that has at any time within the last five years been the beneficial owner, directly or indirectly, of the relevant percentage10% or more of our voting shares), subject to certain exceptions;
rules•Rules regarding how shareholders may present proposals or nominate directors for election at shareholder meetings;
the•The right of our Board of Directors to issue preferred shares without shareholder approval in certain circumstances, subject to applicable law; and
the•The ability of our Board of Directors to set the number of directors and to fill vacancies on our Board of Directors in certain circumstances.Directors.
We believe these provisions will provide some protection to our shareholders from coercive or otherwise unfair takeover tactics. These provisions are not intended to make us immune from takeovers. However, these provisions will apply even if the offer may be considered beneficial by some shareholders and could delay or prevent an acquisition that our Board of Directors determines is in our best interests and our shareholders' best interests. These provisions may also prevent or discourage attempts to remove and replace incumbent directors.
In addition, several mandatory provisions of Irish law could prevent or delay an acquisition of us. For example, Irish law does not permit shareholders of an Irish public limited company to take action by written consent with less than unanimous consent. We also will be subject to various provisions of Irish law relating to mandatory bids, voluntary bids, requirements to make a cash offer and minimum price requirements, as well as substantial acquisition rules and rules requiring the disclosure of interests in our shares in certain circumstances. Also, Irish companies, including us, may alter their Memorandum of Association and Articles of Association only with the approval of at least 75% of the votes of the company’s shareholders cast in person or by proxy at a general meeting of the company.
The agreements that we entered into with Ingersoll Rand in connection with the spin-off generally require Ingersoll Rand’s consent to any assignment by us of our rights and obligations under the agreements. The consent and termination rights set forth in these agreements might discourage, delay or prevent a change of control that shareholders may consider favorable.
Item 1B.UNRESOLVED STAFF COMMENTS
None.
Item 2.PROPERTIES
We operate through a broad network of sales offices, engineering centers, 3129 principal production and assembly facilities and several distribution centers throughout the world. Our active properties represent about 7.06.3 million square feet, of which approximately 47%40% is leased.
The majorityWe own 15 of our plantproduction and assembly facilities, are owned by us with the remainder under long-term lease arrangements. We believe that our plants have been well maintained, are generally in good condition and are suitable for the conduct of our business.
Item 3.LEGAL PROCEEDINGS
In the normal course of business, we are involved in a variety of lawsuits, claims and legal proceedings, including commercial and contract disputes, employment matters, product liability claims, environmental liabilities, intellectual property disputes and tax-related matters. In our opinion, pending legal matters are not expected to have a material adverse impact on our results of operations, financial condition, liquidity or cash flows.
Executive Officers ofThis item should be read in conjunction with the RegistrantCompany's Risk Factors in Part I, Item 1A for additional information.
The following is a list of executive officers of the Company as of February 20, 2018.
David D. Petratis, age 60, is our Chairman, President and Chief Executive Officer. Mr. Petratis served as the Chairman, President and Chief Executive Officer of Quanex Building Products Corporation (a manufacturer of engineered material and components for the building products markets) from 2008 to July 2013.
Patrick S. Shannon, age 55, is our Senior Vice President and Chief Financial Officer. Mr. Shannon served as the Vice President and Treasurer of Ingersoll-Rand plc (a global diversified company) from 2012 to October 2013.
Jeffrey N. Braun, age 58, is our Senior Vice President and General Counsel. Mr. Braun served as our Deputy General Counsel and Chief Compliance Officer from September 2013 to June 2014. Mr. Braun previously served as General Counsel of General Motors China, a subsidiary of General Motors Company (a global automotive company) from 2010 to 2013.
Timothy P. Eckersley, age 56, is our Senior Vice President - Americas. Mr. Eckersley served as Ingersoll Rand’s President, Security Technologies - Americas from 2007 to November 2013.
Todd V. Graves, age 51, is our Senior Vice President - Engineering and Technology. Mr. Graves served as our Vice President - Technology and Engineering from 2013 to January 2016. Mr. Graves served as Ingersoll Rand's Vice President - Technology and Engineering, Security Technologies, from 2012 to 2013.
Tracy L. Kemp, age 49, is our Senior Vice President and Chief Information Officer. Ms. Kemp served as our Vice President and Chief Information Officer from 2013 to February 2015. Prior to that, Ms. Kemp served as Ingersoll Rand’s Vice President - Chief Information Officer, Security Technologies and Residential Solutions sectors from 2011 to 2013.
Shelley A. Meador, age 46, is our Senior Vice President - Human Resources and Communications. Ms. Meador served as our Vice President - Tax from 2013 to August 2016. Ms. Meador previously served as Vice President - Tax at Hillenbrand, Inc. (a global diversified industrial company) from 2011 to 2013.
Lucia Veiga Moretti, age 53, is our Senior Vice President - EMEIA. Ms. Moretti previously served as Senior Vice President and President, Delphi Product and Service Solutions for Delphi Automotive (a supplier of automotive technologies) from 2011 to February 2014.
Chris E. Muhlenkamp, age 60, is our Senior Vice President - Global Operations and Integrated Supply Chain. Mr. Muhlenkamp served as our Vice President - Global Operations and Integrated Supply Chain from 2013 to February 2014. Mr. Muhlenkamp served as Ingersoll Rand's Vice President - Operations and Global Integrated Supply Chain, Security Technologies, from 2011 to 2013.
Douglas P. Ranck, age 59, is our Vice President, Controller and Chief Accounting Officer. Mr. Ranck served as Ingersoll Rand’s Global Controller and Financial Planning and Analysis Leader - Climate Solutions from 2008 to October 2013.
Jeffrey M. Wood, age 47, is our Senior Vice President - Asia Pacific. Mr. Wood previously served as our Vice President, Global Supply Management from 2013 to January 2017. Mr. Wood also served as Senior Vice President, Supply Chain for the Buildings division of Schneider Electric SE (an energy management and automation company) from 2011 to 2013.
No family relationship exists between any of the above-listed executive officers of the Company. All officers are elected to hold office for one year or until their successors are elected and qualified.
Item 4.MINE SAFETY DISCLOSURES
Not applicable.
INFORMATION ABOUT OUR EXECUTIVE OFFICERS
The following is a list of executive officers of the Company as of February 15, 2022.
David D. Petratis, age 64, has served as our Chairman, President and Chief Executive Officer since 2013.
Patrick S. Shannon, age 59, has served as our Senior Vice President and Chief Financial Officer since 2013.
Jeffrey N. Braun, age 62, has served as our Senior Vice President and General Counsel since 2014. Mr. Braun also served as Secretary from 2018 to 2020.
Timothy P. Eckersley, age 60, has served as our Senior Vice President – Allegion International since 2021. Mr. Eckersley served as our Senior Vice President – Americas from 2013 to 2020.
Cynthia D. Farrer, age 59, has served as our Senior Vice President – Global Operations and Integrated Supply Chain since June 2021. Ms. Farrer served as our Vice President – Global Operations and Integrated Supply Chain from October 2020 to June 2021. Ms. Farrer served as our Vice President, Global Supply Management from 2017 to 2020 and as our Vice President, Operations – Americas from 2013 to 2017.
Tracy L. Kemp, age 53, has served as our Senior Vice President – Chief Information and Digital Officer since 2020. Ms. Kemp served as our Senior Vice President – Chief Customer and Digital Officer from 2019 to December 2020. Ms. Kemp also served as our Senior Vice President and Chief Information Officer from 2015 to 2019.
Robert C. Martens, age 51, has served as our Senior Vice President – Chief Innovation and Design Officer since 2019 and Futurist and President of Allegion Ventures since 2017. Mr. Martens served as Futurist of the Americas region and Director of Connectivity Platforms from 2014 to 2017.
Douglas P. Ranck, age 63, has served as our Vice President, Controller and Chief Accounting Officer since 2013.
Vincent M. Wenos, age 55, has served as our Senior Vice President – Chief Technology Officer since 2019. Mr. Wenos served as our Vice President – Global Technology and Engineering from 2018 to 2019 and served as both our Vice President – Americas Engineering and Vice President – Global Mechanical Products from 2016 to 2018.
All above-listed officers have been employed by the Company for more than the past five years. No family relationship exists between any of the above-listed executive officers of the Company. All officers are elected to hold office for one year or until their successors are elected and qualified or their earlier death, resignation or removal from office by the Board of Directors of the Company.
PART II
Item 5.MARKET FOR REGISTRANT’S COMMON EQUITY, RELATED STOCKHOLDER MATTERS AND
ISSUER PURCHASES OF EQUITY SECURITIES
Information regarding the principal market for our ordinary shares and related shareholder matters is as follows:
Our ordinary shares are traded on the NYSE under the symbol ALLE. As of February 16, 2018,10, 2022, the number of record holders of ordinary shares was 3,010. The high and low sales price per share and the dividend declared per share for the following periods were as follows:
|
| | | | | | | | | | | | |
| | | Ordinary shares |
| 2017 | | High | | Low | | Dividend |
| First quarter | | $ | 76.29 |
| | $ | 63.81 |
| | $ | 0.16 |
|
| Second quarter | | 82.77 |
| | 73.93 |
| | 0.16 |
|
| Third quarter | | 86.89 |
| | 76.79 |
| | 0.16 |
|
| Fourth quarter | | $ | 89.81 |
| | $ | 78.63 |
| | $ | 0.16 |
|
| 2016 | | High | | Low | | Dividend |
| First quarter | | $ | 65.40 |
| | $ | 52.95 |
| | $ | 0.12 |
|
| Second quarter | | 69.69 |
| | 63.08 |
| | 0.12 |
|
| Third quarter | | 73.49 |
| | 65.83 |
| | 0.12 |
|
| Fourth quarter | | $ | 69.95 |
| | $ | 61.47 |
| | $ | 0.12 |
|
2,176. Information regarding equity compensation plans required to be disclosed pursuant to this Item is incorporated by reference from our Proxy Statement.
Dividend Policy
Our Board of Directors declared dividends of $0.16$0.36 per ordinary share on February 2, 2017,5, 2021, April 5, 2017,8, 2021, September 6, 20171, 2021 and December 6, 2017.10, 2021. On February 7, 2018,4, 2022, our Board of Directors declared a dividend of $0.21$0.41 per ordinary share payable March 29, 2018.31, 2022. We paid a total of $60.9$129.0 million in cash for dividends to ordinary shareholders during the year ended December 31, 2017.2021. Future dividends on our ordinary shares, if any, will be at the discretion of our Board of Directors and will depend on, among other things, our results of operations, cash requirements and surplus, financial condition, contractual restrictions and other factors that the Board of Directors may deem relevant, as well as our ability to pay dividends in compliance with the Irish Companies Act. Under the Irish Companies Act, dividends and distributions may only be made from distributable reserves. Distributable reserves, broadly, means the accumulated realized profits of Allegion plc (ALLE-Ireland) and are unrelated to any GAAP reporting amount (e.g. retained earnings). As of December 31, 2021, we had distributable reserves of $3.7 billion. In addition, no distribution or dividend may be made unless the net assets of ALLE-Ireland are equal to, or in excess of, the aggregate of ALLE-Ireland’s called up share capital plus undistributable reserves and the distribution does not reduce ALLE-Ireland’s net assets below such aggregate.
Issuer Purchases of Equity Securities
| | | | | | | | | | | | | | | | | | | | | | | | | | |
| Period | | Total number of shares purchased (000s) | | Average price paid per share | | Total number of shares purchased as part of the 2020 Share Repurchase Authorization (000s) | | Approximate dollar value of shares still available to be purchased under the 2020 Share Repurchase Authorization (000s) |
| October 1 - October 31 | | 152 | | | $ | 131.43 | | | 152 | | | $ | 381,427 | |
| November 1 - November 30 | | 796 | | | 132.26 | | | 796 | | | 276,085 | |
| December 1 - December 31 | | 580 | | | 128.80 | | | 580 | | | 201,435 | |
| Total | | 1,528 | | | $ | 130.85 | | | 1,528 | | | $ | 201,435 | |
In February 2017,2020, our Board of Directors approved a new stockshare repurchase authorization of up to, $500and including, $800 million of the Company'sCompany’s ordinary shares ("2017(the "2020 Share Repurchase Authorization"). The 20172020 Share Repurchase Authorization does not have a prescribed expiration date. We paid a totalBased on market conditions, share repurchases are made from time to time in the open market at the discretion of $60.0 million to repurchase 0.8 million ordinary shares during the year ended December 31, 2017 and $85.1 million to repurchase 1.3 million ordinary shares during the year ended December 31, 2016 under the previous authorized share repurchase plan that was established in 2014. At December 31, 2017, we have approximately $440.0 million available under the 2017 Share Repurchase Authorization.management.
Performance Graph
The annual changes for the five-year period shown December 1, 2013 (when our ordinary shares began trading) to December 31, 2017 in the graph on this pagebelow are based on the assumption that $100 had been invested in Allegion plc ordinary shares, the Standard & Poor’s 500 Stock Index ("S&P 500") and the Standard & Poor's 400 Capital Goods Index ("S&P 400 Capital Goods") on December 1, 2013,31, 2016, and that all quarterly dividends were reinvested. The total cumulative dollar returns shown on the graph represent the value that such investments would have had on December 31, 2017.2021.
| | | | | | | | | | | | | | | | | | | | |
| December 31, 2016 | December 31, 2017 | December 31, 2018 | December 31, 2019 | December 31, 2020 | December 31, 2021 |
| Allegion plc | 100.00 | 125.31 | 126.79 | 200.18 | 189.39 | 217.90 |
| S&P 500 | 100.00 | 121.83 | 116.49 | 153.17 | 181.35 | 233.42 |
| S&P 400 Capital Goods | 100.00 | 124.69 | 107.22 | 142.34 | 170.58 | 217.78 |
Item 6.[RESERVED]
|
| | | | | | | | | | | | |
| | | December 1, 2013 | | December 31, 2013 | | December 31, 2014 | | December 31, 2015 | | December 31, 2016 | | December 31, 2017 |
| Allegion plc | | 100.00 | | 102.20 | | 129.03 | | 154.37 | | 150.97 | | 189.19 |
| S&P 500 | | 100.00 | | 102.53 | | 116.57 | | 118.18 | | 132.31 | | 161.20 |
| S&P 400 Capital Goods | | 100.00 | | 104.58 | | 104.84 | | 99.07 | | 130.70 | | 162.97 |
Item 6.SELECTED FINANCIAL DATA (1)
In millions, except per share amounts:
|
| | | | | | | | | | | | | | | | | | | | | |
| At and for the years ended December 31, | | 2017 | | 2016 | | 2015 | | 2014 | | 2013 | |
| | | | | | | | | | | | |
| Net revenues | | $ | 2,408.2 |
| | $ | 2,238.0 |
| | $ | 2,068.1 |
| | $ | 2,118.3 |
| | $ | 2,069.6 |
| |
| | | | | | | | | | | | |
| Net earnings (loss) attributable to Allegion plc ordinary shareholders: | | | | | | | | | | | |
| Continuing operations | | 273.3 |
| (a) | 229.1 |
| (b) | 154.3 |
| (c) | 186.3 |
| (d) | 35.9 |
| (e), (f) |
| Discontinued operations | | — |
| | — |
| | (0.4 | ) | | (11.1 | ) | | (3.6 | ) | |
| | | | | | | | | | | | |
| Total assets | | 2,542.0 |
| | 2,247.4 |
| | 2,263.0 |
| | 2,015.9 |
| | 2,000.6 |
| |
| | | | | | | | | | | | |
| Total debt | | 1,477.3 |
| | 1,463.8 |
| | 1,523.1 |
| | 1,264.6 |
| | 1,343.9 |
| |
| | | | | | | | | | | | |
| Total Allegion plc shareholders’ equity (deficit) | | 401.6 |
| | 113.3 |
| | 25.6 |
| | (4.8 | ) | | (66.1 | ) | |
| | | | | | | | | | | | |
| Earnings (loss) per share attributable to Allegion plc ordinary shareholders: | | | | | | | | | | | |
| Basic: | | | | | | | | | | | |
| Continuing operations | | $ | 2.87 |
| | $ | 2.39 |
| | $ | 1.61 |
| | $ | 1.94 |
| | $ | 0.37 |
| |
| Discontinued operations | | — |
| | — |
| | (0.01 | ) | | (0.12 | ) | | (0.03 | ) | |
| | | | | | | | | | | | |
| Diluted: | | | | | | | | | | | |
| Continuing operations | | $ | 2.85 |
| | $ | 2.36 |
| | $ | 1.59 |
| | $ | 1.92 |
| | $ | 0.37 |
| |
| Discontinued operations | | — |
| | — |
| | — |
| | (0.12 | ) | | (0.03 | ) | |
| | | | | | | | | | | | |
| Dividends declared per ordinary share | | $ | 0.64 |
| | $ | 0.48 |
| | $ | 0.40 |
| | $ | 0.32 |
| | $ | — |
| |
| |
(a) | Net earnings from continuing operations for the year ended December 31, 2017 includes $44.7 million of costs related to the refinancing of our credit facilities and senior notes and a net tax charge of $53.5 million related to the U.S. Tax Reform Act. |
| |
(b) | Net earnings from continuing operations for the year ended December 31, 2016 includes $84.4 million of losses related to our previously divested systems integration business. |
| |
(c) | Net earnings from continuing operations for the year ended December 31, 2015 includes $104.2 million of losses related to the divestitures of our Venezuelan operations and our majority stake in our systems integration business. |
| |
(d) | Net earnings from continuing operations for the year ended December 31, 2014 includes an after-tax, non-cash inventory impairment charge of $18.7 million and a $9.1 million after-tax, non-cash charge related to the devaluation of the Venezuelan bolivar. |
| |
(e) | Net earnings from continuing operations for the year ended December 31, 2013 includes an after-tax, non-cash goodwill impairment charge of $131.2 million and $44.8 million of discrete tax adjustments consisting of $31.5 million of expense related to valuation allowances on deferred tax assets that are no longer expected to be utilized and $13.3 million of net tax expense resulting primarily from transactions occurring to effect the Spin-off. |
| |
(f) | Net earnings from continuing operations includes $174.5 million of centrally managed service costs and corporate allocations from Ingersoll Rand for the year ended December 31, 2013. |
(1) The Company has not restated 2015, 2014, or 2013 for the impact of the adoption of ASU 2016-09 in the fourth quarter of 2016. The Company has not restated 2014 or 2013 for the impact of the adoption of ASU 2015-17 and ASU 2015-03 as of December 31, 2015. The impact of excluding the above standards in prior period presentation is not material.
Item 7.MANAGEMENT’S DISCUSSION AND ANALYSIS OF FINANCIAL CONDITION AND RESULTS OF OPERATIONS
The following Management’s Discussion and Analysis of Financial Condition and Results of Operations contains forward-looking statements that involve risks and uncertainties. Our actual results may differ materially from the results discussed in the forward-looking statements. Factors that might cause a difference include, but are not limited to, those discussed under Item 1A. Risk Factors in this Annual Report on Form 10-K. The following section is qualified in its entirety by the more detailed information, including our consolidated financial statements and the notes thereto, which appears elsewhere in this Annual Report.
Overview
Organization
We are a leading global provider of security products and solutions operating in three geographic regions:two segments: Allegion Americas EMEIA, and Asia Pacific.Allegion International. We sell a wide range of security products and solutions for end-users in commercial, institutional and residential marketsfacilities worldwide, including into the education, healthcare, government, hospitality, commercial office and single and multi-family residential markets. Our corporateleading brands include Schlage, Von Duprin,CISA, Interflex, LCN, CISA,Schlage, SimonsVoss and Interflex.Von Duprin.
Recent Developments
COVID-19 Pandemic and Industry Trends and Economic EventsOutlook
Current market conditions have improved over the past few years,The COVID-19 pandemic and we believe the security products industry will also benefit from continued growth in institutional, commercial, and residential end-markets. We also expect the security products industry will benefit from favorable long-term demographic trends such as continued urbanization of the global population, increased concerns about safety and security and technology-driven innovation.
In recent years, growth in electronic security products and solutions continuesuneven economic recovery continue to outperform the industry, and we expect growthcreate volatility in the global economy and on our business. Throughout 2021, we experienced strong and accelerating demand for our products and services in most of the markets we serve. However, especially in the second half of the year, we also experienced an acceleration of several macroeconomic challenges that have negatively impacted our ability to meet this robust demand, such as supply chain disruptions and delays; shortages in materials, including reductions in allocations of electronic product categories we servecomponents and other parts from key suppliers; labor shortages and elevated levels of employee absenteeism due to the on-going COVID-19 pandemic; and increased commodity, material component, packaging, freight and labor inflation. These challenges have also created both operational and logistical inefficiencies, which have led to periodic production interruptions and an increased level of inventory, which have negatively impacted our productivity, margin performance, working capital and cash flows. While these challenges are impacting all our global businesses, they had a more pronounced impact on our Allegion Americas operating segment in 2021.
We currently anticipate these challenges to continue in 2022 and are rapidly adapting to outperformnavigate them, expecting to be well-positioned to convert demand to revenue as conditions normalize. We remain focused on providing exceptional service to our customers; implementing measures to mitigate operational and distribution inefficiencies and reduce our record high level of backlogs, such as aligning resources to re-engineer product designs and configurations to accept alternate electronic components and developing alternate sources of supply; implementing pricing initiatives to address rising production, material, freight and labor costs; and investing in business initiatives to drive future growth. We will continue to explore various options to control costs and enhance financial performance, while minimizing disruption to customers and the security products industry as a whole as end-users adopt newer technologies in their facilities. Our recent acquisitions have been made to capitalizeoverall business; however, the full impacts of the pandemic and the on-going macroeconomic challenges on this trend.our business, results of operations, financial condition and cash flows remain uncertain.
The economic conditions discussedpandemic and related macroeconomic challenges noted above will likely continue to impact us in numerous and a numberevolving ways that we may not be able to accurately predict. The full impact of the pandemic will continue to depend on future developments such as the continued spread and duration of the pandemic, the emergence of future variant strains of the COVID-19 virus which may be more contagious or severe, the availability and distribution of effective medical treatments and vaccines, vaccination rates, as well as any government-imposed restrictions or mandates. Further, any new or strengthened government-imposed restrictions or mandates on the conduct of business and travel could adversely impact our ability to carry out business as usual in certain markets.
The challenges and uncertainties related to the COVID-19 pandemic and its potential impact on our business, results of operations, financial condition and cash flows, as well as other challenges and uncertainties that could affect our businessbusinesses are described further under "Risk Factors.""Part I, Item 1A. Risk Factors".
2017
2021 and 20162020 Significant Events
Acquisitions
We completed one business acquisition in both 2017 and 2016:
|
| |
Acquisitions |
Business | Month |
Trelock | June 2016 |
Republic | January 2017 |
The incremental impact of the acquisitions for the twelve months ended December 31, 2017 was a net increase in revenues of approximately $32.3 million and a net decrease to operating income of approximately $0.6 million compared to the same period in the prior year. The incremental impact of the acquisitions and divestitures for the twelve months ended December 31, 2016 was a net increase in revenues of approximately $63.6 million and a net increase in operating income of approximately $7.3 million compared to the same period in the prior year.
During the year ended December 31, 2017, we incurred $4.7 million of due diligence and acquisition and integration costs. Acquisition related costs were not material to the 2016 Consolidated Statement of Comprehensive Income.
2017 Dividends
We paid quarterly dividends of $0.16 per ordinary share to shareholders on record as of March 13, 2017, June 13, 2017, September 15, 2017, and December 15, 2017. We paid a total of $60.9 million in cash for dividends to ordinary shareholders during the year ended December 31, 2017.
Restructuring charges
In conjunction with ongoing restructuring actions throughout the year primarily related to workforce reductions and the closure and consolidation of manufacturing facilities in an effort to increase efficiencies, we incurred charges of $12.3 million for the year ended December 31, 2017.
We also incurred $1.5 million of other non-qualified restructuring charges during the year ended December 31, 2017 related to costs directly attributable to restructuring activities, but do not fall into the severance, exit, or disposal category.
Financing activities
WeOn November 18, 2021, we entered into a new $1.2 billion$750.0 million unsecured credit agreement, (the "Credit Agreement"), consisting of a $700.0the $250.0 million term loan facility (the “Term Facility”)2021 Term Facility and athe $500.0 million revolving credit facility (the “Revolving Facility”, and together with the Term Facility, the “Credit Facilities”).2021 Revolving Facility. The initial proceeds of $700.0$250.0 million from the 2021 Term Facility along with initial borrowings of $165.0 million under the Revolving Facility, were primarily used primarily to repay in full our previously outstanding secured credit facility, the Second Amended and Restated Credit Agreement, dated as of September 30, 2015.unsecured Term Facility. All obligations under the Second Amended and Restatedpreviously outstanding Credit Agreement were satisfied, all commitments thereunder were terminated and all guarantees and security interests that had been granted in connection therewith were released.
Acquisitions
In July 2021, we acquired certain assets of Astrum Benelux B.V. ("Astrum Benelux") and 100% of the equity of WorkforceIT B.V. in the Netherlands ("WorkforceIT"), both of which were previously held under common control and offer workforce management technology products and solutions in the Benelux region of Europe. Both Workforce IT and the assets acquired from Astrum Benelux have been integrated into our Allegion International segment.
In December 2020, we acquired Yonomi, Inc. ("Yonomi), a U.S. based smart home integration platform provider and innovation leader in IoT Cloud platforms. Yonomi has been integrated into our Allegion Americas segment.
QMI Divestiture
During the fourth quarter of 2020, the net assets of our Qatar Metal Industries ("QMI") business, met the criteria to be classified as held for sale, and accordingly, were written down to fair value, resulting in a Loss on assets held for sale of $37.9 million.
On October 2, 2017,February 28, 2021, we issued $400.0 millioncompleted our divestiture of 3.200% Senior NotesQMI. The impacts of this divestiture on our results of operations for the year ended December 31, 2021, are reflected in the discussions below.
2020 Impairment of Goodwill and Intangible Assets
As a result of the global economic disruption and uncertainty due 2024 (the “3.200% Senior Notes”)to the COVID-19 pandemic, we performed interim impairment tests on the goodwill balances of our former EMEA and $400.0 million of 3.550% Senior Notes due 2027 (the “3.550% Senior Notes” and, together with the 3.200% Senior Notes, the “Notes”). On October 3, 2017 we used the net proceeds from the Notes to redeem in full the $300.0 million Senior Notes due 2021 and the $300.0 million Senior Notes due 2023,Asia Pacific reporting units, as well as on certain indefinite-lived trade name assets in these two regions, during the first quarter of 2020. The results of these interim impairment tests indicated that the estimated fair value of our former Asia Pacific reporting unit and three indefinite-lived trade names were impaired. Consequently, goodwill and intangible asset impairment charges totaling $96.3 million were recorded during the first quarter of 2020. Further intangible asset impairment charges of $5.4 million were recorded in 2020 in our former Asia Pacific segment, relating to repaysupply chain disruptions that reduced a brand's expected future cash flows and declines in fullvolumes and pricing pressure for a separate subsidiary in the $165.0region.
2021 Dividends and Share Repurchases
We paid quarterly dividends of $0.36 per ordinary share to shareholders on record as of March 17, 2021, June 16, 2021, September 16, 2021, and December 20, 2021. We paid a total of $129.0 million in cash for dividends to ordinary shareholders and repurchased approximately 3.3 million shares for approximately $412.8 million during the year ended December 31, 2021.
Results of Operations - For the years ended December 31
| | | | | | | | | | | | | | | | | | | | | | | | | | | | | | |
| Dollar amounts in millions, except per share amounts | | 2021 | | % of Net revenues | | 2020 | | % of Net revenues | | | | |
| Net revenues | | $ | 2,867.4 | | | | | $ | 2,719.9 | | | | | | | |
| Cost of goods sold | | 1,662.5 | | | 58.0 | % | | 1,541.1 | | | 56.7 | % | | | | |
| Selling and administrative expenses | | 674.7 | | | 23.5 | % | | 635.7 | | | 23.4 | % | | | | |
| Impairment of goodwill and intangible assets | | — | | | — | % | | 101.7 | | | 3.7 | % | | | | |
| Loss on assets held for sale | | — | | | — | % | | 37.9 | | | 1.4 | % | | | | |
| Operating income | | 530.2 | | | 18.5 | % | | 403.5 | | | 14.8 | % | | | | |
| Interest expense | | 50.2 | | | | | 51.1 | | | | | | | |
| | | | | | | | | | | | |
| Other income, net | | (44.0) | | | | | (13.0) | | | | | | | |
| Earnings before income taxes | | 524.0 | | | | | 365.4 | | | | | | | |
| Provision for income taxes | | 40.7 | | | | | 50.9 | | | | | | | |
| Net earnings | | 483.3 | | | | | 314.5 | | | | | | | |
| Less: Net earnings attributable to noncontrolling interests | | 0.3 | | | | | 0.2 | | | | | | | |
| Net earnings attributable to Allegion plc | | $ | 483.0 | | | | | $ | 314.3 | | | | | | | |
| | | | | | | | | | | | |
| Diluted net earnings per ordinary share attributable to Allegion plc ordinary shareholders: | | $ | 5.34 | | | | | $ | 3.39 | | | | | | | |
|
| | | | | | | | | | | | | | | | | | | | | |
| Dollar amounts in millions, except per share data | | 2017 | | % of
Revenues | | 2016 | | % of
Revenues | | 2015 | | % of
Revenues |
| Net revenues | | $ | 2,408.2 |
| |
| | $ | 2,238.0 |
| |
| | $ | 2,068.1 |
| |
|
| Cost of goods sold | | 1,337.5 |
| | 55.5 | % | | 1,252.7 |
| | 56.0 | % | | 1,199.0 |
| | 58.0 | % |
| Selling and administrative expenses | | 582.5 |
| | 24.2 | % | | 559.8 |
| | 25.0 | % | | 510.5 |
| | 24.7 | % |
| Operating income | | 488.2 |
| | 20.3 | % | | 425.5 |
| | 19.0 | % | | 358.6 |
| | 17.3 | % |
| Interest expense | | 105.7 |
| |
| | 64.3 |
| |
| | 52.9 |
| |
|
| Loss on divestitures | | — |
| | | | 84.4 |
| | | | 104.2 |
| | |
| Other income, net | | (13.2 | ) | | | | (18.2 | ) | | | | (7.8 | ) | | |
| Earnings before income taxes | | 395.7 |
| |
| | 295.0 |
| |
| | 209.3 |
| |
|
| Provision for income taxes | | 119.0 |
| | | | 63.8 |
| | | | 54.6 |
| | |
| Earnings from continuing operations | | 276.7 |
| |
| | 231.2 |
| |
| | 154.7 |
| |
|
| Discontinued operations, net of tax | | — |
| | | | — |
| | | | (0.4 | ) | | |
| Net earnings | | 276.7 |
| |
| | 231.2 |
| |
| | 154.3 |
| |
|
| Less: Net earnings attributable to noncontrolling interests | | 3.4 |
| | | | 2.1 |
| | | | 0.4 |
| | |
| Net earnings attributable to Allegion plc | | $ | 273.3 |
| | | | $ | 229.1 |
| | | | $ | 153.9 |
| | |
| Diluted net earnings per ordinary share attributable to Allegion plc ordinary shareholders: | |
| |
| |
| |
| |
| |
|
| Continuing operations | | $ | 2.85 |
| |
| | $ | 2.36 |
| |
| | $ | 1.59 |
| |
|
| Discontinued operations | | — |
| | | | — |
| | | | — |
| | |
| Net earnings | | $ | 2.85 |
| | | | $ | 2.36 |
| | | | $ | 1.59 |
| | |
The discussions that follow describe the significant factors contributing to the changes in our results of operations for the years presented and form the basis used by management to evaluate the financial performance of the business. For a discussion of our results of operations for the year ended December 31, 2020, compared to the year ended December 31, 2019, see “Part II, Item 7. Management’s Discussion and Analysis of Financial Condition and Results of Operations” of our 2020 Annual Report on Form 10-K filed with the SEC on February 16, 2021.
Net Revenues
Net revenues for the year ended December 31, 20172021, increased by 7.6%5.4%, or $170.2$147.5 million,, compared to the same period in 20162020, due to the following:
|
| | | | |
| Pricing | 1.8 | % |
| Volume | 3.92.7 | % |
| Acquisitions / divestitures | 1.4(0.5) | % |
| Currency exchange rates | 0.51.4 | % |
| Total | 7.65.4 | % |
The increase in netNet revenues was primarilyprincipally driven by higher volumes, and improved pricing in all segments, incremental revenue fromand the acquisitions discussed above, and favorableimpact of foreign currency exchange rate movements relative tomovements. These increases were slightly offset by the US Dollar.
Net revenuesdivestiture of our QMI business in February 2021. The increase in sales volumes for the year ended December 31, 2016 increased by 8.2%, or $169.9 million, compared towas principally realized during the same periodsecond quarter, given the muted demand and temporary plant shut-downs we experienced in 2015the second quarter of 2020 due to the following:COVID-19 pandemic. However, in addition to the comparative impact of the rebound in demand in the third and fourth quarters of 2020, the supply chain disruptions and delays and shortages in materials, components and labor discussed above resulted in lower volumes during the second half of 2021 within the Allegion Americas segment. While these challenges are expected to continue into 2022, given the current elevated demand we are experiencing, we expect volume growth to resume as conditions improve.
|
| | |
Pricing | 1.0 | % |
Volume | 4.8 | % |
Acquisitions / divestitures | 3.0 | % |
Currency exchange rates | (0.6 | )% |
Total | 8.2 | % |
The increase in net revenues was primarily driven by higher volumesPricing includes increases or decreases of price, including discounts, surcharges and/or other sales deductions, on our existing products and improved pricing in all segments and incrementalservices. Volume includes increases or decreases of revenue from acquisitions in our EMEIA segment, offset by unfavorable foreign currency exchange rate movements due to the strengtheningchanges in unit volume of the US dollar against currencies in EMEIA, primarily the British pound.existing products and services, as well as new products and services.
Cost of Goods Sold
For the year ended December 31, 2017, cost2021, Cost of goods sold as a percentage of revenue decreasedNet revenues increased to 55.5%58.0% from 56.0%56.7%, due to the following:
|
| | | | |
Pricing and productivityInflation in excess of inflationpricing and productivity | (0.51.2 | )% |
Volume/Volume / product mix | 0.40.7 | % |
| Acquisitions / divestitures | 0.5(0.2) | % |
| |
| Currency exchange rates | (0.1(0.1) | )% |
Environmental remediation charge | (0.7 | )% |
Restructuring / acquisition costsexpenses | (0.1(0.3) | )% |
| Total | (0.51.3 | )% |
CostsCost of goodsGoods sold as a percentage of revenue for the year ended December 31, 2017 decreasedNet revenues increased primarily due to inflation in excess of pricing and productivity improvements, and, to a lesser extent, unfavorable product mix, which exceeded the benefits from sales volume growth during the year. Inflation in excess of pricing and productivity reflects the impacts of increased commodity, material component, packaging, freight and labor inflation, as well as inefficiencies caused by the global supply chain challenges and shortages of materials, components and labor, as discussed above. These increases were partially offset by the year-over-year decrease in restructuring and acquisition expenses, favorable foreign currency exchange rate movements a decreaseand the beneficial impact of our QMI divestiture.
Inflation in excess of pricing and productivity includes the impact to Costs of goods sold from pricing, as defined above, in addition to productivity and inflation. Productivity represents improvements in unit costs of materials and cost reductions related to an environmental remediation chargeimprovements to our manufacturing design and processes. Inflation includes unit costs for the current period compared to the average actual cost for the prior period, multiplied by current year volumes.
Volume/product mix represents the impact due to increases or decreases of revenue due to changes in unit volume, including new products and services, including the effect of changes in the prior year,mix of products and decreased restructuring costs. These decreases were offset by unfavorable product mixservices sold on Cost of goods sold.
Selling and volume and the impact of acquisitions.Administrative Expenses
For the year ended December 31, 2016, cost of goods sold as a percentage of revenue decreased to 56.0% from 58.0% due to the following:
|
| | |
Pricing and productivity in excess of inflation | (1.3 | )% |
Acquisitions / divestitures | (0.5 | )% |
Investment spending | 0.2 | % |
Currency exchange rates | (0.3 | )% |
Non-cash inventory impairment | (0.2 | )% |
Environmental remediation charge | 0.7 | % |
Restructuring / acquisition costs | (0.6 | )% |
Total | (2.0 | )% |
Costs of goods sold as a percentage of revenue for the year ended December 31, 2016 decreased primarily due to productivity benefits in excess of inflation, the impact of the acquisitions discussed above, favorable foreign currency exchange rate movements and decreased restructuring costs primarily in our EMEIA segment. These decreases were offset by increased investment spending and a charge for a change in approach for environmental remediation related to two sites in the Americas.
2021, Selling and Administrative Expenses
For the year ended December 31, 2017, selling and administrative expenses as a percentage of revenue decreasedNet revenues increased to 24.2%23.5% from 25.0%23.4%, due to the following:
|
| | | | |
ProductivityInflation in excess of inflationproductivity | (0.70.5 | )% |
| Volume leverage | (0.9(0.5) | )% |
| Acquisitions / divestitures | (0.2(0.1) | )% |
| Investment spending | 0.7 | % |
| |
Restructuring / acquisition costsexpenses | 0.3(0.5) | % |
| Total | (0.80.1 | )% |
Selling and administrative expenses as a percentage of revenue for the year ended December 31, 2017 decreased primarily due to favorable leverage due to increased volume, productivity benefits in excess of inflation, and acquisitions. These decreases were partially offset due to increased investment spending and higher restructuring and acquisition costs.
For the year ended December 31, 2016, selling and administrative expenses as a percentage of revenue increased to 25.0% from 24.7% due to the following:
|
| | |
Other inflation in excess of productivity | 0.8 | % |
Volume leverage | (1.2 | )% |
Acquisitions / divestitures | 0.7 | % |
Investment spending | 0.4 | % |
Restructuring / acquisition costs | (0.4 | )% |
Total | 0.3 | % |
Selling and administrative expenses as a percentage of revenue for the year ended December 31, 2016Net revenues increased primarily due to acquisitions, increased investment spending and inflation in excess of productivity.productivity and increased investment spending. These increases were partially offset by favorable volume leverage, due to increased volume and lowera year-over-year decrease in restructuring and acquisition costs.expenses and the beneficial impact of our QMI divestiture on current year operations. Inflation in excess of productivity reflects increases to variable compensation and a return to a more normalized level of other discretionary business spending that was reduced or delayed in the prior year as a result of the COVID-19 pandemic. The increased investment spending similarly reflects a return to a full-year focus of investing in business initiatives to drive future growth and realize our vision of seamless access with a focus on software and connected products. The increase also reflects that certain of these investments were temporarily frozen or delayed in 2020 due to the economic uncertainty surrounding the COVID-19 pandemic.
Volume leverage represents the contribution margin related to changes in sales volume, excluding the impact of price, productivity, mix and inflation. Expenses related to increased head count for strategic initiatives, new facilities or significant spending for strategic initiatives or new product and channel development, are captured in Investment spending in the table above.
Operating Income/Margin
Operating income for the year ended December 31, 20172021, increased $62.7$126.7 million from the same period in 20162020, and operatingOperating margin increased to 20.3%18.5% from 19.0% for the same period in 201614.8%, due to the following:
|
| | | | | | |
| in millions | Operating Income | | Operating Margin |
| December 31, 2016 | $ | 425.5 |
| | 19.0 | % |
| Pricing and productivity in excess of inflation | 35.0 |
| | 1.2 | % |
| Volume/product mix | 29.4 |
| | 0.5 | % |
| Currency exchange rates | 4.3 |
| | 0.1 | % |
| Investment spending | (15.3 | ) | | (0.7 | )% |
| Acquisitions | (0.6 | ) | | (0.3 | )% |
| Environmental remediation charge | 15.0 |
| | 0.7 | % |
| Restructuring / acquisition costs | (5.1 | ) | | (0.2 | )% |
| December 31, 2017 | $ | 488.2 |
| | 20.3 | % |
| | | | | | | | | | | |
| In millions | Operating Income | | Operating Margin |
| December 31, 2020 | $ | 403.5 | | | 14.8 | % |
| Inflation in excess of pricing and productivity | (34.9) | | | (1.7) | % |
| Volume / product mix | 9.3 | | | (0.2) | % |
| Currency exchange rates | 8.1 | | | 0.1 | % |
| Investment spending | (19.4) | | | (0.7) | % |
| Acquisitions/ divestitures | 4.4 | | | 0.3 | % |
| Restructuring / acquisition expenses | 19.6 | | | 0.8 | % |
| Impairment of goodwill and intangible assets | 101.7 | | | 3.7 | % |
| Loss on assets held for sale | 37.9 | | | 1.4 | % |
| December 31, 2021 | $ | 530.2 | | | 18.5 | % |
The increase in Operating income and operating margin both increasedwas primarily due to the prior year goodwill and intangible asset impairment charges and the loss on assets held for sale related to our QMI business, which did not recur in the current year. Also contributing to the increase in Operating income were favorable volume/product mix, in all of our segments, pricing improvementslower year-over-year restructuring and productivity in excess of inflation,acquisition expenses, favorable foreign currency exchange rate movements and lower environmental remediation charges in the beneficial impact of our QMI divestiture on current year due to a charge in the prior year for a change in approach for environmental remediation related to two sites in the Americas.operations. These increases were partially offset by inflation in excess of pricing and productivity and increased investment spending. As discussed above, inflation in excess of pricing and productivity reflects the impacts of increased commodity, material component, packaging, freight and labor inflation; inefficiencies caused by the global supply chain challenges; and shortages of materials, components and labor, as well as increases in variable compensation and other discretionary business spending to a more normalized level in the current year. Similarly, the increased investment spending reflects a return to a full-year focus of investing in business initiatives to drive future growth and realize our vision of seamless access with a focus on software and connected products. The increase also reflects that certain of these investments were temporarily frozen or delayed in 2020 due to the economic uncertainty surrounding the COVID-19 pandemic.
The increase in Operating margin was also primarily due to the prior year goodwill and intangible asset impairment charges and the impact of acquisitions and higherloss on assets held for sale related to our QMI business, which did not recur in the current year. Also contributing to the increase in Operating margin were lower year-over-year restructuring and acquisition costs.
Operating income for the year ended December 31, 2016 increased $66.9 million and operating margin increased to 19.0% from 17.3% for the same period in 2015 due to the following:
|
| | | | | | |
| in millions | Operating Income | | Operating Margin |
| December 31, 2015 | $ | 358.6 |
| | 17.3 | % |
| Pricing and productivity in excess of inflation | 13.6 |
| | 0.5 | % |
| Volume/product mix | 44.0 |
| | 1.2 | % |
| Non-cash inventory impairment | 4.2 |
| | 0.2 | % |
| Currency exchange rates | 4.6 |
| | 0.3 | % |
| Investment spending | (12.3 | ) | | (0.6 | )% |
| Acquisitions / divestitures | 7.3 |
| | (0.2 | )% |
| Environmental remediation charge | (15.0 | ) | | (0.7 | )% |
| Restructuring / acquisition costs | 20.5 |
| | 1.0 | % |
| December 31, 2016 | $ | 425.5 |
| | 19.0 | % |
Operating income increased primarily due to favorable volume/product mix in all of our segments, pricing improvements and productivity in excess of inflation, lower restructuring and acquisition costs, the impact of acquisitions and divestitures, inventory impairment charges in Venezuela in the prior year that did not occur in the current year andexpenses, favorable foreign currency exchange rate movements.movements and the beneficial impact of our QMI divestiture on current year operations. These increases were partially offset by investment spending and a charge for a change in approach for environmental remediation related to two sites in the Americas.
Operating margin increased primarily due to favorable volume/product mix in all of our segments, pricing improvements and productivityinflation in excess of inflation, lower restructuringpricing and acquisition costs, inventory impairment charges in Venezuela in the prior yearproductivity and favorable foreign currency exchange rate movements. These increases were partially offset byincreased investment spending as discussed above, as well as unfavorable product mix, which exceeded the impact of acquisitions and divestitures, and a charge for a change in approach for environmental remediation related to two sites inmargin benefits from the Americas.sales volume growth during the year.
Interest Expense
Interest expense for the year ended December 31, 2017 increased $41.42021, decreased $0.9 million compared to the same period in 2016. Interest expense increased2020, primarily due to $44.7 million of costs associated with the refinancing ofa lower weighted-average interest rate on our Credit Facilities, issuance of our new 3.200% and 3.550% Senior Notes, and redemption of our previously outstanding Senior Notes due 2021 and 2023.indebtedness.
Interest expense for the year ended December 31, 2016 increased $11.4 million compared with the same period of 2015. Interest expense increased primarily due to increased debt balances from the September 2015 issuance of the Senior Notes due 2023.
Loss on Divestitures
During the year ended December 31, 2015 we entered into an agreement to sell a majority stake in our systems integration business in China and recorded a pre-tax charge of $78.1 million ($82.4 million after tax charges) to write the carrying value of the assets and liabilities down to their estimated fair value less costs to complete the transaction. During the year ended December 31, 2016 we recorded an additional after tax charge of $84.4 million to further write-down the carrying value of consideration receivable related to this divestiture.
Other income,Income, net
The components of Other income, net, for the yearyears ended December 31 were as follows:
| | | In millions | | 2017 | | 2016 | | 2015 | In millions | | 2021 | | 2020 | |
| Interest income | | $ | (1.2 | ) | | $ | (1.9 | ) | | $ | (1.5 | ) | Interest income | | $ | (0.4) | | | $ | (0.9) | | |
| Exchange loss | | 0.7 |
| | 2.0 |
| | 4.9 |
| |
| (Earnings) loss from and (gains) on the sale of equity investments | | (5.4 | ) | | (3.6 | ) | | 0.3 |
| |
| Foreign currency exchange loss | | Foreign currency exchange loss | | 2.7 | | | 0.7 | | |
| Earnings and gains from the sale of equity method investments, net | | Earnings and gains from the sale of equity method investments, net | | (6.4) | | | (0.3) | | |
| Net periodic pension and postretirement benefit income, less service cost | | Net periodic pension and postretirement benefit income, less service cost | | (7.1) | | | (2.2) | | |
| Other | | (7.3 | ) | | (14.7 | ) | | (11.5 | ) | Other | | (32.8) | | | (10.3) | | |
| Other income, net | | $ | (13.2 | ) | | $ | (18.2 | ) | | $ | (7.8 | ) | Other income, net | | $ | (44.0) | | | $ | (13.0) | | |
For the year ended December 31, 2017, Other income, net decreased by $5.0 million compared to the same period in 2016. During the year ended December 31, 2017 we recorded a cumulative gain of $5.4 million from the sale of iDevices, LLC, and gains of $7.3 million related to legal entity liquidations in our Asia Pacific region, of which $2.2 million has been attributed to noncontrolling interests.
For the year ended December 31, 2016,2021, Other income, net increased by $10.4$31.0 million compared withto 2020, primarily due to a $20.7 million gain in the same periodfourth quarter related to a fair value remeasurement of our investment in 2015. During the year ended December 31, 2016 we recorded gains from the sale of marketable securities of $12.4 million, whichVergeSense, Inc. This gain is included within Other in the table above. Additionally, earningsAlso contributing to the increase in Other income, net, are an increase in other realized and unrealized investment gains during the year, favorable net periodic pension and postretirement benefit income, less service cost, and a gain of $6.4 million from the sale of our equity method investment in Nuki Home Solutions GmbH, which is included in Earnings and gains from the sale of equity method investments, increased primarily duenet in the table above. These increases are partially
offset by gains of $12.8 million in the prior year, which did not recur in 2021, related to a gain recognized by an investmentthe reclassification to earnings of accumulated foreign currency translation adjustments upon the liquidation of two legal entities in 2016.our former EMEA region, and which are included within Other in the table above.
Provision for Income Taxes
On December 22, 2017, the President of the United States signed comprehensive tax legislation commonly referred to as the Tax Cuts and Jobs Act (the “Tax Reform Act”). The Tax Reform Act makes broad and complex changes to the U.S. tax code which will impact our year ended December 31, 2017 including, but not limited to (1) reducing the U.S. federal corporate tax rate, (2) requiring a one-time transition tax on certain unrepatriated earnings of foreign subsidiaries that may electively be paid over eight years, and (3) requiring a review of the future realizability of deferred tax balances.
For the year ended December 31, 2017,2021, our effective tax rate was 30.1%7.8%, compared to 21.6%13.9% for the year ended December 31, 2016.2020. The effective income tax rate fordecrease in the year ended December 31, 2017 was negatively impacted by a $53.5 million tax charge related to the Tax Reform Act, which was partially offset by the release of $10.4 million of valuation allowances. The effective income tax rate for the year ended December 31, 2016 was negatively impacted by $84.4 million (before and after tax) of charges related to the divestiture of our systems integration business in China during 2015.
For the year ended December 31, 2016, our effective tax rate was 21.6% comparedprimarily due to 26.1% for the year ended December 31, 2015. The effective incomeunfavorable tax rate forimpact recognized in 2020 related to goodwill and intangible asset impairment charges, favorable settlements of uncertain tax positions and the year ended December 31, 2016 was negatively impacted by $84.4 million (before and after tax) of chargesunfavorable tax impact recognized in 2020 related to the divestiturerecording of our systems integration business in China during 2015. The effective income tax rate for the ended December 31, 2015 was negatively impacted by $111.3 million ($115.0 million after tax) of charges related to the divestiture of our systems integration business in China, the divestiture of our business in Venezuela and the devaluation of the Venezuelan bolivar. Excluding these charges, the effective tax rate for the year ended December 31, 2016 increased primarily due to increases in uncertain tax positions in 2016 thatvaluation allowances, which were partially offset by favorable changesan unfavorable year-over-year change in theshare-based compensation deductions and an unfavorable mix of income earned in lower tax rate jurisdictions and the continued execution of our tax strategies.jurisdictions.
Review of Business Segments
We operate in and report financial results for threetwo segments: Allegion Americas EMEIA, and Asia Pacific.Allegion International. These segments represent the level at which our chief operating decision maker reviews companyour financial performance and makes operating decisions.
Segment operating income is the measure of profit and loss that our chief operating decision maker uses to evaluate the financial performance of the business and as the basis for resource allocation, performance reviews and compensation. For these reasons, we believe that Segment operating income represents the most relevant measure of Segment profit and loss. Our chief operating decision maker may exclude certain charges or gains, such as corporate charges and other special charges, from operating income to arrive at a Segment operating income that is a more meaningful measure of profit and loss upon which to base our operating decisions. We define Segment operating margin as Segment operating income (loss) as a percentage of netthe segment's Net revenues.
The segment discussions that follow describe the significant factors contributing to the changes in results for each segment included in continuing operations.Net earnings. As previously announced, effective January 1, 2021, we combined our previous operations in EMEA and Asia Pacific into a new segment named Allegion International, in addition to renaming our Americas segment "Allegion Americas". Business segment information for EMEA and Asia Pacific for the year ended December 31, 2020, has been combined in the segment results of operations presented below to reflect this change in reportable segments.
Segment Results of Operations - For the years ended December 31
| | | | | | | | | | | | | | | | | | | | | | | |
| In millions | 2021 | | 2020 | | % Change | | | | | | |
| Net revenues | | | | | | | | | | | |
| Allegion Americas | $ | 2,072.2 | | | $ | 2,016.7 | | | 2.8 | % | | | | | | |
| Allegion International | 795.2 | | | 703.2 | | | 13.1 | % | | | | | | |
| Total | $ | 2,867.4 | | | $ | 2,719.9 | | | | | | | | | |
| | | | | | | | | | | |
| Segment operating income (loss) | | | | | | | | | | | |
| Allegion Americas | $ | 525.0 | | | $ | 580.2 | | | (9.5) | % | | | | | | |
| Allegion International | 82.4 | | | (102.1) | | | 180.7 | % | | | | | | |
| Total | $ | 607.4 | | | $ | 478.1 | | | | | | | | | |
| | | | | | | | | | | |
| Segment operating margin | | | | | | | | | | | |
| Allegion Americas | 25.3 | % | | 28.8 | % | | | | | | | | |
| Allegion International | 10.4 | % | | (14.5) | % | | | | | | | | |
|
| | | | | | | | | | | | | | | | | | | | | |
| in millions | 2017 | | 2016 | | % Change | | 2016 | | 2015 | | % Change |
| Net revenues | | | | | | | | | | | |
| Americas | $ | 1,767.5 |
| | $ | 1,645.7 |
| | 7.4 | % | | $ | 1,645.7 |
| | $ | 1,558.4 |
| | 5.6 | % |
| EMEIA | 523.5 |
| | 485.9 |
| | 7.7 | % | | 485.9 |
| | 386.3 |
| | 25.8 | % |
| Asia Pacific | 117.2 |
| | 106.4 |
| | 10.2 | % | | 106.4 |
| | 123.4 |
| | (13.8 | )% |
| Total | $ | 2,408.2 |
| | $ | 2,238.0 |
| | | | $ | 2,238.0 |
| | $ | 2,068.1 |
| | |
| | | | | | | | | | | | |
| Segment operating income (loss) | | | | | | | | | | | |
| Americas | $ | 503.3 |
| | $ | 448.1 |
| | 12.3 | % | | $ | 448.1 |
| | $ | 418.0 |
| | 7.2 | % |
| EMEIA | 45.2 |
| | 35.9 |
| | 25.9 | % | | 35.9 |
| | 8.6 |
| | 317.4 | % |
| Asia Pacific | 9.5 |
| | 6.1 |
| | 55.7 | % | | 6.1 |
| | (3.4 | ) | | 279.4 | % |
| Total | $ | 558.0 |
| | $ | 490.1 |
| | | | $ | 490.1 |
| | $ | 423.2 |
| | |
| | | | | | | | | | | | |
| Segment operating margin | | | | | | | | | | | |
| Americas | 28.5 | % | | 27.2 | % | | | | 27.2 | % | | 26.8 | % | | |
| EMEIA | 8.6 | % | | 7.4 | % | | | | 7.4 | % | | 2.2 | % | | |
| Asia Pacific | 8.1 | % | | 5.7 | % | | | | 5.7 | % | | (2.8 | )% | | |
Allegion Americas
Our Allegion Americas segment is a leading provider of security products and solutions in approximately 30 countries throughout North America, Central America, the Caribbean and South America. The segment sells a broad range of products and solutions including, locks, locksets, portable locks, key systems, door closers, exit devices, doors and door systems, electronic productproducts and access control systems to end-users in commercial, institutional and residential facilities, including into the education, healthcare, government, hospitality, commercial office and single and multi-family residential markets. This segment’s primary brands are LCN, Schlage, Steelcraft, Technical Glass Products ("TGP") and Von Duprin and LCN.Duprin.
Net revenues
Net revenues for the year ended December 31, 20172021, increased by 7.4%2.8%, or $121.8$55.5 million,, compared to the same period in 20162020, due to the following:
|
| | | | |
| Pricing | 2.01.9 | % |
| Volume | 3.80.5 | % |
Acquisitions | 1.4 | % |
| Currency exchange rates | 0.20.4 | % |
| Total | 7.42.8 | % |
The increase in Net revenues was due toprincipally driven by higher volumes, improved pricing and the impact of an acquisition in January 2017, and favorable foreign currency exchange rate movements. The increase in sales volumes for the year was principally realized during the second quarter, given the muted demand and temporary plant shut-downs we experienced in the second quarter of 2020 due to the COVID-19 pandemic. However, the supply chain disruptions and delays and shortages in materials, components and labor discussed above have resulted in lower volumes during the second half of 2021. While these challenges are expected to continue into 2022, given the current elevated demand we are experiencing, we expect volume growth to resume as conditions improve.
Net revenues from non-residential products for the year ended December 31, 2017 increased high single digitswere flat compared to the same period in the prior year dueyear. While we continue to market growth,see strong demand for our non-residential products, the persistent and widespread supply chain challenges and shortages in materials, components (including electronic components) and labor discussed above have led to challenges in converting this elevated demand into Net revenues. Further, the combination of these factors has also culminated in our highest non-residential product launches and channel initiatives. backlog to date as a company as of December 31, 2021.
Net revenues from residential products for the year ended December 31, 2017 increased mid-singleby a low double digits percent compared to the same periodprior year, driven significantly by the muted demand and temporary plant shut-downs we experienced in the prior year primarilysecond quarter of 2020 due to domesticthe COVID-19 pandemic. While we continue to see strong demand for our residential products due to a sustained level of DIY home projects and a robust residential housing construction market, growth.we also experienced supply chain challenges and electronic component shortages in the second half of 2021, which we expect to continue through 2022.
Additionally, growth in electronic security products and solutions has become an increased metric monitored by management and a focus of our investors. Electronic products encompass both residential and non-residential products, and include all electrified product categories including, but not limited to, electronic and electrified locks, access controls and electrified exit devices. Net revenues from the sale of electronic products decreased by a low single digits percent compared to 2020. As previously disclosed, a surge in global demand for electronic components has led to supply chain challenges and component shortages. This has led to a reduction in the allocations of electronic components we receive from key suppliers, periodic production interruptions and delays in our ability to meet the elevated level of demand for our electronic products in the second half of 2021. While considered temporary, we expect these challenges around the availability of electronic components to continue through 2022. As a result, we are actively implementing measures to mitigate the operational and distribution inefficiencies these component shortages and other challenges are creating, such as re-engineering product designs and configurations and developing alternate sources of component supply.
Operating income/margin
Segment operating income for the year ended December 31, 2017 increased2021, decreased $55.2 million, and segmentSegment operating margin increaseddecreased to 28.5%25.3% from 27.2%28.8% compared to the same period in 20162020, due to the following:
| | | | | | | | | | | |
| In millions | Operating Income | | Operating Margin |
| December 31, 2020 | $ | 580.2 | | | 28.8 | % |
| Inflation in excess of pricing and productivity | (31.5) | | | (2.2) | % |
| Volume / product mix | (17.3) | | | (1.0) | % |
| Currency exchange rates | 2.3 | | | 0.1 | % |
| Investment spending | (14.1) | | | (0.7) | % |
| | | |
| Restructuring / acquisition expenses | 5.4 | | | 0.3 | % |
| December 31, 2021 | $ | 525.0 | | | 25.3 | % |
|
| | | | | | |
| in millions | Operating Income | | Operating Margin |
| December 31, 2016 | $ | 448.1 |
| | 27.2 | % |
| Pricing and productivity in excess of inflation | 29.3 |
| | 1.2 | % |
| Volume / Product mix | 22.2 |
| | 0.3 | % |
| Currency exchange rates | 2.6 |
| | 0.1 | % |
| Investment spending | (10.7 | ) | | (0.6 | )% |
| Acquisitions | 0.3 |
| | (0.4 | )% |
| Environmental remediation charge | 15.0 |
| | 0.9 | % |
| Restructuring / acquisition costs | (3.5 | ) | | (0.2 | )% |
| December 31, 2017 | $ | 503.3 |
| | 28.5 | % |
OperatingThe decreases in Segment operating income increasedand Segment operating margin were primarily due to pricing improvements and productivityinflation in excess of inflation, favorable volume/pricing and productivity, unfavorable product mix, favorable foreign currency exchange rate movements, lower environmental remediation charges inwhich exceeded the currentbenefits from sales volume growth during the year, due to a charge in the prior year for a change in approach for environmental remediation related to two sites in the U.S., and the impact of acquisitions.increased investment spending. These increasesdecreases were partially offset by increased investment spending primarily for new product development and channel development anda year-over-year decrease in restructuring and acquisition costs.
Operating margin increased primarily due to pricing improvements and productivity in excess of inflation, favorable volume/product mix, favorable foreign currency exchange rate movements, and lower environmental remediation charges in the current year due to a charge in the prior year for a change in approach for environmental remediation related to two sites in the U.S. These increases were partially offset by increased investment spending primarily for new product development and channel development, restructuring and acquisition costs,expenses and the impact of acquisitions.
2016 vs 2015
Net revenues
Net revenues for the year ended December 31, 2016 increased by 5.6%, or $87.3 million, compared to the same period in 2015 due to the following:
|
| | |
Pricing | 0.9 | % |
Volume | 5.6 | % |
Acquisitions | (0.6 | )% |
Currency exchange rates | (0.3 | )% |
Total | 5.6 | % |
The increase in revenues was primarily due to higher volumes and improved pricing. Net revenues from non-residential products for the year ended December 31, 2016 increased mid to high single digits compared to the same period in the prior year due to market growth, product launches, and channel initiatives. Net revenues from residential products for the year ended December 31, 2016 increased low single digits compared to the same period in the prior year primarily due to domestic market growth. These increases were partially offset by unfavorable foreign currency exchange movements and the 2015 divestiture of our Venezuelan operation.
Operating income/margin
Segment operating income for the year ended December 31, 2016 increased $30.1 million and segment operating margin increased to 27.2% from 26.8% compared to the same period in 2015 due to the following:
|
| | | | | | |
| in millions | Operating Income | | Operating Margin |
| December 31, 2015 | $ | 418.0 |
| | 26.8 | % |
| Pricing and productivity in excess of inflation | 9.9 |
| | 0.4 | % |
| Volume / Product mix | 40.2 |
| | 1.0 | % |
| Non-cash inventory impairment | 4.2 |
| | 0.3 | % |
| Currency exchange rates | 6.5 |
| | 0.5 | % |
| Investment spending | (6.4 | ) | | (0.4 | )% |
| Acquisitions / divestitures | (7.4 | ) | | (0.3 | )% |
| Environmental remediation charge | (15.0 | ) | | (1.0 | )% |
| Restructuring / acquisition costs | (1.9 | ) | | (0.1 | )% |
| December 31, 2016 | $ | 448.1 |
| | 27.2 | % |
The increases were primarily due to favorable volume/product mix, inventory impairment charges year-over-year in Venezuela, pricing improvements and productivity in excess of inflation and favorable foreign currency exchange rate movements. These increases were partially offsetInflation in excess of pricing and productivity reflects the impacts of the increased commodity, material component, packaging, freight and labor inflation; inefficiencies caused by the divestitureglobal supply chain challenges; and shortages of our Venezuelan operations,materials, components and labor discussed above, as well as increases in variable compensation and other discretionary business spending to a more normalized level in the current year. Similarly, the increased investment spending primarily for new product developmentreflects a return to a full-year focus of investing in business initiatives to drive future growth and channel development, restructuringrealize our vision of seamless access with a focus on software and acquisition costs and a charge for a changeconnected products. The increase also reflects that certain of these investments were temporarily frozen or delayed in approach for environmental remediation at two sites in2020 due to the U.S.economic uncertainty surrounding the COVID-19 pandemic.
EMEIAAllegion International
Our EMEIAAllegion International segment provides security products, services and solutions in approximately 85 countriesprimarily throughout Europe, the Middle East, IndiaAsia and Africa.Oceania. The segment offers end-users a broad range of products, services and solutions including locks, locksets, portable locks, key systems, door closers, exit devices, doors and door systems, electronic productproducts and access control systems, as well as time and attendance and workforce productivity solutions. This segment’s primary brands are AXA, Bricard, Briton, CISA, Gainsborough, Interflex and SimonsVoss. This segment also resells Schlage, Von Duprin and LCN products, primarily in the Middle East.
2017 vs 2016
Net revenues
Net revenues for the year ended December 31, 2017 increased by 7.7%, or $37.6 million, compared to the same period in 2016 due to the following:
|
| | |
Pricing | 1.6 | % |
Volume | 3.1 | % |
Acquisitions | 1.6 | % |
Currency exchange rates | 1.4 | % |
Total | 7.7 | % |
The increase in revenues was due to higher volumes, improved pricing, the impact of an acquisition made in the prior year, and favorable foreign currency exchange rate movements.
Operating income/margin
Segment operating income for the year ended December 31, 2017 increased $9.3 million and segment operating margin increased to 8.6% from 7.4% compared to the same period in 2016 due to the following:
|
| | | | | | |
| in millions | Operating Income | | Operating Margin |
| December 31, 2016 | $ | 35.9 |
| | 7.4 | % |
| Pricing and productivity in excess of inflation | 5.1 |
| | 0.9 | % |
| Volume / Product mix | 5.2 |
| | 0.8 | % |
| Currency exchange rates | 1.3 |
| | 0.1 | % |
| Investment spending | (2.4 | ) | | (0.5 | )% |
| Acquisitions | (0.9 | ) | | (0.3 | )% |
| Restructuring / acquisition costs | 1.0 |
| | 0.2 | % |
| December 31, 2017 | $ | 45.2 |
| | 8.6 | % |
The increases were primarily due to pricing improvements and productivity in excess of inflation, improvements in volume/product mix, favorable foreign currency exchange rate movements, and year-over-year change in restructuring and acquisition costs. These increases were partially offset by increased investment spending and the impact from an acquisition in the prior year.
2016 vs 2015
Net revenue
Net revenues for the year ended December 31, 2016 increased by 25.8%, or $99.6 million, compared to the same period in 2015 due to following:
|
| | |
Pricing | 1.2 | % |
Volume | 1.0 | % |
Acquisitions / divestitures | 25.4 | % |
Currency exchange rates | (1.8 | )% |
Total | 25.8 | % |
The increase in revenues was primarily due to the full-year impact of acquisitions made in 2015, slightly higher volumes and improved pricing offset by unfavorable foreign currency exchange rate movements.
Operating income/margin
Segment operating income for the year ended December 31, 2016 increased $27.3 million and operating margin increased to 7.4% from 2.2% compared to the same period in 2015 due to the following:
|
| | | | | | |
| in millions | Operating Income | | Operating Margin |
| December 31, 2015 | $ | 8.6 |
| | 2.2 | % |
| Pricing and productivity in excess of inflation | 9.4 |
| | 1.6 | % |
| Volume / Product mix | 0.2 |
| | — | % |
| Currency exchange rates | (1.9 | ) | | (0.5 | )% |
| Investment spending | (2.2 | ) | | (0.6 | )% |
| Acquisitions / divestitures | 9.0 |
| | 1.4 | % |
| Restructuring / acquisition costs | 12.8 |
| | 3.3 | % |
| December 31, 2016 | $ | 35.9 |
| | 7.4 | % |
The increases were primarily due to pricing improvements and productivity in excess of inflation, the impact of 2015 acquisitions, slight improvement in volume/product mix and year-over-year change in restructuring and acquisition costs. These increases were partially offset by unfavorable foreign currency exchange rate movements and increased investment spending.
Asia Pacific
Our Asia Pacific segment provides security products and solutions in approximately 15 countries throughout the Asia Pacific region. The segment offers end-users a broad range of products, services and solutions including, locks, locksets, portable locks, key systems, door closers, exit devices, electronic product and access control systems. This segment’s primary brands are Milre, Schlage, Legge, Brio and FSH.
2017 vs 2016
Net revenues
Net revenues for the year ended December 31, 2017 increased by 10.2%, or $10.8 million, compared to the same period in 2016, due to the following:
|
| | |
Pricing | 0.4 | % |
Volume | 7.3 | % |
Acquisitions | 0.7 | % |
Currency exchange rates | 1.8 | % |
Total | 10.2 | % |
The increase in revenues was due to higher volumes, improved pricing, the impact of an acquisition made in the prior year, and favorable foreign currency exchange rate movements.
Operating income/margin
Segment operating income for the year ended December 31, 2017 increased $3.4 million and segment operating margin increased to 8.1% from 5.7% compared with the same period in 2016 due to the following:
|
| | | | | | |
| in millions | Operating Income | | Operating Margin |
| December 31, 2016 | $ | 6.1 |
| | 5.7 | % |
| Pricing and productivity in excess of inflation | 1.5 |
| | 1.3 | % |
| Volume / Product mix | 2.0 |
| | 1.3 | % |
| Currency exchange rates | 0.4 |
| | 0.3 | % |
| Investment spending | (0.4 | ) | | (0.4 | )% |
| Acquisitions | (0.1 | ) | | (0.1 | )% |
| December 31, 2017 | $ | 9.5 |
| | 8.1 | % |
The increases wereprimarily related to pricing improvements and productivity in excess of inflation, improved volume/product mix, and favorable foreign currency exchange rate movements. These increases were partially offset by increased investment spending and the impact of an acquisition in the prior year.
2016 vs 2015
Net revenues
Net revenues for the year ended December 31, 2016 decreased2021, increased by 13.8%13.1%, or $17.0$92.0 million, compared withto the same period of 2015,in 2020, due to the following:
|
| | | | |
| Pricing | 0.41.5 | % |
| Volume | 7.18.9 | % |
| Acquisitions / divestitures | (19.7(2.0) | )% |
| Currency exchange rates | (1.64.7 | )% |
| Total | (13.813.1 | )% |
The decreaseincrease in Net revenues was primarily dueprincipally driven by higher volumes and foreign currency exchange rate movements, in addition to improved pricing, and were partially offset by the divestiture of our systems integrationQMI business in China in the fourth quarter of 2015, as well as unfavorable foreign currency exchange rate movements. These decreases were partially offset byFebruary 2021. The higher volumes, acquisition revenueled by our Global Portable Security businesses, were achieved across nearly all of the countries within our Allegion International segment, reflecting in part the global economic rebound in 2021, contrasted with the depressed demand and slightly improved pricingtemporary plant shut-downs we experienced in our remaining business.2020 due to the COVID-19 pandemic.
Operating income/income (loss)/margin
Segment operating income (loss) for the year ended December 31, 2016 increased $9.52021, was favorable $184.5 million, and segmentSegment operating margin increasedimproved to 5.7%10.4% from (2.8)(14.5)% compared withto the same period in 20152020, due to the following:
|
| | | | | | |
| in millions | Operating Income | | Operating Margin |
| December 31, 2015 | $ | (3.4 | ) | | (2.8 | )% |
| Inflation in excess of pricing and productivity | (0.4 | ) | | (0.1 | )% |
| Volume / Product mix | 3.5 |
| | 2.8 | % |
| Investment spending | (1.1 | ) | | (0.9 | )% |
| Acquisitions / divestitures | 5.6 |
| | 5.1 | % |
| Restructuring / acquisition costs | 1.9 |
| | 1.6 | % |
| December 31, 2016 | $ | 6.1 |
| | 5.7 | % |
| | | | | | | | | | | |
| In millions | Operating Income (Loss) | | Operating Margin |
| December 31, 2020 | $ | (102.1) | | | (14.5) | % |
| Inflation in excess of pricing and productivity | (2.7) | | | (0.5) | % |
| Volume / product mix | 26.5 | | | 2.8 | % |
| Currency exchange rates | 5.9 | | | 0.4 | % |
| Investment spending | (2.3) | | | (0.4) | % |
| Acquisitions / divestitures | 4.4 | | | 0.8 | % |
| Restructuring / acquisition expenses | 13.1 | | | 1.9 | % |
| Impairment of goodwill and intangible assets | 101.7 | | | 14.5 | % |
| Loss on assets held for sale | 37.9 | | | 5.4 | % |
| December 31, 2021 | $ | 82.4 | | | 10.4 | % |
The increasesimprovements in Segment operating income (loss) and Segment operating margin were primarily due to the prior year goodwill and intangible asset impairment charges and the loss on assets held for sale related to improvedour QMI business, which did not recur in the current year. Additional improvements were due to favorable volume/product mix, the divestiturea year-over-year decrease in
restructuring and acquisition costs.expenses, favorable foreign currency exchange rate movements and the beneficial impacts of our current year acquisition and divestiture in the Allegion International segment. These increases were partially offset by increased investment spending and inflation in excess of pricing and productivity.productivity and increased investment spending.
Additionally, while our Allegion International segment did not experience the supply chain disruptions and delays and other operational and logistical challenges to the same extent as our Allegion Americas segment in 2021, these challenges have increased during the fourth quarter of 2021, and we currently expect them to continue into 2022.
Liquidity and Capital Resources
Sources and uses of liquidity
Our primary source of liquidity is cash provided by operating activities. Cash provided by operating activities is used to invest in new product development, fund capital expenditures and fund working capital requirements and is expected to be adequate to service any future debt, pay any declared dividends and potentially fund acquisitions and share repurchases. Our ability to fund these capital needs depends on our ongoing ability to generate cash provided by operating activities, and to access our borrowing facilities (including unused availability under our Revolving Facility) and capital markets. We believe that our future cash provided by operating activities, availability under our Revolving Facility and access to funds on hand and capital markets, will provide adequate resources to fund our operating and financing needs.
The following table reflects the major categories of cash flows for the years ended December 31. For additional details, please see the Consolidated Statements of Cash Flows in the Consolidated Financial Statements.
| | | | | | | | | | | | | | | | |
| In millions | | 2021 | | 2020 | | |
| Net cash provided by operating activities | | $ | 488.6 | | | $ | 490.3 | | | |
| Net cash used in investing activities | | (31.6) | | | (56.7) | | | |
| Net cash used in financing activities | | $ | (529.3) | | | $ | (321.9) | | | |
|
| | | | | | | | | | | | |
| In millions | | 2017 | | 2016 | | 2015 |
| Cash provided by continuing operating activities | | $ | 347.2 |
| | $ | 377.5 |
| | $ | 257.4 |
|
| Cash used in investing activities | | (50.2 | ) | | (64.0 | ) | | (533.8 | ) |
| Cash (used in) provided by financing activities | | $ | (150.9 | ) | | $ | (196.0 | ) | | $ | 195.0 |
|
Operating activities
: Net cash provided by continuing operating activities for the year ended December 31, 2017 decreased $30.3 million2021, was nearly flat compared to the same period in 2016. Operating cash flows for 2017 reflect a discretionary $50.02020, decreasing by $1.7 million, contribution to the U.S. qualified defined benefit pension plan andas increased cash paid for taxes, whichNet earnings were partially offset by higher net earnings compared toworking capital challenges, principally stemming from the same period in the prior year.supply chain disruptions and delays and related operational and logistical interruptions discussed above.
Net cash provided by continuing operating activities for the year ended December 31, 2016 increased $120.1 million compared to the same period in 2015. Operating cash flows for 2016 reflect higher net earnings compared to the same period in 2015.
Investing activities
: Net cash used in investing activities for the year ended December 31, 20172021, decreased $13.8$25.1 million compared to the same period in the prior year. The decrease in net cash used in investing activities is2020, primarily due to $15.6 million incash proceeds from the salesales of anour equity method investment during 2017 that did not occur in the prior yearNuki Home Solutions GmbH and other investments, as well as a $10.6 million decrease ofin cash payments related topaid for acquisitions. These changes were partially offset by $14.1 million of cash received from the sale of marketable securities in 2016 that did not recur in the current year.
Net cash used in investing activities for the year ended December 31, 2016 decreased $469.8 million compared to the same period in the prior year. During the year ended December 31, 2016, cash used for acquisitions decreased $479.9 million compared to the year ended December 31, 2015. This was partially offset by an increase in capital expenditures of $7.3 million compared to 2015.
Financing activities
: Net cash used in financing activities for the year ended December 31, 2017 decreased $45.12021, increased $207.4 million compared to the same period in the prior year. The decrease2020, primarily due to an increase of $204.0 million in cash used in financing activities is due to net proceeds from debt issuances over debt repayments of $10.1 million in 2017 versus net debt repayments of $64.4 million during 2016. Current year debt financing activity includes the redemption of the 2021 and 2023 Senior Notes for a total of $600.0 million and the settlement of the previously outstanding Term Loan A Facility of $856.3 million, offset by the issuance of the 3.200% and 3.550% Senior Notes in an aggregate amount of $800.0 million and a new term loan facility maturing on September 12, 2022 (the "Term Facility") in the amount of $700.0 million. Additionally, during the year endedrepurchase shares.
Capitalization
At December 31, 2017, we repurchased $60.0 million of common shares, compared to $85.1 million during 2016. We also made dividend payments to ordinary shareholders of $60.9 million during the current year, compared to $46.0 million in 2016.
Net cash used in financing activities for the year ended December 31, 2016 increased $391.0 million compared to the same period in the prior year. Net repayments of debt totaled $64.4 million for the year ended December 31, 2016 primarily associated with required amortization payments from our previously outstanding Term Loan A Facility and repayments of other borrowings. Proceeds from long-term debt were $300.0 million for the year ended December 31, 2015. Cash used inand other financing activities increased $48.3 million for the year ended December 31, 2016 compared to the prior year primarily due to higher dividend payments and increased repurchases of our ordinary shares partially offset by lower debt issuance costs, lower proceeds from shares issued under incentive plans and a reduction in dividends paid to noncontrolling interests.
Capitalization
Borrowings at December 31borrowings consisted of the following:
| | | | | | | | | | | |
| In millions | 2021 | | 2020 |
| 2021 Term Facility | $ | 250.0 | | | $ | — | |
| Term Facility | — | | | 238.8 | |
| 2021 Revolving Facility | — | | | — | |
| Revolving Facility | — | | | — | |
| 3.200% Senior Notes due 2024 | 400.0 | | | 400.0 | |
| 3.550% Senior Notes due 2027 | 400.0 | | | 400.0 | |
| 3.500% Senior Notes due 2029 | 400.0 | | | 400.0 | |
| Other debt | 0.3 | | | 0.6 | |
| Total borrowings outstanding | 1,450.3 | | | 1,439.4 | |
| Less discounts and debt issuance costs, net | (8.2) | | | (9.8) | |
| Total debt | 1,442.1 | | | 1,429.6 | |
| Less current portion of long-term debt | 12.6 | | | 0.2 | |
| Total long-term debt | $ | 1,429.5 | | | $ | 1,429.4 | |
|
| | | | | | | |
| In millions | 2017 | | 2016 |
| Term Loan A Facility | $ | — |
| | $ | 879.8 |
|
| Term Facility | 691.3 |
| | — |
|
| Revolving Facility | — |
| | — |
|
| 5.750% Senior Notes due 2021 | — |
| | 300.0 |
|
| 5.875% Senior Notes due 2023 | — |
| | 300.0 |
|
| 3.200% Senior Notes due 2024 | 400.0 |
| | — |
|
| 3.550% Senior Notes due 2027 | 400.0 |
| | — |
|
| Other debt | 1.0 |
| | 2.3 |
|
| Total borrowings outstanding | 1,492.3 |
| | 1,482.1 |
|
| Less discounts and debt issuance costs, net | (15.0 | ) | | (18.3 | ) |
| Total debt | 1,477.3 |
| | 1,463.8 |
|
| Less current portion of long term debt | 35.0 |
| | 48.2 |
|
| Total long-term debt | $ | 1,442.3 |
| | $ | 1,415.6 |
|
As of December 31, 2017,In November 2021, we haveentered into a new unsecured credit agreement (the “2021 Credit Agreement”), which refinanced in full our previously outstanding unsecured Credit Facilities. The 2021 Credit Agreement in place that provides for up to $1,200.0 million in unsecured financing, consistingconsists of a $700.0$250.0 million term loan facility (the “Term“2021 Term Facility”) and a $500.0 million revolving credit facility (the “Revolving“2021 Revolving Facility” and, together with the 2021 Term Facility, the “Credit“2021 Credit Facilities”). The 2021 Credit Facilities mature on September 12, 2022.November 18, 2026. The
initial proceeds from the 2021 Term Facility amortizesof $250.0 million were used primarily to repay in full the outstanding borrowings under our previously outstanding unsecured Term Facility. All obligations under the previously outstanding Credit Agreement were
satisfied, all commitments thereunder were terminated, and all guarantees that had been granted in connection therewith were released.
The 2021 Term Facility will amortize in quarterly installments at the following rates: 1.25% per quarter starting DecemberMarch 31, 20172022 through DecemberMarch 31, 2020,2025, 2.5% per quarter from March, 31, 2021 throughstarting June 30, 2022,2025 through September 30, 2026, with the balance due on September 12, 2022. November 18, 2026. Any amounts outstanding under the 2021 Term Facility may be voluntarily prepaid at any time without premium or penalty, subject to customary breakage costs. Amounts borrowed under the 2021 Term Facility that are repaid may not be reborrowed.
The 2021 Revolving Facility provides aggregate commitments of up to $500.0 million, which includes up to $100.0 million for the issuance of letters of credit. At December 31, 2017,2021, there were no borrowings outstanding on the 2021 Revolving Facility and we had $17.4$8.7 million of letters of credit outstanding. Commitments under the 2021 Revolving Facility may be reduced at any time without premium or penalty, and amounts repaid may be reborrowed. Certain fees are owed with respect to the 2021 Revolving Facility, including an unused commitment fee on the undrawn portion of the 2021 Revolving Facility of between 0.090% and 0.200% per year, depending on our credit rating, as well as certain other fees.
Outstanding borrowings under the 2021 Credit Facilities accrue interest at our option of (i) a LIBORBloomberg Short-Term Bank Yield Index (“BSBY”) rate plus the applicable margin or (ii) a base rate plus the applicable margin. The applicable margin ranges from 1.125%0.875% to 1.500%1.375% depending on our credit ratings. To manage our exposure to fluctuations in LIBOR rates, we have interest rate swaps to fix the interest rate for $250.0 million ofAt December 31, 2021, the outstanding borrowings (see Note 10)under the 2021 Term Facility accrue interest at BSBY plus a margin of 1.125%, resulting in an interest rate of 1.271%. The 2021 Credit Facilities also contain negative and affirmative covenants and events of default that, among other things, limit or restrict our ability to enter into certain transactions. In addition, the 2021 Credit Facilities require us to comply with a maximum leverage ratio as defined within the agreement. As of December 31, 2021, our leverage ratio of approximately 1.8 was significantly below the covenant requirement and we do not anticipate any potential covenant concerns for at least the next 12 months.
As of December 31, 2017,2021, we also have $400.0 million outstanding of 3.200% Senior Notes due 2024 (the “3.200%"3.200% Senior Notes”Notes") and, $400.0 million outstanding of 3.550% Senior Notes due 2027 (the “3.550%"3.550% Senior Notes”Notes") and together with the 3.200%$400.0 million outstanding of 3.500% Senior Notes due 2029 (the "3.500% Senior Notes", and all three senior notes collectively, the “Notes”"Senior Notes"), both of which were issued on October 2, 2017.. The Senior Notes require semi-annual interest payments on April 1 and October 1 of each year, and will mature on October 1, 2024, October 1, 2027, and October 1, 2027,2029, respectively.
Historically, the majority of our earnings were considered to be permanently reinvested in jurisdictions where we have made, and intend to continue to make, substantial investments to support the ongoing development and growth of our global operations. As a result of the Tax Reform Act transition tax,At December 31, 2021, we are currently analyzinganalyzed our global working capital requirements and the potential tax liabilities that would be incurred if certain non-U.S. subsidiaries made distributions which include local country withholding tax and potential U.S. state taxation. We are not yet able to reasonably estimate the effect of this provision of the Tax Reform Act and have not recorded any withholding or state tax liabilities or any deferred taxes attributableconcluded that no material changes to our investment in our non-U.S. subsidiaries. historic permanent reinvestment assertions are required.
AtScheduled principal repayments on indebtedness as of December 31, 2017,2021 can be found in Note 9 to the Consolidated Financial Statements. Expected principal and interest payments related to our long-term indebtedness in 2022 amount to $12.6 million and $45.0 million, respectively, given our current level of indebtedness and effective interest rates as of December 31, 2021.
Liquidity Outlook
Our primary source of liquidity is cash provided by operating activities. Cash provided by operating activities is used to invest in new product development and fund capital expenditures and working capital requirements. Our ability to generate cash from our operating activities, our unused availability under our 2021 Revolving Facility and our access to the capital and credit markets enable us to fund these capital needs, as well as execute our long-term growth strategies and return value to our shareholders. As of December 31, 2021, we hadmaintain cash and cash equivalents of $466.2 million. Approximately 34%$397.9 million and have unused availability of $491.3 million under our 2021 Revolving Facility. Further, our business operates with strong operating cash flows, low leverage and low capital intensity, providing financial flexibility, including sufficient access to credit markets.
Short-term financing needs primarily consist of working capital requirements, restructuring initiatives, capital spending, dividend payments and principal and interest payments on our long-term debt. Long-term financing needs depend largely on potential growth opportunities, including potential acquisitions, repayment or refinancing of our long-term obligations and repurchases of our ordinary shares. Based upon our operations, existing cash balances and availability under our 2021 Credit Facilities, we expect cash equivalents were located outsideflows from operations to be sufficient to maintain a sound financial position and liquidity and to meet our financing needs for at least the U.S.next 12 months. Further, we do not anticipate any covenant compliance challenges with any of our outstanding indebtedness for at least the next 12 months. We also believe the availability under our 2021 Credit Facilities and access to credit and capital markets are sufficient to achieve our longer-term strategic plans.
PensionContractual Obligations and Other Commitments
In addition to the scheduled principal and interest payments discussed above, our material cash requirements include the following contractual and other obligations:
Purchase Commitments – We occasionally enter into short-term, firm purchase commitments to mitigate pricing risk related to certain of our commodity, parts and component purchases, which represent commitments under enforceable and legally binding agreements. Such purchase commitments are made in the normal course of business and are not anticipated to materially impact our liquidity or financial position over the next 12 months.
Leases – We have numerous real estate and equipment leasing arrangements for which we are a lessee. See Note 11 to the Consolidated Financial Statements for further information as to the short and long-term lease liabilities included within the Consolidated Balance Sheets, as well as future minimum lease payments for 2022 and future years.
Defined Benefit Plans
– Our investment objective in managing defined benefit plan assets is to ensure that all present and future benefit obligations are met as they come due. We seek to achieve this goal while trying to mitigate volatility in plan funded status, contributioncontributions and expense by better matching the characteristics of the plan assets to that of the plan liabilities. Global asset allocation decisions are based on a dynamic approach whereby a plan's allocation to fixed income assets increases as the funded status increases. We monitor plan funded status, and asset allocation regularly in addition to investment manager performance.
We monitorand the impact of market conditions on our defined benefit plans on a regular basis. In January 2017, we made a discretionary $50.0 million contributionregularly in addition to the U.S. qualifiedinvestment manager performance. None of our defined benefit pension plan. plans have experienced a significant impact on their liquidity due to volatility in the markets.
At December 31, 2017, the funded status of our qualified pension plan for U.S. employees increased to 93.3% from 73.6% at December 31, 2016, primarily as a result of this discretionary contribution. The funded status for our non-U.S. pension plans increased to 100.5% at December 31, 2017 from 92.9% at December 31, 2016. Funded status for all of our pension plans at December 31, 2017 increased to 95.5% from 83.3% at December 31, 2016. For further details on pension plan activity, see Note 11 to the Consolidated Financial Statements.
Contractual Obligations
The following table summarizes our contractual cash obligations by required payment periods, in millions:
|
| | | | | | | | | | | | | | | | | | | | |
| | | 2018 | | 2019-2020 | | 2021-2022 | | Thereafter | | Total |
| Long-term debt (including current maturities) | | $ | 35.0 |
| | $ | 70.0 |
| | $ | 586.3 |
| | $ | 801.0 |
| | $ | 1,492.3 |
|
| Interest payments on long-term debt | | 46.7 |
| | 90.5 |
| | 82.5 |
| | 89.9 |
| | 309.6 |
|
| Purchase obligations | | 169.5 |
| | — |
| | — |
| | — |
| | 169.5 |
|
| Operating leases | | 20.5 |
| | 30.9 |
| | 12.0 |
| | 13.3 |
| | 76.7 |
|
| Total contractual cash obligations | | $ | 271.7 |
| | $ | 191.4 |
| | $ | 680.8 |
| | $ | 904.2 |
| | $ | 2,048.1 |
|
Future expected obligations under our pension and postretirement benefit plans, income taxes, environmental and product liability matters have not been included in the contractual cash obligations table above.
Pensions
At December 31, 2017,2021, we had net pension liabilitiesassets of $32.2$22.9 million, which consist of plan assets of $681.6$775.9 million and benefit obligations of $713.8$753.0 million. It is our objective to contribute to theour pension plans in order to ensure adequate funds are available in the plans to make benefit payments to plan participants and beneficiaries when required. At December 31, 2021, the funded status of our U.S. pension plans increased to 97.2% from 92.1% at December 31, 2020. The funded status for our non-U.S. pension plans increased to 107.7% at December 31, 2021 from 101.8% at December 31, 2020. The funded status for all of our pension plans increased to 95.5% at December 31, 20172021 increased to 103.0% from 83.3%97.5% at December 31, 2016. We2020. While there are no required pension contributions for 2022, we currently project that an additionalexpect to contribute approximately $13.5$5 million will be contributed to our plans worldwide in 2018.Because the timing and amounts of long-term funding requirements for2022.For further details on pension obligations are uncertain, they have been excluded from the preceding table. Seeplan activity, see Note 1112 to the Consolidated Financial Statements for additional information.Statements.
Postretirement Benefits Other than Pensions
Income Taxes – At December 31, 2017, we had postretirement benefit obligations of $9.3 million. We fund postretirement benefit costs principally on a pay-as-you-go basis as medical costs are incurred by covered retiree populations. Benefit payments, which are net of expected plan participant contributions and Medicare Part D subsidy, are expected to be approximately $0.9 million in 2018. Because the timing and amounts of long-term funding requirements for postretirement obligations are uncertain, they have been excluded from the preceding table. See Note 11 to the Consolidated Financial Statements for additional information.
Income Taxes
At December 31, 2017,2021, we have total unrecognized tax benefits for uncertain tax positions of $29.0$41.5 million and $4.9$7.5 million of related accrued interest and penalties, net of tax. The liability has been excluded from the preceding table astax, although we are unable to reasonably estimate the amount and period intiming over which these liabilities might be paid. See Note 1718 to the Consolidated Financial Statements for additional information regarding matters relating to income taxes, including unrecognized tax benefits and tax authority disputes.
Contingent Liabilities
– We are involved in various litigations,litigation, claims and administrative proceedings, including those related to environmental, asbestos-related and product liability matters. We believe that these liabilities are subject to the uncertainties inherent in estimating future costs for contingent liabilities and will likely be resolved over an extended period of time. Because the timing and amounts of potential future cash flows are uncertain, they have been excluded from the preceding table. See Note 1921 to the Consolidated Financial Statements for additional information.
Guarantor Financial Information
Allegion US Holding Company Inc. ("Allegion US Hold Co") is the issuer of the 3.200% Senior Notes and 3.550% Senior Notes and is the guarantor of the 3.500% Senior Notes. Allegion plc (the “Parent”) is the issuer of the 3.500% Senior Notes and is the guarantor of the 3.200% Senior Notes and 3.550% Senior Notes. Allegion US Hold Co is directly or indirectly 100% owned by the Parent and each of the guarantees of Allegion US Hold Co and the Parent is full and unconditional and joint and several.
The 3.200% Senior Notes and the 3.550% Senior Notes are senior unsecured obligations of Allegion US Hold Co and rank equally with all of Allegion US Hold Co’s existing and future senior unsecured and unsubordinated indebtedness. The guarantee of the 3.200% Senior Notes and the 3.550% Senior Notes is the senior unsecured obligation of the Parent and ranks equally with all of Allegion plc’s existing and future senior unsecured and unsubordinated indebtedness. The 3.500% Senior Notes are senior unsecured obligations of the Parent, are guaranteed by Allegion US Hold Co and rank equally with all of Allegion plc’s existing and future senior unsecured indebtedness.
Each guarantee is effectively subordinated to any secured indebtedness of the Guarantor to the extent of the value of the assets securing such indebtedness. The Senior Notes are structurally subordinated to indebtedness and other liabilities of the subsidiaries of the Guarantor, none of which guarantee the notes. The obligations of the Guarantor under its Guarantee are limited as necessary to prevent such Guarantee from constituting a fraudulent conveyance under applicable law and, therefore,
are limited to the amount that the Guarantor could guarantee without such Guarantee constituting a fraudulent conveyance; this limitation, however, may not be effective to prevent such Guarantee from constituting a fraudulent conveyance. If the Guarantee was rendered voidable, it could be subordinated by a court to all other indebtedness (including guarantees and other contingent liabilities) of the Guarantor, and, depending on the amount of such indebtedness, the Guarantor’s liability on its Guarantee could be reduced to zero. In such an event, the notes would be structurally subordinated to the indebtedness and other liabilities of the Guarantor.
For further details, terms and conditions of the Senior Notes refer to the Company’s Form 8-K filed October 2, 2017 and Form 8-K filed September 27, 2019.
The following tables present the summarized financial information specified in Rule 1-02(bb)(1) of Regulation S-X for each issuer and guarantor. The summarized financial information has been prepared in accordance with Rule 13-01 of Regulation S-X.
Selected Condensed Statement of Comprehensive Income Information
| | | | | | | | | | | |
| Year ended December 31, 2021 |
| In millions | Allegion plc | | Allegion US
Hold Co |
| Net revenues | $ | — | | | $ | — | |
| Gross profit | — | | | — | |
| Operating loss | (6.6) | | | (0.5) | |
| Equity earnings in affiliates, net of tax | 521.6 | | | 173.6 | |
Transactions with related parties and subsidiaries(a) | (12.5) | | | (85.0) | |
| Net earnings | 483.0 | | | 87.1 | |
| Net earnings attributable to the entity | 483.0 | | | 87.1 | |
(a) Transactions with related parties and subsidiaries include intercompany interest and fees.
Selected Condensed Balance Sheet Information
| | | | | | | | | | | |
| December 31, 2021 |
| In millions | Allegion plc | | Allegion US
Hold Co |
| Current assets: | | | |
| Amounts due from related parties and subsidiaries | $ | 0.6 | | | $ | 753.7 | |
| Total current assets | 60.8 | | | 785.5 | |
| Noncurrent assets: | | | |
| Amounts due from related parties and subsidiaries | — | | | 1,240.9 | |
| Total noncurrent assets | 1,793.1 | | | 1,292.7 | |
| Current liabilities: | | | |
| Amounts due to related parties and subsidiaries | $ | 62.8 | | | $ | 233.9 | |
| Total current liabilities | 82.6 | | | 241.3 | |
| Noncurrent liabilities: | | | |
| Amounts due to related parties and subsidiaries | 761.8 | | | 2,660.5 | |
| Total noncurrent liabilities | 1,396.5 | | | 3,466.9 | |
Critical Accounting Policies and Estimates
Management’s Discussion and Analysis of Financial Condition and Results of Operations are based upon our Consolidated Financial Statements, which have been prepared in accordance with GAAP. The preparation of financial statements in conformity with those accounting principles requires management to use judgment in making estimates and assumptions based on the relevant information available at the end of each period. These estimates and assumptions have a significant effect on reported amounts of assets and liabilities, revenuerevenues and expenses as well as the disclosure of contingent assets and liabilities because they result primarily from the need to make estimates and assumptions on matters that are inherently uncertain. Actual results may differ from estimates. If updated information or actual amounts are different from previous estimates, the revisions are included in our results for the period in which they become known.
The following is a summary of certain accounting estimates and assumptions made by management that we consider critical:
Allowance for doubtful accounts •Goodwill – We have provided an allowance for doubtful accounts receivable, which represents our best estimate of probable loss inherent in our accounts receivable portfolio. This estimateGoodwill is based upon our policy, derived from our knowledge of our end markets, customer base and products.
Goodwill and indefinite-lived intangible assets – We have significant goodwill and indefinite-lived intangible assets on our balance sheet related to acquisitions. Our goodwill and other indefinite-lived intangible assets are tested annually during the fourth quarter for impairment or when there is a significant change in events or circumstances that indicate that the fair value of an asseta reporting unit is more likely than not less than theits carrying amount of the asset.
amount. Recoverability of goodwill is measured at the reporting unit level and starts with a comparison of the carrying amount of thea reporting unit to its estimated fair value. If the estimated fair value of a reporting unit exceeds its carrying amount, goodwill of the reporting unit is not impaired. To the extent that the carrying value of thea reporting unit exceeds its estimated fair value, a goodwill impairment charge will be recognized for the amount by which the carrying value of the reporting unit exceeds its fair value, not to exceed the carrying amount of the reporting unit's goodwill.
As quoted market prices are not available for our reporting units, the calculation of their estimated fair valuevalues is based on two valuation techniques, a discounted cash flow model (income approach) and a market adjusted multiple of earnings and revenues (market approach), with each method being weighted in the calculation. The income approach relies on the Company’sour estimates of revenue growth rates, margin assumptions and discount rates to estimate future cash flows and explicitly addresses factors such as timing, growth and margins, with due consideration given to forecasting risk. These assumptions are subject to varying degrees of judgment and complexity. Estimates of future revenue growth rates and margin assumptions represent our best estimates of future cash flows given our expectations of market growth for the security products industry in the specific markets in which we operate, as well as factors such as our market positioning, brand strength, pricing and marketing efforts and other growth and productivity opportunities and initiatives. Discount rate assumptions represent our best estimates of market participant adjusted weighted-average costs of capital. Although these assumptions represent our best estimates as of the assessment date, certain factors could potentially create variances in these estimates, including but not limited to:
•Decreases in estimated market sizes or market growth rates due to greater than expected declines in volumes, pricing pressures or disruptive technology;
•Declines in our market share and penetration assumptions due to increased competition or an inability to develop or launch new products;
•The impacts of market volatility, including but not limited to, impacts of global pandemics, greater than expected inflation, supply chain disruption and delays, declines in pricing, reductions in volumes or fluctuations in foreign exchange rates;
•The level of success of on-going and future research and development efforts, including those related to acquisitions, and increases in the research and development costs necessary to obtain regulatory approvals and launch new products; and
•Volatility in market interest rates that could impact the selection of an appropriate discount rate.
The market approach requires determining an appropriate peer group, which is utilized to derive estimated fair values of our reporting units based on selected market multiples. The market approach reflects the market’s expectations for future growth and risk, with adjustments to account for differences between the guideline publicly-tradedselected peer group companies and the subject reporting units.
The estimated fair values for each While market multiples are based on observable, arm’s-length evidence of value, these assumptions are still subject to inherent uncertainty, as the peer-group companies may differ in significant ways from one or more of our reporting units exceeded their carrying values by more than 15% for the 2017 goodwill impairment test. Additionally, a 1% increase in the discount rate usedterms of size, growth or a 1% decreasebusiness description characteristics.
All critical accounting estimates and assumptions utilized in the terminal growth rate would not result in the carrying value of any reporting unit exceeding its estimated fair value.
Assessingdetermining the fair valuevalues of our reporting units includes, among other things, making key assumptions for estimating future cash flows and appropriate market multiples. These assumptions are subject to a high degree of judgment and complexity. WeWhile we make every effort to estimate future cash flowsfair value as accurately as possible with the information available at the time the forecast is developed. However,assessment date, changes in assumptions and estimates may affect the estimated fair value of the reporting unit and could result in impairment charges in future periods. Factors
•Indefinite-lived intangible assets – Similar to goodwill, indefinite-lived intangible assets are tested annually during the fourth quarter for impairment or when there is a significant change in events or circumstances that haveindicate the potential to create variances in the estimated fair value of the reporting unit include but areasset is more likely than not limited to the following:
Decreases in estimated market sizes or market growth rates due to greater-than-expected declines in volumes, pricing pressures or disruptive technology;
Declines in our market share and penetration assumptions due to increased competition or an inability to develop or launch new products;
The impactsless than its carrying amount. Recoverability of the market volatility, including greater-than-expected declines in pricing, reductions in volumes, or fluctuations in foreign exchange rates;
The level of success of on-going and future research and development efforts, including those related to recent acquisitions, and increases in the research and development costs necessary to obtain regulatory approvals and launch new products;
Increase in the price or decrease in the availability of key commodities and the impact of higher energy prices; and
Increases in our market-participant risk-adjusted weighted-average cost of capital.
Other Indefinite-lived intangible assets - We performed our annual indefinite-lived intangible asset impairment testing in 2017 and determined our indefinite-lived intangible assets were not impaired. Recoverability of intangible assets with indefinite useful lives is determined on a relief from royalty methodology, (income approach), which is based on the implied royalty paid, at an appropriate discount rate, to license the use of an asset rather than owning the asset. The present value of the after-tax cost savings (i.e. royalty relief) indicates the estimated fair value of the asset. Any excess of the carrying value over the estimated fair value is recognized as an impairment loss equal to that excess.
A significant increasechange in any or a combination of the discount rate, decrease in the long-term growth rate, decrease in the royalty rate or substantial reductions inassumptions used to estimate fair value of our end markets and volume assumptionsindefinite-lived intangible assets could have a negative impact on the estimated fair values of any of our trade names. The estimates of fair value are based on the best information available as of the date of the assessment, which primarily incorporates management assumptions about expected future cash flows.values.
Long-lived assets and finite-lived intangibles – Long-lived assets and finite-lived intangibles are reviewed for impairment whenever events or changes in business circumstances indicate that the carrying amount of an asset may not be fully recoverable. Assets are grouped with other assets and liabilities at the lowest level for which identifiable cash flows can be generated. Impairment in the carrying value of an asset could be recognized whenever anticipated future undiscounted cash flows from an asset are less than its carrying value. The impairment is measured as the amount by which the carrying value exceeds the fair value of the asset as determined by an estimate of discounted cash flows. We believe that our use of estimates and assumptions are reasonable and comply with generally accepted accounting principles. Changes in business conditions could potentially require future adjustments to these valuations.
Loss contingencies – Liabilities are recorded for various contingencies arising in the normal course of business, including litigation and administrative proceedings, environmental and asbestos matters and product liability, product warranty, worker’s compensation and other claims. We have recorded reserves in the consolidated financial statements related to these matters, which are developed using input derived from actuarial estimates and historical and anticipated experience
data depending on the nature of the reserve, and in certain instances with consultation of legal counsel, internal and external consultants and engineers. Subject to the uncertainties inherent in estimating future costs for these types of liabilities, we believe our estimated reserves are reasonable and do not believe the final determination of the liabilities with respect to these matters would have a material effect on our financial condition, results of operations, liquidity or cash flows for any year.
Revenue recognition – Revenue is recognized and earned when all of the following criteria are satisfied: (a) persuasive evidence of a sales arrangement exists; (b) the price is fixed or determinable; (c) collectability is reasonably assured; and (d) delivery has occurred or service has been rendered. Delivery generally occurs when the title and the risks and rewards of ownership have transferred to the customer. Both the persuasive evidence of a sales arrangement and fixed or determinable price criteria are deemed to be satisfied upon receipt of an executed and legally binding sales agreement or contract that clearly defines the terms and conditions of the transaction including the respective obligations of the parties. If the defined terms and conditions allow variability in all or a component of the price, revenue is not recognized until such time that the price becomes fixed or determinable. At the point of sale, we validate that existence of an enforceable claim that requires payment within a reasonable amount of time and assesses the collectability of that claim. If collectability is not deemed to be reasonably assured, then revenue recognition is deferred until such time that collectability becomes probable or cash is received. Delivery is not considered to have occurred until the customer has taken title and assumed the risks and rewards of ownership. Service and installation revenue are recognized when earned. In some instances, customer acceptance provisions are included in sales arrangements to give the buyer the ability to ensure the delivered product or service meets the criteria established in the order. In these instances, revenue recognition is deferred until the acceptance terms specified in the arrangement are fulfilled through customer acceptance or a demonstration that established criteria have been satisfied. If uncertainty exists about customer acceptance, revenue is not recognized until acceptance has occurred.
We offer various sales incentive programs to our customers, dealers, and distributors. Sales incentive programs do not preclude revenue recognition, but do require an accrual for our best estimate of expected activity. Examples of the sales incentives that are accrued for as a contra receivable and sales deduction at the point of sale include, but are not limited to, discounts (i.e. net 30 type), coupons, and rebates where the customer does not have to provide any additional requirements to receive the discount. Sales returns and customer disputes involving a question of quantity or price are also accounted for as a reduction in revenue and a contra receivable. At December 31, 2017 and 2016, we had a customer claim accrual (contra receivable) of $32.5 million and $29.0 million, respectively. All other incentives or incentive programs where the customer is required to reach a certain sales level, remain a customer for a certain period, provide a rebate form or is subject to additional requirements are accounted for as a reduction of revenue and establishment of a liability. At December 31, 2017 and 2016, we had a sales incentive accrual of $31.8 million and $29.6 million, respectively. Each of these accruals represents our best estimate we expect to pay related to previously sold units based on historical claim experience. These estimates are reviewed regularly for accuracy. If updated information or actual amounts are different from previous estimates, the revisions are included in our results for the period in which they become known. Historically, the aggregate differences, if any, between our estimates and actual amounts in any year have not had a material impact on our consolidated financial statements.
•Income taxes – We account for income taxes in accordance with ASC Topic 740. Deferred tax assets and liabilities are determined based on temporary differences between financial reporting and tax bases of assets and liabilities, applying enacted tax rates expected to be in effect for the year in which the differences are expected to reverse. We recognize future tax benefits, such as net operating losses and non-U.S. tax credits, to the extent that realizing these benefits is
considered in our judgment to be more likely than not. We regularly review the recoverability of our deferred tax assets considering our historic profitability, projected future taxable income, timing of the reversals of existing temporary differences and the feasibility of our tax planning strategies. Where appropriate, we record a valuation allowance with respect to a future tax benefit.benefits. We establish valuation allowances against the realizability of any deferred tax assets, based on our consideration of all available evidence, both positive and negative, using a “more likely than not” standard. This assessment considers the nature, frequency and amount of recent losses, the duration of statutory carryforward periods and tax planning strategies. In making such judgments, significant weight is given to evidence that can be objectively verified.
The provision for income taxes involves a significant amount of management judgment regarding interpretation of relevant facts and laws in the jurisdictions in which we operate. Future changes in applicable laws, projected levels of taxable income and tax planning could change the effective tax rate and tax balances recorded by us. In addition, tax authorities periodically review income tax returns filed by us and can raise issues regarding our filing positions, timing and amount of income or deductions and the allocation of income among the jurisdictions in which we operate. A significant period of time may elapse between the filing of an income tax return and the ultimate resolution of an issue raised by a revenuetax authority with respect to that return. We believe that we have adequately provided for any reasonably foreseeable resolution of these matters. Wematters and will adjust our estimateestimates if significant events so dictate. To the extent that the ultimate results differ from our original or adjusted estimates, the effect will be recorded in the provision for income taxes in the period that the matter is finally resolved.
The Tax Reform Act constitutes a major change to the U.S. tax system. The estimated impact of the Tax Reform Act is based on current interpretations and related assumptions. As discussed further in Note 17 to the Consolidated Financial
Statements, where applicable, we included provisional estimates in our consolidated financial statements for impacts of the new Tax Reform Act. The actual impact to us may be materially different from current estimates based on regulatory developments and our further analysis of the impacts of the Tax Reform Act. In future periods, our effective tax rate could be subject to additional uncertainty as a result of regulatory developments.
Employee•Defined benefit plans – We provide a range ofseveral U.S. and non-U.S. defined benefit pension plan benefits to eligible employees and retirees, including pensions, postretirementretirees. Our noncontributory defined benefit pension plans covering non-collectively bargained U.S. employees provide benefits on an average pay formula while most plans for collectively bargained U.S. employees provide benefits on a flat dollar benefit formula. The non-U.S. pension plans generally provide benefits based on earnings and postemployment benefits.years of service. Determining the costcosts associated with such benefitsplans is dependent on various actuarial assumptions including discount rates, expected returnreturns on plan assets, compensation increases, employee mortality turnover rates and healthcare cost trendturnover rates. Actuarial valuations are performed to determine expense in accordance with GAAP. Actual results may differ from the actuarial assumptions and when they do, are generally accumulatedrecorded to Accumulated other comprehensive loss and amortized into earnings over future periods.
We review our actuarial assumptions at each measurement date and make modifications to the assumptions based on current rates and trends, ifas appropriate. The discount rate the rate of compensation increase and the expected long-term rates of return on plan assets are determined as of each measurement date. Discount rates for all plans are established using hypothetical yield curves based on the yields of corporate bonds rated AA quality. Spot rates are developed from the yield curve and used to discount future benefit payments. The rate of compensation increase is dependent on expected future compensation levels. The expected long-term rate of return on plan assets reflects the average rate of returns expected on the funds invested or to be invested to provide for the benefits included in the projected benefit obligation. The expected long-term rate of return on plan assets is based on what is achievable given the plan’s investment policy, the types of assets held and the target asset allocation. The expected long-term rate of return is determined as of each measurement date.
We believe that the assumptions utilized in recording our defined benefit obligations under our plans are reasonable based on input from our actuaries, outside investment advisors and information as to assumptions used by plan sponsors.
Changes in any of the assumptions can have an impact on the net periodic pension cost or postretirement benefit cost. Estimated sensitivities to the expected 2017 net periodic pension cost of aAn estimated 0.25% rate decline in the two basic assumptions are as follows: the decline in the discount rate would increase expensehave increased net periodic pension benefit cost by approximately $0.8$1.2 million and thein 2021, while a 0.25% rate decline in the estimated return on assets would increase expensehave increased net periodic pension benefit cost by approximately $0.7$1.9 million. A 1.0% increase in the healthcare cost trend rate would have no impact on expense as we have capped the annual maximum amount we will pay for retiree healthcare costs, therefore any additional costs would be assumed by the retiree.
•Business combinations – The fair value of the consideration paid in a business combination is allocated to the tangible assets and identifiable intangible assets acquired, liabilities assumed and goodwill. Acquired intangible assets primarily include indefinite-lived trade names, customer relationships and completed technologies. The accounting for acquisitionsbusiness combinations involves a considerable amount of judgment and estimate,estimation, including the fair value of acquired intangible assets involving projections of future revenues and cash flows that are either discounted at an estimated discount rate or measured at an estimated royalty rate; fair value of other acquired assets and assumed liabilities, including potential contingencies; and the useful lives of the acquired assets. The assumptions used are determined atAs a result, in the timecase of significant acquisitions, we normally obtain the acquisitionassistance of a third-party valuation specialist in estimating fair values of acquired tangible and intangible assets and assumed liabilities. An income approach or market approach (or both) is utilized in accordance with accepted valuation models. Projections aremodels to determine fair value. The assumptions used to determine the fair value of acquired assets include projections developed using historical information and internal forecasts, available industry and market data, and estimates of long-term growth rates.rates, profitability, customer attrition and royalty rates, which are estimated at the time of acquisition, considering the perspective of marketplace participants. While we believe expectations and assumptions utilized for historical business combinations have been reasonable, they are inherently uncertain, and unanticipated market or macroeconomic events and circumstances occasionally do occur, and may occur in the future, which could affect the
accuracy and validity of such assumptions. The impact of prior or future acquisitionsbusiness combinations on our financial condition or results of operations may also be materially impacted by the change in or initial selection of assumptions and estimates.estimates, in addition to events and circumstances subsequent to the acquisition that are not reasonably anticipated when finalizing our purchase accounting estimates and assumptions.
Recent Accounting Pronouncements
See Note 2 to our consolidated financial statementsConsolidated Financial Statements included in Item 158herein for a discussion of recently issued and adopted accounting pronouncements.
Item 7A.QUANTITATIVE AND QUALITATIVE DISCLOSUREDISCLOSURES ABOUT MARKET RISK
We are exposed to fluctuations in currency exchange rates, interest rates and commodity prices which could impact our results of operations and financial condition.
Foreign Currency Exposures
We have operations throughout the world that manufacture and sell products in various international markets. As a result, we are exposed to movements in exchange rates of various currencies against the U.S. dollar as well as against other currencies throughout the world. We actively manage material currency exposures that are associated with purchases and sales and other assets and liabilities at the legal entity level,level; however, we do not hedge currency translation risk. We attempt to hedge exposures that cannot be naturally offset to an insignificant amount with foreign currency derivatives. Derivative instruments utilized by us in our hedging activities are viewed as risk management tools, involve little complexity and are not used for trading or speculative purposes. To minimize the risk of counter party non-performance, derivative instrument agreements are made only through major financial institutions with significant experience in such derivative instruments.
We evaluate our exposure to changes in currency exchange rates on our foreign currency derivatives using a sensitivity analysis. The sensitivity analysis is a measurement of the potential loss in fair value based on a percentage change in exchange rates. Based on the firmly committed currency derivative instruments in place at December 31, 2017,2021, a hypothetical change in fair value of those derivative instruments assuming a 10% adverse change in exchange rates would result in an additional unrealized loss of approximately $7.4$9.4 million. This amount, when realized, would be partially offset by changes in the fair value of the underlying transactions.
Commodity Price Exposures
We are exposed to volatility in the prices of commodities used in some of our products and we use fixed price contracts to manage this exposure. We do not have committed commodity derivative instruments in place at December 31, 2017.2021.
Interest Rate Exposure
Outstanding borrowings under our unsecured2021 Credit Facilities accrue interest at theour option of the Company, at a per annum rate of (i) a LIBORBSBY rate plus the applicable margin or (ii) a base rate plus the applicable margin. The applicable margin forranges from 0.875% to 1.375% depending on our credit ratings. At December 31, 2021, the outstanding borrowings of $250.0 million under the Credit Facilities is subject2021 Term Facility accrue interest at BSBY plus a margin of 1.125%. We are also exposed to a ratings-based pricing gridthe risk of rising interest rates to the extent that we fund our operations with the margin ranging from 1.125% to 1.500% depending on the Company's credit ratings. Outstandingshort-term or variable-rate borrowings, as we currently have unused availability of $491.3 million under the Termour 2021 Revolving Facility as of December 31, 2017, accrue interest at LIBOR plus an2021. If our BSBY or other applicable margin and expose us to interest rate risks.
The Company has entered into interest rate swaps to fix the interest rate paid during the contract period for $250 millionbase rates of the Company's variable rate Term Facility. These swaps expire in September 2020. A 100 basis pointour 2021 Credit Facilities increase in LIBOR would have resulted in incremental 2017 interest expense of approximately $5.6 million. If the base interest rate in our credit facilities increases in the future, our floating-rate debtInterest expense could have a material effect on our interest expense.increase.
Item 8.FINANCIAL STATEMENTS AND SUPPLEMENTARY DATA
| |
(a) | The following Consolidated Financial Statements and Financial Statement Schedule and the report thereon of PricewaterhouseCoopers LLP dated February 20, 2018, are presented following Item 15 of this Annual Report on Form 10-K.(a)The following Consolidated Financial Statements and Financial Statement Schedule and the report thereon of PricewaterhouseCoopers LLP dated February 15, 2022, are presented following Item 16 of this Annual Report on Form 10-K. |
Consolidated Financial Statements:
Report of independent registered public accounting firm (PCAOB ID 238)
Consolidated statementsStatements of comprehensive incomeComprehensive Income for the years ended December 31, 2017, 20162021, 2020 and 20152019
Consolidated balance sheetsBalance Sheets at December 31, 20172021 and 20162020
For the years ended December 31, 2017, 20162021, 2020 and 2015:2019:
Consolidated statementsStatements of equityEquity
Consolidated statementsStatements of cash flowsCash Flows
Notes to Consolidated Financial Statements
Financial Statement Schedule:
Schedule II – Valuation and Qualifying Accounts for the years ended December 31, 2017, 20162021, 2020 and 20152019
| |
(b) | The unaudited selected quarterly financial data for the two years ended December 31, is as follows:
|
|
| | | | | | | | | | | | | | | | |
| In millions, except per share amounts | | 2017 |
| | | First Quarter | | Second Quarter | | Third Quarter | | Fourth Quarter |
| Net revenues | | $ | 548.8 |
| | $ | 627.0 |
| | $ | 609.4 |
| | $ | 623.0 |
|
| Cost of goods sold | | 308.0 |
| | 346.0 |
| | 335.5 |
| | 348.0 |
|
| Operating income | | 98.8 |
| | 134.1 |
| | 126.1 |
| | 129.2 |
|
| Net earnings | | 68.7 |
| | 105.8 |
| | 90.1 |
| | 12.1 |
|
| Net earnings attributable to Allegion plc | | 68.4 |
| | 105.5 |
| | 89.8 |
| | 9.6 |
|
| Earnings per share attributable to Allegion plc ordinary shareholders: | | | | | | | | |
| Basic | | $ | 0.72 |
| | $ | 1.11 |
| | $ | 0.95 |
| | $ | 0.10 |
|
| Diluted | | $ | 0.71 |
| | $ | 1.10 |
| | $ | 0.94 |
| | $ | 0.10 |
|
| | | | | | | | | |
| | | | | | | | | |
| In millions, except per share amounts | | 2016 |
| | | First Quarter | | Second Quarter | | Third Quarter | | Fourth Quarter |
| Net revenues | | $ | 502.3 |
| | $ | 584.9 |
| | $ | 581.1 |
| | $ | 569.7 |
|
| Cost of goods sold | | 286.0 |
| | 317.5 |
| | 317.6 |
| | 331.6 |
|
| Operating income | | 82.5 |
| | 124.3 |
| | 121.5 |
| | 97.2 |
|
| Net earnings | | 58.8 |
| | 95.4 |
| | 2.0 |
| | 75.0 |
|
| Net earnings attributable to Allegion plc | | 57.7 |
| | 95.0 |
| | 1.6 |
| | 74.8 |
|
| Earnings per share attributable to Allegion plc ordinary shareholders: | | | | | | | | |
| Basic | | $ | 0.60 |
| | $ | 0.99 |
| | $ | 0.02 |
| | $ | 0.78 |
|
| Diluted | | $ | 0.60 |
| | $ | 0.98 |
| | $ | 0.02 |
| | $ | 0.77 |
|
| | | | | | | | | |
Net earnings from the fourth quarter of 2017 includes a $41.3 million charge related to the refinancing of our senior notes and a net tax charge of $53.5 million related to the U.S. Tax Reform Act.
Net earnings from the third quarter of 2016 includes an after tax $84.4 million loss on divestiture related to the write-down of the carrying value of consideration receivable related to the 2015 divestiture of our systems integration business in China.
Item 9.CHANGES IN AND DISAGREEMENTS WITH ACCOUNTANTS ON ACCOUNTING AND FINANCIAL
DISCLOSURE
None.
Item 9A.CONTROLS AND PROCEDURES
|
| | | | |
| (a) | Evaluation of Disclosure Controls and Procedures |
The Company's management, including its Chief Executive Officer and Chief Financial Officer, have conducted an evaluation of the effectiveness of the Company's disclosure controls and procedures (as such term is defined in Rules 13a-15(e) and 15d-15(e) under the Securities Exchange Act of 1934, as amended (the Exchange Act)), as of the end of the period covered by this Annual Report on Form 10-K. Based on that evaluation, the Chief Executive Officer and Chief Financial Officer concluded as of December 31, 2017,2021, that the Company's disclosure controls and procedures were effective in ensuring that information required to be disclosed by the Company in reports that it files or submits under the Exchange Act has been recorded, processed, summarized and reported, within the time periods specified in the Commission's rules and forms, and that such information has been accumulated and communicated to the Company's management including its Chief Executive Officer and Chief Financial Officer, as appropriate, to allow timely decisions regarding required disclosure.
|
| | | | |
| (b) | Management's Report on Internal Control Over Financial Reporting |
Our management is responsible for establishing and maintaining adequate internal control over financial reporting, as defined under Exchange Act Rules 13a-15(f) and 15d-15(f). Our internal control over financial reporting is a process designed to provide reasonable assurance regarding the reliability of financial reporting and the preparation of financial statements for external purposes in accordance with generally accepted accounting principles. Internal control over financial reporting includes those policies and procedures that:
•pertain to the maintenance of records that, in reasonable detail, accurately and fairly reflect the transactions and dispositions of the Company’s assets;
•provide reasonable assurance that transactions are recorded as necessary to permit preparation of financial statements in accordance with generally accepted accounting principles, and that the Company’s receipts and expenditures are being made only in accordance with authorizations of the Company’s management and directors; and
•provide reasonable assurance regarding prevention or timely detection of unauthorized acquisition, use, or disposition of the Company’s assets that could have a material effect on the financial statements.
Because of its inherent limitations, internal control over financial reporting may not prevent or detect misstatements. Also, projections of any evaluation of effectiveness to future periods are subject to the risk that controls may become inadequate because of changes in conditions, or that the degree of compliance with the policies or procedures may deteriorate.
Management assessed the effectiveness of our internal control over financial reporting as of December 31, 2017.2021. In making this assessment, management used the criteria set forth by the Committee of Sponsoring Organizations of the Treadway
Commission (COSO) in Internal Control-Integrated Framework (2013). We concluded that our internal control over financial reporting was effective as of December 31, 2017.2021.
The effectiveness of our internal control over financial reporting has been audited by PricewaterhouseCoopers LLP, the independent registered public accounting firm, as stated in their report herein.
|
| | | | |
| (c) | Changes in Internal Control Over Financial Reporting |
There were no changes in the Company's internal control over financial reporting that occurred during the quarter ended December 31, 20172021 that have materially affected, or are reasonably likely to materially affect, our internal control over financial reporting.
Item 9B.OTHER INFORMATION
None.
Item 9C.DISCLOSURE REGARDING FOREIGN JURISDICTIONS THAT PREVENT INSPECTIONS
Not applicable.
PART III
Item 10.DIRECTORS, EXECUTIVE OFFICERS AND CORPORATE GOVERNANCE
The information regarding our executive officers is included in Part I under the caption "Executive Officers of the Registrant."
The other information required by this item is incorporated herein by reference to the information contained under the headings "Item 1. Election of Directors", "Section"Delinquent Section 16(a) Beneficial Ownership Reporting Compliance"Reports" and "Corporate Governance" in our Proxy Statement.
Item 11.EXECUTIVE COMPENSATION
The other information required by this item is incorporated herein by reference to the information contained under the headings "Compensation Discussion and Analysis", "Executive Compensation" and "Compensation Committee Report" in our Proxy Statement.
Item 12.SECURITY OWNERSHIP OF CERTAIN BENEFICIAL OWNERS AND MANAGEMENT AND RELATED
STOCKHOLDER MATTERS
The other information required by this item is incorporated herein by reference to the information contained under the headings "Security Ownership of Certain Beneficial Owners and Management" and "Equity Compensation Plan Information" of our Proxy Statement.
Item 13.CERTAIN RELATIONSHIPS AND RELATED TRANSACTIONS, AND DIRECTOR INDEPENDENCE
The other information required by this item is incorporated herein by reference to the information contained under the headings "Corporate Governance" and "Certain Relationships and Related Person Transactions" of our Proxy Statement.
Item 14.PRINCIPAL ACCOUNTANT FEES AND SERVICES
The information required by this item is incorporated herein by reference to the information contained under the caption "Fees of the Independent Auditors" in our Proxy Statement.
PART IV
Item 15.EXHIBITS AND FINANCIAL STATEMENT SCHEDULES
|
| | | | |
| (a) 1. and 2. | Financial statements and financial statement schedule
See Item 8.
|
| |
| 3. | Exhibits |
| The exhibits listed on the accompanying index to exhibits are filed as part of this Annual Report on Form 10-K. |
ALLEGION PLC
INDEX TO EXHIBITS
(Item 15(a))
Description
Pursuant to the rules and regulations of the SEC, we have filed certain agreements as exhibits to this Annual Report on Form 10-K. These agreements may contain representations and warranties by the parties. These representations and warranties have been made solely for the benefit of the other party or parties to such agreements and (i) may have been qualified by disclosures made to such other party or parties, (ii) were made only as of the date of such agreements or such other date(s) as may be specified in such agreements and are subject to more recent developments, which may not be fully reflected in our public disclosure, (iii) may reflect the allocation of risk among the parties to such agreements and (iv) may apply materiality standards different from what may be viewed as material to investors. Accordingly, these representations and warranties may not describe our actual state of affairs at the date hereof and should not be relied upon.
(a) Exhibits
|
| | | | | | | | | | | | | |
Exhibit
Number
| | Exhibit Description | | Method of Filing |
| | | |
|
| | Separation and Distribution Agreement between Ingersoll-Rand plc and Allegion plc, dated November 29, 2013.
| | Incorporated by reference to Exhibit 2.1 toof the Company’s Form 8-K filed with the SEC on December 2, 2013 (File No. 001-35971). |
| | | |
|
| | Amended and Restated Memorandum and Articles of Association of Allegion plc
plc.
| | Incorporated by reference to Exhibit 3.1 toof the Company’s Form 8-K filed with the SEC on June 13, 2016 (File No. 001-35971). |
| | | |
|
| | Certificate of Incorporation of Allegion plc | | Incorporated by reference to Exhibit 3.2 to the Company’s Registration Statement on Form 10 filed with the SEC on June 17, 2013, as amended (File No. 001-35971). |
| | | | |
|
| | Indenture, dated as of October 2, 2017, among Allegion US Holding Company Inc., Allegion plc and Wells Fargo Bank, National Association. | | Incorporated by reference to Exhibit 4.1 of Allegion plc's Current Report onthe Company's Form 8-K filed October 2, 2017.2017 (File No. 001-35971). |
| | | | |
|
| | First Supplemental Indenture, dated as of October 2, 2017, among Allegion US Holding Company Inc., Allegion plc and Wells Fargo Bank, National Association. | | Incorporated by reference to Exhibit 4.2 of Allegion plc's Current Report onthe Company's Form 8-K filed October 2, 2017.2017 (File No. 001-35971). |
| | | | |
|
| | Form of Global Note representing the 3.200% Senior Notes due 2024. | | Incorporated by reference to Exhibit 4.3 of Allegion plc's Current Report onthe Company's Form 8-K filed October 2, 2017 (included in Exhibit 4.2) (File No. 001-35971). |
| | | | |
|
| | Second Supplemental Indenture, dated as of October 2, 2017, among Allegion US Holding Company Inc., Allegion plc and Wells Fargo Bank, National Association. | | Incorporated by reference to Exhibit 4.4 of Allegion plc's Current Report onthe Company's Form 8-K filed October 2, 2017.2017 (File No. 001-35971). |
| | | | |
|
| | Form of Global Note representing the 3.550% Senior Notes due 2027. | | Incorporated by reference to Exhibit 4.5 of Allegion plc's Current Report onthe Company's Form 8-K filed October 2, 2017 (included in Exhibit 4.4) (File No. 001-35971). |
| | | | |
| | Third Supplemental Indenture, dated as of September 27, 2019, among Allegion plc, Allegion US Holding Company Inc. and Wells Fargo Bank, National Association. | | Incorporated by reference to Exhibit 4.2 of the Company’s Form 8-K filed September 27, 2019 (File No. 001-35971). |
| | | | |
| | Form of Global Note representing the 3.500% Senior Notes due 2029. | | Incorporated by reference to Exhibit 4.3 of the Company's Form 8-K filed September 27, 2019 (included in Exhibit 4.2) (File No. 001-35971). |
| | | | |
| | Description of the Registrant’s Securities registered pursuant to Section 12 of the Securities Exchange Act of 1934. | | Incorporated by reference to Exhibit 4.8 of the Company’s Form 10-K filed with the SEC on February 18, 2020 (File No. 001-35971). |
| | | | |
|
| Form of Separation Agreement and Release. * | | Incorporated by reference to Exhibit 10.1 of the Company’s Form 10-K filed with the SEC on February 19, 2019 (File No. 001-35971). |
| | | | |
| | Tax Matters Agreement between Ingersoll-Rand plc and Allegion plcplc. | | Incorporated by reference to Exhibit 10.1 toof the Company’s Form 8-K filed with the SEC on December 2, 2013 (File No. 001-35971). |
| | | | |
| | | | | | | | | | | | | | |
|
| | Credit Agreement, dated as of September 12, 2017.November 18, 2021. | | Incorporated by reference to Exhibit 10.1 of Allegion plc's Current Report onthe Company's Form 8-K filed September 15, 2017.November 18, 2021 (File No. 001-35971). |
| | | |
|
| | | | | |
|
| | Employee Matters Agreement between Ingersoll-Rand plc and Allegion plcplc. | | Incorporated by reference to Exhibit 10.2 toof the Company’s Form 8-K filed with the SEC on December 2, 2013 (File No. 001-35971). |
| | | | |
|
| | 2013 Incentive Stock PlanPlan. * | | Incorporated by reference to Exhibit 10.5 toof the Company’s Registration Statement on Form 10 filed with the SEC on June 17, 2013, as amended (File No. 001-35971). |
| | | |
|
| | Executive Deferred Compensation PlanPlan. * | | Incorporated by reference to Exhibit 10.6 toof the Company’s Registration Statement on Form 10 filed with the SEC on June 17, 2013, as amended (File No. 001-35971). |
| | | | |
|
| | Supplemental Employee Savings PlanPlan. * | | Incorporated by reference to Exhibit 10.7 of the Company’s Form 10-K filed with the SEC on February 18, 2020 (File No. 001-35971). |
| | | | |
| | Elected Officer Supplemental Program. * | | Incorporated by reference to Exhibit 10.8 of the Company’s Registration Statement on Form 10 filed with the SEC on June 17, 2013, as amended (File No. 001-35971). |
| | | | |
|
| Key Management Supplemental Program. * | Elected Officer Supplemental Program | | Incorporated by reference to Exhibit 10.8 to10.9 of the Company’s Registration Statement on Form 10 filed with the SEC on June 17, 2013, as amended (File No. 001-35971). |
| | | | |
|
| Supplemental Pension Plan. * | Key Management Supplemental Program | | Incorporated by reference to Exhibit 10.9 to10.10 of the Company’s Registration Statement on Form 10 filed with the SEC on June 17, 2013, as amended (File No. 001-35971). |
| | | | |
|
| Senior Executive Performance Plan. * | Supplemental Pension Plan | | Incorporated by reference to Exhibit 10.10 to10.11 of the Company’s Registration Statement on Form 10 filed with the SEC on June 17, 2013, as amended (File No. 001-35971). |
| | | | |
|
| David D. Petratis Offer Letter, dated June 19, 2013. * | Senior Executive Performance Plan | | Incorporated by reference to Exhibit 10.11 to10.14 of the Company’s Registration Statement on Form 10 filed with the SEC on June 17, 2013, as amended (File No. 001-35971). |
| | | | |
|
| | David D. PetratisPatrick S. Shannon Offer Letter, dated June 19, 2013April 9, 2013. * | | Incorporated by reference to Exhibit 10.14 to10.15 of the Company’s Registration Statement on Form 10 filed with the SEC on June 17, 2013, as amended (File No. 001-35971). |
| | | | |
|
| | Patrick S. ShannonTimothy P. Eckersley Offer Letter, dated April 9, 2013October 3, 2013. * | | Incorporated by reference to Exhibit 10.15 to10.16 of the Company’s Registration Statement on Form 10 filed with the SEC on June 17, 2013, as amended (File No. 001-35971). |
| | | | |
|
| | Timothy P. EckersleyJeffrey N. Braun Offer Letter, dated October 3, 2013June 13, 2014. * | | Incorporated by reference to Exhibit 10.1610.15 of the Company's Form 10-K filed with the SEC on February 17, 2017 (File No. 001-35971).
|
| | | | |
| | Form of Allegion plc Deed Poll Indemnity. | | Incorporated by reference to Exhibit 10.21 of the Company’s Registration Statement on Form 10 filed with the SEC on June 17, 2013, as amended (File No. 001-35971). |
| | | | |
|
| Form of Allegion US Holding Company, Inc. Deed Poll Indemnity. | Lucia V. Moretti, Offer Letter, dated February 19, 2014 | | Incorporated by reference to Exhibit 10.1 to the Company's Form 10-K filed with the SEC on February 26, 2016 (File No. 001-35971).
|
| | | | |
|
| | Jeffrey N. Braun Offer Letter, dated June 13, 2014 | | Incorporated by reference to Exhibit 10.15 to the Company's Form 10-K filed with the SEC on February 17, 2017 (File No. 001-35971).
|
| | | | |
|
| | Form10.22 of Allegion plc Deed Poll Indemnity | | Incorporated by reference to Exhibit 10.21 to the Company’s Registration Statement on Form 10 filed with the SEC on June 17, 2013, as amended (File No. 001-35971). |
| | | | |
|
| | | | | | | | | | | | | |
|
| | Form of Allegion USIrish Holding Company Inc.Limited Deed Poll IndemnityIndemnity. | | Incorporated by reference to Exhibit 10.22 to10.23 of the Company’s Registration Statement on Form 10 filed with the SEC on June 17, 2013, as amended (File No. 001-35971). |
| | | | |
|
| | Form of Allegion Irish Holding Company Limited Deed Poll Indemnity | | Incorporated by reference to Exhibit 10.23 to the Company’s Registration Statement on Form 10 filed with the SEC on June 17, 2013, as amended (File No. 001-35971). |
| | | | |
|
| | Annual Incentive PlanPlan. * | | Incorporated by reference to Exhibit 10.1 toof the Company's Form 10-K filed with the SEC on March 10, 2014 (File No. 001-35971). |
| | | | |
|
| | Change in Control Severance PlanPlan. * | | Incorporated by reference to Exhibit 10.2 toof the Company's Form 10-K filed with the SEC on March 10, 2014 (File No. 001-35971). |
| | | | |
|
| | Form of Special Global Restricted Stock Unit Award AgreementAgreement. * | | Filed herewithherewith. |
| | | | |
|
| | Form of Stock Option Award Agreement | | Filed herewith |
| | | | |
|
| | Form of Performance Share Unit Award Agreement | | Filed herewith |
| | | | |
|
| | Form of Special2019 Global Restricted Stock Unit Award AgreementAgreement. * | | Incorporated by reference to Exhibit 10.4 to10.22 of the Company's Form 8-K10-K filed with the SEC on February 9, 201619, 2019 (File No. 001-35971). |
| | | | |
| | Form of 2019 Global Stock Option Award Agreement. * | | Incorporated by reference to Exhibit 10.23 of the Company's Form 10-K filed with the SEC on February 19, 2019 (File No. 001-35971). |
| | | | |
| | Form of 2019 Global Performance Stock Unit Award Agreement. * | | Incorporated by reference to Exhibit 10.24 of the Company's Form 10-K filed with the SEC on February 19, 2019 (File No. 001-35971). |
| | | | |
| | Form of 2020 Global Restricted Stock Unit Award Agreement. * | | Incorporated by reference to Exhibit 10.22 of the Company's Form 10-K filed with the SEC on February 18, 2020 (File No. 001-35971). |
| | | | |
|
| Form of 2020 Global Stock Option Award Agreement. * | | Incorporated by reference to Exhibit 10.23 of the Company's Form 10-K filed with the SEC on February 18, 2020 (File No. 001-35971). |
| | | | |
| | Form of 2020 Global Performance Stock Unit Award Agreement. * | | Incorporated by reference to Exhibit 10.24 of the Company's Form 10-K filed with the SEC on February 18, 2020 (File No. 001-35971). |
| | | | |
| | Form of 2021 Global Restricted Stock Unit Award Agreement. * | | Incorporated by reference to Exhibit 10.22 of the Company's Form 10-K filed with the SEC on February 16, 2021 (File No. 001-35971). |
| | | | |
| | Form of 2021 Global Stock Option Award Agreement. * | | Incorporated by reference to Exhibit 10.23 of the Company's Form 10-K filed with the SEC on February 16, 2021 (File No. 001-35971). |
| | | | |
| | Form of 2021 Global Performance Stock Unit Award Agreement. * | | Incorporated by reference to Exhibit 10.24 of the Company's Form 10-K filed with the SEC on February 16, 2021 (File No. 001-35971). |
| | | | |
| | Form of 2022 Global Restricted Stock Unit Award Agreement. * | | Filed herewith. |
| | | | |
| | Form of 2022 Global Stock Option Award Agreement. * | | Filed herewith. |
| | | | |
| | Form of 2022 Global Performance Stock Unit Award Agreement. * | | Filed herewith. |
| | | | |
| | Form of Non-Employee Director Restricted Stock Unit Award AgreementAgreement. * | | Incorporated by reference to Exhibit 10.1 toof the Company's Form 10-Q filed with the SEC on April 30, 2015 (File No. 001-35971). |
| | | | |
|
| | Share Purchase Agreement dated June 26, 2015 between SimonsVoss Luxco S.à r.l., SimonsVoss Co-Invest GmbH & Co. KG, Mr Frank Rövekamp and Allegion Luxembourg Holding & Financing S.à r.l. | | Incorporated by reference to Exhibit 10.1 toof the Company's Form 10-Q filed with the SEC on July 30, 2015 (File No. 001-35971). |
| | | | |
|
| Timothy P. Eckersley Offer Letter, dated March 3, 2021. * | Ratio | Incorporated by reference to Exhibit 10.1 of Earnings to Fixed Charges | | Filed herewiththe Company’s Form 8-K filed with the SEC on March 10, 2021 (File No. 001-35971). |
| | | | |
| | | | | | | | | | | | | | |
| | Timothy P. Eckersley Retention Agreement, dated March 3, 2021. * | | Incorporated by reference to Exhibit 10.2 of the Company’s Form 8-K filed with the SEC on March 10, 2021 (File No. 001-35971). |
| | | | |
| | Timothy P. Eckersley Restricted Stock Unit Award Agreement, dated March 10, 2021. * | | Incorporated by reference to Exhibit 10.6 of the Company's Form 10-Q filed with the SEC on April 22, 2021 (File No. 001-35971). |
| | | | |
| | Timothy P. Eckersley Performance Stock Unit Award Agreement, dated March 10, 2021. * | | Incorporated by reference to Exhibit 10.7 of the Company's Form 10-Q filed with the SEC on April 22, 2021 (File No. 001-35971). |
| | | | |
| | Luis Orbegoso Offer Letter, dated January 29, 2021. * | | Filed herewith. |
| | | | |
| | Luis Orbegoso Restricted Stock Unit Award Agreement, dated February 18, 2021. * | | Filed herewith. |
| | | | |
| | Luis Orbegoso Separation Agreement, dated December 31, 2021. * | | Filed herewith. |
| | | | |
|
| | List of subsidiaries of Allegion plcplc. | | Filed herewithherewith. |
| | | | |
|
| | Consent of Independent Registered Public Accounting FirmFirm. | | Filed herewithherewith. |
| | | | |
|
| | Certification of Chief Executive Officer Pursuant to Rule 13a-14(a) or Rule 15d-14(a), as Adopted Pursuant to Section 302 of the Sarbanes-Oxley Act of 2002. | | Filed herewithherewith. |
| | | | |
|
| | Certification of Chief Financial Officer Pursuant to Rule 13a-14(a) or Rule 15d-14(a), as Adopted Pursuant to Section 302 of the Sarbanes-Oxley Act of 2002. | | Filed herewithherewith. |
| | | | |
|
| | Certifications of Chief Executive Officer and Chief Financial Officer Pursuant to Rule 13a-14(b) or Rule 15d-14(b) and 18U.S.C. Section 1350, as Adopted Pursuant to Section 906 of the Sarbanes-Oxley Act of 2002. | | Furnished herewith |
| | | | |
| herewith. |
| | | | |
| 101.INS | | XBRL Instance Document. | | The instance document does not appear in the Interactive Data File because its XBRL tags are embedded within the Inline XBRL document. |
| | | | |
101101.SCH |
| XBRL Taxonomy Extension Schema Document. | The following materials from the Company’s Annual Report on Form 10-K for the year ended December 31, 2017, formatted | Filed herewith. |
| | | | |
| 101.CAL | | XBRL Taxonomy Extension Calculation Linkbase Document. | | Filed herewith. |
| | | | |
| 101.DEF | | XBRL Taxonomy Extension Definition Linkbase Document. | | Filed herewith. |
| | | | |
| 101.LAB | | XBRL Taxonomy Extension Labels Linkbase Document. | | Filed herewith. |
| | | | |
| 101.PRE | | XBRL Taxonomy Extension Presentation Linkbase Document. | | Filed herewith. |
| | | | |
| 104 | | Cover Page Interactive Data File. | | Formatted as Inline XBRL and contained in XBRL (Extensible Business Reporting Language): (i) the Consolidated Statements of Comprehensive Income, (ii) the Consolidated Balance Sheets, (iii) the Consolidated Statement of Cash Flows, (iv) the Consolidated Statements of Equity and (v) Notes to Consolidated Financial Statements. | | Filed herewithExhibit 101. |
* Compensatory plan or arrangement.
Item 16.FORM 10-K SUMMARY
Not applicable.
SIGNATURES
Pursuant to the requirements of Section 13 or 15(d) of the Securities Exchange Act of 1934, the registrant has duly caused this report to be signed on its behalf by the undersigned, thereunto duly authorized.
ALLEGION PLC
(Registrant)
|
| | | | | | | |
| By: | | /s/ David D. Petratis |
| | David D. Petratis |
| | Chief Executive Officer |
| Date: | | February 20, 201815, 2022 |
Pursuant to the requirement of the Securities Exchange Act of 1934, this report has been signed by the following persons on behalf of the registrant and in the capacities and on the dates indicated.
| | | | | | | | | | | | | | |
| Signature | | Title | | Date |
| | | | |
Signature | | Title | | Date |
| | | | |
| /s/ David D. Petratis | | Chairman of the Board, President and Chief Executive Officer (Principal Executive Officer) | | February 20, 201815, 2022 |
| (David D. Petratis) | | | |
| | | | |
| /s/ Patrick S. Shannon | | Senior Vice President and Chief Financial Officer (Principal Financial Officer) | | February 20, 201815, 2022 |
| (Patrick S. Shannon) | | | |
| | | | |
| /s/ Douglas P. Ranck | | Vice President, Controller and Chief Accounting Officer (Principal Accounting Officer) | | February 20, 201815, 2022 |
| (Douglas P. Ranck) | | | |
| | | | |
/s/ Carla Cico | | Director | | February 20, 2018 |
(Carla Cico) | | | |
| | | | |
| /s/ Kirk S. Hachigian | | Director | | February 20, 201815, 2022 |
| (Kirk S. Hachigian) | | | | |
| | | | |
| /s/ Steven C. Mizell | | Director | | February 15, 2022 |
| (Steven C. Mizell) | | | | |
| | | | |
| /s/ Nicole Parent Haughey | | Director | | February 20, 201815, 2022 |
| (Nicole Parent Haughey) | | | | |
| | | | |
| /s/ Lauren B. Peters | | Director | | February 15, 2022 |
| (Lauren B. Peters) | | | | |
| | | | |
| /s/ Dean I. Schaffer | | Director | | February 20, 201815, 2022 |
| (Dean I. Schaffer) | | | | |
| | | | |
| /s/ Charles L. Szews | | Director | | February 15, 2022 |
| (Charles L. Szews) | | | | |
| | | | |
| /s/ Dev Vardhan | | Director | | February 15, 2022 |
| (Dev Vardhan) | | | | |
| | | | |
| /s/ Martin E. Welch III | | Director | | February 20, 201815, 2022 |
| (Martin E. Welch III) | | | | |
| | | | |
ALLEGION PLC
Index to Consolidated Financial Statements
Report of Independent Registered Public Accounting Firm
To the Shareholders and Board of Directors and Shareholders of Allegion plc:Public Limited Company
Opinions on the Financial Statements and Internal Control over Financial Reporting
We have audited the accompanying consolidatedbalance sheets of Allegion plcand its subsidiaries(the “Company”) as of December 31, 2017 2021and 2016,2020,and the related consolidated statements of comprehensive income, of equity and of cash flows for each of the three years in the period ended December 31, 2017,2021, including the related notes and financial statement schedulelisted in the accompanying index (collectively referred to as the “consolidatedfinancial statements”).We also have audited the Company's internal control over financial reporting as of December31, 2017,2021, based on criteria established in Internal Control - Integrated Framework(2013)issued by the Committee of Sponsoring Organizations of the Treadway Commission (COSO).
In our opinion, the consolidatedfinancial statements referred to above present fairly, in all material respects, the financial position of the Company as of December31,2017 2021and 20162020, and the results of theiritsoperations and theiritscash flows for each of the three years in the period ended December31,2017 2021in conformity with accounting principles generally accepted in the United States of America. Also in our opinion, the Company maintained, in all material respects, effective internal control over financial reporting as of December 31, 2017,2021, based on criteria established in Internal Control - Integrated Framework(2013)issued by the COSO.
Basis for Opinions
The Company's management is responsible for these consolidatedfinancial statements, for maintaining effective internal control over financial reporting, and for its assessment of the effectiveness of internal control over financial reporting, included in Management'sManagement’s Report on Internal Control Over Financial Reporting appearing under Item 9A. Our responsibility is to express opinions on the Company’s consolidatedfinancial statements and on the Company's internal control over financial reporting based on our audits. We are a public accounting firm registered with the Public Company Accounting Oversight Board (United States) ("PCAOB")(PCAOB) and are required to be independent with respect to the Company in accordance with the U.S. federal securities laws and the applicable rules and regulations of the Securities and Exchange Commission and the PCAOB.
We conducted our audits in accordance with the standards of the PCAOB. Those standards require that we plan and perform the audits to obtain reasonable assurance about whether the consolidatedfinancial statements are free of material misstatement, whether due to error or fraud, and whether effective internal control over financial reporting was maintained in all material respects.
Our audits of the consolidatedfinancial statements included performing procedures to assess the risks of material misstatement of the consolidatedfinancial statements, whether due to error or fraud, and performing procedures that respond to those risks. Such procedures included examining, on a test basis, evidence regarding the amounts and disclosures in the consolidatedfinancial statements. Our audits also included evaluating the accounting principles used and significant estimates made by management, as well as evaluating the overall presentation of the consolidatedfinancial statements. Our audit of internal control over financial reporting included obtaining an understanding of internal control over financial reporting, assessing the risk that a material weakness exists, and testing and evaluating the design and operating effectiveness of internal control based on the assessed risk. Our audits also included performing such other procedures as we considered necessary in the circumstances. We believe that our audits provide a reasonable basis for our opinions.
Definition and Limitations of Internal Control over Financial Reporting
A company’s internal control over financial reporting is a process designed to provide reasonable assurance regarding the reliability of financial reporting and the preparation of financial statements for external purposes in accordance with generally accepted accounting principles. A company’s internal control over financial reporting includes those policies and procedures that (i) pertain to the maintenance of records that, in reasonable detail, accurately and fairly reflect the transactions and dispositions of the assets of the company; (ii) provide reasonable assurance that transactions are recorded as necessary to permit preparation of financial statements in accordance with generally accepted accounting principles, and that receipts and expenditures of the company are being made only in accordance with authorizations of management and directors of the company; and (iii) provide reasonable assurance regarding prevention or timely detection of unauthorized acquisition, use, or disposition of the company’s assets that could have a material effect on the financial statements.
Because of its inherent limitations, internal control over financial reporting may not prevent or detect misstatements. Also, projections of any evaluation of effectiveness to future periods are subject to the risk that controls may become inadequate because of changes in conditions, or that the degree of compliance with the policies or procedures may deteriorate.
Critical Audit Matters
The critical audit matter communicated below is a matter arising from the current period audit of the consolidated financial statements that was communicated or required to be communicated to the audit committee and that (i) relates to accounts or disclosures that are material to theconsolidated financial statements and (ii) involved our especially challenging, subjective, or complex judgments. The communication of critical audit matters does not alter in any way our opinion on the consolidatedfinancial statements, taken as a whole, and we are not, by communicating the critical audit matter below, providing a separate opinion on the critical audit matter or on the accounts or disclosures to which it relates.
Goodwill Impairment Assessment - Allegion International Reporting Unit
As described in Notes 2 and 5 to the consolidated financial statements, the Company’s consolidated goodwill balance was $803.8 million as of December 31, 2021, and the goodwill associated with the Allegion International reporting unit was $302.6 million. As disclosed by management, goodwill is tested annually for impairment during the fourth quarter or whenever there is a significant change in events or circumstances that indicate that the fair value of the reporting unit is more likely than not less than the carrying amount of the reporting unit. If the estimated fair value of a reporting unit exceeds its carrying amount, goodwill of the reporting unit is not impaired. To the extent that the carrying value of the reporting unit exceeds its estimated fair value, a goodwill impairment charge will be recognized for the amount by which the carrying value of the reporting unit exceeds its fair value, not to exceed the carrying amount of goodwill. For the annual impairment analysis, the estimated fair value of the Allegion International reporting unit was based on two valuation techniques, a discounted cash flow model (income approach) and a market multiple of earnings (market approach), with each method being weighted in the calculation. The income approach relies on management’s estimates of revenue growth rates, margin assumptions, and discount rates. The market approach requires the determination of an appropriate peer group, which is utilized to derive estimated fair values based on selected market multiples.
The principal considerations for our determination that performing procedures relating to the goodwill impairment assessment of the Allegion International reporting unit is a critical audit matter are (i) the significant judgment by management when developing the fair value of the reporting unit; (ii) a high degree of auditor judgment, subjectivity, and effort in performing procedures and evaluating management’s significant assumptions related to revenue growth rates, discount rates, peer group determination, and selected market multiples; and (iii) the audit effort involved the use of professionals with specialized skill and knowledge.
Addressing the matter involved performing procedures and evaluating audit evidence in connection with forming our overall opinion on the consolidated financial statements. These procedures included testing the effectiveness of controls relating to management’s goodwill impairment assessment, including controls over the valuation of the Allegion International reporting unit. These procedures also included, among others (i) testing management’s process for developing the fair value estimate of the Allegion International reporting unit; (ii) evaluating the appropriateness of the income and market approaches; (iii) testing the completeness and accuracy of underlying data used in the approaches; and (iv) evaluating the reasonableness of the significant assumptions used by management related to revenue growth rates and discount rates in the income approach, and the peer group determination and selected market multiples in the market approach. Evaluating management’s assumptions related to revenue growth rates involved evaluating whether the assumptions used by management were reasonable considering (i) the current and past performance of the reporting unit, (ii) the consistency with external market and industry data, and (iii) whether the assumption was consistent with evidence obtained in other areas of the audit. Evaluating the Company’s peer group determination included assessing the appropriateness of the identified peer companies. Professionals with specialized skill and knowledge were used to assist in the evaluation of management’s income and market approaches, and the discount rates, peer group determination, and selected market multiples assumptions.
/s/ PricewaterhouseCoopers LLP
Indianapolis, Indiana
February 20, 201815, 2022
We have served as the Company’s auditor since 2013.
Allegion plc Consolidated Statements of Comprehensive Income In millions, except per share amounts
|
| | | | | | | | | | | | |
| For the years ended December 31, | | 2017 | | 2016 | | 2015 |
| Net revenues | | $ | 2,408.2 |
| | $ | 2,238.0 |
| | $ | 2,068.1 |
|
| Cost of goods sold | | 1,337.5 |
| | 1,252.7 |
| | 1,199.0 |
|
| Selling and administrative expenses | | 582.5 |
| | 559.8 |
| | 510.5 |
|
| Operating income | | 488.2 |
| | 425.5 |
| | 358.6 |
|
| Interest expense | | 105.7 |
| | 64.3 |
| | 52.9 |
|
| Loss on divestitures | | — |
|
| 84.4 |
| | 104.2 |
|
| Other income, net | | (13.2 | ) | | (18.2 | ) | | (7.8 | ) |
| Earnings before income taxes | | 395.7 |
| | 295.0 |
| | 209.3 |
|
| Provision for income taxes | | 119.0 |
| | 63.8 |
| | 54.6 |
|
| Earnings from continuing operations | | 276.7 |
| | 231.2 |
| | 154.7 |
|
| Discontinued operations, net of tax | | — |
| | — |
| | (0.4 | ) |
| Net earnings | | 276.7 |
| | 231.2 |
| | 154.3 |
|
| Less: Net earnings attributable to noncontrolling interests | | 3.4 |
| | 2.1 |
| | 0.4 |
|
| Net earnings attributable to Allegion plc | | $ | 273.3 |
| | $ | 229.1 |
| | $ | 153.9 |
|
| Amounts attributable to Allegion plc ordinary shareholders: | |
| |
| | |
| Continuing operations | | $ | 273.3 |
| | $ | 229.1 |
| | $ | 154.3 |
|
| Discontinued operations | | — |
| | — |
| | (0.4 | ) |
| Net earnings | | $ | 273.3 |
| | $ | 229.1 |
| | $ | 153.9 |
|
| Earnings per share attributable to Allegion plc ordinary shareholders: | | | | | | |
| Basic: | | | | | | |
| Continuing operations | | $ | 2.87 |
| | $ | 2.39 |
| | $ | 1.61 |
|
| Discontinued operations | | — |
| | — |
| | (0.01 | ) |
| Net earnings | | $ | 2.87 |
| | $ | 2.39 |
| | $ | 1.60 |
|
| Diluted: | |
| |
| | |
| Continuing operations | | $ | 2.85 |
| | $ | 2.36 |
| | $ | 1.59 |
|
| Discontinued operations | | — |
| | — |
| | — |
|
| Net earnings | | $ | 2.85 |
| | $ | 2.36 |
| | $ | 1.59 |
|
| | | | | | | |
| Dividends declared per ordinary share | | $ | 0.64 |
| | $ | 0.48 |
| | $ | 0.40 |
|
Allegion plc Consolidated Statements of Comprehensive Income (continued) In millions, except per share amounts
|
| | | | | | | | | | | | |
| For the years ended December 31, | | 2017 | | 2016 | | 2015 |
| Net earnings | | $ | 276.7 |
| | $ | 231.2 |
| | $ | 154.3 |
|
| Other comprehensive income, net of tax | | | | | | |
| Currency translation | | 97.5 |
| | (40.7 | ) | | (60.5 | ) |
| Cash flow hedges and marketable securities: | | | | | | |
| Unrealized net gains arising during period | | 5.2 |
| | 9.7 |
| | 15.8 |
|
| Net gains reclassified into earnings | | (4.7 | ) | | (19.0 | ) | | (17.5 | ) |
| Tax expense | | (0.1 | ) | | (1.3 | ) | | — |
|
| Total cash flow hedges and marketable securities, net of tax | | 0.4 |
| | (10.6 | ) | | (1.7 | ) |
| Pension and OPEB adjustments: | | | | | | |
| Prior service costs for the period | | — |
| | — |
| | (0.1 | ) |
| Net actuarial gains (losses) for the period | | 25.5 |
| | 3.1 |
| | (37.6 | ) |
| Amortization reclassified into earnings | | 5.2 |
| | 6.0 |
| | 5.4 |
|
| Settlements/curtailments reclassified to earnings | | 0.1 |
| | 0.3 |
| | 1.1 |
|
| Currency translation and other | | 0.7 |
| | 14.4 |
| | 5.0 |
|
| Tax (expense) benefit | | (12.2 | ) | | (5.0 | ) | | 3.0 |
|
| Total pension and OPEB adjustments, net of tax | | 19.3 |
| | 18.8 |
| | (23.2 | ) |
| Other comprehensive income (loss), net of tax | | 117.2 |
| | (32.5 | ) | | (85.4 | ) |
| Total comprehensive income, net of tax | | 393.9 |
| | 198.7 |
| | 68.9 |
|
| Less: Total comprehensive income (loss) attributable to noncontrolling interests | | 2.8 |
| | 1.7 |
| | (0.9 | ) |
| Total comprehensive income attributable to Allegion plc | | $ | 391.1 |
| | $ | 197.0 |
| | $ | 69.8 |
|
Consolidated Statements of Comprehensive Income
In millions, except per share amounts
| | | | | | | | | | | | | | | | | | | | |
| For the years ended December 31, | | 2021 | | 2020 | | 2019 |
| Net revenues | | $ | 2,867.4 | | | $ | 2,719.9 | | | $ | 2,854.0 | |
| Cost of goods sold | | 1,662.5 | | | 1,541.1 | | | 1,601.7 | |
| Selling and administrative expenses | | 674.7 | | | 635.7 | | | 681.3 | |
| Impairment of goodwill and intangible assets | | — | | | 101.7 | | | 5.9 | |
| Loss on assets held for sale | | — | | | 37.9 | | | — | |
| Operating income | | 530.2 | | | 403.5 | | | 565.1 | |
| Interest expense | | 50.2 | | | 51.1 | | | 56.0 | |
| Loss on divestitures | | — | | | — | | | 30.1 | |
| Other (income) expense, net | | (44.0) | | | (13.0) | | | 3.8 | |
| Earnings before income taxes | | 524.0 | | | 365.4 | | | 475.2 | |
| Provision for income taxes | | 40.7 | | | 50.9 | | | 73.1 | |
| Net earnings | | 483.3 | | | 314.5 | | | 402.1 | |
| Less: Net earnings attributable to noncontrolling interests | | 0.3 | | | 0.2 | | | 0.3 | |
| Net earnings attributable to Allegion plc | | $ | 483.0 | | | $ | 314.3 | | | $ | 401.8 | |
| Amounts attributable to Allegion plc ordinary shareholders: | | | | | | |
| Earnings per share attributable to Allegion plc ordinary shareholders: | | | | | | |
| Basic net earnings: | | $ | 5.37 | | | $ | 3.41 | | | $ | 4.29 | |
| Diluted net earnings: | | $ | 5.34 | | | $ | 3.39 | | | $ | 4.26 | |
| | | | | | |
| Net earnings | | $ | 483.3 | | | $ | 314.5 | | | $ | 402.1 | |
| Other comprehensive income (loss), net of tax: | | | | | | |
| Currency translation | | (63.3) | | | 57.3 | | | 13.4 | |
| Cash flow hedges: | | | | | | |
| Unrealized net gains arising during period | | 2.6 | | | 3.9 | | | — | |
| Net gains reclassified into earnings | | (0.2) | | | (5.8) | | | (7.5) | |
| Tax (expense) benefit | | (0.6) | | | 0.5 | | | 1.9 | |
| Total cash flow hedges, net of tax | | 1.8 | | | (1.4) | | | (5.6) | |
| Pension and OPEB adjustments: | | | | | | |
| Prior service gains (costs) and net actuarial gains (losses), net | | 25.7 | | | 4.9 | | | (8.3) | |
| Amortization reclassified into earnings | | 4.8 | | | 5.0 | | | 6.1 | |
| Settlements/curtailments reclassified into earnings | | 0.5 | | | 0.1 | | | 2.3 | |
| Currency translation and other | | 1.0 | | | (2.1) | | | (2.7) | |
| Tax expense | | (7.7) | | | (2.0) | | | (0.4) | |
| Total pension and OPEB adjustments, net of tax | | 24.3 | | | 5.9 | | | (3.0) | |
| Other comprehensive (loss) income, net of tax | | (37.2) | | | 61.8 | | | 4.8 | |
| Total comprehensive income, net of tax | | 446.1 | | | 376.3 | | | 406.9 | |
| Less: Total comprehensive income attributable to noncontrolling interests | | 0.4 | | | 0.5 | | | 0.2 | |
| Total comprehensive income attributable to Allegion plc | | $ | 445.7 | | | $ | 375.8 | | | $ | 406.7 | |
See accompanying notes to consolidated financial statements.
Allegion plc
Consolidated Balance Sheets
In millions, except share amounts
| | | As of December 31, | | 2017 | | 2016 | As of December 31, | | 2021 | | 2020 |
| ASSETS | | | | | ASSETS | | | | |
| Current assets: | | | | | Current assets: | |
| Cash and cash equivalents | | $ | 466.2 |
| | $ | 312.4 |
| Cash and cash equivalents | | $ | 397.9 | | | $ | 480.4 | |
| | Accounts and notes receivable, net | | 296.6 |
| | 260.0 |
| Accounts and notes receivable, net | | 283.3 | | | 321.8 | |
| Inventories | | 239.8 |
| | 220.6 |
| Inventories | | 380.4 | | | 283.1 | |
| Current tax receivable | | 12.2 |
| | 11.9 |
| Current tax receivable | | 29.1 | | | 25.8 | |
| Other current assets | | 17.0 |
| | 22.2 |
| Other current assets | | 26.9 | | | 28.1 | |
| Assets held for sale | | 0.9 |
| | 2.2 |
| Assets held for sale | | — | | | 5.8 | |
| Total current assets | | 1,032.7 |
| | 829.3 |
| Total current assets | | 1,117.6 | | | 1,145.0 | |
| Property, plant and equipment, net | | 252.2 |
| | 226.6 |
| Property, plant and equipment, net | | 283.7 | | | 294.9 | |
| Goodwill | | 761.2 |
| | 716.8 |
| Goodwill | | 803.8 | | | 819.0 | |
| Intangible assets, net | | 394.3 |
| | 357.4 |
| Intangible assets, net | | 447.5 | | | 487.1 | |
| Deferred and noncurrent income taxes | | 35.4 |
| | 72.3 |
| Deferred and noncurrent income taxes | | 154.5 | | | 126.7 | |
| Other noncurrent assets | | 66.2 |
| | 45.0 |
| Other noncurrent assets | | 243.9 | | | 196.7 | |
| Total assets | | $ | 2,542.0 |
| | $ | 2,247.4 |
| Total assets | | $ | 3,051.0 | | | $ | 3,069.4 | |
| LIABILITIES AND EQUITY | | | | | LIABILITIES AND EQUITY | | | | |
| Current liabilities: | | | | | Current liabilities: | |
| Accounts payable | | $ | 188.3 |
| | $ | 179.9 |
| Accounts payable | | $ | 259.1 | | | $ | 220.4 | |
| Accrued compensation and benefits | | 84.7 |
| | 81.0 |
| Accrued compensation and benefits | | 117.7 | | | 86.1 | |
| Accrued expenses and other current liabilities | | 134.6 |
| | 117.8 |
| Accrued expenses and other current liabilities | | 199.9 | | | 189.4 | |
| Current tax payable | | 18.2 |
| | 2.7 |
| Current tax payable | | 11.9 | | | 18.2 | |
| Short-term borrowings and current maturities of long-term debt | | 35.0 |
| | 48.2 |
| Short-term borrowings and current maturities of long-term debt | | 12.6 | | | 0.2 | |
| Liabilities held for sale | | Liabilities held for sale | | — | | | 7.2 | |
| Total current liabilities | | 460.8 |
| | 429.6 |
| Total current liabilities | | 601.2 | | | 521.5 | |
| Long-term debt | | 1,442.3 |
| | 1,415.6 |
| Long-term debt | | 1,429.5 | | | 1,429.4 | |
| Postemployment and other benefit liabilities | | 85.9 |
| | 134.5 |
| Postemployment and other benefit liabilities | | 69.2 | | | 79.4 | |
| Deferred and noncurrent income taxes | | 123.6 |
| | 118.7 |
| Deferred and noncurrent income taxes | | 100.8 | | | 105.7 | |
| Other noncurrent liabilities | | 23.9 |
| | 32.6 |
| Other noncurrent liabilities | | 87.9 | | | 100.8 | |
| Total liabilities | | 2,136.5 |
| | 2,131.0 |
| Total liabilities | | 2,288.6 | | | 2,236.8 | |
| Equity: | | | | | Equity: | | | | |
| Allegion plc shareholders’ equity | | | | | Allegion plc shareholders’ equity | |
| Ordinary shares, $0.01 par value (95,062,385 and 95,273,927 shares issued and outstanding at December 31, 2017 and 2016, respectively) | | 1.0 |
| | 1.0 |
| |
| Ordinary shares, $0.01 par value (88,215,625 and 91,212,741 shares issued and outstanding at December 31, 2021 and 2020, respectively) | | Ordinary shares, $0.01 par value (88,215,625 and 91,212,741 shares issued and outstanding at December 31, 2021 and 2020, respectively) | | 0.9 | | | 0.9 | |
| Capital in excess of par value | | 9.1 |
| | — |
| Capital in excess of par value | | — | | | — | |
| Retained earnings | | 544.4 |
| | 376.6 |
| Retained earnings | | 952.6 | | | 985.6 | |
| Accumulated other comprehensive loss | | (152.9 | ) | | (264.3 | ) | Accumulated other comprehensive loss | | (194.4) | | | (157.1) | |
| Total Allegion plc shareholders’ equity | | 401.6 |
| | 113.3 |
| Total Allegion plc shareholders’ equity | | 759.1 | | | 829.4 | |
| Noncontrolling interest | | 3.9 |
| | 3.1 |
| |
| Noncontrolling interests | | Noncontrolling interests | | 3.3 | | | 3.2 | |
| Total equity | | 405.5 |
| | 116.4 |
| Total equity | | 762.4 | | | 832.6 | |
| Total liabilities and equity | | $ | 2,542.0 |
| | $ | 2,247.4 |
| Total liabilities and equity | | $ | 3,051.0 | | | $ | 3,069.4 | |
See accompanying notes to consolidated financial statements.
Allegion plc Consolidated Statements of Equity |
| | | | | | | | | | | | | | | | | | | | | | | | | | | |
| | | | | Allegion plc Shareholders' equity | |
| In millions | | Total equity | | Ordinary Shares | | Capital in excess of par value | | Retained earnings | | Accumulated other comprehensive income (loss) | | Non-controlling Interest |
| | | Amount | | Shares | | | |
| Balance at December 31, 2014 | | $ | 18.5 |
| | $ | 1.0 |
| | 95.8 |
| | $ | — |
| | $ | 142.4 |
| | $ | (148.2 | ) | | $ | 23.3 |
|
| Net earnings | | 154.3 |
| | — |
| | — |
| | — |
| | 153.9 |
| | — |
| | 0.4 |
|
| Other comprehensive loss | | (85.4 | ) | | — |
| | — |
| | — |
| | (0.1 | ) | | (84.0 | ) | | (1.3 | ) |
| Shares issued under incentive stock plans | | 14.3 |
| | — |
| | — |
| | 14.3 |
| | — |
| | — |
| | — |
|
| Repurchase of ordinary shares | | (30.0 | ) | | — |
| | (0.5 | ) | | (4.5 | ) | | (25.5 | ) | | — |
| | — |
|
| Share-based compensation | | 14.6 |
| | — |
| | 0.7 |
| | 14.6 |
| | — |
| | — |
| | — |
|
| Acquisition/divestiture of noncontrolling interest | | 1.7 |
| | — |
| | — |
| | — |
| | — |
| | — |
| | 1.7 |
|
| Dividends declared to noncontrolling interest | | (20.0 | ) | | — |
| | — |
| | — |
| | — |
| | — |
| | (20.0 | ) |
| Cash dividends declared ($0.40 per share) | | (38.3 | ) | | — |
| | — |
| | — |
| | (38.3 | ) | | — |
| | — |
|
| Balance at December 31, 2015 | | 29.7 |
| | 1.0 |
| | 96.0 |
| | 24.4 |
| | 232.4 |
| | (232.2 | ) | | 4.1 |
|
| Net earnings | | 231.2 |
| | — |
| | — |
| | — |
| | 229.1 |
| | — |
| | 2.1 |
|
| Other comprehensive loss | | (32.5 | ) | | — |
| | — |
| | — |
| | — |
| | (32.1 | ) | | (0.4 | ) |
| Shares issued under incentive stock plans | | 5.8 |
| | — |
| | — |
| | 5.8 |
| | — |
| | — |
| | — |
|
| Repurchase of ordinary shares | | (85.1 | ) | | — |
| | (1.3 | ) | | (46.4 | ) | | (38.7 | ) | | — |
| | — |
|
| Share-based compensation | | 16.6 |
| | — |
| | 0.6 |
| | 16.6 |
| | — |
| | — |
| | — |
|
| Acquisition/divestiture of noncontrolling interest | | (0.4 | ) | | — |
| | — |
| | (0.4 | ) | | — |
| | — |
| | — |
|
| Dividends declared to noncontrolling interest | | (2.7 | ) | | — |
| | — |
| | — |
| | — |
| | — |
| | (2.7 | ) |
| Cash dividends declared ($0.48 per share) | | (46.0 | ) | | — |
| | — |
| | — |
| | (46.0 | ) | | — |
| | — |
|
| Other | | (0.2 | ) | | — |
| | — |
| | — |
| | (0.2 | ) | | — |
| | — |
|
| Balance at December 31, 2016 | | 116.4 |
| | 1.0 |
| | 95.3 |
| | — |
| | 376.6 |
| | (264.3 | ) | | 3.1 |
|
| Cumulative effect of change in accounting principle | | (5.0 | ) | | — |
| | — |
| | — |
| | (5.0 | ) | | — |
| | — |
|
| Net earnings | | 276.7 |
| | — |
| | — |
| | — |
| | 273.3 |
| | — |
| | 3.4 |
|
| Other comprehensive income (loss) | | 117.2 |
| | — |
| | — |
| | — |
| | — |
| | 117.8 |
| | (0.6 | ) |
| Shares issued under incentive stock plans | | 7.2 |
| | — |
| | — |
| | 7.2 |
| | — |
| | — |
| | — |
|
| Repurchase of ordinary shares | | (60.0 | ) | | — |
| | (0.8 | ) | | (13.9 | ) | | (46.1 | ) | | — |
| | — |
|
| Share-based compensation | | 15.8 |
| | — |
| | 0.6 |
| | 15.8 |
| | — |
| | — |
| | — |
|
| Dividends declared to noncontrolling interest | | (1.8 | ) | | — |
| | — |
| | — |
| | — |
| | — |
| | (1.8 | ) |
| Cash dividends declared ($0.64 per share) | | (60.9 | ) | | — |
| | — |
| | — |
| | (60.9 | ) | | — |
| | — |
|
| Other (see Note 13) | | (0.1 | ) | | — |
| | — |
| | — |
| | 6.5 |
| | (6.4 | ) | | (0.2 | ) |
| Balance at December 31, 2017 | | $ | 405.5 |
| | $ | 1.0 |
| | 95.1 |
| | $ | 9.1 |
| | $ | 544.4 |
| | $ | (152.9 | ) | | $ | 3.9 |
|
Allegion plc
Consolidated Statements of Equity
In millions, except per share amounts
| | | | | | | | | | | | | | | | | | | | | | | | | | | | | | | | | | | | | | | | | | | | |
| | | | Allegion plc shareholders' equity | | |
| | Total
equity | | Ordinary Shares | | Capital in excess of par value | | Retained earnings | | Accumulated
other
comprehensive loss | | Noncontrolling interests |
| | Amount | | Shares | | | |
| Balance at December 31, 2018 | | $ | 654.0 | | | $ | 0.9 | | | 94.6 | | | $ | — | | | $ | 873.6 | | | $ | (223.5) | | | $ | 3.0 | |
| | | | | | | | | | | | | | |
| Net earnings | | 402.1 | | | — | | | — | | | — | | | 401.8 | | | — | | | 0.3 | |
| Other comprehensive income (loss), net | | 4.8 | | | — | | | — | | | — | | | — | | | 4.9 | | | (0.1) | |
| Repurchase of ordinary shares | | (226.0) | | | — | | | (2.3) | | | (26.5) | | | (199.5) | | | — | | | — | |
| Share-based compensation activity | | 26.5 | | | — | | | 0.4 | | | 26.5 | | | — | | | — | | | — | |
| | | | | | | | | | | | | | |
| Dividends declared to noncontrolling interests | | (0.2) | | | — | | | — | | | — | | | — | | | — | | | (0.2) | |
| Cash dividends declared ($1.08 per share) | | (100.9) | | | — | | | — | | | — | | | (100.9) | | | — | | | — | |
| Other | | 0.1 | | | — | | | — | | | — | | | 0.1 | | | — | | | — | |
| Balance at December 31, 2019 | | 760.4 | | | 0.9 | | | 92.7 | | | — | | | 975.1 | | | (218.6) | | | 3.0 | |
Cumulative effect of adoption of ASC 326, Financial Instruments – Credit Losses | | (2.2) | | | — | | | — | | | — | | | (2.2) | | | — | | | — | |
| Net earnings | | 314.5 | | | — | | | — | | | — | | | 314.3 | | | — | | | 0.2 | |
| Other comprehensive income, net | | 61.8 | | | — | | | — | | | — | | | — | | | 61.5 | | | 0.3 | |
| Repurchase of ordinary shares | | (208.8) | | | — | | | (1.9) | | | (24.8) | | | (184.0) | | | — | | | — | |
| Share-based compensation activity | | 24.8 | | | — | | | 0.4 | | | 24.8 | | | — | | | — | | | — | |
| | | | | | | | | | | | | | |
| Dividends declared to noncontrolling interests | | (0.3) | | | — | | | — | | | — | | | — | | | — | | | (0.3) | |
| Cash dividends declared ($1.28 per share) | | (117.9) | | | — | | | — | | | — | | | (117.9) | | | — | | | — | |
| Other | | 0.3 | | | — | | | — | | | — | | | 0.3 | | | — | | | — | |
| Balance at December 31, 2020 | | 832.6 | | | 0.9 | | | 91.2 | | | — | | | 985.6 | | | (157.1) | | | 3.2 | |
| | | | | | | | | | | | | | |
| Net earnings | | 483.3 | | | — | | | — | | | — | | | 483.0 | | | — | | | 0.3 | |
| Other comprehensive (loss) income, net | | (37.2) | | | — | | | — | | | — | | | — | | | (37.3) | | | 0.1 | |
| Repurchase of ordinary shares | | (412.8) | | | — | | | (3.3) | | | (25.8) | | | (387.0) | | | — | | | — | |
| Share-based compensation activity | | 25.8 | | | — | | | 0.3 | | | 25.8 | | | — | | | — | | | — | |
| | | | | | | | | | | | | | |
| Dividends declared to noncontrolling interests | | (0.3) | | | — | | | — | | | — | | | — | | | — | | | (0.3) | |
| Cash dividends declared ($1.44 per share) | | (129.0) | | | — | | | — | | | — | | | (129.0) | | | — | | | — | |
| | | | | | | | | | | | | | |
| Balance at December 31, 2021 | | $ | 762.4 | | | $ | 0.9 | | | 88.2 | | | $ | — | | | $ | 952.6 | | | $ | (194.4) | | | $ | 3.3 | |
See accompanying notes to consolidated financial statements.
Allegion plc Consolidated Statements of Cash Flows In millions
|
| | | | | | | | | | | | |
| For the years ended December 31, | | 2017 | | 2016 | | 2015 |
| Cash flows from operating activities: | | | | | | |
| Net earnings | | $ | 276.7 |
| | $ | 231.2 |
| | $ | 154.3 |
|
| Loss from discontinued operations, net of tax | | — |
| | — |
| | 0.4 |
|
| Adjustments to arrive at net cash provided by operating activities: | | | | | | |
| Debt extinguishment costs | | 43.1 |
| | — |
| | — |
|
| Depreciation and amortization | | 66.9 |
| | 66.9 |
| | 53.2 |
|
| Share based compensation | | 16.2 |
| | 16.6 |
| | 14.6 |
|
| Loss on divestitures | | — |
| | 84.4 |
| | 102.8 |
|
| Gain on sale of marketable securities | | — |
| | (12.4 | ) | | (11.0 | ) |
| (Gain) loss on sale of property, plant and equipment | | (0.1 | ) | | 1.3 |
| | 0.9 |
|
| Equity earnings, net of dividends | | (5.3 | ) | | (3.2 | ) | | 0.3 |
|
| Discretionary pension plan contribution | | (50.0 | ) | | — |
| | — |
|
| Deferred income taxes | | 24.9 |
| | 6.3 |
| | (2.0 | ) |
| Other items | | 3.0 |
| | (7.7 | ) | | (14.6 | ) |
| Changes in other assets and liabilities | | | | | | |
| (Increase) decrease in: | | | | | | |
| Accounts and notes receivable | | (22.7 | ) | | (19.8 | ) | | (13.5 | ) |
| Inventories | | (4.4 | ) | | (15.6 | ) | | (5.8 | ) |
| Other current and noncurrent assets | | 3.5 |
| | 62.0 |
| | (5.0 | ) |
| Accounts payable | | 0.4 |
| | 3.4 |
| | (14.7 | ) |
| Other current and noncurrent liabilities | | (5.0 | ) | | (35.9 | ) | | (2.5 | ) |
| Net cash provided by continuing operating activities | | 347.2 |
| | 377.5 |
| | 257.4 |
|
| Net cash used in discontinued operating activities | | — |
| | — |
| | (0.4 | ) |
| Net cash provided by operating activities | | 347.2 |
| | 377.5 |
| | 257.0 |
|
| Cash flows from investing activities: | | | | | | |
| Capital expenditures | | (49.3 | ) | | (42.5 | ) | | (35.2 | ) |
| Acquisition of businesses, net of cash acquired | | (20.8 | ) | | (31.4 | ) | | (511.3 | ) |
| Proceeds from sale of property, plant and equipment | | 3.1 |
| | 0.1 |
| | 0.3 |
|
| Proceeds from sale of equity investment | | 15.6 |
| | — |
| | — |
|
| Proceeds (payments) related to business dispositions | | 1.2 |
| | (4.3 | ) | | 0.1 |
|
| Proceeds from sale of marketable securities | | — |
| | 14.1 |
| | 12.3 |
|
| Net cash used in investing activities | | $ | (50.2 | ) | | $ | (64.0 | ) | | $ | (533.8 | ) |
Allegion plc Consolidated Statements of Cash Flows - (Continued) In millions
|
| | | | | | | | | | | | |
| For the years ended December 31, | | 2017 | | 2016 | | 2015 |
| Cash flows from financing activities: | | | | | | |
| Short-term borrowings, net | | $ | (1.3 | ) | | $ | (17.4 | ) | | $ | 18.8 |
|
| Proceeds from revolving credit facility | | 165.0 |
| | — |
| | 400.0 |
|
| Proceeds from term facility | | 700.0 |
| | — |
| | — |
|
| Repayment of second amended credit facility | | (856.3 | ) | | — |
| | — |
|
| Proceeds from issuance of senior notes | | 800.0 |
| | — |
| | 300.0 |
|
| Redemption of senior notes | | (600.0 | ) | | — |
| | — |
|
| Payments of long-term debt | | (197.3 | ) | | (47.0 | ) | | (440.5 | ) |
| Net proceeds from (repayments of) debt | | 10.1 |
| | (64.4 | ) | | 278.3 |
|
| Debt issuance costs | | (9.5 | ) | | (0.3 | ) | | (9.0 | ) |
| Redemption premium | | (33.2 | ) | | — |
| | — |
|
| Dividends paid to ordinary shareholders | | (60.9 | ) | | (46.0 | ) | | (38.3 | ) |
| Dividends paid to noncontrolling interests | | (1.8 | ) | | (2.7 | ) | | (20.0 | ) |
| Repurchase of ordinary shares | | (60.0 | ) | | (85.1 | ) | | (30.0 | ) |
| Proceeds from shares issued under incentive plans | | 7.2 |
| | 5.8 |
| | 11.0 |
|
| Other, net | | (2.8 | ) | | (3.3 | ) | | 3.0 |
|
| Net cash (used in) provided by financing activities | | (150.9 | ) | | (196.0 | ) | | 195.0 |
|
| Effect of exchange rate changes on cash and cash equivalents | | 7.7 |
| | (4.8 | ) | | (9.0 | ) |
| Net increase (decrease) in cash and cash equivalents | | 153.8 |
| | 112.7 |
| | (90.8 | ) |
| Cash and cash equivalents – beginning of period | | 312.4 |
| | 199.7 |
| | 290.5 |
|
| Cash and cash equivalents – end of period | | $ | 466.2 |
| | $ | 312.4 |
| | $ | 199.7 |
|
Consolidated Statements of Cash Flows
In millions
| | | | | | | | | | | | | | | | | | | | |
| For the years ended December 31, | | 2021 | | 2020 | | 2019 |
| Cash flows from operating activities: | | | | | | |
| Net earnings | | $ | 483.3 | | | $ | 314.5 | | | $ | 402.1 | |
| Adjustments to arrive at net cash provided by operating activities: | | | | | | |
| Debt extinguishment costs | | 0.5 | | | — | | | 2.7 | |
| Depreciation and amortization | | 83.1 | | | 81.0 | | | 83.0 | |
| Impairment of goodwill and intangible assets | | — | | | 101.7 | | | 5.9 | |
| Loss on assets held for sale | | — | | | 37.3 | | | — | |
| Loss on divestitures | | — | | | — | | | 30.1 | |
| Share-based compensation | | 23.4 | | | 20.8 | | | 20.4 | |
| Unrealized (gains) losses on investments, net | | (25.6) | | | 2.0 | | | (3.1) | |
| | | | | | |
| | | | | | |
| | | | | | |
| Deferred income taxes | | (43.8) | | | (24.4) | | | (30.2) | |
| Other items | | 7.9 | | | (6.4) | | | (0.5) | |
| Changes in other assets and liabilities: | | | | | | |
| Accounts and notes receivable | | 31.7 | | | (1.9) | | | (6.0) | |
| Inventories | | (105.6) | | | (7.8) | | | 5.4 | |
| Other current and noncurrent assets | | (38.0) | | | (46.0) | | | (15.0) | |
| Accounts payable | | 40.0 | | | (1.6) | | | (11.0) | |
| Other current and noncurrent liabilities | | 31.7 | | | 21.1 | | | 4.4 | |
| Net cash provided by operating activities | | 488.6 | | | 490.3 | | | 488.2 | |
| Cash flows from investing activities: | | | | | | |
| Capital expenditures | | (45.4) | | | (47.1) | | | (65.6) | |
| Acquisition of and equity investments in businesses, net of cash acquired | | (6.5) | | | (12.5) | | | (7.6) | |
| | | | | | |
| Proceeds from sale of equity method investment | | 7.6 | | | — | | | — | |
| Proceeds related to business dispositions, net | | — | | | — | | | 3.3 | |
| | | | | | |
| | | | | | |
| | | | | | |
| Other investing activities, net | | 12.7 | | | 2.9 | | | (7.7) | |
| Net cash used in investing activities | | (31.6) | | | (56.7) | | | (77.6) | |
| Cash flows from financing activities: | | | | | | |
| | | | | | |
| | | | | | |
| | | | | | |
| Proceeds from issuance of 2021 Term Facility | | 250.0 | | | — | | | — | |
| Proceeds from issuance of senior notes | | — | | | — | | | 400.0 | |
| | | | | | |
| Payments of short-term borrowings and long-term debt, net | | (238.9) | | | (0.2) | | | (417.9) | |
| Proceeds from (repayments of) debt, net | | 11.1 | | | (0.2) | | | (17.9) | |
| Debt issuance costs | | (1.9) | | | — | | | (4.2) | |
| | | | | | |
| | | | | | |
| Dividends paid to ordinary shareholders | | (129.0) | | | (117.3) | | | (100.6) | |
| | | | | | |
| | | | | | |
| | | | | | |
| Repurchase of ordinary shares | | (412.8) | | | (208.8) | | | (226.0) | |
| Proceeds from shares issued under incentive plans | | — | | | 4.5 | | | 6.5 | |
| Other financing activities, net | | 3.3 | | | (0.1) | | | — | |
| Net cash used in financing activities | | (529.3) | | | (321.9) | | | (342.2) | |
| Effect of exchange rate changes on cash, cash equivalents and restricted cash | | (10.2) | | | 10.0 | | | (0.3) | |
| Net (decrease) increase in cash, cash equivalents and restricted cash | | (82.5) | | | 121.7 | | | 68.1 | |
| Cash, cash equivalents and restricted cash – beginning of period | | 480.4 | | | 358.7 | | | 290.6 | |
| Cash, cash equivalents and restricted cash – end of period | | $ | 397.9 | | | $ | 480.4 | | | $ | 358.7 | |
| | | | | | |
| | | | | | |
| | | | | | |
| | | | | | |
See accompanying notes to consolidated financial statements.
NOTES TO CONSOLIDATED FINANCIAL STATEMENTS
NOTE 1 – DESCRIPTION OF COMPANY AND BASIS OF PRESENTATION
Allegion plc, an Irish public limited company, and its consolidated subsidiaries ("Allegion" or "the Company") are a leading global company that provides security products and solutions that keep people and assets safe and secure in the places they reside, work and thrive. Allegion creates peace of mind by pioneering safety and security.security with a vision of seamless access and a safer world. The Company offers an extensive and versatile portfolio of mechanicalsecurity and electronic securityaccess control products and solutions across a range of market-leading brands including CISA®, Interflex®, LCN®, Schlage®, SimonsVoss® and Von Duprin®.
Basis of presentation: The Consolidated Financial Statements were prepared in accordance with generally accepted accounting principles in the United States of America ("GAAP") as defined by the Financial Accounting Standards Board ("FASB") within the FASB Accounting Standards Codification ("ASC").
NOTE 2 – SUMMARY OF SIGNIFICANT ACCOUNTING POLICIES
AThe following is a summary of significant accounting policies used in the preparation of the accompanying Consolidated Financial Statements follows:Statements:
Principles of Consolidation: The Consolidated Financial Statements include all majority-ownedcontrolled subsidiaries of the Company. A noncontrolling interest in a subsidiary is considered an ownership interest in a majority-ownedcontrolled subsidiary that is not attributable to the parent.Company. The Company includes noncontrolling interestinterests as a component of Total equity in the Consolidated Balance SheetSheets and the Net earnings attributable to noncontrolling interests are presented as an adjustment from Net earnings used to arrive at Net earnings attributable to Allegion plc in the Consolidated StatementStatements of Comprehensive Income.
Partially-owned equityEquity method affiliates generally represent 20-50% ownership interests in investments and where we demonstrateunconsolidated entities over which the Company demonstrates significant influence in investments, but dodoes not have a controlling financial interest. Partially-owned equity affiliates are accounted for under the equity method. The Company is also required to consolidate variable interest entities in which it bears a majority of the risk to the entities’entity’s potential losses or stands to gain from a majority of the entities’entity’s expected returns. Transactions between the Company and Ingersoll Rand and its affiliates are herein referred to as "related party" or "affiliated" transactions. The results of operations and cash flows of all discontinued operations have been separately reported as discontinued operations.
Use of Estimates: The preparation of financial statements in conformity with GAAP requires management to make estimates and assumptions that affect the reported amounts of assets and liabilities and the disclosures of contingent assets and liabilities at the date of the financial statements, as well as the reported amounts of revenues and expenses during the reporting period. Estimates are based on several factors including the facts and circumstances available at the time the estimates are made, historical experience, risk of loss, general economic conditions and trends and the assessment of the probable future outcome. Some of the more significant estimates include accounting for doubtful accounts, useful lives of property, plant and equipment and intangible assets, purchase price allocations of acquired businesses, valuation of assets and liabilities including goodwill and other intangible assets, product warranties, sales allowances, pensionassets and liabilities related to defined benefit plans, postretirement benefits other than pensions, taxes, lease related assets and liabilities, share-based compensation, environmental costs, product liability and other contingencies. Actual results could differ from those estimates. Estimates and assumptions are reviewed periodically, and the effects of changes, if any, are reflected in the Consolidated StatementStatements of Comprehensive Income in the period that they are determined.
Currency Translation: Assets and liabilities where the functional currency is not the U.S. dollar have been translated at year-end exchange rates, and income and expense accounts have been translated using average exchange rates throughout the year. Adjustments resulting from the process of translating an entity’sa subsidiary’s financial statements into the U.S. dollar have beenare recorded in the Equity section of the Consolidated Balance Sheet withinto Accumulated other comprehensive loss.
Foreign currency transaction gains and losses are a result of the effect of exchange rate changes on transactions denominated in currencies other than the functional currency. Transaction gains and losses are recognized in Other income (expense), net, in the Consolidated Statements of Comprehensive Income in the period they are incurred.
Cash and Cash Equivalents: Cash and cash equivalents include cash on hand, demand deposits and all highly liquid investments with original maturities at the time of purchase of three months or less.
Allowance for Doubtful Accounts: The Company provides for an allowance for doubtful accounts and notes receivable, which represents the best estimate of expected lifetime credit losses inherent in the Company’s accounts and notes receivable portfolios. The Company's estimates are influenced by a continuing credit evaluation of customers' financial condition, trade accounts and notes receivable aging and historical loss experience, as well as reasonable and supportable forecasts of future economic conditions. The Company has reserved $5.4 million and $6.2 million for doubtful accounts and notes receivable as of December 31, 2021 and 2020, respectively.
Inventories: Inventories are stated at the lower of cost and net realizable value using the first-in, first-out (FIFO) method.
Allowance for Doubtful Accounts: The Company has provided an allowance for doubtful accounts reserve, which represents the best estimate of probable loss inherent in the Company’s accounts receivable portfolio. Changes in the financial condition of customers or other unanticipated events, which may affect their ability to make payments, could result in charges for additional allowances exceeding the Company's estimates. The Company's estimates are influenced by the following considerations: a continuing credit evaluation of our customers’ financial condition; trade accounts receivable aging; and historical loss experience. The Company reserved $2.8 million and $2.7 million for doubtful accounts as of December 31, 2017 and 2016, respectively.
Property, Plant and Equipment: Property, plant and equipment are stated at cost, less accumulated depreciation. Assets placed in service are recorded at cost and depreciated using the straight-line method over the estimated useful life of the asset except for leasehold improvements, which are depreciated over the shorter of their economic useful life or their lease term. The range of useful lives used to depreciate property, plant and equipment is as follows:
|
| | | | |
| Buildings | 10 | to | 50 | years |
| Machinery and equipment | 2 | to | 12 | years |
| Software | 2 | to | 7 | years |
Repair and maintenance costs that do not extend the useful life of the asset are charged against earningsexpensed as incurred. Major replacements and significant improvements that increase asset values and extend useful lives are capitalized. The range of useful lives used to depreciate property, plant and equipment is as follows:
| | | | | | | | | | | | | | |
| Buildings | 10 | to | 50 | years |
| Machinery and equipment | 2 | to | 12 | years |
| Software | 2 | to | 7 | years |
The Company assesses the recoverability of the carrying value of its property, plant and equipment whenever events or changes in circumstances indicate that the carrying amount of the asset may not be fully recoverable. Recoverability is measured by a comparison of the carrying amount of an asset to the future net undiscounted cash flows expected to be generated by the asset. If the undiscounted cash flows are less than the carrying amount of the asset, an impairment loss is recognized for the amount by which the carrying value of the asset exceeds its fair value.
Investments: The Company periodically invests in debt or equity securities of start-up companies and/or development stage technology or other companies without acquiring a controlling interest. The Company applies the equity method of accounting when the Company has the ability to exercise significant influence over the operating and financial decision making of the investee. Investments in equity method affiliates totaled $11.0 million and $17.4 million as of December 31, 2021 and 2020, respectively. Equity investments that have readily determinable fair values in which the Company does not have significant influence are measured at fair value, with any unrealized holding gains and losses being recorded to earnings. Investments without readily determinable fair values are measured at cost minus impairment, if any, plus or minus changes resulting from observable price changes in orderly transactions for the identical or similar investment of the assets.same issuer and are qualitatively assessed for impairment indicators each reporting period. Investments in debt and equity securities not accounted for under the equity method of accounting totaled $35.8 million and $13.7 million as of December 31, 2021 and 2020, respectively. The Company's investments are recorded within Other noncurrent assets within the Consolidated Balance Sheets.
GoodwillLeases: The Company records a right-of-use ("ROU") asset and Intangible Assets: lease liability for substantially all leases for which it is a lessee. At inception of a contract, the Company considers all relevant facts and circumstances to assess whether or not the contract represents a lease by determining whether or not the contract conveys the right to control the use of an identified asset, either explicit or implicit, for a period of time in exchange for consideration. Judgment and estimation is also required in determining the lease classification and the amount of the ROU asset and corresponding lease liability for each lease, which includes determining the appropriate lease term and an applicable discount rate. The Company assesses the specific terms and conditions of each lease to determine the appropriate classification as either an operating or finance lease. Substantially all of the Company's leases for which the Company is a lessee are classified as operating leases. In determining the appropriate length of the lease term, both the minimum period over which lease payments are required plus any renewal options that are both within the Company's control to exercise and reasonably certain of being exercised as of lease commencement are considered. If at lease commencement date, a lease has a term of less than 12 months and does not include a purchase option that is reasonably certain to be exercised, the Company does not include the lease as part of its ROU asset or lease liability. If the Company enters into a large number of leases in the same month with the same terms and conditions, these are considered a group (portfolio). There are no material residual value guarantees provided by the Company nor any restrictions or covenants imposed by any leases to which the Company is a party.
As a lessee, the Company categorizes its leases into two general categories: real estate leases and equipment leases. The Company's real estate leases include leased production and assembly facilities, warehouses and distribution centers and office space. The Company's equipment leases include vehicles, material handling equipment, other machinery and equipment utilized in the Company's production and assembly facilities, warehouses and distribution centers, laptops and other IT equipment and other miscellaneous leased equipment.
The terms and conditions of real estate leases can vary significantly from lease to lease. The Company assesses the specific terms and conditions of each real estate lease to determine the amount of the lease payments and the length of the lease term, which includes the minimum period over which lease payments are required plus any renewal options that are both within the Company's control to exercise and reasonably certain of being exercised upon lease commencement. The Company assesses all relevant factors to determine if sufficient incentives exist as of lease commencement to conclude whether or not renewal is
reasonably certain. When available, the Company will utilize the rate implicit in the lease as the discount rate to determine the lease liability. However, as this rate is not available for most leases, the Company will use its incremental borrowing rate for debt instruments with terms approximating the weighted-average term of its real estate or equipment leases to discount the future lease payments over the lease term to present value. The Company does incur variable lease payments for certain of its real estate leases, such as reimbursements of property taxes, maintenance and other operational costs to the lessor. In general, these variable lease payments are not captured as part of the lease liability or ROU asset, but rather are expensed as incurred. Most of the Company's equipment leases are for terms ranging from two to five years, although terms and conditions can vary from lease to lease. The Company applies similar estimates and judgments to its equipment lease portfolio in determining the lease payments, lease term and incremental borrowing rate as it does to its real estate lease portfolio. The Company does not typically incur variable lease payments related to its equipment leases.
Goodwill: The Company records as goodwill the excess of the purchase price of an acquired business over the fair value of the net assets acquired.
In accordance with GAAP, goodwill and other indefinite-lived intangible assets are Once the final valuation has been performed for each acquisition, adjustments may be recorded. Goodwill is tested and reviewed annually for impairment during the fourth quarter or whenever there is a significant change in events or circumstances that indicate that the fair value of thea reporting unit or indefinite-lived intangible asset is more likely than not less than theits carrying amount of the reporting unit or indefinite-lived intangible asset.amount.
Recoverability of goodwill is measured at the reporting unit level. The carrying amount of thea reporting unit is compared to its estimated fair value. If the estimated fair value of a reporting unit exceeds its carrying amount, goodwill of the reporting unit is not impaired. To the extent that the carrying value of the reporting unit exceeds its estimated fair value, a goodwill impairment charge will be recognized for the amount by which the carrying value of the reporting unit exceeds its fair value, not to exceed the carrying amount of the reporting unit's goodwill. Estimated fair value of the Company's reporting units is based on two valuation techniques, a discounted cash flow model (income approach) and a market adjusted multiple of earnings and revenues (market approach), with each method being weighted in the calculation.
Intangible Assets: Indefinite-lived intangible assets other than Goodwill are not amortized, but similar to Goodwill, are also tested and reviewed annually for impairment during the fourth quarter or whenever there is a significant change in events or circumstances that indicate the asset is more likely than not less than its carrying amount. Recoverability of other intangible assets with indefinite useful lives (i.e. Trademarks)Trade names) is determined on a relief from royalty methodology, (income approach), which is based on the implied royalty paid, at an appropriate discount rate, to license the use of an asset rather than owning the asset. The present value of the after-tax cost savings (i.e. royalty relief) indicates the estimated fair value of the asset. Any excess of the carrying value over the estimated fair value is recognized as an impairment loss equal to that excess.
Intangible assets such as completed technologies, patents, customer-related intangible assets and other intangible assets with finite useful lives are amortized on a straight-line basis over their estimated economic lives. The weighted-average useful lives approximate the following:
|
| | | | | | | |
| Customer relationships | 2520 | years |
TrademarksTrade names (finite-lived) | 25 | years |
Completed technology/technologies/patents | 10 | years |
| Other | 257 | years |
Recoverability of intangible assets with finite useful lives is assessed in the same manner as property, plant and equipment, as described above.
Business Combinations: The fair value of consideration paid in a business combination is allocated to the tangible and identifiable intangible assets acquired, liabilities assumed and goodwill. Acquired intangible assets primarily include indefinite-lived trade names, customer relationships and completed technologies. The accounting for business combinations involves a considerable amount of judgment and estimation, including the fair value of acquired intangible assets involving projections of future revenues and cash flows that are either discounted at an estimated discount rate or measured at an estimated royalty rate; fair value of other acquired assets and assumed liabilities, including potential contingencies; and the useful lives of the acquired assets. As a result, in the case of significant acquisitions, the Company normally obtains the assistance of a third-party valuation specialist in estimating fair values of acquired tangible and intangible assets and assumed liabilities. An income approach or market approach (or both) is utilized in accordance with accepted valuation models for significant acquired assets to determine fair value.
Income Taxes: The calculation of the Company’s income taxes involves considerable judgment and the use of both estimates and allocations. Deferred tax assets and liabilities are determined based on temporary differences between financial reporting and tax bases of assets and liabilities, applying enacted tax rates expected to be in effect for the year in which the differences are expected to reverse. The Company recognizes future tax benefits, such as net operating losses and tax credits, to the extent that
that realizing these benefits is considered in its judgment to be more likely than not. The Company regularly reviews the recoverability of its deferred tax assets considering its historic profitability, projected future taxable income, timing of the reversals of existing temporary differences and the feasibility of its tax planning strategies. Where appropriate, the Company records a valuation allowance with respect to a future tax benefit.benefits.
Cash paid for income taxes, net of refunds, for the twelve months ended December 31, 20172021, 2020 and 20162019 was $86.7$89.1 million, $82.6 million and $10.4$103.0 million, respectively.
Product Warranties: The 2016 net cash income taxes paid includesCompany offers a refundstandard warranty with most product sales, and the value of $46.2 million received from the Canadian Tax Authorities.
On December 22, 2017, the President of the United States signed comprehensive tax legislation commonly referred to as the Tax Cuts and Jobs Act (the “Tax Reform Act”), whichsuch warranty is discussed in greater detail in Note 17. The Tax Reform Act includes a provision termed the global intangible low-taxed income ("GILTI"). The GILTI provisions will require the Company to include in its U.S. income tax return foreign subsidiary earnings in excess of an allowable return on the non-U.S. subsidiary's tangible assets. Although it is uncertain whether we will incur a GILTI liability, to the extent a GILTI tax is incurred, the Company has elected to account for GILTI taxincluded in the period in which it is incurred.
Product Warranties: contractual sales price. Standard product warranty accruals are recorded at the time of sale and are estimated based upon product warranty terms and historical experience. The Company regularly assesses the adequacy of its liabilities and will makemakes adjustments as necessary based on known or anticipated warranty claims, or as new information becomes available. Refer to Note 19 for further details of product warranties.
Revenue Recognition: Revenue isNet revenues are recognized and earned when allbased on the satisfaction of performance obligations under the following criteria are satisfied: (a) persuasive evidenceterms of a contract. A performance obligation is a promise in a contract to transfer control of a distinct product or to provide a service, or a bundle of products or services, to a customer. The Company has two principal revenue streams, tangible product sales arrangement exists; (b)and services. Approximately 99% of consolidated Net revenues involve contracts with a single performance obligation, the price is fixedtransfer of control of a product or determinable; (c) collectability is reasonably assured; and (d) delivery has occurred or service has been rendered. Delivery generallybundle of products to a customer. Transfer of control typically occurs when goods are shipped from the titleCompany's facilities or at other predetermined control transfer points (for instance, destination terms). The Company's remaining Net revenues involve services, including installation and consulting. Unlike the risks and rewardssingle performance obligation to ship a product or bundle of ownership have transferred to the customer. Both the persuasive evidence of a sales arrangement and fixed or determinable price criteria are deemed to be satisfied upon receipt of an executed and legally binding sales agreement or contract that clearly defines the terms and conditions of the transaction including the respective obligations of the parties. If the defined terms and conditions allow variability in all or a component of the price, revenue is not recognized until such time that the price becomes fixed or determinable. At the point of sale, the Company validates the existence of an enforceable claim that requires payment within a reasonable amount of time and assesses the collectability of that claim. If collectability is not deemed to be reasonably assured, thenproducts, revenue recognition related to services is deferred until such time that collectability becomes probable or cash is received. Delivery is not considered to have occurreddelayed until the customer has taken title and assumed the risks and rewards of ownership. Service and installation revenueservice based performance obligations are recognized when earned.satisfied. In some instances, customer acceptance provisions are included in sales arrangements to give the buyer the ability to ensure the delivered product or service meets the criteriaany established in the order.criteria. In these instances, revenue recognition is deferred until the performance obligations are satisfied, which could include acceptance terms specified in the arrangement arebeing fulfilled through customer acceptance or a demonstration that established criteria have been satisfied. If uncertainty exists about customer acceptance, revenue is not recognized until acceptance has occurred.
The Company offers variousNet revenues are measured as the amount of consideration expected to be received in exchange for transferring control of the products or providing the services and takes into account variable consideration, such as sales incentive programs to our customers, dealers,including discounts and distributors. Sales incentivevolume rebates. The existence of these programs dodoes not preclude revenue recognition but dodoes require an accrual for the Company’sCompany's best estimate of the variable consideration to be made based on expected activity. Examples of the sales incentives thatactivity, as these items are accruedreserved for as a contra receivablededuction to Net revenues based on the Company's historical rates of providing these incentives and annual forecasted sales deduction at the point of sale include, but are not limited to, discounts (i.e. net 30 type), coupons, and rebates where the customer does not have to provide any additional requirements to receive the discount.volumes. Sales returns and customer disputes involving a question of quantity or price are also accounted for as variable consideration, and therefore, as a reduction in revenueto Net revenues and as a contra receivable. At December 31, 20172021 and 2016,2020, the Company had a customer claim accrual (contra receivable) of $32.5$47.7 million and $29.0$48.6 million, respectively. All other incentives or incentive programs where the customer is required to reach a certain level of purchases, remain a customer for a certain period, provide a rebate form or is subject to additional requirements are also considered variable consideration and are accounted for as a reduction of revenue and establishment of a liability. At December 31, 20172021 and 2016,2020, the Company had a sales incentive accrual of $31.8$38.0 million and $29.6$35.0 million, respectively. Each of these accruals represents the Company’s best estimate it expectsof the most likely amount expected to pay related to previously sold unitsbe received from customers based on historical claim experience. These estimates are reviewed regularly for accuracy. Ifaccuracy, and if updated information or actual amounts are different from previous estimates, the revisions are included in the Company’s results for the period in which they become known. Historically,
As a practical expedient, the aggregate differences,Company recognizes incremental costs of obtaining a contract, if any, as an expense when incurred if the amortization period of the asset would have been one year or less. The Company also applies the practical expedients allowed under ASC 606, "Revenue from Contracts with Customers", to omit the disclosure of remaining performance obligations for contracts with an original expected duration of one year or less and for contracts where the Company has the right to invoice for performance completed to date. The transaction price is not adjusted for the effects of a significant financing component, as the time period between control transfer of goods and services is less than one year. Sales, value-added and other similar taxes collected by the Company’s estimatesCompany are excluded from Net revenues. The Company has also elected to account for shipping and actual amountshandling activities that occur after control of the related goods transfers as fulfillment activities instead of performance obligations. These activities are included in any year have not had a material impact onCost of goods sold in the Consolidated Financial Statements.Statements of Comprehensive Income. The Company’s payment terms are generally consistent with the industries in which its businesses operate.
Environmental Costs: The Company is subject to laws and regulations relating to protecting the environment. environment and is dedicated to an environmental program to reduce the utilization and generation of hazardous materials during the manufacturing process and to remediate identified environmental concerns. The Company is currently engaged in site investigations and remediation activities to address environmental cleanup from past operations at current and former production facilities. The Company regularly evaluates its remediation programs and considers alternative remediation methods that are in addition to, or in
replacement of, those currently utilized by the Company based upon enhanced technology and regulatory changes. Changes to the Company's remediation programs may result in increased expenses and increased environmental reserves.
The Company is sometimes a party to environmental lawsuits and claims and has, from time to time, received notices of potential violations of environmental laws and regulations from the U.S. Environmental Protection Agency and similar state authorities. It has also been identified as a potentially responsible party ("PRP") for cleanup costs associated with off-site waste disposal at federal Superfund and state remediation sites for past operations. For all such sites, there are other PRPs and, in most instances, the Company’s involvement is minimal. In estimating its liability, the Company has assumed it will not bear the entire cost of remediation of any site to the exclusion of other PRPs who may be jointly and severally liable. The ability of other PRPs to participate has been taken into account, based on the Company's understanding of the parties’ financial condition and probable contributions on a per site basis. Additional lawsuits and claims involving environmental matters are likely to arise from time to time in the future.
Environmental expenditures relating to current operations are expensed or capitalized as appropriate. Expenditures relating to existing conditions caused by past operations, which do not contribute to current or future revenues, are expensed. Liabilities for remediation costs are recorded when they are probable and can be reasonably estimated, generally no later than the completion of feasibility studies or the Company’s commitment to a plan of action. The assessment of this liability, which is calculated based on existing technology,
does not reflect any offset for possible recoveries from insurance companies and is not discounted. Refer to Note 19 for further details of environmental matters.
Research and Development Costs: The Company conducts research and development activities for the purpose of developing and improving new products and services. These expenditurescosts are expensed when incurred. For the years ended December 31, 2017, 20162021, 2020 and 2015, these expenditures2019, expenses related to research and development activities amounted to approximately $48.3$73.3 million,, $47.3 $54.4 million and $45.2$54.7 million,, respectively, and consistprimarily consisted of salaries, wages, benefits, buildingfacility costs and other overhead expenses.
Software Costs: The Company capitalizes certain qualified internal-use software costs during the application development stage and subsequently amortizes those costs over the software's useful life, which ranges from 2 to 7 years.
EmployeeDefined Benefit Plans:Plans: The Company provides a range of defined benefits, including pensions,pension, postretirement and postemployment benefits to eligible current and former employees. Determining the costcosts associated with such benefits is dependent on various actuarial assumptions, including discount rates, expected returnreturns on plan assets, compensation increases, employee mortality turnover rates, and healthcare cost trendturnover rates. Actuaries perform the required calculations to determine expense in accordance with GAAP. Actual results may differ from the actuarial assumptionsestimates and are generally accumulated intorecorded to Accumulated other comprehensive loss and amortized into Net earnings over future periods. The Company reviews its actuarial assumptions at each measurement date and makes modifications to the assumptions based on current rates and trends, ifas appropriate. Refer to Note 1112for further details on employeedefined benefit plans.
Share-Based Compensation: The Company records share-based compensation awards using a fair value method and recognizes compensation expense for an amount equal to the fair value of the share-based payment issued in its financial statements. The Company’s share-based compensation plans include programs for stock options, restricted stock units ("RSUs"), performance stock units ("PSUs") and deferred compensation. The fair value of each of the Company’s stock option and RSU awards is expensed on a straight-line basis over the required service period, which is generally the 3-year vesting period. However, for stock options and RSUs granted to retirement eligible employees, the Company recognizes expense for the fair value at the grant date. The Company's Performance Stock Program ("PSP") provides awards for key employees in the form of PSUs based on performance against pre-established objectives. The annual target award level is expressed as a number of the Company's ordinary shares. All PSUs are settled in the form of ordinary shares unless deferred.
Loss Contingencies: Liabilities are recorded for various contingencies arising in the normal course of business, including litigation and administrative proceedings, environmental matters, product liability,liabilities, product warranty,warranties, worker’s compensation and other claims. The Company has recorded reserves in the financial statements related to these matters, which are developed using inputs derived from actuarial estimates and historical and anticipated experience data depending on the nature of the reserve and, in certain instances, with consultation of legal counsel, internal and external consultants and engineers. Amounts recorded for identified contingent liabilities are estimates, which are reviewed periodically and adjusted to reflect additional information when it becomes available. Subject to the uncertainties inherent in estimating future costs for these types of liabilities, the Company believes its estimated reserves are reasonable and does not believe the final determination of the liabilities with respect to these matters would have a material effect on the financial condition, results of operations, liquidity or cash flows of the Company for any year. Refer
Financial Instruments: In the normal course of business, the Company uses various financial instruments, including derivative instruments, to Note 19manage the risks associated with interest and currency rate exposures. These financial instruments are not used for further details on loss contingencies.trading or speculative purposes. When a derivative contract is entered into, the Company designates the derivative instrument as a cash flow hedge of a forecasted transaction, a cash flow hedge of a recognized asset or liability or as an
Derivative Instruments: undesignated derivative. The Company periodically enters intoformally documents its hedge relationships, including identification of the derivative instruments and the hedged items, as well as its risk management objectives and strategies for undertaking the hedge transaction. This process includes linking derivative instruments that are designated as hedges to specific assets, liabilities or forecasted transactions.
The Company assesses at inception and at least quarterly thereafter, whether the derivatives used in cash flow hedging transactions are effective in offsetting the changes in the cash flows of the hedged item. To the extent the derivative is deemed to be an effective hedge, the fair market value changes of the instrument are recorded to Accumulated other comprehensive loss and other derivative transactionssubsequently reclassified to specificallyNet earnings when the hedged transaction affects earnings, while changes in the fair market value of derivatives not deemed to be an effective hedge exposure to various risks related to currency and interest rates.are recorded in Net earnings in the period of change. The Company recognizes all derivativesderivative instruments on the Consolidated Balance Sheets at their fair value as either assets or liabilities. For designated cash flow hedges, the effective portion of the changes inThe fair value of derivative instruments is determined through market-based valuations and may not be representative of the actual gains or losses that will be recorded when these instruments mature due to future fluctuations in the markets in which they are traded. If the hedging relationship ceases to be effective subsequent to inception, or it becomes probable that a forecasted transaction will no longer occur, the hedging relationship will be undesignated and any future gains or losses on the derivative contract isinstrument will be recorded in Other comprehensive income (loss), net of tax, and in Net earnings at the time earnings are affected by the hedged transaction. For other derivative transactions, the changes in the fair value of the derivative contract are immediately recognized in Net earnings. Refer to Note 10 for further details on derivative instruments.
Recent Accounting Pronouncements
Recently Adopted Accounting Pronouncements:
In July 2015,December 2019, the FASB issued ASU 2015-11, "Inventory (Topic 330): Simplifying the Measurement of Inventory." ASU 2015-11 changes the measurement principle for inventory from the lower of cost or market to the lower of cost and net realizable value. The standard defines net realizable value as estimated selling prices in the ordinary course of business less reasonably predictable costs of completion, disposal and transportation. The Company adopted the provisions of ASU 2015-11 on January 1, 2017. The adoption of ASU 2015-11 did not have a material impact on the consolidated financial statements.
In October 2016, the FASB issued ASU 2016-16,2019-12, "Income Taxes (Topic 740): Intra-Entity Transfers of Assets Other Than Inventory." This update addresses the income tax consequences of intra-entity transfers of assets other than inventory. Previously, GAAP prohibited the recognition of current and deferred income taxes for an intra-entity asset transfer until the asset has been sold to an outside party. In addition, interpretations of this guidance have developed in practice over the years for transfers of certain intangible and tangible assets. The amendments in the update will require recognition of current and deferred income taxes resulting from an intra-entity transfer of an asset other than inventory when the transfer occurs. The Company elected to early adopt on January 1, 2017. As a result, during the first quarter of 2017, the Company recognized a cumulative effect within retained earnings of $5.0 million with an offset to other current assets and other noncurrent assets.
In January 2017, the FASB issued ASU 2017-04, "Intangibles– Goodwill and Other (Topic 350): Simplifying the Accounting for Goodwill Impairment.Income Taxes." The amendednew guidance simplifieswas intended to simplify the accounting for goodwill impairment for all entitiesincome taxes by eliminating the requirement to perform a hypothetical purchase price allocation. Aremoving certain exceptions and by updating accounting requirements around franchise taxes, goodwill impairment charge will now be recognized for
tax purposes, the amount by which the carrying valueallocation of a reporting unit exceeds its fair value, not to exceed the carrying amount of goodwill. Thecurrent and deferred tax expense among legal entities, among other minor changes. This ASU will bebecame effective for fiscal years beginning after December 15, 2019. Early adoption is permitted for any impairment tests after January 1, 2017. The Company elected to early adopt on October 1, 2017; however, this new standard did not impact our annual impairment test performed on goodwill as of October 1, 2017.
Recently Issued Accounting Pronouncements:
In May 2014, the FASB issued ASU 2014-09, "Revenue from Contracts with Customers" (ASC 606). ASC 606 is a single, comprehensive revenue recognition model for all contracts with customers. The model is based on changes in contract assets (rights to receive consideration) and liabilities (obligations to provide a good or perform a service). Revenue is recognized based on the satisfaction of performance obligations, which occurs when control of a good or service transfers to a customer. ASC 606
contains expanded disclosure requirements relating to the nature, amount, timing, and uncertainty of revenue and cash flows arising from contracts with customers. Entities may use a full retrospective approach or report the cumulative effect as of the date of adoption ("modified retrospective method"). The FASB has also issued the following standards which clarify ASU 2014-09: ASU 2017-14, Revenue Recognition, Revenue from Contracts with Customers: Amendments to SEC Paragraphs Pursuant to Staff Accounting Bulletin No. 116 and SEC Release No. 33-10403, ASU 2017-13, Revenue Recognition, Revenue from Contracts with Customers: Amendments to SEC Paragraphs Pursuant to the Staff Announcement at the July 20, 2017 EITF Meeting and Rescission of Prior SEC Staff Announcements and Observer Comments, ASU 2016-20, Revenue from Contracts with Customers: Technical Corrections and Improvements, ASU 2016-12, Revenue from Contracts with Customers: Narrow-Scope Improvements and Practical Expedients and ASU 2016-10, Revenue from Contracts with Customers: Identifying Performance Obligations and Licensing. The Company adopted each of these standards on January 1, 2018 on a modified retrospective basis. The Company has completed an assessment of the new standard’s impact and determined the new standards will not have a material impact on the Company's consolidated statements of comprehensive income, balance sheets or statements of cash flows. The Company will expand the consolidated financial statement disclosures in order to comply with ASU 2014-09 starting in our first quarter 10-Q of 2018. The expanded disclosure will present in a tabular format the split by business segment between 1) product and service revenue, and 2) products transferred at a point in time and services transferred over time.
In February 2016, the FASB issued ASU 2016-02, "Leases (Topic 842)." ASU 2016-02 requires the identification of arrangements that should be accounted for as leases by lessees. In general, for lease arrangements exceeding a twelve month term, these arrangements will be recognized as assets and liabilities on the balance sheet of the lessee. Under ASU 2016-02, a right-of-use asset and lease obligation will be recorded for all leases, whether operating or financing, while the income statement will reflect lease expense for operating leases and amortization/interest expense for financing leases. The ASU is effective for annual periods beginning after December 15, 2018,2020, and interim periods within those annual periods. Early adoption is permitted. ASU 2016-02 is required to be applied with a modified retrospective approach to each prior reporting period presented with various optional practical expedients. The Company is continuing to assess what impact ASU 2016-02 will have on the consolidated financial statements; however,Accordingly, the Company anticipates that thisadopted ASU 2019-12 on January 1, 2021, and the adoption will result indid not have a significant gross-up of assets and liabilities on its consolidated balance sheets and will require changesmaterial impact to its systems and processes.the Consolidated Financial Statements.
In June 2016,January 2020, the FASB issued ASU 2016-13, "Financial Instruments-Credit Losses2020-01, "Investments—Equity Securities (Topic 326)321), Investments—Equity Method and Joint Ventures (Topic 323), and Derivatives and Hedging (Topic 815): Measurement of Credit Losses on Financial Instruments.Clarifying the Interactions between Topic 321, Topic 323, and Topic 815." The new guidance introduces an approach based on expected losses to estimate credit losses on certain typesamendments in ASU 2020-01 clarify the interaction of financial instruments. Thethe accounting for equity securities under Topic 321 and investments accounted for under the equity method of accounting. This ASU will bebecame effective for fiscal years beginning after December 15, 2019,2020, and interim periods within those annual periods. Accordingly, the Company adopted ASU 2020-01 on January 1, 2021, and the adoption did not have a material impact to the Consolidated Financial Statements.
Recently Issued Accounting Pronouncements:
In October 2021, the FASB issued ASU No. 2021-08, "Business Combinations (Topic 805): Accounting for Contract Assets and Contract Liabilities from Contracts with Customers." This ASU requires contract assets and contract liabilities (e.g. deferred revenue) acquired in a business combination to be recognized and measured by the acquirer on the acquisition date in accordance with ASC 606, "Revenue from Contracts with Customers". Generally, this new guidance will result in the acquirer recognizing contract assets and contract liabilities at the same amounts recorded by the acquiree. Historically, such amounts were recognized by the acquirer at fair value in purchase accounting. The guidance is effective for fiscal years beginning after December 15, 2022, including interim periods within those fiscal years. Early adoption is permitted. The Company is assessing what impact ASU 2016-13 willpermitted, including in interim periods, for any financial statements that have on the consolidated financial statements.
In August 2016, the FASB issued ASU 2016-15, "Statement of Cash Flows (Topic 230): Clarification of Certain Cash Receipts and Cash Payments." ASU 2016-15 eliminates the diversity in practice related to the classification of certain cash receipts and payments in the statement of cash flows, by adding or clarifying guidance on eight specific cash flow issues. The ASU will be effective for annual and interim reporting periods beginning after December 15, 2017, and as such, the Company adopted ASU 2016-15 on January 1, 2018. The amendments in this update will be applied retrospectively to all periods presented, beginning in 2018, unless deemed impracticable, in which case, prospective application is permitted. The Company does not expect the adoption of this standard to have a material impact on the consolidated financial statements.
In January 2017, the FASB issued ASU No. 2017-01, "Business Combinations (Topic 805): Clarifying the Definition of a Business." This update provides guidance to assist companies in evaluating whether transactions should be accounted for as acquisitions (or disposals) of assets or businesses. The update provides a more robust framework to use in determining when a set of transferred assets and activities is a business. This ASU is effective for annual and interim reporting periods beginning after December 15, 2017, and requires prospective adoption. The Company adopted ASU 2017-01 on January 1, 2018. The Company does not expect the adoption of this standard to have a material impact on the consolidated financial statements.
In March 2017, the FASB issued ASU 2017-07, "Compensation—Retirement Benefits (Topic 715): Improving the Presentation of Net Periodic Pension Cost and Net Periodic Postretirement Benefit Cost." ASU 2017-07 requires that an employer report the service cost component in the same line item or items as other compensation costs arising from services rendered by the pertinent employees during the period. The other components of net benefit cost are required to be presented in the statement of comprehensive income separately from the service cost component and outside a subtotal of operating income. ASU 2017-07 also allows only the service cost component to be eligible for capitalization when applicable (for example, as a cost of internally manufactured inventory or a self-constructed asset). The ASU is effective for annual periods beginning after December 15, 2017, and as such, the Company adopted ASU 2017-07 on January 1, 2018. The ASU will be applied retrospectively for the presentation of the service cost component and the other components of net periodic pension cost and net periodic postretirement benefit cost in the consolidated statement of comprehensive income and prospectively, on and after the effective date, for the capitalization of the service cost component of net periodic pension cost and net periodic postretirement benefit in assets. The amendments allow a practical expedient that permits an employer to use the amounts disclosed in its pension and other postretirement benefit plan note for the prior comparative periods as the estimation basis for applying the retrospective presentation requirements. The Company intends to apply these practical expedients for prior period presentation. The Company does not believe the adoption of the new standard will have a material impact on the Company's consolidated financial statements.
In August 2017, the FASB issued ASU 2017-12, "Derivatives and Hedging (Topic 815): Targeted Improvements to Accounting for Hedging Activities." ASU 2017-12 addresses previous limitations on how an entity can designate the hedged risk in certain cash flow and fair value hedging relationships by expanding and refining hedge accounting for both nonfinancial and financial risk components and aligning the recognition and presentation of the effects of the hedging instrument and the hedged item in the financial statements. The ASU is effective for annual periods beginning after December 15, 2018, with early adoption permitted.yet been issued. The Company elected to early adopt the provisions of ASU 2017-122021-08 on January 1, 2018. The amendments in2022, and will apply to all business combinations consummated subsequent to this update will be applied to hedging relationships existing on the datedate.
NOTE 3 – INVENTORIES
At December 31, the major classes of inventory were as follows:
|
| | | | | | | | |
| In millions | | 2017 | | 2016 |
| Raw materials | | $ | 66.6 |
| | $ | 56.7 |
|
| Work-in-process | | 29.8 |
| | 23.6 |
|
| Finished goods | | 143.4 |
| | 140.3 |
|
| Total | | $ | 239.8 |
| | $ | 220.6 |
|
Inventories are stated at the lower of cost and net realizable value using the first-in, first-out (FIFO) method.
At December 31, the major classes of Inventories were as follows:
| | | | | | | | | | | | | | |
| In millions | | 2021 | | 2020 |
| Raw materials | | $ | 144.4 | | | $ | 114.0 | |
| Work-in-process | | 42.2 | | | 42.3 | |
| Finished goods | | 193.8 | | | 126.8 | |
| Total | | $ | 380.4 | | | $ | 283.1 | |
NOTE 4 – PROPERTY, PLANT AND EQUIPMENT
At December 31, the major classes of property, plant and equipment were as follows:
| | | | | | | | | | | | | | |
| In millions | | 2021 | | 2020 |
| Land | | $ | 16.5 | | | $ | 17.2 | |
| Buildings | | 177.0 | | | 179.8 | |
| Machinery and equipment | | 451.1 | | | 455.2 | |
| Software | | 152.6 | | | 157.7 | |
| Construction in progress | | 30.5 | | | 20.2 | |
| Total property, plant and equipment | | 827.7 | | | 830.1 | |
| Accumulated depreciation | | (544.0) | | | (535.2) | |
| Property, plant and equipment, net | | $ | 283.7 | | | $ | 294.9 | |
|
| | | | | | | | |
| In millions | | 2017 | | 2016 |
| Land | | $ | 16.0 |
| | $ | 14.5 |
|
| Buildings | | 142.2 |
| | 127.6 |
|
| Machinery and equipment | | 383.9 |
| | 353.6 |
|
| Software | | 141.4 |
| | 126.5 |
|
| Construction in progress | | 24.4 |
| | 18.2 |
|
| | | 707.9 |
| | 640.4 |
|
| Accumulated depreciation | | (455.7 | ) | | (413.8 | ) |
| Total | | $ | 252.2 |
| | $ | 226.6 |
|
Depreciation expense for the years ended December 31, 2017, 20162021, 2020 and 20152019, was $40.0$45.2 million,, $40.9 $46.5 million and $36.4$47.1 million,, which includes amounts for software amortization of $14.3$11.5 million,, $16.6 $13.5 million and $14.4$14.5 million,. respectively.
NOTE 5 – GOODWILL
The Company records as goodwill the excess of the purchase price over the fair value of the net assets acquired. Once the final valuation has been performed for each acquisition, adjustments may be recorded. The changes in the carrying amount of Goodwill arewere as follows:
| | | | | | | | | | | | | | | | | |
| In millions | Allegion Americas | | Allegion International | | Total |
| December 31, 2019 (gross) | $ | 485.0 | | | $ | 873.8 | | | $ | 1,358.8 | |
| Accumulated impairment | — | | | (485.5) | | | (485.5) | |
| December 31, 2019 (net) | 485.0 | | | 388.3 | | | 873.3 | |
| Acquisitions | 16.1 | | | — | | | 16.1 | |
| Impairment charge | — | | | (88.1) | | | (88.1) | |
| Currency translation | — | | | 17.7 | | | 17.7 | |
| December 31, 2020 (net) | 501.1 | | | 317.9 | | | 819.0 | |
| Acquisitions and adjustments | 0.1 | | | 4.6 | | | 4.7 | |
| | | | | |
| Currency translation | — | | | (19.9) | | | (19.9) | |
| December 31, 2021 (net) | $ | 501.2 | | | $ | 302.6 | | | $ | 803.8 | |
|
| | | | | | | | | | | | | | | | |
| In millions | | Americas | | EMEIA | | Asia Pacific | | Total |
| December 31, 2015 (gross) | | $ | 372.8 |
| | $ | 733.4 |
| | $ | 93.4 |
| | $ | 1,199.6 |
|
| Accumulated impairment * | | — |
| | (478.6 | ) | | (6.9 | ) | | (485.5 | ) |
| December 31, 2015 (net) | | 372.8 |
| | 254.8 |
| | 86.5 |
| | 714.1 |
|
| Acquisitions | | — |
| | 12.5 |
| | 3.3 |
| | 15.8 |
|
| Currency translation | | 0.1 |
| | (9.8 | ) | | (3.4 | ) | | (13.1 | ) |
| December 31, 2016 (net) | | 372.9 |
| | 257.5 |
| | 86.4 |
| | 716.8 |
|
| Acquisitions and settlements | | 2.3 |
| | (1.6 | ) | | 1.3 |
| | 2.0 |
|
| Currency translation | | — |
| | 35.3 |
| | 7.1 |
| | 42.4 |
|
| December 31, 2017 (net) | | $ | 375.2 |
| | $ | 291.2 |
| | $ | 94.8 |
| | $ | 761.2 |
|
* Accumulated impairment consists of charges of $137.6 million (EMEIA), $341.0 million (EMEIA) and $6.9 million (Asia Pacific).
As discussed in Note 8 - Divestitures, the Company sold a majority stake in its systems integration business in China within the Asia Pacific segment in the fourth quarter of 2015. In conjunction with this divestiture, the Company determined that the goodwill assigned to this business was impaired. As a result approximately $21.0 million of the $78.1 million pre-tax charge relatedglobal economic disruption and uncertainty due to the divestitureCOVID-19 pandemic arising during the first quarter of 2020, the Company concluded a triggering event had occurred as of March 31, 2020, and performed interim impairment tests on the goodwill balances, at that time, of its previous EMEA and Asia Pacific reporting units (which were combined to form the new Allegion International segment effective January 1, 2021). The results of the interim impairment testing indicated that the estimated fair value of the former Asia Pacific reporting unit was less than its carrying value. Consequently, a goodwill impairment charge of $88.1 million was recorded, which is included in 2015 related toImpairment of goodwill and intangible assets in the write-offConsolidated Statement of goodwill.Comprehensive Income for the year ended December 31, 2020.
NOTE 6 – INTANGIBLE ASSETS
The following table sets forth the gross amount and related accumulated amortization of the Company’s intangible assets at December 31:
| | | | | | | | | | | | | | | | | | | | | | | | | | | | | | | | | | | | | | |
| | 2021 | | 2020 |
| In millions | | Gross carrying amount | | Accumulated amortization | | Net carrying amount | | Gross carrying amount | | Accumulated amortization | | Net carrying amount |
| Completed technologies/patents | | $ | 57.9 | | | $ | (28.8) | | | $ | 29.1 | | | $ | 59.9 | | | $ | (25.1) | | | $ | 34.8 | |
| Customer relationships | | 395.9 | | | (141.6) | | | 254.3 | | | 415.5 | | | (130.2) | | | 285.3 | |
| Trade names (finite-lived) | | 84.0 | | | (56.9) | | | 27.1 | | | 90.2 | | | (57.4) | | | 32.8 | |
| Other | | 45.8 | | | (22.7) | | | 23.1 | | | 27.0 | | | (11.1) | | | 15.9 | |
| Total finite-lived intangible assets | | 583.6 | | | $ | (250.0) | | | 333.6 | | | 592.6 | | | $ | (223.8) | | | 368.8 | |
| Trade names (indefinite-lived) | | 113.9 | | | | | 113.9 | | | 118.3 | | | | | 118.3 | |
| Total | | $ | 697.5 | | | | | $ | 447.5 | | | $ | 710.9 | | | | | $ | 487.1 | |
|
| | | | | | | | | | | | | | | | | | | | | | | | |
| | | 2017 | | 2016 |
| In millions | | Gross carrying amount | | Accumulated amortization | | Net carrying amount | | Gross carrying amount | | Accumulated amortization | | Net carrying amount |
| Completed technologies/patents | | $ | 32.6 |
| | $ | (10.0 | ) | | $ | 22.6 |
| | $ | 48.0 |
| | $ | (25.3 | ) | | $ | 22.7 |
|
| Customer relationships | | 324.5 |
| | (74.1 | ) | | 250.4 |
| | 278.9 |
| | (51.6 | ) | | 227.3 |
|
| Trademarks (finite-lived) | | 89.0 |
| | (46.1 | ) | | 42.9 |
| | 78.5 |
| | (37.3 | ) | | 41.2 |
|
| Other | | 7.9 |
| | (4.9 | ) | | 3.0 |
| | 11.0 |
| | (9.4 | ) | | 1.6 |
|
| Total finite-lived intangible assets | | 454.0 |
| | $ | (135.1 | ) | | 318.9 |
| | 416.4 |
| | $ | (123.6 | ) | | 292.8 |
|
| Trademarks (indefinite-lived) | | 75.4 |
| | | | 75.4 |
| | 64.6 |
| | | | 64.6 |
|
| Total | | $ | 529.4 |
| | | | $ | 394.3 |
| | $ | 481.0 |
| | | | $ | 357.4 |
|
The Company amortizes intangible assets with finite useful lives on a straight-line basis over their estimated economic lives in accordance with GAAP. Indefinite-lived intangible assets are not subject to amortization, but instead, are tested for impairment at least annually (more frequently if certain indicators are present).
Intangible asset amortization expense for 2017, 2016the years ended December 31, 2021, 2020 and 20152019, was $22.1$34.0 million,, $20.5 $31.5 million and $11.9$31.2 million,, respectively. Future estimated amortization expense on existing intangible assets in each of the next five years amounts to approximately $22.7 million for 2018, $21.8$29.0 million for 2019, $21.82022, $28.8 million for 2020, $21.72023, $28.8 million for 2021, and $21.72024, $27.9 million for 2022.2025 and $25.7 million for 2026.
In accordance with the Company’s indefinite-livedNo intangible asset impairment testing policy outlined in Note 2, the Company performed its annual impairment test in the fourth quarter of each year. In each year, the Company determined the fair value of all indefinite-lived intangible assets exceeded their respective carrying values. Therefore, no impairment charges were recorded for the year ended December 31, 2021. However, as a result of the global economic disruption and uncertainty due to the COVID-19 pandemic arising during 2017, 2016 or 2015.the first quarter of 2020, the Company concluded a triggering event had occurred as of March 31, 2020, and performed interim impairment testing on certain indefinite-lived trade names. Based on these tests, it was determined that three of the Company's indefinite-lived trade names were impaired, and impairment charges of $8.2 million were recorded. Additional intangible asset impairment charges of $5.4 million were recorded in 2020, relating to supply chain disruptions, which reduced a brand's expected future cash flows, and declines in volumes and pricing pressure for a separate subsidiary. During the 2019 annual impairment testing, it was determined that two of the Company's indefinite-lived trade names were impaired, resulting in impairment charges totaling $5.9 million. Intangible asset impairment charges are included in Impairment of goodwill and intangible assets in the Consolidated Statements of Comprehensive Income.
NOTE 7 - ACQUISITIONS
2017
In January 2017,July 2021, the Company acquired, Republic Doors & Frames, LLCthrough its subsidiaries, certain assets of Astrum Benelux B.V. ("Republic"Astum Benelux") and 100% of the equity of WorkforceIT B.V. in the Netherlands ("WorkforeceIT"), both of which were previously held under common control and offer workforce management technology products and solutions in the Benelux region of Europe. Neither the assets from Astrum Benelux nor the acquisition of WorkforceIT had a material impact on the Consolidated Financial Statements. Both Workforce IT and the assets acquired from Astrum Benelux were accounted for as a business combination and have been integrated into the Allegion International segment.
In December 2020, the Company acquired the remaining interest of Yonomi, Inc. ("Yonomi"), a U.S. based smart home integration platform provider and innovation leader in IoT Cloud platforms, through one of its subsidiaries. Prior to acquisition, the Company held a noncontrolling interest in Yonomi that was considered an equity method investment. This acquisition was accounted for as a business combination and did not have a material impact on the Consolidated Financial Statements. Yonomi has been integrated into the Allegion Americas segment.
During the yearyears ended December 31, 20172021, 2020 and 2019, the Company incurred $4.7$4.4 million, $2.3 million and $2.0 million, respectively, of acquisition and integration related costs,expenses, which are included in Selling and administrative expenses in the Consolidated Statement of Comprehensive Income.
2016
NOTE 8 - DIVESTITURES
In June 2016,
As previously disclosed, during the Company acquired 100%fourth quarter of Trelock GmbH,2020, the net assets of the Company's Qatar Metal Industries ("QMI") business, met the criteria to be classified as held for sale, and accordingly, were written down to fair value, resulting in a portable safety and security provider, and certain affiliated companies. Acquisition related costs were not material to the 2016 Consolidated StatementLoss on assets held for sale in 2020 of Comprehensive Income.
2015
In 2015,$37.9 million. On February 28, 2021, the Company completed one investment and five acquisitions:
|
| | |
Business | | Date |
iDevices (investment) | | February 2015 |
Zero International Inc. ("Zero") | | April 2015 |
Brio (Division of RMD Industries Pty Ltd) ("Brio") | | May 2015 |
Milre Systek Co., Ltd ("Milre") | | July 2015 |
SimonsVoss Technologies GmbH ("SimonsVoss") | | September 2015 |
AXA Stenman Holding ("AXA") | | September 2015 |
iDevices isits divestiture of QMI. The completion of the divestiture did not have a brand and development partner in the Internet of Things industry. The investment was accounted for using the equity method. As discussed further in Note 8, the Company's equity investment in iDevices LLC was acquired by a third party on April 5, 2017.
Zero manufactures door and window products for commercial spaces and products include sealing systems, such as sound control, fire and smoke protection, threshold applications, lites, door louvers, intumescent products, photo-luminescent and flood barrier for doors.
Brio is a designer and manufacturer of sliding and folding door hardware for commercial and residential spaces in Australia, New Zealand, the United Kingdom and the United States.
Milre is a leading security solutions manufacturer in South Korea, focused on producing high-quality and innovative electronic door locks.
SimonsVoss was acquired for approximately $230.0 million. SimonsVoss, headquartered in Munich, Germany, is an electronic lock company in the European electronic market segment.
AXA was acquired for approximately $208.0 million. AXA is a European residential and portable security provider headquartered in Veenendaal, the Netherlands, with production facilities in the Netherlands, France and Poland. AXA manufactures and sells a branded portfolio of portable locks and lights as well as a wide variety of window and door hardware. The products are sold throughout Europe to bicycle manufacturers, retail distributors and property builders.
Total consideration paid for the acquisitions in 2015 was $511.3 million (net of cash acquired). The acquisitions in 2015 contributed revenues of $74.5 million and earnings before tax of $2.2 millionmaterial impact to the Company from the acquisition dates to December 31, 2015.
DuringConsolidated Financial Statements for the year ended December 31, 20152021.
In 2019, the Company incurred $17.9 million of acquisition related costs. These expenses are includedclosed its production facility in both Cost of goodsTurkey and sold and Selling and administrative expenses in the Consolidated Statement of Comprehensive Income.
NOTE 8 - DIVESTITURES
As previously disclosed, the Company sold its majority ownership in its Venezuelan operation to Venezuelan investors. As a resultcertain of the production assets thereof. Total proceeds from the sale in the third quarter of 2015,were approximately $4.1 million, and the Company recorded a non-cash chargeloss on divestiture of $26.1$24.2 million which($25.5 million, net of tax), primarily represents cumulativedriven by the reclassification of $25.0 million of accumulated foreign currency translation adjustments that were previously deferredto earnings upon sale. The Company also sold its interests in equity and were reclassifiedits Colombia operations in 2019 for a nominal amount, recording a net loss on divestiture of $5.9 million, of which $1.2 million relates to a lossthe reclassification of accumulated foreign currency translation adjustments to earnings upon sale. These losses are included within Loss on divestitures in the Consolidated StatementStatements of Comprehensive Income upon sale.
As previously disclosed,for the Company sold a majority stake of Bocom Wincent Technologies Co., Ltd. ("Systems Integration") in the fourth quarter of 2015, retaining 15% of the shares. Under the terms of the transaction, the Company was to receive consideration of up to $75.0 million based on the future cash collection performance of Systems Integration and additional payments of approximately $8.3 million related to working capital transferred with the sale. During the twelve monthsyear ended December 31, 2015, and as a result of the sale, the Company recorded a non-cash, pre-tax charge of $78.1 million ($82.4 million after tax charges) to write the carrying value of Systems Integration’s assets and liabilities down to their estimated fair value less costs to complete the transaction. The charge was recorded as a Loss on divestitures within the Consolidated Statement of Comprehensive Income.2019.
During the third quarter of 2016 the receivable was considered impaired, as it was determined that certain unfavorable events occurred related to the Systems Integration business requiring an impairment of the original consideration and working capital transfer amounts that were recorded at the time of the sale. A charge of $81.4 million (net of tax) was recorded, reducing the carrying value of the receivable to a fair value estimated by discounting the expected future cash flows. The assumptions used in this estimate are considered unobservable inputs. Fair value measurements that utilize significant unobservable inputs are categorized as Level 3 measurements under the accounting guidance. The total charge recorded as a Loss on divestitures within the Consolidated Statement of Comprehensive Income was $84.4 million for the twelve months ended December 31, 2016.
The Company currently estimates the fair value of the consideration to be $2.6 million as of December 31, 2017, which is classified within Other noncurrent assets within the Consolidated Balance Sheet. The Company does not expect to incur any material charges in future periods related to the Systems Integration business.
In April 2017, iDevices LLC, including the Company's equity investment, was acquired by a third party. The Company recorded a cumulative gain of $5.4 million in 2017 related to this divestiture within Other income, net.
NOTE 9 – DEBT AND CREDIT FACILITIES
At December 31, long-term debt and other borrowings consisted of the following:
| | | In millions | 2017 | | 2016 | In millions | 2021 | | 2020 |
| Term Loan A Facility | $ | — |
| | $ | 879.8 |
| |
| 2021 Term Facility | | 2021 Term Facility | $ | 250.0 | | | $ | — | |
| Term Facility | 691.3 |
| | — |
| Term Facility | — | | | 238.8 | |
| 2021 Revolving Facility | | 2021 Revolving Facility | — | | | — | |
| Revolving Facility | — |
| | — |
| Revolving Facility | — | | | — | |
| 5.750% Senior Notes due 2021 | — |
| | 300.0 |
| |
| 5.875% Senior Notes due 2023 | — |
| | 300.0 |
| |
| 3.200% Senior Notes due 2024 | 400.0 |
| | — |
| 3.200% Senior Notes due 2024 | 400.0 | | | 400.0 | |
| 3.550% Senior Notes due 2027 | 400.0 |
| | — |
| 3.550% Senior Notes due 2027 | 400.0 | | | 400.0 | |
| 3.500% Senior Notes due 2029 | | 3.500% Senior Notes due 2029 | 400.0 | | | 400.0 | |
| Other debt | 1.0 |
| | 2.3 |
| Other debt | 0.3 | | | 0.6 | |
| Total borrowings outstanding | 1,492.3 |
| | 1,482.1 |
| Total borrowings outstanding | 1,450.3 | | | 1,439.4 | |
| Less discounts and debt issuance costs, net | (15.0 | ) | | (18.3 | ) | Less discounts and debt issuance costs, net | (8.2) | | | (9.8) | |
| Total debt | 1,477.3 |
| | 1,463.8 |
| Total debt | 1,442.1 | | | 1,429.6 | |
| Less current portion of long term debt | 35.0 |
| | 48.2 |
| |
| Less current portion of long-term debt | | Less current portion of long-term debt | 12.6 | | | 0.2 | |
| Total long-term debt | $ | 1,442.3 |
| | $ | 1,415.6 |
| Total long-term debt | $ | 1,429.5 | | | $ | 1,429.4 | |
Unsecured Credit Facilities
As of December 31, 2017,On November 18, 2021, the Company has anentered into a new unsecured credit agreement (the “2021 Credit Agreement”), which refinanced in full the Company's previously outstanding unsecured Credit Facilities. The 2021 Credit Agreement in place that provides for up to $1,200.0 million in unsecured financing, consistingconsists of a $700.0$250.0 million term loan facility (the “Term“2021 Term Facility”) and a $500.0 million revolving credit
facility (the “Revolving“2021 Revolving Facility” and, together with the 2021 Term Facility, the “Credit“2021 Credit Facilities”). The 2021 Credit Facilities mature on September 12, 2022November 18, 2026, and are unconditionally guaranteed jointly and severally on an unsecured basis by the Company and Allegion US Holding Company Inc. ("Allegion US Hold Co"), the Company's wholly-owned subsidiary. All obligations under the previously outstanding Credit Agreement were satisfied, all commitments thereunder were terminated, and all guarantees that had been granted in connection therewith were released.
The full amount of the 2021 Term Facility amortizeswas drawn at closing, with the initial proceeds of $250.0 million primarily used to repay in full the outstanding borrowings under the previously outstanding Term Facility. The 2021 Term Facility will amortize in quarterly installments at the following rates: 1.25% per quarter starting DecemberMarch 31, 20172022 through DecemberMarch 31, 2020,2025, 2.5% per quarter from March, 31, 2021 throughstarting June 30, 2022,2025 through September 30, 2026, with the balance due on September 12, 2022.November 18, 2026. The Company may voluntarily prepay outstanding amounts under the 2021 Term Facility at any time without premium or penalty, subject to customary breakage costs. Amounts borrowed under the 2021 Term Facility that are repaid may not be reborrowed.
The 2021 Revolving Facility provides aggregate commitments of up to $500.0 million, which includes up to $100.0 million for the issuance of letters of credit. At December 31, 2017,2021, there were no borrowings outstanding on the 2021 Revolving Facility and the Company had $17.4$8.7 million of letters of credit outstanding. Commitments under the 2021 Revolving Facility may be reduced at any time without premium or penalty, and amounts repaid may be reborrowed. The Company pays certain fees with respect to the 2021 Revolving Facility, including an unused commitment fee on the undrawn portion of the 2021 Revolving Facility of between 0.125%0.090% and 0.200% per year, depending on the Company's credit rating, as well as certain other fees.
Outstanding borrowings under the 2021 Credit Facilities accrue interest at the option of the Company of (i) a LIBORBloomberg Short-Term Bank Yield Index (“BSBY”) rate plus the applicable margin or (ii) a base rate plus the applicable margin. The applicable margin ranges from 1.125%0.875% to 1.500%1.375% depending on the Company's credit ratings. At December 31, 2017,2021, the outstanding borrowings under the 2021 Term Facility accrue interest at LIBORBSBY plus a margin of 1.250%. To manage the Company's exposure to fluctuations1.125%, resulting in LIBOR rates, the Company hasan interest rate swaps to fix the interest rate for $250.0 millionof
1.271%. The 2021 Credit Facilities also contain negative and affirmative covenants and events of default that, among other things, limit or restrict the Company'sCompany’s ability to enter into certain transactions. In addition, the 2021 Credit Facilities require the Company to comply with a maximum leverage ratio and a minimum interest expense coverage ratio, as defined within the agreement. As of December 31, 2017,2021, the Company was in compliance with all covenants.
Senior Notes
As of December 31, 2017,2021, Allegion US Hold Co has $400.0 million outstanding of its 3.200% Senior Notes due 2024 (the “3.200% Senior Notes”) and $400.0 million outstanding of its 3.550% Senior Notes due 2027 (the “3.550% Senior Notes” and, together with the), while Allegion plc has $400.0 million outstanding of its 3.500% Senior Notes due 2029 (the “3.500% Senior Notes”). The 3.200% Senior Notes, 3.550% Senior Notes and 3.500% Senior Notes (collectively, the “Notes”"Senior Notes"), both of which were issued on October 2, 2017. The Notes all require semi-annual interest payments on April 1 and October 1 of each year, and will mature on October 1, 2024, October 1, 2027, and October 1, 2027,2029, respectively.
The 3.200% Senior Notes and the 3.550% Senior Notes are senior unsecured obligations of Allegion US Hold Co and rank equally with all of Allegion US Hold Co’s existing and future senior unsecured and unsubordinated indebtedness. The guarantee of the 3.200% Senior Notes and the 3.550% Senior Notes is the senior unsecured obligation of the Company and ranks equally with all of the Company's existing and future senior unsecured and unsubordinated indebtedness.
2017 Refinancing
The Company entered into the Credit Agreement on September 12, 2017. The initial proceeds3.500% Senior Notes are senior unsecured obligations of $700.0 million from the Term Facility, along with initial borrowings of $165.0 million under the Revolving Facility, were used primarily to repay in full the outstanding borrowing under the Company’s previously outstanding secured credit facility, the Second Amended and Restated Credit Agreement, dated as of September 30, 2015. All obligations under the Second Amended and Restated Credit Agreement were satisfied, all commitments thereunder were terminated, and all guarantees and security interests that had been granted in connection therewith were released.
On October 3, 2017,Allegion plc, are guaranteed by Allegion US Hold Co used the net proceeds from the Notes to redeem in full the $300.0 million Senior Notes due 2021 and the $300.0 million Senior Notes due 2023, as well as to repay in full the borrowings under the Revolving Facility and other costs associatedrank equally with the refinancing.
Related to the 2017 refinancing activities, the Company recorded a $33.2 million charge for the redemption premiums associated with the Senior Notes due 2021 and 2023, non-cash charges of $9.9 million related to the write-off of previously deferred financing costs, and $1.6 million of third party costs. These charges were all recorded within Interest expense on the Consolidated Statement of Comprehensive Income. The Company also incurred and deferred $10.8 million of discounts and financing costs associated with the new debt, which will be amortized to interest expense over the terms of the respective debt.Company's existing and future senior unsecured indebtedness.
Future Repayments
Our scheduledScheduled principal repayments on indebtedness as of December 31, 2017 are2021 were as follows:
| | | | | |
| In millions | |
| 2022 | $ | 12.6 | |
| 2023 | 12.6 | |
| 2024 | 412.6 | |
| 2025 | 21.9 | |
| 2026 | 190.6 | |
| Thereafter | 800.0 | |
| Total | $ | 1,450.3 | |
|
| | | |
| In millions | |
| 2018 | $ | 35.0 |
|
| 2019 | 35.0 |
|
| 2020 | 35.0 |
|
| 2021 | 70.0 |
|
| 2022 | 516.3 |
|
| Thereafter | 801.0 |
|
| Total | $ | 1,492.3 |
|
At December 31, 2017, the weighted-average interest rate for borrowings was 2.82% under the Term Facility (including the effect of interest rate swaps), 3.200% under the 3.200% Senior Notes and 3.550% under the 3.550% Senior Notes. Cash paid for interest for the years ended December 31, 2017, 20162021, 2020 and 20152019 was $58.4$45.1 million, $56.0$47.3 million and $39.0$48.8 million, respectively.
NOTE 10 – FINANCIAL INSTRUMENTS
In the normal course of business, the Company uses various financial instruments, including derivative instruments, to manage the risks associated with currency and variable interest rate exposures. These financial instruments are not used for trading or speculative purposes.
On the date a derivative contract is entered into, the Company designates the derivative instrument as a cash flow hedge of a forecasted transaction, a cash flow hedge of a recognized asset or liability, or as an undesignated derivative. The Company formally documents its hedge relationships, including identification of the derivative instruments and the hedged items, as well as its risk management objectives and strategies for undertaking the hedge transaction. This process includes linking derivative instruments that are designated as hedges to specific assets, liabilities or forecasted transactions.
The fair market value of derivative instruments is determined through market-based valuations and may not be representative of the actual gains or losses that will be recorded when these instruments mature due to future fluctuations in the markets in which they are traded.
The Company assesses at inception and at least quarterly thereafter, whether the derivatives used in cash flow hedging transactions are highly effective in offsetting the changes in the cash flows of the hedged item. To the extent the derivative is deemed to be a highly effective hedge, the fair market value changes of the instrument are recorded to Accumulated other comprehensive income (AOCI).
Any ineffective portion of a derivative instrument’s change in fair value is recorded in Net earnings in the period of change. If the hedging relationship ceases to be highly effective, or it becomes probable that a forecasted transaction is no longer expected to occur, the hedging relationship will be undesignated and any future gains and losses on the derivative instrument will be recorded in Net earnings.
Currency Hedging InstrumentsDerivatives
The gross notional amount of the Company’s currency derivatives were $57.7was $164.9 million and $132.6$218.9 million at December 31, 20172021 and 2016. At 2020, respectively. The fair values of currency derivatives included within the Consolidated Balance Sheets as of December 31, 20172021 and 2016, gains of $0.3 million and $0.8 million, net of tax,2020 were not material, nor were either the balances included in Accumulated other comprehensive loss related toor the fair value of the Company’s currency derivatives designated as accounting hedges. The approximate amount expected to be reclassified into Net earnings over the next twelve months is a gain of $0.3 million. Therelated to currency derivatives designated as cash flow hedges, although the actual amounts that will be reclassified to Net earnings may vary from this amount as a result of changes in market conditions. Gains and losses associated with the Company’s currency derivatives not designated as hedges are recorded in Net earnings as changes in fair value occur. At December 31, 2017, the maximum term of the Company’s currency derivatives was less than one year.
Interest Rate Swaps
The Company has forward starting interest rate swaps to fix interest rate payments during the contract period for $250.0 million of the Company's variable rate Term Facility. These swaps expire in September 2020. These interest rate swaps met the criteria to be accounted for as cash flow hedges of variable rate interest payments. Consequently, the changes in fair value of the interest rate swaps are recognized in Accumulated other comprehensive loss. At December 31, 2017 and 2016, $3.5 million and $2.6 million of gains, net of tax, were recorded in Accumulated other comprehensive loss related to these interest rate swaps. The approximate amount expected to be reclassified into Net earnings over the next twelve months is a gain of $1 million. The actual amounts that will be reclassified to Net earnings may vary from this amount as a result offuture changes in market conditions.
The fair values of derivative instruments included within the Consolidated Balance Sheets as of December 31 were as follows:
|
| | | | | | | | | | | | | | | | |
| | | Asset derivatives | | Liability derivatives |
| In millions | | 2017 | | 2016 | | 2017 | | 2016 |
| Derivatives designated as hedges: | | | | | | | | |
| Currency derivatives | | $ | 0.2 |
| | $ | 0.7 |
| | $ | 0.3 |
| | $ | 0.1 |
|
| Interest rate swaps | | 5.3 |
| | 4.6 |
| | — |
| | 0.4 |
|
| Derivatives not designated as hedges: | | | | | | | | |
| Currency derivatives | | — |
| | 0.3 |
| | 0.4 |
| | 0.2 |
|
| Total derivatives | | $ | 5.5 |
| | $ | 5.6 |
| | $ | 0.7 |
| | $ | 0.7 |
|
Asset and liability currency derivatives included in the table above are recorded within Other current assets and Accrued expenses and other current liabilities, respectively. Asset and liability interest rate swap derivatives included in the table above are recorded within Other noncurrent assets and Other noncurrent liabilities.
The amounts associated with currency derivatives designated as hedges affecting Net earnings and Accumulated other comprehensive loss for the years ended December 31 were as follows:
| | | | | | | | | | | | | | | | | | | | | | | | | | | | | | | | | | | | | | | | | | | | |
| | | Amount of gain recognized in Accumulated other comprehensive loss | | Location of gain recognized in Net earnings | | Amount of gain reclassified from Accumulated other comprehensive loss and recognized into Net earnings |
| In millions | | 2021 | | 2020 | | 2019 | | | 2021 | | 2020 | | 2019 |
| Currency derivatives | | $ | 2.6 | | | $ | 4.1 | | | $ | 1.9 | | | Cost of goods sold | | $ | 0.2 | | | $ | 5.3 | | | $ | 4.4 | |
| | | | | | | | | | | | | | |
| | | | | | | | | | | | | | |
|
| | | | | | | | | | | | | | | | | | | | | | | | | | |
| | | Amount of gain (loss) recognized in AOCI | | Location of gain (loss) reclassified from AOCI and recognized into Net earnings | | Amount of gain (loss) reclassified from AOCI and recognized into Net earnings |
| In millions | | 2017 | | 2016 | | 2015 | | | 2017 | | 2016 | | 2015 |
| Currency derivatives | | $ | 4.0 |
| | $ | 4.2 |
| | $ | 6.6 |
| | Cost of goods sold | | $ | 4.7 |
| | $ | 5.4 |
| | $ | 6.5 |
|
| Interest rate swaps | | 1.2 |
| | 5.4 |
| | (0.3 | ) | | Interest expense | | (0.3 | ) | | — |
| | — |
|
| Total | | $ | 5.2 |
| | $ | 9.6 |
| | $ | 6.3 |
| | | | $ | 4.4 |
| | $ | 5.4 |
| | $ | 6.5 |
|
The gainsGains and losses associated with the Company's non-designated currency derivatives, which are offset by changes in the fair value of the underlying transactions, are included within Other income,(income) expense, net in the Consolidated Statements of
Comprehensive Income. At December 31, 2021, the maximum term of the Company’s currency derivatives, both those that are designated as cash flow hedges and those that are not, was less than one year.
Concentration of Credit Risk
The counterparties to the Company’s forward contracts and swaps consist of a number of investment grade major international financial institutions. The Company could be exposed to losses in the event of nonperformance by the counterparties. However, the credit ratings and the concentration of risk in these financial institutions are monitored on a continuous basis and present no significant credit risk to the Company.
NOTE 11 - LEASES
Total rental expense for the years ended December 31, 2021, 2020 and 2019, was $45.4 million, $44.2 million and $43.2 million, respectively, and is classified within Cost of goods sold and Selling and administrative expenses within the Consolidated Statements of Comprehensive Income. Rental expense related to short-term leases, variable lease payments or other leases or lease components not included within the ROU asset or lease liability totaled $8.2 million, $9.1 million and $8.1 million, respectively, for the years ended December 31, 2021, 2020 and 2019. No material lease costs have been capitalized on the Consolidated Balance Sheets as of December 31, 2021 or 2020.
Amounts included within the Consolidated Balance Sheets related to the Company's ROU asset and lease liability were as follows:
| | | | | | | | | | | | | | | | | | | | | | | | | | | | | | | | | | | | | | | | | |
| | | December 31, 2021 | | December 31, 2020 |
| In millions | Balance Sheet classification | | Real estate | | Equipment | | Total | | Real estate | | Equipment | | Total |
| ROU asset | Other noncurrent assets | | $ | 58.2 | | | $ | 31.7 | | | $ | 89.9 | | | $ | 59.5 | | | $ | 32.5 | | | $ | 92.0 | |
| Lease liability - current | Accrued expenses and other current liabilities | | 15.5 | | | 13.6 | | | 29.1 | | | 14.7 | | | 12.9 | | | 27.6 | |
| Lease liability - noncurrent | Other noncurrent liabilities | | 45.1 | | | 18.2 | | | 63.3 | | | 46.5 | | | 19.8 | | | 66.3 | |
| | | | | | | | | | | | | |
| Other information: | | | | | | | | | | | | |
| Weighted-average remaining term (years) | | 6.5 | | 2.8 | | | | 7.0 | | 3.2 | | |
| Weighted-average discount rate | | 3.4 | % | | 2.1 | % | | | | 3.9 | % | | 2.7 | % | | |
The following table summarizes additional information related to the Company's leases for the years ended December 31:
| | | | | | | | | | | | | | | | | | | | | | | | | | | | | | | | | | | | | | |
| | 2021 | | 2020 |
| In millions | | Real estate | | Equipment | | Total | | Real estate | | Equipment | | Total |
| Cash paid for amounts included in the measurement of lease liabilities | | $ | 19.1 | | | $ | 17.4 | | | $ | 36.5 | | | $ | 19.0 | | | $ | 15.0 | | | $ | 34.0 | |
| ROU assets obtained in exchange for new lease liabilities | | 16.7 | | | 12.8 | | | 29.5 | | | 19.2 | | | 22.0 | | | 41.2 | |
The Company frequently enters into both real estate and equipment leases in the normal course of business. While there have been lease agreements entered into that have not yet commenced as of December 31, 2021, none of these leases provide new rights or obligations to the Company that are material individually or in the aggregate.
Future Repayments
Scheduled minimum lease payments required under non-cancellable operating leases for both the real estate and equipment lease portfolios for the next five years and thereafter as of December 31, 2021, were as follows:
| | | | | | | | | | | | | | | | | | | | | | | | | | | | | | | | | | | | | | | | | | | | |
| In millions | | 2022 | | 2023 | | 2024 | | 2025 | | 2026 | | Thereafter | | Total |
| Real estate leases | | $ | 17.3 | | | $ | 12.9 | | | $ | 9.5 | | | $ | 8.0 | | | $ | 4.8 | | | $ | 16.2 | | | $ | 68.7 | |
| Equipment leases | | 14.1 | | | 9.9 | | | 5.7 | | | 2.6 | | | 0.3 | | | — | | | 32.6 | |
| Total | | $ | 31.4 | | | $ | 22.8 | | | $ | 15.2 | | | $ | 10.6 | | | $ | 5.1 | | | $ | 16.2 | | | $ | 101.3 | |
The difference between the total undiscounted minimum lease payments and the combined current and noncurrent lease liabilities as of December 31, 2021, is due to imputed interest of $8.9 million.
NOTE 1112 – PENSIONS AND POSTRETIREMENT BENEFITS OTHER THAN PENSIONS
The Company sponsors several U.S. defined benefit and defined contribution plans covering substantially all of our U.S. employees. Additionally, the Company has non-U.S. defined benefit and defined contribution plans covering eligible non-U.S. employees. Postretirement benefits, other than pensions, provide healthcare benefits, and in some instances, life insurance benefits for certain eligible employees.
Pension Plans
The noncontributory defined benefit pension plans covering non-collectively bargained U.S. employees provide benefits on an average pay formula, while most plans for collectively bargained U.S. employees provide benefits on a flat dollar benefit formula. The non-U.S. pension plans generally provide benefits based on earnings and years of service. The Company also maintains additional other supplemental plans for officers and other key employees.
The following table details information regarding the Company’s pension plans at December 31:
| | | | | U.S. | | NON-U.S. | | U.S. | | NON-U.S. |
| In millions | | 2017 | | 2016 | | 2017 | | 2016 | In millions | | 2021 | | 2020 | | 2021 | | 2020 |
| Change in benefit obligations: | | | | | | | | | Change in benefit obligations: | | | | | | | | |
| Benefit obligation at beginning of year | | $ | 286.9 |
| | $ | 280.7 |
| | $ | 380.5 |
| | $ | 371.7 |
| Benefit obligation at beginning of year | | $ | 361.4 | | | $ | 341.0 | | | $ | 455.7 | | | $ | 404.5 | |
| Service cost | | 8.7 |
| | 9.4 |
| | 3.3 |
| | 3.1 |
| Service cost | | 6.7 | | | 6.7 | | | 2.0 | | | 1.7 | |
| Interest cost | | 10.5 |
| | 9.8 |
| | 8.9 |
| | 10.7 |
| Interest cost | | 6.8 | | | 9.6 | | | 5.1 | | | 6.6 | |
| Employee contributions | | — |
| | — |
| | 0.3 |
| | 0.3 |
| Employee contributions | | — | | | — | | | 0.3 | | | 0.3 | |
| Actuarial losses (gains) | | 17.5 |
| | 1.6 |
| | (15.4 | ) | | 80.8 |
| |
| Amendments | | Amendments | | — | | | — | | | (0.1) | | | 0.2 | |
| Actuarial (gains) losses | | Actuarial (gains) losses | | (18.7) | | | 22.5 | | | (21.9) | | | 43.4 | |
| Benefits paid | | (12.4 | ) | | (12.6 | ) | | (13.7 | ) | | (18.7 | ) | Benefits paid | | (20.0) | | | (19.0) | | | (14.8) | | | (16.3) | |
| Foreign exchange rate changes | | — |
| | — |
| | 34.3 |
| | (63.5 | ) | Foreign exchange rate changes | | — | | | — | | | (5.4) | | | 15.9 | |
| Curtailments and settlements | | — |
| | — |
| | (0.9 | ) | | (1.8 | ) | Curtailments and settlements | | — | | | — | | | (3.0) | | | (0.6) | |
Acquisitions
| | 7.3 |
| | — |
| | — |
| | — |
| |
| Divestitures | | Divestitures | | — | | | — | | | (0.8) | | | — | |
| Other, including expenses paid | | (1.0 | ) | | (2.0 | ) | | (1.0 | ) | | (2.1 | ) | Other, including expenses paid | | (0.3) | | | 0.6 | | | — | | | — | |
| Benefit obligation at end of year | | $ | 317.5 |
| | $ | 286.9 |
| | $ | 396.3 |
| | $ | 380.5 |
| Benefit obligation at end of year | | $ | 335.9 | | | $ | 361.4 | | | $ | 417.1 | | | $ | 455.7 | |
| Change in plan assets: | | | | | |
| |
| Change in plan assets: | | | | | | | | |
| Fair value at beginning of year | | $ | 202.4 |
| | $ | 192.7 |
| | $ | 353.4 |
| | $ | 340.4 |
| Fair value at beginning of year | | $ | 333.0 | | | $ | 301.5 | | | $ | 463.9 | | | $ | 409.0 | |
| Actual return on plan assets | | 31.9 |
| | 16.4 |
| | 22.3 |
| | 90.3 |
| Actual return on plan assets | | 8.9 | | | 45.2 | | | 3.7 | | | 52.1 | |
| Company contributions | | 55.7 |
| | 7.9 |
| | 5.2 |
| | 6.0 |
| Company contributions | | 6.2 | | | 6.3 | | | 6.0 | | | 5.1 | |
| Employee contributions | | — |
| | — |
| | 0.3 |
| | 0.3 |
| Employee contributions | | — | | | — | | | 0.3 | | | 0.3 | |
| Benefits paid | | (12.4 | ) | | (12.6 | ) | | (13.7 | ) | | (18.7 | ) | Benefits paid | | (20.0) | | | (19.0) | | | (14.8) | | | (16.3) | |
| Foreign exchange rate changes | | — |
| | — |
| | 33.7 |
| | (61.0 | ) | Foreign exchange rate changes | | — | | | — | | | (4.8) | | | 15.9 | |
| Settlements | | — |
| | — |
| | (0.9 | ) | | (1.8 | ) | |
| Acquisitions | | 6.5 |
| | — |
| | — |
| | — |
| |
| Curtailment and settlements | | Curtailment and settlements | | — | | | — | | | (3.0) | | | (0.6) | |
| | Other, including expenses paid | | (0.9 | ) | | (2.0 | ) | | (1.9 | ) | | (2.1 | ) | Other, including expenses paid | | (1.6) | | | (1.0) | | | (1.9) | | | (1.6) | |
| Fair value of assets end of year | | $ | 283.2 |
| | $ | 202.4 |
| | $ | 398.4 |
| | $ | 353.4 |
| |
| Fair value of assets at end of year | | Fair value of assets at end of year | | $ | 326.5 | | | $ | 333.0 | | | $ | 449.4 | | | $ | 463.9 | |
| Funded status: | | | | | |
| |
| Funded status: | | | | | | | | |
| Plan assets (less than) over benefit obligations | | $ | (34.3 | ) | | $ | (84.5 | ) | | $ | 2.1 |
| | $ | (27.1 | ) | |
| Plan assets (less than) exceeding benefit obligations | | Plan assets (less than) exceeding benefit obligations | | $ | (9.4) | | | $ | (28.4) | | | $ | 32.3 | | | $ | 8.2 | |
| Amounts included in the balance sheet: | | | | | |
| |
| Amounts included in the balance sheet: | | | | | | | | |
| Other noncurrent assets | | $ | — |
| | $ | — |
| | $ | 28.5 |
| | $ | — |
| Other noncurrent assets | | $ | 13.9 | | | $ | — | | | $ | 55.9 | | | $ | 37.4 | |
| Accrued compensation and benefits | | (0.2 | ) | | (0.1 | ) | | (1.3 | ) | | (1.5 | ) | Accrued compensation and benefits | | (0.5) | | | (0.2) | | | (0.7) | | | (0.8) | |
| Postemployment and other benefit liabilities | | (34.1 | ) | | (84.4 | ) | | (25.1 | ) | | (25.6 | ) | Postemployment and other benefit liabilities | | (22.8) | | | (28.2) | | | (22.9) | | | (27.6) | |
| Liabilities held for sale | | Liabilities held for sale | | — | | | — | | | — | | | (0.8) | |
| Net amount recognized | | $ | (34.3 | ) | | $ | (84.5 | ) | | $ | 2.1 |
| | $ | (27.1 | ) | Net amount recognized | | $ | (9.4) | | | $ | (28.4) | | | $ | 32.3 | | | $ | 8.2 | |
It is the Company’s objective to contribute to the pension plans to ensure adequate funds are available in the plans to make benefit payments to plan participants and beneficiaries when required. However, certain plans are not funded due to either legal,
accounting or tax requirements in certain jurisdictions. As of December 31, 2017,2021, approximately 5%6% of ourthe Company's projected benefit obligation relates to plans that are not funded, of which the majority are non-U.S. plans.
The pretax amounts recognized in Accumulated other comprehensive loss were as follows:
| | | | | | | | | | | | | | | | | | | | |
| | U.S. |
| In millions | | Prior service cost | | Net actuarial losses | | Total |
| December 31, 2019 | | $ | (1.2) | | | $ | (69.1) | | | $ | (70.3) | |
| Current year changes recorded to Accumulated other comprehensive loss | | — | | | 8.1 | | | 8.1 | |
| Amortization reclassified to earnings | | 0.2 | | | 3.6 | | | 3.8 | |
| | | | | | |
| | | | | | |
| December 31, 2020 | | $ | (1.0) | | | $ | (57.4) | | | $ | (58.4) | |
| Current year changes recorded to Accumulated other comprehensive loss | | — | | | 13.5 | | | 13.5 | |
| Amortization reclassified to earnings | | 0.3 | | | 3.4 | | | 3.7 | |
| | | | | | |
| | | | | | |
| December 31, 2021 | | $ | (0.7) | | | $ | (40.5) | | | $ | (41.2) | |
|
| | | | | | | | | | | | |
| | | U.S. |
| In millions | | Prior service cost | | Net actuarial losses | | Total |
| December 31, 2015 | | $ | (2.8 | ) | | $ | (88.9 | ) | | $ | (91.7 | ) |
| Current year changes recorded to Accumulated other comprehensive loss | | — |
| | 4.5 |
| | 4.5 |
|
| Amortization reclassified to earnings | | 0.7 |
| | 4.7 |
| | 5.4 |
|
| December 31, 2016 | | $ | (2.1 | ) | | $ | (79.7 | ) | | $ | (81.8 | ) |
| Current year changes recorded to Accumulated other comprehensive loss | | — |
| | 2.4 |
| | 2.4 |
|
| Amortization reclassified to earnings | | 0.3 |
| | 4.8 |
| | 5.1 |
|
| December 31, 2017 | | $ | (1.8 | ) | | $ | (72.5 | ) | | $ | (74.3 | ) |
| | | | | NON-U.S. | | NON-U.S. |
| In millions | | Prior service cost | | Net actuarial losses | | Total | In millions | | Prior service cost | | Net actuarial losses | | Total |
| December 31, 2015 | | $ | — |
| | $ | (92.2 | ) | | $ | (92.2 | ) | |
| December 31, 2019 | | December 31, 2019 | | $ | (3.8) | | | $ | (69.8) | | | $ | (73.6) | |
| Current year changes recorded to Accumulated other comprehensive loss | | — |
| | (4.3 | ) | | (4.3 | ) | Current year changes recorded to Accumulated other comprehensive loss | | (0.3) | | | (4.0) | | | (4.3) | |
| Amortization reclassified to earnings | | — |
| | 2.2 |
| | 2.2 |
| Amortization reclassified to earnings | | 0.1 | | | 1.3 | | | 1.4 | |
| Settlements/curtailments reclassified to earnings | | — |
| | 0.3 |
| | 0.3 |
| Settlements/curtailments reclassified to earnings | | — | | | 0.1 | | | 0.1 | |
| Currency translation and other | | — |
| | 14.4 |
| | 14.4 |
| Currency translation and other | | (0.1) | | | (2.6) | | | (2.7) | |
| December 31, 2016 | | $ | — |
| | $ | (79.6 | ) | | $ | (79.6 | ) | |
| December 31, 2020 | | December 31, 2020 | | $ | (4.1) | | | $ | (75.0) | | | $ | (79.1) | |
| Current year changes recorded to Accumulated other comprehensive loss | | — |
| | 23.3 |
| | 23.3 |
| Current year changes recorded to Accumulated other comprehensive loss | | 0.1 | | | 11.8 | | | 11.9 | |
| Amortization reclassified to earnings | | — |
| | 1.8 |
| | 1.8 |
| Amortization reclassified to earnings | | 0.1 | | | 1.4 | | | 1.5 | |
| Settlements/curtailments reclassified to earnings | | — |
| | 0.1 |
| | 0.1 |
| Settlements/curtailments reclassified to earnings | | — | | | 0.5 | | | 0.5 | |
| Currency translation and other | | 0.1 |
| | (6.2 | ) | | (6.1 | ) | Currency translation and other | | 0.1 | | | 2.0 | | | 2.1 | |
| December 31, 2017 | | $ | 0.1 |
| | $ | (60.6 | ) | | $ | (60.5 | ) | |
| December 31, 2021 | | December 31, 2021 | | $ | (3.8) | | | $ | (59.3) | | | $ | (63.1) | |
Weighted-average assumptions used:
| | | Benefit obligations at December 31, | | 2017 | | 2016 | Benefit obligations at December 31, | | 2021 | | 2020 |
| Discount rate: | | | | | Discount rate: | | | | |
| U.S. plans | | 3.6 | % | | 4.1 | % | U.S. plans | | 2.8 | % | | 2.5 | % |
| Non-U.S. plans | | 2.5 | % | | 2.6 | % | Non-U.S. plans | | 1.9 | % | | 1.3 | % |
| Rate of compensation increase: | | | | | Rate of compensation increase: | |
| U.S. plans | | 3.0 | % | | 3.5 | % | U.S. plans | | 3.0 | % | | 3.0 | % |
| Non-U.S. plans | | 3.2 | % | | 3.2 | % | Non-U.S. plans | | 3.4 | % | | 3.0 | % |
The accumulated benefit obligation for all U.S. defined benefit pension plans was $304.9$333.4 million and $272.5$354.9 million at December 31, 20172021 and 2016.2020, respectively. The accumulated benefit obligation for all non-U.S. defined benefit pension plans was $388.3$410.2 million and $371.9$446.0 million at December 31, 20172021 and 2016.2020, respectively.
BeginningInformation regarding pension plans with accumulated benefit obligations more than plan assets were:
| | | | | | | | | | | | | | | | | | | | | | | | | | |
| | U.S. | | NON-U.S. |
| In millions | | 2021 | | 2020 | | 2021 | | 2020 |
| Projected benefit obligation | | $ | 23.3 | | | $ | 24.0 | | | $ | 33.7 | | | $ | 40.3 | |
| Accumulated benefit obligation | | 23.0 | | | 23.3 | | | 28.2 | | | 34.0 | |
| Fair value of plan assets | | $ | — | | | $ | — | | | $ | 10.1 | | | $ | 11.1 | |
Future pension benefit payments are expected to be paid as follows:
| | | | | | | | | | | |
| In millions | U.S. | | NON-U.S. |
| 2022 | $ | 19.5 | | | $ | 15.6 | |
| 2023 | 30.0 | | | 16.1 | |
| 2024 | 28.2 | | | 17.0 | |
| 2025 | 19.8 | | | 17.8 | |
| 2026 | 21.2 | | | 18.6 | |
| 2027 - 2031 | 93.4 | | | 104.8 | |
The components of the Company’s net periodic pension benefit cost (income) for the years ended December 31 were as follows:
| | | | | | | | | | | | | | | | | | | | |
| | U.S. |
| In millions | | 2021 | | 2020 | | 2019 |
| Service cost | | $ | 6.7 | | | $ | 6.7 | | | $ | 6.5 | |
| Interest cost | | 6.8 | | | 9.6 | | | 11.7 | |
| Expected return on plan assets | | (14.0) | | | (14.5) | | | (12.5) | |
| Administrative costs and other | | 1.2 | | | 1.6 | | | 1.7 | |
| Net amortization of: | | | | | | |
| Prior service costs | | 0.3 | | | 0.2 | | | 0.3 | |
| Plan net actuarial losses | | 3.4 | | | 3.6 | | | 4.7 | |
| Net periodic pension benefit cost | | $ | 4.4 | | | $ | 7.2 | | | $ | 12.4 | |
| | | | | | | | | | | | | | | | | | | | |
| | NON-U.S. |
| In millions | | 2021 | | 2020 | | 2019 |
| Service cost | | $ | 2.0 | | | $ | 1.7 | | | $ | 1.7 | |
| Interest cost | | 5.1 | | | 6.6 | | | 8.8 | |
| Expected return on plan assets | | (13.8) | | | (12.7) | | | (13.0) | |
| Administrative costs and other | | 1.9 | | | 1.6 | | | 1.3 | |
| Net amortization of: | | | | | | |
| Prior service costs | | 0.1 | | | 0.1 | | | 0.2 | |
| Plan net actuarial losses | | 1.4 | | | 1.3 | | | 1.4 | |
| Net curtailment and settlement losses | | 0.5 | | | 0.1 | | | 2.3 | |
| Net periodic pension benefit (income) cost | | $ | (2.8) | | | $ | (1.3) | | | $ | 2.7 | |
The Service cost component of Net periodic pension benefit cost (income) is recorded in 2016,Cost of goods sold and Selling and administrative expenses, while the remaining components are recorded within Other (income) expense, net within the Consolidated Statements of Comprehensive Income.
Net periodic pension benefit income for 2022 is projected to be approximately $1.7 million, utilizing the assumptions for calculating the pension benefit obligations at the end of 2021.
Weighted-average assumptions used:
| | | | | | | | | | | | | | | | | | | | |
| Net periodic pension benefit cost (income) for the year ended December 31, | | 2021 | | 2020 | | 2019 |
| Discount rate: | | | | | | |
| U.S. plans | | 2.5 | % | | 3.3 | % | | 4.3 | % |
| Non-U.S. plans | | 1.3 | % | | 1.9 | % | | 2.8 | % |
| Rate of compensation increase: | | | | | | |
| U.S. plans | | 3.0 | % | | 3.0 | % | | 3.0 | % |
| Non-U.S. plans | | 3.0 | % | | 3.0 | % | | 3.3 | % |
| Expected return on plan assets: | | | | | | |
| U.S. plans | | 4.3 | % | | 5.0 | % | | 5.0 | % |
| Non-U.S. plans | | 3.0 | % | | 3.3 | % | | 3.8 | % |
The Company elected to change the method used to estimateestimates the service and interest cost components of net periodic benefit cost toutilizing a full yield-curve approach. Historically, the Company estimated the service and interest cost components using a single weighted-average discount rate, rounded to the nearest 25th basis point, derived from the yield curve used to measure the benefit obligation at the beginning of the period. Under the newthis approach, the Company appliedapplies discounting using the applicable spot rates derived from the yield curve to discount the cash flows used to measure the benefit obligation. These spot rates align to each of the projected benefit obligations and service cost cash flows. This change was made to better align the projected benefit cash flows and the corresponding yield curve spot rates to provide a better estimate of service and interest cost components of net periodic benefit costs. This change was considered a change in estimate and was accounted for on a prospective basis beginning January 1, 2016. This change did not have a material impact on 2016 pension expense.
Information regarding pension plans with accumulated benefit obligations more than plan assets were:
|
| | | | | | | | | | | | | | | | |
| | | U.S. | | NON-U.S. |
| In millions | | 2017 | | 2016 | | 2017 | | 2016 |
| Projected benefit obligation | | $ | 317.5 |
| | $ | 286.9 |
| | $ | 34.4 |
| | $ | 30.2 |
|
| Accumulated benefit obligation | | 304.9 |
| | 272.5 |
| | 29.5 |
| | 25.9 |
|
| Fair value of plan assets | | $ | 283.2 |
| | $ | 202.4 |
| | $ | 7.9 |
| | $ | 6.8 |
|
Future pension benefit payments are expected to be paid as follows:
|
| | | | | | | |
| In millions | U.S. | | NON-U.S. |
| 2018 | $ | 16.3 |
| | $ | 16.0 |
|
| 2019 | 16.6 |
| | 16.3 |
|
| 2020 | 23.6 |
| | 17.0 |
|
| 2021 | 18.7 |
| | 17.8 |
|
| 2022 | 19.1 |
| | 18.3 |
|
| 2023 - 2027 | $ | 111.7 |
| | $ | 102.3 |
|
The components of the Company’s net periodic pension benefit costs for the years ended December 31 include the following:
|
| | | | | | | | | | | | |
| | | U.S. |
| In millions | | 2017 | | 2016 | | 2015 |
| Service cost | | $ | 8.7 |
| | $ | 9.4 |
| | $ | 9.5 |
|
| Interest cost | | 10.5 |
| | 9.8 |
| | 11.0 |
|
| Expected return on plan assets | | (12.0 | ) | | (10.2 | ) | | (11.2 | ) |
| Net amortization of: | | | | | | |
| Prior service costs | | 0.3 |
| | 0.7 |
| | 0.7 |
|
| Plan net actuarial losses | | 4.8 |
| | 4.7 |
| | 4.9 |
|
| Net periodic pension benefit cost | | 12.3 |
| | 14.4 |
| | 14.9 |
|
| Net curtailment and settlement losses | | — |
| | — |
| | 0.9 |
|
| Net periodic pension benefit cost after net curtailment and settlement losses | | $ | 12.3 |
| | $ | 14.4 |
| | $ | 15.8 |
|
|
| | | | | | | | | | | | |
| | | NON-U.S. |
| In millions | | 2017 | | 2016 | | 2015 |
| Service cost | | $ | 3.3 |
| | $ | 3.1 |
| | $ | 3.3 |
|
| Interest cost | | 8.9 |
| | 10.7 |
| | 13.7 |
|
| Expected return on plan assets | | (14.3 | ) | | (13.7 | ) | | (17.8 | ) |
| Other adjustments | | 0.7 |
| | — |
| | — |
|
| Net amortization of: | |
| |
| |
|
| Plan net actuarial losses | | 1.9 |
| | 2.2 |
| | 1.4 |
|
| Net periodic pension benefit cost | | 0.5 |
| | 2.3 |
| | 0.6 |
|
| Net curtailment and settlement losses | | 0.1 |
| | 0.3 |
| | 0.2 |
|
| Net periodic pension benefit cost after net curtailment and settlement losses | | $ | 0.6 |
| | $ | 2.6 |
| | $ | 0.8 |
|
Pension expense for 2018 is projected to be approximately $5.9 million, utilizing the assumptions for calculating the pension benefit obligations at the end of 2017. The amounts expected to be recognized in net periodic pension cost during the year ended December 31, 2018 for prior service cost and plan net actuarial losses are $0.4 million and $4.8 million, respectively.
Weighted-average assumptions used:
|
| | | | | | | | | |
| Net periodic pension cost for the year ended December 31, | | 2017 | | 2016 | | 2015 |
| Discount rate: | | | | | | |
| U.S. plans | | 4.1 | % | | 4.3 | % | | 4.0 | % |
| Non-U.S. plans | | 2.6 | % | | 3.7 | % | | 3.7 | % |
| Rate of compensation increase: | | | | | | |
| U.S. plans | | 3.5 | % | | 3.5 | % | | 3.5 | % |
| Non-U.S. plans | | 3.2 | % | | 3.0 | % | | 2.9 | % |
| Expected return on plan assets: | | | | | | |
| U.S. plans | | 4.8 | % | | 5.5 | % | | 5.5 | % |
| Non-U.S. plans | | 4.0 | % | | 4.5 | % | | 5.0 | % |
The expected long-term rate of return on plan assets reflects the average rate of returns expected on the funds invested or to be invested to provide for the benefits included in the projected benefit obligation. The expected long-term rate of return on plan assetsobligation and is based on what is achievable given the plan’s investment policy, the types of assets held and target asset allocations. The expected long-term rate of return is determined as of the measurement date. Each plan is reviewed, along with its historical returns and target asset allocations, to determine the appropriate expected long-term rate of return on plan assets to be used.
The Company's overall objective in managing defined benefit plan assets is to ensure that all present and future benefit obligations are met as they come due. The goal is to achieve this while trying to mitigate volatility in plan funded status, contribution,contributions and expense by better matching the characteristics of the plan assets to that of the plan liabilities. Each plan’s funded status and asset allocation is monitored regularly in addition to investment manager performance.
The fair values of the Company’s U.S. pension plan assets at December 31, 20172021, by asset category arewere as follows:
| | | | | | | | | | | | | | | | | | | | | | | | | | | | | | | | |
| | | Fair value measurements | | | | Total |
| In millions | | Quoted prices in active markets for identical assets (Level 1) | | Significant other observable inputs
(Level 2) | | Significant unobservable inputs (Level 3) | | Assets measured at NAV | |
| Cash, cash equivalents and short-term investments | | $ | — | | | $ | — | | | $ | — | | | $ | 4.5 | | | $ | 4.5 | |
| Common collective trusts | | — | | | — | | | — | | | 252.3 | | | 252.3 | |
Other(a) | | — | | | — | | | — | | | 69.7 | | | 69.7 | |
| Total U.S. pension plan assets | | $ | — | | | $ | — | | | $ | — | | | $ | 326.5 | | | $ | 326.5 | |
|
| | | | | | | | | | | | | | | | | | | | |
| | | Fair value measurements | | | | Total fair value |
| In millions | | Level 1 | | Level 2 | | Level 3 | | Assets measured at NAV | |
| Cash, cash equivalents, and short term investments | | $ | — |
| | $ | 3.2 |
| | $ | — |
| | $ | — |
| | $ | 3.2 |
|
| Equity mutual funds | | — |
| | — |
| | — |
| | 70.9 |
| | 70.9 |
|
| Fixed income investments: | | | | | | | | | | |
| U.S. government and agency obligations | | — |
| | 83.6 |
| | — |
| | — |
| | 83.6 |
|
Corporate and non-U.S. bonds(a) | | — |
| | 111.3 |
| | — |
| | 12.8 |
| | 124.1 |
|
| | | — |
| | 194.9 |
| | — |
| | 12.8 |
| | 207.7 |
|
| Total assets at fair value | | $ | — |
| | $ | 198.1 |
| | $ | — |
| | $ | 83.7 |
| | $ | 281.8 |
|
| Receivables and payables, net | | | | | | | | | | 1.4 |
|
| Net assets available for benefits | | | | | | | | | | $ | 283.2 |
|
| |
(a) | Includes state and municipal bonds. |
No material transfers in or out of Level 3 occurred during the year ended December 31, 2017.
The fair values of the Company’s U.S. pension plan assets at December 31, 20162020, by asset category arewere as follows:
| | | | | | | | | | | | | | | | | | | | | | | | | | | | | | | | |
| | | Fair value measurements | | | | Total |
| In millions | | Quoted prices in active markets for identical assets (Level 1) | | Significant other observable inputs
(Level 2) | | Significant unobservable inputs (Level 3) | | Assets measured at NAV | |
| Cash, cash equivalents and short-term investments | | $ | — | | | $ | — | | | $ | — | | | $ | 2.1 | | | $ | 2.1 | |
| Common collective trusts | | — | | | — | | | — | | | 288.4 | | | 288.4 | |
Other(a) | | — | | | — | | | — | | | 42.5 | | | 42.5 | |
| Total U.S. pension plan assets | | $ | — | | | $ | — | | | $ | — | | | $ | 333.0 | | | $ | 333.0 | |
| | | | | | | | | | |
| | | | | | | | | | |
(a)Includes a group trust diversified credit fund and real estate investment trust. |
| | | | | | | | | | | | | | | | | | | | |
| | | Fair value measurements | | | | Total fair value |
| In millions | | Level 1 | | Level 2 | | Level 3 | | Assets measured at NAV | |
| Cash, cash equivalents, and short term investments | | $ | — |
| | $ | 5.6 |
| | $ | — |
| | $ | — |
| | $ | 5.6 |
|
| Equity mutual funds | | — |
| | — |
| | — |
| | 62.9 |
| | 62.9 |
|
| Fixed income investments: | | | | | | | | | | |
| U.S. government and agency obligations | | — |
| | 55.2 |
| | — |
| | — |
| | 55.2 |
|
Corporate and non-U.S. bonds(a) | | — |
| | 77.6 |
| | — |
| | — |
| | 77.6 |
|
| | | — |
| | 132.8 |
| | — |
| | — |
| | 132.8 |
|
| Total assets at fair value | | $ | — |
| | $ | 138.4 |
| | $ | — |
| | $ | 62.9 |
| | $ | 201.3 |
|
| Receivables and payables, net | | | | | | | | | | 1.1 |
|
| Net assets available for benefits | | | | | | | | | | $ | 202.4 |
|
| |
(a) | Includes state and municipal bonds. |
No material transfers in or out of Level 3 occurred during the yearyears ended December 31, 2016.2021 or 2020.
The Company determinesCompany's U.S. pension plan assets are valued using the following methodologies:
•Cash, cash equivalents and short-term investments – Short-term investments are valued at their daily net asset value (NAV) per share or the equivalent based upon the fair value of itsthe underlying investments. NAV per share or the equivalent is used for fair value purposes as a practical expedient and is calculated by the investment manager or sponsor of the fund. These investments primarily consist of short-term investment funds.
•Common collective trusts - Common collective trust ("CCT") funds are not publicly traded and are valued at NAV per share or the equivalent based upon the fair value of the underlying investments. NAV per share or the equivalent is used for fair value purposes as a practical expedient and is calculated by the investment manager or sponsor of the applicable fund. CCT funds consist of a variety of publicly traded securities, including equity mutual funds, U.S. government and agency obligations, corporate and non-U.S. bonds, securitized credit and emerging market debt. There are no unfunded commitments, redemption frequency restrictions or other redemption restrictions related to such investments.
The fair values of the Company’s non-U.S. pension plan assets at December 31, 2021, by asset category were as follows:
| | | | | | | | | | | | | | | | | | | | | | | | | | | | | | | | |
| | | Fair value measurements | | | | Total |
| In millions | | Quoted prices in active markets for identical assets (Level 1) | | Significant other observable inputs
(Level 2) | | Significant unobservable inputs (Level 3) | | Assets measured at NAV | |
| Cash, cash equivalents and short-term investments | | $ | 0.3 | | | $ | — | | | $ | — | | | $ | 103.9 | | | $ | 104.2 | |
| Equity mutual funds | | — | | | 3.1 | | | — | | | 112.5 | | | 115.6 | |
| Corporate and non-U.S. bonds | | — | | | 3.0 | | | — | | | 166.4 | | | 169.4 | |
Other(a) | | — | | | 0.5 | | | 3.8 | | | 55.9 | | | 60.2 | |
| Total non-U.S. pension plan assets | | $ | 0.3 | | | $ | 6.6 | | | $ | 3.8 | | | $ | 438.7 | | | $ | 449.4 | |
(a) Primarily includes a core diversified credit fund, a credit opportunity fund and derivative contracts.
The fair values of the Company’s non-U.S. pension plan assets at December 31, 2020, by asset category were as follows:
| | | | | | | | | | | | | | | | | | | | | | | | | | | | | | | | |
| | | Fair value measurements | | | | Total |
| In millions | | Quoted prices in active markets for identical assets (Level 1) | | Significant other observable inputs
(Level 2) | | Significant unobservable inputs (Level 3) | | Assets measured at NAV | |
| Cash, cash equivalents and short-term investments | | $ | 1.6 | | | $ | — | | | $ | — | | | $ | 92.5 | | | $ | 94.1 | |
| Equity mutual funds | | — | | | 3.3 | | | — | | | 110.0 | | | 113.3 | |
| Corporate and non-U.S. bonds | | — | | | 3.5 | | | — | | | 203.8 | | | 207.3 | |
Other(a) | | — | | | 0.5 | | | 4.2 | | | 44.5 | | | 49.2 | |
| Total non-U.S. pension plan assets | | $ | 1.6 | | | $ | 7.3 | | | $ | 4.2 | | | $ | 450.8 | | | $ | 463.9 | |
(a) Primarily includes a core diversified credit fund and derivative contracts.
No material transfers in or out of Level 3 occurred during the years ended December 31, 2021 or 2020.
The Company's non-U.S. pension plan assets are valued using the following methodologies:
•Cash, cash equivalents and short termshort-term investments– Short termCash equivalents are valued using a market approach with inputs including quoted market prices for either identical or similar instruments. Short-term investments are valued at the closing price or amount held on deposit by the custodian bank, or at fair value by discounting the related cash flows based on current yields of similar instruments with comparable durations considering the credit-worthiness of the issuer. As theseissuer, or at their NAV per share or the equivalent based upon the fair value of the underlying investments. NAV per share or the equivalent is used for fair value purposes as a practical expedient and is calculated by the investment manager or sponsor of the fund. These investments are not traded on active markets, these investments are classified as Level 2.
primarily consist of short-term investment funds.
•Equity mutual funds– Equity mutual funds are primarily valued at their daily net asset value (NAV)NAV per share or the equivalent. NAV per share or the equivalent is used for fair value purposes as a practical expedient. NAVs areNAV is calculated by the investment manager or sponsor of the fund.
U.S. government•Corporate and agency obligationsnon-U.S. bonds – Quoted market prices are not available for these securities. Fair values are either estimated using pricing models and/or quoted prices of securities with similar characteristics or discounted cash flows. Suchflows, in which instances such securities are classified as Level 2.
Corporate and non-U.S. bonds – Quoted market prices are not available for these securities. Fair values are estimated by using pricing models and/2 or quoted prices of securities with similar characteristics or discounted cash flows. Such securities are classified as Level 2.
The fair values of the Company’s non-U.S. pension plan assets at December 31, 2017 by asset category are as follows:
|
| | | | | | | | | | | | | | | | | | | | |
| | | Fair value measurements | | | | Total fair value |
| In millions | | Level 1 | | Level 2 | | Level 3 | | Assets measured at NAV | |
| Cash and cash equivalents | | $ | 36.7 |
| | $ | — |
| | $ | — |
| | — |
| | $ | 36.7 |
|
| Equity mutual funds | | — |
| | 2.0 |
| | — |
| | 103.1 |
| | 105.1 |
|
| Corporate and non-U.S. bonds | | — |
| | 176.9 |
| | — |
| | — |
| | 176.9 |
|
| Real estate | | — |
| | — |
| | 0.8 |
| | — |
| | 0.8 |
|
Other(a) | | — |
| | 46.7 |
| | 2.3 |
| | 29.9 |
| | 78.9 |
|
| Total assets at fair value | | $ | 36.7 |
| | $ | 225.6 |
| | $ | 3.1 |
| | $ | 133.0 |
| | $ | 398.4 |
|
| |
(a) | Primarily includes insurance contracts, mortgage-backed securities, and derivative contracts. |
No material transfers in or out of Level 3 occurred during the year ended December 31, 2017.
The fair values of the Company’s non-U.S. pension plan assets at December 31, 2016 by asset category are as follows:
|
| | | | | | | | | | | | | | | | |
| | | Fair value measurements | | Total fair value |
| In millions | | Level 1 | | Level 2 | | Level 3 | |
| Cash and cash equivalents | | $ | 58.9 |
| | $ | — |
| | $ | — |
| | $ | 58.9 |
|
| Equity mutual funds | | — |
| | 107.2 |
| | — |
| | 107.2 |
|
| Corporate and non-U.S. bonds | | — |
| | 110.8 |
| | — |
| | 110.8 |
|
Real estate(a) | | — |
| | 9.7 |
| | 0.7 |
| | 10.4 |
|
Other(b) | | — |
| | 64.1 |
| | 2.0 |
| | 66.1 |
|
| Total assets at fair value | | $ | 58.9 |
| | $ | 291.8 |
| | $ | 2.7 |
| | $ | 353.4 |
|
| |
(a) | Includes several private equity funds that invest in real estate. It includes both direct investment funds and funds-of-funds. |
| |
(b) | Primarily includes insurance contracts. |
No material transfers in or out of Level 3 occurred during the year ended December 31, 2016.
The Company determines the fair value of its non-U.S. plan assets using the following methodologies:
Cash and cash equivalents - Cash equivalents are valued using a market approach with inputs including quoted market prices for either identical or similar instruments.
Equity mutual funds - Equity mutual funds are valued at their daily net asset value (NAV)NAV per share or the equivalent. NAV per share or the equivalent is used for fair value purposes as a practical expedient. NAVsexpedient and are calculated by the investment manager or sponsor of the fund.
Corporate and non-U.S. bonds - Corporate and non-U.S. bonds are valued through a market approach with inputs including, but not limited to, benchmark yields, reported trades, broker quotes and issuer spreads.
Real estate - Private real estate fund values are reported by the fund manager and are based on valuation or appraisal of the underlying investments.
The Company made employer contributions of $55.7$6.2 million, to the U.S. pension plan in 2017, of which $50.0$6.3 million was discretionary, and $7.9$6.0 million in 2016. The Company did not make any required or discretionary contributions to the U.S. pension plans in 2015.2021, 2020 and 2019, respectively. The Company made required and discretionary contributions to its non-U.S. pension plans of $5.2$6.0 million, $5.1 million and $10.6 million in 2017, $6.0 million in 2016,2021, 2020 and $6.5 million in 2015.2019, respectively.
The Company currently projects that an approximate $13.5approximately $5 million will be contributed to its U.S and non-U.S. plans worldwide in 2018.2022. The Company’s policy allows it to fund an amount, which could be in excess of or less than the pension cost expensed, subject to the limitations imposed by current tax regulations. The Company anticipates funding the plans in 20182022 in accordance with contributions required by funding regulations or the laws of each jurisdiction.
Most of the Company’s U.S. employees are covered by defined contribution plans. Employer contributions are determined based on criteria specific to the individual plans and amounted to approximately $14.0$18.3 million, $13.3$17.9 million and $12.1$15.6 million in 2017, 20162021, 2020 and 2015.2019, respectively. The Company’s contributions relating to non-U.S. defined contribution plans and other non-U.S. benefit plans were $8.6 million, $7.0 million $5.6 million and $6.2$6.0 million in 2017, 20162021, 2020 and 2015.2019, respectively.
Deferred Compensation Plan
The Company maintains an Executive Deferred Compensation Plan ("EDCP"), which is an unfunded, nonqualified plan that, permitsprior to 2019, permitted certain employees to defer receipt of up to 50% of their annual salary and up to 100% of their annual bonus awards, performance sharestock plan awards and restricted stock units received upon commencementearned until conclusion of employment.their employment with the Company. As of December 31, 20172021 and 2020, the deferred compensation liability balance was $20.9 million.$18.2 million and $18.1 million, respectively, which was recorded within Postemployment and other benefit liabilities in the Consolidated Balance Sheets.
Postretirement Benefits Other Than Pensions
The Company sponsors a postretirement ("OPEB") plan that provides for healthcare benefits, and in some instances, life insurance benefits, that cover certain eligible retired employees. The Company funds postretirement benefit obligations principally on a pay-as-you-go basis. Generally, postretirement health benefits are contributory with contributions adjusted annually. Life insurance plans for retirees are primarily noncontributory.
The following table details information regarding the Company’s postretirement plans at December 31:
|
| | | | | | | | |
| In millions | | 2017 | | 2016 |
| Change in benefit obligations: | | | | |
| Benefit obligation at beginning of year | | $ | 9.7 |
| | $ | 12.9 |
|
| Service cost | | 0.1 |
| | 0.1 |
|
| Interest cost | | 0.3 |
| | 0.4 |
|
| Actuarial gains | | 0.1 |
| | (2.9 | ) |
| Benefits paid, net of Medicare Part D subsidy | | (0.9 | ) | | (0.8 | ) |
| Benefit obligations at end of year | | $ | 9.3 |
| | $ | 9.7 |
|
|
| | | | | | | | |
| Funded status: | | | | |
| Plan assets less than benefit obligations | | $ | (9.3 | ) | | $ | (9.7 | ) |
| Amounts included in the balance sheet: | | | | |
| Accrued compensation and benefits | | (0.9 | ) | | (0.9 | ) |
| Postemployment and other benefit liabilities | | (8.4 | ) | | (8.8 | ) |
| Total | | $ | (9.3 | ) | | $ | (9.7 | ) |
The pretax amounts recognized in Accumulated other comprehensive loss were as follows:
|
| | | | | | | | | | | | |
| In millions | | Prior service gains | | Net actuarial losses | | Total |
| December 31, 2015 | | $ | 3.9 |
| | $ | (1.2 | ) | | $ | 2.7 |
|
| Current year changes recorded to Accumulated other comprehensive loss | | — |
| | 2.9 |
| | 2.9 |
|
| Amortization reclassified to earnings | | (1.6 | ) | | — |
| | (1.6 | ) |
| Balance at December 31, 2016 | | $ | 2.3 |
| | $ | 1.7 |
| | $ | 4.0 |
|
| Current year changes recorded to Accumulated other comprehensive loss | | — |
| | (0.2 | ) | | (0.2 | ) |
| Amortization reclassified to earnings | | (1.7 | ) | | — |
| | (1.7 | ) |
| Balance at December 31, 2017 | | $ | 0.6 |
| | $ | 1.5 |
| | $ | 2.1 |
|
The components of net Net periodic postretirement benefit costincome is included within Other (income) expense, net within the Consolidated Statements of Comprehensive Income.
The benefit obligation related to the Company's postretirement plans as of December 31, 2021 and 2020 was $4.4 million and $5.2 million, respectively, and is classified as Accrued compensation and benefits and Postemployment and other benefit liabilities within the Consolidated Balance Sheets. Net periodic postretirement benefit income was not material for any of the years ended December 31, were as follows:
|
| | | | | | | | | | | | |
| In millions | | 2017 | | 2016 | | 2015 |
| Service cost | | $ | 0.1 |
| | $ | 0.1 |
| | $ | 0.1 |
|
| Interest cost | | 0.3 |
| | 0.4 |
| | 0.5 |
|
| Net amortization of: | | | | | | |
| Prior service gains | | (1.7 | ) | | (1.6 | ) | | (1.6 | ) |
| Net actuarial losses | | (0.1 | ) | | — |
| | — |
|
| Net periodic postretirement benefit income | | $ | (1.4 | ) | | $ | (1.1 | ) | | $ | (1.0 | ) |
Postretirement income for 20182021, 2020 or 2019, nor is it projected to be $0.5 million. Amounts expected to be recognized in net periodic postretirement benefits cost in 2018material for prior service gains and plan net actuarial losses are $0.7 million and $0.1 million.
|
| | | | | | | | | |
| Assumptions: | | 2017 | | 2016 | | 2015 |
| Weighted-average discount rate assumption to determine: | | | | | | |
| Benefit obligations at December 31 | | 3.3 | % | | 3.5 | % | | 3.5 | % |
| Net periodic benefit cost | | 3.5 | % | | 3.5 | % | | 3.5 | % |
The Company has capped the annual maximum amount it will pay for retiree healthcare costs. Accordingly, assumptions of health-care cost trend rates are no longer applicable.
A 1% change in the medical trend rate assumed for postretirement benefits would have no effect on the postretirement benefit obligation as the Company has capped the annual maximum amount it will pay for retiree healthcare costs, therefore any additional costs would be assumed by the retiree.
2022. Benefit payments for postretirement benefits, which are net of expected plan participant contributions and Medicare Part D subsidy,subsidies, are expected to be paid as follows:less than $1 million per year for the foreseeable future.
|
| | | |
| In millions | |
| 2018 | $ | 0.9 |
|
| 2019 | 1.0 |
|
| 2020 | 0.9 |
|
| 2021 | 0.9 |
|
| 2022 | 0.8 |
|
| 2023 - 2027 | $ | 3.5 |
|
NOTE 1213 – FAIR VALUE MEASUREMENTS
Fair value is defined as the exchange price that would be received to sell an asset or paid to transfer a liability (an exit price) in the principal or most advantageous market for the asset or liability in an orderly transaction between market participants on the measurement date. Fair value measurements are based on a framework that utilizes the inputs market participants use to determine the fair value of an asset or liability and establishes a fair value hierarchy to prioritize those inputs. The fair value hierarchy is comprised of the three levels that are described below:
•Level 1 – Inputs based on quoted prices in active markets for identical assets or liabilities.
•Level 2 – Inputs other than Level 1 quoted prices, such as quoted prices for similar assets or liabilities; quoted prices in markets that are not active; or other inputs that are observable or can be corroborated by observable market data for substantially the full term of the asset or liability.
•Level 3 – Unobservable inputs based on little or no market activity and that are significant to the fair value of the assets and liabilities.
The fair value hierarchy requires an entity to maximize the use of observable inputs and minimize the use of unobservable inputs when measuring fair value. Observable inputs are obtained from independent sources and can be validated by a third party, whereas unobservable inputs reflect assumptions regarding what a third party would use in pricing an asset or liability based on the best information available under the circumstances. A financial instrument’s categorization within the fair value hierarchy is based upon the lowest level of input that is significant to the fair value measurement.
Assets and liabilities measured at fair value at December 31, 2017 are2021, were as follows:
| | | | | | | | | | | | | | | | | | | | | | | |
| | Fair value measurements | | Total
fair value |
| In millions | Quoted prices in active markets for identical assets (Level 1) | | Significant other observable inputs (Level 2) | | Significant unobservable inputs (Level 3) | |
| Recurring fair value measurements | | | | | | | |
| Assets: | | | | | | | |
| Investments | $ | — | | | $ | 24.5 | | | $ | — | | | $ | 24.5 | |
| Derivative instruments | — | | | 0.5 | | | — | | | 0.5 | |
| Total asset recurring fair value measurements | $ | — | | | $ | 25.0 | | | $ | — | | | $ | 25.0 | |
| Liabilities: | | | | | | | |
| Derivative instruments | $ | — | | | $ | 0.4 | | | $ | — | | | $ | 0.4 | |
| Deferred compensation and other retirement plans | — | | | 25.9 | | | — | | | 25.9 | |
| Total liability recurring fair value measurements | $ | — | | | $ | 26.3 | | | $ | — | | | $ | 26.3 | |
| Financial instruments not carried at fair value | | | | | | | |
| Total debt | $ | — | | | $ | 1,510.4 | | | $ | — | | | $ | 1,510.4 | |
| Total financial instruments not carried at fair value | $ | — | | | $ | 1,510.4 | | | $ | — | | | $ | 1,510.4 | |
|
| | | | | | | | | | | | | | | |
| | Fair value measurements | | Total
fair value |
| In millions | Quoted Prices in Active Markets for Identical Assets (Level 1) | | Significant Other Observable Inputs (Level 2) | | Significant Unobservable Inputs (Level 3) | |
| Recurring fair value measurements | | | | | | | |
| Assets: | | | | | | | |
| Interest rate swaps | $ | — |
| | $ | 5.3 |
| | $ | — |
| | $ | 5.3 |
|
| Foreign currency contracts | — |
| | 0.2 |
| | — |
| | 0.2 |
|
| Total asset recurring fair value measurements | $ | — |
| | $ | 5.5 |
| | $ | — |
| | $ | 5.5 |
|
| Liabilities: | | | | | | | |
| Foreign currency contracts | $ | — |
| | $ | 0.7 |
| | $ | — |
| | $ | 0.7 |
|
| Deferred compensation plans | — |
| | 20.9 |
| | — |
| | 20.9 |
|
| Total liability recurring fair value measurements | $ | — |
| | $ | 21.6 |
| | $ | — |
| | $ | 21.6 |
|
| Financial instruments not carried at fair value: | | | | | | | |
| Total debt | $ | — |
| | $ | 1,485.2 |
| | $ | — |
| | $ | 1,485.2 |
|
| Total financial instruments not carried at fair value | $ | — |
| | $ | 1,485.2 |
| | $ | — |
| | $ | 1,485.2 |
|
Assets and liabilities measured at fair value at December 31, 2016 are2020, were as follows:
| | | | | | | | | | | | | | | | | | | | | | | |
| | Fair value measurements | | Total
fair value |
| In millions | Quoted prices in active markets for identical assets (Level 1) | | Significant other observable inputs (Level 2) | | Significant unobservable inputs (Level 3) | |
| Recurring fair value measurements | | | | | | | |
| Assets: | | | | | | | |
| Investments | $ | — | | | $ | 23.5 | | | $ | — | | | $ | 23.5 | |
| Derivative instruments | — | | | 1.6 | | | — | | | 1.6 | |
| Total asset recurring fair value measurements | $ | — | | | $ | 25.1 | | | $ | — | | | $ | 25.1 | |
| Liabilities: | | | | | | | |
| Derivative instruments | $ | — | | | $ | 3.4 | | | $ | — | | | $ | 3.4 | |
| Deferred compensation and other retirement plans | — | | | 25.1 | | | — | | | 25.1 | |
| Total liability recurring fair value measurements | $ | — | | | $ | 28.5 | | | $ | — | | | $ | 28.5 | |
| Financial instruments not carried at fair value | | | | | | | |
| Total debt | $ | — | | | $ | 1,541.4 | | | $ | — | | | $ | 1,541.4 | |
| Total financial instruments not carried at fair value | $ | — | | | $ | 1,541.4 | | | $ | — | | | $ | 1,541.4 | |
|
| | | | | | | | | | | | | | | |
| | Fair value measurements | | Total
fair value |
| In millions | Quoted Prices in Active Markets for Identical Assets (Level 1) | | Significant Other Observable Inputs (Level 2) | | Significant Unobservable Inputs (Level 3) | |
| Recurring fair value measurements | | | | | | | |
| Assets: | | | | | | | |
| Interest rate swaps | $ | — |
| | $ | 4.6 |
| | $ | — |
| | $ | 4.6 |
|
| Foreign currency contracts | — |
| | 1.0 |
| | — |
| | 1.0 |
|
| Total asset recurring fair value measurements | $ | — |
| | $ | 5.6 |
| | $ | — |
| | $ | 5.6 |
|
| Liabilities: | | | | | | | |
| Foreign currency contracts | $ | — |
| | $ | 0.3 |
| | $ | — |
| | $ | 0.3 |
|
| Interest rate swaps | — |
| | 0.4 |
| | — |
| | 0.4 |
|
| Deferred compensation plans | — |
| | 16.8 |
| | — |
| | 16.8 |
|
| Total liability recurring fair value measurements | $ | — |
| | $ | 17.5 |
| | $ | — |
| | $ | 17.5 |
|
| Financial instruments not carried at fair value: | | | | | | | |
| Total debt | $ | — |
| | $ | 1,510.6 |
| | $ | — |
| | $ | 1,510.6 |
|
| Total financial instruments not carried at fair value | $ | — |
| | $ | 1,510.6 |
| | $ | — |
| | $ | 1,510.6 |
|
The Company determines the fair value of its financial assets and liabilities using the following methodologies:
•Investments – These instruments include equity mutual funds and corporate bond funds. The fair value is obtained based on observable market prices quoted on public exchanges for similar instruments.
Foreign currency contracts •Derivative instruments– These instruments include foreign currency contracts for non-functional currency balance sheet exposures.exposures, including both those that are and are not designated as cash flow hedges. The fair value of the foreign currency contracts areis determined based on a pricing model that uses spot rates and forward prices from actively quoted currency markets that are readily accessible and observable.
Interest rate swaps – These instruments include forward-starting interest rate swap contracts for $250.0 million of the Company's variable rate debt. The fair value of the derivative instruments are determined based on quoted prices for the Company's swaps, which are not considered an active market.
•Deferred compensation and other retirement plans - These include obligations related to deferred compensation and other retirement plans adjusted for market performance. The fair value is obtained based on observable market prices quoted on public exchanges for similar instruments.
•Debt – These securitiesinstruments are recorded at cost and include senior notes maturing through 2027.2029. The fair value of the long-term debt instruments is obtained based on observable market prices quoted on public exchanges for similar instruments.
The carrying values of cashCash and cash equivalents, accountsAccounts and notes receivable, accountsnet, Accounts payable, Accrued compensation and short-term borrowingsbenefits and Accrued expenses and other current liabilities are a reasonable estimate of their fair value due to the short-term nature of these instruments. As discussed in Note 2, the Company also has investments in debt and equity securities without readily determinable fair values, which are measured at cost minus impairment, if any, plus or minus changes resulting from observable price changes in orderly transactions for identical or similar investments of the same issuer and are qualitatively assessed for impairment indicators at each reporting period. As these investments are considered to be nonrecurring fair value measurements, they are not included in the fair value tables above.
The methodologymethodologies used by the Company to determine the fair value of its financial assets and liabilities at December 31, 20172021, are the same as those used at December 31, 2016. There have been no significant transfers between Level 1 and Level 2 categories.2020.
NOTE 1314 – EQUITY
Ordinary Shares
The reconciliation ofchanges in Ordinary shares isfor the year ended December 31, 2021 were as follows:
|
| | | | |
| In millions | Total |
December 31, 20162020 | 95.391.2 |
|
| Shares issued under incentive plans | 0.60.3 |
|
| Repurchase of ordinary shares | (0.8(3.3) | ) |
December 31, 20172021 | 95.188.2 |
|
Allegion had 400.0 million ordinary shares authorized and 10.0 million $0.001 par value preferred shares authorized (with none outstanding) at December 31, 2017.2021.
OnIn February 2, 2017,2020, the Company's Board of Directors approved a new stockshare repurchase authorization of up to, $500and including, $800 million of the Company's ordinary shares. This new stock repurchase authorization replaced the authorization established in 2014.shares (the "2020 Share Repurchase Authorization"). The 2020 Share Repurchase Authorization does not have a prescribed expiration date. During the year ended December 31, 2017,2021, the Company paid $60.0$412.8 million to repurchase 0.83.3 million ordinary shares on the open market under this new repurchase authorization.the 2020 Share Repurchase Authorization. As of December 31, 2021, the Company has approximately $201.4 million still available to be repurchased under the 2020 Share Repurchase Authorization.
Accumulated Other Comprehensive Income (Loss)Loss
The changes in Accumulated other comprehensive income (loss) areloss were as follows:
| | | | | | | | | | | | | | | | | | | | | | | | | | |
| In millions | | Cash flow hedges | | Pension and OPEB items | | Foreign currency items | | Total |
| December 31, 2018 | | $ | 6.1 | | | $ | (123.2) | | | $ | (106.4) | | | $ | (223.5) | |
Other comprehensive (loss) income, net of tax(a) | | (5.6) | | | (3.0) | | | 13.5 | | | 4.9 | |
| December 31, 2019 | | 0.5 | | | (126.2) | | | (92.9) | | | (218.6) | |
Other comprehensive (loss) income, net of tax(b) | | (1.4) | | | 5.9 | | | 57.0 | | | 61.5 | |
| December 31, 2020 | | (0.9) | | | (120.3) | | | (35.9) | | | (157.1) | |
| Other comprehensive income (loss), net of tax | | 1.8 | | | 24.3 | | | (63.4) | | | (37.3) | |
| December 31, 2021 | | $ | 0.9 | | | $ | (96.0) | | | $ | (99.3) | | | $ | (194.4) | |
(a)During 2019, the Company reclassified $26.2 million of accumulated foreign currency translation adjustments to earnings upon the sale of the Company's business operations in Colombia and Turkey, which is included in Foreign currency items in the table above. See Note 8 for further information on these divestitures.
|
| | | | | | | | | | | | | | | | |
| In millions | | Cash flow hedges and marketable securities | | Pension and OPEB Items | | Foreign Currency Items | | Total |
| December 31, 2014 | | $ | 15.7 |
| | $ | (116.1 | ) | | $ | (47.8 | ) | | $ | (148.2 | ) |
| Other comprehensive loss, net of tax | | (1.7 | ) | | (23.2 | ) | | (59.1 | ) | | (84.0 | ) |
| December 31, 2015 | | $ | 14.0 |
| | $ | (139.3 | ) | | $ | (106.9 | ) | | $ | (232.2 | ) |
| Other comprehensive (loss) income, net of tax | | (10.6 | ) | | 18.8 |
| | (40.3 | ) | | (32.1 | ) |
| December 31, 2016 | | $ | 3.4 |
| | $ | (120.5 | ) | | $ | (147.2 | ) | | $ | (264.3 | ) |
| Other comprehensive income (loss), net of tax | | 0.4 |
| | 19.3 |
| | 98.1 |
| | 117.8 |
|
Other(a) | | — |
| | (6.4 | ) | | — |
| | (6.4 | ) |
| December 31, 2017 | | $ | 3.8 |
| | $ | (107.6 | ) | | $ | (49.1 | ) | | $ | (152.9 | ) |
| |
(a) | During 2017, the Company reclassified $6.4 million between Accumulated other comprehensive loss and Retained earnings to correct a prior period classification error of Pension and OPEB items. The Company does not believe this reclassification is material to 2017 or to any of its previously issued annual or interim financial statements. |
(b)During 2020, the Company reclassified $12.8 million of accumulated foreign currency translation adjustments to earnings upon the liquidation of two legal entities in the Company's former EMEA segment, which is included in Foreign currency items in the table above.
TheAll amounts of Other comprehensive income (loss), net attributable to noncontrolling interests are as follows:on the Consolidated Statements of Equity relate to foreign currency items.
|
| | | | | | | | | | | | |
| In millions | | 2017 | | 2016 | | 2015 |
| Foreign currency items | | $ | (0.6 | ) | | $ | (0.4 | ) | | $ | (1.4 | ) |
| Total other comprehensive loss attributable to noncontrolling interests | | $ | (0.6 | ) | | $ | (0.4 | ) | | $ | (1.4 | ) |
NOTE 1415 – SHARE-BASED COMPENSATION
The Company records share-based compensation awards using a fair value method and recognizes compensation expense for an amount equal to the fair value of the share-based payment issued in its financial statements. The Company’s share-based compensation plans include programs for stock options, restricted stock units ("RSUs"), performance stock units ("PSUs"), and deferred compensation.
Under the Company's incentive stock plan, the total number of ordinary shares authorized by the shareholders is 8.0 million,, of which 3.4which 2.6 million remainremain available as of December 31, 20172021 for future incentive awards.
Compensation Expense
Share-based compensation expense is included in Cost of goods sold and Selling and administrative expenses.expenses within the Consolidated Statements of Comprehensive Income. The following table summarizes the expenses recognized for the years ended December 31:
| | | | | | | | | | | | | | | | | | | | |
| In millions | | 2021 | | 2020 | | 2019 |
| Stock options | | $ | 3.9 | | | $ | 3.8 | | | $ | 3.5 | |
| RSUs | | 13.6 | | | 11.4 | | | 10.0 | |
| PSUs | | 5.9 | | | 5.6 | | | 6.9 | |
| Deferred compensation | | 2.1 | | | 2.4 | | | 3.2 | |
| Pre-tax expense | | 25.5 | | | 23.2 | | | 23.6 | |
Tax benefit(a) | | (3.0) | | | (2.9) | | | (3.0) | |
| After-tax expense | | $ | 22.5 | | | $ | 20.3 | | | $ | 20.6 | |
(a)Tax benefit reflected in the table above does not include the excess benefit from exercises and vesting of share-based compensation of $2.1 million, $4.5 million and $2.8 million for the years ended December 31, 2021, 2020 and 2019, respectively. |
| | | | | | | | | | | | |
| In millions | | 2017 | | 2016 | | 2015 |
| Stock options | | $ | 3.3 |
| | $ | 4.1 |
| | $ | 3.7 |
|
| RSUs | | 7.0 |
| | 7.7 |
| | 5.8 |
|
| PSUs | | 5.8 |
| | 4.8 |
| | 5.0 |
|
| Deferred compensation | | 2.8 |
| | 0.8 |
| | 0.3 |
|
| Pre-tax expense | | 18.9 |
| | 17.4 |
| | 14.8 |
|
| Tax benefit | | (6.4 | ) | | (5.6 | ) | | (4.4 | ) |
| Total | | $ | 12.5 |
| | $ | 11.8 |
| | $ | 10.4 |
|
Stock Options / RSUs
Eligible participants may receive (i) stock options, (ii) RSUs or (iii) a combination of both stock options and RSUs. The fair value of each of the Company’s stock option and RSU awards is expensed on a straight-line basis over the required service period, which is generally the 3-year vesting period. However, for stock options and RSUs granted to retirement eligible employees, the Company recognizes expense for the fair value at the grant date.
The average fair value of the stock options granted for the yearyears ended December 31, 20172021, 2020 and 20162019, was estimated to be $18.22 per share$24.99, $25.62 and $15.86$19.58 per share, respectively, using the Black-Scholes option-pricing model. The weighted averageweighted-average assumptions used were the following:as follows:
| | | | | | | | | | | | | | | | | | | | |
| | 2021 | | 2020 | | 2019 |
| Dividend yield | | 1.32 | % | | 0.99 | % | | 1.23 | % |
| Volatility | | 27.14 | % | | 20.70 | % | | 21.44 | % |
| Risk-free rate of return | | 0.75 | % | | 1.41 | % | | 2.53 | % |
| Expected life | | 6.0 years | | 6.0 years | | 6.0 years |
|
| | | | | | | | | |
| | | 2017 | | 2016 | | 2015 |
| Dividend yield | | 0.89 | % | | 0.83 | % | | 0.69 | % |
| Volatility | | 24.93 | % | | 28.85 | % | | 31.37 | % |
| Risk-free rate of return | | 2.08 | % | | 1.38 | % | | 1.78 | % |
| Expected life | | 6.0 years |
| | 6.0 years |
| | 6.0 years |
|
Expected volatilityVolatility is based on the weighted average of the implied volatility of a group of the Company’s peers.Company's historic volatility. The risk-free rate of return is based on the yield curve of a zero-coupon U.S. Treasury bond on the date the award is granted with a maturity equal to the expected term of the award. Historical peer data is used to estimate forfeitures within the Company’s valuation model. The expected life of the Company’s stock option awards granted post separation is derived from the simplified approach based
on the weighted averageweighted-average time to vest and the remaining contractual term and represents the period of time that awards are expected to be outstanding.
Changes in options outstanding under the plans for the years ended December 31, 2017, 20162021, 2020 and 2015 are2019, were as follows:
| | | | | | | | | | | | | | | | | | | | | | | | | | |
| | Shares
subject
to option | | Weighted- average exercise price(a) | | Aggregate
intrinsic
value (millions) | | Weighted-average
remaining life (years) |
| December 31, 2018 | | 957,198 | | | $ | 56.71 | | | | | |
| Granted | | 195,675 | | | 88.07 | | | | | |
| Exercised | | (272,003) | | | 42.97 | | | | | |
| Canceled | | (17,248) | | | 85.22 | | | | | |
| | | | | | | | |
| December 31, 2019 | | 863,622 | | | 67.57 | | | | | |
| Granted | | 161,600 | | | 129.26 | | | | | |
| Exercised | | (256,704) | | | 52.89 | | | | | |
| Canceled | | (8,376) | | | 107.23 | | | | | |
| | | | | | | | |
| December 31, 2020 | | 760,142 | | | 85.18 | | | | | |
| Granted | | 179,743 | | | 109.14 | | | | | |
| Exercised | | (156,063) | | | 66.98 | | | | | |
| Canceled | | (26,042) | | | 109.36 | | | | | |
| | | | | | | | |
| | | | | | | | |
| Outstanding December 31, 2021 | | 757,780 | | | $ | 93.76 | | | $ | 29.3 | | | 6.6 |
| Exercisable December 31, 2021 | | 439,997 | | | $ | 80.83 | | | $ | 22.7 | | | 5.4 |
|
| | | | | | | | | | | | | |
| | | Shares subject to option | | Weighted- average exercise price (a) | | Aggregate intrinsic value (millions) | | Weighted- average remaining life (years) |
| December 31, 2014 | | 1,962,028 |
| | $ | 28.11 |
| | | | |
| Granted | | 220,679 |
| | 57.85 |
| | | | |
| Exercised | | (575,564 | ) | | 22.98 |
| | | | |
| Canceled | | (14,976 | ) | | 47.28 |
| | | | |
| December 31, 2015 | | 1,592,167 |
| | 33.91 |
| | | | |
| Granted | | 231,521 |
| | 57.91 |
| | | | |
| Exercised | | (447,019 | ) | | 26.04 |
| | | | |
| Canceled | | (63,599 | ) | | 53.40 |
| | | | |
| December 31, 2016 | | 1,313,070 |
| | 39.87 |
| | | | |
| Granted | | 165,113 |
| | 71.84 |
| | | | |
| Exercised | | (410,397 | ) | | 31.54 |
| | | | |
| Canceled | | (15,906 | ) | | 60.84 |
| | | | |
| Outstanding December 31, 2017 | | 1,051,880 |
| | $ | 47.80 |
| | $ | 33.4 |
| | 6.0 |
| Exercisable December 31, 2017 | | 696,929 |
| | $ | 39.46 |
| | $ | 27.9 |
| | 4.8 |
| |
(a) | The weighted average exercise price of awards represents the exercise price of the awards on the grant date converted to ordinary shares of the Company. |
(a)The weighted-average exercise price of awards represents the exercise price of the awards on the grant date converted to ordinary shares of the Company.
The following table summarizes information concerning currently outstanding and exercisable options:
| | | | | | | | | | | | | | | | | | | | | | | | | | | | | | | | | | | | | | | | | | | | | | | | | | |
| | | | | | | Options outstanding | | Options exercisable |
Range of
exercise price | | Number
outstanding at
December 31,
2021 | | Weighted-
average
remaining
life (years) | | Weighted-
average
exercise
price | | Number
exercisable at
December 31,
2021 | | Weighted-
average
remaining
life (years) | | Weighted-
average
exercise
price |
| $ | 0.01 | | | — | | $ | 25.00 | | | 1,275 | | | 0.2 | | $ | 24.95 | | | 1,275 | | | 0.2 | | $ | 24.95 | |
| 25.01 | | | — | | 50.00 | | | 14,242 | | | 1.1 | | 33.77 | | | 14,242 | | | 1.1 | | 33.77 | |
| 50.01 | | | — | | 75.00 | | | 179,313 | | | 4.2 | | 64.62 | | | 179,313 | | | 4.2 | | 64.62 | |
| 75.01 | | | — | | 100.00 | | | 253,153 | | | 6.4 | | 87.61 | | | 196,802 | | | 6.3 | | 87.47 | |
| 100.01 | | | — | | 125.00 | | | 162,848 | | | 9.1 | | 109.12 | | | 130 | | | 8.4 | | 100.68 | |
| 125.01 | | | — | | 150.00 | | | 146,949 | | | 7.8 | | 129.33 | | | 48,235 | | | 7.7 | | 129.33 | |
| | | | | | | | | | | | | | | | |
| | | | | | | | | | | | | | | | |
| | | | | | 757,780 | | | 6.6 | | $ | 93.76 | | | 439,997 | | | 5.4 | | $ | 80.83 | |
|
| | | | | | | | | | | | | | | | | | | | | | | | | | | |
| | | | | | | Options outstanding | | Options exercisable |
Range of exercise price | | Number
outstanding at
December 31,
2017 | | Weighted- average remaining life (years) | | Weighted- average exercise price | | Number
exercisable at
December 31,
2017 | | Weighted- average remaining life (years) | | Weighted- average exercise price |
| $ | 10.01 |
| | — | | $ | 20.00 |
| | 88,965 |
| | 1.5 | | $ | 15.17 |
| | 88,965 |
| | 1.5 |
| | $ | 15.17 |
|
| 20.01 |
| | — | | 30.00 |
| | 149,055 |
| | 2.6 | | 26.62 |
| | 149,055 |
| | 2.6 |
| | 26.62 |
|
| 30.01 |
| | — | | 40.00 |
| | 82,043 |
| | 4.7 | | 32.33 |
| | 82,043 |
| | 4.7 |
| | 32.33 |
|
| 40.01 |
| | — | | 50.00 |
| | 128,503 |
| | 6.0 | | 43.37 |
| | 128,503 |
| | 6.0 |
| | 43.37 |
|
| 50.01 |
| | — | | 60.00 |
| | 442,663 |
| | 7.1 | | 56.92 |
| | 248,295 |
| | 6.7 |
| | 56.19 |
|
| 60.01 |
| | — | | 70.00 |
| | 421 |
| | 8.8 | | 63.93 |
| | — |
| | — |
| | — |
|
| 70.01 |
| | — | | 80.00 |
| | 160,230 |
| | 9.0 | | 71.84 |
| | 68 |
| | 2.7 |
| | 71.35 |
|
|
| |
| |
|
| | 1,051,880 |
| | 6.0 | | $ | 47.80 |
| | 696,929 |
| | 4.8 |
| | $ | 39.46 |
|
At December 31, 2017,2021, there was $2.4$1.5 million of total unrecognized compensation cost from stock option arrangements granted under the plan, which is primarily related to unvested shares of non-retirement eligible employees. The aggregate intrinsic value of the Company's options exercised during the yearyears ended December 31, 20172021 and 20162020, was $17.5$10.5 million and $18.3$18.8 million,, respectively. Generally, stock options expire ten years from their date of grant.
The following table summarizes RSU activity for the years ended December 31, 2017, 20162021, 2020 and 2015:2019:
| | | | | | | | | | | | | | |
| | RSUs | | Weighted-average grant date fair value(a) |
| Outstanding and unvested at December 31, 2018 | | 244,347 | | | $ | 76.51 | |
| Granted | | 134,518 | | | 91.75 | |
| Vested | | (118,060) | | | 73.52 | |
| Canceled | | (24,286) | | | 79.53 | |
| Outstanding and unvested at December 31, 2019 | | 236,519 | | | 86.37 | |
| Granted | | 81,796 | | | 124.91 | |
| Vested | | (113,776) | | | 85.40 | |
| Canceled | | (9,249) | | | 91.73 | |
| Outstanding and unvested at December 31, 2020 | | 195,290 | | | 102.52 | |
| Granted | | 134,543 | | | 112.75 | |
| Vested | | (124,347) | | | 100.52 | |
| Canceled | | (10,083) | | | 109.31 | |
| Outstanding and unvested at December 31, 2021 | | 195,403 | | | $ | 112.35 | |
(a)The weighted-average grant date fair value represents the fair value of the awards on the grant date converted to ordinary shares of the Company. |
| | | | | | | |
| | | RSUs | | Weighted- average grant date fair value (a) |
| Outstanding and unvested at December 31, 2014 | | 325,160 |
| | $ | 42.15 |
|
| Granted | | 121,153 |
| | 59.69 |
|
| Vested | | (92,029 | ) | | 36.63 |
|
| Canceled | | (9,354 | ) |
| 49.32 |
|
| Outstanding and unvested at December 31, 2015 | | 344,930 |
| | 49.59 |
|
| Granted | | 123,299 |
| | 59.49 |
|
| Vested | | (220,854 | ) | | 45.83 |
|
| Canceled | | (41,741 | ) | | 52.40 |
|
| Outstanding and unvested at December 31, 2016 | | 205,634 |
| | 58.99 |
|
| Granted | | 124,933 |
| | 73.76 |
|
| Vested | | (90,523 | ) | | 58.78 |
|
| Canceled | | (10,038 | ) | | 60.47 |
|
| Outstanding and unvested at December 31, 2017 | | 230,006 |
| | $ | 66.83 |
|
| |
(a) | The weighted average grant date fair value represents the fair value of the awards on the grant date converted to ordinary shares of the Company. |
At December 31, 2017,2021, there was $6.5$6.5 million of total unrecognized compensation cost from RSU arrangements granted under the plan, which is primarily related to unvested shares of non-retirement eligible employees.
Performance SharesStock
The Company has a Performance Share Program ("PSP") for key employees which provides awards in the form of Performance Share Units ("PSU") based on performance against pre-established objectives. The annual target award level is expressed as a number of the Company's ordinary shares. All PSUs are settled in the form of ordinary shares unless deferred.
In February 2015, 20162019, 2020 and 2017,2021, the Company's Compensation Committee granted PSUs that were earned based 50% upon a performance condition, measured at each reporting period by earnings per share ("EPS") performance in relation to pre-established targets set by the Compensation Committee, and 50% upon a market condition, measured by the Company’s relative total shareholder return ("TSR") against the S&P 400 Capital Goods Index over a three-year performance period based on the change in the 30 day average price for the grant year index to the 30 day average price for the index over the performance period. The fair values of the market conditions are estimated using a Monte Carlo simulation approach in a risk-neutral framework to model future stock price movements based upon historical volatility, risk-free rates of return and correlation matrix.
The following table summarizes PSU activity for the maximum number of shares that may be issued for the years ended December 31, 2017, 20162021, 2020 and 2015:2019:
| | | | | | | | | | | | | | |
| | PSUs | | Weighted-average grant date fair value(a) |
| Outstanding and unvested at December 31, 2018 | | 156,041 | | | $ | 65.07 | |
| Granted | | 68,125 | | | 87.02 | |
| Vested | | (56,773) | | | 61.00 | |
| Forfeited | | (10,045) | | | 68.63 | |
| Outstanding and unvested at December 31, 2019 | | 157,348 | | | 75.82 | |
| Granted | | 92,913 | | | 113.54 | |
| Vested | | (101,638) | | | 83.16 | |
| Forfeited | | (2,647) | | | 121.43 | |
| Outstanding and unvested at December 31, 2020 | | 145,976 | | | 93.89 | |
| Granted | | 92,717 | | | 109.53 | |
| Vested | | (80,194) | | | 100.26 | |
| Forfeited | | (13,332) | | | 115.92 | |
| Outstanding and unvested at December 31, 2021 | | 145,167 | | | $ | 98.34 | |
(a)The weighted-average grant date fair value represents the fair value of the awards on the grant date converted to ordinary shares of the Company.
|
| | | | | | | |
| | | PSUs | | Weighted-average grant date fair value (a) |
| Outstanding and unvested at December 31, 2014 | | 161,132 |
| | $ | 57.39 |
|
| Granted | | 58,323 |
| | 66.47 |
|
| Vested | | (17,327 | ) | | 75.05 |
|
| Forfeited | | (85 | ) | | 75.05 |
|
| Outstanding and unvested at December 31, 2015 | | 202,043 |
| | 64.92 |
|
| Granted | | 94,201 |
| | 64.83 |
|
| Vested | | (64,979 | ) | | 72.69 |
|
| Forfeited | | (21,661 | ) | | 57.07 |
|
| Outstanding and unvested at December 31, 2016 | | 209,604 |
| | 56.02 |
|
| Granted | | 99,832 |
| | 78.13 |
|
| Vested | | (146,830 | ) | | 72.01 |
|
| Forfeited | | (1,783 | ) | | 67.10 |
|
| Outstanding and unvested at December 31, 2017 | | 160,823 |
| | $ | 55.02 |
|
| |
(a) | The weighted average grant date fair value represents the fair value of the awards on the grant date converted to ordinary shares of the Company. |
At December 31, 2017,2021, there was $4.2$6.3 million of total unrecognized compensation cost from the PSP based on current performance, which is related to unvested shares. This compensation will be recognized over the required service period, which is generally the three-year vesting period.
Deferred Compensation
ThePrior to 2019, the Company allowsallowed key employees to defer a portion of their eligible granted PSUs and/or compensation into a number of investment choices including its ordinary share equivalents. Any amounts invested in ordinary share equivalents will be settled in ordinary shares of the Company at the time of distribution.
NOTE 1516 – RESTRUCTURING ACTIVITIES
During2017, 2016, and 2015, the Company incurred costs of $12.3 million, $3.1 million, and $15.1 million respectively, associated with restructuring actions. These actions included workforce reductions, costs associated with the exit of an immaterial product line, and the closure and consolidation of manufacturing facilities in an effort to increase efficiencies.
Restructuring charges recorded during the years ended December 31, as part2021, 2020 and 2019, the Company recorded $4.3 million, $25.6 million and $16.5 million, respectively, of expenses associated with restructuring plansactivities. Restructuring activities in each period were as follows:primarily associated with the Allegion International segment and related to workforce reductions intended to optimize and simplify operations and cost structure, although approximately $9 million of the restructuring charges incurred during the year ended December 31, 2020, related to the Allegion Americas segment and Corporate. Restructuring expenses for each of the three years ended December 31, 2021, 2020 and 2019, are primarily included within Cost of goods sold and Selling and administrative expenses, although $1.9 million of the 2019 restructuring charges related to pension curtailment costs and are included within Other (income) expense, net within the Consolidated Statements of Comprehensive Income.
|
| | | | | | | | | | | | |
| In millions | | 2017 | | 2016 | | 2015 |
| Americas | | $ | 5.5 |
| | $ | 2.0 |
| | $ | — |
|
| EMEIA | | 6.2 |
| | 0.9 |
| | 14.7 |
|
| Asia Pacific | | — |
| | 0.2 |
| | 0.4 |
|
| Corporate and Other | | 0.6 |
| | — |
| | — |
|
| Total | | $ | 12.3 |
| | $ | 3.1 |
| | $ | 15.1 |
|
| | | | | | | |
| Cost of goods sold | | $ | 5.8 |
| | $ | 0.9 |
| | $ | 13.6 |
|
| Selling and administrative expenses | | 6.5 |
| | 2.2 |
| | 1.5 |
|
| Total | | $ | 12.3 |
| | $ | 3.1 |
| | $ | 15.1 |
|
The changes in the restructuring reserve during the years ended December 31, 20172021 and 20162020, were as follows:
|
| | | | | | | | | | | | | | | | | | | | |
| In millions | | Americas | | EMEIA | | Asia Pacific | | Corporate/Other | | Total |
| December 31, 2015 | | $ | — |
| | $ | 10.0 |
| | $ | 0.2 |
| | $ | — |
| | $ | 10.2 |
|
| Additions | | 2.0 |
| | 0.9 |
| | 0.2 |
| | — |
| | 3.1 |
|
| Cash and non-cash uses | | (1.7 | ) | | (7.5 | ) | | (0.4 | ) | | — |
| | (9.6 | ) |
| Currency translation | | — |
| | (0.2 | ) | | — |
| | — |
| | (0.2 | ) |
| December 31, 2016 | | 0.3 |
| | 3.2 |
| | — |
| | — |
| | 3.5 |
|
| Additions | | 5.5 |
| | 6.2 |
| | — |
| | 0.6 |
| | 12.3 |
|
| Cash and non-cash uses | | (5.5 | ) | | (5.8 | ) | | — |
| | (0.5 | ) | | (11.8 | ) |
| Currency translation | | — |
| | 0.2 |
| | — |
| | — |
| | 0.2 |
|
| December 31, 2017 | | $ | 0.3 |
| | $ | 3.8 |
| | $ | — |
| | $ | 0.1 |
| | $ | 4.2 |
|
The Company incurred other non-qualified restructuring charges of $1.5 million and $6.4 million during the years ended December 31, 2017 and 2016, respectively, in conjunction with the other restructuring plans, which represent costs that are directly attributable to restructuring activities, but do not fall into the severance, exit or disposal category.
| | | | | | | | | | | | | |
| In millions | | | | | | | | | Total |
| December 31, 2019 | | | | | | | | | $ | 1.2 | |
| Additions, net of reversals | | | | | | | | | 25.0 | |
| Cash payments | | | | | | | | | (21.3) | |
| Currency translation | | | | | | | | | 0.4 | |
| December 31, 2020 | | | | | | | | | 5.3 | |
| Additions, net of reversals | | | | | | | | | 3.8 | |
| Cash payments | | | | | | | | | (8.6) | |
| Currency translation | | | | | | | | | (0.1) | |
| December 31, 2021 | | | | | | | | | $ | 0.4 | |
The majority of the costs accrued as of December 31, 20172021, will be paid within one year.
The Company also incurred other non-qualified restructuring charges of $0.8 million, $1.2 million and $5.7 million during the years ended December 31, 2021, 2020 and 2019, respectively, which represent costs directly attributable to restructuring activities, but that do not fall into the severance, exit or disposal category. Non-qualified restructuring charges are included within Cost of goods sold and Selling and administrative expenses within the Consolidated Statements of Comprehensive Income.
NOTE 1617 – OTHER INCOME,(INCOME) EXPENSE, NET
At December 31, the components of Other income,(income) expense, net were as follows:
| | | In millions | | 2017 | | 2016 | | 2015 | In millions | | 2021 | | 2020 | | 2019 |
| Interest income | | $ | (1.2 | ) | | $ | (1.9 | ) | | $ | (1.5 | ) | Interest income | | $ | (0.4) | | | $ | (0.9) | | | $ | (1.8) | |
| Exchange loss | | 0.7 |
| | 2.0 |
| | 4.9 |
| |
| (Earnings) loss from and (gains) on the sale of equity investments | | (5.4 | ) | | (3.6 | ) | | 0.3 |
| |
| Foreign currency exchange loss | | Foreign currency exchange loss | | 2.7 | | | 0.7 | | | 1.8 | |
| (Earnings and gains from the sale of) losses from equity method investments, net | | (Earnings and gains from the sale of) losses from equity method investments, net | | (6.4) | | | (0.3) | | | 0.1 | |
| Net periodic pension and postretirement benefit (income) cost, less service cost | | Net periodic pension and postretirement benefit (income) cost, less service cost | | (7.1) | | | (2.2) | | | 6.8 | |
| Other | | (7.3 | ) | | (14.7 | ) | | (11.5 | ) | Other | | (32.8) | | | (10.3) | | | (3.1) | |
| Other income, net | | $ | (13.2 | ) | | $ | (18.2 | ) | | $ | (7.8 | ) | |
| Other (income) expense, net | | Other (income) expense, net | | $ | (44.0) | | | $ | (13.0) | | | $ | 3.8 | |
Other income,(income) expense, net for the year ended December 31, 20172021, included unrealized gains related to the Company's investments in debt and equity securities of $25.6 million, the largest of which was a gain of $5.4$20.7 million fromrelated to the salefair value remeasurement of iDevices, LLC, which isthe Company's investment in VergeSense, Inc. upon an observable price change in an orderly external
funding round. These gains are included within the (Earnings) loss from and (gains) on the sale of equity investmentsOther in the table above. Other income,(income) expense, net for the year ended December 31, 20172021, also included a gain of $6.4 million from the sale of the Company's equity method investment in Nuki Home Solutions GmbH.
Other (income) expense, net for the year ended December 31, 2020, included gains of $7.3$12.8 million related to the reclassification to earnings of accumulated foreign currency translation adjustments upon the liquidation of two legal entity liquidationsentities in our Asia Pacific region, of which $2.2 million has been attributed to noncontrolling interests.the Company's former EMEA segment. These gains are included within Other in the table above.
During the year ended December 31, 2016 the Company recorded gains from the sale of marketable securities of $12.4 million, which is included within Other in the table above.
During the year ended December 31, 2015, the Company recorded gains from the sale of marketable securities of $11.0 million, which is included within Other in the table above. In February 2015, the Venezuelan government announced changes to its exchange rate system that included the launch of a new, market-based system called the Marginal Currency System, or "SIMADI." During the year ended December 31, 2015 the Company recorded a charge of $2.8 million in order to remeasure net monetary assets at the SIMADI rate and other unfavorable currency impacts. These losses are within Exchange loss in the table above.
NOTE 1718 – INCOME TAXES
Earnings before income taxes for the years ended December 31 were taxed within the following jurisdictions:
| | | | | | | | | | | | | | | | | | | | |
| In millions | | 2021 | | 2020 | | 2019 |
| U.S. | | $ | 74.5 | | | $ | 151.4 | | | $ | 211.1 | |
| Non-U.S. | | 449.5 | | | 214.0 | | | 264.1 | |
| Total | | $ | 524.0 | | | $ | 365.4 | | | $ | 475.2 | |
The jurisdictional mix of earnings, which includes the impact of the location of earnings as well as the tax cost on the Company's international operations, can vary as a result of operating fluctuations in the normal course of business, the impact of internal restructurings and as a result of the extent and location of other income and expense items, such as restructuring charges, asset impairments and gains or losses on strategic business decisions. |
| | | | | | | | | | | | |
| In millions | | 2017 | | 2016 | | 2015 |
| United States | | $ | 166.5 |
| | $ | 129.9 |
| | $ | 123.1 |
|
| Non-U.S. | | 229.2 |
| | 165.1 |
| | 86.2 |
|
| Total | | $ | 395.7 |
| | $ | 295.0 |
| | $ | 209.3 |
|
The components of the Provision for income taxes for the years ended December 31 were as follows:
| | | In millions | | 2017 | | 2016 | | 2015 | In millions | | 2021 | | 2020 | | 2019 |
| Current tax expense: | | | | | | | Current tax expense: | | | | | | |
| United States | | $ | 78.8 |
| | $ | 43.8 |
| | $ | 53.4 |
| |
| U.S. | | U.S. | | $ | 57.4 | | | $ | 55.0 | | | $ | 87.1 | |
| Non-U.S. | | 15.0 |
| | 13.8 |
| | 3.5 |
| Non-U.S. | | 27.1 | | | 20.3 | | | 16.2 | |
| Total: | | 93.8 |
| | 57.6 |
| | 56.9 |
| Total: | | 84.5 | | | 75.3 | | | 103.3 | |
| Deferred tax expense (benefit): | | | | | | | |
| United States | | 41.2 |
| | 14.4 |
| | 2.1 |
| |
| Deferred tax benefit: | | Deferred tax benefit: | |
| U.S. | | U.S. | | (38.3) | | | (13.4) | | | (25.2) | |
| Non-U.S. | | (16.0 | ) | | (8.2 | ) | | (4.4 | ) | Non-U.S. | | (5.5) | | | (11.0) | | | (5.0) | |
| Total: | | 25.2 |
| | 6.2 |
| | (2.3 | ) | Total: | | (43.8) | | | (24.4) | | | (30.2) | |
| Total tax expense (benefit): | | | | | | | |
| United States | | 120.0 |
| | 58.2 |
| | 55.5 |
| |
| Total tax expense: | | Total tax expense: | |
| U.S. | | U.S. | | 19.1 | | | 41.6 | | | 61.9 | |
| Non-U.S. | | (1.0 | ) | | 5.6 |
| | (0.9 | ) | Non-U.S. | | 21.6 | | | 9.3 | | | 11.2 | |
| Total | | $ | 119.0 |
| | $ | 63.8 |
| | $ | 54.6 |
| Total | | $ | 40.7 | | | $ | 50.9 | | | $ | 73.1 | |
The Provision for income taxes differs from the amount of income taxes determined by applying the applicable U.S. statutory income tax rate to pretax income, as a result of the following differences:
| | | | | | | | | | | | | | | | | | | | |
| | | Percent of pretax income |
| | | 2021 | | 2020 | | 2019 |
| Statutory U.S. rate | | 21.0 | % | | 21.0 | % | | 21.0 | % |
| Increase (decrease) in rates resulting from: | | | | | | |
Non-U.S. tax rate differential (1) | | (14.1) | | | (17.5) | | | (10.6) | |
| | | | | | |
State and local income taxes (1) | | 1.1 | | | 2.4 | | | 3.0 | |
| | | | | | |
| Reserves for uncertain tax positions | | 0.3 | | | 1.1 | | | 0.5 | |
| Tax on unremitted earnings | | (0.1) | | | (0.1) | | | 0.1 | |
| | | | | | |
| Trade incentives | | — | | | — | | | 0.2 | |
| Impairment of goodwill and intangible assets | | — | | | 7.3 | | | — | |
| Impact of divestitures | | — | | | — | | | 1.6 | |
| Other adjustments | | (0.4) | | | (0.3) | | | (0.4) | |
| Effective tax rate | | 7.8 | % | | 13.9 | % | | 15.4 | % |
(1)Net of changes in valuation allowances
|
| | | | | | | | | |
| | | Percent of pretax income |
| | | 2017 | | 2016 | | 2015 |
| Statutory U.S. rate | | 35.0 | % | | 35.0 | % | | 35.0 | % |
| Increase (decrease) in rates resulting from: | | | | | | |
| Non-U.S. tax rate differential (1) | | (20.0 | ) | | (17.4 | ) | | (11.1 | ) |
| State and local income taxes (1) | | 1.8 |
| | 2.0 |
| | 2.8 |
|
| Reserves for uncertain tax positions | | 0.8 |
| | 2.0 |
| | (3.4 | ) |
| Tax on unremitted earnings | | 0.8 |
| | 1.2 |
| | 1.5 |
|
| Tax Reform Act | | 13.5 |
| | — |
| | — |
|
| Venezuela devaluation | | — |
| | — |
| | 0.9 |
|
| Production incentives | | (0.9 | ) | | (0.6 | ) | | (1.0 | ) |
| Other adjustments | | (0.9 | ) | | (0.6 | ) | | 1.4 |
|
| Effective tax rate | | 30.1 | % | | 21.6 | % | | 26.1 | % |
| |
(1) | Net of changes in valuation allowances |
On December 22, 2017, the Tax Reform Act became law, resulting in broad and complex changes to the U.S. tax code which impact the Company's consolidated financial statements during the year ended December 31, 2017 including, but not limited to (1) reducing the U.S. federal corporate tax rate, (2) requiring a one-time transition tax on certain unrepatriated earnings of non-U.S. subsidiaries that may electively be paid over eight years, and (3) requiring a review of the future realizability of deferred tax balances.
The Tax Reform Act reduces the federal corporate tax rate from 35 percent to 21 percent effective January 1, 2018. The Tax Reform Act also puts in place new tax laws which include, but are not limited to (1) a Base Erosion Anti-abuse Tax (BEAT), which is a new minimum tax, (2) generally eliminating U.S. federal income taxes on dividends from foreign subsidiaries, (3) a provision designed to tax currently global intangible low taxed income (GILTI), (4) a provision that may limit the amount of currently deductible interest expense, (5) the repeal of the domestic production incentives, (6) limitations on the deductibility of certain executive compensation, and (7) limitations on the utilization of foreign tax credits to reduce the U.S. income tax liability.
Shortly after the Tax Reform Act was enacted, the SEC staff issued Staff Accounting Bulletin No. 118, Income Tax Accounting Implications of the Tax Cuts and Jobs Act (SAB 118) which provides guidance on accounting for the Tax Reform Act’s impact. SAB 118 provides a measurement period, which in no case should extend beyond one year from the Tax Reform Act enactment date, during which a company acting in good faith may complete the accounting for the impacts of the Tax Reform Act under ASC Topic 740. In accordance with SAB 118, the company must reflect the income tax effects of the Tax Reform Act in the reporting period in which the accounting under ASC Topic 740 is complete.
To the extent that a company’s accounting for certain income tax effects of the Tax Reform Act is incomplete, the Company can determine a reasonable estimate for those effects and record a provisional estimate in the financial statements in the first reporting period in which a reasonable estimate can be determined. If a company cannot determine a provisional estimate to be included in the financial statements, the company should continue to apply ASC 740 based on the provisions of the tax laws that were in effect immediately prior to the Tax Reform Act being enacted. If a company is unable to provide a reasonable estimate of the impacts of the Tax Reform Act in a reporting period, a provisional amount must be recorded in the first reporting period in which a reasonable estimate can be determined.
The Company has recorded a provisional discrete net tax charge of $53.5 million related to the Tax Reform Act in the year ended December 31, 2017. This net charge primarily consists of a net charge of $24.5 million due to the remeasurement of deferred tax accounts to reflect the corporate rate reduction impact to the Company's net deferred tax balances, a net charge of $22.8 million due to the future realizability of certain deferred tax balances, and a net charge for the transition tax of $5.0 million, as more fully described below.
Reduction in U.S. Corporate Rate: The Tax Reform Act reduces the U.S. federal statutory corporate tax rate to 21 percent in years beginning on or after January 1, 2018. The Company has recorded a provisional adjustment to the net deferred tax balances, with a corresponding discrete net tax charge of $24.5 million in the current period. While the Company can make a reasonable estimate of the impact of the reduction in corporate rate, the Company is continuing to analyze the temporary differences that existed on the date of enactment.
Future Realizability of Certain Deferred Tax Balances: The Tax Reform Act contains provisions that may limit or restrict the future realizability of certain existing deferred tax balances. The Company has recorded a provisional valuation allowance related to interest limitation carryforwards and other adjustments to the net deferred tax assets, with a corresponding discrete net tax charge of $22.8 million in the current period. While the Company can make a reasonable estimate of the valuation allowance, the Company is awaiting further interpretative guidance and is continuing to gather additional information to refine its assessment. To the extent transition rules and interpretative guidance is clarified, some or all of the valuation allowance may reverse in a subsequent period.
Transition Tax: The transition tax is levied on the previously untaxed accumulated and current earnings and profits (E&P) of certain of the Company's foreign subsidiaries. In order to determine the amount of the transition tax, the Company must determine, in addition to other factors, the amount of post-1986 E&P of the relevant subsidiaries, as well as the amount of non-U.S. income taxes paid on such earnings. E&P is similar to retained earnings of the subsidiary, but requires other adjustments to conform to U.S. tax rules. The Company has made a reasonable estimate of the transition tax and recorded a provisional transition tax obligation of $5.0 million which the Company expects to elect to pay over eight years. This amount is presented in current and Other long-term liabilities. However, the Company is awaiting further interpretative guidance, continuing to assess available tax methods and elections, and continuing to gather additional information to more precisely compute the amount of the transition tax.
The majority of the Company's earnings are considered permanently reinvested. The $5.0 million transition tax will result in certain previously untaxed non-U.S. earnings being included inreinvested, and therefore, the U.S. federal and state 2017 taxable income. As a result of the Tax Reform Act, the Company is currently analyzing its global working capital requirements and the potential tax liabilities that would be incurred if certain non-U.S. subsidiaries made distributions, which include local country withholding tax and potential U.S. state taxation. For these reasons, the Company is not yet able to reasonably estimate the effect of this provision of the Tax Reform Act and has not recorded any incremental withholding or stateincome tax liabilities on its investment inearnings of its non-U.S. subsidiaries.
The Company is also currently analyzing other provisions of the Tax Reform Act that come into effect in 2018. These provisions include BEAT, eliminating U.S. federal income taxes on dividends from foreign subsidiaries, the treatment of amounts in accumulated other comprehensive income, the new provision that could limit the amount of deductible interest expense, and the limitations on the deductibility of certain executive compensation.
At December 31, a summary of the deferred tax accounts werewas as follows:
| | | | | | | | | | | | | | |
| In millions | | 2021 | | 2020 |
| Deferred tax assets: | | | | |
| Inventory and accounts receivable | | $ | 6.5 | | | $ | 6.5 | |
| Fixed assets and intangibles | | 3.2 | | | 2.6 | |
| Lease liabilities | | 21.6 | | | 22.0 | |
| Postemployment and other benefit liabilities | | 24.9 | | | 29.9 | |
| | | | |
| Other reserves and accruals | | 12.9 | | | 16.4 | |
| Net operating losses, tax credits and other carryforwards | | 446.0 | | | 386.1 | |
| | | | |
| Other | | 0.6 | | | 1.8 | |
| Gross deferred tax assets | | 515.7 | | | 465.3 | |
| Less: deferred tax valuation allowances | | (265.5) | | | (259.7) | |
| Deferred tax assets net of valuation allowances | | $ | 250.2 | | | $ | 205.6 | |
| Deferred tax liabilities: | | | | |
| | | | |
| Fixed assets and intangibles | | $ | (110.6) | | | $ | (112.0) | |
| Right of use assets | | (21.0) | | | (21.7) | |
| Postemployment and other benefit liabilities | | (13.9) | | | (6.8) | |
| Unremitted earnings of foreign subsidiaries | | (1.9) | | | (1.4) | |
| | | | |
| Other | | (10.3) | | | (5.6) | |
| Gross deferred tax liabilities | | (157.7) | | | (147.5) | |
| Net deferred tax assets | | $ | 92.5 | | | $ | 58.1 | |
|
| | | | | | | | |
| In millions | | 2017 | | 2016 |
| Deferred tax assets: | | | | |
| Inventory and accounts receivable | | $ | 17.0 |
| | $ | 18.3 |
|
| Fixed assets and intangibles | | 2.6 |
| | 2.0 |
|
| Postemployment and other benefit liabilities | | 29.9 |
| | 42.0 |
|
| Other reserves and accruals | | 12.5 |
| | 16.0 |
|
| Net operating losses, tax credits and other carryforwards | | 309.5 |
| | 227.1 |
|
| Other | | 4.2 |
| | 5.3 |
|
| Gross deferred tax assets | | 375.7 |
| | 310.7 |
|
| Less: deferred tax valuation allowances | | (312.9 | ) | | (225.5 | ) |
| Deferred tax assets net of valuation allowances | | $ | 62.8 |
| | $ | 85.2 |
|
| Deferred tax liabilities: | | | | |
| Fixed assets and intangibles | | $ | (101.7 | ) | | $ | (90.6 | ) |
| Postemployment and other benefit liabilities | | (4.7 | ) | | — |
|
| Unremitted earnings of foreign subsidiaries | | (6.0 | ) | | (4.2 | ) |
| Other | | (7.4 | ) | | (6.0 | ) |
| Gross deferred tax liabilities | | (119.8 | ) | | (100.8 | ) |
| Net deferred tax liabilities | | $ | (57.0 | ) | | $ | (15.6 | ) |
At December 31, 2017, $6.02021, $1.9 million of deferred tax wastaxes were recorded for certain undistributed earnings of non-U.S. subsidiaries. Historically, no deferred taxes have been provided for any portion of the remaining undistributed earnings of the Company's subsidiaries since these earnings have been, and will continue to be, permanently reinvested in these subsidiaries. For many reasons, including the number of legal entities and jurisdictions involved, the complexity of the Company's legal entity structure, the complexity of tax laws in the relevant jurisdictions and the impact of projections of income for future years to any calculations, the Company believes it is not practicable to estimate, within any reasonable range, the amount of additional taxes which may be payable upon the distribution of earnings.
At December 31, 2017,2021, the Company had the following tax losses and tax credit carryforwards available to offset taxable income in prior and future years:
|
| | | | | | |
| In millions | | Amount | | Expiration Period |
| U.S. Federal tax loss carryforwards | | $ | 15.1 |
| | 2027 & 2028 |
| U.S. Federal and State credit carryforwards | | 22.2 |
| | 2024-2027 |
| U.S. State tax loss carryforwards | | 29.6 |
| | 2018-2037 |
| Non-U.S. tax loss carryforwards | | $ | 1,013.0 |
| | 2018-Unlimited |
| | | | | | | | | | | | | | |
| In millions | | Amount | | Expiration
Period |
| U.S. Federal tax loss carryforwards | | $ | 17.7 | | | 2027-Unlimited |
| U.S. Federal and State credit carryforwards | | 23.4 | | | 2025-2037 |
| U.S. State tax loss carryforwards | | 52.1 | | | 2022-Unlimited |
| | | | |
| | | | |
| Non-U.S. tax loss carryforwards | | $ | 1,013.7 | | | 2025-Unlimited |
The U.S. state loss carryforwards were incurred in various jurisdictions. The non-U.S. loss carryforwards were incurred in various jurisdictions, predominantly in China, Ireland, Italy, Luxembourg and the United Kingdom.
The Company evaluates its deferred income tax assets to determine if valuation allowances are required or should be adjusted. U.S. GAAP requires that companies assess whether valuation allowances should be established against their deferred tax assets based on consideration of all available evidence, both positive and negative, using a "more likely than not" standard. This assessment considers the nature, frequency and amount of recent losses, the duration of statutory carryforward periods and tax planning strategies. In making such judgments, significant weight is given to evidence that can be objectively verified.
Activity associated with the Company’s valuation allowance is as follows:
| | | In millions | | 2017 | | 2016 | | 2015 | In millions | | 2021 | | 2020 | | 2019 |
| Beginning balance | | $ | 225.5 |
| | $ | 133.3 |
| | $ | 50.8 |
| Beginning balance | | $ | 259.7 | | | $ | 241.0 | | | $ | 357.1 | |
| Increase to valuation allowance | | 96.9 |
| | 109.0 |
| | 82.2 |
| Increase to valuation allowance | | 8.4 | | | 21.1 | | | 2.8 | |
| Decrease to valuation allowance | | (11.9 | ) | | (13.9 | ) | | (3.0 | ) | Decrease to valuation allowance | | (2.0) | | | (2.8) | | | (118.6) | |
| Foreign exchange translation | | 2.4 |
| | (3.3 | ) | | (1.6 | ) | Foreign exchange translation | | (0.6) | | | 0.4 | | | (0.3) | |
| Accumulated other comprehensive income (loss) | | — |
| | 0.4 |
| | 4.9 |
| |
| | Ending balance | | $ | 312.9 |
| | $ | 225.5 |
| | $ | 133.3 |
| Ending balance | | $ | 265.5 | | | $ | 259.7 | | | $ | 241.0 | |
During 2017,the year ended December 31, 2021, the valuation allowance increased by $87.4$5.8 million, while during the year ended December 31, 2020, the valuation allowance increased by $18.7 million. This increase isThe increases for the years ended December 31, 2021 and 2020, are the result of changes in jurisdictional profitability, country specific tax laws, internal restructurings, jurisdictional profitability and changes in judgmentjudgments and facts regarding the realizability of deferred tax assets.
The Company has total unrecognized tax benefits of $29.0$41.5 million and $32.0$41.2 million as of December 31, 2017,2021 and December 31, 2016,2020, respectively. The amount of unrecognized tax benefits that, if recognized, would affect the effective tax rate are $27.4is $40.4 million as of December 31, 2017.2021. A reconciliation of the beginning and ending amount of unrecognized tax benefits is as follows:
| | | | | | | | | | | | | | | | | | | | |
| In millions | | 2021 | | 2020 | | 2019 |
| Beginning balance | | $ | 41.2 | | | $ | 37.3 | | | $ | 42.0 | |
| Additions based on tax positions related to the current year | | 8.8 | | | 6.0 | | | 5.7 | |
| Additions based on tax positions related to prior years | | 3.6 | | | 4.1 | | | 1.7 | |
| Reductions based on tax positions related to prior years | | (2.2) | | | (1.5) | | | (7.0) | |
| Reductions related to settlements with tax authorities | | (3.6) | | | (0.3) | | | (4.0) | |
| Reductions related to lapses of statute of limitations | | (5.6) | | | (5.2) | | | (0.8) | |
| Translation (gain)/loss | | (0.7) | | | 0.8 | | | (0.3) | |
| Ending balance | | $ | 41.5 | | | $ | 41.2 | | | $ | 37.3 | |
|
| | | | | | | | | | | | |
| In millions | | 2017 | | 2016 | | 2015 |
| Beginning balance | | $ | 32.0 |
| | $ | 23.8 |
| | $ | 25.4 |
|
| Additions based on tax positions related to the current year | | 6.4 |
| | 9.1 |
| | 3.9 |
|
| Additions based on tax positions related to prior years | | 1.6 |
| | 7.1 |
| | 1.6 |
|
| Reductions based on tax positions related to prior years | | (5.0 | ) | | (5.5 | ) | | (3.0 | ) |
| Reductions related to settlements with tax authorities | | (7.1 | ) | | (0.6 | ) | | — |
|
| Reductions related to lapses of statute of limitations | | (1.2 | ) | | (0.9 | ) | | (1.4 | ) |
| Translation loss/(gain) | | 2.3 |
| | (1.0 | ) | | (2.7 | ) |
| Ending balance | | $ | 29.0 |
| | $ | 32.0 |
| | $ | 23.8 |
|
The Company records interest and penalties associated with the uncertain tax positions within its Provisionprovision for income taxes. The Company had reserves associated with interest and penalties, net of tax, of $4.9$7.5 million and $5.4$7.6 million at December 31, 20172021 and 2016.2020, respectively. For the years ended December 31, 20172021 and 2016,2020, the Company recognized $0.0$0.5 million and $0.3$1.9 million in net interest and penalties, net of tax, related to these uncertain tax positions.
The total amount of unrecognized tax benefits relating to the Company's tax positions is subject to change based on future events including, but not limited to, the settlements of ongoing audits and/or the expiration of applicable statutes of limitations. Although the outcomes and timing of such events are highly uncertain, it is reasonably possible that the balance of gross unrecognized tax benefits, excluding interest and penalties, could potentially be reduced by up to approximately $10.7$8.7 million during the next 12 months.
The provision for income taxes involves a significant amount of management judgment regarding interpretation of relevant facts and laws in the jurisdictions in which the Company operates. Future changes in applicable laws, projected levels of taxable income and tax planning could change the effective tax rate and tax balances recorded by the Company. In addition, tax authorities periodically review income tax returns filed by the Company and can raise issues regarding its filing positions, timing and amount of income or deductions and the allocation of income among the jurisdictions in which the Company operates. A significant period of time may elapse between the filing of an income tax return and the ultimate resolution of an issue raised by a tax authority with respect to that return. In the normal course of business, the Company is subject to examination by taxing authorities throughout the world, including such major jurisdictions as Australia, Canada, France, Germany, Italy, Mexico, the Netherlands, Poland and the United States.U.S. In general, the examination of the material tax returns of subsidiaries of the Company is complete for the years prior to 2003,2009, with certain matters being resolved through appeals and litigation.
The Company had indemnity receivables in the amount of $5.7 million and $5.6 million included in Other noncurrent assets at December 31, 2017 and 2016, respectively, primarily related to additional competent authority relief filings.
NOTE 1819 – EARNINGS PER SHARE (EPS)
Basic EPS is calculated by dividing Net earnings attributable to Allegion plc by the weighted-average number of ordinary shares outstanding for the applicable period. Diluted EPS is calculated after adjusting the denominator of the basic EPS calculation for the effect of all potentially dilutive ordinary shares, which in the Company’s case, includes shares issuable under share-based compensation plans.
The following table summarizes the weighted-average number of ordinary shares outstanding for basic and diluted earnings per share calculations.calculations:
| | | In millions | | 2017 | | 2016 | | 2015 | In millions | | 2021 | | 2020 | | 2019 |
| Weighted-average number of basic shares | | 95.1 |
| | 95.8 |
| | 95.9 |
| Weighted-average number of basic shares | | 89.9 | | | 92.3 | | | 93.6 | |
| Shares issuable under incentive stock plans | | 0.9 |
| | 1.1 |
| | 1.0 |
| |
| Shares issuable under share-based compensation plans | | Shares issuable under share-based compensation plans | | 0.6 | | | 0.5 | | | 0.7 | |
| Weighted-average number of diluted shares | | 96.0 |
| | 96.9 |
| | 96.9 |
| Weighted-average number of diluted shares | | 90.5 | | | 92.8 | | | 94.3 | |
At December 31, 2017,2021, 0.1 million stock options were excluded from the computation of weighted averageweighted-average diluted shares outstanding because the effect of including these shares would have been anti-dilutive.
The following table shows the Company's Net revenues related to both tangible product sales and services for the years ended December 31, 2021, 2020 and 2019, respectively, disaggregated by business segment. Net revenues are shown by tangible product sales and services, as contract terms, conditions and economic factors affecting the nature, amount, timing and uncertainty around revenue recognition and cash flows are substantially similar within each of the two principal revenue streams:
| | | | | | | | | | | | | | | | | |
| 2021 |
| In millions | Allegion Americas | | Allegion International | | Consolidated |
| Net revenues | | | | | |
| Products | $ | 2,070.4 | | | $ | 763.1 | | | $ | 2,833.5 | |
| Services | 1.8 | | | 32.1 | | | 33.9 | |
| Total Net revenues | $ | 2,072.2 | | | $ | 795.2 | | | $ | 2,867.4 | |
| | | | | | | | | | | | | | | | | |
| 2020 |
| In millions | Allegion Americas | | Allegion International | | Consolidated |
| Net revenues | | | | | |
| Products | $ | 2,016.7 | | | $ | 672.2 | | | $ | 2,688.9 | |
| Services | — | | | 31.0 | | | 31.0 | |
| Total Net revenues | $ | 2,016.7 | | | $ | 703.2 | | | $ | 2,719.9 | |
| | | | | | | | | | | | | | | | | |
| 2019 |
| In millions | Allegion Americas | | Allegion International | | Consolidated |
| Net revenues | | | | | |
| Products | $ | 2,114.5 | | | $ | 704.9 | | | $ | 2,819.4 | |
| Services | — | | | 34.6 | | | 34.6 | |
| Total Net revenues | $ | 2,114.5 | | | $ | 739.5 | | | $ | 2,854.0 | |
As of December 31, 2021 and 2020, neither the contract assets related to the Company's right to consideration for work completed but not billed nor the contract liabilities associated with contract revenue were material. The Company does not have any costs to obtain or fulfill a contract that are capitalized on its Consolidated Balance Sheets. During the years ended December 31, 2021 and 2020, no adjustments related to performance obligations satisfied in previous periods were recorded.
NOTE 1921 – COMMITMENTS AND CONTINGENCIES
The Company is involved in various litigations,litigation, claims and administrative proceedings, including those related to environmental and product warranty matters. Amounts recorded for identified contingent liabilities are estimates, which are reviewed periodically and adjusted to reflect additional information when it becomes available. Subject to the uncertainties inherent in estimating future costs for contingent liabilities, except as expressly set forth in this note, management believes that any liability which may result from these legal matters would not have a material adverse effect on the financial condition, results of operations, liquidity or cash flows of the Company.
Environmental Matters
The Company is dedicated to an environmental program to reduce the utilizationincurred $0.9 million, $7.1 million and generation of hazardous materials during the manufacturing process and to remediate identified environmental concerns. As to the latter, the Company is currently engaged in site investigations and remediation activities to address environmental cleanup from past operations at current and former production facilities. The Company regularly evaluates its remediation programs and considers alternative remediation methods that are in addition to, or in replacement of, those currently utilized by the Company based upon enhanced technology and regulatory changes. Changes to the Company's remediation programs may result in increased expenses and increased environmental reserves.
The Company is sometimes a party to environmental lawsuits and claims and has received notices of potential violations of environmental laws and regulations from the U.S. Environmental Protection Agency and similar state authorities. It has also been identified as a potentially responsible party ("PRP") for cleanup costs associated with off-site waste disposal at federal Superfund and state remediation sites. For all such sites, there are other PRPs and, in most instances, the Company’s involvement is minimal.
In estimating its liability, the Company has assumed it will not bear the entire cost of remediation of any site to the exclusion of other PRPs who may be jointly and severally liable. The ability of other PRPs to participate has been taken into account, based on our understanding of the parties’ financial condition and probable contributions on a per site basis. Additional lawsuits and claims involving environmental matters are likely to arise from time to time in the future.
The Company incurred $3.2$1.7 million, $23.3 million, and $4.4 million of expenses during the years ended December 31, 2017, 20162021, 2020 and 2015,2019, respectively, for environmental remediation at sites presently or formerly owned or leased by the Company. In the fourth-quarter
Environmental remediation costs are recorded in Costs of goods sold within the Consolidated Statements of Comprehensive Income.
As of December 31, 20172021 and 2016,2020, the Company has recorded reserves for environmental matters of $28.9$16.4 million and $30.6 million.$21.1 million, respectively. The total reserve at December 31, 20172021 and 20162020, included $8.9$4.3 million and $9.6$4.4 million, respectively, related to remediation of sites previously disposed by the Company. Environmental reserves are classified as Accrued expenses and other current liabilities or Other noncurrent liabilities within the Consolidated Balance Sheets based on the timing of their expected term.future payment. The Company's total current environmental reserve at December 31, 20172021 and 20162020, was $12.6$3.7 million and $6.1$6.1 million, respectively, and the remainder is classified as noncurrent. Given the evolving nature of environmental laws, regulations and technology, the ultimate cost of future compliance is uncertain.
Warranty Liability
Standard product warranty accruals are recorded at the time of sale and are estimated based upon product warranty terms and historical experience. The Company assesses the adequacy of its liabilities and will make adjustments as necessary based on known or anticipated warranty claims, or as new information becomes available.
The changes in the standard product warranty liability for the yearyears ended December 31, were as follows:
| | | In millions | 2017 | | 2016 | | 2015 | In millions | 2021 | | 2020 | | 2019 |
| Balance at beginning of period | $ | 13.3 |
| | $ | 11.7 |
| | $ | 9.8 |
| Balance at beginning of period | $ | 16.5 | | | $ | 15.9 | | | $ | 14.5 | |
| Reductions for payments | (7.8 | ) | | (6.5 | ) | | (5.4 | ) | Reductions for payments | (10.6) | | | (7.3) | | | (8.4) | |
| Accruals for warranties issued during the current period | 9.0 |
| | 8.1 |
| | 7.1 |
| Accruals for warranties issued during the current period | 11.9 | | | 8.2 | | | 10.3 | |
| Changes to accruals related to preexisting warranties | (0.8 | ) | | 0.2 |
| | 0.5 |
| Changes to accruals related to preexisting warranties | — | | | (0.6) | | | (0.4) | |
| | Translation | 0.4 |
| | (0.2 | ) | | (0.3 | ) | Translation | (0.1) | | | 0.3 | | | (0.1) | |
| | Balance at end of period | $ | 14.1 |
| | $ | 13.3 |
| | $ | 11.7 |
| Balance at end of period | $ | 17.7 | | | $ | 16.5 | | | $ | 15.9 | |
Standard product warranty liabilities are classified as Accrued expenses and other current liabilities.liabilities or Other noncurrent liabilities within the Consolidated Balance Sheets based on the timing of the expected future payments.
Other Commitments and Contingencies
Certain office and warehouse facilities, transportation vehicles and data processing equipment are leased by the Company. Total rental expense was $35.5 million in 2017, $32.5 million in 2016 and $30.3 million in 2015. Minimum lease payments required under non-cancellable operating leases with terms in excess of one year for the next five years are as follows: $20.5 million in 2018, $17.9 million in 2019, $13.0 million in 2020, $8.0 million in 2021, and $4.0 million in 2022.
NOTE 2022 – BUSINESS SEGMENT INFORMATION
The Company classifies its business into the following three2 reportable segments based on industry and market focus: Allegion Americas EMEIA, and Asia Pacific.
Allegion International. The Company largely evaluates performance based on Segment operating income and Segment operating margins. Segment operating income is the measure of profit and loss that the Company’s chief operating decision maker uses to evaluate the financial performance of the business and as the basis for resource allocation, performance reviews and compensation. For these reasons, the Company believes that Segment operating income represents the most relevant measure of segment profit and loss. The Company’s chief operating decision maker may exclude certain charges or gains, such as corporate charges and other special charges, from Operating income to arrive at a Segment operating income that is a more meaningful measure of profit and loss upon which to base its operating decisions. The Company defines Segment operating margin as Segment operating income (loss) as a percentage of the segment's Net revenues.
As previously announced, effective January 1, 2021, the Company combined its previous operations in Europe, the Middle East and Africa ("EMEA") and Asia Pacific into a new segment named Allegion International, in addition to renaming its Americas segment "Allegion Americas". Business segment information for EMEA and Asia Pacific for the years ended December 31, 2020 and 2019, has been combined in the table below to reflect this change in reportable segments.
A summary of operations and balance sheet information by reportable segments as of and for the years ended December 31 were as follows:
| | | | | | | | | | | | | | | | | | | | |
| Dollar amounts in millions | | 2021 | | 2020 | | 2019 |
| Allegion Americas | | | | | | |
| Net revenues | | $ | 2,072.2 | | | $ | 2,016.7 | | | $ | 2,114.5 | |
| Segment operating income | | 525.0 | | | 580.2 | | | 611.6 | |
| Segment operating margin | | 25.3 | % | | 28.8 | % | | 28.9 | % |
| Depreciation and amortization | | 34.8 | | | 34.5 | | | 35.7 | |
| Capital expenditures | | 30.7 | | | 26.9 | | | 32.1 | |
| Total segment assets | | 1,309.6 | | | 1,249.0 | | | 1,239.0 | |
| | | | | | |
| Allegion International | | | | | | |
| Net revenues | | 795.2 | | | 703.2 | | | 739.5 | |
| Segment operating income (loss) | | 82.4 | | | (102.1) | | | 34.8 | |
| Segment operating margin | | 10.4 | % | | (14.5) | % | | 4.7 | % |
| Depreciation and amortization | | 40.4 | | | 39.0 | | | 38.0 | |
| Capital expenditures | | 11.4 | | | 15.6 | | | 28.3 | |
| Total segment assets | | 1,276.9 | | | 1,343.5 | | | 1,338.7 | |
| | | | | | |
| Total Net revenues | | $ | 2,867.4 | | | $ | 2,719.9 | | | $ | 2,854.0 | |
| | | | | | |
| Reconciliation to earnings before income taxes | | | | | | |
| Segment operating income from reportable segments | | $ | 607.4 | | | $ | 478.1 | | | $ | 646.4 | |
| Unallocated corporate expense | | 77.2 | | | 74.6 | | | 81.3 | |
| Interest expense | | 50.2 | | | 51.1 | | | 56.0 | |
| Loss on divestitures | | — | | | — | | | 30.1 | |
| Other (income) expense, net | | (44.0) | | | (13.0) | | | 3.8 | |
| Total earnings before income taxes | | $ | 524.0 | | | $ | 365.4 | | | $ | 475.2 | |
| | | | | | |
| Depreciation and amortization from reportable segments | | $ | 75.2 | | | $ | 73.5 | | | $ | 73.7 | |
| Unallocated depreciation and amortization | | 4.0 | | | 4.5 | | | 4.4 | |
| Total depreciation and amortization | | $ | 79.2 | | | $ | 78.0 | | | $ | 78.1 | |
| | | | | | |
| Capital expenditures from reportable segments | | $ | 42.1 | | | $ | 42.5 | | | $ | 60.4 | |
| Corporate capital expenditures | | 3.3 | | | 4.6 | | | 5.2 | |
| Total capital expenditures | | $ | 45.4 | | | $ | 47.1 | | | $ | 65.6 | |
| | | | | | |
| Assets from reportable segments | | $ | 2,586.5 | | | $ | 2,592.5 | | | $ | 2,577.7 | |
Unallocated assets(a) | | 464.5 | | | 476.9 | | | 389.5 | |
| Total assets | | $ | 3,051.0 | | | $ | 3,069.4 | | | $ | 2,967.2 | |
|
| | | | | | | | | | | | |
| Dollar amounts in millions | | 2017 | | 2016 | | 2015 |
| Americas | | | | | | |
| Net revenues | | $ | 1,767.5 |
| | $ | 1,645.7 |
| | $ | 1,558.4 |
|
| Segment operating income | | 503.3 |
| | 448.1 |
| | 418.0 |
|
| Segment operating margin | | 28.5 | % | | 27.2 | % | | 26.8 | % |
| Depreciation and amortization | | 26.4 |
| | 26.4 |
| | 26.4 |
|
| Capital expenditures | | 26.1 |
| | 21.5 |
| | 18.9 |
|
| Total segment assets | | 872.4 |
| | 852.7 |
| | 806.1 |
|
| | | | | | | |
| EMEIA | | | | | | |
| Net revenues | | 523.5 |
| | 485.9 |
| | 386.3 |
|
| Segment operating income | | 45.2 |
| | 35.9 |
| | 8.6 |
|
| Segment operating margin | | 8.6 | % | | 7.4 | % | | 2.2 | % |
| Depreciation and amortization | | 28.6 |
| | 27.6 |
| | 17.2 |
|
| Capital expenditures | | 17.1 |
| | 13.6 |
| | 5.6 |
|
| Total segment assets | | 1,027.7 |
| | 886.2 |
| | 899.4 |
|
| | | | | | | |
| Asia Pacific | | | | | | |
| Net revenues | | 117.2 |
| | 106.4 |
| | 123.4 |
|
| Segment operating income (loss) | | 9.5 |
| | 6.1 |
| | (3.4 | ) |
| Segment operating margin | | 8.1 | % | | 5.7 | % | | (2.8 | )% |
| Depreciation and amortization | | 2.5 |
| | 2.4 |
| | 2.1 |
|
| Capital expenditures | | 1.5 |
| | 1.1 |
| | 2.0 |
|
| Total segment assets | | 196.3 |
| | 177.4 |
| | 237.1 |
|
| | | | | | | |
| Total net revenues | | $ | 2,408.2 |
| | $ | 2,238.0 |
| | $ | 2,068.1 |
|
| | | | | | | |
| Reconciliation to earnings before income taxes | | | | | | |
| Segment operating income from reportable segments | | $ | 558.0 |
| | $ | 490.1 |
| | $ | 423.2 |
|
| Unallocated corporate expense | | 69.8 |
| | 64.6 |
| | 64.6 |
|
| Interest expense | | 105.7 |
| | 64.3 |
| | 52.9 |
|
| Loss on divestitures | | — |
| | 84.4 |
| | 104.2 |
|
| Other income, net | | (13.2 | ) | | (18.2 | ) | | (7.8 | ) |
| Total earnings before income taxes | | $ | 395.7 |
| | $ | 295.0 |
| | $ | 209.3 |
|
| | | | | | | |
| Depreciation and amortization from reportable segments | | $ | 57.5 |
| | $ | 56.4 |
| | $ | 45.7 |
|
| Unallocated depreciation and amortization | | 4.1 |
| | 5.0 |
| | 3.1 |
|
| Total depreciation and amortization | | $ | 61.6 |
|
| $ | 61.4 |
|
| $ | 48.8 |
|
| Capital expenditures from reportable segments | | $ | 44.7 |
| | $ | 36.2 |
| | $ | 26.5 |
|
| Corporate capital expenditures | | 4.6 |
| | 6.3 |
| | 8.7 |
|
| Total capital expenditures | | $ | 49.3 |
| | $ | 42.5 |
| | $ | 35.2 |
|
| Assets from reportable segments | | $ | 2,096.4 |
| | $ | 1,916.3 |
| | $ | 1,942.6 |
|
| Unallocated assets (a) | | 445.6 |
| | 331.1 |
| | 320.4 |
|
| Total assets | | $ | 2,542.0 |
| | $ | 2,247.4 |
| | $ | 2,263.0 |
|
| |
(a) | Unallocated assets consists of investments in unconsolidated affiliates, fixed assets, deferred income taxes and cash. |
RevenuesNet revenues by destination and product as well as long-lived assets by geographic areatype for the years ended December 31, were as follows:
| | | | | | | | | | | | | | | | | | | | |
| In millions | | 2021 | | 2020 | | 2019 |
| Net revenues | | | | | | |
| U.S. | | $ | 1,948.9 | | | $ | 1,905.5 | | | $ | 1,988.9 | |
| Non-U.S. | | 918.5 | | | 814.4 | | | 865.1 | |
| Total | | $ | 2,867.4 | | | $ | 2,719.9 | | | $ | 2,854.0 | |
|
| | | | | | | | | | | | |
| In millions | | 2017 | | 2016 | | 2015 |
| Revenues | | | | | | |
| United States | | $ | 1,645.6 |
| | $ | 1,531.2 |
| | $ | 1,425.1 |
|
| Non-U.S. | | 762.6 |
| | 706.8 |
| | 643.0 |
|
| Total | | $ | 2,408.2 |
| | $ | 2,238.0 |
| | $ | 2,068.1 |
|
| | | | | | | | | | | | | | | | | | | | |
| In millions | | 2021 | | 2020 | | 2019 |
| Net revenues | | | | | | |
| Mechanical products | | $ | 2,249.2 | | | $ | 2,146.1 | | | $ | 2,247.0 | |
| All other | | 618.2 | | | 573.8 | | | 607.0 | |
| Total | | $ | 2,867.4 | | | $ | 2,719.9 | | | $ | 2,854.0 | |
|
| | | | | | | | | | | | |
| In millions | | 2017 | | 2016 | | 2015 |
| Revenues | | | | | | |
| Mechanical products | | $ | 1,906.4 |
| | $ | 1,793.1 |
| | $ | 1,661.4 |
|
| All other | | 501.8 |
| | 444.9 |
| | 406.7 |
|
| Total | | $ | 2,408.2 |
| | $ | 2,238.0 |
| | $ | 2,068.1 |
|
Less thanIn fiscal year 2021, 2020 and 2019, no customer exceeded 10% of the Company's net revenues come from the sale of services.consolidated Net revenues.
At December 31, long-lived assets by geographic area were as follows:
| | | | | | | | | | | | | | |
| In millions | | 2021 | | 2020 |
| Long-lived assets | | | | |
| U.S. | | $ | 231.7 | | | $ | 236.8 | |
| Non-U.S. | | 385.6 | | | 426.9 | |
| Total | | $ | 617.3 | | | $ | 663.7 | |
|
| | | | | | | | |
| In millions | | 2017 | | 2016 |
| Long-lived assets | | | | |
| United States | | $ | 131.0 |
| | $ | 117.1 |
|
| Non-U.S. | | 440.1 |
| | 402.3 |
|
| Total | | $ | 571.1 |
| | $ | 519.4 |
|
NOTE 2123 – SUBSEQUENT EVENTS
Subsequent to the year ended December 31, 2017, the Company completed three acquisitions:
|
| | |
Business | | Date |
Technical Glass Products, Inc. ("TGP") | | January 2018 |
Hammond Enterprises, Inc. ("Hammond") | | January 2018 |
Qatar Metal Industries LLC ("QMI") | | February 2018 |
In January 2018, the Company acquired 100% of TGP through one of its subsidiaries. TGP provides glass and framing solutions for commercial buildings, as well as non-fire rated architectural glass and framing, including channel glass systems and curtain walls throughout the United States, Canada, and select markets in the Middle East. TGP will be incorporated into the Company's Americas and EMEIA segments.
In January 2018, the Company acquired 100% of the machinery, equipment, and intellectual property of a division of Hammond through one of its subsidiaries. The assets acquired will be integrated into the Company's existing production facilities and are specific to the Company's Schlage branded products.
In February 2018, the Company acquired 100% of QMI through one of its subsidiaries. QMI specializes in fire rated and non-fire rated steel and wooden doors, acoustic doors, and wooden cabinets, as well as fire rated curtain wall systems and access panels in Qatar, Saudi Arabia, Bahrain, Oman, Kuwait, the United Arab Emirates, and Africa. QMI will be incorporated into the Company's EMEIA segment.
Total consideration paid for these three acquisitions at closing was approximately $215 million (net of cash acquired), with additional consideration approximating $10 million to be paid subject to a retention and transition period for two of these acquisitions. Cash on hand was utilized to fund these acquisitions.
Based on the preliminary allocation of the aggregate purchase price to assets acquired and liabilities assumed for these acquisitions, approximately $5 million has been allocated to net working capital, approximately $15 million to long-term tangible assets,
approximately $120 million to indefinite-lived and finite intangible assets, and the remaining approximately $85 million to goodwill. Goodwill is expected to be deductible for tax purposes. Supplemental pro forma information has not been provided as the acquisitions individually and in the aggregate would not have had a material impact on consolidated pro forma results of operations in 2017 or 2016.
On February 7, 2018,4, 2022, the Company's Board of Directors declared a quarterly dividend of $0.21$0.41 cents per ordinary share. The dividend is payable March 29, 201831, 2022 to shareholders of record on March 15, 2018.16, 2022.
NOTE 22 – GUARANTOR FINANCIAL INFORMATION
Allegion US Holding Company, Inc. ("Allegion US Hold Co") is the issuer of the 3.200% and 3.550% Senior Notes. Allegion plc is the guarantor of the 3.200% and 3.550% Senior Notes. The following condensed and consolidated financial information of Allegion plc, Allegion US Hold Co, and the other Allegion subsidiaries that are not guarantors (the "Other Subsidiaries") on a combined basis as of December 31, 2017 and for the years ended December 31, 2017, 2016 and 2015, is being presented in order to meet the reporting requirements under the Senior Notes indenture and Rule 3-10 of Regulation S-X. In accordance with Rule 3-10(d) of Regulation S-X, separate financial statements for the Issuer, Allegion plc, whom is the guarantor, are not required to be filed with the SEC as the subsidiary debt issuer is directly or indirectly 100% owned by the Parent, whom is the guarantor, and the guarantees are full and unconditional and joint and several.
In addition to reflecting the presentation of the condensed and consolidating financial statements for the new guarantor reporting structure disclosed in Form 10-Q filed with the SEC on October 26, 2017, the Company also made revisions to correct certain errors that were not material to the condensed and consolidating balance sheet as of December 31, 2016, which impacted Allegion US Hold Co, with applicable offsetting adjustments in the Consolidating Adjustments column. These revisions had no impact to the condensed and consolidating statements of comprehensive income (loss) or cash flows for any period. The effects of the revisions were as follows: Allegion US Hold Co's Investments in affiliates and Other shareholders' equity (deficit) was reduced by $2,696.3 million. The applicable offsetting effect of these corrections was included in the Consolidating Adjustments column.
Subsequent to December 31, 2017 but before the issuance of this annual report, a merger of an entity currently presented in the "Other Subsidiaries" column with Allegion US Hold Co took place. As a result, the guarantor financial information presented under Rule 3-10 of Regulation S-X included in this periodic report does not reflect this merger. The entity merged with Allegion US Hold Co primarily includes intercompany investments and related equity; there is no material income statement or cash flow activity related to this entity. In future periodic filings beginning with the Company's 2018 first quarterly report included in Form 10-Q, the condensed and consolidating financial information presented below will be modified to reflect this merger.
Condensed and Consolidated Statement of Comprehensive Income
For the year ended December 31, 2017
|
| | | | | | | | | | | | | | | | | | | |
| In millions | Allegion plc | | Allegion US Holding | | Other Subsidiaries | | Consolidating Adjustments | | Total |
| Net revenues | $ | — |
| | $ | — |
| | $ | 2,408.2 |
| | $ | — |
| | $ | 2,408.2 |
|
| Cost of goods sold | — |
| | — |
| | 1,337.5 |
| | — |
| | 1,337.5 |
|
| Selling and administrative expenses | 5.3 |
| | 0.2 |
| | 577.0 |
| | — |
| | 582.5 |
|
| Operating income (loss) | (5.3 | ) | | (0.2 | ) | | 493.7 |
| | — |
| | 488.2 |
|
| Equity earnings (loss) in affiliates, net of tax | 348.2 |
| | 148.9 |
| | — |
| | (497.1 | ) | | — |
|
| Interest expense | 70.6 |
| | 34.8 |
| | 0.3 |
| | — |
| | 105.7 |
|
| Intercompany interest and fees | (1.0 | ) | | 102.7 |
| | (101.7 | ) | | — |
| | — |
|
| Other income, net | — |
| | — |
| | (13.2 | ) | | — |
| | (13.2 | ) |
| Earnings (loss) before income taxes | 273.3 |
| | 11.2 |
| | 608.3 |
| | (497.1 | ) | | 395.7 |
|
| Provision (benefit) for income taxes | — |
| | (27.3 | ) | | 146.3 |
| | — |
| | 119.0 |
|
| Net earnings (loss) | 273.3 |
| | 38.5 |
| | 462.0 |
| | (497.1 | ) | | 276.7 |
|
| Less: Net earnings attributable to noncontrolling interests | — |
| | — |
| | 3.4 |
| | — |
| | 3.4 |
|
| Net earnings (loss) attributable to Allegion plc | $ | 273.3 |
| | $ | 38.5 |
| | $ | 458.6 |
| | $ | (497.1 | ) | | $ | 273.3 |
|
| | | | | | | | | | |
| Total comprehensive income (loss) | $ | 391.1 |
| | $ | 39.2 |
| | $ | 577.6 |
| | $ | (614.0 | ) | | $ | 393.9 |
|
| Less: Total comprehensive income attributable to noncontrolling interests | — |
| | — |
| | 2.8 |
| | — |
| | 2.8 |
|
| Total comprehensive income (loss) attributable to Allegion plc | $ | 391.1 |
| | $ | 39.2 |
| | $ | 574.8 |
| | $ | (614.0 | ) | | $ | 391.1 |
|
For the year ended December 31, 2016
|
| | | | | | | | | | | | | | | | | | | |
| | | | | | | | | | |
| In millions | Allegion plc | | Allegion US Holding | | Other
Subsidiaries | | Consolidating
Adjustments | | Total |
| Net revenues | $ | — |
| | $ | — |
| | $ | 2,238.0 |
| | $ | — |
| | $ | 2,238.0 |
|
| Cost of goods sold | — |
| | — |
| | 1,252.7 |
| | — |
| | 1,252.7 |
|
| Selling and administrative expenses | 4.7 |
| | — |
| | 555.1 |
| | — |
| | 559.8 |
|
| Operating income (loss) | (4.7 | ) | | — |
| | 430.2 |
| | — |
| | 425.5 |
|
| Equity earnings (loss) in affiliates, net of tax | 277.4 |
| | 148.3 |
| | 0.3 |
| | (426.0 | ) | | — |
|
| Interest expense | 43.5 |
| | 20.2 |
| | 0.6 |
| | — |
| | 64.3 |
|
| Intercompany interest and fees | (0.4 | ) | | 97.9 |
| | (97.5 | ) | | — |
| | — |
|
| Other (income) expense, net | — |
| | — |
| | 66.2 |
| | — |
| | 66.2 |
|
| Earnings (loss) before income taxes | 229.6 |
| | 30.2 |
| | 461.2 |
| | (426.0 | ) | | 295.0 |
|
| Provision (benefit) for income taxes | 0.5 |
| | (45.5 | ) | | 108.8 |
| | — |
| | 63.8 |
|
| Net earnings (loss) | 229.1 |
| | 75.7 |
| | 352.4 |
| | (426.0 | ) | | 231.2 |
|
| Less: Net earnings attributable to noncontrolling interests | — |
| | — |
| | 2.1 |
| | — |
| | 2.1 |
|
| Net earnings (loss) attributable to Allegion plc | $ | 229.1 |
| | $ | 75.7 |
| | $ | 350.3 |
| | $ | (426.0 | ) | | $ | 229.1 |
|
| | | | | | | | | | |
| Total comprehensive income (loss) | $ | 197.0 |
| | $ | 79.4 |
| | $ | 314.2 |
| | $ | (391.9 | ) | | $ | 198.7 |
|
| Less: Total comprehensive income attributable to noncontrolling interests | — |
| | — |
| | 1.7 |
| | — |
| | 1.7 |
|
| Total comprehensive income (loss) attributable to Allegion plc | $ | 197.0 |
| | $ | 79.4 |
| | $ | 312.5 |
| | $ | (391.9 | ) | | $ | 197.0 |
|
Condensed and Consolidated Statement of Comprehensive Income
For the year ended December 31, 2015
|
| | | | | | | | | | | | | | | | | | | |
| | | | | | | | | | |
| In millions | Allegion plc | | Allegion US Holding | | Other
Subsidiaries | | Consolidating
Adjustments | | Total |
| Net revenues | $ | — |
| | $ | — |
| | $ | 2,068.1 |
| | $ | — |
| | $ | 2,068.1 |
|
| Cost of goods sold | — |
| | — |
| | 1,199.0 |
| | — |
| | 1,199.0 |
|
| Selling and administrative expenses | 4.7 |
| | (0.1 | ) | | 505.9 |
| | — |
| | 510.5 |
|
| Operating income (loss) | (4.7 | ) | | 0.1 |
| | 363.2 |
| | — |
| | 358.6 |
|
| Equity earnings (loss) in affiliates, net of tax | 190.6 |
| | 167.2 |
| | — |
| | (357.8 | ) | | — |
|
| Interest expense | 31.2 |
| | 21.1 |
| | 0.6 |
| | — |
| | 52.9 |
|
| Intercompany interest and fees | (0.4 | ) | | 95.0 |
| | (94.6 | ) | | — |
| | — |
|
| Other (income) expense, net | (0.2 | ) | | — |
| | 96.6 |
| | — |
| | 96.4 |
|
| Earnings (loss) before income taxes | 155.3 |
| | 51.2 |
| | 360.6 |
| | (357.8 | ) | | 209.3 |
|
| Provision (benefit) for income taxes | 1.2 |
| | (44.7 | ) | | 98.1 |
| | — |
| | 54.6 |
|
| Earnings (loss) from continuing operations | 154.1 |
| | 95.9 |
| | 262.5 |
| | (357.8 | ) | | 154.7 |
|
| Discontinued operations, net of tax | — |
| | — |
| | (0.4 | ) | | — |
| | (0.4 | ) |
| Net earnings (loss) | 154.1 |
| | 95.9 |
| | 262.1 |
| | (357.8 | ) | | 154.3 |
|
| Less: Net earnings attributable to noncontrolling interests | — |
| | — |
| | 0.4 |
| | — |
| | 0.4 |
|
| Net earnings (loss) attributable to Allegion plc | $ | 154.1 |
| | $ | 95.9 |
| | $ | 261.7 |
| | $ | (357.8 | ) | | $ | 153.9 |
|
| | | | | | | | | | |
| Total comprehensive income (loss) | $ | 69.8 |
| | $ | 95.6 |
| | $ | 177.9 |
| | $ | (274.4 | ) | | $ | 68.9 |
|
| Less: Total comprehensive income attributable to noncontrolling interests | — |
| | — |
| | (0.9 | ) | | — |
| | (0.9 | ) |
| Total comprehensive income (loss) attributable to Allegion plc | $ | 69.8 |
| | $ | 95.6 |
| | $ | 178.8 |
| | $ | (274.4 | ) | | $ | 69.8 |
|
Condensed and Consolidated Balance Sheet
December 31, 2017
|
| | | | | | | | | | | | | | | | | | | |
| In millions | Allegion plc | | Allegion US Holding | | Other
Subsidiaries | | Consolidating
Adjustments | | Total |
| Current assets: | | | | | | | | | |
| Cash and cash equivalents | $ | 0.7 |
| | $ | 0.2 |
| | $ | 465.3 |
| | $ | — |
| | $ | 466.2 |
|
| Accounts and notes receivable, net | — |
| | — |
| | 296.6 |
| | — |
| | 296.6 |
|
| Inventories | — |
| | — |
| | 239.8 |
| | — |
| | 239.8 |
|
| Other current assets | 0.3 |
| | 53.1 |
| | 16.7 |
| | (40.9 | ) | | 29.2 |
|
| Assets held for sale | — |
| | — |
| | 0.9 |
| | — |
| | 0.9 |
|
| Accounts and notes receivable affiliates | — |
| | 396.8 |
| | 33.1 |
| | (429.9 | ) | | — |
|
| Total current assets | 1.0 |
| | 450.1 |
| | 1,052.4 |
| | (470.8 | ) | | 1,032.7 |
|
| Investment in affiliates | 1,079.6 |
| | 215.3 |
| | — |
| | (1,294.9 | ) | | — |
|
| Property, plant and equipment, net | — |
| | — |
| | 252.2 |
| | — |
| | 252.2 |
|
| Intangible assets, net | — |
| | — |
| | 1,155.5 |
| | — |
| | 1,155.5 |
|
| Notes receivable affiliates | 3.5 |
| | 1,165.1 |
| | 2,182.9 |
| | (3,351.5 | ) | | — |
|
| Other noncurrent assets | 5.0 |
| | 5.2 |
| | 91.4 |
| | — |
| | 101.6 |
|
| Total assets | $ | 1,089.1 |
| | $ | 1,835.7 |
| | $ | 4,734.4 |
| | $ | (5,117.2 | ) | | $ | 2,542.0 |
|
| Current liabilities: | | | | | | | | | |
| Accounts payable and accruals | $ | 1.9 |
| | $ | 7.1 |
| | $ | 457.7 |
| | $ | (40.9 | ) | | $ | 425.8 |
|
| Short-term borrowings and current maturities of long-term debt | 35.0 |
| | — |
| | — |
| | — |
| | 35.0 |
|
| Accounts and note payable affiliates | 0.2 |
| | 32.9 |
| | 396.8 |
| | (429.9 | ) | | — |
|
| Total current liabilities | 37.1 |
| | 40.0 |
| | 854.5 |
| | (470.8 | ) | | 460.8 |
|
| Long-term debt | 649.3 |
| | 791.9 |
| | 1.1 |
| | — |
| | 1,442.3 |
|
| Note payable affiliate | — |
| | 2,182.9 |
| | 1,168.6 |
| | (3,351.5 | ) | | — |
|
| Other noncurrent liabilities | 1.1 |
| | 2.1 |
| | 230.2 |
| | — |
| | 233.4 |
|
| Total liabilities | 687.5 |
| | 3,016.9 |
| | 2,254.4 |
| | (3,822.3 | ) | | 2,136.5 |
|
| Equity: | | | | | | | | | |
| Total shareholders’ equity (deficit) | 401.6 |
| | (1,181.2 | ) | | 2,476.1 |
| | (1,294.9 | ) | | 401.6 |
|
| Noncontrolling interests | — |
| | — |
| | 3.9 |
| | — |
| | 3.9 |
|
| Total equity (deficit) | 401.6 |
| | (1,181.2 | ) | | 2,480.0 |
| | (1,294.9 | ) | | 405.5 |
|
| Total liabilities and equity | $ | 1,089.1 |
| | $ | 1,835.7 |
| | $ | 4,734.4 |
| | $ | (5,117.2 | ) | | $ | 2,542.0 |
|
Condensed and Consolidated Balance Sheet
December 31, 2016
|
| | | | | | | | | | | | | | | | | | | |
| In millions | Allegion plc | | Allegion US Holding | | Other
Subsidiaries | | Consolidating
Adjustments | | Total |
| Current assets: | | | | | | | | | |
| Cash and cash equivalents | $ | 0.5 |
| | $ | 0.1 |
| | $ | 311.8 |
| | $ | — |
| | $ | 312.4 |
|
| Accounts and notes receivable, net | — |
| | — |
| | 260.0 |
| | — |
| | 260.0 |
|
| Inventories | — |
| | — |
| | 220.6 |
| | — |
| | 220.6 |
|
| Other current assets | 0.4 |
| | 49.7 |
| | 17.6 |
| | (33.6 | ) | | 34.1 |
|
| Assets held for sale | — |
| | — |
| | 2.2 |
| | — |
| | 2.2 |
|
| Accounts and notes receivable affiliates | — |
| | 331.6 |
| | 36.8 |
| | (368.4 | ) | | — |
|
| Total current assets | 0.9 |
| | 381.4 |
| | 849.0 |
| | (402.0 | ) | | 829.3 |
|
| Investment in affiliates | 1,229.4 |
| | 220.2 |
| | — |
| | (1,449.6 | ) | | — |
|
| Property, plant and equipment, net | — |
| | — |
| | 226.6 |
| | — |
| | 226.6 |
|
| Intangible assets, net | — |
| | — |
| | 1,074.2 |
| | — |
| | 1,074.2 |
|
| Notes receivable affiliates | 53.2 |
| | 1,149.8 |
| | 2,690.7 |
| | (3,893.7 | ) | | — |
|
| Other noncurrent assets | 5.4 |
| | 14.8 |
| | 97.1 |
| | — |
| | 117.3 |
|
| Total assets | $ | 1,288.9 |
| | $ | 1,766.2 |
| | $ | 4,937.6 |
| | $ | (5,745.3 | ) | | $ | 2,247.4 |
|
| Current liabilities: | | | | | | | | | |
| Accounts payable and accruals | $ | 7.0 |
| | $ | 4.7 |
| | $ | 403.3 |
| | $ | (33.6 | ) | | $ | 381.4 |
|
| Short-term borrowings and current maturities of long-term debt | 46.9 |
| | — |
| | 1.3 |
| | — |
| | 48.2 |
|
| Accounts and note payable affiliates | 0.4 |
| | 36.4 |
| | 331.6 |
| | (368.4 | ) | | — |
|
| Total current liabilities | 54.3 |
| | 41.1 |
| | 736.2 |
| | (402.0 | ) | | 429.6 |
|
| Long-term debt | 1,120.2 |
| | 294.4 |
| | 1.0 |
| | — |
| | 1,415.6 |
|
| Note payable affiliate | — |
| | 2,690.7 |
| | 1,203.0 |
| | (3,893.7 | ) | | — |
|
| Other noncurrent liabilities | 1.1 |
| | — |
| | 284.7 |
| | — |
| | 285.8 |
|
| Total liabilities | 1,175.6 |
| | 3,026.2 |
| | 2,224.9 |
| | (4,295.7 | ) | | 2,131.0 |
|
| Equity: | | | | | | | | | |
| Total shareholders’ equity (deficit) | 113.3 |
| | (1,260.0 | ) | | 2,709.6 |
| | (1,449.6 | ) | | 113.3 |
|
| Noncontrolling interests | — |
| | — |
| | 3.1 |
| | — |
| | 3.1 |
|
| Total equity (deficit) | 113.3 |
| | (1,260.0 | ) | | 2,712.7 |
| | (1,449.6 | ) | | 116.4 |
|
| Total liabilities and equity | $ | 1,288.9 |
| | $ | 1,766.2 |
| | $ | 4,937.6 |
| | $ | (5,745.3 | ) | | $ | 2,247.4 |
|
Condensed and Consolidated Statement of Cash Flows
For the year ended December 31, 2017
|
| | | | | | | | | | | | | | | | | | | |
| In millions | Allegion plc | | Allegion US Holding | | Other
Subsidiaries | | Consolidating
Adjustments | | Total |
| Net cash provided by (used in) operating activities | $ | 581.3 |
| | $ | 40.0 |
| | $ | 510.2 |
| | $ | (784.3 | ) | | $ | 347.2 |
|
| Cash flows from investing activities: | | | | | | | | | |
| Capital expenditures | — |
| | — |
| | (49.3 | ) | | — |
| | (49.3 | ) |
| Acquisition of businesses, net of cash acquired | — |
| | — |
| | (20.8 | ) | | — |
| | (20.8 | ) |
| Proceeds from sale of property, plant and equipment | — |
| | — |
| | 3.1 |
| | — |
| | 3.1 |
|
| Proceeds from sale of equity investment | — |
| | — |
| | 15.6 |
| | — |
| | 15.6 |
|
| Proceeds (payments) related to business dispositions | — |
| | — |
| | 1.2 |
| | — |
| | 1.2 |
|
| Net cash used in investing activities | — |
| | — |
| | (50.2 | ) | | — |
| | (50.2 | ) |
| Cash flows from financing activities: | | | | | | | | | |
| Net debt repayments | (488.5 | ) | | 500.0 |
| | (1.4 | ) | | — |
| | 10.1 |
|
| Debt issuance costs | (4.0 | ) | | (5.5 | ) | | — |
| | — |
| | (9.5 | ) |
| Redemption premium | (24.6 | ) | | (8.6 | ) | | — |
| | — |
| | (33.2 | ) |
| Net inter-company proceeds (payments) | 49.7 |
| | (523.0 | ) | | 473.3 |
| | — |
| | — |
|
| Dividends paid to shareholders | (60.9 | ) | | — |
| | — |
| | — |
| | (60.9 | ) |
| Dividends paid to noncontrolling interests | — |
| | — |
| | (1.8 | ) | | — |
| | (1.8 | ) |
| Dividends paid | — |
| | — |
| | (784.3 | ) | | 784.3 |
| | — |
|
| Proceeds from shares issued under incentive plans | 7.2 |
| | — |
| | — |
| | — |
| | 7.2 |
|
| Repurchase of ordinary shares | (60.0 | ) | | — |
| | — |
| | — |
| | (60.0 | ) |
| Other financing activities, net | — |
| | (2.8 | ) | | — |
| | — |
| | (2.8 | ) |
| Net cash (used in) provided by financing activities | (581.1 | ) | | (39.9 | ) | | (314.2 | ) | | 784.3 |
| | (150.9 | ) |
| Effect of exchange rate changes on cash and cash equivalents | — |
| | — |
| | 7.7 |
| | — |
| | 7.7 |
|
| Net increase in cash and cash equivalents | 0.2 |
| | 0.1 |
| | 153.5 |
| | — |
| | 153.8 |
|
| Cash and cash equivalents - beginning of period | 0.5 |
| | 0.1 |
| | 311.8 |
| | — |
| | 312.4 |
|
| Cash and cash equivalents - end of period | $ | 0.7 |
| | $ | 0.2 |
| | $ | 465.3 |
| | $ | — |
| | $ | 466.2 |
|
Condensed and Consolidated Statement of Cash Flows
For the year ended December 31, 2016
|
| | | | | | | | | | | | | | | | | | | |
| In millions | Allegion plc | | Allegion US Holding | | Other
Subsidiaries | | Consolidating
Adjustments | | Total |
| Net cash provided by (used in) continuing operating activities | $ | (25.6 | ) | | $ | 34.1 |
| | $ | 528.9 |
| | $ | (159.9 | ) | | $ | 377.5 |
|
| Cash flows from investing activities: | | | | | | | | | |
| Capital expenditures | — |
| | — |
| | (42.5 | ) | | — |
| | (42.5 | ) |
| Acquisition of businesses, net of cash acquired | — |
| | — |
| | (31.4 | ) | | — |
| | (31.4 | ) |
| Proceeds from sales and maturities of marketable securities | — |
| | — |
| | 14.1 |
| | — |
| | 14.1 |
|
| Proceeds (payments) related to business disposition | — |
| | — |
| | (4.3 | ) | | — |
| | (4.3 | ) |
| Other investing activities, net | — |
| | — |
| | 0.1 |
| | — |
| | 0.1 |
|
| Net cash used in investing activities | — |
| | — |
| | (64.0 | ) | | — |
| | (64.0 | ) |
| Cash flows from financing activities: | | | | | | | | | |
| Net debt repayments | (47.0 | ) | | — |
| | (17.4 | ) | | — |
| | (64.4 | ) |
| Debt issuance costs | (0.3 | ) | | — |
| | — |
| | — |
| | (0.3 | ) |
| Net inter-company proceeds (payments) | 195.4 |
| | (34.3 | ) | | (161.1 | ) | | — |
| | — |
|
| Dividends paid to shareholders | (46.0 | ) | | — |
| | — |
| | — |
| | (46.0 | ) |
| Dividends paid to noncontrolling interests | — |
| | — |
| | (2.7 | ) | | — |
| | (2.7 | ) |
| Dividends paid | — |
| | — |
| | (159.9 | ) | | 159.9 |
| | — |
|
| Acquisition of noncontrolling interest | — |
| | — |
| | (3.3 | ) | | — |
| | (3.3 | ) |
| Proceeds from shares issued under incentive plans | 5.8 |
| | — |
| | — |
| | — |
| | 5.8 |
|
Repurchase of ordinary shares
| (85.1 | ) | | — |
| | — |
| | — |
| | (85.1 | ) |
| Net cash provided by (used in) financing activities | 22.8 |
| | (34.3 | ) | | (344.4 | ) | | 159.9 |
| | (196.0 | ) |
| Effect of exchange rate changes on cash and cash equivalents | — |
| | — |
| | (4.8 | ) | | — |
| | (4.8 | ) |
| Net (decrease) increase in cash and cash equivalents | (2.8 | ) | | (0.2 | ) | | 115.7 |
| | — |
| | 112.7 |
|
| Cash and cash equivalents - beginning of period | 3.3 |
| | 0.3 |
| | 196.1 |
| | — |
| | 199.7 |
|
| Cash and cash equivalents - end of period | $ | 0.5 |
| | $ | 0.1 |
| | $ | 311.8 |
| | $ | — |
| | $ | 312.4 |
|
Condensed and Consolidated Statement of Cash Flows
For the year ended December 31, 2015
|
| | | | | | | | | | | | | | | | | | | |
| In millions | Allegion plc | | Allegion US Holding | | Other
Subsidiaries | | Consolidating
Adjustments | | Total |
| Net cash provided by (used in) continuing operating activities | $ | (23.4 | ) | | $ | 125.8 |
| | $ | 416.5 |
| | $ | (261.5 | ) | | $ | 257.4 |
|
| Net cash used in discontinued operating activities | — |
| | — |
| | (0.4 | ) | |
|
| | (0.4 | ) |
| Net cash provided by (used in) operating activities | (23.4 | ) | | 125.8 |
| | 416.1 |
| | (261.5 | ) | | 257.0 |
|
| Cash flows from investing activities: | | | | | | | | | |
| Capital expenditures | — |
| | — |
| | (35.2 | ) | | — |
| | (35.2 | ) |
| Acquisition of businesses, net of cash acquired | — |
| | — |
| | (511.3 | ) | | — |
| | (511.3 | ) |
| Proceeds from sale of property, plant and equipment | — |
| | — |
| | 0.3 |
| | — |
| | 0.3 |
|
| Proceeds from business disposition, net of cash sold | — |
| | — |
| | 0.1 |
| | — |
| | 0.1 |
|
| Proceeds from sale of marketable securities | — |
| | — |
| | 12.3 |
| | — |
| | 12.3 |
|
| Net cash used in investing activities | — |
| | — |
| | (533.8 | ) | | — |
| | (533.8 | ) |
| Cash flows from financing activities: | | | | | | | | | |
| Net debt proceeds | 263.8 |
| | — |
| | 14.5 |
| | — |
| | 278.3 |
|
| Debt issuance costs | (9.0 | ) | | — |
| | — |
| | — |
| | (9.0 | ) |
| Net inter-company proceeds (payments) | (200.9 | ) | | (126.0 | ) | | 326.9 |
| | — |
| | — |
|
| Dividends paid to shareholders | (38.3 | ) | | — |
| | — |
| | — |
| | (38.3 | ) |
| Dividends paid to noncontrolling interests | — |
| | — |
| | (20.0 | ) | | — |
| | (20.0 | ) |
| Dividends paid | — |
| | — |
| | (261.5 | ) | | 261.5 |
| | — |
|
| Proceeds from shares issued under incentive plans | 11.0 |
| | — |
| | — |
| | — |
| | 11.0 |
|
| Repurchase of ordinary shares | (30.0 | ) | | — |
| | — |
| | — |
| | (30.0 | ) |
| Other financing activities, net | 3.0 |
| | — |
| | — |
| | — |
| | 3.0 |
|
| Net cash (used in) provided by financing activities | (0.4 | ) | | (126.0 | ) | | 59.9 |
| | 261.5 |
| | 195.0 |
|
| Effect of exchange rate changes on cash and cash equivalents | — |
| | — |
| | (9.0 | ) | | — |
| | (9.0 | ) |
| Net decrease in cash and cash equivalents | (23.8 | ) | | (0.2 | ) | | (66.8 | ) | | — |
| | (90.8 | ) |
| Cash and cash equivalents - beginning of period | 27.1 |
| | 0.5 |
| | 262.9 |
| | — |
| | 290.5 |
|
| Cash and cash equivalents - end of period | $ | 3.3 |
| | $ | 0.3 |
| | $ | 196.1 |
| | $ | — |
| | $ | 199.7 |
|
SCHEDULE II
ALLEGION PLC
VALUATION AND QUALIFYING ACCOUNTS
FOR THE YEARS ENDED DecemberDECEMBER 31, 2017, 20162021, 2020 AND 20152019
(Amounts in millions)
|
| | | |
| Allowances for Doubtful Accounts: | |
| | |
| Balance December 31, 2014 | $ | 3.2 |
|
| Additions charged to costs and expenses | 1.6 |
|
| Deductions* | (1.5 | ) |
| Business acquisitions and divestitures, net | 0.9 |
|
| Currency translation | (0.4 | ) |
| Balance December 31, 2015 | 3.8 |
|
| Additions charged to costs and expenses | 0.1 |
|
| Deductions* | (1.1 | ) |
| Currency translation | (0.1 | ) |
| Balance December 31, 2016 | 2.7 |
|
| Additions charged to costs and expenses | 0.8 |
|
| Deductions* | (0.9 | ) |
| Currency translation | 0.2 |
|
| Balance December 31, 2017 | $ | 2.8 |
|
| | | | | |
| Allowances for Doubtful Accounts: |
|
| |
| Balance December 31, 2018 | $ | 3.3 | |
| Additions charged to costs and expenses | 2.4 | |
| |
(*) | |
| Currency translation | (0.1) | |
| |
| |
| Balance December 31, 2019 | 5.6 | |
Adoption of ASC 326, Financial Instruments – Credit Losses | 1.9 | |
| Additions charged to costs and expenses | 2.4 | |
| Deductions* | (3.9) | |
| Currency translation | 0.2 | |
| |
| Balance December 31, 2020 | 6.2 | |
| Additions charged to costs and expenses | 0.1 | |
| Deductions* | (0.7) | |
| |
| Currency translation | (0.2) | |
| |
| Balance December 31, 2021 | $ | 5.4 | |
| | | | | |
| * | "Deductions" include accounts and advances written off, less recoveries. |