UNITED STATES
SECURITIES AND EXCHANGE COMMISSION
Washington, D.C. 20549
FORM 10-K
(Mark One)
| | | | | |
| ☒ | ANNUAL REPORT PURSUANT TO SECTION 13 OR 15(d) OF THE SECURITIES EXCHANGE ACT OF 1934 |
For the fiscal year ended December 31, 20202023
or
| | | | | |
| ☐ | TRANSITION REPORT PURSUANT TO SECTION 13 OR 15(d) OF THE SECURITIES EXCHANGE ACT OF 1934 |
For the transition period from to
Commission File No. 001-35971
ALLEGION PUBLIC LIMITED COMPANY
(Exact name of registrant as specified in its charter)
| | | | | | | | |
| Ireland | | 98-1108930 |
| (State or other jurisdiction of incorporation or organization) | | (I.R.S. Employer
Identification No.) |
Block D
Iveagh Court
Harcourt Road
Dublin 2, D02 VH94, Ireland
(Address of principal executive offices, including zip code)
+(353) (1) 2546200
(Registrant’s telephone number, including area code)
Securities registered pursuant to Section 12(b) of the Act:
| | | | | | | | |
| Title of each class | Trading symbols | Name of each exchange on which registered |
| Ordinary shares, par value $0.01 per share | ALLE | New York Stock Exchange |
| 3.500% Senior Notes due 2029 | ALLE 3 ½ | New York Stock Exchange |
Securities registered pursuant to Section 12(g) of the Act: None
Indicate by check mark if the registrant is a well-known seasoned issuer, as defined in Rule 405 of the Securities Act. Yes x No ¨
Indicate by check mark if the registrant is not required to file reports pursuant to Section 13 or Section 15(d) of the Act. Yes ¨ No x
Indicate by check mark whether the registrant (1) has filed all reports required to be filed by Section 13 or 15(d) of the Securities Exchange Act of 1934 during the preceding 12 months (or for such shorter period that the registrant was required to file such reports), and (2) has been subject to such filing requirements for the past 90 days. Yes x No ¨
Indicate by check mark whether the registrant has submitted electronically every Interactive Data File required to be submitted pursuant to Rule 405 of Regulation S-T (§232.405 of this chapter) during the preceding 12 months (or for such shorter period that the registrant was required to submit such files). Yes x No ¨
Indicate by check mark whether the registrant is a large accelerated filer, an accelerated filer, a non-accelerated filer, a smaller reporting company, or an emerging growth company. See the definitions of "large accelerated filer," "accelerated filer," "smaller reporting company," and "emerging growth company" in Rule 12b-2 of the Exchange Act.:
| | | | | | | | | | | |
| Large accelerated filer | ☒ | Accelerated filer | ☐ |
| | | |
| Non-accelerated filer | ☐ | Smaller reporting company | ☐ |
| | | |
| | Emerging growth company | ☐ |
If an emerging growth company, indicate by check mark if the registrant has elected not to use the extended transition period for complying with any new or revised financial accounting standards provided pursuant to Section 13(a) of the Exchange Act. ☐
Indicate by check mark whether the registrant has filed a report on and attestation to its management’s assessment of
the effectiveness of its internal control over financial reporting under Section 404(b) of the Sarbanes-Oxley Act (15 U.S.C.
7262(b)) by the registered public accounting firm that prepared or issued its audit report. ☒
If securities are registered pursuant to Section 12(b) of the Act, indicate by check mark whether the financial statements of the registrant included in the filing reflect the correction of an error to previously issued financial statements. ☐
Indicate by check mark whether any of those error corrections are restatements that required a recovery analysis of incentive-based compensation received by any of the registrant's executive officers during the relevant recovery period pursuant to §240.10D-1(b). ☐
Indicate by check mark whether the registrant is a shell company (as defined in Rule 12b-2 of the Act). Yes ☐ No ☒
The aggregate market value of our ordinary shares held by non-affiliates on June 30, 20202023 was approximately $9.4$10.5 billion based on the closing price of such stockshares on the New York Stock Exchange.Exchange on that date.
The number of ordinary shares outstanding of Allegion plc as of February 11, 202114, 2024 was 90,732,297.87,554,388.
DOCUMENTS INCORPORATED BY REFERENCE
Portions of the registrant’s definitive proxy statement to be filed with the Securities and Exchange Commission (the "SEC") within 120 days of the close of the registrant’s fiscal year in connection with the registrant’s Annual General Meeting of Shareholders to be held June 3, 20216, 2024 (the "Proxy Statement") are incorporated by reference into Part II and Part III of this Form 10-K as described herein.
ALLEGION PLC
Form 10-K
For the Fiscal Year Ended December 31, 20202023
TABLE OF CONTENTS
| | | | | | | | | | | |
| | | | Page |
| Part I | Item 1. | | |
| | | |
| Item 1A. | | |
| | | |
| Item 1B. | | |
| | | |
| Item 1C. | | | |
| | | |
| Item 2. | | |
| | | |
| Item 3. | | |
| | | |
| Item 4. | | |
| | | |
| Part II | Item 5. | | |
| | | |
| Item 6. | | |
| | | |
| Item 7. | | |
| | | |
| Item 7A. | | |
| | | |
| Item 8. | | |
| | | |
| Item 9. | | |
| | | |
| Item 9A. | | |
| | | |
| Item 9B. | | |
| | | |
| Item 9C. | | |
| | | |
| Part III | Item 10. | | |
| | | |
| Item 11. | | |
| | | |
| Item 12. | | |
| | | |
| Item 13. | | |
| | | |
| Item 14. | | |
| | | |
| Part IV | Item 15. | | |
| | | |
| Item 16. | | |
| | | |
| | | |
CAUTIONARY STATEMENT FOR FORWARD LOOKING STATEMENTS
Certain statements in this report, other than purely historical information, are "forward-looking statements" within the meaning of the Private Securities Litigation Reform Act of 1995, Section 27A of the Securities Act of 1933 and Section 21E of the Securities Exchange Act of 1934.1934, as amended (the "Exchange Act"). These forward-looking statements generally are identified by the words "believe," "project," "expect," "anticipate," "estimate," "forecast," "outlook," "intend," "strategy," "future", "opportunity","future," "opportunity," "plan," "may," "should," "will," "would," "will be," "will continue," "will likely result," or the negative thereof or variations thereon or similar expressions generally intended to identify forward-looking statements.
Forward-looking statements may relate to such matters as: statements regarding the potential impacts of the global COVID-19 pandemic, projections of revenue, margins, expenses, tax provisions, earnings, cash flows, benefit obligations, dividends, share purchases or other financial items; any statements of the plans, strategies and objectives of management for future operations, including those relating to any statements concerning expected development, performance or market share relating to our products and services; any statements regarding future economic conditions or our performance; any statements regarding pending investigations, claims or disputes; any statements of expectation or belief; and any statements of assumptions underlying any of the foregoing. These statements are based on currently available information and our current assumptions, expectations and projections about future events. While we believe that our assumptions, expectations and projections are reasonable in view of the currently available information, you are cautioned not to place undue reliance on our forward-looking statements. You are advised to review any further disclosures we make on related subjects in materials we file with or furnish to the United States Securities and Exchange Commission (SEC). Forward-looking statements speak only as of the date they are made and are not guarantees of future performance. They are subject to future events, risks and uncertainties – many of which are beyond our control – as well as potentially inaccurate assumptions, that could cause actual results to differ materially from our expectations and projections. We do not undertake to update any forward-looking statements.
Factors that might affect our forward-looking statements include,projections including, among other things:
•adverse impacts to our normal business operations due to the global COVID-19 pandemic;ongoing macroeconomic challenges and continued economic instability;
•competitive factorsincreased prices and inflation;
•volatility and uncertainty in the industrypolitical, economic and regulatory environments in which we compete,operate, including technological developmentschanges to trade agreements, sanctions, import and export regulations, custom duties and applicable tax regulations and interpretations, social and political unrest, instability, national and international conflict, terrorist acts and other geographical disputes and uncertainties;
•the strength and stability of the institutional, commercial and residential construction and remodeling markets;
•fluctuations in currency exchange rates;
•potential impairment of our goodwill, indefinite-lived intangible assets and/or our long-lived assets;
•instability in the U.S. and global capital and credit markets;
•our ability to make scheduled debt payments or to refinance our debt obligations;
•increased competition, including from private label brands;technological developments;
•the development, commercialization and acceptance of new products and services that meet the varied and evolving needs of our customers;services;
•the demand for our products and services, including changes in customer and consumer preferences and our ability to maintain beneficial relationships with large customers;
•our products or solutions failfailing to meet certification and specification requirements, arebeing defective, causing property damage, bodily harm or injury, or otherwise fallfalling short of customers’ needs and expectations;
•theour ability to identify and successfully complete and integrate any acquisitions, and/or losses related to our investments in external companies;including achieving their anticipated strategic and financial benefits;
•business opportunities that diverge from our core business;
•our ability to operate efficiently and productively;achieve the expected improvements or financial returns we expect from our strategic initiatives;
•our ability to effectively manage and implement restructuring initiatives andor other organizational changes;
•global climate change or other unexpected events, including global health crises, such as COVID-19;
•the proper functioning of our information technology and operational technology systems, including disruption or breaches of our information systems, such as cybersecurity attacks;
•the failure of our third-party vendors to provide effective support for many of the critical elements of our global information and operational technology infrastructure;
•our ability to recruit and retain a highly qualified and diverse workforce;
•disruptions in our global supply chain, including product manufacturing and logistical services provided by our supplier partners;
•the effects of global climate change or other unexpected events, including global health crises, that may disrupt our operations;
•our ability to effectively manage risksreal or perceived issues related to our information technologyproduct quality, safety, corporate social responsibility and operational technology systems and cybersecurity, including implementation of new processes that may cause disruptions and be more difficult, costly or time consuming than expected;other reputational matters;
•our reliance on third-party vendors for many of the critical elements of our global information and operational technology infrastructure and their failure to provide effective support for such infrastructure;
•disruption and breaches of our information systems;
•ability to recruitprotect our brand reputation and retain a highly qualified and diverse workforce;
•economic, political and business conditions in the markets in which we operate, including changes to trade agreements, sanctions, import and export regulations and custom duties;trademarks;
•conditions of the institutional, commercial and residential construction and remodeling markets, including the impact of work-from-home trends;
•fluctuations in currency exchange rates;
•availability of and fluctuations in the prices of key commodities and the impact of higher energy prices;
•potential further impairment of our goodwill, indefinite-lived intangible assets and/legal judgments, fines, penalties or settlements imposed against us or our long-lived assets;
•interest rate fluctuationsassets as a result of legal proceedings, claims and other changes in borrowing costs, in addition to risks associated with our outstanding and future indebtedness;
•the impact our outstanding indebtedness may have on our business and operations and other capital market conditions, including availability of funding sources and currency exchange rate fluctuations;
•risks related to corporate social responsibility and reputational matters;
•the ability to protect our brand reputation and trademarks;
•the outcome of any litigation, governmental investigations or proceedings;disputes;
•claims of infringement of intellectual property rights by third parties;
•adverse publicity or improper conduct by any of our employees, agents or business partners;
•changes to, or changes in interpretations of, current laws and regulations;
•uncertainty and inherent subjectivity related to transfer pricing regulations;regulations in the countries in which we operate;
•changes in tax requirements, including tax rate changes,rates, the adoption of new tax legislation or exposure to additional tax liabilities and revised tax law interpretations;liabilities; and
•risks related to our incorporation in Ireland, including the possible effects on us of future legislation or interpretations in the U.S.adverse determinations by taxing authorities that may limit or eliminate potential U.S.could increase our tax benefits resulting from our incorporation in a non-U.S. jurisdiction, such as Ireland, or deny U.S. government contracts to us based upon our incorporation in such non-U.S. jurisdiction.burden.
Some of the significantThese events, risks and uncertainties that could cause actual results to differ materially from our expectations and projections are further described more fully in Item 1A. "Risk Factors." You should read that information in conjunction withFactors" and Item 7. "Management's Discussion and Analysis of Financial Condition and Results of Operations" in Item 7 of this report and our Consolidated Financial Statements and related notes in Item 8 of this report. We note such information for investorsdo not undertake to update any forward-looking statements, except as permittedrequired by the Private Securities Litigation Reform Act of 1995.law.
PART I
Item 1. BUSINESS
Overview
Allegion plc ("Allegion," "we," "us" or "the Company") is a leading global provider of security products and solutions that keep people and assets safe and secure in the places where they reside,live, learn, work and thrive.connect. We create peace of mind by pioneering safety and security with a vision of enabling seamless access and a safer world. Seamless access allows authorized, automated and safe passage and movement through spaces and places in the most efficient and frictionless manner possible. Central to our vision is partnering and developing ecosystems to create a flawless experience and enable an uninterrupted and secure flow of people and assets. We offer an extensive and versatile portfolio of mechanicalsecurity and electronic securityaccess control products and solutions across a range of market-leading brands. Our experts across the globe deliver high-quality security products,hardware, software, services and systems, and we use our deep expertise to serve as trusted partners to end-users who seek customized solutions to their security needs.
| | | | | |
| Allegion Principal Products and Services |
Door closerscontrols and controlssystems | DoorsLocks, locksets, portable locks and door systems |
Electronic security products | Electronic, biometric and mobile access controlkey systems |
| Exit devices | Locks, locksets, portable locks, key systems and servicesElectronic security products |
| Software-enabled access control systems | Time, attendance and workforce productivity systems |
OtherDoors, accessories and other | Services and software |
Access control security products and solutions are critical elements in every building and home. Many door openings are configured to maximize a room’s particular form and function while also meeting local and national building and safety code requirements and end-user security needs. Most buildings have multiple door openings, each serving its own purpose and requiring different specific access-controlaccess control solutions. Each door must fit exactly within its frame, be prepared precisely for its hinges, synchronize with its specific lockset and corresponding latch and align with a specific key to secure the door. Moreover, with the increasing adoption of the Internet of Things ("IoT"), security products – including keyscredentials – are increasingly linked electronically, integrated into software and popular consumer technology platforms and controlled with mobile applications, creating additional functionality and complexity. Seamless access capitalizes on the ability for multiple products and brands to work in tandem, allowing people and assets to move efficiently and safely by adapting access rights for various settings or use cases. These solutions can also provide insights on usage and traffic patterns to boost efficiency, improve hygiene of high-traffic areas boost efficiency and improve visitor, staff and tenant experiences.
We believe our ability to deliver a wide range of solutions that can be custom configured to meet end-users’ security needs is a key driver of our success. We accomplish this with:
•Our extensive and versatile product and service portfolio, combined with our deep expertise, which enables us to deliver the right products and solutions to meet diverse security and functional specifications and to successfully and securely integrate into leading technologytechnologies and systems;
•Our consultative approach and expertise, which enables us to develop the most efficient and appropriate building security and access-controlaccess control specifications to fulfill the unique needs of our end-users and their partners, including architects, contractors, homebuilders and engineers;
•Our access to and management of key channels in the market, which is critical to delivering our products in an efficient and consistent manner; and
•Our enterprise excellence capabilities, including our global manufacturing operations and agile supply chain, which facilitate our ability to deliver specific product and system configurations to end-users and consumers worldwide, quickly and efficiently.
We believe the security products industry will continue to benefit from several global macroeconomic trends, including:
•Expected growth in global electronic products and solutions as end-users adopt newer technologies in their facilities and homes;
•Heightened awareness of security and privacy requirements;
•Increased focus on touchless solutions that help promote a healthy environment; and
•The shift to a digital, interconnected and increasingly interoperable environment.
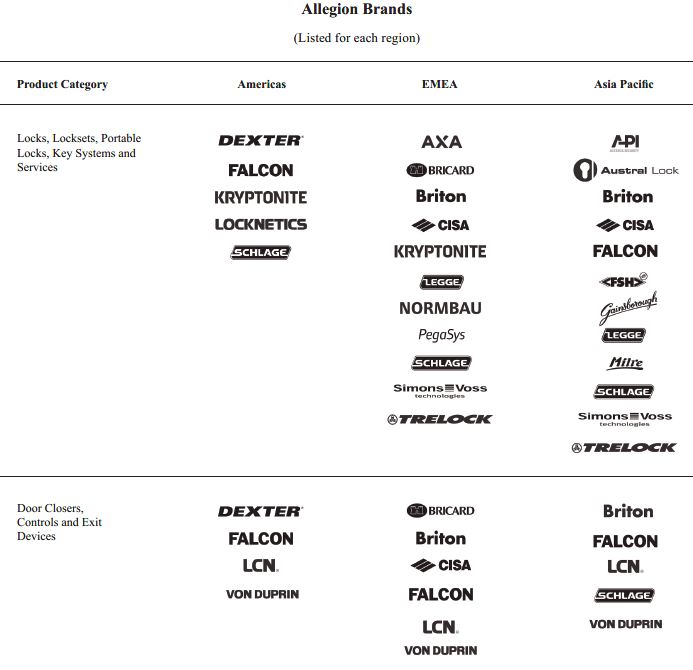
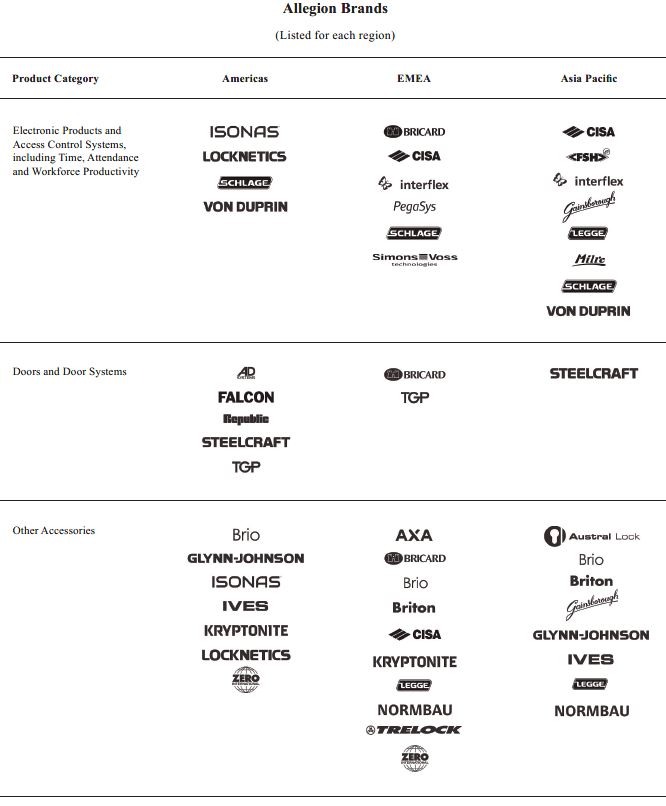
We operate in three geographic regions: Americas;and report financial results for two segments: Allegion Americas and Allegion International, the latter of which provides security products, services and solutions primarily throughout Europe, Middle EastAsia and Africa ("EMEA"); and Asia Pacific.Oceania. We sell our products and solutions under the following brands:
We sell a wide range of security and access control solutions for end-users in commercial, institutional and residential facilities worldwide, including the education, healthcare, government, hospitality, retail, commercial office and single and multi-family residential markets. Our leading brands include CISA®, Interflex®, LCN®, Schlage®, SimonsVoss® and Von Duprin®. We believe LCN, Schlage and Von Duprin hold the No. 1 position in their primary product categories in North America while CISA, Interflex and SimonsVoss hold the No. 1 or No. 2 position in their primary product categories in certain European markets.
During the year ended December 31, 2020,2023, we generated Net revenues of $2,719.9$3,650.8 million and Operating income of $403.5$708.4 million.
History and Developments
We were incorporated in Ireland on May 9, 2013, to hold the commercial and residential security businesses of what was then Ingersoll Rand plc ("Ingersoll Rand"). On December 1, 2013, we became a stand-alone public company after Ingersoll Rand completed the separation of these businesses from the rest of Ingersoll Rand via the transfer of these businesses from Ingersoll Rand to us and the issuance by us of ordinary shares directly to Ingersoll Rand’s shareholders (the "Spin-off").shareholders. Our security businesses have long and distinguished operating histories. Several of our brands were established more than 100 years ago, and many originally created their categories:
•Von Duprin, established in 1908, was awarded the first exit device patent;
•Schlage, established in 1920, was awarded the first patents granted for the cylindrical lock and the push button lock;
•LCN, established in 1926, created the first door closer;
•CISA, established in 1926, devised the first electronically controlled lock; and
•SimonsVoss, established in 1995, created the first keyless digital transponder.transponder; and
We have built upon these founding legacies since our entry into the security products market through the acquisition of Schlage, Von Duprin and LCN in 1974. Today, we continue to develop, acquire and introduce innovative and market-leading products. For example, in
In 2018, we announced the formation of Allegion Ventures a corporate venture fund that investsto invest in and helpshelp accelerate the growth of companies that have innovative, digital-first technologies and products such as touchless access and workspace monitoring solutions that complement our core business solutions. Since its formation,Building on this success, in December 2021, Allegion Ventures has invested nearly $15announced a second fund with an additional allocation of $100 million to focus on investing in several early-stage companies that share our pioneeringtechnologies like artificial intelligence (AI), video monitoring, machine learning and cybersecurity. For example, in 2023, Allegion Ventures made a $20 million investment in Ambient.ai, an AI powered computer vision and seek to find smart and innovative solutions that help keep people and assets safe and secure in the places where they reside, work and thrive.
Recent examples of successful product launches by Allegion are illustrated in the table below:
| | | | | | | | | | | | | | | | | | | | |
| Product | | Brands | | Year | | Innovation |
ResidentialElectronic Locks, CylindersLocksets and LeversPortable Locks | | Schlage, CISA, AXA | | 2021/2022/2023 | | Schlage Gainsborough, CISA
| | 2018/2019/ 2020 | | Next-generation Schlage smart locks includeEncode Plus Smart WiFi Deadbolt one of the first WiFi enabled deadboltin the market to work with Key by AmazonApple home keys, allowing lock or unlock access using an iPhone or Apple Watch. Schlage Encode Smart WiFi Lever is for use in doors without a deadbolt; connects to home WiFi and Ring devicespairs with built-in connectivity (Schlage Encode); Z-wave smart deadbolt and Zigbee-certified model compatible with Amazon Key and Ring devices (Schlage Connect); fire-ratedthe Schlage app.
Narrow profile smart lock for Australia and New Zealand paired with a mobilefor use on aluminum and timber doors, utilizing the Schlage Breeze app (Schlage Omnia Breeze)Artus). Next-generation smart entry door lock for convenient accessthe New Zealand market, operating on the Schlage Breeze app and security that meets current fireoffering a retrofit solution to Schlage S-6000 and accessibility requirements.competitor products (Schlage Resolute). Upgraded mortice lock platform for the Australia and New Zealand OEM market, providing increased functionality and improving installation time (Schlage Virtus).
Next generation Gainsborough Freestyle Trilock features three-in-one functionality: passage, privacy or dead lock mode; and can be operated using the built-in keypad, a key override or through the mobile app. In conjunction with the optional WiFi bridge, the lock can be programmed and operated from anywhere in the world.
First CISA motorized lock solution for high securityhigh-security connected smart doors (Domo Connexa), manageable in proximity and remotely using a mobile app. |
Commercial Locks, Cylinders, LeversElectronic Key Systems and Electronic Access PlatformsControl, Mobile and Web Applications | | Schlage, SimonsVoss, CISA, Schlage, Interflex, ISONAS, Zentra | | 2021/2022/2023 | | 2018/2019/ 2020 | Enhancements to our comprehensive portfolio of globally available mechanical, wired electrified and wireless electronic solutions provide a common aesthetic and consistent user experience throughout a building; firmware releases added functionality and USB communication mode for readers (Schlage). Mobile-enabled versions of locks, readers and controllers (Schlage NDE, LE, MTB and CTE), mobile credentials, Bluetooth Low Energy and RFID technology and integrations between electronic locks and exit devices (Schlage, CISA).
SimonsVoss offers new option for wireless online connections to a virtual network (SmartHandle AX, SmartIntego) and a retrofit, no-drill locking option for lockers and furniture in schools, hospitals and industry facilities that integrates into the existing SimonsVoss digital eco-systemecosystem for offline and online access (SmartLocker). Expanded radio network technology to include European frequency band 868MHz and 920MHz technology.
Mortice self-locking systemFSS1 High Security Door Position Sensors (Schlage) provide a high-security solution with a mono-point motorized lock variant (CISA) and new platformed, modular replacement of cylindrical locks (Schlage ALX).
|
Exit Devices and Closers | | Von Duprin, Falcon, LCN, CISA | | 2018/2019/2020 | | Award-winning and cost-effective retrofit exit device that allows for remote undogging and monitoring with partner software (Von Duprin); new fire-rated retrofit series (Falcon); and quiet exit solutions (Von Duprin).
Range of touchless solutions, including automatic operators, actuators and wireless transmitters (LCN) and a range of asymmetric rack-and-pinion door closers and an entry-level, high-efficiency option (CISA).
|
Doors and Door Systems | | TGP, AD Systems | | 2019 | | Firstadjustable anti-tamper features to the market surface mounted, top-hung single-leaf, sliding flush wood doors that achieve a 45-minute UL 10B fire rating (FireSlide). Fire-rated and impact safety-rated glass doors with a heat resistive perimeter frame, which features nearly colorless transitions between adjoining pieces of low-iron glass, eliminating the need for colored internal glass unit spacershelp prevent against attacks through magnetic, electronic or vertical frame mullions (Fireframes ClearView). |
Bike Lighting and Portable Locking Solutions | | AXA, Kryptonite, Trelock | | 2018/2019 | | Innovation in bike safety including rechargeable lights and expanded lines of folding locks from each of our Global Portable Security brands (AXA, Kryptonite, Trelock); and ergonomic cable and chain locks and expanded track-and-trace services (AXA). |
Software, Mobile and Web Applications | | Allegion (Overtur, ENGAGE), Schlage, Gainsborough, Interflex, ISONAS | | 2018/2019/2020 | | Cloud-based suite of tools for project teams to collaborate on specifications and the security design of doors and openings (Overtur). Multiple enhancements to the user experience include simplified account and site set-up and gateway site survey (ENGAGE) and mobile apps for iOS and Android phones (Schlage, CISA, Gainsborough) to lock, unlock, issue mobile keys and status check. Schlage Mobile Student ID allows university students, faculty and staff to add student ID cards to their Apple Wallet or Google Pay for door access, payments, attendance tracking and ticketing.physical means.
Visitor management modules and managed service featuring a cloud-based solution of time recording (Interflex); cloud-hosted access control platform with real timereal-time events, alertingalerts and user-initiated door control (ISONAS). |
| | | | | |
Pure Access enhanced support for mobile ready Schlage TB readers connected to an ISONAS IP-Bridge to allow seamless integration with Schlage Mobile Credentials and enhanced functionality for the NDE/LE wireless locks.
Multi-family access control solution providing a turnkey, simple, secure and smart offering of software and integrated hardware covering all access needs for the building (Zentra). |
| | | | | | | | | | | | | | | | | | | | |
| Product | | Brands | | Year | | Innovation |
| Mechanical Locks, Locksets, Portable Locks and Key Systems | | CISA, Schlage, Legge, Bricard, AXA, Kryptonite, Trelock | | 2021/2022/2023 | | Mortice self-locking system with a mono-point motorized lock variant, new multi-point exit mortice self-locking system for panic exit doors with narrow profile (CISA) and new platformed, modular replacement of cylindrical locks (Schlage ALX). Next generation of multi-function mortice locks, 991 Multi-Function Mortice Lock Series (Legge), allows easy conversions and anti-lockout function.
New key override safety feature option on mortise locks (Schlage L Series). Six mechanical and two electrified options available. Large format interchangeable core options to fit competitive locksets. Bricard Evidence handle range for commercial and residential markets, with an exclusive and unique rose fixation and adjustment design, functionality and finishes. |
| Electronic and Electrified Door Controls and Systems and Exit Devices | | Von Duprin, LCN, CISA, Stanley Access Technologies | | 2021/2022/2023 | | Security indicator (Von Duprin) for visual verification and lockdown. The -2SI security indicator provides at-a-glance verification of door status from inside the room. Also available as a retrofit conversion kit for existing 98/99 Series exit devices.
Range of touchless solutions, including automatic operators, actuators and wireless transmitters (LCN). New 6400 Compact Series (LCN) low-energy automatic operator retrofit solution with actuators reduces the cost and complexity of touchless access and adds ADA accessibility. Enhancements to the already durable 4040XP (LCN) door closer, making it even easier to install and maintain.
NA new automatic door/window solution for increased efficiencies for drive through restaurants (Stanley Access Technologies DuraGlide DT). Telescopic manual and automatic version of ICU doors providing the biggest clear door opening in the industry, proprietary handle design and the slimmest header (ProCare 8500). |
| Doors, Accessories and Other | | TGP, AXA | | 2021/2022/2023 | | North America's first fire-rated Full-Lite Door System (TGP), certified to meet forced entry standards (TGP ASTM E2395).
Smoke-rated partition featuring doors, sidelites/transoms and standalone windows suitable for enclosed elevator lobbies in multifamily buildings. It is comprised of glass, frames and hardware and is the first system fully tested to UL 1784 (TGP SmokeSafe™ Window & Door System).
Die-rolled steel profile swinging door with sidelite(s); North America’s first fire-rated full-lite door system certified to forced-entry standards (TGP TGProtect™ FR System). |
| | | | | | |
Industry and Competition
The global markets weWe serve encompasscustomers within institutional, commercial and residential construction and remodeling markets throughout North America, EMEAEurope, Asia and Asia Pacific. As end-users continue to adopt newer technologies, including IoT, in their facilities and single and multi-family homes, growth in electronic security products and solutions is expected to outperform growth in mechanical security products and solutions.Oceania. We also expect the security products industry will continue to benefit from favorable trends such as increased concerns about safety and security, new attention on touchless solutions that help promote a healthy environment and technology-driven innovation that enables seamless access and a better user experience as people and assets traverse multiple locations and facilities.
The security products markets are highly competitive and fragmented throughout the world, with a number of large multi-national companies and thousands of smaller regional and local companies. This high degree of fragmentation primarily reflects local regulatory requirements and highly variable end-user needs. We believe our principal global competitors are Assa Abloy AB and dormakaba Group. We also face competition in various markets and product categories throughout the world, including from SpectrumFortune Brands Holdings,Innovations, Inc. in the North American residential market. As we move into more technologically advanced product categories, we may also compete against new, more specialized competitors.
Our success depends on a variety of factors, including brand and reputation, product breadth, innovation, integration with popular technology platforms, quality and delivery capabilities, price and service capabilities. As many of our businesses sell through wholesale distribution, our success also depends on building and partnering with a strong channel network. Although price often serves as an important customer decision point, we also compete based on the breadth, innovation and quality of our products and solutions, our ability to custom-configure solutions to meet individual end-user requirements and our global supply chain.
Products and Services
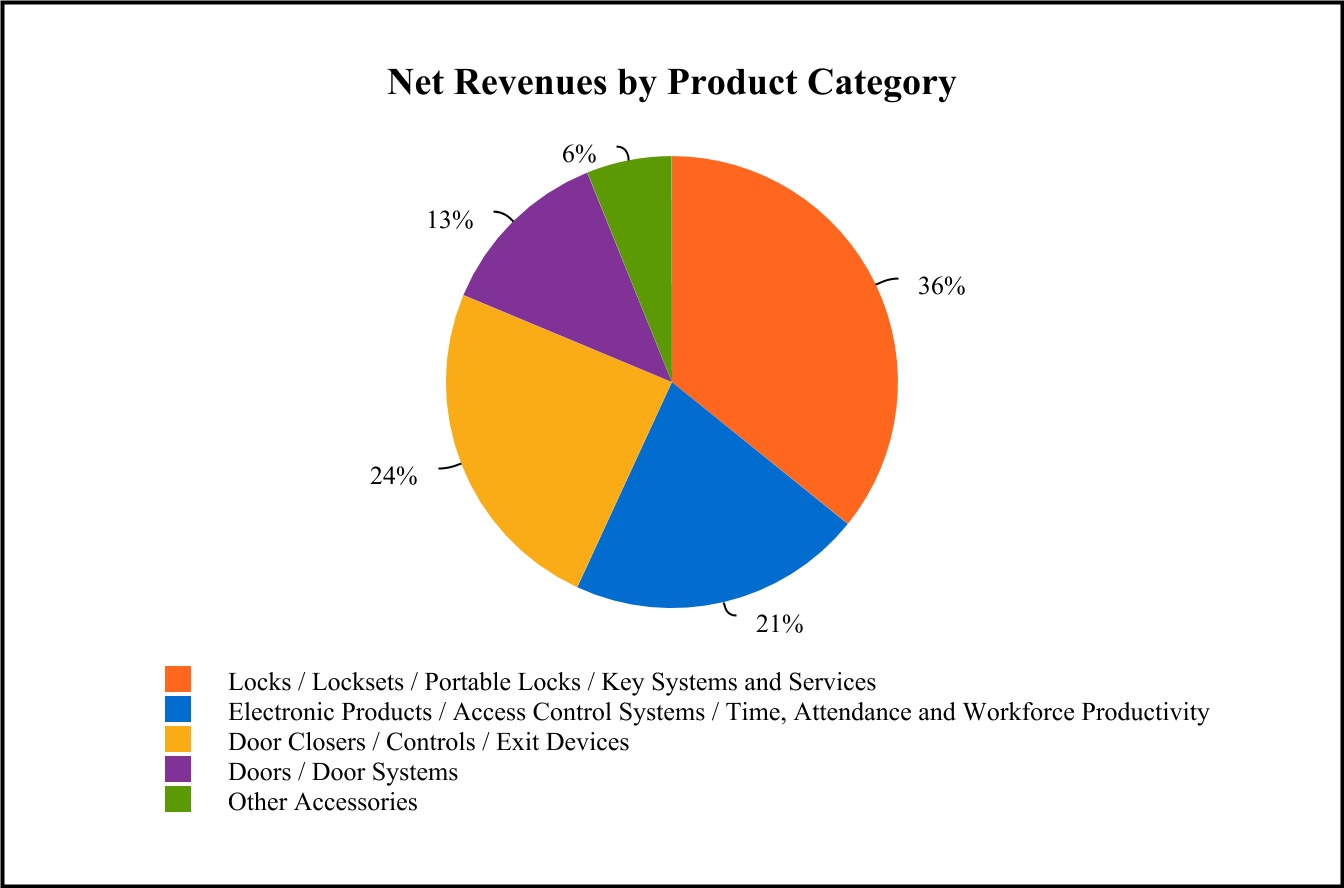
We offer anthe following extensive and versatile portfolio of mechanicalsecurity and electronic securityaccess control products and solutions across a range of market-leading brands:
•Locks, locksets, portable locks and key systems and services: A broad array of cylindrical, tubular and mortise door locksets, security levers and master key systems that are used to protect and control access and a range of portable security products, including bicycle, small vehicle and travel locks. We also offer locksmith services in select locations;locks;
•Electronic security products and access control systems: A broad range of electrified locks, electrified door closers and exit devices, access control products and systems, credentials and credential readers and accessories, including IoT, Bluetooth Low Energy, Power over Ethernet and cloud-based solutions;
•Time, attendance and workforce productivity systems: These products are designed to help business customers manage and monitor workforce access, attendance and employee scheduling;
•Door closers, controls and systems and exit devices: An extensive portfolio of life-safety products and solutions generally installed on fire doors and facility entrances and exits. Door controls include both mechanical door closers and automatic door operators. Exit devices, also known as panic hardware, provide rapid egress to allow building occupants to exit safely in an emergency;
•Electronic security productsemergency. Door controls and access control systems: A broad include mechanical door closers, automatic door operators, as well as high-performance interior and storefront door systems. In addition, we offer a full range of electrified locks, access control systems, key cardautomatic entrance solutions, including sliding, swing, folding and reader systemsICU doors, as well as an array of sensors, controls and accessories, including IoT, Bluetooth Low Energy (BLE), Power over Ethernetsecurity options for commercial and cloud-based solutions;
•Time, attendance and workforce productivity systems: Products and services designed to help business customers manage and monitor workforce access control parameters, attendance and employee scheduling. We also offer ongoing aftermarket services in addition to design and installation offerings;institutional buildings;
•Doors, accessories and door systemsother: A portfolio of hollow metal, glass and specialty doors, and door systems; and
•Other accessories: Aas well as a variety of additional security products and product components, including hinges, door pulls, door stops, bike lights, louvers, weather stripping, thresholds and other accessories, as well as certain bathroom fittings and accessibility aids.aids; and
Customers
We sell most of our products and solutions through distribution and retail channels, including specialty distribution, e-commerce and wholesalers. We have built a network of channel partners that help our customers choose the right solution to meet their security needs and help commercial and institutional end-users fulfill and install orders. We also sell through a variety of retail channels, including large do-it-yourself home improvement centers, multiple online and e-commerce platforms, as well as small, specialty showroom outlets. We work with our retail partners on developing marketing and merchandising strategies to maximize their sales per square foot of shelf space. Through a few of our businesses, most notably our Access Technologies business, Interflex and API Locksmiths businesses andour Global Portable Security brands, we also provide products and services directly to end-users.
Our 10 largest customers represented approximately 24%25% of our total Net revenues in 2020.2023. No single customer represented 10% or more of our total Net revenues in 2020.2023.
Sales and Marketing
In markets where we sell through commercial and institutional distribution channels, we employ sales professionals around the world who work with a combination of end-users, security professionals, architects, contractors, engineers and distribution partners to develop specific, custom-configured solutions forto meet our end-users’ needs. Our field sales professionals are assisted by specification writers who work with architects, engineers and consultants to help design door openings and security systems to meet end-users’ functional, aesthetic and regulatory requirements. Both groups are supported by dedicated customer care and technical sales-support specialists worldwide. We also support our sales efforts with a variety of marketing efforts, including trade-specific advertising, cooperative distributor merchandising, digital marketing and marketing at a variety of industry trade shows.
In markets in whichwhere we sell through retail and home-builderhomebuilder distribution channels, we have teams of sales, merchandising and marketing professionals who help drive brand and product awareness through our channel partners and to consumers. We utilize a variety of advertising and marketing strategies, including traditional consumer media, retail merchandising, digital marketing, retail promotions and builder and consumer trade shows, to support these teams.
We also work actively with several industry bodies around the world to help promote effective and consistent safety and security open platform standards. For example, we are members of the American Association of Automatic Door Manufacturers (AAADM), Builders Hardware Manufacturers Association (BHMA), Connectivity Standards Alliance (CSA), Construction Specification Institute, Door and Hardware Institute (DHI), FiRa Consortium, InternetNational Association of Things Consortium (IoTC)State Fire Marshals (NASFM), Partner Alliance for Safer Schools (PASS), Physical Security Interoperability Alliance (PSIA), Security Industry Association (SIA), Security Technology Alliance, Z-Wave Alliance, The European Federation of Associations of Locks and Builders Hardware Manufacturers (ARGE), ASSOFERMA (Italy), BHE (Germany), Door Hardware Federation (UK), Open Security Standards Association (Germany) and UNIQ (France).
Production and Distribution
We manufacture our products in ourseveral geographic markets around the world. We operate 3031 principal production and assembly facilities – 1518 in our Allegion Americas 9segment and 13 in EMEA and 6 in Asia Pacific.our Allegion International segment. We own 16 of these facilities and lease the others. Our strategy is to produce in the region of use, wherever appropriate, to allow us to be closer to the end-user and increase efficiency and timely product delivery. Much of our U.S. based residential portfolio is manufactured in the Baja region of Mexico under the Maquiladora, Manufacturing and Export Services Industry ("IMMEX") program (formerly known as the maquiladora program).program. In managing our network of production and assembly facilities, we focus on continuous improvement in customer experience, employee health and safety, productivity, resource utilization and operational excellence.
We distribute our products through a broad network of channel partners. In addition, third-party manufacturing and logistics providers perform certain manufacturing, storage and distribution services for us to support certain parts of our manufacturing and distribution network.
Raw Materials
We continue to support our region-of-use production strategy with corresponding region-of-use supplier partners where available.for much of our supply base. Our global and regional commodity teams work with production leadership, product management and materials management teams to ensure adequatesource materials are available for production.
We purchase a wide range of raw materials, including steel, zinc, brass and other non-ferrous metals, as well as other parts and components, such as electronic components, to support our production facilities. Where appropriate, we may enter into fixed-cost contracts
In late 2022, supply chain disruptions experienced in prior years moderated and the availability of many raw material categories improved. The prior actions taken to lower overall costs.
Intellectual Property
Intellectual property, inclusive of certain patents, trademarks, copyrights, know-how, trade secrets and other proprietary rights, is important to our business. We create, protect and enforce our intellectual property investments in a variety of ways. We work actively in the U.S. and internationally to try to ensure the protection and enforcement of our intellectual property rights. We use trademarks on nearly all of our products and believe such distinctive marks are an important factor in creating a market for our goods, in identifying us and in distinguishing our products from others. We consider our CISA, Interflex, LCN, Schlage, SimonsVoss, Von Duprin and other associated trademarks to be among our most valuable assets, and we have registered these trademarks in a number of countries. Although certain proprietary intellectual property rights are important to our success, we do not believe we are materially dependent on any particular patent or license, or any particular group of patents or licenses.
Facilities
We operate through a broad network of sales offices, engineering centers, 3031 principal production and assembly facilities and several distribution centers throughout the world. Our active properties represent approximately 6.37.6 million square feet, of which approximately 37%48% is leased. The following table shows the location of our principal worldwide production and assembly facilities:
| | | | | | | | | | | | | | |
| Production and Assembly Facilities |
| Allegion Americas | | EMEA | | Asia PacificAllegion International |
| Blue Ash, Ohio | | Clamecy, France | | Auckland, New Zealand |
Boulder, Colorado | | Durchhausen, Germany | | Brooklyn, Australia |
| Chino, California | | Faenza, Italy | | Bucheon, South KoreaBlackburn, Australia |
| Ensenada, Mexico | | Feuquieres, France | | Jinshan, ChinaBrooklyn, Australia |
| Everett, Washington | | Monsampolo, ItalyClamecy, France |
| Farmington, Connecticut | | Durchhausen, Germany |
| Greenfield, Indiana (2) | | Melbourne, AustraliaFaenza, Italy |
| Indianapolis, Indiana | | Osterfeld, Germany | | Sydney, AustraliaFeuquieres, France |
| Irving, Texas | | Renchen, GermanyJinshan, China | | |
| McKenzie, Tennessee | | Veenendaal, NetherlandsMonsampolo, Italy | | |
| Mississauga, Ontario | | Zawiercie, PolandOsterfeld, Germany | | |
| Perrysburg, Ohio | | | | Renchen, Germany |
| Princeton, Illinois | | Veenendaal, Netherlands |
| Queretaro, Mexico | | | Zawiercie, Poland |
| Security, Colorado | | | | |
| Snoqualmie, Washington | | | | |
| Tecate, Mexico | | | | |
| Tijuana, Mexico | | | | |
Research and Development
We are committed to investing in our research and development capabilities with a focus on technology innovations that will deliver growth through the introduction of new products and solutions. In addition, we invest in initiatives that continuously drive improvements in product cost, quality, safety and sustainability.
Our research and development team is managed as a global, collaborative group to identify and develop new technologies and worldwide product platforms. We organize ourOur regionally located resources regionally to leverage expertise in local standards and configurations and apply those to adapt products for the benefit of our customers. Further, we operate a global technology center in Bangalore,Bengaluru, India, which augments and supports theour regional engineering and technology teams.
Seasonality
Our business experiences seasonality that varies by product and service line. BecauseFor instance, as more construction and do-it-yourself projects occur during the second and third calendar quarters of each year in the Northern Hemisphere, our security product sales related to those projects are typically higher in those quarters than in the first and fourth calendar quarters. However, certain other businesses typically experience higher sales in the fourth calendar quarter due to demand for services and project timing. In 2020, we experienced lower sales volumes during the second quarter, principally due
Human Capital
Our human capital strategy is based on our values and is foundational to the economic challenges stemming from the COVID-19 pandemic, which were most pronounced during this quarter. Thisachieving our business strategy. Our workplace culture is not anticipated to be a long-term trend in the seasonalitybased on practices that reward performance, provide growth and development opportunities, and support employees with competitive compensation and benefits packages.
As of our businesses. Net revenues by quarter for the years ended December 31, 2020, 20192023, we had approximately 12,400 employees worldwide, of which approximately 12,200 are full-time employees. Approximately 48% of employees are employed within the U.S. and 2018,approximately 52% based outside the U.S. Among our U.S. based employees, approximately 15% were subject to collective bargaining agreements with various labor unions. Outside the U.S., we have employees in certain countries, particularly in Europe, that are represented by an employee representative organization, such as follows:a works council. Our employee base is supplemented by contingent labor where business demand fluctuates or we experience short-term needs for specialized skills. We believe our relations with our workforce in both unionized and non-unionized settings are generally positive.
| | | | | | | | | | | | | | | | | | | | | | | | | | |
| | First Quarter | | Second Quarter | | Third Quarter | | Fourth Quarter |
| 2020 | | 25% | | 21% | | 27% | | 27% |
| 2019 | | 23% | | 26% | | 26% | | 25% |
| 2018 | | 22% | | 26% | | 26% | | 26% |
Human Capital
The Company’s human capital strategy is foundationalWe want to achievingattract talent with core capabilities relevant to our long-term corporate business strategystrategy: customer focus, innovation, partnering, pace and agility and collaboration. We use a variety of recruitment tactics to ensure a strong base of labor for manufacturing operations and to build the responsibilitybase of our Senior Vice President – Human Resourcestalent with these capabilities. Throughout the recruitment cycle, we provide a technology-enabled seamless experience for internal and Communications. To ensure we attractexternal candidates and retain top talent, we strive for a diverse and inclusive culture that rewards performance, provides growth and development opportunities and supports employees and their families through competitivehiring managers. Our compensation benefits and numerous volunteer and charitable giving opportunities.
As of December 31, 2020, we had approximately 11,500 employees around the world, the vast majority working full time. Our employee base is supplemented by contingent labor where demand fluctuates or we experience short-term needs for specialized skills.
Compensation and Benefits
Compensation and benefit programs are tailoreddesigned to be competitive in the geographies where we work, including thea total rewards package (which varies by country/region) that includes hourly and salaried compensation, performanceperformance-based incentive and long-term equity incentive plans, retirement, insurance and government social welfare programs, disability and family leave, health and wellness programs, education benefits to pursue degrees and certifications and additional offerings to support financial stability and personal planning. Health and wellness programs are provided globally and contribute to a productive, sustainable workforce by empowering our employees to take personal responsibility for their health, safety and well-being. In addition, we maintain tobacco-free facilities and pursue strategies to incentivize healthy behaviors and outcome-driven rewards. Pay for performance strategies consider not only accomplishments, but how individuals achieve results. The Allegion Leadership Behaviors – be a pioneer, break boundaries, coach, champion change, be courageous and inspire – are used to identify key talent and to train and develop aspiring leaders. They also work in concert with our performance management system to reinforce our values and code of conduct in assessing how people lead and deliver top performance.
Talent Attraction
Talent attraction efforts begin well before people walk in our doors. Around the world, our sites partner with schools and support teachers, providing mentoring, grants, scholarships, internships, co-op programs, classroom technology and on-site activities. Our sites also sponsor science, technology, engineering and math ("STEM") programs and competitions such as robotics and engineering competitions. These programs expose students to careers in manufacturing and technology and provide educators with programming to encourage academic excellence and social development.
Key capabilities have been identified for our long-term corporate business strategy: talent, customer focus, innovation, partnering, pace and agility and collaboration. In recruiting for open positions, we participate in community job fairs and outreach to secondary schools, technical training programs, colleges and universities; promote open positions through internal and external recruiters, on websites and through social media; and encourage Company employees to refer talent.
Talent Development and Succession Planning
Talent development and succession planning are key components of the Allegion Operating System, which supports governance, reporting processes and management of the business. Our performance management system includes annual performance reviews for all permanent salaried employees. Talent development and succession planning takes place at all levels of the organization are instrumental in ensuring we have the key capabilities to deliver the value proposition expected by our customers and employees. Inclusive succession planning is supported through the Allegion Leadership Behaviors, individual career mapping, assessment of performance and talent pipeline planning up to and including the Chief Executive Officerexecutive leadership team ("CEO"ELT"). On aAs part of their quarterly basis,business review, the executive teamELT reviews talent development, focusing on developing a diverse succession bench, as part of their quarterly business review and a key component of the Allegion Operating System, our system of annual operation to support governance, reporting processes and management of the business.pipeline. These cross-functional reviews highlight individuals who are ready for new opportunities, individuals who are on a special assignment or project and individuals early in their career that demonstrate emerging leadership skills.
Learning and Development
Opportunities for on-going learning and development are delivered to employees through structured coursework, on-site and expert-led training and experiential, applied development. The Allegion Academy is offered globally, supporting multiple languages and providing more than 17,000thousands of self-guided online courses, as well as community channels on targeted skills and inclusion and diversity.courses. We offer programs to provide successive levels of development, including reskilling and upskilling existing employees, as well as strengths-based leadership curriculum. Enterprise excellence initiativescurriculum and sprint teams expand skills in lean manufacturingglobal programs for employee mentoring and quality principles and lead to redesigning workflow to boost productivity and reduce waste.
Employee-led resource and affinity groups provide enrichment opportunities for women’s leadership, early-career professionals, creativity and innovation, health and fitness, community volunteering and philanthropy.
Engagement Inclusion and Diversity, Equity and Inclusion ("DEI")
A commitment to engagement, inclusionEngagement and diversity is core toDEI are also parts of the Allegion Operating System. Engagement surveys provide a mechanism to gather direct employee feedback, give team leaders with insights on potential areas of focus and help themallow leaders to prioritize and take actionact on their teams’ foundational, inclusion, growth and development needs. Strengths-based leadership is an element of our commitment to inclusion: the more employees understand their own strengths, the better equipped they are to add value and appreciate the contributions of diverse members of their teams.
Inclusion and diversity are topics for learning communities, employee roundtables and ongoing, regular analysis and dialogue among our people leaders, executive leadership and our Board of Directors. We believe in fundamental standards that support our employees, including a commitment towhile building and maintaining diverse and inclusive workplaces, safe and healthy practicespractices. Employee led resource and competitive wagesaffinity groups provide opportunities for women's leadership, early career professionals, allies and benefits. We embrace all differences and similarities among colleagues and within the relationships we foster with customers, suppliers and the communities where we live and work. Whatever background, experience, race, color, national origin, religion, age, gender, gender identity, disability status, sexual orientation, protected veteran status or any other characteristic protected by law, we make sure that potential and current employees have every opportunity for application and the opportunity to give their best at work because it’s the right thing to do.
We are dedicated to fulfilling equal opportunity commitments in all decisions regarding all employment actions and at all levels of employment. In partnership with the Company’s Human Resources organization, the Company’s Equal Employment Opportunity Officer ensures that the applicable policy and procedures are appropriately established, implemented and disseminated, including those prohibiting discrimination, harassment, bullying and/or retaliation.
Civic Involvement
Civic involvement is partmembers of the value proposition we offerLGBTQIA+, Black, veteran and Hispanic communities.
The efforts of Allegion’s DEI Steering Committee, our ELT and our employee resource groups, are driving expectations and accountability while creating role models and change champions. Our DEI strategy has three core pillars:
•Learn & listen deeply: Learn to recognize biases and mitigate them. Seek to first understand an individual's perspective rather than respond or act;
•Unite widely: Create a workplace where all employees feel welcomed, respected and supports inclusion, diversity, growthvalued, enabling customers to more easily connect with our brands through our people; and development. The Company and its employees provide multi-faceted support for
•Take action: Identify the unique things that impact our organization, our communities guided by three philanthropic pillars: safety and security; wellness; and addressing the unique needs of the communities where we work, live and thrive. Corporate sponsorships and voluntary employee payroll deductions support a wide range of non-profits, including those that address housing and school security and safety; children and youth programs; education and scholarships for people of color and those who are economically disadvantaged and support for Historically Black Colleges and Universities; community safety nets for basic needs (e.g., food, shelter, transportation) for underserved people and to break the cycle of poverty; wellness, mental health, health research, emergency relief and blood supply initiatives; and programs to advance equality, justice and address systemic bias. In addition to corporate sponsorships, site leaders and employees are encouraged to organize local volunteer and fundraising activities, provide grants to local organizations and serve on boards and committees. Recognizing the growing number of people facing food insecurity in the wake of the COVID-19 pandemic, we supplemented on-going food drives at local sites with a one-time $500,000 gift to support communities in need in the fourth quarter of 2020.
Respect for Human Rights
Our respect for human rightsisexpressed instandards for our employees, our business partners, our customers and our communities. We have adopted and continue to uphold our Global Human Rights Policy, with standards that align with basic working conditions and human rights concepts advanced by international organizations such as the International Labor Organization and the United Nations. This policy also represents our own minimum standards for working conditions and human rights in our business and supply chains. In addition, we conduct risk assessments and continue to have conversations with the suppliers and companies we work with about the importance of human rights.
Employee Health and Safety
Employee health and safety are top priorities and we consistently rank asintegral to the safest among leading competitors on core measures such as the total recordable incident rate.Company's growth strategy. ‘Be safe, be healthy’ is a core organizational value in our proactive safety cultureculture. We continue to adapt to changing health conditions at a local level and has guided our response to the COVID-19 pandemic throughout 2020. We have adopted numeroussupport a wide range of health and safety measures, in accordanceincluding encouraging preventative health measures such as COVID-19 and influenza vaccines and booster shots.
The ELT, with best-practice safe hygiene guidelines issued by recognized health experts like the U.S. Centersoversight from our Board of Directors, is responsible for Disease Controlrisk management, employee accountability, safety hazard recognition and Prevention (“CDC”), the European Centre for Disease Preventionexecuting safety initiatives. We monitor leading and Control (“ECDC”) and the World Health Organization (“WHO”), as well as any applicable government mandates. Theselagging indicators related to health and safety measures include, but are not limited to:as part of our ongoing management of the Allegion Operating System and regularly update the Corporate Governance and Nominating Committee of the Board of Directors on key developments and employee health and safety topics.
•Work-from-home arrangements for employees, where possible;
•Continuous safe hygiene education in accordance with evolving guidelines;
•Regular communication updates to leadership and team members;
•Aggressive and regular deep cleaning and disinfecting schedules;
•Social distancing measures, such as signage and physical barriers or reconfigurations of workspaces;
•Reduced density measures, such as staggering work shifts and breaks;
•Mask use requirements and expectations at our facilities;
•Temperature and health screenings prior to entering facilities;
•Increased available supplies for employees, like masks, cleaning solutions, hand sanitizers, thermometers and gloves; and
•Temporary travel, visitor and in-person meeting restrictions.
Senior executives and the CEO have responsibility for risk management, employee accountability and safety hazard recognition and take a personal responsibility toward executing on safety initiatives. The Company monitors leading and lagging indicators related to health and safety as part of its ongoing management of the Allegion Operating System and regularly updates the Corporate Governance and Nominating Committee of the Board of Directors on key accomplishments and employee health and safety topics.
Regulatory Matters
We are subject to a variety of federal, state and local laws and regulations, both within and outside the U.S., relating to environmental, healthEnvironmental, Health and safety concerns.Safety ("EHS") matters. We are committed to conducting our business in a safe, environmentally responsible and sustainable manner, in compliance with all applicable environmental, health and safetyEHS laws and regulations, and in a manner that helps promote and protect the health and safety of our environment, associates, customers, contractors and members of our local communities worldwide. We operate with principles that support our proactive commitments, including:
•Integrating sound environmental, health, safety (EHS)EHS and sustainability strategies in all elements of our business functions, including objectives and measurements;
•Conducting periodic, formal evaluation of our compliance status and annual review of objectives and targets;
•Creating a workplace culture where all employees are responsible for safety;
•Making continuous improvements in EHS and sustainability management systems and performance, including the reduction in the usage of natural resources, waste minimization, prevention of pollution and prevention of workplace accidents, injuries and risks;
•Designing, operating and maintaining our facilities in a manner that minimizes negative EHS and sustainability impacts;
•Using materials responsibly, including where feasible, the recycling and reuse of materials;materials, where feasible; and
•Acting in a way that shows sensitivity to community concerns about EHS and sustainability issues.
We recognize that these principles are critical to our future success. We have a dedicated environmental program designed to reduce the utilization and generation of hazardous materials during the manufacturing process and to remediate any identified environmental concerns. As to the latter, we are currently engaged in site investigations and remediation activities to address environmental cleanup from past operations at current and former production facilities. We also regularly evaluate our remediation methods that are in addition to, or in replacement of, those we currently utilize based upon enhanced technology and regulatory changes. We are sometimes a party to environmental lawsuits and claims and have, from time to time, received notices of potential violations of environmental laws and regulations from the U.S. Environmental Protection Agency (the "EPA"("EPA") and similar state authorities. We have also been identified as a potentially responsible party ("PRP") for cleanup costs associated with off-site waste disposal at federal Superfund and state remediation sites. For all such sites, there are other PRPs and in most instances,we believe our involvement is minimal.
In estimating our liability, we have assumed that we will not bear the entire cost of remediation of any site to the exclusion of other PRPs who may be jointly and severally liable. The ability of other PRPs to participate has been taken into account, based on our understanding of the parties’ financial condition and probable contributions on a per site basis. Additional lawsuits and claims involving environmental matters are likely to arise from time to time in the future. For a further discussion of our potential environmental liabilities, see NoteNotes 2 and 21 to the Consolidated Financial Statements.
Available Information
We are required to file annual, quarterly and current reports, proxy statements and other documents with the SEC under the Securities Exchange Act of 1934.Act. The SEC maintains an Internet website that contains reports, proxy and information
statements and other information regarding issuers that file electronically with the SEC. The public can obtain any documents that are filed by us at www.sec.gov.
In addition, the Company's Annual Report on Form 10-K, as well as future quarterly reports on Form 10-Q, current reports on Form 8-K and any amendments to all of the foregoing reports, are made available free of charge on our Internet website ((https://www.allegion.com)www.allegion.com) as soon as reasonably practicable after such reports are electronically filed with or furnished to the SEC.
Throughout this Form 10-K, we refer to additional information that may be found or is available on our websites. The contents ofinformation contained on, or that may be accessed through, our website arewebsites is not incorporated by reference ininto, and is not part of, this report.Form 10-K.
Item 1A. RISK FACTORS
We discussare subject to future events, risks and uncertainties – many of which are beyond our expectations regarding future performance, eventscontrol – that could materially and outcomes in this Form 10-K, quarterlyadversely affect our business, financial condition, results of operations and annual reports, press releases and other written and oral communications. All statements except for historical and present factual information are “forward-looking statements” and are based on financial data and business plans available only as of the time the statements are made, which may become outdated or incomplete. Forward-looking statements are inherently uncertain, and investors must recognize that events could significantly differ from our expectations.cash flows. You should carefully consider the risk factors discussed below, together with all the other information included in this Form 10-K, in evaluating us our ordinary shares and our senior notes.securities. If any of the events, risks or uncertainties below actually occurs, our business, financial condition, results of operations and cash flows could be materially and adversely affected. Any such adverse effect may cause the trading price of our ordinary sharessecurities to decline, and as a result, you could lose all or part of your investment in us. Our business, financial condition, results of operations and cash flows may also be materially and adversely affected by events, risks and uncertainties not known to us or events, risks and uncertainties that we currently believe to be immaterial. We assume no obligation to update any forward-looking statements as a result of new information, future events or other factors.
StrategicEconomic, Market and OperationalFinancial Risks
Our normal business operations and performance have been, and are expected to continue to be, adversely impacted by the global COVID-19 pandemic.
The COVID-19 outbreak, which was declared by the WHO as a pandemic in March 2020, and preventative measures taken to contain or mitigate this pandemic have caused, and are continuing to cause, business slowdowns or shutdowns in various regions around the world. This pandemic has also caused, and may continue to cause, disruption to our global supply chain and business operations, in addition to the various effects noted elsewhere within the risk factors contained in this Annual Report on Form 10-K. Actions taken to help limit the spread of COVID-19, such as general public health decrees or other government mandates to restrict business activities and travel, avoid large gatherings or to self-quarantine, have impacted and will likely continue to impact our ability to carry out business as usual, including the temporary suspension of some of our operations, shortages in materials, reduction in customer demand, increased absenteeism, costs associated with operational changes and an extended period of remote work arrangements for some of our employees which could increase cybersecurity risks and other operational risks. Conversely, as governments ease their restrictions and social interactions increase prior to the development and distribution of an effective vaccine or treatments for COVID-19, preventative and precautionary measures may not be sufficient to mitigate the risk of increased infection and could result in increased illness among our employees, business partners and others, and lead to further business interruption. In addition, a significant number of our customers, suppliers, vendors and other business partners have been adversely affected by the COVID-19 pandemic. While we cannot predict the impact that this pandemic will continue to have on our customers, suppliers, vendors and other business partners and each of their financial conditions, any material adverse effects on these partiesmacroeconomic factors. Ongoing macroeconomic challenges could adversely impact us.our business, results of operations, financial conditions and cash flows.
The global economic uncertainty due to this pandemic has also negativelyMacroeconomic challenges, including ongoing supply chain disruptions and delays, material, electronic component and labor shortages, cost inflation, rising interest rates and volatility in the capital markets, have impacted, and may continue to adversely affect,impact, our business, our customers and our suppliers. These challenges may also make it more challenging for us to manufacture and deliver products to our customers, could cause periodic production interruptions and supply constraints, impact our ability to forecast and plan for future business activities and, if not adequately managed, could have a material adverse impact on our business, results of operations, financial condition and cash flows.
Further, demand for our products and solutions is impacted by the strength of institutional, commercial and residential construction and remodeling markets, which are sensitive to national, regional and local economic conditions. As a result, deterioration of these macroeconomic conditions (or weakness in these conditions existing for an extended period of time), a decline in general economic activity or recession in the U.S. or global economy could slow demand for new construction or remodeling projects and result in our customers cancelling or delaying orders, which in turn could erode average selling prices and result in declines in our revenues, profitability and cash flows.
Increased prices and inflation could negatively impact our margin performance and our financial results.
Elevated levels of inflation, including rising prices for raw materials, parts and components, freight, packaging, labor and energy, increases our costs to manufacture and distribute our products and services, and we may be unable to pass these increased costs on to our customers. We do not currently use financial derivatives to hedge against volatility in commodity prices; however, we utilize firm purchase commitments, where possible, to help mitigate risk. The pricing of some materials, parts and components we use is based on market prices. To mitigate this exposure, we may use annual price contracts to minimize the impact of inflation and to benefit from deflation.
Additionally, we are exposed to fluctuations in other costs such as packaging, freight, labor and energy prices. If inflation in these costs increases beyond our ability to control for them through measures such as implementing operating efficiencies, or we are not able to increase prices to sufficiently offset the effect of various cost increases without negatively impacting customer demand, our margin performance and results of operations would be negatively impacted.
Our global operations subject us to economic risks.
Our businesses operate around the world in various geographic regions and product markets. Additionally, we procure various products, parts, components and services from supplier partners located throughout the world. Our global operations depend on products manufactured, purchased and sold in the U.S. and internationally, including in Australia, Canada, China, Europe, Mexico, New Zealand and the Middle East. The political, economic and regulatory environments in which we operate are becoming increasingly volatile and uncertain. Accordingly, we are subject to multiple risks that are inherent in operating and sourcing globally, including:
•Changes to trade agreements, sanctions, import and export regulations, including imposition of burdensome tariffs and quotas, and customs duties;
•Changes in applicable tax regulations and interpretations;
•Economic downturns;
•Social and political unrest, instability, national and international conflict, including the conflicts in the Middle East and the war between Russia and Ukraine, border closures, civil disturbances, terrorist acts and other geographical disputes and uncertainties;
•Government measures to restrict business activity, for example, to prevent the spread of a communicable disease;
•Changes in laws and regulations or imposition of currency restrictions and other restraints in various jurisdictions;
•Limitation of ownership rights, including expropriation of assets by a local government, and limitation on the ability to repatriate earnings;
•Sovereign debt crises and currency instability in developed and developing countries;
•Difficulty in staffing and managing global operations;
•Difficulty in enforcing agreements, collecting receivables and protecting assets through non-U.S. legal systems; and
•Difficulty in transporting materials, components and products.
These risks have increased our cost of doing business in the U.S. and internationally. These risks may also increase our counterparty risk, disrupt our operations, disrupt the ability of suppliers and customers to fulfill their obligations, increase our effective tax rate, increase the cost of our products, limit our ability to sell products and services in certain markets, reduce our operating margin and cash flows and/or negatively impact our ability to compete.
Our business relies on the institutional, commercial and residential construction and remodeling markets.
Demand for our security products and solutions relies on the institutional, commercial and residential construction and remodeling markets, which are marked by cyclicality based on overall economic conditions, including consumer confidence and disposable income, corporate and government spending, work-from-home trends, availability of credit and demand for new housing and infrastructure. Weakness or instability in one or more of these markets may cause current and potential customers to delay or cancel major capital projects or otherwise choose not to make purchases, which could negatively impact the demand for our products and solutions and erode average selling prices.
Currency exchange rate fluctuations have had, and may continue to have, an adverse effect on our business, financial condition, results of operations and cash flows.
We are exposed to a variety of market risks, including the effects of changes in currency exchange rates. See "Part II, Item 7A. Management’s Discussion and Analysis of Financial Condition and Results of Operations – Quantitative and Qualitative Disclosures About Market Risk."
Approximately 25% of our 2023 Net revenues were derived outside the U.S., and we expect sales to non-U.S. customers to continue to represent a significant portion of our consolidated Net revenues. Although we may enter into currency exchange contracts to reduce our risk related to currency exchange fluctuations, changes in the relative fair values of currencies occur from time to time and in some instances have had a significant impact on our results of operations. We do not hedge against all our currency exposure, and therefore, our results of operations will continue to be susceptible to impacts from currency fluctuations.
We also translate assets, liabilities, revenues and financial condition. For example, this pandemic has led to changesexpenses denominated in commercial real estate occupancy, increasesnon-U.S. dollar currencies into U.S. dollars for our Consolidated Financial Statements based on applicable exchange rates. Consequently, fluctuations in work-from-home arrangements, constraints on government and institutional budgets and an uncertain business climate, which have all contributed to declines and delays in new construction and renovation activity during 2020, including in manythe value of the commercial and institutional construction markets we serve. These challengesU.S. dollar compared to other currencies may have a material impact on the value of these items in our Consolidated Financial Statements, even if their value has not changed in their original currency. Further, certain of our businesses may invoice customers in a currency other than its functional currency, or may be significantinvoiced by suppliers in a currency other than its functional currency, which could result in unfavorable translation effects on these businesses and continue beyondour results of operations.
We may be required to recognize impairment charges for our goodwill, indefinite-lived intangible assets and other long-lived assets.
At December 31, 2023, the COVID-19 pandemic,net carrying value of our goodwill and the rateother indefinite-lived intangible assets totaled approximately $1.4 billion and sustainability of future growth remains uncertain, as the long-term impacts of the pandemic and related market disruption$104 million, respectively. Pursuant to U.S. generally accepted accounting principles ("GAAP"), we are not yet known.
Additionally, as a result of the global economic disruption and uncertainty duerequired to the COVID-19 pandemic, interim impairment tests were performed on selectannually assess our goodwill and indefinite-lived trade nameintangible assets for impairment. In addition, interim assessments must be performed for these and other long-lived assets whenever events or changes in the first quartercircumstances indicate that an impairment may have occurred. Significant disruptions to our business or end market conditions, protracted economic weakness (including a potential economic downturn or recession), unexpected significant declines in operating results of 2020, resultingreporting units, divestitures or market capitalization declines may result in recognition of impairment charges of approximately $96.3 million. If the on-going economic impact of the COVID-19 pandemic proves to be more severe than estimated, the economic recovery takes longerour goodwill, indefinite-lived intangible or other long-lived assets. Any charges relating to materialize or does not materialize as strongly as anticipated, thissuch impairments could result in further impairment charges in the future.
Despite our efforts to manage and mitigate these impacts to the Company, their ultimate impact also depends on factors beyond our knowledge or control, including the duration and severity of this pandemic, third-party actions taken to contain its spread and mitigate its public health effects, the development, distribution and acceptance of an effective vaccine and the pace of global economic recovery following containment of the spread. The impact of the COVID-19 pandemic continues to evolve, and its ultimatehave a material adverse impact on our business is highly uncertain and difficult to predict. The continued spreadresults of COVID-19 may have further adverse impactsoperations in the periods when recognized. Based on our business, operations, customer demand, supply chain, cash flow generation, financial position2023 assessment, it was determined that two of the Company's indefinite-lived trade names in the International segment were impaired, and we recorded a $7.5 million impairment charge.
The capital and credit markets are important to our business.
Continued instability in U.S. and global capital and credit markets, including market disruptions, limited liquidity and interest rate volatility or reductions in the credit ratings assigned to us by independent ratings agencies, could reduce our access to capital markets, increase our costs of borrowing or adversely impact our ability to obtain favorable financing terms in the future. In particular, if we are unable to access capital and credit markets on terms that are acceptable to us, we may also exacerbatenot be able to execute potential merger and acquisition plans, make other risksinvestments or fully execute our business plans and uncertainties described in this Annual Report on Form 10-K. Further, our management is focused on mitigating the impacts of COVID-19 which has required, and will continue to require, a large investment of time and resources, which may divert attention and resources from other business matters.strategy.
Our suppliers and customers are also dependent upon the capital and credit markets. Limitations on the ability of customers, suppliers or financial counterparties to access credit could lead to insolvencies of key suppliers and customers, limit or prevent customers from obtaining credit to finance purchases of our products and services, delay institutional, commercial and/or residential construction and remodeling projects and cause delays in the delivery of key products from suppliers.
There are risks associated with our outstanding and future indebtedness.
We had approximately $2 billion of outstanding indebtedness at December 31, 2023. In addition, we have a senior unsecured revolving credit facility (the "2021 Revolving Facility") that permits borrowings of up to $500 million. A portion of our cash flows from operations is dedicated to servicing our indebtedness and will not be available for other purposes, including our operations, capital expenditures, payment of dividends, share repurchases or future business opportunities or other strategic investments.
At December 31, 2023, our borrowings included a variable rate term loan facility (the "2021 Term Facility", and together with the 2021 Revolving Facility, the "2021 Credit Facilities"). The 2021 Credit Facilities had a combined outstanding variable rate balance of $225.0 million at December 31, 2023, which exposes us to variable interest rate risk. Applicable variable interest rates have increased throughout 2023, resulting in increased Interest expense. We are also exposed to the risk of continued rising interest rates to the extent we fund our short or long-term financing needs with variable-rate borrowings under the 2021 Revolving Facility. If variable base rates under the 2021 Credit Facilities continue to increase in the future, our Interest expense could increase as well. For more details about our interest rate exposure under the 2021 Credit Facilities, please see Part II. Item 7A.
Our ability to make scheduled payments or to refinance our debt obligations depends on our financial and operating performance, which is subject to prevailing economic and competitive conditions and to certain financial, business and other factors beyond our control, such as the credit ratings assigned to us by independent ratings agencies or our ability to access capital markets on acceptable terms. If our cash flows and capital resources are insufficient to fund our debt service obligations, we may be forced to reduce or delay capital expenditures, reduce or eliminate the payment of dividends, sell assets, seek additional capital or seek to restructure or refinance our indebtedness. These alternative measures may not be successful and may not permit us to meet our scheduled debt service obligations. In such event, we could face substantial liquidity problems and might be required to sell material assets or operations to attempt to meet our debt service and other obligations. If we are not able to maintain compliance with stated financial covenants or if we breach other covenants in any debt agreement, we could be in default under such agreement or trigger a cross-default of other debt instruments. Such a default would adversely affect our credit ratings, may allow our creditors to accelerate the related indebtedness, and may result in the acceleration of any other indebtedness to which a cross-acceleration or cross-default provision applies.
Strategic and Operational Risks
Increased competition, including from technological developments, could adversely affect our business.
The markets in which we operate include a large number of participants, including multi-national, regional and small, local companies. We primarily compete on the basis of quality, innovation, expertise, effective channels to market, breadth of product offering and price. We may be unable to effectively compete on all these bases. Further, in a number of our product offerings, we compete with our retail customers and technology partners who use their own private labels. If we are unable to anticipate evolving trends in the market or the timing and scale of our competitors’ activities and initiatives, including increased competition from private label brands, the demand for our products and services could be negatively impacted.
In addition, we compete in an industry that is experiencing the convergence of mechanical, electronic and digital products. Technology and innovation play significant roles in the competitive landscape. Our success depends, in part, upon the research, development and implementation of new technologies and products including obtaining, maintaining and enforcing necessary intellectual property protections. Securing and maintaining key partnerships and alliances, recruiting and retaining highly skilled and qualified employee talent and having access to technologies, services, intellectual property and solutions developed by others will play a significant role in our ability to effectively compete. The continual development of new technologies, such as artificial intelligence and machine learning, by existing and new competitors, including non-traditional competitors with significant resources, could adversely affect our ability to sustain operating margins and desirable levels of sales volumes. To remain competitive, we must develop new products and service offerings and respond to new technologies in a timely manner.
Our growth is dependent, in part, on the development, commercialization and acceptance of new products and services.
We must develop and commercialize new products and services that meet the varied and evolving needs of our customers and end-users in order to remain competitive in our current and future markets and in order to continue to grow our business. End users are continually adopting more advanced technologies in their facilities and homes, accelerated by the increasing adoption of IoT technologies and connected devices, which will require us to devote significant effort and resources to the development, maintenance and enhancement of our IT Systems (as defined below) and other infrastructure required to support and/or enhance the functionality of our electronic products and solutions. The speed of development by our competitors and new market entrants is increasing. We cannot provide any assurance that any new product or service will be successfully commercialized in
a timely manner, if ever, or, if commercialized, will result in returns greater than our investment. Investment in a product or service could divert our attention and resources from other projects that become more commercially viable in the market. We also cannot provide any assurance that any new product or service will be accepted by the market.
Changes in customer and consumer preferences and the inability to maintain beneficial relationships with large customers could adversely affect our business.
We have significant customers, particularly major retailers, although no one customer represented 10% or more of our total Net revenues in any of the past three fiscal years. The loss or material reduction of business, either due to a reduction in demand from one or more of our significant customers, or our inability to timely meet any elevated level of customer demand for various reasons, the lack of success of sales initiatives or changes in customer preferences or loyalties for our products related to any such significant customer could have a material adverse impact on our business. In addition, major customers who are volume purchasers are much larger than us and have strong bargaining power with their suppliers. This limits our ability to recover cost increases through higher selling prices. Furthermore, unanticipated inventory adjustments by these customers can have a negative impact on sales.
We also sell our products through various trade channels, including traditional retail and e-commerce channels. If we or our major customers are not successful in navigating the shifting consumer preferences to distribution channels such as e-commerce, our expected future revenues may be negatively impacted.
If our products or solutions fail to meet certification and specification requirements, are defective, cause, or are alleged to have caused, bodily harm or injury, or otherwise fall short of end-users' needs and expectations, our business may be negatively impacted.
The security and access control product markets we serve often have unique certification and specification requirements, reflecting local regulatory requirements and highly variable end-user needs. While we strive to meet all certification and specification requirements, if any of our products or solutions do not meet such requirements, or contain, or are perceived to contain, defects or otherwise fall short of end-users' needs and expectations, fail to perform as intended, or are otherwise alleged to result in property damage, bodily injury and/or death we may become subject to personal injury lawsuits and/or product liability claims, and if found liable, may incur significant costs, andwhich could negatively impact our business, results of operations or financial condition may be negatively impacted.
Additionally, as end-users have continued to adopt newer technologies in their facilities and homes, accelerated by the increasing adoption of IoT technologies, growth in sales of electronic security products and solutions are expected to outperform growth in sales of mechanical security products. Electronic security products and solutions are increasingly more sophisticated and technologically complex than the mechanical security products we sell and have an increased risk of design, cybersecurity or manufacturing defects, which could lead to product liability claims, recalls, product replacements or modifications, write-offs
of inventory or other assets and significant warranty and other expenses. Product quality issues cancould also adversely affect the end-user experience, resulting in reputational harm, loss of competitive advantage, poor market acceptance, reduced demand for products and solutions, delay in new product and service introductions and lost sales. Further, adverse publicity, whether or not justified, or allegations of product or service quality issues, even if false or unfounded, could damage our reputation and negatively affect our sales.
Our business and innovation strategies include making acquisitions of, and investments in, external companies. These acquisitions and investments could be unsuccessful, or consume significant resources or increase our exposure to cybersecurity, data privacy or other regulatory risks, which could adversely affect our operatingbusiness, financial condition, results of operations and financial results.cash flows.
We will continue to analyze and evaluateOur long-term growth strategies include the acquisition of strategic businesses or product lines with the potential to strengthen our industry position, or enhance our existing set of products and services offerings. Weofferings or expand into adjacent markets. However, we cannot provide assurance that we will identify or successfully complete acquisitions with suitable candidates in the future, nor can we provide assurance that completed or future acquisitions will be successful or otherwise achieve the anticipated strategic and financial benefits, including efficient integrationcost and creation ofrevenue synergies.
Some of the businesses we may seek to acquire may be marginally profitable or unprofitable. For these businesses to achieve acceptable levels of profitability, we mustmay need to improve their management, operations, products and market penetration.penetration or incur significant capital expenditures. We may not be successful in this regard, andthe costs of doing so may exceed our original estimates or we may encounter other difficulties in integrating acquired businesses into our existing operations.potential difficulties.
Acquisitions may involve significant cash expenditures, debt incurrence, operating losses and expenses.
Acquisitions also involve numerous other risks, including:
•Diversion of management's time and attention from daily operations;
•Difficulties integrating acquired businesses, technologies and personnel into our business;
•Difficulties completing the transaction in a timely manner;
•Difficulties realizing synergies expected to result from acquisitions;
•Difficulties in obtaining and verifying the financial statements and other business information of acquired businesses;
•Our ability to raise capital on reasonable terms to finance attractive acquisitions;
•Inability to obtain regulatory approvals and/or required financing on favorable terms;
•Potential loss of key employees, key contractual relationships or key customers of acquired companies or of us;
•Difficulties competing in theany new markets we may enter;
•Assumption of the liabilities and exposure to unforeseen liabilities (including, but not limited to, regulatory, legal and product or personal liability claims) of acquired companies;
•Cybersecurity related vulnerabilities or data security incidents that may be present in the IT Systems of acquired companies, or emerge when integrating the acquired company into our IT Systems;
•Dilution of interests of holders of our ordinary shares through the issuance of equity securities or equity-linked securities;
•Labor disruptions, work stoppages or other employee-related issues, particularly if employees of the acquired companies are represented by labor unions or trade councils; and
•Difficulty in integrating financial reporting systems and implementing controls, procedures and policies, including disclosure controls and procedures and internal control over financial reporting appropriate for public companies of our size at companies that, prior to the acquisition, had lacked such controls, procedures and policies.
Further, as part of our innovation strategy, from time to time we invest in start-up companies and/or development stage technology or other companies. In evaluating these opportunities, we follow a structured evaluation process that considers factors such as potential financial returns, new expertise in emerging technology and business benefits. Despite our best efforts to calculate potential return and risk, some or all of thesethe companies we invest in may be unprofitable at the time of, and subsequent to, our investment. We may lose money in these investments, including the potential for future impairment charges on the investments, and the anticipated benefits of the technology and business relationships may be less than expected.
We continually lookmay pursue business opportunities that diverge from our core business, including expanding our products or service offerings, seeking to expand our servicesproducts and productsservices into new international markets, investing in new and as we do, weunproven technologies and forming new alliances with companies to develop and distribute our products and services. We can offer no assurance that any such business opportunities will have only limited experience in marketing and operating services and products in such markets. In some instances, we may rely on the efforts and abilities of third-party and foreign business partners in such markets.prove successful. Certain international markets may be slower than our established markets in adopting our services and products, and our operations in such markets may not develop at a rate that supports our level of investment. In addition to the risks outlined above, expansion into certain new markets may require us to compete with local businesses with greater knowledge of the market, including the tastes and preferences of end-users and businesses with dominant market shares. Any acquisitions or investments may ultimately not be successful, may harm our business or financial condition and/or result in impairment charges.
We may pursue business opportunities that diverge from our core business.
We may pursue business opportunities that diverge from our core business, including expanding our products or service offerings, investing in new and unproven technologies and forming new alliances with companies to distribute our products and services. We can offer no assurance that any such business opportunities will prove successful. Among other negative effects,
our investment in new business opportunities may exceed the returns we realize. Additionally, any newNew investments could have higher cost structures than our current business, which could reduce operating margins and require more working capital. In the event that working capital requirements exceed operating cash flow, we may be required to draw on our revolving credit facilitythe 2021 Revolving Facility or pursue other external financing, which may not be readily available.
Our strategic initiatives, including enterprise excellence efforts among other significant capital expenditure projects, may not achieve the improvements or financial returns we expect.
We utilize a number of tools to improve efficiency and productivity. Implementation of new processes to our operations could cause disruptions and may prove to be more difficult, costly or time consuming than expected. There isAdditionally, from time to time, we undertake substantial capital projects for varying reasons, such as to increase production capacity or to insource certain products, parts or components. We invest in areas we believe best align with our business strategies and that will optimize future returns. However, there can be no assurance that all of our planned enterprise excellence projects or other capital expenditures will be fully implemented, or if implemented, will realize the expected improvements.
We may not be able to effectively manage and implement restructuring initiatives or other organizational changes.
We have, from time to time, restructured or made other adjustments to our workforce and manufacturing footprint, and may need to do so in the future, in response to market or product changes, performance issues, changes in strategy, acquisitions and/or other internal andor external considerations. For example, we recently announced that effective January 1, 2021, our EMEA and Asia Pacific operating segments would be combined to form the new Allegion International segment. These restructuring activities and other organizational changes often result in increased restructuring costs, diversion of management’s time and attention from daily operations, cybersecurity and other operational risks and temporarily reduced productivity. If we are unable to successfully manage and implement theserestructuring and other organizational changes, we may not achieve or sustain the expected growth or cost savings benefits of these activities or do so within the expected timeframe. These effects could recur in connection with future acquisitions and other organizational changes and our Net revenues and other results of operations could be negatively affected.
Disruptions in our global supply chain, including product manufacturing and logistical services provided by supplier partners, may negatively impact our business.
Our ability to meet our customers' needs and achieve cost targets depends on our ability to maintain key manufacturing and supply arrangements, including execution of supply chain optimizations and certain sole supplier or sole manufacturing arrangements. The loss or disruption of such manufacturing and supply arrangements could interrupt product supply and, if not effectively managed and remedied, have an adverse impact on our business.
We procure certain products, components and logistical services from supplier partners located throughout the world. Our reliance on these third parties reduces our control over the manufacturing and delivery process, exposing us to risks including reduced control over quality assurance, product costs, product supply and delivery delays. If we are unable to effectively manage these relationships, or if these third parties experience delays, disruptions, capacity constraints, regulatory issues or quality control problems in their operations or otherwise fail to meet our future requirements for timely delivery, our ability to ship and deliver certain of our products to our customers could be impaired and our business could be harmed.
The effects of global climate change or other unexpected events, including global health crises, may disrupt our operations and have a negative impact on our business.
The effects of global climate change, such as extreme weather conditions and natural disasters occurring more frequently or with more intense effects, or the occurrence of unexpected events including wildfires, tornadoes, hurricanes, earthquakes, floods, tsunamis and other severe hazards or global health crises, such as the outbreak of Ebola or the global COVID-19 pandemic, or other actual or threatened epidemic, pandemic, outbreak and spread of a communicable disease or virus, in the countries where we operate or sell products and provide services, could adversely affect our business, financial condition, results of operations and financial performance. Extreme weather, natural disasters, power outages, global health crises or other unexpectedcash flows. These events could disrupt our operations by impacting the availability and cost of materials needed for manufacturing, causingcause physical damage and partial or complete closure of our manufacturing sites or distribution centers, lead to loss of human capital and/or cause temporary or long-term disruption in the manufacturing and supplyor delivery of products and services and disruption in our ability to deliver products and services to customers. These events and disruptions could also adversely affect our customers’ and suppliers’ financial condition or ability to operate, resulting in reduced customer demand, delays in payments received or supply chain disruptions. Further, these events and disruptions could increase insurance and other operating costs, including impacting our decisions regarding construction of new facilities to select areas less prone to climate change risks and natural disasters, which could result in indirect financial risks passed through the supply chain or other price modifications to our products and services.
Global health crises, such as the COVID-19 pandemic or any other actual or threatened epidemic, pandemic, or outbreak and spread of a communicable disease or virus in the countries where we operate or sell products and provide services, could adversely affect our operations and financial performance. Further, any national, state or local government mandates or other orders taken to minimize the spread of a global health crisis could restrict our ability to conduct business as usual, as well as the business activities of our key customers and suppliers, including the potential for labor shortages. In particular, the ultimate extent of the impact of any epidemic, pandemic or other global health crisis on our business, financial condition and results of operations will depend on future developments which are highly uncertain and cannot be predicted,
including new information that may emerge concerning the duration and severity of such epidemic, pandemic or other global health crisis, actions taken to contain or prevent their further spread and the pace of global economic recovery following containment of the spread.
We may be subject to risks relating to our information technology and operational technology systems.
We rely extensively on information technology and operational technology systems, networks and services including hardware, software, firmware and technological applications and platforms (collectively, "IT Systems") to manage and operate our business from end-to-end, including ordering and managing materials from suppliers, design and development, manufacturing, marketing, selling and shipping to customers, invoicing and billing, managing our banking and cash liquidity systems, managing our enterprise resource planning and other accounting and financial systems and complying with regulatory, legal and tax requirements. There can be no assurance that our current IT Systems will function properly. We have invested and will continue to invest in improving our IT Systems. Some of these investments are significant and impact many important operational processes and procedures. There is no assurance that any newly implemented IT Systems will improve our current systems, improve our operations or yield the expected returns on the investments. In addition, the implementation of new IT Systems may be more difficult, costly or time consuming than expected and cause disruptions in our operations and, if not properly implemented and maintained, negatively impact our business. If our IT Systems cease to function properly or if these systems do not provide the anticipated benefits, our ability to manage our operations could be impaired.
We currently rely on third-party vendorsservice providers for many of the critical elements of our global information and operational technology infrastructure, and their failure to provide effective support for such infrastructure could increase our cybersecurity risk or otherwise negatively impact our business and financial results.
We have outsourced many of the critical elements of our global information and operational technology infrastructure to third-party service providers in order to achieve efficiencies. If such service providers experience a disruption due to a cyberattack or other internal or external factors, or they do not perform or do not perform effectively, we may not be able to achieve the expected efficiencies and may have to incur additional costs to address failures in providing service by the service providers. Depending on the function involved, such non-performance, ineffective performance or failures of service may lead to business disruptions, processing inefficiencies or security breaches.
Disruptions or breaches of our information systems could adversely affect us.
Despite our implementation of cybersecurity measures, which have focused on prevention, mitigation, resilience and recovery, our network and products, including access solutions, may be vulnerable to cybersecurity attacks, computer viruses, malicious codes, malware, ransomware, phishing, social engineering, denial of service, hacking, break-ins and similar disruptions. Cybersecurity attacks and intrusion efforts are continuous and evolving, and in certain cases they have been successful at the
most robust institutions. The scope and severity of risks that cyber threats present have increased dramatically and include, but are not limited to, malicious software, ransomware attacks, attempts to gain unauthorized access to data or premises, exploiting weaknesses related to vendors or other third parties that could be exploited to attack our systems, denials of service and other electronic security breaches that could lead to disruptions in systems, unauthorized release of confidential or otherwise protected information and corruption of data. Any such event could have a material adverse effect on our business, operatingfinancial condition, results of operations and financial condition,cash flows as we face regulatory, reputational and litigation risks resulting from potential cyber incidents, as well as the potential of incurring significant remediation costs.
Further, while we maintain insurance coverage that may, subject to policy terms and exclusions, cover certain aspects of our cyber risks, such insurance coverage may be insufficient to cover our losses or all types of claims that may arise in the continually evolving area of cyber risk.
Our daily business operations also require us to collect and/or retain sensitive data such as intellectual property, proprietary business information and data related to customers, employees, suppliers and business partners within our networking infrastructure including data from individuals subject to the European Union's General Data Protection Regulation, that is subject to privacy and security laws, regulations and/or customer-imposed controls. Despite our efforts to protect such data, the loss or breach of such data due to various causes including material security breaches, catastrophic events, extreme weather, natural disasters, power outages, system failures, computer viruses, improper data handling, programming errors, unauthorized access and employee error or malfeasance could result in wide reaching negative impacts to our business, and asbusiness. As such, the ongoing maintenance and security of this information is pertinent to the success of our business operations and our strategic goals.
In addition, we operate in an environment where there are different and potentially conflicting data privacy laws and regulations in effect or expected to go into effect in the future, including regulations related to devices connected through IoT, in the various jurisdictions in which we operate, and we must understand and comply with such laws and regulations while ensuring our data is secure.
Our networking infrastructure and related assets may be subject to unauthorized access by hackers, employee error or malfeasance or other unforeseen activities. Such issues could result in the disruption of business processes, network degradation and system downtime, along with the potential that a third party will exploit our critical assets such as intellectual property, proprietary business information and data related to our customers, suppliers and business partners. To the extent that such disruptions occur, and our business continuity plans do not effectively address these disruptions in a timely manner, they may cause delays in the manufacture or shipment of our products and the cancellation of customer orders and, as a result, our business operating results and financial condition could be materially and adversely affected, resulting in a possible loss of business or brand reputation.
Our ability to successfully grow and expand our business depends on our ability to recruit and retain a highly qualified and diverse workforce.
Our ability to successfully grow and expand our business depends onis dependent upon our ability to recruit and retain a workforce with the contributionsskills necessary to develop, manufacture and abilities ofdeliver the products and services desired by our employeescustomers. We need highly skilled and key management,qualified personnel in multiple areas, including for example, the ability of ourengineering, sales, force to adapt to any changes made in the sales organizationmanufacturing, information technology, cybersecurity, business development, strategy and achieve adequate customer coverage.management. We must therefore continue to effectively recruit, retain and motivate key management, sales and other highly qualified, skilled and diverse personnel to maintain our current business and support our projected growth. A shortage of these key employees for various reasons, including intense competition for skilled employees, labor shortages, increased labor costs, candidates’ preference to work remotely, changes in laws and policies regarding immigration and work authorizations or any government or public health mandates in jurisdictions where we have operations mightthat may result in workforce attrition and difficulty with recruiting, may jeopardize our ability to grow and expand our business.
Economic, MarketIn recent years, we have experienced labor shortages and Financial Risks
Our global operations subject usincreased turnover rates that have led to, economic risks.
We are incorporated in Ireland and operate in countries worldwide. Our global operations depend on products manufactured, purchased and soldcould in the U.S.future lead to, increased costs, such as increased overtime to meet customer demand and internationally, including in Australia, Canada, China, Europe, Korea, Mexico, New Zealandincreased wage rates to attract and the Middle East. The political, economicretain employees and regulatory environments in which we operate are becoming increasingly volatile and uncertain. Accordingly, we are subject to risks that are inherent in operating globally, including:
•Changes to trade agreements, sanctions, import and export regulations, including imposition of burdensome tariffs and quotas, and customs duties;
•Changes in applicable tax regulations and interpretations;
•Economic downturns and social and political instability;
•Changes in laws and regulations or imposition of currency restrictions and other restraints in various jurisdictions;
•Limitation of ownership rights, including expropriation of assets by a local government, and limitation on the ability to repatriate earnings;
•Sovereign debt crises and currency instability in developed and developing countries;
•Difficulty in staffing and managing global operations;
•Difficulty in enforcing agreements, collecting receivables and protecting assets through non-U.S. legal systems; and
•Political unrest, national and international conflict, including war, border closures, civil disturbances and terrorist acts.
These risks could increase our cost of doing business in the U.S. and internationally, increase our counterparty risk, disrupt our operations, disrupt the ability of suppliers and customers to fulfill their obligations, increase our effective tax rate, increase the cost of our products, limitnegatively affect our ability to sell products in certain markets, reduceefficiently operate our operating margin, reduce cash flow and negatively impact our ability to compete.
Our business relies on the institutional, commercial and residential construction and remodeling markets.
Demand for our security products and solutions relies on the institutional, commercial and residential construction and remodeling markets, which are marked by cyclicality based on overall economic conditions, including consumer confidence and disposable income, corporate and government spending, work-from-home trends, availability of credit and demand for new housing and infrastructure. Weakness or instability in one or more of these markets may cause current and potential customers to delay or cancel major capital projects,production facilities or otherwise choose not to make purchases, whichoperate at full capacity. An overall or prolonged labor shortage, lack of skilled labor, increased turnover or sustained level of wage inflation could negativelyhave a material adverse impact the demand foron our productsbusiness, financial position, results of operations and solutions and erode average selling prices.cash flows.
Currency exchange rate fluctuationsDisruptions in our global supply chain, including product manufacturing and logistical services provided by our supplier partners, may adversely affectnegatively impact our results.
We are exposed to a variety of market risks,procure certain products, including the effects of changes in currency exchange rates. See "Management’s Discussionraw materials and Analysis of Financial Condition and Results of Operations - Quantitative and Qualitative Disclosure About Market Risk."
Approximately 30% of our 2020 Net revenues were derived outside the U.S., and we expect sales to non-U.S. customers to continue to represent a significant portion of our consolidated Net revenues. Although we may enter into currency exchange contracts to reduce our risk related to currency exchange fluctuations, changes in the relative fair values of currencies occur from time to time and may, in some instances, have a material impact on our results of operations. We do not hedge against all of our currency exposure and therefore, our business will continue to be susceptible to currency fluctuations.
We also translate assets, liabilities, revenues and expenses denominated in non-U.S. dollar currencies into U.S. dollars for our Consolidated Financial Statements based on applicable exchange rates. Consequently, fluctuations in the value of the U.S. dollar compared to other currencies may have a material impact on the value of these items in our Consolidated Financial Statements, even if their value has not changed in their original currency.
Commodity shortages, price increases and higher energy prices could negatively affect our financial results.
We rely on suppliers to secure commodities, including steel, zinc, brass and other non-ferrous metals, required foras well as parts, components (including electronic components) and logistical services from supplier partners located throughout the manufacture ofworld. Our ability to meet our products. A disruption of deliveries from our suppliers or decreased availability of commodities could have an adverse effectcustomers' needs and achieve cost targets depends on our ability to meetmaintain key manufacturing and supply arrangements, including supplier execution and certain sole supplier or sole manufacturing arrangements. Our reliance on these third parties reduces our commitmentscontrol over the manufacturing and delivery process, exposing us to customers or increase our operating costs. We believe that available sources of supply will generally be sufficient for our needs for the foreseeable future. Nonetheless, the unavailability of some commodities could have a material adverse impact on our business.
Volatility in the prices of these commodities could increase therisks including reduced control over product costs and delivery. Additionally, because not all of our productssupply arrangements provide for guaranteed supply and services,some key parts and wecomponents may not be able to pass on these costs to our customers. We do not currently use financial derivatives to hedge against this volatility; however, we utilize firm purchase commitments to mitigate risk. The pricingavailable only from a single supplier or a limited group of some commodities we use is based on market prices. To mitigate this exposure, we may use annual price contracts to minimize the impact of inflation and to benefit from deflation.
Additionally,suppliers, we are exposedalso subject to fluctuations in energy prices due to the instability of current market prices. Higher energy costs increasesupply and pricing risks, which could negatively impact our operating costs and the cost of shipping our products and supplying services to our customers around the world. Consequently, sharp price increases, the imposition of taxes or an interruption of supply could cause us to lose the ability to effectively manage the risk of rising energy prices and may have an adverse impact on ourmargin performance, results of operations, inventory levels and cash flows.
We may be required to recognize impairment charges for our goodwill, indefinite-lived intangible assets and other long-lived assets.
At December 31, 2020, the net carrying value of our goodwill and other indefinite-lived intangible assets totaled approximately $819.0 million and $118.3 million, respectively. Pursuant to U.S. generally accepted accounting principles ("GAAP"), we are required to annually assess our goodwill and indefinite-lived intangible assets for impairment. In addition, interim assessments must be performed for these and other long-lived assets whenever events or changes in circumstances indicate that an impairment may have occurred. Significant disruptions to our business or end market conditions, protracted economic weakness, unexpected significant declines in operating results of reporting units, divestitures or market capitalization declines may result in recognition of impairment charges to our goodwill, indefinite-lived intangible or other long-lived assets. Specifically, an unanticipated deterioration in Net revenues and/or operating margins generated by our newly created Allegion International segment could trigger future impairments. Any charges relating to such impairments could have a material adverse impact on our results of operations in the periods when recognized.
The capital and credit markets are important to our business.
Instability in U.S. and global capital and credit markets, including market disruptions, limited liquidity and interest rate volatility or reductions in the credit ratings assigned to us by independent ratings agencies, could reduce our access to capital markets or increase the cost of funding our short and long-term credit requirements. In particular, ifIf we are unable to access capitaleffectively manage these relationships, or if these third parties experience delays, disruptions, shortages of materials, labor, electronic and credit markets on terms that are acceptableother components, capacity constraints, regulatory issues or quality control problems in their operations, freight delays and other supply chain constraints and disruptions, or otherwise fail to us, we may not be ablemeet our future requirements for timely delivery, our ability to makeship and deliver certain investments or fully execute our business plans and strategy.
Our suppliers and customers are also dependent upon the capital and credit markets. Limitations on the ability of customers, suppliers or financial counterparties to access credit could lead to insolvencies of key suppliers and customers, limit or prevent
customers from obtaining credit to finance purchases of our products to our customers could be impaired and services and cause delays in the delivery of key products from suppliers.
There are risks associated with our outstanding and future indebtedness.
We have approximately $1.4 billion of outstanding indebtedness at December 31, 2020. In addition, we have a senior unsecured revolving credit facility (the "Revolving Facility") that permits borrowings of up to an additional $500 million. Volatility in the credit marketsbusiness could adversely impact our ability to obtain favorable financing terms in the future. A portion of our cash flows from operations is dedicated to servicing our indebtedness and will not be available for other purposes, including our operations, capital expenditures, payment of dividends, share repurchases or future business opportunities.
Our ability to make scheduled payments or to refinance our debt obligations depends on our financial and operating performance, which is subject to prevailing economic and competitive conditions and to certain financial, business and other factors beyond our control. If our cash flows and capital resources are insufficient to fund our debt service obligations, we may be forced to reduce or delay capital expenditures, reduce or eliminate the payment of dividends, sell assets, seek additional capital or seek to restructure or refinance our indebtedness. These alternative measures may not be successful and may not permit us to meet our scheduled debt service obligations. In such event, we could face substantial liquidity problems and might be required to sell material assets or operations to attempt to meet our debt service and other obligations.
Additionally, at December 31, 2020, our borrowings included a variable rate term loan facility indexed to LIBOR (the "Term Facility", and together with the Revolving Facility, the "Credit Facilities") with an outstanding balance of $238.8 million, which exposes us to variable interest rate risk. We are also exposed to the risk of rising interest rates to the extent that we fund our operations with short-term or variable-rate borrowings under our Revolving Facility. If LIBOR or other applicable base rates under our Credit Facilities increase in the future, our Interest expense could increase. Additionally, the regulator that oversees LIBOR has announced that it cannot guarantee LIBOR's availability after 2021. In the event LIBOR is discontinued, replaced, significantly changed or ceases to be recognized as an acceptable benchmark, there may be uncertainty or differences in the calculation of our applicable interest rate or required payment amounts for our Credit Facilities. This could also require different hedging strategies and require renegotiation of our existing Credit Facilities. While we do not currently anticipate the transition from LIBOR and the risks thereto to have a material adverse effect on us, it remains uncertain at this time.harmed.
Legal and Compliance Risks
We are subject to risks related to corporate social responsibility and reputational matters.
Our reputation and the reputation of our brands, including the perception held by our customers, end-users, business partners, investors, other key stakeholders and the communities in which we do business are influenced by various factors. There is an increased focus from our stakeholders, as well as regulatory authorities both within the U.S. and internationally, on environmental, social and governance ("ESG")ESG practices and disclosure – and ifdisclosure. If we fail, or are perceived to have failed, in any number of ESG matters, such as environmental stewardship, inclusion and diversity,DEI, good corporate governance, workplace conduct and support for local communities, or to effectively respond to changes in, or new, legal, regulatory or reporting requirements concerning climate change or other sustainability concerns, we may be subject to regulatory fines and penalties, and our reputation or the reputation of our brands may suffer. Further, we have made several public commitments regarding our intended reduction of carbon emissions, including a commitment to achieve carbon neutral emissions by 2050. Although we intend to meet these commitments, we may be required to expend significant resources to do so, which could increase our operational costs. Further, there can be no assurance of the extent to which any of our commitments will be achieved, or that any future investments we make to achieve such commitments will meet investor, legal and/or any other regulatory expectations and requirements. Moreover, we may determine that it is in the best interest of our Company and our stockholders to prioritize other business, social, governance or sustainable investments over the achievement of our current commitments based on economic, technological developments, regulatory and social factors, business strategy or pressure from investors, activist groups or other stakeholders. If we are unable to meet our commitments, we could incur adverse publicity and reaction from investors, advocacy groups or other stakeholders, which could adversely impact our reputation and brand perception. Such damage to our reputation and the reputation of our brands may negatively impact our business, demand for our products and services, our financial condition and results of operations.
In addition, negative or inaccurate postings or comments on social media or networking websites about the Companyour company or our brands could generate adverse publicity that could damage our reputation or the reputation of our brands. If we are unable to effectively manage real or perceived issues, including concerns about product quality, safety, corporate social responsibility or other matters, sentiments toward the Company or our products could be negatively impacted, and our financial results could suffer.
Our brands are important assets of our businesses, and violation of our trademark rights by imitators could negatively impact revenues and brand reputation.
Our brands and trademarks enjoy a reputation for quality and value and are important to our success and competitive position. Unauthorized use of our trademarks may not only erode sales of our products but may also cause significant damage to our brand name and reputation, interfere with relationships with our customers and increase litigation costs. There can be no assurance that our on-going effort to protect our brand and trademark rights will prevent all violations.
Material adverse legal judgments, fines, penalties or settlements imposed against us or our assets could adversely affect our business.
We are currently, and may in the future become, involved in legal proceedings, claims and disputes incidental to the operation of our business.business in the ordinary course. Our business may be adversely affected by the outcome of these proceedings and other contingencies (including, without limitation, environmental, product and warranty liability, claims for property damage, physical harm or bodily injury, antitrust, intellectual property, data protection, privacy and labor and employment matters) that cannot be predicted with certainty. As required by GAAP, we establish reserves based on our assessment of contingencies.the probability of contingencies and whether we are able to reasonably estimate the expected range of loss. Subsequent developments in legal
proceedings and other contingencies may affect our assessment and estimates of the loss contingency recorded as a reserve, and we may incur additional costs or be required to make additional material payments.
Allegations that we have infringed the intellectual property rights of third parties could negatively affect us.
We may be subject to claims of infringement of intellectual property rights by third parties. In particular, we often compete in areas having extensive intellectual property rights owned by others, and we have become subject to claims alleging infringement of intellectual property rights of others. In general, if it is determined that one or more of our technologies, products or services infringes the intellectual property rights owned by others, we may be required to cease marketing those products or services, to obtain licenses from the holders of the intellectual property at a material cost or to take other actions to avoid infringing such intellectual property rights. The litigation process is costly and subject to inherent uncertainties, and we may not prevail in litigation matters regardless of the merits of our position. Adverse intellectual property litigation or claims of infringement against us may become extremely disruptive if the plaintiffs succeed in blocking the trade of our products and services and may have a material adverse effect on our business.
Our reputation, ability to do business and results of operations could be impaired by adverse publicity or improper conduct by any of our employees, agents or business partners.
We are subject to regulation under a variety of U.S. federal and state and non-U.S. laws, regulations and policies including laws related to anti-bribery and anti-corruption, export and import compliance, anti-trustcompetition and moneyanti-money laundering due to our global operations. We provide compliance training for our employees and have other controls and procedures in these areas. We cannot provide assurance that our internal controls will always protect us from the improper conduct of our employees, agents and business partners. Any improper conduct could damage our reputation and subject us to, among other things, civil and criminal penalties, material fines, equitable remedies (including profit disgorgement and injunctions on future conduct), securities litigation, adverse publicity and a general loss of investor or public confidence.
Our operations are subject to regulatory risks.
Our U.S. and non-U.S. operations are subject to a number of laws and regulations, including fire and building codes and environmental, health and safetyEHS standards. We have incurred, and will be required to continue to incur, significant expenditures to comply with these laws and regulations. Changes to, or changes in interpretations of, current laws and regulations, including climate change legislation or other environmental mandates, could require us to increase our compliance expenditures, cause us to significantly alter or discontinue offering existing products and services or cause us to develop new products and services. Altering current products and services or developing new products and services to comply with changes in the applicable laws and regulations could require significant research and development investments, increase the cost of providing the products and services and adversely affect the demand for our products and services.
In the event a regulatory authority concludes that we are not or have not at all times been in full compliance with these laws or regulations, we could be fined, criminally charged or otherwise sanctioned.
Certain environmental laws assess liability on current or previous owners of real property or operators of manufacturing facilities for the costs of investigation, removal or remediation of hazardous substances or materials at such properties or at properties at which parties have disposed of hazardous substances. Liability for investigative, removal and remedial costs under certain U.S. federal and state laws and certain non-U.S. laws are retroactive, strict and joint and several. In addition to cleanup actions brought by governmental authorities, private parties could bring personal injury or other claims due to the presence of, or exposure to, hazardous substances. We have received notificationnotifications from U.S. and non-U.S. governmental agencies, including the EPA and similar state environmental agencies, that conditions at a number of current and formerly owned sites where we and others have disposed of hazardous substances require investigation, cleanup and other possible remedial action. These agencies may require that we reimburse the government for its costs incurred at these sites or otherwise pay for the costs of investigation and cleanup of these sites, including by providing compensation for natural resource damage claims from such sites. For more information, see "Item 1. Business -– Regulatory Matters."
While we have planned for future capital and operating expenditures to maintain compliance with environmental laws and have accrued for costs related to current remedial efforts, our costs of compliance, or our liabilities arising from past or future
releases of, or exposures to, hazardous substances, may exceed our estimates. We may also be subject to additional environmental claims for personal injury or cost recovery actions for remediation of facilities in the future based on our past, present or future business activities.
As a global business, we have a relatively complex tax structure, and there is a risk that tax authorities will disagree with our tax positions.
Since we conduct operations worldwide through our subsidiaries, we are subject to complex transfer pricing regulations in the countries in which we operate. Transfer pricing regulations generally require that, for tax purposes, transactions between us and our affiliates be priced on a basis that would be comparable to an arm's length transaction and that contemporaneous documentation be maintained to support the tax allocation. Although uniform transfer pricing standards are emerging in many of the countries in which we operate, there is still a relatively high degree of uncertainty and inherent subjectivity in complying
with these rules. To the extent that any tax authority disagrees with our transfer pricing policies, we could become subject to significant tax liabilities and penalties. Our tax returns are subject to review by taxing authorities in the jurisdictions in which we operate. Although we believe that we have provided for all tax exposures, the ultimate outcome of a tax review could differ materially from our provisions.
We could be subject to changes in tax rates, the adoption of new tax legislation or exposure to additional tax liabilities.
Our future effective tax rate and cash tax obligations could be adversely affected by shifts in our mix of earnings in countries with varying statutory tax rates, changes in the valuation of our deferred tax assets or liabilities or changes in tax laws, regulations, interpretations or accounting principles, as well as certain discrete items. In addition, we are subject to regular review and audit by tax authorities. As a result, we have received, and may in the future receive, assessments in multiple jurisdictions on various tax-related assertions. Any adverse outcome of such a review or audit could have a negative effect on our operating results and financial condition. In addition, the determination of our worldwide provision for income taxes and other tax liabilities requires significant judgment, and there are many transactions and calculations where the ultimate tax determination is uncertain. Although we believe our estimates are reasonable, the ultimate tax outcome may differ from the amounts recorded in our financial statementsConsolidated Financial Statements and may materially affect our financial results in the period or periods for which such determination is made. Furthermore, due to shifting economic and political conditions, tax policies, laws, interpretations and rates in various jurisdictions may be subject to significant change, which could materially affect our financial position and results of operations. For example, many countries in Europe, as well as a number of other countries and organizations, have recently proposed, recommended or implemented changes to existing tax laws or have enacted new laws that could significantly increase our effective tax rate or cash tax obligations in countries where we do business or require us to change the manner in which we operate our business. Additionally, the European Commission has been investigating whether various tax regimes or private tax rulings provided by a country to a particular taxpayer may constitute State Aid. We continue to examine the impact the above items may have on our business and the amount of tax we must pay.
The implementation of global tax reforms could negatively impact our financial results.
In recent years, the Organization for Economic Cooperation and Development (“OECD”) has led international efforts to implement various international tax reforms, including the introduction of a global minimum effective corporate tax (“GMT”) rate of 15%, applied on a jurisdiction-by-jurisdiction basis. Over 130 countries agreed to the general framework of the GMT rules and approximately 25 countries have implemented the GMT rules. Further, on December 15, 2022, the European Union adopted a Council Directive which requires GMT rules to be transposed into member states’ national laws starting in 2024.
On December 18, 2023, Ireland, the location of our incorporation, enacted legislation which includes provisions regarding the implementation of GMT. We are currently assessing the impact of the legislation, but we expect our effective income tax rate to increase beginning in 2024. Further, we anticipate the continued and ongoing release of OECD GMT interpretive guidance. We are continuing to evaluate the potential impact of this interpretative guidance and the release of GMT-implementation legislation in other countries, and such guidance or legislation could result in a material increase in our effective tax rate.
Risks Related to Our Incorporation in Ireland
Irish law differs from the laws in effect in the United States and may afford less protection to holders of our securities.
The U.S. currently does not have a treaty with Ireland providing for the reciprocal recognition and enforcement of judgments in civil and commercial matters. As such, there is some uncertainty as to whether the courts of Ireland would recognize or enforce judgments of U.S. courts obtained against us or our directors or officers based on U.S. federal or state civil liability laws, including the civil liability provisions of the U.S. federal or state securities laws, or hear actions against us or those persons based on those laws.
As an Irish company, we are governed by the Companies Act 2014 of Ireland, as amended, which differs in some material respects from laws generally applicable to U.S. corporations and shareholders, including, among others, differences relating to interested director and officer transactions and shareholder lawsuits. Likewise, the duties of directors and officers of an Irish company generally are owed to the company only. Shareholders of Irish companies generally do not have a personal right of action against directors or officers of the company and may exercise such rights of action on behalf of the company only in limited circumstances. Accordingly, holders of our securities may have more difficulty protecting their interests than would holders of securities of a corporation incorporated in a jurisdiction of the U.S.
In addition, Irish law allows shareholders to authorize share capital which then can be issued by a board of directors without shareholder approval. Also, subject to specified exceptions, Irish law grants statutory preemptive rights to existing shareholders to subscribe for new issuances of shares for cash. At our annual general meeting of shareholders, our shareholders authorized our Board of Directors to issue up to 33% of our issued ordinary shares and further authorized our Board of Directors to issue up to 5% of such shares for cash without first offering them to our existing shareholders. Both of these authorizations will expire after a certain period unless renewed by our shareholders, and we cannot guarantee that the renewal of these authorizations will always
be approved. If the Directors' authority to issue ordinary shares is not renewed, then we may be limited in our ability to use our shares, for example, as consideration for acquisitions.
Changes in tax laws, regulations or treaties, changes in our status under the tax laws of many jurisdictions or adverse determinations by taxing authorities could increase our tax burden or otherwise affect our financial condition or operating results, as well as subject our shareholders to additional taxes.
The realization of any tax benefit related to our incorporation and tax residence in Ireland could be impacted by changes in tax laws, tax treaties or tax regulations or the interpretation or enforcement thereof by the tax authorities of many jurisdictions. From time to time, proposals have been made and/or legislation introduced to change the tax laws of various jurisdictions or limit tax treaty benefits that if enacted could materially increase our tax burden and/or our effective tax rate. Moreover, other legislative proposals could have a material adverse impact on us by overriding certain tax treaties and limiting the treaty benefits on certain payments, which could increase our tax liability. We cannot predict the outcome of any specific legislation in any jurisdiction.
While we monitor proposals that would materially impact our tax burden and/or our effective tax rate and investigate our options, we could still be subject to increased taxation on a going forward basis no matter what action we undertake if certain proposals are enacted, certain tax treaties are amended and/or our interpretation of applicable tax law is challenged and determined to be incorrect. In particular, any changes and/or differing interpretations of applicable tax law that have the effect of disregarding our incorporation in Ireland, limiting our ability to take advantage of tax treaties between jurisdictions, modifying or eliminating the deductibility of various currently deductible payments or increasing the tax burden of operating or being resident in a particular country, could subject us to increased taxation.
Dividends received by our shareholders may be subject to Irish dividend withholding tax.
In certain circumstances, we are required to deduct Irish dividend withholding tax of 25% from dividends paid to our shareholders. In the majority of cases, shareholders residing in the U.S. will not be subject to Irish withholding tax, and shareholders resident in a number of other countries will not be subject to Irish withholding tax provided that they complete certain Irish dividend withholding tax forms. However, some shareholders may be subject to withholding tax, which could discourage the investment in our stock and adversely impact the price of our shares.
Dividends received by our shareholders may be subject to Irish income tax.
Dividends paid in respect of our shares generally are not subject to Irish income tax where the beneficial owner of these dividends is exempt from Irish dividend withholding tax, unless the beneficial owner of the dividend has some connection with Ireland other than his or her shareholding in Allegion.
Our shareholders who receive their dividends subject to Irish dividend withholding tax will generally have no further liability to Irish income tax on the dividends unless the beneficial owner of the dividend has some connection with Ireland other than his or her shareholding in Allegion.
Certain provisions in our Memorandum and Articles of Association, among other things, could prevent or delay an acquisition of us, which could decrease the trading price of our ordinary shares.
Our Memorandum and Articles of Association contains provisions to deter takeover practices, inadequate takeover bids and unsolicited offers. These provisions include, amongst others:
•A provision of our Articles of Association which generally prohibits us from engaging in a business combination with an interested shareholder (being (i) the beneficial owner, directly or indirectly, of 10% or more of our voting shares or (ii) an affiliate or associate of us that has at any time within the last five years been the beneficial owner, directly or indirectly, of 10% or more of our voting shares), subject to certain exceptions;
•Rules regarding how shareholders may present proposals or nominate directors for election at shareholder meetings;
•The right of our Board of Directors to issue preferred shares without shareholder approval in certain circumstances, subject to applicable law; and
•The ability of our Board of Directors to set the number of directors and to fill vacancies on our Board of Directors.
We believe these provisions will provide some protection to our shareholders from coercive or otherwise unfair takeover tactics. These provisions are not intended to make us immune from takeovers. However, these provisions will apply even if the offer may be considered beneficial by some shareholders and could delay or prevent an acquisition that our Board of Directors
determines is in our best interests and our shareholders' best interests. These provisions may also prevent or discourage attempts to remove and replace incumbent directors.
In addition, several mandatory provisions of Irish law could prevent or delay an acquisition of us. For example, Irish law does not permit shareholders of an Irish public limited company to take action by written consent with less than unanimous consent. We also will be subject to various provisions of Irish law relating to mandatory bids, voluntary bids, requirements to make a cash offer and minimum price requirements, as well as substantial acquisition rules and rules requiring the disclosure of interests in our shares in certain circumstances. Also, Irish companies, including us, may alter their Memorandum of Association and Articles of Association only with the approval of at least 75% of the votes of the company’s shareholders cast in person or by proxy at a general meeting of the company.
Item 1B. UNRESOLVED STAFF COMMENTS
None.
Item 1C. CYBERSECURITY
Risk Management and Strategy
Allegion plc recognizes the significance of developing, implementing, and maintaining cybersecurity measures to safeguard our information systems and products and protect the confidentiality, integrity, and availability of our data.
Managing Material Risks & Integrated Overall Risk Management
Cybersecurity is a critical part of our enterprise risk management. To address cybersecurity threats, we leverage a multi-layer approach, with our Chief Information Security Officer (“CISO”) leading a team that is responsible for forming our enterprise-wide information security strategy, training, policy, standards, architecture and processes to protect us against cybersecurity risks. Our risk management group works with our cybersecurity team to continuously evaluate and address cybersecurity risks. Further, we have an employee security awareness program in place and a security training program for technical personnel that provides mandatory and on-demand training.
Engage Third Parties on Risk Management
We engage a range of external experts, including cybersecurity consultants and auditors to evaluate and test our risk management systems. Our collaboration with these third parties includes regular audits, threat assessments, and consultation on security enhancements. Our cybersecurity programs generally align with the NIST Cybersecurity Framework, and third party audits on portions of our cybersecurity program or processes apply the NIST Cybersecurity Framework controls. These partnerships provide expert knowledge and insights, which are designed to ensure our cybersecurity strategies and processes are consistent with industry best practices.
Oversee Third-party Risk
We rely on our information technology systems and networks in connection with many of our business activities. Some of these networks and systems are managed by third-party service providers and are not under our direct control.
The Company has implemented processes designed to manage the cybersecurity risks associated with its use of third-party service providers.
Risks from Cybersecurity Threats
Despite the security measures we have implemented, certain cyber incidents could materially disrupt operational systems; result in loss of trade secrets or other proprietary or competitively sensitive information; compromise personally identifiable information regarding customers or employees; delay our ability to deliver products to customers; and/or jeopardize the security of our facilities. These risks are further described in the risk factors within Item 1A, particularly under the headings “We may be subject to risks relating to our information technology and operational technology systems”, “We currently rely on third-party service providers for many of the critical elements of our global information and operational technology infrastructure, and their failure to provide effective support for such infrastructure could increase our cybersecurity risk or otherwise negatively impact our business and financial results”, and “Disruptions or breaches of our information systems could adversely affect us.”
We have not encountered any risks from cybersecurity threats, including as a result of any previous cybersecurity incidents, that have materially affected or are reasonably likely to materially affect us, including our business strategy, results of operations, or financial condition.
Governance
The Board of Directors has established oversight mechanisms designed to ensure effective governance in managing risks associated with cybersecurity threats.
Board of Directors Oversight
Due to the importance of cybersecurity to the Company, the full Board is charged with oversight responsibility for our risk management and security strategy and policy. The Board is composed of members with diverse expertise including, risk management, information technology, engineering, manufacturing, innovation and finance, equipping them to oversee cybersecurity risks effectively. The Boardreceives updates from the CISO and management at its quarterly board meeting, which updates cover the Company's cybersecurity strategy, current cybersecurity risk assessment, key risk areas, current cyber trends, and any significant cyber incidents that have occurred or are reasonably likely to occur.
Management’s Role
Management is responsible for assessing and managing cybersecurity risk. Specifically, the CISO is responsible for the prevention, mitigation, detection, and remediation of cybersecurity incidents. The CISO regularly meets with the Chief Executive Officer (“CEO”) and Executive Leadership Team to inform them on cybersecurity risks. These briefings encompass a broad range of topics, including:
•Threat intelligence;
•Risk updates with regional vice presidents;
•Third-party assessments and results of tabletop exercises;
•Training programs for employees;
•Results of phishing simulations;
•Cybersecurity technologies and best practices; and
•Significant cybersecurity incidents and/or trends (if any).
Risk Management Personnel
Primary responsibility for assessing, monitoring and managing our cybersecurity risks rests with the CISO. With over 20 years of experience in the field of information technology, the CISO brings a wealth of expertise to the role. The CISO’s education includes a Master’s in Cybersecurity Management. The CISO has in-depth knowledge and experience in developing and executing our cybersecurity strategies. The CISO oversees our governance programs, tests our compliance with standards, remediates known risks, and leads our comprehensive employee security awareness program. The CISO is also responsible for building and overseeing a cybersecurity team, including internal and external resources, who provide subject matter expertise and operational talents to achieve our cybersecurity objectives.
Monitor Cybersecurity Incidents
The CISO and the cybersecurity team are continually informed about the latest developments in cybersecurity, including potential threats and innovative risk management techniques, which is an important component in designing programs to prevent, detect, mitigate, and remediate cybersecurity incidents. The CISO implements and oversees processes for the regular monitoring of our information systems. This includes the deployment of advanced security measures and regular system audits to identify potential vulnerabilities. In the event of a cybersecurity incident, we have a well-defined incident response plan. This plan includes immediate actions to mitigate the impact and long-term strategies for remediation and prevention of future incidents and informing the board of significant cyber incidents in accordance with the Company’s incident response plan.
Item 2. PROPERTIES
We operate through a broad network of sales offices, engineering centers, 3031 principal production and assembly facilities and several distribution centers throughout the world. Our active properties represent about 6.37.6 million square feet, of which approximately 37%48% is leased.
We own 16 of our production and assembly facilities, with the remainder under long-term lease arrangements. We believe that our plants have been well maintained, are generally in good condition and are suitable for the conduct of our business.
Item 3. LEGAL PROCEEDINGS
In the normal course of business, we are involved in a variety of lawsuits, claims and legal proceedings, including commercial and contract disputes, employment matters, product liability claims, environmental liabilities, intellectual property disputes and tax-related matters. In our opinion, pending legal matters are not expected to have a material adverse impact on our results of operations, financial condition, liquidity or cash flows.
This item should be read in conjunction with the Company's Risk Factors set forth in Part I,I. Item 1A for additional information.of this Form 10-K.
Item 4. MINE SAFETY DISCLOSURES
Not applicable.
INFORMATION ABOUT OUR EXECUTIVE OFFICERS
The following is a list of executive officers of the Company as of February 16, 2021.
David D. Petratis, age 63, has served as our Chairman, President and Chief Executive Officer since 2013.
Patrick S. Shannon, age 58, has served as our Senior Vice President and Chief Financial Officer since 2013.
Jeffrey N. Braun, age 61, has served as our Senior Vice President and General Counsel since 2014. Mr. Braun also served as Secretary from 2018 to 2020.
Timothy P. Eckersley, age 59, has served as our Senior Vice President – Allegion International since 2021. Mr. Eckersley served as our Senior Vice President – Americas from 2013 to 2020.
Cynthia D. Farrer, age 58, has served as our Vice President – Global Operations and Integrated Supply Chain since October 2020. Ms. Farrer served as our Vice President, Global Supply Management from 2017 to 2020 and as our Vice President, Operations – Americas from 2013 to 2017.
Tracy L. Kemp, age 52, has served as our Senior Vice President – Chief Information and Digital Officer since December 2020. Ms. Kemp served as our Senior Vice President – Chief Customer and Digital Officer from 2019 to December 2020. Ms. Kemp also served as our Senior Vice President and Chief Information Officer from 2015 to 2019.
Robert C. Martens, age 50, has served as our Senior Vice President – Chief Innovation and Design Officer since 2019 and Futurist and President of Allegion Ventures since 2017. Mr. Martens served as Futurist of the Americas region and Director of Connectivity Platforms from 2014 to 2017.
Shelley A. Meador, age 49, has served as our Senior Vice President – Human Resources and Communications since 2016. Ms. Meador served as our Vice President – Tax from 2013 to 2016.
Luis J. Orbegoso, age 50, has served as our Senior Vice President – Allegion Americas since February 2021. Mr. Orbegoso previously served as President and Chief Operating Officer at American Residential Services (ARS, a residential HVAC and plumbing company) from 2017 to 2020 and as President, ADT Business at ADT Corporation (currently ADT Inc., a leading provider of security, automation and smart home solutions) from 2013-2016.
Douglas P. Ranck, age 62, has served as our Vice President, Controller and Chief Accounting Officer since 2013.
Vincent Wenos, age 54, has served as our Senior Vice President – Chief Technology Officer since 2019. Mr. Wenos served as our Vice President – Global Technology and Engineering from 2018 to 2019 and served as both our Vice President – Americas Engineering and Vice President – Global Mechanical Products from 2016 to 2018. Mr. Wenos previously served as Vice President – Product Development and Technology at Stanley Black & Decker, Inc. (a global diversified consumer and industrial products company).
All above-listed officers except for Mr. Orbegoso and Mr. Wenos have been employed by the Company for more than the past five years. No family relationship exists between any of the above-listed executive officers of the Company. All officers are elected to hold office for one year or until their successors are elected and qualified or their earlier death, resignation or removal from office by the Board of Directors of the Company.
PART II
Item 5. MARKET FOR REGISTRANT’S COMMON EQUITY, RELATED STOCKHOLDER MATTERS AND
ISSUER PURCHASES OF EQUITY SECURITIES
Information regarding the principal market for our ordinary shares and related shareholder matters is as follows:
Our ordinary shares are traded on the NYSENew York Stock Exchange under the symbol ALLE. As of February 11, 2021,14, 2024, the number of record holders of ordinary shares was 2,301. Information regarding equity compensation plans required to be disclosed pursuant to this Item is incorporated by reference from our Proxy Statement.1,920.
Dividend Policy
Our Board of Directors declared dividends of $0.32$0.45 per ordinary share on February 6, 2020,9, 2023, April 8, 2020,13, 2023, September 1, 20207, 2023 and December 2, 2020.7, 2023. On February 5, 2021,7, 2024, our Board of Directors declared a dividend of $0.36$0.48 per ordinary share payable on March 31, 2021.29, 2024, to shareholders of record on March 15, 2024. We paid a total of $117.3$158.7 million in cash for dividends to ordinary shareholders during the year ended December 31, 2020.2023. Future dividends on our ordinary shares, if any, will be at the discretion of our Board of Directors and will depend on, among other things, our results of operations, cash requirements and surplus, financial condition, contractual restrictions (including under the agreements governing our indebtedness) and other factors that the Board of Directors may deem relevant, as well as our ability to pay dividends in compliance with the Irish Companies Act. Under the Irish Companies Act, dividends and distributions may only be made from distributable reserves. Distributable reserves, broadly, means the accumulated realized profits of Allegion plc (ALLE-Ireland) and("ALLE-Ireland") which are unrelated to any U.S. GAAP reporting amountreported amounts (e.g., retained earnings). As of December 31, 2020,2023, we had distributable reserves of $3.8$3.9 billion. In addition, no distribution or dividend may be made unless the net assets of ALLE-Ireland are equal to, or in excess of, the aggregate of ALLE-Ireland’s called up share capital plus undistributable reserves, and the distribution or dividend does not reduce ALLE-Ireland’s net assets below such aggregate.
Issuer Purchases of Equity Securities
| | | | | | | | | | | | | | | | | | | | | | | | | | |
| Period | | Total number of shares purchased (000s) | | Average price paid per share | | Total number of shares purchased as part of the Authorization (000s) | | Approximate dollar value of shares still available to be purchased under the 2020 Share Repurchase Authorization (000s) |
| October 1 - October 31 | | 382 | | | $ | 102.51 | | | 382 | | | $ | 689,782 | |
| November 1 - November 30 | | 313 | | | 108.09 | | | 313 | | | 655,907 | |
| December 1 - December 31 | | 370 | | | 112.81 | | | 370 | | | 614,192 | |
| Total | | 1,065 | | | $ | 107.73 | | | 1,065 | | | $ | 614,192 | |
| | | | | | | | | | | | | | | | | | | | | | | | | | |
| Period | | Total number of shares purchased (000s) | | Average price paid per share | | Total number of shares purchased as part of the Share Repurchase Authorization (000s) | | Approximate dollar value of shares still available to be purchased under the Share Repurchase Authorization (000s) |
| October 1 - October 31 | | — | | | $ | — | | | — | | | $ | 500,000 | |
| November 1 - November 30 | | — | | | — | | | — | | | 500,000 | |
| December 1 - December 31 | | 342 | | | 116.85 | | | 342 | | | 460,024 | |
| Total | | 342 | | | $ | 116.85 | | | 342 | | | $ | 460,024 | |
In February 2017, our Board of Directors approved a stock repurchase authorization of up to $500 million of the Company’s ordinary shares (the "2017 Share Repurchase Authorization"). On February 6, 2020, our Board of Directors approved a new share repurchase authorization of up to, and including, $800 million of the Company’s ordinary shares (the "2020 Share"Share Repurchase Authorization"), replacing. On June 8, 2023, our Board of Directors reauthorized the Company's existing 2017 Share Repurchase Authorization.share repurchase program and, as a result, authorized the repurchase of up to, and including, $500 million of the Company's ordinary shares. The 2020 Share Repurchase Authorization does not have a prescribed expiration date. Based on market conditions, share repurchases aremay be made from time to time in the open market at the discretion of management.
Performance Graph
The annual changes for the five-year period shown below are based on the assumption that $100 had been invested in Allegion plc ordinary shares, the Standard & Poor’s 500 Stock Index ("S&P 500") and the Standard & Poor's 400 Capital Goods Index ("S&P 400 Capital Goods") on December 31, 2015,2018, and that all quarterly dividends were reinvested. The total cumulative dollar returns shown on the graph represent the value that such investments would have had on December 31, 2020.2023.
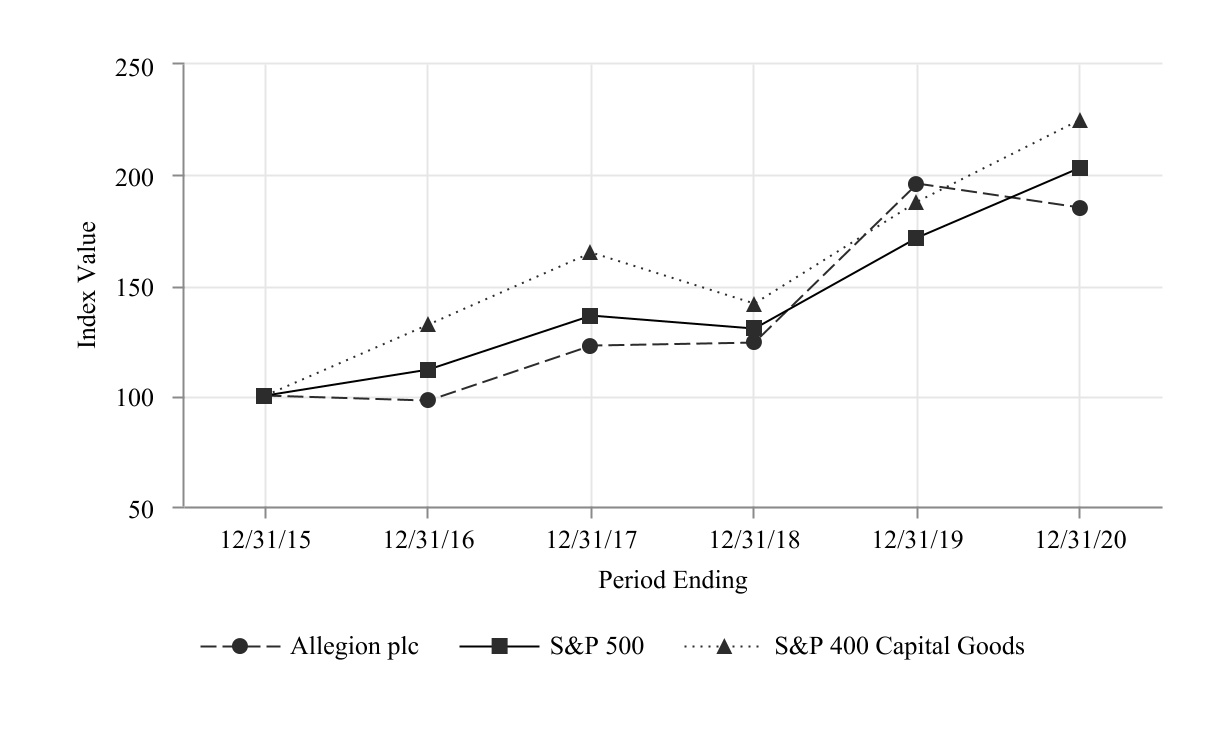

| | December 31, 2015 | | December 31, 2016 | | December 31, 2017 | | December 31, 2018 | | December 31, 2019 | | December 31, 2020 | |
| December 31, 2018 | | | December 31, 2018 | December 31, 2019 | December 31, 2020 | December 31, 2021 | December 31, 2022 | December 31, 2023 |
| Allegion plc | Allegion plc | | 100.00 | | 97.80 | | 122.55 | | 124.00 | | 195.77 | | 185.22 | | Allegion plc | 100.00 | 157.88 | 149.38 | 171.86 | 138.78 | 169.74 |
| S&P 500 | S&P 500 | | 100.00 | | 111.96 | | 136.40 | | 130.42 | | 171.49 | | 203.04 | | S&P 500 | 100.00 | 131.49 | 155.68 | 200.37 | 164.08 | 207.21 |
| S&P 400 Capital Goods | S&P 400 Capital Goods | | 100.00 | | 131.93 | | 164.51 | | 141.46 | | 187.79 | | 225.05 | | S&P 400 Capital Goods | 100.00 | 132.75 | 159.09 | 203.10 | 182.76 | 251.41 |
Item 6.[RESERVED]
Item 6.SELECTED FINANCIAL DATA (1)
In millions, except per share amounts:
| | | | | | | | | | | | | | | | | | | | | | | | | | | | | | | | | | | |
| As of and for the years ended December 31, | | 2020 | | 2019 | | 2018 | | 2017 | | 2016 | |
| | | | | | | | | | | |
| Net revenues | | $ | 2,719.9 | | | $ | 2,854.0 | | | $ | 2,731.7 | | | $ | 2,408.2 | | | $ | 2,238.0 | | |
| | | | | | | | | | | |
| Net earnings attributable to Allegion plc ordinary shareholders | | 314.3 | | (a) | 401.8 | | (b) | 434.9 | | (c) | 273.3 | | (d) | 229.1 | | (e) |
| | | | | | | | | | | |
| Total assets | | 3,069.4 | | | 2,967.2 | | | 2,810.2 | | | 2,542.0 | | | 2,247.4 | | |
| | | | | | | | | | | |
| Total debt | | 1,429.6 | | | 1,427.7 | | | 1,444.8 | | | 1,477.3 | | | 1,463.8 | | |
| | | | | | | | | | | |
| Total Allegion plc shareholders’ equity | | 829.4 | | | 757.4 | | | 651.0 | | | 401.6 | | | 113.3 | | |
| | | | | | | | | | | |
| Earnings per share attributable to Allegion plc ordinary shareholders: | | | | | | | | | | | |
| Basic: | | $ | 3.41 | | | $ | 4.29 | | | $ | 4.58 | | | $ | 2.87 | | | $ | 2.39 | | |
| Diluted: | | $ | 3.39 | | | $ | 4.26 | | | $ | 4.54 | | | $ | 2.85 | | | $ | 2.36 | | |
| | | | | | | | | | | |
| Dividends declared per ordinary share | | $ | 1.28 | | | $ | 1.08 | | | $ | 0.84 | | | $ | 0.64 | | | $ | 0.48 | | |
(a)Net earnings for the year ended December 31, 2020, includes goodwill and intangible asset impairment charges of $99.0 million (net of tax), predominantly related to the economic challenges stemming from the ongoing COVID-19 pandemic and the expected impacts on the future cash flows in our EMEA and Asia Pacific segments, as well as a $37.9 million loss on assets held for sale at December 31, 2020 related to our Qatar Metal Industries ("QMI") business.
(b)Net earnings for the year ended December 31, 2019, includes a $31.4 million (net of tax) loss related to the divestitures of our business operations in Colombia and Turkey.
(c)Net earnings for the year ended December 31, 2018, includes a $21.9 million tax benefit related to an adjustment to the provisional amounts previously recognized related to the enactment of the 2017 U.S. Tax Cuts and Jobs Act (the "Tax Reform Act").
(d)Net earnings for the year ended December 31, 2017, includes $44.7 million of costs related to the refinancing of our credit facilities and senior notes and a net tax charge of $53.5 million related to the Tax Reform Act.
(e)Net earnings for the year ended December 31, 2016, includes $84.4 million of losses related to our previously divested Systems Integration business.
(1) The Company has not restated 2016 - 2017 for the impact of the adoption of ASC Topic 606, "Revenue from Contracts with Customers" ("ASC 606") as of January 1, 2018, nor has the Company restated the Total assets for 2016 - 2018 for the impact of the adoption of ASC Topic 842, "Leases" as of January 1, 2019. The impact of excluding these standards in prior period presentation is not material.
Item 7. MANAGEMENT’S DISCUSSION AND ANALYSIS OF FINANCIAL CONDITION AND RESULTS OF OPERATIONS
The following Management’s Discussion and Analysis of Financial Condition and Results of Operations contains forward-looking statements that involve risks and uncertainties. Our actual results may differ materially from the results discussed in the forward-looking statements. Factors that might cause a difference include, but are not limited to, those discussed under Part I, Item 1A. Risk Factors in this Annual Report on Form 10-K. The following section is qualified in its entirety by the more detailed information, including our consolidated financial statements and the notes thereto, which appears elsewhere in this Annual Report.
Overview
Organization
We are a leading global provider of security products and solutions operating in three geographic regions:two segments: Allegion Americas EMEA and Asia Pacific.Allegion International. We sell a wide range of security products and solutions for end-users in commercial, institutional and residential marketsfacilities worldwide, including the education, healthcare, government, hospitality, retail, commercial office and single and multi-family residential markets. Our leading brands include CISA, Interflex, LCN, Schlage, SimonsVoss and Von Duprin.
Recent Developments
COVID-19 Pandemic
In March 2020, a global pandemic was declared by the WHO related to COVID-19. The impacts of the COVID-19 pandemic negatively affected the global economy, disrupted supply chains and created significant volatility and disruption in financial markets. The outbreak and spread of COVID-19 also resulted in a substantial curtailment of business activities worldwide, including the major geographic marketsDuring 2023, we serve. As part of the efforts to contain the spread of COVID-19, federal, state and local governments have imposed various restrictions on the conduct of business and travel, such as stay-at-home orders, travel restrictions and quarantines. These measures, as well as changes in employee health and safety concerns and consumer spending patterns, trends and preferences, have led to widespread business closures and lowerexperienced stable demand for our non-residential products with the most pronounced negative impacts of these measures onand services in our results of operations occurring during the second quarter of 2020. Further, changes in commercial real estate occupancy, constraints on government and institutional budgets and the uncertain business climate have led to declines and delays in new construction activity and discretionary projects, including in many of the commercial and institutional construction markets we serve.
Allegion Americas segment. As the pandemicyear progressed, customers began adjusting ordering patterns in response to our reduced lead times due to improved supply chain and resulting economic challenges have adverselyoperational execution, which resulted in abnormal seasonality of non-residential revenues in 2023. Macroeconomic conditions had a more challenging impact on the demand for our residential products in our Allegion Americas segment which negatively impacted revenues. We also experienced a continued softening of demand in our Global Portable Security and will likely continue to adversely impact us, we continue to closely monitor their effects on all aspects ofChina businesses in our businessAllegion International segment.
Growth in electronic security products and the markets in which we operate. Throughout the pandemic, our primary focus has been,solutions remained strong throughout 2023 and continues to be,outperform mechanical products. We expect growth in the healthglobal electronic security product and safety of employees, our business continuity plan, meeting the evolving needs of our customers and the well-being of the many communities around the world in whichsolution categories we operate. During the early months of the pandemic, we experienced temporary production shut-downs due either to government mandate or to help ensure employee safety, most notably in Italy and the Baja region of Mexico. However, the vast majority of our manufacturing facilities have remained open and operational throughout 2020, in part due to the numerous health and safety measures we adopted to promote the health and safety of our workforce and because many of our global operations have been deemed essential businesses. All of our global production and assembly facilities were operational as of December 31, 2020, and while we currently expect they will remain operational for the foreseeable future, such expectation is dependent upon future governmental actions, demand for our products, the stability of our global supply chain and our abilityserve to continue to operateoutperform growth in a safe manner.
We remain focused on business continuity and ensuring our facilities remain operational where safe and appropriate to do so. Weexpect the security products industry will also continue to serve our customers when needed through our channel partners or inventory on hand. To the extent any additional temporary closures or adjustments to production are necessary,benefit from favorable long-term demographic trends such measures will be implemented in a way that allows us to resume operations in an efficient and safe manner, while also minimizing disruption to customers and our overall business, including prudent measures to mitigate, to the extent possible, any financial impacts, although any additional local orders or decrees resulting in new temporary shut-downs will drive further unfavorable impacts to our operations, ability to serve our customers and potentially, our financial position and liquidity. The pandemic will likely continue to impact us in numerous and evolving ways that we may not be able to accurately predict; however, we will continue to closely monitor its impact on our business, employees, customers, suppliers, distribution channels and other business partners, and we believe that our actions taken to date, our financial flexibility and potential measures within our control will allow us to maintain a sound financial position and provide for adequate resources to fund our ongoing operating and financing needs.
Additionally, as a response to the COVID-19 pandemic, on March 27, 2020, the Coronavirus Aid, Relief and Economic Security Act (the "CARES Act") was enacted and signed into law, which included measures to assist companies in response to the COVID-19 pandemic. One measure allowed companies to defer the remittancecontinued urbanization of the employer portion of the socialglobal population, increased concerns about safety and security tax through December 31, 2020, with half the amount deferred required to be paid by December 31, 2021, and the other half by December 31, 2022. Through December 31, 2020, we have elected to defer approximately $13 million under this provision, which is classified in Accrued expenses and other current liabilities and Other noncurrent liabilities within our Consolidated Balance Sheet. A second measure of the CARES Act raised the limit on business interest deductions from 30% to 50% of adjusted taxable income for tax years 2019 and 2020. This increased interest limitation resulted in approximately $20 million of reduced cash tax payments in 2020. Each of these two measures has resulted in a benefit to our cash flows from operations for the year ended December 31, 2020; however, neither measure is expected to materially impact our effective tax rate, and no income tax effects have been recorded during the year ended December 31, 2020.
The challengeseconomic conditions discussed above and uncertainties related to the COVID-19 pandemic and its potential impact on our business, results of operations, financial condition and cash flows, as well as a number of other challenges and uncertainties that could affect our businesses are described further under Part I, Item 1A.1A, "Risk Factors."
20202023 and 20192022 Significant Events
Acquisitions
In December 2020,On January 3, 2023, we acquired Yonomi, Inc. ("Yonomi),plano for a U.S.closing purchase price of $36.6 million. This acquisition was financed through cash on hand and borrowings under the 2021 Revolving Facility. Plano is a SaaS workforce management solution based smart home integration platform providerin Germany, and innovation leader in IoT Cloud platforms. Yonomihas been incorporated into our Allegion International segment.
Acquisition of the Access Technologies business
On July 5, 2022, we completed the acquisition of the Access Technologies business for a purchase price of $915.2 million. This acquisition was financed by the net proceeds from the issuance of our 5.411% Senior Notes, together with borrowings under the 2021 Revolving Facility. The Access Technologies business has been integrated into our Allegion Americas segment.
ImpairmentDivestiture of Goodwill and Intangible AssetsMilre
In September 2022, we sold Milre Systek Co. Ltd. ("Milre") in South Korea for an immaterial amount. As a result of the global economic disruption and uncertainty due to the COVID-19 pandemic,sale, we performed interim impairment testsrecorded a net loss on the goodwill balancesdivestiture of our EMEA and Asia Pacific reporting units, as well as on certain indefinite-lived trade name assets in these two regions, during the first quarter$7.6 million.
Impairment of Intangible Assets
As discussed in Notes 5 and 6Note 7 to the Consolidated Financial Statements, the results of these interimour 2023 impairment teststest indicated that the estimated fair value of our Asia Pacific reporting unit and threetwo indefinite-lived trade names in our International segment were impaired.determined to be less than book value. Consequently, goodwill and intangible asset impairment charges totaling $96.3$7.5 million were recorded. The impairments related to declines in volumes which reduced the brands' expected future cash flows.
Further impairment chargesOn June 22, 2022, Allegion US Holding Company Inc., a wholly-owned subsidiary of the Company ("Allegion US Hold Co"), issued $600.0 million aggregate principal amount of its 5.411% Senior Notes due 2032 (the “5.411% Senior Notes”). The 5.411% Senior Notes require semi-annual interest payments on January 1 and July 1, and mature on July 1, 2032. We incurred and deferred $5.9 million of discounts and financing costs associated with the 5.411% Senior Notes, which is being amortized to Interest expense over their 10-year term, as well as $4.3 million of third party financing costs that were recorded in our Asia Pacific segment duringwithin Interest expense on the Consolidated Statement of Comprehensive Income for the year ended December 31, 2020, including $2.6 million related to supply chain disruptions that reduced a brand's expected future cash flows and $2.8 million related to declines in volumes and pricing pressure for a separate subsidiary in the region.2022.
Loss on Assets Held for Sale
The assets and liabilities of our QMI business met the criteria to be classified as held for sale as of December 31, 2020. Accordingly, QMI's net assets, which primarily included working capital and long-lived assets, were written down to fair value, estimated based on expected sales proceeds, less cost to sell, resulting in a Loss on assets held for sale of $37.9 million.
Turkey and Colombia Divestitures
In 2019, we closed our production facility in Turkey to help streamline our footprint in EMEA and subsequently sold certain of the production assets, which represented a business, for total proceeds of approximately $4.1 million. We recorded a loss on divestiture of $24.2 million ($25.5 million, net of tax), primarily driven by the reclassification of $25.0 million of accumulated foreign currency translation adjustments to earnings upon sale. We also sold our interests in our Colombia operations in 2019 for a nominal amount, recording a net loss on divestiture of $5.9 million, of which $1.2 million related to the reclassification of accumulated foreign currency translation adjustments to earnings upon sale.
2020 Dividends and Share Repurchases
We paid quarterly dividends of $0.32$0.45 per ordinary share to shareholders on record as of March 17, 2020,15, 2023, June 16, 2020,15, 2023, September 16, 2020,18, 2023, and December 16, 2020. We paid18, 2023, for a total of $117.3$158.7 million in cash for dividends to ordinary shareholders and repurchased approximately 1.90.5 million ordinary shares for approximately $208.8$59.9 million during the year ended December 31, 2020.2023.
Other Financing Activities
In 2019, we issued $400.0 million of 3.500% Senior Notes due 2029 (the "3.500% Senior Notes"). Net proceeds from the issuance of the 3.500% Senior Notes, along with cash on hand, were utilized to make a $400.0 million principal payment to partially pay down the Company's outstanding term loan facility (the "Term Facility") balance. As a result of this payment, we have satisfied our obligation to make quarterly installments on the Term Facility up to its maturity date, with the remaining outstanding balance of $238.8 million due on September 12, 2022.
Subsequent Event
Effective January 1, 2021, we have combined our EMEA and Asia Pacific operations into a new segment named Allegion International, in addition to renaming our Americas segment "Allegion Americas". The new Allegion International segment has been created to drive speed and efficiency, simplify our operating segments and optimize our non-U.S. operations.
Results of Operations - For the years ended December 31
| | Dollar amounts in millions, except per share amounts | Dollar amounts in millions, except per share amounts | | 2020 | | % of Net revenues | | 2019 | | % of Net revenues | |
| Dollar amounts in millions, except per share amounts | |
| Dollar amounts in millions, except per share amounts | |
| Net revenues | |
| Net revenues | |
| Net revenues | Net revenues | | $ | 2,719.9 | | | | | $ | 2,854.0 | | | | |
| Cost of goods sold | Cost of goods sold | | 1,541.1 | | | 56.7 | % | | 1,601.7 | | | 56.1 | % | |
| Cost of goods sold | |
| Cost of goods sold | |
| Selling and administrative expenses | Selling and administrative expenses | | 635.7 | | | 23.4 | % | | 681.3 | | | 23.9 | % | |
| Impairment of goodwill and intangible assets | | 101.7 | | | 3.7 | % | | 5.9 | | | 0.2 | % | |
| Loss on assets held for sale | | 37.9 | | | 1.4 | % | | — | | | — | % | |
| Selling and administrative expenses | |
| Selling and administrative expenses | |
| Impairment of intangible assets | |
| Impairment of intangible assets | |
| Impairment of intangible assets | |
| | Operating income | |
| | Operating income | |
| | Operating income | Operating income | | 403.5 | | | 14.8 | % | | 565.1 | | | 19.8 | % | |
| Interest expense | Interest expense | | 51.1 | | | 56.0 | | | |
| Interest expense | |
| Interest expense | |
| Loss on divestitures | Loss on divestitures | | — | | | 30.1 | | | |
| Other (income) expense, net | | (13.0) | | | | | 3.8 | | | | |
| Loss on divestitures | |
| Loss on divestitures | |
| Other income, net | |
| Other income, net | |
| Other income, net | |
| Earnings before income taxes | |
| Earnings before income taxes | |
| Earnings before income taxes | Earnings before income taxes | | 365.4 | | | 475.2 | | | |
| Provision for income taxes | Provision for income taxes | | 50.9 | | | | | 73.1 | | | | |
| Provision for income taxes | |
| Provision for income taxes | |
| Net earnings | |
| Net earnings | |
| Net earnings | Net earnings | | 314.5 | | | 402.1 | | | |
| Less: Net earnings attributable to noncontrolling interests | Less: Net earnings attributable to noncontrolling interests | | 0.2 | | | | | 0.3 | | | | |
| Less: Net earnings attributable to noncontrolling interests | |
| Less: Net earnings attributable to noncontrolling interests | |
| Net earnings attributable to Allegion plc | |
| Net earnings attributable to Allegion plc | |
| Net earnings attributable to Allegion plc | Net earnings attributable to Allegion plc | | $ | 314.3 | | | | | $ | 401.8 | | | | |
| | Diluted net earnings per ordinary share attributable to Allegion plc ordinary shareholders: | Diluted net earnings per ordinary share attributable to Allegion plc ordinary shareholders: | | $ | 3.39 | | | | | $ | 4.26 | | | | |
| | Diluted net earnings per ordinary share attributable to Allegion plc ordinary shareholders: | |
| | Diluted net earnings per ordinary share attributable to Allegion plc ordinary shareholders: | |
The discussions that follow describe the significant factors contributing to the changes in our results of operations for the years presented and form the basis used by management to evaluate the financial performance of the business. For a discussion of our results of operations for the year ended December 31, 2019,2022, compared to the year ended December 31, 2018,2021, see “Part II, Item 7. Management’s Discussion and Analysis of Financial Condition and Results of Operations” of our 20192022 Annual Report on Form 10-K filed with the SEC on February 18, 2020.22, 2023.
Net Revenues
Net revenues for the year ended December 31, 2020, decreased2023, increased by 4.7%11.6%, or $134.1$378.9 million, as compared to the same period in 2019,year ended December 31, 2022, due to the following:
| | | | | |
| Pricing | 1.07.5 | % |
| Volume | (5.8)(2.3) | % |
DivestituresAcquisitions / divestitures | (0.3)6.2 | % |
| Currency exchange rates | 0.40.2 | % |
| Total | (4.7)11.6 | % |
The decreaseincrease in Net revenues was principally driven by lower volumes across all regions, primarily due to the economic challenges stemming from the ongoing COVID-19 pandemic, particularly during the second quarter of 2020. The decrease was, to a lesser degree, due to the impact of the divestitures of our Colombia and Turkey businesses in 2019, as discussed above. These decreases were slightly offset by improved pricing across our major businesses, our acquisitions of the Access Technologies and the impact ofplano businesses and favorable foreign currency exchange rate movements. These increases were partially offset by lower volumes and a divestiture in the prior year. Increased pricing was the result of multiple pricing initiatives implemented to help mitigate the impact of inflation. We will continue to monitor the inflationary pressures to our businesses and address them through pricing initiatives where appropriate.
Pricing includes increases or decreases of price, including discounts, surcharges and/or other sales deductions, on our existing products and services. Volume includes increases or decreases of revenue due to changes in unit volume of existing products and services, as well as new products and services.
Cost of Goods Sold
For the year ended December 31, 2020,2023, Cost of goods sold as a percentage of Net revenues increaseddecreased to 56.7% from 56.1%59.6%, as compared to the year ended December 31, 2022, due to the following:
| | | | | |
InflationPricing and productivity in excess of pricinginflation and productivityinvestment spending | 0.2 (3.8) | % |
| Volume / product mix | 0.80.3 | % |
DivestituresAcquisitions / divestitures | (0.1)0.5 | % |
| |
| Currency exchange rates | 0.3 | % |
| Restructuring / integration / acquisition expenses | (0.2) | % |
Restructuring expenses | (0.1) | % |
| Total | 0.6 (2.9) | % |
CostsCost of goods sold as a percentage of Net revenues for the year ended December 31, 2020, increaseddecreased primarily due to the impact of reduced volumes and product mix and, to a lesser extent, inflation in excess of pricing and productivity. Inflation in excess of pricing and productivity was driven by productivity challenges stemmingimprovements, which exceeded the impacts from the temporary closures during the second quarter discussed above; labor inefficiencies, such as increased absenteeism;inflation and increasedinvestment spending, and lower restructuring and acquisition costs related to ensuring a safe and healthy work environment in lightyear-over-
year. These increasesdecreases were partially offset by certain non-U.S. government incentives, which were included within inflation in excess of pricingunfavorable product mix, lower gross margins associated with our acquired Access Technologies business and productivity, as well as the impacts of the divestitures discussed above,unfavorable foreign currency exchange rate movementsmovements.
Pricing and a year-over-year decrease in restructuring expenses. The year-over-year decrease in restructuring expenses impacting Costs of goods sold is due to the prior year restructuring costs related to the closure of our production facility in Turkey in 2019.
Inflationproductivity in excess of pricinginflation and productivityinvestment spending includes the impact to CostCosts of goods sold from pricing, as defined above, in addition to productivity, inflation and inflation.investment spending. Productivity represents improvements in unit costs of materials and cost reductions related to improvements to our manufacturing design and processes. Inflation includes unit costs for the current period compared to the average actual cost for the prior period, multiplied by current year volumes.
Expenses related to increased head count for strategic initiatives, new facilities or other significant spending for strategic initiatives or new product and channel development, are captured in investment spending. Volume/product mix represents the impact due to increases or decreases of revenue due to changes in unit volume, including new products and services, including the effect of changes in the mix of products and services sold on Cost of goods sold.
Selling and Administrative Expenses
For the year ended December 31, 2020,2023, Selling and administrative expenses as a percentage of Net revenues decreasedincreased to 23.4%23.7% from 23.9%22.5%, as compared to the year ended December 31, 2022, due to the following:
| | | | | |
ProductivityInflation in excess of inflationproductivity and investment spending | (2.3)0.7 | % |
| Volume leverage | 1.40.5 | % |
| |
Investment spendingAcquisitions / divestitures | 0.1 (0.3) | % |
| Currency exchange rates | (0.1)% |
| Restructuring / integration / acquisition expenses | 0.40.3 | % |
| Total | (0.5)1.2 | % |
Selling and administrative expenses as a percentage of Net revenues for the year ended December 31, 2020, decreased primarilyincreased due to productivity benefitsinflation in excess of inflationproductivity and foreign currency exchange rate movements.investment spending, as well as unfavorable volume leverage and year-over-year increase in acquisition and integration expenses. These decreasesincreases were partially offset by unfavorable leverage due to lower volumes, increased investment spendingthe beneficial impact from current and a year-over-year increase in restructuringprior year acquisition and acquisition expenses.divestiture activity.
ProductivityInflation in excess of inflation includesproductivity is primarily the impact from reductions in selling and administrative expenses dueresult of increases to productivity projects and current period costs of ongoing selling and administrative functions compared to the same ongoing expenses in the prior period. Productivity in excess of inflation also reflects the benefits of certain non-U.S. government incentives, reductions in variable compensation and reductions or delays of other business spending in the current year, in response to the COVID-19 pandemic.
compensation. Volume leverage represents the contribution margin related to changes in sales volume, excluding the impact of price, productivity, mix and inflation. Expenses related to increased head count for strategic initiatives, new facilities or significant improvementsspending for strategic initiatives andor new product and channel development, are captured in Investment spending in the table above.
Operating Income/Margin
Operating income for the year ended December 31, 2020, decreased $161.62023, increased $122.0 million fromas compared to the same period in 2019,year ended December 31, 2022, and Operating margin decreasedincreased to 14.8%19.4% from 19.8%17.9%, due to the following:
| | | | | | | | | | | |
| In millions | Operating Income | | Operating Margin |
| December 31, 2022 | $ | 586.4 | | | 17.9 | % |
| Pricing and productivity in excess of inflation and investment spending | 154.9 | | | 3.1 | % |
| Volume / product mix | (40.3) | | | (0.8) | % |
| Currency exchange rates | (10.8) | | | (0.3) | % |
| Acquisitions/ divestitures | 29.7 | | | (0.2) | % |
| Impairment of intangible assets | (7.5) | | | (0.2) | % |
| Restructuring / integration / acquisition expenses | (4.0) | | | (0.1) | % |
| | | |
| December 31, 2023 | $ | 708.4 | | | 19.4 | % |
The increase in Operating income was driven by pricing and productivity improvements in excess of inflation and investment spending and the contribution from recent acquisition and divestiture activity. These increases were partially offset by unfavorable volume/product mix, unfavorable foreign currency exchange rate movements, a year-over-year increase in restructuring and acquisition costs and impairment charges on intangible assets recorded in the current year.
The increase in Operating margin was driven by pricing and productivity improvements in excess of inflation and investment spending. The increase was partially offset due to an unfavorable volume/product mix, unfavorable foreign currency exchange rate movements, the year-over-year increase in restructuring, integration and acquisition expenses and the full year dilutive impact to Operating margin from our Access Technologies business as well as the impairment charges recorded in the current year.
Interest Expense
Interest expense for the year ended December 31, 2023, increased $17.2 million as compared to the year ended December 31, 2022 due to the full year impact of interest on our 5.411% Senior Notes issued in June of 2022 as well as an increase in the variable interest rate on borrowings under our 2021 Term Facility.
| | | | | | | | | | | |
| In millions | Operating Income | | Operating Margin |
| December 31, 2019 | $ | 565.1 | | | 19.8 | % |
| Pricing and productivity in excess of inflation | 66.7 | | | 2.1 | % |
| Volume / product mix | (94.9) | | | (2.3) | % |
| | | |
| Currency exchange rates | 8.6 | | | 0.2 | % |
| Investment spending | (2.1) | | | (0.1) | % |
| Divestitures | 0.6 | | | 0.1 | % |
| Restructuring / acquisition expenses | (6.8) | | | (0.3) | % |
| Impairment of goodwill and intangible assets | (95.8) | | | (3.4) | % |
| Loss on assets held for sale | (37.9) | | | (1.3) | % |
| December 31, 2020 | $ | 403.5 | | | 14.8 | % |
The decreases in Operating income and Operating margin were largely driven by our current year goodwill and intangible asset impairment charges and loss on assets held for sale related to our QMI business. As a result of the global economic disruption and uncertainty due to the COVID-19 pandemic, we determined a triggering event had occurred as of March 31, 2020, and performed interim impairment testing on the goodwill balances of our EMEA and Asia Pacific reporting units, as well as on certain indefinite-lived trade name assets in these two regions, which resulted in impairment charges totaling $96.3 million. Additional intangible asset impairments of $2.6 million and $2.8 million were recorded in our Asia Pacific segment in the third and fourth quarters of 2020, respectively. Further, as we concluded that the net assets of our QMI business met the criteria to be classified as held for sale as of December 31, 2020, they were written down to fair value, estimated based on expected sales proceeds, less cost to sell, which resulted in a loss of $37.9 million.
The decreases in Operating income and Operating margin were also attributable to unfavorable volume/product mix, a year-over-year increase in restructuring and acquisition expenses and increased investment spending. These decreases were partially offset by pricing improvements and productivity in excess of inflation, foreign currency exchange rate movements and the impact of the divestitures discussed above.
Interest Expense
Interest expense for the year ended December 31, 2020, decreased $4.9 million compared to 2019, which is due to a lower weighted-average interest rate during the current year on our outstanding indebtedness and a $2.7 million prior year charge for the write-off of previously deferred financing costs related to the Term Facility, which did not recur in the current period.
Loss on DivestituresDivestiture
In 2019,As discussed above, in September 2022 we closed our production facilitysold Milre for an immaterial amount, resulting in Turkey and subsequently sold certain of the production assets thereof, which represented a business, for total proceeds of approximately $4.1 million. We recorded a loss on divestiture of $24.2 million ($25.5 million, net of tax), primarily driven by the reclassification of $25.0 million of accumulated foreign currency translation adjustments to earnings upon sale. We also sold our interests in our Colombia operations in 2019 for a nominal amount, recording a net loss on divestiture of $5.9 million, of which $1.2 million related to the reclassification of accumulated foreign currency translation adjustments to earnings upon sale.
Other (Income) Expense,Income, net
The components of Other (income) expense,income, net, for the years ended December 31 were as follows:
| | | | | | | | | | | | | | | | |
| In millions | | 2020 | | 2019 | | |
| Interest income | | $ | (0.9) | | | $ | (1.8) | | | |
| Foreign currency exchange loss | | 0.7 | | | 1.8 | | | |
| (Earnings) loss from equity method investments | | (0.3) | | | 0.1 | | | |
| Net periodic pension and postretirement benefit (income) cost, less service cost | | (2.2) | | | 6.8 | | | |
| Other | | (10.3) | | | (3.1) | | | |
| Other (income) expense, net | | $ | (13.0) | | | $ | 3.8 | | | |
| | | | | | | | | | | | | | | | |
| In millions | | 2023 | | 2022 | | |
| Interest income | | $ | (6.8) | | | $ | (1.3) | | | |
| Foreign currency exchange loss | | 3.9 | | | 2.4 | | | |
| Earnings and gains from the sale of equity method investments, net | | (1.0) | | | (0.8) | | | |
| Net periodic pension and postretirement benefit cost (income), less service cost | | 1.0 | | | (9.4) | | | |
| Other expense (income) | | 1.0 | | | (2.5) | | | |
| Other income, net | | $ | (1.9) | | | $ | (11.6) | | | |
For the year ended December 31, 2020,2023, Other (income) expense,income, net, was favorable $16.8decreased $9.7 million compared to 2019,2022, primarily due to gains of $12.8 million related to the reclassification to earnings of accumulated foreign currency translation adjustments upon the liquidation of two legal entities in our EMEA region, which are included within Other in the table above, as well as favorablean unfavorable net periodic pension and postretirement benefit cost (income) cost,, less service cost in 20202023 compared to 2019.
Provision for Income Taxes
For the year ended December 31, 2020,2023, our effective tax rate was 13.9%12.4%, compared to 15.4%10.9% for the year ended December 31, 2019.2022. The decreaseincrease in the effective tax rate was primarily due to the favorable mix of income earned in lowerhigher tax rate jurisdictions, which was partially offset by the unfavorablefavorable resolutions of uncertain tax impact related to goodwill and intangible asset impairment charges and the unfavorable year-over-year change in the amounts recognized for valuation allowances.positions.
Review of Business Segments
We operate in and report financial results for threetwo segments: Allegion Americas EMEA and Asia Pacific. Beginning in the second quarter of 2020, results for the Company's India operations have been included within the Asia Pacific segment results, due to an operational change. This change did not result in a material impact to Segment results of operations for either the EMEA or Asia Pacific segment.Allegion International. These segments represent the level at which our chief operating decision maker (the "CODM") reviews companyour financial performance and makes operating decisions.
Segment operating income (loss) is the measure of profit and loss that our chief operating decision makerCODM uses to evaluate the financial performance of the business and as the basis for resource allocation, performance reviews and compensation. For these reasons, we believe that Segment operating income (loss) represents the most relevant measure of Segment profit and loss. Our chief operating decision makerCODM may exclude certain charges or gains, such as corporate charges and other special charges, to arrive at a Segment operating income (loss) that is a more meaningful measure of profit and loss upon which to base our operating decisions. We define Segment operating margin as Segment operating income (loss) as a percentage of the segment's Net revenues.
The segment discussions that follow describe the significant factors contributing to the changes in results for each segment included in Net earnings.
Segment Results of Operations - For the years ended December 31
| | | | | | | | | | | | | | | | | | | | | | | |
| In millions | 2020 | | 2019 | | % Change | | | | | | |
| Net revenues | | | | | | | | | | | |
| Americas | $ | 2,016.7 | | | $ | 2,114.5 | | | (4.6) | % | | | | | | |
| EMEA | 554.6 | | | 572.5 | | | (3.1) | % | | | | | | |
| Asia Pacific | 148.6 | | | 167.0 | | | (11.0) | % | | | | | | |
| Total | $ | 2,719.9 | | | $ | 2,854.0 | | | | | | | | | |
| | | | | | | | | | | |
| Segment operating income (loss) | | | | | | | | | | | |
| Americas | $ | 580.2 | | | $ | 611.6 | | | (5.1) | % | | | | | | |
| EMEA | (5.4) | | | 34.3 | | | (115.7) | % | | | | | | |
| Asia Pacific | (96.7) | | | 0.5 | | | N/M | | | | | | |
| Total | $ | 478.1 | | | $ | 646.4 | | | | | | | | | |
| | | | | | | | | | | |
| Segment operating margin | | | | | | | | | | | |
| Americas | 28.8 | % | | 28.9 | % | | | | | | | | |
| EMEA | (1.0) | % | | 6.0 | % | | | | | | | | |
| Asia Pacific | (65.1) | % | | 0.3 | % | | | | | | | | |
"N/M" = not meaningful | | | | | | | | | | | | | | | | | | | | | | | |
| In millions | 2023 | | 2022 | | % Change | | | | | | |
| Net revenues | | | | | | | | | | | |
| Allegion Americas | $ | 2,913.6 | | | $ | 2,530.7 | | | 15.1 | % | | | | | | |
| Allegion International | 737.2 | | | 741.2 | | | (0.5) | % | | | | | | |
| Total | $ | 3,650.8 | | | $ | 3,271.9 | | | | | | | | | |
| | | | | | | | | | | |
| Segment operating income | | | | | | | | | | | |
| Allegion Americas | $ | 757.2 | | | $ | 611.2 | | | 23.9 | % | | | | | | |
| Allegion International | 58.1 | | | 70.4 | | | (17.5) | % | | | | | | |
| Total | $ | 815.3 | | | $ | 681.6 | | | | | | | | | |
| | | | | | | | | | | |
| Segment operating margin | | | | | | | | | | | |
| Allegion Americas | 26.0 | % | | 24.2 | % | | | | | | | | |
| Allegion International | 7.9 | % | | 9.5 | % | | | | | | | | |
Allegion Americas
Our Allegion Americas segment is a leading provider of security products, services and solutions in approximately 30 countries throughout North America, Central America, the Caribbean and South America. The segment sells a broad range of products and solutions including, locks, locksets, portable locks, key systems, door closers,controls and systems, exit devices, doors, and door systems,accessories, electronic security products, and access control systems and software and service solutions to end-userscustomers in commercial, institutional and residential facilities, including the education, healthcare, government, hospitality, retail, commercial office and single and multi-family residential markets. This segment’s primary brands are LCN, Schlage, Steelcraft, Technical Glass ProductsVon Duprin and Stanley Access Technologies, which we utilize with permission in accordance with the terms of the Access Technologies acquisition agreement ("TGP") and Von Duprin.
Net revenues
Net revenues for the year ended December 31, 2020, decreased2023, increased by 4.6%15.1%, or $97.8$382.9 million, as compared to the same period in 2019,year ended December 31, 2022, due to the following:
| | | | | |
| Pricing | 1.18.3 | % |
| Volume | (5.3)(0.9) | % |
DivestituresAcquisitions | (0.4)7.9 | % |
| Currency exchange rates | (0.2) | % |
| Total | (4.6)15.1 | % |
The decreaseincrease in Net revenues was principally driven by lower volumes due toimproved pricing and the economic challenges stemming from the ongoing COVID-19 pandemic, as well as the impact of the divestitureacquisition of our Colombia business in 2019.Access Technologies business. These decreasesincreases were partially offset by lower volumes and unfavorable foreign currency exchange rate movements. Increased pricing was the result of multiple pricing initiatives implemented to help mitigate the impact of inflation. We will continue to monitor the inflationary pressures to our businesses and address them through pricing initiatives where appropriate.
Net revenues from non-residential products (excluding Net revenues from our acquired Access Technologies business), increased by a low double-digits percent compared to the prior year, driven by improved pricing. pricing which was offset by lower volumes. Pricing improvements reflect the realization of initiatives taken by the Company in response to inflation pressures.
Net revenues from residential products for the year ended December 31, 2020, increased mid-singledecreased by a low single digits compared to the same period in the prior year, primarily driven by higher volumes. Net revenues from non-residential products for the year ended December 31, 2020, decreased high single digitspercent compared to the prior year, primarily drivenyear. Stable pricing was offset by lower volumes during the year. During 2023, we experienced a softening in market demand for our residential products, due in part to lower consumer sentiment, which resulted in reduced sales volumes. As a result of the COVID-19 pandemic, there have been changesFurther, market conditions for new residential construction remained soft throughout 2023 and we anticipate softness in commercial real estate occupancy, constraints on government and institutional budgets and an overall uncertain business climate, which have led to declines and delays in new construction activity and discretionary projects in the non-residential construction markets we serve. These challenges are expecteddemand for our residential products to continue in 2021, but the long-term impacts of the pandemic and related market disruption are not yet known.into 2024.
Additionally, as end-users have continued to adopt newer technologies in their facilities and homes, accelerated by the increasing adoption of the Internet of Things ("IoT"), growthGrowth in electronic security products and solutions has become an increasedis a metric monitored by management and ofa focus toof our investors. For the year ended December 31, 2020, Net revenues from the sale of electronicElectronic products in the Americas segment decreased mid-single digits compared to the same period in the prior year, primarily driven by lower volumes due to delays in discretionary projects. Electronicencompass both residential and non-residential products, and include all electrified product categories including, but not limited to, electronic and electrified locks, access control systems and electronic and electrified door controls and electrifiedsystems and exit devices.
Operating income/margin
Segment operating income for the year ended December 31, 2020, decreased $31.42023, increased $146.0 million, and Segment operating margin decreasedincreased to 28.8%26.0% from 28.9%24.2% as compared to the same period in 2019,year ended December 31, 2022, due to the following:
| | | | | | | | | | | |
| In millions | Operating Income | | Operating Margin |
| December 31, 2019 | $ | 611.6 | | | 28.9 | % |
| Pricing and productivity in excess of inflation | 31.0 | | | 1.1 | % |
| Volume / product mix | (64.8) | | | (1.5) | % |
| Currency exchange rates | 5.9 | | | 0.3 | % |
| Investment spending | (2.0) | | | (0.1) | % |
| Divestitures | 0.7 | | | 0.2 | % |
| Restructuring / acquisition expenses | (2.2) | | | (0.1) | % |
| December 31, 2020 | $ | 580.2 | | | 28.8 | % |
| | | | | | | | | | | |
| In millions | Operating Income | | Operating Margin |
| December 31, 2022 | $ | 611.2 | | | 24.2 | % |
| Pricing and productivity in excess of inflation and investment spending | 159.2 | | | 3.9 | % |
| Volume / product mix | (17.1) | | | (0.5) | % |
| Currency exchange rates | (13.8) | | | (0.5) | % |
| Acquisitions | 25.0 | | | (0.8) | % |
| Restructuring/ integration / acquisition expenses | (7.3) | | | (0.3) | % |
| December 31, 2023 | $ | 757.2 | | | 26.0 | % |
The decreasesincrease in Segment operating income was primarily driven by pricing and Segmentproductivity improvements in excess of inflation and investment spending and operating marginincome from our acquired Access Technologies business. These increases were primarily due topartially offset by an unfavorable volume/product mix, as well as increased investment spending and year-over-year increases in restructuring and acquisition expenses. These decreases were partially offset by pricing improvements and productivity in excess of inflation,unfavorable foreign currency exchange rate movements and the impacta year-over-year increase in restructuring, integration, and acquisition expenses.
The increase in Segment operating margin was driven by pricing and productivity improvements in excess of the divestiture of our Colombia business in 2019. As a result of the ongoing COVID-19 pandemic, certain of our facilities in the Americas experienced productivity challenges due to temporary closuresinflation and lower volume and demand, particularly during the second quarter; however, these productivity decreases were more thaninvestment spending. This increase was partially offset by reductions in variable compensation and reductions or delays of other business spending.unfavorable volume/product mix, unfavorable foreign currency
EMEAexchange rate movements, year-over-year increases in restructuring, integration and acquisition expenses, as well as the full year impact to Segment Operating margin from our Access Technologies business.
Allegion International
Our EMEAAllegion International segment provides security products, services and solutions in approximately 80 countriesprimarily throughout Europe, the Middle EastAsia and Africa.Oceania. The segment offers end-users a broad range of products, services and solutions including locks, locksets, portable locks, key systems, door closers,controls and systems, exit devices, doors, and door systems, electronic security products, and access control systems, as well as time and attendance and workforce productivity solutions, among other software and service solutions. This segment’s primary brands are AXA, Bricard, Briton, CISA, Gainsborough, Interflex, Kryptonite and SimonsVoss. This segment also resells LCN, Schlage and Von Duprin products, primarily in the Middle East.
Net revenues
Net revenues for the year ended December 31, 2020,2023, decreased by 3.1%0.5%, or $17.9$4.0 million, as compared to the same period in 2019,year ended December 31, 2022, due to the following:
| | | | | |
| Pricing | 0.94.9 | % |
| Volume | (6.0)(7.4) | % |
DivestituresAcquisitions / divestitures | (0.2)0.7 | % |
| Currency exchange rates | 2.21.3 | % |
| Total | (3.1)(0.5) | % |
The decrease in Net revenues was principally driven by lower volumes, due to the economic challenges stemming from the ongoing COVID-19 pandemic, particularly during the second quarter, as well as the divestiture ofwithin our Turkey business in 2019.Global Portable Security business. These decreases were partially offset by improved pricing andacross our major businesses throughout the segment as well as favorable foreign currency exchange rate movements. The impact from the acquisition of plano in 2023 was partially offset by the divestiture of Milre in 2022.
Operating income (loss)/margin
Segment operating income (loss) for the year ended December 31, 2020, was unfavorable $39.72023, decreased $12.3 million, and Segment operating margin decreased to (1.0)%7.9% from 6.0%9.5% as compared to the same period in 2019,year ended December 31, 2022, due to the following:
| | | | | | | | | | | |
| In millions | Operating Income (Loss) | | Operating Margin |
| December 31, 2019 | $ | 34.3 | | | 6.0 | % |
| Pricing and productivity in excess of inflation | 15.0 | | | 2.6 | % |
| Volume / product mix | (22.4) | | | (3.8) | % |
| Currency exchange rates | 2.8 | | | 0.4 | % |
| Investment spending | (0.3) | | | (0.1) | % |
| Divestitures | (0.1) | | | — | % |
| Restructuring / acquisition expenses | 3.1 | | | 0.5 | % |
| Impairment of intangible assets | 0.1 | | | — | % |
| Loss on assets held for sale | (37.9) | | | (6.6) | % |
| December 31, 2020 | $ | (5.4) | | | (1.0) | % |
| | | | | | | | | | | |
| In millions | Operating Income | | Operating Margin |
| December 31, 2022 | $ | 70.4 | | | 9.5 | % |
| Pricing and productivity in excess of inflation and investment spending | 16.0 | | | 1.6 | % |
| Volume / product mix | (23.1) | | | (2.6) | % |
| Currency exchange rates | 3.0 | | | 0.3 | % |
| Acquisitions / divestitures | 4.7 | | | 0.8 | % |
| Restructuring/ integration / acquisition expenses | (5.4) | | | (0.7) | % |
| Impairment of intangible assets | (7.5) | | | (1.0) | % |
| | | |
| December 31, 2023 | $ | 58.1 | | | 7.9 | % |
The decreases in Segment operating income (loss) was unfavorableand Segment operating margin were primarily due to the loss on assets held for sale related to our QMI business,driven by unfavorable volume/product mix, a year-over-year increase in restructuring, integration and to a lesser extent, increased investment spendingacquisition expenses, and impairment charges on intangible assets recorded in the impact of the divestiture of our Turkey business in 2019.current year. These decreases were partially offset by pricing improvements and productivity in excess of inflation, foreign currency exchange rate movements, year-over-year decreases in restructuring and acquisition expenses and intangible asset impairment charges. Certain of our facilities in EMEA did experience productivity challenges as a result of the COVID-19 pandemic due to temporary closures and lower volume and demand, particularly during the second quarter in Italy; however, this was more than offset by the benefits of certain government incentives and reductions in variable compensation and other business spending. Pricing and productivity in excess of inflation also includes the impact of a $5.1 million environmental remediation charge incurred during the fourth quarter of 2020.
Segment operating margin decreased primarily due to the loss on assets held for sale, unfavorable volume/product mix and increased investment spending. These decreases were partially offset by pricing improvements and productivity in excess of inflation, foreign currency exchange rate movements and year-over-year decreases in restructuring and acquisition expenses.
Asia Pacific
Our Asia Pacific segment provides security products, services and solutions in approximately 15 countries throughout the Asia Pacific region. The segment offers end-users a broad range of products, services and solutions including, locks, locksets, portable locks, key systems, door closers, exit devices, electronic products and access control systems. This segment’s primary brands are Brio, Briton, FSH, Gainsborough, Legge, Milre and Schlage.
Net revenues
Net revenues for the year ended December 31, 2020, decreased by 11.0%, or $18.4 million, compared to the same period in 2019, due to the following:
| | | | | |
Pricing | (0.7) | % |
Volume | (9.9) | % |
| |
Currency exchange rates | (0.4) | % |
Total | (11.0) | % |
The decrease in Net revenues was principally driven by lower volumes in our Korea business, declines attributable to the economic challenges stemming from the ongoing COVID-19 pandemic and weakness in end markets throughout the region. Unfavorable foreign currency exchange rate movements and lower pricing also contributed to the decrease in Net revenues during the current year.
Operating income (loss)/margin
Segment operating income (loss) for the year ended December 31, 2020, was unfavorable $97.2 million, and Segment operating margin decreased to (65.1)% from 0.3% compared to the same period in 2019, due to the following:
| | | | | | | | | | | |
| In millions | Operating Income (Loss) | | Operating Margin |
| December 31, 2019 | $ | 0.5 | | | 0.3 | % |
| Pricing and productivity in excess of inflation | 8.2 | | | 4.9 | % |
| Volume / product mix | (7.7) | | | (4.9) | % |
| Currency exchange rates | (0.1) | | | (0.1) | % |
| Investment spending | 0.8 | | | 0.5 | % |
| | | |
| Restructuring / acquisition expenses | (2.5) | | | (1.5) | % |
| Impairment of goodwill and intangible assets | (95.9) | | | (64.3) | % |
| December 31, 2020 | $ | (96.7) | | | (65.1) | % |
The decreases to Segment operating income (loss) and Segment operating margin were both primarily due to an $88.1 million goodwill impairment charge in the first quarter of 2020 and increased year-over-year intangible asset impairment charges, as well as unfavorable volume/product mix, year-over-year increases in restructuring and acquisition expenses and foreign currency exchange rate movements. These decreases were partially offset by productivity improvements in excess of lower pricing and inflation and decreased investment spending. Pricingspending, favorable movements in foreign currency exchange rates and productivity in excess of inflation includes the impact of a $4.0 million gain on the sale of a building within the region during the fourth quarter of 2020.both prior year and current year acquisition and divestiture activity.
Liquidity and Capital Resources
Liquidity Outlook, Sources and uses of liquidity
Our primary source of liquidity is cash provided by operating activities. Cash provided by operating activities is used to invest in new product development and fund capital expenditures and working capital requirements and is expected to be adequate to service any future debt, pay any declared dividends and potentially fund acquisitions and share repurchases.requirements. Our ability to fund these capital needs depends on our ongoing ability to generate cash from our operating activities, and to access our borrowing facilities (including unused availability under the 2021 Revolving Facility and our Revolving Facility) and capital markets.
Throughout 2020, we have closely monitored the developments relatedaccess to the COVID-19 pandemic, including the resulting uncertainties around customer demand, supply chain disruption, the availabilitycapital and cost of materials, customercredit markets enable us to fund these capital needs, execute our long-term growth strategies and supplier financial condition, levels of liquidity andreturn value to our ongoing compliance with debt covenants. Whileshareholders. Further, our business operates with strong operating cash flows, low leverage and resultslow capital intensity, providing us financial flexibility.
Our short-term financing needs primarily consist of working capital requirements, restructuring initiatives, capital spending, dividend payments and principal and interest payments on our long-term debt. Long-term financing needs depend largely on
operations have been negatively impacted by the pandemic and the resulting global economic slowdown, we have no required principal payments onpotential growth opportunities, including potential acquisitions, repayment or refinancing of our long-term debt until September 2022, maintainobligations and repurchases of our ordinary shares. Of our total outstanding indebtedness as of December 31, 2023, approximately 89% incurs fixed-rate interest and is therefore not exposed to the risk of rising variable interest rates.
Based upon our operations, existing cash balances and cash equivalents of $480.4 million and have unused availability of $485.0 million under ourthe 2021 Revolving Facility, as of December 31, 2020. Further, our business operates with low capital intensity, providing financial flexibility during this time of continued uncertainty. We believe that our actions taken2023, we expect cash flows from operations to date, future cash provided by operating activities, availability under our Revolving Facility, access to funds on hand and capital markets, as well as other potential measures within our controlbe sufficient to maintain a sound financial position and liquidity will provide adequate resourcesand to fundmeet our operatingfinancing needs for at least the next 12 months. Further, we do not anticipate any covenant compliance challenges with any of our outstanding indebtedness for at least the next 12 months. We also believe existing availability under the 2021 Credit Facilities and financing needs.
The following table reflects the major categories of cash flows for the years ended December 31. For additional details, please see the Consolidated Statements of Cash Flows in the Consolidated Financial Statements.
| | In millions | In millions | | 2020 | | 2019 | |
| In millions | |
| In millions | |
| Net cash provided by operating activities | |
| Net cash provided by operating activities | |
| Net cash provided by operating activities | Net cash provided by operating activities | | $ | 490.3 | | | $ | 488.2 | | |
| Net cash used in investing activities | Net cash used in investing activities | | (56.7) | | | (77.6) | | |
| Net cash used in financing activities | | $ | (321.9) | | | $ | (342.2) | | |
| Net cash used in investing activities | |
| Net cash used in investing activities | |
| Net cash (used in) provided by financing activities | |
| Net cash (used in) provided by financing activities | |
| Net cash (used in) provided by financing activities | |
Operating activities
: Net cash provided by operating activities for the year ended December 31, 2020,2023, increased $2.1by $141.1 million compared to 2019. As discussed above, Net2022, driven primarily by higher net earnings and higher cash provided by operating activities for the year ended December 31, 2020, included benefits totaling approximately $30 million due to measures included in the CARES Act.
Investing activities
Investing activities: Net cash used in investing activities for the year ended December 31, 2020,2023, decreased $20.9by $865.0 million compared to 2019, 2022, primarily due to a decreasethe Access Technologies acquisition in 2022, which was partially offset by an increase of $20.2 million in capital expenditures.expenditures compared to 2022 and an increase in other investments by $6.2 million compared to 2022.
Financing activities
: Net cash used in financing activities for the year ended December 31, 2020, decreased $20.32023, changed by $735.7 million compared to 2019.2022. In 2022, we issued $600.0 million of Senior Notes and had net borrowings of $69.0 million on the 2021 Revolving Facility to finance the acquisition of the Access Technologies business. In 2023, we repaid the remaining borrowings on the 2021 Revolving Facility. The year over-year reductionsremaining change in debt repayments andcash used in financing activities was primarily due to an increase in dividend payments partially offset by slightly less cash used to repurchase shares of $17.7 million and $17.2 million, respectively, were partially offset by a year-over-year increase in dividend payments2023 compared to ordinary shareholders of $16.7 million.2022.
At December 31, long-term debt and other borrowings consisted of the following:
| | In millions | In millions | 2020 | | 2019 | In millions | 2023 | | 2022 |
| Term Facility | $ | 238.8 | | | $ | 238.8 | |
| Revolving Facility | — | | | — | |
| 2021 Term Facility | |
| 2021 Revolving Facility | |
| 3.200% Senior Notes due 2024 | 3.200% Senior Notes due 2024 | 400.0 | | | 400.0 | |
| 3.550% Senior Notes due 2027 | 3.550% Senior Notes due 2027 | 400.0 | | | 400.0 | |
| 3.500% Senior Notes due 2029 | 3.500% Senior Notes due 2029 | 400.0 | | | 400.0 | |
| 5.411% Senior Notes due 2032 | |
| Other debt | Other debt | 0.6 | | | 0.7 | |
| Total borrowings outstanding | Total borrowings outstanding | 1,439.4 | | | 1,439.5 | |
| Less discounts and debt issuance costs, net | (9.8) | | | (11.8) | |
| Discounts and debt issuance costs, net | |
| Total debt | Total debt | 1,429.6 | | | 1,427.7 | |
| Less current portion of long-term debt | Less current portion of long-term debt | 0.2 | | | 0.1 | |
| Total long-term debt | Total long-term debt | $ | 1,429.4 | | | $ | 1,427.6 | |
As of December 31, 2020,2023, we have an unsecured Credit Agreement in place, consisting of a $700.0the $250.0 million term loan facility (the “Term Facility”), of which $238.8 million is outstanding,2021 Term Facility, and a $500.0 million revolving credit facility (the “Revolving Facility” and, togetherthe 2021 Revolving Facility (together with the 2021 Term Facility, the “Credit“2021 Credit Facilities”). The 2021 Credit Facilities mature on September 12, 2022.
At inception, theNovember 18, 2026. The 2021 Term Facility was scheduled to amortizeamortizes in quarterly installments at the following rates: 1.25% per quarter starting Decemberfrom March 31, 20172022 through DecemberMarch 31, 2020,2025, 2.5% per quarter from March 31, 2021 throughstarting June 30, 2022,2025 through September 30, 2026, with the remaining balance due on September 12, 2022.November 18, 2026. Principal amounts repaid on the Term Facility may not be reborrowed. During the third
quarter of 2019, we made a $400.0 million principal payment to partially pay down the outstanding Term Facility balance. As a result of this payment, we have satisfied our obligation to make quarterly installments on the Term Facility up to the maturity date, with the remaining outstanding balance due on September 12, 2022.
The 2021 Revolving Facility provides aggregate commitments of up to $500.0 million, which includes up to $100.0 million for the issuance of letters of credit. At December 31, 2020, there were noIn July 2022, we borrowed $340.0 million under the 2021 Revolving Facility to partially fund our acquisition of the Access Technologies business. We subsequently repaid $271.0 million, resulting in $69.0 million of borrowings outstanding on the 2021 Revolving Facility andas of December 31, 2022. In 2023, we repaid the remaining balance, resulting in no outstanding balance on the 2021 Revolving Facility as of December 31, 2023. We also had $15.0$18.4 million of letters of credit outstanding. Commitmentsoutstanding as of December 31, 2023. Outstanding borrowings under the 2021 Revolving Facility may be reducedrepaid at any time without premium or penalty, and amounts repaid may be reborrowed.
Outstanding borrowings under the 2021 Credit Facilities accrue interest at our option of (i) a LIBORBloomberg Short-Term Bank Yield Index (“BSBY”) rate plus thean applicable margin, or (ii) a base rate (as defined in the Credit Agreement) plus thean applicable margin. The applicable margin ranges from 1.125%0.875% to 1.500%1.375% depending on our credit ratings. At December 31, 2020,2023, outstanding borrowings under the 2021 Credit Facilities accrueaccrued interest at LIBORBSBY plus a margin of 1.250%1.125%, resulting in an interest rate of 1.51%6.581%.
As of December 31, 2020,2023, we also have $400.0 million outstanding of 3.200% Senior Notes due 2024 (the "3.200%“3.200% Senior Notes"Notes”), $400.0 million outstanding of 3.550% Senior Notes due 2027 (the "3.550%“3.550% Senior Notes"Notes”) and, $400.0 million outstanding of 3.500% Senior Notes due 2029 (the "3.500%“3.500% Senior Notes"Notes”), and $600.0 million outstanding of 5.411% Senior Notes due 2032 (the “5.411% Senior Notes” and all threefour senior notes collectively, the "Senior Notes"). The 3.200% Senior Notes, 3.550% Senior Notes, 3.500% Senior Notes, and 5.411% Senior Notes all require semi-annual interest payments, on April 1 and October 1 of each year, and will mature on October 1, 2024, October 1, 2027, and October 1, 2029, and July 1, 2032, respectively.
Historically, the majority of our earnings were considered to be permanently reinvested in jurisdictions where we have made, and intend to continue to make, substantial investments to support the ongoing development and growth of our global operations. At December 31, 2020,2023, we have analyzed our working capital requirements and the potential tax liabilities that would be incurred if certain subsidiaries made distributions and concluded that no material changes to our historic permanent reinvestment assertions arewere required.
Scheduled future principal repayments on our outstanding indebtedness can be found in Note 9 to the Consolidated Financial Statements. Expected principal and interest payments related to our long-term indebtedness in 2024 amount to $412.6 million and $97.1 million, respectively, given our current level of indebtedness and effective interest rates as of December 31, 2023.
Contractual Obligations and Other Commitments
In addition to the scheduled principal and interest payments discussed above, our material cash requirements include the following contractual and other obligations:
Purchase Commitments – We occasionally enter into short-term, firm purchase commitments to mitigate pricing risk related to certain of our commodity, parts and component purchases, which represent commitments under enforceable and legally binding agreements. Such purchase commitments are made in the normal course of business and are not anticipated to materially impact our liquidity or financial position over the next 12 months.
Leases – We have numerous real estate and equipment leasing arrangements for which we are a lessee. See Note 11 to the Consolidated Financial Statements for further information as to the short and long-term lease liabilities included within the Consolidated Balance Sheets, as well as future minimum lease payments for 2024 and future years.
Defined Benefit Plans
– Our investment objective in managing defined benefit plan assets is to ensure that all present and future benefit obligations are met as they come due. We seek to achieve this goal while trying to mitigate volatility in plan funded status, contributions and expense by better matching the characteristics of the plan assets to that of the plan liabilities. Global asset allocation decisions are based on a dynamic approach whereby a plan's allocation to fixed income assets increases as the funded status increases. We monitor plan funded status, asset allocation and the impact of market conditions on our defined benefit plans regularly in addition to investment manager performance. None of our defined benefit pension plans have experienced a significant impact on their liquidity due to volatility in the markets. For further details on pension plan activity, see Note 12 to the Consolidated Financial Statements.
Contractual Obligations
The following table summarizes our contractual cash obligations by required payment periods:
| | | | | | | | | | | | | | | | | | | | | | | | | | | | | | | | |
| In millions | | 2021 | | 2022-2023 | | 2024-2025 | | Thereafter | | Total |
| | | | | | | | | | |
| Long-term debt (including current maturities) | | $ | 0.2 | | | $ | 239.1 | | | $ | 400.1 | | | $ | 800.0 | | | $ | 1,439.4 | |
| Interest payments on long-term debt | | 45.6 | | | 85.4 | | | 66.0 | | | 77.3 | | | 274.3 | |
| Purchase obligations | | 462.5 | | | — | | — | | — | | 462.5 | |
| Operating leases | | 30.4 | | | 38.2 | | | 16.8 | | | 19.5 | | | 104.9 | |
| Total contractual cash obligations | | $ | 538.7 | | | $ | 362.7 | | | $ | 482.9 | | | $ | 896.8 | | | $ | 2,281.1 | |
Future interest payments on variable rate long-term debt are estimated based on the rate in effect as of December 31, 2020. As the timing and amounts of our future expected obligations under our defined benefit plans, income taxes, environmental and product liability matters are uncertain, they have not been included in the contractual cash obligations table above, but rather, are discussed below:
Defined Benefit Pension and Postretirement ("OPEB") Plans
At December 31, 2020,2023, we had net pension liabilities of $20.2$0.3 million, which consist of plan assets of $796.9$512.1 million and benefit obligations of $817.1$512.4 million. It is our objective to contribute to our pension plans in order to ensure adequate funds are available in the plans to make benefit payments to plan participants and beneficiaries when required. At December 31, 2020,2023, the funded status of our qualifiedU.S. pension plan for U.S. employeesplans increased to 98.7%101.6% from 93.5%97.8% at December 31, 2019.2022. The
funded status for our non-U.S. pension plans increased to 101.8%98.5% at December 31, 20202023 from 101.1%97.4% at December 31, 2019.2022. The funded status for all of our pension plans at December 31, 20202023 increased to 97.5%99.9% from 95.3%97.6% at December 31, 2019.2022. We currently project thatexpect to contribute approximately $11.4$5 million will be contributed to our plans worldwide in 2021.2024.
At December 31, 2020, we also had OPEBDetermining the costs and obligations associated with our defined benefit plans is dependent on various actuarial assumptions including discount rates, expected returns on plan assets, employee mortality and turnover rates. Changes in any of $5.2the assumptions can have an impact on the net periodic pension benefit cost. An estimated 0.5% rate decline in the discount rate would have increased net periodic pension benefit cost by approximately $0.4 million in 2023, while a 0.5% rate decline in the estimated return on assets would have increased net periodic pension benefit cost by approximately $2.4 million. We fund OPEB costs principallyFor further details on a pay-as-you-go basis as medical costs are incurred by covered retiree populations. Benefit payments, which are net of expecteddefined benefit plan participant contributions and Medicare Part D subsidies, are not expected to be material in 2021. Seeactivity, see Note 12 to the Consolidated Financial Statements for additional information related to our pension and OPEB obligations.Statements.
Income Taxes
– At December 31, 2020,2023, we have total unrecognized tax benefits for uncertain tax positions of $41.2$45.1 million and $7.6$9.0 million of related accrued interest and penalties, net of tax. These liabilities have been excluded from the preceding table astax, although we are unable to reasonably estimate the amount and period intiming over which these liabilities might be paid. See Note 18 to the Consolidated Financial Statements for additional information regarding matters relating to income taxes, including unrecognized tax benefits and tax authority disputes.
Contingent Liabilities
– We are involved in various litigation, claims and administrative proceedings, including those related to environmental, asbestos-related and product liability matters. We believe that these liabilities are subject to the uncertainties inherent in estimating future costs for contingent liabilities and will likely be resolved over an extended period of time. See Note 21 to the Consolidated Financial Statements for additional information.
Guarantor Financial Information
In March 2020, the SEC adopted amendments to the financial disclosure requirements applicable to registered debt offerings that include credit enhancements, such as subsidiary guarantees, in Rule 3-10 of Regulation S-X. The amended rules focus on providing material, relevant and decision-useful information regarding guarantees and other credit enhancements, while eliminating certain prescriptive requirements. We adopted these amendments on March 31, 2020. Accordingly, summarized financial information has been presented only for the issuers and guarantors of our registered securities for the most recent fiscal year, and the location of the required disclosures has been moved outside the Notes to the Consolidated Financial Statements and is provided below.
Allegion US Holding Company Inc. ("Allegion US Hold Co")Co is the issuer of the 3.200% Senior Notes, 3.550% Senior Notes and 3.550%5.411% Senior Notes and is the guarantor of the 3.500% Senior Notes. Allegion plc (the “Parent”) is the issuer of the 3.500% Senior Notes and is the guarantor of the 3.200% Senior Notes, 3.550% Senior Notes and 3.550%5.411% Senior Notes. Allegion US Hold Co is directly or indirectly 100% owned by the Parent and each of the guarantees of Allegion US Hold Co and the Parent is full and unconditional and joint and several.
The 3.200% Senior Notes, 3.550% Senior Notes and the 3.550%5.411% Senior Notes are senior unsecured obligations of Allegion US Hold Co and rank equally with all of Allegion US Hold Co’s existing and future senior unsecured and unsubordinated indebtedness. The guarantee of the 3.200% Senior Notes, 3.550% Senior Notes and the 3.550%5.411% Senior Notes is the senior unsecured obligation of the Parent and ranks equally with all of Allegion plc’sthe Parent’s existing and future senior unsecured and unsubordinated indebtedness. The 3.500% Senior Notes are senior unsecured obligations of the Parent are guaranteed by Allegion US Hold Co and rank equally with all of Allegion plc’sthe Parent’s existing and future senior unsecured and unsubordinated indebtedness.
Each guarantee is effectively subordinated to any secured indebtedness of the Guarantor to the extent of the value of the assets securing such indebtedness. The Senior Notes are structurally subordinated to indebtedness and other liabilities of the
subsidiaries of the Guarantor, none of which guarantee the notes. The obligations of the Guarantor under its Guarantee are limited as necessary to prevent such Guarantee from constituting a fraudulent conveyance under applicable law and, therefore, are limited to the amount that the Guarantor could guarantee without such Guarantee constituting a fraudulent conveyance; this limitation, however, may not be effective to prevent such Guarantee from constituting a fraudulent conveyance. If the Guarantee was rendered voidable, it could be subordinated by a court to all other indebtedness (including guarantees and other contingent liabilities) of the Guarantor, and, depending on the amount of such indebtedness, the Guarantor’s liability on its Guarantee could be reduced to zero. In such an event, the notes would be structurally subordinated to the indebtedness and other liabilities of the Guarantor.
For further details, terms and conditions of the Senior Notes refer to the Company’s FormForms 8-K filed October 2, 2017, and Form 8-K filed September 27, 2019.
The following tables present the summarized financial information specified in Rule 1-02(bb)(1) of Regulation S-X for each issuer and guarantor. The summarized financial information has been prepared in accordance with Rule 13-01 of Regulation S-X.
Selected Condensed Statement of Comprehensive Income Information
| | | | | | | | | | | | | | | |
| Year ended December 31, 2020 | | |
| In millions | Allegion plc | | Allegion US
Hold Co | | | | |
| Net revenues | $ | — | | | $ | — | | | | | |
| Gross profit | — | | | — | | | | | |
| Operating loss | (7.5) | | | (0.2) | | | | | |
| Equity earnings in affiliates, net of tax | 358.8 | | | 216.5 | | | | | |
Transactions with related parties and subsidiaries(a) | (15.3) | | | (39.3) | | | | | |
| Net earnings | 314.3 | | | 164.7 | | | | | |
| Net earnings attributable to the entity | 314.3 | | | 164.7 | | | | | |
| | | | | | | | | | | |
| Year ended December 31, 2023 |
| In millions | Allegion plc | | Allegion US Hold Co |
| Net revenues | $ | — | | | $ | — | |
| Gross profit | — | | | — | |
| Operating loss | (7.4) | | | (0.5) | |
| Equity earnings in affiliates, net of tax | 606.5 | | | 330.6 | |
Transactions with related parties and subsidiaries(a) | (30.8) | | | (77.0) | |
| Net earnings | 540.4 | | | 232.6 | |
| Net earnings attributable to the entity | 540.4 | | | 232.6 | |
(a) Transactions with related parties and subsidiaries include intercompany interest and fees.
Selected Condensed Balance Sheet Information
| | December 31, 2020 | |
| December 31, 2023 | | | December 31, 2023 |
| In millions | In millions | Allegion plc | | Allegion US
Hold Co | | In millions | Allegion plc | | Allegion US Hold Co |
| Current assets: | Current assets: | | | | |
| Amounts due from related parties and subsidiaries | |
| Amounts due from related parties and subsidiaries | |
| Amounts due from related parties and subsidiaries | Amounts due from related parties and subsidiaries | $ | — | | | $ | 20.0 | | |
| Total current assets | Total current assets | 19.0 | | | 38.7 | | |
| Noncurrent assets: | Noncurrent assets: | | |
| Amounts due from related parties and subsidiaries | Amounts due from related parties and subsidiaries | — | | | 1,644.2 | | |
| Amounts due from related parties and subsidiaries | |
| Amounts due from related parties and subsidiaries | |
| Total noncurrent assets | Total noncurrent assets | 1,793.3 | | | 1,671.8 | | |
| Current liabilities: | Current liabilities: | | |
| Amounts due to related parties and subsidiaries | |
| Amounts due to related parties and subsidiaries | |
| Amounts due to related parties and subsidiaries | Amounts due to related parties and subsidiaries | $ | 197.5 | | | $ | 183.9 | | |
| Total current liabilities | Total current liabilities | 204.4 | | | 190.7 | | |
| Noncurrent liabilities: | Noncurrent liabilities: | | |
| Amounts due to related parties and subsidiaries | Amounts due to related parties and subsidiaries | 507.3 | | | 2,463.9 | | |
| Amounts due to related parties and subsidiaries | |
| Amounts due to related parties and subsidiaries | |
| Total noncurrent liabilities | Total noncurrent liabilities | 1,143.2 | | | 3,267.3 | | |
Critical Accounting PoliciesEstimates
Management’s Discussion and Analysis of Financial Condition and Results of Operations are based upon our Consolidated Financial Statements, which have been prepared in accordance with GAAP. The preparation of financial statements in conformityaccordance with those accounting principlesGAAP requires management to use judgment in making estimates and assumptions based on the relevant information available at the end of each period. These estimates and assumptions have a significant effect on reported amounts of assets and liabilities, revenues and expenses as well as the disclosure of contingent assets and liabilities because they result primarily from the need to make estimates and assumptions on matters that are inherently uncertain. Actual results may differ from estimates. If updated information or actual amounts are different from previous estimates, the revisions are included in our results for the period in which they become known.
The following is a summary of certain accounting estimates and assumptions made by management that we consider critical:
•Goodwill – Goodwill is tested annually during the fourth quarter for impairment or when there is a significant change in events or circumstances that indicate the fair value of a reporting unit is, more likely than not, less than its carrying amount. Recoverability of goodwill is measured at the reporting unit level and starts with a comparison of the carrying amount of a reporting unit to its estimated fair value. If the estimated fair value of a reporting unit exceeds its carrying amount, goodwill of the reporting unit is not impaired. To the extent that the carrying value of a reporting unit exceeds its estimated fair value, a goodwill impairment charge will be recognized for the amount by which the carrying value of the reporting unit exceeds its fair value, not to exceed the carrying amount of the reporting unit's goodwill.
As quoted market prices are not available for our reporting units, the calculation of their estimated fair values is based on two valuation techniques, a discounted cash flow model (income approach) and a market multiple of earnings (market approach), with each method being weighted in the calculation. The income approach relies on the Company’sour estimates of revenue growth rates, terminal growth rates, margin assumptions and discount rates to estimate future cash flows and explicitly addresses factors such as timing, with due consideration given to forecasting risk. These assumptions are subject to varying degrees of judgment and complexity. Estimates of future revenue growth rates and margin assumptions represent our best estimates of future cash flows given our expectations of market growth for the security products industry in the specific markets in which we operate, as well as factors such as our market positioning, brand strength, pricing and marketing efforts and other growth and productivity opportunities and initiatives. Discount rate assumptions represent our best estimates of market participant adjusted weighted-average costs of capital. Although these assumptions represent our best estimates as of the assessment date, certain factors could potentially create variances in these estimates, including, but not limited to:
•Decreases in estimated market sizes or market growth rates due to greater than expected declines in volumes, pricing pressures or disruptive technology;
•Declines in our market share and penetration assumptions due to increased competition or an inability to develop or launch new products;
•The impacts of market volatility, including but not limited to, impacts of global pandemics, greater than expected inflation, supply chain disruption and delays, declines in pricing, reductions in volumes or fluctuations in foreign currency exchange rates;
•The level of success of on-going and future research and development efforts, including those related to acquisitions, and increases in the research and development costs necessary to obtain regulatory approvals and launch new products; and
•Volatility in market interest rates that could impact the selection of an appropriate discount rate.
The market approach requires determining an appropriate peer group, which is utilized to derive estimated fair values of our reporting units based on selected market multiples. The market approach reflects the market’s expectations for future growth and risk, with adjustments to account for differences between the selected peer group companies and the subject reporting units.
As a result of the global economic disruption and uncertainty due to the COVID-19 pandemic, we concluded a triggering event had occurred as of March 31, 2020, and accordingly, performed interim impairment testing on the goodwill balances of our EMEA and Asia Pacific reporting units. Given the high degree of While market volatility and lack of reliable market data that existed as of March 31, 2020, we determined a discounted cash flow model (income approach) provided the best approximation of fair value of the EMEA and Asia Pacific reporting units for the purpose of performing these interim tests. This was a change in estimate, as historically our determination of reporting unit fair values has been estimatedmultiples are based on both an income and a market approach,observable, arm’s-length evidence of value, these assumptions are still subject to inherent uncertainty, as discussed above, with each method being weightedthe peer-group companies may differ in the calculation. The results of the interim impairment testing indicated the estimated fair value of the Asia Pacific reporting unit was less than its carrying value, and consequently, a goodwill impairment charge of $88.1 million was recorded.
As markets stabilized throughout the year, we reverted to utilizing both an income and market approach while performing our annual impairment test in the fourth quarter. The estimated fair values for eachsignificant ways from one or more of our reporting units exceeded their carrying values by more than 20% for the annual 2020 goodwill impairment test, completed in the fourth quarter. Assessing the fair valueterms of size, growth or business characteristics.
The critical accounting estimates and assumptions discussed above, include our reporting units includes, among other things, making keyestimates of revenue growth rates and margin assumptions, for estimating future cash flowsdiscount rates, our selection of an appropriate peer group and appropriateselected market multiples. These estimates and assumptions are considered critical, as they are subject to a high degree of judgment and complexity. WeForecasted revenue growth rates and margin assumptions are updated annually and often fluctuate from year to year due to a myriad of factors, such as our assessment of the macroeconomic conditions throughout the major markets in which we do business, supply chain challenges, elevated levels of inflation in recent years and pricing initiatives to offset inflation, market acceptance of new product innovation, investments in productivity projects, restructuring efforts, among other economic, strategic and operational factors impacting our businesses. Discount rate and market multiple assumptions are similarly updated annually, based on our best estimates of market participants, which typically include observable, arm's length-evidence of value, where possible. While we make every effort to estimate future cash flowsfair value as accurately as possible with the information available at the time the forecast is developed. However,assessment date, changes in assumptions and estimates may affect the estimated fair value of the reporting unit and could result in impairment charges in future periods. Factors that have the potentialDuring our most recent annual impairment analysis, none of our reporting units were determined to create variances in the estimated fair value of the reporting unit include, but are not limited to, the following:
•Decreases in estimated market sizes or market growth rates due to greater-than-expected declines in volumes, pricing pressures or disruptive technology;
•Declines in our market share and penetration assumptions due to increased competition or an inability to develop or launch new products;
•The impacts of market volatility, including greater-than-expected declines in pricing, reductions in volumes or fluctuations in foreign exchange rates;
•The level of success of on-going and future research and development efforts, including those related to acquisitions, and increases in the research and development costs necessary to obtain regulatory approvals and launch new products;
•Increases in the price or decreases in the availability of key commodities and the impact of higher energy prices; and
•Increases in our market-participant risk-adjusted weighted-average cost of capital.be impaired.
•Indefinite-lived intangible assets – Similar to goodwill, indefinite-lived intangible assets are tested annually during the fourth quarter for impairment or when there is a significant change in events or circumstances that indicate the fair value of the asset is, more likely than not, less than its carrying amount. Recoverability of indefinite-lived intangible assets is determined on a relief from royalty methodology, which is based on the implied royalty paid, at an appropriate discount rate, to license the use of an asset rather than owning the asset. The present value of the after-tax cost savings (i.e. royalty relief) indicates the estimated fair value of the asset. Any excess of the carrying value over the estimated fair value is recognized as an impairment loss equal to that excess. DuringThe critical assumptions utilized in our annual impairment analysis for indefinite-lived intangible assets are the first quarterroyalty rates and discount rates, which often differ amongst our various indefinite-lived assets. We assess the appropriateness of 2020, we concludedeach royalty rate assumption annually, based on our
assessment of observable market royalty rates and an analysis of the global economic disruption and uncertainty dueprofitability of the primary business that owns or otherwise uses the indefinite-lived asset. Discount rate assumptions typically consider the discount rate conclusions for the reporting unit in which an underlying business operates, plus an incremental spread, where appropriate, to consider size, country or other company-specific risk. A significant change in any or a combination of the COVID-19 pandemicassumptions used to be a triggering event. Accordingly, interim impairment tests on certain indefinite-lived trade names were performed as of March 31, 2020. Based on these tests, it was determined that threeestimate fair value of our indefinite-lived trade names in the EMEA and Asia Pacific segments were impaired, and impairment charges totaling $8.2 million were recorded.
A significant increase in the discount rate, decrease in the terminal growth rate, decrease in the royalty rate or substantial reductions in future revenue projectionsintangible assets could have a negative impact on the estimated fair values of any of our indefinite-lived intangible assets.
•Income taxes – We account for income taxes in accordance with ASC Topic 740. Deferred tax assets and liabilities are determined based on temporary differences between financial reporting and tax bases of assets and liabilities, applying enacted tax rates expected to be in effect for the year in which the differences are expected to reverse. We recognize future tax benefits, such as net operating losses and non-U.S. tax credits, to the extent that realizing these benefits is considered in our judgment to be more likely than not. We regularly review theThe recoverability of our deferred tax assets, which we consider to be a critical estimate, is reviewed regularly by considering our historic profitability, projected future taxable income, timing of the reversals of existing temporary differences and the feasibility of our tax planning strategies. Where appropriate, we record a valuation allowance with respect to future tax benefits. We establish valuation allowances against the realizability of any deferred tax assets based on our consideration of all available evidence, both positive and negative, using a “more likely than not” standard. This assessment considers the nature, frequency and amount of recent losses, the duration of statutory carryforward periods and tax planning strategies. Although our assessments of the valuation and recoverability of our deferred tax assets can change given a change in facts and circumstances (such as a change in a statutory tax rate), in making such judgments and estimates, significant weight is given to evidence that can be objectively verified.
The provision for income taxes also involves a significant amount of management judgment regarding interpretation of relevant facts and laws in the jurisdictions in which we operate. Future changes in applicable laws, projected levels of taxable income and tax planning could change the effective tax rate and tax balances recorded by us. In addition, tax authorities periodically review income tax returns filed by us and can raise issues regarding our filing positions, timing and amount of income or deductions and the allocation of income among the jurisdictions in which we operate. A significant period of time may elapse between the filing of an income tax return and the ultimate resolution of an issue raised by a revenuetax authority with respect to that return. We believe that we have adequately provided for any reasonably foreseeable resolution of these matters. Wematters and will adjust our estimates if significant events so dictate. To the extent that the ultimate results differ from our original or adjusted estimates, the effect will be recorded in the provisionProvision for income taxes in the period that the matter is finally resolved.
•Defined benefit plans – We provide several U.S. and non-U.S. defined benefit pension plan benefits to eligible employees and retirees. Our noncontributory defined benefit pension plans covering non-collectively bargained U.S. employees provide benefits on an average pay formula while most plans for collectively bargained U.S. employees provide benefits on a flat dollar benefit formula. The non-U.S. pension plans generally provide benefits based on earnings and years of service. Determining the costs associated with such plans is dependent on various actuarial assumptions including discount rates, expected return on plan assets, employee mortality and turnover rates. Actuarial valuations are performed to determine expense in accordance with GAAP. Actual results may differ from the actuarial assumptions and are generally recorded to Accumulated other comprehensive loss and amortized into earnings over future periods.
We review our actuarial assumptions at each measurement date and make modifications to the assumptions as appropriate. The discount rate and expected return on plan assets are determined as of each measurement date. Discount rates for all plans are established using hypothetical yield curves based on the yields of corporate bonds rated AA quality. Spot rates are developed from the yield curve and used to discount future benefit payments. The expected return on plan assets reflects the average rate of returns expected on the funds invested or to be invested to provide for the benefits included in the projected benefit obligation. The expected return on plan assets is based on what is achievable given the plan’s investment policy, the types of assets held and the target asset allocation. We believe the assumptions utilized in recording our defined benefit obligations are reasonable based on input from our actuaries, outside investment advisors and information as to assumptions used by plan sponsors.
Changes in any of the assumptions can have an impact on the net periodic pension benefit cost. An estimated 0.25% rate decline in the discount rate would increase net periodic pension benefit cost by approximately $1.1 million in 2021, while a 0.25% rate decline in the estimated return on assets would increase net periodic pension benefit cost by approximately $1.9 million.
•Business combinations – The fair value of consideration paid in a business combination is allocated to the tangible and identifiable intangible assets acquired, liabilities assumed and goodwill. Acquired intangible assets primarily include indefinite-lived trade names, customer relationships and completed technologies. The accounting for business combinations involves a considerable amount of judgment and estimation, including the identification of and fair valuevalues determined for acquired intangible assets, which typically include trade names, customer relationships and completed technologies. The determination of fair values of acquired intangible assets involvinginvolves projections of future revenues and cash flows that are either discounted at an estimated discount rate or measured at an estimated royalty rate; fair valuevalues of other acquired assets and assumed liabilities, including potential contingencies; and the useful lives of the acquired assets. The assumptions usedDue to determine the level of judgment and estimation required, in the case of significant acquisitions, we normally obtain the assistance of a third-party valuation specialist in estimating fair valuevalues of acquired tangible and intangible assets include projections developed using internal forecasts, available industry and market data, estimates of long-term growth rates, profitability, customer attrition and royalty rates, which are determined at the time of acquisition.assumed liabilities. An income approach or market approach (or both) is utilized in accordance with accepted valuation models for each acquired intangible asset to determine fair value. The determination of fair value of acquired assets typically requires the use of assumptions that include projections developed using historical information, internal forecasts, available industry and market data, estimates of revenue growth rates, profitability, customer attrition and discount and royalty rates, which are estimated at the time of acquisition, considering the perspective of marketplace participants. While we believe expectations and assumptions utilized for historical business combinations have been reasonable, they are inherently uncertain, and unanticipated market or macroeconomic events and circumstances occasionally do occur, and may occur in the future, which could affect the accuracy and validity of such assumptions.
The impact of prior or future business combinations on our financial condition or results of operations may also be materially impacted by the change in or initial selection of assumptions and estimates.estimates, in addition to events and circumstances subsequent to the acquisition that are not reasonably anticipated when finalizing our purchase accounting estimates and assumptions.
Recent Accounting Pronouncements
See Note 2 to our Consolidated Financial Statements included in Item 8herein for a discussion of recently issued and adopted accounting pronouncements.
Item 7A. QUANTITATIVE AND QUALITATIVE DISCLOSURES ABOUT MARKET RISK
We are exposed to fluctuations in currency exchange rates, commodity prices and interest rates and commodity prices which could impact our results of operations and financial condition.
Foreign Currency Exposures
We have operations throughout the world that manufacture and sell products in various international markets. As a result, we are exposed to movements in exchange rates of various currencies against the U.S. dollar as well as against other currencies throughout the world. We actively manage material currency exposures that are associated with purchases and sales and other assets and liabilities at the legal entity level; however, we do not hedge currency translation risk. We attempt to hedge exposures that cannot be naturally offset to an insignificant amount with foreign currency derivatives. Derivative instruments utilized by us in our hedging activities are viewed as risk management tools, involve little complexity and are not used for trading or speculative purposes. To minimize the risk of counter party non-performance, derivative instrument agreements are made only through major financial institutions with significant experience in such derivative instruments.
We evaluate our exposure to changes in currency exchange rates on our foreign currency derivatives using a sensitivity analysis. The sensitivity analysis is a measurement of the potential loss in fair value based on a percentage change in exchange rates. Based on the firmly committed currency derivative instruments in place at December 31, 2020,2023, a hypothetical change in fair value of those derivative instruments assuming a 10% adverse change in exchange rates would result in an additional unrealized loss of approximately $16.9$2.9 million. This amount, when realized, would be partially offset by changes in the fair value of the underlying transactions.
Commodity Price Exposures
We purchase a wide range of raw material, including steel, zinc, brass and other non-ferrous metals, and are exposed to volatility in the prices of these and other commodities used in some of our products and weproducts. We use fixed price contracts to manage this exposure.exposure where appropriate. We do not have committed commodity derivative instruments in place at December 31, 2020.
Interest Rate Exposure
OutstandingOf our total outstanding indebtedness of $2.0 billion as of December 31, 2023, approximately 89% incurs fixed-rate interest and is therefore not exposed to the risk of rising variable interest rates. However, outstanding borrowings under ourthe 2021 Credit Facilities accrue variable rate interest at our option of (i) a LIBORBSBY rate plus the applicable margin or (ii) a base rate plus the applicable margin. The applicable margin ranges from 1.125%0.875% to 1.500%1.375% depending on our credit ratings. At December 31, 2020,2023, the outstanding borrowings of $238.8$225.0 million under the Term Facility2021 Credit Facilities accrue interest at LIBORBSBY plus a margin of 1.250%1.125%, resulting in an interest rate of 6.581%. Applicable variable interest rates increased throughout 2023, resulting in increased Interest expense. We are also exposed to the risk of rising interest rates to the extent that we fund our operations with short-term or variable-rate borrowings, as we currentlyborrowings. We have $18.4 million of letters of credit outstanding and unused availability of $485.0$481.6 million under ourthe 2021 Revolving Facility as of December 31, 2020.2023. A hypothetical increase of 1% in the interest rate on the variable rate borrowings under our 2021 Credit Facilities would increase our interest expense over the next twelve months by $2.2 million based on the balances outstanding for these borrowings as of December 31, 2023. If LIBORthe BSBY or other applicable base rates of ourthe 2021 Credit Facilities increase in the future, our Interest expense could increase.
Item 8. FINANCIAL STATEMENTS AND SUPPLEMENTARY DATA
(a)The following Consolidated Financial Statements and Financial Statement Schedule and the report thereon of PricewaterhouseCoopers LLP dated February 16, 2021,20, 2024, are presented following Item 16 of this Annual Report on Form 10-K.
Consolidated Financial Statements:
Report of independent registered public accounting firm (PCAOB ID 238)
Consolidated Statements of Comprehensive Income for the years ended December 31, 2020, 20192023, 2022 and 20182021
Consolidated Balance Sheets at December 31, 20202023 and 20192022
For the years ended December 31, 2020, 20192023, 2022 and 2018:2021:
Consolidated Statements of Equity
Consolidated Statements of Cash Flows
Notes to Consolidated Financial Statements
Financial Statement Schedule:
Schedule II – Valuation and Qualifying Accounts for the years ended December 31, 2020, 20192023, 2022 and 20182021
(b)The unaudited selected quarterly financial data for the two years ended December 31, is as follows:
| | | | | | | | | | | | | | | | | | | | | | | | | | |
| In millions, except per share amounts | | 2020 |
| | First
Quarter | | Second
Quarter | | Third
Quarter | | Fourth
Quarter |
| Net revenues | | $ | 674.7 | | | $ | 589.5 | | | $ | 728.4 | | | $ | 727.3 | |
| Cost of goods sold | | 381.6 | | | 342.9 | | | 409.2 | | | 407.4 | |
| Operating income | | 28.9 | | | 96.5 | | | 160.4 | | | 117.7 | |
| Net earnings | | 0.5 | | | 73.7 | | | 146.9 | | | 93.4 | |
| Net earnings attributable to Allegion plc | | 0.4 | | | 73.7 | | | 146.9 | | | 93.3 | |
| Earnings per share attributable to Allegion plc ordinary shareholders: | | | | | | | | |
| Basic | | $ | — | | | $ | 0.80 | | | $ | 1.59 | | | $ | 1.02 | |
| Diluted | | $ | — | | | $ | 0.80 | | | $ | 1.58 | | | $ | 1.01 | |
| | | | | | | | |
| | | | | | | | |
| | 2019 |
| | First
Quarter | | Second
Quarter | | Third
Quarter | | Fourth
Quarter |
| Net revenues | | $ | 655.0 | | | $ | 731.2 | | | $ | 748.3 | | | $ | 719.5 | |
| Cost of goods sold | | 378.1 | | | 410.5 | | | 412.8 | | | 400.3 | |
| Operating income | | 108.0 | | | 145.7 | | | 168.1 | | | 143.3 | |
| Net earnings | | 80.3 | | | 109.4 | | | 131.7 | | | 80.7 | |
| Net earnings attributable to Allegion plc | | 80.2 | | | 109.3 | | | 131.6 | | | 80.7 | |
| Earnings per share attributable to Allegion plc ordinary shareholders: | | | | | | | | |
| Basic | | $ | 0.85 | | | $ | 1.17 | | | $ | 1.41 | | | $ | 0.87 | |
| Diluted | | $ | 0.84 | | | $ | 1.16 | | | $ | 1.40 | | | $ | 0.86 | |
| | | | | | | | |
Net earnings from the first quarter of 2020 includes a goodwill and intangible asset impairment charge of $94.3 million (net of tax). Net earnings from the fourth quarter of 2020 includes a $37.9 million loss on assets held for sale at December 31, 2020, related to our QMI business.
Net earnings from the fourth quarter of 2019 includes a $31.4 million (net of tax) loss on the divestitures of our business operations in Colombia and Turkey.
Item 9. CHANGES IN AND DISAGREEMENTS WITH ACCOUNTANTS ON ACCOUNTING AND FINANCIAL
DISCLOSURE
None.
Item 9A. CONTROLS AND PROCEDURES
| | | | | |
| (a) | Evaluation of Disclosure Controls and Procedures |
The Company's management, including its Chief Executive Officer and Chief Financial Officer, have conducted an evaluation of the effectiveness of the Company's disclosure controls and procedures (as such term is defined in Rules 13a-15(e) and 15d-15(e) under the Securities Exchange Act of 1934, as amended (the Exchange Act)), as of the end of the period covered by this Annual Report on Form 10-K. Based on that evaluation, the Chief Executive Officer and Chief Financial Officer concluded as of December 31, 2020,2023, that the Company's disclosure controls and procedures were effective in ensuring that information required to be disclosed by the Company in reports that it files or submits under the Exchange Act has been recorded, processed, summarized and reported, within the time periods specified in the Commission's rules and forms, and that such information has been accumulated and communicated to the Company's management including its Chief Executive Officer and Chief Financial Officer, as appropriate, to allow timely decisions regarding required disclosure.
| | | | | |
| (b) | Management's Report on Internal Control Over Financial Reporting |
Our management is responsible for establishing and maintaining adequate internal control over financial reporting, as defined under Exchange Act Rules 13a-15(f) and 15d-15(f). Our internal control over financial reporting is a process designed to provide reasonable assurance regarding the reliability of financial reporting and the preparation of financial statements for external purposes in accordance with generally accepted accounting principles. Internal control over financial reporting includes those policies and procedures that:
•pertain to the maintenance of records that, in reasonable detail, accurately and fairly reflect the transactions and dispositions of the Company’s assets;
•provide reasonable assurance that transactions are recorded as necessary to permit preparation of financial statements in accordance with generally accepted accounting principles, and that the Company’s receipts and expenditures are being made only in accordance with authorizations of the Company’s management and directors; and
•provide reasonable assurance regarding prevention or timely detection of unauthorized acquisition, use, or disposition of the Company’s assets that could have a material effect on the financial statements.
Because of its inherent limitations, internal control over financial reporting may not prevent or detect misstatements. Also, projections of any evaluation of effectiveness to future periods are subject to the risk that controls may become inadequate because of changes in conditions, or that the degree of compliance with the policies or procedures may deteriorate.
Management assessed the effectiveness of our internal control over financial reporting as of December 31, 2020.2023. In making this assessment, management used the criteria set forth by the Committee of Sponsoring Organizations of the Treadway Commission (COSO) in Internal Control-Integrated Framework (2013). We concluded that our internal control over financial reporting was effective as of December 31, 2020.
The effectiveness of our internal control over financial reporting has been audited by PricewaterhouseCoopers LLP, the independent registered public accounting firm, as stated in their report herein.
| | | | | |
| (c) | Changes in Internal Control Over Financial Reporting |
There were no changes in the Company's internal control over financial reporting that occurred during the quarter ended December 31, 20202023 that have materially affected, or are reasonably likely to materially affect, our internal control over financial reporting.
Item 9B. OTHER INFORMATION
None.During the three months ended December 31, 2023, no director or officer of the Company adopted or terminated a "Rule 10b5-1 trading arrangement" or "non-rule 10b5-1 trading arrangement," as each term is defined in item 408(a) of Regulation S-K.
Item 9C.DISCLOSURE REGARDING FOREIGN JURISDICTIONS THAT PREVENT INSPECTIONS
Not applicable.
PART III
Item 10. DIRECTORS, EXECUTIVE OFFICERS AND CORPORATE GOVERNANCE
The information regarding our executive officers is included in Part I under the caption "Executive Officers of the Registrant."
The other information required by this item is incorporated herein by reference to the information contained under the headings "Item"Proposal 1. Election of Directors",Directors," "Delinquent Section 16(a) Reports" and "Corporate Governance" in our Proxy Statement. For information with respect to our executive officers, see the section titled "Corporate Governance" in our Proxy Statement.
Item 11. EXECUTIVE COMPENSATION
The information required by this item is incorporated herein by reference to the information contained under the headings "Compensation Discussion and Analysis",Analysis," "Executive Compensation" and "Compensation and Human Capital Committee Report" in our Proxy Statement.
Item 12. SECURITY OWNERSHIP OF CERTAIN BENEFICIAL OWNERS AND MANAGEMENT AND RELATED
STOCKHOLDER MATTERS
The information required by this item is incorporated herein by reference to the information contained under the headings "Security Ownership of Certain Beneficial Owners and Management" and "Equity Compensation Plan Information" of our Proxy Statement.
Item 13. CERTAIN RELATIONSHIPS AND RELATED TRANSACTIONS, AND DIRECTOR INDEPENDENCE
The information required by this item is incorporated herein by reference to the information contained under the headings "Corporate Governance" and "Certain Relationships and Related Person Transactions" of our Proxy Statement.
Item 14. PRINCIPAL ACCOUNTANT FEES AND SERVICES
The information required by this item is incorporated herein by reference to the information contained under the caption "Fees of the Independent Auditors"Registered Public Accounting Firm" in our Proxy Statement.
PART IV
Item 15. EXHIBITS AND FINANCIAL STATEMENT SCHEDULES
| | | | | |
| (a) 1. and 2. | Financial statements and financial statement schedule
See Item 8. |
| |
| 3. | Exhibits |
| The exhibits listed on the accompanying index to exhibits are filed as part of this Annual Report on Form 10-K. |
ALLEGION PLC
INDEX TO EXHIBITS
(Item 15(a))
Description
Pursuant to the rules and regulations of the SEC, we haveCertain agreements filed certain agreements as exhibits to this Annual Report on Form 10-K. These agreements10-K may contain representations and warranties by the parties.parties thereto. These representations and warranties have been made solely for the benefit of the other party or parties to such agreements and (i) may have been qualified by confidential disclosures made toby parties in connection with such other party or parties,agreements, (ii) were made only as of the date of such agreements or such other date(s) as may be specified in such agreements and are subject to more recent developments, which may or may not be fully reflected in our public disclosure, (iii) maywere included in such agreements solely to reflect the allocation of risk among the parties to such agreements and (iv) may apply materiality standards different from what may be viewed as material to investors. Accordingly,Investors are not third-party beneficiaries under such agreements, and accordingly, should not rely on these representations and warranties may not describeas characterizations of our actual state of affairs at the date hereof and should not be relied upon.thereof or hereof.
(a) Exhibits
| | | | | | | | | | | | | | |
Exhibit
Number | | Exhibit Description | | Method of Filing |
| | | |
| | Separation and Distribution Agreement between Ingersoll-Rand plc and Allegion plc, dated November 29, 2013.
| | Incorporated by reference to Exhibit 2.1 of the Company’s Form 8-K filed with the SEC on December 2, 2013 (File No. 001-35971). |
| | | |
| | Amended and Restated Memorandum and Articles of Association of Allegion plc.
| | Incorporated by reference to Exhibit 3.1 of the Company’s Form 8-K filed with the SEC on June 13, 2016 (File No. 001-35971). |
| | | |
| | Indenture, dated as of October 2, 2017, among Allegion US Holding Company Inc., Allegion plc and Wells Fargo Bank, National Association. | | Incorporated by reference to Exhibit 4.1 of the Company's Form 8-K filed October 2, 2017 (File No. 001-35971). |
| | | | |
| | First Supplemental Indenture, dated as of October 2, 2017, among Allegion US Holding Company Inc., Allegion plc and Wells Fargo Bank, National Association. | | Incorporated by reference to Exhibit 4.2 of the Company's Form 8-K filed October 2, 2017 (File No. 001-35971). |
| | | | |
| | Form of Global Note representing the 3.200% Senior Notes due 2024. | | Incorporated by reference to Exhibit 4.3 of the Company's Form 8-K filed October 2, 2017 (included in Exhibit 4.2) (File No. 001-35971). |
| | | | |
| | Second Supplemental Indenture, dated as of October 2, 2017, among Allegion US Holding Company Inc., Allegion plc and Wells Fargo Bank, National Association. | | Incorporated by reference to Exhibit 4.4 of the Company's Form 8-K filed October 2, 2017 (File No. 001-35971). |
| | | | |
| | Form of Global Note representing the 3.550% Senior Notes due 2027. | | Incorporated by reference to Exhibit 4.5 of the Company's Form 8-K filed October 2, 2017 (included in Exhibit 4.4) (File No. 001-35971). |
| | | | |
| | Third Supplemental Indenture, dated as of September 27, 2019, among Allegion plc, Allegion US Holding Company Inc. and Wells Fargo Bank, National Association. | | Incorporated by reference to Exhibit 4.2 of the Company’s Form 8-K filed September 27, 2019 (File No. 001-35971). |
| | | | |
| | Form of Global Note representing the 3.500% Senior Notes due 2029. | | Incorporated by reference to Exhibit 4.3 of the Company's Form 8-K filed September 27, 2019 (included in Exhibit 4.2) (File No. 001-35971). |
| | | | |
| | Fourth Supplemental Indenture, dated as of June 22, 2022, among Allegion plc, Allegion US Holding Company Inc., and Computershare Trust Company, N.A. as successor to Wells Fargo Bank National Association. | | Incorporated by reference to Exhibit 4.2 of the Company’s Form 8-K filed June 22, 2022 (File No. 001-35971). |
| | | | |
| | Form of Global Note representing the 5.411% Senior Notes due 2032. | | Incorporated by reference to Exhibit 4.3 of the Company's Form 8-K filed June 22,2022 included in Exhibit 4.2) (File No. 001-35971). |
| | | | |
| | Description of the Registrant’s Securities registered pursuant to Section 12 of the Securities Exchange Act of 1934. | | Incorporated by reference to Exhibit 4.8 of the Company’s Form 10-K filed with the SEC on February 18, 2020 (File No. 001-35971). |
| | | | |
| | Form of Separation Agreement and Release. * | | Incorporated by reference to Exhibit 10.1 of the Company’s Form 10-K filed with the SEC on February 19, 2019 (File No. 001-35971). |
| | | | |
| | | | | | | | | | | | | | |
| | Tax Matters Agreement between Ingersoll-Rand plc and Allegion plc. | | Incorporated by reference to Exhibit 10.1 of the Company’s Form 8-K filed with the SEC on December 2, 2013 (File No. 001-35971). |
| | | | |
| | | | | | | | | | | | | | |
| | Credit Agreement, dated as of September 12, 2017.November 18, 2021. | | Incorporated by reference to Exhibit 10.1 of the Company's Form 8-K filed September 15, 2017November 18, 2021 (File No. 001-35971). |
| | | |
| | Employee Matters Agreement between Ingersoll-Rand plc and Allegion plc. | | Incorporated by reference to Exhibit 10.2 of the Company’s Form 8-K filed with the SEC on December 2, 2013 (File No. 001-35971). |
| | | | |
| | 20132023 Incentive Stock Plan. * | | Incorporated by reference to Exhibit 10.510.1 of the Company’s Registration Statement on Form 1010-Q filed with the SEC on June 17, 2013,July 26, 2023, as amended (File No. 001-35971). |
| | | |
| | Executive Deferred Compensation Plan. * | | Incorporated by reference to Exhibit 10.6 of the Company’s Registration Statement on Form 10 filed with the SEC on June 17, 2013, as amended (File No. 001-35971). |
| | | | |
| | Supplemental Employee Savings Plan. * | | Incorporated by reference to Exhibit 10.7 of the Company’s Form 10-K filed with the SEC on February 18, 2020 (File No. 001-35971). |
| | | | |
| | Elected Officer Supplemental Program. * | | Incorporated by reference to Exhibit 10.8 of the Company’s Registration Statement on Form 10 filed with the SEC on June 17, 2013, as amended (File No. 001-35971). |
| | | | |
| | Key Management Supplemental Program. * | | Incorporated by reference to Exhibit 10.9 of the Company’s Registration Statement on Form 10 filed with the SEC on June 17, 2013, as amended (File No. 001-35971). |
| | | | |
| | Supplemental Pension Plan. * | | Incorporated by reference to Exhibit 10.10 of the Company’s Registration Statement on Form 10 filed with the SEC on June 17, 2013, as amended (File No. 001-35971). |
| | | | |
| | Senior Executive Performance Plan. * | | Incorporated by reference to Exhibit 10.11 of the Company’s Registration Statement on Form 10 filed with the SEC on June 17, 2013, as amended (File No. 001-35971). |
| | | | |
| | David D. Petratis Offer Letter, dated June 19, 2013. * | | Incorporated by reference to Exhibit 10.14 of the Company’s Registration Statement on Form 10 filed with the SEC on June 17, 2013, as amended (File No. 001-35971). |
| | | | |
| | Patrick S. Shannon Offer Letter, dated April 9, 2013. * | | Incorporated by reference to Exhibit 10.15 of the Company’s Registration Statement on Form 10 filed with the SEC on June 17, 2013, as amended (File No. 001-35971). |
| | | | |
| | Timothy P. Eckersley Offer Letter, dated OctoberMarch 3, 2013.2021. * | | Incorporated by reference to Exhibit 10.16 of the Company’s Registration Statement on Form 10 filed with the SEC on June 17, 2013, as amended (File No. 001-35971). |
| | | | |
| | Lucia V. Moretti, Offer Letter, dated February 19, 2014. * | | Incorporated by reference to Exhibit 10.1 of the Company'sCompany’s Form 10-K8-K filed with the SEC on February 26, 2016March 10, 2021 (File No. 001-35971).
|
| | | | |
| | Jeffrey N. Braun Offer Letter, dated June 13, 2014. * | | Incorporated by reference to Exhibit 10.15 of the Company's Form 10-K filed with the SEC on February 17, 2017 (File No. 001-35971).
|
| | | | |
| | Form of Allegion plc Deed Poll Indemnity. | | Incorporated by reference to Exhibit 10.21 of the Company’s Registration Statement on Form 10 filed with the SEC on June 17, 2013, as amended (File No. 001-35971). |
| | | | |
| | | | | | | | | | | | | | |
| | Form of Allegion US Holding Company, Inc. Deed Poll Indemnity. | | Incorporated by reference to Exhibit 10.22 of the Company’s Registration Statement on Form 10 filed with the SEC on June 17, 2013, as amended (File No. 001-35971). |
| | | | |
| | Form of Allegion Irish Holding Company Limited Deed Poll Indemnity. | | Incorporated by reference to Exhibit 10.23 of the Company’s Registration Statement on Form 10 filed with the SEC on June 17, 2013, as amended (File No. 001-35971). |
| | | | |
| | Annual Incentive Plan. * | | Incorporated by reference to Exhibit 10.1 of the Company's Form 10-K filed with the SEC on March 10, 2014 (File No. 001-35971). |
| | | | |
| | Change in Control Severance Plan. * | | Incorporated by reference to Exhibit 10.2 of the Company's Form 10-K filed with the SEC on March 10, 2014 (File No. 001-35971). |
| | | | |
| | | | | | | | | | | | | | |
| | Form of Global Restricted Stock Unit Award Agreement. * | | Filed herewith. |
| | | | |
| | Form of RestrictedGlobal Stock UnitOption Award Agreement. * | | Filed herewith. |
| | | | |
| | Form of Global Performance Stock OptionUnit Award Agreement. * | | Filed herewith. |
| | | | |
| | Form of Performance Stock Unit Award Agreement. * | | Filed herewith. |
| | | | |
| | Form of Special Restricted Stock Unit Award Agreement. * | | Incorporated by reference to Exhibit 10.4 of the Company's Form 8-K filed with the SEC on February 9, 2016 (File No. 001-35971). |
| | | | |
| | Form of Non-Employee Director Restricted Stock Unit Award Agreement. * | | Incorporated by reference to Exhibit 10.110.2 of the Company's Form 10-Q filed with the SEC on April 30, 2015July 26, 2023 (File No. 001-35971). |
| | | | |
| | Share Purchase Agreement dated June 26, 2015 between SimonsVoss Luxco S.à r.l., SimonsVoss Co-Invest GmbH & Co. KG, Mr Frank Rövekamp and Allegion Luxembourg Holding & Financing S.à r.l. | | Incorporated by reference to Exhibit 10.1 of the Company's Form 10-Q filed with the SEC on July 30, 2015 (File No. 001-35971). |
| | | | |
| | Chris E. MuhlenkampMichael J. Wagnes Offer Letter, dated September 8, 2020.February 14, 2022. * | | Filed herewith. |
| | | | |
| | Chris E. Muhlenkamp Restricted Stock Unit Award Agreement, dated February 20, 2020. * | | Filed herewith. |
| | | | |
| | Lucia V. Moretti Separation Agreement, dated December 31, 2020. * | | Incorporated by reference to Exhibit 10.1 of the Company’s Form 8-K filed with the SEC on January 6, 2021February 15, 2022 (File No. 001-35971). |
| | | | |
| | John H. Stone Offer Letter, dated May 24, 2022. * | | Incorporated by reference to Exhibit 10.1 of the Company’s Form 8-K filed with the SEC on May 31, 2022 (File No. 001-35971). |
| | | | |
| | David S. Ilardi Offer Letter, dated February 14, 2022. * | | Incorporated by reference to Exhibit 10.39 of the Company's Form 10-K filed with the SEC on February 15, 2022 (File No. 001-35971) |
| | | | |
| | Transaction Agreement, dated as of April 22, 2022, by and between Allegion US Holding Company Inc. Stanley Black & Decker, Inc., Stanley Black & Decker Canada Corporation, various entities thereto and Stanley Access Technologies LLC. | | Incorporated by reference to Exhibit 10.1 of the Company’s Form 8-K filed with the SEC on April 22, 2022 (File No. 001-35971). |
| | | | |
| | List of subsidiaries of Allegion plc. | | Filed herewith. |
| | | | |
| | Subsidiary Guarantors and Issuers of Guaranteed Securities | | Filed herewith. |
| | | | |
| | Consent of Independent Registered Public Accounting Firm. | | Filed herewith. |
| | | | |
| | Certification of Chief Executive Officer Pursuant to Rule 13a-14(a) or Rule 15d-14(a), as Adopted Pursuant to Section 302 of the Sarbanes-Oxley Act of 2002. | | Filed herewith. |
| | | | |
| | Certification of Chief Financial Officer Pursuant to Rule 13a-14(a) or Rule 15d-14(a), as Adopted Pursuant to Section 302 of the Sarbanes-Oxley Act of 2002. | | Filed herewith. |
| | | | |
| | Certifications of Chief Executive Officer and Chief Financial Officer Pursuant to Rule 13a-14(b) or Rule 15d-14(b) and 18U.S.C. Section 1350, as Adopted Pursuant to Section 906 of the Sarbanes-Oxley Act of 2002. | | FurnishedFiled herewith. |
| | | | |
| | SEC Rule 10D-1 Clawback Policy*. | | Filed herewith. |
| | | | |
| 101.INS | | XBRL Instance Document. | | The instance document does not appear in the Interactive Data File because its XBRL tags are embedded within the Inline XBRL document. |
| | | | |
| 101.SCH | | XBRL Taxonomy Extension Schema Document. | | Filed herewith. |
| | | | |
| 101.CAL | | XBRL Taxonomy Extension Calculation Linkbase Document. | | Filed herewith. |
| | | | |
| | | | | | | | | | | | | | |
101.CAL | | XBRL Taxonomy Extension Calculation Linkbase Document. | | Filed herewith. |
| | | | |
| 101.DEF | | XBRL Taxonomy Extension Definition Linkbase Document. | | Filed herewith. |
| | | | |
| 101.LAB | | XBRL Taxonomy Extension Labels Linkbase Document. | | Filed herewith. |
| | | | |
| 101.PRE | | XBRL Taxonomy Extension Presentation Linkbase Document. | | Filed herewith. |
| | | | |
| 104 | | Cover Page Interactive Data File. | | Formatted as Inline XBRL and contained in Exhibit 101. |
* CompensatoryManagement contract or compensatory plan or arrangement.
Item 16. FORM 10-K SUMMARY
Not applicable.
SIGNATURES
Pursuant to the requirements of Section 13 or 15(d) of the Securities Exchange Act of 1934, the registrant has duly caused this report to be signed on its behalf by the undersigned, thereunto duly authorized.
ALLEGION PLC
(Registrant)
| | | | | | | | |
| By: | | /s/ David D. PetratisJohn H. Stone |
| | David D. PetratisJohn H. Stone |
| | Chief Executive Officer |
| Date: | | February 16, 202120, 2024 |
Pursuant to the requirement of the Securities Exchange Act of 1934, this report has been signed by the following persons on behalf of the registrant and in the capacities and on the dates indicated.
| | | | | | | | | | | | | | |
| Signature | | Title | | Date |
| | | | |
/s/ David D. PetratisJohn H. Stone | | Chairman of the Board, President and Chief Executive Officer (Principal Executive Officer) | | February 16, 202120, 2024 |
(David D. Petratis)John H. Stone) | | | |
| | | | |
/s/ Patrick S. ShannonMichael J. Wagnes | | Senior Vice President and Chief Financial Officer (Principal Financial Officer) | | February 16, 202120, 2024 |
(Patrick S. Shannon)Michael J. Wagnes) | | | |
| | | | |
/s/ Douglas P. RanckNickolas A. Musial | | Vice President, Controller and Chief Accounting Officer (Principal Accounting Officer) | | February 16, 202120, 2024 |
(Douglas P. Ranck)Nickolas A. Musial) | | | |
| | | | |
| /s/ Kirk S. Hachigian | | Chairman of the Board and Director | | February 16, 202120, 2024 |
| (Kirk S. Hachigian) | | | | |
| | | | |
| /s/ Nicole Parent Haughey | | Director | | February 20, 2024 |
| (Nicole Parent Haughey) | | | | |
| | | | |
| /s/ Susan L. Main | | Director | | February 20, 2024 |
| (Susan L. Main | | | | |
| | | | |
| /s/ Steven C. Mizell | | Director | | February 16, 202120, 2024 |
| (Steven C. Mizell) | | | | |
| | | | |
/s/ Nicole Parent HaugheyLauren B. Peters | | Director | | February 16, 202120, 2024 |
(Nicole Parent Haughey)Lauren B. Peters) | | | | |
| | | | |
| /s/ Ellen Rubin | | Director | | February 20, 2024 |
| (Ellen Rubin) | | | | |
| | | | |
| /s/ Dean I. Schaffer | | Director | | February 16, 202120, 2024 |
| (Dean I. Schaffer) | | | | |
| | | | |
/s/ Charles L. Szews | | Director | | February 16, 2021 |
(Charles L. Szews) | | | | |
| | | | |
| /s/ Dev Vardhan | | Director | | February 16, 202120, 2024 |
| (Dev Vardhan) | | | | |
| | | | |
| /s/ Martin E. Welch III | | Director | | February 16, 202120, 2024 |
| (Martin E. Welch III) | | | | |
| | | | |
ALLEGION PLC
Index to Consolidated Financial Statements
Report of Independent Registered Public Accounting Firm
To the Board of Directors and Shareholders of Allegion plc
Opinions on the Financial Statements and Internal Control over Financial Reporting
We have audited the accompanying consolidated balance sheets of Allegion plcand its subsidiaries(the (the “Company”) as of December 31, 20202023 and 2019,2022, and the related consolidated statements of comprehensive income, of equity and of cash flows for each of the three years in the period ended December 31, 2020,2023, including the related notes and financial statement schedulelisted in the accompanying index (collectively(collectively referred to as the “consolidated financial statements”).We also have audited the Company's internal control over financial reporting as of December 31, 2020,2023, based on criteria established in Internal Control - Integrated Framework(2013)issued by the Committee of Sponsoring Organizations of the Treadway Commission (COSO).
In our opinion, the consolidatedfinancial statements referred to above present fairly, in all material respects, the financial position of the Company as of December 31, 20202023 and 2019, 2022, and the results of itsoperations and itscash flows for each of the three years in the period ended December 31, 20202023 in conformity with accounting principles generally accepted in the United States of America. Also in our opinion, the Company maintained, in all material respects, effective internal control over financial reporting as of December 31, 2020,2023, based on criteria established in Internal Control - Integrated Framework(2013)issued by the COSO.
Change in Accounting Principle
As discussed in Note 11 to the consolidated financial statements, the Company changed the manner in which it accounts for leases in 2019.
Basis for Opinions
The Company's management is responsible for these consolidated financial statements, for maintaining effective internal control over financial reporting, and for its assessment of the effectiveness of internal control over financial reporting, included in Management’s Report on Internal Control Over Financial Reporting appearing under Item 9A. Our responsibility is to express opinions on the Company’s consolidatedfinancial statements and on the Company's internal control over financial reporting based on our audits. We are a public accounting firm registered with the Public Company Accounting Oversight Board (United States) (PCAOB) and are required to be independent with respect to the Company in accordance with the U.S. federal securities laws and the applicable rules and regulations of the Securities and Exchange Commission and the PCAOB.
We conducted our audits in accordance with the standards of the PCAOB. Those standards require that we plan and perform the audits to obtain reasonable assurance about whether the consolidatedfinancial statements are free of material misstatement, whether due to error or fraud, and whether effective internal control over financial reporting was maintained in all material respects.
Our audits of the consolidatedfinancial statements included performing procedures to assess the risks of material misstatement of the consolidatedfinancial statements, whether due to error or fraud, and performing procedures that respond to those risks. Such procedures included examining, on a test basis, evidence regarding the amounts and disclosures in the consolidatedfinancial statements. Our audits also included evaluating the accounting principles used and significant estimates made by management, as well as evaluating the overall presentation of the consolidatedfinancial statements. Our audit of internal control over financial reporting included obtaining an understanding of internal control over financial reporting, assessing the risk that a material weakness exists, and testing and evaluating the design and operating effectiveness of internal control based on the assessed risk. Our audits also included performing such other procedures as we considered necessary in the circumstances. We believe that our audits provide a reasonable basis for our opinions.
Definition and Limitations of Internal Control over Financial Reporting
A company’s internal control over financial reporting is a process designed to provide reasonable assurance regarding the reliability of financial reporting and the preparation of financial statements for external purposes in accordance with generally accepted accounting principles. A company’s internal control over financial reporting includes those policies and procedures that (i) pertain to the maintenance of records that, in reasonable detail, accurately and fairly reflect the transactions and dispositions of the assets of the company; (ii) provide reasonable assurance that transactions are recorded as necessary to permit preparation of financial statements in accordance with generally accepted accounting principles, and that receipts and expenditures of the company are being made only in accordance with authorizations of management and directors of the company; and (iii) provide reasonable assurance regarding prevention or timely detection of unauthorized acquisition, use, or disposition of the company’s assets that could have a material effect on the financial statements.
Because of its inherent limitations, internal control over financial reporting may not prevent or detect misstatements. Also, projections of any evaluation of effectiveness to future periods are subject to the risk that controls may become inadequate because of changes in conditions, or that the degree of compliance with the policies or procedures may deteriorate.
Critical Audit Matters
The critical audit matter communicated below is a matter arising from the current period audit of the consolidated financial statements that was communicated or required to be communicated to the audit committee and that (i) relates to accounts or disclosures that are material to theconsolidated financial statements and (ii) involved our especially challenging, subjective, or complex judgments. The communication of critical audit matters does not alter in any way our opinion on the consolidated
financial statements, taken as a whole, and we are not, by communicating the critical audit matter below, providing a separate opinion on the critical audit matter or on the accounts or disclosures to which it relates.
Goodwill Impairment Assessments - EMEA and Asia Pacific Reporting Units
As described in Notes 2 and 520 to the consolidated financial statements, the Company’s consolidated goodwill balance was $819.0 million as ofCompany has two principal revenue streams, tangible product sales and services. For the year ended December 31, 2020,2023, the Company’s net revenues were $3,650.8 million. Net revenues are recognized based on the satisfaction of performance obligations under the terms of a contract. A performance obligation is a promise in a contract to transfer control of a distinct product or to provide a service, or a bundle of products or services, to a customer. Product sales involve contracts with a single performance obligation. Transfer of control typically occurs when goods are shipped from the Company's facilities or at other predetermined control transfer points (for instance, destination terms). Service offerings include inspection, maintenance and the goodwill associated with the EMEArepair, aftermarket, design and Asia Pacific reporting units was $309.9 millioninstallation and $8.0 million, respectively. As of March 31, 2020, management identified a triggering event for the EMEA and Asia Pacific reporting units, andlocksmith services, as well as software as a result, performed interim goodwill impairment analyses. The resultsservice solutions. Unlike the single performance obligation to ship a product or bundle of products, revenue recognition related to services is delayed until the impairment testing indicated that the estimated fair value of the Asia Pacific reporting unit was less than its carrying value, and as such, the Company recorded an impairment of $88.1 million. For the impairment analyses performed as of March 31, 2020, the estimated fair values of the EMEA and Asia Pacific reporting units wereservice based on a discounted cash flow model (income approach). Goodwill is tested annually for impairment during the fourth quarter or whenever there is a significant change in events or circumstances that indicate that the fair value of the reporting unit is more likely than not less than the carrying amount of the reporting unit. If the estimated fair value of a reporting unit exceeds its carrying amount, goodwill of the reporting unit is not impaired. To the extent that the carrying value of the reporting unit exceeds its estimated fair value, a goodwill impairment charge will be recognized for the amount by which the carrying value of the reporting unit exceeds its fair value, not to exceed the carrying amount of goodwill. For the annual impairment analyses, the estimated fair values of the EMEA and Asia Pacific reporting units were based on two valuation techniques, a discounted cash flow model and a market multiple of earnings (market approach), with each method being weighted in the calculation. As disclosed by management, the income approach relies on management’s estimates of revenue growth rates, terminal growth rates, margin assumptions, and discount rates. The market approach requires the determination of an appropriate peer group, which is utilized to derive estimated fair values based on selected market multiples.
The principal considerationsconsideration for our determination that performing procedures relatingrelated to the goodwill impairment assessment of EMEA and Asia Pacific reporting unitsrevenue recognition is a critical audit matter are (i)is the significant judgment by management when developing the fair value measurements of the reporting units; (ii) a high degree of auditor judgment, subjectivity, and effort in performing procedures and evaluating management’s significant assumptionsaudit evidence related to the Company’s revenue growth rates, terminal growth rates, margin assumptions, discount rates, peer group determination, and market multiple selections; and (iii) the audit effort involved the use of professionals with specialized skill and knowledge.
Addressing the matter involved performing procedures and evaluating audit evidence in connection with forming our overall opinion on the consolidated financial statements. These procedures included testing the effectiveness of controls relating to management’s goodwill impairment assessment, including controls over the valuation of the Company’s EMEA and Asia Pacific reporting units.revenue recognition process. These procedures also included, among others (i) testing management’s processthe completeness, accuracy, and occurrence of revenue recognized during the year for developinga sample of revenue transactions by obtaining and inspecting source documents, such as purchase orders, invoices, shipping documentation, service order completion sheets and subsequent cash receipts, (ii) for certain revenue transactions, testing the fair value measurementsissuance and settlement of the reporting units; (ii) evaluating the appropriatenessinvoices and credit memos, tracing transactions not settled to a detailed listing of the discounted cash flowaccounts receivable, and market multiple of earnings models; (iii) testing the completeness and accuracy of underlying data used in the models; and (iv) evaluating the reasonableness of significant assumptions usedprovided by management related to revenue growth rates, terminal growth rates, margin assumptions, discount rates, peer group determination, and market multiple selections. Evaluating management’s assumptions related to revenue growth rates and margin assumptions involved evaluating whether the assumptions used by management were reasonable considering (i) the current and past performance of the reporting units, (ii) the consistency with external market and industry data,management; and (iii) whether these assumptions were consistent with evidence obtained in other areasconfirming a sample of the audit. Evaluating the Company’s peer group determination included assessing the appropriatenessoutstanding customer invoice balances as of the identified peer companies. Professionals with specialized skillyear-end and knowledge were used to assist in the evaluation of management’s discountedobtaining and inspecting source documents, such as subsequent cash flow and market multiple models, and management’s significant assumptions related to terminal growth rates, discount rates, selected peer group, and market multiples.receipts or shipping documentation, for confirmations not returned.
/s/ PricewaterhouseCoopers LLP
Indianapolis, Indiana
February 16, 202120, 2024
We have served as the Company’s auditor since 2013.
Allegion plc
Consolidated Statements of Comprehensive Income
In millions, except per share amounts
| | For the years ended December 31, | For the years ended December 31, | | 2020 | | 2019 | | 2018 | For the years ended December 31, | | 2023 | | 2022 | | 2021 |
| Net revenues | Net revenues | | $ | 2,719.9 | | | $ | 2,854.0 | | | $ | 2,731.7 | |
| Cost of goods sold | Cost of goods sold | | 1,541.1 | | | 1,601.7 | | | 1,558.4 | |
| Selling and administrative expenses | Selling and administrative expenses | | 635.7 | | | 681.3 | | | 647.5 | |
| Impairment of goodwill and intangible assets | | 101.7 | | | 5.9 | | | 0 | |
| Loss on assets held for sale | | 37.9 | | | 0 | | | 0 | |
| Impairment of intangible assets | |
| | Operating income | |
| Operating income | |
| Operating income | Operating income | | 403.5 | | | 565.1 | | | 525.8 | |
| Interest expense | Interest expense | | 51.1 | | | 56.0 | | | 54.0 | |
| Loss on divestitures | Loss on divestitures | | 0 | | | 30.1 | | | 0 | |
| Other (income) expense, net | | (13.0) | | | 3.8 | | | (3.4) | |
| Other income, net | |
| Earnings before income taxes | Earnings before income taxes | | 365.4 | | | 475.2 | | | 475.2 | |
| Provision for income taxes | Provision for income taxes | | 50.9 | | | 73.1 | | | 39.8 | |
| Net earnings | Net earnings | | 314.5 | | | 402.1 | | | 435.4 | |
| Less: Net earnings attributable to noncontrolling interests | Less: Net earnings attributable to noncontrolling interests | | 0.2 | | | 0.3 | | | 0.5 | |
| Net earnings attributable to Allegion plc | Net earnings attributable to Allegion plc | | $ | 314.3 | | | $ | 401.8 | | | $ | 434.9 | |
| Amounts attributable to Allegion plc ordinary shareholders: | Amounts attributable to Allegion plc ordinary shareholders: | | | | | | |
| Earnings per share attributable to Allegion plc ordinary shareholders: | Earnings per share attributable to Allegion plc ordinary shareholders: | |
| Earnings per share attributable to Allegion plc ordinary shareholders: | |
| Earnings per share attributable to Allegion plc ordinary shareholders: | |
| Basic net earnings: | |
| Basic net earnings: | |
| Basic net earnings: | Basic net earnings: | | $ | 3.41 | | | $ | 4.29 | | | $ | 4.58 | |
| Diluted net earnings: | Diluted net earnings: | | $ | 3.39 | | | $ | 4.26 | | | $ | 4.54 | |
| | Net earnings | Net earnings | | $ | 314.5 | | | $ | 402.1 | | | $ | 435.4 | |
| Net earnings | |
| Net earnings | |
| Other comprehensive income (loss), net of tax: | Other comprehensive income (loss), net of tax: | |
| Currency translation | Currency translation | | 57.3 | | | 13.4 | | | (56.9) | |
| Currency translation | |
| Currency translation | |
| Cash flow hedges: | Cash flow hedges: | | | | | | |
| Unrealized net gains arising during period | |
| Unrealized net gains arising during period | |
| Unrealized net gains arising during period | Unrealized net gains arising during period | | 3.9 | | | 0 | | | 4.6 | |
| Net gains reclassified into earnings | Net gains reclassified into earnings | | (5.8) | | | (7.5) | | | (2.3) | |
| Tax benefit (expense) | Tax benefit (expense) | | 0.5 | | | 1.9 | | | (0.5) | |
| Total cash flow hedges, net of tax | Total cash flow hedges, net of tax | | (1.4) | | | (5.6) | | | 1.8 | |
| Pension and OPEB adjustments: | | | | | | |
| Prior service gains (costs) and net actuarial gains (losses), net | | 4.9 | | | (8.3) | | | (16.6) | |
| Defined benefit plan adjustments: | |
| Prior service (costs) gains and net actuarial (losses) gains, net | |
| Prior service (costs) gains and net actuarial (losses) gains, net | |
| Prior service (costs) gains and net actuarial (losses) gains, net | |
| Amortization reclassified into earnings | Amortization reclassified into earnings | | 5.0 | | | 6.1 | | | 4.5 | |
| Settlements/curtailments reclassified into earnings | Settlements/curtailments reclassified into earnings | | 0.1 | | | 2.3 | | | 0 | |
| Currency translation and other | Currency translation and other | | (2.1) | | | (2.7) | | | 5.1 | |
| Tax (expense) benefit | | (2.0) | | | (0.4) | | | 1.6 | |
| Total pension and OPEB adjustments, net of tax | | 5.9 | | | (3.0) | | | (5.4) | |
| Tax benefit (expense) | |
| Total defined benefit plan adjustments, net of tax | |
| Other comprehensive income (loss), net of tax | Other comprehensive income (loss), net of tax | | 61.8 | | | 4.8 | | | (60.5) | |
| Total comprehensive income, net of tax | Total comprehensive income, net of tax | | 376.3 | | | 406.9 | | | 374.9 | |
| Less: Total comprehensive income attributable to noncontrolling interests | | 0.5 | | | 0.2 | | | 0.9 | |
| Less: Total comprehensive (loss) income attributable to noncontrolling interests | |
| Total comprehensive income attributable to Allegion plc | Total comprehensive income attributable to Allegion plc | | $ | 375.8 | | | $ | 406.7 | | | $ | 374.0 | |
See accompanying notes to consolidated financial statements.
Allegion plc
Consolidated Balance Sheets
In millions, except share amounts
| | As of December 31, | As of December 31, | | 2020 | | 2019 | As of December 31, | | 2023 | | 2022 |
| ASSETS | ASSETS | | | | |
| Current assets: | Current assets: | |
| Current assets: | |
| Current assets: | |
| Cash and cash equivalents | Cash and cash equivalents | | $ | 480.4 | | | $ | 355.3 | |
| Restricted cash | | 0 | | | 3.4 | |
| Cash and cash equivalents | |
| Cash and cash equivalents | |
| | Accounts and notes receivable, net | |
| Accounts and notes receivable, net | |
| Accounts and notes receivable, net | Accounts and notes receivable, net | | 321.8 | | | 329.8 | |
| Inventories | Inventories | | 283.1 | | | 269.9 | |
| Current tax receivable | Current tax receivable | | 25.8 | | | 14.2 | |
| Other current assets | Other current assets | | 28.1 | | | 29.2 | |
| Assets held for sale | Assets held for sale | | 5.8 | | | 0 | |
| Total current assets | Total current assets | | 1,145.0 | | | 1,001.8 | |
| Property, plant and equipment, net | Property, plant and equipment, net | | 294.9 | | | 291.4 | |
| Goodwill | Goodwill | | 819.0 | | | 873.3 | |
| Intangible assets, net | Intangible assets, net | | 487.1 | | | 510.9 | |
| Deferred and noncurrent income taxes | Deferred and noncurrent income taxes | | 126.7 | | | 112.5 | |
| Other noncurrent assets | Other noncurrent assets | | 196.7 | | | 177.3 | |
| Total assets | Total assets | | $ | 3,069.4 | | | $ | 2,967.2 | |
| LIABILITIES AND EQUITY | LIABILITIES AND EQUITY | | | | |
| Current liabilities: | Current liabilities: | |
| Current liabilities: | |
| Current liabilities: | |
| Accounts payable | |
| Accounts payable | |
| Accounts payable | Accounts payable | | $ | 220.4 | | | $ | 221.0 | |
| Accrued compensation and benefits | Accrued compensation and benefits | | 86.1 | | | 98.4 | |
| Accrued expenses and other current liabilities | Accrued expenses and other current liabilities | | 189.4 | | | 174.7 | |
| Current tax payable | Current tax payable | | 18.2 | | | 12.8 | |
| Short-term borrowings and current maturities of long-term debt | Short-term borrowings and current maturities of long-term debt | | 0.2 | | | 0.1 | |
| Liabilities held for sale | | 7.2 | | | 0 | |
| | Total current liabilities | |
| Total current liabilities | |
| Total current liabilities | Total current liabilities | | 521.5 | | | 507.0 | |
| Long-term debt | Long-term debt | | 1,429.4 | | | 1,427.6 | |
| Postemployment and other benefit liabilities | Postemployment and other benefit liabilities | | 79.4 | | | 87.7 | |
| Deferred and noncurrent income taxes | Deferred and noncurrent income taxes | | 105.7 | | | 107.8 | |
| Other noncurrent liabilities | Other noncurrent liabilities | | 100.8 | | | 76.7 | |
| Total liabilities | Total liabilities | | 2,236.8 | | | 2,206.8 | |
| Equity: | Equity: | | | | |
| Allegion plc shareholders’ equity | Allegion plc shareholders’ equity | |
| Ordinary shares, $0.01 par value (91,212,741 and 92,723,682 shares issued and outstanding at December 31, 2020 and 2019, respectively) | | 0.9 | | | 0.9 | |
| Allegion plc shareholders’ equity | |
| Allegion plc shareholders’ equity | |
| Ordinary shares, $0.01 par value (87,504,673 and 87,852,777 shares issued and outstanding at December 31, 2023 and 2022, respectively) | |
| Ordinary shares, $0.01 par value (87,504,673 and 87,852,777 shares issued and outstanding at December 31, 2023 and 2022, respectively) | |
| Ordinary shares, $0.01 par value (87,504,673 and 87,852,777 shares issued and outstanding at December 31, 2023 and 2022, respectively) | |
| Capital in excess of par value | Capital in excess of par value | | 0 | | | 0 | |
| Retained earnings | Retained earnings | | 985.6 | | | 975.1 | |
| Accumulated other comprehensive loss | Accumulated other comprehensive loss | | (157.1) | | | (218.6) | |
| Total Allegion plc shareholders’ equity | Total Allegion plc shareholders’ equity | | 829.4 | | | 757.4 | |
| Noncontrolling interests | Noncontrolling interests | | 3.2 | | | 3.0 | |
| Total equity | Total equity | | 832.6 | | | 760.4 | |
| Total liabilities and equity | Total liabilities and equity | | $ | 3,069.4 | | | $ | 2,967.2 | |
See accompanying notes to consolidated financial statements.
Allegion plc
Consolidated Statements of Equity
In millions, except per share amounts
| | | | | Allegion plc shareholders' equity | |
| | Total
equity | |
| | | Total
equity | | | | Total
equity | | Ordinary Shares | | Capital in excess of par value | | Retained earnings | | Accumulated
other
comprehensive loss | | Noncontrolling interests |
| | Balance at December 31, 2020 | |
| Balance at December 31, 2020 | |
| Balance at December 31, 2020 | |
| | Allegion plc shareholders' equity | |
| | Total
equity | | Ordinary Shares | | Capital in excess of par value | | Retained earnings | | Accumulated
other
comprehensive loss | | Noncontrolling interests |
| Amount | | Shares | |
| Balance at December 31, 2017 | | $ | 405.5 | | | $ | 1.0 | | | 95.1 | | | $ | 9.1 | | | $ | 544.4 | | | $ | (152.9) | | | $ | 3.9 | |
| | Net earnings | |
| Net earnings | |
| Net earnings | Net earnings | | 435.4 | | | — | | | — | | | — | | | 434.9 | | | — | | | 0.5 | |
| Other comprehensive (loss) income, net | Other comprehensive (loss) income, net | | (60.5) | | | — | | | — | | | — | | | 0 | | | (60.9) | | | 0.4 | |
| Repurchase of ordinary shares | Repurchase of ordinary shares | | (67.3) | | | (0.1) | | | (0.9) | | | (31.5) | | | (35.7) | | | — | | | — | |
| Share-based compensation activity | Share-based compensation activity | | 22.4 | | | 0 | | | 0.4 | | | 22.4 | | | 0 | | | — | | | — | |
| | Dividends declared to noncontrolling interests | Dividends declared to noncontrolling interests | | (1.8) | | | — | | | — | | | — | | | 0 | | | — | | | (1.8) | |
| Cash dividends declared ($0.84 per share) | | (79.7) | | | — | | | — | | | — | | | (79.7) | | | — | | | — | |
| Reclassification due to adoption of ASU 2018-02 (see Note 14) | | 0 | | | — | | | — | | | — | | | 9.7 | | | (9.7) | | | — | |
| Balance at December 31, 2018 | | 654.0 | | | 0.9 | | | 94.6 | | | 0 | | | 873.6 | | | (223.5) | | | 3.0 | |
| Dividends declared to noncontrolling interests | |
| Dividends declared to noncontrolling interests | |
| Cash dividends declared ($1.44 per share) | |
| | Balance at December 31, 2021 | |
| Balance at December 31, 2021 | |
| Balance at December 31, 2021 | |
| | Net earnings | Net earnings | | 402.1 | | | — | | | — | | | — | | | 401.8 | | | — | | | 0.3 | |
| Other comprehensive income (loss), net | | 4.8 | | | — | | | — | | | — | | | 0 | | | 4.9 | | | (0.1) | |
| Net earnings | |
| Net earnings | |
| Other comprehensive loss, net | |
| Repurchase of ordinary shares | Repurchase of ordinary shares | | (226.0) | | | 0 | | | (2.3) | | | (26.5) | | | (199.5) | | | — | | | — | |
| Share-based compensation activity | Share-based compensation activity | | 26.5 | | | 0 | | | 0.4 | | | 26.5 | | | 0 | | | — | | | — | |
| | Dividends declared to noncontrolling interests | Dividends declared to noncontrolling interests | | (0.2) | | | — | | | — | | | — | | | 0 | | | — | | | (0.2) | |
| Cash dividends declared ($1.08 per share) | | (100.9) | | | — | | | — | | | — | | | (100.9) | | | — | | | — | |
| Other | | 0.1 | | | — | | | — | | | — | | | 0.1 | | | — | | | — | |
| Balance at December 31, 2019 | | 760.4 | | | 0.9 | | | 92.7 | | | 0 | | | 975.1 | | | (218.6) | | | 3.0 | |
| Dividends declared to noncontrolling interests | |
| Dividends declared to noncontrolling interests | |
| Cash dividends declared ($1.64 per share) | |
| | Cumulative effect of adoption of ASC 326 (see Note 2) | | (2.2) | | | — | | | — | | | — | | | (2.2) | | | — | | | — | |
| Balance at December 31, 2022 | |
| Balance at December 31, 2022 | |
| Balance at December 31, 2022 | |
| | Net earnings | |
| Net earnings | |
| Net earnings | Net earnings | | 314.5 | | | — | | | — | | | — | | | 314.3 | | | — | | | 0.2 | |
| Other comprehensive income, net | Other comprehensive income, net | | 61.8 | | | — | | | — | | | — | | | 0 | | | 61.5 | | | 0.3 | |
| Repurchase of ordinary shares | Repurchase of ordinary shares | | (208.8) | | | 0 | | | (1.9) | | | (24.8) | | | (184.0) | | | — | | | — | |
| Share-based compensation activity | Share-based compensation activity | | 24.8 | | | 0 | | | 0.4 | | | 24.8 | | | 0 | | | — | | | — | |
| Acquisition/divestiture of noncontrolling interest and other | |
| Dividends declared to noncontrolling interests | |
| Cash dividends declared ($1.80 per share) | |
| | Dividends declared to noncontrolling interests | | (0.3) | | | — | | | — | | | — | | | 0 | | | — | | | (0.3) | |
| Cash dividends declared ($1.28 per share) | | (117.9) | | | — | | | — | | | — | | | (117.9) | | | — | | | — | |
| Other | | 0.3 | | | — | | | — | | | — | | | 0.3 | | | — | | | — | |
| Balance at December 31, 2020 | | $ | 832.6 | | | $ | 0.9 | | | 91.2 | | | $ | 0 | | | $ | 985.6 | | | $ | (157.1) | | | $ | 3.2 | |
| Balance at December 31, 2023 | |
| Balance at December 31, 2023 | |
| Balance at December 31, 2023 | |
See accompanying notes to consolidated financial statements.
Allegion plc
Consolidated Statements of Cash Flows
In millions
| | For the years ended December 31, | For the years ended December 31, | | 2020 | | 2019 | | 2018 | For the years ended December 31, | | 2023 | | 2022 | | 2021 |
| Cash flows from operating activities: | Cash flows from operating activities: | | | | | | |
| Net earnings | Net earnings | | $ | 314.5 | | | $ | 402.1 | | | $ | 435.4 | |
| Net earnings | |
| Net earnings | |
| Adjustments to arrive at net cash provided by operating activities: | Adjustments to arrive at net cash provided by operating activities: | |
| Debt extinguishment costs | | 0 | | | 2.7 | | | 0 | |
| | Depreciation and amortization | Depreciation and amortization | | 81.0 | | | 83.0 | | | 86.2 | |
| Impairment of goodwill and intangible assets | | 101.7 | | | 5.9 | | | 0 | |
| Loss on assets held for sale | | 37.3 | | | 0 | | | — | |
| | Depreciation and amortization | |
| | Depreciation and amortization | |
| Impairment of intangible assets | |
| | Loss on divestitures | |
| Loss on divestitures | |
| Loss on divestitures | Loss on divestitures | | 0 | | | 30.1 | | | 0 | |
| Share-based compensation | Share-based compensation | | 20.8 | | | 20.4 | | | 19.6 | |
| Unrealized losses (gains) on investments, net | |
| | | Deferred income taxes | |
| | Deferred income taxes | |
| | Deferred income taxes | Deferred income taxes | | (24.4) | | | (30.2) | | | (64.4) | |
| Other items | Other items | | (4.4) | | | (3.6) | | | (8.0) | |
| Changes in other assets and liabilities: | Changes in other assets and liabilities: | |
| Accounts and notes receivable | Accounts and notes receivable | | (1.9) | | | (6.0) | | | (8.6) | |
| Accounts and notes receivable | |
| Accounts and notes receivable | |
| Inventories | Inventories | | (7.8) | | | 5.4 | | | (19.7) | |
| Other current and noncurrent assets | | (46.0) | | | (15.0) | | | (3.3) | |
| Accounts payable | Accounts payable | | (1.6) | | | (11.0) | | | 33.9 | |
| Other current and noncurrent liabilities | | 21.1 | | | 4.4 | | | (13.3) | |
| Other assets and liabilities | |
| Net cash provided by operating activities | Net cash provided by operating activities | | 490.3 | | | 488.2 | | | 457.8 | |
| Cash flows from investing activities: | Cash flows from investing activities: | | | | | | |
| Capital expenditures | Capital expenditures | | (47.1) | | | (65.6) | | | (49.1) | |
| Capital expenditures | |
| Capital expenditures | |
| Acquisition of and equity investments in businesses, net of cash acquired | Acquisition of and equity investments in businesses, net of cash acquired | | (12.5) | | | (7.6) | | | (376.1) | |
| | Proceeds from sale of equity method investment | |
| Proceeds from sale of equity method investment | |
| Proceeds from sale of equity method investment | |
| | Proceeds related to business dispositions | | 0 | | | 3.3 | | | 0 | |
| Purchase of other investments | | (3.0) | | | 0 | | | (14.3) | |
| | Other investing activities, net | |
| | Other investing activities, net | |
| | | Other investing activities, net | Other investing activities, net | | 5.9 | | | (7.7) | | | (4.3) | |
| Net cash used in investing activities | Net cash used in investing activities | | (56.7) | | | (77.6) | | | (443.8) | |
| Cash flows from financing activities: | Cash flows from financing activities: | | | | | | |
| Short-term repayments, net | | (0.1) | | | (0.2) | | | (0.6) | |
| Proceeds from Revolving facility | | 0 | | | 0 | | | 115.0 | |
| Repayments of Revolving facility | | 0 | | | 0 | | | (115.0) | |
| Debt repayments, net | |
| Debt repayments, net | |
| Debt repayments, net | |
| Proceeds from 2021 Revolving Facility | |
| Repayments of 2021 Revolving Facility | |
| Proceeds from issuance of 2021 Term Facility | |
| Proceeds from issuance of Senior Notes | |
| | Proceeds from issuance of senior notes | | 0 | | | 400.0 | | | 0 | |
| Proceeds from (repayments of) debt, net | |
| | Payments of long-term debt | | (0.1) | | | (417.7) | | | (35.5) | |
| Debt repayments, net | | (0.2) | | | (17.9) | | | (36.1) | |
| Debt issuance costs | | 0 | | | (4.2) | | | 0 | |
| Proceeds from (repayments of) debt, net | |
| | Proceeds from (repayments of) debt, net | |
| Debt financing costs | |
| | Dividends paid to ordinary shareholders | |
| | Dividends paid to ordinary shareholders | |
| | Dividends paid to ordinary shareholders | Dividends paid to ordinary shareholders | | (117.3) | | | (100.6) | | | (79.4) | |
| | Repurchase of ordinary shares | Repurchase of ordinary shares | | (208.8) | | | (226.0) | | | (67.3) | |
| Proceeds from shares issued under incentive plans | | 4.5 | | | 6.5 | | | 3.2 | |
| | Repurchase of ordinary shares | |
| | Repurchase of ordinary shares | |
| | Other financing activities, net | Other financing activities, net | | (0.1) | | | 0 | | | (3.8) | |
| Net cash used in financing activities | | (321.9) | | | (342.2) | | | (183.4) | |
| Effect of exchange rate changes on cash, cash equivalents and restricted cash | | 10.0 | | | (0.3) | | | (6.2) | |
| Net increase (decrease) in cash, cash equivalents and restricted cash | | 121.7 | | | 68.1 | | | (175.6) | |
| Cash, cash equivalents and restricted cash – beginning of period | | 358.7 | | | 290.6 | | | 466.2 | |
| Cash, cash equivalents and restricted cash – end of period | | $ | 480.4 | | | $ | 358.7 | | | $ | 290.6 | |
| Other financing activities, net | |
| Other financing activities, net | |
| Net cash (used in) provided by financing activities | |
| Effect of exchange rate changes on cash and cash equivalents | |
| Net increase (decrease) in cash and cash equivalents | |
| Cash and cash equivalents – beginning of period | |
| Cash and cash equivalents – end of period | |
|
See accompanying notes to consolidated financial statements.
NOTES TO CONSOLIDATED FINANCIAL STATEMENTS
NOTE 1 – DESCRIPTION OF COMPANY AND BASIS OF PRESENTATION
Allegion plc, an Irish public limited company, and its consolidated subsidiaries ("Allegion" or "the Company") are a leading global company that provides security products and solutions that keep people and assets safe and secure in the places where they reside,live, learn, work and thrive.visit. Allegion creates peace of mind by pioneering safety and security with a vision of seamless access and a safer world. The Company offers an extensive and versatile portfolio of mechanicalsecurity and electronic securityaccess control products and solutions across a range of market-leading brands including CISA®, Interflex®, LCN®, Schlage®, SimonsVoss® and Von Duprin®.
Basis of presentation: The Consolidated Financial Statements were prepared in accordance with generally accepted accounting principles in the United States of America ("GAAP") as defined by the Financial Accounting Standards Board ("FASB") within the FASB Accounting Standards Codification ("ASC"). Certain prior-period amounts have been reclassified to conform to the current year presentation.
NOTE 2 – SUMMARY OF SIGNIFICANT ACCOUNTING POLICIES
AThe following is a summary of significant accounting policies used in the preparation of the accompanying Consolidated Financial Statements follows:
Principles of Consolidation: The Consolidated Financial Statements include all controlled subsidiaries of the Company.Company, after elimination of all intercompany accounts and transactions. A noncontrolling interest in a subsidiary is considered an ownership interest in a controlled subsidiary that is not attributable to the Company. The Company includes noncontrolling interests as a component of Total equity in the Consolidated Balance Sheets and the Net earnings attributable to noncontrolling interests are presented as an adjustment from Net earnings used to arrive at Net earnings attributable to Allegion plc in the Consolidated Statements of Comprehensive Income.
Equity method affiliates represent unconsolidated entities over which the Company demonstrates significant influence but does not have a controlling financial interest. The Company is also required to consolidate variable interest entities in which it bears a majority of the risk to the entity’s potential losses or stands to gain from a majority of the entity’s expected returns.
Use of Estimates: The preparation of financial statements in conformity with GAAP requires management to make estimates and assumptions that affect the reported amounts of assets and liabilities and the disclosures of contingent assets and liabilities at the date of the financial statements, as well as the reported amounts of revenues and expenses during the reporting period. Estimates are based on several factors including the facts and circumstances available at the time the estimates are made, historical experience, risk of loss, general economic conditions and trends and the assessment of the probable future outcome. Some of the more significant estimates include useful lives of property, plant and equipment and intangible assets, purchase price allocations of acquired businesses, valuation of assets and liabilities including goodwill and other intangible assets, product warranties, sales allowances, pension plan benefits, postretirement benefits other than pensions,assets and liabilities related to defined benefit plans, taxes, lease related assets and liabilities, share-based compensation, environmental costs, and product liability and other contingencies. Actual results could differ from thosethe Company's estimates. Estimates and assumptions are reviewed periodically, and the effects of changes, if any, are reflected in the Consolidated Statements of Comprehensive Income in the period they are determined.
Currency Translation: Assets and liabilities where the functional currency is not the U.S. dollar have been translated at year-end exchange rates, and income and expense accounts have been translated using average exchange rates throughout the year. Adjustments resulting from the process of translating a subsidiary’s financial statements into the U.S. dollar are recorded to Accumulated other comprehensive loss.
Cash and Cash Equivalents: Cash and cash equivalents include cash on hand, demand deposits and all highly liquid investments with original maturities at the time of purchase of three months or less.
Allowance for Doubtful Accounts and Notes Receivable, Net: Receivables consist of billed receivables which are currently due from customers. The Company provides for an allowance for doubtful accounts and notes receivable, which represents the best estimate of expected lifetime credit losses inherent in the Company’s accounts and notes receivable portfolios. The Company's estimates are influenced by a continuing credit evaluation of customers' financial condition, trade accounts and notes receivable aging and historical loss experience, as well as reasonable and supportable forecasts of future economic conditions. The Company has reserved $6.2$14.0 million and $5.6$6.0 million for doubtful accounts and notes receivable as of December 31, 20202023 and 2019,2022, respectively.
Inventories: Inventories are stated at the lower of cost and net realizable value using the first-in, first-out (FIFO) method.
Property, Plant and Equipment: Property, plant and equipment are stated at cost, less accumulated depreciation. Assets placed in service are recorded at cost and depreciated using the straight-line method over the estimated useful life of the asset except for leasehold improvements, which are depreciated over the shorter of their economic useful life or their lease term. Repair and maintenance costs that do not extend the useful life of the asset are expensed as incurred. Major replacements and
significant improvements that increase asset values andand/or extend useful lives are capitalized. The range of useful lives used to depreciate property, plant and equipment is as follows:
| | | | | | | | | | | | | | |
| Buildings | 10 | to | 50 | years |
| Machinery and equipment | 2 | to | 12 | years |
| Software | 2 | to | 7 | years |
The Company assesses the recoverability of the carrying value of its property, plant and equipment whenever events or changes in circumstances indicate that the carrying amount of the asset may not be fully recoverable. Recoverability is measured by a comparison of the carrying amount of an asset to the future net undiscounted cash flows expected to be generated by the asset. If the undiscounted cash flows are less than the carrying amount of the asset, an impairment loss is recognized for the amount by which the carrying value of the asset exceeds its fair value.
Investments: The Company periodically invests in debt or equity securities of start-up companies and/or development stage technology or other companies without acquiring a controlling interest. The Company applies the equity method of accounting when the Company has the ability to exercise significant influence over the operating and financial decision making of the investee. Investments in equity method affiliates totaled $17.4$12.7 million and $18.2$11.8 million as of December 31, 20202023 and 2019,2022, respectively. Equity investments that have readily determinable fair values in which the Company does not have significant influence are measured at fair value, with any unrealized holding gains and losses being recorded to earnings. Investments without readily determinable fair values are measured at cost minus impairment, if any, plus or minus changes resulting from observable price changes in orderly transactions for the identical or similar investment of the same issuer and are qualitatively assessed for impairment indicators each reporting period. Investments in debt and equity securities not accounted for under the equity method of accounting totaled $13.7$65.8 million and $18.1$46.8 million as of December 31, 20202023 and 2019,2022, respectively. The Company's investments are principally recorded within Other noncurrent assets within the Consolidated Balance Sheets.
Leases: In accordance with ASC 842,As a lessee, the Company categorizes its leases into two general categories: real estate and equipment leases. The Company's real estate leases include leased production and assembly facilities, warehouses and distribution centers and office space, while the Company's equipment leases primarily include vehicles, material handling and other equipment utilized in the Company's production and assembly facilities, warehouses and distribution centers and laptops and other IT equipment. The Company records a right-of-use ("ROU") asset and lease liability for substantially all leases for which it is a lessee. In determining ifAt inception of a contract, represents a lease, consideration is given tothe Company considers all relevant facts and circumstances to assess whether or not the contract represents a lease by determining whether or not the contract conveys the right to control the use of an identified asset either explicit or implicit, for a period of time in exchange for consideration. Judgment and estimation is also required in determining the lease classification and the amount of the ROU asset and corresponding lease liability for each lease, which includes determining the appropriate lease term and an applicable discount rate. The Company assesses the specific terms and conditions of each lease to determine the appropriate classification as either an operating or finance lease. In determininglease and the appropriatelease term. Substantially all of the Company's leases for which the Company is a lessee are classified as operating leases. If at lease commencement date, a lease has a term of less than 12 months and does not include a purchase option that is reasonably certain to be exercised, the Company does not include the lease as part of its ROU asset or lease liability. If the Company enters into a large number of leases in the same month with the same terms and conditions, these are considered a group (portfolio). There are no material residual value guarantees provided by the Company nor any restrictions or covenants imposed by any leases to which the Company is a party.
The Company assesses the specific terms and conditions of each real estate lease, which can vary significantly from lease to lease, to determine the amount of the lease payments and the length of the lease term, bothwhich includes the minimum period over which lease payments are required plus any renewal options that are both within the Company's control to exercise and reasonably certain of being exercised as ofupon lease commencement are considered.commencement. When available, the Company will utilize the rate implicit in the lease is utilized as the discount rate to determine the lease liability. Ifliability; however, as this rate is unavailable,not available for most leases, the Company utilizeswill use its incremental borrowing rate for debt instruments with terms approximating the weighted-average term of its real estate or equipment leases to discount the future lease payments over the lease term to present value. The Company incurs variable lease payments for certain of its real estate leases, such as reimbursements of property taxes, maintenance and other operational costs to the discount rate, which is the rate at inceptionlessor. In general, these variable lease payments are not captured as part of the lease that would hypothetically be incurred to borrow over a similar term the funds needed to purchase the leased asset. Refer to Note 11for further details onliability or ROU asset, but rather are expensed as incurred. Most of the Company's equipment leases are for terms ranging from two to five years, although terms and conditions can vary from lease accounting policies.to lease. The Company applies similar estimates and judgments to its equipment lease portfolio in determining the lease payments, lease term and incremental borrowing rate as it does to its real estate lease portfolio. The Company does not typically incur variable lease payments related to its equipment leases.
Goodwill and Intangible Assets:Goodwill: The Company records goodwill as goodwill the excess of the purchase price of an acquired business over the fair value of the net assets acquired. Once the final valuation has been performed for each acquisition, adjustments may be recorded. In accordance with ASC 350, "Intangibles—Goodwill and Other", goodwill and other indefinite-lived intangible assets areis tested and reviewed annually for impairment during the fourth quarter or whenever there is a significant change in events or circumstances that indicate the fair value of a reporting unit or indefinite-lived intangible asset is more likely than not less than theits carrying amount of the asset.
amount. Recoverability of goodwill is measured at the reporting unit level. The carrying amount of a reporting unit is compared to its estimated fair value. If the estimated fair value of a reporting unit exceeds it'sits carrying amount, goodwill of the reporting unit is not impaired. To the extent that the carrying value of the reporting unit exceeds its estimated fair value, a goodwill impairment
charge will be recognized for the amount by which the carrying value of the reporting unit exceeds its fair value, not to exceed the carrying amount of the reporting unit's goodwill. Estimated fair value of the Company's reporting units is based on two valuation techniques, a discounted cash flow model (income approach) and a market multiple of earnings (market approach), with each method being weighted in the calculation.
AsSimilar to Goodwill, indefinite-lived intangible assets are not amortized, but are tested and reviewed annually for impairment during the fourth quarter or whenever there is a result of the global economic disruption and uncertainty due to the novel coronavirus ("COVID-19") pandemic, the Company concluded a triggering event had occurred as of March 31, 2020, and accordingly, performed interim impairment tests on the goodwill balances of its EMEA and Asia Pacific reporting units. Given the high degree of market volatility and lack of reliable market data that existed as of March 31, 2020, the Company determined a discounted cash flow model (income approach) provided the best approximation of fair value of these reporting units for the purpose of performing these interim tests. This was asignificant change in estimate, as historicallyevents or circumstances that indicate the determination of reporting unit fair values has been estimated based on both an income and a market approach, as discussed above, with each method being weighted in the calculation. As markets stabilized throughout the year, the Company reverted to utilizing both an income and market approach while performingasset is more likely than not less than its annual impairment test in the fourth quarter.
carrying amount. Recoverability of otherindefinite-lived intangible assets with indefinite useful lives (i.e. Trade names) is determined on a relief from royalty methodology, which is based on the implied royalty paid, at an appropriate discount rate, to license the use of an asset rather than owning the asset. The present value of the after-tax cost savings (i.e. royalty relief) indicates the estimated fair value of the asset. Any excess of the carrying value over the estimated fair value is recognized as an impairment loss equal to that excess.
Intangible assets such as completed technologies, patents, customer-related intangible assets and other intangible assets with finite useful lives are amortized on a straight-line basis over their estimated economic lives. The weighted-average useful lives approximate the following:
| | | | | | | | |
| Customer relationships | 20 | years |
| Trade names (finite-lived) | 2515 | years |
| Completed technologies/patents | 10 | years |
| Other | 75 | years |
Recoverability of intangible assets with finite useful lives is assessed in the same manner as property, plant and equipment, as described above.
Income Taxes: The calculation of the Company’s income taxes involves considerable judgment and the use of both estimates and allocations. Deferred tax assets and liabilities are determined based on temporary differences between financial reporting and tax bases of assets and liabilities, applying enacted tax rates expected to be in effect for the year in which the differences are expected to reverse. The Company recognizes future tax benefits, such as net operating losses and tax credits, to the extent that realizing these benefits is considered in its judgment to be more likely than not. The Company regularly reviews the recoverability of its deferred tax assets considering its historic profitability, projected future taxable income, timing of the reversals of existing temporary differences and the feasibility of its tax planning strategies. Where appropriate, the Company records a valuation allowance with respect to future tax benefits.
Cash paid for income taxes, net of refunds, for the twelve monthsyears ended December 31, 20202023, 2022 and 20192021 was $82.6$157.9 million, $81.7 million and $103.0$89.1 million, respectively.
Product Warranties: The Company offers a standard warranty with most product sales, and the value of such warranty is included in the contractual sales price. Standard product warranty accruals are recorded at the time of sale and are estimated based upon product warranty terms and historical experience. The Company regularly assesses the adequacy of its liabilities and makes adjustments as necessary based on known or anticipated warranty claims, or as new information becomes available. Refer to Note 21 for further details regarding product warranties.
Revenue Recognition: Net revenues are recognized based on the satisfaction of performance obligations under the terms of a contract. A performance obligation is a promise in a contract to transfer control of a distinct product or to provide a service, or a bundle of products or services, to a customer. The Company has two principal revenue streams, tangible product sales and services. Approximately 99% of consolidated Net revenuesProduct sales involve contracts with a single performance obligation, the transfer of control of a product or bundle of products to a customer. TheTransfer of control typically occurs when goods are shipped from the Company's remaining facilities or at other predetermined control transfer points (for instance, destination terms). Service offerings include inspection, maintenance and repair, aftermarket, design and installation and locksmith services, as well as software as a service ("SaaS") solutions. Unlike the single performance obligation to ship a product or bundle of products, revenue related to services is recognized when the service based performance obligations are satisfied. In some instances, customer acceptance provisions are included in sales
arrangements to give the buyer the ability to ensure the service meets any established criteria. In these instances, revenue recognition is deferred until the performance obligations are satisfied, which could include acceptance terms specified in the arrangement being fulfilled through customer acceptance or a demonstration that established criteria have been satisfied.
Net revenues involveare measured as the amount of consideration expected to be received in exchange for transferring control of the products or providing the services and takes into account variable consideration, such as sales incentive programs including installationdiscounts and consulting. See Note 20 for additional information regardingvolume rebates. The existence of these programs does not preclude revenue recognition but does require the Company's revenue recognition policies.
best estimate of the variable consideration to be made based on expected activity, as these items are reserved for as a deduction to Net revenues based on the Company's historical rates of providing these incentives and annual forecasted sales volumes. Sales returns and customer disputes involving a question of quantity or price are accounted for as variable consideration, and therefore, as a reduction to Net revenues and as a contra receivable. At December 31, 20202023 and 2019,2022, the Company had a reserve for customer claim accrual (contra receivable)claims of $48.6$52.8 million and $36.5$43.5 million, respectively. All other incentives or incentive programs where the customer is required to reach a certain level of purchases, remain a customer for a certain period, provide a rebate form or is subject to additional requirements are also considered variable consideration and are accounted for as a reduction of revenue and a liability. At December 31, 20202023 and 2019,2022, the Company had a sales incentive accrual of $35.0$55.7 million and $37.2$60.4 million, respectively. Variable consideration is estimated based on the most likely amount expected to be
received from customers. Each of these accruals represents the Company’s best estimate of the most likely amount expected to be received from customers based on historical experience. These estimates are reviewed regularly for accuracy, and if updated information or actual amounts are different from previous estimates, the revisions are included in the Company’s results for the period in which they become known. Historically,
As a practical expedient allowed under ASC 606, "Revenue from Contracts with Customers", the aggregate differences,Company recognizes incremental costs of obtaining a contract, if any, betweenas an expense when incurred if the Company’s estimates and actual amounts in anyamortization period of the asset would have been one year have not had a material impact on the Consolidated Financial Statements.or less. The Company also offersapplies the practical expedients to omit the disclosure of remaining performance obligations for contracts with an original expected duration of one year or less and for contracts where the Company has the right to invoice for performance completed to date. The transaction price is not adjusted for the effects of a standard warranty with most product sales,significant financing component, as the time period between control transfer of goods and services is less than one year. Sales, value-added and other similar taxes collected by the valueCompany are excluded from Net revenues. The Company has also elected to account for shipping and handling activities that occur after control of such warranty isthe related goods transfers as fulfillment activities instead of performance obligations. These activities are included in Cost of goods sold in the contractual price.Consolidated Statements of Comprehensive Income. The corresponding cost ofCompany’s payment terms are generally consistent with the warranty obligation is accrued as a liability.
Environmental Costs: The Company is subject to laws and regulations relating to protecting the environment. environment and is dedicated to an environmental program to reduce the utilization and generation of hazardous materials during the manufacturing process and to remediate identified environmental concerns. The Company is currently engaged in site investigations and remediation activities to address environmental cleanup from past operations at current and former production facilities. The Company is also sometimes a party to environmental lawsuits and claims and has, from time to time, received notices of potential violations of environmental laws and regulations from the U.S. Environmental Protection Agency and similar state authorities. It has also been identified as a potentially responsible party ("PRP") for cleanup costs associated with off-site waste disposal at federal Superfund and state remediation sites for past operations. For all such sites, there are other PRPs and, in most instances, the Company’s involvement is minimal. In estimating its liability, the Company has assumed it will not bear the entire cost of remediation of any site to the exclusion of other PRPs who may be jointly and severally liable. The ability of other PRPs to participate has been taken into account, based on the Company's understanding of the parties’ financial condition and probable contributions on a per site basis. The Company regularly evaluates its remediation programs and considers alternative remediation methods that are in addition to, or in replacement of, those currently utilized by the Company based upon enhanced technology and regulatory changes.
Environmental expenditures relating to current operations are expensed or capitalized as appropriate. Expenditures relating to existing conditions caused by past operations, which do not contribute to current or future revenues, are expensed. Liabilities for remediation costs are recorded when they are probable and can be reasonably estimated, generally no later than the completion of feasibility studies or the Company’s commitment to a plan of action. The assessment of this liability, which is calculated based on existing technology, does not reflect any offset for possible recoveries from insurance companies and is not discounted. Refer to Note 21 for further details related to environmental matters.
Research and Development Costs: The Company conducts research and development activities for the purpose of developing and improving new products and services. These costs are expensed when incurred. For the years ended December 31, 2020, 20192023, 2022 and 2018,2021, expenses related to research and development activities amounted to approximately $54.4$101.9 million, $54.7$74.5 million and $54.4$73.3 million, respectively, and primarily consistconsisted of salaries, wages, benefits, facility costs and other overhead expenses.
Defined Benefit PlansPlans:: The Company provides a range of U.S. and non-U.S. defined benefits, including pension, postretirement and postemploymentbenefit plan benefits to eligible current and former employees. Noncontributory defined benefit pension plans covering non-collectively bargained U.S. employees provide benefits based on an average pay formula while most plans for collectively bargained U.S. employees provide benefits based on a flat dollar benefit formula. The non-U.S. defined benefit plans generally provide benefits based on earnings and
years of service. Determining the costs associated with such benefits is dependent on various actuarial assumptions, including discount rates, expected returnreturns on plan assets, compensation increases, employee mortality and turnover rates. Actuaries performActuarial valuations are performed to determine the required calculations to determineplan obligations and expense in accordance with GAAP. Actual results may differ from the actuarial estimates and assumptions, and when they do, are generally recorded to Accumulated other comprehensive loss and amortized into Net earnings over future periods.
The Company reviews its actuarial assumptions at each measurement date and makes modifications to the assumptions as appropriate. ReferDiscount rates are generally established using hypothetical yield curves based on the yields of corporate bonds rated AA quality. Spot rates are developed from the yield curve and used to Note 12discount future benefit payments. The expected return on plan assets reflects the average rate of returns expected on the funds invested or to be invested to provide for further detailsthe benefits included in the projected benefit obligation. The expected return on employee benefit plans.plan assets is based on what is achievable given the plan’s investment policy, the types of assets held and the target asset allocation.
Loss Contingencies: Liabilities are recorded for various contingencies arising in the normal course of business, including litigation and administrative proceedings, environmental matters, product liabilities, product warranties, worker’sworkers' compensation and other claims. The Company has recorded reserves in the financial statements related to these matters, which are developed using inputs derived from actuarial estimates and historical and anticipated experience data, depending on the nature of the reserve and, in certain instances, with consultation of legal counsel, internal and external consultants and engineers. SubjectAmounts recorded for identified contingent liabilities are estimates, which are reviewed periodically and adjusted to reflect additional information when it becomes available.
Financial Instruments: The Company uses various financial instruments, including derivative instruments, to manage the uncertainties inherent in estimating future costsrisks associated with interest and currency rate exposures. These financial instruments are not used for these types of liabilities,trading or speculative purposes. When a derivative contract is entered into, the Company believesdesignates the derivative instrument as a cash flow hedge of a forecasted transaction, a cash flow hedge of a recognized asset or liability or as an undesignated derivative. The Company formally documents its estimated reserves are reasonable and does not believe the final determinationhedge relationships, including identification of the derivative instruments and the hedged items, as well as its risk management objectives and strategies for undertaking the hedge transaction. This process includes linking derivative instruments that are designated as hedges to specific assets, liabilities with respect to these matters would have a material effect onor forecasted transactions.
The Company assesses at inception and at least quarterly thereafter, whether the financial condition, results of operations, liquidity orderivatives used in cash flow hedging transactions are effective in offsetting the changes in the cash flows of the Company for any year. Referhedged item. To the extent the derivative is deemed to Note 21for further details relatedbe an effective hedge, the fair market value changes of the instrument are recorded to Accumulated other comprehensive loss contingencies.
Derivative Instruments: The Company periodically enters into cash flow and other derivative transactionssubsequently reclassified to specificallyNet earnings when the hedged transaction affects earnings. Changes in the fair market value of derivatives not deemed to be an effective hedge exposure to various risks related to currency and variable interest rates.are recorded in Net earnings in the period of change. The Company recognizes all derivativesderivative instruments on the Consolidated Balance Sheets at their fair value, as either assets or liabilities. For designated cash flow hedges, the changes in fair valuewhich is determined through market-based valuations and may not be representative of the derivative contract isactual gains or losses that will be recorded when these instruments mature due to Accumulated other comprehensive loss and reclassified into Net earnings at the time earnings are affected by the hedged transaction. For undesignated derivative transactions, the changesfuture fluctuations in the fair value ofmarkets in which they are traded. If the hedging relationship ceases to be effective subsequent to inception, or it becomes probable that a forecasted transaction will no longer occur, the hedging relationship will be undesignated, and any future gains or losses on the derivative contract are immediately recognizedinstrument will be recorded in Net earnings. Refer to Note 10 for further details regarding derivative instruments.
Recent Accounting Pronouncements
Recently Adopted Accounting Pronouncements:
In June 2016,November 2023, the FASB issued ASU 2016-13, "Financial Instruments—Credit LossesAccounting Standards Update No. 2023-07, "Segment Reporting (Topic 326)280): Measurement of Credit Losses on Financial Instruments." The newImprovements to Reportable Segment Disclosures" (ASU 2023-07), which expands annual and interim disclosure requirements for reportable segments, primarily through enhanced disclosures about significant segment expenses. This guidance within ASU 2016-13, along with related updates (collectively "ASC 326") introduces an approach based on expected losses to estimate credit losses on certain types of financial instruments. The new guidance becamewill be effective for the annual periods beginning afterthe year ended December 15, 2019,31, 2024, and for interim periods within those annual periods. Accordingly, the Company adopted ASC 326 onbeginning January 1, 2020, using the modified retrospective transition method through a $2.2 million cumulative-effect decrease to retained earnings.2025. Early adoption is permitted. The Company has also made updatesis currently evaluating the impact that the updated standard will have on the Consolidated Financial Statements and related disclosures.
In December 2023, the FASB issued Accounting Standards Update No. 2023-09, “Income Taxes (Topic 740): Improvements to its policiesIncome Tax Disclosures” (“ASU 2023-09”), which modifies the rules on income tax disclosures to require entities to disclose (1) specific categories in the rate reconciliation, (2) the income or loss from continuing operations before income tax expense or benefit (separated between domestic and internal controls over financial reporting as a result of adoption.foreign) and (3) income tax expense or benefit from continuing operations (separated
In August 2018, the FASB issued ASU 2018-15, "Intangibles—Goodwillby federal, state and Other—Internal-Use Software (Subtopic 350-40): Customer’s Accounting for Implementation Costs Incurred in a Cloud Computing Arrangement That Is a Service Contract." The new guidance aligns the requirements for capitalizing implementation costs incurred in a cloud-based hosting arrangement that is a service contract with the requirements for capitalizing implementation costs incurred to develop or obtain internal-use software (and hosting arrangements that include an internal-use software license)foreign). ASU 2018-15 became2023-09 also requires entities to disclose their income tax payments to international, federal, state and local jurisdictions, among other changes. This guidance will be effective for the annual periods beginning afterthe year ended December 15, 2019, and interim periods within those31, 2025. Early adoption is permitted for annual periods. Accordingly,financial statements that have not yet been issued or made available for issuance. ASU 2023-09 should be applied on a prospective basis, but retrospective application is permitted. As the Companyguidance requires only additional disclosure, there will be no effects of this standard on the financial position, results of operations or cash flows.
There have been no other recent accounting pronouncements, changes in accounting pronouncements or recently adopted ASU 2018-15 on January 1, 2020, using the prospective method of adoption, and the adoption did notaccounting guidance that have had or are expected to have a material impact to the Consolidated Financial Statements.
Recently Issued Accounting Pronouncements:
In December 2019, the FASB issued ASU 2019-12, "Income Taxes (Topic 740): Simplifying the Accounting for Income Taxes." The new guidance is intended to simplify the accounting for income taxes by removing certain exceptions and by updating accounting requirements around franchise taxes, goodwill recognized for tax purposes, the allocation of current and deferred tax expense among legal entities, among other minor changes. The ASU is effective for fiscal years beginning after December 15, 2020, including interim periods within those fiscal years. Early adoption is permitted. The Company adopted ASU 2019-12 on January 1, 2021, and the adoption did not have a material impact to the Consolidated Financial Statements.
In January 2020, the FASB issued ASU 2020-01, "Investments—Equity Securities (Topic 321), Investments—Equity Method and Joint Ventures (Topic 323), and Derivatives and Hedging (Topic 815): Clarifying the Interactions between Topic 321, Topic 323, and Topic 815." The amendments in ASU 2020-01 clarify the interaction of the accounting for equity securities under Topic 321 and investments accounted for under the equity method of accounting. The ASU is effective for fiscal years beginning after December 15, 2020, including interim periods within those fiscal years. Early adoption is permitted. The Company adopted ASU 2020-01 on January 1, 2021, and the adoption did not have a material impact to the Consolidated Financial Statements.
In March 2020, the FASB issued ASU 2020-04, "Reference Rate Reform (Topic 848): Facilitation of the Effects of Reference Rate Reform on Financial Reporting." This ASU, along with related updates, provides temporary optional expedients and exceptions for applying GAAP to contract modifications, hedging relationships and other transactions if certain criteria are met in order to ease the potential accounting and financial reporting burden associated with the expected market transition away from the London Interbank Offered Rate (LIBOR) and other interbank offered rates to alternative reference rates. The ASU is currently effective and may be applied prospectively at any point through December 31, 2022 at the Company’s option. The Company is assessing what impact ASU 2020-04 will have on the Consolidated Financial Statements.
NOTE 3 – INVENTORIES- ACQUISITIONS
On January 3, 2023, the Company, through its subsidiaries, completed an acquisition of plano. group ("plano"), a SaaS workforce management solution business based in Germany, for $36.6 million, net of cash acquired. The acquisition was accounted for as a business combination and the financial results of plano have been included in the Company's Consolidated Financial Statements since the date of the acquisition. Plano has been integrated into the Allegion International segment.
The allocation of the purchase price, which includes initial cash consideration and the estimated fair value of contingent consideration, to assets acquired and liabilities assumed as of the acquisition date includes $16.0 million of finite-lived intangible assets, $23.0 million of goodwill and $2.4 million of net liabilities assumed. The finite-lived intangible assets have a weighted average useful life of approximately 15 years.
On July 5, 2022, the Company, through its subsidiaries, completed the acquisition of Stanley Access Technologies LLC and assets related to the automatic entrance solutions business from Stanley Black & Decker, Inc. (the "Access Technologies business"). The total consideration paid for the acquisition was $915.2 million, and the acquisition was accounted for as a business combination.
The Access Technologies business is a leading manufacturer, installer and service provider of automatic entrance solutions in North America, primarily in the U.S. and Canada. Its diversified customer base centers on non-residential settings, including retail, healthcare, education, commercial offices, hospitality and government. This acquisition helps the Company create a more comprehensive portfolio of access solutions with the addition of automated entrances. Additionally, the Access Technologies business adds an expansive service and support network throughout the U.S. and Canada, broadening the Company's solutions to national, regional and local customers and complementing the Company's existing strengths in these non-residential markets. The Access Technologies business has been integrated into the Allegion Americas segment.
The following table summarizes the allocation of the purchase price to assets acquired and liabilities assumed as of the acquisition date:
| | | | | |
| In millions | |
| Accounts receivable, net | $ | 69.7 | |
| Inventories | 50.8 | |
| Other current assets | 0.4 | |
| Property, plant and equipment | 14.6 | |
| Goodwill | 628.2 | |
| Intangible assets | 222.5 | |
| Other noncurrent assets | 13.7 | |
| Accounts payable | (21.3) | |
| Accrued expenses and other current liabilities | (36.2) | |
| Other noncurrent liabilities | (27.2) | |
| Total net assets acquired and liabilities assumed | $ | 915.2 | |
Intangible assets recognized as of the acquisition date were comprised of the following:
| | | | | | | | | | | | | | |
| | Value (in millions) | | Useful life (in years) |
| Completed technologies/patents | | $ | 6.2 | | | 5 |
| Customer relationships | | 137.4 | | | 23 |
| Trade names (finite-lived) | | 56.8 | | | 5 |
| Backlog revenue | | 22.1 | | | 2 |
Goodwill results from several factors, including Allegion-specific synergies that were excluded from the cash flow projections used in the valuation of intangible assets and intangible assets that do not qualify for separate recognition, such as an assembled workforce. Goodwill resulting from this acquisition is deductible for tax purposes.
During the years ended December 31, 2023, 2022 and 2021, the Company incurred $21.0 million, $30.5 million and $4.4 million, respectively, of acquisition and integration related expenses, which are included in Selling and administrative expenses in the Consolidated Statements of Comprehensive Income.
Inventories are stated at the lower of cost and net realizable value using the first-in, first-out (FIFO) method.
At December 31, the major classes of Inventories were as follows:
| | In millions | In millions | | 2020 | | 2019 | In millions | | 2023 | | 2022 |
| Raw materials | Raw materials | | $ | 114.0 | | | $ | 116.8 | |
| Work-in-process | Work-in-process | | 42.3 | | | 33.1 | |
| Finished goods | Finished goods | | 126.8 | | | 120.0 | |
| Total | Total | | $ | 283.1 | | | $ | 269.9 | |
NOTE 45 – PROPERTY, PLANT AND EQUIPMENT
At December 31, the major classes of property, plant and equipment were as follows:
| | In millions | In millions | | 2020 | | 2019 | In millions | | 2023 | | 2022 |
| Land | Land | | $ | 17.2 | | | $ | 16.6 | |
| Buildings | Buildings | | 179.8 | | | 154.8 | |
| Machinery and equipment | Machinery and equipment | | 455.2 | | | 417.1 | |
| Software | Software | | 157.7 | | | 155.0 | |
| Construction in progress | Construction in progress | | 20.2 | | | 42.5 | |
| Total property, plant and equipment | Total property, plant and equipment | | 830.1 | | | 786.0 | |
| Accumulated depreciation | Accumulated depreciation | | (535.2) | | | (494.6) | |
| Property, plant and equipment, net | Property, plant and equipment, net | | $ | 294.9 | | | $ | 291.4 | |
Depreciation expense for the years ended December 31, 2020, 20192023, 2022 and 2018,2021, was $46.5$47.3 million, $47.1$45.7 million and $46.2$45.2 million, which includes amounts for software amortizationdepreciation of $13.5$12.9 million, $14.5$12.3 million and $15.4$11.5 million, respectively.
NOTE 56 – GOODWILL
The changes in the carrying amount of Goodwill were as follows:
| | | | | | | | | | | | | | | | | | | | | | | | | | |
| In millions | | Americas | | EMEA | | Asia Pacific | | Total |
| December 31, 2018 (gross) | | $ | 486.1 | | | $ | 767.1 | | | $ | 115.3 | | | $ | 1,368.5 | |
| Accumulated impairment | | 0 | | | (478.6) | | | (6.9) | | | (485.5) | |
| December 31, 2018 (net) | | 486.1 | | | 288.5 | | | 108.4 | | | 883.0 | |
Acquisitions and adjustments (a) | | (1.3) | | | 2.7 | | | (4.4) | | | (3.0) | |
| | | | | | | | |
| Currency translation | | 0.2 | | | (5.7) | | | (1.2) | | | (6.7) | |
| December 31, 2019 (net) | | 485.0 | | | 285.5 | | | 102.8 | | | 873.3 | |
| Acquisitions | | 16.1 | | | 0 | | | 0 | | | 16.1 | |
| Impairment charge | | 0 | | | 0 | | | (88.1) | | | (88.1) | |
| Currency translation | | 0 | | | 24.4 | | | (6.7) | | | 17.7 | |
| December 31, 2020 (net) | | $ | 501.1 | | | $ | 309.9 | | | $ | 8.0 | | | $ | 819.0 | |
| | | | | | | | | | | | | | | | | |
| In millions | Allegion Americas | | Allegion International | | Total |
| December 31, 2021 (gross) | $ | 501.2 | | | $ | 876.2 | | | $ | 1,377.4 | |
| Accumulated impairment | — | | | (573.6) | | | (573.6) | |
| December 31, 2021 (net) | 501.2 | | | 302.6 | | | 803.8 | |
| Acquisitions and adjustments | 631.5 | | | — | | | 631.5 | |
| | | | | |
| Currency translation | (4.6) | | | (17.6) | | | (22.2) | |
| December 31, 2022 (net) | 1,128.1 | | | 285.0 | | | 1,413.1 | |
| Acquisitions and adjustments | (3.7) | | | 23.0 | | | 19.3 | |
| | | | | |
| Currency translation | 2.3 | | | 8.4 | | | 10.7 | |
| December 31, 2023 (net) | $ | 1,126.7 | | | $ | 316.4 | | | $ | 1,443.1 | |
(a) In 2019,There was no impairment of goodwill for the Company made reclassificationsyears ended December 31, 2023, 2022 and 2021. Accumulated impairments were recorded prior to goodwill across all segments related to a change in how revenue is managed for a specific immaterial product line where revenue previously managed in the Asia Pacific segment is now being managed in the Americas and EMEA segments.2021.
As a result of the global economic disruption and uncertainty due to the COVID-19 pandemic, the Company concluded a triggering event had occurred as of March 31, 2020, and accordingly, performed interim impairment tests on the goodwill balances of its EMEA and Asia Pacific reporting units. As quoted market prices were not available for these reporting units, and given the high degree of market volatility and lack of reliable market data that existed as of March 31, 2020, the Company determined that a discounted cash flow model (income approach) provided the best approximation of fair value of its EMEA and Asia Pacific reporting units for the purpose of performing these interim tests. This approach relied on numerous assumptions and judgments that were subject to various risks and uncertainties. Principal assumptions utilized, all of which are considered Level 3 inputs under the fair value hierarchy (see Note 13), included the Company’s estimates of future revenue and terminal growth rates, margin assumptions and discount rates to estimate future cash flows. The calculations explicitly addressed factors such as timing, with due consideration given to forecasting risk. While assumptions utilized were subject to a high degree of judgment and complexity, the Company made every effort to estimate future cash flows as accurately as possible, given the high degree of economic uncertainty that existed as of March 31, 2020. The results of the interim impairment testing indicated that the estimated fair value of the Asia Pacific reporting unit was less than its carrying value. Consequently, a goodwill impairment charge was recorded for the Asia Pacific reporting unit, as reflected in the table above. As markets stabilized throughout the year, the Company reverted to utilizing both an income and market approach while performing its annual impairment test in the fourth quarter, which resulted in no further impairment charges.
NOTE 67 – INTANGIBLE ASSETS
The following table sets forthAt December 31, the gross amount of the Company's intangible assets and related accumulated amortization of the Company’s intangible assets at December 31:were as follows:
| | 2020 | | 2019 |
| | 2023 | | | | 2023 | | 2022 |
| In millions | In millions | | Gross carrying amount | | Accumulated amortization | | Net carrying amount | | Gross carrying amount | | Accumulated amortization | | Net carrying amount | In millions | | Gross carrying amount | | Accumulated amortization | | Net carrying amount | | Gross carrying amount | | Accumulated amortization | | Net carrying amount |
| Completed technologies/patents | Completed technologies/patents | | $ | 59.9 | | | $ | (25.1) | | | $ | 34.8 | | | $ | 59.3 | | | $ | (19.2) | | | $ | 40.1 | |
| Customer relationships | Customer relationships | | 415.5 | | | (130.2) | | | 285.3 | | | 412.7 | | | (107.5) | | | 305.2 | |
| Trade names (finite-lived) | Trade names (finite-lived) | | 90.2 | | | (57.4) | | | 32.8 | | | 82.5 | | | (49.4) | | | 33.1 | |
| Other | Other | | 27.0 | | | (11.1) | | | 15.9 | | | 17.6 | | | (8.1) | | | 9.5 | |
| Total finite-lived intangible assets | Total finite-lived intangible assets | | 592.6 | | | $ | (223.8) | | | 368.8 | | | 572.1 | | | $ | (184.2) | | | 387.9 | |
| Trade names (indefinite-lived) | Trade names (indefinite-lived) | | 118.3 | | | 118.3 | | | 123.0 | | | 123.0 | |
| Total | Total | | $ | 710.9 | | | $ | 487.1 | | | $ | 695.1 | | | $ | 510.9 | |
The Company amortizes finite-lived intangible assets on a straight-line basis over their estimated economic lives in accordance with GAAP. Indefinite-lived intangible assets are not subject to amortization, but instead are tested for impairment at least annually (more frequently if certain indicators are present). Intangible asset amortization expense for the years ended 2020, 2019December 31, 2023, 2022 and 2018,2021, was $31.5$61.7 million, $31.2$49.4 million and $36.3$34.0 million, respectively. Intangible asset amortization expense for 2018 included the amortization of approximately $6 million of backlog revenue that was acquired during an acquisition.
Future estimated amortization expense on existing intangible assets in each of the next five years amounts to approximately $28.5 million for 2021, $28.5 million for 2022, $28.4 million for 2023, $28.3$55.7 million for 2024, and $27.4$49.9 million for 2025.2025, $46.7 million for 2026, $39.8 million for 2027 and $31.5 million for 2028.
In accordance with the Company’s indefinite-lived intangible asset impairment testing policy, the Company performs its annual impairment test in the fourth quarter of each year or whenever there is a significant change in events or circumstances that indicate the fair value of an indefinite-lived intangible asset is more likely than not less than its carrying amount. As a result of the global economic disruption and uncertainty due to the COVID-19 pandemic, the Company concluded a triggering event had occurred as of March 31, 2020, and accordingly, performed interim impairment testing on certain indefinite-lived trade names. Based on these tests, it was determined that three of the Company's indefinite-lived trade names in the EMEA and Asia Pacific segments were impaired, and impairment charges of $8.2 million were recorded. Further intangible asset impairment charges were recorded in the Asia Pacific segment during the year ended December 31, 2020, including $2.6 million relating to supply chain disruptions, which reduced a brand's expected future cash flows, and $2.8 million related to declines in volumes and pricing pressure for a separate subsidiary in the region.
During the 2019 annual impairment testing, it was determined that two of the Company's indefinite-lived trade names in the International segment were impaired, resultingand an impairment charge of $7.5 million was recorded for the year ended December 31, 2023. The impairment related to declines in volumes which reduced the brands' expected future cash flows. Intangible asset impairment charges totaling $5.9 million.are included in Impairment of intangible assets in the Consolidated Statements of Comprehensive Income. No intangible asset impairment charges were recorded in 2018.
NOTE 7 - ACQUISITIONS
In December 2020, the Company acquired the remaining interesteither of Yonomi, Inc. ("Yonomi), a U.S. based smart home integration platform provider and innovation leader in IoT Cloud platforms, through one of its subsidiaries. Prior to acquisition, the Company held a noncontrolling interest in Yonomi that was considered an equity method investment. This acquisition has been accounted for as a business combination and did not have a material impact on the Consolidated Financial Statements. Yonomi has been integrated into the Americas segment.
In 2018, the Company completed six acquisitions:
| | | | | | | | |
Business | | Date |
Technical Glass Products, Inc. ("TGP") | | January 2018 |
Hammond Enterprises, Inc. ("Hammond") | | January 2018 |
Qatar Metal Industries LLC ("QMI") | | February 2018 |
AD Systems, Inc. ("AD Systems") | | March 2018 |
Gainsborough Hardware and API Locksmiths ("Door and Access Systems") | | July 2018 |
ISONAS Security Systems, Inc. ("ISONAS") | | July 2018 |
Total cash paid for the acquisitions completed in 2018 was approximately $373 million (net of cash acquired), including $4.6 million during the year ended December 31, 2019. These acquisitions were accounted for as business combinations.
During the years ended December 31, 2020, 2019 and 2018, the Company incurred $2.3 million, $2.0 million and $10.0 million, respectively, of acquisition and integration related expenses, which are included in Selling and administrative expenses in the Consolidated Statement of Comprehensive Income.2022 or 2021.
NOTE 8 - DIVESTITURES
In September 2022, the Company sold Milre Systek Co. Ltd. ("Milre") in South Korea for an immaterial amount. As of December 31, 2020, the net assetsa result of the Company's QMI business, which primarily included working capital and long-lived assets, met the criteria to be classified as held for sale, and accordingly, were written down to fair value, which was estimated based on expected sales proceeds, less cost to sell, in accordance with ASC 360. This remeasurement was based on inputs considered to be Level 3 inputs under the fair value hierarchy (see Note 13) and resulted in a Loss on assets held for sale of $37.9 million. As the expected sales proceeds, less cost to sell, were nominal, no goodwill was allocated to the Assets held for sale, and the goodwill attributable to the 2018 acquisition of QMI remains in the EMEA reporting unit as of December 31, 2020.
In 2019, the Company closed its production facility in Turkey and sold certain of the production assets thereof, which collectively met the definition of a business under ASC 805. Total proceeds from the sale were approximately $4.1 million, and the Company recorded a lossLoss on divestiture of $24.2 million ($25.5 million, net of tax), primarily driven by the reclassification of $25.0 million of accumulated foreign currency translation adjustments to earnings upon sale. The Company also sold its interests in its Colombia operations in 2019 for a nominal amount, recording a net loss on divestiture of $5.9$7.6 million, of which $1.2$1.6 million relatesrelated to the reclassification of accumulated foreign currency translation adjustments to earnings upon sale. These losses are included within Loss on divestitures in the Consolidated Statements of Comprehensive Income.
NOTE 9 – DEBT AND CREDIT FACILITIES
At December 31, long-term debt and other borrowings consisted of the following:
| | In millions | In millions | 2020 | | 2019 | In millions | 2023 | | 2022 |
| Term Facility | $ | 238.8 | | | $ | 238.8 | |
| Revolving Facility | 0 | | | 0 | |
| 2021 Term Facility | |
| 2021 Revolving Facility | |
| 3.200% Senior Notes due 2024 | 3.200% Senior Notes due 2024 | 400.0 | | | 400.0 | |
| 3.550% Senior Notes due 2027 | 3.550% Senior Notes due 2027 | 400.0 | | | 400.0 | |
| 3.500% Senior Notes due 2029 | 3.500% Senior Notes due 2029 | 400.0 | | | 400.0 | |
| 5.411% Senior Notes due 2032 | |
| Other debt | Other debt | 0.6 | | | 0.7 | |
| Total borrowings outstanding | Total borrowings outstanding | 1,439.4 | | | 1,439.5 | |
| Less discounts and debt issuance costs, net | (9.8) | | | (11.8) | |
| Discounts and debt issuance costs, net | |
| Total debt | Total debt | 1,429.6 | | | 1,427.7 | |
| Less current portion of long-term debt | Less current portion of long-term debt | 0.2 | | | 0.1 | |
| Total long-term debt | Total long-term debt | $ | 1,429.4 | | | $ | 1,427.6 | |
Unsecured Credit Facilities
As of December 31, 2020,2023, the Company has an unsecured Credit Agreement in place, consisting of a $700.0$250.0 million term loan facility (the “Term“2021 Term Facility”), of which $238.8 million is outstanding at December 31, 2020, and a $500.0 million revolving credit facility (the “Revolving“2021 Revolving Facility” and, together with the 2021 Term Facility, the “Credit“2021 Credit Facilities”). TheBorrowings under the 2021 Credit Facilities mature on September 12, 2022,November 18, 2026, and are unconditionally guaranteed jointly and severally on an unsecured basis by the CompanyAllegion plc and Allegion US Holding Company Inc. ("Allegion US Hold Co"), the Company's wholly-owned subsidiary.
At inception, the The 2021 Term Facility was scheduled to amortizeamortizes in quarterly installments at the following rates: 1.25% per quarter starting December 31, 2017 through December 31, 2020, 2.5% per quarter from March 31, 20212022 through June 30, 2022, with the balance due on September 12, 2022. Principal amounts repaid on the Term Facility may not be reborrowed. During the third quarter of 2019, the Company made a $400.0 million principal payment to partially pay down the outstanding Term Facility balance. As a result of this payment, the Company has satisfied its obligation to make quarterly installments on the Term Facility up to the maturity date, with the remaining outstanding balance due on September 12, 2022. In conjunction with this principal pay down, the Company recognized a $2.7 million charge related to the write-off of previously deferred financingMarch 31, 2025, 2.5% per
costs related toquarter starting June 30, 2025 through September 30, 2026, with the remaining balance due at maturity. The Company may voluntarily prepay outstanding amounts under the 2021 Term Facility which is included in Interest expense inat any time without premium or penalty, subject to customary breakage costs. Amounts borrowed under the Consolidated Statement2021 Term Facility that are repaid may not be reborrowed. The Company repaid $12.5 million of Comprehensive Income forprincipal on the 2021 Term Facility during the year ended December 31, 2019.
The 2021 Revolving Facility provides aggregate commitments of up to $500.0 million, which includes up to $100.0 million for the issuance of letters of credit. AtIn July 2022, the Company borrowed $340.0 million under the 2021 Revolving Facility to partially fund the acquisition of the Access Technologies business. The Company subsequently repaid $271.0 million, resulting in $69.0 million of borrowings outstanding as of December 31, 2020, there were 02022. In 2023, the Company repaid all borrowings outstanding on the 2021 Revolving Facility, resulting in no outstanding balance as of December 31, 2023. The Company also had $18.4 million and the Company had $15.0$13.2 million of letters of credit outstanding. Commitmentsoutstanding at December 31, 2023 and 2022, respectively. Outstanding borrowings under the 2021 Revolving Facility may be reducedrepaid at any time without premium or penalty, and amounts repaid may be reborrowed. The Company pays certain fees with respect to the 2021 Revolving Facility, including an unused commitment fee on the undrawn portion of the Revolving Facility of between 0.125%0.090% and 0.200% per year, depending on the Company's credit rating,ratings, as well as certain other fees.
Outstanding borrowings under the 2021 Credit Facilities accrue interest, at the option of the Company, of (i) a LIBORBloomberg Short-Term Bank Yield Index (“BSBY”) rate plus thean applicable margin, or (ii) a base rate (as defined in the Credit Agreement) plus thean applicable margin. The applicable margin ranges from 1.125%0.875% to 1.500%1.375% depending on the Company's credit ratings. At December 31, 2020,2023, the Company's outstanding borrowings under the Term Facility accrue2021 Credit Facilities accrued interest at LIBORBSBY plus a margin of 1.250%1.125%, resulting in an interest rate of 1.51%6.581%. The Credit FacilitiesAgreement also containcontains negative and affirmative covenants and events of default that, among other things, limit or restrict the Company’s ability to enter into certain transactions. In addition, the Credit Facilities requireAgreement requires the Company to comply with a maximum leverage ratio and a minimum interest expense coverage ratio as defined within the agreement. As of December 31, 2020,2023, the Company was in compliance with all covenants.
Senior Notes
As of December 31, 2020,2023, Allegion US Hold Co has $400.0 million outstanding of its 3.200% Senior Notes due 2024 (the “3.200% Senior Notes”) and, $400.0 million outstanding of its 3.550% Senior Notes due 2027 (the “3.550% Senior Notes”) and $600.0 million outstanding of its 5.411% Senior Notes due 2032 (the “5.411% Senior Notes”), while Allegion plc has $400.0 million outstanding of its 3.500% Senior Notes due 2029 (the “3.500% Senior Notes”, and all four senior notes collectively, the "Senior Notes"). The 3.200% Senior Notes, 3.550% Senior Notes and 3.500% Senior Notes (collectively, the "Senior Notes") all require semi-annual interest payments on April 1 and October 1 of each year and will mature on October 1, 2024, October 1, 2027, and October 1, 2029, respectively. The 5.411% Senior Notes require semi-annual interest payments on January 1 and July 1 of each year and will mature on July 1, 2032. The 3.200% Senior Notes, 3.550% Senior Notes and the 3.550%5.411% Senior Notes are senior unsecured obligations of Allegion US Hold Co and rank equally with all of Allegion US Hold Co’s existing and future senior unsecured and unsubordinated indebtedness. The guarantee of the 3.200% Senior Notes, 3.550% and the 3.550%5.411% Senior Notes is the senior unsecured obligation of the CompanyAllegion plc and ranks equally with all of the Company's existing and future senior unsecured and unsubordinated indebtedness. The 3.500% Senior Notes are senior unsecured obligations of Allegion plc, are guaranteed by Allegion US Hold Co and rank equally with all of the Company's existing and future senior unsecured indebtedness.
Future Repayments
ScheduledFuture required principal repaymentspayments on indebtedness as of December 31, 20202023 were as follows:
| | | | | |
| In millions | |
| 2021 | $ | 0.2 | |
| 2022 | 238.9 | |
| 2023 | 0.2 | |
| 2024 | 400.1 | |
| 2025 | 0 | |
| Thereafter | 800.0 | |
| Total | $ | 1,439.4 | |
| | | | | |
| In millions | |
| 2024 | $ | 412.6 | |
| 2025 | 21.9 | |
| 2026 | 190.6 | |
| 2027 | 400.0 | |
| 2028 | — | |
| Thereafter | 1,000.0 | |
| Total | $ | 2,025.1 | |
Cash paid for interest for the years ended December 31, 2020, 20192023, 2022 and 20182021 was $47.3$92.0 million, $48.8$56.9 million and $52.0$45.1 million, respectively.
NOTE 10 – FINANCIAL INSTRUMENTS
In the normal course of business, the Company uses various financial instruments, including derivative instruments, to manage the risks associated with variable interest and currency rate exposures. These financial instruments are not used for trading or speculative purposes. When a derivative contract is entered into, the Company designates the derivative instrument as a cash flow hedge of a forecasted transaction, a cash flow hedge of a recognized asset or liability or as an undesignated derivative. The Company formally documents its hedge relationships, including identification of the derivative instruments and the hedged
items, as well as its risk management objectives and strategies for undertaking the hedge transaction. This process includes linking derivative instruments that are designated as hedges to specific assets, liabilities or forecasted transactions.
The Company assesses at inception and at least quarterly thereafter, whether the derivatives used in cash flow hedging transactions are effective in offsetting the changes in the cash flows of the hedged item. To the extent the derivative is deemed to be an effective hedge, the fair market value changes of the instrument are recorded to Accumulated other comprehensive loss, while changes in the fair market value of derivatives not deemed to be an effective hedge are recorded in Net earnings in the period of change. The fair market value of derivative instruments is determined through market-based valuations and may not be representative of the actual gains or losses that will be recorded when these instruments mature due to future fluctuations in the markets in which they are traded. If the hedging relationship ceases to be effective subsequent to inception, or it becomes probable that a forecasted transaction will longer occur, the hedging relationship will be undesignated and any future gains or losses on the derivative instrument will be recorded in Net earnings.
Currency Derivatives
The gross notional amount of the Company’s currency derivatives was $218.9$175.4 million and $146.4$161.5 million at December 31, 20202023 and 2019,2022, respectively. At December 31, 2020Neither the fair values of currency derivatives, which are determined based on a pricing model that uses spot rates and 2019, bothforward prices from actively quoted currency markets that are readily observable (Level 2 inputs under the lossesfair value hierarchy described in Note 13), nor the balances included in Accumulated other comprehensive loss, were
material as of December 31, 2023 and 2022. Currency derivatives designated as cash flow hedges did not have a material impact to either Net earnings or Other Comprehensive (loss) income during any of the years ended December 31, 2023, 2022 or 2021, nor is the amount expected to be reclassified into Net earnings over the next twelve months relatedexpected to the Company’s currency derivatives designated as cash flow hedges were notbe material, although the actual amounts that will be reclassified to Net earnings may vary as a result of future changes in market conditions. Gains and losses associated with the Company’s currency derivatives not designated as hedges are recorded in Net earnings as changes in fair value occur. At December 31, 2020,2023, the maximum term of the Company’sCompany's currency derivatives, both those that are designated as cash flow hedges and those that are not, was less than one year.
Interest Rate Swaps
As of December 31, 2019, and through their expiration in September 2020, the Company had interest rate swaps to fix the interest rate paid during the contract period related to $200.0 million of the Company's variable rate Term Facility. Prior to expiration, these swaps met the criteria to be accounted for as cash flow hedges of variable rate interest payments.
The fair values of derivative instruments included within the Consolidated Balance Sheets as of December 31, 2020 and 2019 were not material. The amounts associated with derivatives designated as hedges affecting Net earnings and Accumulated other comprehensive loss for the years ended December 31 were as follows:
| | | | | | | | | | | | | | | | | | | | | | | | | | | | | | | | | | | | | | | | | | | | |
| | | Amount of gain (loss) recognized in Accumulated other comprehensive loss | | Location of gain recognized in Net earnings | | Amount of gain reclassified from Accumulated other comprehensive loss and recognized into Net earnings |
| In millions | | 2020 | | 2019 | | 2018 | | | 2020 | | 2019 | | 2018 |
| Currency derivatives | | $ | 4.1 | | | $ | 1.9 | | | $ | 4.3 | | | Cost of goods sold | | $ | 5.3 | | | $ | 4.4 | | | $ | 2.3 | |
| Interest rate swaps | | (0.2) | | | (1.9) | | | 2.5 | | | Interest expense | | 0.5 | | | 3.1 | | | 2.2 | |
| Total | | $ | 3.9 | | | $ | 0 | | | $ | 6.8 | | | | | $ | 5.8 | | | $ | 7.5 | | | $ | 4.5 | |
The gains and losses associated with the Company's non-designated currency derivatives, which are offset by changes in the fair value of the underlying transactions, are included within Other (income) expense, net in the Consolidated Statements of Comprehensive Income.
Concentration of Credit Risk
The counterparties to the Company’s forward contracts consist of a number of investment grade major international financial institutions. The Company could be exposed to losses in the event of nonperformance by the counterparties. However, the credit ratings and the concentration of risk in these financial institutions are monitored on a continuous basis and present no significant credit risk to the Company.
NOTE 11 - LEASES
The Company adopted ASC 842 on January 1, 2019, utilizing the transition method allowed per ASU 2018-11. Financial information for the year ended December 31, 2018, has not been adjusted for the effects of adopting ASC 842, and no cumulative-effect adjustment was required to the opening balance of Retained earnings on the adoption date. In accordance with ASC 842, the Company records a right-of-use ("ROU") asset andTotal lease liability for substantially all leases for which it is a lessee. At inception of a contract, the Company considers all relevant facts and circumstances to assess whether or not the
contract represents a lease by determining whether or not the contract conveys the right to control the use of an identified asset, either explicit or implicit, for a period of time in exchange for consideration. The Company has no significant lease agreements in place for which the Company is a lessor, and substantially all of the Company's leases for which the Company is a lessee are classified as operating leases. Total rental expense for the years ended December 31, 20202023, 2022 and 2019,2021, was $44.2$60.9 million, $48.9 million and $43.2$45.4 million, respectively, and is classified within Cost of goods sold and Selling and administrative expenses within the Consolidated Statements of Comprehensive Income. RentalLease expense related to short-term leases, variable lease payments or other leases or lease components not included within the ROU asset or lease liability totaled $9.1$16.9 million, $9.6 million and $8.1$8.2 million, respectively, for the years ended December 31, 20202023, 2022 and 2019.2021. No material lease costs have been capitalized on the Consolidated Balance Sheets as of December 31, 20202023 or 2019. Total rental expense for 2018, as determined in accordance with the previous lease guidance, ASC 840, was $42.5 million and is classified within Cost of goods sold and Selling and administrative expenses within the Consolidated Statements of Comprehensive Income.
If at lease commencement a lease has a term of less than 12 months and does not include a purchase option that is reasonably certain to be exercised, the Company does not include the lease as part of its ROU asset or lease liability. If the Company enters into a large number of leases in the same month with the same terms and conditions, these are considered a group (portfolio), assuming the lease model under this approach does not materially differ from applying ASC 842 to each individual lease. When available, the Company will utilize the rate implicit in the lease as the discount rate to determine the lease liability. However, as this rate is not available for most leases, the Company will use its incremental borrowing rate as the discount rate, which is the rate at inception of the lease the Company would hypothetically incur to borrow over a similar term the funds needed to purchase the leased asset.
As a lessee, the Company categorizes its leases into two general categories: real estate and equipment leases.
The Company’s real estate leases include leased production and assembly facilities, warehouses and distribution centers, office space and to a lesser degree, employee housing. The terms and conditions of real estate leases can vary significantly from lease to lease. The Company has assessed the specific terms and conditions of each real estate lease to determine the amount of the lease payments and the length of the lease term, which includes the minimum period over which lease payments are required plus any renewal options that are both within the Company's control to exercise and reasonably certain of being exercised upon lease commencement. The Company assesses all relevant factors to determine if sufficient incentives exist as of lease commencement to conclude whether or not renewal is reasonably certain. There are no material residual value guarantees provided by the Company nor any restrictions or covenants imposed by the real estate leases to which the Company is a party. In determining the lease liability, the Company utilizes its incremental borrowing rate for debt instruments with terms approximating the weighted-average term for its real estate leases to discount the future lease payments over the lease term to present value. The Company does incur variable lease payments for certain of its real estate leases, such as reimbursements of property taxes, maintenance and other operational costs to the lessor. In general, these variable lease payments are not captured as part of the lease liability or ROU asset, but rather are expensed as incurred.
The Company’s equipment leases include vehicles, material handling equipment, other machinery and equipment utilized in the Company's production and assembly facilities, warehouses and distribution centers, laptops and other IT equipment, and other miscellaneous leased equipment. Most of the equipment leases are for terms ranging from two to five years, although terms and conditions can vary from lease to lease. The Company applies similar estimates and judgments to its equipment lease portfolio in determining the lease payments and lease term as it does to its real estate lease portfolio. There are no material residual value guarantees provided by the Company nor any restrictions or covenants imposed by the equipment leases to which the Company is a party. In determining the lease liability, the Company utilizes its incremental borrowing rate for debt instruments with terms approximating the weighted-average term for its equipment leases to discount the future lease payments over the lease term to present value. The Company does not typically incur variable lease payments related to its equipment leases.
Amounts included within the Consolidated Balance Sheets related to the Company's ROU asset and lease liability were as follows:
| | | | | | | | | | | | | | | | | | | | | | | | | | | | | | | | | | | | | | | | | |
| | | December 31, 2020 | | December 31, 2019 |
| In millions | Balance Sheet classification | | Real estate | | Equipment | | Total | | Real estate | | Equipment | | Total |
| ROU asset | Other noncurrent assets | | $ | 59.5 | | | $ | 32.5 | | | $ | 92.0 | | | $ | 57.5 | | | $ | 23.9 | | | $ | 81.4 | |
| Lease liability - current | Accrued expenses and other current liabilities | | 14.7 | | | 12.9 | | | 27.6 | | | 15.4 | | | 10.4 | | | 25.8 | |
| Lease liability - noncurrent | Other noncurrent liabilities | | 46.5 | | | 19.8 | | | 66.3 | | | 42.1 | | | 13.5 | | | 55.6 | |
| | | | | | | | | | | | | |
| Other information: | | | | | | | | | | | | |
| Weighted-average remaining term (years) | | 7.0 | | 3.2 | | | | 6.5 | | 2.8 | | |
| Weighted-average discount rate | | 3.9 | % | | 2.7 | % | | | | 4.5 | % | | 3.8 | % | | |
| | | | | | | | | | | | | | | | | | | | | | | | | | | | | | | | | | | | | | | | | |
| | | December 31, 2023 | | December 31, 2022 |
| In millions | Balance Sheet classification | | Real estate | | Equipment | | Total | | Real estate | | Equipment | | Total |
| ROU asset | Other noncurrent assets | | $ | 114.7 | | | $ | 33.4 | | | $ | 148.1 | | | $ | 69.3 | | | $ | 28.8 | | | $ | 98.1 | |
| Lease liability - current | Accrued expenses and other current liabilities | | 18.7 | | | 15.0 | | | 33.7 | | | 17.7 | | | 14.1 | | | 31.8 | |
| Lease liability - noncurrent | Other noncurrent liabilities | | 98.9 | | | 18.4 | | | 117.3 | | | 54.8 | | | 14.7 | | | 69.5 | |
| | | | | | | | | | | | | |
| Other information: | | | | | | | | | | | | |
| Weighted-average remaining term (years) | | 11.6 | | 2.7 | | | | 5.9 | | 2.4 | | |
| Weighted-average discount rate | | 5.0 | % | | 4.4 | % | | | | 3.5 | % | | 2.1 | % | | |
The following table summarizes additional information related to the Company's leases for the years ended December 31:
| | 2020 | | 2019 |
| | 2023 | | | | 2023 | | 2022 |
| In millions | In millions | | Real estate | | Equipment | | Total | | Real estate | | Equipment | | Total | In millions | | Real estate | | Equipment | | Total | | Real estate | | Equipment | | Total |
| Cash paid for amounts included in the measurement of lease liabilities | Cash paid for amounts included in the measurement of lease liabilities | | $ | 19.0 | | | $ | 15.0 | | | $ | 34.0 | | | $ | 19.2 | | | $ | 15.9 | | | $ | 35.1 | |
| ROU assets obtained in exchange for new lease liabilities | | 19.2 | | | 22.0 | | | 41.2 | | | 14.7 | | | 16.0 | | | 30.7 | |
ROU assets obtained in exchange for new lease liabilities (a) | |
The Company frequently enters into both real estatesignificant increase in ROU assets obtained in exchange for new lease liabilities for the year ended December 31, 2023 compared to the year ended December 31, 2022 is primarily due to two new manufacturing and equipmentassembly facility leases in the normal course of business. While there have been lease agreements entered into that have not yet commenced as of December 31, 2020, none of these leases provide new rights or obligations to the Company that are material individually or in the aggregate.
Future Repayments
Future minimum rental commitments for the subsequent five years under non-cancellable operating leases with terms in excess of one year as of December 31, 2018 were as follows:
| | | | | | | | |
| In millions | | Total |
| 2019 | | $ | 30.3 | |
| 2020 | | 21.5 | |
| 2021 | | 14.1 | |
| 2022 | | 9.3 | |
| 2023 | | 5.5 | |
Scheduled minimum lease payments required under non-cancellable operating leases for both the real estate and equipment lease portfolios for the next five years and thereafter as of December 31, 2020,2023, were as follows:
| | In millions | In millions | | 2021 | | 2022 | | 2023 | | 2024 | | 2025 | | Thereafter | | Total | In millions | | 2024 | | 2025 | | 2026 | | 2027 | | 2028 | | Thereafter | | Total |
| Real estate leases | Real estate leases | | $ | 16.8 | | | $ | 13.8 | | | $ | 9.1 | | | $ | 6.5 | | | $ | 5.3 | | | $ | 19.5 | | | $ | 71.0 | |
| Equipment leases | Equipment leases | | 13.6 | | | 9.8 | | | 5.5 | | | 3.2 | | | 1.8 | | | 0 | | | 33.9 | |
| Total | Total | | $ | 30.4 | | | $ | 23.6 | | | $ | 14.6 | | | $ | 9.7 | | | $ | 7.1 | | | $ | 19.5 | | | $ | 104.9 | |
The difference between the total undiscounted minimum lease payments and the combined current and noncurrent lease liabilities as of December 31, 2020,2023, is due to imputed interest of $11.0$46.7 million.
NOTE 12 – PENSIONS AND POSTRETIREMENT BENEFITS OTHER THAN PENSIONS
The Company sponsors several U.S. defined benefit and defined contribution plans covering substantially all U.S. employees. Additionally, the Company has non-U.S. defined benefit and defined contribution plans covering eligible non-U.S. employees. Postretirement benefits, other than pensions, provide healthcare benefits, and in some instances, life insurance benefits for certain eligible employees.
Pension Plans
The noncontributoryCompany sponsors several U.S. and non-U.S. defined benefit pension plans covering non-collectively bargained U.S.to eligible employees provide benefits on an average pay formula, while most plans for collectively bargained U.S. employees provide benefits on a flat dollar benefit formula. The non-U.S. pension plans generally provide benefits based on earnings and years of service. The Companyretirees and also maintains additional other supplemental plans for officers and other key employees.
The following table details information regarding the Company’s pensiondefined benefit plans at December 31:
| | U.S. | | NON-U.S. |
| | U.S. | | | | U.S. | | NON-U.S. |
| In millions | In millions | | 2020 | | 2019 | | 2020 | | 2019 | In millions | | 2023 | | 2022 | | 2023 | | 2022 |
| Change in benefit obligations: | Change in benefit obligations: | | | | | | | | |
| Benefit obligation at beginning of year | |
| Benefit obligation at beginning of year | |
| Benefit obligation at beginning of year | Benefit obligation at beginning of year | | $ | 341.0 | | | $ | 293.3 | | | $ | 404.5 | | | $ | 356.8 | |
| Service cost | Service cost | | 6.7 | | | 6.5 | | | 1.7 | | | 1.7 | |
| Interest cost | Interest cost | | 9.6 | | | 11.7 | | | 6.6 | | | 8.8 | |
| Employee contributions | Employee contributions | | 0 | | | 0 | | | 0.3 | | | 0.3 | |
| Amendments | Amendments | | 0 | | | 0 | | | 0.2 | | | (0.8) | |
| Actuarial losses | | 22.5 | | | 42.2 | | | 43.4 | | | 45.7 | |
Actuarial losses (gains)(a) | |
| Benefits paid | Benefits paid | | (19.0) | | | (13.0) | | | (16.3) | | | (16.9) | |
| Foreign exchange rate changes | | 0 | | | 0 | | | 15.9 | | | 13.9 | |
| Foreign currency exchange rate changes | |
| Curtailments and settlements | Curtailments and settlements | | 0 | | | 0 | | | (0.6) | | | (5.0) | |
| | Other, including expenses paid | |
| | Other, including expenses paid | |
| | Other, including expenses paid | Other, including expenses paid | | 0.6 | | | 0.3 | | | 0 | | | 0 | |
| Benefit obligation at end of year | Benefit obligation at end of year | | $ | 361.4 | | | $ | 341.0 | | | $ | 455.7 | | | $ | 404.5 | |
| Change in plan assets: | Change in plan assets: | | | | | | | | |
| Fair value at beginning of year | Fair value at beginning of year | | $ | 301.5 | | | $ | 259.4 | | | $ | 409.0 | | | $ | 352.2 | |
| Fair value at beginning of year | |
| Fair value at beginning of year | |
| Actual return on plan assets | Actual return on plan assets | | 45.2 | | | 50.4 | | | 52.1 | | | 55.2 | |
| Company contributions | Company contributions | | 6.3 | | | 6.0 | | | 5.1 | | | 10.6 | |
| Employee contributions | Employee contributions | | 0 | | | 0 | | | 0.3 | | | 0.3 | |
| Benefits paid | Benefits paid | | (19.0) | | | (13.0) | | | (16.3) | | | (16.9) | |
| Foreign exchange rate changes | | 0 | | | 0 | | | 15.9 | | | 15.2 | |
| Foreign currency exchange rate changes | |
| Curtailment and settlements | Curtailment and settlements | | 0 | | | 0 | | | (0.6) | | | (6.2) | |
| | Other, including expenses paid | Other, including expenses paid | | (1.0) | | | (1.3) | | | (1.6) | | | (1.4) | |
| Other, including expenses paid | |
| Other, including expenses paid | |
| Fair value of assets at end of year | Fair value of assets at end of year | | $ | 333.0 | | | $ | 301.5 | | | $ | 463.9 | | | $ | 409.0 | |
| Funded status: | Funded status: | | | | | | | | |
| Plan assets (less than) exceeding benefit obligations | | $ | (28.4) | | | $ | (39.5) | | | $ | 8.2 | | | $ | 4.5 | |
| Plan assets exceeding (less than) benefit obligations | |
| Plan assets exceeding (less than) benefit obligations | |
| Plan assets exceeding (less than) benefit obligations | |
| Amounts included in the balance sheet: | Amounts included in the balance sheet: | | | | | | | | |
| Other noncurrent assets | |
| Other noncurrent assets | |
| Other noncurrent assets | Other noncurrent assets | | $ | 0 | | | $ | 0 | | | $ | 37.4 | | | $ | 29.3 | |
| Accrued compensation and benefits | Accrued compensation and benefits | | (0.2) | | | (0.5) | | | (0.8) | | | (0.8) | |
| Postemployment and other benefit liabilities | Postemployment and other benefit liabilities | | (28.2) | | | (39.0) | | | (27.6) | | | (24.0) | |
| Liabilities held for sale | | 0 | | | 0 | | | (0.8) | | | 0 | |
| | Net amount recognized | Net amount recognized | | $ | (28.4) | | | $ | (39.5) | | | $ | 8.2 | | | $ | 4.5 | |
| Net amount recognized | |
| Net amount recognized | |
(a)The significant actuarial gains during the year ended December 31, 2022, were primarily driven by discount rate increases.
It is the Company’s objective to contribute to the pension plans to ensure adequate funds are available in the plans to make benefit payments to plan participants and beneficiaries when required. However, certain plans are not funded due to either legal, accounting or tax requirements in certain jurisdictions. As of December 31, 2020,2023, approximately 6%5% of the Company's projected benefit obligation relates to plans that are not funded, of which the majority are non-U.S. plans.
The pretax amounts recognized in Accumulated other comprehensive loss were as follows:
| | | | | | | | | | | | | | | | | | | | |
| | U.S. |
| In millions | | Prior service cost | | Net actuarial losses | | Total |
| December 31, 2021 | | $ | (0.7) | | | $ | (40.5) | | | $ | (41.2) | |
| Current year changes recorded to Accumulated other comprehensive loss | | — | | | 5.4 | | | 5.4 | |
| Amortization reclassified to earnings | | 0.2 | | | 1.1 | | | 1.3 | |
| | | | | | |
| | | | | | |
| December 31, 2022 | | $ | (0.5) | | | $ | (34.0) | | | $ | (34.5) | |
| Current year changes recorded to Accumulated other comprehensive loss | | — | | | (7.6) | | | (7.6) | |
| Amortization reclassified to earnings | | 0.1 | | | 0.7 | | | 0.8 | |
| Settlements/curtailments reclassified to earnings | | — | | | 0.1 | | | 0.1 | |
| | | | | | |
| December 31, 2023 | | $ | (0.4) | | | $ | (40.8) | | | $ | (41.2) | |
| | | | | | | | | | | | | | | | | | | | |
| | NON-U.S. |
| In millions | | Prior service cost | | Net actuarial losses | | Total |
| December 31, 2021 | | $ | (3.8) | | | $ | (59.3) | | | $ | (63.1) | |
| Current year changes recorded to Accumulated other comprehensive loss | | 0.1 | | | (44.7) | | | (44.6) | |
| Amortization reclassified to earnings | | 0.1 | | | (0.5) | | | (0.4) | |
| | | | | | |
| Currency translation and other | | 0.5 | | | 7.3 | | | 7.8 | |
| December 31, 2022 | | $ | (3.1) | | | $ | (97.2) | | | $ | (100.3) | |
| Current year changes recorded to Accumulated other comprehensive loss | | 0.1 | | | (1.7) | | | (1.6) | |
| Amortization reclassified to earnings | | 0.1 | | | 3.5 | | | 3.6 | |
| Settlements/curtailments reclassified to earnings | | — | | | 0.3 | | | 0.3 | |
| Currency translation and other | | (0.1) | | | (5.3) | | | (5.4) | |
| December 31, 2023 | | $ | (3.0) | | | $ | (100.4) | | | $ | (103.4) | |
Weighted-average discount rate assumptions utilized in determining benefit obligations as of December 31, were as follows:
| | | | | | | | | | | | | | |
| | 2023 | | 2022 |
| | | | |
| U.S. plans | | 5.1 | % | | 5.4 | % |
| Non-U.S. plans | | 4.6 | % | | 4.9 | % |
| | | | |
| | | | |
| | | | |
Information regarding pension plans with accumulated benefit obligations more than plan assets were:
| | | | | | | | | | | | | | | | | | | | | | | | | | |
| | U.S. | | NON-U.S. |
| In millions | | 2023 | | 2022 | | 2023 | | 2022 |
| Projected benefit obligation | | $ | 4.6 | | | $ | 20.2 | | | $ | 34.4 | | | $ | 29.1 | |
| Accumulated benefit obligation | | 4.6 | | | 20.2 | | | 28.7 | | | 24.3 | |
| Fair value of plan assets | | $ | — | | | $ | — | | | $ | 10.6 | | | $ | 9.8 | |
Future pension benefit payments are expected to be paid as follows:
| | | | | | | | | | | |
| In millions | U.S. | | NON-U.S. |
| 2024 | $ | 22.1 | | | $ | 15.0 | |
| 2025 | 19.5 | | | 15.3 | |
| 2026 | 22.2 | | | 15.7 | |
| 2027 | 19.1 | | | 16.2 | |
| 2028 | 19.5 | | | 16.5 | |
| 2029 - 2033 | 90.4 | | | 90.5 | |
| | | | | | | | | | | | | | | | | | | | |
| | U.S. |
| In millions | | Prior service cost | | Net actuarial losses | | Total |
| December 31, 2018 | | $ | (1.5) | | | $ | (69.6) | | | $ | (71.1) | |
| Current year changes recorded to Accumulated other comprehensive loss | | 0 | | | (4.2) | | | (4.2) | |
| Amortization reclassified to earnings | | 0.3 | | | 4.7 | | | 5.0 | |
| | | | | | |
| | | | | | |
| December 31, 2019 | | $ | (1.2) | | | $ | (69.1) | | | $ | (70.3) | |
| Current year changes recorded to Accumulated other comprehensive loss | | 0 | | | 8.1 | | | 8.1 | |
| Amortization reclassified to earnings | | 0.2 | | | 3.6 | | | 3.8 | |
| | | | | | |
| | | | | | |
| December 31, 2020 | | $ | (1.0) | | | $ | (57.4) | | | $ | (58.4) | |
| | | | | | | | | | | | | | | | | | | | |
| | NON-U.S. |
| In millions | | Prior service cost | | Net actuarial losses | | Total |
| December 31, 2018 | | $ | (4.7) | | | $ | (66.2) | | | $ | (70.9) | |
| Current year changes recorded to Accumulated other comprehensive loss | | 0.8 | | | (4.8) | | | (4.0) | |
| Amortization reclassified to earnings | | 0.2 | | | 1.3 | | | 1.5 | |
| Settlements/curtailments reclassified to earnings | | 0 | | | 2.3 | | | 2.3 | |
| Currency translation and other | | (0.1) | | | (2.4) | | | (2.5) | |
| December 31, 2019 | | $ | (3.8) | | | $ | (69.8) | | | $ | (73.6) | |
| Current year changes recorded to Accumulated other comprehensive loss | | (0.3) | | | (4.0) | | | (4.3) | |
| Amortization reclassified to earnings | | 0.1 | | | 1.3 | | | 1.4 | |
| Settlements/curtailments reclassified to earnings | | 0 | | | 0.1 | | | 0.1 | |
| Currency translation and other | | (0.1) | | | (2.6) | | | (2.7) | |
| December 31, 2020 | | $ | (4.1) | | | $ | (75.0) | | | $ | (79.1) | |
| | | | | | | | | | | | | | | | | | | | |
| | U.S. |
| In millions | | 2023 | | 2022 | | 2021 |
| Service cost | | $ | 0.9 | | | $ | 5.9 | | | $ | 6.7 | |
| Interest cost | | 12.1 | | | 8.1 | | | 6.8 | |
| Expected return on plan assets | | (15.0) | | | (13.5) | | | (14.0) | |
| Administrative costs and other | | 1.0 | | | 1.1 | | | 1.2 | |
| Net amortization of: | | | | | | |
| Prior service costs | | 0.2 | | | 0.2 | | | 0.3 | |
| Plan net actuarial losses | | 0.7 | | | 1.1 | | | 3.4 | |
| Net periodic pension benefit (income) cost | | $ | (0.1) | | | $ | 2.9 | | | $ | 4.4 | |
| | | | | | | | | | | | | | | | | | | | |
| | NON-U.S. |
| In millions | | 2023 | | 2022 | | 2021 |
| Service cost | | $ | 1.4 | | | $ | 1.4 | | | $ | 2.0 | |
| Interest cost | | 12.5 | | | 6.7 | | | 5.1 | |
| Expected return on plan assets | | (16.0) | | | (14.3) | | | (13.8) | |
| Administrative costs and other | | 1.8 | | | 1.5 | | | 1.9 | |
| Net amortization of: | | | | | | |
| Prior service costs | | 0.1 | | | 0.1 | | | 0.1 | |
| Plan net actuarial losses (gains) | | 3.5 | | | (0.5) | | | 1.4 | |
| Net curtailment and settlement losses | | 0.3 | | | — | | | 0.5 | |
| Net periodic pension benefit cost (income) | | $ | 3.6 | | | $ | (5.1) | | | $ | (2.8) | |
The Service cost component of Net periodic pension benefit cost (income) is recorded in Cost of goods sold and Selling and administrative expenses, while the remaining components are recorded within Other income, net within the Consolidated Statements of Comprehensive Income.
Net periodic pension benefit cost for 2024 is projected to be approximately $2 million, utilizing the assumptions for calculating the pension benefit obligations at the end of 2023.
Weighted-average assumptions used:
| | | | | | | | | | | | | | |
| Benefit obligations at December 31, | | 2020 | | 2019 |
| Discount rate: | | | | |
| U.S. plans | | 2.5 | % | | 3.3 | % |
| Non-U.S. plans | | 1.3 | % | | 1.9 | % |
| Rate of compensation increase: | | | | |
| U.S. plans | | 3.0 | % | | 3.0 | % |
| Non-U.S. plans | | 3.0 | % | | 3.0 | % |
The accumulatedutilized in determining net periodic pension benefit obligationcost (income) for all U.S. defined benefit pension plans was $354.9 million and $332.4 million atthe years ended December 31, 2020 and 2019, respectively. The accumulated benefit obligation for all non-U.S. defined benefit pension plans was $446.0 million and $396.7 million at December 31, 2020 and 2019, respectively.were as follows:
| | | | | | | | | | | | | | | | | | | | |
| | 2023 | | 2022 | | 2021 |
| Discount rate: | | | | | | |
| U.S. plans | | 5.4 | % | | 2.8 | % | | 2.5 | % |
| Non-U.S. plans | | 4.9 | % | | 1.9 | % | | 1.3 | % |
| Rate of compensation increase: | | | | | | |
| U.S. plans | | — | % | | 3.0 | % | | 3.0 | % |
| Non-U.S. plans | | 3.4 | % | | 3.5 | % | | 3.0 | % |
| Expected return on plan assets: | | | | | | |
| U.S. plans | | 6.5 | % | | 4.3 | % | | 4.3 | % |
| Non-U.S. plans | | 6.4 | % | | 3.5 | % | | 3.0 | % |
The Company generally estimates the service and interest cost components of net periodic benefit cost utilizing a full yield-curve approach. Under this approach, the Company applies discounting using the applicable spot rates derived from the yield curve to discount the cash flows used to measure the benefit obligation. These spot rates align to each of the projected benefit obligationsobligation cash flows and service cost cash flows.
Information regarding pension plans with accumulated benefit obligations more than plan assets were:
| | | | | | | | | | | | | | | | | | | | | | | | | | |
| | U.S. | | NON-U.S. |
| In millions | | 2020 | | 2019 | | 2020 | | 2019 |
| Projected benefit obligation | | $ | 24.0 | | | $ | 341.0 | | | $ | 40.3 | | | $ | 34.0 | |
| Accumulated benefit obligation | | 23.3 | | | 332.4 | | | 34.0 | | | 29.1 | |
| Fair value of plan assets | | $ | 0 | | | $ | 301.5 | | | $ | 11.1 | | | $ | 9.5 | |
Future pension benefit payments are expected to be paid as follows:
| | | | | | | | | | | |
| In millions | U.S. | | NON-U.S. |
| 2021 | $ | 20.0 | | | $ | 18.4 | |
| 2022 | 29.2 | | | 18.8 | |
| 2023 | 22.0 | | | 19.7 | |
| 2024 | 29.8 | | | 20.6 | |
| 2025 | 20.0 | | | 22.0 | |
| 2026 - 2030 | 97.0 | | | 118.6 | |
The components of the Company’s net periodic pension benefit cost (income) for the years ended December 31 were as follows:
| | | | | | | | | | | | | | | | | | | | |
| | U.S. |
| In millions | | 2020 | | 2019 | | 2018 |
| Service cost | | $ | 6.7 | | | $ | 6.5 | | | $ | 6.8 | |
| Interest cost | | 9.6 | | | 11.7 | | | 10.5 | |
| Expected return on plan assets | | (14.5) | | | (12.5) | | | (14.4) | |
| Administrative costs and other | | 1.6 | | | 1.7 | | | 1.6 | |
| Net amortization of: | | | | | | |
| Prior service costs | | 0.2 | | | 0.3 | | | 0.3 | |
| Plan net actuarial losses | | 3.6 | | | 4.7 | | | 4.1 | |
| Net periodic pension benefit cost | | $ | 7.2 | | | $ | 12.4 | | | $ | 8.9 | |
| | | | | | | | | | | | | | | | | | | | |
| | NON-U.S. |
| In millions | | 2020 | | 2019 | | 2018 |
| Service cost | | $ | 1.7 | | | $ | 1.7 | | | $ | 1.7 | |
| Interest cost | | 6.6 | | | 8.8 | | | 8.4 | |
| Expected return on plan assets | | (12.7) | | | (13.0) | | | (15.4) | |
| Administrative costs and other | | 1.6 | | | 1.3 | | | 1.8 | |
| Net amortization of: | | | | | | |
| Prior service costs | | 0.1 | | | 0.2 | | | 0 | |
| Plan net actuarial losses | | 1.3 | | | 1.4 | | | 0.9 | |
| Net curtailment and settlement losses | | 0.1 | | | 2.3 | | | 0 | |
| Net periodic pension benefit (income) cost | | $ | (1.3) | | | $ | 2.7 | | | $ | (2.6) | |
The Service cost component of Net periodic pension benefit cost (income) is recorded in Cost of goods sold and Selling and administrative expenses within the Consolidated Statements of Comprehensive Income. The remaining components are recorded within Other (income) expense, net within the Consolidated Statements of Comprehensive Income.
Pension expense for 2021 is projected to be approximately $1.8 million, utilizing the assumptions for calculating the pension benefit obligations at the end of 2020.
Weighted-average assumptions used:
| | | | | | | | | | | | | | | | | | | | |
| Net periodic pension cost for the year ended December 31, | | 2020 | | 2019 | | 2018 |
| Discount rate: | | | | | | |
| U.S. plans | | 3.3 | % | | 4.3 | % | | 3.6 | % |
| Non-U.S. plans | | 1.9 | % | | 2.8 | % | | 2.5 | % |
| Rate of compensation increase: | | | | | | |
| U.S. plans | | 3.0 | % | | 3.0 | % | | 3.0 | % |
| Non-U.S. plans | | 3.0 | % | | 3.3 | % | | 3.3 | % |
| Expected return on plan assets: | | | | | | |
| U.S. plans | | 5.0 | % | | 5.0 | % | | 5.3 | % |
| Non-U.S. plans | | 3.3 | % | | 3.8 | % | | 4.0 | % |
The expected return on plan assets reflects the average rate of returns expected on the funds invested or to be invested to provide for the benefits included in the projected benefit obligation and is based on what is achievable given the plan’s investment policy, the types of assets held and target asset allocations. The expected long-term rate of return is determined as of the measurement date. Each plan is reviewed, along with its historical returns and target asset allocations, to determine the appropriate expected return on plan assets to be used.
The Company's overall objective in managing its defined benefit plan assets is to ensure that all present and future benefit obligations are met as they come due. The goal is to achieve this while trying to mitigate volatility in plan funded status, contributions and expense by better matching the characteristics of the plan assets to that of the plan liabilities. Each plan’s funded status and asset allocation is monitored regularly in addition to investment manager performance.
The fair values of the Company’s U.S. pension plan assets at December 31, 2023, by asset category, were as follows:
| | | | | | | | | | | | | | | | | | | | | | | | | | | | | | | | |
| | | Fair value measurements | | | | Total |
| In millions | | Quoted prices in active markets for identical assets (Level 1) | | Significant other observable inputs
(Level 2) | | Significant unobservable inputs (Level 3) | | Assets measured at NAV | |
| Cash, cash equivalents and short-term investments | | $ | — | | | $ | — | | | $ | — | | | $ | 5.5 | | | $ | 5.5 | |
| Common collective trusts | | — | | | — | | | — | | | 183.7 | | | 183.7 | |
Other(a) | | — | | | — | | | — | | | 55.2 | | | 55.2 | |
| Total U.S. pension plan assets | | $ | — | | | $ | — | | | $ | — | | | $ | 244.4 | | | $ | 244.4 | |
The fair values of the Company’s U.S. pension plan assets at December 31, 2020,2022, by asset category, were as follows:
| | | | | Fair value measurements | | Total | | | Fair value measurements | | | | Total |
| In millions | In millions | | Quoted prices in active markets for identical assets (Level 1) | | Significant other observable inputs
(Level 2) | | Significant unobservable inputs (Level 3) | | Assets measured at NAV | |
| Cash, cash equivalents and short-term investments | Cash, cash equivalents and short-term investments | | $ | 0 | | | $ | 0 | | | $ | 0 | | | $ | 2.1 | | | $ | 2.1 | |
| Cash, cash equivalents and short-term investments | |
| Cash, cash equivalents and short-term investments | |
| Common collective trusts | Common collective trusts | | 0 | | | 0 | | | 0 | | | 288.4 | | | 288.4 | |
Other(a) | Other(a) | | 0 | | | 0 | | | 0 | | | 42.5 | | | 42.5 | |
| Total U.S. pension plan assets | Total U.S. pension plan assets | | $ | 0 | | | $ | 0 | | | $ | 0 | | | $ | 333.0 | | | $ | 333.0 | |
|
(a)Includes a group trust diversified credit fund and real estate investment trust.
The fair values of the Company’s U.S. pension plan assets at December 31, 2019, by asset category were as follows:
| | | | | | | | | | | | | | | | | | | | | | | | | | | | | | | | |
| | | Fair value measurements | | | | Total |
| In millions | | Quoted prices in active markets for identical assets (Level 1) | | Significant other observable inputs
(Level 2) | | Significant unobservable inputs (Level 3) | | Assets measured at NAV | |
| Cash, cash equivalents and short-term investments | | $ | 0 | | | $ | 0 | | | $ | 0 | | | $ | 4.7 | | | $ | 4.7 | |
| Common collective trusts | | 0 | | | 0 | | | 0 | | | 262.5 | | | 262.5 | |
Other(a) | | 0 | | | 0 | | | 0 | | | 34.3 | | | 34.3 | |
| Total U.S. pension plan assets | | $ | 0 | | | $ | 0 | | | $ | 0 | | | $ | 301.5 | | | $ | 301.5 | |
| | | | | | | | | | |
| | | | | | | | | | |
(a)Includes a group trust diversified credit fund and real estate investment trust.
No material transfers in or out of Level 3 occurred during the years ended December 31, 20202023 or 2019.
The Company's U.S. pension plan assets are valued using the following methodologies:
•Cash, cash equivalents and short-term investments – Short-term investments are valued at their daily net asset value (NAV) per share or the equivalent based upon the fair value of the underlying investments. NAV per share or the
equivalent is used for fair value purposes as a practical expedient and is calculated by the investment manager or sponsor of the fund. These investments primarily consist of short-term investment funds.
•Common collective trusts -– Common collective trust ("CCT") funds are not publicly traded and are valued at NAV per share or the equivalent based upon the fair value of the underlying investments. NAV per share or the equivalent is used for fair value purposes as a practical expedient and is calculated by the investment manager or sponsor of the applicable fund. CCT funds consist of a variety of publicly traded securities, including equity mutual funds, U.S. government and agency obligations, corporate and non-U.S. bonds, securitized credit and emerging market debt. There are no unfunded commitments, redemption frequency restrictions or other redemption restrictions related to such investments.
The fair values of the Company’s non-U.S. pension plan assets at December 31, 2023, by asset category, were as follows:
| | | | | | | | | | | | | | | | | | | | | | | | | | | | | | | | |
| | | Fair value measurements | | | | Total |
| In millions | | Quoted prices in active markets for identical assets (Level 1) | | Significant other observable inputs
(Level 2) | | Significant unobservable inputs (Level 3) | | Assets measured at NAV | |
| Cash, cash equivalents and short-term investments | | $ | 0.8 | | | $ | — | | | $ | — | | | $ | 39.0 | | | $ | 39.8 | |
| Equity mutual funds | | — | | | 3.3 | | | — | | | 45.4 | | | 48.7 | |
| Corporate and non-U.S. bonds | | — | | | 3.0 | | | — | | | 137.4 | | | 140.4 | |
Other(a) | | — | | | 0.3 | | | 4.1 | | | 34.4 | | | 38.8 | |
| Total non-U.S. pension plan assets | | $ | 0.8 | | | $ | 6.6 | | | $ | 4.1 | | | $ | 256.2 | | | $ | 267.7 | |
(a) Primarily includes a core diversified credit fund, a credit opportunity fund and derivative contracts.
The fair values of the Company’s non-U.S. pension plan assets at December 31, 2020,2022, by asset category, were as follows:
| | | | | Fair value measurements | | Total | | | Fair value measurements | | | | Total |
| In millions | In millions | | Quoted prices in active markets for identical assets (Level 1) | | Significant other observable inputs
(Level 2) | | Significant unobservable inputs (Level 3) | | Assets measured at NAV | |
| Cash, cash equivalents and short-term investments | |
| Cash, cash equivalents and short-term investments | |
| Cash, cash equivalents and short-term investments | Cash, cash equivalents and short-term investments | | $ | 1.6 | | | $ | 0 | | | $ | 0 | | | $ | 92.5 | | | $ | 94.1 | |
| Equity mutual funds | Equity mutual funds | | 0 | | | 3.3 | | | 0 | | | 110.0 | | | 113.3 | |
| Corporate and non-U.S. bonds | Corporate and non-U.S. bonds | | 0 | | | 3.5 | | | 0 | | | 203.8 | | | 207.3 | |
Other(a) | Other(a) | | 0 | | | 0.5 | | | 4.2 | | | 44.5 | | | 49.2 | |
| Total non-U.S. pension plan assets | Total non-U.S. pension plan assets | | $ | 1.6 | | | $ | 7.3 | | | $ | 4.2 | | | $ | 450.8 | | | $ | 463.9 | |
(a) Primarily includes a core diversified credit fund, and derivative contracts.
The fair values of the Company’s non-U.S. pension plan assets at December 31, 2019, by asset category were as follows:
| | | | | | | | | | | | | | | | | | | | | | | | | | | | | | | | |
| | | Fair value measurements | | | | Total |
| In millions | | Quoted prices in active markets for identical assets (Level 1) | | Significant other observable inputs
(Level 2) | | Significant unobservable inputs (Level 3) | | Assets measured at NAV | |
| Cash, cash equivalents and short-term investments | | $ | 0.9 | | | $ | 0 | | | $ | 0 | | | $ | 56.9 | | | $ | 57.8 | |
| Equity mutual funds | | 0 | | | 2.7 | | | 0 | | | 102.5 | | | 105.2 | |
| Corporate and non-U.S. bonds | | 0 | | | 118.0 | | | 0 | | | 70.1 | | | 188.1 | |
Other(a) | | 0 | | | 9.0 | | | 3.4 | | | 45.5 | | | 57.9 | |
| Total non-U.S. pension plan assets | | $ | 0.9 | | | $ | 129.7 | | | $ | 3.4 | | | $ | 275.0 | | | $ | 409.0 | |
(a) Primarily includes a core diversified credit opportunity fund and derivative contracts.
No material transfers in or out of Level 3 occurred during the years ended December 31, 20202023 or 2019.
The Company's non-U.S. pension plan assets are valued using the following methodologies:
•Cash, cash equivalents and short-term investments – Cash equivalents are valued using a market approach with inputs including quoted market prices for either identical or similar instruments. Short-term investments are valued at the closing price or amount held on deposit by the custodian bank, at fair value by discounting the related cash flows based on current yields of similar instruments with comparable durations considering the credit-worthiness of the issuer, or at their NAV per share or the equivalent based upon the fair value of the underlying investments. NAV per share or the equivalent is used for fair value purposes as a practical expedient and is calculated by the investment manager or sponsor of the fund. These investments primarily consist of short-term investment funds.
•Equity mutual funds – Equity mutual funds are primarily valued at their NAV per share or the equivalent. NAV per share or the equivalent is used for fair value purposes as a practical expedient. NAVexpedient and is calculated by the investment manager or sponsor of the fund.
•Corporate and non-U.S. bonds – Quoted market prices are not available for these securities. Fair values are either estimated using pricing models and/or quoted prices of securities with similar characteristics or discounted cash flows, in which instances such securities are classified as Level 2, or valued at their NAV per share or the equivalent. NAV
per share or the equivalent is used for fair value purposes as a practical expedient and areis calculated by the investment manager or sponsor of the fund.
The Company made employer contributions of $6.3$15.9 million, $6.0$0.5 million and $6.1$6.2 million to the U.S. pension plans in 2020, 20192023, 2022 and 2018,2021, respectively. In 2022, the Company prefunded $8.2 million of supplemental plan payments to a former executive to satisfy an obligation due in early 2023, which is included within the $15.9 million. The Company made required and discretionaryemployer contributions to its non-U.S. pension plans of $5.1$5.0 million, $10.6$5.5 million and $5.4$6.0 million in 2020, 20192023, 2022 and 2018,2021, respectively.
The Company currently projects that approximately $11.4$5 million will be contributed to its U.S and non-U.S. plans worldwide in 2021.2024. The Company’s policy allows it to fund an amount, which could be in excess of or less than the pension cost expensed, subject to the limitations imposed by current tax regulations. The Company anticipates funding the plans in 20212024 in accordance with contributions required by funding regulations or the laws of each jurisdiction.
Most of the Company’s U.S. employees are covered by defined contribution plans. Employer contributions are determined based on criteria specific to the individual plans and amounted to approximately $17.9$31.7 million, $15.6$23.0 million and $14.4$18.3 million in 2020, 20192023, 2022 and 2018,2021, respectively. The Company’s contributions relating to non-U.S. defined contribution plans and other non-U.S. benefit plans were $7.0$10.1 million, $6.0$8.8 million and $8.0$8.6 million in 2020, 20192023, 2022 and 2018,2021, respectively.
Deferred Compensation Plan
The Company maintains an Executive Deferred Compensation Plan ("EDCP"), which is an unfunded, nonqualified plan that, prior to 2019, permitted certain employees to defer up to 50% of their annual salary and up to 100% of their annual bonus awards, performance stock plan awards and restricted stock units earnedinto a number of investment choices, including its ordinary share equivalents, until conclusion of their employment with the Company. As of December 31, 20202023 and 2019,2022, the deferred compensation liability balance was $18.1$13.9 million and $17.4$13.8 million, respectively, the majority of which was recorded within Postemployment and other benefit liabilities in the Consolidated Balance Sheets. Amounts invested in ordinary share equivalents of the Company are not included in the deferred compensation liability balance, as these amounts will be settled in ordinary shares of the Company at the time of distribution.
Postretirement Benefits Other Than PensionsF-21
The Company sponsors a postretirement ("OPEB") plan that provides for healthcare benefits, and in some instances, life insurance benefits, that cover certain eligible retired employees. The Company funds postretirement benefit obligations principally on a pay-as-you-go basis. Generally, postretirement health benefits are contributory with contributions adjusted annually. Life insurance plans for retirees are primarily noncontributory. Net periodic postretirement benefit income is included within Other (income) expense, net within the Consolidated Statements of Comprehensive Income.
The benefit obligation related to the Company's postretirement plans as of December 31, 2020 and 2019 was $5.2 million and $6.8 million, respectively, and is classified as Accrued compensation and benefits and Postemployment and other benefit liabilities within the Consolidated Balance Sheets. Net periodic postretirement benefit income was not material for any of the years ended December 31, 2020, 2019 or 2018, nor is it projected to be material for 2021. Benefit payments for postretirement benefits, which are net of expected plan participant contributions and Medicare Part D subsidies, are expected to be less than $1 million per year for the foreseeable future.
NOTE 13 – FAIR VALUE MEASUREMENTS
Fair value is defined as the exchange price that would be received to sell an asset or paid to transfer a liability (an exit price) in the principal or most advantageous market for the asset or liability in an orderly transaction between market participants on the measurement date. Fair value measurements are based on a framework that utilizes the inputs market participants use to determine the fair value of an asset or liability and establishes a fair value hierarchy to prioritize those inputs. The fair value hierarchy is comprised of the three levels described below:
•Level 1 – Inputs based on quoted prices in active markets for identical assets or liabilities.
•Level 2 – Inputs other than Level 1 quoted prices, such as quoted prices for similar assets or liabilities; quoted prices in markets that are not active; or other inputs that are observable or can be corroborated by observable market data for substantially the full term of the asset or liability.
•Level 3 – Unobservable inputs based on little or no market activity and that are significant to the fair value of the assets and liabilities.
The fair value hierarchy requires an entity to maximize the use of observable inputs and minimize the use of unobservable inputs when measuring fair value. Observable inputs are obtained from independent sources and can be validated by a third
party, whereas unobservable inputs reflect assumptions regarding what a third party would use in pricing an asset or liability based on the best information available under the circumstances. A financial instrument’s categorization within the fair value hierarchy is based upon the lowest level of input that is significant to the fair value measurement.
| | | | | | | | | | | | | | | | | | | | | | | |
| | Fair value measurements | | Total
fair value |
| In millions | Quoted prices in active markets for identical assets (Level 1) | | Significant other observable inputs (Level 2) | | Significant unobservable inputs (Level 3) | |
| Recurring fair value measurements | | | | | | | |
| Assets: | | | | | | | |
| Investments | $ | — | | | $ | 18.0 | | | $ | — | | | $ | 18.0 | |
| Total asset recurring fair value measurements | $ | — | | | $ | 18.0 | | | $ | — | | | $ | 18.0 | |
| Liabilities: | | | | | | | |
| Deferred compensation and other retirement plans | $ | — | | | $ | 18.2 | | | $ | — | | | $ | 18.2 | |
| Total liability recurring fair value measurements | $ | — | | | $ | 18.2 | | | $ | — | | | $ | 18.2 | |
| Financial instruments not carried at fair value | | | | | | | |
| Total debt | $ | — | | | $ | 1,984.9 | | | $ | — | | | $ | 1,984.9 | |
| Total financial instruments not carried at fair value | $ | — | | | $ | 1,984.9 | | | $ | — | | | $ | 1,984.9 | |
Assets and liabilities measured at fair value at December 31, 2020,2022, were as follows:
| | | | Fair value measurements | | Total
fair value | | Fair value measurements | | Total
fair value |
| In millions | In millions | Quoted prices in active markets for identical assets (Level 1) | | Significant other observable inputs (Level 2) | | Significant unobservable inputs (Level 3) | |
| Recurring fair value measurements | Recurring fair value measurements | | | | | | | |
| Recurring fair value measurements | |
| Recurring fair value measurements | |
| Assets: | |
| Assets: | |
| Assets: | Assets: | |
| Investments | Investments | $ | 0 | | | $ | 23.5 | | | $ | 0 | | | $ | 23.5 | |
| Derivative instruments | 0 | | | 1.6 | | | 0 | | | 1.6 | |
| Investments | |
| Investments | |
| Total asset recurring fair value measurements | Total asset recurring fair value measurements | $ | 0 | | | $ | 25.1 | | | $ | 0 | | | $ | 25.1 | |
| Liabilities: | Liabilities: | | | | | | | |
| Derivative instruments | $ | 0 | | | $ | 3.4 | | | $ | 0 | | | $ | 3.4 | |
| Deferred compensation and other retirement plans | |
| Deferred compensation and other retirement plans | |
| Deferred compensation and other retirement plans | Deferred compensation and other retirement plans | 0 | | | 25.1 | | | 0 | | | 25.1 | |
| Total liability recurring fair value measurements | Total liability recurring fair value measurements | $ | 0 | | | $ | 28.5 | | | $ | 0 | | | $ | 28.5 | |
| Financial instruments not carried at fair value | Financial instruments not carried at fair value | | | | | | | |
| Total debt | Total debt | $ | 0 | | | $ | 1,541.4 | | | $ | 0 | | | $ | 1,541.4 | |
| Total debt | |
| Total debt | |
| Total financial instruments not carried at fair value | Total financial instruments not carried at fair value | $ | 0 | | | $ | 1,541.4 | | | $ | 0 | | | $ | 1,541.4 | |
Assets and liabilities measured at fair value at December 31, 2019, were as follows:
| | | | | | | | | | | | | | | | | | | | | | | |
| | Fair value measurements | | Total
fair value |
| In millions | Quoted prices in active markets for identical assets (Level 1) | | Significant other observable inputs (Level 2) | | Significant unobservable inputs (Level 3) | |
| Recurring fair value measurements | | | | | | | |
| Assets: | | | | | | | |
| Investments | $ | 0 | | | $ | 17.4 | | | $ | 0 | | | $ | 17.4 | |
| Derivative instruments | 0 | | | 1.1 | | | 0 | | | 1.1 | |
| | | | | | | |
| Total asset recurring fair value measurements | $ | 0 | | | $ | 18.5 | | | $ | 0 | | | $ | 18.5 | |
| Liabilities: | | | | | | | |
| Derivative instruments | $ | 0 | | | $ | 1.5 | | | $ | 0 | | | $ | 1.5 | |
| | | | | | | |
| Deferred compensation and other retirement plans | 0 | | | 23.1 | | | 0 | | | 23.1 | |
| Total liability recurring fair value measurements | $ | 0 | | | $ | 24.6 | | | $ | 0 | | | $ | 24.6 | |
| Financial instruments not carried at fair value | | | | | | | |
| Total debt | $ | 0 | | | $ | 1,474.0 | | | $ | 0 | | | $ | 1,474.0 | |
| Total financial instruments not carried at fair value | $ | 0 | | | $ | 1,474.0 | | | $ | 0 | | | $ | 1,474.0 | |
The Company determines the fair value of its financial assets and liabilities using the following methodologies:
•Investments – These instruments include equity mutual funds and corporate bond funds. The fair value is obtained based on observable market prices quoted on public exchanges for similar instruments.
•Derivative instruments – These instruments include foreign currency contracts for non-functional currency balance sheet exposures, including both those that are and are not designated as cash flow hedges. As of December 31, 2019, these instruments also included interest rate swap contracts, which expired in September 2020, related to the Company’s variable rate Term Facility. The fair value of the foreign currency contracts is determined based on a pricing model that uses spot rates and forward prices from actively quoted currency markets that are readily accessible and observable. The fair value of the interest rate swap contracts was determined based on quoted prices for the Company’s swaps, which was not considered an active market.
•Deferred compensation and other retirement plans -– These include obligations related to deferred compensation and other retirement plans adjusted for market performance. The fair value is obtained based on observable market prices quoted on public exchanges for similar instruments.
•Debt – These instruments are recorded at cost and include senior notesthe 2021 Credit Facilities and Senior Notes maturing through 2029.2032. The fair value of the long-termthese debt instruments is obtained based on observable market prices quoted on public exchanges for similar instruments.
The carrying values of Cash and cash equivalents, Restricted cash, Accounts and notes receivable, net, Accounts payable, Accrued compensation and benefits and Accrued expenses and other current liabilities are a reasonable estimate of their fair valuevalues due to the short-term nature of these instruments. As discussed in Note 2, the Company also has investments in debt and equity securities without readily determinable fair values, which are measured at cost minus impairment, if any, plus or minus changes resulting from observable price changes in orderly transactions for identical or similar investments of the same issuer and are qualitatively assessed for impairment indicators at each reporting period. As these investments are considered to be nonrecurring fair value measurements, they are not included in the fair value tables above.
The methodologies used by the Company to determine the fair value of its financial assets and liabilities at December 31, 2020,2023, are the same as those used at December 31, 2019.2022.
NOTE 14 – EQUITY
Ordinary Shares
The changes in Ordinaryordinary shares outstanding for the year ended December 31, 2020 are2023, were as follows:
| | | | | |
| In millions | Total |
December 31, 20192022 | 92.787.9 | |
| Shares issued under equity incentive plans | 0.40.1 | |
| |
| Repurchase of ordinary shares | (1.9)(0.5) | |
December 31, 20202023 | 91.287.5 | |
Allegion had 400.0 million ordinary shares authorized and 10.0 million preferred shares, $0.001 par value preferred sharesper share, authorized (with none outstanding) at December 31, 2020.
In February 2017,June 2023, the Company's Board of Directors approved areauthorized the Company's existing share repurchase authorizationprogram and, as a result, authorized the repurchase of up to, and including $500 million of the Company's ordinary shares (the "2017 Share"Share Repurchase Authorization"). On February 6, 2020, the Company's Board of Directors approved a new share repurchase authorization of up to, and including, $800 million of the Company's ordinary shares (the "2020 Share Repurchase Authorization"), replacing the existing 2017 Share Repurchase Authorization. The 2020 Share Repurchase Authorization does not have a prescribed expiration date. During the year ended December 31, 2020,2023, the Company paid $208.8$59.9 million to repurchase 1.90.5 million ordinary shares on the open market under these share repurchase authorizations.
Accumulated Other Comprehensive Loss
The changes in Accumulated other comprehensive loss were as follows:
| | | | | | | | | | | | | | | | | | | | | | | | | | |
| In millions | | Cash flow hedges | | Pension and OPEB items | | Foreign currency items | | Total |
| December 31, 2017 | | $ | 3.8 | | | $ | (107.6) | | | $ | (49.1) | | | $ | (152.9) | |
| Other comprehensive income (loss), net of tax | | 1.8 | | | (5.4) | | | (57.3) | | | (60.9) | |
Reclassification to Retained earnings upon adoption of ASU 2018-02(a) | | 0.5 | | | (10.2) | | | — | | | (9.7) | |
| December 31, 2018 | | 6.1 | | | (123.2) | | | (106.4) | | | (223.5) | |
Other comprehensive (loss) income, net of tax(b) | | (5.6) | | | (3.0) | | | 13.5 | | | 4.9 | |
| December 31, 2019 | | 0.5 | | | (126.2) | | | (92.9) | | | (218.6) | |
Other comprehensive (loss) income, net of tax(c) | | (1.4) | | | 5.9 | | | 57.0 | | | 61.5 | |
| December 31, 2020 | | $ | (0.9) | | | $ | (120.3) | | | $ | (35.9) | | | $ | (157.1) | |
(a)In February 2018, the FASB issued ASU 2018-02, "Income Statement-Reporting Comprehensive Income (Topic 220): Reclassification of Certain Tax Effects from Accumulated Other Comprehensive Income," allowing entities to reclassify tax effects stranded in AOCI as a result of the 2017 U.S. Tax Cuts and Jobs Act (the "Tax Reform Act"). The Company adopted ASU 2018-02 in 2018, the impact of which is reflected in the reclassification presented above.
(b)During 2019, the Company reclassified $26.2 million of accumulated foreign currency translation adjustments to earnings upon the sale of the Company's business operations in Colombia and Turkey, which is included in Foreign currency items in the table above. See Note 8 for further information on these divestitures.
(c)During 2020, the Company reclassified $12.8 million of accumulated foreign currency translation adjustments to earnings upon the liquidation of two legal entities in EMEA, which is included in Foreign currency items in the table above.
| | | | | | | | | | | | | | | | | | | | | | | | | | |
| In millions | | Cash flow hedges | | Defined benefit plan items | | Foreign currency items | | Total |
| December 31, 2020 | | $ | (0.9) | | | $ | (120.3) | | | $ | (35.9) | | | $ | (157.1) | |
| Other comprehensive (loss) income, net of tax | | 1.8 | | | 24.3 | | | (63.4) | | | (37.3) | |
| December 31, 2021 | | 0.9 | | | (96.0) | | | (99.3) | | | (194.4) | |
| Other comprehensive income (loss), net of tax | | 5.2 | | | (21.1) | | | (75.5) | | | (91.4) | |
| December 31, 2022 | | 6.1 | | | (117.1) | | | (174.8) | | | (285.8) | |
| Other comprehensive income (loss), net of tax | | (0.5) | | | (8.8) | | | 33.6 | | | 24.3 | |
| December 31, 2023 | | $ | 5.6 | | | $ | (125.9) | | | $ | (141.2) | | | $ | (261.5) | |
All amounts of Other comprehensive income (loss),loss, net attributable to noncontrolling interests on the Consolidated Statements of Equity relate to foreign currency items.
NOTE 15 – SHARE-BASED COMPENSATION
The Company records share-based compensation awards using a fair value method and recognizes compensation expense for an amount equal to the fair value of the share-based payment issued in its financial statements. The Company’s share-based compensation plans include programs for stock options, restricted stock units ("RSUs"), performance stock units ("PSUs") and deferred compensation.
Under the Company's shareholder-approved equity incentive stock plan, the total numbera maximum of 2.7 million ordinary shares are authorized by the shareholders is 8.0for issuance, of which 2.7 million of which 2.9 million remainremained available for issuance as of December 31, 20202023, for future equity incentive awards.
Compensation Expense
Share-based compensation expense is included in Cost of goods sold and Selling and administrative expenses within the Consolidated Statements of Comprehensive Income. The following table summarizes the expenses recognized for the years ended December 31:
| | | | | | | | | | | | | | | | | | | | |
| In millions | | 2020 | | 2019 | | 2018 |
| Stock options | | $ | 3.8 | | | $ | 3.5 | | | $ | 4.3 | |
| RSUs | | 11.4 | | | 10.0 | | | 9.6 | |
| PSUs | | 5.6 | | | 6.9 | | | 5.7 | |
| Deferred compensation | | 2.4 | | | 3.2 | | | (0.8) | |
| | | | | | |
| Pre-tax expense | | 23.2 | | | 23.6 | | | 18.8 | |
Tax benefit(a) | | (2.9) | | | (3.0) | | | (1.9) | |
| After-tax expense | | $ | 20.3 | | | $ | 20.6 | | | $ | 16.9 | |
(a)Tax benefit reflected in the table above does not include the excess benefit from exercises and vesting of share-based compensation of $4.5 million, $2.8 million and $1.5 million for the years ended December 31, 2020, 2019 and 2018, respectively.
| | | | | | | | | | | | | | | | | | | | |
| In millions | | 2023 | | 2022 | | 2021 |
| Stock options | | $ | 4.3 | | | $ | 4.4 | | | $ | 3.9 | |
| RSUs | | 14.6 | | | 14.2 | | | 13.6 | |
| PSUs | | 7.5 | | | 5.9 | | | 5.9 | |
| | | | | | |
| Pre-tax expense | | 26.4 | | | 24.5 | | | 23.4 | |
| Tax benefit | | (2.7) | | | (2.7) | | | (2.6) | |
| After-tax expense | | $ | 23.7 | | | $ | 21.8 | | | $ | 20.8 | |
Stock Options / RSUs
Eligible participants may receive (i) stock options, (ii) RSUs or (iii) a combination of both stock options and RSUs. The weighted-average fair value of each of the Company’s stock option and RSU awards is expensed on a straight-line basis over the required service period, which is generally the 3-year vesting period. However, for stock options and RSUs granted to retirement eligible employees, the Company recognizes expense for the fair value at the grant date.
The average fair value of the stock options granted for the years ended December 31, 2020, 20192023, 2022 and 2018,2021, was estimated to be $25.62, $19.58$33.66, $28.24 and $21.29$24.99 per share, respectively, using the Black-Scholes option-pricing model. The weighted-average assumptions used were as follows:
| | 2020 | | 2019 | | 2018 |
| | 2023 | | | | 2023 | | 2022 | | 2021 |
| Dividend yield | Dividend yield | | 0.99 | % | | 1.23 | % | | 0.97 | % | Dividend yield | | 1.60 | % | | 1.46 | % | | 1.32 | % |
| Volatility | Volatility | | 20.70 | % | | 21.44 | % | | 22.38 | % | Volatility | | 28.47 | % | | 27.12 | % | | 27.14 | % |
| Risk-free rate of return | Risk-free rate of return | | 1.41 | % | | 2.53 | % | | 2.75 | % | Risk-free rate of return | | 4.10 | % | | 2.13 | % | | 0.75 | % |
| Expected life | Expected life | | 6.0 years | | 6.0 years | | 6.0 years | Expected life | | 6.0 years |
Volatility is based on the Company's historic volatility for the prior six years.volatility. The risk-free rate of return is based on the yield curve of a zero-coupon U.S. Treasury bond on the date the award is granted with a maturity equal to the expected term of the award. The expected life of the Company’s stock option awards is derived from the simplified approach based on the weighted-average time to vest and the remaining contractual term and represents the period of time that awards are expected to be outstanding.
Changes in options outstanding under the plans for the years ended December 31, 2020, 20192023, 2022 and 2018,2021, were as follows:
| | Shares
subject
to option | | Weighted- average exercise price(a) | | Aggregate
intrinsic
value (millions) | | Weighted-average
remaining life (years) |
| December 31, 2017 | | 1,051,880 | | | $ | 47.80 | | | | | |
| | Shares
subject
to option | | | | Shares
subject
to option | | Weighted- average exercise price(a) | | Aggregate
intrinsic
value (millions) | | Weighted-average
remaining life (years) |
| December 31, 2020 | |
| Granted | |
| Granted | |
| Granted | Granted | | 160,849 | | | 86.92 | | |
| Exercised | Exercised | | (239,427) | | | 36.50 | | |
| Exercised | |
| Exercised | |
| Canceled | |
| Canceled | |
| Canceled | Canceled | | (16,104) | | | 74.23 | | | | | | | (26,042) | | | 109.36 | | 109.36 | | | | | |
| | December 31, 2018 | | 957,198 | | | 56.71 | | |
| December 31, 2021 | |
| December 31, 2021 | |
| December 31, 2021 | |
| Granted | |
| Granted | |
| Granted | Granted | | 195,675 | | | 88.07 | | |
| Exercised | Exercised | | (272,003) | | | 42.97 | | |
| Exercised | |
| Exercised | |
| Canceled | |
| Canceled | |
| Canceled | Canceled | | (17,248) | | | 85.22 | | | | | | | (7,366) | | | 115.55 | | 115.55 | | | | | |
| | December 31, 2019 | | 863,622 | | | 67.57 | | |
| December 31, 2022 | |
| December 31, 2022 | |
| December 31, 2022 | |
| Granted | |
| Granted | |
| Granted | Granted | | 161,600 | | | 129.26 | | |
| Exercised | Exercised | | (256,704) | | | 52.89 | | |
| Exercised | |
| Exercised | |
| Canceled | |
| Canceled | |
| Canceled | Canceled | | (8,376) | | | 107.23 | | | | | | | (12,182) | | | 117.82 | | 117.82 | | | | | |
| | Outstanding December 31, 2020 | | 760,142 | | | $ | 85.18 | | | $ | 25.7 | | | 6.6 |
| Exercisable December 31, 2020 | | 440,987 | | | $ | 68.70 | | | $ | 21.1 | | | 5.4 |
| Outstanding December 31, 2023 | |
| | Outstanding December 31, 2023 | |
| | Outstanding December 31, 2023 | | | 1,000,360 | | | $ | 104.01 | | | $ | 23.1 | | | 5.7 |
| Exercisable December 31, 2023 | | Exercisable December 31, 2023 | | 643,947 | | | $ | 99.66 | | | $ | 17.8 | | | 4.6 |
(a)The weighted-average exercise price of awards represents the exercise price of the awards on the grant date converted to ordinary shares of the Company.
The following table summarizes information concerning currently outstanding and exercisable options:options as of December 31, 2023:
| | | | | Options outstanding | | Options exercisable | | | | | | | Options outstanding | | Options exercisable |
Range of
exercise price | Range of
exercise price | | Number
outstanding at
December 31,
2020 | | Weighted-
average
remaining
life (years) | | Weighted-
average
exercise
price | | Number
exercisable at
December 31,
2020 | | Weighted-
average
remaining
life (years) | | Weighted-
average
exercise
price | Range of
exercise price | | Number
outstanding at
December 31,
2023 | | Weighted-
average
remaining
life (years) | | Weighted-
average
exercise
price | | Number
exercisable at
December 31,
2023 | | Weighted-
average
remaining
life (years) | | Weighted-
average
exercise
price |
| | $ | 0.01 | | | — | | $ | 25.00 | | | 3,223 | | | 1.1 | | $ | 24.96 | | | 3,223 | | | 1.1 | | $ | 24.96 | |
| 25.01 | | | — | | 50.00 | | | 34,206 | | | 1.5 | | 31.34 | | | 34,206 | | | 1.5 | | 31.34 | |
| | 50.01 | |
| | 50.01 | |
| | 50.01 | 50.01 | | | — | | 75.00 | | | 258,428 | | | 5.0 | | 63.40 | | | 258,428 | | | 5.0 | | 63.40 | |
| 75.01 | 75.01 | | | — | | 100.00 | | | 307,127 | | | 7.4 | | 87.59 | | | 143,379 | | | 7.1 | | 87.40 | |
| 100.01 | 100.01 | | | — | | 125.00 | | | 391 | | | 9.4 | | 100.68 | | | 0 | | | 0.0 | | 0 | |
| 125.01 | 125.01 | | | — | | 150.00 | | | 156,767 | | | 9.0 | | 129.33 | | | 1,751 | | | 2.7 | | 129.33 | |
| | | | | | | 1,000,360 | |
| | 760,142 | | | 6.6 | | $ | 85.18 | | | 440,987 | | | 5.4 | | $ | 68.70 | |
| | | | | | 1,000,360 | |
| | | | | | | 1,000,360 | |
At December 31, 2020,2023, there was $1.5$4.0 million of total unrecognized compensation cost from stock option arrangements granted under the plan, which is primarily related to unvested shares ofstock options held by non-retirement eligible employees. The aggregate intrinsic value of the Company'sstock options exercised during the years ended December 31, 20202023 and 2019,2022, was $18.8$3.5 million and $16.3$2.9 million, respectively. Generally, stock options expire ten years from their date of grant.
The following table summarizes RSU activity for the years ended December 31, 2020, 20192023, 2022 and 2018:2021:
| | RSUs | | Weighted-average grant date fair value(a) |
| Outstanding and unvested at December 31, 2017 | | 230,006 | | | $ | 66.83 | |
| RSUs | | | RSUs | | Weighted-average grant date fair value(a) |
| Outstanding and unvested at December 31, 2020 | |
| Granted | Granted | | 132,865 | | | 84.65 | |
| Vested | Vested | | (104,065) | | | 65.42 | |
| Canceled | Canceled | | (14,459) | | | 76.25 | |
| Outstanding and unvested at December 31, 2018 | | 244,347 | | | 76.51 | |
| Outstanding and unvested at December 31, 2021 | |
| Granted | Granted | | 134,518 | | | 91.75 | |
| Vested | Vested | | (118,060) | | | 73.52 | |
| Canceled | Canceled | | (24,286) | | | 79.53 | |
| Outstanding and unvested at December 31, 2019 | | 236,519 | | | 86.37 | |
| Outstanding and unvested at December 31, 2022 | |
| Granted | Granted | | 81,796 | | | 124.91 | |
| Vested | Vested | | (113,776) | | | 85.40 | |
| Canceled | Canceled | | (9,249) | | | 91.73 | |
| Outstanding and unvested at December 31, 2020 | | 195,290 | | | $ | 102.52 | |
| Outstanding and unvested at December 31, 2023 | |
(a)The weighted-average grant date fair value represents the fair value of the awards on the grant date converted to ordinary shares of the Company.
At December 31, 2020,2023, there was $6.1$11.7 million of total unrecognized compensation cost from RSU arrangements granted under the plan, which is primarily related to unvested shares ofRSUs held by non-retirement eligible employees.
Performance Stock
The Company has a Performance Stock Program ("PSP") for key employees which provides awards inIn February 2021, 2022 and 2023, the form of PSUs based on performance against pre-established objectives. The annual target award level is expressed as a numberCompensation Committee of the Company's ordinary shares. All PSUs are settled in the formBoard of ordinary shares unless deferred.
In February 2018, 2019 and 2020, the Company's Compensation CommitteeDirectors granted PSUs that were earnedvested based 50% upon a performance condition, measured at each reporting period by earnings per share ("EPS") performance during a three-year performance period in relation to pre-established targets set by the Compensation Committee, and 50% upon a market condition, measured by the Company’s relative total shareholder return ("TSR") against the S&P 400 Capital Goods Index over a three-year performance period. The fair values of the market conditions are estimated using a Monte Carlo simulation approach in a risk-neutral framework to model future stock price movements based upon historical volatility, risk-free rates of return and correlation matrix.
The following table summarizes PSU activity for the maximum number of shares that may be issued upon vesting of those awards for the years ended December 31, 2020, 20192023, 2022 and 2018:2021:
| | PSUs | | Weighted-average grant date fair value(a) |
| Outstanding and unvested at December 31, 2017 | | 160,823 | | | $ | 55.02 | |
| PSUs | | | PSUs | | Weighted-average grant date fair value(a) |
| Outstanding and unvested at December 31, 2020 | |
| Granted | Granted | | 93,018 | | | 86.46 | |
| Vested | Vested | | (90,967) | | | 68.05 | |
| Forfeited | Forfeited | | (6,833) | | | 79.93 | |
| Outstanding and unvested at December 31, 2018 | | 156,041 | | | 65.07 | |
| Outstanding and unvested at December 31, 2021 | |
| Granted | Granted | | 68,125 | | | 87.02 | |
| Vested | Vested | | (56,773) | | | 61.00 | |
| Forfeited | Forfeited | | (10,045) | | | 68.63 | |
| Outstanding and unvested at December 31, 2019 | | 157,348 | | | 75.82 | |
| Outstanding and unvested at December 31, 2022 | |
| Granted | Granted | | 92,913 | | | 113.54 | |
| Vested | Vested | | (101,638) | | | 83.16 | |
| Forfeited | Forfeited | | (2,647) | | | 121.43 | |
| Outstanding and unvested at December 31, 2020 | | 145,976 | | | $ | 93.89 | |
| Outstanding and unvested at December 31, 2023 | |
(a)The weighted-average grant date fair value represents the fair value of the awards on the grant date converted to ordinary shares of the Company.
At December 31, 2020,2023, there was $4.6$10.4 million of total unrecognized compensation cost from the PSP based on currentactual performance through such date, which is related to shares underlying unvested shares.awards. This compensation cost will be recognized over the required service period, which is generally the three-year performance/vesting period.
Deferred Compensation
Prior to 2019, the Company allowed key employees to defer a portion of their eligible granted PSUs and/or compensation into a number of investment choices including its ordinary share equivalents. Any amounts invested in ordinary share equivalents will be settled in ordinary shares of the Company at the time of distribution.
NOTE 16 – RESTRUCTURING ACTIVITIES
Restructuring charges recorded duringDuring the years ended December 31, 2023, 2022 and 2021, the Company recorded $12.5 million, $3.3 million and $4.3 million, respectively, of expenses associated with restructuring activities. Restructuring activities in each period were follows:
| | | | | | | | | | | | | | | | | | | |
| In millions | 2020 | | 2019 | | 2018 | | |
| Americas | $ | 5.5 | | | $ | 1.4 | | | $ | 0.5 | | | |
| EMEA | 12.4 | | | 13.4 | | | 3.3 | | | |
| Asia Pacific | 4.4 | | | 1.7 | | | 1.1 | | | |
| Corporate and Other | 3.3 | | | 0 | | | 0 | | | |
| Total | $ | 25.6 | | | $ | 16.5 | | | $ | 4.9 | | | |
| | | | | | | |
| Cost of goods sold | $ | 5.2 | | | $ | 8.3 | | | $ | 1.7 | | | |
| Selling and administrative expenses | 20.4 | | | 6.3 | | | 3.2 | | | |
| Total | $ | 25.6 | | | $ | 14.6 | | | $ | 4.9 | | | |
Restructuring charges across all regions are primarily related to workforce reductions intended to optimize and simplify operations and cost structure. Restructuring charges in EMEA also included costs related to the closure of the Company's production facility in Turkey in 2019. Approximately $1.9 million of the 2019 restructuring charges related to pension curtailment costs, whichexpenses are included within Other (income) expense, netCost of goods sold and Selling and administrative expenses within the Consolidated Statements of Comprehensive Income.
The changes in the restructuring reserve during the years ended December 31, 20202023 and 2019,2022, were as follows:
| | | | | | | | | | | | | |
| In millions | | | | | | | | | Total |
December 31, 20182021 | | | | | | | | | $ | 2.10.4 | |
| Additions, net of reversals | | | | | | | | | 16.53.3 | |
| Cash payments | | | | | | | | | (17.3)(3.4) | |
| Currency translation | | | | | | | | | (0.1) | |
December 31, 20192022 | | | | | | | | | 1.20.2 | |
| Additions, net of reversals | | | | | | | | | 25.012.5 | |
| Cash payments | | | | | | | | | (21.3)(10.9) | |
| Currency translation | | | | | | | | | 0.40.1 | |
December 31, 20202023 | | | | | | | | | $ | 5.31.9 | |
The majority of the costs accrued as of December 31, 2020, will2023, are expected to be paid within one year.
The Company also incurred other non-qualified restructuring charges, of $1.2 million, $5.7 million and $1.6 million during the years ended December 31, 2020, 2019 and 2018, respectively, which represent costs directly attributable to restructuring activities, but that do not fall into the severance, exit or disposal category. Approximately $4.3 million ofThese costs were not material during the non-qualified restructuring expenses incurred during 2019 related to the closure of the Company's production facility in Turkey.years ended December 31, 2023, 2022 and 2021. Non-qualified restructuring charges are included within Cost of goods sold and Selling and administrative expenses within the Consolidated Statements of Comprehensive Income.
The Company anticipates additional future restructuring charges
Contents
NOTE 17 – OTHER (INCOME) EXPENSE,INCOME, NET
At December 31, theThe components of Other (income) expense,income, net for the years ended December 31, were as follows:
| | | | | | | | | | | | | | | | | | | | |
| In millions | | 2020 | | 2019 | | 2018 |
| Interest income | | $ | (0.9) | | | $ | (1.8) | | | $ | (0.8) | |
| Foreign currency exchange loss | | 0.7 | | | 1.8 | | | 0.3 | |
| (Earnings) loss from equity method investments | | (0.3) | | | 0.1 | | | (0.4) | |
| Net periodic pension and postretirement benefit (income) cost, less service cost | | (2.2) | | | 6.8 | | | (2.8) | |
| Other | | (10.3) | | | (3.1) | | | 0.3 | |
| Other (income) expense, net | | $ | (13.0) | | | $ | 3.8 | | | $ | (3.4) | |
Other (income) expense, net for the year ended December 31, 2020, included gains of $12.8 million related to the reclassification to earnings of accumulated foreign currency translation adjustments upon the liquidation of two legal entities in EMEA. These gains are included within Other in the table above. | | | | | | | | | | | | | | | | | | | | |
| In millions | | 2023 | | 2022 | | 2021 |
| Interest income | | $ | (6.8) | | | $ | (1.3) | | | $ | (0.4) | |
| Foreign currency exchange loss | | 3.9 | | | 2.4 | | | 2.7 | |
| Earnings and gains from the sale of equity method investments, net | | (1.0) | | | (0.8) | | | (6.4) | |
| Net periodic pension and postretirement benefit cost (income), less service cost | | 1.0 | | | (9.4) | | | (7.1) | |
| Other expense (income) | | 1.0 | | | (2.5) | | | (32.8) | |
| Other income, net | | $ | (1.9) | | | $ | (11.6) | | | $ | (44.0) | |
NOTE 18 – INCOME TAXES
Earnings before income taxes for the years ended December 31 were taxed within the following jurisdictions:
| | In millions | In millions | | 2020 | | 2019 | | 2018 | In millions | | 2023 | | 2022 | | 2021 |
| U.S. | U.S. | | $ | 151.4 | | | $ | 211.1 | | | $ | 151.4 | |
| Non-U.S. | Non-U.S. | | 214.0 | | | 264.1 | | | 323.8 | |
| Total | Total | | $ | 365.4 | | | $ | 475.2 | | | $ | 475.2 | |
earnings, which includes the impact of the location of earnings as well as the tax cost on the Company's international operations, can vary as a result of operating fluctuations in the normal course of business, the impact of internal restructurings and as a result of the extent and location of other income and expense items, such as restructuring charges, asset impairments and gains or losses on strategic business decisions. The components of the Provision for income taxes for the years ended December 31 were as follows:
| | In millions | In millions | | 2020 | | 2019 | | 2018 | In millions | | 2023 | | 2022 | | 2021 |
| Current tax expense: | Current tax expense: | | | | | | |
| U.S. | |
| U.S. | |
| U.S. | U.S. | | $ | 55.0 | | | $ | 87.1 | | | $ | 86.4 | |
| Non-U.S. | Non-U.S. | | 20.3 | | | 16.2 | | | 18.1 | |
| Total: | Total: | | 75.3 | | | 103.3 | | | 104.5 | |
| Deferred tax benefit: | Deferred tax benefit: | |
| U.S. | U.S. | | (13.4) | | | (25.2) | | | (56.1) | |
| U.S. | |
| U.S. | |
| Non-U.S. | Non-U.S. | | (11.0) | | | (5.0) | | | (8.6) | |
| Total: | Total: | | (24.4) | | | (30.2) | | | (64.7) | |
| Total tax expense: | Total tax expense: | |
| U.S. | U.S. | | 41.6 | | | 61.9 | | | 30.3 | |
| U.S. | |
| U.S. | |
| Non-U.S. | Non-U.S. | | 9.3 | | | 11.2 | | | 9.5 | |
| Total | Total | | $ | 50.9 | | | $ | 73.1 | | | $ | 39.8 | |
The Provision for income taxes differs from the amount of income taxes determined by applying the applicable U.S. statutory income tax rate to pretax income, as a result of the following differences:
| | | | | Percent of pretax income | | | Percent of pretax income |
| | | | 2020 | | 2019 | | 2018 | | | 2023 | | 2022 | | 2021 |
| Statutory U.S. rate | Statutory U.S. rate | | 21.0 | % | | 21.0 | % | | 21.0 | % | Statutory U.S. rate | | 21.0 | % | | 21.0 | % | | 21.0 | % |
| Increase (decrease) in rates resulting from: | Increase (decrease) in rates resulting from: | |
| Non-U.S. tax rate differential (1) | Non-U.S. tax rate differential (1) | | (17.5) | | | (10.6) | | | (11.9) | |
Non-U.S. tax rate differential (1) | |
Non-U.S. tax rate differential (1) | |
| | State and local income taxes (1) | State and local income taxes (1) | | 2.4 | | | 3.0 | | | 2.1 | |
State and local income taxes (1) | |
State and local income taxes (1) | |
| | Reserves for uncertain tax positions | |
| Reserves for uncertain tax positions | |
| Reserves for uncertain tax positions | |
| Tax on unremitted earnings | |
| | Reserves for uncertain tax positions | | 1.1 | | | 0.5 | | | 2.1 | |
| Tax on unremitted earnings | | (0.1) | | | 0.1 | | | (1.2) | |
| Tax Reform Act | | 0 | | | 0 | | | (4.6) | |
| Trade incentives | | 0 | | | 0.2 | | | 0.6 | |
| Impairment of goodwill and intangible assets | | 7.3 | | | 0 | | | 0 | |
| Impact of divestitures | | 0 | | | 1.6 | | | 0 | |
| | Other adjustments | |
| | Other adjustments | |
| | Other adjustments | Other adjustments | | (0.3) | | | (0.4) | | | 0.3 | |
| Effective tax rate | Effective tax rate | | 13.9 | % | | 15.4 | % | | 8.4 | % | Effective tax rate | | 12.4 | % | | 10.9 | % | | 7.8 | % |
(1)Net of changes in valuation allowances
On December 22, 2017, the Tax Reform Act became law, resulting in broad and complex changes to the U.S. tax code. The impact to the Company's Consolidated Financial Statements during the year ended December 31, 2017, included, but were not limited to, a (1) reduced U.S. federal corporate tax rate from 35.0% to 21.0%, effective January 1, 2018, (2) required a one-time transition tax on certain unrepatriated earnings of non-U.S. subsidiaries and (3) required review of the future realizability of deferred tax balances.
Shortly after the Tax Reform Act was enacted, the SEC staff issued Staff Accounting Bulletin No. 118, Income Tax Accounting Implications of the Tax Cuts and Jobs Act (SAB 118) which provided guidance on accounting for the Tax Reform Act’s impact. SAB 118 provided a measurement period, which in no case was to extend beyond one year from the Tax Reform Act enactment date, during which a company acting in good faith could complete the accounting for the impacts of the Tax Reform Act under ASC Topic 740. In finalizing the net tax charge resulting from the Tax Reform Act, in accordance with the one-year SAB 118 measurement period, the Company reversed $22.8 million of previous charges and recorded an additional $0.9 million of transition tax in 2018.
The majority of the Company's earnings are considered permanently reinvested, and therefore, the Company has not recorded any incremental withholding or income tax liabilities on earnings of its non-U.S. subsidiaries.
these permanently reinvested earnings. At December 31, a summary of the deferred tax accounts was as follows:
| | In millions | In millions | | 2020 | | 2019 | In millions | | 2023 | | 2022 |
| Deferred tax assets: | Deferred tax assets: | | | | |
| Inventory and accounts receivable | |
| Inventory and accounts receivable | |
| Inventory and accounts receivable | Inventory and accounts receivable | | $ | 6.5 | | | $ | 5.3 | |
| Fixed assets and intangibles | Fixed assets and intangibles | | 2.6 | | | 2.3 | |
| Lease liabilities | Lease liabilities | | 22.0 | | | 19.0 | |
| Postemployment and other benefit liabilities | Postemployment and other benefit liabilities | | 29.9 | | | 31.0 | |
| | Other reserves and accruals | Other reserves and accruals | | 16.4 | | | 14.2 | |
| Other reserves and accruals | |
| Other reserves and accruals | |
| Net operating losses, tax credits and other carryforwards | Net operating losses, tax credits and other carryforwards | | 386.1 | | | 346.3 | |
| | Other | |
| Other | |
| Other | Other | | 1.8 | | | 0.8 | |
| Gross deferred tax assets | Gross deferred tax assets | | 465.3 | | | 418.9 | |
| Less: deferred tax valuation allowances | Less: deferred tax valuation allowances | | (259.7) | | | (241.0) | |
| Deferred tax assets net of valuation allowances | Deferred tax assets net of valuation allowances | | $ | 205.6 | | | $ | 177.9 | |
| Deferred tax liabilities: | Deferred tax liabilities: | | | | |
| | Fixed assets and intangibles | Fixed assets and intangibles | | $ | (112.0) | | | $ | (104.3) | |
| | Fixed assets and intangibles | |
| | Fixed assets and intangibles | |
| Right of use assets | Right of use assets | | (21.7) | | | (19.0) | |
| Postemployment and other benefit liabilities | Postemployment and other benefit liabilities | | (6.8) | | | (5.1) | |
| Unremitted earnings of foreign subsidiaries | Unremitted earnings of foreign subsidiaries | | (1.4) | | | (2.4) | |
| | Other | Other | | (5.6) | | | (3.8) | |
| Other | |
| Other | |
| Gross deferred tax liabilities | Gross deferred tax liabilities | | (147.5) | | | (134.6) | |
| Net deferred tax assets | Net deferred tax assets | | $ | 58.1 | | | $ | 43.3 | |
At December 31, 2020, $1.42023, $3.4 million of deferred taxes were recorded for certain undistributed earnings of non-U.S. subsidiaries. Historically, no deferred taxes have been provided for any portion of the remaining undistributed earnings of the Company's subsidiaries since these earnings have been, and will continue to be, permanently reinvested in these subsidiaries. For many reasons, including the number of legal entities and jurisdictions involved, the complexity of the Company's legal entity structure, the complexity of tax laws in the relevant jurisdictions and the impact of projections of income for future years to any calculations, the Company believes it is not practicable to estimate, within any reasonable range, the amount of additional taxes which may be payable upon the distribution of earnings.
At December 31, 2020,2023, the Company had the following tax losses and tax credit carryforwards available to offset taxable income in prior and future years:
| | | | | | | | | | | | | | |
| In millions | | Amount | | Expiration
|
| U.S. Federal tax loss carryforwards | | $ | 18.915.6 | | | 2027-20372029-Unlimited |
| U.S. Federal and State credit carryforwards | | 22.524.2 | | | 2025-20372024-2037 |
| U.S. State tax loss carryforwards | | 22.96.8 | | | 2021-Unlimited2024-Unlimited |
| | | | |
| | | | |
| Non-U.S. tax loss carryforwards | | $ | 1,015.81,034.0 | | | 2021-Unlimited2025-Unlimited |
The U.S. state loss carryforwards were incurred in various jurisdictions. The non-U.S. loss carryforwards were incurred in various jurisdictions, predominantly in China, Ireland, Italy, Luxembourg and the United Kingdom.
The Company evaluates its deferred income tax assets to determine if valuation allowances are required or should be adjusted. GAAP requires that companies assess whether valuation allowances should be established against their deferred tax assets based on consideration of all available evidence, both positive and negative, using a "more likely than not" standard. This assessment considers the nature, frequency and amount of recent losses, the duration of statutory carryforward periods and tax planning strategies. In making such judgments, significant weight is given to evidence that can be objectively verified.
Activity associated with the Company’s valuation allowance is as follows:
| | In millions | In millions | | 2020 | | 2019 | | 2018 | In millions | | 2023 | | 2022 | | 2021 |
| Beginning balance | Beginning balance | | $ | 241.0 | | | $ | 357.1 | | | $ | 312.9 | |
| Increase to valuation allowance | Increase to valuation allowance | | 21.1 | | | 2.8 | | | 70.9 | |
| Decrease to valuation allowance | Decrease to valuation allowance | | (2.8) | | | (118.6) | | | (25.0) | |
| Foreign exchange translation | Foreign exchange translation | | 0.4 | | | (0.3) | | | (1.7) | |
| | Ending balance | Ending balance | | $ | 259.7 | | | $ | 241.0 | | | $ | 357.1 | |
| | Ending balance | |
| | Ending balance | |
During the year ended December 31, 2020,2023, the valuation allowance increased by $18.7$16.3 million, while during the year ended December 31, 2019,2022, the valuation allowance decreased by $116.1$0.8 million. The increase for theCompany's valuation allowance will fluctuate from year ended December 31, 2020, and the decrease for theto year ended December 31, 2019, are theas a result of changes in country specific tax laws, internal restructurings, jurisdictional profitability and changes in judgments and facts regarding the realizability of deferred tax assets.
The Company has total unrecognized tax benefits of $41.2$45.1 million and $37.3$45.2 million as of December 31, 20202023 and 2019,2022, respectively. The amount of unrecognized tax benefits that, if recognized, would affect the effective tax rate is $41.2$45.1 million as of December 31, 2020.2023. A reconciliation of the beginning and ending amount of unrecognized tax benefits is as follows:
| | In millions | In millions | | 2020 | | 2019 | | 2018 | In millions | | 2023 | | 2022 | | 2021 |
| Beginning balance | Beginning balance | | $ | 37.3 | | | $ | 42.0 | | | $ | 29.0 | |
| Additions based on tax positions related to the current year | Additions based on tax positions related to the current year | | 6.0 | | | 5.7 | | | 9.5 | |
| | Additions based on tax positions related to prior years | Additions based on tax positions related to prior years | | 4.1 | | | 1.7 | | | 8.2 | |
| Reductions based on tax positions related to prior years | Reductions based on tax positions related to prior years | | (1.5) | | | (7.0) | | | (1.4) | |
| Reductions related to settlements with tax authorities | Reductions related to settlements with tax authorities | | (0.3) | | | (4.0) | | | (1.5) | |
| Reductions related to lapses of statute of limitations | Reductions related to lapses of statute of limitations | | (5.2) | | | (0.8) | | | (1.1) | |
| Translation loss/(gain) | Translation loss/(gain) | | 0.8 | | | (0.3) | | | (0.7) | |
| Ending balance | Ending balance | | $ | 41.2 | | | $ | 37.3 | | | $ | 42.0 | |
The Company records interest and penalties associated with the uncertain tax positions within its provision for income taxes. The Company had reserves associated with interest and penalties, net of tax, of $7.6$9.0 million and $6.2$11.0 million at December 31, 20202023 and 2019,2022, respectively. For the yearsyear ended December 31, 2020 and 2019,2023, the Company recognized $1.9a $2.7 million and $1.3 millionreduction in net interest and penalties, net of tax, related to these uncertain tax positions.
The total amount of unrecognized tax benefits relating to the Company's tax positions is subject to change based on future events including, but not limited to, the settlements of ongoing audits and/or the expiration of applicable statutes of limitations. Although the outcomes and timing of such events are highly uncertain, it is reasonably possible that the balance of gross unrecognized tax benefits, excluding interest and penalties, could potentially be reduced by up to approximately $14.8$10.8 million during the next 12 months.
The provision for income taxes involves a significant amount of management judgment regarding interpretation of relevant facts and laws in the jurisdictions in which the Company operates. Future changes in applicable laws, projected levels of taxable income and tax planning could change the effective tax rate and tax balances recorded by the Company. In addition, tax authorities periodically review income tax returns filed by the Company and can raise issues regarding its filing positions, timing and amount of income or deductions and the allocation of income among the jurisdictions in which the Company operates. A significant period of time may elapse between the filing of an income tax return and the ultimate resolution of an issue raised by a tax authority with respect to that return. In the normal course of business, the Company is subject to examination by taxing authorities throughout the world, including such major jurisdictions as Australia, Canada, France, Germany, Italy, Mexico, the Netherlands, Poland and the U.S. In general, the examination of the material tax returns of subsidiaries of the Company is complete for the years prior to 2003,2014, with certain matters being resolved through appeals and litigation.
NOTE 19 – EARNINGS PER SHARE (EPS)
Basic EPS is calculated by dividing Net earnings attributable to Allegion plc by the weighted-average number of ordinary shares outstanding for the applicable period. Diluted EPS is calculated after adjusting the denominator of the basic EPS calculation for the effect of all potentially dilutive ordinary shares, which in the Company’s case, includes shares issuable under its share-based compensation plans.
The following table summarizes the weighted-average number of ordinary shares outstanding for basic and diluted earnings per share calculations:
| | In millions | In millions | | 2020 | | 2019 | | 2018 | In millions | | 2023 | | 2022 | | 2021 |
| Weighted-average number of basic shares | Weighted-average number of basic shares | | 92.3 | | | 93.6 | | | 95.0 | |
| Shares issuable under share-based compensation plans | Shares issuable under share-based compensation plans | | 0.5 | | | 0.7 | | | 0.7 | |
| Weighted-average number of diluted shares | Weighted-average number of diluted shares | | 92.8 | | | 94.3 | | | 95.7 | |
AtAs of December 31, 2020, 0.12023 and 2022, 0.6 million and 0.5 million stock options were excluded from the computation of weighted-average diluted shares outstanding, respectively, because the effect of including these shares would have been anti-dilutive.
NOTE 20 – NET REVENUES
Net revenues are recognized based on the satisfaction of performance obligations under the terms of a contract. A performance obligation is a promise in a contract to transfer control of a distinct product or to provide a service, or a bundle of products or services, to a customer. The Company has two principal revenue streams, tangible product sales and services. Approximately 99% of consolidated Net revenues involve contracts with a single performance obligation, the transfer of control of a product or bundle of products to a customer. Transfer of control typically occurs when goods are shipped from the Company's facilities or at other predetermined control transfer points (for instance, destination terms). Net revenues are measured as the amount of consideration expected to be received in exchange for transferring control of the products and takes into account variable consideration, such as sales incentive programs including discounts and volume rebates. The existence of these programs does not preclude revenue recognition but does require the Company's best estimate of the variable consideration to be made based on expected activity, as these items are reserved for as a deduction to Net revenues over time based on the Company's historical rates of providing these incentives and annual forecasted sales volumes. The Company also offers a standard warranty with most product sales and the value of such warranty is included in the contractual price. The corresponding cost of the warranty obligation is accrued as a liability (see Note 21).
The Company's remaining Net revenues involve services, including installation and consulting. Unlike the single performance obligation to ship a product or bundle of products, revenue recognition related to services revenues is delayed until the service based performance obligations are satisfied. In some instances, customer acceptance provisions are included in sales arrangements to give the buyer the ability to ensure the service meets any established criteria. In these instances, revenue recognition is deferred until the performance obligations are satisfied, which could include acceptance terms specified in the arrangement being fulfilled through customer acceptance or a demonstration that established criteria have been satisfied. During the years ended December 31, 2020 and 2019, no adjustments related to performance obligations satisfied in previous periods were recorded.
The Company applies the practical expedients allowed under ASC 606 to omit the disclosure of remaining performance obligations for contracts with an original expected duration of one year or less and for contracts where the Company has the right to invoice for performance completed to date. The transaction price is not adjusted for the effects of a significant financing component, as the time period between control transfer of goods and services is less than one year. Sales, value-added and other similar taxes collected by the Company are excluded from Net revenues. The Company has also elected to account for shipping and handling activities that occur after control of the related goods transfers as fulfillment activities instead of performance obligations. These activities are included in Cost of goods sold in the Consolidated Statements of Comprehensive Income. The Company’s payment terms are generally consistent with the industries in which its businesses operate.
The following table shows the Company's Net revenues related to both tangible product sales and services for the years ended December 31, 2020, 20192023, 2022 and 2018,2021, respectively, disaggregated by business segment. Net revenues are shown by tangible product sales and services, as contract terms, conditions and economic factors affecting the nature, amount, timing and uncertainty around revenue recognition and cash flows are substantially similar within each of thethese two principal revenue streams:
| | 2023 | | | 2023 |
| In millions | | In millions | Allegion Americas | | Allegion International | | Total |
| | 2020 |
| In millions | Americas | | EMEA | | Asia Pacific | | Consolidated |
| Net revenues | | | | | | | |
| Products | |
| Products | |
| Products | Products | $ | 2,016.7 | | | $ | 530.4 | | | $ | 141.8 | | | $ | 2,688.9 | |
| Services | Services | 0 | | | 24.2 | | | 6.8 | | | 31.0 | |
| Total Net revenues | Total Net revenues | $ | 2,016.7 | | | $ | 554.6 | | | $ | 148.6 | | | $ | 2,719.9 | |
| | | | | | | | | | | | | | | | | |
| 2022 |
| In millions | Allegion Americas | | Allegion International | | Total |
| | | | | |
| Products | $ | 2,455.8 | | | $ | 704.0 | | | $ | 3,159.8 | |
| Services | 74.9 | | | 37.2 | | | 112.1 | |
| Total Net revenues | $ | 2,530.7 | | | $ | 741.2 | | | $ | 3,271.9 | |
| | | | | | | | | | | | | | | | | | | | | | | |
| 2019 |
| In millions | Americas | | EMEA | | Asia Pacific | | Consolidated |
| Net revenues | | | | | | | |
| Products | $ | 2,114.5 | | | $ | 546.1 | | | $ | 158.8 | | | $ | 2,819.4 | |
| Services | 0 | | | 26.4 | | | 8.2 | | | 34.6 | |
| Total Net revenues | $ | 2,114.5 | | | $ | 572.5 | | | $ | 167.0 | | | $ | 2,854.0 | |
| | 2021 | | | 2021 |
| In millions | | In millions | Allegion Americas | | Allegion International | | Total |
| | 2018 |
| In millions | Americas | | EMEA | | Asia Pacific | | Consolidated |
| Net revenues | | | | | | | |
| Products | |
| Products | |
| Products | Products | $ | 1,988.6 | | | $ | 567.8 | | | $ | 148.9 | | | $ | 2,705.3 | |
| Services | Services | 0 | | | 22.1 | | | 4.3 | | | 26.4 | |
| Total Net revenues | Total Net revenues | $ | 1,988.6 | | | $ | 589.9 | | | $ | 153.2 | | | $ | 2,731.7 | |
As of December 31, 20202023 and 2019,2022, neither the contract assets related to the Company's right to consideration for work completed but not billed nor the contract liabilities associated with contract revenue were material. As a practical expedient, the Company recognizes incremental costs of obtaining a contract, if any, as an expense when incurred if the amortization period of the asset would have been one year or less. The Company does not have any material costs to obtain or fulfill a contract that are capitalized under ASC 606.on its Consolidated Balance Sheets. During the years ended December 31, 2023 and 2022, no adjustments related to performance obligations satisfied in previous periods were recorded.
NOTE 21 – COMMITMENTS AND CONTINGENCIES
The Company is involved in various litigation, claims and administrative proceedings, including those related to environmental and product warranty matters. Amounts recorded for identified contingent liabilities are estimates, which are reviewed periodically and adjusted to reflect additional information when it becomes available. Subject to the uncertainties inherent in estimating future costs for contingent liabilities, except as expressly set forth in this note, management believes that any liability which may result from these legal matters would not have a material adverse effect on the financial condition, results of operations, liquidity or cash flows of the Company.
Environmental Matters
The Company is dedicated to an environmental program to reduce the utilization and generation of hazardous materials during the manufacturing process and to remediate identified environmental concerns. As to the latter, the Company is currently engaged in site investigations and remediation activities to address environmental cleanup from past operations at current and former production facilities. The Company regularly evaluates its remediation programs and considers alternative remediation methods that are in addition to, or in replacement of, those currently utilized by the Company based upon enhanced technology and regulatory changes. Changes to the Company's remediation programs may result in increased expenses and increased environmental reserves.
The Company is sometimes a party to environmental lawsuits and claims and has, from time to time, received notices of potential violations of environmental laws and regulations from the U.S. Environmental Protection Agency and similar state authorities. It has also been identified as a potentially responsible party ("PRP") for cleanup costs associated with off-site waste disposal at federal Superfund and state remediation sites. For all such sites, there are other PRPs and, in most instances, the Company’s involvement is minimal.
In estimating its liability, the Company has assumed it will not bear the entire cost of remediation of any site to the exclusion of other PRPs who may be jointly and severally liable. The ability of other PRPs to participate has been taken into account, based on the Company's understanding of the parties’ financial condition and probable contributions on a per site basis. Additional lawsuits and claims involving environmental matters are likely to arise from time to time in the future.
The Company incurred $7.1 million, $1.7 million and $2.4 million of expenses during the years ended December 31, 2020, 2019 and 2018, respectively, for environmental remediation at sites presently or formerly owned or leased by the Company. Environmental remediation costs are recorded in Costs of goods sold within the Consolidated Statements of Comprehensive Income.
As of December 31, 20202023 and 2019,2022, the Company has recorded reserves for environmental matters of $21.1$20.2 million and $19.3$24.1 million, respectively. The total reserve at December 31, 20202023 and 2019,2022, included $4.4$11.2 million and $4.2$13.8 million, respectively, related to remediation of sites previously disposed by the Company. Environmental reserves are classified as Accrued expenses and other current liabilities or Other noncurrent liabilities within the Consolidated Balance Sheets based on the timing of their expected future payment. The Company's total current environmental reserve at December 31, 20202023 and 2019,2022, was $6.1$3.6 million and $3.9 million, respectively, and the remainder is classified as noncurrent.
The Company incurred $0.5 million, $2.9 million and $0.9 million of expenses during the years ended December 31, 2023, 2022 and 2021, respectively, for environmental remediation at sites presently or formerly owned or leased by the Company.
and $6.2 million, respectively, andEnvironmental remediation costs are recorded in Costs of goods sold within the remainder is classified as noncurrent.Consolidated Statements of Comprehensive Income. Given the evolving nature of environmental laws, regulations and technology, the ultimate cost of future compliance is uncertain.
Warranty Liability
Standard product warranty accruals are recorded at the time of sale and are estimated based upon product warranty terms and historical experience. The Company assesses the adequacy of its liabilities and will make adjustments as necessary based on known or anticipated warranty claims, or as new information becomes available.
The changes in the standard product warranty liability for the years ended December 31, were as follows:
| | In millions | In millions | 2020 | | 2019 | | 2018 | In millions | 2023 | | 2022 | | 2021 |
| Balance at beginning of period | Balance at beginning of period | $ | 15.9 | | | $ | 14.5 | | | $ | 14.1 | |
| Reductions for payments | Reductions for payments | (7.3) | | | (8.4) | | | (7.9) | |
| Accruals for warranties issued during the current period | Accruals for warranties issued during the current period | 8.2 | | | 10.3 | | | 7.8 | |
| Changes to accruals related to preexisting warranties | Changes to accruals related to preexisting warranties | (0.6) | | | (0.4) | | | 0.2 | |
| Acquisitions | 0 | | | 0 | | | 0.5 | |
| Acquisitions/divestitures | |
| Translation | Translation | 0.3 | | | (0.1) | | | (0.2) | |
| | Balance at end of period | Balance at end of period | $ | 16.5 | | | $ | 15.9 | | | $ | 14.5 | |
| Balance at end of period | |
| Balance at end of period | |
Standard product warranty liabilities are classified as Accrued expenses and other current liabilities or Other noncurrent liabilities within the Consolidated Balance Sheets based on the timing of the expected future payments. The amount included within current liabilities at December 31, 2023 and 2022, was $14.7 million and $12.1 million, respectively, and the remainder is classified as noncurrent.
NOTE 22 – BUSINESS SEGMENT INFORMATION
The Company classifies its business into the following 3two reportable segments based on industry and market focus: Americas; Europe, Middle EastAllegion Americas and Africa ("EMEA"); and Asia Pacific. Results for the Company's India operations are now included within the Asia Pacific segment results due to an operational change during the year ended December 31, 2020. This change did not result, and is not expected to result, in a material impact to Segment results of operations for either the EMEA or Asia Pacific segment.
Allegion International. The Company largely evaluates performance based on Segment operating income and Segment operating margins.margin. Segment operating income is the measure of profit and loss that the Company’s chief operating decision maker ("CODM") uses to evaluate the financial performance of the business and as the basis for resource allocation, performance reviews and compensation. For these reasons, the Company believes that Segment operating income represents the most relevant measure of segment profit and loss. The Company’s chief operating decision makerCODM may exclude certain charges or gains, such as corporate charges and other special charges, from Operating income to arrive at a Segment operating income that is a more meaningful measure of profit and loss upon which to base operating decisions. The Company defines Segment operating margin as Segment operating income (loss) as a percentage of the segment's Net revenues.
A summary of operations and balance sheet information by reportable segments as of and for the years ended December 31, were as follows:
| | Dollar amounts in millions | Dollar amounts in millions | | 2020 | | 2019 | | 2018 | Dollar amounts in millions | | 2023 | | 2022 | | 2021 |
| Americas | | | | | | |
| Allegion Americas | |
| Net revenues | |
| Net revenues | |
| Net revenues | Net revenues | | $ | 2,016.7 | | | $ | 2,114.5 | | | $ | 1,988.6 | |
| Segment operating income | Segment operating income | | 580.2 | | | 611.6 | | | 544.5 | |
| Segment operating margin | Segment operating margin | | 28.8 | % | | 28.9 | % | | 27.4 | % | Segment operating margin | | 26.0 | % | | 24.2 | % | | 25.5 | % |
| Depreciation and amortization | Depreciation and amortization | | 34.5 | | | 35.7 | | | 42.2 | |
| Capital expenditures | Capital expenditures | | 26.9 | | | 32.1 | | | 22.5 | |
| Total segment assets | Total segment assets | | 1,249.0 | | | 1,239.0 | | | 1,175.8 | |
| | EMEA | |
| Allegion International | |
| Allegion International | |
| Allegion International | |
| Net revenues | Net revenues | | 554.6 | | | 572.5 | | | 589.9 | |
| Segment operating (loss) income | | (5.4) | | | 34.3 | | | 49.3 | |
| Segment operating margin | | (1.0) | % | | 6.0 | % | | 8.4 | % |
| Depreciation and amortization | | 33.8 | | | 33.1 | | | 32.0 | |
| Capital expenditures | | 8.4 | | | 16.9 | | | 16.2 | |
| Total segment assets | | 1,154.9 | | | 1,057.6 | | | 1,052.1 | |
| | Asia Pacific | |
| Net revenues | Net revenues | | 148.6 | | | 167.0 | | | 153.2 | |
| Segment operating (loss) income | | (96.7) | | | 0.5 | | | 6.9 | |
| Net revenues | |
| Segment operating income | |
| Segment operating margin | Segment operating margin | | (65.1) | % | | 0.3 | % | | 4.5 | % | Segment operating margin | | 7.9 | % | | 9.5 | % | | 10.3 | % |
| Depreciation and amortization | Depreciation and amortization | | 5.2 | | | 4.9 | | | 3.9 | |
| Capital expenditures | Capital expenditures | | 7.2 | | | 11.4 | | | 4.2 | |
| Total segment assets | Total segment assets | | 188.6 | | | 281.1 | | | 286.6 | |
| | Total Net revenues | Total Net revenues | | $ | 2,719.9 | | | $ | 2,854.0 | | | $ | 2,731.7 | |
| Total Net revenues | |
| Total Net revenues | |
| | Reconciliation to earnings before income taxes | Reconciliation to earnings before income taxes | |
| Reconciliation to earnings before income taxes | |
| Reconciliation to earnings before income taxes | |
| Segment operating income from reportable segments | |
| Segment operating income from reportable segments | |
| Segment operating income from reportable segments | Segment operating income from reportable segments | | $ | 478.1 | | | $ | 646.4 | | | $ | 600.7 | |
| Unallocated corporate expense | Unallocated corporate expense | | 74.6 | | | 81.3 | | | 74.9 | |
| Interest expense | Interest expense | | 51.1 | | | 56.0 | | | 54.0 | |
| Loss on divestitures | Loss on divestitures | | 0 | | | 30.1 | | | 0 | |
| Other (income) expense, net | Other (income) expense, net | | (13.0) | | | 3.8 | | | (3.4) | |
| Total earnings before income taxes | Total earnings before income taxes | | $ | 365.4 | | | $ | 475.2 | | | $ | 475.2 | |
| | Depreciation and amortization from reportable segments | Depreciation and amortization from reportable segments | | $ | 73.5 | | | $ | 73.7 | | | $ | 78.1 | |
| Depreciation and amortization from reportable segments | |
| Depreciation and amortization from reportable segments | |
| Unallocated depreciation and amortization | Unallocated depreciation and amortization | | 4.5 | | | 4.4 | | | 4.2 | |
| Total depreciation and amortization | Total depreciation and amortization | | $ | 78.0 | | | $ | 78.1 | | | $ | 82.3 | |
| | Capital expenditures from reportable segments | Capital expenditures from reportable segments | | $ | 42.5 | | | $ | 60.4 | | | $ | 42.9 | |
| Corporate capital expenditures | | 4.6 | | | 5.2 | | | 6.2 | |
| Capital expenditures from reportable segments | |
| Capital expenditures from reportable segments | |
| Corporate capital expenditures, net of transfers to business segments | |
| Total capital expenditures | Total capital expenditures | | $ | 47.1 | | | $ | 65.6 | | | $ | 49.1 | |
| | Assets from reportable segments | Assets from reportable segments | | $ | 2,592.5 | | | $ | 2,577.7 | | | $ | 2,514.5 | |
| Assets from reportable segments | |
| Assets from reportable segments | |
Unallocated assets(a) | Unallocated assets(a) | | 476.9 | | | 389.5 | | | 295.7 | |
| Total assets | Total assets | | $ | 3,069.4 | | | $ | 2,967.2 | | | $ | 2,810.2 | |
(a)Unallocated assets consist primarily of investments in unconsolidated affiliates, property, plant and equipment, net, ROU assets, deferred income taxes and cash.
Effective January 1, 2021, the Company has combined its EMEAcash and Asia Pacific operations into a new segment named Allegion International, in addition to renaming its Americas segment "Allegion Americas". The new Allegion International segment has been created to drive speed and efficiency, simplify the Company's operating segments and optimize its non-U.S. operations.
Net revenues by destination and product typenature of products and services for the years ended December 31, were as follows:
| | In millions | In millions | | 2020 | | 2019 | | 2018 | In millions | | 2023 | | 2022 | | 2021 |
| Net revenues | | | | | | |
| | U.S. | |
| U.S. | |
| U.S. | U.S. | | $ | 1,905.5 | | | $ | 1,988.9 | | | $ | 1,852.8 | |
| Non-U.S. | Non-U.S. | | 814.4 | | | 865.1 | | | 878.9 | |
| Total | | $ | 2,719.9 | | | $ | 2,854.0 | | | $ | 2,731.7 | |
| Total Net revenues | |
| | | | | | | | | | | | | | | | | | | | |
| In millions | | 2020 | | 2019 | | 2018 |
| Net revenues | | | | | | |
| Mechanical products | | $ | 2,146.1 | | | $ | 2,247.0 | | | $ | 2,155.2 | |
| All other | | 573.8 | | | 607.0 | | | 576.5 | |
| Total | | $ | 2,719.9 | | | $ | 2,854.0 | | | $ | 2,731.7 | |
| | | | | | | | | | | | | | | | | | | | |
| In millions | | 2023 | | 2022 | | 2021 |
| | | | | | |
| Mechanical products | | $ | 2,436.3 | | | $ | 2,302.3 | | | $ | 2,045.4 | |
Electronic products(a) | | 1,022.9 | | | 857.5 | | | 788.1 | |
Services and software(b) | | 191.6 | | | 112.1 | | | 33.9 | |
| Total Net revenues | | $ | 3,650.8 | | | $ | 3,271.9 | | | $ | 2,867.4 | |
(a)Electronic products encompass both residential and non-residential products, and include all electrified product categories, including, but not limited to, electronic and electrified locks, access control systems, time, attendance and workforce productivity solutions and electronic and electrified door controls and systems and exit devices.
(b)Services and software revenues include inspection, maintenance and repair, design and installation, aftermarket and locksmith services, as well as SaaS offerings such as access control, IoT integration and workforce management solutions.
In fiscal year 2020, 2019years 2023, 2022 and 2018,2021, no customer exceeded 10% of consolidated Net revenues.
At December 31, long-lived assets by geographic area were as follows:
| | In millions | In millions | | 2020 | | 2019 | In millions | | 2023 | | 2022 |
| Long-lived assets | | | | |
| | U.S. | |
| U.S. | |
| U.S. | U.S. | | $ | 236.8 | | | $ | 242.0 | |
| Non-U.S. | Non-U.S. | | 426.9 | | | 437.3 | |
| Total | Total | | $ | 663.7 | | | $ | 679.3 | |
NOTE 23 – SUBSEQUENT EVENTS
As discussed in Note 22, effective JanuaryOn February 1, 2021,2024, the Company, has combinedthrough its EMEA and Asia Pacific operationssubsidiaries, acquired Boss Door Controls ("Boss Door Controls"), a door solutions provider in the UK. The Boss Door Controls business will be incorporated into a new segment namedthe Company's Allegion International and renamed its Americas segment "Allegion Americas".
segment.
On February 5, 2021,7, 2024, the Company's Board of Directors declared a quarterly dividend of $0.36$0.48 cents per ordinary share. The dividend is payable March 31, 202129, 2024, to shareholders of record on March 17, 2021.15, 2024.
SCHEDULE II
ALLEGION PLC
VALUATION AND QUALIFYING ACCOUNTS
FOR THE YEARS ENDED DECEMBER 31, 2020, 20192023, 2022 AND 20182021
(Amounts in millions)
| | | | | |
| Allowances for Doubtful Accounts: | |
| |
Balance December 31, 2017 | $ | 2.8 | |
Additions charged to costs and expenses | 1.6 | |
Deductions* | (1.0) | |
| |
Currency translation | (0.1) | |
| |
| |
Balance December 31, 2018 | 3.3 | |
Additions charged to costs and expenses | 2.4 | |
| |
| |
Currency translation | (0.1) | |
| |
| |
Balance December 31, 2019 | 5.6 | |
Adoption of ASC 326 (see Note 2) | 1.9 | |
Additions charged to costs and expenses | 2.4 | |
Deductions* | (3.9) | |
| |
Currency translation | 0.2 | |
| |
| Balance December 31, 2020 | $ | 6.2 | |
| |
| Additions charged to costs and expenses | 0.1 | |
| Deductions* | (0.7) | |
| Currency translation | (0.2) | |
| Balance December 31, 2021 | 5.4 | |
| Additions charged to costs and expenses | 2.1 | |
| Deductions* | (0.8) | |
| Divestitures | (0.3) | |
| Currency translation | (0.4) | |
| Balance December 31, 2022 | 6.0 | |
| Additions charged to costs and expenses | 11.7 | |
| Deductions* | (3.7) | |
| |
| |
| Balance December 31, 2023 | $ | 14.0 | |
| | | | | |
| * | "Deductions" include accounts and advances written off, less recoveries. |