UNITED STATES
SECURITIES AND EXCHANGE COMMISSION
WASHINGTON, D.C. 20549
FORM 10-K
☒ ANNUAL REPORT PURSUANT TO SECTION 13 OR 15(d) OF THE SECURITIES EXCHANGE ACT OF 1934
For the fiscal year ended December 31, 2020.2023.
OR
☐ TRANSITION REPORT PURSUANT TO SECTION 13 OR 15(d) OF THE SECURITIES EXCHANGE ACT OF 1934
For the transition period from __________ to __________.
Commission file number 001-36108
ONE Gas, Inc.
(Exact name of registrant as specified in its charter)
| | | | | | | | |
| Oklahoma | 46-3561936 |
(State or other jurisdiction of
incorporation or organization) | (I.R.S. Employer Identification No.) |
| | |
| 15 East Fifth Street | |
| Tulsa, | OK | 74103 |
| (Address of principal executive offices) | (Zip Code) |
Registrant’s telephone number, including area code (918) 947-7000
Securities registered pursuant to Section 12(b) of the Act:
| | | | | | | | | | | | | | |
| Title of each class | | Trading Symbol | | Name of exchange on which registered |
| Common Stock, par value $0.01 per share | | OGS | | New York Stock Exchange |
Securities registered pursuant to Section 12(g) of the Act: None
Indicate by check mark if the registrant is a well-known seasoned issuer, as defined in Rule 405 of the Securities Act. Yes ☒ No ☐
Indicate by check mark if the registrant is not required to file reports pursuant to Section 13 or Section 15(d) of the Act. Yes ☐ No ☒
Indicate by check mark whether the registrant (1) has filed all reports required to be filed by Section 13 or 15(d) of the Securities Exchange Act of 1934 during the preceding 12 months (or for such shorter period that the registrant was required to file such reports), and (2) has been subject to such filing requirements for the past 90 days. Yes ☒ No ☐
Indicate by check mark whether the registrant has submitted electronically every Interactive Data File required to be submitted pursuant to Rule 405 of Regulation S-T (§ 232.405 of this chapter) during the preceding 12 months (or for such shorter period that the registrant was required to submit such files).
Yes ☒ No ☐
Indicate by check mark whether the registrant is a large accelerated filer, an accelerated filer, a non-accelerated filer, a smaller reporting company, or an emerging growth company. See the definitions of “large accelerated filer,” “accelerated filer,” “smaller reporting company,” and “emerging growth company” in Rule 12b-2 of the Exchange Act. (Check one) Large accelerated filer ☒ Accelerated filer ☐ Non-accelerated filer ☐
Smaller reporting company ☐ Emerging growth company ☐
If an emerging growth company, indicate by check mark if the registrant has elected not to use the extended transition period for complying with any new or revised financial accounting standards provided pursuant to Section 13(a) of the Exchange Act. ☐
Indicate by check mark whether the registrant has filed a report on and attestation to its management’s assessment of the effectiveness of its internal control over financial reporting under Section 404(b) of the Sarbanes-Oxley Act (15 U.S.C. 7262(b)) by the registered public accounting firm that prepared or issued its audit report. ☒
If an emerging growth company,securities are registered pursuant to Section 12(b) of the Act, indicate by check mark ifwhether the financial statements of the registrant has elected notincluded in the filing reflect the correction of an error to usepreviously issued financial statements. ☐
Indicate by check mark whether any of those error corrections are restatements that required a recovery analysis of incentive-based compensation received by any of the extended transitionregistrant’s executive officers during the relevant recovery period for complying with any new or revised financial accounting standards provided pursuant to Section 13(a) of the Exchange Act.§240.10D-1(b). ☐
Indicate by check mark whether the registrant is a shell company (as defined in Rule 12b-2 of the Act). Yes ☐ No ☒
The aggregate market value of the equity securities held by nonaffiliates based on the closing trade price of the registrant on June 30, 2020,2023, was $3.9$4.1 billion.
OnFebruary 22, 2021,16, 2024, we had 53,243,98656,546,006 shares of common stock outstanding.
DOCUMENTS INCORPORATED BY REFERENCE:
Portions of the definitive proxy statement to be delivered to shareholders in connection with the Annual Meeting of Shareholders to be heldMay 27, 2021,23, 2024, are incorporated by reference in Part III.
This page intentionally left blank.
ONE Gas, Inc.
2020 ANNUAL REPORTTABLE OF CONTENTS
| | | | | | | | | | | |
| | | Page No. |
| Business | | | |
| | | |
| | |
| Cybersecurity | |
| | | |
| | | |
| Mine Safety Disclosures | | | |
| | | |
| Item 5. | Market for Registrant’s Common Equity, Related Stockholder Matters and Issuer Purchases of Equity Securities | | |
| [Reserved] | | | |
| | | |
| | | |
| | | |
| | | |
| Controls and Procedures | | | |
| Other Information | | | |
| Item 9C. | | | |
| Disclosure Regarding Foreign Jurisdictions that Prevent Inspections | |
| Part III. | | |
| Item 10. | Directors, Executive Officers and Corporate Governance | | |
| Executive Compensation | | | |
| | | |
| | | |
| Principal Accountant Fees and Services | | | |
| | | |
| | | |
| Item 16. | Form 10-K Summary | | | |
| Signatures | | |
| | |
| | |
|
| | |
| | |
| | |
| | |
| | |
| | |
| | |
| | |
| | |
| | |
| | |
| | |
| | |
| | |
| | |
| | |
| | |
| | |
| | |
| | |
As used in this Annual Report, references to “we,” “our,” “us” or the “Company” refer to ONE Gas, Inc., an Oklahoma corporation, and its predecessors and subsidiaries, unless the context indicates otherwise.
GLOSSARY
The abbreviations, acronyms and industry terminology used in this Annual Report are defined as follows:
| | | | | |
AAO | Accounting Authority Order |
ADIT | Accumulated deferred income tax |
AFUDC | Allowance for funds used during construction |
Annual Report | Annual Report on Form 10-K for the year ended December 31, 2020 |
ASC | Accounting Standards Codification |
ASU | Accounting Standards Update |
Bcf | Billion cubic feet |
CDC | Centers for Disease Control and Prevention |
CERCLA | Federal Comprehensive Environmental Response, Compensation and Liability Act
of 1980, as amended
|
CFTC | Commodities Futures Trading Commission |
Clean Air Act | Federal Clean Air Act, as amended |
Clean Water Act | Federal Water Pollution Control Amendments of 1972, as amended |
CNG | Compressed natural gas |
Code | Internal Revenue Code of 1986, as amended |
COSA | Cost-of-Service Adjustment |
COVID-19 | Coronavirus Disease 2019 |
DOT | United States Department of Transportation |
Dth | Dekatherm |
ECP | The ONE Gas, Inc. Amended and Restated Equity Compensation Plan (2018) |
EDIT | Excess accumulated deferred income taxes resulting from a change in enacted tax rates |
EPA | United States Environmental Protection Agency |
EPS | Earnings per share |
ESG | Environmental, social and governance |
ESPP | The ONE Gas, Inc. Amended and Restated Employee Stock Purchase Plan |
Exchange Act | Securities Exchange Act of 1934, as amended |
FASB | Financial Accounting Standards Board |
FERC | Federal Energy Regulatory Commission |
GAAP | Accounting principles generally accepted in the United States of America |
GPAC | Gas Pipeline Advisory Committee |
GRIP | Texas Gas Reliability Infrastructure Program |
GSRS | Gas System Reliability Surcharge |
Heating Degree Day or HDD | A measure designed to reflect the demand for energy needed for heating based on the extent to which the daily average temperature falls below a reference temperature for which no heating is required, usually 65 degrees Fahrenheit |
HCA(s) | High consequence area(s) |
IT | Information technology |
KCC | Kansas Corporation Commission |
KDHE | Kansas Department of Health and Environment |
kWh | Kilowatt hour |
LDC | Local distribution company |
LIBOR | London Interbank Offered Rate |
MAOP(s) | Maximum allowable operating pressure(s) |
MGP | Manufactured gas plant |
MMcf | Million cubic feet |
Moody’s | Moody’s Investors Service, Inc. |
Net margin | Non-GAAP measure defined as total revenues less cost of natural gas |
NOL | Net operating loss |
NPRM | Notice of proposed rulemaking |
NYMEX | New York Mercantile Exchange |
NYSE | New York Stock Exchange |
| | | | | |
OCC | Oklahoma Corporation Commission |
ONE Gas | ONE Gas, Inc. |
ONE Gas 2021 Term Loan Facility | ONE Gas’ $2.5 billion two-year unsecured term loan facility |
ONE Gas 364-day Credit Agreement | ONE Gas’ $250 million 364-day revolving credit agreement, which expires on April 6, 2021 |
ONE Gas Credit Agreement | ONE Gas’ $700 million amended and restated revolving credit agreement, which expires on October 4, 2024 |
OSHA | Occupational Safety and Health Administration |
PBRC | Performance-Based Rate Change |
PHMSA | United States Department of Transportation Pipeline and Hazardous Materials
Safety Administration
|
Pipeline Safety Improvement Act | Pipeline Safety Improvement Act of 2002, as amended |
Pipeline Safety, Regulatory Certainty and
Job Creation Act
| Pipeline Safety, Regulatory Certainty and Job Creation Act of 2011, as amended |
PPE | Personal protective equipment |
RNG | Renewable natural gas |
ROE | Return on equity calculated consistent with utility ratemaking principles in each
jurisdiction in which we operate
|
RRC | Railroad Commission of Texas |
S&P | Standard and Poor’s Rating Services |
SEC | Securities and Exchange Commission |
Securities Act | Securities Act of 1933, as amended |
Senior Notes | ONE Gas’ registered notes consisting of $300 million of 3.61 percent senior notes due 2024, $300 million of 2.00 percent senior notes due 2030, $600 million of 4.658 percent notes due 2044, and $400 million of 4.50 percent senior notes due 2048 |
WNA | Weather normalization adjustment(s) |
XBRL | eXtensible Business Reporting Language |
The statements in this Annual Report that are not historical information, including statements concerning plans and objectives of management for future operations, economic performance or related assumptions, are forward-looking statements. Forward-looking statements may include words such as “will,” “anticipate,” “estimate,” “expect,” “project,” “intend,” “plan,” “believe,” “should,” “goal,” “forecast,” “guidance,” “could,” “may,” “continue,” “might,” “potential,” “scheduled”“scheduled,” “likely” and other words and terms of similar meaning. Although we believe that our expectations regarding future events are based on reasonable assumptions, we can give no assurance that such expectations and assumptions will be achieved. Important factors that could cause actual results to differ materially from those in the forward-looking statements are described under Part I, Item 1A, Risk Factors, and Part II, Item 7, Management’s Discussion and Analysis of Financial Condition and Results of Operation, Forward-Looking Statements, in this Annual Report.
AVAILABLE INFORMATION
We make available, free of charge, on our website (www.onegas.com) our Annual Reports, Quarterly Reports, Current Reports on Form 8-K, amendments to those reports filed or furnished to the SEC pursuant to Section 13(a) or 15(d) of the Exchange Act and reports of holdings of our securities filed by our officers and directors under Section 16 of the Exchange Act. Such materials are available as soon as reasonably practicable after filing such material electronically or otherwise furnishing it to the SEC, which also makes these materials available on its website (www.sec.gov). Our Code of Business Conduct and Ethics, Corporate Governance Guidelines, Certificate of Incorporation, bylaws, the written charters of our Audit Committee, Executive Compensation Committee, Corporate Governance Committee and Executive Committee and our ESG Report are also available on our website, and copies of these documents are available upon request.
In addition to filings with the SEC and materials posted on our website, we also use social media platforms as channels of information distribution to reach investors and other stakeholders. Information contained on our website and posted on or disseminated through our social media accounts is not incorporated by reference into this report.
GLOSSARY
| | | | | |
| The abbreviations, acronyms and industry terminology used in this Annual Report are defined as follows: |
| |
| AAO | Accounting Authority Order |
| ADIT | Accumulated deferred income taxes |
| AFUDC | Allowance for funds used during construction |
| Annual Report | Annual Report on Form 10-K for the year ended December 31, 2023 |
| ASC | Accounting Standards Codification |
| ASU | Accounting Standards Update |
| Bcf | Billion cubic feet |
| CAA | Federal Clean Air Act, as amended |
| CERCLA | Federal Comprehensive Environmental Response, Compensation and Liability Act of 1980, as amended |
| CFTC | Commodities Futures Trading Commission |
| CISA | Cybersecurity and Infrastructure Security Agency |
| Clean Water Act | Federal Water Pollution Control Amendments of 1972, as amended |
| CNG | Compressed natural gas |
| Code | Internal Revenue Code of 1986, as amended |
| COSA | Cost-of-Service Adjustment |
| DART | Days Away, Restricted or Transferred Incident Rate; calculated by multiplying the total number of recordable injuries and illnesses, or one or more restricted days that resulted in an employee transferring to a different job within the company by 200,000, and then dividing that number by the total number of hours worked by all employees |
| DHS | United States Department of Homeland Security |
| DOT | United States Department of Transportation |
| Dth | Dekatherm |
| ECP | The ONE Gas, Inc. Amended and Restated Equity Compensation Plan (2018) |
| EDIT | Excess deferred income taxes resulting from a change in enacted tax rates |
| EPA | United States Environmental Protection Agency |
| EPS | Earnings per share |
| ER | Emissions Reduction; measured by the reduction of MTCO2e emissions through planned vintage main replacements and service line replacements. |
| ERT | Emergency Response Time; calculated as the time between the creation of an emergency order and the arrival of a first company responder to the scene expressed as the percentage of emergency orders with a response time of 30 minutes or less |
| ESG | Environmental, social and governance |
| ESPP | The ONE Gas, Inc. Amended and Restated Employee Stock Purchase Plan |
| Exchange Act | Securities Exchange Act of 1934, as amended |
| FASB | Financial Accounting Standards Board |
| FERC | Federal Energy Regulatory Commission |
| GAAP | Accounting principles generally accepted in the United States of America |
| GRIP | Gas Reliability Infrastructure Program |
| GSRS | Gas System Reliability Surcharge |
| |
| HDD | Heating degree day is a measure designed to reflect the demand for energy needed for heating based on the extent to which the daily average temperature falls below a reference temperature for which no heating is required, usually 65 degrees Fahrenheit |
| IRS | United States Internal Revenue Service |
| IT | Information Technology |
| KCC | Kansas Corporation Commission |
| KDHE | Kansas Department of Health and Environment |
| KGSS-I | Kansas Gas Service Securitization I, L.L.C. |
| LDC | Local distribution company |
| LIBOR | London Interbank Offered Rate |
| |
| MGP | Manufactured gas plant |
| MMcf | Million cubic feet |
| Moody’s | Moody’s Investors Service, Inc. |
| | | | | |
| MTCO2e | Metric ton of carbon dioxide equivalent |
| NPRM | Notice of proposed rulemaking |
| NYSE | New York Stock Exchange |
| OCC | Oklahoma Corporation Commission |
| ODFA | Oklahoma Development Finance Authority |
| ONE Gas | ONE Gas, Inc. |
| ONE Gas Credit Agreement | ONE Gas’ $1.2 billion revolving credit agreement, as amended |
| OSHA | Occupational Safety and Health Administration |
| PBRC | Performance-Based Rate Change |
| PHMSA | United States Department of Transportation Pipeline and Hazardous Materials Safety Administration |
| |
| PIPES Act | Protecting Our Infrastructure of Pipelines and Enhancing Safety (PIPES) Act of 2020 |
| PVIR | Preventable Vehicle Incident Rate; calculated by multiplying the number of total preventable vehicle incidents by 1,000,000 and then dividing that number by the total number of business use miles driven |
| Quarterly Report(s) | Quarterly Report(s) on Form 10-Q |
| RNG | Renewable natural gas |
| ROE | Return on equity calculated consistent with utility ratemaking principles in each jurisdiction in which we operate |
| RRC | Railroad Commission of Texas |
| S&P | Standard & Poor’s Ratings Services |
| SEC | Securities and Exchange Commission |
| Securities Act | Securities Act of 1933, as amended |
| Securitized Utility Tariff Bonds | Series 2022-A Senior Secured Securitized Utility Tariff Bonds, Tranche A |
| Securitized Utility Tariff Property | Securitized Utility Tariff Property as defined in the financing order issued by the KCC in August 2022 |
| Senior Notes | ONE Gas’ registered unsecured notes consisting of $300 million of 3.61 percent senior notes due February 2024, $473 million of 1.10 percent senior notes due March 2024, $300 million of 5.10 percent senior notes due April 2029, $300 million of 2.00 percent senior notes due May 2030, $300 million of 4.25 percent senior notes due September 2032, $600 million of 4.66 percent senior notes due February 2044 and $400 million of 4.50 percent senior notes due November 2048 |
| SOFR | Secured Overnight Financing Rate administered by the Federal Reserve Bank of New York |
| TCEQ | Texas Commission on Environmental Quality |
| TNG Corporation | Texas Natural Gas Securitization Finance Corporation |
| TPFA | Texas Public Finance Authority |
| TRIR | Total Recordable Incident Rate; calculated by multiplying the number of recordable cases by 200,000, and then dividing that number by the number of hours worked by all employees |
| TSA | United States Department of Homeland Security’s Transportation Security Administration |
| WNA | Weather normalization adjustment(s) |
| XBRL | eXtensible Business Reporting Language |
PART II.
ITEM 1. BUSINESS
OUR BUSINESS
ONE Gas, Inc. is incorporated under the laws of the state of Oklahoma. Our common stock is listed on the NYSE under the trading symbol “OGS,” and is included in the S&P MidCap 400 Index. We are a 100-percent regulated natural gas distribution utility, headquartered in Tulsa, Oklahoma, and one of the largest publicly traded natural gas utilities in the United States. We are the successor to the company founded in 1906 as Oklahoma Natural Gas Company, which became ONEOK, Inc. (NYSE: OKE) in 1980. On January 31, 2014, ONE Gas officially separated from ONEOK, Inc.
We provide natural gas distribution services to our approximately 2.22.3 million customers and are the largest natural gas distributor in Oklahoma and Kansas and the third largest in Texas, in terms of customers. We primarily serve residential, commercial and transportation customers in all three states. Our largest natural gas distribution markets in terms of customers are Oklahoma City and Tulsa, Oklahoma; Kansas City, Wichita and Topeka, Kansas; and Austin and El Paso, Texas. Our three divisions, Oklahoma Natural Gas, Kansas Gas Service and Texas Gas Service, distribute natural gas to approximately 8889 percent, 7271 percent and 13 percent of the natural gas distribution customers in Oklahoma, Kansas and Texas, respectively.
OUR STRATEGY
Our mission is to deliver natural gas for a better tomorrow. Our vision is to be a premier natural gas distribution company, creating exceptional value for all stakeholders. Our business strategy is focused on:
•Safety, ComplianceSafe and ReliabilityReliable Energy - We are committed, first and foremost, to pursuing a zero-incident safety and 100-percent compliance culture through programs, procedures, policies, guidelines and other internal controls designed to mitigate risk and incidents that may harm our employees, contractors, customers, the public or the environment. Additionally, aculture. A significant portion of our capital spending is focused on the safety, integrity reliability and efficiencyreliability of our natural gas distribution system. We also deploy a variety of operational and damage prevention procedures and technologies to monitor and maintain our natural gas distribution system. Our Company’s focus on safety also extends to protecting our assets and information systems from physical damage and cyber intrusions.
•Fostering aA High-performing Workforce - TheOur employees are the foundation of our Company is our employees.Company. Our success begins with a values-driven culture and a commitment to developing a skilled, agile, diverse and engaged workforce where every employee understands that they can andengaging people to do make a difference.their best work in an inclusive environment.
•Investing in Our SystemCapital Demand Growth - As a result of our commitment to enhance the integrity, reliability and safety of our existing infrastructure, we are making significant investments in our existing system. In addition, as some of our service territories continue to experience economic growth, ourThrough capital investments, we meet growing customer demand, support economic development, and manage our system investments for new service lines and main line extensions to serve new customers, predominately in the seven major metropolitan areas we serve, will further contribute to our growth.long-term.
•Maintaining a Conservative Financial ProfileClean Energy Solutions - As we increase rate base through system investments, weOur assets are essential to a clean energy future. We are focused on maintaining a conservative financial profilereducing our emissions and providingsupporting our customers with reasonable rates, while providing our shareholders with a competitive total return. We believe that maintaining strong credit ratings is prudent as we seek to access the capital markets to fund capital expenditures and for other general corporate purposes.customers’ emission reduction efforts.
•SustainabilityServing Customers - We understandprovide reliable and affordable energy to our customers by efficiently managing our resources and leveraging technology solutions to enhance operational efficiency. Our energy efficiency and education programs help our customers invest in higher efficiency appliances and reduce energy usage. For customers needing assistance, we offer payment arrangement options and seek to connect customers to social service agencies that our stakeholders expect us to operate a sustainable business. We are committed to environmental stewardship, social responsibility and good corporate governance, all evaluated through the lens of our core values of safety, ethics, diversity and inclusion, service and value. We are focused on continually improving practices and disclosures of our ESG-related plans, programs, goals and targets. See “Available Information” for additional information regarding our ESG-related matters.provide financial assistance.
REGULATORY OVERVIEW
We are subject to the regulationsregulation and oversight of the state and local regulatory authorities of the territories in which we operate. Rates and charges for natural gas distribution services are established by the OCC for Oklahoma Natural Gas and by the KCC for Kansas Gas Service. Texas Gas Service is subject to regulatory oversight byRates and charges in the various incorporated cities that it serves,of our service areas in Texas are established by those cities, which have primary jurisdiction for their respective service areas. Rates and charges in the unincorporated areas of our service territory in Texas and allare established by the RRC. All appellate matters in Texas are subject to regulatory oversight by the RRC. These regulatory authorities have the
responsibility of ensuring that the utilities inunder their jurisdictionsjurisdiction provide safe and reliable service at a reasonable cost, while providing utility companiesutilities the opportunity to earn a fair and reasonable return on their investments.
Generally, our rates and charges are established in rate case proceedings. Regulatory authorities may also approve mechanisms that allow for adjustments between rate cases for investments made or specific costs or investments made between rate cases.incurred. Due to the nature of the regulatory process, there is an inherent lag between the time that we make investments or incur additional costs and the setting of new rates and/or charges to recover those investments or costs. Additionally, we are not allowed recovery of certain costs we incur.
The following provides additional detail on the regulatory mechanisms in the jurisdictions we serve.
Oklahoma - Oklahoma Natural Gas currently operates under a PBRC mechanism, which provides for streamlined annual rate reviews between rate cases and includes adjustmentsto adjust rates for incremental capital investment and changes in revenue and allowed expenses. Under this mechanism, we have an authorized ROE of 9.59.4 percent, with a 100 basis point dead-band of 98.9 to 109.9 percent. If our achieved ROE is below 98.9 percent, our base rates are increased upon OCC approval to an amount necessary to restore the ROE to 9.59.4 percent. If our achieved ROE exceeds 109.9 percent, the portion of the earnings that exceeds 109.9 percent is shared with our customers, who receive the benefit of 75 percent of those earnings. We receiveretain the benefit of the remaining 25 percent. Oklahoma Natural Gas wasis required to make filings pursuant to the PBRC mechanism for the 12 months ended December 31 for each of the years 20162021 through 2020.2025. Oklahoma Natural Gas is also required to file a rate case on or before June 30, 2021,2027, based on a test year consisting of the twelve months endedending December 31, 2020.2026.
Kansas - Kansas Gas Service files periodic rate cases with the KCC as needed. Between rate cases, Kansas Gas Service adjusts rates through provisions of the GSRS statute. The GSRS statute allows Kansas Gas Service to file for a rate adjustment providing a recovery of and return on qualifying infrastructure investments incurred between rate case filings, including safety-related investments to replace, upgrade or modernize obsolete facilities, as well as projects that enhance the integrity of pipeline system components or extend the useful life of such assets. Eligible investments also include expenditures for relocations and physical and cyber security. The filingFilings cannot occur more often than once every 12 months and the rate adjustment cannot increase the monthly charge by more than $0.80 per residential customer per month compared with the most recent GSRS filing. After five annual filings,Rate adjustments reflected in the GSRS surcharge may only be collected for 60 months before Kansas Gas Service is required to file a rate case or cease collection of thisthe surcharge. A full rate case may be filed at shorter intervals if desired by either Kansas Gas Service or the KCC.
Texas - Texas Gas Service provides service to customers in fivevarious service areas. These service areas are further divided into the incorporated cities and the unincorporated areas. Periodic rate cases are filed with the cities or the RRC, as needed. Between rate cases, Texas Gas Service can adjust rates through annual filings pursuant to the GRIP statute or an annuala COSA filing.tariff. In 2022, Texas Gas Service’s customers were aggregated in five service areas. Effective February 2023, three of these service areas were consolidated, reducing the total number of service areas to three.
Annual filings under the GRIP statute allow Texas Gas Service to recover depreciation, taxes, and depreciation and to earn a return on the annual net increase in investment for a service area. After the fifth anniversary of the effective date of the rate schedules from our last rate casethe first GRIP filing for a service area, Texas Gas Service is required to file a full rate case. A full rate case may be filed at shorter intervals if desired by either Texas Gas Service or the regulator. In 2023, Texas Gas Service makesmade annual GRIP filings for the incorporated cities in three of its service areas and for the unincorporated areas in all five service areas, which combined comprise 89 percent of Texas Gas Service’s customers.
COSA tariffs permit Texas Gas Service to recover return, taxes and depreciation on the annual increases in net investment, as well as annual increases or decreases in certain expenses and revenues. The COSAs have a cap of 3.25 percent to 5 percent on the expense portion of the increase. A full rate case may be filed when desired by Texas Gas Service or the regulator but is not required. Texas Gas Service makes an annual COSA filing for the incorporated cities in two of its service areas, comprising 11which combined comprise 91 percent of itsTexas Gas Service’s customers.
Weather normalization - All of our service areas utilize weather normalization mechanisms. These mechanisms are designed to reduce the delivery charge component of customers’ bills for the additional volumes used when actual HDDs exceed normalized HDDs and to increase the delivery charge component of customers’ bills for the reduction in volumes used when actual HDDs are less than normal HDDs. Normal HDDs are established through rate proceedings in each of our jurisdictions.
The following tables provide additional detail on our rate structures and the regulatory mechanisms in each of our jurisdictions:
| | Division | Division | Jurisdiction | Effective Date of Last Action(1) | Rate Base (millions)(2) | Rate of Return(2) | Equity Ratio(2) | Return on Equity(2) | Division | Jurisdiction | Effective Date of Last Action(1) | Rate Base (millions) | Pre-Tax Rate of Return | Equity Ratio | ROE |
| Oklahoma Natural Gas | OK | June 2020 | $1,616 | 7.06% | 56% | 9.50% |
Oklahoma Natural Gas (2) | | Oklahoma Natural Gas (2) | Oklahoma | June 2023 | $2,066 | 8.95% | 59% | 9.40% |
Kansas Gas Service (3) | Kansas Gas Service (3) | KS | December 2020 | $1,133 | 8.60% | N/A | 9.30% | Kansas Gas Service (3) | Kansas | November 2023 | $1,330 | 8.60% | N/A | 9.30% |
| Texas Gas Service | Central-Gulf | August 2020 | $458 | 7.46% | 59% | 9.50% |
| West Texas | June 2020 | $397 | 7.28% | 60% | 9.50% |
| Rio Grande Valley | November 2020 | $128 | 7.35% | 61% | 9.50% |
| North Texas | November 2020 | $54 | 7.55% | 62% | 9.75% |
| Borger / Skellytown | December 2020 | $10 | 7.55% | 62% | 9.75% |
Texas Gas Service (2) | | Texas Gas Service (2) | Central-Gulf | June 2023 | $617 | 8.95% | 59% | 9.50% |
| West-North | | | West-North | June 2023 | $589 | 8.91% | 60% | 9.60% |
| Rio Grande Valley | | | Rio Grande Valley | January 2024 | $160 | 8.95% | 59% | 9.70% |
| | | | | | | | | | | | | | | | | | | | |
| Division | Jurisdiction | Interim Rate Adjustment Mechanism | Interim Capital Recovery | WNA | WNA Effective Dates | Energy Efficiency / Conservation Program |
| Oklahoma Natural Gas | OKOklahoma | PBRC | Yes | Yes | November - April | Yes |
Kansas Gas Service (3) | KSKansas | GSRS | Yes | Yes | January - December | No |
| Texas Gas Service | Central-Gulf | GRIP | Yes | Yes | September - May | Yes |
| West TexasWest-North | GRIP | Yes | Yes | September - May | No |
| Rio Grande Valley | GRIP/ COSA
| Yes | Yes | September - May | Yes |
| North Texas | GRIP/ COSA
| Yes | Yes | September - May | No |
| Borger / Skellytown | GRIP | Yes | Yes | September - May | NoYes |
| | | | | | | | | | | | | | |
| Division | Jurisdiction | Purchased Gas RidersAdjustment(4) | Bad Debt Recovery(5) | Expense Trackers(6) |
| Oklahoma Natural Gas | OKOklahoma | Yes | Yes | YesN/A |
Kansas Gas Service (3) | KSKansas | Yes | Yes | Yes |
| Texas Gas Service | Central-Gulf | Yes | Yes | Yes |
| West TexasWest-North | Yes | Yes | Yes |
| Rio Grande Valley | Yes | Yes | Yes |
| North Texas | Yes | Yes | Yes |
| Borger / Skellytown | Yes | Yes | Yes |
| | | | | |
| (1) | Effective date of last approved rate case or interim filing. |
| (2) | The rate base, authorized rate of return,ROE, authorized debt/equity ratio and authorized return on equity presented in this table are those from the most recent approved regulatory filing for each jurisdiction. These rate bases, rates of return, debt/equity ratiosOklahoma Natural Gas and returns on equity are not necessarily indicative of current or future rate bases, rates of return, debt/equity ratios or returns on equity.Texas Gas Service. |
| (3) | Kansas Gas Service’s most recent rate case, approved in February 2019, settled without a determination of rate base, rate of return,ROE, authorized debt/equity ratio and authorized return on equity within the settlement.equity. This reflects Kansas Gas Service’s estimate of rate base from that rate case adjusted for approved GSRS filings and the return on equityROE embedded in the pre-tax carrying charge utilized in its GSRS filing. |
| (4) | Our purchased gas adjustment mechanisms allow recovery of expenses the Company incurs to purchase, transport, and store natural gas for our customers. These costs are passed on to customers without markup. |
| (5) | We recover the gas cost portion of bad debts through our various purchased gas cost adjustment mechanisms. |
| (6) | TheseExpense trackers represent cost adjustment mechanisms for costs that are subject to significant fluctuations compared to other costs, represent a large component of our cost of service and are generally outside our control. Examples include pension and other postemployment benefits costs for Kansas Gas Service and Texas Gas Service, ad-valorem taxes in Kansas and pipeline integrity testing expenses in Texas. |
Our natural gas sales include fixed and variable charges related to the delivery of natural gas and gas costs that are passed through to our customers in accordance with our cost of natural gas regulatory mechanisms. Fixed charges reflect the portion of our natural gas sales attributable to the monthly fixed customer charge component of our rates, which does not fluctuate based on customer usage in each period. Variable charges reflect the portion of our natural gas sales that fluctuate with the volumes delivered and billed and the effects of weather normalization.
For the year ended December 31, 2020,2023, approximately 8789 percent, 5556 percent, and 70 percent of net marginour revenues from sales customers, excluding the cost of natural gas, were recovered from fixed charges for Oklahoma Natural Gas, Kansas Gas Service, and Texas Gas Service, respectively.
MARKET CONDITIONS AND SEASONALITY
Supply - We purchased 153160 Bcf and 174165 Bcf of natural gas supply in 20202023 and 2019,2022, respectively. Our natural gas supply portfolio consists of contracts with varying terms from a diverse group of suppliers. We award these contracts through competitive-bidding processes to ensure reliable and competitively priced natural gas supply. We acquire our natural gas supply from natural gas processors, marketers and producers.
An objective of our supply-sourcing strategy is to provide value to our customers through reliable, competitively priced and flexible natural gas supply and transportation from multiple production areas and suppliers. This strategy is designed to
mitigate the impact on our supply from physical interruption,interruptions, financial difficulties of a single supplier, natural disasters and other
unforeseen force majeure events, as well as to ensure that adequate supply is available to meet the variations of customer demand.
We do not anticipate problems with securing natural gas supply to satisfy customer demand; however, if supply shortages were to occur, we have curtailment provisions in our tariffs that allow us to reduce or discontinue natural gas service to large industrial users and to request that residential and commercial customers reduce their natural gas requirements to an amount essential for public health and safety. In addition, during times of critical supply disruptions, curtailments of deliveries to customers with firm contracts may be made in accordance with guidelines established by appropriate federal, state and local regulatory agencies.
Natural gas supply requirements for our sales customers are impacted by weather and economic conditions. The consumption patterns for our customersOur customers’ usage may also change from time-to-time in response to a variety of possible factors, including:
•the occurrence of a significant disruption in natural gas supplies, either by itself, or accompanied by higher or lower natural gas prices;
•the availability of more energy-efficient construction methods;methods or home improvements such as installation or replacement of insulated doors and windows, additional or energy efficient insulation and installation or replacement of existing appliances with more efficient appliances; and
•fuel switching from natural gas to electricity; and
•residential customers may improve upon theother energy efficiency of existing homes by replacing doors and windows, adding insulation and replacing appliances with more efficient appliances.alternatives.
In each jurisdiction in which we operate, changes in customer-usage profilescustomer usage are considered in the periodic redesign of our rates.
As of December 31, 2020,2023, we had 48.358.1 Bcf of natural gas storage capacity under contract with remaining terms ranging from one to ten years and maximum allowable daily withdrawal capacity of approximately 1.31.7 Bcf. This storage capacity allows us to purchase natural gas during the off-peak season and store it for use in the winter periods. This storage is also needed to assuresupport the reliability of gas deliveries during peak demands for natural gas. Approximately 2632 percent of our winter natural gas supply needs for our sales customers is expected to be supplied from storage.
In managing our natural gas supply portfolios, we partially mitigate price volatility for our customers using a combination of financial derivatives and natural gas in storage.storage, fixed-price natural gas contracts, and financial derivatives. We have natural gas financial hedging programs that have been authorized by the OCC, KCC and certain jurisdictions in Texas. We do not utilize financial derivatives for speculative purposes, nor do we have trading operations associated with our business.
Demand - See discussiondiscussions below under Seasonality, Competition and CNG for factors affecting demand for our services.
Seasonality - Natural gas sales to residential and commercial customers are seasonal, as a substantial portion of their natural gas requirements are for heating. Accordingly, the volume of natural gas sales is normally higher during the months of November through March than in other months of the year. The impact on our marginsnatural gas sales resulting from weather temperatures that are above or below normal is offset partially through our WNA mechanisms. See the tables above under Regulatory Overview for additional information.
Competition - We encounter competition based on customers’ preference for natural gas, compared with other energy alternatives and their comparative prices. We compete primarily to supply energy for space and water heating, cooking and clothes drying. Significant energy usage competition occurs between natural gas and electricity in the residential and small commercial markets. Customers and builders typically make the decision on the type of equipment, and therefore the energy source, at initial installation, generally locking in the chosen energy source for the life of the equipment. Changes in the competitive position of natural gas relative to electricity and other energy alternatives have the potential to cause a decline in consumption of natural gas or in the number of natural gas customers.
The U.S. Department of Energy issued a statement of policy that it will use full fuel-cycle measures of energy use and emissions when evaluating energy-conservation standards for appliances. In addition, the EPA has determined that source energy is the most equitable unit for evaluating energy consumption. Assessing energy efficiency in terms of a full fuel-cycle or source-energy analysis, which takes all energy use into account, including transmission, delivery and production losses, in addition to energy consumed at the site, highlights the high overall efficiency of natural gas in residential and commercial uses compared with electricity.
The table below contains data related to the cost of delivered natural gas relative to electricity:
| | | | | | | | | | | | | | | | | | | | |
Natural Gas vs. Electricity | | Oklahoma | | Kansas | | Texas |
| | | | | | |
Average retail price of electricity / kWh(1)
| | 10.09¢ | | 12.78¢ | | 11.95¢ |
ONE Gas delivered cost of natural gas / kWh(2)
| | 2.86¢ | | 3.00¢ | | 3.42¢ |
Natural gas advantage ratio(3)
| | 3.5x | | 4.3x | | 3.5x |
(1) Source: United States Energy Information Agency, www.eia.gov, for the eleven-month period ended November 30, 2020.
(2) Represents the average delivered cost of natural gas per kWh equivalent to a residential customer, including the cost of the natural gas supplied, fixed customer charge, delivery charges and charges for riders, surcharges and other regulatory mechanisms associated with the services we provide, for the year ended December 31, 2020.
(3) Calculated as the ratio of the ONE Gas delivered average cost of natural gas per kWh equivalent to the average retail price of electricity per kWh.
We are subject to competition from other pipelines for our large industrial and commercial customers, and this competition has and may continue to impact margins.customers. Under our transportation tariffs, qualifying industrial and commercial customers are able to purchase their natural gas supply from the provider of their choice and contract with us to transport it for a fee. A portion of the transportation services that we provide are at negotiated rates that are below the maximum approved transportation tariff rates. Reduced-rate transportation service may be negotiated when a competitive pipeline is in close proximity or another viable energy option is available to the customer. In Texas, we are also subject to competition from other local distribution companies.
CNG - In meeting demand for CNG for motor vehicle transportation, particularly from fleet operators who are attracted tovalue its lower greenhouse gas emissions and operating fuel costs relative to gasoline- or diesel-powered vehicles, we have continued to supply natural gas to CNG fueling stations. Our strategy is to support third-party investment in CNG fueling stations. We deploy capital to connect our system to CNG stations built and operated by third parties to our system.parties. As of December 31, 2020,2023, we supply 151152 fueling stations, 3337 of which we operate in conjunction with our own fleets. Of the 118 115
remaining stations, 6769 are retail and 5146 are private stations. We transported 2.6approximately 2.8 million Dth to CNG stations each year in 2020, which represents a decrease of 6 percent compared with 2019.2023 and 2022.
RNG and HydrogenAlternative Fuels – RNG and hydrogen technologies offer potential opportunities to secure new natural gas supply sources that could be transported onthrough our pipeline system and reduce greenhouse gas emissions. We have begun to make investments in RNG and hydrogenpipelines. Our evaluation of these technologies and innovation, including:opportunities includes: (1) establishing interconnection guidelines for bringing RNG intodelivery of alternative fuels to our system, (2) working directly with developers and end-use customers to identify potential RNGalternative fuel supply projects, (3) analyzing pipeline system integrity and gas supply implications, including sourcing opportunities, related to hydrogen use in our system, and (4) partnering with industry groups to develop methodologies regardingidentify opportunities for hydrogen blending and utilization, and (5) evaluating the opportunity to allow for intentional sharingreduce greenhouse gas emissions through the use of alternative fuels. See additional information regarding RNG in the “Regulatory Activities” section of Management’s Discussion and learning across the LDC industry.Analysis of Financial Condition and Results of Operations.
ENVIRONMENTAL AND SAFETY MATTERS
See Note 1715 of the Notes to Consolidated Financial Statements and Management’s Discussion and Analysis of Financial Condition and Results of Operations in this Annual Report for information regarding environmental and safety matters.
EMPLOYEESHUMAN CAPITAL
We intentionally foster an inclusive work culture, where a broad range of viewpoints are welcome, to develop an engaged and high-performing workforce and an environment where top talent wants to work.
Employment - We employed approximately 3,7003,900 people at February 1, 2021,2024, including approximately 700 people at Kansas Gas Service who are subject to collective bargaining agreements. The following table sets forth our contracts with collective bargaining units at February 1, 2021:2024:
| | | | | | | | | | | | | | |
| Union | | Approximate Employees | | Contract Expires |
| The United Steelworkers | | 400 | | May 31, 20222025 |
| International Brotherhood of Electrical Workers | | 300 | | June 30, 20212024 |
The foundationWe recognize that employees are a key stakeholder group for the success of our Company is our employeesbusiness. Therefore, we perform an annual survey to monitor and our success begins with a values-driven cultureassess employee engagement.
Workplace Health and commitment to developing a skilled, agile, diverse and engaged workforce where every employee understands that they can and do make a difference. Advancing a safe, ethical, inclusive and diverse culture creates an environment that attracts and retains the high-performing workforce needed to successfully execute our strategy.Safety - Safety is our number one core valuevalue. We are committed to pursuing a zero-incident safety culture, which can reduce risk, enhance productivity and build a strong reputation in the foundation of everythingcommunities in which we do.operate. Our success is reliant on training and development, performance management and shared responsibility that focuses on engagement and ensures our employees know what is expected to keep themselves, their teammates,co-workers, our customers and communities safe. To reinforce our commitment to the safety and well-being of our co-workers, customers and communities, our short-term incentive compensation program includes four operational measures, ER, DART, PVIR and ERT. These measures focus on the importance of personal injury prevention, reducing the severity of injuries, safe driving, and public safety. The following table sets forth our performance for the periods indicated:
| | | | | | | | | | | | | | | | | | | | |
| | Years Ended December 31, |
| Operational measure | | 2023 | | 2022 | | 2021 |
| ER | | 3,076 | | — | | — |
| TRIR | | — | | 1.37 | | 0.96 |
| DART | | 0.16 | | 0.22 | | 0.22 |
| PVIR | | 1.82 | | 1.84 | | 2.10 |
| ERT | | 64.8% | | 62.7% | | 62.7% |
DART and PVIR are personal safety metrics tracked by the American Gas Association. We regularly rank in the top quartile for similar-sized LDCs for these metrics.
To buildWe are committed to a better tomorrowsupportive culture of physical, financial, emotional and social wellness for everyone, we continueemployees. We provide health and wellness programs to foster a culture that embraces inclusionsupport and diversityinspire our employees to make healthy personal and encourages collaboration.professional lifestyle choices.
Inclusion and Diversity - Our core values include inclusion and diversity, and we believe in equity andcreating opportunities to recognize the value and voice of every employee. As part of our commitment, we have and continue to consider inclusion and diversity implications in our recruiting process, Company training, and Company performance monitoring. For example, we monitor our workforce diversity statistics across roles and seniority levels. Additionally, we make available conscious inclusion training to all employees.
We have an Inclusion and Diversity Council, which is chaired by our Chief Executive Officer, and includes fivesix employees serving as permanent members, withand 14 employees serving as rotating members with two-yearthree-year terms. The Inclusion and Diversity Council provides governance and guidance for implementing our strategy and sharing our vision of an inclusive and diverse workforce. To promote an inclusiveIn addition, we have employee-led resource groups to provide community and diverse workforce, we are developing training programs forsupport to our employees. Inclusion and diversity are embedded in our selection process and our new-hire orientation, and managing bias training is included in our leadership development program.employees based on shared characteristics, interests or experiences.
INFORMATION ABOUT OUR EXECUTIVE OFFICERS
All executive officers are elected annually by our Board of Directors and each serves until such person resigns, is removed or is otherwise disqualified to serve or until such officer’s successor is duly elected. Our executive officers listed below include the officers who have been designated by our Board of Directors as our Section 16 executive officers.
| | | | | | | | | | | | | | |
| Name | Age* | | Business Experience in Past Five Years |
Pierce H. Norton IIRobert S. McAnnally | 60 | 20142021 to present | President, Chief Executive Officer and Director |
| | Caron A. Lawhorn2020 to 2021 | 59Senior Vice President and Chief Operating Officer |
| | 2015 to 2020 | 2019Senior Vice President, Operations |
| Christopher P. Sighinolfi | 40 | 2024 to present | Senior Vice President and Chief Financial Officer |
| | 20142022 to 20192024 | Senior Vice President, CommercialCorporate Development and Investor Relations |
| | 2021 to 2022 | Vice President, Corporate Development |
| | 2016 to 2021 | Managing Director, Jefferies Financial Group, Inc. |
| Joseph L. McCormick | 6164 | 2014 to present | Senior Vice President, General Counsel and Assistant Secretary |
| Curtis L. Dinan | 5356 | 2021 to present | Senior Vice President and Chief Operating Officer |
| | 2020 to present2021 | Senior Vice President and Chief Commercial Officer |
| | 2019 to 2020 | Senior Vice President, Commercial |
| | 2018 to 2019 | Senior Vice President and Chief Financial Officer |
| | 2014 to 2018 | Senior Vice President, Chief Financial Officer and Treasurer |
Robert S. McAnnally | 57 | 2020 to present | Senior Vice President and Chief Operating Officer |
| | 2015 to 2020 | Senior Vice President, Operations |
| Mark A. Bender | 5659 | 2015 to present | Senior Vice President, Administration and Chief Information Officer |
Jeffrey J. HusenW. Kent Shortridge | 4957 | 2022 to present | Senior Vice President, Operations and Customer Service |
| | 2018 to 2022 | Managing Vice President, Operations |
| Brian F. Brumfield | 56 | 2022 to present | Vice President, Chief Accounting Officer and Controller |
| | 20142017 to 20182022 | Controller, Tucson Electric Power/UNS Energy |
| Angela E. Kouplen | 49 | 2023 to present | Senior Vice President and Chief Human Resources Officer |
| | 2022 to 2023 | Vice President of Administration and Chief Information Officer, the University of Tulsa |
| | 2021 to 2022 | Vice President and Chief Information Officer, the University of Tulsa |
| | 2016 to 2021 | Senior Vice President of Administration and Chief Information Officer, WPX Energy |
* As of January 1, 20212024 | | | | |
No family relationship exists between any of the executive officers, nor is there any arrangement or understanding between any executive officer and any other person pursuant to which the officer was selected.
AVAILABLE INFORMATION
We make available, free of charge, on our website (www.onegas.com) copies of our Annual Report, Quarterly Reports on Form 10-Q, Current Reports on Form 8-K, amendments to those reports filed or furnished to the SEC pursuant to Section 13(a) or 15(d) of the Exchange Act and reports of holdings of our securities filed by our officers and directors under Section 16 of the Exchange Act as soon as reasonably practicable after filing such material electronically or otherwise furnishing it to the SEC, which also makes these materials available on its website (www.sec.gov). Copies of our Code of Business Conduct and Ethics, Corporate Governance Guidelines, Certificate of Incorporation, bylaws, the written charters of our Audit Committee, Executive Compensation Committee, Corporate Governance Committee and Executive Committee and our Sustainability Report are also available on our website, and copies of these documents are available upon request.
In addition to filings with the SEC and materials posted on our website, we also use social media platforms as channels of information distribution to reach public investors. Information contained on our website and posted on or disseminated through our social media accounts is not incorporated by reference into this report.
ITEM 1A. RISK FACTORS
Our investors should consider the following risks that could affect us and our business. Although we believe we have discussed the key factors, our investors need to be aware that other risks may prove to be important in the future. New risks may emerge at any time, and we cannot predict such risks or estimate the extent to which they may affect our financial performance. Investors should carefully consider the following discussion of risks and the other information included or incorporated by reference in this Annual Report, including Forward-Looking Statements, which are included in Part 2,II, Item 7, Management’s Discussion and Analysis of Financial Condition and Results of Operations.
RISK FACTORS INHERENT IN OUR BUSINESS
Operational Risks
Pandemics or other health crises could have an adverse effect on our business.
Our business and our customers could be materially and adversely affected by the risks, or the public perception of the risks, related to a pandemic or other health crisis, such as the outbreak of COVID-19. The COVID-19 pandemic is having an unprecedented impact on the U.S. and its economy and has created significant uncertainties about the potential adverse effect of the pandemic on the economy, our customers, our employees and supply chain partners. These uncertainties have also resulted in significant volatility within financial markets and a decrease in the value of equity securities, including our common stock.
International, federal, state and local public health and governmental authorities have taken extraordinary and wide-ranging actions to contain and combat the outbreak and spread of COVID-19 across the U.S. and throughout the world, including quarantines, “stay-at-home” orders and similar mandates for many individuals to substantially restrict daily activities and for many businesses to curtail or cease normal operations. These recommendations and/or mandates from federal, state and local authorities may remain in place for a prolonged period or may be reimposed in connection with a resurgence of the virus following resumption or partial resumption of normal economic activities. These recommendations and/or mandates result in temporary or long-term financial hardships for our residential customers and business interruptions and/or closures for our commercial, industrial and transportation customers, all of which increases the risk of delinquencies and defaults of payments on their accounts and may also affect our supply chain. It is possible that COVID-19 public health containment efforts will be intensified to such an extent that we will be forced to curtail or possibly suspend certain business operations for an indefinite period. Regulatory orders require us to continue serving our natural gas customers in default during the pandemic outbreak, which may adversely affect our earnings, liquidity and cash flows.
Experts have observed an increase in the volume and the sophistication of cyberattacks since the beginning of the COVID-19 pandemic. Any breaches of technology systems could disrupt our operations or result in the loss or exposure of confidential or sensitive customer, employee or Company information and adversely affect our business, financial condition and results of operations.
As an essential business, we have implemented business continuity and emergency response plans to continue to provide natural gas services to customers and support our operations, while taking health and safety measures such as implementing worker distancing measures and using a remote workforce where possible. Beginning at the end of the first quarter of 2020, remote working arrangements for our employees increased as a result of the COVID-19 pandemic, requiring enhancements and modifications to our IT infrastructure (e.g. Internet, Virtual Private Network, remote collaboration systems, etc.), and any failures of the technologies, including third-party service providers, that facilitate working remotely could limit our ability to conduct ordinary operations and expose us to increased risk or impact of a cyberattack or data breach. When we begin reintegrating our personnel back into the workplace, having a greater number of employees working from our facilities will likely cause us to incur greater costs related to purchasing more PPE, additional facility sanitation activities and expanding health-screening processes. Shortages in PPE may require us to revise or delay our reintegration plans. Increases in the number of COVID-19 cases in our service areas may also result in delaying or slowing personnel reintegration.
There is no assurance that the continued spread of COVID-19 and efforts to contain the virus (including, but not limited to, voluntary and mandatory quarantines, restrictions on travel, vaccinations, limiting gatherings of people, and reduced operations and extended closures of many businesses and institutions) will not materially impact our business, results of operations and financial condition.
We are subject to pipeline safety and system integrity laws and regulations that may require significant expenditures, significant increases in operating costs or, in the case of noncompliance, substantial fines or penalties.
We are subject to the Pipeline Safety Improvement Act, which requires companies like us that operate high-pressure pipelines to perform integrity assessments on pipeline segments that pass through densely populated areas or near specifically designated high-consequence areas. Further, the Pipeline Safety, Regulatory Certainty and Job Creation Act increased the maximum penalties for violating federal pipeline safety regulations and directed the DOT and Secretary of Transportation to conduct further review or studies on issues that may or may not be material to us. Compliance with existing or new laws and regulations may result in increased capital, operating and other costs which may not be recoverable in rates from our customers or may impact materially our competitive position relative to other energy providers. The failure to comply with these laws, regulations and other requirements could expose us to civil or criminal liability, enforcement actions, fines, penalties or injunctive measures that may not be recoverable from customers in rates and could have a material adverse effect on our business, financial condition, results of operations and cash flows, and reputation.
We are subject to strict regulations at many of our facilities regarding employee safety, and failure to comply with these regulations could adversely affect our financial results or result in significant fines or penalties.
The workplaces associated with our facilities are subject to the requirements of DOT and OSHA, and comparable state statutes that regulate the protection of the health and safety of workers. The failure to comply with DOT, OSHA and state requirements or general industry standards, including keeping adequate records or preventing occupational exposure to regulated substances, could expose us to civil or criminal liability, enforcement actions, and regulatory fines and penalties that may not be recoverable through our rates and could have a material adverse effect on our business, financial condition, results of operations and cash flows. Although we employ safety procedures in the design and operation of our facilities, there is a risk that an accident or injury to one of our employees could occur in one of our facilities. Any accident or injury to our employees could result in litigation, operational delays and harm to our reputation, which could negatively affect our business, operating results and financial condition.OPERATIONAL RISKS
Our business is subject to operational hazards and unforeseen interruptions that could materially and adversely affect our business and for which we may not be insured adequately.
We are subject to all of the risks and hazards typically associated with the natural gas distribution business.business that could affect the public safety as well as the reliability of our distribution system. Operating risks include, but are not limited to, leaks, accidents, pipeline ruptures and the breakdown or failure of equipment or processes. Other operational hazards and unforeseen interruptions include adverse weather conditions, accidents, explosions, fires, the collision of equipment or vehicles with our pipeline facilities (for example, this may occur if a third-party were to perform excavation or construction work near our facilities or vehicles colliding with above-ground pipeline facilities) and catastrophic events, such as severe weather events, hurricanes, thunderstorms, tornadoes, sustained extreme temperatures, earthquakes, floods, acts of terrorism, pandemics and other health crises, or other similar events beyond our control. DisruptionsClimate change could cause these catastrophic events to the operations of natural gas producers who supply us with natural gas, including due to the loss of power, could disrupt our ability to serve our customers.become more severe or more frequent. It is also possible that our facilities, or those of our counterparties or service providers, could be direct targets or indirect casualties of an act of terrorism, including cyber-attacks. Lapses in judgement or failure to follow protocolsThese issues could lead to warranty and indemnification liabilities or catastrophic accidents, causing property damage or personal injury. A casualty occurrence might result in injury orlegal liability, repair and remediation costs, increased operating costs, significantly increased capital expenditures, regulatory fines and penalties and other costs and a loss of life, extensive property damage or environmental damage caused to or by employees, customers, contractors, vendors and other third parties. The location of pipeline facilities near populated areas, including residential areas, commercial business centers and industrial gathering places, could increase the level of damages resulting from these risks. Liabilities incurred and interruptions to the operations of our pipelines or other facilities caused by such an event could reduce revenues generated by us and increase expenses, which could have a material adverse effect on our financial condition, results of operations and cash flows. Additionally, our regulators may not allow us to recover part or all of the increased cost related to the foregoing events from our customers, which would adversely affect our earnings and cash flows.customer confidence.
Unanticipated events or a combination of events, failure in resources needed to respond to events, or slow or inadequate response to events may have an adverse impact on our financial condition, results of operations and cash flows.
While we haveOur general liability, cyber, and property insurance currently in place in amounts that we consider appropriate based on our assessmentpolicies for many of business riskthese hazards and best practices in our industry and in general business, such policiesrisks are subject to certain limits, deductibles, and policy exclusions. Further, we are not fully insured against all risks inherent in our business, including certain types of catastrophic events. As a result of market conditions, premiums and deductibles for certain insurance policies can increase substantially, and, in some instances, certain insurance may become unavailable or available only for reduced amounts
of coverage. Consequently, we may not be able to renew existing insurance policies or purchase other desirable insurance on commercially reasonable terms, if at all.
The insurance proceeds received for any loss of, or any damage to, any of our systems or facilities or to third parties may not be sufficient to restore the total loss or damage. Further, the proceeds of any such insurance may not be paidreceived in a timely manner. The occurrence of any of the foregoing could have a material adverse effect on our financial condition, results of operations and cash flows.
We may be unable to attract and retain management and professional and technical employees, or we may experience workforce disruptions due to strikes or work stoppages by our unionized employees, which could adversely impact our operations, earnings, and cash flows.
Our ability to implement our business strategy, satisfy our regulatory requirements, and serve our customers is dependent upon our ability to continue to recruit and employ a skilled, agile, diverse, and engaged workforce consisting of talented and experienced managers, professional and technical employees. The competition for talent has become increasingly intense and we may experience increased employee turnover due to a tight labor market. If we are unable to recruit and retain an appropriately qualified workforce, we could encounter operating challenges primarily due to a loss of institutional knowledge and expertise, errors due to inexperience, or the lengthy time period typically required to adequately train replacement personnel. In addition, higher costs could result from loss of productivity, increased safety compliance issues, or cost of contract labor. Additionally, approximately 18 percent of our employees are represented by collective-bargaining units under collective-bargaining agreements. Disputes over the agreements or failure to timely and effectively renegotiate new agreements upon their expiration could have a negative effect on our business, financial condition and results of operations or result in a work stoppage. Any future work stoppage could, depending on the breadth and the length of the work stoppage, have a material adverse effect on our financial condition, results of operations and cash flows.
The availability of adequate natural gas pipeline transportation and storage capacity and natural gas supply may decrease and impair our ability to meet customers’ natural gas requirements and our financial condition may be adversely affected.
In order to meet customers’ natural gas demands, we rely on and must obtain sufficient natural gas supplies, pipeline transportation and storage capacity from third parties. We must contract for reliable and adequate delivery capacity for our distribution system, while considering the dynamics of the interstate and intrastate pipeline capacity markets, our own in-system resources, as well as the characteristics of our customer base. If we are unable to obtain these, our ability to meet our customers’ natural gas requirements could be impaired. A significantIf a substantial disruption to or reduction in natural gas supply, pipeline capacity or
storage capacity occurred due to events including, but not limited to operational failures or disruptions, severe weather events, hurricanes, thunderstorms, tornadoes, sustained extreme temperatures, earthquakes, floods, freeze off of natural gas wells, terrorist or cyber-attacks or other acts of war, or legislative or regulatory actions, hurricanes, tornadoes, floods, earthquakes, extreme cold weather, acts of terrorism, or cyber-attacks or acts of war, our operations or financial results could reduce our normal supply of natural gas. Such severe events may also cause significant reductions in our natural gas in storage, which will take time to replenish, and cause gas restrictions or curtailment of operations and delivery of natural gas to customers including, for example, restrictions and curtailments imposed by regulators during the recent February 2021 winter weather event. These types of events and disruptions could have a material adverse effect on our business, contracts, financial condition, operating results, cash flow, liquidity and prospects.
We may not be able to complete necessary or desirable expansion or infrastructure development projects, which may delay or prevent us from serving our customers or expanding our business.
In order to serve new customers or expand our service to existing customers, we may need to maintain, expand or upgrade our distribution and/or transmission infrastructure, including laying new distribution lines. Various factors may prevent or delay us from completing such projects or make completion more costly, such as the inability to obtain required approvals from local, state and/or federal regulatory and governmental bodies, public opposition to the project, inability to obtain adequate financing, competition for labor and materials, construction delays, cost overruns, and inability to negotiate acceptable agreements relating to construction or other material components of an infrastructure development project. As a result, we may not be able to adequately serve existing customers or support customer growth, which would adversely impact our business, stakeholder perception, financial condition, results of operations and cash flows.
Our risk-management policies and procedures may not be effective, and employees may violate our risk-management policies.
We have implemented a set of policies and procedures that involve both our senior management and the Audit Committee of our Board of Directors to assist us in managing risks associated with our business. These risk-management policies and procedures are intended to align strategies, processes, people, IT and business knowledge so that risk is managed throughout the organization. However, as conditions change and become more complex, current risk measures may fail to assess adequately the relevant risk due to changes in the market and the presence of risks previously unknown to us. Additionally, if employees fail to adhere to our policies and procedures or if our policies and procedures are not effective, potentially because of future conditions or risks outside of our control, we may be exposed to greater risk than we had intended. Ineffective risk-management policies and procedures or violation of risk-management policies and procedures could have a material adverse effect on our earnings, financial condition and cash flows.affected.
Our business increasingly relies on technology, the failure of which or the occurrence of cyber or physical security attacks thereon, or those of third parties, may adversely affect our financial results and cash flows.
Due to increased technologytechnological advances, we have become more reliant on technology to help increase efficiency ineffectively operate our business. We use computer programs and applications to help run our financial and operations organizations,business, including an enterprise resource planning system that integrates data and reporting activities across our Company. Additionally, certain portions of our IT systems and infrastructure are provided or maintained by third-party vendors. The failure of these or other similarly important technologies, the lack of alternative technologies, or our inability to have these technologies supported, updated, expanded, or integrated into other technologies, could hinder our operations, and adversely impact our financial condition and results of operations. The use of technological programs, systems and tools may subject our business to increased risks.
OurThe occurrence of cyber breaches or physical security attacks on our business, is dependent upon our operational systems to process a large amountor those of data and complex transactions. As part ofthird parties, may disrupt or adversely affect our operations we come into contact with sensitive information, including personally identifiable information. If any of our financial, operational or other data processing systems fail or have other significant shortcomings, our financial results could be adversely affected. Our financial results could also be adversely affected if an employee or third party causes our operational systems to fail, either as a result of inadvertent error or by deliberately tampering with or manipulating our operational systems. In addition, dependence upon automated systems may further increase the risk that operational system flaws, employee or third-party tampering or manipulation of those systems will result in losses that are difficult to detectthe loss or mitigate.misuse of confidential and proprietary information.
Additionally, certain portions of our IT, customer service, resource management, pipeline and infrastructure installation and maintenance, engineering, payroll and human resources functions that we rely on are provided by third-party vendors. Services provided by third-parties could be disrupted due to events and circumstances beyond our control which could adversely impact our business, financial condition, results of operations and cash flows.
Any cyber breaches or physical security attacks, or threats of such attacks, that affect our IT systems, distribution facilities, our customers, our suppliers and third-party service providers or any financial data could disrupt normal business operations, expose sensitive information, and/or lead to physical damages that may have a material adverse effect on our business. Physical damage due to a cyber security incident or acts of cyber terrorism could impact services and could lead to material liabilities. As cyber or physical security attacks become more common and sophisticated, we could be required to incur increased costs to strengthen our systems or to obtain additional insurance coverage against potential losses. Federal and state regulatory agencies are increasingly focused on risk related to physical security and cybersecurity in general, and specifically in critical infrastructure sectors, including natural gas distribution. In addition, cyber or physical attacks or threats on our Company, customer and employee data may result in a financial loss and may adversely impact our business, financial condition, results of operations and cash flows. Third-party systems on which we rely could also suffer such attacks or operational system failure.
While we have implemented and continue to evaluate and improve policies, procedures, protective technologies, and controls to prevent and detect cyber or physical security attacks, there is no guarantee that these efforts (or any similar efforts by third parties on which we rely) will be effective against any particular cyber or physical attack or protect us from unauthorized access or damage to our systems. A severe attack or security breach could adversely affect our business reputation, diminish customer confidence, disrupt operations, subject us to financial liability or increased regulation, increase our costs and expose us to material legal claims and liability which may not be fully covered by insurance, and our business, financial condition, results of operations and cash flows could be adversely affected.
Failure As cyber or physical security attacks become more frequent and sophisticated, we could be required to maintain the security of personally identifiable information could adversely affect us.
In connection withincur increased costs to strengthen our business wesystems or to obtain additional insurance coverage against potential losses. Federal and our vendors, suppliersstate regulatory agencies, such as DHS and contractors collect and retain personally identifiable information (e.g., information of our customers, shareholders, suppliers and employees), and there is an expectation that we and such third parties will adequately protect that information. The U.S. regulatory environment surrounding informationTSA, are increasingly focused on risks related to physical security and privacy is increasingly demanding. New lawscybersecurity in general and have promulgated more stringent security regulations governing data privacyspecifically for certain federal contractors and the unauthorized disclosure of confidential information pose increasingly complex compliance challenges and potentially elevate our costs. critical infrastructure sectors, including natural gas distribution. Any failure by us to comply with these laws andsuch government regulations including as a result of a security or privacy breach, could result in significant penalties and liabilities for us. A significant theft, loss or fraudulent use of the personally identifiable information we maintain or failure of our vendors, suppliers and contractors to use or maintain such data in accordance with contractual provisions could adversely impact our reputation and could result in significant costs, fines, litigation.
Our business could be adversely affected by strikes or work stoppages by our unionized employees, which may impact our operations, cash flows and earnings.
At February 1, 2021, approximately 700 of our estimated 3,700 employees were represented by collective-bargaining units under collective-bargaining agreements. We are involved periodically in discussions with collective-bargaining units representing some of our employees to negotiate or renegotiate labor agreements. We cannot predict the results of these negotiations, including whether any failure to reach new agreements will have a negative effect on our business, financial condition and results of operations or whether we will be able to reach any agreement with the collective-bargaining units. Any failure to reach agreement on new labor contracts might result in a work stoppage. Any future work stoppage could, depending on the operations and the length of the work stoppage, have a material adverse effect on our financial condition, results of operations and financial condition.
We are subject to various risks associated with climate change which could increase our operating costs or restrict our opportunities in new or existing markets, adversely affecting our financial results, growth, cash flows.flows and results of operations.
Climate change may increase the likelihood of extreme weather in our service territory, and our customers’ energy use could increase or decrease depending on the duration and magnitude of any changes. A decrease in energy use due to weather changes may affect our financial condition through decreased revenues and cash flows which are not adequately offset by our WNA mechanisms. Extreme weather conditions in general require increased system resiliency, adding to costs, and can contribute to increased system stresses, including service interruptions. Weather conditions outside of our operating territory could also have an impact on our revenues and cash flows by affecting natural gas prices and the availability of our leased transportation and storage capacity. Weather impacts our operations primarily through severe weather events, including hurricanes, thunderstorms, tornadoes, sustained extreme temperatures, snow and ice storms, earthquakes, floods, or other similar events beyond our control. To the extent the frequency of extreme weather events increases, our costs of providing service and our working capital requirements could increase.
A shortage of skilled labor may make it difficult for us to maintain labor productivity and competitive costs, which could adversely affect operations, cash flows and earnings. Further, we may be unable to attract and retain management and professional and technical employees, which could adversely impact our operations, earnings and cash flows.REGULATORY AND LEGISLATIVE RISKS
Our operations require skilled and experienced workers with proficiency in multiple tasks. In recent years, a shortage of workers trained in various skills associated with the natural gas distribution business has caused us to conduct certain operations without full staff, thus hiring outside resources, which may decrease productivity and increase costs. This shortage of trained workers is the result of experienced workers reaching retirement age and increased competition for workers in certain areas, combined with the challenges of attracting new qualified workers to the natural gas distribution industry. This shortage of skilled labor could continue over an extended period. If the shortage of experienced labor continues or worsens, it could have an adverse impact on labor productivity and costs and our ability to meet the needs of our customers in the event there is an increase in the demand for our products and services, which could adversely affect our business and cash flows.
Our ability to implement our business strategy, satisfy our regulatory requirements, and serve our customers is dependent upon our ability to continue to recruit and employ talented management and professionals while retaining a skilled, agile, diverse and engaged workforce. We are subject to federal, state, and local regulation of the risksafety of our systems and operations, including pipeline safety, system integrity, and the safety of our employees and facilities that we willmay require significant expenditures or, in the case of noncompliance, substantial fines or penalties.
We are subject to regulation under federal pipeline safety statutes promulgated by PHMSA, DOT, OSHA, and any analogous state regulations. These include safety requirements for the design, construction, operation, and maintenance of pipelines, including transmission and distribution pipelines. Additionally, the workplaces associated with our facilities are subject to the requirements of DOT and OSHA, and comparable state statutes that regulate the protection of the health and safety of workers. Compliance with existing or new laws and regulations may result in increased capital, operating and other costs which may not be able to effectively replace or transfer the knowledge and expertise of retiring management or employees. Without effective succession, our ability to provide quality service torecoverable in rates from our customers or may impact materially our competitive position relative to other energy providers. The failure to comply with these laws, regulations and satisfyother requirements, or an accident or injury to employees could expose us to civil or criminal liability, enforcement actions, fines, penalties, or injunctive measures that may not be recoverable through our regulatory requirements will be challenged,rates and this could adversely impacthave a material adverse effect on our business, financial condition, results of operations, cash flows, and reputation.
We are subject to federal, state, and local laws, rules and regulations that could impact our ability to earn a reasonable rate of return on our invested capital and to fully recover our invested capital, operating costs, and natural gas costs.
We are subject to regulatory oversight from various federal, state, and local regulatory authorities, including the OCC, KCC, RRC and various municipalities in Texas. Regulatory actions from these authorities relate to allowed rates of return, rate design and construct, and purchased gas and operating cost recovery. Therefore, our returns are continuously monitored and are subject to challenge for their reasonableness by regulatory authorities or third-party intervenors. Our ability to obtain timely future rate increases depends on regulatory discretion and therefore, there can be no assurance that we will be able to obtain rate increases, fully recover our costs or that our authorized rates of return will continue at the current levels, which could adversely impact our results of operations, financial condition, and cash flows.
In the normal course of business, assets are placed in service before regulatory action is taken, such as filing a rate case or seeking interim recovery under a capital tracking mechanism that could result in an adjustment of our returns. Once we make a regulatory filing, regulatory bodies have the authority to suspend implementation of the new rates while evaluating the filing. Because of this process, we may suffer the negative financial effects of having placed assets in service that do not initially earn our authorized rate of return or may not be allowed recovery on such expenditures at all.
We are subject to environmental regulations and failurelegislation, including those intended to comply with these regulationsaddress climate change, which could result in significant fines or penaltiesincrease our operating costs, adversely affecting our financial results, growth, cash flows and could adversely affect our operations or financial results.results of operations.
We are subject to laws, regulations and other legal requirements enacted or adopted by federal, state and local governmental authorities, including the EPA and any analogous state agencies, relating to environmental and health and safety matters,protection of the environment, including those legal requirements that govern discharges of substances into the air and water, the management and disposal of hazardous substances and waste, the clean-up of contaminated sites, groundwater quality and availability, plant and wildlife protection, as well as work practices related to employee health and safety. Environmental legislation also requires that our facilities, sites, and other properties associated with our operations be operated, maintained, abandoned, and reclaimed to the satisfaction of applicable regulatory authorities. The failure to comply with theseany laws, regulations, permits and other requirements, or the discovery of presently unknown environmental conditions, could expose us to civil or criminal liability, enforcement actions and regulatory fines and penalties that may not be recoverable through our rates and could have a material adverse effect on our business, financial condition, results of operations and cash flows.
WeInternational, federal, regional and/or state legislative and/or regulatory initiatives may attempt to regulate greenhouse gas emissions, including carbon dioxide and methane, as a response to the threat of climate change. Various states and municipalities have adopted or are considering adopting legislation, regulations or other regulatory initiatives that are focused on areas such as greenhouse gas cap and trade programs, carbon taxes, reporting and tracking programs, and restrictions on emissions. Such laws or regulations could impose costs tied to carbon emissions, operational requirements or restrictions, or additional charges to fund energy efficiency activities. They could also ownincentivize alternative energy sources, impose costs or retain legal responsibility for certain environmental conditions at certain former MGP sites. A numberrestrictions on end users of environmental issues may existnatural gas, or result in other costs or requirements, such as costs associated with respectthe adoption of new infrastructure and technology to these former MGP sites. Accordingly, future costs are dependent on the final determination and regulatory approval of any remedial actions, the complexity of the site, level of remediation, changing technology and governmental regulations and could be materialrespond to our financial condition, results of operations and cash flows.new mandates.
With the trend toward stricter standards, greater regulation and more extensive permit requirements for the types of assets operated by us that are subject to environmental regulation, our environmental expenditures could increase in the future, and such expenditures may not be fully recovered by insurance or recoverable in rates from our customers, which could adversely affect our financial condition, results of operations and cash flows.
We are subject to physical and financial risks associated with climate change, which may adversely affect our financial results, growth, cash flows and results of operations.
There is a growing belief that emissions of greenhouse gases may be linked to global climate change. Climate change creates physical and financial risks. Our customers’ energy needs vary with weather conditions, primarily temperature and humidity. For residential customers, heating and cooling represent their largest energy use. To the extent weather conditions may be affected by climate change, customers’ energy use could increase or decrease depending on the duration and magnitude of any changes. To the extent climate change adversely impacts the economic health of our operating territory, it could adversely impact customer demand or our customers’ ability to pay. A decrease in energy use due to weather changes may affect our financial condition through decreased revenues and cash flows. Extreme weather conditions in general require more system backup, adding to costs, and can contribute to increased system stresses, including service interruptions. Weather conditions outside of our operating territory could also have an impact on our revenues and cash flows by affecting natural gas prices. Severe weather impacts our operating territories primarily through severe weather events, hurricanes, thunderstorms, tornadoes, sustained extreme temperatures, earthquakes, floods or other similar events beyond our control. To the extent the frequency of extreme weather events increases, our costs of providing service and our working capital requirements could increase. We may
not be able to pass on the higher costs to our customers or recover all the costs related to mitigating these physical risks. To the extent financial markets view climate change and emissions of greenhouse gases as a financial risk, this could adversely affect our ability to access capital markets or cause us to receive less favorable terms and conditions in future financings. Our business could be affected by the potential for lawsuits related to or against greenhouse gas emitters based on the claimed connection between greenhouse gas emissions and climate change, which could adversely impact our business, results of operations and cash flows.
Regulatory and Legislative Risks
Regulatory actions could impact our ability to earn a reasonable rate of return on our invested capital and to fully recover our invested capital, operating costs and natural gas costs.
In addition to regulation by other governmental authorities, we are subject to regulation by the OCC, KCC, RRC and various municipalities in Texas. These authorities set the rates that we charge our customers for our services. Our ability to obtain timely future rate increases depends on regulatory discretion. Significant events, including severe weather events, may result in us experiencing unforeseeable and unprecedented market pricing for gas costs, as well as financing costs related to the payment of gas costs, all or a part of which may not be recoverable through our tariffs in each state where we operate. As such, there can be no assurance that we will be able to obtain rate increases, fully recover our natural gas costs or that our authorized rates of return will continue at the current levels.
We monitor and compare the rates of return we achieve with our allowed rates of return and initiate general and specific rate proceedings as needed. If a regulatory agency were to prohibit us from setting rates that allow for the timely recovery of our costs and a reasonable return by significantly lowering our allowed return or adversely altering our cost allocation, rate design or other tariff provisions, modifying or eliminating cost trackers, prohibiting recovery of regulatory assets or disallowing portions of our expenses, then our earnings could be adversely impacted. Regulatory proceedings also involve a risk of rate reduction, because once a proceeding has been filed, it is subject to challenge by various intervenors. Risks and uncertainties relating to delays in obtaining, or failure to obtain, regulatory approvals, conditions imposed in regulatory approvals, and determinations in regulatory investigations can also impact financial performance. In particular, the timing and amount of rate relief can materially impact results of operations, financial condition and cash flows.
Further, accounting principles that govern our Company permit certain assets that result from the regulatory process to be recorded on our consolidated balance sheets that could not be recorded under GAAP for nonregulated entities. We consider factors such as rate orders from regulators, previous rate orders for substantially similar costs, written approval from the regulators and analysis of recoverability by internal and external legal counsel to determine the probability of future recovery of these assets. If we determine future recovery is no longer probable, we would be required to write off the regulatory assets at that time, which would also adversely affect our financial condition, results of operations and cash flows. Regulatory authorities also review whether our natural gas costs are prudent and can adjust the amount of our natural gas costs that we pass through to our customers. In certain instances, including in the event of significant and severe weather events, we may apply to regulators seeking authority to timely recover extraordinary costs, and our application may not be approved. If any of our natural gas costs or related expenses were disallowed, our results of operations and cash flows would also be adversely affected.
In the normal course of business in the regulatory environment, assets are placed in service before regulatory action is taken, such as filing a rate case or for interim recovery under a capital tracking mechanism that could result in an adjustment of our returns. Once we make a regulatory filing, regulatory bodies have the authority to suspend implementation of the new rates while studying the filing. Because of this process, we may suffer the negative financial effects of having placed in service assets that do not initially earn our authorized rate of return or may not be allowed recovery on such expenditures at all.
The profitability of our operations is dependent on our ability to timely recover the costs related to providing natural gas service to our customers. However, we are unable to predict the impact that new regulatory requirements will have on our operating expenses or the level of capital expenditures and we cannot give assurance that our regulators will continue to allow recovery of such expenditures in the future. Changes in the regulatory environment applicable to our business or the imposition of additional regulation could impair our ability to recover costs absorbed historically by our customers, and adversely impact our results of operations, financial condition and cash flows.
We are subject to comprehensive energy regulation by governmental agencies, and the recovery of our costs is dependent on regulatory action.
We are subject to comprehensive regulation by severalfederal, state, and municipal utility regulatory agencies, which significantly influences our operating environmentlocal laws, rules and our ability to recover our costs from utility customers. The utility regulatory
authorities in Oklahoma, Kansas and Texas regulate many aspects of our utility operations, including organization, safety, financing, affiliate transactions, customer service and the terms of service to customers, including the ratesregulations that we can charge customers.
The profitability ofcould affect our operations is dependent on our ability to recover costs, including income taxes, related to providing natural gas to our customers by filing periodic rate cases. The regulatory environment applicable to our operations could impair our ability to recover costs historically included in the rates billed to our customers. In addition, as the regulatory environment applicable to our operations increases in complexity, the risk of inadvertent noncompliance could also increase. Our failure to comply with applicable laws and regulations could result in the imposition of fines, penalties or other enforcement actions by the authorities that regulate our operations that would not be recoverable in our rates.
We are unable to predict the impact that the future regulatory activities of these agencies will have on our operations. Changes in regulations or the imposition of additional regulations could have an adverse impact on our business, financial condition and results of operations. Further, the results of our operations could be impacted adversely if our authorized cost-recovery mechanisms do not function as anticipated.results.
Our business and operations are subject to regulation by a number of federal agencies, including FERC, DOT, OSHA, EPA, CFTC, IRS and various regulatorystate agencies in Oklahoma, Kansas, and Texas, and we are subject to numerous other federal and state laws and regulations. Future changes to laws, regulations and policies may impair our ability to compete for business or to recover costs and could adversely affect our cash flows, restrict our ability to make capital investments and may cause us to increase the cost of our operations. Furthermore, because the language in some lawsdebt and regulations is not prescriptive, there is a risk that our interpretation of these laws and regulations may not be consistent with expectations of regulators.take other actions to conserve cash. Any compliance failure related to these laws and regulations may result in fines, penalties or injunctive measures affecting our operating assets. For example, under the Energy Policy Act of 2005, the FERC has civil penalty authority under the Natural Gas Act of 1938, as amended, to impose penalties for current violations of up to $1 million per day for each violation. In addition, as the regulatory environment for our industry increases in complexity, the risk of inadvertent noncompliance could also increase. The fines or penalties for noncompliance with laws and regulations may not be recoverable through our rates. Our failure to comply with applicable regulations could result in a material adverse effect on our business, financial condition, results of operations and cash flows.
Carbon neutral, energy-efficiency or other legislation or regulations intended to address climate change could increase our operating costs or restrict our market opportunities, adversely affecting our financial results, growth, cash flows and results of operations.
International, federal, regional and/or state legislative and/or regulatory initiatives may attempt to control or limit the causes of climate change, including greenhouse gas emissions, such as carbon dioxide and methane. Such laws or regulations could impose costs tied to carbon emissions, operational requirements or restrictions, or additional charges to fund energy efficiency activities. They could also provide a cost advantage to alternative energy sources, impose costs or restrictions on end users of natural gas, or result in other costs or requirements, such as costs associated with the adoption of new infrastructure and technology to respond to new mandates. The focus on climate change could adversely impact the reputation of fossil fuel products or services. The occurrence of the foregoing events could put upward pressure on the cost of natural gas relative to other energy sources, increase our costs and the prices we charge to customers, reduce the demand for natural gas or cause fuel switching to other energy sources, and impact the competitive position of natural gas and the ability to serve new or existing customers, adversely affecting our business, results of operations and cash flows.
We are involved in legal or administrative proceedings before various courts and governmental bodies that could adversely affect our financial condition, results of operations and cash flows.
In the normal course of business, we are involved in legal or administrative proceedings before various courts and governmental bodies with respect to general claims, rates, environmental issues, gas cost prudence reviews and other matters. Adverse decisions regarding these matters, to the extent they require us to make payments in excess of amounts provided for in our consolidated financial statements, or to the extent they are not covered by insurance, could adversely affect our financial condition, results of operations and cash flows.
Changes in federal and state fiscal, tax and monetary policy could significantly increase our costs and decrease our cash flows.
Changes in federal and state fiscal, tax and monetary policy may result in increased taxes, interest rates, and inflationary pressures on the costs of goods, services and labor or may result in refunding amounts previously collected for deferred taxes to customers on an accelerated basis. This could increase our expenses and capital spending and decrease our cash flows if we are
not able to recover or recover timely such increased costs from our customers. This series of events may increase our rates to customers and thus may adversely impact customer growth. Changes in tax rates could adversely affect our cash flows and may increase the cash we pay for income taxes in the future. Changes in monetary or other policies of the federal or state governments may adversely affect the economic climate for the United States, the regions in which we operate or particular industries, such as ours or those of our customers. Any of these events could adversely affect our cash flows, restrict our ability to make capital investments and may cause us to increase debt and take other actions to conserve cash.
Financial, Economic and Market RisksFINANCIAL, ECONOMIC AND MARKET RISKS
Unfavorable economic and market conditions could adversely affect our financial condition, earnings, cash flows and cash flows.limit our future growth.
Weakening economic activity in our markets and supply chain disruptions could result in a loss of existing customers, fewer new customers, especially in newly constructed homes and other buildings, or a decline in energy consumption, any of which could adversely affect our revenues or restrict our future growth. ItThese conditions may becomemake it more difficult for customers to pay their natural gas bills, leading to slow collections and higher-than-normal levels of accounts receivable, which in turn could increase our financing requirements and bad debt expense. Customers may also experience difficulties paying their natural gas bills in the instance of severe weather events that result in higher usage and higher natural gas prices, exacerbating impacts onreducing our ability to collectcollections and furtheringincreasing our increasing financing requirements and bad debt expense, which could have a material adverse effect on our business, contracts, financial condition, operating results, cash flow, liquidity, and prospects.
We cannot predict the timing, strength, or duration of any future economic slowdowns. Fluctuations and uncertainties in the economy make it challenging for us to accurately forecast and plan future business activities and to identify risks that may affect our business, financial condition, results of operations and cash flows. The foregoing could adversely affect our business, financial condition, results of operations and cash flows.
Increases in the price of natural gas could reduce our earnings, increase our working capital requirements, and adversely impact our customer base.
Changes in supply and demand within the natural gas markets, as well as other factors, could cause an increase in the price of natural gas. The increased production in the U.S. of natural gas from shale formations generally has put downward pressure on the wholesale cost of natural gas in recent years; however, other factors could put upward pressure on natural gas prices, including weather-related events, restrictions or regulations on shale natural gas production and waste water disposal, increased demand from natural gas fueled electric power generation and increases in natural gas exports. Market conditions can also lead to short-term price spikes in natural gas prices, such as high demand during periods of extreme cold weather or system constraints at specific delivery locations.
Natural gas costs are passed through to our customers based on the actual cost of the natural gas we purchase and a customer’s consumption. Regulatory authorities review whether our natural gas costs are prudent and can adjust the amount of our natural gas costs that we pass through to our customers. The disallowance of or delay in recovery of our natural gas costs could adversely affect our financial condition, results of operations and cash flows. Additionally, an An increase in the price of natural gas could cause us to experience a significant increase in short-term or long-term debt because we must pay suppliers for natural gas when purchased.
Further, higher and more volatileWe cannot predict the timing, severity, or duration of any future economic slowdowns or natural gas pricesmarket disruptions. Fluctuations and uncertainties in the economy may adversely impact our customers’ perception of natural gas. Substantial fluctuations in natural gas prices can occur from year to year and sustained periods of high natural gas prices or of pronounced natural gas price volatility may lead to customers selecting other energy alternatives, such as electricity, and to increased scrutiny of the prudence of our natural gas procurement strategies and practices by our regulators. It may also cause new home developers, builders and new customers to select alternative sources of energy. Additionally, high natural gas prices may cause customers to conserve more and may also adversely impact our accounts receivable collections, resultingresult in higher bad debt expense.interest rates and inflationary pressures on the costs of goods, services, and labor. This could increase our expenses and capital spending and decrease our cash flows if we are not able to recover or recover timely such increased costs from our customers. The occurrence of any of the foregoing could adversely affect our business, financial condition, results of operations and cash flows, as well as our future growth opportunities.
Our business is subject to competition that could adversely affect our results of operations.
The natural gas distribution business is competitive, and we face competition from other companies that supply energy, including electric companies, private generation, solar energy producers, propane dealers, other renewable energy providers and from other sources of energy for power generation, such as coal or nuclear energy. Significant competitive factors include efficiency, quality and reliability of the services we provide and the price we charge.
The most significant product competition occurs between natural gas and electricity in the residential and small commercial markets. Natural gas competes with electricity for water and space heating, cooking, clothes drying and other general energy needs. Increases in the price of natural gas or decreases in the price of other energy sources could adversely impact our competitive position by decreasing the price benefits of natural gas to the consumer. Customers and builders typically make the decision on the type of equipment at initial installation and use the chosen energy source for the life of the equipment. Changes in the competitive position of natural gas relative to electricity and other energy products have the potential to cause a decline in consumption or in the number of natural gas customers.
Consumer or government-mandated conservation efforts, bans on natural gas infrastructure in new construction, higher natural gas costs or decreases in the price of other energy sources also may encourage decreases in natural gas consumption and allow competition from alternative energy sources for applications that have used natural gas, encouraging some customers to move away from natural gas-powered equipment to equipment fueled by other energy sources. Competition between natural gas and other forms of energy is also based on efficiency, performance, reliability, safety, environmental and other nonprice factors. Technological improvements in other energy sources, energy storage, conservation, efficiency and events that impair the public perception of the nonprice attributes of natural gas could erode our competitive advantage. These factors in turn could decrease the demand for natural gas, impair our ability to attract new customers, and cause existing customers to switch to other forms of energy or to bypass our systems in favor of alternative competitive sources. This could result in slow or no customer growth and could cause customers to reduce or cease using our product, thereby reducing our ability to make capital expenditures and otherwise grow our business and adversely affecting our financial condition, results of operations and cash flows.
Our business activities are concentrated in three states.
We provide natural gas distribution services to customers in Oklahoma, Kansas, and Texas. Changes in the regional economies, politics, regulations, regulatory decisions by state and local regulatory authorities, and weather patterns of these states could adversely impact the growth opportunities available to us and the usage patterns and financial condition of our customers. This could adversely affect our financial condition, results of operations and cash flows.
A downgrade in our credit ratings or placing those ratings on negative outlook or watch could adversely affect our cost of and ability to access capital.
Our ability to obtain adequate and cost-effective financing depends in part on our credit ratings. Our credit ratings are subject to change at any time in the discretion of the applicable rating agencies. Numerous factors, including many of which are not within our control, are considered by the rating agencies in connection with assigning credit ratings. A reduction in our ratings by our rating agencies could adversely affect our costs of borrowing and/or access to sources of liquidity and capital. Such a downgrade could further limit or delay our access to public and private credit markets and increase the costs of borrowing under available credit lines. While the current Moody’s and S&P (collectively, the Rating Agencies) issuer credit ratings for ONE Gas are investment grade, there is no assurance that these credit ratings will not be downgraded. A downgrade of our credit ratings may materially and adversely affect the market prices of our equity and debt securities, the interest rates at which borrowings are made and debt securities and commercial paper are issued, and the various fees on credit facilities. This could make it significantly more costly for us to borrow money, to issue debt securities and to raise certain other types of capital and/or complete additional financings. Such negative credit rating actions, as well as the reasons for such actions, could materially and adversely affect our cash flows, results of operations and financial condition and the market price of, and our ability to pay the principal of and interest on, our debt securities. Should our credit ratings be downgraded, it could limit or delay our ability to obtain additional financing in the future for working capital, capital expenditures and acquisitions when necessary or desirable. In addition, our pool of investors and prospective creditors would likely decrease. An increase in borrowing costs without the ability to recover these higher costs in the rates charged to our customers could adversely affect our results of operations, financial condition and cash flows by limiting our ability to earn our allowed rate of return.
Moreover, most of our large suppliers and counterparties require an expected level of creditworthiness in order for them to enter into transactions with us. If our credit ratings decline, the costs to operate our business could increase because counterparties could require the posting of collateral in the form of cash-related instruments, or counterparties could decline to do business with us.
Demand for natural gas is highly weather sensitive and seasonal, and weather conditions may cause our earnings to vary from year to year.
Our earnings can vary from year to year, depending in part on weather conditions, which directly influence the volume of natural gas delivered to customers. Natural gas sales to residential and commercial customers are seasonal, as a substantial portion of their natural gas requirements are for heating during the winter months. Warmer-than-normal weather can reduce our
utility margins as customer consumption declines. We have implemented WNA mechanisms for our sales to customers in Oklahoma, Kansas and Texas, which are designed to reduce our earnings sensitivity to weather. WNA mechanisms require us to increase customer billings to offset lower natural gas usage when weather is warmer than normal and decrease customer billings to offset higher natural gas usage when weather is colder than normal. If our rates and tariffs are modified to curtail such weather protection programs, then we would be exposed to additional risk associated with weather. As a result of occurrences of the foregoing, our results of operations, financial condition and cash flows could vary and be impacted adversely.
Emerging technologies may cause disruption in utility services, which may adversely affect our customer growth, earnings and cash flows.
Commercial technologies that advance electrification and increase energy efficiency in some aspects of the economy, such as transportation or heating, could negatively impact the demand for natural gas. We may not be able to quickly adapt to changes resulting from rapidly advancing technologies that may result in a reduction in demand for our services. This could slow customer growth and even cause customers to reduce or cease using natural gas which could have a material adverse effect on our financial condition, results of operations and cash flows.
An impairment of goodwill and long-lived assets could reduce our earnings.
At December 31, 2020, we had approximately $158 million of goodwill recorded on our Consolidated Balance Sheet. Goodwill is recorded when the purchase price of a business exceeds the fair market value of the tangible and separately measurable intangible net assets. GAAP requires us to test goodwill for impairment on an annual basis or when events or circumstances occur indicating that goodwill might be impaired. Long-lived assets with finite useful lives are reviewed for impairment whenever events or changes in circumstances indicate that the carrying amount may not be recoverable. If we determine that impairment is indicated, we would be required to take an immediate noncash charge to earnings with a correlative effect on our equity and balance sheet leverage as measured by debt to total capitalization, which could adversely impact our financial condition and results of operations.
We may be unableThe inability to access capital or oursignificant increases in the cost of capital may increase significantly which maycould adversely affect our results of operations, cash flows and financial condition.
Our ability to obtain adequate and cost-effective financing is dependent upon the liquidity of the financial markets, in addition toas well as our financial condition and credit ratings. Disruptions in the capital and credit markets could adversely affect our ability to access short-term and long-term capital. Access to funds under our ONE Gas Credit Agreement, our commercial paper program, our ONE Gas 364-day Credit Agreement and our ONE Gas 2021 Term Loan Facility will be dependent on the ability of the participating banks to meet their funding commitments and any issues with lenders causing them to stop purchasing our commercial paper. Those banks may not be able to meet their funding commitments if they experience shortages of capital and liquidity. Disruptions and volatility in the global credit markets could cause the interest rate we pay on our ONE Gas Credit Agreement, our ONE Gas 2021 Term Loan Facility, our commercial paper program, and our ONE Gas 364-day Credit Agreement, which is based on LIBOR, to increase. This could result in higher interest rates on future financings and could impact the liquidity of the lenders under our ONE Gas Credit Agreement, our ONE Gas 2021 Term Loan Facility and our ONE Gas 364-day Credit Agreement, potentially impairing their ability to meet their funding commitments to us. Disruptions in the capital and credit markets as a result of uncertainty, changing or increased regulation or failures of significant financial institutions could adversely affect our access to capital needed for our business. The inability to access adequate capital or an increase in the cost of capital may require us to conserve cash, prevent or delay us from making capital expenditures, and require us to reduce or eliminate our dividend or other discretionary uses of cash. A significant reduction in our liquidity could cause a negative change in our ratings outlook or even a reduction in our credit ratings. This could in turn further limit our access to credit markets and increase our costs of borrowing. Additionally, as we have recently entered into the ONE Gas 2021 Term Loan Facility in February 2021, our additional indebtedness may limit our ability to borrow additional funds, if needed, or prevent us from raising the funds on commercially reasonable terms, or on terms acceptable to us, or at all.
As a result of cross-default provisions in our borrowing arrangements, we may be unable to satisfy all of our outstanding obligations in the event of a default on our part, which may adversely affect our results of operations, cash flows and financial condition.
The terms of our debt agreements contain cross-default provisions, which provide that we will be in default under such agreements in the event of certain defaults under other debt agreements. Accordingly, should an event of default occur under any of those agreements, we would face the prospect of being in default under many or all of our debt agreements, obliged in such instance to satisfy all of our outstanding indebtedness under many or all such agreements simultaneously. In such an event,
we may not be able to obtain alternative financing or, if we are able to obtain such financing, we may not be able to obtain it on terms acceptable to us, which would adversely affect our ability to implement our business plan, have flexibility in planning for, or reacting to, changes in our business, make capital expenditures and finance our operations.
The cost of providing pension and other postemployment health care benefits to eligible employees and qualified retirees is subject to changes in pension fund values, changing demographics and other factors and may increase our costs. In addition, the passage of the Patient Protection and Affordable Care Act in 2010 and the Consolidated Appropriations Act in 2021 and the potential revision, repeal and/or replacement of either of these acts could increase the cost of health care benefits for our employees. Further, the costs to us of providing such benefits and related funding requirements are subject to the continued and timely recovery of such costs through our rates which may adversely affect our cash flows and earnings.
We have defined benefit pension plans and other postemployment welfare plans for certain eligible employees. Our defined benefit plans are closed to new participants. Our other postemployment welfare plans subsidize costs for providing postemployment medical benefits and life insurance. The cost of providing these benefits to eligible current and former employees is subject to changes in the market value of our pension and other postemployment benefit plan assets, changing demographics, including longer life expectancy of plan participants and their beneficiaries, current and future legislative changes, changes in health care costs, changes in discount rates used to calculate liability, and various actuarial calculations and assumptions.
Any sustained declines in equity markets and reductions in bond values may have a material adverse effect on the value of our pension and other postemployment benefit plan assets. In these circumstances, additional cash contributions to our pension and other postemployment benefit plans may be required, which could have a material adverse impact on our financial condition and cash flows.
In addition, the costs of providing health care benefits to our employees could increase over the next several years due in large part to the Patient Protection and Affordable Care Act of 2010 and the Consolidated Appropriations Act in 2021, and the potential revision, repeal and/or replacement of either of these acts. The future costs of compliance with the provisions are difficult to measure at this time. Also, our costs of providing such benefits and related funding requirements could also materially increase in the future, depending on the timing of the recovery, if any, of such costs through our rates, which could adversely impact our financial condition and cash flows.
Our financing arrangements subject us to various restrictions that could limit our operating flexibility, earnings and cash flows.
The covenants in the indenture governing our Senior Notes, our ONE Gas Credit Agreement and the ONE Gas 364-day Credit Agreement restrict our ability to create or permit certain liens, to consolidate or merge or to convey, transfer or lease substantially all of our properties and assets.
The ONE Gas Credit Agreement and the ONE Gas 364-day Credit Agreement include a requirement that our debt to total capital ratio may not exceed 70 percent as of the end of any calendar quarter. Events beyond our control could impair our ability to satisfy this requirement. As long as our indebtedness remains outstanding, these restrictive covenants could impair our ability to expand or pursue our growth strategy. The ONE Gas 364-day Credit Agreement is scheduled to mature in April 2021.
In addition, the breach of any covenants or any payment obligations in any of these debt agreements will result in an event of default under the applicable debt instrument. If there were an event of default under one of our debt agreements, the holders of the defaulted debt may have the ability to cause all amounts outstanding with respect to that debt to be due and payable, subject to applicable grace periods. This could trigger cross-defaults under our other debt agreements, including our Senior Notes. Forced repayment of some or all of our indebtedness would reduce our available cash and have an adverse impact on our financial condition, results of operations and cash flows.
Some of our debt, including borrowings under our ONE Gas Credit Agreement, our ONE Gas 364-day Credit Agreement and our commercial paper program, is based on variable rates of interest, which could result in higher interest expenses in the event of an increase in interest rates.
We are exposed to fluctuations in variable interest rates. This increases our exposure to fluctuations in market interest rates. Amounts borrowed under the ONE Gas Credit Agreement, the ONE Gas 364-day Credit Agreement and commercial paper program are based on variable rates of interest. If these rates rise, the interest rate on this debt will also increase. Therefore, an
increase in these rates will increase our interest payment obligations and have a negative effect on our cash flows and financial position.
Conditions in the financial markets and economic conditions generally may materially adversely affect us.
Our business is capital intensive and we rely significantly on long-term debt to fund a portion of our capital expenditures and repay outstanding debt, and on short-term borrowings to fund a portion of day-to-day business operations.
Limitations on the availability of credit and increases in interest rates or credit spreads may materially adversely affect our businesses, cash flows, results of operations, financial condition and/or prospects, as well as our ability to meet contractual and other commitments. In difficult credit market environments, we may find it necessary to fund our operations and capital expenditures at a higher cost or we may be unable to raise as much funding as we need to support new or ongoing business activities. This could cause us to reduce non-safety related capital expenditures and could increase our cost of servicing debt, both of which could significantly reduce our short-term and long-term profitability.
Other factors can affect the availability and cost of credit for our businesses, as well as the terms of equity and debt financing, including:
•adverse changes to laws and regulations in the states in which we operate;
•the overall health of the energy industry;
•volatility in natural gas prices;
•changes in tax law;
•credit ratings downgrades; and
•general economic and financial market conditions.
We are dependent on continued access to the credit and capital markets to execute our business strategy.
Our long-term debt is currently rated as “investment grade” by the Rating Agencies.both of our rating agencies. We rely upon access to both the short-term and long-term credit and capital markets to satisfy our liquidity requirements. If adverse credit conditions or a downgrade in our ratings outlook were to cause a significant limitation on our access to the private credit and public capital markets, we could see a reduction in our liquidity. A significant reduction in our liquidity could in turn trigger a negative change in our ratings outlook or even a reduction in our credit ratings by one or moreboth of the creditour rating agencies. Such a downgrade could further limit our access to private credit and/or public capital markets and increase our costs of borrowing. Additionally, the inability to access adequate capital or an increase in the cost of capital may require us to conserve cash, prevent or delay us from making capital expenditures, and require us to reduce or eliminate our dividend or other discretionary uses of cash.
While we believe we can meet our capital requirements from our operations and the sources of financing available to us, we can provide no assurance that we will continue to be able to do so in the future, especially if the market price of natural gas increases significantly or there are regulatory constraints on our ability to recover gas or financing costs. The future effects on our business, liquidity and financial results of a deterioration of current conditions in the credit and capital markets could be material and adverse to us, both in the ways described above or in other ways that we do not currently anticipate.
RISKS RELATING TO OUR COMMON STOCK
Provisions in our certificate of incorporation, our bylaws and Oklahoma law as well as regulatory approvals may prevent or delay an acquisition of our Company, which could decrease the trading price of our common stock.
Our certificate of incorporation, bylaws and Oklahoma law contain provisions that are intended to deter coercive takeover practices and inadequate takeover bids by making such practices or bids unacceptably expensive to the raider and to encourage prospective acquirers to negotiate with our Board of Directors rather than to attempt a hostile takeover. These provisions include, among others:
•rules regarding how shareholders may present proposals or nominate directors for election at shareholder meetings; and
•the right of our Board of Directors to issue preferred stock without shareholder approval.
Oklahoma law also imposes some restrictions on mergers and other business combinations between us and any holder of 15 percent or more of our outstanding common stock.
We believe these provisions protect our shareholders from coercive or otherwise potentially unfair takeover tactics by requiring potential acquirers to negotiate with our Board of Directors and by providing our Board of Directors with more time to assess
any acquisition proposal. These provisions are not intendedOur financing arrangements subject us to makevarious restrictions that could limit our Company immune from takeovers. However, these provisions apply even if the offer may be considered beneficial by some shareholders and could delay or prevent an acquisition that our Board of Directors determines is not in the best interests of our Company and our shareholders.
Additionally, any acquisition of our Company would need to be approved by certain regulatory bodies including the OCC, KCC and various regulators in Texas, which could delay or prevent an acquisition.
Our ability to pay dividends on our common stock will depend on our ability to generate sufficient positiveoperating flexibility, earnings, and cash flows.
OurThe indentures governing our Senior Notes and our ONE Gas Credit Agreement contain customary covenants that restrict our ability to pay dividends in the future will depend upon, among other things,create or permit certain liens, to consolidate or merge, or to convey, transfer or lease substantially all of our future earnings, cash flowsproperties and assets. Events beyond our control could impair our ability to satisfy these requirements. As long as our indebtedness remains outstanding, these restrictive covenants if any, under future credit agreements to which we may be a party. Our cash available for dividends will principally be generated fromcould impair our operations. Because the cash we generate from operations will fluctuate from quarter to quarter, we may not be able to maintain future dividends at the levels we expect or at all. Our ability to pay dividends depends primarily on cash flows, including cash flows from changes in working capital, and not solely on profitability, which is affected by noncash items. As a result, we may pay dividends during periods when we record net losses and may be unable to pay cash dividends during periods when we record net income.expand or pursue our growth strategy.
GENERAL RISK FACTORS
Federal, stateIn addition, the breach of any covenants or any payment obligations in any of these debt agreements will result in an event of default under the applicable debt instrument. If an event of default were to occur, the holders of the defaulted debt may have the ability to cause all amounts outstanding with respect to that debt to be due and local jurisdictions may challengepayable, subject to applicable grace periods. This could trigger cross-defaults under our tax return positions.
The preparationother debt agreements, including our Senior Notes. Forced repayment of some or all of our federal and state tax return filings requires significant judgments, use of estimates and the interpretation and application of complex tax laws. Significant judgment also is required in assessing the timing and amounts of deductible and taxable items, and in determining the amount of any reserves for potentialindebtedness could require us to incur new debt at a higher cost, which would have an adverse outcomes regarding tax positions that have been taken that may be subject to challenge by taxing authorities. Despite management’s expectation thatimpact on our tax return positions will be fully supportable, certain positions may be challenged successfully by federal, state and local jurisdictions, which could adversely impact ourfinancial condition, results of operations and cash flows and financial condition.flows.
We may pursue acquisitions, divestitures, and other strategic opportunities which, if not successful, may adversely impact our results of operations, cash flows and financial condition.
As part of our strategic objectives, we may pursue acquisitions to complement or expand our business, as well as divestitures and other strategic opportunities. We may not be able to successfully negotiate, finance or receive regulatory approval for future acquisitions or integrate the acquired businesses with our existing business and services. These efforts may also distract our management and employees from day-to-day operations and require substantial commitments of time and resources. Future acquisitions could result in potentially dilutive issuances of equity securities, a decrease in our liquidity as a result of our using a significant portion of our available cash or borrowing capacity to finance the acquisition, the incurrence of debt, contingent liabilities and amortization expenses and substantial goodwill. The effects of these strategic decisions may have long-term implications that are not likely to be known to us in the short-term. Changing political climates and public attitudes may adversely affect the ongoing acceptability of strategic decisions that have been made (and, in some cases, previously approved by regulators) to the detriment of the Company. We may be materially and adversely affected if we are unable to successfully integrate businesses that we acquire.
Changes in accounting standards may adversely impact our financial condition, results of operations and cash flows.
We are subject to additional changes in GAAP, SEC regulations and other interpretations of financial reporting requirements for public utilities. We neither have control over the impact these changes may have on our financial condition or results of operations nor the timing of such changes.
ITEM 1B. UNRESOLVED STAFF COMMENTS
None.
ITEM 1C. CYBERSECURITY
We commit significant resources to protecting and continuing to improve the security of our computer systems, software, networks, and other information or operations technology assets. Our cybersecurity efforts are designed to preserve the confidentiality, integrity, and continued availability of all information owned by, or in the care of, the Company and protect against, among other things, cybersecurity attacks by unauthorized parties attempting to obtain access to confidential information, destroy data, disrupt or degrade service, sabotage systems, or otherwise cause damage.
Governance
Our Board of Directors considers cybersecurity risk one of the significant risks to our business. As such, the Board of Directors has retained responsibility for overseeing policies and procedures related to cybersecurity and data privacy matters. The Board of Directors routinely evaluates our cybersecurity strategy to review its effectiveness. Management provides reports to the Board of Directors at least quarterly regarding cybersecurity and other information and operations technology risks.
The Company established a governance committee to provide governance and oversight of security and compliance related activities for security and IT in support of their effective and efficient management of risks, strategies, and operational imperatives for the Company. The committee is chaired by our Chief Information Officer and the membership includes a cross-functional team of executives from IT/cybersecurity, operations, customer service, commercial, risk and insurance, finance, and the legal department. The committee is structured to cultivate collaboration across the enterprise and to align and prioritize resources with our strategic plan.
Risk Management and Strategy
The cybersecurity function is centralized under the Senior Vice President and Chief Information Officer, who has over three decades of experience in information technology. The cybersecurity function is comprised of a dedicated team of professionals who work continuously to monitor risks relating to cybersecurity resilience strategy, policy, standards, architecture, and
processes. We identify and address cybersecurity risks by employing a defense-in-depth methodology, consisting of both proactive and reactive elements. This requires a comprehensive program involving advanced monitoring and defense technology along with recurring situational drills that exercise incident response and crisis management plans. We leverage dedicated internal resources, along with strategic external partnerships, to mitigate cybersecurity threats to the Company. In the event a cybersecurity incident occurs, we maintain cybersecurity insurance to provide appropriate resources for both financial and cyber expertise. We have partnerships for penetration testing, incident response, and various third-party assessments. We deploy both commercially available solutions and proprietary systems to actively manage threats to our technology environment.
Oversight
Our cybersecurity oversight includes our internal control environment, cybersecurity standards, benchmarks, and internal governance committees. Annually, we assess, either internally or by an independent third-party, against multiple cybersecurity maturity models. We also leverage other industry standards and benchmarks, such as National Institute of Standards and Technology (NIST) standards, and Cybersecurity and Infrastructure Security Agency (CISA) best practices to inform our oversight strategy. The governance committee functions to ensure adherence and accountability to these standards and deploy appropriate resources to keep pace with the shifting cybersecurity threat landscape.
We have policies and procedures to oversee and manage the cybersecurity risks associated with both internal or external threats including the regular review of security reports, relevant cyber attestations, and other independent cyber ratings. These practices include technical controls and processes, as well as contractual mechanisms to mitigate risk. Additionally, we utilize cyber ratings, prepared by reputable external agencies which provide an independent ranking of our cybersecurity maturity and coverage, to assess our cyber proficiency on a standalone basis and comparatively against peers and other companies reviewed annually by the Board of Directors. We have also implemented certain third-party risk management processes to vet, select, and monitor suppliers.
Furthermore, we have established an organizational unit within the legal and compliance department that provides independent compliance testing and review for our regulatory obligations, industry standards, and policies and procedures. It supports the IT and cybersecurity department by conducting formal assessments of compliance measures, consulting on control development and enhancement, and facilitating third-party assessments.
Response
In addition to the safeguards in place to minimize the likelihood and impact of a cyber incident, the Company has established response procedures to address in the event they may occur. These response procedures are designed to identify, analyze, contain, and remediate such cyber incidents in a timely, consistent, and compliant manner. Annually, the Company completes incident response, disaster response, and crisis management plan exercises to validate our current readiness. These exercises are intended to test our cybersecurity response plans and resources through simulated cybersecurity incidents, and may include engagement of outside cybersecurity legal counsel, other third-party partners, executive management, and our Board of Directors.
Education
The Company seeks to ensure every employee understands their role in keeping ONE Gas safe from cyber incidents. As part of this commitment, we require our employees to complete recurring cybersecurity awareness training that provides immediate feedback and, if necessary, additional training or remedial action to employees.
Experience
We have experienced no material cybersecurity breaches. As such, we have not spent any material amount of capital on addressing impacts during this time, nor have we incurred any material breach expenses from penalties and settlements. We maintain cybersecurity insurance coverage that we believe is appropriate for the size and complexity of our business.
ITEM 2. PROPERTIES
The following table sets forth the approximate miles of distribution mains and transmission pipelinepipelines we own as of December 31, 2020:2023:
| | Properties (miles) | Properties (miles) | OK | KS | TX | Total | Properties (miles) | OK | KS | TX | Total |
| Distribution | Distribution | 19,000 | | 11,600 | | 10,600 | | 41,200 | |
| Transmission | Transmission | 700 | | 1,500 | | 300 | | 2,500 | |
| Total properties | Total properties | 19,700 | | 13,100 | | 10,900 | | 43,700 | |
We lease approximately 400300 thousand square feet of office space and other facilities for our operations. In addition, we have 48.358.1 Bcf of natural gas storage capacity under contract, with maximum allowable daily withdrawal capacity of approximately 1.31.7 Bcf.
ITEM 3. LEGAL PROCEEDINGS
See Note 1715 of the Notes to Consolidated Financial Statements in this Annual Report for information regarding legal proceedings.
ITEM 4. MINE SAFETY DISCLOSURES
Not applicable.
PART IIII.
ITEM 5. MARKET FOR REGISTRANT’S COMMON EQUITY, RELATED STOCKHOLDER MATTERS AND ISSUER PURCHASES OF EQUITY SECURITIES
MARKET HOLDERS AND DIVIDENDS
Our common stock is listed on the NYSE under the trading symbol “OGS.”
At February 22, 2021,16, 2024, there were 10,6018,969 registered shareholders of our common stock.
In January 2021,2024, we declared a dividend of $0.58$0.66 per share ($2.322.64 per share on an annualized basis) for shareholders of record as ofon February 19, 2021,23, 2024, payable on March 5, 2021.8, 2024.
Performance Graph
The following performance graph compares the performance of our common stock with the S&P MidCap 400 Utilities Index, the S&P MidCap 400 Index, the Dow Jones Industrial Average and a ONE Gas peer group during the period beginning December 31, 20152018 and ending on December 31, 2020.2023. This graph assumes a $100 investment in our common stock and in each of the indices at the beginning of the period and a reinvestment of dividends paid on such investments throughout the period.
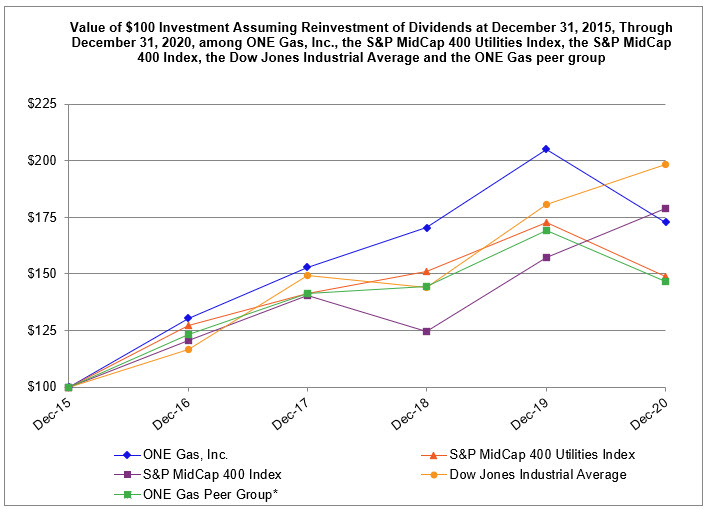
| | | | | | | | | | | | | | | | | |
| Cumulative Total Return
As of Each Year Ending |
|
| December 31, |
| 2016 | 2017 | 2018 | 2019 | 2020 |
| ONE Gas, Inc. | $ | 130.46 | | $ | 153.03 | | $ | 170.47 | | $ | 205.04 | | $ | 172.79 | |
| S&P MidCap 400 Utilities Index | $ | 127.35 | | $ | 141.47 | | $ | 151.11 | | $ | 172.76 | | $ | 148.81 | |
| S&P MidCap 400 Index | $ | 120.74 | | $ | 140.35 | | $ | 124.80 | | $ | 157.49 | | $ | 179.00 | |
| Dow Jones Industrial Average | $ | 116.50 | | $ | 149.24 | | $ | 144.05 | | $ | 180.56 | | $ | 198.11 | |
ONE Gas Peer Group* | $ | 123.38 | | $ | 141.21 | | $ | 144.43 | | $ | 169.20 | | $ | 146.47 | |
| * The ONE Gas peer group used in this graph is the same peer group that will be used in determining our level of performance under our 2020 performance units at the end of the three-year performance period and is comprised of the following companies: Alliant Energy Corporation; Atmos Energy Corporation; Avista Corporation; CenterPoint Energy, Inc.; Chesapeake Utilities Corporation; CMS Energy Corporation; New Jersey Resources Corporation; NiSource Inc.; Northwest Natural Holding Company; NorthWestern Corporation; South Jersey Industries Inc.; Southwest Gas Holdings, Inc.; and Spire Inc. |

| | | | | | | | | | | | | | | | | |
| Cumulative Total Return
As of Each Year Ended |
|
| December 31, |
| 2019 | 2020 | 2021 | 2022 | 2023 |
| ONE Gas, Inc. | $ | 120.28 | | $ | 101.36 | | $ | 105.78 | | $ | 106.40 | | $ | 92.79 | |
| S&P MidCap 400 Utilities Index | $ | 114.33 | | $ | 98.47 | | $ | 117.92 | | $ | 117.74 | | $ | 102.19 | |
| S&P MidCap 400 Index | $ | 126.17 | | $ | 143.39 | | $ | 178.85 | | $ | 155.42 | | $ | 180.90 | |
| Dow Jones Industrial Average | $ | 125.34 | | $ | 137.53 | | $ | 166.34 | | $ | 154.92 | | $ | 180.00 | |
ONE Gas Peer Group* | $ | 118.15 | | $ | 104.83 | | $ | 123.73 | | $ | 127.65 | | $ | 123.31 | |
| * The ONE Gas peer group used in this graph is the same peer group that will be used in determining our level of performance under our 2023 performance units at the end of the three-year performance period and is comprised of the following companies: Alliant Energy Corporation; Atmos Energy Corporation; Avista Corporation; Black Hills Corporation; CenterPoint Energy, Inc.; Chesapeake Utilities Corporation; CMS Energy Corporation; New Jersey Resources Corporation; NiSource Inc.; Northwest Natural Holding Company; NorthWestern Energy Group, Inc.; Southwest Gas Holdings, Inc.; and Spire Inc. |
ITEM 6. SELECTED FINANCIAL DATA
Not applicable.
ITEM 6. [RESERVED]
ITEM 7. MANAGEMENT’S DISCUSSION AND ANALYSIS OF FINANCIAL CONDITION AND RESULTS OF OPERATIONS
The following discussion and analysis should be read in conjunction with our audited consolidated financial statements and the Notes to Consolidated Financial Statements in this Annual Report.
EXECUTIVE SUMMARY
We are a 100-percent regulated natural gas distribution company. As such, our regulators determine the rates we are allowed to charge for our service based on the revenue requirements needed to achieve our authorized rates of return. We earn revenues from the delivery of natural gas, but do not earn a profit on the natural gas that we deliver, as those costs are passed through to our customers at cost. The primary components of our revenue requirements are the amount of capital invested in our business, which is also known as rate base, our allowed rate of return on our capital investments and our recoverable operating expenses, including depreciation, interest expense and income taxes. Our rates have both a fixed and a variable component, with approximately 72 percent of our natural gas sales net margin in 2020 derived from fixed monthly charges to our sales customers. The variable component of our rates is dependent on the consumption of natural gas, which is impacted primarily by the weather and, to a lesser extent, economic activity. While we have WNA mechanisms that adjust sales customers’ bills when actual HDDs differ from normalized HDDs, these mechanisms are in place for only a portion of the year, except in Kansas, and do not offset all fluctuations in usage resulting from weather variability. Accordingly, the weather can have either a positive or negative impact on our financial performance.
Our financial performance therefore, is contingent on a number of factors, including: (1) our regulatory construct, and outcomes, which determineincluding the rates we are allowed to charge for our service, and the authorized rates of return on our investments in rate base; (2) the consumption of natural gas, which impacts the amount of our net marginnatural gas sales derived from the variable component of our rates; (3) customer growth; (4) our operating performance, which impacts our operating expenses;performance; and (5) the perceived value of natural gas relative to other energy sources, particularly electricity, which influences our customers’ choice of natural gas to provide a portion of their energy needs.
We are subject to regulatory requirements for pipeline integrity, pipeline and cyber security, and environmental compliance. These requirements impact our operating expenses and the level of capital expenditures required for compliance. Historically, our regulators have allowed recovery of these expenditures. However, because integrity and environmental regulation isregulations are frequently changing, constantly, our capital and operating expenditures to comply are changing as well. Although we believe our regulators will continue to allow recovery of such expenditures in the future, we will continue to make these expenditures with no assurance about if, or over what period, we will be permitted to recover them.
RECENT DEVELOPMENTS
2021 February Winter Weather EventSecuritization transactions - A historic winter weather event in February 2021 impacted supply, market pricingIn March 2023, the TNG Corporation completed the issuance of the Customer Rate Relief (Winter Storm Uri), Taxable Series 2023 Bonds. On March 23, 2023, we received our portion of the net proceeds, which was approximately $197 million. The proceeds were used to repay debt and demand for natural gas in a number of states, including our service territories of Kansas, Oklahoma, and Texas. During this time, the governors of Kansas, Oklahoma, and Texas, each declared a state of emergency, and certain regulatory agencies issued emergency orders that impacted the utility and natural gas industries, including statewide utilities curtailment programs and orders requiring jurisdictional natural gas and electric utilities to do all things possible and necessary to ensure that natural gas and electricity utility services continue to be provided to their customers. Due to the historic nature of this winter weather event, we experienced unforeseeable and unprecedented market pricing for gas costs in our Kansas, Oklahoma, and Texas jurisdictions, which resulted in aggregated natural gas purchases for the month of February of approximately $2.2 billion. These purchases are generally payable at the end of March 2021.general corporate purposes.
On February 22, 2021, we entered intoIn November 2022, KGSS-I issued $336 million of 5.486 percent Securitized Utility Tariff Bonds. KGSS-I used the ONEproceeds from the issuance to purchase the Securitized Utility Tariff Property from Kansas Gas 2021 Term Loan Facility to enhance our liquidity position as partService, pay for debt issuance costs, and reimburse Kansas Gas Service for upfront securitization costs paid by Kansas Gas Service on behalf of the financing of our natural gas purchases in order to provide sufficient liquidity to satisfy our obligations as a result of the 2021 winter weather event and the repayment of indebtedness.KGSS-I.
Our purchased gas costs are recoverable through our tariffs in each state where we operate. Due toIn August 2022, Oklahoma Natural Gas received proceeds of approximately $1.3 billion, which represents the higher levelamount of the securitization bonds issued by the ODFA, less issuance costs. The receipt of these proceeds represents Oklahoma Natural Gas’ recovery of approximately $1.3 billion of authorized extraordinary natural gas purchase costs and other operational costs incurred during the 2021 winter event, we are working with regulators to extend the recovery periods of such costs in order to lessen the immediate customer impact. In that regard, the Kansas Corporation Commission and the Railroad Commission of Texas each authorized certain utilities, including local natural gas distribution companies, to record a regulatoryWinter Storm Uri, as well as carrying costs.
assetLong-Term Debt transactions - In December 2023, we issued $300 million of 5.10 percent senior notes due April 2029. The proceeds from the issuance were used to accountrepay amounts outstanding under our commercial paper program and for the extraordinary costs associated with this winter weather event, including but not limited to gas purchase costs and other costs related to the procurement and transportation of gas supply. We have also filed a motion with the Oklahoma Corporation Commission to seek comparable authority in Oklahoma to record a regulatory asset to account for the extraordinary costs, including carrying costs, associated with this winter weather event. An administrative law judge has recommended approval of our motion by the Oklahoma Corporation Commission.general corporate purposes.
In August 2022, we issued $300 million of 4.25 percent senior notes due September 2032. The proceeds from the issuance were used to repay amounts outstanding under our commercial paper program and for general corporate purposes.
In August 2022, we called $750 million of the $1.0 billion of 0.85 percent senior notes due March 2023, $150 million of the $700 million of 1.10 percent senior notes due March 2024 and the remaining $400 million of outstanding floating-rate senior notes due March 2023, using the proceeds received from the securitization transaction for Oklahoma Natural Gas. In November 2022, we called the remaining $250 million of the $1.0 billion of 0.85 percent senior notes due March 2023 and $77 million of the $700 million of 1.10 percent senior notes due March 2024, using the proceeds from the securitization transaction for Kansas Gas Service.
See “Regulatory Activities”, “Liquidity”, Note 2Activities,” “Liquidity and Capital Resources,” and Notes 1 and 3 of the Notes to the Consolidated Financial Statements and Item 1A, “Risk Factors” in this Annual Report for additional discussion of the effects of this winter weather event on us.securitization transactions.
COVID-19Equity issuances - Throughout the COVID-19 pandemic,On December 28, 2023, we have continuedsettled under forward contracts 1,032,403 shares (289,403 from forwards related to provide essential servicesan at-the-market equity distribution agreement and 743,000 from forwards related to our customers. We have implemented a comprehensive set of policies, procedures and guidelines to protect the safetyunderwriting agreements) of our employees, customers and communities. The following summarizes actions we have taken and the impact on our operations:common stock for net proceeds of $79.0 million, or $76.52 per share.
In December 2023, we amended the forward sale agreement we entered into in March 2023 to extend the maturity date of 657,000 shares to December 31, 2024 from December 29, 2023. The amended forward sale agreement provides for settlement on a date, or dates, to be specified at our discretion, but which will occur no later than December 31, 2024, for 1,257,000 shares of common stock.
| | | | | |
WorkforceIn September 2023, we entered into an underwriting agreement and two forward sale agreements for 1.2 million and 180,000 shares of our common stock, respectively. The forward sale agreements provide for settlement on a date, or dates, to be specified at our discretion, but which will occur no later than December 31, 2024.
In June 2023, we executed forward sale agreements under our current at-the-market equity program for 926,465 shares of our common stock.
In March 2023, we entered into an underwriting agreement and a forward sale agreement for 2.0 million shares of our common stock. The forward sale agreement provided for settlement on a date, or dates, to be specified at our discretion, but which will occur no later than December 29, 2023, for 1.4 million shares of common stock and by December 31, 2024, for the remaining balance.
In February 2023, we entered into an at-the-market equity distribution agreement under which we may issue and sell shares of our common stock with an aggregate offering price up to $300 million. This at-the-market equity program replaced our previous at-the-market equity program, which began in February 2020, and expired in February 2023. Sales of common stock are made by means of ordinary brokers’ transactions on the NYSE, in block transactions or as otherwise agreed to between us and the sales agent. We are under no obligation to offer and sell common stock under the program. At December 31, 2023, we had $225.5 million of equity available for issuance under the program.
ONE Gas Credit Agreement - In October 2023, we entered into an agreement that increased the capacity of the ONE Gas Credit Agreement to $1.2 billion from $1.0 billion.
In March 2023, we entered into an extension agreement related to the ONE Gas Credit Agreement that extended the maturity date to March 16, 2028, from March 16, 2027.
Other than the increased commitments and term extension, all other terms and conditions of the ONE Gas Credit Agreement remain in full force and effect.
Commercial paper program - In November 2023, we increased the capacity of our commercial paper program to $1.2 billion from $1.0 billion. Other than the increased capacity, all other terms and conditions of the commercial paper program remain in full force and effect.
| Following the guidance of the CDC, OSHA and third-party subject matter experts we have engaged, we have established a number of protocols to protect our employees. For all employees, we are encouraging social distancing and proper hygiene, and are requiring the use of masks in our facilities. Employees who may be exhibiting symptoms or who may have been exposed to COVID-19 are required to contact a third-party medical consultant engaged by the Company who follows protocols specifically developed for COVID-19 to determine whether the employee should seek medical attention, self-isolate or can safely return to work.
Our business continuity planning and investments in IT enabled an orderly transition to remote work for approximately 50 percent of our employees. For those employees who continue to report to our offices and service centers, the reduced number of employees working in these locations provides space for social distancing. We have implemented health screenings at all of our employee work locations, which include a self-assessment health screening application using mobile devices and automated thermal temperature checks at our larger facilities. We routinely disinfect employee work locations, placing emphasis on high-touch surfaces in common areas. For employees who continue to interact with customers, we are providing additional PPE in accordance with CDC and OSHA guidelines.
In addition, we have implemented a Paid Pandemic Leave Policy, increased medical benefits for COVID-19 testing and vaccination and are reminding employees of our benefit plans and programs for their financial, physical and mental health and well-being. |
Customers | For customers requesting service orders, we have implemented protocols to determine whether someone in the home has been exposed to COVID-19. Employees entering customers’ homes are provided appropriate PPE in accordance with CDC and OSHA guidelines to protect themselves and our customers. Customers are also asked to provide for social distancing while our employees are in the customer’s home.
As ordered by our regulators, customer disconnects for nonpayment were suspended from mid-March through May 20, 2020, in Oklahoma, through May 31, 2020, in Kansas, and through December 31, 2020, in some areas of Texas. As of December 31, 2020, we have temporarily suspended disconnects for safety reasons across all of our jurisdictions due to the level of COVID-19 infection. Customers who are finding it difficult to pay their bills are being encouraged to contact us so we can work with them to establish alternative payment arrangements and advise them of public-assistance programs that may be available. |
Operations | Although we have experienced employee absences due to our protocols for self-isolation of employees who may be exhibiting symptoms or who may have been exposed to or contracted the COVID-19 virus, we have continued, and expect to continue, to execute our work in the field, including our capital work for system integrity, pipeline replacements and extending service to new customers. Our work going forward could be impacted if we do not have access to the PPE needed to keep our employees and customers safe or experience a significant increase in employee and contractor absences. |
| | | | | |
Supply Chain | We are actively managing the materials, supplies and contract services necessary for our operations. We utilize a diverse group of suppliers and contractors and are in frequent contact with our vendors to understand their ability to continue to provide the materials, supplies and services we require. To date, we have not experienced significant disruption to our supply chain and have no indication of significant disruptions in the future. Our suppliers and contractors could be impacted if they, or the businesses they rely on, experience a significant increase in employee absences.
Our natural gas supply portfolio consists of contracts with varying terms from a diverse group of suppliers. We acquire our natural gas supply from natural gas processors, marketers and producers from multiple production areas and lease capacity from third-party natural gas storage providers. This strategy is designed to mitigate the impact on our supply from physical interruption, financial difficulties of a single supplier, natural disasters and other unforeseen force majeure events, as well as to ensure these resources are reliable and flexible to meet the variations of customer demands.
To date, we have not experienced disruption to our natural gas supply and we do not anticipate significant disruption in the future. |
Regulatory | We are in regular communication with our regulators to keep them apprised of the effects COVID-19 is having on the service we provide. We have received accounting orders in each of our jurisdictions authorizing us to accumulate and defer for regulatory purposes certain incremental costs incurred, including bad debt expenses, and certain lost revenues, net of offsetting expense reductions, associated with COVID-19. |
Liquidity | In April 2020, we entered into the ONE Gas 364-day Credit Agreement in the amount of $250 million, which provides us an additional source of liquidity.
At December 31, 2020, we had short-term liquidity available through our commercial paper program, credit facilities and cash on hand totaling $538.6 million.
In April 2020, we issued $300 million of 2.00 percent senior notes due 2030. The proceeds from the issuance were used to reduce the amount of our outstanding commercial paper and for general corporate purposes.
We believe our investment-grade credit ratings and strong balance sheet will enable us to access sources of liquidity that are adequate to support our current and planned level of operations. |
During the year ended December 31, 2020, impacts on our results of operations as a result of COVID-19 include but are not limited to:
•lower late payment, reconnect and collection fees and incremental expenses for bad debts related to the suspension of disconnects for nonpayment in each of our rate jurisdictions;
•incremental expenses for PPE, cleaning supplies, outside services and other expenses; and
•lower expenses for travel and employee training that have been restricted due to the pandemic.
Going forward, we expect continuing impacts on our revenues and expenses during the course of the pandemic. We also could experience a possible reduction in revenues from commercial and transportation customers temporarily or permanently impacted by the pandemic. We have received accounting orders in each of our jurisdictions authorizing us to accumulate and defer for regulatory purposes certain incremental costs incurred, including bad debt expenses, and certain lost revenues, net of offsetting expense reductions associated with COVID-19. Pursuant to these orders, the recovery of any net incremental costs and lost revenue will be determined in future rate cases or alternative rate recovery filings in each jurisdiction. For financial reporting purposes, any amounts deferred as a regulatory asset for future recovery under these accounting orders must be probable of recovery. At December 31, 2020, no regulatory assets have been recorded. We continue to evaluate the impacts of COVID-19 on our business and will record regulatory assets for financial reporting purposes at such time as recovery is deemed probable. Accordingly, there could be a delay in the recognition of amounts that may be approved for recovery until the conclusion of future regulatory proceedings.
See “Regulatory Activities,” “Financial Results and Operating Information,” “Capital Expenditures and Asset Removal Costs,” Note 11 and Note 17 of the Notes to Consolidated Financial Statements and Item 1A, “Risk Factors” in this Annual Report for additional discussion of the effects of COVID-19 on us.
At-the-Market Equity Program - In February 2020, we initiated a $250 million at-the-market equity program. Proceeds from the program are available for general corporate purposes, which may include repaying or refinancing a portion of our outstanding indebtedness and funding working capital and capital expenditures. See “Liquidity and Capital Resources” in this Annual Report for additional discussion.
Dividend - In January 2021,2024, we declared a dividend of $0.58$0.66 per share ($2.322.64 per share on an annualized basis) for shareholders of record as of February 19, 2021,23, 2024, payable on March 5, 2021.8, 2024.
REGULATORY ACTIVITIES
Oklahoma - On February 12, 2021, the governor of Oklahoma declared a state of emergency for all 77 counties in the state of Oklahoma in light of expected severe weather and freezing temperatures associated with a winter weather event. The declaration cited anticipated damage to private and public properties and utilities, including electric, gas, and water systems, within the state of Oklahoma.
On February 16, 2021, the Oklahoma Corporation Commission approved an Emergency Order (the “OCC Order”) (i) directing natural gas and electric utilities to prioritize deliveries of natural gas and electricity for services necessary for life, health, and public safety, and natural gas to electric generation facilities that serve human needs customers, and (ii) directing local utilities to communicate with their customers in order to reduce all non-essential energy consumption, and to reduce load in a safe and reasonable manner. The OCC Order recognized that the severe weather conditions resulted in increased commodity prices for both gas and electric utilities, along with issues relating to commodity acquisition, line pressure, and supply shortages. The OCC Order expired on February 20, 2021.
In order to reduce the impact on customers, on February 19, 2021, Oklahoma Natural Gas filed a motion with the Oklahoma Corporation Commission to seek the authority to record a regulatory asset to account for the extraordinary costs, including costs associated with gas purchases, other operational costs and carrying costs, associated with this winter weather event. These costs will be subject to a review for reasonableness and accuracy in future regulatory proceedings. On February 25, 2021, an administrative law judge recommended for approvalAs required by the OCC an interim order granting a motion to establish a regulatory asset. The order states that Oklahoma Natural Gas shall defer to a regulatory asset the extraordinary costs associated with this unprecedented winter weather event, including commodity costs incorporating escalated spot and daily index prices, operational costs and carrying costs. The order identifies that decisions related to the recovery of the deferred costs will be addressed at a later date. The recommendation from the administrative law judge will next be considered by the OCC.
In June 2020, the OCC issued an order permitting the creation of regulatory assets and deferrals related to COVID-19. Each utility is authorized under the OCC’s order to record as a regulatory asset increased bad debt expenses, costs associated with expanded payment plans, waived fees, and incremental expenses that are directly related to the suspension of or delay in disconnection of service (or the reconnection of service) beginning March 15, 2020, as a result of the governor’s executive order declaring a state of emergency. In addition, the OCC recognizes that utilities report taking many steps to ensure the continuity of utility service, while protecting utility personnel, customers, and the general public. Such steps include procuring additional PPE, increasing sanitation efforts at facilities, implementing health-screening processes, and securing temporary facilities for potential sequestration of critical operations personnel. The OCC has stated it supports the continuation of these critical response and planning efforts and acknowledges such efforts cause incremental costs that it will allow to be deferred and reviewed in a future rate case. The OCC’s deferral authorization does not bind the OCC to any specific treatment of these items in any future proceeding, nor does it prohibit the OCC from considering the effect of any operational savings, or other financial impacts that may occur as a result of COVID-19. The recovery of the regulatory assets and deferrals will be addressed in the next rate case that is required to be filed on or before June 30, 2021.
In February 2020, Oklahoma Natural Gas filed its fourth annual PBRC application following the general rate case that was approved in January 2016. A settlement was reached, and the OCC approved a joint stipulation in July 2020. This stipulation includes a base rate increase of $9.7 million and an energy efficiency incentive of $2.2 million, with new rates reflecting these changes effective in June 2020. This stipulation also includes a credit of $12.2 million associated with EDIT to be issued through a bill credit to Oklahoma customers in the first quarter 2021.
In March 2019, Oklahoma Natural Gas filed its third annual PBRC application following the general rate case that was approved in January 2016. This filing was made in compliance with the January 2019 OCC order settling tax issues resulting
from the Tax Cuts and Jobs Act of 2017. A settlement was reached, and the OCC approved a joint stipulation in August 2019. This stipulation includes a PBRC credit of $15.6 million to be spread over a 12-month period through a bill credit to Oklahoma customers beginning in the third quarter 2019 and a credit of $12.7 million associated with EDIT.
In March 2018, Oklahoma Natural Gas filed its second annual PBRC application following the general rate case that was approved in January 2016. This filing was based on a calendar test year of 2017 and addressed the tax issues resulting from the Tax Cuts and Jobs Act of 2017. In January 2019, the OCC issued an order requiring Oklahoma Natural Gas to lower base rates by $11.3 million beginning February 2019 to reflect the lower federal corporate income tax rate and the authorized ROE of 9.5 percent prospectively and to credit customers for EDIT based upon amortization periods in compliance with the tax normalization rules for the portions of EDIT stipulated by the Code and ten years for all other components. This order also required the March 15, 2019, PBRC filing to include the return of all earnings above 9.5 percent occurring in the 2018 test year.
As required,our tariff, PBRC filings are made annually on or before March 15 until the next general rate case, which is currently required to be filed on or before June 30, 2021, based2027. In March 2023, Oklahoma Natural Gas filed its required PBRC application for the year ended December 2022. The filed request included a $27.6 million base rate revenue increase, $2.5 million energy efficiency incentive, and $11.9 million of estimated EDIT to be credited to customers in 2024. On June 13, 2023, a settlement in the case was filed with a proposed revenue increase of $26.3 million, a $2.5 million energy efficiency incentive, and a $12.6 million EDIT credit. Pursuant to its tariff, Oklahoma Natural Gas placed new rates into effect on a calendar 2020 test year.June 29, 2023. In July 2023, the OCC issued an order approving the settlement.
In December 2022, Oklahoma Natural Gas filed a request for an RNG Pilot Program and Voluntary Tariff pursuant to the requirement in the rate case order approved in 2021. The tariff will allow all residential, small commercial and industrial sales customers to voluntarily purchase the environmental attributes of RNG up to the equivalent of 10 Dth per month. In September 2023, responsive testimony was filed by the Public Utility Division of the OCC and the Attorney General’s office supporting Oklahoma Natural Gas’ request. On October 6, 2023, a unanimous settlement recommending approval of the tariff was filed. On October 19, 2023, a hearing before an administrative law judge was held. At the conclusion of the hearing, the administrative law judge recommended approval of the tariff. On November 21, 2023 the OCC issued an order approving the RNG Pilot Program and Voluntary tariff and customer enrollment began on December 1, 2023. Approximately $2.4 million of RNG credits were purchased in December to support the program. Assessment of the tariff and pilot program will be made in the rate case required to be filed on or before June 30, 2027.
Kansas - On February 14, 2021, the governor of Kansas issued a State of Disaster Emergency due to wind chill warnings and stress on utility and natural gas providers caused by the significantly colder than normal weather from a winter weather event. The executive order also urged Kansas citizens to conserve energy to help ensure a continued supply of natural gas and electricity and keep their own personal costs down. The declaration also noted that due to increased energy demand and natural gas supply constraints caused by sub-zero temperatures, utilities at the time were experiencing wholesale natural gas prices anywhere from 10 to 100 times higher than normal.
On February 15, 2021, the KCC issued an Emergency Order (i) directing all jurisdictional natural gas and electric utilities to coordinate efforts and take all reasonably feasible, lawful, and appropriate actions to ensure adequate delivery of natural gas and electricity to interconnected, non-jurisdictional utilities in Kansas, (ii) requiring jurisdictional natural gas and electric utilities to do all things possible and necessary to ensure that natural gas and electricity utility services continue to be provided to their customers in Kansas, and (iii) allowing those electric and natural gas distribution utilities who incur extraordinary costs to ensure their customers and other interconnected customers continue to receive utility service during this unprecedented cold weather event to defer those costs to a regulatory asset account. Once this weather event is over, each jurisdictional utility will be required to file a compliance report detailing the extent of such costs incurred and present a plan to minimize the financial impacts of this event on ratepayers over a reasonable time frame. These costs will be subject to review for reasonableness and accuracy in future regulatory proceedings. Kansas Gas Service expects to file its compliance report in the first quarter of 2021.
In August 2020,2023, Kansas Gas Service submitted an application to the KCC requesting an increase of approximately $7.8$8.0 million related to its GSRS. This filing incorporates the effect on the requested GSRS rate increase of a bill amending the Kansas income tax code that eliminates public utilities regulated by theThe KCC from paying Kansas state income taxes beginning January 1, 2021. In September 2020, Kansas Gas Service submittedissued an errata to the application which modified the requested increase to approximately $7.5 million. Inorder in November 2020, the KCC approved2023 authorizing the increase, and the new surcharge became effective on December 2020.1, 2023.
In May 2020, a bill amending the Kansas state income tax code was signed into law that exempts public utilities regulated by the KCC from paying Kansas state income taxes beginning January 1, 2021, and authorizes the KCC
Texas - Pursuant to adjust utility rates for the elimination of Kansas state income tax beginning January 1, 2021. Assecuritization legislation enacted in Texas as a result of the enactment of this legislation, we remeasured our ADIT. AsWinter Storm Uri and a regulated entity, the reduction in ADIT of $81.5 million was recorded as an EDIT regulatory liability and will be refundedJune 2021 RRC Notice to our customers. This adjustment had no material impact on our income tax expense and no impact on our cash flows for the year ended December 31, 2020. The bill stipulates that, if requested by the utility, this EDIT will be returned to Kansas customers over a period of no less than 30 years, with the exact timing to be determined in our next general rate proceeding. In August 2020, KansasGas Utilities, Texas Gas Service submitted an application to the KCC to reduce its base rates to reflectRRC in July 2021 for an order authorizing the eliminationamount of Kansas state income taxes by approximately $4.9 million. In December 2020,extraordinary costs for recovery and other such specifications necessary for the KCC approved the reduction, effective January 1, 2021. See Notes 11 and 15issuance of the Notes to Consolidated Financial Statements in this Annual Report for additional information.securitized bonds.
In April 2020, KansasFebruary 2022, the RRC issued a single financing order for Texas Gas Service filed an application withand other natural gas utilities in Texas participating in the KCC for an AAO to accumulate and defer certain incrementalsecuritization process, which included a determination that the approved costs incurred, including bad debt expenses and lost revenues, as well as associated carrying costs, related to COVID-19 beginning March 1, 2020, for recovery in Kansas Gas Service’s next rate case filing. In July 2020, the KCC approved the request for an AAO subject to the recommendations set forth in its Staff Report and Recommendation and clarifications sought by Kansas Gas Service. The AAO provides notice that Kansas Gas Service may identify, track, document, accumulate, and defer in a regulatory asset extraordinary costs (net of any cost decreases) and lost revenue, plus carrying costs, associated with the COVID-19 pandemic. The KCC states that approval of the AAO is not a finding that tracked costs and lost revenue will be included in future rates; rather, any determination regarding recoverability will occur incollected from customers over a future rate proceeding. Inperiod of not more than 30 years. The TPFA formed the TNG Corporation, a separate
order applicablenew independent public authority, to all regulated utilities,issue the KCC approved the deferral of bad debt expense and late payment fees associated with the suspension of disconnection activity and customer protection provisions. The recovery, the carrying charges and amortization period will be determined in Kansas Gas Service’s next rate case or alternative rate recovery filing.securitized bonds.
In August 2019, KansasMarch 2023, the TNG Corporation completed the issuance of the Customer Rate Relief (Winter Storm Uri), Taxable Series 2023 Bonds and we received our portion of the net proceeds, which was approximately $197 million. The proceeds were used to repay certain indebtedness and for general corporate purposes. Interest costs that exceeded the amount securitized have been deferred and will be addressed in the next general rate proceeding in each applicable jurisdiction in Texas. In October 2023, Texas Gas Service began acting as a collection agent, with responsibility for collecting the securitization charges from customers that are then submitted an application to the KCC requesting an increase of approximately $4.2 million relatedTNG Corporation to its GSRS. In November 2019,repay the KCC approved the increase effective December 2019.securitization bonds.
In November 2018, Kansas Gas
Central-Gulf Service submitted an application to the KCC requesting approval of its contract to own, operate and maintain the natural gas distribution system at Fort Riley, a United States Army installation, for approximately $5.8 million. The KCC approved the Company’s application in May 2019 and Kansas Gas Service and Fort Riley began preparing for the transition. In response to the COVID-19 pandemic, Kansas Gas Service entered into an agreement dated April 1, 2020, with the U.S. government to stay the transition period and contract performance until concerns surrounding the COVID-19 pandemic are resolved. The 10-month transition period work officially started in June 2020, with the understanding that there may be excusable delays in the future because of new state of Kansas requirements related to COVID-19 or changes in Fort Riley’s health protection conditions. The duration of the stay and any future excusable delays will impact the timing of the asset acquisition.
Area
In June 2018, Kansas Gas Service filed a request with the KCC for an increase in base rates, reflecting investments in system improvements and changes in operating costs necessary to maintain the safety and reliability of its natural gas distribution system, as well as addressing the tax issues resulting from the Tax Cuts and Jobs Act of 2017.- In February 2019, the KCC issued an order that included a net base rate increase of $18.6 million and a GSRS pre-tax carrying charge of approximately 9.1 percent. Kansas Gas Service was already recovering $2.9 million from customers through the GSRS, therefore, this order represents a total base rate increase of $21.5 million. The increase in base rates reflects an amortization credit for the refund of EDIT over a period in compliance with the tax normalization rules for the portions stipulated by the Code and five years for all other components of EDIT. Additionally, the settlement provides for extending application of the WNA rider to small transportation customers and the implementation of a tracker for cybersecurity expenses.
In a separate order issued by the KCC, Kansas Gas Service was required to refund to customers the amount of the regulatory liability for the decrease in the federal corporate income tax rate in 2018 through the date on which Kansas Gas Service’s new rates went into effect in February 2019. The total refund of $16.6 million was issued through a bill credit to Kansas customers in the second quarter 2019.
In April 2018, a bill amending the GSRS statute was approved. Beginning January 1, 2019, the scope of projects eligible for recovery under the statute includes safety-related investments to replace, upgrade or modernize obsolete facilities, as well as projects that enhance the integrity of pipeline system components or extend the useful life of such assets. Safety-related investments also include expenditures for physical and cyber security. Additionally, the cap on the monthly residential surcharge increased to $0.80 from $0.40.
Texas - On February 12, 2021, the governor of Texas declared a state of disaster for all 254 counties in Texas in response to the then-forecasted weather conditions. The declaration certified that severe winter weather posed an imminent threat due to prolonged freezing temperatures, heavy snow, and freezing rain statewide.
Also, on February 12, 2021, the RRC issued an Emergency Order to temporarily implement a statewide utilities curtailment program intended to protect residences, hospitals, schools, churches, and other human needs customers. On February 17, 2021, the RRC extended its Emergency Order issued on February 12, 2021, to February 23, 2021.
On February 13, 2021, the RRC issued a Notice to Local Distribution Companies that acknowledged that, due to the demand for natural gas during this winter weather event, natural gas utility LDCs may be required to pay extraordinarily high prices in the market for natural gas and may be subjected to other extraordinary costs when responding to the event. The RRC also encouraged natural gas utilities to continue to work to ensure that the citizens of the State of Texas are provided with safe and reliable natural gas service. To partially defer and reduce the impact on customers for these costs that ultimately are reflected in customer bills, the RRC authorized LDCs to record a regulatory asset to account for the extraordinary costs associated with this winter weather event, including but not limited to gas cost and other costs related to the procurement and transportation of gas supply. These costs will be subject to review for reasonableness and accuracy in future regulatory proceedings.
In April 2020, the RRC issued an order authorizing utilities to use a regulatory accounting mechanism and a subsequent process through which Texas Gas Service may seek future recovery of incremental expenses resulting from the effects of COVID-19, including bad debt and associated credit and collections costs, waived fees and other reasonable and necessary incremental costs to address the impact of COVID-19. The timing of any recovery will be determined as we work with our regulators.
West Texas Service Area - In March 2020,2024, Texas Gas Service made GRIP filings for all customers in the West Texas service area. In June 2020, the RRC and the cities in the West TexasCentral-Gulf service area, agreed requesting a $12.3 million increase to an increase of $4.7 million, and new rates becamebe effective in June 2020.2024.
In March 2019, Texas Gas Service made GRIP filings for all customers in the West Texas service area. In June 2019, the RRC and the cities in the West Texas service area agreed to an increase of $4.1 million, and new rates became effective in July 2019.
In March 2018, Texas Gas Service made GRIP filings for all customers in the West Texas service area. In June 2018, the RRC and the cities in the West Texas service area agreed to an increase of $3.5 million, and new rates became effective in July 2018.
Central-Gulf Service Area - In February 2021,2023, Texas Gas Service made GRIP filings for all customers in the Central-Gulf service area, requesting an $11.5 million increase of $10.7 million to be effective in June 2023. All municipalities, and the third quarterRRC, approved the increase or allowed it to take effect with no action, in June 2023.
West-North Service Area - In March 2023, Texas Gas Service made GRIP filings for all customers in the West-North service area, requesting a $7.4 million increase to be effective in July 2023. In June 2023, El Paso, Socorro and Anthony denied the requested increase. Texas Gas Service appealed the municipalities’ actions to the RRC. All other municipalities, and the RRC, approved an increase of 2021.$7.3 million or allowed it to take effect with no action. Texas Gas Service implemented the new rates in June 2023, subject to adjustment depending upon the outcome of the appeal. In August 2023, the RRC granted the appeal and approved the increase.
In 2019,June 2022, Texas Gas Service filed a rate case seeking to consolidate its West Texas, North Texas and Borger/Skellytown service areas into a single West-North service area and requesting a rate increase of $13.0 million. In January 2023, the RRC
approved the consolidation and a rate increase of $8.8 million premised on a return on equity of 9.6 percent and a common equity ratio of 59.74 percent equity. The new rates were implemented in February 2023.
Rio Grande Valley Service Area - In June 2023, Texas Gas Service filed a rate case for all customers in the Central TexasRio Grande Valley service area, requesting a $9.8 million increase. In November 2023, the parties filed a signed settlement agreement that included a 9.7 percent ROE and Gulf Coast service areas, seeking a ratean overall revenue increase of $15.6 million and$5.9 million. In January 2024, the administrative law judge issued a $1.3 million credit to customers associated with EDIT, and requesting to consolidateproposal for decision recommending approval of the two service areas into one. In August 2020,settlement. On January 30, 2024, the RRC approved all terms of a settlement, including a $10.3 million increase in base rates, as well as consolidation of the Central Texas service areaadministrative law judge’s decision and the Gulf Coast service area into a new Central-Gulf service area. The RRC also approved an $8.5 million credit to customers associated with EDIT. The settlement included an ROE of 9.5 percent and a capital structure with equity of 59 percent and debt of 41 percent, and new rates became effective in August 2020.
In March 2019, Texas Gas Service made GRIP filings for all customers in the Central Texas service area. In June 2019, the RRC and the cities in the Central Texas service area agreed to an increase of $5.5 million, and new rates became effective in June 2019.
In March 2018, Texas Gas Service made GRIP filings for all customers in the Central Texas service area. In June 2018, the RRC and the cities in the Central Texas service area agreed to an increase of $3.3 million, and new rates became effective in July 2018.
Other Texas Service Areas - In the normal course of business, Texas Gas Service has filed rate cases and sought GRIP and COSA increases in various other Texas jurisdictions to address investments in rate base and changes in expenses. Annual rate increases associated with these filings that were approved totaled $1.8 million, $1.9 million and $1.6 million for the years ended December 31, 2020, 2019, and 2018, respectively.
In 2018, Texas Gas Service requested a total of $11.1 million of decreases to rates for customers in its service areas due to the reduction of the federal corporate income tax rate, and one-time refunds totaling $6.6 million for the reduction in the federal corporate income tax rate for the period between January 1, 2018, to the dates new rates were implemented. The requests for the decreases in rates and the one-time refunds were approved and new rates, where applicable, became effective in the second half of 2018. Four service areas in Texas have authorized EDIT to be credited to customers annually. The timing of the return of EDIT to customers in our remaining service area in Texas will be determined as we work with our regulators.
EDIT - The treatment of EDIT by our regulators is not expected to have a material impact on earnings, as any reduction or credit in rates is offset by a reduction in income tax expense, which includes the amortization of the regulatory liability as a credit in income tax expense. During the years ended December 31, 2020 and 2019, we credited income tax expense $17.4 million and $12.8 million, respectively, for the amortization of the regulatory liability associated with EDIT that was returned to customers. No amortization of the regulatory liability associated with EDIT returned to customers was recorded in 2018. See “Liquidity and Capital Resources - Tax Reform” and Note 15 of the Notes to Consolidated Financial Statements for additional discussion of the Tax Cuts and Jobs Act of 2017.
OTHER
Certain costs to be recovered through the ratemaking process have been capitalized as regulatory assets. Should recovery cease due to regulatory actions, certain of these assets may no longer meet the criteria for recognition and accordingly, a write-off of regulatory assets and stranded costs may be required. There were no write-offs of regulatory assets resulting from the failure to meet the criteria for capitalization during 2020, 2019 or 2018.
FINANCIAL RESULTS AND OPERATING INFORMATION
Selected Financial Results - Net income was $196.4 million, or $3.68 per diluted share, $186.7 million, or $3.51 per diluted share, and $172.2 million, or $3.25 per diluted share, for the years ended December 31, 2020, 2019 and 2018, respectively.
We operate in one reportable business segment: regulated public utilities that deliver natural gas to residential, commercial and transportation customers. We evaluate our financial performance principally on net income.
Selected Financial Results - Net income was $231.2 million, or $4.14 per diluted share, $221.7 million, or $4.08 per diluted share, and $206.4 million, or $3.85 per diluted share, for the years ended December 31, 2023, 2022 and 2021, respectively.
The following table sets forth certain selected financial results for our operations for the periods indicated:
| | | | | | | | | Variances | | Variances | | | Years Ended | Variances | | Variances |
| | | | Years Ended December 31, | | 2020 vs. 2019 | | 2019 vs. 2018 | | | December 31, | 2023 vs. 2022 | | 2022 vs. 2021 |
| Financial Results | Financial Results | | 2020 | | 2019 | | 2018 | | Increase (Decrease) | | Increase (Decrease) | Financial Results | | 2023 | | 2022 | | 2021 | Increase (Decrease) | | Increase (Decrease) |
| | | | (Millions of dollars, except percentages) | | (Millions of dollars, except percentages) |
| Natural gas sales | Natural gas sales | | $ | 1,389.2 | | | $ | 1,508.1 | | | $ | 1,492.4 | | | $ | (118.9) | | | (8) | % | | $ | 15.7 | | | 1 | % | Natural gas sales | | $ | 2,154.0 | | | $ | | $ | 2,412.9 | | | $ | | $ | 1,661.7 | | $ | (258.9) | | | (11) | | (11) | % | | $ | 751.2 | | | 45 | | 45 | % |
| Transportation revenues | Transportation revenues | | 114.1 | | | 114.1 | | | 109.7 | | | — | | | — | % | | 4.4 | | | 4 | % | Transportation revenues | | 133.6 | | | 126.5 | | 126.5 | | | 119.0 | | 119.0 | | 7.1 | 7.1 | | | 6 | | 6 | % | | 7.5 | | | 6 | | 6 | % |
| Securitization customer charges | | Securitization customer charges | | 48.7 | | | 5.8 | | | — | | 42.9 | | | 740 | % | | 5.8 | | | 100 | % |
| Other revenues | Other revenues | | 27.0 | | | 30.5 | | | 31.6 | | | (3.5) | | | (11) | % | | (1.1) | | | (3) | % | Other revenues | | 35.7 | | | 32.8 | | 32.8 | | | 27.9 | | 27.9 | | 2.9 | 2.9 | | | 9 | | 9 | % | | 4.9 | | | 18 | | 18 | % |
| Total revenues | Total revenues | | 1,530.3 | | | 1,652.7 | | | 1,633.7 | | | (122.4) | | | (7) | % | | 19.0 | | | 1 | % | Total revenues | | 2,372.0 | | | 2,578.0 | | 2,578.0 | | 1,808.6 | (206.0) | | | (8) | | (8) | % | | 769.4 | | | 43 | | 43 | % |
| Cost of natural gas | Cost of natural gas | | 537.4 | | | 687.9 | | | 714.6 | | | (150.5) | | | (22) | % | | (26.7) | | | (4) | % | Cost of natural gas | | 1,134.5 | | | 1,459.1 | | 1,459.1 | | | 775.0 | | 775.0 | | (324.6) | (324.6) | | | (22) | | (22) | % | | 684.1 | | | 88 | | 88 | % |
| Net margin | | 992.9 | | | 964.8 | | | 919.1 | | | 28.1 | | | 3 | % | | 45.7 | | | 5 | % |
| Operating costs | Operating costs | | 494.5 | | | 489.1 | | | 470.6 | | | 5.4 | | | 1 | % | | 18.5 | | | 4 | % | Operating costs | | 580.1 | | | 540.4 | | 540.4 | | | 516.1 | | 516.1 | | 39.7 | 39.7 | | | 7 | | 7 | % | | 24.3 | | | 5 | | 5 | % |
| Depreciation and amortization | Depreciation and amortization | | 194.9 | | | 180.4 | | | 160.1 | | | 14.5 | | | 8 | % | | 20.3 | | | 13 | % | Depreciation and amortization | | 279.8 | | | 228.5 | | 228.5 | | | 207.2 | | 207.2 | | 51.3 | 51.3 | | | 22 | | 22 | % | | 21.3 | | | 10 | | 10 | % |
| Operating income | Operating income | | $ | 303.5 | | | $ | 295.3 | | | $ | 288.4 | | | $ | 8.2 | | | 3 | % | | $ | 6.9 | | | 2 | % | Operating income | | $ | 377.6 | | | $ | | $ | 350.0 | | | $ | | $ | 310.3 | | $ | 27.6 | | | 8 | | 8 | % | | $ | 39.7 | | | 13 | | 13 | % |
| Net income | | $ | 196.4 | | | $ | 186.7 | | | $ | 172.2 | | | $ | 9.7 | | | 5 | % | | $ | 14.5 | | | 8 | % |
| Net Income | | Net Income | | $ | 231.2 | | | 221.7 | | 206.4 | $ | 9.5 | | | 4 | % | | $ | 15.3 | | | 7 | % |
| Capital expenditures and asset removal costs | Capital expenditures and asset removal costs | | $ | 512.2 | | | $ | 465.1 | | | $ | 447.4 | | | $ | 47.1 | | | 10 | % | | $ | 17.7 | | | 4 | % | Capital expenditures and asset removal costs | | $ | 728.7 | | | $ | | $ | 656.5 | | | $ | | $ | 544.3 | | $ | 72.2 | | | 11 | | 11 | % | | $ | 112.2 | | | 21 | | 21 | % |
|
Natural gas sales to customers represent revenue from contracts with customers through implied contracts established by our tariffs and rates approved by the regulatory authorities, as well as revenues from regulatory mechanisms related to natural gas sales. Additionally, natural gas sales include recovery of the cost of natural gas.
Our natural gas sales include fixed and variable charges related to the delivery of natural gas and gas costs that are passed through to our customers in accordance with our cost of natural gas regulatory mechanisms. Fixed charges reflect the portion of our natural gas sales attributable to the monthly fixed customer charge component of our rates, which are included as other revenuesdoes not fluctuate based on customer usage in each period. Variable charges reflect the portion of our Notes to Consolidated Financial Statements.natural gas sales that fluctuate with the volumes delivered and billed and the effects of weather normalization.
Transportation revenues represent revenue from contracts with customers through implied contracts established by our tariffs and rates approved by the regulatory authorities, as well as tariff-based negotiated contracts.
Securitization customer charges represent revenue from contracts with customers through implied contracts established by the financing order approved by the KCC, related to the securitization of extraordinary costs incurred during Winter Storm Uri in the state of Kansas. See Note 17 of the Notes to Consolidated Financial Statements in this Quarterly Report for additional discussion of the securitization transaction in Kansas.
Other utility revenues include primarily miscellaneous service charges, which represent implied contracts with customers established by our tariffs and rates approved by the regulatory authorities and other revenues from regulatory mechanisms, which are included in the consolidated statements of income and our Notes to Consolidated Financial Statements as other revenues.mechanisms.
Non-GAAP Financial Measure - We have disclosed net margin, which is considered a non-GAAP financial measure, in our selected financial data and selected financial results. Net margin is comprised of total revenues lessOur average cost of natural gas.gas rate decreased to $7.08 per Mcf for the year ended December 31, 2023, compared to $8.22 per Mcf in the prior year. Cost of natural gas includes commodity purchases, fuel, storage, transportation, hedging costs and settlement proceeds for natural gas price volatility mitigation programs approved by our regulators and other gas purchase costs recovered through our cost of natural gas regulatory mechanisms and does not include an allocation of general operating costs or depreciation and amortization. In addition, theseThese regulatory mechanisms provide a method of recovering natural gas costs on an ongoing basis without a profit. Therefore, although our revenues will fluctuate with the cost of natural gas that we pass-through to our customers, net marginoperating income is not affected by fluctuations in the cost of natural gas. Accordingly, we routinely use net margin in the analysis of our financial performance. We believe that net margin provides investors a more relevant and useful measure to analyze our financial performance as a 100 percent regulated natural gas utility than total revenues because the change in the cost of natural gas from period to period does not impact our operating income. As such, the following discussion and analysis of our financial performance will reference net margin rather than total revenues and cost of natural gas individually.
The following table sets forth reconciliation of net margin to the most directly comparable GAAP measure for the periods indicated:
| | | | | | | | | | | | | | | | | | | | | | | | | | | | | | | | | | | | | | | | | | | | |
| | | | | | | Variances | | Variances |
| | | Years Ended December 31, | | 2020 vs. 2019 | | 2019 vs. 2018 |
| Non-GAAP Reconciliation | | 2020 | | 2019 | | 2018 | | Increase (Decrease) | | Increase (Decrease) |
| | | (Millions of dollars, except percentages) |
| Total revenues | | $ | 1,530.3 | | | $ | 1,652.7 | | | $ | 1,633.7 | | | $ | (122.4) | | | (7) | % | | $ | 19.0 | | | 1 | % |
| Cost of natural gas | | 537.4 | | | 687.9 | | | 714.6 | | | (150.5) | | | (22) | % | | (26.7) | | | (4) | % |
| Net margin | | $ | 992.9 | | | $ | 964.8 | | | $ | 919.1 | | | $ | 28.1 | | | 3 | % | | $ | 45.7 | | | 5 | % |
The following table sets forth our net margin by type of customer for the periods indicated:
| | | | | | | | | | | | | | | | | | | | | | | | | | | | | | | | | | | | | | | | | | | | |
| | | | | | | Variances | | Variances |
| | | Years Ended December 31, | | 2020 vs. 2019 | | 2019 vs. 2018 |
| Net Margin | | 2020 | | 2019 | | 2018 | | Increase (Decrease) | | Increase (Decrease) |
| Natural gas sales | | (Millions of dollars, except percentages) |
| Residential | | $ | 711.1 | | | $ | 681.0 | | | $ | 644.1 | | | $ | 30.1 | | | 4 | % | | $ | 36.9 | | | 6 | % |
| Commercial and industrial | | 132.8 | | | 131.5 | | | 127.1 | | | 1.3 | | | 1 | % | | 4.4 | | | 3 | % |
| Other | | 7.9 | | | 7.7 | | | 6.6 | | | 0.2 | | | 3 | % | | 1.1 | | | 17 | % |
| Net margin on natural gas sales | | 851.8 | | | 820.2 | | | 777.8 | | | 31.6 | | | 4 | % | | 42.4 | | | 5 | % |
| Transportation revenues | | 114.1 | | | 114.1 | | | 109.7 | | | — | | | — | % | | 4.4 | | | 4 | % |
| Other revenues | | 27.0 | | | 30.5 | | | 31.6 | | | (3.5) | | | (11) | % | | (1.1) | | | (3) | % |
| Net margin | | $ | 992.9 | | | $ | 964.8 | | | $ | 919.1 | | | $ | 28.1 | | | 3 | % | | $ | 45.7 | | | 5 | % |
Our net margin on natural gas sales is comprised of two components, fixed and variable margin. Fixed margin reflects the portion of our net margin attributable to the monthly fixed customer charge component of our rates, which does not fluctuate based on customer usage in each period. Variable margin reflects the portion of our net margin that fluctuates with the volumes delivered and billed and the effects of weather normalization. The following table sets forth our net margin on natural gas sales by revenue type for the periods indicated:
| | | | | | | | | | | | | | | | | | | | | | | | | | | | | | | | | | | | | | | | | | | | |
| | | | | | | Variances | | Variances |
| | | Years Ended December 31, | | 2020 vs. 2019 | | 2019 vs. 2018 |
| Net Margin on Natural Gas Sales | | 2020 | | 2019 | | 2018 | | Increase (Decrease) | | Increase (Decrease) |
| Net margin on natural gas sales | | (Millions of dollars, except percentages) |
| Fixed margin | | $ | 610.3 | | | $ | 590.2 | | | $ | 553.9 | | | $ | 20.1 | | | 3 | % | | $ | 36.3 | | | 7 | % |
| Variable margin | | 241.5 | | | 230.0 | | | 223.9 | | | 11.5 | | | 5 | % | | 6.1 | | | 3 | % |
| Net margin on natural gas sales | | $ | 851.8 | | | $ | 820.2 | | | $ | 777.8 | | | $ | 31.6 | | | 4 | % | | $ | 42.4 | | | 5 | % |
20202023 vs. 20192022 - Net marginOperating income increased $28.1$27.6 million due primarily to the following:
•an increase of $23.1$61.6 million from new rates;
•an increase of $10.1$6.3 million in residential sales due primarily to net customer growth;
•an increase of $2.1 million in rider and surcharge recoveries due to a higher ad-valorem surcharge in Kansas, which was offset with higher regulatory amortization expense in depreciation and amortization expense; and
•an increase of $1.3$4.9 million due to the beneficial impact of a retroactive CNG federal excise tax credit, offset partially by:
•a decrease of $4.3 million due to lower fees associated with collection activities and late payments primarily related to the suspensions of disconnects for nonpayment in response to the COVID-19 pandemic in each of our rate jurisdictions;ad valorem recoveries.
•a decrease of $2.8 million due to lower transport volumes primarily in Kansas; and
•a decrease of $0.9 million due to lower sales volumes, net of weather normalization, primarily in Kansas and Oklahoma from warmer weather in 2020 compared with the same period in 2019. For 2020, heating degree days in Oklahoma and Kansas were 12% and 11% lower, respectively, compared with 2019.
Operating costs increased $5.4 million due primarily to the following:These increases were offset partially by:
•an increase of $6.4$26.5 million in expenses related to our response to the COVID-19 pandemic;
•an increase of $5.4 million in bad debt expense;
•an increase of $2.6 million in ad-valorem taxes;employee-related costs; and
•an increase of $2.1$19.3 million in insurancedepreciation expense offset partially by:
•a decrease of $4.8 million in expenses for travel and employee training that have been impacted by the COVID-19 pandemic;
•a decrease of $3.3 million in legal-related costs;
•a decrease of $1.4 million in materials for pipeline repair and maintenance activities; and
•a decrease of $1.0 million in outside service costs.
The portion of the decrease in late payment, reconnect and collection fees resulting from the suspension of disconnects for nonpayment in responsedue to the COVID-19 pandemic and increased bad debt expense and the net incremental expenses related to the COVID-19 pandemic are eligible for future recovery under the regulatory orders we have received in each of our jurisdictions. For financial reporting purposes, the amounts deferred as a regulatory asset for future recovery under the accounting orders must be probable of recovery. At December 31, 2020, no regulatory assets have been recorded. We continue to evaluate the impacts of COVID-19 on our business and will record regulatory assets for financial statement purposes at such time as recovery is deemed probable.
Depreciation and amortization expense increased $14.5 million due primarily to an increase in depreciation from ouradditional capital expenditures being placed in service andservice.
Revenues for the year ended December 31, 2023, include an increase of $42.9 million associated with KGSS-I, which is offset by an increase of $27.1 million in amortization of the ad-valorem surcharge riderand operating expense and $15.7 million in Kansas.net interest expense.
Other Factors Affecting Net Income - Other factors that affect net income include a $1.3 million decrease,for the year ended December 31, 2023, compared with 2019,2022, include an increase of $13.7 million in other income, tax expensenet, and an increase of $37.8 million in interest expense. The increase in other income, net, is due primarily to a higher credit to income tax expense from the amortization of EDIT of $4.6$12.0 million offset partially by the increase in income before income taxes.the market value of investments associated with our nonqualified employee benefit plans. The increase in interest expense is due primarily to interest on our commercial paper, the issuance of $300 million of 4.250 percent senior notes in August 2022 and $336 million of 5.486 percent Securitized Utility Tariff Bonds in November 2022, compared with the same period last year.
EDIT - The return of EDIT to our customers is not expected to have a material impact on earnings, as any reduction or credit in rates is offset by a reduction in income tax expense. During the years ended December 31, 20202023 and 2019,2022, we credited income tax expense $17.4$22.4 million and $12.8$18.0 million, respectively, for the amortization of the regulatory liability associated with EDIT that was returned to customers. No amortization of the regulatory liability associated with EDIT returned to customers was recorded in 2018. See “Liquidity and Capital Resources” and Note 11 of the Notes to Consolidated Financial Statements for additional discussion of the Tax Cuts and Jobs Act of 2017.
Capital Expenditures and Asset Removal Costs - Our capital expenditures program includes expenditures for pipeline integrity, extending service to new areas, modifications to customer service lines, increasing system capabilities, pipeline replacements, automated meter reading, government-mandated pipeline relocations, fleet, facilities, IT assets, and cybersecurity. It is our practice to maintain and upgrade our infrastructure, facilities and systems to ensure safe, reliable, and efficient operations. Asset removal costs include expenditures associated with the replacement or retirement of long-lived assets that result from the construction, development and/or normal use of our assets, primarily our pipeline assets.
Capital expenditures and asset removal costs increased $47.1$72.2 million for 2020,2023, compared with 2019, 2022, due primarily to increasedexpenditures for system integrity activities,and extension of service to new areas and higher government relocation activities.. Our capital expenditures and asset removal costs are expected to be approximately $540$750 million for 2021, although the amount and timing of these expenditures could be impacted by the COVID-19 pandemic.2024. While we havedid not experiencedexperience a significant impact to our capital expendituresexpenditure program forduring the year ended December 31, 2020,2023, our future capital expenditure activity for 2021 could experienceis dependent on a delay ifnumber of factors, including economic conditions associated with COVID-19 worsen, impacting employee absences, orand our supply chainchains for contract labor, materials and supplies, which may cause us to suspend or curtail certain business operations for an indefinite period.supplies.
Selected Operating Information - The following tables set forth certain selected operating information for the periods indicated:
| | | Years Ended | Variances |
| | | | December 31, | 2020 vs. 2019 |
| | | Years Ended | |
| | | Years Ended | |
| | | Years Ended | | Variances |
| | December 31, | | | | December 31, | 2023 vs. 2022 |
| (in thousands) | (in thousands) | | 2020 | 2019 | Increase (Decrease) | (in thousands) | | 2023 | 2022 | Increase (Decrease) |
| Average Number of Customers | Average Number of Customers | | OK | KS | TX | Total | OK | KS | TX | Total | OK | KS | TX | Total | Average Number of Customers | | OK | KS | TX | Total | OK | KS | TX | Total | OK | KS | TX | Total |
| Residential | Residential | | 814 | | 589 | | 641 | | 2,044 | | 804 | | 584 | | 631 | | 2,019 | | 10 | | 5 | | 10 | | 25 | |
| Commercial and industrial | Commercial and industrial | | 75 | | 50 | | 35 | | 160 | | 74 | | 50 | | 35 | | 159 | | 1 | | — | | — | | 1 | |
| Other | Other | | — | | — | | 3 | | 3 | | — | | — | | 3 | | 3 | | — | | — | | — | | — | |
| Transportation | Transportation | | 6 | | 6 | | 1 | | 13 | | 6 | | 6 | | 1 | | 13 | | — | | — | | — | | — | |
| Total customers | Total customers | | 895 | | 645 | | 680 | | 2,220 | | 884 | | 640 | | 670 | | 2,194 | | 11 | | 5 | | 10 | | 26 | |
|
| | | | | | | | | | | | | | | | | | | | | | | | | | | | | | | | | | | | | | | | | |
| | Years Ended | Variances |
| | | December 31, | 2019 vs. 2018 |
| (in thousands) | | 2019 | 2018 | Increase (Decrease) |
| Average Number of Customers | | OK | KS | TX | Total | OK | KS | TX | Total | OK | KS | TX | Total |
| Residential | | 804 | | 584 | | 631 | | 2,019 | | 798 | | 583 | | 624 | | 2,005 | | 6 | | 1 | | 7 | | 14 | |
| Commercial and industrial | | 74 | | 50 | | 35 | | 159 | | 74 | | 50 | | 35 | | 159 | | — | | — | | — | | — | |
| Other | | — | | — | | 3 | | 3 | | — | | — | | 3 | | 3 | | — | | — | | — | | — | |
| Transportation | | 6 | | 6 | | 1 | | 13 | | 5 | | 6 | | 1 | | 12 | | 1 | | — | | — | | 1 | |
| Total customers | | 884 | | 640 | | 670 | | 2,194 | | 877 | | 639 | | 663 | | 2,179 | | 7 | | 1 | | 7 | | 15 | |
The increase in the average number of customers for 2020,2023, compared with 2019,2022, is due primarily to the connection of new customers resulting from the extension and expansion of our system in our service areas. For 2020,2023, our average customer count includes 26,40023,400 new customer connections compared to 22,30027,100 in 2019. Also contributing to the increase is a reduction in disconnects for nonpayment by our customers as a result of suspensions of collection activities in response to the COVID-19 pandemic.2022.
The following table reflects the total volumes delivered, excluding the effects of WNA mechanisms on sales volumes:
| | | | | Years Ended December 31, | |
| | | | Years Ended December 31, | |
| | | | Years Ended December 31, | |
| | | | Years Ended December 31, |
Volumes (MMcf) | Volumes (MMcf) | | 2020 | | 2019 | | 2018 |
Volumes (MMcf) | |
Volumes (MMcf) | | | | | | | 2023 | | 2022 | | 2021 |
| Natural gas sales | Natural gas sales | | | | | | |
| Residential | |
| Residential | |
| Residential | Residential | | 121,967 | | | 128,723 | | | 128,393 | |
| Commercial and industrial | Commercial and industrial | | 36,169 | | | 40,690 | | | 40,743 | |
| Other | Other | | 2,427 | | | 2,688 | | | 2,505 | |
| Total sales volumes delivered | Total sales volumes delivered | | 160,563 | | | 172,101 | | | 171,641 | |
| Transportation | Transportation | | 224,531 | | | 224,304 | | | 220,884 | |
| Total volumes delivered | Total volumes delivered | | 385,094 | | | 396,405 | | | 392,525 | |
Total volumes delivered decreased for 2020, compared with 2019, due primarily to warmer weather in the fourth quarter 2020. The impact of weather on residential and commercial net marginnatural gas sales is mitigated by WNA mechanisms in all jurisdictions.
The following table sets forth the HDD’sHDDs by state for the periods indicated: | | | | | | | | | | | | | | | | | | | | | | | | | | | | | | | | | | | | | | | | | | | | |
| | Years Ended |
| | December 31, |
| | 2020 | | 2019 | | 2020 vs. 2019 | | 2020 | | 2019 |
| HDDs | | Actual | | Normal | | Actual | | Normal | | Actual Variance | | Actual as a percent of Normal |
| Oklahoma | | 3,253 | | | 3,264 | | | 3,716 | | | 3,264 | | | (12) | % | | 100 | % | | 114 | % |
| Kansas | | 4,408 | | | 4,722 | | | 4,971 | | | 4,791 | | | (11) | % | | 93 | % | | 104 | % |
| Texas | | 1,580 | | | 1,779 | | | 1,803 | | | 1,773 | | | (12) | % | | 89 | % | | 102 | % |
| | | | | | | | | | | | | | | | | | | | | | | | | | | | | | | | | | | | | | | | | | | | |
| | Years Ended |
| | December 31, |
| | 2019 | | 2018 | | 2019 vs. 2018 | | 2019 | | 2018 |
| HDDs | | Actual | | Normal | | Actual | | Normal | | Actual Variance | | Actual as a percent of Normal |
| Oklahoma | | 3,716 | | | 3,264 | | | 3,771 | | | 3,263 | | | (1) | % | | 114 | % | | 116 | % |
| Kansas | | 4,971 | | | 4,791 | | | 5,012 | | | 4,914 | | | (1) | % | | 104 | % | | 102 | % |
| Texas | | 1,803 | | | 1,773 | | | 1,738 | | | 1,782 | | | 4 | % | | 102 | % | | 98 | % |
| | | | | | | | | | | | | | | | | | | | | | | | | | | | | | | | | | | | | | | | | | | | |
| | |
| | |
| | | | | | | | | | |
| | | | | | | | | | | | |
| | | | | | | | | | | | | | |
| | | | | | | | | | | | | | |
| | | | | | | | | | | | | | |
| | | | | | | | | | | | | | |
| | |
| | Years Ended December 31, |
| | 2023 | | 2022 | | 2023 vs. 2022 | | 2023 | | 2022 |
| HDDs | | Actual | | Normal | | Actual | | Normal | | Actual Variance | | Actual as a percent of Normal |
| Oklahoma | | 3,125 | | | 3,346 | | | 3,621 | | | 3,346 | | | (14) | % | | 93 | % | | 108 | % |
| Kansas | | 4,117 | | | 4,721 | | | 4,779 | | | 4,722 | | | (14) | % | | 87 | % | | 101 | % |
| Texas | | 1,558 | | | 1,705 | | | 1,950 | | | 1,764 | | | (20) | % | | 91 | % | | 111 | % |
| | | | | | | | | | | | | | |
| | |
| | |
| | | | | | | | | | |
| | | | | | | | | | | | |
| | | | | | | | | | | | | | |
| | | | | | | | | | | | | | |
| | | | | | | | | | | | | | |
Normal HDDs are established through rate proceedings in each of our rate jurisdictions for use primarily in weather normalization billing calculations. Normal HDDs disclosed above are based on:
•Oklahoma - For years 2016-2020,A 10-year weighted average HDDs as of December 31, 2014,June 30, 2021, as calculated using 11 weather stations across Oklahoma and weighted on average customer count.
•Kansas - For April 2019 and forward, aA 30-year rolling average for years 1988-2017 calculated using three weather stations across Kansas and weighted on HDDs by weather station and customers. For 2017 to March 2019, 30-year average for years 1981-2010 published by the National Oceanic and Atmospheric Administration, as calculated using four weather stations across Kansas and weighted on HDDs by weather station and customers.
•Texas - An average of HDDs authorized in our most recent rate proceeding in each service areajurisdiction and weighted using a rolling 10-year average of actual natural gas distribution sales volumes by service area.
Actual HDDs are based on year-to-date,the quarter-to-date weighted average of:
•11 weather stations and customers by month for Oklahoma;
•3 weather stations and customers by month for Kansas; and
•9 weather stations and natural gas distribution sales volumes by service area for Texas.
Selected financial results and operating information for 2019, compared with 2018, is described in Part II, Item 7 "Management's Discussion and Analysis of Financial Condition and Results of Operations" in our Annual Report on Form 10-K for the year ended December 31, 2019.
CONTINGENCIES
We are a party to various litigation matters and claims that have arisen in the normal course of our operations. While the results of litigation and claims cannot be predicted with certainty, we believe the reasonably possible losses from such matters, individually and in the aggregate, are not material. Additionally, we believe the probable final outcome of such matters will not have a material adverse effect on our results of operations, financial position or cash flows. See Note 1715 of the Notes to Consolidated Financial Statements in this Annual Report for information with respect to legal proceedings.
LIQUIDITY AND CAPITAL RESOURCES
General - We have relied primarily on operating cash flow and commercial paper for our liquidity and capital resource requirements. We fund operating expenses, working capital requirements, including purchases of natural gas, and capital expenditures primarily with cash from operations and commercial paper.
We believe that the combination of the significant residential component of our customer base, the fixed-charge component of our natural gas sales net marginrevenues and our rate mechanisms that we have in place result in a stable cash flow profile and historically has generated stable earnings. Additionally, we have rate mechanisms in place in our jurisdictions that reduce the lag in earning a return on our capital expenditures and provide for recovery of certain changes in our cost of service by allowing for adjustments to rates between rate cases. We anticipate that our cash flow generated from operations and our expected short- and long-term financing arrangements will enable us to maintain our current and planned level of operations and provide us flexibility to finance our infrastructure investments.
Our ability to access capital markets for debt and equity financing under reasonable terms depends on market conditions, our financial condition and credit ratings. By maintaining a conservative financial profile and stable revenue base, we expect to maintain credit ratings at a level that supports our access to diverse sources of capital at favorable rates for capital investments and expenses.
Short-term Financing -Debt - In October 2019,2023, we exercised a one-year extensionentered into an agreement that increased the capacity of the ONE Gas Credit Agreement and amendedto $1.2 billion from $1.0 billion.
In March 2023, we entered into an extension agreement related to the agreement to provideONE Gas Credit Agreement that we may extendextended the maturity date by one year, subject to March 16, 2028, from March 16, 2027.
Other than the lenders’ consent, two additional times. increased commitments and term extension, all other terms and conditions of the ONE Gas Credit Agreement remain in full force and effect.
The ONE Gas Credit Agreement remainsprovides for a $700 million$1.2 billion revolving unsecured credit facility and includes a $20 million letter of credit subfacility and a $60 million swingline subfacility. We are able tocan request an increase in commitments of up to an additional $500$300 million upon satisfaction of customary conditions, including receipt of commitments from either new lenders or increased commitments from existing lenders. The ONE Gas Credit Agreement expires in October 2024, and is available to provide liquidity for working capital, capital expenditures, acquisitions and mergers, the issuance of letters of credit, and for other general corporate purposes.
The ONE Gas Credit Agreement contains certain financial, operational and legal covenants. Among other things, these covenants include maintaining ONE Gas’ total debt-to-capital ratio of no more than 70 percent at the end of any calendar quarter. At December 31, 2023, our total debt-to-capital ratio was 52 percent and we were in compliance with all covenants under the ONE Gas Credit Agreement. Excluding the debt of KGSS-I, which is non-recourse to us, our total debt-to-capital ratio was 50 percent. We may reduce the unutilized portion of the ONE Gas Credit Agreement in whole or in part without premium or penalty. The ONE Gas Credit Agreement contains customary events of default. Upon the occurrence of certain events of default, the obligations under the ONE Gas Credit Agreement may be accelerated and the commitments may be terminated. The ONE Gas Credit Agreement also contains certain financial, operational and legal covenants. Among other things, these covenants include maintaining ONE Gas’ total debt-to-capital ratio of no more than 70 percent at the end of any calendar quarter. The ONE Gas Credit Agreement also contains customary affirmative and negative covenants, including covenants relating to liens, indebtedness of subsidiaries, investments, changes in the nature of business, fundamental changes, transactions with affiliates, burdensome agreements, and use of proceeds. In the event of a breach of certain covenants by ONE Gas, amounts outstanding under the ONE Gas Credit Agreement may become due and payable immediately. At December 31, 2020, our total debt-to-capital ratio was 47 percent, and we were in compliance with all covenants under the ONE Gas Credit Agreement.
The ONE Gas Credit Agreement contains provisions for an applicable margin rate and an annual facility fee, both of which adjust with changes in our credit rating. Based on our current credit ratings, borrowings, if any, will accrue interest at LIBOR plus 79.5 basis points, and the annual facility fee is 8 basis points.
In April 2020,November 2023, we entered intoincreased the ONE Gas 364-day Credit Agreement. The ONE Gas 364-day Credit Agreement is a $250 million revolving unsecured credit facility containing various customary conditionscapacity of our commercial paper program to borrowing and affirmative, negative and financial ratio maintenance covenants, all of which are substantially the same as those of the ONE Gas Credit Agreement. The ONE Gas 364-day Credit Agreement also contains provisions for an applicable margin rate and a quarterly facility fee, both of which adjust with changes in our credit rating. Based on our current credit ratings, borrowings, if any, will accrue interest at LIBOR plus 115 basis points, and the quarterly facility fee is 10 basis points.$1.2 billion from $1.0 billion.
BothUnder our commercial paper program, we may issue unsecured commercial paper up to a maximum amount of $1.2 billion to fund short-term borrowing needs. The maturities of the ONE Gas Credit Agreementcommercial paper vary but may not exceed 270 days from the date of issue. Commercial paper is generally sold at par less a discount representing an interest factor. At December 31, 2023 and the ONE Gas 364-day Credit Agreement utilize LIBOR as the reference rate for determining interest to accrue on borrowings under the respective agreements. In the event LIBOR is not available,2022, we had $88.5 million and such circumstances are unlikely to be temporary, our lenders for each respective agreement may establish an alternative$552.0 million of commercial paper outstanding with a weighted-average interest rate for the impacted loans by replacing LIBOR with one or more secured overnight financing-based rates or another alternate benchmark rate.of 5.60 percent and 4.75 percent, respectively.
At December 31, 2020,2023, we had $1.2$1.4 million in letters of credit issued and no borrowings under the ONE Gas Credit Agreement, or the ONE Gas 364-day Credit Agreement, with $948.8 millionapproximately $1.2 billion of combined remaining credit, which is available to repay our commercial paper borrowings.
We have a commercial paper program under which we may issue unsecured commercial paper up to a maximum amount of $700 million to fund short-term borrowing needs. The maturities of the commercial paper notes may vary, but may not exceed 270 days from the date of issue. The commercial paper notes are generally sold at par less a discount representing an interest factor. At - In December 31, 2020,2023, we had $418.2 million of commercial paper outstanding.
Long-Term Debt - On February 22, 2021, we entered into the ONE Gas 2021 Term Loan Facility to enhance our liquidity position as part of the financing of our natural gas purchases in order to provide sufficient liquidity to satisfy our obligations as a result of the 2021 winter weather event and the repayment of indebtedness.
The ONE Gas 2021 Term Loan Facility provides for a $2.5 billion unsecured term loan facility. Proceeds of the loans under the ONE Gas 2021 Term Loan Facility will be available for natural gas purchases as a result of the 2021 winter weather event and the repayment of indebtedness. The ONE Gas 2021 Term Loan Facility matures two years after the loans are funded under the ONE Gas 2021 Term Loan Facility. The loans under the ONE Gas 2021 Term Loan Facility will bear interest at a “Eurodollar Rate” or a “Base Rate” as specified in the ONE Gas 2021 Term Loan Facility, plus a margin specified in the ONE Gas 2021 Term Loan Facility which adjusts based on our debt ratings and the outstanding amount of loans remaining under the ONE Gas 2021 Term Loan Facility. Outstanding loans or commitments under the ONE Gas 2021 Term Loan Facility are required to be prepaid or reduced, as applicable, with the net cash proceeds received by ONE Gas or any of its subsidiaries from certain debt and equity issuances.
The ONE Gas 2021 Term Loan Facility contains customary conditions to borrowing, and customary affirmative and negative covenants, including a financial ratio maintenance covenant requiring us to maintain a total debt-to-capital ratio of no more than 72.5 percent at the end of any calendar quarter through December 31, 2021, and 70 percent at the end of any calendar quarter thereafter. The ONE Gas 2021 Term Loan Facility also contains various customary events of default, the occurrence of which could result in a termination of the lenders’ commitments and the acceleration of all of our obligations thereunder.
In April 2020, ONE Gas issued $300 million of 2.005.10 percent senior notes due 2030.April 2029. The proceeds from the issuance were used to reduce the amount ofrepay amounts outstanding under our commercial paper program and for general corporate purposes.
At December 31, 2023, we had outstanding $2.7 billion of Senior Notes with $773.0 million due within the next year. The indenture governing our Senior Notes includes an event of default upon the acceleration of other indebtedness of $100 million or more. Such events of default would entitle the trustee or the holders of 25 percent in aggregate principal amount of the outstanding Senior Notes to declare those Senior Notes immediately due and payable in full.
Depending on the series, we may redeem our Senior Notes at par, plus accrued and unpaid interest to the redemption date, starting three months or six months before their maturity dates. Prior to these dates, we may redeem these Senior Notes, in whole or in part, at a redemption price equal to the principal amount, plus accrued and unpaid interest and a make-whole premium. The redemption price will never be less than 100 percent of the principal amount of the respective Senior NotesNote plus accrued and unpaid interest to the redemption date. The remaining $473 million of outstanding principal of our 1.10 percent senior notes due March 2024 can be called at par with a 30-day notice. Our Senior Notes are senior unsecured obligations, ranking equally in right of payment with all of our existing and future unsecured senior indebtedness.
Securitized Utility Tariff Bonds - At December 31, 2023, we had outstanding $315.3 million of 5.486 percent KGSS-I Securitized Utility Tariff Bonds with $27.4 million due within the next year. The bonds are governed by an indenture between KGSS-I and the indenture trustee. The indenture contains certain covenants that restrict KGSS-I’s ability to sell, transfer, convey, exchange, or otherwise dispose of its assets.
At December 31, 2020,2023, our long-term debt-to-capital ratio was 4152 percent. Excluding the debt of KGSS-I, which is non-recourse to us, our long-term debt-to-capital ratio was 49 percent. See Note 17 of the Notes to Consolidated Financial Statements in this Annual Report for information with respect to KGSS-I.
Credit Ratings - Our credit ratings as ofat December 31, 2020,2023, were:
| | | | | | | | |
Rating Agency | Rating | Outlook |
Moody’s | A2 | Stable |
S&P | A | Stable |
Our commercial paper was rated Prime-1 by Moody’s and A-1 by S&P as of December 31, 2020.
On February 23, 2021, our credit ratings changed as follows:
| | | | | | | | |
| Rating Agency | Rating | Outlook |
| Moody’s | A3 | NegativeStable |
| S&P | BBB+A- | NegativeStable |
Also on February 23, 2021, the ratings onAt December 31, 2023, our commercial paper changed towas rated Prime-2 by Moody’s and A-2 by S&P.
We intend to maintain credit metrics at a level that supports our balanced approach to capital investment and a return of capital to shareholders via a dividend that we believe will be competitive with our peer group.
At-the-Market Equity ProgramIssuances - In February 2020,On December 28, 2023, we initiatedsettled under forward contracts 1,032,403 shares (289,403 from forwards related to an at-the-market equity program by enteringdistribution agreement and 743,000 from forwards related to underwriting agreements) of our common stock for net proceeds of $79.0 million.
In December 2023, we amended the forward sale agreement we entered into in March 2023 to extend the maturity date of 657,000 shares to December 31, 2024 from December 29, 2023. The amended forward sale agreement provides for settlement on a date, or dates, to be specified at our discretion, but which will occur no later than December 31, 2024, for 1,257,000 shares of common stock.
In September 2023, we entered into an underwriting agreement and two forward sale agreements for 1.2 million and 180,000 shares of our common stock, respectively. The forward sale agreements provide for settlement on a date, or dates, to be specified at our discretion, but which will occur no later than December 31, 2024.
In June 2023, we executed forward sale agreements under our current at-the-market equity program for 926,465 shares of our common stock.
In March 2023, we entered into an underwriting agreement and a forward sale agreement for 2.0 million shares of our common stock. The forward sale agreement provided for settlement on a date, or dates, to be specified at our discretion, but which will occur no later than December 29, 2023, for 1.4 million shares of common stock and by December 31, 2024, for the remaining balance.
In February 2023, we entered into an at-the-market equity distribution agreement under which we may issue and sell shares of our common stock with an aggregate offering price up to $250$300 million. This at-the-market equity program replaced our previous at-the-market equity program, which began in February 2020, and expired in February 2023. Sales of common stock are made by means of ordinary brokers’ transactions on the NYSE, in block transactions or as otherwise agreed to between us and the sales agent. We are under no obligation to offer and sell common stock under the program. At December 31, 2020,2023, we had $225.5 million of equity available for issuance under the program.
The following table summarizes all of our outstanding forward sale agreements at December 31, 2023:
| | | | | | | | | | | | | | |
| Maturity | Original Shares | Remaining Shares | Net Proceeds Available
(in thousands) | Forward Price |
| December 31, 2024 | 926,465 | | 926,465 | | $ | 74,396 | | $ | 80.30 | |
| December 31, 2024 | 2,000,000 | | 1,257,000 | | 96,709 | | 76.94 | |
| December 31, 2024 | 1,200,000 | | 1,200,000 | | 88,823 | | 74.02 | |
| December 31, 2024 | 180,000 | | 180,000 | | 13,315 | | 73.97 | |
| Total forward sale agreements | 4,306,465 | | 3,563,465 | | $ | 273,243 | | $ | 76.68 | |
For the year ended December 31, 2022, under our at-the-market equity distribution agreement we sold and issued and sold 179,514403,792 shares of our common stock for $13.6$35.0 million, generating proceeds, net of issuance costs, of $13.5 million, and had $236.4 million of equity available for issuance under the program. Proceeds from the program are available for general corporate purposes, which may include repaying or refinancing a portion of our outstanding indebtedness and funding working capital and capital expenditures.$34.7 million.
Tax Reform - We have addressed the regulatory liability for EDIT resulting from the Tax Cuts and Jobs Act of 2017 in each of our jurisdictions. Our regulatory liability for income tax rate changes represents deferral of the effects of enacted federal and state income tax rate changes on our ADIT and other regulatory liabilities resulting from the effect of the changes in income taxes on our rates.
In May 2020, a bill amending the Kansas state income tax code was signed into law that exempts public utilities regulated by the KCC from paying Kansas state income taxes beginning January 1, 2021. As a result of the enactment of this legislation, we remeasured our ADIT. As a regulated entity, the reduction in ADIT of $81.5 million was recorded as an EDIT regulatory liability and will be refunded to our customers. This adjustment had no material impact on our income tax expense and no impact on our cash flows forFor the year ended December 31, 2020. The bill stipulates that, if requested by the utility, this EDIT will be returned2022, we executed forward sale agreements under our previous at-the-market equity distribution agreement for 1,451,474 shares of our common stock. On December 30, 2022, we settled forward sales agreements with respect to Kansas customers over a period1,162,071 shares of no less than 30 years, with the exact timing to be determined in our next general rate proceeding. In August 2020, Kansas Gas Service submitted an application to the KCC to reduce its base rates to reflect the eliminationcommon stock for net proceeds of Kansas state income taxes by approximately $4.9$93.8 million. In December 2020, the KCC approved the reduction, effective January 1, 2021.
Cash flows for years ended December 31, 2020 and 2019 were reduced by approximately $17.4 million and $12.8 million, respectively, for EDIT returned to customers. No amortization of the regulatory liability associated with EDIT returned to customers was recorded in 2018.
Pension and Other Postemployment Benefit Plans - We did not make any material contributions to our defined benefit pension plan or other postemployment plans in 2020. During 2019,For the year ended December 31,2023, we contributed $29.2$1.3 million to our defined benefit pension planplans and $6.2$2.5 million to our other postemployment benefit plans. InformationFor the year ended December 31, 2022, we contributed $1.5 million to our defined benefit pension plans and $1.9 million to our other postemployment benefit plans. Additional information about our pension and other postemployment benefitsbenefit plans, including anticipated contributions, is included under “Estimates and Critical Accounting Policies - Pension and Other Postemployment Benefits” and under Note 1411 of the Notes to Consolidated Financial Statements in this Annual Report.
CASH FLOW ANALYSIS
We use the indirect method to prepare our consolidated statements of cash flows. Under this method, we reconcile net income to cash flows provided by operating activities by adjusting net income for those items that impact net income but may not result in actual cash receipts or payments and changes in our assets and liabilities not classified as investing or financing activities during the period. Items that impact net income but may not result in actual cash receipts or payments include, but are not limited to, depreciation and amortization, deferred income taxes, share-based compensation expense and provision for doubtful accounts.
The following table sets forth the changes in cash flows by operating, investing and financing activities for the periods indicated:
| | | |
| | | | |
| | | Years Ended December 31, | | Variances | | | | Year Ended December 31, | | Variance | Variance |
| | | 2020 | | 2019 | | 2018 | | 2020 vs. 2019 | 2019 vs. 2018 | | | | | | | 2023 | 2022 | 2021 | | 2023 vs. 2022 | 2022 vs. 2021 |
| | | (Millions of dollars) | | | | | | | (Millions of dollars) |
| Total cash provided by (used in): | Total cash provided by (used in): | | | | | | |
| Operating activities | Operating activities | $ | 364.5 | | | $ | 310.4 | | | $ | 467.7 | | | $ | 54.1 | | $ | (157.3) | |
| Operating activities | |
| Operating activities | |
| Investing activities | Investing activities | (470.4) | | | (422.9) | | | (394.5) | | | (47.5) | | (28.4) | |
| Financing activities | Financing activities | 96.0 | | | 109.1 | | | (66.3) | | | (13.1) | | 175.4 | |
| Change in cash and cash equivalents | (9.9) | | | (3.4) | | | 6.9 | | | (6.5) | | (10.3) | |
| Cash and cash equivalents at beginning of period | 17.9 | | | 21.3 | | | 14.4 | | | (3.4) | | 6.9 | |
| Cash and cash equivalents at end of period | $ | 8.0 | | | $ | 17.9 | | | $ | 21.3 | | | $ | (9.9) | | $ | (3.4) | |
| Change in cash, cash equivalents, restricted cash and restricted cash equivalents | |
| Cash, cash equivalents, restricted cash and restricted cash equivalents at beginning of period | |
| Cash, cash equivalents, restricted cash and restricted cash equivalents at end of period | |
Operating Cash Flows - Changes in cash flows from operating activities are due primarily to changes in net marginsales revenues, natural gas costs and operating expenses discussed in Financial“Financial Results and Operating Information,” the effects of tax reformWinter Storm Uri discussed in Regulatory Activities“Regulatory Activities” and changes in working capital. Changes in natural gas prices and demand for our services or natural gas, whether because of general economic conditions, variations in weather not mitigated by WNAs, changes in supply or increased competition from other service providers, could affect our earnings and operating cash flows. Typically, our cash flows from operations are greater in the first half of the year compared with the second half of the year.
Operating cash flows from operating activities were higherlower in 20202023, compared with 2019,to 2022, due primarily to recovery of the winter weather event regulatory asset for Oklahoma Natural Gas through securitization beginning in August 2022, offset by the recovery of the winter weather event regulatory asset for Texas Gas Service through securitization in March 2023, and working capital changes resulting from the timing of payments for natural gas purchases.related to accounts receivable which were impacted by new rates in 2023 compared with 2022.
Investing Cash Flows - 2020 vs. 2019 - Cash used in investing activities increased for 2020,in 2023, compared to 2019,2022, due primarily to an increase in capital expenditures for increased system integrity activities and extendingextension of service to new areas.
Financing Cash Flows - 2020 vs. 2019 - Cash provided byused in financing activities for 2020 decreased in 2023, compared with 2019,to 2022, due primarily to proceeds from issuancethe repayment in August 2022 of long-term debt offset by larger repayments on notes payable.
2019 vs. 2018 - Cash flows in 2019, compared with 2018, are described in Part II, Item 7, "Management's Discussion and Analysis of Financial Condition and Results of Operations" in our Annual Report on Form 10-K for the year ended December 31, 2019.related to Winter Storm Uri.
ENVIRONMENTAL, SAFETY AND REGULATORY MATTERS
COVID-19 - Throughout the COVID-19 pandemic, we have continued to provide essential services to our customers. We have implemented a comprehensive set of policies, procedures and guidelines to protect the safety of our employees, customers and communities. As ordered by our regulators, customer disconnects for nonpayment were suspended from mid-March through May 20, 2020, in Oklahoma, through May 31, 2020, in Kansas, and through December 31, 2020, in some areas of Texas. As of December 31, 2020, we have temporarily suspended disconnects for safety reasons in all of our jurisdictions due to the level of COVID-19 infection. Since the onset of the pandemic in the first quarter of 2020, we have experienced impacts on our results of operations including, but not limited to: lower late payment, reconnect and collection fees and incremental expenses for bad debts related to the suspensions of disconnects for nonpayment; incremental expenses for PPE, cleaning supplies, outside services and other expenses; and lower expenses for travel and employee training that have been impacted by the pandemic. We have received accounting orders in each of our jurisdictions authorizing us to accumulate and defer for regulatory purposes certain incremental costs incurred, including bad debt expenses, and certain lost revenues, net of offsetting expense reductions associated with COVID-19. Pursuant to these orders, the recovery of any net incremental costs and lost revenues will be determined in future rate cases or alternative rate recovery filings in each jurisdiction. For financial reporting purposes, any amounts deferred as a regulatory asset for future recovery under these accounting orders must be probable of recovery. At December 31, 2020, no regulatory assets have been recorded. We continue to evaluate the impacts of COVID-19 on our business and will record regulatory assets for financial reporting purposes at such time as recovery is deemed probable. Going forward, we expect continuing impacts on our revenues and expenses during the course of the pandemic. We also could experience a possible reduction in revenues from commercial and transportation customers temporarily or permanently impacted by the pandemic.
Environmental Matters - We are subject to multiple historical, wildlife preservationlaws and environmental laws and/or regulations regarding protection of the environment and natural and cultural resources, which affect many aspects of our present and future operations. Regulated activities include, but are not limited to, those involving air emissions, storm water and wastewater discharges, handling and disposal of solid and hazardous wastes, wetland preservation, plant and wildlife protection, hazardous materials use, storage and transportation, and pipeline and facility construction. These laws and regulations require us to obtain and/or comply with a wide variety of environmental clearances, registrations, licenses, permits and other approvals. Failure to comply with these laws, regulations, licenses and permits or the discovery of presently unknown environmental conditions may expose us to fines, penalties and/or interruptions in our operations that could be material to our results of operations. In addition, emission controls and/or other regulatory or permitting mandates under the Clean Air ActCAA and other similar federal and state laws could require unexpected capital expenditures. We cannot assure that existing environmental statutes and regulations will not be revised or that new regulations will not be adopted or become applicable to us. Revised or additional statutes or regulations that result in increased compliance costs or additional operating restrictions could have a material adverse effect on our business, financial condition and results of operations. Our expenditures for environmental investigation and remediation compliance to-date have not been significant in relation to our financial position, results of operations or cash flows, and our expenditures related to environmental matters had no material effects on earnings or cash flows during 2020, 2019, or 2018.2023, 2022 and 2021.
We own or retain legal responsibility for certain environmental conditions at 12 former MGP sites in Kansas. These sites contain contaminants generally associated with MGP sites and are subject to control or remediation under various environmental laws and regulations. A consent agreement with the KDHE governs all environmental investigation and remediation work at these sites. The terms of the consent agreement require us to investigate these sites and set remediation activities based upon the results of the investigations and risk analysis. Remediation typically involves the management of contaminated soils and may involve removal of structures and monitoring and/or remediation of groundwater. Regulatory closure has been achieved at threefive of the 12 sites, but these sites remain subject to potential future requirements that may result in additional costs.
We have completed or are addressing removal of the source of soil contamination at all 12 sites and continue to monitor groundwater at seven of the 12 sites according to plans approved by the KDHE. In 2019, we completed a project to remove a source of contamination and associated contaminated materials at the twelfth site where no active soil remediation had previously occurred. In 2022, we completed a remediation project to remove a source of contamination and contaminated materials at one of the MGP sites. In June 2023, we submitted a revised draft remediation plan to the KDHE for review following receipt of agency comments and public feedback. In August 2023, the KDHE approved the remediation plan without comment. We submitted a site investigation work plan for another site and on August 27, 2023 the KDHE approved the document without comment.
We have an AAO that allows Kansas Gas Service to defer and seek recovery of costs necessary for investigation and remediation at, and nearby, these 12 former MGP sites that are incurred after January 1, 2017, up to a cap of $15.0 million, net of any related insurance recoveries. Costs approved for recovery in a future rate proceeding would then be amortized over a 15-year period. The unamortized amounts will not be included in rate base or accumulate carrying charges. Following a determination that future investigation and remediation work approved by the KDHE is expected to exceed $15.0 million, net of any related insurance recoveries, Kansas Gas Service will be required to file an application with the KCC for approval to increase the $15.0 million cap. At December 31, 20202023 and 2019,2022, we have deferred $18.8$32.0 million and $9.8$29.8 million, respectively, for accrued investigation and remediation costs pursuant to our AAO. Kansas Gas Service expects to file an application for amounts deferred in excess of the cap as soon as practicable after the KDHE approves the remediation plans we have submitted and anticipates that filing will occur in 2021.submitted.
We have completed or are addressing removal of the source of soil contamination at all 12 sites and continue to monitor groundwater at eight of the 12 sites according to plans approved by the KDHE. In 2019, we completed a project to remove a source of contamination and associated contaminated materials at the twelfth site where no active soil remediation had previously occurred. A remediation plan was submitted to the KDHE concerning this site in 2020 and the KDHE has provided comments that we are addressing. We are also working on a remediation plan that will be submitted to the KDHE in 2021 for an additional site.
As a result of our work to investigate and remediate the environmental impacts of our MGP sites in 2020, we estimated the potential costs associated with additional investigation and remediation to be in the range of $9.1 million to $23.3 million. A single reliable estimate of the remediation costs for these sites was not feasible due to the amount of uncertainty in the ultimate remediation approach that will be utilized. Accordingly, in 2020, we recorded an adjustment to our reserve of $9.1 million, which also increased our regulatory asset pursuant to our AAO in Kansas, as we believe recovery of these costs is probable through our existing AAO or future regulatory filings. At December 31, 2020 and 2019, the reserve for remediation of our MGP sites was $14.5 million and $5.8 million, respectively.
We also own or retain legal responsibility for certain environmental conditions at a former MGP site in Texas. At the request of the Texas Commission on Environmental Quality,TCEQ, we began investigating the level and extent of contamination associated with the site under their Texas Risk Reduction Program. A preliminary site investigation revealed that this site contains contaminants generally associated with MGP sites and is subject to control or remediation under various environmental laws and regulations. UntilImpacts have been identified in the investigation is complete,soil and groundwater at the site with limited impacts observed in surrounding areas. In April 2022, we are unablesubmitted a remediation work plan to determine what, if any, active remediation will be required. A reliable estimate of potential remediation costs is not feasible at this point dueaddress the areas impacted to the amount of uncertainty asTCEQ. In August 2023, remediation activities were conducted to address the levels and extent of contamination.impacted area in accordance with the remediation work plan.During the third quarter 2023, the TCEQ requested acceptable financial assurance for the projected costs on post-response action care activities at the site. At December 31, 2023, estimated costs associated with expected remediation activities for this site are not material.
Our expenditures for environmental evaluation, mitigation, remediation and compliance to date have not been significant in relation to our financial position, results of operations or cash flows, and our expenditures related to environmental matters had no material effects on earnings or cash flows during 2020, 2019 or 2018.the years ended December 31, 2023 and 2022. The reserve for remediation of our MGP sites was $14.3 million and $12.7 million at December 31, 2023 and 2022, respectively.
We are subject to environmental regulation by federal, state and local authorities. Due to the inherent uncertainties surrounding the development of federal and state environmental laws and regulations, we cannot determine with specificity the impact such laws and regulations may have on our existing and future facilities. With the trend toward stricter standards, greater regulation and more extensive permit requirements for the types of assets operated by us, our environmental expenditures could increase in the future, and such expenditures may not be fully recovered by insurance or recoverable in rates from our customers, and those costs may adversely affect our financial condition, results of operations and cash flows. We do not expect expenditures for these matters to have a material adverse effect on our financial condition, results of operations or cash flows.
Pipeline Safety - We are subject to PHMSA regulations, including integrity-management regulations. PHMSA regulations require pipeline companies operating high-pressure transmission pipelines to perform integrity assessments on pipeline segments that pass through densely populated areas or near specifically designated HCAs. In January 2012, the Pipeline Safety, Regulatory Certainty and Job Creation Act was signed into law. The law increased maximum penalties for violating federal pipeline safety regulations and directs the DOT and the Secretary of Transportation to conduct further review or studies on issues that may or may not be material to us. These issues include, but are not limited to, the following:
•an evaluation of whether natural gas pipeline integrity-management requirements should be expanded beyond current HCAs;
•a verification of records for pipelines in class 3 and 4 locations and HCAs to confirm MAOPs; and
•a requirement to test previously untested pipelines operating above 30 percent yield strength in HCAs.
In April 2016, PHMSA published a NPRM, the Safety of Gas Transmission & Gathering Lines Rule, in the Federal Register to revise pipeline safety regulations applicable to the safety of onshore natural gas transmission and gathering pipelines. Proposals included changes to pipeline integrity management requirements and other safety-related requirements. The NPRM comment period ended July 7, 2016, and comments were reviewed by PHMSA. As part of the comment review process, PHMSA was advised by the Technical Pipeline Safety Standards Committee, informally known by PHMSA as the GPAC, a statutorily mandated advisory committee that advises PHMSA on proposed safety policies for natural gas pipelines. The GPAC reviews PHMSA's proposed regulatory initiatives to assure the technical feasibility, reasonableness, cost-effectiveness and practicality of each proposal. The GPAC met six times since January 2017 to review public comments and make recommendations to PHMSA. The GPAC completed their review of the NPRM on March 28, 2018, except for gas gathering pipelines. The GPAC met in June 2019 on gas gathering pipelines. In addition to reviewing public and committee comments, PHMSA announced they would split this NPRM into three separate final rulemakings:
•the first final rule addresses the legislative mandates from the Pipeline Safety, Regulatory Certainty and Jobs Creation Act and is called the Safety of Gas Transmission Pipelines: MAOP Reconfirmation, Expansion of Assessment Requirements, and Other Related Amendments;
•the second final rule will be called the Safety of Gas Transmission Pipelines: Repair Criteria, Integrity Management Improvements, Cathodic Protection, Management of Change, and Other Related Amendments and will cover all remaining elements of the NPRM (except for gas gathering pipelines); and
•the third final rule will be called the Safety of Gas Gathering Pipelines and will address gas gathering pipelines.
A significant number of recommendations have been made to PHMSA to improve the NPRM. The industry trade associations filed joint comments to the “legislative mandates” rulemaking to amend the federal safety regulations applicable to gas transmission and gathering pipelines.
On October 1, 2019, PHMSA published the first of the three final rules referenced above, which addressed the 2011 congressional mandates. This final rule expands integrity management principles beyond HCAs and requires operators to collect traceable, verifiable and complete records moving forward, retain existing and new records for the life of the pipeline, and reconfirm pipeline MAOP in populated areas. The final rule also outlines methods for reconfirming a pipeline’s MAOP within 15 years. The first final rule became effective July 1, 2020. The estimated capital and operating expenditures associated with compliance with the first final rule were not material.
PHMSA has not yet issued the second final rule. The potential capital and operating expenditures associated with compliance with this rule are currently being evaluated and could be significant depending on the final regulations. We do not expect to be impacted by the third final rule, as we do not own gas gathering pipelines.
Air and Water Emissions - The Clean Air Act, the Clean Water Act, analogous state laws and/or regulations promulgated thereunder, impose restrictions and controls regarding the discharge of pollutants into the air and water in the United States. Under the Clean Air Act, a federally enforceable operating permit is required for sources of significant air emissions. We may be required to incur certain capital expenditures for air-pollution-control equipment in connection with obtaining or maintaining permits and approvals for sources of air emissions. We do not expect that these expenditures will have a material impact on our respective results of operations, financial position or cash flows. The Clean Water Act imposes substantial potential liability for the removal of pollutants discharged to waters of the United States and remediation of waters affected by such discharge.
International, federal, regional and/or state legislative and/or regulatory initiatives may attempt to regulate greenhouse gas emissions. We monitor relevant legislation and regulatory initiatives to assess the potential impact on our operations. The EPA’s Mandatory Greenhouse Gas Reporting Rule requires annual greenhouse gas emissions reporting as carbon dioxide equivalents from affected facilities and for the natural gas delivered by us to our natural gas distribution customers who are not otherwise required to report their own emissions. The additional cost to gather and report this emission data did not have, and we do not expect it to have, a material impact on our results of operations, financial position or cash flows. In addition, Congress has considered, and may consider in the future, legislation to reduce greenhouse gas emissions, including carbon dioxide and methane. Likewise, the EPA may institute additional regulatory rulemaking associated with greenhouse gas emissions. At this time, no rule or legislation has been enacted for natural gas distribution that assesses any costs, fees or expenses on any of these emissions.
CERCLA - CERCLA, also commonly known as Superfund, imposes strict, joint and several liability, without regard to fault or the legality of the original act, on certain classes of “persons” (defined under CERCLA) that caused and/or contributed to the release of a hazardous substance into the environment. These persons include, but are not limited to, the owner or operator of a facility where the release occurred and/or companies that disposed or arranged for the disposal of the hazardous substances found at the facility. Under CERCLA, these persons may be liable for the costs of cleaning up the hazardous substances released into the environment, damages to natural resources and the costs of certain health studies. We do not expect that our responsibilities under CERCLA will have a material impact on our respective results of operations, financial position or cash flows.
Pipeline Security - The U.S. Department of Homeland Security’s Transportation Security Administration issued updated pipeline security guidelines in March 2018. Our pipeline facilities have been reviewed according to the current guidelines and no material changes have been required to date.
Environmental Footprint - Our environmental and climate change strategy focuses on taking steps to minimize the impact of our operations on the environment. These strategies include: (1) developing and maintaining an accurate greenhouse gas emissions inventory according to current rules issued by the EPA; (2) improving the integrity of our pipelines; (3) following developing technologies for emission control; (4) promoting end-use conservation through programs that incentivize the use of high-efficiency equipment; and (5) reducing the loss of methane from our facilities. In addition, RNG and hydrogen technologies offer potential opportunities to secure new natural gas supply sources that could be transported on our pipeline system and reduce greenhouse gas emissions.
We participate in the EPA’s Natural Gas STAR Program to voluntarily reduce methane emissions. We continue to focus on maintaining low rates of lost-and-unaccounted-for natural gas through expanded implementation of best practices to limit the release of natural gas during pipeline and facility maintenance and operations. Additionally, in March 2016, we were one of 40 founding partners to launch the EPA’s Natural Gas STAR Methane Challenge Program, whereby oil and natural gas companies agree to promote and track commitments to reduce methane emissions beyond what is federally required. Our Methane Challenge Program commitment to annually replace or rehabilitate at least two percent of our combined inventory of cast iron and noncathodically-protected steel pipe aligns with our planned system integrity expenditures for infrastructure replacements. We exceeded our goal by achieving an overall replacement rate greater than two percent annually in 2016, 2017, 2018, and 2019 and anticipate reporting on our 2020 progress in 2021.
In September 2020, we announced membership in Our Nation’s Energy Future (ONE Future), a group of natural gas companies working together to voluntarily reduce methane emissions across the natural gas value chain to one percent or less by 2025. In its most recent report, ONE Future reported that its members registered a 2019 methane intensity of 0.334%.
Additional information about our environmental matters is included in the section entitled Environmental Matters in Note 17 of the Notes to Consolidated Financial Statements in this Annual Report. We cannot assure that existing environmental statutes and regulations will not be revised or that new regulations will not be adopted or become applicable to us. Revised or additional regulations that result in increased compliance costs or additional operating restrictions could have a material adverse effect on our business, financial condition and results of operations. Our expenditures for environmental investigation, and remediation
compliance to-date have not been significant in relation to our financial position, results of operations or cash flows, and our expenditures related to environmental matters had no material effects on earnings or cash flows during 2020, 2019,2023, 2022 or 2018.2021.
Pipeline Safety - We are subject to regulation under federal pipeline safety statutes and any analogous state regulations. These include safety requirements for the design, construction, operation, and maintenance of pipelines, including transmission and distribution pipelines. At the federal level, we are regulated by PHMSA. PHMSA regulations require the following for certain pipelines: inspection and maintenance plans; integrity management programs, including the determination of pipeline integrity risks and periodic assessments on certain pipeline segments; an operator qualification program, which includes certain trainings; a public awareness program that provides certain information; and a control room management plan.
As part of the Consolidated Appropriations Act, 2021, the PIPES Act reauthorized PHMSA through 2023 and directed the agency to move forward with several regulatory actions, including the “Pipeline Safety: Class Location Change Requirements” and the “Pipeline Safety: Safety of Gas Transmission and Gathering Pipelines” proposed rulemakings. Congress has also instructed PHMSA to issue final regulations that will require operators of non-rural gas gathering lines and new and existing transmission and distribution pipeline facilities to conduct certain leak detection and repair programs and to require facility inspection and maintenance plans to align with those regulations. To the extent such rulemakings impose more stringent requirements on our facilities, we may be required to incur expenditures that may be material.
Regulatory - Several regulatory initiatives impacted the earnings and future earnings potential of our business. See additional information regarding our regulatory initiatives in the “Regulatory Activities” insection of Management’s Discussion and Analysis of Financial Condition and Results of Operations.
IMPACT OF NEW ACCOUNTING STANDARDS
Information about the impact of new accounting standards, if any, is included in Note 1 of the Notes to Consolidated Financial Statements in this Annual Report.
CRITICAL ESTIMATES AND CRITICAL ACCOUNTING POLICIES
The preparation of our consolidated financial statements and related disclosures in accordance with GAAP requires us to make estimates and assumptions with respect to values or conditions that cannot be known with certainty that affect the reported amounts of assets and liabilities and the disclosure of contingent assets and liabilities at the date of the consolidated financial statements. These estimates and assumptions also affect the reported amounts of revenuerevenues and expenses during the reporting period. Although we believe these estimates and assumptions are reasonable, actual results could differ from our estimates. See our Risk Factors and/or Forward-Looking Statements for factors which could impact our estimates.
The following summary sets forth what we consider to be our most critical estimates and accounting policies. Our critical accounting policies are defined as those estimates and policies most important to the portrayal of our financial condition and results of operations and that require management’s most difficult, subjective or complex judgment, particularly because of the need to make estimates concerning the impact of inherently uncertain matters.
Regulation - Our operations are subject to regulation with respect to rates, service, maintenance of pipeline and accounting records and various other matters by the respective regulatory authorities in the states in which we operate. We account for the financial effects of the ratemaking and accounting practices and policies of the various regulatory commissionsauthorities in our consolidated financial statements. We record regulatory assets for costs that have been deferred for which future recovery through customer rates is considered probable and regulatory liabilities when it is probable that revenues will be reduced for amounts that will be returned to customers through the ratemaking process. As a result, certain costs that would normally be expensed under GAAP are capitalized or deferred on the balance sheet because it is probable they can be recovered through rates. Discontinuing the application of this method of accounting for regulatory assets and liabilities could significantly increase our operating expenses, as fewer costs would likely be capitalized or deferred on the balance sheet, which could reduce our net income. Further, regulation may impact the period in which revenues or expenses are recognized. The amounts to be recovered or recognized are based upon historical experience and our understanding of the regulations. The impact of regulation on our operations may be affected by decisions of the regulatory authorities or the issuance of new regulations.
For further discussion of regulatory assets and liabilities, see Note 113 of the Notes to Consolidated Financial Statements in this Annual Report.
Revenue Recognition - For regulated deliveries of natural gas, we read meters and bill customers on a monthly cycle. We recognize revenues upon the delivery of natural gas commodity or services rendered to customers. The billing cycles for customers do not necessarily coincide with the accounting periods used for financial reporting purposes. We accrue unbilled revenues for natural gas that has been delivered but not yet billed at the end of an accounting period. Accrued unbilled revenue is based on a percentage estimate of amounts unbilled each month, which is dependent upon a number of factors, some of which require management’s judgment. These factors include customer consumption patterns and the impact of weather on usage. The accrued unbilled natural gas sales revenue at December 31, 20202023 and 20192022 was $144.9$191.4 million and $109.7$269.5 million, respectively, and is included in accounts receivable on our Consolidated Balance Sheets.consolidated balance sheets.
We adopted ASC 606 which clarifies the revenue recognition principles under GAAP for our interim and annual reports beginning in the first quarter 2018, using the modified retrospective method. We evaluated all of our sources of revenue to determine the potential effect of the new standard on our financial position, results of operations, cash flows and the related accounting policies and business processes. Upon adoption, there was no cumulative adjustment to our opening retained earnings. The only impact of adopting ASC 606 is that we reclassified certain revenues that do not meet the requirements under ASC 606 as revenues from contracts with customers, but will continue to be reflected as other revenues in determining total revenue. The items we reclassified relate primarily to the WNA mechanism in Kansas, where the KCC determines how we reflect variations in weather in our rates billed to customers.
We have determined the majority of our natural gas sales and transportation tariffs to be implied contracts with customers, which are settled over time, where our performance obligation is settled with our customer when natural gas is delivered and simultaneously consumed by the customer. In addition, we useduse the invoice method practical expedient, where we recognizedrecognize revenue for volumes delivered for which we have a right to invoice. For our other utility revenue, which are primarily one-time service fees that meet the requirements under ASC 606, the performance obligation is satisfied at a point in time when services are rendered to the customer. Certain revenues that do not meet the requirements under ASC 606 as revenues from contracts with customers are reflected as other revenues in determining total revenue. See Note 32 of the Notes to Consolidated Financial Statements in this Annual Report for additional information regarding our revenues.
Pension and Other Postemployment Benefits - We have defined benefit pension plans covering eligible retirees and full-timeeligible employees. We also sponsor welfare plans that provide other postemployment medical and life insurance benefits to eligible retirees and employees who retire with at least five years of service.
To calculate the expense and liabilities related to our plans, we utilize an outside actuarial consultant, which uses statistical and other factors to anticipate future events. These factors include assumptions about the discount rate, expected return on plan assets, rate of future compensation increases, age and mortality and employment periods. We use tables issued by the Society of Actuaries to estimate mortality rates. In determining the projected benefit costs, assumptions can change from period to period and may result in material changes in the costs and liabilities we recognize.
We did not make any material contributionsFor the year ended December 31, 2023, we contributed $1.3 million to our defined benefit pension plan orplans and $2.5 million to our other postemployment benefit plans. For the year ended December 31, 2022, we contributed $1.5 million to our defined benefit pension plans in 2020.and $1.9 million to our other postemployment benefit plans. In 2021,2024, our contributions are expected to be $1.1$1.4 million to our defined benefit pension plans, and no contributions are expected to be made to our other postemployment benefit plans. In 2020, we paid $12.5 million of lump-sum settlements to certain terminated-vested participants in our defined benefit pension plan. In 2019, we purchased a group annuity contract and transferred approximately $49.2 million of liabilities related to certain participants in our defined benefit pension plan to a third-party insurance company.
We recorded net periodic benefit costscredits for our defined benefit pension plans, prior to regulatory deferrals, of $28.2$7.5 million in 2020,2023, and estimate that in 2021,2024, we will record expensesa credit of approximately $26.4$5.5 million. Net periodic benefits costs for our postemployment benefit plans, prior to regulatory deferrals, were $0.3 million in 2023, and we estimate that in 2024, we will record a credit of $6.2 million in 2020, and estimate that in 2021, we will record credits of approximately $8.9$0.4 million, prior to regulatory deferrals.
The following table sets forth the significant assumptions used to determine our estimated 20212024 net periodic benefit cost related to our defined benefit pension and other postemployment benefit plans and sensitivity to changes with respect to these assumptions:
| | | | | | | | | | | | | | | | | | | | |
| | | Rate Used | | Cost
Sensitivity (a) | | Obligation
Sensitivity (b) |
| | | | (Millions of dollars) |
| Discount rate for pension | | 2.80% | | $ | 3.6 | | | $ | 37.1 | |
| Discount rate for other postemployment benefits | | 2.70% | | $ | (0.2) | | | $ | 6.5 | |
| Expected long-term return on plan assets (c) | | 7.15%/7.50% | | $ | 2.8 | | | $ | — | |
| | | | | | | | | | | | | | | | | | | | |
| | | Rate Used | | Cost
Sensitivity (a) | | Obligation
Sensitivity (b) |
| | | | (Millions of dollars) |
| Discount rate for pension | | 5.30 | % | | $ | 2.3 | | | $ | 21.3 | |
| Discount rate for other postemployment benefits | | 5.40 | % | | (0.2) | | | 3.4 | |
| Expected long-term return on plan assets for pension | | 6.70 | % | | 2.2 | | | — | |
| Expected long-term return on plan assets for other postemployment benefits | | 5.20 | % | | 0.4 | | | — | |
(a) Approximate impact a quarter percentage point decrease in the assumed rate would have on net periodic pension costs.(b) Approximate impact a quarter percentage point decrease in the assumed rate would have on defined benefit pension obligation.
(c) Expected long-term return on plan assets for pension and other postemployment benefits are 7.15 percent and 7.50 percent, respectively.
Impairment of Goodwill-We assess our goodwill for impairment at least annually as of July 1, unless events of change in circumstances indicate an impairment may have occurred before that time. Goodwill impairment reviews are performed at a reporting unit level, which for ONE Gas equates to our single business segment. Our goodwill impairment analysis, performed in 2020 and 2018, utilized a qualitative assessment and did not result in any impairment indicators, nor did our analysis reflect our reporting unit at risk. Additionally, we performed a quantitative analysis in 2019 which did not result in any impairment indicators. Subsequent to July 1, 2020, no event has occurred indicating that our fair value is less than the carrying value of our net assets.
As part of our goodwill impairment test, we first assess qualitative factors (including macroeconomic conditions, industry and market considerations, cost factors and overall financial performance) to determine whether it is more likely than not that our fair value is less than the carrying amount of our net assets. If further testing is necessary or a quantitative test is elected to refresh our recurring qualitative assessment, we perform an impairment test for goodwill. Our impairment test is made by comparing our fair value with our book value, including goodwill. If the fair value is less than the book value, an impairment is measured by the amount of our carrying value that exceeds our fair value, not to exceed the carrying amount of our goodwill.
To estimate our fair value, we use two generally accepted valuation approaches, an income approach and a market approach, using assumptions consistent with a market participant’s perspective. Under the income approach, we use anticipated cash flows over a period of years plus a terminal value and discount these amounts to their present value using appropriate discount rates. Under the market approach, we apply acquisition multiples to forecasted cash flows. The acquisition multiples used are consistent with historical market transactions. The forecasted cash flows are based on average forecasted cash flows over a period of years.
Our impairment tests require the use of assumptions and estimates, such as industry economic factors and the profitability of future business strategies. If actual results are not consistent with our assumptions and estimates or our assumptions and estimates change due to new information, we may be exposed to future impairment charges.
See Note 111 of the Notes to Consolidated Financial Statements in this Annual Report for further discussion of goodwill.additional information regarding our pension and other postretirement benefit plans.
Contingencies - Our accounting for contingencies covers a variety of business activities, including contingencies for legal and environmental exposures. We accrue these contingencies when our assessments indicate that it is probable that a liability has been incurred or an asset will not be recovered and an amount can be reasonably estimated. We expense legal fees as incurred and base our legal liability estimates on currently available facts and our assessments of the ultimate outcome or resolution. Accruals for estimated losses from environmental remediation obligations generally are recognized no later than the completion of a remediation feasibility study. Recoveries of environmental remediation costs from other parties are recorded as assets when their receipt is deemed probable. In 2020, we submitted a remediation plan to the KDHE for one of our sites and the KDHE has provided comments that we are addressing. We are also working on a remediation plan that will be submitted to the KDHE in 2021 for an additional site. As a result of our work to investigate and remediate the environmental impacts of our MGP sites in 2020, we estimated the potential costs associated with additional investigation and remediation to be in the range of $9.1 million to $23.3 million. A single reliable estimate of the remediation costs for these sites was not feasible due to the amount of uncertainty in the ultimate remediation approach that will be utilized. Accordingly, in 2020, we recorded an adjustment to our reserve of $9.1 million, which also increased our regulatory asset pursuant to our AAO in Kansas, as we believe recovery of these costs is probable through our existing AAO or future regulatory filings. At December 31, 2020 and 2019, the reserve for remediation of our MGP sites was $14.5 million and $5.8 million, respectively.
We have an AAO that allows Kansas Gas Service to defer and seek recovery of costs necessary for investigation and remediation at, and nearby, these 12 former MGP sites that are incurred after January 1, 2017, up to a cap of $15.0 million, net of any related insurance recoveries. Costs approved for recovery in a future rate proceeding would then be amortized over a 15-year period. The unamortized amounts will not be included in rate base or accumulate carrying charges. Following a determination that future investigation and remediation work approved by the KDHE is expected to exceed $15.0 million, net of any related insurance recoveries, Kansas Gas Service will be required to file an application with the KCC for approval to increase the $15.0 million cap. At December 31, 2020 and 2019, we have deferred $18.8 million and $9.8 million, respectively, for accrued investigation and remediation costs pursuant to our AAO.
Our expenditures for environmental evaluation, mitigation, remediation and compliance to date have not been significant in relation to our financial position, or results of operations or cash flows, and our expenditures related to environmental matters had no material effect on earnings or cash flows for 2020, 2019 or 2018.the years ended December 31, 2023, 2022 and 2021. Environmental issues may exist with respect to these MGP sites that are unknown to us. Accordingly, future costs are dependent on the final determination and regulatory approval of any remedial actions, the complexity of the site, level of remediation required, changing technology and governmental regulations, and to the extent not recovered by insurance or recoverable in rates from our customers, could be material to our financial condition, results of operations or cash flows.
See “Environmental Matters” and Note 1715 of the Notes to Consolidated Financial Statements in this Annual Report for additional discussion of contingencies.
CONTRACTUAL OBLIGATIONS
The following table sets forth our contractual obligations at December 31, 2020:
| | | | | | | | | | | | | | | | | | | | | | | | | | | | | | | | | | | | | | | | | | | | |
| Contractual Obligations |
| | (Millions of dollars) |
| | 2021 | | 2022 | | 2023 | | 2024 | | 2025 | | Thereafter | | Total |
| Long-term debt, including current maturities | | $ | — | | | $ | — | | | $ | — | | | $ | 300.0 | | | $ | — | | | $ | 1,301.3 | | | $ | 1,601.3 | |
| Commercial paper | | 418.2 | | | — | | | — | | | — | | | — | | | — | | | 418.2 | |
| Interest payments on long-term debt | | 62.9 | | | 62.9 | | | 62.9 | | | 52.9 | | | 52.0 | | | 946.0 | | | 1,239.6 | |
| Firm transportation and storage capacity contracts | | 175.6 | | | 135.0 | | | 98.9 | | | 49.5 | | | 36.8 | | | 35.5 | | | 531.3 | |
| Natural gas purchase commitments | | 141.3 | | | — | | | — | | | — | | | — | | | — | | | 141.3 | |
| Operating leases | | 7.9 | | | 7.4 | | | 6.2 | | | 4.7 | | | 4.1 | | | 11.0 | | | 41.3 | |
| Total | | $ | 805.9 | | | $ | 205.3 | | | $ | 168.0 | | | $ | 407.1 | | | $ | 92.9 | | | $ | 2,293.8 | | | $ | 3,973.0 | |
Long-term debt, commercial paper borrowings and interest payments on debt - Long-term debt includes our four debt issuances at their due dates. Interest payments on debt are calculated by multiplying our long-term debt by the respective coupon rates.
On February 22, 2021, we entered into the ONE Gas 2021 Term Loan Facility to enhance our liquidity position as part of the financing of our natural gas purchases in order to provide sufficient liquidity to satisfy our obligations as a result of the 2021 winter weather event and the repayment of indebtedness.
Firm transportation and storage contracts - We are party to fixed-price contracts providing us with firm transportation and storage capacity. The commitments associated with these contracts are recoverable through our purchased-gas cost mechanisms as allowed by the applicable regulatory authority.
Natural gas purchase commitments - We are party to fixed-price and variable-price contracts for the purchase of natural gas. Future variable-price natural gas purchase commitments are estimated based on market price information as of December 31, 2020. Actual future variable-price purchase commitments may vary depending on market prices at the time of delivery. As market information changes daily and is potentially volatile, these values may change significantly. The commitments associated with these contracts are recoverable through our purchased-gas cost mechanisms as allowed by the applicable regulatory authority.
Due to the historic winter weather event in February 2021, we experienced unforeseeable and unprecedented market pricing for gas costs in our Kansas, Oklahoma, and Texas jurisdictions, which resulted in aggregated natural gas purchases for the month of February of approximately $2.2 billion. These purchases are generally payable at the end of March 2021.
Operating leases - Our operating leases consist primarily of office facilities and IT leases. See Note 6 of the Notes to Consolidated Financial Statements in this Annual Report for discussion of leases.
FORWARD-LOOKING STATEMENTS
Some of the statements contained and incorporated in this Annual Report are forward-looking statements within the meaning of Section 27A of the Securities Act and Section 21E of the Exchange Act. The forward-looking statements relate to our anticipated financial performance, liquidity, management’s plans and objectives for our future operations, our business prospects, the outcome of regulatory and legal proceedings, market conditions and other matters. We make these forward-looking statements in reliance on the safe harbor protections provided under the Private Securities Litigation Reform Act of 1995. The following discussion is intended to identify important factors that could cause future outcomes to differ materially from those set forth in the forward-looking statements.
Forward-looking and other statements in this Annual Report regarding our environmental, social and other sustainability plans and goals are not an indication that these statements are necessarily material to investors or required to be disclosed in our filings with the SEC. In addition, historical, current, and forward-looking environmental, social and sustainability-related statements may be based on standards for measuring progress that are still developing, internal controls and processes that continue to evolve, and assumptions that are subject to change in the future.
Forward-looking statements include the items identified in the preceding paragraph, the information concerning possible or assumed future results of our operations and other statements contained or incorporated in this Annual Report identified by words such as “anticipate,” “estimate,” “expect,” “project,” “intend,” “plan,” “believe,” “should,” “goal,” “forecast,” “guidance,” “could,” “may,” “continue,” “might,” “potential,” “scheduled,” “likely,” and other words and terms of similar meaning.
One should not place undue reliance on forward-looking statements, which are applicable only as of the date of this Annual Report. Known and unknown risks, uncertainties and other factors may cause our actual results, performance or achievements
to be materially different from any future results, performance or achievements expressed or implied by forward-looking statements. Those factors may affect our operations, costs, liquidity, markets, products, services and prices. In addition to any assumptions and other factors referred to specifically in connection with the forward-looking statements, factors that could cause our actual results to differ materially from those contemplated in any forward-looking statement include, among others, the following:
•our ability to recover costs, (including operating costs and increased commodity costs related to the recent winter weather storm), income taxes and amounts equivalent to the cost of property, plant and equipment, regulatory assets and our allowed rate of return in our regulated rates;rates or other recovery mechanisms;
•cyber-attacks, which, according to experts, continue to increase in volume and sophistication, or breaches of technology systems that could disrupt our operations or result in the loss or exposure of confidential or sensitive customer, employee, vendor, counterparty or Company information; further, increased remote working arrangements have required enhancements and modifications to our IT infrastructure (e.g. Internet, Virtual Private Network, remote collaboration systems, etc.), and any failures of the technologies, including third-party service providers, that facilitate working remotely could limit our ability to conduct ordinary operations or expose us to increased risk or effect of an attack;
•our ability to manage our operations and maintenance costs;
•the concentration of our operations in Kansas, Oklahoma, and Texas;
•changes in regulation of natural gas distribution services, particularly those in Oklahoma, Kansas and Texas;
•regulations in local jurisdictions in which we operate authorizing utilities to record in a regulatory asset account or comparable account the expenses associated with the recent winter weather event, including but not limited to gas costs, other costs related to the procurement and transportation of gas supply and the associated financing costs;
•the economic climate and, particularly, its effect on the natural gas requirements of our residential and
commercial customers;
•the length and severity of a pandemic or other health crisis such as the outbreak of COVID-19, including the impact to our operations, customers, contractors, vendors and employees, and the measures that international, federal, state and local governments, agencies, law enforcement and/or health authorities implement to address it, which may (as with COVID-19) precipitate or exacerbate one or more of the above-mentioned and/or other risks, andcould significantly disrupt or prevent us from operating our business in the ordinary course for an extended period;
•competition from alternative forms of energy, including, but not limited to, electricity, solar power, wind power, geothermal energy and biofuels;
•conservation and energy efficiency efforts of our customers;
•adverse weather conditions and variations in weather, including seasonal effects on demand and/or supply, the occurrence of severe storms including the most recent unprecedented winter weather storm in the territories in which we operate, and climate change, and the related effects on supply, demand, and costs and disasters, and climate change;costs;
•indebtedness could make us more vulnerable to general adverse economic and industry conditions, limit our ability to borrow additional funds and/or place us at competitive disadvantage compared with competitors;
•our ability to secure reliable, competitively priced and flexible natural gas transportation and supply, including decisions by natural gas producers to reduce production or shut-in producing natural gas wells and expiration of existing supply and transportation and storage arrangements that are not replaced with contracts with similar terms and pricing;
•our ability to complete necessary or desirable expansion or infrastructure development projects, which may delay or prevent us from serving our customers or expanding our business;
•operationoperational and mechanical hazards or interruptions;
•adverse labor relations;
•the effectiveness of our strategies to reduce earnings lag, marginrevenue protection strategies and risk mitigation strategies, which may be affected by risks beyond our control such as commodity price volatility, counterparty performance or creditworthiness and interest rate risk;
•the capital-intensive nature of our business, and the availability of and access to, in general, funds to meet our debt obligations prior to or when they become due and to fund our operations and capital expenditures, either through (i) cash on hand, (ii) operating cash flow, or (iii) access to the capital markets and other sources of liquidity;
•our ability to raiseobtain capital to reduce the draw under the ONE Gas 2021 Term Loan Facility and/or repay a portion of the proceeds under the ONE Gas 2021 Term Loan Facility to reduce the costs of indebtedness;
•in light of ONE Gas recently entering into the ONE Gas 2021 Term Loan Facility, our ability to borrow additional funds, if needed, including raising the funds on commercially reasonable terms, or on terms acceptable to us, or at all;
•limitations on our operating flexibility, earnings and cash flows due to restrictions in our financing arrangements;
•cross-default provisions in our borrowing arrangements, which may lead to our inability to satisfy all of our outstanding obligations in the event of a default on our part;
•changes in the financial markets during the periods covered by the forward-looking statements, particularly those affecting the availability of capital and our ability to refinance existing debt and fund investments and acquisitions to execute our business strategy;
•actions of rating agencies, including the ratings of debt, general corporate ratings and changes in the rating agencies’ ratings criteria;
•changes in inflation and interest rates;
•our ability to recover the costs of natural gas purchased for our customers including related to the recent winter weather storms and any financingsrelated financing required to support our purchase of natural gas supply;
•impact of potential impairment charges;
•volatility and changes in markets for natural gas and our ability to secure additional and sufficient liquidity on reasonable commercial terms to cover costs associated with such volatility;
•possible loss of LDC franchises or other adverse effects caused by the actions of municipalities;
•payment and performance by counterparties and customers as contracted and when due, including our counterparties maintaining ordinary course terms of supply and payments;
•changes in existing or the addition of new environmental, safety, tax, cybersecurity and other laws or regulations to which we and our subsidiaries are subject, including those that may require significant expenditures, significant increases in operating costs or, in the case of noncompliance, substantial fines or penalties;
•the effectiveness of our risk-management policies and procedures, and employees violating our risk-management policies;
•the uncertainty of estimates, including accruals and costs of environmental remediation;
•advances in technology, including technologies that increase efficiency or that improve electricity’s competitive position relative to natural gas;
•population growth rates and changes in the demographic patterns of the markets we serve in Oklahoma, Kansas and Texas, and economic conditions in these areas’ housing markets;areas;
•acts of nature and the potential effects of threatened or actual terrorism and war;
•cyber-attacks, which, according to experts, have increasedwar, including recent events in volumeEurope and sophistication since the beginning of the COVID-19 pandemic, or breaches of technology systems that could disrupt our operations or result in the loss or exposure of confidential or sensitive customer, employee or Company information; further, increased remote working arrangements as a result of the pandemic have required enhancements and modifications to our IT infrastructure (e.g. Internet, Virtual Private Network, remote collaboration systems, etc.), and any failures of the technologies, including third-party service providers, that facilitate working remotely could limit our ability to conduct ordinary operations or expose us to increased risk or effect of an attack;Middle East;
•the sufficiency of insurance coverage to cover losses;
•the effects of our strategies to reduce tax payments;
•the effects of litigation and regulatory investigations, proceedings, including our rate cases, or inquiries and the requirements of our regulators as a result of the Tax Cuts and Jobs Act of 2017;
•changes in accounting standards;
•changes in corporate governance standards;
•discoveryexistence of material weaknesses in our internal controls;
•our ability to comply with all covenants in our indentures and the ONE Gas Credit Agreement, the ONE Gas 364-day Credit Agreement and the ONE Gas 2021 Term Loan Facility, a violation of which, if not cured in a timely manner, could trigger a default of our obligations;
•our ability to attract and retain talented employees, management and directors, and shortage of skilled-labor;
•unexpected increases in the costs of providing health care benefits, along with pension and postemployment health care benefits, as well as declines in the discount rates on, declines in the market value of the debt and equity securities of, and increases in funding requirements for, our defined benefit plans; and
•theour ability to successfully complete merger, acquisition or divestiture plans, regulatory or other limitations imposed as a result of a merger, acquisition or divestiture, and the success of the business following a merger, acquisition or divestiture.
These factors are not necessarily all of the important factors that could cause actual results to differ materially from those expressed in any of our forward-looking statements. Other factors could also have material adverse effects on our future results. These and other risks are described in greater detail in Part 1, Item 1A, Risk Factors, in this Annual Report. All forward-looking statements attributable to us or persons acting on our behalf are expressly qualified in their entirety by these factors. Other than as required under securities laws, we undertake no obligation to update publicly any forward-looking statement whether as a result of new information, subsequent events or change in circumstances, expectations or otherwise.
ITEM 7A. QUANTITATIVE AND QUALITATIVE DISCLOSURES ABOUT MARKET RISK
Our exposure to market risk discussed below includes forward-looking statements. Our views on market risk are not necessarily indicative of actual results that may occur and do not represent the maximum possible gains and losses that may occur since actual gains and losses will differ from those estimated based on actual fluctuations in commodity prices or interest rates and the timing of transactions.
Commodity Price Risk
Our commodity price risk, driven primarily by fluctuations in the price of natural gas, is mitigated by our purchased-gas cost adjustment mechanisms.mechanisms through which we pass-through natural gas costs to our customers without profit. We may use fixed-price natural gas contracts or derivative instruments to economically hedge the cost of a portion of our anticipated natural gas purchases during the winter heating months to reduce the impact on our customers of upward market price volatility of natural gas. Additionally, we inject natural gas into storage during the summerwarmer months, when natural gas prices are typically lower, and withdraw the natural gas during the winter heating season.colder months of the year. Gains or losses associated with these derivative instruments and the costs of our fixed-price natural gas contracts and storage activities are included in, and recoverable through our purchased-gas cost adjustment mechanisms, which are subject to review by regulatory authorities.
Interest-Rate Risk
We are exposed to interest-rate risk primarily associated with commercial paper borrowings, borrowings under our credit agreement, and new debt financing needed to fund capital requirements, including future contractual obligations and maturities
of long-term and short-term debt. We expect tomay manage interest-rate risk on future borrowings through the use of fixed-rate debt, floating-rate debt and, at times, interest-rate swaps. Fixed-rate swaps may be used to reduce our risk of increased interest costs during periods of rising interest rates. Floating-rate swaps may be used to convert the fixed rates of long-term borrowings into short-term variable rates.
Counterparty Credit Risk
We assess the creditworthiness of our customers. Those customers who do not meet minimum standards are required to provide security, including deposits andor other forms of collateral, when appropriate and allowed by tariff. With approximately 2.22.3 million customers across three states, we are not exposed materially to a concentration of credit risk. As ordered by our regulators, customer disconnects for nonpayment were suspended from mid-March through May 20, 2020, in Oklahoma, through May 31, 2020, in Kansas, and through December 31, 2020, in some areas of Texas. As of December 31, 2020, we have temporarily suspended disconnects for safety reasons in all of our jurisdictions due to the level of COVID-19 infection. Since the onset of the pandemic in the first quarter of 2020, we have experienced impacts on our results of operations including, but not limited to: lower late payment, reconnect and collection fees and incremental expenses for bad debts related to the suspensions of disconnects for nonpayment; incremental expenses for PPE, cleaning supplies, outside services and other expenses; and lower expenses for travel and employee training that have been impacted by the pandemic. We have received accounting orders in each of our jurisdictions authorizing us to accumulate and defer for regulatory purposes certain incremental costs incurred, including bad debt expenses, and certain lost revenues, net of offsetting expense reductions associated with COVID-19. Pursuant to these orders, the recovery of any net incremental costs and lost revenues will be determined in future rate cases or alternative rate recovery filings in each jurisdiction. For financial reporting purposes, any amounts deferred as a regulatory asset for future recovery under these accounting orders must be probable of recovery. At December 31, 2020, no regulatory assets have been recorded. We continue to evaluate the impacts of COVID-19 on our business and will record regulatory assets for financial reporting purposes at such time as recovery is deemed probable. We maintain a provision for doubtful accounts based upon factors surrounding the credit risk of customers, historical trends, consideration of the current credit environment and other information. We are able to recover the fuel-related portion of bad debts through our purchased-gas cost adjustment mechanisms.
ITEM 8. CONSOLIDATED FINANCIAL STATEMENTS AND SUPPLEMENTARY DATA
Report of Independent Registered Public Accounting Firm
To the Board of Directors and Shareholders of ONE Gas, Inc.
Opinions on the Financial Statements and Internal Control over Financial Reporting
We have audited the accompanying consolidated balance sheets of ONE Gas, Inc. and its subsidiaries (the “Company”) as of December 31, 20202023 and 2019,2022, and the related consolidated statements of income, of comprehensive income, of equity and of cash flows for each of the three years in the period ended December 31, 2020,2023, including the related notes (collectively referred to as the “consolidated financial statements”). We also have audited the Company's internal control over financial reporting as of December 31, 2020,2023, based on criteria established in Internal Control - Integrated Framework (2013) issued by the Committee of Sponsoring Organizations of the Treadway Commission (COSO).
In our opinion, the consolidated financial statements referred to above present fairly, in all material respects, the financial position of the Company as of December 31, 20202023 and 2019,2022, and the results of its operations and its cash flows for each of the three years in the period ended December 31, 20202023 in conformity with accounting principles generally accepted in the United States of America. Also in our opinion, the Company maintained, in all material respects, effective internal control over financial reporting as of December 31, 2020,2023, based on criteria established in Internal Control - Integrated Framework (2013) issued by the COSO.
Basis for Opinions
The Company's management is responsible for these consolidated financial statements, for maintaining effective internal control over financial reporting, and for its assessment of the effectiveness of internal control over financial reporting, included in Management'sManagement’s Report on Internal Control Overover Financial Reporting appearing under Item 9A. Our responsibility is to express opinions on the Company’s consolidated financial statements and on the Company's internal control over financial reporting based on our audits. We are a public accounting firm registered with the Public Company Accounting Oversight Board (United States) (PCAOB) and are required to be independent with respect to the Company in accordance with the U.S. federal securities laws and the applicable rules and regulations of the Securities and Exchange Commission and the PCAOB.
We conducted our audits in accordance with the standards of the PCAOB. Those standards require that we plan and perform the audits to obtain reasonable assurance about whether the consolidated financial statements are free of material misstatement, whether due to error or fraud, and whether effective internal control over financial reporting was maintained in all material respects.
Our audits of the consolidated financial statements included performing procedures to assess the risks of material misstatement of the consolidated financial statements, whether due to error or fraud, and performing procedures that respond to those risks. Such procedures included examining, on a test basis, evidence regarding the amounts and disclosures in the consolidated financial statements. Our audits also included evaluating the accounting principles used and significant estimates made by management, as well as evaluating the overall presentation of the consolidated financial statements. Our audit of internal control over financial reporting included obtaining an understanding of internal control over financial reporting, assessing the risk that a material weakness exists, and testing and evaluating the design and operating effectiveness of internal control based on the assessed risk. Our audits also included performing such other procedures as we considered necessary in the circumstances. We believe that our audits provide a reasonable basis for our opinions.
Definition and Limitations of Internal Control over Financial Reporting
A company’s internal control over financial reporting is a process designed to provide reasonable assurance regarding the reliability of financial reporting and the preparation of financial statements for external purposes in accordance with generally accepted accounting principles. A company’s internal control over financial reporting includes those policies and procedures that (i) pertain to the maintenance of records that, in reasonable detail, accurately and fairly reflect the transactions and dispositions of the assets of the company; (ii) provide reasonable assurance that transactions are recorded as necessary to permit preparation of financial statements in accordance with generally accepted accounting principles, and that receipts and expenditures of the company are being made only in accordance with authorizations of management and directors of the
company; and (iii) provide reasonable assurance regarding prevention or timely detection of unauthorized acquisition, use, or disposition of the company’s assets that could have a material effect on the financial statements.
Because of its inherent limitations, internal control over financial reporting may not prevent or detect misstatements. Also, projections of any evaluation of effectiveness to future periods are subject to the risk that controls may become inadequate because of changes in conditions, or that the degree of compliance with the policies or procedures may deteriorate.
Critical Audit Matters
The critical audit matter communicated below is a matter arising from the current period audit of the consolidated financial statements that was communicated or required to be communicated to the audit committee and that (i) relates to accounts or disclosures that are material to the consolidated financial statements and (ii) involved our especially challenging, subjective, or complex judgments. The communication of critical audit matters does not alter in any way our opinion on the consolidated financial statements, taken as a whole, and we are not, by communicating the critical audit matter below, providing a separate opinion on the critical audit matter or on the accounts or disclosures to which it relates.
Accounting for the Effects of New, or Changes in Existing, Rate RegulationRegulatory Matters
As described in NotesNote 1 and 113 to the consolidated financial statements, total regulatory assets and total regulatory liabilities are approximately $424 million and $563 million, respectively, as of December 31, 2020. Thethe Company is subject to rate regulation and accounting requirements of regulatory authorities in the states in which it operates, and it follows the accounting and reporting guidance for regulated operations.operations, including evaluating regulatory decisions to determine appropriate revenue recognition, cost deferrals, recoverability for regulatory assets and refund requirements for regulatory liabilities. As disclosed by management, regulatory assets are recorded for costs that have been deferred for which future recovery through customer rates is considered probable and regulatory liabilities are recorded when it is probable that revenues will be reduced for amounts that will be credited to customers through the ratemaking process. As a result, certain costs that would normally be expensed under accounting principles generally accepted in the United States of America for non-regulated entities are capitalized or deferred on the balance sheet because it is probable they can be recovered through rates. The amounts to be recovered or recognized are based upon historical experience and management’s understanding of regulations and may be affected by decisions of the regulatory authorities or the issuance of new regulations. Should recovery cease due to regulatory actions, certain regulatory assets may no longer meet the criteria for recognition, and accordingly, the Company may be required to write off the regulatory assets at that time. As described in Note 3, as of December 31, 2023, there were $363 million of deferred costs included in regulatory assets and $567 million of regulatory liabilities awaiting cash outflow or potential refund.
The principal considerations for our determination that performing procedures relating to the Company’s accounting for the effects of rate regulationregulatory matters is a critical audit matter are (i) the significant judgment by management when assessingin evaluating the impact of regulationregulatory orders and accounting guidance on accounting for newrelevant transactions and existing regulatory assets and liabilities, which in turn led to significant(ii) a high degree of auditor judgment, subjectivity, and subjectivityeffort in performing procedures and evaluating audit evidence related to the accounting for the impactmanagement’s evaluation of revenue recognition, cost deferrals, and recoverability of regulatory proceedings on newassets, including the securitization of the costs related to the winter weather event and existingthe recovery of the related regulatory assets, and refund requirements for regulatory liabilities.
Addressing the matter involved performing procedures and evaluating audit evidence in connection with forming our overall opinion on the consolidated financial statements. These procedures included testing the effectiveness of controls relating to the assessmentimpact of new rate regulation or changes to existing regulation,regulatory orders and accounting guidance on relevant transactions, including controls over management’s process for evaluating and recording (i) deferred costs, including the amounts to be deferred and the future recovery, resulting in regulatory assets or (ii) a reduction to revenues for amounts that will be credited to customers, resulting in regulatory liabilities. These procedures also included, among others, (i) obtaining and evaluating management’s process for identifying relevant transactions which require application of regulatory rate orders, including correspondence between the Company and regulators,accounting guidance; (ii) assessingevaluating the reasonableness of management’s judgmentsassessment regarding new or updatedrevenue recognition, probability of recovery and establishment of regulatory guidance and proceedingsassets, including the securitization of the costs related to the winter weather event and the recovery of the related accounting implications,regulatory assets, and the establishment of regulatory liabilities; and (iii) testing the regulatory assets and regulatory liabilities based onconsidering the provisions and formulas outlined in regulatoryrate orders and other regulatory correspondence.
/s/ PricewaterhouseCoopers LLP
Tulsa, Oklahoma
February 26, 202122, 2024
We have served as the Company’s auditor since 2013.
| | | | | | | | | | | | | | | | | | | | |
| ONE Gas, Inc. | | | | | | |
| CONSOLIDATED STATEMENTS OF INCOME | | | | | | |
| | | | | | |
| | | Years Ended December 31, |
| | | 2020 | | 2019 | | 2018 |
| | (Thousands of dollars, except per share amounts) |
| | | | | | |
| Total revenues | | $ | 1,530,268 | | | $ | 1,652,730 | | | $ | 1,633,731 | |
| | | | | | |
| Cost of natural gas | | 537,445 | | | 687,974 | | | 714,636 | |
| | | | | | |
| Operating expenses | | | | | | |
| Operations and maintenance | | 431,115 | | | 429,126 | | | 411,702 | |
| Depreciation and amortization | | 194,881 | | | 180,395 | | | 160,086 | |
| General taxes | | 63,311 | | | 59,977 | | | 58,878 | |
| Total operating expenses | | 689,307 | | | 669,498 | | | 630,666 | |
| Operating income | | 303,516 | | | 295,258 | | | 288,429 | |
| Other expense, net | | (3,020) | | | (2,976) | | | (11,359) | |
| Interest expense, net | | (62,505) | | | (62,681) | | | (51,305) | |
| Income before income taxes | | 237,991 | | | 229,601 | | | 225,765 | |
| Income taxes | | (41,579) | | | (42,852) | | | (53,531) | |
| Net income | | $ | 196,412 | | | $ | 186,749 | | | $ | 172,234 | |
| | | | | | |
| Earnings per share | | | | | | |
| Basic | | $ | 3.70 | | | $ | 3.53 | | | $ | 3.27 | |
| Diluted | | $ | 3.68 | | | $ | 3.51 | | | $ | 3.25 | |
| | | | | | |
Average shares (thousands) | | | | | | |
| Basic | | 53,133 | | | 52,895 | | | 52,693 | |
| Diluted | | 53,370 | | | 53,240 | | | 53,029 | |
| Dividends declared per share of stock | | $ | 2.16 | | | $ | 2.00 | | | $ | 1.84 | |
See accompanying Notes to Consolidated Financial Statements.
| | | | | | | | | | | | | | | | | | | | |
| ONE Gas, Inc. | | | | | | |
| CONSOLIDATED STATEMENTS OF COMPREHENSIVE INCOME | | | | | | |
| | | | | | | |
| | | Years Ended December 31, |
| | 2020 | | 2019 | | 2018 |
| | | (Thousands of dollars) |
| Net income | | $ | 196,412 | | | $ | 186,749 | | | $ | 172,234 | |
| Other comprehensive income (loss), net of tax | | | | | | |
| Change in pension and other postemployment benefit plans liability, net of tax of $289, $479, and $(848), respectively | | (1,038) | | | (1,435) | | | 1,407 | |
| | | | | | |
| Total other comprehensive income (loss), net of tax | | (1,038) | | | (1,435) | | | 1,407 | |
| Comprehensive income | | $ | 195,374 | | | $ | 185,314 | | | $ | 173,641 | |
See accompanying Notes to Consolidated Financial Statements.
| | | | | | | | | | | | | | |
| ONE Gas, Inc. | | | | |
| CONSOLIDATED BALANCE SHEETS | | | | |
| | | | |
| | | December 31, | | December 31, |
| | | 2020 | | 2019 |
| Assets | | (Thousands of dollars) |
| Property, plant and equipment | | | | |
| Property, plant and equipment | | $ | 6,838,603 | | | $ | 6,433,119 | |
| Accumulated depreciation and amortization | | 1,971,546 | | | 1,867,893 | |
| Net property, plant and equipment | | 4,867,057 | | | 4,565,226 | |
| Current assets | | | | |
| Cash and cash equivalents | | 7,993 | | | 17,853 | |
| Accounts receivable, net | | 292,985 | | | 250,012 | |
| Materials and supplies | | 52,766 | | | 55,732 | |
| | | | |
| Natural gas in storage | | 93,946 | | | 104,259 | |
| Regulatory assets | | 56,773 | | | 47,440 | |
| Other current assets | | 35,406 | | | 30,906 | |
| Total current assets | | 539,869 | | | 506,202 | |
| Goodwill and other assets | | | | |
| Regulatory assets | | 366,956 | | | 391,036 | |
| Goodwill | | 157,953 | | | 157,953 | |
| Other assets | | 96,877 | | | 87,883 | |
| Total goodwill and other assets | | 621,786 | | | 636,872 | |
| Total assets | | $ | 6,028,712 | | | $ | 5,708,300 | |
See accompanying Notes to Consolidated Financial Statements.
| | | | | | | | | | | | | | |
| ONE Gas, Inc. | | | | |
| CONSOLIDATED BALANCE SHEETS | | | | |
| (Continued) | | | | |
| | | December 31, | | December 31, |
| | | 2020 | | 2019 |
| Equity and Liabilities | | (Thousands of dollars) |
| Equity and long-term debt | | | | |
Common stock, $0.01 par value: authorized 250,000,000 shares; issued and outstanding 53,166,733 shares at December 31, 2020; issued and outstanding 52,771,749 shares at December 31, 2019 | | $ | 532 | | | $ | 528 | |
| Paid-in capital | | 1,756,921 | | | 1,733,092 | |
| Retained earnings | | 483,635 | | | 402,509 | |
| Accumulated other comprehensive loss | | (7,777) | | | (6,739) | |
| | | | |
| Total equity | | 2,233,311 | | | 2,129,390 | |
| Long-term debt, excluding current maturities, and net of issuance costs of $13,159 and $10,936, respectively | | 1,582,428 | | | 1,286,064 | |
| Total equity and long-term debt | | 3,815,739 | | | 3,415,454 | |
| Current liabilities | | | | |
| | | | |
| Notes payable | | 418,225 | | | 516,500 | |
| Accounts payable | | 152,313 | | | 120,490 | |
| | | | |
| Accrued taxes other than income | | 63,800 | | | 47,956 | |
| | | | |
| Regulatory liabilities | | 15,761 | | | 45,201 | |
| Customer deposits | | 68,028 | | | 57,987 | |
| Other current liabilities | | 78,952 | | | 84,603 | |
| Total current liabilities | | 797,079 | | | 872,737 | |
| Deferred credits and other liabilities | | | | |
| Deferred income taxes | | 656,806 | | | 682,632 | |
| Regulatory liabilities | | 547,563 | | | 503,518 | |
| Employee benefit obligations | | 97,637 | | | 115,657 | |
| Other deferred credits | | 113,888 | | | 118,302 | |
| Total deferred credits and other liabilities | | 1,415,894 | | | 1,420,109 | |
| Commitments and contingencies | | 0 | | 0 |
| Total liabilities and equity | | $ | 6,028,712 | | | $ | 5,708,300 | |
See accompanying Notes to Consolidated Financial Statements.
This page intentionally left blank.
| | | | | | | | | | | | | | | | | | | | | | | | |
| ONE Gas, Inc. | | | | | | | | | | |
| CONSOLIDATED STATEMENTS OF INCOME | | | | | | | | | | |
| | | | |
| | | | | Years Ended December 31, |
| | | | | | 2023 | | 2022 | | 2021 |
| | | | | | (Thousands of dollars, except per share amounts) |
| | | | | | | | | | |
| Total revenues | | | | | | $ | 2,371,990 | | | $ | 2,578,005 | | | $ | 1,808,597 | |
| | | | | | | | | | |
| Cost of natural gas | | | | | | 1,134,510 | | | 1,459,087 | | | 775,006 | |
| | | | | | | | | | |
| Operating expenses | | | | | | | | | | |
| Operations and maintenance | | | | | | 508,399 | | | 472,265 | | | 449,676 | |
| Depreciation and amortization | | | | | | 279,830 | | | 228,479 | | | 207,233 | |
| General taxes | | | | | | 71,661 | | | 68,217 | | | 66,424 | |
| Total operating expenses | | | | | | 859,890 | | | 768,961 | | | 723,333 | |
| Operating income | | | | | | 377,590 | | | 349,957 | | | 310,258 | |
| Other income (expense), net | | | | | | 9,476 | | | (4,183) | | | (3,207) | |
| Interest expense, net | | | | | | (115,339) | | | (77,506) | | | (60,301) | |
| Income before income taxes | | | | | | 271,727 | | | 268,268 | | | 246,750 | |
| Income taxes | | | | | | (40,495) | | | (46,526) | | | (40,316) | |
| Net income | | | | | | $ | 231,232 | | | $ | 221,742 | | | $ | 206,434 | |
| | | | | | | | | | |
| Earnings per share | | | | | | | | | | |
| Basic | | | | | | $ | 4.16 | | | $ | 4.09 | | | $ | 3.85 | |
| Diluted | | | | | | $ | 4.14 | | | $ | 4.08 | | | $ | 3.85 | |
| | | | | | | | | | |
Average shares (thousands) | | | | | | | | | | |
| Basic | | | | | | 55,600 | | | 54,207 | | | 53,575 | |
| Diluted | | | | | | 55,860 | | | 54,338 | | | 53,674 | |
| | | | | | | | | | |
| Dividends declared per share of stock | | | | | | $ | 2.60 | | | $ | 2.48 | | | $ | 2.32 | |
| | | | | | | | | | |
See accompanying Notes to Consolidated Financial Statements.
| | | | | | | | | | | | | | | | | | | | |
| ONE Gas, Inc. | | | | | | |
| CONSOLIDATED STATEMENTS OF CASH FLOWS | | |
| | Years Ended December 31, |
| | | 2020 | | 2019 | | 2018 |
| | | (Thousands of dollars) |
| Operating activities | | | | | | |
| Net income | | $ | 196,412 | | | $ | 186,749 | | | $ | 172,234 | |
| Adjustments to reconcile net income to net cash provided by operating activities: | | | | | | |
| Depreciation and amortization | | 194,881 | | | 180,395 | | | 160,086 | |
| Deferred income taxes | | 18,485 | | | 13,307 | | | 53,242 | |
| Share-based compensation expense | | 9,803 | | | 9,314 | | | 8,195 | |
| Provision for doubtful accounts | | 15,450 | | | 8,994 | | | 8,506 | |
| Changes in assets and liabilities: | | | | | | |
| Accounts receivable | | (58,423) | | | 30,415 | | | 841 | |
| Materials and supplies | | 2,966 | | | (11,399) | | | (4,661) | |
| | | | | | |
| Natural gas in storage | | 10,313 | | | 3,036 | | | 22,859 | |
| Asset removal costs | | (40,833) | | | (47,784) | | | (52,855) | |
| Accounts payable | | 28,376 | | | (59,293) | | | 36,885 | |
| | | | | | |
| Accrued taxes other than income | | 15,844 | | | 316 | | | 6,316 | |
| | | | | | |
| Customer deposits | | 10,041 | | | (3,196) | | | 372 | |
| Regulatory assets and liabilities - current | | (38,773) | | | 3,787 | | | 72,716 | |
| Regulatory assets and liabilities - non-current | | 23,648 | | | 24,416 | | | 36,721 | |
| Employee benefit obligation | | (3,109) | | | (35,401) | | | (50,100) | |
| Other assets and liabilities - current | | (12,877) | | | 7,173 | | | (1,885) | |
| Other assets and liabilities - non-current | | (7,704) | | | (484) | | | (1,778) | |
| Cash provided by operating activities | | 364,500 | | | 310,345 | | | 467,694 | |
| Investing activities | | | | | | |
| Capital expenditures | | (471,345) | | | (417,322) | | | (394,450) | |
| Other investing expenditures | | (2,804) | | | (7,009) | | | 0 | |
| Other investing receipts | | 3,777 | | | 1,399 | | | 0 | |
| Cash used in investing activities | | (470,372) | | | (422,932) | | | (394,450) | |
| Financing activities | | | | | | |
| Borrowings (repayment) on notes payable, net | | (98,275) | | | 217,000 | | | (57,715) | |
| | | | | | |
| Issuance of debt, net of discounts | | 298,428 | | | 0 | | | 395,648 | |
| Long-term debt financing costs | | (2,885) | | | 0 | | | (4,324) | |
| Issuance of common stock | | 19,383 | | | 5,116 | | | 4,803 | |
| Repayment of long-term debt | | 0 | | | 0 | | | (300,000) | |
| Dividends paid | | (114,372) | | | (105,424) | | | (96,594) | |
| Tax withholdings related to net share settlements of stock compensation | | (6,267) | | | (7,575) | | | (8,152) | |
| Cash provided by (used in) financing activities | | 96,012 | | | 109,117 | | | (66,334) | |
| Change in cash and cash equivalents | | (9,860) | | | (3,470) | | | 6,910 | |
| Cash and cash equivalents at beginning of period | | 17,853 | | | 21,323 | | | 14,413 | |
| Cash and cash equivalents at end of period | | $ | 7,993 | | | $ | 17,853 | | | $ | 21,323 | |
| Supplemental cash flow information: | | | | | | |
| Cash paid for interest, net of amounts capitalized | | $ | 60,126 | | | $ | 61,160 | | | $ | 49,371 | |
| Cash paid (received) for income taxes, net | | $ | 30,361 | | | $ | 30,152 | | | $ | 800 | |
| | | | | | | | | | | | | | | | | | | | | | | | |
| ONE Gas, Inc. | | | | | | | | | | |
| CONSOLIDATED STATEMENTS OF COMPREHENSIVE INCOME | | | | | | | | | | |
| | | | | | | | |
| | | | | Years Ended December 31, |
| | | | |
| | | | | | 2023 | | 2022 | | 2021 |
| | | | | | (Thousands of dollars) |
| Net income | | | | | | $ | 231,232 | | | $ | 221,742 | | | $ | 206,434 | |
| Other comprehensive income, net of tax | | | | | | | | | | |
| Change in pension and other postemployment benefit plan liability, net of tax of $140, $(1,705), and $(379), respectively | | | | | | (478) | | | 5,823 | | | 1,250 | |
| Total other comprehensive income (loss), net of tax | | | | | | (478) | | | 5,823 | | | 1,250 | |
| Comprehensive income | | | | | | $ | 230,754 | | | $ | 227,565 | | | $ | 207,684 | |
See accompanying Notes to Consolidated Financial Statements.
| | | | | | | | | | | | |
| ONE Gas, Inc. | | | | |
| CONSOLIDATED STATEMENTS OF EQUITY | | | | |
| | | | |
| Common Stock Issued | Common Stock | Paid-in Capital | |
| | (Shares) | (Thousands of dollars) |
| | | | |
| January 1, 2018 | 52,598,005 | | $ | 526 | | $ | 1,737,551 | | |
| Net income | — | | 0 | | 0 | | |
| Other comprehensive income | — | | 0 | | 0 | | |
| Common stock issued and other | 0 | | 0 | | (10,951) | | |
| Common stock dividends - $1.84 per share | — | | 0 | | 892 | | |
| December 31, 2018 | 52,598,005 | | 526 | | 1,727,492 | | |
| Net income | — | | 0 | | 0 | | |
| Other comprehensive loss | — | | 0 | | 0 | | |
| Reclassification of stranded tax effects | — | | — | | — | | |
| Common stock issued and other | 173,744 | | 2 | | 4,697 | | |
| Common stock dividends - $2.00 per share | — | | 0 | | 903 | | |
| December 31, 2019 | 52,771,749 | | 528 | | 1,733,092 | | |
| Net income | — | | 0 | | 0 | | |
| Other comprehensive loss | — | | 0 | | 0 | | |
| Common stock issued and other | 394,984 | | 4 | | 22,915 | | |
| Common stock dividends - $2.16 per share | — | | 0 | | 914 | | |
| December 31, 2020 | 53,166,733 | | $ | 532 | | $ | 1,756,921 | | |
| | | | | | | | | | | | | | |
| ONE Gas, Inc. | | | | |
| CONSOLIDATED BALANCE SHEETS | | | | |
| | | | |
| | | December 31, | | December 31, |
| | 2023 | | 2022 |
| Assets | | (Thousands of dollars) |
| Property, plant and equipment | | | | |
| Property, plant and equipment | | $ | 8,468,967 | | | $ | 7,834,557 | |
| Accumulated depreciation and amortization | | 2,333,755 | | | 2,205,717 | |
| Net property, plant and equipment | | 6,135,212 | | | 5,628,840 | |
| Current assets | | | | |
| Cash and cash equivalents | | 18,835 | | | 9,681 | |
| Restricted cash and cash equivalents | | 20,552 | | | 8,446 | |
| Total cash, cash equivalents and restricted cash and cash equivalents | | 39,387 | | | 18,127 | |
| Accounts receivable, net | | 347,864 | | | 553,834 | |
| Materials and supplies | | 77,649 | | | 70,873 | |
| | | | |
| Natural gas in storage | | 187,097 | | | 269,205 | |
| Regulatory assets | | 75,308 | | | 275,572 | |
| | | | |
| Other current assets | | 37,899 | | | 29,997 | |
| Total current assets | | 765,204 | | | 1,217,608 | |
| Goodwill and other assets | | | | |
| Regulatory assets | | 287,906 | | | 330,831 | |
| Securitized intangible asset, net | | 293,619 | | | 323,838 | |
| Goodwill | | 157,953 | | | 157,953 | |
| | | | |
| Other assets | | 131,100 | | | 117,326 | |
| Total goodwill and other assets | | 870,578 | | | 929,948 | |
| Total assets | | $ | 7,770,994 | | | $ | 7,776,396 | |
See accompanying Notes to Consolidated Financial Statements.
| | | | | | | | | | | | | | |
| ONE Gas, Inc. | | | | |
| CONSOLIDATED BALANCE SHEETS | | | | |
| (Continued) | | | | |
| | | December 31, | | December 31, |
| | 2023 | | 2022 |
| Equity and Liabilities | | (Thousands of dollars) |
| Equity and long-term debt | | | | |
Common stock, $0.01 par value: authorized 250,000,000 shares; issued and outstanding 56,545,924 shares at December 31, 2023; issued and outstanding 55,349,954 shares at December 31, 2022 | | $ | 565 | | | $ | 553 | |
| Paid-in capital | | 2,028,755 | | | 1,932,714 | |
| Retained earnings | | 737,739 | | | 651,863 | |
| Accumulated other comprehensive loss | | (1,182) | | | (704) | |
| | | | |
| Total equity | | 2,765,877 | | | 2,584,426 | |
| Other long-term debt, excluding current maturities, net of issuance costs | | 1,877,895 | | | 2,352,400 | |
| Securitized utility tariff bonds, excluding current maturities, net of issuance costs | | 282,506 | | | 309,343 | |
| Total long-term debt, excluding current maturities, net of issuance costs | | 2,160,401 | | | 2,661,743 | |
| Total equity and long-term debt | | 4,926,278 | | | 5,246,169 | |
| Current liabilities | | | | |
| Current maturities of other long-term debt | | 772,984 | | | 12 | |
| Current maturities of securitized utility tariff bonds | | 27,430 | | | 20,716 | |
| Notes payable | | 88,500 | | | 552,000 | |
| Accounts payable | | 278,056 | | | 360,493 | |
| | | | |
| Accrued taxes other than income | | 68,793 | | | 78,352 | |
| | | | |
| Regulatory liabilities | | 66,901 | | | 47,867 | |
| Customer deposits | | 62,187 | | | 57,854 | |
| Other current liabilities | | 112,370 | | | 72,125 | |
| Total current liabilities | | 1,477,221 | | | 1,189,419 | |
| Deferred credits and other liabilities | | | | |
| Deferred income taxes | | 752,068 | | | 698,456 | |
| Regulatory liabilities | | 500,478 | | | 529,441 | |
| Employee benefit obligations | | 20,265 | | | 19,587 | |
| Other deferred credits | | 94,684 | | | 93,324 | |
| Total deferred credits and other liabilities | | 1,367,495 | | | 1,340,808 | |
| Commitments and contingencies | | | | |
| Total liabilities and equity | | $ | 7,770,994 | | | $ | 7,776,396 | |
See accompanying Notes to Consolidated Financial Statements.
| | | | | | | | | | | | | | | |
| ONE Gas, Inc. | | | | | |
| CONSOLIDATED STATEMENTS OF EQUITY | | |
| (Continued) | | | | | |
| Retained Earnings | Treasury Stock | | Accumulated Other Comprehensive Loss | Total Equity |
| | (Thousands of dollars) |
| | | | | |
| January 1, 2018 | $ | 246,121 | | $ | (18,496) | | | $ | (5,493) | | $ | 1,960,209 | |
| Net income | 172,234 | | 0 | | | 0 | | 172,234 | |
| Other comprehensive income | 0 | | 0 | | | 1,407 | | 1,407 | |
| Common stock issued and other | 0 | | 16,351 | | | 0 | | 5,400 | |
| Common stock dividends - $1.84 per share | (97,486) | | 0 | | | 0 | | (96,594) | |
| December 31, 2018 | 320,869 | | (2,145) | | | (4,086) | | 2,042,656 | |
| Net income | 186,749 | | 0 | | | 0 | | 186,749 | |
| Other comprehensive loss | 0 | | 0 | | | (1,435) | | (1,435) | |
| Reclassification of stranded tax effects | 1,218 | | 0 | | | (1,218) | | 0 | |
| Common stock issued and other | 0 | | 2,145 | | | 0 | | 6,844 | |
| Common stock dividends - $2.00 per share | (106,327) | | 0 | | | 0 | | (105,424) | |
| December 31, 2019 | 402,509 | | 0 | | | (6,739) | | 2,129,390 | |
| Net income | 196,412 | | 0 | | | 0 | | 196,412 | |
| Other comprehensive loss | 0 | | 0 | | | (1,038) | | (1,038) | |
| Common stock issued and other | 0 | | 0 | | | 0 | | 22,919 | |
| Common stock dividends - $2.16 per share | (115,286) | | 0 | | | 0 | | (114,372) | |
| December 31, 2020 | $ | 483,635 | | $ | 0 | | | $ | (7,777) | | $ | 2,233,311 | |
| | | | | | | | | | | | | | | | | | | | |
| ONE Gas, Inc. | | | | | | |
| CONSOLIDATED STATEMENTS OF CASH FLOWS | | | | |
| | Year Ended December 31, |
| | |
| | 2023 | | 2022 | | 2021 |
| | | (Thousands of dollars) | | |
| Operating activities | | | | | | |
| Net income | | $ | 231,232 | | | $ | 221,742 | | | $ | 206,434 | |
| Adjustments to reconcile net income to net cash provided by operating activities: | | | | | | |
| Depreciation and amortization | | 279,830 | | | 228,479 | | | 207,233 | |
| Deferred income taxes | | 24,773 | | | (22,034) | | | 43,449 | |
| Share-based compensation expense | | 12,184 | | | 10,741 | | | 10,498 | |
| Provision for doubtful accounts | | 9,698 | | | 6,003 | | | 9,131 | |
| Proceeds from government securitization of winter weather event costs | | 197,366 | | | 1,330,582 | | | — | |
| Changes in assets and liabilities: | | | | | | |
| Accounts receivable | | 196,272 | | | (213,656) | | | (57,902) | |
| Materials and supplies | | (6,776) | | | (15,981) | | | (2,126) | |
| Natural gas in storage | | 82,108 | | | (89,559) | | | (85,700) | |
| | | | | | |
| Asset removal costs | | (62,023) | | | (47,032) | | | (49,029) | |
| Accounts payable | | (90,046) | | | 85,915 | | | 107,207 | |
| | | | | | |
| Accrued taxes other than income | | (9,559) | | | 11,317 | | | 3,235 | |
| | | | | | |
| Customer deposits | | 4,333 | | | (4,600) | | | (5,574) | |
| Regulatory assets and liabilities - current | | 7,249 | | | 52,417 | | | (1,562,574) | |
| Regulatory assets and liabilities - noncurrent | | 38,869 | | | 53,992 | | | (367,210) | |
| | | | | | |
| Other assets and liabilities - current | | 26,070 | | | (23,377) | | | 18,461 | |
| Other assets and liabilities - noncurrent | | (2,048) | | | (14,107) | | | (11,190) | |
| Cash provided by (used in) operating activities | | 939,532 | | | 1,570,842 | | | (1,535,657) | |
| Investing activities | | | | | | |
| Capital expenditures | | (666,634) | | | (609,486) | | | (495,246) | |
| Other investing expenditures | | (8,508) | | | (8,632) | | | (7,554) | |
| Other investing receipts | | 5,499 | | | 4,008 | | | 1,717 | |
| Cash used in investing activities | | (669,643) | | | (614,110) | | | (501,083) | |
| Financing activities | | | | | | |
| Borrowings (repayments) of notes payable, net | | (463,500) | | | 58,000 | | | 75,775 | |
| Issuance of other long-term debt, net of discounts | | 299,583 | | | 297,591 | | | 2,498,895 | |
| Issuance of securitized utility tariff bonds, net of discounts | | — | | | 335,931 | | | — | |
| Long-term debt financing costs | | (2,508) | | | (8,567) | | | (35,110) | |
| Issuance of common stock | | 85,259 | | | 133,711 | | | 26,662 | |
| Repayment of other long-term debt | | — | | | (1,627,000) | | | (400,000) | |
| Repayment of securitized utility tariff bonds | | (20,716) | | | — | | | |
| Dividends paid | | (144,094) | | | (133,954) | | | (123,912) | |
| Tax withholdings related to net share settlements of stock compensation | | (2,653) | | | (3,169) | | | (4,711) | |
| Cash provided by (used in) financing activities | | (248,629) | | | (947,457) | | | 2,037,599 | |
| Change in cash, cash equivalents, restricted cash and restricted cash equivalents | | 21,260 | | | 9,275 | | | 859 | |
| Cash, cash equivalents, restricted cash and restricted cash equivalents at beginning of period | | 18,127 | | | 8,852 | | | 7,993 | |
| Cash, cash equivalents, restricted cash and restricted cash equivalents at end of period | | $ | 39,387 | | | $ | 18,127 | | | $ | 8,852 | |
| Supplemental cash flow information: | | | | | | |
| Cash paid for interest, net of amounts capitalized | | $ | 80,726 | | | $ | 84,871 | | | $ | 70,066 | |
| Cash paid (received) for income taxes, net | | $ | 20,844 | | | $ | 67,421 | | | $ | (10,809) | |
See accompanying Notes to Consolidated Financial Statements.
This page intentionally left blank.
| | | | | | | | | | | | | | | | | | | | |
| ONE Gas, Inc. | | | | | | |
| CONSOLIDATED STATEMENTS OF EQUITY | | | | | |
| | | | | | |
| Common Stock Issued | Common Stock | Paid-in Capital | Retained Earnings | Accumulated Other Comprehensive Income/(Loss) | Total Equity |
| | (Shares) | (Thousands of dollars) |
| | | | | | |
| January 1, 2021 | 53,166,733 | | $ | 532 | | $ | 1,756,921 | | $ | 483,635 | | $ | (7,777) | | $ | 2,233,311 | |
| Net income | — | | — | | — | | 206,434 | | — | | 206,434 | |
| Other comprehensive income | — | | — | | — | | — | | 1,250 | | 1,250 | |
| Common stock issued and other | 466,477 | | 4 | | 32,445 | | — | | — | | 32,449 | |
| Common stock dividends - $2.32 per share | — | | — | | 996 | | (124,908) | | — | | (123,912) | |
| December 31, 2021 | 53,633,210 | | 536 | | 1,790,362 | | 565,161 | | (6,527) | | 2,349,532 | |
| Net income | — | | — | | — | | 221,742 | | — | | 221,742 | |
| Other comprehensive income | — | | — | | — | | — | | 5,823 | | 5,823 | |
| Common stock issued and other | 1,716,744 | | 17 | | 141,266 | | — | | — | | 141,283 | |
| Common stock dividends - $2.48 per share | — | | — | | 1,086 | | (135,040) | | — | | (133,954) | |
| December 31, 2022 | 55,349,954 | | 553 | | 1,932,714 | | 651,863 | | (704) | | 2,584,426 | |
| Net income | — | | — | | — | | 231,232 | | — | | 231,232 | |
| Other comprehensive income | — | | — | | — | | — | | (478) | | (478) | |
| Common stock issued and other | 1,195,970 | | 12 | | 94,779 | | — | | — | | 94,791 | |
| Common stock dividends - $2.60 per share | — | | — | | 1,262 | | (145,356) | | — | | (144,094) | |
| December 31, 2023 | 56,545,924 | | $ | 565 | | $ | 2,028,755 | | $ | 737,739 | | $ | (1,182) | | $ | 2,765,877 | |
See accompanying Notes to Consolidated Financial Statements.
ONE Gas, Inc.
NOTES TO CONSOLIDATED FINANCIAL STATEMENTS
1.SUMMARY OF SIGNIFICANT ACCOUNTING POLICIES
Basis of Presentation - The consolidated financial statements include the accounts of our natural gas distribution business as set forth in “Organization and Nature of Operations” below. All significant balances and transactions between our subsidiaries have been eliminated.
Organization and Nature of Operations - We provide natural gas distribution services to our approximately 2.22.3 million customers through our divisions in Oklahoma, Kansas and Texas through our three divisions, Oklahoma Natural Gas, Kansas Gas Service and Texas Gas Service, respectively. We primarily serve residential, commercial and transportation customers in all three states. We are a corporation incorporated under the laws of the state of Oklahoma, and our common stock is listed on the NYSE under the trading symbol “OGS.”
BasisSegments - We operate in one reportable business segment: regulated public utilities that deliver natural gas primarily to residential, commercial and transportation customers. We define reportable business segments as components of Presentation - The consolidatedan organization for which discrete financial statementsinformation is available and operating results are evaluated on a regular basis by the chief operating decision maker (“CODM”) in order to assess performance and allocate resources. Our CODM is our Chief Executive Officer. Characteristics of our organization that were relied upon in making this determination include the accountssimilar nature of services we provide, the functional alignment of our natural gasorganizational structure, and the reports that are regularly reviewed by the CODM for the purpose of assessing performance and allocating resources. Our management is functionally aligned and centralized, with performance evaluated based upon results of the entire distribution business as set forth in “Organizationbusiness. Capital allocation decisions are driven by asset integrity management, operating efficiency, growth opportunities and Nature of Operations” above. All significant balances and transactions between our subsidiaries have been eliminated.government-requested pipeline relocations, not geographic location or regulatory jurisdiction.
In 2023, 2022 and 2021, we had no single external customer from which we received 10 percent or more of our gross revenues.
Revenues - We recognize revenue from contracts with customers to depict the transfers of goods and services to customers at an amount that we expect to be entitled to receive in exchange for these goods and services. Our sources of revenue are disaggregated by natural gas sales, transportation revenues, and miscellaneous revenues, which are primarily one-time service fees, that meet the requirements of ASC 606. Certain revenues that do not meet the requirements of ASC 606 are classified as other revenues in our Notes to Consolidated Financial Statements in this Annual Report.
Our natural gas sales to customers and transportation revenues represent revenues from contracts with customers through implied contracts established by our tariffs approved by regulatory authorities. Our customers receive the benefits of our performance when the commodity is delivered to the customer. The performance obligation is satisfied over time as the customer receives the natural gas.
For deliveries of natural gas, customers are billed on a monthly cycle. We recognize revenues upon the delivery of natural gas or services rendered to customers. The billing cycles for customers do not necessarily coincide with the accounting periods used for financial reporting purposes. We accrue unbilled revenues for natural gas that has been delivered but not yet billed at the end of an accounting period. We use the invoice method practical expedient, where we recognize revenue for volumes delivered for which we have a right to invoice. Our estimate of accrued unbilled revenue is based on a percentage estimate of amounts unbilled each month, which is dependent upon a number of factors, some of which require management’s judgment. These factors include customer consumption patterns and the impact of weather on usage. The accrued unbilled natural gas sales revenue is included in accounts receivable on our consolidated balance sheets.
Our miscellaneous revenues from contracts with customers represent implied contracts established by our tariff rates approved by the regulatory authorities and include miscellaneous utility services with the performance obligation satisfied at a point in time when services are rendered to the customer.
Total other revenues consist of revenues associated with regulatory mechanisms that do not meet the requirements of ASC 606 as revenue from contracts with customers, but authorize us to accrue revenues earned based on tariffs approved by regulatory authorities. Other revenues - natural gas sales primarily relate to the WNA mechanism in Kansas. This mechanism adjusts our revenues earned for the variance between actual and normal HDDs. This mechanism can have either positive
(warmer than normal) or negative (colder than normal) effects on revenues.
We collect and remit other taxes on behalf of governmental authorities, and we record these amounts in accrued taxes other than income in our consolidated balance sheets. See Note 2 for additional discussion of revenues.
Use of Estimates - The preparation of our consolidated financial statements and related disclosures in accordance with GAAP requires us to make estimates and assumptions with respect to values or conditions that cannot be known with certainty that affect the reported amount of assets and liabilities, and the disclosure of contingent assets and liabilities at the date of the consolidated financial statements. These estimates and assumptions also affect the reported amounts of revenue and expenses during the reporting period. Items that may be estimated include, but are not limited to, the economic useful life of assets, fair value of assets and liabilities, provisions for doubtful accounts receivable, unbilled revenues for natural gas delivered but for which meters have not been read, natural gas purchased but for which no invoice has been received, provision for income taxes, including any deferred income tax valuation allowances, the results of litigation and various other recorded or disclosed amounts.
We evaluate these estimates on an ongoing basis using historical experience and other methods we consider reasonable based on the particular circumstances. Nevertheless, actual results may differ significantly from the estimates. Any effects on our financial position or results of operations from revisions to these estimates are recorded in the period when the facts that give rise to the revision become known.
Revenues - We recognize revenue from contracts with customers to depict the transfers of goods and services to customers at an amount that we expect to be entitled to receive in exchange for these goods and services. Our sources of revenue are disaggregated by natural gas sales, transportation revenues, and miscellaneous revenues, which are primarily one-time service fees, that meet the requirements of ASC 606. Certain revenues that do not meet the requirements of ASC 606 are classified as other revenues in our Notes to Consolidated Financial Statements in this Annual Report.
Our natural gas sales to customers and transportation revenues represent revenues from contracts with customers through implied contracts established by our tariffs approved by the regulatory authorities. Our customers receive the benefits of our performance when the commodity is delivered to the customer. The performance obligation is satisfied over time as the customer receives the natural gas.
For deliveries of natural gas, we read meters and bill customers on a monthly cycle. We recognize revenues upon the delivery of natural gas commodity or services rendered to customers. The billing cycles for customers do not necessarily coincide with the accounting periods used for financial reporting purposes. We accrue unbilled revenues for natural gas that has been delivered but not yet billed at the end of an accounting period. We use the invoice method practical expedient, where we recognize revenue for volumes delivered for which we have a right to invoice. Our estimate of accrued unbilled revenue is based on a percentage estimate of amounts unbilled each month, which is dependent upon a number of factors, some of which require management’s judgment. These factors include customer consumption patterns and the impact of weather on usage. The accrued unbilled natural gas sales revenue at December 31, 2020 and 2019 was $144.9 million and $109.7 million, respectively, and is included in accounts receivable on our consolidated balance sheets.
Our miscellaneous revenues from contracts with customers represent implied contracts established by our tariff rates approved by the regulatory authorities and include miscellaneous utility services with the performance obligation satisfied at a point in time when services are rendered to the customer.
Total other revenues consist of revenues associated with regulatory mechanisms that do not meet the requirements of ASC 606 as revenue from contracts with customers, but authorize us to accrue revenues earned based on tariffs approved by the regulatory authorities. Other revenues - natural gas sales primarily relate to the WNA mechanism in Kansas. This mechanism adjusts our revenues earned for the variance between actual and normal HDDs. This mechanism can have either positive
(warmer than normal) or negative (colder than normal) effects on revenues.
We collect and remit other taxes on behalf of governmental authorities, and we record these amounts in accrued taxes other than income in our consolidated balance sheets. See Note 3 for additional discussion of revenues.
Cost of Natural Gas - Cost of natural gas includes commodity purchases, fuel, storage, transportation, financial derivatives, and other gas purchase costs recovered through our cost of natural gas regulatory mechanisms and does not include an allocation of general operating costs or depreciation and amortization. In addition, ourThese cost of natural gas regulatory mechanisms provide a method of recovering natural gas costs on an ongoing basis without a profit. See Note 113 for additional discussion of purchased gas cost recoveries.
Cash, Cash Equivalents and Restricted Cash and Restricted Cash Equivalents - Cash equivalents and restricted cash equivalents consist of highly liquid investments, which are readily convertible into cash and have original maturities of three months or less. Restricted cash consists of funds that are contractually or legally restricted as to usage or withdrawal and have been presented separately from cash and cash equivalents on our consolidated balance sheets. Restricted cash and restricted cash equivalents accounts were established for payment of Securitized Utility Tariff Bond issuance costs and payment of debt service on those bonds.
Property, Plant and Equipment - Our properties are stated at cost, which includes direct construction costs such as direct labor, materials, burden and AFUDC. Generally, the cost of our property retired or sold, plus removal costs, less salvage, is charged to accumulated depreciation. Gains and losses from sales or retirement of an entire operating unit or system of our properties are recognized in income. Maintenance and repairs are charged directly to expense.
AFUDC represents the cost of borrowed funds used to finance construction activities. We capitalize interest costs during the construction or upgrade of qualifying assets. Capitalized interest is recorded as a reduction to interest expense.
Our properties are depreciated using the straight-line method over their estimated useful lives. Generally, we apply composite depreciation rates to functional groups of property having similar economic circumstances. We periodically conduct depreciation studies to assess the economic lives of our assets. These depreciation studies are completed as a part of our regulatory proceedings, and the changes in economic lives, if applicable, are implemented prospectively when the new rates are approved by our regulators and become effective. Changes in the estimated economic lives of our property, plant and equipment could have a material effect on our financial position, results of operations or cash flows.
Property, plant and equipment on our consolidated balance sheets includes construction work in process for capital projects that have not yet been placed in service and therefore are not being depreciated. Assets are transferred out of construction work in process when they are substantially complete and ready for their intended use.
See Note 14 for additional information regarding our property, plant and equipment.
Accounts Receivable, Net - Accounts receivable represent valid claims against nonaffiliated customers for natural gas sold or services rendered, net of an allowance for doubtful accounts.rendered. We assess the creditworthiness of our customers. Those customers who do not meet minimum standards may be required to provide security, including deposits and other forms of collateral, when appropriate and allowed by our tariffs. With approximately 2.22.3 million customers across three states, we are not exposed materially to a concentration of credit risk. We maintain an allowance for doubtful accounts based upon factors surrounding the credit risk of customers, historical trends, consideration of the current credit environment and other information. We are able to recover natural gas costs related to doubtful accounts written off
when they are deemed uncollectible through the purchased-gas cost adjustment mechanisms.mechanisms in each of our jurisdictions. At December 31, 20202023 and 2019,2022, our allowance for doubtful accounts was $16.6$16.1 million and $6.6$16.7 million, respectively.
Inventories - Natural gas in storage is accounted for on the basis of weighted-average cost. Natural gas inventories that are injected into storage are recorded in inventory based on actual purchase costs, including storage and transportation costs. Natural gas inventories that are withdrawn from storage are accounted for in our purchased-gas cost adjustment mechanisms at the weighted-average inventory cost.
Materials and supplies inventories are stated at the lower of weighted-average cost or net realizable value.
Leases - We determine if an arrangement is a lease at inception if the contract conveys the right to control the use and obtain substantially all the economic benefits from the use of an identified asset for a period of time in exchange for consideration. We identify a lease as a finance lease if the agreement includes any of the following criteria: transfer of ownership by the end of the lease term; an option to purchase the underlying asset that the lessee is reasonably certain to exercise; a lease term that represents 75 percent or more of the remaining economic life of the underlying asset; a present value of lease payments and any residual value guaranteed by the lessee that equals or exceeds 90 percent of the fair value of the underlying asset; or an underlying asset that is so specialized in nature that there is no expected alternative use to the lessor at the end of the lease term. A lease that does not meet any of these criteria is considered an operating lease.
Lease right-of-use assets represent our right to use an underlying asset for the lease term and lease liabilities represent our obligation to make lease payments arising from the lease. Right-of-use assets and liabilities are recognized at the commencement date of a lease based on the present value of lease payments over the lease term. Our lease terms may include options to extend or terminate the lease. We include these extension or termination options in the determination of the lease term when it is reasonably certain that we will exercise that option. We have lease agreements with lease and non-lease components, which are accounted for separately. Additionally, for certain office equipment leases, we apply a portfolio approach to effectively account for the operating lease right-of-use assets and liabilities. We do not recognize leases having a term of less than one year in our consolidated balance sheets.
For purposes of determining the present value of the lease payments, we use a lease’s implicit interest rate when readily determinable. As most of our leases do not provide an implicit interest rate, we use an incremental borrowing rate based on available information at the commencement of the lease. Lease cost for operating leases is recognized on a straight-line basis over the lease term. See Note 6 for additional information regarding our leases.
Derivatives and Risk Management Activities - We record all derivative instruments at fair value, with the exception of certain commodity purchase contracts for which we have chosen the normal purchases andpurchase normal sales thatsale election as they are expected to result in physical delivery. The accounting for changes in the fair value of a derivative instrument depends on whether it has been designated and qualifies as part of a hedging relationship and, if so, the reason for holding it, or if regulatory rulings requirerequirements impose a different accounting treatment.
If certain conditions are met, we may elect to designate a derivative instrument as a hedge of exposure to changes in fair values or cash flows. We have not elected to designate any of our derivative instruments as hedges.
The table below summarizes the various ways in which we account for our derivative instruments and the impact on our consolidated financial statements:
| | | | | | | | | | | | | | |
| | | Recognition and Measurement |
| Accounting Treatment | | Balance Sheet | | Income Statement |
Normal purchases and
normal sales | - | Fair value not recorded | - | Change in fair value not recognized in earnings |
| Mark-to-market | - | Recorded at fair value | - | Change in fair value recognized in, and
recoverable through, the purchased-gas cost adjustment mechanisms |
See Note 1016 for additional information regarding our economic hedging activities using derivatives.
Fair Value Measurements - We define fair value as the price that would be received from the sale of an asset or the transfer of a liability in an orderly transaction between market participants at the measurement date. We use the market and income approaches to determine the fair value of our assets and liabilities and consider the markets in which the transactions are executed. We measure the fair value of a group of financial assets and liabilities consistent with how a market participant would price the net risk exposure at the measurement date.
Fair Value Hierarchy - At each balance sheet date, we utilize a fair value hierarchy to classify fair value amounts recognized or disclosed in our consolidated financial statements based on the observability of inputs used to estimate such fair value. The levels of the hierarchy are described below:
•Level 1 - Unadjusted quoted prices in active markets for identical assets or liabilities;
•Level 2 - Significant observable pricing inputs other than quoted prices included within Level 1 that are, either directly or indirectly, observable as of the reporting date. Essentially, this represents inputs that are derived principally from or corroborated by observable market data; and
•Level 3 - May include one or more unobservable inputs that are significant in establishing a fair value estimate. These unobservable inputs are developed based on the best information available and may include our own internal data.
We recognize transfers into and out of the levels as of the end of each reporting period.
Determining the appropriate classification of our fair value measurements within the fair value hierarchy requires management’s judgment regarding the degree to which market data is observable or corroborated by observable market data. We categorize derivatives for which fair value is determined using multiple inputs within a single level, based on the lowest level input that is significant to the fair value measurement in its entirety. See Note 1016 for additional information regarding our fair value measurements.
Property, Plant and Equipment - Our properties are stated at cost, which includes direct construction costs such as direct labor, materials, burden and AFUDC. Generally, the cost of our property retired or sold, plus removal costs, less salvage, is charged to accumulated depreciation. Gains and losses from sales or retirement of an entire operating unit or system of our properties are recognized in income. Maintenance and repairs are charged directly to expense.
AFUDC represents the cost of borrowed funds used to finance construction activities. We capitalize interest costs during the construction or upgrade of qualifying assets. Capitalized interest is recorded as a reduction to interest expense.
Our properties are depreciated using the straight-line method over their estimated useful lives. Generally, we apply composite depreciation rates to functional groups of property having similar economic circumstances. We periodically conduct depreciation studies to assess the economic lives of our assets. These depreciation studies are completed as a part of our regulatory proceedings, and the changes in economic lives, if applicable, are implemented prospectively when the new rates are approved by our regulators and become effective. Changes in the estimated economic lives of our property, plant and equipment could have a material effect on our financial position, results of operations or cash flows.
Property, plant and equipment on our Consolidated Balance Sheets includes construction work in process for capital projects that have not yet been placed in service and therefore are not being depreciated. Assets are transferred out of construction work in process when they are substantially complete and ready for their intended use.
See Note 12 for additional information regarding our property, plant and equipment.
Impairment of Goodwill and Long-Lived Assets - We assess our goodwill for impairment at least annually as of July 1, unless events or a change in circumstances indicate an impairment may have occurred before that time. As part of our goodwill impairment test, we first assess qualitative factors (including macroeconomic conditions, industry and market considerations, cost factors and overall financial performance) to determine whether it is more likely than not that our fair value is less than the carrying amount of our net assets. If further testing is necessary or a quantitative test is elected to refresh our recurring qualitative assessment, we perform a quantitative impairment test for goodwill.
Our impairment testassessment is madeperformed by comparing our fair value with our book value, including goodwill. If the fair value is less than the book value, an impairment is measured by the amount of our carrying value that exceeds our fair value, not to exceed the carrying amount of our goodwill.
To estimate our fair value, we use two generally accepted valuation approaches, an income approach and a market approach, using assumptions consistent with a market participant’s perspective. Under the income approach, we use anticipated cash flows over a period of years plus a terminal value and discount these amounts to their present value using appropriate discount rates. Under the market approach, we apply acquisition multiples to forecasted cash flows. The acquisition multiples used are consistent with historical market transactions. The forecasted cash flows are based on average forecasted cash flows over a period of years.
We performed a quantitative analysis in 2019, which did not result in any impairment indicators, nor did our analysis reflect our reporting unit at risk. Our goodwill impairment analysis performed in 20202023 and 20182022 utilized a qualitative assessment and did not result in any impairment indicators, nor did our analysis reflect our reporting unit at risk. Subsequent to July 1, 2020,2023, no event has occurred indicating that it is more likely than not that our fair value is less than the carrying value of our net assets.
We assess our long-lived assets for impairment whenever events or changes in circumstances indicate that an asset’s carrying amount may not be recoverable. An impairment is indicated if the carrying amount of a long-lived asset exceeds the sum of the undiscounted future cash flows expected to result from the use and eventual disposition of the asset. If an impairment is indicated, we record an impairment loss equal to the difference between the carrying value and the fair value of the long-lived asset. We determined that there were 0no material asset impairments in 2020, 20192023, 2022 or 2018.2021.
Securitized Intangible Asset - On November 18, 2022, KGSS-I acquired the Securitized Utility Tariff Property from Kansas Gas Service for $327.4 million. The Securitized Utility Tariff Property is classified as a securitized intangible asset on our consolidated balance sheets. This securitized intangible asset will be amortized over 10 years, the estimated period needed to collect the required amounts from Kansas Gas Service’s customers to service the Securitized Utility Tariff Bonds. The amortization expense related to the securitized intangible asset will be included in depreciation and amortization expense in our consolidated statements of income. For the years ended December 31, 2023 and 2022, we recorded $30.2 million and $3.5 million, respectively, of amortization expense related to the securitized intangible asset. At the end of its life, this securitized intangible asset will have no residual value. See Note 5 for additional information about the Securitized Utility Tariff Bonds and Notes 3 and 7 for additional information about the securitization transactions.
Finite-lived intangible assets are stated at cost, net of accumulated amortization, which is recorded on a straight-line or accelerated basis over the life of the asset. We review amortizable intangible assets for impairment whenever events or changes in circumstances indicate that the carrying amount of such assets may not be recoverable. If such a review should indicate that
the carrying amount of amortizable intangible assets is not recoverable, we reduce the carrying amount of such assets to fair value.
Regulation - We are subject to the rate regulation and accounting requirements of the OCC, KCC, RRC and various municipalities in Texas. We follow the accounting and reporting guidance for regulated operations.operations, including evaluating regulatory decisions to determine appropriate revenue recognition, cost deferrals and recoverability for regulatory assets and refund requirements for regulatory liabilities. During the ratemaking process, regulatory authorities set the framework for what we can charge customers for our services and establish the manner that our costs are accounted for, including allowing us to defer recognition of certain costs and permitting recovery of the amounts through rates over time, as opposed to expensing such costs as incurred. Examples include weather normalization, unrecovered purchased-gas costs, extraordinary costs associated with Winter Storm Uri, pension and postemployment benefit costs and ad-valorem taxes. This allows us to stabilize rates over time rather than passing such costs on to the customer for immediate recovery. Actions by regulatory authorities could have an effect on the amount recovered from customers. Any difference in the amount recoverable and the amount deferred is recorded as income or expense at the time of the regulatory action. A write-off of regulatory assets and costs not recovered may be required if all or a portion of the regulated operations have rates that are no longer:
•established by independent regulators;
•designed to recover our costs of providing regulated services; and
•set at levels that will recover our costs when considering the demand and competition for our services.
Should recovery cease due to regulatory actions, certain of these assets may no longer meet the criteria for recognition and accordingly, a write-off of regulatory assets and stranded costs may be required. There were no write-offs of regulatory assets resulting from the failure to meet the criteria for capitalization during 2023, 2022 and 2021.
See Note 113 for additional information regarding our regulatory assets and liabilities disclosures.liabilities.
Pension and Other Postemployment Employee Benefits - We have defined benefit pension plans covering eligible employees.employees, all of which are closed to new participants. We also sponsor welfare plans that provide other postemployment medical and life insurance benefits to eligible employees who retire with at least five years of service. To calculate the costs and liabilities related to our plans, we utilize an outside actuarial consultant, which uses statistical and other factors to anticipate future events. These factors include assumptions about the discount rate, expected return on plan assets, rate of future compensation increases, age and mortality and employment periods. We use tables issued by the Society of Actuaries to estimate mortality rates. In determining the projected benefit obligations and costs, assumptions can change from period to period and may result in material changes in the cost and liabilities we recognize.
Income Taxes - Deferred income taxes are recorded for the difference between the financial statement and income tax basis of assets and liabilities and carryforward items, based on income tax laws and rates existing at the time the temporary differences are expected to reverse. The effect on deferred income taxes of a change in tax rates is deferred and amortized for operations regulated by the OCC, KCC, RRC and various municipalities in Texas, if, as a result of an action by a regulator, it is probable that the effect of the change in tax rates will be recovered from or returned to customers through future rates. We continue to amortize previously deferred investment tax credits for ratemaking purposes over the periods prescribed by our regulators.
A valuation allowance for deferred income tax assets is recognized when it is more likely than not that some or all of the benefit from the deferred income tax asset will not be realized. To assess that likelihood, we use estimates and judgment regarding our future taxable income, as well as the jurisdiction in which such taxable income is generated, to determine whether a valuation allowance is required. Such evidence can include our current financial position, our results of operations, both actual and forecasted, the reversal of deferred income tax liabilities, as well as the current and forecasted business economics of our industry. We had 0no valuation allowance at December 31, 20202023 and 2019.2022.
We utilize a more-likely-than-not recognition threshold and measurement attribute for the financial statement recognition and measurement of a tax position that is taken or expected to be taken in a tax return. We reflect penalties and interest as part of income tax expense as they become applicable for tax provisions that do not meet the more-likely-than-not recognition threshold and measurement attribute. There were 0no material uncertain tax positions at December 31, 20202023 and 2019.2022.
Changes in tax laws or tax rates are recognized in the financial reporting period that includes the enactment date.
See Note 1512 for additional information regarding income taxes.
Asset Retirement Obligations - Asset retirement obligations represent legal obligations associated with the retirement of long-lived assets that result from the acquisition, construction, development and/or normal use of the asset. Certain long-lived assets that comprise our natural gas distribution systems, primarily our pipeline assets, are subject to agreements or regulations that give rise to an asset retirement obligation for removal or other disposition costs associated with retiring the assets in place upon the discontinued use of the natural gas distribution system. We recognize the fair value of a liability for an asset retirement obligation in the period when it is incurred if a reasonable estimate of the fair value can be made. We are not able to estimate reasonably the fair value of the asset retirement obligations for portions of our assets because the settlement dates are indeterminable given our expected continued use of the assets with proper maintenance. We expect our natural gas distribution systems will continue in operation for the foreseeable future. Based on our proximity to significant natural gas reserves and infrastructure and the widespread use of natural gas for heating and cooking activities by residential and commercial customers in our service areas, we expect supply and demand to exist for the foreseeable future.
In accordance with long-standing regulatory treatment, we collect through rates the estimated costs of removal on certain regulated properties through depreciation expense as a portion of the net salvage value component of our composite deprecation rates, with a corresponding credit to accumulated depreciation and amortization. These removal costs collected through our rates include costs attributable to legal and nonlegal removal obligations. The amounts collected for non-legal asset removal costs that are in excess of costs incurred, if any, are accounted for as a regulatory liability for financial reporting purposes. Historically, with the exception of the regulatory authority in Kansas, the regulatory authorities that have jurisdiction over our regulated operations have not required us to quantify or disclose this amount. These costs are addressed prospectively in depreciation rates, rather than as a regulatory liability, in each general rate order.
For financial reporting purposes, if the removal costs collected have exceeded our removal costcosts incurred, we estimate oura regulatory liability using current rates since the last general rate order in each of our jurisdictions. At December 31, 2023 and 2022, we have not recorded a regulatory liability, as our removal costs incurred have exceeded amounts collected through our depreciation rates. Significant uncertainty exists regarding the future dispositionrecording of thisthese regulatory liability,liabilities, pending, among other issues, clarification of regulatory intent. We continue to monitor the regulatory requirements, and the liabilityany future regulatory liabilities incurred may be adjusted as more information is obtained. To the extent thisthese estimated liability isliabilities are adjusted, such amounts will be reclassified between accumulated depreciation and amortization and other deferred creditsregulatory liabilities on our balance sheet and therefore will not have an impact on earnings.
Contingencies - Our accounting for contingencies covers a variety of business activities, including contingencies for legal and environmental exposures. We accrue these contingencies when our assessments indicate that it is probable that a liability has been incurred or an asset will not be recovered and an amount can be estimated reasonably. We expense legal fees as incurred and base our legal liability estimates on currently available facts and our estimates of the ultimate outcome or resolution. Accruals for the estimated cost of environmental remediation obligations generally are recognized no later than the completion of a remediation feasibility study. Recoveries of environmental remediation costs from other parties are recorded as assets when their receipt is deemed probable. Actual results may differ from our estimates resulting in an impact, positive or negative, on earnings.
See Note 1715 for additional information regarding contingencies.
Share-Based Payments - We expense the fair value of share-based payments net of estimated forfeitures. We estimate forfeiture rates based on historical forfeitures under our share-based payment plans.
Earnings per share - Basic EPS is based oncalculated by dividing net income and is calculated based uponby the daily weighted-average number of common shares outstanding during the periods presented. Also, this calculationpresented, which includes fully vested stock awards that have not yet been issued as common stock. Diluted EPS includesis based on shares outstanding for the above,calculation of basic EPS, plus unvested stock awards granted under our compensation plans and equity forward sale agreements, but only to the extent these instruments dilute earnings per share.
Segments - We operate in one reportable business segment: regulated public utilities that deliver natural gas primarily to residential, commercial and transportation customers. We define reportable business segments as components of an organization for which discrete financial information is available and operating results are evaluated on a regular basis by the chief operating decision maker (“CODM”) in order to assess performance and allocate resources. Our CODM is our Chief Executive Officer. Characteristics of our organization that were relied upon in making this determination include the similar nature of services we provide, the functional alignment of our organizational structure, and the reports that are regularly reviewed by the CODM for the purpose of assessing performance and allocating resources. Our management is functionally aligned and centralized, with performance evaluated based upon results of the entire distribution business. Capital allocation decisions are driven by asset integrity management, operating efficiency, growth opportunities and government-requested pipeline relocations, not geographic location or regulatory jurisdiction.
In 2020, 2019 and 2018, we had 0 single external customer from which we received 10 percent or more of our gross revenues.
Treasury Stock - We record treasury stock purchases at cost, which includes incremental direct transaction costs. Amounts are recorded as reductions in equity in our consolidated balance sheets. We record the reissuance of treasury stock at our weighted average cost of treasury shares recorded in equity in our consolidated balance sheets.
Reclassifications - Certain reclassifications haveA reclassification has been made in the prior-year financial statements to conform to the current-year presentation. For the year ended December 31, 2019, an accrued amount totaling $10 million that was previously presented within “accounts receivable, net” on our balance sheets was reclassified to “other current assets.” Additionally, weWe have updated our 2019 and 2018 Statements of Cash Flowsconsolidated balance sheet at December 31, 2022, to disaggregate regulatory assets and“current maturities of other long-term debt,” which had previously been included in “other current liabilities, and other assets and liabilities into current and non-current components that are presented on our balance sheet” to conform to our current yearcurrent-year presentation.
Recently Issued Accounting Standards Update - In December 2023, the FASB issued ASU 2023-09, “Income Taxes (Topic 740): Improvements to Income Tax Disclosures,” which will enhance annual income tax disclosures to address investor requests for more information about the tax risks and opportunities present in an entity’s operations. The amendments require disclosure of additional information in specified categories with respect to the reconciliation of the effective tax rate to the statutory rate (the rate reconciliation) for federal, state, and foreign income taxes. They also require greater detail about individual reconciling items in the rate reconciliation to the extent the impact of those items exceeds a specified threshold. In addition to new disclosures associated with the rate reconciliation, the amendments in this update require information pertaining to taxes paid (net of refunds received) to be disaggregated for federal, state, and foreign taxes and further disaggregated for
specific jurisdictions to the extent the related amounts exceed a quantitative threshold. The amendments in this update are effective for annual periods beginning after December 15, 2023, and early adoption is permitted. We are currently assessing the timing and impacts of adopting this standard.
In November 2023, the FASB issued ASU 2023-07, “Segment Reporting (Topic 280): Improvements to Reportable Segment Disclosures,” which will improve annual and interim reportable segment disclosure requirements, primarily through enhanced disclosures about significant segment expenses. The amendment enhances interim disclosure requirements, clarifies circumstances in which an entity can disclose multiple segment measures of profit or loss, provides new segment disclosure requirements for entities with a single reportable segment, and contains other disclosure requirements. The amendments in this update are effective for annual periods beginning after December 15, 2023, and interim periods within annual periods beginning after December 15, 2024. Early adoption is permitted. We are currently assessing the timing and impacts of adopting this standard.
In November 2021, the FASB issued ASU 2021-10, “Government Assistance (Topic 832): Disclosures by Business Entities about Government Assistance,” which will require disclosure about government assistance in the notes to the financial statements. The amendment requires annual disclosures about transactions with a government that are accounted for by applying a grant or contribution accounting model by analogy, including information about the nature of the transactions and the related accounting policy used to account for the transactions, the line items on the balance sheet and income statement that are affected by the transactions and the significant terms and conditions of the transactions, including commitments and contingencies. The amendment became effective for us beginning January 1, 2022. As the guidance is related only to disclosures in the notes to the financial statements, it did not impact our financial position, results of operations or cash flows. See Note 3 for additional discussion regarding our securitization transactions with the Oklahoma and Texas governments that are accounted for by applying a grant accounting model by analogy.
In March 2020, the FASB issued ASU 2020-04, “Reference Rate Reform (Topic 848): Facilitation of the Effects of Reference Rate Reform on Financial Reporting,” which provides relief from the accounting analysis and impacts that may otherwise be required for modifications to agreements (e.g., loans, debt securities, derivatives, borrowings) necessitated by reference rate reform. It also provides optional expedients to enable companies to continue to apply hedge accounting to certain hedging relationships impacted by reference rate reform. In the first quarter 2020, we adopted this new guidance effective for contracts modified between March 12, 2020 and December 31, 2022. Our revolving lines of credit underIn March 2022, we amended the ONE Gas Credit Agreement to change the defined benchmark rate to SOFR from LIBOR. Our adoption and subsequent amendment of the ONE Gas 364-day Credit Agreement utilize LIBOR as the reference rate. If modified, we may elect the optional practical expedients to account for the modifications prospectively. Our adoption did not result in a material impact to our consolidated financial statements.
In December 2019, the FASB issued ASU 2019-12, “Income Taxes (Topic 740): Simplifying the Accounting for Income Taxes,” which removes certain exceptions for recognizing deferred taxes for investments, performing intra-period allocation and calculating income taxes in interim periods. ASU 2019-12 also adds guidance to reduce complexity in certain areas, including recognizing deferred taxes for tax goodwill and allocating taxes to members of a consolidated group. This standard is effective for interim and annual periods in fiscal years beginning after December 15, 2020. We adopted this new guidance in the first quarter of 2021 and our adoption did not result in a material impact to our financial position or results of operations or to our consolidated financial statements.
In August 2018, the FASB issued ASU 2018-15, “Intangibles - Goodwill and Other - Internal-Use Software (Subtopic 350-40): Customer’s Accounting for Implementation Costs Incurred in a Cloud Computing Arrangement That Is a Service Contract (a consensus of the FASB Emerging Issues Task Force).” Under this guidance, a company should defer implementation costs that it incurs if a company would capitalize those same costs under the internal-use software guidance for an arrangement that is a software license. The deferred implementation costs should be amortized over the term of the hosting arrangement, including any probable renewals. We are party to hosting arrangements identified as service contracts for various information systems used in our operations. We adopted this new guidance using the prospective transition approach for implementation costs
incurred in hosting arrangement service contracts beginning January 1, 2020. In certain jurisdictions, we have orders from our regulators allowing us to amortize deferred implementation costs for hosting arrangements entered into after January 1, 2020, over the life approved by our regulators for our internal-use software systems rather than the term of the hosting arrangement. The difference in amortization calculated between the term of the hosting arrangement and internal-use software life approved by our regulators is deferred as a regulatory asset and amortized over the remaining internal-use software life that exceeds the term of the hosting arrangement. Our adoption did not result in a material impact to our consolidated financial statements.
In August 2018, the FASB issued ASU No. 2018-14, an amendment to ASC 715, “Compensation - Retirement Benefits.” This guidance eliminates requirements for certain disclosures such as the amount and timing of plan assets expected to be returned to the employer and the amount of future annual benefits covered by insurance contracts. The standard is effective for periods ending after December 15, 2020, and we adopted this guidance in the first quarter 2020. The guidance added new disclosure requirements for sponsors of the defined benefit plans to provide information relating to the weighted-average interest crediting rate for cash balance plans and other plans with promised interest crediting rates and an explanation for significant gains or losses related to changes in the benefit obligations for the period. We have reflected these changes as presented in Note 14 to our consolidated financial statements.
2. REVENUE
In August 2018, the FASB issued ASU No. 2018-13, “Fair Value Measurement (Topic 820): Disclosure Framework - Changes to the Disclosure Requirements for Fair Value Measurement”, which removes, modifies and adds to certain disclosure requirements of fair value measurements. The guidance was effectivefollowing table sets forth our revenues disaggregated by source for the Company beginning January 1, 2020, and we adopted this guidance in the first quarter 2020. Disclosure requirements removed include the amount of and reasons for transfers between Level 1 and Level 2 of the fair value hierarchy, the policy for timing of transfers between levels and the valuation processes for Level 3 fair value measurements. Modifications include considerations around the requirement to disclose the timing of liquidation of an investee’s assets and the date when restrictions from redemption might lapse. The additions include the requirement to disclose changes in unrealized gains and losses for the period in other comprehensive income for recurring Level 3 fair value measurements held and the range and weighted average of significant unobservable inputs used to develop Level 3 fair value measurements. The guidance did not have a material impact on the Company’s fair value disclosure, and we have reflected these changes as presented in Note 14 to our consolidated financial statements.periods indicated:
| | | | | | | | | | | | | | | | | | | | | | | | |
| | | | Years Ended December 31, |
| | | | | | 2023 | | 2022 | | 2021 |
| | | | | | (Thousands of dollars) |
| Natural gas sales to customers | | | | | | $ | 2,141,908 | | | $ | 2,410,048 | | | $ | 1,652,566 | |
| Transportation revenues | | | | | | 132,945 | | | 125,951 | | | 118,492 | |
| Securitization customer charges (Note 17) | | | | | | 48,677 | | | 5,769 | | | — | |
| Miscellaneous revenues | | | | | | 22,791 | | | 19,850 | | | 16,757 | |
| Total revenues from contracts with customers | | | | | | 2,346,321 | | | 2,561,618 | | | 1,787,815 |
| Other revenues - natural gas sales related | | | | | | 12,764 | | | 3,403 | | | 9,650 | |
| Other revenues | | | | | | 12,905 | | | 12,984 | | | 11,132 | |
| Total other revenues | | | | | | 25,669 | | | 16,387 | | | 20,782 | |
| Total revenues | | | | | | $ | 2,371,990 | | | $ | 2,578,005 | | | $ | 1,808,597 | |
In February 2018, the FASB issued ASU 2018-02, “Income Statement - Reporting Comprehensive Income (Topic 220): Reclassification of Certain Tax Effects from Accumulated Other Comprehensive Income,” which allows a reclassification from accumulated other comprehensive income (loss) to retained earnings for stranded tax effects resulting from the Tax CutsAccrued unbilled natural gas sales revenues at December 31, 2023 and Jobs Act of 2017. We adopted this new guidanceDecember 31, 2022, were $191.4 million and $269.5 million, respectively, and are included in the first quarter 2019 and our adoption did not result in a material impact toaccounts receivable on our consolidated financial statements. This change is reflected in our consolidated statements of equity.balance sheets.
In June 2016, the FASB issued ASU 2016-13, “Financial Instruments - Credit Losses: Measurement of Credit Losses on Financial Instruments,” which introduces new guidance to the accounting for credit losses on instruments within its scope, including trade receivables. We adopted this new guidance in the first quarter 2020 using the modified retrospective method. Our financial assets within scope of this guidance primarily include our trade receivables from customers. Our policy for measuring our allowance for doubtful accounts is disclosed in the aforementioned policy for accounts receivable. We did not create any new accounting policies, nor did we modify any of our existing policies, as a result of adopting this guidance. Our adoption did not result in a cumulative adjustment to our opening retained earnings or have a material impact to our consolidated financial statements.
In February 2016, the FASB issued ASU 2016-02, “Leases (Topic 842),” as amended, (“Topic 842”) which prescribes recognizing lease assets and liabilities on the balance sheet and includes disclosure of key information about leasing arrangements. We adopted this new guidance effective January 1, 2019, and applied the modified retrospective approach to all existing leases. Upon adoption, we recognized lease liabilities of approximately $32 million, with corresponding right-of-use assets of the same amount based on the present value of the remaining minimum rental payments for existing operating leases. Our adoption did not result in a material impact to our results of operations or cash flows. We utilized the practical expedients that allow us to: (1) not reassess expired or existing contracts to determine whether they are subject to lease accounting guidance, (2) not reconsider lease classification at transition, and (3) not evaluate previously capitalized initial direct costs under the revised requirements. We also utilized the practical expedients that allowed us to: (1) not evaluate under Topic 842 existing or expired land easements that were not previously accounted for as leases under the current lease guidance in ASC Topic 840 (“Topic 840”) and (2) use an additional transition method in which an entity initially applies the new leases standard at the adoption date and recognizes a cumulative-effect adjustment to the opening balance of retained earnings in the period of adoption. We adopted an accounting policy that exempts leases with terms of less than one year from the recognition requirements of Topic 842, and we disclose such leases in our interim and annual disclosures upon adoption. Our adoption did not result in a cumulative adjustment to our opening retained earnings or a material impact to our consolidated financial statements. See Note 6 for additional information regarding our leases.
3. REGULATORY ASSETS AND LIABILITIES
2. SUBSEQUENT EVENTSThe tables below present a summary of regulatory assets and liabilities, net of amortization, for the periods indicated:
| | | | | | | | | | | | | | | | | | | | | | | | | | |
| | | | December 31, 2023 |
| | Remaining Recovery Period | | Current | | Noncurrent | | Total |
| | | | (Thousands of dollars) |
| Winter weather event costs | | (a) | | $ | 22,633 | | | $ | 21,495 | | | $ | 44,128 | |
| Under-recovered purchased-gas costs | | 1 year | | 10,391 | | | — | | | 10,391 | |
| Pension and postemployment benefit costs | | See Note 11 | | 6,379 | | | 228,092 | | | 234,471 | |
| Reacquired debt costs | | 6 years | | 723 | | | 2,712 | | | 3,435 | |
| MGP remediation costs | | 15 years | | 98 | | | 31,893 | | | 31,991 | |
| Ad-valorem tax | | 1 year | | 14,533 | | | — | | | 14,533 | |
| WNA | | 1 year | | 11,404 | | | — | | | 11,404 | |
| Customer credit deferrals | | 1 year | | 6,184 | | | — | | | 6,184 | |
| Other | | 1 to 18 years | | 2,963 | | | 3,714 | | | 6,677 | |
| Total regulatory assets, net of amortization | | | | 75,308 | | | 287,906 | | | 363,214 | |
| Income tax rate changes | | (a) | | — | | | (500,478) | | | (500,478) | |
| Over-recovered purchased-gas costs | | 1 year | | (66,901) | | | — | | | (66,901) | |
| Total regulatory liabilities | | | | (66,901) | | | (500,478) | | | (567,379) | |
| Net regulatory assets and liabilities | | | | $ | 8,407 | | | $ | (212,572) | | | $ | (204,165) | |
| (a) Recovery period varies by jurisdiction. See discussion below for additional information regarding our regulatory assets related to winter weather event costs and regulatory liabilities related to federal income tax rate changes. |
A | | | | | | | | | | | | | | | | | | | | | | | | | | |
| | | | December 31, 2022 |
| | Remaining Recovery Period | | Current | | Noncurrent | | Total |
| | | | (Thousands of dollars) |
| Winter weather event costs | | (a) | | $ | 221,926 | | | $ | 36,291 | | | $ | 258,217 | |
| Under-recovered purchased-gas costs | | 1 year | | 19,755 | | | — | | | 19,755 | |
| Pension and postemployment benefit costs | | See Note 11 | | — | | | 258,257 | | | 258,257 | |
| Reacquired debt costs | | 6 years | | 812 | | | 3,347 | | | 4,159 | |
| MGP remediation costs | | 15 years | | 98 | | | 29,743 | | | 29,841 | |
| Ad-valorem tax | | 1 year | | 13,359 | | | — | | | 13,359 | |
| WNA | | 1 year | | 8,474 | | | — | | | 8,474 | |
| Customer credit deferrals | | 1 year | | 9,504 | | | — | | | 9,504 | |
| Other | | 1 to 18 years | | 1,644 | | | 3,193 | | | 4,837 | |
| Total regulatory assets, net of amortization | | | | 275,572 | | | 330,831 | | | 606,403 | |
| Pension and other postemployment benefit costs | | See Note 11 | | (8,228) | | | — | | | (8,228) | |
| Income tax rate changes | | (a) | | — | | | (529,441) | | | (529,441) | |
| Over-recovered purchased-gas costs | | 1 year | | (39,639) | | | — | | | (39,639) | |
| Total regulatory liabilities | | | | (47,867) | | | (529,441) | | | (577,308) | |
| Net regulatory assets and liabilities | | | | $ | 227,705 | | | $ | (198,610) | | | $ | 29,095 | |
| (a) Recovery period varies by jurisdiction. See discussion below for additional information regarding our regulatory assets related to winter weather event costs and regulatory liabilities related to federal income tax rate changes. |
Regulatory assets in our consolidated balance sheets, as authorized by various regulatory authorities, are probable of recovery. Base rates and certain riders are designed to provide a recovery of costs during the period such rates are in effect, but do not generally provide for a return on investment for amounts we have deferred as regulatory assets. All of our regulatory assets are subject to review by the respective regulatory authorities during future regulatory proceedings.
Winter weather event costs - In February 2021, the U.S. experienced Winter Storm Uri, a historic winter weather event in February 2021 impactedimpacting supply, market pricing and demand for natural gas in a number of states, including our service territories of Oklahoma, Kansas, Oklahoma, and Texas. During this time, the governors of Oklahoma, Kansas, Oklahoma, and Texas each declared a state of
emergency, and certain regulatory agencies issued emergency orders that impacted the utility and natural gas industries, including statewide utilitiesutility curtailment programs and orders requiring jurisdictional natural gas and electric utilities to do all things possible and necessary to ensure that natural gas and electricity utility services continuecontinued to be provided to their customers. Due to the historic nature of this winter weather event, we experienced unforeseeable and unprecedented market pricing for natural gas costs in our Oklahoma, Kansas, Oklahoma, and Texas jurisdictions, which resulted in aggregated natural gas purchases for the month of February 2021 of approximately $2.2$2.1 billion. These purchases are generally payable at the end of March 2021.
On February 22, 2021, we entered into
Oklahoma - In August 2022, the ONE Gas 2021 Term Loan Facility to enhance our liquidity position as partODFA completed the issuance of $1.4 billion in ratepayer-backed bonds with varying scheduled final maturities over 30 years, consistent with the OCC financing order. The bonds are limited and special revenue obligations of the financingODFA, payable solely from the securitization bond collateral and are not an obligation of our natural gas purchases in order to provide sufficient liquidity to satisfy our obligations as a resultOklahoma Natural Gas or any of the 2021 winter weather event and the repayment of indebtedness. See Note 5 for additional discussion of the ONE Gas 2021 Term Loan Facility.its affiliates.
Our purchased gas costs are recoverable through our tariffs in each state where we operate. Due toThe proceeds received by Oklahoma Natural Gas were approximately $1.3 billion, which represents the higher levelamount of gas purchase costs during the 2021 winter event, we are working with regulators to extendsecuritization bonds issued by the ODFA less issuance costs. The receipt of these proceeds represents Oklahoma Natural Gas’ recovery periods of such costs in order to lessen the immediate customer impact. In that regard, the Kansas Corporation Commission and the Railroad Commissionapproximately $1.3 billion of Texas each authorized certain utilities, including localextraordinary natural gas distribution companies, to record a regulatory asset to account for the extraordinary costs associated with this winter weather event, including but not limited to gas purchase costs and other operational costs relatedincurred during Winter Storm Uri, as well as carrying costs. Beginning September 1, 2022, Oklahoma Natural Gas acts as a servicer, with responsibility for collecting the securitization charges from Oklahoma customers that are then submitted to the procurementODFA to repay the securitization bonds. The collection and transportationremittance of these funds on behalf of the ODFA are recorded in other current liabilities in our consolidated balance sheets.
Kansas - In November 2022, KGSS-I issued $336 million of 5.486 percent Securitized Utility Tariff Bonds. KGSS-I used the proceeds from the issuance to purchase the Securitized Utility Tariff Property from Kansas Gas Service, pay for debt issuance costs, and reimburse Kansas Gas Service for upfront securitization costs paid by Kansas Gas Service on behalf of KGSS-I. See Notes 1 and 5 for additional information about the Securitized Utility Tariff Bonds and Note 17 for additional information about the securitization transaction in Kansas.
Texas - Pursuant to securitization legislation enacted in Texas as a result of Winter Storm Uri and a June 2021 RRC Notice to Gas Utilities, Texas Gas Service submitted an application to the RRC in July 2021, for an order authorizing the amount of extraordinary costs for recovery and other such specifications necessary for the issuance of securitized bonds.
In February 2022, the RRC issued a single financing order for Texas Gas Service and other natural gas supply. Weutilities in Texas participating in the securitization process, which included a determination that the approved costs will be collected from customers over a period of not more than 30 years. The TPFA formed the TNG Corporation, a new independent public authority, to issue the securitized bonds.
In March 2023, the TNG Corporation completed the issuance of the Customer Rate Relief (Winter Storm Uri), Taxable Series 2023 Bonds and we received our portion of the net proceeds, which was approximately $197 million. The proceeds were used to repay certain indebtedness and for general corporate purposes. Interest costs that exceeded the amount securitized have filed a motionbeen deferred and will be addressed in the next general rate proceeding in each applicable jurisdiction in Texas.
At December 31, 2023, Texas Gas Service had deferred approximately $26.6 million in extraordinary costs associated with Winter Storm Uri attributable to its former West Texas service area. Pursuant to the Oklahoma Corporation Commission to seek comparable authority in Oklahoma to record a regulatory asset to account forapproved settlement order, Texas Gas Service began collecting the extraordinary costs, including carrying costs, associated with this winter weather event. An administrative law judge has recommended approval of our motion by the Oklahoma Corporation Commission. The recommendation from the administrative law judge will next be considered by the Oklahoma Corporation Commission.those customers in January 2022.
GAAP does not provide comprehensive recognition and measurement guidance for many forms of government assistance received by business entities. Accordingly, we have accounted for the proceeds received from the ODFA and TNG Corporation by analogy to International Accounting Standards No. 20, “Accounting for Government Grants and Disclosure of Government Assistance” consistent with a grant related to income. The proceeds received and the corresponding recognition of the deferred regulatory asset have been reflected in cost of natural gas in our consolidated statements of income. As the proceeds reflect the recovery of our winter weather event regulatory asset, there was no material impact to earnings.
3.
The deferred winter weather event costs also include invoiced costs for natural gas purchases during Winter Storm Uri that have not been paid as we work with our suppliers for Kansas and Texas to resolve discrepancies in invoiced amounts. These amounts may be adjusted as the differences with suppliers are resolved. Settlements of these amounts are recoverable through the purchased gas cost mechanisms in the respective state. Future adjustments to the amounts are not expected to have a material impact on earnings.
Other regulatory assets and liabilitiesREVENUE - Purchased-gas costs represent the natural gas costs that have been over- or under-recovered from customers through the purchased-gas cost adjustment mechanisms, and includes natural gas utilized in our operations and premiums paid and any cash settlements received from our purchased natural gas call options.
The following table sets forthOCC, KCC and regulatory authorities in Texas have approved the recovery of pension costs and other postemployment benefits costs through rates for Oklahoma Natural Gas, Kansas Gas Service and Texas Gas Service, respectively. The costs recovered through rates are based on the net periodic benefit cost for defined benefit pension and other postemployment costs. Differences, if any, between the net periodic benefit cost, net of deferrals, and the amount recovered through rates are reflected in earnings. We historically have recovered defined benefit pension and other postemployment benefit costs through rates. We believe it is probable that regulators will continue to include the net periodic pension and other postemployment benefit costs in our revenues disaggregated by source for the periods indicated:cost of service.
| | | | | | | | | | | | | | | | | | | | | |
| | Year Ended December 31, |
| | 2020 | | 2019 | | | 2018 |
| | (Thousands of dollars) |
| Natural gas sales to customers | | $ | 1,381,141 | | | $ | 1,512,886 | | | | $ | 1,495,250 | |
| Transportation revenues | | 113,855 | | | 114,014 | | | | 109,658 | |
| Miscellaneous revenues | | 15,505 | | | 20,579 | | | | 21,710 | |
| Total revenues from contracts with customers | | 1,510,501 | | | 1,647,479 | | | | 1,626,618 | |
| Other revenues - natural gas sales related | | 8,299 | | | (4,699) | | | | (2,806) | |
| Other revenues | | 11,468 | | | 9,950 | | | | 9,919 | |
| Total other revenues | | 19,767 | | | 5,251 | | | | 7,113 | |
| Total revenues | | $ | 1,530,268 | | | $ | 1,652,730 | | | | $ | 1,633,731 | |
See Note 15 for additional information regarding our regulatory assets for MGP remediation costs.
Ad-valorem tax represents the difference in Kansas Gas Service’s taxes incurred each year above or below the amount approved in base rates. This difference is deferred as a regulatory asset or liability for a 12-month period. Kansas Gas Service then applies an adjustment to customers’ bills to refund the over-collected revenue or bill the under-collected revenue over the subsequent 12 months.
Weather normalization represents revenue over- or under-recovered through the WNA rider in Kansas. This amount is deferred as a regulatory asset or liability for a 12-month period. Kansas Gas Service then applies an adjustment to customers’ bills for 12 months to refund the over-collected revenue or bill the under-collected revenue.
The customer credit deferrals and the noncurrent regulatory liability for income tax rate changes represents deferral of the effects of enacted federal and state income tax rate changes on our ADIT and the effects of these changes on our rates. See Note 12 for additional information regarding the impact of income tax rate changes.
Recovery through rates resulted in amortization of regulatory assets of approximately $14.7 million, $9.4 million and $5.5 million for the years ended December 31, 2023, 2022 and 2021, respectively.
4.CREDIT FACILITY AND SHORT-TERM NOTES PAYABLEDEBT
In October 2019,2023, we exercised a one-year extensionentered into an agreement that increased the capacity of the ONE Gas Credit Agreement and amendedto $1.2 billion from $1.0 billion.
In March 2023, we entered into an extension agreement related to the agreement to provideONE Gas Credit Agreement that we may extendextended the maturity date by one year, subject to March 16, 2028, from March 16, 2027.
Other than the lenders’ consent, two additional times. increased commitments and term extension, all other terms and conditions of the ONE Gas Credit Agreement remain in full force and effect.
The ONE Gas Credit Agreement remainsprovides for a $700 million$1.2 billion revolving unsecured credit facility and includes a $20 million letter of credit subfacility and a $60 million swingline subfacility. We are able tocan request an increase in commitments of up to an additional $500$300 million upon satisfaction of customary conditions, including receipt of commitments from either new lenders or increased commitments from existing lenders. The ONE Gas Credit Agreement expires in October 2024, and is available to provide liquidity for working capital, capital expenditures, acquisitions and mergers, the issuance of letters of credit and for other general corporate purposes.
The ONE Gas Credit Agreement contains certain financial, operational and legal covenants. Among other things, these covenants include maintaining ONE Gas’ total debt-to-capital ratio of no more than 70 percent at the end of any calendar quarter. At December 31, 2023, our total debt-to-capital ratio was 52 percent and we were in compliance with all covenants under the ONE Gas Credit Agreement. We may reduce the unutilized portion of the ONE Gas Credit Agreement in whole or in part without premium or penalty. The ONE Gas Credit Agreement contains customary events of default. Upon the occurrence of certain events of default, the obligations under the ONE Gas Credit Agreement may be accelerated and the commitments may be terminated. The ONE Gas Credit Agreement also contains certain financial, operational and legal covenants. Among other things, these covenants include maintaining ONE Gas’ total debt-to-capital ratio of no more than 70 percent at the end of any calendar quarter. The ONE Gas Credit Agreement also contains customary affirmative and negative covenants, including covenants relating to liens, indebtedness of subsidiaries, investments, changes in the nature of business, fundamental changes, transactions with affiliates, burdensome agreements, and use of proceeds. In the event of a breach of certain covenants by ONE Gas, amounts outstanding under the ONE Gas Credit Agreement may become due and payable immediately. At December 31, 2020, our total debt-to-capital ratio was 47 percent and we were in compliance with all covenants under the ONE Gas Credit Agreement.
The ONE Gas Credit Agreement contains provisions for an applicable margin rate and an annual facility fee, both of which adjust with changes in our credit rating. Based on our current credit ratings, borrowings, if any, will accrue interest at LIBOR plus 79.5 basis points, and the annual facility fee is 8 basis points.
In April 2020, we entered into the ONE Gas 364-day Credit Agreement. The ONE Gas 364-day Credit Agreement is a $250 million revolving unsecured credit facility containing various customary conditions to borrowing and affirmative, negative and financial ratio maintenance covenants, all of which are substantially the same as those of the ONE Gas Credit Agreement. The ONE Gas 364-day Credit Agreement also contains provisions for an applicable margin rate and a quarterly facility fee, both of which adjust with changes in our credit rating. Based on our current credit ratings, borrowings, if any, will accrue interest at LIBOR plus 115 basis points, and the quarterly facility fee is 10 basis points.
Both the ONE Gas Credit Agreement and the ONE Gas 364-day Credit Agreement utilize LIBOR as the reference rate for determining interest to accrue on borrowings under the respective agreements. In the event LIBOR is not available, and such circumstances are unlikely to be temporary, our lenders for each respective agreement may establish an alternative interest rate for the impacted loans by replacing LIBOR with one or more secured overnight financing-based rates or another alternate benchmark rate.
At December 31, 2020,2023, we had $1.2$1.4 million in letters of credit issued and 0no borrowings under the ONE Gas Credit Agreement, or the ONE Gas 364-day Credit Agreement, with $948.8 millionapproximately $1.2 billion of combined remaining credit, which is available to repay our commercial paper borrowings.
We have aIn November 2023, we increased the capacity of our commercial paper program under whichto $1.2 billion from $1.0 billion.
Under our commercial paper program, we may issue unsecured commercial paper up to a maximum amount of $700 million$1.2 billion to fund short-term borrowing needs. The maturities of the commercial paper notes may vary but may not exceed 270 days from the date of issue. The commercialCommercial paper notes areis generally sold generally at par less a discount representing an interest factor. At December 31, 2020,2023 and December 31, 2022, we had $418.2$88.5 million and $552.0 million of commercial paper outstanding. Theoutstanding with a weighted-average interest rate on our commercial paper was 0.18of 5.60 percent and 1.834.75 percent, at December 31, 2020 and 2019, respectively.
5.LONG-TERM DEBT
The table below presents a summary of our long-term debt outstanding for the periods indicated:
| | | | | | | | | | | | | | |
| | Interest rate at December 31, 2023 | December 31, 2023 | December 31, 2022 |
| | | (Thousands of dollars) |
| Senior Notes due: | | | | |
| February 2024 | | 3.610% | $ | 300,000 | | $ | 300,000 | |
| March 2024 | | 1.100% | 473,000 | | 473,000 | |
| April 2029 | | 5.100% | 300,000 | | — | |
| May 2030 | | 2.000% | 300,000 | | 300,000 | |
| September 2032 | | 4.250% | 300,000 | | 300,000 | |
| February 2044 | | 4.658% | 600,000 | | 600,000 | |
| November 2048 | | 4.500% | 400,000 | | 400,000 | |
| Total Senior Notes | | | 2,673,000 | | 2,373,000 | |
| KGSS-I Securitized Utility Tariff Bonds | | 5.486% | 315,284 | | 336,000 | |
| Other | | 8.000% | 1,238 | | 1,250 | |
| Unamortized discounts on long-term debt | | | (7,615) | | (7,636) | |
| Debt issuance costs (a) | | | (21,092) | | (20,143) | |
| Total long-term debt, net | | | 2,960,815 | | 2,682,471 | |
| Less: current maturities of securitized utility tariff bonds, net | | | 27,430 | | 20,716 | |
| Less: current maturities of other long-term debt, net | | | 772,984 | | 12 | |
| Noncurrent portion of long-term debt, net | | | $ | 2,160,401 | | $ | 2,661,743 | |
(a) Includes issuance costs for the KGSS-I Securitized Utility Tariff Bonds of $5.3 million and $5.9 million, respectively.
Senior Notes - In April 2020, ONE GasDecember 2023, we issued $300 million of 2.005.10 percent senior notes due 2030.April 2029. The proceeds from the issuance were used to reduce the amount ofrepay amounts outstanding under our commercial paper program and for general corporate purposes.
Our long-term debt includesIn August 2022, we issued $300 million of 3.614.25 percent senior notes due in 2024, $300September 2032. The proceeds from the issuance were used to repay amounts outstanding under our commercial paper program and for general corporate purposes.
In August 2022, we called $750 million of 2.00the $1.0 billion of 0.85 percent senior notes due 2030, $600March 2023, $150 million of 4.658the $700 million of 1.10 percent senior notes due 2044,March 2024 and the remaining $400 million of 4.50outstanding floating-rate senior notes due March 2023, using the proceeds received from the Oklahoma government in our securitization transaction for Oklahoma Natural Gas.
In November 2022, we called the remaining $250 million of the $1.0 billion of 0.85 percent senior notes due 2048. March 2023 and $77 million of the $700 million of 1.10 percent senior notes due March 2024, using the proceeds from the securitization transaction for Kansas Gas Service.
The indenture governing our Senior Notes includes an event of default upon the acceleration of other indebtedness of $100 million or more. Such events of default would entitle the trustee or the holders of 25 percent in the aggregate principal amount of the outstanding Senior Notes to declare those Senior Notes immediately due and payable in full.
Depending on the series, we may redeem our Senior Notes at par, plus accrued and unpaid interest to the redemption date, starting three months or six months before their maturity dates. Prior to these dates, we may redeem these Senior Notes, in whole or in part, at a redemption price equal to the principal amount, plus accrued and unpaid interest and a make-whole
premium. The redemption price will never be less than 100 percent of the principal amount of the respective noteSenior Note plus accrued and unpaid interest to the redemption date. OurThe remaining $473 million of outstanding principal of our 1.10 percent senior notes due March 2024 can be called at par with a 30-day notice. Senior Notes are senior unsecured obligations, ranking equally in right of payment with all of our existing and future unsecured senior indebtedness.
ONE Gas 2021 Term Loan FacilitySecuritized Utility Tariff Bonds - On February 22, 2021, we entered intoNovember 18, 2022, KGSS-I issued $336 million of 5.486 percent Securitized Utility Tariff Bonds. The Securitized Utility Tariff Bonds have a term of 10 years with semi-annual principal repayments that began on August 1, 2023, and an expected weighted average life of 5.5 years. The bonds are governed by an indenture between KGSS-I and the ONE Gas 2021 Term Loan Facilityindenture trustee. The indenture contains certain covenants that restrict KGSS-I’s ability to enhance our liquidity position as partsell, transfer, convey, exchange, or otherwise dispose of its assets. See Notes 3 and 17 for additional discussion of the financing of our natural gas purchases in order to provide sufficient liquidity to satisfy our obligations as a result of the 2021 winter weather event and the repayment of indebtedness.securitization transactions.
The ONE Gas 2021 Term Loan Facility providesKGSS-I Securitized Utility Tariff Bonds are governed by an indenture between KGSS-I and the indenture trustee. The indenture contains certain covenants that restrict KGSS-I’s ability to sell, transfer, convey, exchange, or otherwise dispose of its assets. See Note 17 for a $2.5 billion unsecured term loan facility. Proceedsadditional discussion of the loans under the ONE Gas 2021 Term Loan Facility will be available for natural gas purchases as a result of the 2021 winter weather event and the repayment of indebtedness. The ONE Gas 2021 Term Loan Facility matures two years after the loans are funded under the ONE Gas 2021 Term Loan Facility. The loans under the ONE Gas 2021 Term Loan Facility will bear interest at a “Eurodollar Rate” or a “Base Rate” as specified in the ONE Gas 2021 Term Loan Facility, plus a margin specified in the ONE Gas 2021 Term Loan Facility which adjusts based on our debt ratings and the outstanding amount of loans remaining under the ONE Gas 2021 Term Loan Facility. Outstanding loans or commitments under the ONE Gas 2021 Term Loan Facility are required to be prepaid or reduced, as applicable, with the net cash proceeds received by us or any of our subsidiaries from certain debt and equity issuances.
The ONE Gas 2021 Term Loan Facility contains customary conditions to borrowing, and customary affirmative and negative covenants, including a financial ratio maintenance covenant requiring us to maintain a total debt-to-capital ratio of no more than 72.5 percent at the end of any calendar quarter through December 31, 2021, and 70 percent at the end of any calendar quarter thereafter. The ONE Gas 2021 Term Loan Facility also contains various customary events of default, the occurrence of which could result in a termination of the lenders’ commitments and the acceleration of all of our obligations thereunder.Kansas securitization transaction.
6.LEASES
We have operating leases for office facilities, gas storage facilities, IT equipment and right-of-way contracts. Our leases have remaining lease terms of one year1 to nine6 years, some of which include options to extend the leases for up to 10 years, and some of which include options to terminate the leases within specified time frames. We have not entered into any finance leases.
Our right-of-use asset is $37.2$21.0 million and $34.2$23.3 million as of December 31, 20202023 and 2019,2022, respectively, and is reported within other assets in our Consolidated Balance Sheets.consolidated balance sheets. Operating lease liabilities are reported within our other current liabilities and other liabilities in our consolidated balance sheets. Total operating lease cost including immaterial amounts attributable to short-term operating leases was $8.4$7.7 million, $8.5$7.8 million, and $8.2 million in 2020, 20192023, 2022 and 2018,2021, respectively.
In 2020,2023, we reassessed certain operating leases for office facilities and IT equipment which were extended or modified, resulting in an increase of $3.9 million in our right-of-use asset and operating lease liability of $9.8 million and $10.2 million, respectively.liability.
| | Years Ended | |
| December 31, |
| Year Ended | |
| Year Ended | |
| Year Ended | |
| December 31, | |
| December 31, | |
| December 31, | |
| Other information related to operating leases | Other information related to operating leases | 2020 | 2019 | |
| (Millions of dollars) | |
| (Millions of dollars) | |
| (Millions of dollars) | |
| (Millions of dollars) | |
| Weighted-average remaining lease term | |
| Weighted-average remaining lease term | |
| Weighted-average remaining lease term | Weighted-average remaining lease term | 7 years | |
| Weighted-average discount rate | Weighted-average discount rate | 2.81% | 3.62% | |
| Weighted-average discount rate | |
| Weighted-average discount rate | |
| Supplemental cash flows information | |
| Supplemental cash flows information | |
| Supplemental cash flows information | Supplemental cash flows information | | |
| Lease payments | Lease payments | $ | (8.0) | | $ | (8.4) | | |
| Lease payments | |
| Lease payments | |
| Right-of-use assets obtained in exchange for lease obligations | Right-of-use assets obtained in exchange for lease obligations | $ | 9.8 | | $ | 9.5 | | |
| Right-of-use assets obtained in exchange for lease obligations | |
| Right-of-use assets obtained in exchange for lease obligations | |
| | | | | | | | | | | | | | |
| | |
| | December 31, |
| Future minimum lease payments under non-cancellable operating leases | | 2023 | | | | | | |
| | (Millions of dollars) |
| 2024 | | $ | 6.7 | | | | | | | |
| 2025 | | 4.9 | | | | | | | |
| 2026 | | 3.3 | | | | | | | |
| 2027 | | 3.1 | | | | | | | |
| 2028 | | 2.8 | | | | | | | |
| Thereafter | | 1.4 | | | | | | | |
| Total future minimum lease payments | | $ | 22.2 | | | | | | | |
| Imputed interest | | (1.9) | | | | | | | |
| Total operating lease liability | | $ | 20.3 | | | | | | | |
| | | | | | | | |
| Consolidated balance sheets as of December 31, 2023 | | | | | | | | |
| Current operating lease liability | | $ | 6.0 | | | | | | | |
| Long-term operating lease liability | | 14.3 | | | | | | | |
| Total operating lease liability | | $ | 20.3 | | | | | | | |
| | | | | | | | | | | | | | |
| | |
| | December 31, |
| Future minimum lease payments under non-cancellable operating leases | | 2020 | | | | | | |
| | (Millions of dollars) |
| 2021 | | $ | 7.9 | | | | | | | |
| 2022 | | 7.4 | | | | | | | |
| 2023 | | 6.2 | | | | | | | |
| 2024 | | 4.7 | | | | | | | |
| 2025 | | 4.1 | | | | | | | |
| Thereafter | | 11.0 | | | | | | | |
| Total future minimum lease payments | | $ | 41.3 | | | | | | | |
| Imputed interest | | (3.5) | | | | | | | |
| Total operating lease liability | | $ | 37.8 | | | | | | | |
| | | | | | | | |
| Consolidated balance sheets as of December 31, 2020 | | | | | | | | |
| Current operating lease liability | | $ | 7.0 | | | | | | | |
| Long-term operating lease liability | | 30.8 | | | | | | | |
| Total operating lease liability | | $ | 37.8 | | | | | | | |
7.EQUITY
Preferred Stock - At December 31, 2020,2023, we had 50 million, $0.01 par value, authorized shares of preferred stock available. We have not issued or established any classes or series of shares of preferred stock.
Common Stock - At December 31, 2020,2023, we had approximately 196.8193.5 million shares of authorized common stock available for issuance.
Treasury SharesEquity Issuances - In 2019,On December 28, 2023, we were authorizedsettled under forward contracts 1,032,403 shares (289,403 from forwards related to purchase treasury sharesan at-the-market equity distribution agreement and 743,000 from forwards related to be used to offset shares issued underunderwriting agreements) of our equity compensation plan and the ESPP. Our Boardcommon stock for net proceeds of Directors established an annual limit of $20 million of treasury stock purchases, exclusive of funds received through the dividend reinvestment and the ESPP. Stock purchases could have been made in the open market or in private transactions at times, and in amounts that we deemed appropriate. There was no guarantee as to the exact number of shares that we would have purchased, and we terminated the program in 2019.$79.0 million.
At-the-Market Equity Program - In February 2020,December 2023, we initiatedamended the forward sale agreement we entered into in March 2023 to extend the maturity date of 657,000 shares to December 31, 2024 from December 29, 2023. The amended forward sale agreement provides for settlement on a date, or dates, to be specified at our discretion, but which will occur no later than December 31, 2024, for 1,257,000 shares of common stock.
In September 2023, we entered into an underwriting agreement and two forward sale agreements for 1.2 million and 180,000 shares of our common stock, respectively. The forward sale agreements provide for settlement on a date, or dates, to be specified at our discretion, but which will occur no later than December 31, 2024.
In June 2023, we executed forward sale agreements under our current at-the-market equity program by enteringfor 926,465 shares of our common stock.
In March 2023, we entered into an underwriting agreement and a forward sale agreement for 2.0 million shares of our common stock. The forward sale agreement provided for settlement on a date, or dates, to be specified at our discretion, but which will occur no later than December 29, 2023, for 1.4 million shares of common stock and by December 31, 2024, for the remaining balance.
In February 2023, we entered into an at-the-market equity distribution agreement under which we may issue and sell shares of our common stock with an aggregate offering price up to $250 million (including any shares of common stock that may be sold pursuant to the master forward sale confirmation entered into$300 million. This at-the-market equity program replaced our previous at-the-market equity program, which began in connection with the equity distribution agreementFebruary 2020, and the related supplemental confirmations).expired in February 2023. Sales of common stock are made by means of ordinary brokers’ transactions on the NYSE, in block transactions or as otherwise agreed to between us and the sales agent. We are under no obligation to offer and sell common stock under the program. At December 31, 2020,2023, we had $225.5 million of equity available for issuance under the program.
The following table summarizes all of our outstanding forward sale agreements at December 31, 2023:
| | | | | | | | | | | | | | |
| Maturity | Original Shares | Remaining Shares | Net Proceeds Available
(in thousands) | Forward Price |
| December 31, 2024 | 926,465 | | 926,465 | | $ | 74,396 | | $ | 80.30 | |
| December 31, 2024 | 2,000,000 | | 1,257,000 | | 96,709 | | 76.94 | |
| December 31, 2024 | 1,200,000 | | 1,200,000 | | 88,823 | | 74.02 | |
| December 31, 2024 | 180,000 | | 180,000 | | 13,315 | | 73.97 | |
| Total forward sale agreements | 4,306,465 | | 3,563,465 | | $ | 273,243 | | $ | 76.68 | |
For the year ended December 31, 2022, under our at-the-market equity distribution agreement we sold and issued and sold 179,514403,792 shares of our common stock for $13.6$35.0 million, generating proceeds, net of issuance costs, of $13.5 million, and had $236.4 million$34.7 million.
For the year ended December 31, 2022, we executed forward sale agreements related to our at-the-market equity distribution agreement for 1,451,474 shares of equity availableour common stock. On December 30, 2022, we settled forward sales agreements with respect to 1,162,071 shares of our common stock for issuance under the program.net proceeds of $93.8 million.
Dividends Declared - In 2020For the years ended December 31, 2023 and 2019,2022, we declared and paid dividends of $2.16$2.60 per share ($0.540.65 per share quarterly) and $2.00$2.48 per share ($0.500.62 per share quarterly), respectively. In January 2021,2024, we declared a dividend of $0.58$0.66 per share ($2.322.64 per share on an annualized basis) for shareholders of record as of February 23, 2024, payable on February 19, 2021, payable March 5, 2021.8, 2024.
8.ACCUMULATED OTHER COMPREHENSIVE LOSS
The following table sets forth the balance in accumulated other comprehensive loss for the periods indicated:
| | | | | | | | |
| | Accumulated Other Comprehensive LossIncome (Loss) |
| | (Thousands of dollars) |
January 1, 20192022 | | $ | (4,086)(6,527) | |
| Pension and other postemployment benefit plans obligations | | |
| Other comprehensive income before reclassification, net of tax of $(1,669) | | 5,701 | |
| Amounts reclassified from accumulated other comprehensive income (loss), net of tax of $(36) | | 122 | |
| Other comprehensive income | | 5,823 | |
| December 31, 2022 | | (704) |
| Pension and other postemployment benefit plans obligations | | |
Other comprehensive income before reclassification, net of tax of $692 | | (2,074) | |
Amounts reclassified from accumulated other comprehensive loss, net of tax of $(213) | | 639 | |
Other comprehensive loss | | (1,435) | |
Reclassification of stranded tax effects (a) | | (1,218) | |
December 31, 2019 | | (6,739) | |
Pension and other postemployment benefit plans obligations | | |
Other comprehensive loss before reclassification, net of tax of $587$140 | | (479) | | (1,932) | |
Amounts reclassified from accumulated other comprehensive loss,income, net of tax of $(298)$— | | 8941 | |
| Other comprehensive loss | | (1,038)(478) | |
December 31, 20202023 | | $ | (7,777)(1,182) | |
(a) Reflects the impact of the adoption of ASU 2018-02 in fiscal year 2019 related to stranded tax effects in accumulated other comprehensive loss as a result of the Tax Cuts and Jobs Act of 2017. See Note 1 for additional information regarding our adoption of this standard.
The following table sets forth the effect of reclassifications from accumulated other comprehensive loss
onin our
Consolidated Statementsconsolidated statements of
Incomeincome for the periods indicated:
| | | | | | | | | | | | | | | | | | | | | | | |
| | | | | | | Affected Line Item in the |
| Details about Accumulated Other Comprehensive | | Years Ended December 31, | Consolidated Statements of |
| Loss Components | | 2020 | | 2019 | | 2018 | Income |
| | (Thousands of dollars) | |
| Pension and other postemployment benefit plan obligations (a) | | | | | | | |
| Amortization of net loss | | $ | 42,492 | | | $ | 35,283 | | | $ | 43,800 | | |
| Amortization of unrecognized prior service cost | | (117) | | | (673) | | | (4,567) | | |
| | 42,375 | | | 34,610 | | | 39,233 | | |
| Regulatory adjustments (b) | | (41,183) | | | (33,758) | | | (38,151) | | |
| | 1,192 | | | 852 | | | 1,082 | | Income before income taxes |
| | (298) | | | (213) | | | (271) | | Income tax expense |
| Total reclassifications for the period | | $ | 894 | | | $ | 639 | | | $ | 811 | | Net income |
| | | | | | | | | | | | | | | | | | | | | | | |
| | | | Years Ended | | Affected Line Item in the |
| Details About Accumulated Other | | | | December 31, | | Consolidated Statements |
| Comprehensive Loss Components | | | | | 2023 | 2022 | 2021 | | of Income |
| | | | | (Thousands of dollars) | | |
| Pension and other postemployment benefit plan obligations (a) | | | | | | | | | |
| Amortization of net loss | | | | | $ | 1,960 | | $ | 17,010 | | $ | 45,896 | | | |
| Amortization of unrecognized prior service cost | | | | | 525 | | 289 | | (279) | | | |
| | | | | 2,485 | | 17,299 | | 45,617 | | | |
| Regulatory adjustments (b) | | | | | (2,484) | | (17,141) | | (44,055) | | | |
| | | | | 1 | | 158 | | 1,562 | | | Income before income taxes |
| | | | | — | | (36) | | (390) | | | Income tax expense |
| Total reclassifications for the period | | | | | $ | 1 | | $ | 122 | | $ | 1,172 | | | Net income |
(a) These components of accumulated other comprehensive loss are included in the computation of net periodic benefit cost. See Note 1411 for additional information regardingdetail of our net periodic benefit cost.
(b) Regulatory adjustments represent pension and other postemployment benefit costs expected to be recovered through rates and are deferred as part of our regulatory assets. See Note 113 for additional information regarding ourdisclosures of regulatory assets and liabilities.
9.EARNINGS PER SHARE
Basic EPS is calculated by dividing net income by the daily weighted-average number of common shares outstanding during the periods presented, which includes fully vested stock awards that have not yet been issued as common stock. Diluted EPS is based on shares outstanding for the calculation of basic EPS, plus unvested stock awards granted under our compensation plans and equity forward sale agreements, but only to the extent these instruments dilute earnings per share.
The following tables set forth the computation of basic and diluted EPS from continuing operations for the periods indicated:
| | | | | | | | | | | | | | | | | |
| | Year Ended December 31, 2020 |
| | Income | | Shares | | Per Share
Amount |
| | (Thousands, except per share amounts) |
| Basic EPS Calculation | | | | | |
| Net income available for common stock | $ | 196,412 | | | 53,133 | | | $ | 3.70 | |
| Diluted EPS Calculation | | | | | |
| Effect of dilutive securities | 0 | | | 237 | | | |
| Net income available for common stock and common stock equivalents | $ | 196,412 | | | 53,370 | | | $ | 3.68 | |
| | | | | | | | | | | | | | | | | |
| | Year Ended December 31, 2019 |
| | Income | | Shares | | Per Share
Amount |
| | (Thousands, except per share amounts) |
| Basic EPS Calculation | | | | | |
| Net income available for common stock | $ | 186,749 | | | 52,895 | | | $ | 3.53 | |
| Diluted EPS Calculation | | | | | |
| Effect of dilutive securities | 0 | | | 345 | | | |
| Net income available for common stock and common stock equivalents | $ | 186,749 | | | 53,240 | | | $ | 3.51 | |
| | | | | | | | | | | | | | | | | |
| | Year Ended December 31, 2018 |
| | Income | | Shares | | Per Share
Amount |
| | (Thousands, except per share amounts) |
| Basic EPS Calculation | | | | | |
| Net income available for common stock | $ | 172,234 | | | 52,693 | | | $ | 3.27 | |
| Diluted EPS Calculation | | | | | |
| Effect of dilutive securities | 0 | | | 336 | | | |
| Net income available for common stock and common stock equivalents | $ | 172,234 | | | 53,029 | | | $ | 3.25 | |
| | | | | | | | | | | | | | | | | |
| |
| | | | | |
| |
| | | | | |
| | | | | |
| | | | | |
| | | | | |
| | | | | |
| | | | | |
| |
| | | | | |
| |
| | | | | |
| | | | | |
| | | | | |
| | | | | |
| | | | | |
| | | | | |
| Year Ended December, 31, 2023 |
| Income | | Shares | | Per Share
Amount |
| (Thousands, except per share amounts) |
| Basic EPS Calculation | | | | | |
| Net income available for common stock | $ | 231,232 | | | 55,600 | | | $ | 4.16 | |
| Diluted EPS Calculation | | | | | |
| Effect of dilutive securities | — | | | 260 | | | |
| Net income available for common stock and common stock equivalents | $ | 231,232 | | | 55,860 | | | $ | 4.14 | |
| | | | | |
| Year Ended December, 31, 2022 |
| Income | | Shares | | Per Share
Amount |
| (Thousands, except per share amounts) |
| Basic EPS Calculation | | | | | |
| Net income available for common stock | $ | 221,742 | | | 54,207 | | | $ | 4.09 | |
| Diluted EPS Calculation | | | | | |
| Effect of dilutive securities | — | | | 131 | | | |
| Net income available for common stock and common stock equivalents | $ | 221,742 | | | 54,338 | | | $ | 4.08 | |
| | | | | |
| Year Ended December, 31, 2021 |
| Income | | Shares | | Per Share
Amount |
| (Thousands, except per share amounts) |
| Basic EPS Calculation | | | | | |
| Net income available for common stock | $ | 206,434 | | | 53,575 | | | $ | 3.85 | |
| Diluted EPS Calculation | | | | | |
| Effect of dilutive securities | — | | | 99 | | | |
| Net income available for common stock and common stock equivalents | $ | 206,434 | | | 53,674 | | | $ | 3.85 | |
| | | | | |
10.DERIVATIVE FINANCIAL INSTRUMENTS AND FAIR VALUE MEASUREMENTS
Derivative Instruments -At December 31, 2020, we held purchased natural gas call options for the heating season ending March 2021, with total notional amounts of 14.7 Bcf, for which we paid premiums of $6.7 million, and which had a fair value of $0.8 million. At December 31, 2019, we held purchased natural gas call options for the heating season ended March 2020, with total notional amounts of 14.3 Bcf, for which we paid premiums of $4.4 million, and which had a fair value of $0.3 million. The premiums paid and any cash settlements received are recorded as part of our unrecovered purchased-gas costs in current regulatory assets as these contracts are included in, and recoverable through, the purchased-gas cost adjustment mechanisms. Additionally, changes in fair value associated with these contracts are deferred as part of our unrecovered purchased-gas costs in our consolidated balance sheets. Our natural gas call options are classified as Level 1, as fair value amounts are based on unadjusted quoted prices in active markets, including NYMEX-settled prices. There were 0 transfers between levels for the periods presented.
Other Financial Instruments -The approximate fair value of cash and cash equivalents, accounts receivable and accounts payable is equal to book value, due to the short-term nature of these items. Our cash and cash equivalents are comprised of cash and money market accounts, which we consider to be Level 1. At December 31, 2020, other current and noncurrent assets included $1.6 million of corporate bonds and $3.2 million of United States treasury notes, for which the fair value approximates our cost, and are classified as Level 2 and Level 1, respectively. At December 31, 2019, other current and noncurrent assets included $2.6 million of corporate bonds and $3.0 million of United States treasury notes, for which the fair value approximates our cost, and are classified as Level 2 and Level 1, respectively.
Short-term notes payable and commercial paper are due upon demand and, therefore, the carrying amounts approximate fair value and are classified as Level 1. The book value of our long-term debt, including current maturities, was $1.6 billion and $1.3 billion at December 31, 2020 and 2019, respectively. The estimated fair value of our long-term debt, including current maturities, was $2.0 billion and $1.5 billion at December 31, 2020 and 2019, respectively. The estimated fair value of our long-term debt at December 31, 2020 and December 31, 2019, was determined using quoted market prices, and is considered Level 2.
11.REGULATORY ASSETS AND LIABILITIES
The tables below present a summary of regulatory assets, net of amortization, and liabilities for the periods indicated:
| | | | | | | | | | | | | | | | | | | | | | | | | | |
| | | | December 31, 2020 |
| | Remaining Recovery Period | | Current | | Noncurrent | | Total |
| | | | (Thousands of dollars) |
| Under-recovered purchased-gas costs | | 1 year | | $ | 16,502 | | | $ | 0 | | | $ | 16,502 | |
| Pension and other postemployment benefit costs | | See Note 14 | | 16,541 | | | 341,266 | | | 357,807 | |
| Reacquired debt costs | | 7 years | | 812 | | | 4,866 | | | 5,678 | |
| MGP remediation costs | | 15 years | | 98 | | | 18,711 | | | 18,809 | |
| Ad-valorem tax | | 1 year | | 5,558 | | | 0 | | | 5,558 | |
| WNA | | 1 year | | 4,806 | | | 0 | | | 4,806 | |
| Customer credit deferrals | | 1 year | | 10,267 | | | 0 | | | 10,267 | |
| Other | | 1 to 18 years | | 2,189 | | | 2,113 | | | 4,302 | |
| Total regulatory assets, net of amortization | | | | 56,773 | | | 366,956 | | | 423,729 | |
| Income tax rate changes (a) | | (a) | | 0 | | | (547,563) | | | (547,563) | |
| Over-recovered purchased-gas costs | | 1 year | | (15,761) | | | 0 | | | (15,761) | |
| Total regulatory liabilities | | | | (15,761) | | | (547,563) | | | (563,324) | |
| Net regulatory assets and liabilities | | | | $ | 41,012 | | | $ | (180,607) | | | $ | (139,595) | |
(a) Includes the reclassification of $81.5 million of deferred taxes related to the elimination of state income tax for utilities in Kansas. Recovery period varies by jurisdiction. See discussion below for additional information regarding our regulatory liabilities related to federal income tax rate changes.
| | | | | | | | | | | | | | | | | | | | | | | | | | |
| | | | December 31, 2019 |
| | Remaining Recovery Period | | Current | | Noncurrent | | Total |
| | | | (Thousands of dollars) |
| Under-recovered purchased-gas costs | | 1 year | | $ | 17,172 | | | $ | 0 | | | $ | 17,172 | |
| Pension and other postemployment benefit costs | | See Note 14 | | 21,213 | | | 373,266 | | | 394,479 | |
| Reacquired debt costs | | 8 years | | 812 | | | 5,677 | | | 6,489 | |
| MGP remediation costs | | 15 years | | 98 | | | 9,709 | | | 9,807 | |
| Ad-valorem tax | | 1 year | | 2,921 | | | 0 | | | 2,921 | |
| Other | | 1 to 19 years | | 5,224 | | | 2,384 | | | 7,608 | |
| Total regulatory assets, net of amortization | | | | 47,440 | | | 391,036 | | | 438,476 | |
| Income tax rate changes (a) | | (a) | | (10,297) | | | (503,518) | | | (513,815) | |
| Over-recovered purchased-gas costs | | 1 year | | (27,623) | | | 0 | | | (27,623) | |
| WNA | | 1 year | | (7,281) | | | 0 | | | (7,281) | |
| Total regulatory liabilities | | | | (45,201) | | | (503,518) | | | (548,719) | |
| Net regulatory assets and liabilities | | | | $ | 2,239 | | | $ | (112,482) | | | $ | (110,243) | |
(a) Recovery period varies by jurisdiction. See discussion below for additional information regarding our regulatory liabilities related to federal income tax rate changes.
Regulatory assets in our consolidated balance sheets, as authorized by various regulatory authorities, are probable of recovery. Base rates and certain riders are designed to provide a recovery of costs during the period rates are in effect, but do not generally provide for a return on investment for amounts we have deferred as regulatory assets. All of our regulatory assets are subject to review by the respective regulatory authorities during future regulatory proceedings. We are not aware of any evidence that these costs will not be recoverable through either rate riders or base rates, and we believe that we will be able to recover such costs, consistent with our historical recoveries.
Purchased-gas costs represent the natural gas costs that have been over- or under-recovered from customers through the purchased-gas cost adjustment mechanisms, and includes natural gas utilized in our operations and premiums paid and any cash settlements received from our purchased natural gas call options.
We amortize reacquired debt costs in accordance with the accounting guidelines prescribed by the OCC and KCC.
Weather normalization represents revenue over- or under-recovered through the WNA rider in Kansas. This amount is deferred as a regulatory asset or liability for a 12-month period. Kansas Gas Service then applies an adjustment to the customers’ bills for 12 months to refund the over-collected revenue or bill the under-collected revenue.
Ad-valorem tax represents an increase or decrease in Kansas Gas Service’s taxes above or below the amount approved in a rate case. This amount is deferred as a regulatory asset or liability for a 12-month period. Kansas Gas Service then applies an adjustment to the customers’ bills for 12 months to refund the over-collected revenue or bill the under-collected revenue.
The current portion of the regulatory liability for income tax rate changes represents the effect of the Tax Cuts and Jobs Act of 2017. In each state, we received accounting orders requiring us to establish a regulatory liability for the difference in taxes included in our rates that have been calculated based on a 35 percent federal corporate income tax rate and the new 21 percent federal corporate income tax rate effective in January 2018 and to refund the reduction in ADIT due to the remeasurement resulting from the change in the exacted tax rate.
The customer credit deferrals and the noncurrent regulatory liability for income tax rate changes represents deferral of the effects of enacted federal and state income tax rate changes on our ADIT and the effects of these changes on our rates.
The noncurrent regulatory liability for income tax changes reflects EDIT associated with the remeasurement of our ADIT as a result of a bill amending the Kansas state income tax code exempting public utilities regulated by the KCC from paying Kansas state income taxes beginning January 1, 2021, that was signed into law in May 2020 and the Tax Cuts and Jobs Act of 2017. Our customers began receiving credit for this liability as determined by our regulators in 2019. Our customers receive credit annually based upon amortization periods in compliance with the tax normalization rules for the portions of EDIT stipulated by the Code and varying periods of five to ten years for all other components of EDIT. See Note 15 for additional information regarding our regulatory liabilities for income tax rate changes.
See Note 17 for additional information regarding our regulatory assets for MGP remediation costs.
We have received accounting orders in each of our jurisdictions authorizing us to accumulate and defer for regulatory purposes certain incremental costs incurred, including bad debt expenses, and certain lost revenues, net of offsetting expense reductions associated with COVID-19. Pursuant to these orders, the recovery of any net incremental costs and lost revenues will be determined in future rate cases or alternative rate recovery filings in each jurisdiction. For financial reporting purposes, any amounts deferred as a regulatory asset for future recovery under these accounting orders must be probable of recovery. At December 31, 2020, no regulatory assets have been recorded. We continue to evaluate the impacts of COVID-19 on our business and will record regulatory assets for financial reporting purposes at such time as recovery is deemed probable.
Recovery through rates resulted in amortization of regulatory assets of approximately $3.2 million, $2.5 million and $1.7 million for the years ended December 31, 2020, 2019 and 2018, respectively. For the years ended December 31, 2020 and 2019, income tax expense reflects credits of $17.4 million and $12.8 million, respectively, for the amortization of the regulatory liability associated with EDIT that was returned to customers.
12.PROPERTY, PLANT AND EQUIPMENT
The following table sets forth our property, plant and equipment by property type, for the periods indicated:
| | | | | | | | | | | | | | |
| | December 31, | | December 31, |
| | 2020 | | 2019 |
| | (Thousands of dollars) |
| Natural gas distribution pipelines and related equipment | | $ | 5,517,488 | | | $ | 5,117,496 | |
| Natural gas transmission pipelines and related equipment | | 586,360 | | | 549,788 | |
| General plant and other | | 657,037 | | | 612,984 | |
| Construction work in process | | 77,718 | | | 152,851 | |
| Property, plant and equipment | | 6,838,603 | | | 6,433,119 | |
| Accumulated depreciation and amortization | | (1,971,546) | | | (1,867,893) | |
| Net property, plant and equipment | | $ | 4,867,057 | | | $ | 4,565,226 | |
We compute depreciation expense by applying composite, straight-line rates of approximately 2.5 percent to 3.5 percent that were approved by various regulatory authorities.
We recorded capitalized interest of $4.2 million, $4.6 million and $3.4 million for the years ended December 31, 2020, 2019 and 2018, respectively. We incurred liabilities for construction work in process that had not been paid at December 31, 2020, 2019 and 2018 of $24.3 million, $20.9 million and $15.6 million, respectively. Such amounts are not included in capital expenditures or in the change of working capital items on our Consolidated Statements of Cash Flows.
13.SHARE-BASED PAYMENTS
The ECP provides for the granting of stock-based compensation, including incentive stock options, nonstatutory stock options, stock bonus awards, restricted stock awards, restricted stock unit awards, performance stock awards and performance unit awards to eligible employees and the granting of stock awards to nonemployeenon-employee directors. At December 31, 2020,2023, we have 4.3 million shares of common stock reserved for issuance under the ECP. In May 2018, shareholders approved making an additional 1.8 million shares available under the ECP, less the number of shares remaining available for future grants on the effective date. At December 31, 2020,2023, we had approximately 1.91.8 million shares available for issuance under the ECP, which reflect shares issued and estimated shares expected to be issued upon vesting of outstanding awards granted under the plan, less forfeitures. The plan allows for the deferral of awards granted in stock or cash, in accordance with the Code section 409A requirements.
Compensation expense for our ECP share-based payment plans was $7.0$7.8 million, net of tax benefits of $2.6 million, for 2023, $6.8 million, net of tax benefits of $2.3 million, for 2020, $6.82022, and $7.5 million, net of tax benefits of $2.2$2.5 million, for 2019, and $6.1 million, net of tax benefits of $2.1 million, for 2018.2021.
Restricted Stock Unit Awards - We have granted restricted stock unit awards to key employees that vest over a service period of generally three years and entitle the grantee to receive shares of our common stock. Restricted stock unit awards granted accrue dividend equivalents in the form of additional restricted stock units prior to vesting. Restricted stock unit awards are
measured at fair value as if they were vested and issued on the grant date and adjusted for estimated forfeitures. Compensation expense is recognized on a straight-line basis over the vesting period of the award. A forfeiture rate of 3 percent per year based on historical forfeitures under our share-based payment plans is used.
Performance Stock Unit Awards - We have granted performance stock unit awards to key employees. The shares of common stock underlying the performance stock units vest at the expiration of a service period of generally three years if certain performance criteria are met by us as determined by the Executive Compensation Committee of the Board of Directors. Upon vesting, a holder of performance stock units is entitled to receive a number of shares of common stock equal to a percentage (0 percent to 200 percent) of the performance stock units granted, based on our total shareholder return over the vesting period, compared with the total shareholder return of a peer group of other utilities over the same period.
If paid, the outstanding performance stock unit awards entitle the grantee to receive shares of our common stock. The outstanding performance stock unit awards are equity awards with a market-based condition, which results in the compensation expense for these awards being recognized on a straight-line basis over the requisite service period, provided that the requisite service period is fulfilled, regardless of when, if ever, the market condition is satisfied. The performance stock unit awards granted accrue dividend equivalents in the form of additional performance stock units prior to vesting. The fair value of these performance stock units was estimated on the grant date based on a Monte Carlo model. The compensation expense on these awards will only be adjusted for forfeitures. A forfeiture rate of 3 percent per year based on historical forfeitures under our share-based payment plans is used.
Restricted Stock Unit Award Activity
As of December 31, 2020, there was $3.1 million of totalTotal unrecognized compensation expense related to the nonvested restricted stock unit awards was $4.0 million and $3.7 million as of December 31, 2023 and 2022, respectively, which is expected to be recognized over a weighted-average period of 1.71.8 years. The following tables set forth activity and various statistics for restricted stock unit awards outstanding under the respective plans for the period indicated:
| | Number of
Units | | Weighted-
Average Grant Date Fair Value |
| Nonvested at December 31, 2019 | | 104,398 | | | $ | 72.21 | |
| | Number of
Units | | | | Number of
Units | | Weighted-
Average Grant Date Fair Value |
| Nonvested at December 31, 2022 | |
| Granted | Granted | | 31,233 | | | $ | 96.21 | |
| Vested | Vested | | (34,066) | | | $ | 64.32 | |
| Forfeited | Forfeited | | (1,765) | | | $ | 78.89 | |
| Nonvested at December 31, 2020 | | 99,800 | | | $ | 82.29 | |
| Nonvested at December 31, 2023 | |
| | | | | 2020 | | 2019 | | 2018 | | | 2023 | | 2022 | | 2021 |
| Weighted-average grant date fair value (per share) | Weighted-average grant date fair value (per share) | | $ | 96.21 | | | $ | 83.94 | | | $ | 68.17 | |
| Fair value of shares granted (thousands of dollars) | Fair value of shares granted (thousands of dollars) | | $ | 3,005 | | | $ | 3,001 | | | $ | 2,583 | |
TheFor the years ended December 31, 2023, 2022 and 2021, the fair value of restricted stock vested was $3.3$2.8 million, $3.3$2.9 million, and $4.7$3.4 million, in 2020, 2019, and 2018, respectively.
Performance Stock Unit Award Activity
As of December 31, 2020, there was $6.7 million of totalTotal unrecognized compensation expenseexpenses related to the nonvested performance stock unit awards was $9.7 million and $8.0 million as of December 31, 2023 and 2022, respectively, which is expected to be recognized over a weighted-average period of 1.71.8 years. The following tables set forth activity and various statistics related to our performance stock unit awards and the assumptions used by us in the valuations of the 2020, 20192023, 2022 and 20182021 grants at the grant date:
| | Number of
Units | | Weighted-
Average Grant Date Fair Value |
| Nonvested at December 31, 2019 | | 218,176 | | | $ | 77.58 | |
| | Number of
Units | | | | Number of
Units | | Weighted-
Average Grant Date Fair Value |
| Nonvested at December 31, 2022 | |
| Granted | Granted | | 63,268 | | | $ | 102.77 | |
| Vested | Vested | | (69,107) | | | $ | 68.94 | |
| Forfeited | Forfeited | | (3,817) | | | $ | 84.10 | |
| Nonvested at December 31, 2020 | | 208,520 | | | $ | 87.97 | |
| Nonvested at December 31, 2023 | |
| | | | | | | | | | | | | | | | | | | | | | | |
| | 2020 | | 2019 | | 2018 | |
| Volatility (a) | | 16.40% | | 18.70% | | 18.80% | |
| Dividend yield | | 2.25% | | 2.38% | | 2.70% | |
| Risk-free interest rate (b) | | 1.40% | | 2.50% | | 2.38% | |
| | | | | | | | | | | | | | | | | | | | |
| | 2023 | | 2022 | | 2021 |
| Volatility (a) | | 29.20% | | 34.00% | | 32.70% |
| Dividend yield | | 3.18% | | 3.22% | | 3.19% |
| Risk-free interest rate (b) | | 4.37% | | 1.65% | | 0.20% |
(a) - Volatility based on historical volatility over three years using daily stock price observations of our peer utilities.
(b) - Using 3-year treasury.treasury rate.
| | 2020 | | 2019 | | 2018 |
| | 2023 | | | | 2023 | | 2022 | | 2021 |
| Weighted-average grant date fair value (per share) | Weighted-average grant date fair value (per share) | | $ | 102.77 | | | $ | 89.86 | | | $ | 74.04 | |
| Fair value of shares granted (thousands of dollars) | Fair value of shares granted (thousands of dollars) | | $ | 6,502 | | | $ | 6,401 | | | $ | 5,882 | |
TheFor the years ended December 31, 2023, 2022 and 2021, the fair value of performance stock vested was $10.2$3.7 million, $12.7$5.2 million, and $13.7$7.2 million, in 2020, 2019, and 2018, respectively.
Employee Stock Purchase Plan
We have reserved a total of 700 thousand1.25 million shares of common stock for issuance under our ESPP. Employees can choose to have up to 10 percent of their annual base pay withheld to purchase our common stock, subject to terms and limitations of the plan. The purchase price of the stock is 85 percent of the lower of the average market price of our common stock on the grant date or exercise date. Approximately 5045 percent, 4442 percent and 4544 percent of employees participated in the plan in 2020, 20192023, 2022 and 2018,2021, respectively. For the years ended December 31, 2023, 2022 and 2021, employees purchased 108,875, 86,657, and 89,240 shares, respectively, at an average price of $58.98, $65.21 and purchased 92,507 shares at $64.77 in 2020, 71,613 shares at $71.42 in 2019, and 76,231 shares at $63.01 in 2018.$63.41, respectively.
Compensation expense related to our ESPP, before taxes, was $1.2 million, $1.1 million $1.5and $1.1 million for the years ended December 31, 2023, 2022 and $1.0 million in 2020, 2019 and 2018,2021, respectively.
11. EMPLOYEE BENEFIT PLANS
Defined Benefit Pension and Other Postemployment Benefit Plans
Defined Benefit Pension Plans - We have a defined benefit pension plan and a supplemental executive retirement plan, both of which are closed to new participants. Certain employees of the Texas Gas Service division are entitled to benefits under a frozen cash-balance pension plan. We fund our defined benefit pension costs at a level needed to maintain or exceed the minimum funding levels required by the Employee Retirement Income Security Act of 1974, as amended, and the Pension Protection Act of 2006.
Other Postemployment Benefit Plans - We sponsor health and welfare plans that provide postemployment medical and life insurance benefits to certain employees who retire with at least five years of service. The postemployment medical plan is contributory based on hire date, age and years of service, with retiree contributions adjusted periodically, and contains other cost-sharing features such as deductibles and coinsurance.
Actuarial Assumptions - The following table sets forth the weighted-average assumptions used to determine benefit obligations for pension and postemployment benefits for the periods indicated:
| | December 31, |
| | December 31, | | | | December 31, |
| | | | 2020 | | 2019 | | | 2023 | | 2022 |
| Discount rate - pension plans | Discount rate - pension plans | | 2.80% | | 3.50% | Discount rate - pension plans | | 5.30% | | 5.60% |
| Discount rate - other postemployment plans | Discount rate - other postemployment plans | | 2.70% | | 3.40% | Discount rate - other postemployment plans | | 5.40% | | 5.70% |
| Compensation increase rate | Compensation increase rate | | 3.10% - 3.90% | | 3.10% - 4.00% | Compensation increase rate | | 3.50% - 4.30% | | 3.60% - 5.00% |
|
The following table sets forth the weighted-average assumptions used by us to determine the periodic benefit costs for pension and postemployment benefits for the periods indicated:
| | | Years Ended December 31, |
| | | | Years Ended December 31, | |
| | | | Years Ended December 31, | |
| | | | Years Ended December 31, | |
| | | | | 2020 | | 2019 | | 2018 | | | | | 2023 | | 2022 | | 2021 |
| Discount rate - pension plans | Discount rate - pension plans | | | 3.50% | | 4.40% | | 3.80% | Discount rate - pension plans | | | | 5.60% | | 3.05%/4.55% (a) | | 2.80% |
| Discount rate - other postemployment plans | Discount rate - other postemployment plans | | | 3.40% | | 4.40% | | 3.70% | Discount rate - other postemployment plans | | | | 5.70% | | 3.00% | | 2.70% |
| Expected long-term return on plan assets - pension plans | Expected long-term return on plan assets - pension plans | | | 7.20% | | 7.20% | | 7.25% | Expected long-term return on plan assets - pension plans | | | | 6.75% | | 6.40% | | 7.15% |
| Expected long-term return on plan assets - other postemployment plans | Expected long-term return on plan assets - other postemployment plans | | | 7.65% | | 7.35% | | 7.60% | Expected long-term return on plan assets - other postemployment plans | | | | 5.55% | | 5.85% | | 7.50% |
| Compensation increase rate | Compensation increase rate | | | 3.10% - 4.00% | | 3.20% - 4.00% | | 3.25% - 3.35% | Compensation increase rate | | | | 3.60% - 5.00% | | 3.10% - 5.00% | | 3.10% - 3.90% |
|
(a) Pension plans were remeasured as of April 30, 2022.
We determine our discount rates annually. We estimate our discount rate based upon a comparison of the expected cash flows associated with our future payments under our defined benefit pension and other postemployment obligations to a hypothetical bond portfolio created using high-quality bonds that closely match expected cash flows. Bond portfolios are developed by selecting a bond for each of the next 60 years based on the maturity dates of the bonds. Bonds selected to be included in the portfolios are only those rated by Moody’s as AA- or better and exclude callable bonds, bonds with less than a minimum issue size, yield outliers and other filtering criteria to remove unsuitable bonds.
We determine our overall expected long-term rate of return on plan assets based on our review of historical returns and economic growth models. We update our assumed mortality rates to incorporate new tables issued by the Society of Actuaries as needed.
Regulatory Treatment - The OCC, KCC and regulatory authorities in Texas have approved the recovery of pension costs and other postemployment benefits costs through rates for Oklahoma Natural Gas, Kansas Gas Service and Texas Gas Service, respectively. The costs recovered through rates are based on current funding requirements and the net periodic benefit cost for defined benefit pension and other postemployment costs. Differences, if any, between the net periodic benefit cost, net of deferrals, and the amount recovered through rates are reflected in earnings.
We historically have recovered defined benefit pension and other postemployment benefit costs through rates. We believe it is probable that regulators will continue to include the net periodic pension and other postemployment benefit costs in our cost of service.
We capitalize all eligible service cost and non-service cost components pursuant to the accounting requirements of ASC Topic 980 (Regulated Operations) for rate-regulated entities, as these costs are authorized by our regulators to be included in capitalized costs. OurNoncurrent regulatory assets in our consolidated balance sheets reflect the capitalized non-service cost components as a regulatory asset. We have recognized a regulatory asset of $6.0$2.2 million and $4.7$2.8 million as of December 31, 20202023 and December 31, 2019,2022, respectively. See Note 113 for additional information.
Obligations and Funded Status - The following table sets forth our defined benefit pension and other postemployment benefit plans, benefit obligations and fair value of plan assets for the periods indicated:
| | | | | | | | | | | | | | | | | | | | | | | |
| Pension Benefits | | Other Postemployment Benefits |
| December 31, | | December 31, |
| 2020 | | 2019 | | 2020 | | 2019 |
| Changes in Benefit Obligation | (Thousands of dollars) | | |
| Benefit obligation, beginning of period | $ | 1,001,368 | | | $ | 950,510 | | | $ | 230,490 | | | $ | 220,144 | |
| Service cost | 12,869 | | | 12,030 | | | 1,692 | | | 1,734 | |
| Interest cost | 34,179 | | | 40,670 | | | 7,557 | | | 9,318 | |
| Plan participants’ contributions | 0 | | | 0 | | | 3,500 | | | 3,697 | |
| Actuarial loss (gain) | 91,566 | | | 98,231 | | | 14,013 | | | 13,945 | |
| Benefits paid | (62,341) | | | (50,915) | | | (17,722) | | | (18,348) | |
| | | | | | | |
| | | | | | | |
| Settlements | 0 | | | (49,158) | | | 0 | | | 0 | |
| Benefit obligation, end of period | 1,077,641 | | | 1,001,368 | | | 239,530 | | | 230,490 | |
| | | | | | | |
| Change in Plan Assets | | | | | | | |
| Fair value of plan assets, beginning of period | 907,974 | | | 814,112 | | | 207,182 | | | 176,859 | |
| Actual return (loss) on plan assets | 140,939 | | | 162,785 | | | 35,837 | | | 38,772 | |
| Employer contributions | 1,011 | | | 29,199 | | | 2,098 | | | 6,202 | |
| Plan participants’ contributions | 0 | | | 0 | | | 3,500 | | | 3,697 | |
| Benefits paid | (62,341) | | | (50,915) | | | (17,722) | | | (18,348) | |
| Settlements | 0 | | | (47,207) | | | 0 | | | 0 | |
| Fair value of assets, end of period | 987,583 | | | 907,974 | | | 230,895 | | | 207,182 | |
| Benefit Obligation, net at December 31 | $ | (90,058) | | | $ | (93,394) | | | $ | (8,635) | | | $ | (23,308) | |
| | | | | | | |
| Current liabilities | $ | (1,056) | | | $ | (1,045) | | | $ | 0 | | | $ | 0 | |
| Noncurrent liabilities | (89,002) | | | (92,349) | | | (8,635) | | | (23,308) | |
| Benefit Obligation, net at December 31 | $ | (90,058) | | | $ | (93,394) | | | $ | (8,635) | | | $ | (23,308) | |
Benefits paid reflects $12.5 million of lump sum payments to certain terminated-vested participants. During 2019, we purchased a group annuity contract for $47.2 million, and transferred to a third-party insurance company liabilities of $49.2 million related to certain participants in our defined benefit pension plan. | | | | | | | | | | | | | | | | | | | | | | | |
| Pension Benefits | | Other Postemployment Benefits |
| December 31, | | December 31, |
| 2023 | | 2022 | | 2023 | | 2022 |
| Changes in Benefit Obligation | (Thousands of dollars) | | |
| Benefit obligation, beginning of period | $ | 784,633 | | | $ | 1,049,990 | | | $ | 168,342 | | | $ | 222,806 | |
| Service cost | 7,242 | | | 10,369 | | | 730 | | | 1,274 | |
| Interest cost | 42,428 | | | 36,150 | | | 9,154 | | | 6,448 | |
| Plan participants’ contributions | — | | | — | | | 2,823 | | | 3,035 | |
| Actuarial loss (gain) | 23,015 | | | (259,261) | | | (5,551) | | | (48,609) | |
| Benefits paid | (53,713) | | | (55,326) | | | (16,963) | | | (16,612) | |
| | | | | | | |
| Plan amendments | — | | | 2,711 | | | — | | | — | |
| | | | | | | |
| Benefit obligation, end of period | $ | 803,605 | | | $ | 784,633 | | | 158,535 | | | $ | 168,342 | |
| | | | | | | |
| Change in Plan Assets | | | | | | | |
| Fair value of plan assets, beginning of period | $ | 768,961 | | | $ | 1,013,244 | | | $ | 181,877 | | | $ | 231,994 | |
| Actual return (loss) on plan assets | 78,827 | | | (190,484) | | | 11,325 | | | (38,432) | |
| Employer contributions | 1,306 | | | 1,527 | | | 2,546 | | | 1,892 | |
| Plan participants’ contributions | — | | | — | | | 2,823 | | | 3,035 | |
| Benefits paid | (53,713) | | | (55,326) | | | (16,963) | | | (16,612) | |
| | | | | | | |
| Fair value of assets, end of period | 795,381 | | | 768,961 | | | 181,608 | | | 181,877 | |
| Benefit Asset (Obligation), net at December 31 | $ | (8,224) | | | $ | (15,672) | | | $ | 23,073 | | | $ | 13,535 | |
| | | | | | | |
| Other noncurrent assets | $ | 13,409 | | | $ | 5,267 | | | $ | 23,073 | | | $ | 13,535 | |
| Current liabilities | (1,368) | | | (1,352) | | | — | | | — | |
| Noncurrent liabilities | (20,265) | | | (19,587) | | | — | | | — | |
| Benefit Asset (Obligation), net at December 31 | $ | (8,224) | | | $ | (15,672) | | | $ | 23,073 | | | $ | 13,535 | |
The accumulated benefit obligation for our defined benefit pension plans was $1.0 billion$772.1 million and $937.8$746.8 million at December 31, 20202023 and 2019,2022, respectively. At December 31, 2020 and 2019, the accumulated benefit obligations of each of our plans exceeded the fair value of the related plan’s assets.
TheFor the years ended December 31, 2023 and 2022, the pension benefit obligations experienced an actuarial losslosses and gains of $91.6$23.0 million and $98.2$259.3 million, in 2020 and 2019, respectively, primarily due to the impact of decreasesincreases in the discount rates used to calculate the benefit obligations.
In 2021,2024, our contributions are expected to be $1.1$1.4 million to our defined benefit pension plans, and 0no contributions are expected to be made to our other postemployment benefit plans.
Components of Net Periodic Benefit Cost - The following tables set forth the components of net periodic benefit cost prior to regulatory deferrals, for our defined benefit pension and other postemployment benefit plans for the periodperiods indicated:
| | | | | | | | | | | | | | | | | |
| | | | | Pension Benefits |
| | | | Year Ended December 31, |
| | | | |
| | | | | 2023 | 2022 | 2021 |
| (Thousands of dollars) |
| Components of net periodic benefit cost (credit) | | | | | | | |
| Service cost | | | | | $ | 7,242 | | $ | 10,369 | | $ | 13,811 | |
| Interest cost (a) | | | | | 42,428 | | 36,150 | | 29,458 | |
| Expected return on assets (a) | | | | | (59,518) | | (58,528) | | (62,382) | |
| Amortization of unrecognized prior service cost (a) | | | | | 372 | | 248 | | — | |
| Amortization of net loss (a) | | | | | 2,008 | | 16,793 | | 45,523 | |
| Net periodic benefit cost (credit) | | | | | $ | (7,468) | | $ | 5,032 | | $ | 26,410 | |
| (a) These amounts, net of any amounts capitalized as a regulatory asset, have been recognized as other income (expense), net in the consolidated statement of income. See Note 13 for additional detail for our other income (expense), net. |
| | | | | | | | | | | | | | | | | |
| | | | | Other Postemployment Benefits |
| | | | Year Ended December 31, |
| | | | |
| | | | | 2023 | 2022 | 2021 |
| | | | | (Thousands of dollars) | |
| Components of net periodic benefit cost (credit) | | | | | | | |
| Service cost | | | | | $ | 730 | | $ | 1,274 | | $ | 1,587 | |
| Interest cost (a) | | | | | 9,154 | | 6,448 | | 6,251 | |
| Expected return on assets (a) | | | | | (9,728) | | (13,181) | | (16,807) | |
| Amortization of unrecognized prior service cost (credit) (a) | | | | | 153 | | 41 | | (279) | |
| Amortization of net (gain) loss (a) | | | | | (48) | | 217 | | 373 | |
| | | | | | | |
| Net periodic benefit cost (credit) | | | | | $ | 261 | | $ | (5,201) | | $ | (8,875) | |
| (a) These amounts, net of any amounts capitalized as a regulatory asset, have been recognized as other income (expense), net in the consolidated statement of income. See Note 13 for additional detail for our other income (expense), net. |
| | | | | | | | | | | | | | | | | |
| Pension Benefits |
| Year Ended December 31, |
| 2020 | | 2019 | | 2018 |
| (Thousands of dollars) |
| Components of net periodic benefit cost | | | | | |
| Service cost | $ | 12,869 | | | $ | 12,030 | | | $ | 12,919 | |
| Interest cost (a) | 34,179 | | | 40,670 | | | 36,801 | |
| Expected return on assets (a) | (61,119) | | | (61,939) | | | (60,579) | |
| Amortization of net loss (a) | 42,319 | | | 33,039 | | | 39,913 | |
| Net periodic benefit cost | $ | 28,248 | | | $ | 23,800 | | | $ | 29,054 | |
(a) These amounts,We use a December 31 measurement date for our plans. On April 30, 2022, we amended our defined benefit pension plans to change the variable cost of living adjustment for eligible participants to a fixed rate. Accordingly, we remeasured our net benefit obligations as of April 30, 2022, resulting in an adjustment of approximately $7.2 million to our pension expense, net of any amounts capitalized as acapitalization and regulatory asset since adoption of ASU 2017-07 on January 1, 2018, have been recognized as other income (expense), net indeferrals, for the Consolidated Statements of Income. See Note 16 for additional detail of our other income (expense), net.
| | | | | | | | | | | | | | | | | |
| Other Postemployment Benefits |
| Year Ended December 31, |
| 2020 | | 2019 | | 2018 |
| (Thousands of dollars) |
| Components of net periodic benefit cost | | | | | |
| Service cost | $ | 1,692 | | | $ | 1,734 | | | $ | 2,354 | |
| Interest cost (a) | 7,557 | | | 9,318 | | | 9,117 | |
| Expected return on assets (a) | (15,469) | | | (12,586) | | | (14,284) | |
| Amortization of unrecognized prior service cost (a) | (117) | | | (673) | | | (4,567) | |
| Amortization of net loss (a) | 173 | | | 2,244 | | | 3,887 | |
| | | | | |
| Net periodic benefit cost (credit) | $ | (6,164) | | | $ | 37 | | | $ | (3,493) | |
(a) These amounts, net of any amounts capitalized as a regulatory asset since adoption of ASU 2017-07 on January 1, 2018, have been recognized as other income (expense), net in the Consolidated Statements of Income. See Note 16 for additional detail of our other income (expense), net.year ended December 31, 2022.
Other Comprehensive Income (Loss) - The following table sets forth the amounts recognized in other comprehensive income (loss), net of regulatory deferrals, related to our defined benefit pension benefits for the period indicated:
| | Pension Benefits |
| Year Ended December 31, |
| 2020 | | 2019 | | 2018 |
| (Thousands of dollars) |
| Pension Benefits | | | Pension Benefits |
| Year Ended December 31, | | | Year Ended December 31, |
| 2023 | | | 2023 | | 2022 | | 2021 |
| (Thousands of dollars) | | | (Thousands of dollars) |
| Net gain (loss) arising during the period | Net gain (loss) arising during the period | $ | (2,519) | | | $ | (2,766) | | | $ | 1,173 | |
| Amortization of loss | Amortization of loss | 1,192 | | | 852 | | | 1,082 | |
| Deferred income taxes | Deferred income taxes | 289 | | | 479 | | | (848) | |
| Total recognized in other comprehensive income (loss) | Total recognized in other comprehensive income (loss) | $ | (1,038) | | | $ | (1,435) | | | $ | 1,407 | |
Due to our regulatory deferrals, there were 0no amounts recognized in other comprehensive income (loss) related to our other postemployment benefits for the periods presented.
The tables below set forth the amounts in accumulated other comprehensive loss that had not yet been recognized as components of net periodic benefit expense for the periods indicated:
| | Pension Benefits |
| December 31, |
| 2020 | | 2019 |
| (Thousands of dollars) |
| Pension Benefits | | | Pension Benefits |
| December 31, | | | December 31, |
| 2023 | | | 2023 | | 2022 |
| (Thousands of dollars) | | | (Thousands of dollars) |
| Prior service cost | |
| Accumulated loss | Accumulated loss | $ | (351,059) | | | $ | (381,633) | |
Accumulated other comprehensive loss
before regulatory assets | Accumulated other comprehensive loss
before regulatory assets | (351,059) | | | (381,633) | |
| Regulatory asset for regulated entities | Regulatory asset for regulated entities | 341,125 | | | 373,025 | |
Accumulated other comprehensive loss
after regulatory assets | Accumulated other comprehensive loss
after regulatory assets | (9,934) | | | (8,608) | |
| Deferred income taxes | Deferred income taxes | 2,157 | | | 1,869 | |
Accumulated other comprehensive loss,
net of tax | Accumulated other comprehensive loss,
net of tax | $ | (7,777) | | | $ | (6,739) | |
| | | | | | | | | | | |
| Other Postemployment Benefits |
| December 31, |
| 2020 | | 2019 |
| (Thousands of dollars) |
| Prior service credit | $ | 85 | | | $ | 202 | |
| Accumulated loss | (13,134) | | | (19,660) | |
Accumulated other comprehensive loss
before regulatory assets | $ | (13,049) | | | $ | (19,458) | |
| Regulatory asset for regulated entities | 13,049 | | | 19,458 | |
Accumulated other comprehensive loss
after regulatory assets | $ | 0 | | | $ | 0 | |
| | | |
| | | | | | | | | | | |
| Other Postemployment Benefits |
| December 31, |
| 2023 | | 2022 |
| (Thousands of dollars) |
| Prior service cost | $ | — | | | $ | (153) | |
| Accumulated loss | (1.457) | | | (8,557) | |
Accumulated other comprehensive loss
before regulatory assets | (1.457) | | | (8,710) | |
| Regulatory asset for regulated entities | 1.457 | | | 8,710 | |
Accumulated other comprehensive loss
after regulatory assets | $ | — | | | $ | — | |
| | | |
Health Care Cost Trend Rates - The following table sets forth the assumed health care cost-trend rates for the periods indicated:
| | 2020 | | 2019 |
| 2023 | | | 2023 | | 2022 |
| Health care cost-trend rate assumed for next year | Health care cost-trend rate assumed for next year | 6.25% | | 6.50% | Health care cost-trend rate assumed for next year | 6.00% | | 6.50% |
Rate to which the cost-trend rate is assumed to decline
(the ultimate trend rate) | Rate to which the cost-trend rate is assumed to decline
(the ultimate trend rate) | 4.50% | | 5.00% | Rate to which the cost-trend rate is assumed to decline
(the ultimate trend rate) | 4.50% | | 4.50% |
| Year that the rate reaches the ultimate trend rate | Year that the rate reaches the ultimate trend rate | 2026 | | 2025 | Year that the rate reaches the ultimate trend rate | 2030 | | 2030 |
Plan Assets - Our investment strategy is to invest plan assets in accordance with sound investment practices that emphasize long-term fundamentals. The goal of this strategy is to maximize investment returns while managing risk in order to meet the plan’s current and projected financial obligations. To achieve this strategy, we have established a liability-driven investment strategy to change the allocations as the funded status of the defined benefit pension plan increases. The plan’s investments include a diverse blend of various domestic and international equities, investment-grade debt securities which mirror the cash flows of our liability, insurance contracts and alternative investments. The current target allocation for the assets of our defined benefit pension plan is as follows:
| | | | | |
| |
| Investment-grade bonds | 40.070.0 | % |
| U.S. large-cap equities | 18.013.0 | % |
| Alternative investments | 14.07.0 | % |
| Developed foreign large-cap equities | 10.05.0 | % |
| Mid-cap equities | 7.03.0 | % |
| Emerging markets equities | 6.01.0 | % |
| Small-cap equities | 5.01.0 | % |
| Total | 100100.0 | % |
As part of our risk management for the plans, minimums and maximums have been set for each of the asset classes listed above. All investment managers for the plan are subject to certain restrictions on the securities they purchase and, with the exception of indexing purposes, are prohibited from owning our stock.
The current target allocation for the assets of our other postemployment benefits plan is 3090 percent fixed income securities and 7010 percent equity securities.
The following tables set forth our pension benefits and other postemployment benefits plan assets by fair value category as of the measurement date:
| | Pension Benefits |
| December 31, 2020 |
| Pension Benefits | | | Pension Benefits |
| December 31, 2023 | | | December 31, 2023 |
| Asset Category | Asset Category | Level 1 | Level 2 | Level 3 | Total | Asset Category | Level 1 | Level 2 | Level 3 | Total |
| (Thousands of dollars) |
| (Thousands of dollars) | | | (Thousands of dollars) |
| Investments: | Investments: | |
| Equity securities (a) | |
| Equity securities (a) | |
| Equity securities (a) | Equity securities (a) | $ | 392,639 | | $ | 35,454 | | $ | 0 | | $ | 428,093 | |
| Government obligations | Government obligations | 0 | | 78,080 | | 0 | | 78,080 | |
| Corporate obligations (b) | Corporate obligations (b) | 0 | | 343,118 | | 0 | | 343,118 | |
| Cash and money market funds (c) | Cash and money market funds (c) | 1,589 | | 23,311 | | 0 | | 24,900 | |
| Insurance contracts and group annuity contracts | Insurance contracts and group annuity contracts | 0 | | 0 | | 24,603 | | 24,603 | |
| Other investments (d) | Other investments (d) | 0 | | 1,155 | | 87,634 | | 88,789 | |
| Total assets | Total assets | $ | 394,228 | | $ | 481,118 | | $ | 112,237 | | $ | 987,583 | |
(a) - This category represents securities of the various market sectors from diverse industries.
(b) - This category represents bonds from diverse industries.
(c) - This category primarily represents money market funds.
(d) - This category represents alternative investments such as hedge funds and other financial instruments.
| | Pension Benefits |
| December 31, 2019 |
| Pension Benefits | | | Pension Benefits |
| December 31, 2022 | | | December 31, 2022 |
| Asset Category | Asset Category | Level 1 | Level 2 | Level 3 | Total | Asset Category | Level 1 | Level 2 | Level 3 | Total |
| (Thousands of dollars) |
| (Thousands of dollars) | | | (Thousands of dollars) |
| Investments: | Investments: | |
| Equity securities (a) | |
| Equity securities (a) | |
| Equity securities (a) | Equity securities (a) | $ | 323,737 | | $ | 27,267 | | $ | 0 | | $ | 351,004 | |
| Government obligations | Government obligations | 0 | | 54,726 | | 0 | | 54,726 | |
| Corporate obligations (b) | Corporate obligations (b) | 0 | | 304,457 | | 0 | | 304,457 | |
| Cash and money market funds (c) | Cash and money market funds (c) | 1,687 | | 87,422 | | 0 | | 89,109 | |
| Insurance contracts and group annuity contracts | Insurance contracts and group annuity contracts | 0 | | 0 | | 25,988 | | 25,988 | |
| Other investments (d) | Other investments (d) | 0 | | 897 | | 81,793 | | 82,690 | |
| Total assets | Total assets | $ | 325,424 | | $ | 474,769 | | $ | 107,781 | | $ | 907,974 | |
(a) - This category represents securities of the various market sectors from diverse industries.
(b) - This category represents bonds from diverse industries.
(c) - This category primarily represents money market funds.
(d) - This category represents alternative investments such as hedge funds and other financial instruments.
| | Other Postemployment Benefits |
| December 31, 2020 |
| Other Postemployment Benefits | | | Other Postemployment Benefits |
| December 31, 2023 | | | December 31, 2023 |
| Asset Category | Asset Category | Level 1 | Level 2 | Level 3 | Total | Asset Category | Level 1 | Level 2 | Level 3 | Total |
| (Thousands of dollars) |
| (Thousands of dollars) | | | (Thousands of dollars) |
| Investments: | Investments: | |
| Equity securities (a) | |
| Equity securities (a) | |
| Equity securities (a) | Equity securities (a) | $ | 73,578 | | $ | 0 | | $ | 0 | | $ | 73,578 | |
| Government obligations | Government obligations | 0 | | 0 | | 0 | | 0 | |
| Corporate obligations (b) | Corporate obligations (b) | 0 | | 39,115 | | 0 | | 39,115 | |
| Cash and money market funds (c) | Cash and money market funds (c) | 52 | | 8,071 | | 0 | | 8,123 | |
| Insurance contracts and group annuity contracts (d) | Insurance contracts and group annuity contracts (d) | 0 | | 110,079 | | 0 | | 110,079 | |
| Total assets | Total assets | $ | 73,630 | | $ | 157,265 | | $ | 0 | | $ | 230,895 | |
(a) - This category represents securities of the various market sectors from diverse industries.
(b) - This category represents bonds from diverse industries.
(c) - This category primarily represents money market funds.
(d) - This category includes equity securities and bonds held in a captive insurance product.
| | Other Postemployment Benefits |
| December 31, 2019 |
| Other Postemployment Benefits | | | Other Postemployment Benefits |
| December 31, 2022 | | | December 31, 2022 |
| Asset Category | Asset Category | Level 1 | Level 2 | Level 3 | Total | Asset Category | Level 1 | Level 2 | Level 3 | Total |
| (Thousands of dollars) |
| (Thousands of dollars) | | | (Thousands of dollars) |
| Investments: | Investments: | |
| Equity securities (a) | |
| Equity securities (a) | |
| Equity securities (a) | Equity securities (a) | $ | 61,688 | | $ | 0 | | $ | 0 | | $ | 61,688 | |
| Government obligations | Government obligations | 0 | | 0 | | 0 | | 0 | |
| Corporate obligations (b) | Corporate obligations (b) | 0 | | 26,852 | | 0 | | 26,852 | |
| Cash and money market funds (c) | Cash and money market funds (c) | 18,350 | | 682 | | 0 | | 19,032 | |
| Insurance contracts and group annuity contracts (d) | Insurance contracts and group annuity contracts (d) | 0 | | 99,610 | | 0 | | 99,610 | |
| Total assets | Total assets | $ | 80,038 | | $ | 127,144 | | $ | 0 | | $ | 207,182 | |
(a) - This category represents securities of the various market sectors from diverse industries.
(b) - This category represents bonds from diverse industries.
(c) - This category primarily represents money market funds.
(d) - This category includes equity securities and bonds held in a captive insurance product.
Insurance contracts and group annuity contracts include investments in the Immediate Participation Guarantee Fund (“IPG Fund”) with John Hancock and are valued at fair value. John Hancock invests the IPG Fund in its general fund portfolio. The contract value of the IPG Fund at the end of the year, which approximates fair value, is estimated. The difference between this estimated balance and the actual balance, as subsequently determined by John Hancock, is charged or credited to the net assets of the plans.
Certain investments that are categorized as money market funds in Level 2 and “Other investments” in Level 3 represent alternative investments such as hedge funds and other financial instruments measured using the net asset value per share (or its equivalent) practical expedient.
The following tables set forth additional information regarding commitments and redemption limitations of these other investments at the periods indicated:
| | December 31, 2020 |
| Fair Value | Unfunded Commitments | Redemption Frequency | Redemption Notice Period |
| (in thousands) | | (in days) |
| December 31, 2023 | | | December 31, 2023 |
| Fair Value | | | Fair Value | Unfunded Commitments | Redemption Frequency | Redemption Notice Period |
| (in thousands) | | | (in thousands) | | (in days) |
| Grosvenor Registered Multi Limited Partnership | Grosvenor Registered Multi Limited Partnership | $ | 42,632 | | $ | 0 | | quarterly | 65 | Grosvenor Registered Multi Limited Partnership | $ | 40,872 | | $ | — | | quarterly | quarterly | 65 |
| K2 Institutional Investors II Limited Partnership | K2 Institutional Investors II Limited Partnership | $ | 45,002 | | $ | 0 | | quarterly | 91 | K2 Institutional Investors II Limited Partnership | $ | 48,254 | | $ | — | | quarterly | quarterly | 91 |
| | December 31, 2019 |
| Fair Value | Unfunded Commitments | Redemption Frequency | Redemption Notice Period |
| (in thousands) | | (in days) |
| December 31, 2022 | | | December 31, 2022 |
| Fair Value | | | Fair Value | Unfunded Commitments | Redemption Frequency | Redemption Notice Period |
| (in thousands) | | | (in thousands) | | (in days) |
| Grosvenor Registered Multi Limited Partnership | Grosvenor Registered Multi Limited Partnership | $ | 40,577 | | $ | 0 | | quarterly | 65 | Grosvenor Registered Multi Limited Partnership | $ | 40,160 | | $ | — | | quarterly | quarterly | 65 |
| K2 Institutional Investors II Limited Partnership | K2 Institutional Investors II Limited Partnership | $ | 41,215 | | $ | 0 | | quarterly | 91 | K2 Institutional Investors II Limited Partnership | $ | 46,871 | | $ | — | | quarterly | quarterly | 91 |
The following table sets forth the reconciliation of Level 3 fair value measurements of our pension plans for the periods indicated:
| | Pension Benefits |
| Insurance
Contracts | | Other
Investments | | Total |
| (Thousands of dollars) |
| January 1, 2019 | $ | 30,445 | | | $ | 79,205 | | | $ | 109,650 | |
| Pension Benefits | | | Pension Benefits |
| Insurance
Contracts | | | Insurance
Contracts | | Other
Investments | | Total |
| (Thousands of dollars) | | | (Thousands of dollars) |
| January 1, 2022 | |
| Unrealized gains | Unrealized gains | — | | | 2,588 | | | 2,588 | |
| Unrealized (losses) | (860) | | | — | | | (860) | |
| | Settlements | (3,597) | | | — | | | (3,597) | |
| December 31, 2019 | $ | 25,988 | | | $ | 81,793 | | | $ | 107,781 | |
| Unrealized gains | 1,764 | | | 4,849 | | | 6,613 | |
| Unrealized losses | |
| Purchases | Purchases | — | | | 992 | | | 992 | |
| Settlements | Settlements | (3,149) | | | — | | | (3,149) | |
| December 31, 2020 | $ | 24,603 | | | $ | 87,634 | | | $ | 112,237 | |
| December 31, 2022 | |
| Unrealized gains | |
| Unrealized losses | |
| Purchases | |
| Settlements | |
| December 31, 2023 | |
Pension and Other Postemployment Benefit Payments - Benefit payments for our defined benefit pension and other postemployment benefit plans for the periodyear ended December 31, 20202023 were $62.3$55.3 million and $17.7$16.6 million, respectively. The following table sets forth the pension benefits and other postemployment benefits payments expected to be paid in 2021-2030:2023-2032:
| | | | | | | | | | | |
| Pension
Benefits | | Other Postemployment
Benefits |
| Benefits to be paid in: | (Thousands of dollars) |
| 2021 | $ | 51,127 | | | $ | 16,032 | |
| 2022 | $ | 51,945 | | | $ | 15,987 | |
| 2023 | $ | 52,810 | | | $ | 15,853 | |
| 2024 | $ | 53,633 | | | $ | 15,487 | |
| 2025 | $ | 54,498 | | | $ | 15,262 | |
| 2026 through 2030 | $ | 279,689 | | | $ | 70,385 | |
| | | | | | | | | | | |
| Pension
Benefits | | Other Postemployment
Benefits |
| Benefits to be paid in: | (Thousands of dollars) |
| 2024 | $ | 55,391 | | | $ | 14,127 | |
| 2025 | $ | 55,988 | | | $ | 13,890 | |
| 2026 | $ | 56,422 | | | $ | 13,505 | |
| 2027 | $ | 56,591 | | | $ | 13,194 | |
| 2028 | $ | 57,296 | | | $ | 12,848 | |
| 2029 through 2033 | $ | 286,471 | | | $ | 59,299 | |
The expected benefits to be paid are based on the same assumptions used to measure our benefit obligationobligations at December 31, 2020,2023, and include estimated future employee service.
Other Employee Benefit Plans
401(k) Plan - We have a 401(k) Planplan which covers all full-time employees, and employeeeligible employees. Employee contributions are discretionary. Wediscretionary and we match 100 percent of each participant’s eligible contribution up to 6 percent of eligible compensation, subject to certain limits. Our contributions made to the plan were $13.8$16.7 million, $12.8$15.3 million and $12.1$14.3 million in 2020, 20192023, 2022 and 2018,2021, respectively.
Profit-Sharing Plan - We have a profit-sharing plan for all employees who do not participate inEffective December 30, 2021, our defined benefit pension plan.profit sharing-plan was merged with and into our 401(k) Plan. We plan to make a profit-sharing contribution to the profit-sharing plan401(k) Plan each quarter equal to 1 percent of each participant’s eligible compensation during the quarter. Additional discretionary employerprofit-sharing contributions may be made at the end of each year. Employee contributions are not allowed under the plan. Our profit-sharing contributions made to the plan were $9.4$12.6 million, $8.5$10.9 million and $7.4$9.9 million in 2020, 20192023, 2022 and 2018,2021, respectively.
12. INCOME TAXES
15.INCOME TAXES
The following table sets forth our provision for income taxes for the periods indicated:
| | Years Ended December 31, |
| 2020 | | 2019 | | 2018 |
| (Thousands of dollars) |
| Current income tax provision | |
| Years Ended December 31, | | | Years Ended December 31, |
| 2023 | | | 2023 | | 2022 | | 2021 |
| (Thousands of dollars) | | | (Thousands of dollars) |
| Current income tax provision (benefit) | |
| Federal | |
| Federal | |
| Federal | Federal | $ | 20,129 | | | $ | 24,537 | | | $ | 0 | |
| State | State | 2,965 | | | 5,008 | | | 289 | |
| Total current income tax provision | 23,094 | | | 29,545 | | | 289 | |
| Deferred income tax provision | |
| Total current income tax provision (benefit) | |
| Deferred income tax provision (benefit) | |
| Federal | |
| Federal | |
| Federal | Federal | 10,757 | | | 8,375 | | | 42,413 | |
| State | State | 7,728 | | | 4,932 | | | 10,829 | |
| Total deferred income tax provision | 18,485 | | | 13,307 | | | 53,242 | |
| Total deferred income tax provision (benefit) | |
| Total provision for income taxes | Total provision for income taxes | $ | 41,579 | | | $ | 42,852 | | | $ | 53,531 | |
The following table is a reconciliation of our income tax provision for the periods indicated:
| | Years Ended December 31, |
| 2020 | | 2019 | | 2018 |
| (Thousands of dollars) |
| Years Ended December 31, | | | Years Ended December 31, |
| 2023 | | | 2023 | | 2022 | | 2021 |
| (Thousands of dollars) | | | (Thousands of dollars) |
| Income before income taxes | Income before income taxes | $ | 237,991 | | | $ | 229,601 | | | $ | 225,765 | |
| Federal statutory income tax rate | Federal statutory income tax rate | 21 | % | | 21 | % | | 21 | % | Federal statutory income tax rate | 21 | % | | 21 | % | | 21 | % |
| Provision for federal income taxes | Provision for federal income taxes | 49,978 | | | 48,215 | | | 47,411 | |
| State income taxes, net of federal tax benefit | State income taxes, net of federal tax benefit | 10,693 | | | 9,758 | | | 8,783 | |
| EDIT not recovered in rates | 0 | | | 0 | | | 74 | |
| Amortization of EDIT regulatory liability | (17,031) | | | (12,828) | | | 0 | |
| Tax benefit of employee share-based compensation | (1,489) | | | (2,116) | | | (2,770) | |
| Amortization of excess deferred federal income taxes | |
| Amortization of excess deferred state income taxes | |
| Tax (expense) benefit for employee share-based compensation | |
| Other, net | Other, net | (572) | | | (177) | | | 33 | |
| Total provision for income taxes | Total provision for income taxes | $ | 41,579 | | | $ | 42,852 | | | $ | 53,531 | |
As of December 31, 2020,2023, we have no uncertain tax positions. Changes in tax laws or tax rates are recognized in the financial reporting period that includes the enactment date. As a regulated entity, the change in ADIT resulting from a change in tax laws or tax rates is recorded as a regulatory liability and is subject to refund to our customers.
In May 2020, a bill amendingIncome tax expense reflects credits for the Kansas state income tax code was signed into law that exempts public utilities regulated by the KCC from paying Kansas state income taxes beginning January 1, 2021. As a resultamortization of the enactment of this legislation, we remeasured our ADIT. As a regulated entity, the reduction in ADIT of $81.5 million was recorded as an EDIT regulatory liability associated with EDIT that was returned to customers of $22.4 million and will be refunded to our customers. This adjustment had no material impact on our income tax expense and no impact on our cash flows$18.0 million for the year endedyears ending December 31, 2020. The bill stipulates that, if requested by the utility, this EDIT will be returned to Kansas customers over a period of no less than 30 years, with the exact timing to be determined in our next general rate proceeding. In August 2020, Kansas Gas Service submitted an application to the KCC to reduce its base rates to reflect the elimination of Kansas state income taxes by approximately $4.9 million. In December 2020, the KCC approved the reduction, effective January 1, 2021.2023, and 2022, respectively.
The following table sets forth the tax effects of temporary differences that gave rise to significant portions of the deferred tax assets and liabilities for the periods indicated: | | December 31, |
| 2020 | | 2019 |
| (Thousands of dollars) |
| December 31, | | | December 31, |
| 2023 | | | 2023 | | 2022 |
| (Thousands of dollars) | | | (Thousands of dollars) |
| Deferred tax assets | Deferred tax assets | |
| Employee benefits and other accrued liabilities | |
| Employee benefits and other accrued liabilities | |
| Employee benefits and other accrued liabilities | Employee benefits and other accrued liabilities | $ | 28,127 | | | $ | 32,036 | |
| Regulatory adjustments for enacted tax rate changes | Regulatory adjustments for enacted tax rate changes | 121,738 | | | 124,680 | |
| Net operating loss | Net operating loss | 0 | | | 752 | |
| Lease obligation basis | Lease obligation basis | 9,319 | | | 8,599 | |
| Purchased-gas cost adjustment | |
| Other | Other | 4,790 | | | 2,772 | |
| Total deferred tax assets | Total deferred tax assets | 163,974 | | | 168,839 | |
| Deferred tax liabilities | Deferred tax liabilities | |
| Excess of tax over book depreciation | Excess of tax over book depreciation | 717,492 | | | 742,860 | |
| Purchased-gas cost adjustment | 5,240 | | | 3,556 | |
| Excess of tax over book depreciation | |
| Excess of tax over book depreciation | |
| Winter weather event costs | |
| | Other regulatory assets and liabilities, net | Other regulatory assets and liabilities, net | 88,260 | | | 96,456 | |
| Other regulatory assets and liabilities, net | |
| Other regulatory assets and liabilities, net | |
| Employee benefits and other accrued liabilities | |
| Right-of-use asset basis | Right-of-use asset basis | 9,788 | | | 8,599 | |
| Other | |
| Total deferred tax liabilities | Total deferred tax liabilities | 820,780 | | | 851,471 | |
| Net deferred tax liabilities | Net deferred tax liabilities | $ | 656,806 | | | $ | 682,632 | |
We deduct our purchased gas costs for federal income tax purposes in the period they are paid. As a result of the impacts from government securitization of Winter Storm Uri, we recorded a $64.4 million and $299.7 million decrease in our deferred tax liability for the years ended December 31, 2020,2023 and 2022, respectively. At December 31, 2023, we have 0had $87.6 million (tax effected) of federal ornet operating loss carryforwards and $5.7 million (tax effected) of state income tax NOL carryforwards.net operating loss carryforwards available to offset future taxable income.
We have filed our consolidated federal and state income tax returns for years 2017, 20182020, 2021 and 2019.2022. We are no longer subject to income tax examination for years prior to 2017.2019.
16.13. OTHER INCOME AND OTHER EXPENSE
The following table sets forth the components of other income and other expense for the periods indicated:
| | | | | | | | | | | | | | | | | | | | | | | |
| | Years Ended December 31, | |
| | 2020 | | 2019 | | 2018 | |
| | (Thousands of dollars) |
| Net periodic benefit cost other than service cost | | $ | (5,071) | | | $ | (5,895) | | | $ | (8,824) | | |
| Earnings (losses) on investments associated with nonqualified employee benefit plans | | 4,616 | | | 5,268 | | | (1,343) | | |
| Other, net | | (2,565) | | | (2,349) | | | (1,192) | | |
| Total other expense, net | | $ | (3,020) | | | $ | (2,976) | | | $ | (11,359) | | |
| | | | | | | | | | | | | | | | | | | | | | | | |
| | | | Year Ended December 31, |
| | | | |
| | | | | | 2023 | | 2022 | | 2021 |
| | | | | | (Thousands of dollars) |
| Net periodic benefit (cost) other than service cost | | | | | | $ | 4,017 | | | $ | 3,766 | | | $ | (3,930) | |
| Earnings (losses) on investments associated with nonqualified employee benefit plans | | | | | | 4,826 | | | (7,197) | | | 3,699 | |
| Other income (expense), net | | | | | | 633 | | | (752) | | | (2,976) | |
| Total other income (expense), net | | | | | | $ | 9,476 | | | $ | (4,183) | | | $ | (3,207) | |
14. PROPERTY, PLANT AND EQUIPMENT
17.
The following table sets forth our property, plant and equipment by property type, for the periods indicated:
| | | | | | | | | | | | | | |
| | December 31, | | December 31, |
| | 2023 | | 2022 |
| | (Thousands of dollars) |
| Natural gas distribution pipelines and related equipment | | $ | 6,716,074 | | | $ | 6,240,236 | |
| Natural gas transmission pipelines and related equipment | | 713,505 | | | 661,379 | |
| General plant and other | | 907,946 | | | 782,870 | |
| Construction work in process | | 131,442 | | | 150,072 | |
| Property, plant and equipment | | 8,468,967 | | | 7,834,557 | |
| Accumulated depreciation and amortization | | (2,333,755) | | | (2,205,717) | |
| Net property, plant and equipment | | $ | 6,135,212 | | | $ | 5,628,840 | |
We compute depreciation expense by applying composite, straight-line rates of approximately 2.5 percent to 3.5 percent as approved by various regulatory authorities.
We recorded capitalized interestCOMMITMENTS AND CONTINGENCIES of $5.7 million, $4.5 million and $4.2 million for the years ended December 31, 2023, 2022 and 2021, respectively. We incurred liabilities for construction work in process that had not been paid at December 31, 2023, 2022 and 2021 of $36.2 million, $28.6 million and $25.6 million, respectively. Such amounts are not included in capital expenditures or in the change of working capital items on our consolidated statements of cash flows.
15. COMMITMENTS AND CONTINGENCIES
Leases - See Note 6 of the Notes to Consolidated Financial Statements in this Annual Report for discussion of operating leases.
COVID-19 - Throughout the COVID-19 pandemic, we have continued to provide essential services to our customers. We have implemented a comprehensive set of policies, procedures and guidelines to protect the safety of our employees, customers and communities. As ordered by our regulators, customer disconnects for nonpayment were suspended from mid-March through May 20, 2020, in Oklahoma, through May 31, 2020, in Kansas, and through December 31, 2020, in some areas of Texas. As of December 31, 2020, we have temporarily suspended disconnects for safety reasons in all of our jurisdictions due to the level of COVID-19 infection. Since the onset of the pandemic in the first quarter of 2020, we have experienced impacts on our results of operations including, but not limited to: lower late payment, reconnect and collection fees and incremental expenses for bad debts related to the suspensions of disconnects for nonpayment; incremental expenses for PPE, cleaning supplies, outside services and other expenses; and lower expenses for travel and employee training that have been impacted by the pandemic. We have received accounting orders in each of our jurisdictions authorizing us to accumulate and defer for regulatory purposes certain incremental costs incurred, including bad debt expenses, and certain lost revenues, net of offsetting expense reductions associated with COVID-19. Pursuant to these orders, the recovery of any net incremental costs and lost revenues will be determined in future rate cases or alternative rate recovery filings in each jurisdiction. For financial reporting purposes, any amounts deferred as a regulatory asset for future recovery under these accounting orders must be probable of recovery. At December 31, 2020, no regulatory assets have been recorded. We continue to evaluate the impacts of COVID-19 on our business and will record regulatory assets for financial reporting purposes at such time as recovery is deemed probable. Going forward, we expect continuing impacts on our revenues and expenses during the course of the pandemic. We also could experience a possible reduction in revenues from commercial and transportation customers temporarily or permanently impacted by the pandemic.
Environmental Matters - We are subject to multiple historical, wildlife preservationlaws and environmental laws and/or regulations regarding protection of the environment and natural and cultural resources, which affect many aspects of our present and future operations. Regulated activities include, but are not limited to, those involving air emissions, storm water and wastewater discharges, handling and disposal of solid and hazardous wastes, wetland preservation, plant and wildlife protection, hazardous materials use, storage and transportation, and pipeline and facility construction. These laws and regulations require us to obtain and/or comply with a wide variety of environmental clearances, registrations, licenses, permits and other approvals. Failure to comply with these laws, regulations, licenses and permits or the discovery of presently unknown environmental conditions may expose us to fines, penalties and/or interruptions in our operations that could be material to our results of operations. In addition, emission controls and/or other regulatory or permitting mandates under the Clean Air ActCAA and other similar federal and state laws could require unexpected capital expenditures. We cannot assure that existing environmental statutes and regulations will not be revised or that new regulations will not be adopted or become applicable to us. Revised or additional statutes or regulations that result in increased compliance costs or additional operating restrictions could have a material adverse effect on our business, financial condition and results of operations. Our expenditures for environmental investigation and remediation compliance to-date have not been significant in relation to our financial position, results of operations or cash flows, and our expenditures related to environmental matters had no material effects on earnings or cash flows during 2020, 2019 or 2018.2023, 2022 and 2021.
We own or retain legal responsibility for certain environmental conditions at 12 former MGP sites in Kansas. These sites contain contaminants generally associated with MGP sites and are subject to control or remediation under various environmental laws and regulations. A consent agreement with the KDHE governs all environmental investigation and remediation work at these sites. The terms of the consent agreement require us to investigate these sites and set remediation activities based upon the results of the investigations and risk analysis. Remediation typically involves the management of contaminated soils and may involve removal of structures and monitoring and/or remediation of groundwater. Regulatory closure has been achieved at 3five of the 12 sites, but these sites remain subject to potential future requirements that may result in additional costs.
We have completed or are addressing removal of the source of soil contamination at all 12 sites and continue to monitor groundwater at seven of the 12 sites according to plans approved by the KDHE. In 2019, we completed a project to remove a source of contamination and associated contaminated materials at the twelfth site where no active soil remediation had previously occurred. In 2022, we completed a remediation project to remove a source of contamination and contaminated materials at one of the MGP sites. In June 2023, we submitted a revised draft remediation plan to the KDHE for review following receipt of agency comments and public feedback. In August 2023, the KDHE approved the remediation plan without comment. We submitted a site investigation work plan for another site and on August 27, 2023 the KDHE approved the document without comment.
We have an AAO that allows Kansas Gas Service to defer and seek recovery of costs necessary for investigation and remediation at, and nearby, these 12 former MGP sites that are incurred after January 1, 2017, up to a cap of $15.0 million, net of any related insurance recoveries. Costs approved for recovery in a future rate proceeding would then be amortized over a 15-year period. The unamortized amounts will not be included in rate base or accumulate carrying charges. Following a determination that future investigation and remediation work approved by the KDHE is expected to exceed $15.0 million, net of any related insurance recoveries, Kansas Gas Service will be required to file an application with the KCC for approval to increase the $15.0 million cap. At December 31, 20202023 and 2019,2022, we have deferred $18.8$32.0 million and $9.8$29.8 million, respectively, for accrued investigation and remediation costs pursuant to our AAO. Kansas Gas Service expects to file an application for amounts deferred in excess of the cap as soon as practicable after the KDHE approves the remediation plans we have submitted and anticipates that filing will occur in 2021.
We have completed or are addressing removal of the source of soil contamination at all 12 sites and continue to monitor groundwater at 8 of the 12 sites according to plans approved by the KDHE. In 2019, we completed a project to remove a source of contamination and associated contaminated materials at the twelfth site where no active soil remediation had previously occurred. A remediation plan was submitted to the KDHE concerning this site in 2020 and the KDHE has provided comments that we are addressing. We are also working on a remediation plan that will be submitted to the KDHE in 2021 for an additional site.
As a result of our work to investigate and remediate the environmental impacts of our MGP sites in 2020, we estimated the potential costs associated with additional investigation and remediation to be in the range of $9.1 million to $23.3 million. A single reliable estimate of the remediation costs for these sites was not feasible due to the amount of uncertainty in the ultimate remediation approach that will be utilized. Accordingly, in 2020, we recorded an adjustment to our reserve of $9.1 million, which also increased our regulatory asset pursuant to our AAO in Kansas, as we believe recovery of these costs is probable through our existing AAO or future regulatory filings. At December 31, 2020 and 2019, the reserve for remediation of our MGP sites was $14.5 million and $5.8 million, respectively.submitted.
We also own or retain legal responsibility for certain environmental conditions at a former MGP site in Texas. At the request of the Texas Commission on Environmental Quality,TCEQ, we began investigating the level and extent of contamination associated with the site under their Texas Risk Reduction Program. A preliminary site investigation revealed that this site contains contaminants generally associated with MGP sites and is subject to control or remediation under various environmental laws and regulations. UntilImpacts have been identified in the investigation is complete,soil and groundwater at the site with limited impacts observed in surrounding areas. In April 2022, we are unablesubmitted a remediation work plan to determine what, if any, active remediation will be required. A reliable estimate of potential remediation costs is not feasible at this point dueaddress the areas impacted to the amount of uncertainty asTCEQ. In August 2023, remediation activities were conducted to address the levels and extent of contamination.impacted area in accordance with the remediation work plan. The TCEQ requested acceptable financial assurance for the projected costs on post-response action care activities at the site. At December 31, 2023, estimated costs associated with expected remediation activities for this site are not material.
Our expenditures for environmental evaluation, mitigation, remediation and compliance to date have not been significant in relation to our financial position, results of operations or cash flows, and our expenditures related to environmental matters had no material effects on earnings or cash flows during 2020, 2019the years ended December 31, 2023, 2022 and 2021. The reserve for remediation of our MGP sites was $14.3 million and $12.7 million at December 31, 2023 and December 31, 2022, respectively.
Environmental issues may exist with respect to these MGP sites that are unknown to us. Accordingly, future costs are dependent on the final determination and regulatory approval of any remedial actions, the complexity of the site, level of remediation required, changing technology and governmental regulations, and to the extent not recovered by insurance or 2018.recoverable in rates from our customers, could be material to our financial condition, results of operations or cash flows.
We are subject to environmental regulation by federal, state and local authorities. Due to the inherent uncertainties surrounding the development of federal and state environmental laws and regulations, we cannot determine with specificity the impact such laws and regulations may have on our existing and future facilities. With the trend toward stricter standards, greater regulation and more extensive permit requirements for the types of assets operated by us, our environmental expenditures could increase in the future, and such expenditures may not be fully recovered by insurance or recoverable in rates from our customers, and those costs may adversely affect our financial condition, results of operations and cash flows. We do not expect expenditures for these matters to have a material adverse effect on our financial condition, results of operations or cash flows.
Pipeline Safety - We are subject to PHMSA regulations,regulation under federal pipeline safety statutes and any analogous state regulations. These include safety requirements for the design, construction, operation, and maintenance of pipelines, including integrity-management regulations.transmission and distribution pipelines. At the federal level, we are regulated by PHMSA. PHMSA regulations require the following for certain pipelines: inspection and maintenance plans; integrity management programs, including the determination of pipeline companies operating high-pressure transmission pipelines to perform integrity risks and periodic assessments on certain pipeline segmentssegments; an operator qualification program, which includes certain trainings; a public awareness program that pass through densely populated areas or near specifically designated HCAs. In January 2012, the Pipeline Safety, Regulatory Certaintyprovides certain information; and Job Creation Act was signed into law. The law increased maximum penalties for violating federal pipeline safety regulations and directs the DOT and the Secretary of Transportation to conduct further review or studies on issues that may or may not be material to us. These issues include, but are not limited to, the following:
•an evaluation of whether natural gas pipeline integrity-management requirements should be expanded beyond current HCAs;
•a verification of records for pipelines in class 3 and 4 locations and HCAs to confirm MAOPs; and
•a requirement to test previously untested pipelines operating above 30 percent yield strength in HCAs.control room management plan.
As part of regulating pipeline safety, PHMSA promulgates various regulations. In April 2016, PHMSA published a NPRM, the Safety of Gas Transmission & Gathering Lines Rule, in the Federal Register to revise pipeline safety regulations applicable to the safety of onshore natural gas transmission and gathering pipelines. Proposals included changes to pipeline integrity management requirements and other safety-related requirements. The NPRM comment period ended July 7, 2016, and commentsrequirements, which were reviewed by PHMSA. As part of the comment review process, PHMSA was advised by the Technical Pipeline Safety Standards Committee, informally known by PHMSA as the GPAC, a statutorily mandated advisory committee that advises PHMSA on proposed safety policies for natural gas pipelines. The GPAC reviews PHMSA's proposed regulatory initiatives to assure the technical feasibility, reasonableness, cost-effectiveness and practicality of each proposal. The GPAC met six times since January 2017 to review public comments and make recommendations to PHMSA. The GPAC completed their review of the NPRM on March 28, 2018, except for gas gathering pipelines. The GPAC met in June 2019 on gas gathering pipelines. In addition to reviewing public and committee comments, PHMSA announced they would split this NPRM into three separate final rulemakings:
•the first final rule addresses the legislative mandates from the Pipeline Safety, Regulatory Certainty and Jobs Creation Act and is called the Safetyrulemakings. As of Gas Transmission Pipelines: MAOP Reconfirmation, Expansion of Assessment Requirements, and Other Related Amendments;
•the second final rule will be called the Safety of Gas Transmission Pipelines: Repair Criteria, Integrity Management Improvements, Cathodic Protection, Management of Change, and Other Related Amendments and will coverDecember 31, 2022, all remaining elements of the NPRM (except for gas gathering pipelines); and
•the third final rule will be called the Safety of Gas Gathering Pipelines and will address gas gathering pipelines.
A significant number of recommendations have been made to PHMSA to improve the NPRM. The industry trade associations filed joint comments to the “legislative mandates” rulemaking to amend the federal safety regulations applicable to gas transmission and gathering pipelines.
On October 1, 2019, PHMSA published the first of the three final rules referenced above, which addressedwere published and the 2011 congressional mandates. This final rule expands integrity management principles beyond HCAs and requires operators to collect traceable, verifiable and complete records moving forward, retain existing and new records for the life of the pipeline, and reconfirm pipeline MAOP in populated areas. The final rule also outlines methods for reconfirming a pipeline’s MAOP within 15 years. The first final rule became effective July 1, 2020. The estimated capital and operating expenditures associated with compliance with the first final rulemaking were not material.
PHMSA has not yet issued the second final rule. The potential capital and operating expenditures associated with compliance were not material or did not apply to us.
As part of the Consolidated Appropriations Act, 2021, the PIPES Act reauthorized PHMSA through 2023 and directed the agency to move forward with this rule are currently being evaluatedseveral regulatory actions, including the “Pipeline Safety: Class Location Change Requirements” and couldthe “Pipeline Safety: Safety of Gas Transmission and Gathering Pipelines” proposed rulemakings. Congress has also instructed PHMSA to issue final regulations that will require operators of new and existing transmission and distribution pipeline facilities to conduct certain leak detection and repair programs and to require facility inspection and maintenance plans to align with those regulations. To the extent such rulemakings impose more stringent requirements on our facilities, we may be significant depending on the final regulation. We do not expectrequired to incur expenditures that may be impacted by the third final rule, as we do not own gas gathering pipelines.material.
Legal Proceedings - We are a party to various litigation matters and claims that have arisen in the normal course of our operations. While the results of litigation and claims cannot be predicted with certainty, we believe the reasonably possible losses from such matters, individually and in the aggregate, are not material. Additionally, we believe the probable final outcome of such matters will not have a material adverse effect on our results of operations, financial position or cash flows.
16. DERIVATIVE FINANCIAL INSTRUMENTS AND FAIR VALUE MEASUREMENTS
Derivative Instruments - Our derivatives are comprised of over-the-counter natural gas fixed price swaps and call options.
Swaps - At December 31, 2023, we held over-the-counter natural gas fixed-price swaps for the heating season ending March 2024, with a total notional amount of 5.1 Bcf. We did not hold any swaps at December 31, 2022.
Options - At December 31, 2023, we held natural gas call options for the heating season ending March 2024, with total notional amounts of 0.5 Bcf, for which we paid premiums of $0.5 million. At December 31, 2022, we held purchased natural gas call options for the heating season ended March 2023, with total notional amounts of 19.4 Bcf, for which we paid premiums of $14.1 million. The fair value of our natural gas call options was insignificant as of December 31, 2023 and 2022.
We have not designated any of our derivative instruments as accounting hedges. These contracts are included in, and recoverable through, our purchased-gas cost adjustment mechanisms. Additionally, premiums paid, changes in fair value and any settlements received associated with these contracts are deferred as part of our unrecovered purchased-gas costs in our consolidated balance sheets. There were no transfers between levels for the periods presented.
Other Financial Instruments -The approximate fair value of cash and cash equivalents, restricted cash and cash equivalents, accounts receivable and accounts payable is equal to book value, due to the short-term nature of these items. Commercial paper is due upon demand and, therefore, the carrying amounts approximate fair value.
The following tables summarize, by level within the fair value hierarchy, our derivative and other assets and liabilities that were accounted for at fair value on a recurring basis at December 31, 2023 and 2022:
| | | | | | | | | | | | | | | | | | | |
| December 31, 2023 |
| Level 1 | | Level 2 | | | | Total |
| (Thousands of dollars) |
| Assets: | | | | | | | |
| | | | | | | |
| | | | | | | |
| United States treasury notes (b) | $ | 6,496 | | | $ | — | | | | | $ | 6,496 | |
| Corporate bonds (b) | — | | | 11,080 | | | | | 11,080 | |
| Total assets | $ | 6,496 | | | $ | 11,080 | | | | | $ | 17,576 | |
| Liabilities: | | | | | | | |
| Derivative instruments - swaps (a) | $ | — | | | $ | 13,920 | | | | | $ | 13,920 | |
(a) The fair value is included in other current assets and other current liabilities in our consolidated balance sheets.
(b) The fair value is included in other current and noncurrent assets and other current and noncurrent liabilities in our consolidated balance sheets.
| | | | | | | | | | | | | | | | | |
| December 31, 2022 |
| Level 1 | | Level 2 | | Total |
| (Thousands of dollars) |
| Assets: | | | | | |
| United States treasury notes (b) | $ | 4,695 | | | $ | — | | | $ | 4,695 | |
| Corporate bonds (b) | — | | | 9,710 | | | 9,710 | |
| Total assets | $ | 4,695 | | | $ | 9,710 | | | $ | 14,405 | |
(a) The fair value is included in other current assets and other current liabilities in our consolidated balance sheets.
(b) The fair value is included in other current and noncurrent assets and other current and noncurrent liabilities in our consolidated balance sheets.
The estimated fair value of our long-term debt, including current maturities, was $2.8 billion and $2.5 billion at December 31, 2023 and December 31, 2022, respectively. The estimated fair value of our long-term debt was determined using quoted market prices, and is classified as Level 2.
17. VARIABLE INTEREST ENTITY
KGSS-I is a special-purpose, wholly owned subsidiary of ONE Gas that was formed for the purpose of issuing securitized bonds to recover extraordinary costs incurred by Kansas Gas Service resulting from Winter Storm Uri. On November 18, 2022, the securitized financing was complete. KGSS-I’s assets cannot be used to settle ONE Gas’ obligations and the holders of the Securitized Utility Tariff Bonds have no recourse against ONE Gas. See Note 5 for additional information about the securitization financing.
KGSS-I is considered to be a variable interest entity. As a result, KGSS-I is included in the consolidated financial statements of ONE Gas. No gain or loss was recognized upon initial consolidation.
The following table summarizes the impact of KGSS-I on our consolidated balance sheets:
| | | | | | | | | | | | | |
| December 31, | | December 31, | | |
| 2023 | | 2022 | | |
| (Thousands of dollars) | | |
| Restricted cash and cash equivalents | $ | 20,552 | | | $ | 8,446 | | | |
| Accounts receivable | 5,133 | | | 4,862 | | | |
| Securitized intangible asset, net | 293,619 | | | 323,838 | | | |
| Current maturities of securitized utility tariff bonds | 27,430 | | | 20,716 | | | |
| Accounts payable | 394 | | | 3,204 | | | |
| Accrued interest | 7,207 | | | 2,202 | | | |
| Securitized utility tariff bonds, excluding current maturities, net of discounts and issuance costs of $5.3 million and $5.9 million, respectively | 282,506 | | | 309,343 | | | |
| Equity | 1,768 | | | 1,681 | | | |
The following table summarizes the impact of KGSS-I on our consolidated statements of income:
| | | | | | | | | | | | | | | | | | |
| | | | | | Year Ended December 31, |
| | | | | | 2023 | | 2022 |
| | | | | | (Thousands of dollars) |
| Operating revenues | | | | | | $ | 48,677 | | | $ | 5,769 | |
| Operating expense | | | | | | (440) | | | (52) | |
| Amortization expense | | | | | | (30,219) | | | (3,521) | |
| Interest income | | | | | | 696 | | | 6 | |
| Interest expense | | | | | | (18,552) | | | (2,202) | |
| Income before income taxes | | | | | | $ | 162 | | | $ | — | |
The following table summarizes the amortization expense related to the securitized intangible asset expected to be recognized in our consolidated statements of income:
| | | | | | | | | | |
| For the year ending: | | (Thousands of dollars) | | |
| 2024 | | $ | 27,843 | | | |
| 2025 | | $ | 29,391 | | | |
| 2026 | | $ | 31,025 | | | |
| 2027 | | $ | 32,751 | | | |
| 2028 | | $ | 34,572 | | | |
ITEM 9. CHANGES IN AND DISAGREEMENTS WITH ACCOUNTANTS ON ACCOUNTING AND FINANCIAL DISCLOSURE
None.
ITEM 9A. CONTROLS AND PROCEDURES
Evaluation of Disclosure Controls and Procedures
OurWe carried out an evaluation, under the supervision and with the participation of our management, including our Chief Executive Officer (Principal Executive Officer) and Chief Financial Officer (Principal Financial Officer), of the effectiveness of the Company’s disclosure controls and procedures, as such term is defined in Rule 13a-15(e) under the Exchange Act. Based on this evaluation, the Company’s Principal Executive Officer and Principal Financial Officer have concluded that our disclosure controls and procedures were effective as of the end of the period covered by this reportAnnual Report based on the evaluation of the controls and procedures required by Rule 13a-15(b) of the Exchange Act.
Management’s Report on Internal Control Over Financial Reporting
Our management is responsible for establishing and maintaining adequate internal control over financial reporting, as such term is defined in Exchange Act Rule 13a-15(f). Under the supervision and with the participation of our management, including our Principal Executive Officer and Principal Financial Officer, we evaluated the effectiveness of our internal control over financial reporting based on the framework in Internal Control-Integrated Framework (2013) issued by the Committee of Sponsoring Organizations of the Treadway Commission. Because of inherent limitations, internal control over financial reporting may not prevent or detect misstatements. Also, projections of any evaluation of effectiveness to future periods are subject to the risk that controls may become inadequate because of changes in conditions, or that the degree of compliance with the policies or procedures may deteriorate. Based on our evaluation under that framework and applicable SEC rules, our management concluded that our internal control over financial reporting was effective as of December 31, 2020.2023.
The effectiveness of our internal control over financial reporting as of December 31, 2020,2023, has been audited by PricewaterhouseCoopers LLP, an independent registered public accounting firm, as stated in their report which is included herein (Item 8).
Changes in Internal Control Over Financial Reporting
In response to the COVID-19 pandemic, we have required employees, some of whom are involved in the operation of our internal controls over financial reporting, to work remotely. Despite working remotely, thereThere have been no changes in our internal control over financial reporting during the quarter ended December 31, 2020,2023, that have materially affected, or are reasonably likely to materially affect, our internal control over financial reporting.
ITEM 9B. OTHER INFORMATION
Not applicable.
ITEM 9C. DISCLOSURE REGARDING FOREIGN JURISDICTIONS THAT PREVENT INSPECTIONS
Not applicable.
PART III.
ITEM 10. DIRECTORS, EXECUTIVE OFFICERS AND CORPORATE GOVERNANCE
Directors of the Registrant
Information concerning our directors is set forth in our 20212024 definitive Proxy Statement and is incorporated herein by this reference.
Executive Officers of the Registrant
Information concerning our executive officers is included in Part I, Item 1, Business, of this Annual Report.
Compliance with Section 16(a) of the Exchange Act
Information on compliance with Section 16(a) of the Exchange Act is set forth in our 20212024 definitive Proxy Statement and is incorporated herein by this reference.
Code of Ethics
Information concerning the code of ethics, or code of business conduct, is set forth in our 20212024 definitive Proxy Statement and is incorporated herein by this reference.
Nominating Procedures
Information concerning the nominating procedures is set forth in our 20212024 definitive Proxy Statement and is incorporated herein by this reference.
The Audit Committee
Information concerning the Audit Committee is set forth in our 20212024 definitive Proxy Statement and is incorporated herein by this reference.
The Audit Committee Financial Experts
Information concerning the Audit Committee Financial Experts is set forth in our 20212024 definitive Proxy Statement and is incorporated herein by this reference.
The Executive Compensation Committee
Information concerning the Executive Compensation Committee is set forth in our 20212024 definitive Proxy Statement and is incorporated herein by this reference.
The Corporate Governance Committee
Information concerning the Corporate Governance Committee is set forth in our 20212024 definitive Proxy Statement and is incorporated herein by this reference.
The Executive Committee
Information concerning the Executive Committee is set forth in our 20212024 definitive Proxy Statement and is incorporated herein by this reference.
Committee Charters
The full text of our Audit Committee charter, Executive Compensation Committee charter, Corporate Governance Committee charter and Executive Committee charter are published on and may be printed from our website at www.onegas.com and are also available from our corporate secretary upon request.
ITEM 11. EXECUTIVE COMPENSATION
Information on executive compensation is set forth in our 20212024 definitive Proxy Statement and is incorporated herein by this reference.
ITEM 12. SECURITY OWNERSHIP OF CERTAIN BENEFICIAL OWNERS AND MANAGEMENT AND RELATED STOCKHOLDER MATTERS
Security Ownership of Certain Beneficial Owners
Information concerning the ownership of certain beneficial owners is set forth in our 20212024 definitive Proxy Statement and is incorporated herein by this reference.
Security Ownership of Management
Information on security ownership of directors and officers is set forth in our 20212024 definitive Proxy Statement and is incorporated herein by this reference.
Equity Compensation Plan Information
The following table sets forth certain information concerning ourInformation on equity compensation plans as of December 31, 2020:
| | | | | | | | | | | | | | | | | | | | |
| | Number of Securities Issued Upon Exercise of Outstanding Options, Warrants and Rights | | Weighted-Average Exercise Price of Outstanding Options, Warrants and Rights | | Number of Securities Remaining Available For Future Issuance Under Equity Compensation Plans (Excluding Securities in Column (a)) |
| Plan Category | | (a) | | (b) | | (c) |
| Equity compensation plans approved by security holders (1) | | — | | $ | — | | (3) | | 2,942,946 | |
| Equity compensation plans not approved by security holders (2) | | — | | | $ | — | | | 1,812 | |
| Total | | — | | | $ | — | | | 2,944,758 | |
(1) Includes shares granted underis set forth in our ESPP2024 definitive Proxy Statement and restricted stock incentive units and performance-unit awards granted under our ECP and our Deferred Compensation Plan for Non-employee Directors. For a brief description of the material features ofis incorporated herein by this plan, see Note 13 of the Notes to Consolidated Financial Statements in this Annual Report. Column (c) includes 143,990 and 2,798,956 shares available for future issuance under our ESPP and our ECP and Deferred Compensation Plan for Non-employee Directors, respectively.
(2) Includes the Employee Stock Award Program. No shares under the Employee Stock Award Program have been issued since May 2017, and the Company does not intend to issue any further shares thereunder.
(3) Compensation deferred into our common stock under our ECP and Deferred Compensation Plan for Non-employee Directors is distributed to participants at fair market value on the date of distribution. The price used to calculate the weighted-average exercise price in the table is $76.77, which represents the year-end closing price of our common stock on the NYSE.reference.
ITEM 13. CERTAIN RELATIONSHIPS AND RELATED TRANSACTIONS, AND DIRECTOR INDEPENDENCE
Information on certain relationships and related transactions and director independence is set forth in our 20212024 definitive Proxy Statement and is incorporated herein by this reference.
ITEM 14. PRINCIPAL ACCOUNTINGACCOUNTANT FEES AND SERVICES
Information on the principal accountant’s fees and services is set forth in our 20212024 definitive Proxy Statement and is incorporated herein by this reference.
PART IV.
ITEM 15. EXHIBITS, FINANCIAL STATEMENT SCHEDULES
| | | | | | | | | | | |
| (1) Consolidated Financial Statements | Page No. |
| | | |
| | | |
| | | |
| | 2021 | |
| | | |
| | 2021 | |
| | | |
| | 2022 | |
| | | |
| | 2021 | |
| | | |
| (f) | | 2021 | |
| | | |
| | | |
| | | |
| (2) Consolidated Financial Statements Schedules | |
| | | |
| All schedules have been omitted because of the absence of conditions under which they are required. |
| | | | | | | | |
| (3) Exhibits |
| | |
| 3.1 | |
| | |
| 3.2 | |
| | |
| 3.3 | | |
| | |
| 4.1 | |
| | |
| 4.2 | |
| | |
| 4.3 | |
| | |
| 4.4 | |
| | |
| | |
| 4.10 | Indenture by and among Kansas Gas Service Securitization I, L.L.C., U.S. Bank Trust Company, National Association, as Indenture Trustee, and U.S. Bank National Association, as Securities Intermediary (including the form of the Securitized Utility Tariff Bonds and the Series Supplement), dated as of November 18, 2022 (incorporated by reference to Exhibit 4.1 to ONE Gas, Inc.’s Current Report on Form 8-K filed on November 18, 2022 (File No. 1-36108)). | | | | | | | | | | | | | 4.11 | | | | | | | 4.12 | | | | | | 10.1* | | | | | | 10.210.2* | | | | | | 10.310.3* | | | | | | 10.410.4* | | | | | | 10.510.5* | | | | |
| | | | | | | | | | 10.610.6* | | | | | | 10.710.7* | | | | | | 10.810.8* | | | | | | 10.9* | | | | | | 10.10* | | | | | | 10.910.11* | | | | | | 10.10 | | | | | | 10.11 | | | | | | 10.12 | Extension Agreement dated as of October 5, 2018, among ONE Gas, Inc., Bank of America, N.A., as administrative agent, swing line lender, a letter of credit issuer and a lender, and the other lenders and letter of credit issuers parties thereto (incorporated by reference to Exhibit 10.1 to ONE Gas Inc’s Current Report on Form 8-K filed on October 5, 2018 (File No. 1-36108)). | | | | | 10.1310.12* | | | | | | 10.14 | | | | | | 10.15 | Credit Agreement, dated as of April 7, 2020, among ONE Gas, Inc., Bank of America, N.A., as administrative agent, and the other lenders party thereto (incorporated by reference to Exhibit 10.1 to ONE Gas, Inc.’s Current Report on Form 8-K filed on April 7, 2020 (File No. 1-36108)). | | | |
| | | | | | | | | | 10.1610.13 | | | | | | 10.1710.14* | | | | | | 10.1810.15* | | | | | | 10.1910.16 | Equity Distribution Agreement, dated as of February 26, 2020,24, 2023, among ONE Gas, Inc. and Morgan Stanley & Co. LLC, BofA Securities, Inc., andJ.P. Morgan Securities, LLC, Mizuho Securities USA LLC and RBC Capital Markets, LLC, acting as managers; Morgan Stanley & Co. LLC, Bank of America, N.A., JPMorgan Chase Bank, National Association, Mizuho Markets Americas LLC and Mizuho Securities Americas LLC,Royal Bank of Canada, acting as forward purchasers; and Morgan Stanley & Co. LLC, BofA Securities, Inc. and, J.P. Morgan Securities LLC, Mizuho Securities USA LLC and RBC Capital Markets, LLC, acting as forward sellers (incorporated by reference to Exhibit 1.1 to ONE Gas, Inc.’s Current Report on Form 8-K filed on February 26, 202024, 2023 (File No. 1-36108)). | | | | | 10.2010.17 | | | | | | 10.2110.18* | | | | | | 10.2210.19* | | | | | | 10.2310.20 | Amended and Restated CreditExtension Agreement, dated as of October 5, 2017,March 16, 2023, among ONE Gas, Inc., Bank of America, N.A., as administrative agent, swinglineswing line lender, and a letter of credit issuer, and the other lenders and letter of credit issuers parties thereto (incorporated by reference to Exhibit 10.1 to ONE Gas, Inc.’s Current Report on Form 8-K filed on October 6, 2017March 16, 2023 (File No. 1-36108)). | | | | | 10.2410.21* | | | | |
| | | | | | | | | | 10.2510.22 | First Amendment and ExtensionForward Sale Agreement, dated as of October 4, 2019, amongSeptember 11, 2023, between ONE Gas, Inc., and Bank of America, N.A., as administrative agent, swing line lender, a letter of credit issuer and a lender, and the other lenders and letter of credit issuers parties thereto (incorporated by reference to Exhibit 10.1 to ONE Gas, Inc.’s Current Report on Form 8-K filed on October 4, 2019September 14, 2023 (File No. 1-36108)). | | | | | 10.2610.23* | | | | | | 10.2710.24* | | | | | | 10.25* | | | | | | | 10.26* | | | | | | 10.27* | | | | | | 10.2910.28* | | | | | | 10.29* | | | | | | | 10.30* | | | | | | 10.31* | | | | | | 10.3110.32* | | | | |
| | | | | | | | | | 10.3210.33 | | | | | | 10.34 | Second Amended and Restated credit Agreement, dated as of February 22,March 16, 2021, among ONE Gas, Inc., the lenders from time to time party thereto and Bank of America, N.A., as administrative agent (incorporated by reference to Exhibit 10.1 to ONE Gas, Inc.’s Current Report on Form 8-K filed on February 22,March 16, 2021 (File No. 1-36108)). | | | | | 10.35* | | | | | | | 10.36* | | | | | | 10.37 | First Amendment to Second Amended and Restated Credit Agreement, dated as of March 16, 2022, among ONE Gas, Inc., Bank of America, N.A., as administrative agent, swing line lender and letter of credit issuer, and the lenders party thereto (incorporated by reference to Exhibit 10.1 to ONE Gas, Inc.’s Current Report on Form 8-K filed on March 17, 2022 (File No. 1-36108)). |
| | | | | | | | | | | | | 10.38 | | | | | | 10.39 | | | | | | 10.40 | | | | | | 10.41 | | | | | | 10.42 | | | | | | 10.43 | Commitment Increase Agreement, dated as of October 20, 2023, among ONE Gas, Inc., Bank of America, N.A., as administrative agent, swing line lender, and letter of credit issuer, and the other lenders and letter of credit issuers parties thereto (incorporated by reference to Exhibit 10.1 to ONE Gas, Inc.’s Current Report on Form 8-K filed on October 23, 2023 (File No. 1-36108)). | | | | | 10.44 | | | | | | 21.1 | | | | | | 23.1 | | | | | | 31.1 | | | | | | 31.2 | | | | | | 32.1 | | | | | | 32.2 | | | | |
| | | | | | | | | | 101.INS | XBRL Instance Document - the instance document does not appear in the Interactive Data File because its XBRL tags are embedded within the Inline XBRL document. | | | | | 101.SCH | XBRL Schema Document. | | | | | 101.CAL | XBRL Calculation Linkbase Document. | | | | | 101.LAB | XBRL Label Linkbase Document. | | | | | 101. PRE | XBRL Presentation Linkbase Document. | | | | | 101.DEF | XBRL Extension Definition Linkbase Document. | | | | | 104 | Cover Page Interactive Data File (embedded within the Inline XBRL document and contained in Exhibit 101). |
* Management contract or compensatory plan or arrangement
Attached as Exhibit 101 to this Annual Report are the following XBRL-related documents: (i) Document and Entity Information; (ii) Consolidated Statements of Income for the years ended December 31, 2020, 20192023, 2022 and 2018;2021; (iii) Consolidated Statements of Comprehensive Income for the years ended December 31, 2020, 20192023, 2022 and 2018;2021; (iv) Consolidated Balance Sheets as of December 31, 20202023 and 2019;2022; (v) Consolidated Statements of Cash Flows for the years ended December 31, 2020, 20192023, 2022 and 2018;2021; (vi) Consolidated Statements of Equity for the years ended December 31, 2020, 20192023, 2022 and 2018;2021; and (vii) Notes to Consolidated Financial Statements.
We also make available on our website the Interactive Data Files submitted as Exhibit 101 to this Annual Report.
ITEM 16. FORM 10-K SUMMARY
None.
SignaturesSIGNATURE
Pursuant to the requirements of Section 13 or 15(d) of the Exchange Act, the registrant has duly caused this report to be signed on its behalf by the undersigned, thereunto duly authorized.
| | | | | | | | | | | | | Date: February 22, 2024 | | February 26, 2021 | ONE Gas, Inc. | | | | Registrant | | | | | | | By: | /s/ Caron A. LawhornChristopher P. Sighinolfi | | | | Caron A. LawhornChristopher P. Sighinolfi | | | | Senior Vice President and | | | | Chief Financial Officer | | | (Principal Financial Officer) |
Pursuant to the requirements of the Exchange Act, this report has been signed below by the following persons on behalf of the registrant and in the capacities indicated on this 26th22nd day of February 2021.2024.
| | | | | | | | | | | | | /s/ John W. Gibson | | /s/ Pierce H. Norton IIRobert S. McAnnally | | John W. Gibson | | Pierce H. Norton IIRobert S. McAnnally | | Chairman of the Board | | President, Chief Executive Officer and | | | | and Director | | | | | | /s/ Caron A. LawhornChristopher P. Sighinolfi | | /s/ Jeffrey J. HusenBrian F. Brumfield | | Caron A. LawhornChristopher P. Sighinolfi | | Jeffrey J. HusenBrian F. Brumfield | | Senior Vice President and | | Vice President, Chief Accounting Officer | | Chief Financial Officer | | and Controller | | | | (Principal Accounting Officer) | | | | | | /s/ Robert B. Evans | | /s/ Tracy E. Hart | | Robert B. Evans | | Tracy E. Hart | | Director | | Director | | | | | | /s/ Deborah A. P. Hersman | | /s/ Michael G. Hutchinson | | Deborah A. P. Hersman | | /s/ Pattye L. Moore | | Michael G. Hutchinson | | Pattye L. Moore | | Director | | Director | | | | | | /s/ Pattye L. Moore | | /s/ Eduardo A. Rodriguez | | Pattye L. Moore | | Eduardo A. Rodriguez | | Director | | Director | | | | | | /s/ Douglas H. Yaeger | | | | Eduardo A. Rodriguez | | Douglas H. Yaeger | | | | Director | | | Director | | | |
|