UNITED STATES
SECURITIES AND EXCHANGE COMMISSION
Washington, D.C. 20549
FORM 10-K
(Mark One)
| | | | | |
| ☒ | ANNUAL REPORT PURSUANT TO SECTION 13 OR 15(d) OF THE SECURITIES EXCHANGE ACT OF 1934 |
For the fiscal year ended December 31, 20202023
OR
| | | | | |
| ☐ | TRANSITION REPORT PURSUANT TO SECTION 13 OR 15(d) OF THE SECURITIES EXCHANGE ACT OF 1934 |
For the transition period from _________________________ to
Commission file number: 001-36246
Civeo Corporation
____________
(Exact name of registrant as specified in its charter)
| | | | | | | | | | | |
| British Columbia, Canada | 98-1253716 | |
| (State or other jurisdiction of | (I.R.S. Employer | |
| incorporation or organization) | Identification No.) | |
| | | |
| Three Allen Center, 333 Clay Street, Suite 4980, | | |
| Houston, Texas | 77002 | |
| (Address of principal executive offices) | (Zip Code) | |
| | |
| 713 510-2400 |
| (Registrant’s telephone number, including area code) |
Securities registered pursuant to Section 12(b) of the Act:
| | | | | | | | |
| Title of Each Class | Trading Symbol(s) | Name of Exchange on Which Registered |
| Common Shares, no par value | CVEO | New York Stock Exchange |
Securities registered pursuant to Section 12(g) of the Act:
None
Indicate by check mark if the registrant is a well-known seasoned issuer, as defined in Rule 405 of the Securities Act.
Indicate by check mark if the registrant is not required to file reports pursuant to Section 13 or Section 15(d) of the Act.
Indicate by check mark whether the registrant (1) has filed all reports required to be filed by Section 13 or 15(d) of the Securities Exchange Act of 1934 during the preceding 12 months (or for such shorter period that the registrant was required to file such reports), and (2) has been subject to such filing requirements for the past 90 days.
Indicate by check mark whether the registrant has submitted electronically every Interactive Data File required to be submitted pursuant to Rule 405 of Regulation S-T (§232.405 of this chapter) during the preceding 12 months (or for such shorter period that the registrant was required to submit such files).
Indicate by check mark whether the registrant is a large accelerated filer, an accelerated filer, a non-accelerated filer, a smaller reporting company or an emerging growth company. See the definitions of "accelerated filer," "large accelerated filer," "smaller reporting company” and “emerging growth company” in Rule 12b-2 of the Exchange Act.
(Check one):
| | | | | | | | | | | | | | | | | |
| Large Accelerated Filer | ☐ | Accelerated Filer | ☒ | Emerging Growth Company | ☐ |
| | | | | | |
| Non-Accelerated Filer | ☐ | Smaller Reporting Company | ☐☒ | | |
If an emerging growth company, indicate by check mark if the registrant has elected not to use the extended transition period for complying with any new or revised financial accounting standards provided pursuant to Section 13(a) of the Exchange Act. ☐
Indicate by check mark whether the registrant has filed a report on and attestation to its management’s assessment of the effectiveness of its internal control over financial reporting under Section 404(b) of the Sarbanes-Oxley Act (15 U.S.C. 7262(b)) by the registered public accounting firm that prepared or issued its audit report. ☒
If securities are registered pursuant to Section 12(b) of the Act, indicate by check mark whether the financial statements of the registrant included in the filing reflect the correction of an error to previously issued financial statements. ☐
Indicate by check mark whether any of those error corrections are restatements that required a recovery analysis of incentive-based compensation received by any of the registrant’s executive officers during the relevant recovery period pursuant to §240.10D-1(b). ☐
Indicate by check mark whether the registrant is a shell company (as defined in Rule 12b-2 of the Exchange Act).
The aggregate market value of common shares held by non-affiliates computed by reference to the price at which the common equity was last sold, or the average bid and asked price of such common equity, as of the last business day of the registrant’s most recently completed second fiscal quarter, June 30, 2020,2023, was $81,953,395.$254,992,411.
The Registrant had 14,286,29014,669,767 common shares outstanding as of February 22, 2021.23, 2024.
DOCUMENTS INCORPORATED BY REFERENCE
Portions of the registrant's Definitive Proxy Statement for the 20212024 Annual General Meeting of Shareholders, which the registrant intends to file with the Securities and Exchange Commission not later than 120 days after the end of the fiscal year covered by this Annual Report on Form 10-K, are incorporated by reference into Part III of this Annual Report on Form 10-K.
CIVEO CORPORATION
INDEX
| | | | | | | | |
| | | Page No. |
| | |
| |
| | | |
| | |
| | |
| | |
| Cybersecurity | |
| | |
| | |
| | |
| | | |
| | |
| | |
| Item 6. | Selected Financial DataReserved | |
| | |
| | |
| | |
| | |
| | |
| | |
| Disclosure Regarding Foreign Jurisdictions that Prevent Inspections | |
| | | |
| | |
| | |
| | |
| | |
| | |
| | |
| | | |
| | |
| | |
| | |
| | | |
| |
| |
PART I
This annual report on Form 10-K (annual report) contains certain “forward-looking statements" within the meaning of Section 27A of the Securities Act of 1933 (the Securities Act) and Section 21E of the Securities Exchange Act of 1934 (the Exchange Act). Actual results could differ materially from those projected in the forward-looking statements as a result of a number of important factors. For a discussion of known material factors that could affect our results, please refer to "Cautionary Statement Regarding Forward-Looking Statements" below and “Part I, Item 1. Business,” “Part I, Item 1A. Risk Factors,” “Part II, Item 7. Management's Discussion and Analysis of Financial Condition and Results of Operations” and “Part II, Item 7A. Quantitative and Qualitative Disclosures about Market Risk” of this annual report.
In addition, in certain places in this annual report, we refer to reports published by third parties that purport to describe trends or developments in the energy industry. We do so for the convenience of our shareholders and in an effort to provide information available in the market that will assist our investors in a better understanding of the market environment in which we operate. However, we specifically disclaim any responsibility for the accuracy and completeness of such information and undertake no obligation to update such information.
On November 19, 2020, we effected a reverse share split where each twelve issued and outstanding common shares were converted into one common share (the Reverse Share Split). Our common shares began trading on a reverse share split-adjusted basis on November 19, 2020. All common share and per common share data included in this annual report have been retroactively adjusted to reflect the Reverse Share Split.
Cautionary Statement Regarding Forward-Looking Statements
We include the following cautionary statement to take advantage of the "safe harbor" provisions of the Private Securities Litigation Reform Act of 1995 for any "forward-looking statement" made by us or on our behalf. All statements other than statements of historical facts included in this annual report are forward-looking statements. The forward-looking statements can be identified by the use of forward-looking terminology including “may,” “expect,” “anticipate,” “estimate,” “continue,” “believe” or other similar words. Such statements may include statements regarding our future financial position, budgets, capital expenditures, projected costs, plans and objectives of management for future operations and possible future strategic transactions. Where any such forward-looking statement includes a statement of the assumptions or bases underlying such forward-looking statement, we caution that, while we believe such assumptions or bases to be reasonable and make them in good faith, assumed facts or bases almost always vary from actual results. The differences between assumed facts or bases and actual results can be material, depending upon the circumstances. The factors identified in this cautionary statement are important factors (but not necessarily all of the important factors) that could cause actual results to differ materially from those expressed in any forward-looking statement made by us, or on our behalf.
In any forward-looking statement where we, or our management, express an expectation or belief as to future results, such expectation or belief is expressed in good faith and believed to have a reasonable basis. However, there can be no assurance that the statement of expectation or belief will result or be achieved or accomplished. Taking this into account, the following are identified as important factors that could cause actual results to differ materially from those expressed in any forward-looking statement made by, or on behalf of, us:
•the level of supply and demand for oil, metallurgical coal, natural gas, iron ore and other minerals;
•the level of activity, spending and developmentsnatural resource development in the Canadian oil sands;Canada and Australia;
•the level of demand, particularly from China, for coal and other natural resources from and investments and opportunities in Australia;
•the availability of attractive oilnatural resource projects and natural gas field assets, which may be affected by governmental actions, including changes in royalty or tax regimes, or environmental activists which may restrict drilling;drilling or development;
•fluctuations in the current and future prices of oil, coal, natural gas, iron ore and other minerals;
•failure by our customers to reach positive final investment decisions on, or otherwise not complete, projects with respect to which we have been awarded contracts to provide related hospitality services, which may cause those customers to terminate or postpone the contracts;
•fluctuations in currency exchange rates;
•the impact of the ongoing COVID-19 pandemic and the response thereto;
•general global economic conditions, andsuch as the pace of global economic growth;growth, a general slowdown in the global economy, supply chain disruptions, inflationary pressures and geopolitical events such as the ongoing Russia/Ukraine and Israel/Hamas conflicts;
•changes in tax laws, tax treaties or tax regulations or the interpretation or enforcement thereof, including taxing authorities not agreeing with our assessment of the effects of such laws, treaties and regulations;
•changes to government and environmental regulations, including climate change;change legislation and clean energy policies;
•global weather conditions, natural disasters, global health concerns, and security threats;threats, including cybersecurity incidents;
•our ability to hire and retain skilled personnel;
•the availability and cost of capital, including the ability to access the debt and equity markets;
•our capital structure and our ability to return cash to shareholders through dividends or common share repurchases;
•our ability to integrate acquisitions;
•the development of new projects, including whether such projects will continue in the future; and
•other factors identified in Item 1A. - "Risk Factors" of this annual report.
Such risks and uncertainties are beyond our ability to control, and in many cases, we cannot predict the risks and uncertainties that could cause our actual results to differ materially from those indicated by the forward-looking statements.
All subsequent written and oral forward-looking statements attributable to us or to persons acting on our behalf are expressly qualified in their entirety by reference to these risks and uncertainties. You should not place undue reliance on forward-looking statements. Each forward-looking statement speaks only as of the date of the particular statement, and we do not undertake any obligation to publicly update or revise any forward-looking statements except as required by law.
ITEM 1. Business
Available Information
We maintain a website with the address of www.civeo.com. We are not including the information contained on our website as a part of, or incorporating it by reference into, this annual report. We file or furnish annual, quarterly and current reports, proxy statements and other documents with the Securities and Exchange Commission (the SEC). We make available free of charge through our website our Annual Report on Form 10-K, quarterly reports on Form 10-Q and current reports on Form 8-K, and amendments to these reports, as soon as reasonably practicable after we electronically file such material with, or furnish such material to, the SEC. Also, the SEC maintains a website that contains reports, proxy and information statements, and other information regarding issuers that file electronically with the SEC, including us, and our filings are available on the Internet at www.sec.gov and free of charge upon written request to our corporate secretary at the address shown on the cover page of this annual report.
Our Company
We provide hospitality services to the natural resources industry in Canada, Australia and the U.S. We provide a full suite of hospitality services for our guests in the natural resources industry, including lodging, catering and food service, housekeeping and maintenance at accommodation facilities that we or our customers own. In many cases, we provide services that support the day-to-day operations of accommodationthese facilities, such as laundry, facility management and maintenance, water and wastewater treatment, power generation, communication systems, security and logistics. We also offermanage development activities for workforce accommodation facilities, including site selection, permitting, engineering and design, manufacturing management and site construction, along with providing hospitality services once the facility is constructed.
We primarily operate in some of the world’s most active oil, metallurgical (met) coal, liquefied natural gas (LNG) and iron ore producing regions, where, in many cases, traditional accommodations and ourrelated infrastructure often are not accessible, sufficient or cost effective. Our customers include major and independent oil companies, mining companies, engineering companies and oilfield and mining service companies. Our extensive suite of services enables us to meet the unique needs of each of our customers, while providing comfortable accommodations for their employees. Our customers are able to outsource their accommodations needs to a single supplier, maintaining employee welfare and satisfaction while focusing their investment on their core resource production efforts.
Our Company is built on the foundation of the following core values: Safety, Respect, Care, Excellence, Integrity and Collaboration. We put the safety of our employees and guests above all other concerns. We care about our people, guests, customers, communities and the environment, and we deliver excellent service with passion and pride. We act with integrity and collaborate with our people, communities, customers and partners. We take an active role working to minimize the environmental impact of our operations through a number of sustainable initiatives. We also have a focus on water conservation and utilize alternative water supply options such as recycling and rainwater collection and use. By building infrastructure such as wastewater treatment and water treatment facilities to recycle gray and black water on some of our sites, we are able to gain cost efficiencies as well as reduce the use of trucks related to water and wastewater hauling, which in turn, reduces our carbon footprint. In our Australian villages, we utilize passive-solar-design principles and smart-switching systems to reduce the need for electricity related to heating and cooling.
We provideOur hospitality services that span the lifecycle of customer projects, from the initial exploration and resource delineation to long-term production. Initially, as customers assess the resource potential and determine how they will develop it, they typically need our hospitality services for a limited number of employees for an uncertain duration of time. Our fleet of mobile assets is well-suited to support this initial exploratory stage as customers evaluate their development and construction plans. As development of the resource begins, we are able to serve their needs through either: (1)(i) our fleet of mobile assets, particularly for shorter term projects such as pipeline construction and seasonal drilling programs; (2)programs, (ii) our scalable lodge or village model;model, or (3)(iii) our service of guestsintegrated services model in customer-owned facilities. As projects grow and headcount needs increase, we are able to meet our customers growing needs at our accommodation facilities or with our hospitality services. By providing infrastructure support and hospitality services early in the project lifecycle, we are well positioned to continue to service our customers throughout the production phase, which typically lasts decades.
Our scalable facilities provide workforce accommodations where, in many cases, traditional accommodations and related housing are not accessible, sufficient or cost effective. Our customers are able to outsource their accommodations needs to a single supplier, maintaining employee welfare and satisfaction while focusing their investment on their core resource production efforts. Our primary focus is on providing these hospitality services to leading natural resource companies at our major properties, which we refer to as lodges in Canada and the U.S. and villages in Australia, or at facilities owned by our customers. We own and operate 2824 lodges and villages with a total of approximately 30,00026,000 rooms. We operate approximately 9,00014,200 rooms owned by our customers. Additionally, in both Canada, and the U.S., we also offer a fleet of mobile assets which serve shorter term projects, such as pipeline construction. We have long-standing relationships with many of our customers, many of whom are, or are affiliates of, large, investment-grade energy and mining companies.
Demand for our hospitality services is influenced by four primary factors: (1) commodity prices, (2) available infrastructure, (3) headcount requirements and (4) competition. Current commodity prices, and our customers’ expectations for future commodity prices, influence customers’ spending and maintenance on current productive assets, expansion of existing assets and greenfield development of new assets. In addition to commodity prices, different types of customer activity require varying workforce sizes, influencing the demand for our services. Competing locations and services will also influence demand for our rooms and services.
In the Canadian oil sands region, demand for our hospitality services is primarily influenced by oil prices. Spending on the construction and development of new projects has historically decreased as the outlook for oil prices decreases. However, spending on current operations and maintenance has historically reacted less quickly and less severely to changes in oil prices, as customers consider their cash operating costs, rather than overall full-cycle returns. Likewise, construction and expansion projects already underway have also been less sensitive to commodity price decreases, as customers generally focus on completion and incremental costs. In 2020, demand for our services was impacted by the significant decline in oil prices stemming from global oversupply of oil coupled with the historic decline in oil demand due to the COVID-19 pandemic.Canadian oil prices were also impacted by provincial oil production curtailments and continued insufficient long-term takeaway capacity. Natural gas prices also influence oil sands activity as an input cost: as natural gas prices fluctuate, a significant component of our customers’ operating costs fluctuate as well.
Another factor that influences demand for our hospitality services is the type of customer project we are supporting. Generally, Canadian customers require larger workforces during construction and expansionary periods, and therefore have higher demand for our rooms and services. Operational and maintenance headcounts are typically a fraction, 20-25%, of the headcounts experienced during construction.
In addition, proximity to customer activity and availability of customer-owned and competitor-owned rooms influences the rental demand of our rooms. Typically, customers prefer to first utilize their own rooms on location, and if such customer-owned rooms are insufficient, customers prefer to avoid busing their workforces to housing more than 45 kilometers away.
A number of multinational energy companies believe there is a potential to export LNG from Canada to meet the increasing global demand, particularly in Asia, for LNG. We expect that LNG activity in Western Canada will be influenced by the global prices for LNG, which are largely tied to global oil prices, global supply/demand dynamics for LNG and Western Canadian wellhead prices for natural gas.
Currently, Western Canada does not have any operational LNG export facilities. LNG Canada (LNGC), a joint venture among Shell Canada Energy, an affiliate of Royal Dutch Shell plc (40 percent), and affiliates of PETRONAS, through its wholly-owned entity, North Montney LNG Limited Partnership (25 percent), PetroChina (15 percent), Mitsubishi Corporation (15 percent) and Korea Gas Corporation (5 percent), is currently constructing a liquefaction and export facility in Kitimat, British Columbia (Kitimat LNG Facility). LNGC activity and related pipeline projects are a material driver of activity for our Sitka Lodge, as well as for our mobile assets, which are contracted to serve several portions of the related pipeline construction activity. See "Canada-Canadian British Columbia Lodge" for more information.
Our Australian villages support similar activities as our Canadian lodges for the natural resources industry in Australia. Our customers are typically developing and producing met coal, iron ore and other minerals which have resource lives that are measured in decades. As such, their spending levels tend to react similarly to commodity prices as the spending levels of our Canadian customers. Spending on producing assets is less sensitive to commodity price decreases in the short and medium term, assuming the projects remain cash flow positive. However, new construction projects and expansionary projects are typically canceled or deferred during periods of lower met coal and iron ore prices. Similar to the Canadian market, new project construction activity typically requires larger workforces than day-to-day operations, where proximity and availability of customer-owned rooms influences the demand for our rooms and services. Since 2017, our customer service requirements have primarily been driven by production, maintenance and operational activities. More recently, we have seen an increase in the number of significant maintenance projects, along with customers initiating projects to optimize their operations. This work has also included some small mine expansion projects. Current met coal prices and global economic and political uncertainty make it unlikely that our customers will move forward with major met coal expansionary projects in 2021. Customer growth projects for met coal could be sanctioned later in 2021 and into 2022 should the global economy and met coal prices stabilize. However, current high iron ore prices are conducive to customer growth projects and we expect to support several such growth projects in Western Australia in 2021.
Our U.S. operations are primarily tied to activity in the U.S. shale formations in the Permian Basin, the Mid-Continent, the Bakken and the Rockies, as well as activity in the Louisiana downstream and offshore Gulf of Mexico markets. Given the
shorter investment horizon and decision cycle of our U.S. customers, which is typically on a well-by-well basis, spending activities of U.S. customers normally react more quickly to changes in oil and natural gas prices. These spending dynamics were clearly demonstrated in 2020. With the decline in oil prices in April 2020 due to the COVID-19 pandemic and its impact on global oil demand, U.S. drilling and completion activity reached historic lows. By August 2020, the U.S. drilling rig count fell to an all-time low of 172. U.S. oil shale drilling and completion activity will continue to be dependent on sustained higher West Texas Intermediate oil prices, pipeline capacity and sufficient capital to support exploration and production (E&P) drilling and completion plans. The Permian Basin remains the most active U.S. unconventional play, representing 66% of the oil rigs active in the U.S. at the end of 2020. As the U.S. market for drilling rig accommodations is primarily supported by mobile assets, competition for well accommodations is primarily driven by the availability of permanent and temporary camp assets in the markets we service and pricing among our competitors, including hotels.
For the years ended December 31, 2020, 20192023, 2022 and 2018,2021, we generated $529.7$700.8 million, $527.6$697.1 million and $466.7$594.5 million in revenues and $147.2$39.5 million, $49.1$17.0 million and $88.1$6.1 million in operating loss,income, respectively. The majority of our operations, assets and income are derived from the hospitality services provided at lodges and villages we own that have historically been contracted by our customers under multi-year, take-or-pay or exclusivity contracts. The hospitality services we provide at these facilities generated 66%63% of our revenue for the year ended December 31, 2020.2023. Important performance metrics include revenue related to our major properties, average daily raterates and aggregate billed rooms. The table below summarizes these key statistics for the periods presented in this annual report.
| | | | Year Ended December 31, | | Year Ended December 31, |
| | | 2020 | | 2019 | | 2018 | | 2023 | | 2022 | | 2021 |
| | | (In thousands, except for room counts and average daily rate) | | (In thousands, except for room counts and average daily rate) |
Accommodation Revenue (1) | Accommodation Revenue (1) | | | | | | Accommodation Revenue (1) | | | |
| Canada | Canada | $ | 202,534 | | | $ | 281,577 | | | $ | 266,899 | |
| Australia | Australia | 144,070 | | | 126,047 | | | 117,896 | |
| United States | 2,451 | | | 12,462 | | | 18,288 | |
| Other | |
| Total Accommodation Revenue | Total Accommodation Revenue | $ | 349,055 | | | $ | 420,086 | | | $ | 403,083 | |
| Mobile Facility Rental Revenue (2) | Mobile Facility Rental Revenue (2) | | | | | |
Mobile Facility Rental Revenue (2) | |
Mobile Facility Rental Revenue (2) | | | | |
| Canada | Canada | $ | 33,192 | | | $ | 9,575 | | | $ | 9,316 | |
| United States | 16,837 | | | 28,119 | | | 20,389 | |
| Other | |
| Total Mobile Facility Rental Revenue | Total Mobile Facility Rental Revenue | $ | 50,029 | | | $ | 37,694 | | | $ | 29,705 | |
| Food Service and Other Services Revenue (3) | Food Service and Other Services Revenue (3) | | | | | |
Food Service and Other Services Revenue (3) | |
Food Service and Other Services Revenue (3) | | | | |
| Canada | Canada | $ | 33,923 | | | $ | 33,485 | | | $ | 15,601 | |
| Australia | Australia | 90,472 | | | 30,046 | | | 1,342 | |
| United States | 50 | | | 145 | | | 170 | |
| Other | |
| Total Food Service and Other Services Revenue | Total Food Service and Other Services Revenue | $ | 124,445 | | | $ | 63,676 | | | $ | 17,113 | |
| Manufacturing Revenue (4) | Manufacturing Revenue (4) | | | | | |
| Canada | $ | — | | | $ | 1,014 | | | $ | 4,196 | |
| United States | 6,200 | | | 5,085 | | | 12,595 | |
Manufacturing Revenue (4) | |
Manufacturing Revenue (4) | | | | |
| Other | |
| Total Manufacturing Revenue | Total Manufacturing Revenue | $ | 6,200 | | | $ | 6,099 | | | $ | 16,791 | |
| | Total Revenue | Total Revenue | $ | 529,729 | | | $ | 527,555 | | | $ | 466,692 | |
| Total Revenue | |
| Total Revenue | |
| Average Daily Rates for Lodges and Villages (5) | |
Average Daily Rates for Lodges and Villages (5) | |
Average Daily Rates for Lodges and Villages (5) | Average Daily Rates for Lodges and Villages (5) | | | | | | | | |
| Canada | Canada | $ | 95 | | | $ | 91 | | | $ | 89 | |
| Australia | Australia | $ | 73 | | | $ | 73 | | | $ | 78 | |
| Total Billed Rooms for Lodges and Villages (6) | Total Billed Rooms for Lodges and Villages (6) | | | | | |
Total Billed Rooms for Lodges and Villages (6) | |
Total Billed Rooms for Lodges and Villages (6) | | | | |
| Canada | Canada | 2,095,784 | | | 3,078,727 | | | 3,007,229 | |
| Australia | Australia | 1,968,284 | | | 1,717,186 | | | 1,512,030 | |
| | Average Exchange Rate | Average Exchange Rate | | | | | |
| Average Exchange Rate | |
| Average Exchange Rate | | | | |
| Canadian dollar to U.S. dollar | Canadian dollar to U.S. dollar | $ | 0.75 | | | $ | 0.75 | | | $ | 0.77 | |
| Australian dollar to U.S. dollar | Australian dollar to U.S. dollar | 0.69 | | | 0.70 | | | 0.75 | |
(1)Includes revenues related to lodge and village rooms and hospitality services for Civeo owned rooms for the periods presented.
(2)Includes revenues related to mobile assets for the periods presented.
(3)Includes revenues related to food service, laundry and water and wastewater treatment services, and facilities management for the periods presented.
(4)Includes revenues related to modular construction and manufacturing services for the periods presented. Civeo's remaining manufacturing operations in Louisiana were sold in the fourth quarter of 2022.
(5)Average daily rate is based on billed rooms and accommodation revenue for Civeo owned rooms during the periods presented.
(6)Billed rooms represents total billed days for Civeo owned rooms for the periods presented.
Our History
Our history is one of identifying customer and market needs and developing economic solutions. Our historical experience in Canada began in small, mobile camps and evolved into owning and managing large scale remote accommodations. In Australia, our operations originated with a similar build-own-operate model as we operate in our Canadian lodges, growing up to our current eight owned villages. Since then and with the addition of an acquisition, we have evolved our service delivery to include operating customer-owned locations with the same hospitality services that we provide at our owned villages.
Our Canadian operations, founded in 1977, began by providing modular rental housing to energy customers, primarily supporting drilling rig crews in the Western Canadian Sedimentary Basin. Over the next decade, we acquired a food service operation, enabling us to provide a more comprehensive accommodation solution. Through our experience with Syncrude’s Mildred Lake Village, a 2,100 bed facility that we operated and managed for them for nearly 20 years, we recognized athe need for a premium, and more permanent, solution for workforce accommodations and hospitality services in the Canadian oil sands region. Pursuing this strategy, we opened PTI Lodge in 1998, one of the first independent lodging facilities in the region.
Through our wide range of hospitality services, we are able to identify, solve and implement solutions and services that enhance the guests’ accommodations experience and reduce the customer’s total cost of housing a workforce in a remote operating location. Using our experiences and service delivery model, our hospitality services have evolved to include fitness centers, water and wastewater treatment, laundry service and many other enhancements. In 2018, we acquired Noralta Lodge Ltd. (Noralta), which provided remote hospitality services in Alberta, Canada (the Noralta Acquisition) through eleven lodges comprising over 5,700 owned rooms and 7,900 total rooms. Over time, we have developed into Canada’s largest third-party provider of accommodations and hospitality services in the Canadian oil sands region.
During 2015, we entered the Canadian LNG market with the construction of our Sitka Lodge. In 2018, LNGC's partners announced thatLNG Canada (LNGC), a positive FID had been reached onjoint venture among Shell Canada Energy, an affiliate of Shell plc (40 percent), and affiliates of PETRONAS, through its wholly-owned entity, North Montney LNG Limited Partnership (25 percent), PetroChina (15 percent), Mitsubishi Corporation (15 percent) and Korea Gas Corporation (5 percent), is currently constructing a liquefaction and export facility in Kitimat, British Columbia (Kitimat LNG Facility). The Kitimat LNG Facility is nearing completion and expected to be operational in 2024. Our Sitka Lodge is well positioned to serve construction activity at the Kitimat LNG Facility. British Columbia LNG activity and related pipeline projects are a material driver of activity for our Sitka Lodge,facility, as well as for our mobile assets, which are contracted to serve several portions of the related pipeline construction activity.
With the acquisition of our Australian business in December 2010, we began providing hospitality services to support the Australian natural resources industry through our villages located in Queensland, New South Wales and Western Australia. Like Canada, our Australian business has a long-history of taking care of customers in remote regions, beginning with itsour initial Moranbah Village in 1996, and has grown to become Australia’s largest independent provider of hospitality services for people working in remote locations. Our Australian business was the first to introduce resort-style accommodations to the mining sector, adding landscaping, outdoor kitchens, pools, fitness centers and, in some cases, taverns.
In 2019, we acquired Action Industrial Catering (Action), a provider of catering and managed services (which we refer to as our integrated services)services business) to the mining industry in Western Australia. The Action acquisition enhanced our service offering, expanded our geographic footprint, andadded exposure to new commodities in Australia and underlines our focus on pursuing growth opportunities that fit within our core competencies and strategic direction. In all our operating regions, our business is built on a culture of continuous service improvement to enhance the guest experience and reduce customers' workforce housing costs.
Our IndustryCustomers
We provide our hospitality services forto customers in the natural resource industries.resources industry. Our scalable facilities provide long-term and temporary workforce accommodations where, in many cases, traditional accommodations and related infrastructure often are not accessible, sufficient or cost effective. Once facilities are deployed in the field, we also provide
Through our wide range of hospitality services such asofferings, we are able to identify, solve and implement solutions and services that enhance the guest experience and reduce the customer’s total cost of housing a workforce in a remote operating location. In addition to lodging, catering and food service, housekeeping and maintenance as well as operations, including laundry,at accommodation facilities that we or our customers own, our hospitality services have evolved to include fitness centers, water and wastewater treatment, power generation, communication systems, securitylaundry service and logistics. Our hospitality services can be provided at accommodation facilities we own or at facilities owned by our customers. Demand for our services is cyclical and substantially dependent upon activity levels, particularly our customers’ willingness to spend capital on the exploration for, development and production of oil, met coal, LNG, iron ore andmany other natural resources. Our customers’ spending plans generally are based on their view of commodity supply and demand dynamics, as well as the outlook for near-term and long-term commodity prices. As a result, the demand for our services is sensitive to current and expected commodity prices.enhancements.
We serve multiple projectsOur customers either own their accommodations assets or outsource them. Customers may choose to own their accommodations assets because (i) their natural resource project is the only source of demand for rooms in the region; (ii) they believe in the long-term nature of their resource project; and/or (iii) they desire to maintain control over the supply of rooms for their project. Where customers have chosen to own their accommodations assets, customers usually subcontract the
management of the facility and the provision of the hospitality services to a third-party provider, such as Civeo through our integrated services model in customer-owned facilities.
Historically, Canadian oil sands developers and Australian mining companies built and owned the accommodations necessary to house their personnel in these remote regions because local labor and third-party owned rooms were not available. Over the past 20 years, and increasingly over the past 10 years, some customers have moved away from the insourcing business model for a portion of their accommodation needs as they recognize that owning accommodations and providing the related hospitality services are non-core investments for their business.
The accommodations outsourcing model is effective in regions in which multiple customers at most of our sites, whichhave on-going or prospective projects where third-party owned and operated accommodations assets can service multiple customers. This allows those customers to share some of the costs associated with their peak accommodations needs, including infrastructure (power, water, sewer and information technology) and central dining and recreation facilities.
Our business is significantly influenced by: (1) the level of production of The Canadian oil sands depositsregion and the Queensland Bowen Basin region are two geographic areas that fit this market dynamic.
Initial demand for our hospitality services has historically been driven by our customers’ capital spending programs related to the construction and development of natural resource projects and associated infrastructure, as well as the exploration for oil and natural gas. Long-term demand for our services has been driven by natural resource production, maintenance and turnaround activities in Alberta, Canada;operation of those facilities as well as expansion of those sites. In general, industry capital spending programs are based on the outlook for commodity prices, production costs, economic growth, global commodity supply/demand, estimates of resource production and the expectations of our customers' shareholders. As a result, demand for our hospitality services is largely sensitive to expected commodity prices, principally related to oil, met coal, production in Australia's Bowen BasinLNG and iron ore, productionand the resultant impact of these commodity price expectations on our customers’ spending. Other factors that can affect our business and financial results include the general global economic environment, including inflationary pressures, supply chain disruptions and labor shortages, volatility affecting the banking system and financial markets, availability of capital to the natural resource industry and regulatory changes in Western Australia; (2) activity levels in support of extractive industries in Australia; (3) LNGCanada, Australia and related pipeline activity in Canada; and (4) oil production in the U.S.
Historically, Canadian oil sands developers and Australian mining companies built, owned and in some cases operated the accommodations necessaryother markets, including governmental measures introduced to house their personnel in these remote regions because local labor and third-party owned
rooms were not available. Over the past 20 years, and increasingly over the past 10 years, some customers have moved away from the in sourcing business model for some of their accommodation needs as they recognize that owning accommodations and providing the hospitality services are non-core investments for their business.fight climate change.
We believe that our existing industry divides accommodations into two primary types: (1)(i) lodges and villages and (2)(ii) mobile assets. Civeo is principally focused on hospitality services at lodges and villages. Lodges and villages typically contain a larger number of rooms and require more time and capital to develop. These facilities typically have dining areas, meeting rooms, recreational facilities, pubs and taverns and landscaped grounds where weather permits. Lodges and villages are generally supported by multi-year, take-or-pay or exclusivity contracts. These facilities are designed to serve the long-term needs of customers in developing and producing their natural resource developments. Mobile assets are designed to follow customers’ activities and can be deployed rapidly to scale. They are often used to support conventional and in-situ drilling crews, as well as pipeline and seismic crews, and are contracted on a project-by-project, well-by-well or short-term basis. Oftentimes, customers will initially require mobile assets as they evaluate or initially develop a field or mine. Mobile asset projects can be dedicated and committed to a single customer or project or can serve multiple customers.
Our Competitors
The accommodation facilities market supporting the natural resource industry is segmented into competitors that serve components of the overall value chain, but very few offer the entire suite of hospitality services to customers. We estimate that customer-owned rooms represent over 50% of the market. Engineering firms such as Bechtel Fluor and ColtAmecFluor often design accommodations facilities. Many public and private firms, such as ATCO Structures & Logistics Ltd. (ATCO), Dexterra Group Inc. (Dexterra), Alta-Fab Structures Ltd. (Alta-Fab) and Northgate Industries Ltd. (Northgate), build modular accommodations for sale. Dexterra, Black Diamond Group Limited (Black Diamond), ATCO, Royal Camp Services Ltd. and Target Hospitality primarily own and lease units to customers and, in some cases, provide facility management services, usually on a shorter-term basis with a more limited number of rooms, similar to our mobile assets business. Facility service companies, such as Aramark Corporation (Aramark), Sodexo Inc. (Sodexo), Compass Group PLC (Compass Group), or and Cater Care, typically do not invest in and own the accommodations assets, but will provide hospitality services at third-party or customer-owned facilities.
Canada
Overview
During the year ended December 31, 2020,2023, we generated approximately 51%50% of our revenue from our Canadian operations. We are Westernwestern Canada’s largest provider of hospitality services for people working in remote locations. We provide our services through our lodges and mobile assets and at customer-owned locations. Our hospitality services support
workforces in the Canadian LNG and oil sands markets and in a variety of oil and natural gas drilling, mining, pipeline and related natural resource applications.
Canadian Market
Demand for our hospitality services in the Canadian market is largely driven by customer capital spending, which is greatly influenced by current and future commodity price driven. prices.
In the Canadian oil sands region, demand is primarily influenced by the longer-term outlook for crude oil prices rather than current energy prices, given the multi-year production life of oil sands projects and the capital investment associated with development of such large-scale projects. Demand for our Canadian lodges is secondarily impacted by oil pipeline takeaway capacity;capacity which influences the net price our customers receive for their oil production.
Spending on the construction and development of new projects generally decreases as the outlook for oil prices decreases. However, spending on current operations and maintenance has historically reacted less quickly and less severely to changes in 2020,oil prices, as customers consider their cash operating costs, rather than overall full-cycle returns. Likewise, construction and expansion projects already underway have also been less sensitive to commodity price decreases, as customers generally focus on completion and incremental costs. Natural gas prices also influence oil sands activity as an input cost: as natural gas prices fluctuate, a provincial oil production curtailment policy was imposed by the Governmentsignificant component of Alberta. However, monthly production limits were put on hold in December 2020 until further notice, allowing operators to produce freely at their discretion while the government monitors production. Should forecasts show storage inventories approaching maximum capacity, the government may reintroduce production limits. Demandour customers’ operating costs fluctuate as well.
Another factor that influences demand for our hospitality services relatedin the Canadian oil sands region is the type of customer project we are supporting. Generally, Canadian customers require larger workforces during construction and expansionary periods, and therefore have higher demand for our rooms and services. Operational and maintenance headcounts are typically a fraction, 20% to LNG is influenced by25%, of the global prices for LNG. Utilizationheadcounts experienced during construction.
In addition, proximity to customer activity and availability of customer-owned and competitor-owned rooms influences the rental demand of our existingrooms in the Canadian capacity and any future expansions will largely depend on continued LNG and oil sands spending relatedregion. Typically, customers prefer to existing production, maintenance activitiesfirst utilize their own rooms on location, and potential future expansion of existing projects.if such customer-owned rooms are insufficient, customers prefer to avoid busing their workforces to housing more than 45 kilometers away.
The Athabasca oil sands are located in northern Alberta, an area that is very remote, with a limited local labor supply. Of Canada’s approximately 3840 million residents, nearlyapproximately half of the population lives in ten cities, while approximately 12% of the population lives in Alberta and less than 1% of the population lives within 100 kilometers of the oil sands activity. The local municipalities, of which Fort McMurray is the largest, have limited infrastructure to respond to workforce accommodation demands and are a significant driving distance from many of the oil sands projects. As such, the workforce accommodations market provides a cost-effective solution to the challenge of staffing large oil sands projects by sourcing labor largely throughout Canada to work on a rotational basis.
Similarly,With respect to LNG and related pipeline activity in Canada, a number of multinational energy companies believe there is a potential to export LNG from Canada to meet the LNGC project locatedincreasing global LNG demand, particularly in Asia. Currently, Western Canada does not have any operational LNG export facilities. The Kitimat British Columbia,LNG Facility is nearing completion and expected to need as many as 7,500 workers to construct the liquefaction facilities.be operational in 2024. The population of Kitimat and the surrounding area is approximately 9,000.9,000 people, whereas the LNGC project had almost 7,500 workers at its peak to construct the Kitimat LNG Facility. Accordingly, British Columbia LNG activity and related pipeline projects are a material driver of activity for our Sitka Lodge, as well as for our mobile assets, which are contracted to serve designated portions of the related pipeline construction activity. The majority of our contracted commitments associated with the Coastal GasLink Pipeline (CGL), the pipeline constructed to transport natural gas feedstock to LNGC, were completed in the fourth quarter of 2023. See "Canada-Canadian British Columbia Lodge" for more information.
LNG investment and activity in Western Canada, and related demand for hospitality services, is influenced by the global prices for LNG, which are largely tied to global oil prices, global supply/demand dynamics for LNG and Western Canadian wellhead prices for natural gas. Utilization of our existing Canadian capacity and any future expansions will largely depend on continued LNG and oil sands spending related to existing production, maintenance activities and potential future expansion of existing projects.
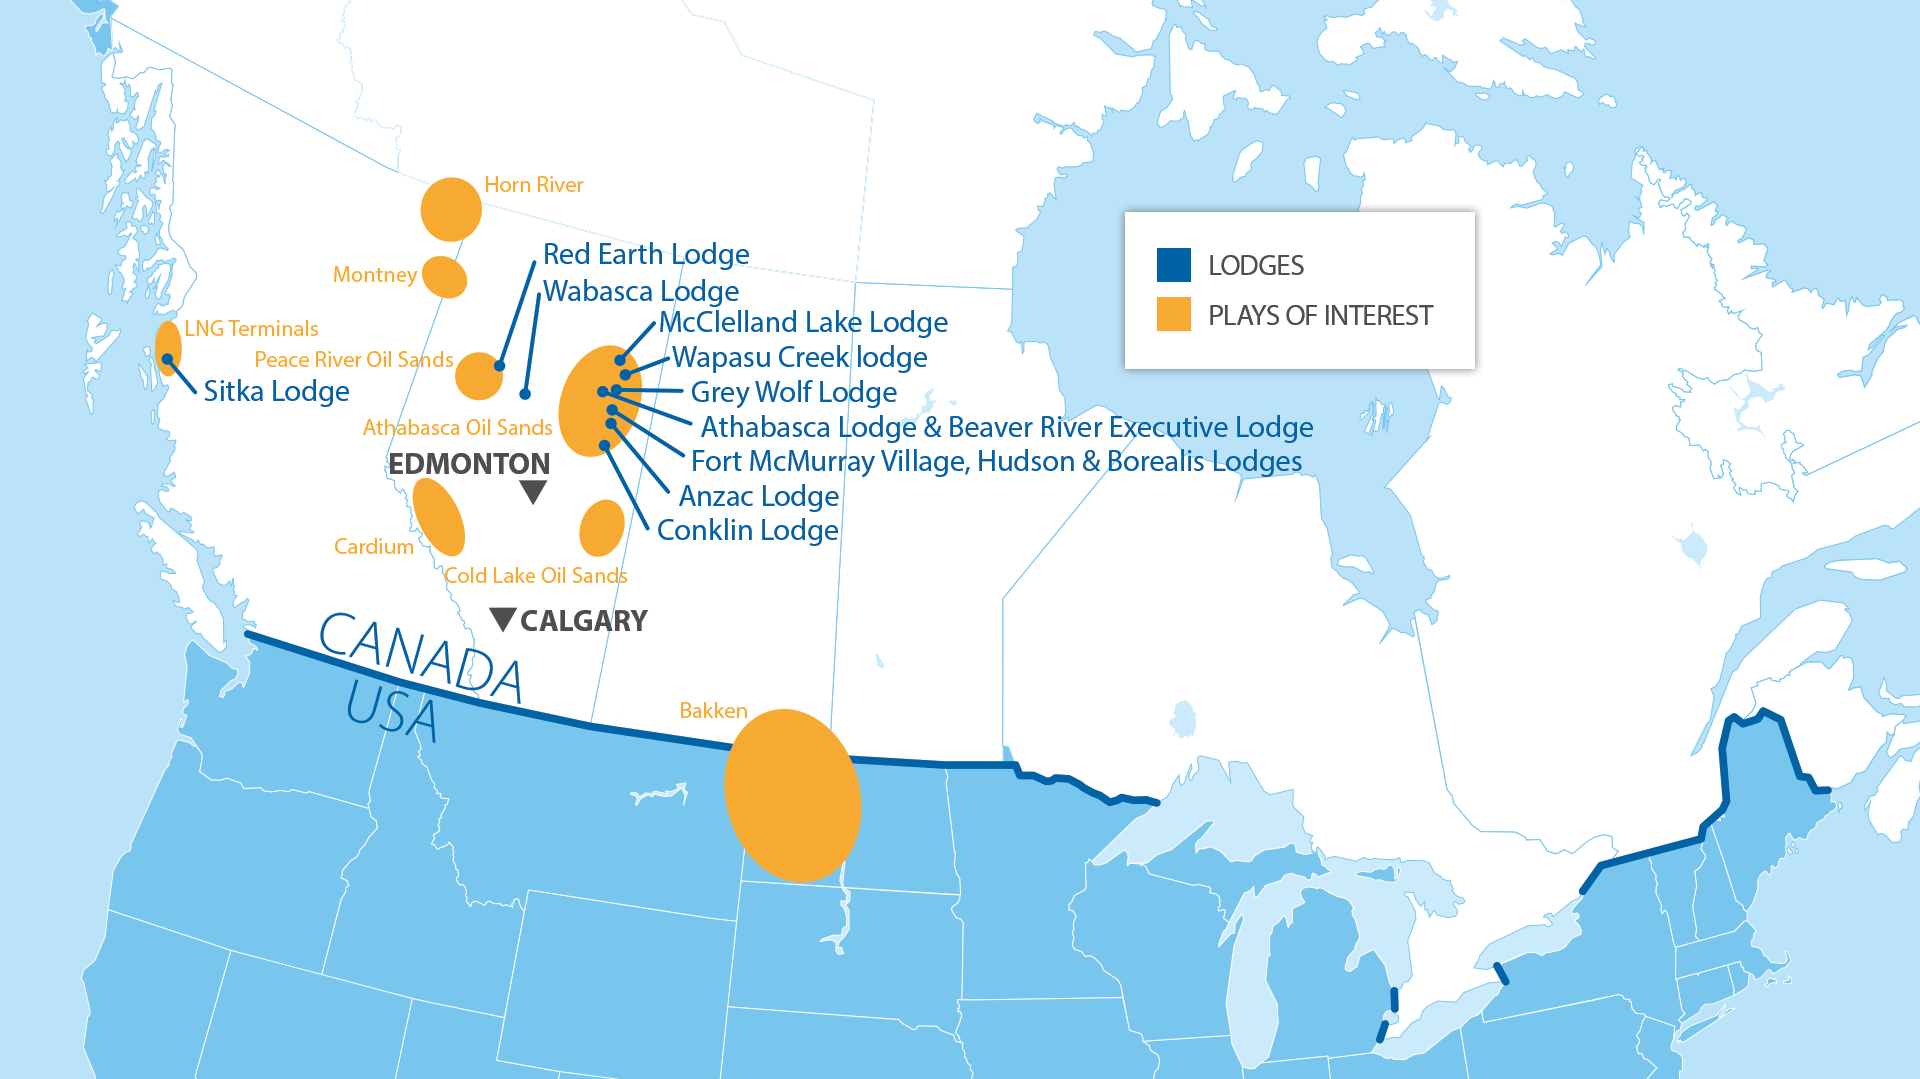
Canadian Oil Sands Lodges
During the year ended December 31, 2020,2023, activity in the Athabasca oil sands region generated approximately 61%67% of our Canadian revenue, or 34% of our consolidated revenue. The oil sands region continues to represent one of the world’s largest reserves for heavy oil. Our McClelland Lake, Wapasu Creek, Athabasca, Beaver River, Fort McMurray Village, Grey Wolf, Hudson, and Borealis lodges are focused on the northern region of the Athabasca oil sands, where customers primarily utilize surface mining to extract bitumen. Oil sands mining operations are characterized by large capital requirements, large reserves, largelarger personnel requirements, long-term reserve lives, very low exploration or reserve risk and relatively lower cash operating costs per barrel of bitumen produced. Our Conklin, Anzac, Red Earth and Wabasca lodges as well as a portion of our mobile assets, are focused in the southern portion of the region where we primarily serve in-situ operations and pipeline expansion and maintenance activity. In-situ methods are used on reserves that are too deep for traditional mining methods. In-situ technology typically injects steam or solvents into the deep oil sands in place to separate the bitumen from the sand and pumps it to the surface where it undergoes the same upgrading treatment as the mined bitumen. Reserves requiring in-situ techniques of extraction represent 80% of the established recoverable reserves in Alberta. In-situIn comparison to surface mining operations, in-situ operations generally require lesslower initial capital andinvestment, fewer personnel andbut produce lower volumes of bitumen per development, with higher ongoing operating expense per barrel of bitumen produced.
Our oil sands lodges primarily support personnel for ongoing operations associated with surface mining and in-situ oil sands projects, as well as maintenance, turnaround and expansionary personnel, generally under shortshort- and medium-term contracts. Most of our oil sands lodges are located on land with leases obtained from the province of Alberta, with initial terms of ten years, or subleased from the resource developer. Our leases have expiration dates that range from 20222024 to 2028.2030. In recent years, we have successfully renewed or extended all expiring land leases.leases which we have requested to renew or extend. We did not renew an expiring land lease associated with our McClelland Lake Lodge in Alberta, Canada, which expired in June 2023, in order to support our customer’s intent to mine the land where the lodge was located. Two of our oil sands properties are located on land which we own.
In order to operate a lodge in Canada, we are required to obtain a development permit from the regional municipality in which the lodge resides.is located. The development permits are granted for a term ranging from one to tenof five years. Our development permits have expiration dates that range from 20212024 to 2025.2028. In recent years, we have successfully renewed or extended all expiring development permits. See “Item 1A. Risk Factors-RisksFactors - Risks Related to Our Business-TheOperations - The majority of our major Canadian lodges are located on land subject to leases. If we are unable to renew a lease or obtain permits necessary to operate on such leased land, we could be materially and adversely affected.” of this annual report for further information.
We provide a range of hospitality services at our lodges, including reservation management, check in and check out, food service, housekeeping and facilities management. Our lodge guests receive amenities similar to a full-service, urban hotel pluswith our service offering a room and three meals a day. Our Wapasu Creek Lodge, with more than 5,000 rooms, is equivalent in size to the largest hotels in North America.
We provide our hospitality services at the lodges we own on a day rate or monthly rental basis, and our customers typically commit for short to medium-termlong-term contracts (from several months up to several years). Most customers make a minimum nightly or monthly room commitment or an aggregate total room night commitment for the term of the contract, and the multi-year contracts typically provide for inflationary escalations in rates for increased food, labor and utilities costs.
Canadian British Columbia Lodge
As previously discussed, in October 2018, LNGC's partners announced a positive FID onLNGC is currently constructing the Kitimat LNG Facility. British Columbia LNG activity and related Coastal GasLink (CGL) pipeline projects are a material driver of activity for our Sitka Lodge, as well as for our mobile assets, which are contracted to serve severaldesignated portions of the related CGL pipeline construction activity. We previously announced contract awards for locations along the CGL pipeline project and room commitments for our Sitka Lodge. The actual timingmajority of when revenue is realized from the CGL pipeline and Sitka Lodge contracts could be impacted by any delays in the construction of the Kitimat LNG Facility or the pipeline, including recent blockades that aim to delay construction. Our current expectation is that our contracted commitments associated with the CGL pipeline project will bewere completed in early 2022.the fourth quarter of 2023.
Canadian Lodge Locations
Rooms in our Canadian Lodges
| | | | | | | | | | | | | | | | | | | | | | | | | | | | | | | | |
| | | | | | | As of December 31, |
Lodges | | Region | | Extraction
Technique | | 2020 | | 2019 | | 2018 |
| Wapasu Creek | | N. Athabasca | | mining | | 5,246 | | | 5,246 | | | 5,246 | |
Athabasca (2) | | N. Athabasca | | mining | | 2,005 | | | 2,005 | | | 2,005 | |
| McClelland Lake | | N. Athabasca | | mining | | 1,997 | | | 1,997 | | | 1,997 | |
Henday (1) | | N. Athabasca | | mining/in-situ | | — | | | — | | | 1,698 | |
Beaver River (2) | | N. Athabasca | | mining | | 1,094 | | | 1,094 | | | 1,094 | |
| Fort McMurray Village: | | | | | | | | | | |
Buffalo (1) | | N. Athabasca | | mining | | — | | | — | | | 573 | |
Black Bear (2) | | N. Athabasca | | mining | | 531 | | | 531 | | | 531 | |
Bighorn (2) | | N. Athabasca | | mining | | 763 | | | 763 | | | 763 | |
| Lynx | | N. Athabasca | | mining | | 855 | | | 855 | | | 855 | |
| Wolverine | | N. Athabasca | | mining | | 855 | | | 855 | | | 855 | |
| Borealis | | N. Athabasca | | mining | | 1,504 | | | 1,504 | | | 1,504 | |
| Grey Wolf | | N. Athabasca | | mining | | 946 | | | 947 | | | 946 | |
Firebag (1) | | N. Athabasca | | in situ | | — | | | — | | | 664 | |
| Hudson | | N. Athabasca | | mining | | 624 | | | 624 | | | 624 | |
Wabasca (2) | | S. Athabasca | | mining | | 288 | | | 288 | | | 246 | |
Red Earth (2) | | S. Athabasca | | mining | | 216 | | | 216 | | | 216 | |
Conklin (2) | | S. Athabasca | | mining/in-situ | | 616 | | | 1,012 | | | 1,032 | |
| Anzac | | S. Athabasca | | in-situ | | 526 | | | 526 | | | 526 | |
Mariana Lake (1) | | S. Athabasca | | mining | | — | | | — | | | 686 | |
| Subtotal – Oil Sands | | | | | | 18,066 | | | 18,463 | | | 22,061 | |
| Sitka Lodge | | Kitimat, BC | | LNG | | 958 | | | 1,186 | | | 646 | |
| Total Rooms | | | | | | 19,024 | | | 19,649 | | | 22,707 | |
| | | | | | | | | | | | | | | | | | | | | | | | | | | | | | | | |
| | | | | | | As of December 31, |
Lodges | | Region | | Extraction
Technique | | 2023 | | 2022 | | 2021 |
| Wapasu Creek | | N. Athabasca | | mining/in-situ | | 5,174 | | | 5,174 | | | 5,174 | |
| Athabasca | | N. Athabasca | | mining | | 2,005 | | | 2,005 | | | 2,005 | |
McClelland Lake (2) | | N. Athabasca | | mining | | — | | | 1,997 | | | 1,997 | |
| Beaver River | | N. Athabasca | | mining | | 1,094 | | | 1,094 | | | 1,094 | |
| Fort McMurray Village: | | | | | | | | | | |
Black Bear | | N. Athabasca | | mining | | 531 | | | 531 | | | 531 | |
| Bighorn | | N. Athabasca | | mining | | 763 | | | 763 | | | 763 | |
| Lynx | | N. Athabasca | | mining | | 855 | | | 855 | | | 855 | |
| Wolverine | | N. Athabasca | | mining | | 855 | | | 855 | | | 855 | |
Borealis (1) | | N. Athabasca | | mining | | 1,504 | | | 1,504 | | | 1,504 | |
| Grey Wolf | | N. Athabasca | | mining | | 946 | | | 946 | | | 946 | |
Hudson (1) | | N. Athabasca | | mining | | 624 | | | 624 | | | 624 | |
Wabasca (1) | | S. Athabasca | | mining | | 288 | | | 288 | | | 288 | |
Red Earth (1) | | S. Athabasca | | mining | | 216 | | | 216 | | | 216 | |
Conklin (1) | | S. Athabasca | | mining/in-situ | | 610 | | | 610 | | | 610 | |
Anzac (1) | | S. Athabasca | | in-situ | | 526 | | | 526 | | | 526 | |
| Subtotal – Oil Sands | | | | | | 15,991 | | | 17,988 | | | 17,988 | |
| Sitka Lodge | | Kitimat, BC | | LNG | | 961 | | | 961 | | | 959 | |
| Total Rooms | | | | | | 16,952 | | | 18,949 | | | 18,947 | |
(1)Permanently closed as of December 31, 2020.
(2)Currently closed as of December 31, 2020,2023, due to lodge loading strategy, seasonal activity fluctuations or low activity level in the region. All seven closed lodges are periodically assessed for impairment at an asset group level, in accordance with U.S.United States (U.S.) generally accepted accounting principles (U.S. GAAP).principles. See Note 4 - Impairment Charges to the notes to the consolidated financial statements in Item 8 of this annual report for further discussion.
(2)The land lease associated with the asset expired in June 2023 and was not renewed. See "Item 7. Management’s Discussion and Analysis of Financial Condition and Results of Operations - Overview and Macroeconomic Environment -McClelland Lake Lodge” of this annual report for additional information.
Hospitality Services at Third-Party Owned Facilities
We also provide hospitality services at facilities owned by our customers.customer-owned facilities. Historically, this has been focused around natural resource production-related housing facilities that are owned by oil production companies. The facilities we manage typically range anywhere from 100500 to 1,500 rooms. We customize our service offerings depending on our customer’s needs. Hospitality services can be performed on an end-to-end basis with food service, housekeeping, maintenance and utility services included or in segments such as food service only. Our focus on hospitality service contracts has allowed us to successfully pursue food service only opportunities. Due to our experience servicing customer-owned facilities, this business easily fits into our overall strategy.
Canadian Mobile Assets
Our mobile assets consist of modular, skid-mounted accommodations and central facilities that can be quickly configured to serve a multitude of shortshort- to medium-term accommodation needs. Dormitory, kitchen and ancillary assets can be rapidly mobilized and demobilized and are scalable to support 200 to 800 people in a single location. In addition to asset rental, we provide hospitality services such as food service and housekeeping, as well as other camp management services. Our mobile assets service the traditional oil and gas sector in Alberta and British Columbia and in-situ oil sands drilling and development operations in Alberta, as well as pipeline construction crews throughout Western Canada. These assets have also been used in the past in disaster relief efforts, the 2010 Vancouver Winter Olympic Games and a variety of other non-energy related projects.
Our mobile assets are rented on a per unit basis based on the number of days that a customer utilizes the asset, and, in some cases, involve standby rental arrangements. In cases where we provide food service or ancillary services, the contract can provide for per unit pricing or cost-plus pricing. Customers are also typically responsible for mobilization and demobilization costs. Our focus on hospitality service contracts has allowed us to successfully pursue food service only opportunities. Due to our experience servicing customer-owned facilities, this business easily fits into our overall strategy.
Australia
Overview
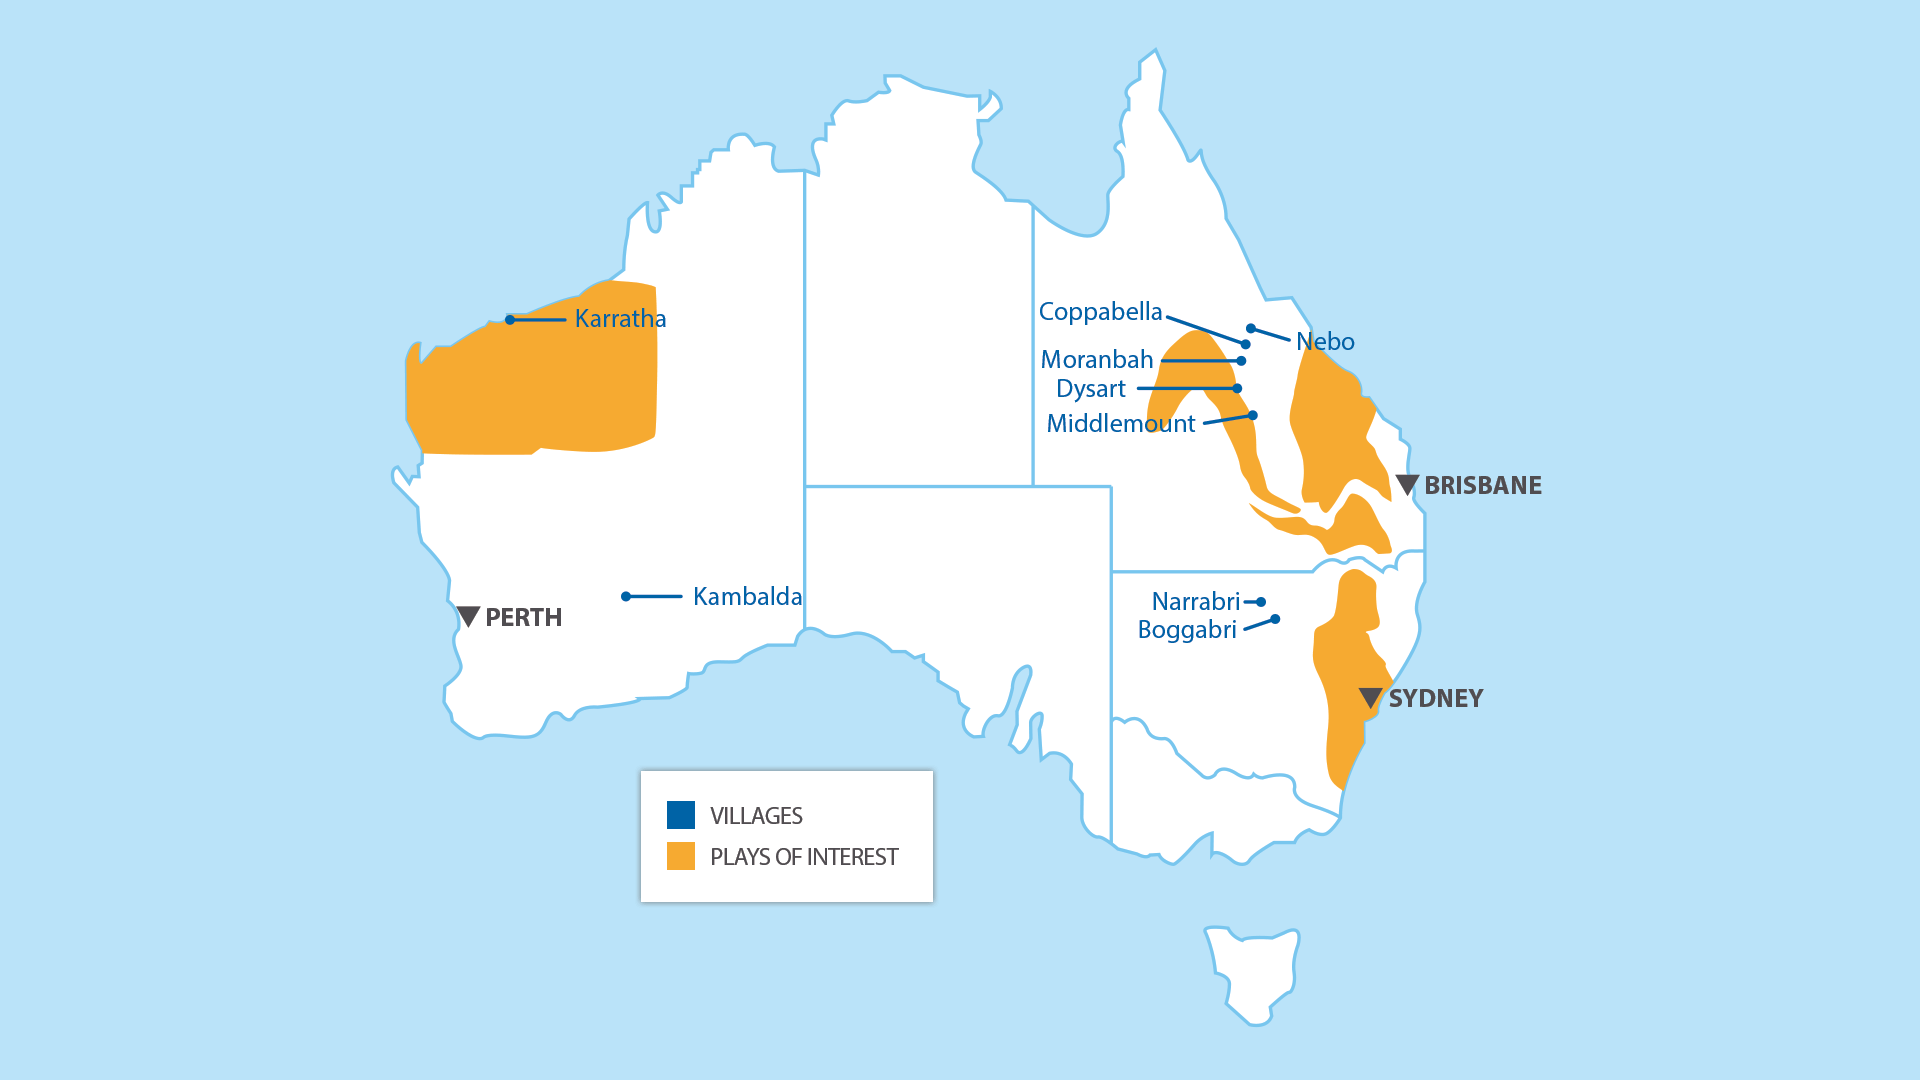
During the year ended December 31, 2020,2023, we generated 44%48% of our revenue from our Australian operations. As of December 31, 2020,2023, we owned 9,0468,910 rooms across nineeight villages, of which 7,3927,488 rooms service the Bowen Basin region of central Queensland, one of the premier met coal basins in the world. We provide hospitality services on a day rate basis to mining and related service companies (including construction contractors), typically under shortshort- and medium-term contracts (one to threefive years) with minimum nightly room commitments. In addition, we provide integrated services to the mining industry in Western Australia and South Australia.
Australian Market
As the largest contributor to exports and a major contributor to the country’s gross domestic product and government revenue, the Australian natural resources industry plays a vital role in the Australian economy. Australia has broad natural resources, including met and thermal coal, conventional and coal seam gas, base metals, iron ore, copper, lithium and precious metals such as gold. Australia is the largest exporter of met coal and iron ore in the world, in addition to being in close proximity to the largest steel producing countries in the world.world, primarily in Southeast Asia. The growth of Australian natural resource commodity exports over the last decade has been largely driven by strong Asian demand for met coal, iron ore and LNG. Australia’s resources are primarily located in remote regions of the country that lack infrastructure and resident labor forces to produce these resources, as the majority of Australia’s population is located on the east coast of the country. As a result, much of the natural resources labor force works on a rotational basis, which often requires a commute from a major city or the coast to a living arrangement near the resource projects. Consequently, there is substantial need for workforce accommodations and hospitality services to support resource production in the country. Workforce accommodations have historically been built and owned by the resource developer/owner, with third parties providing the hospitality and facility management services, typical of an insourcing business model.
Since 1996, our Australian business has sought to change the insourcing business model through its hospitality services offering, allowing customers to outsource their accommodations needs and focus their investments on resource production operations. Our Australian villages are strategically located in proximity to long-lived, low-cost mines operated by multiple investment-grade, international mining companies.
Our Australian villages support similar activities as our Canadian lodges for the natural resources industry in Australia. Our customers are typically developing and producing met coal, iron ore and other minerals which have resource lives that are measured in decades. As such, their spending levels tend to react similarly to commodity prices as the spending levels of our Canadian customers. Spending on producing assets is less sensitive to commodity price decreases in the short and medium term, assuming the projects remain cash flow positive. However, new construction projects and expansionary projects are typically canceled or deferred during periods of lower met coal and iron ore prices. New project construction activity typically requires larger workforces than day-to-day operations, where proximity and availability of customer-owned rooms influences the demand for our rooms and services. Demand for rooms at our Australian villages is primarily driven by production, maintenance and operational activities.
Our Australian operations primarily serve the Bowen Basin of Queensland and the Pilbara region in Western Australia. During the year ended December 31, 2020,2023, our five villages in the Bowen Basin of central Queensland generated 55%47% of our Australian revenue, or 23% of our consolidated revenue. The Bowen Basin contains one of the largest coal deposits in Australia and is renowned for its premium met coal. In addition, we provide village operation and mine site cleaning services at sixeight customer locations in the Pilbara and Kimberly regions of Western Australia,region, which areis renowned for high grade iron ore production. Our villages and customer-basedcustomer-owned locations are focused on the mines in the central portion of the Pilbara and Bowen Basins and are well positioned for the active mines in the region.
Currently China and Australia are in a trade dispute that has led to China implementing an unofficial trade embargo on Australian coal. China has historically accounted for approximately 22% of Australia’sBeyond met coal exports. The continuing uncertaintyand iron ore markets served in the demand for met coal, related to the impact of Chinese bans on the importation of Australian commodities, led to a decrease in the met coal spot price to US$103 per tonne at December 31, 2020. The softening of the met coal spot price at the end of 2020 has been exacerbated as Chinese mills and traders resell stranded Australian met coal at a discount. As a result, there is currently a shuffling of global export trade flows, coupled with growing demand for steel with an infrastructure led recovery which may lead to near term growth in Australian met coal spot pricing. Should this dispute continue, it could negatively impact pricing and demand for Australian met coal.
To date, we have not seen an overall material decline in occupancy at our Australian villages resulting from the COVID-19 pandemic or the Chinese trade dispute.
Beyond the Pilbara and Bowen Basins, we serve several other markets with fourthree additional villages and fiveten customer-owned villages. At the end of 2020,2023, we had two villages with over 1,000 combined rooms in the Gunnedah Basin, a thermal and met coal region in New South Wales. In Western Australia, we serve workforces related to LNG facilities operations on the Northwest Shelf through our Karratha village and gold production in the Goldfields region through our Kambalda village. In addition, we provide hospitality services in Western Australia and South Australia at fiveten customer-owned villages which support workforces related to nickel, copper, zinc, silver and gold production in the Goldfields-Esperance region, and lithium production in the Pilbara region.region and copper, silver and gold in Western Australia and South Australia.
Australian Village Locations
Owned Rooms in our Australian Villages
| | | | | | | | | As of December 31, | | | | | As of December 31, |
Villages |
Villages | | Resource
Basin | | Commodity | | 2020 | | 2019 | | 2018 |
Villages | | Resource
Basin | | Commodity | | 2023 | | 2022 | | 2021 |
| Coppabella | Coppabella | | Bowen | | met coal | | 3,048 | | | 3,048 | | | 3,048 | |
| Dysart | Dysart | | Bowen | | met coal | | 1,798 | | | 1,798 | | | 1,798 | |
| Moranbah | Moranbah | | Bowen | | met coal | | 1,240 | | | 1,240 | | | 1,240 | |
| Middlemount | Middlemount | | Bowen | | met coal | | 816 | | | 816 | | | 816 | |
| Boggabri | Boggabri | | Gunnedah | | met/thermal coal | | 622 | | | 622 | | | 622 | |
| Narrabri | Narrabri | | Gunnedah | | met/thermal coal | | 502 | | | 502 | | | 502 | |
| Nebo | Nebo | | Bowen | | met coal | | 490 | | | 490 | | | 490 | |
Calliope (1) | | - | | LNG | | — | | | — | | | 300 | |
| Kambalda | | - | | Gold, lithium | | 232 | | | 232 | | | 232 | |
| Karratha | Karratha | | Pilbara | | LNG, iron ore | | 298 | | | 298 | | | 298 | |
Kambalda (1) | |
| Total Rooms | Total Rooms | | | | | | 9,046 | | | 9,046 | | | 9,346 | |
(1) Sold in September 2019.the third quarter of 2022.
Our Australian segment includes nineeight company-owned villages with 9,046 rooms8,910 rooms as of December 31, 2020,2023, which are strategically located near long-lived, low-cost mines operated by large mining companies. Our Australian business provides hospitality services to mining and related service companies under short- and medium-term contracts. Our growth plan for this part of our business continues to include enhanced occupancy and expansion of these properties where we believe there is durable long-term demand, as well as to provide hospitality services at customer-owned assets.
Our Coppabella, Dysart, Moranbah, Middlemount and Nebo villages are located in the Bowen Basin. Coppabella, at over 3,0003,100 rooms, is our largest village and provides rooms and related hospitality services to a variety of customers. Each of these villages supports both operational workforce needs and contractor needs with resort style amenities, including swimming pools, gyms, a walking track and a tavern.
Our Narrabri and Boggabri villages in New South Wales serviceprovide rooms and related hospitality services to met and thermal coal mines and coal seam gas in the Gunnedah Basin. Our Karratha village, in Western Australia, services workforces related to LNG facilities operations on the Northwest Shelf. Our Kambalda village supports gold and lithium mining in southern Western Australia.
Hospitality Services at Third-Party Owned Facilities
We also provide hospitality services at customer-owned villages to the mining industry in Western Australia. Historically, this has been focused around natural resource production-related village facilities that are primarily owned by iron ore production companies. We provide village operationhospitality services at eleven18 customer-owned locations, which represent over 7,000 12,600rooms, primarily in the Pilbara region of Western Australia, one of the premier iron ore bodies in the world, and in the Kimberly and Goldfields-Esperance regionsregion of Western Australia. The facilities we manage range anywhere from 200 to 1,750over 1,900 rooms. We work together with our customers to customize our service offerings depending on our customer’s needs. Hospitality services can be performed on an end-to-end basis with catering and food service, housekeeping and site maintenance included or in segments such as food service only. Mine site cleaning services are also provided at some of our customer-owned locations.
U.S.Other
Overview
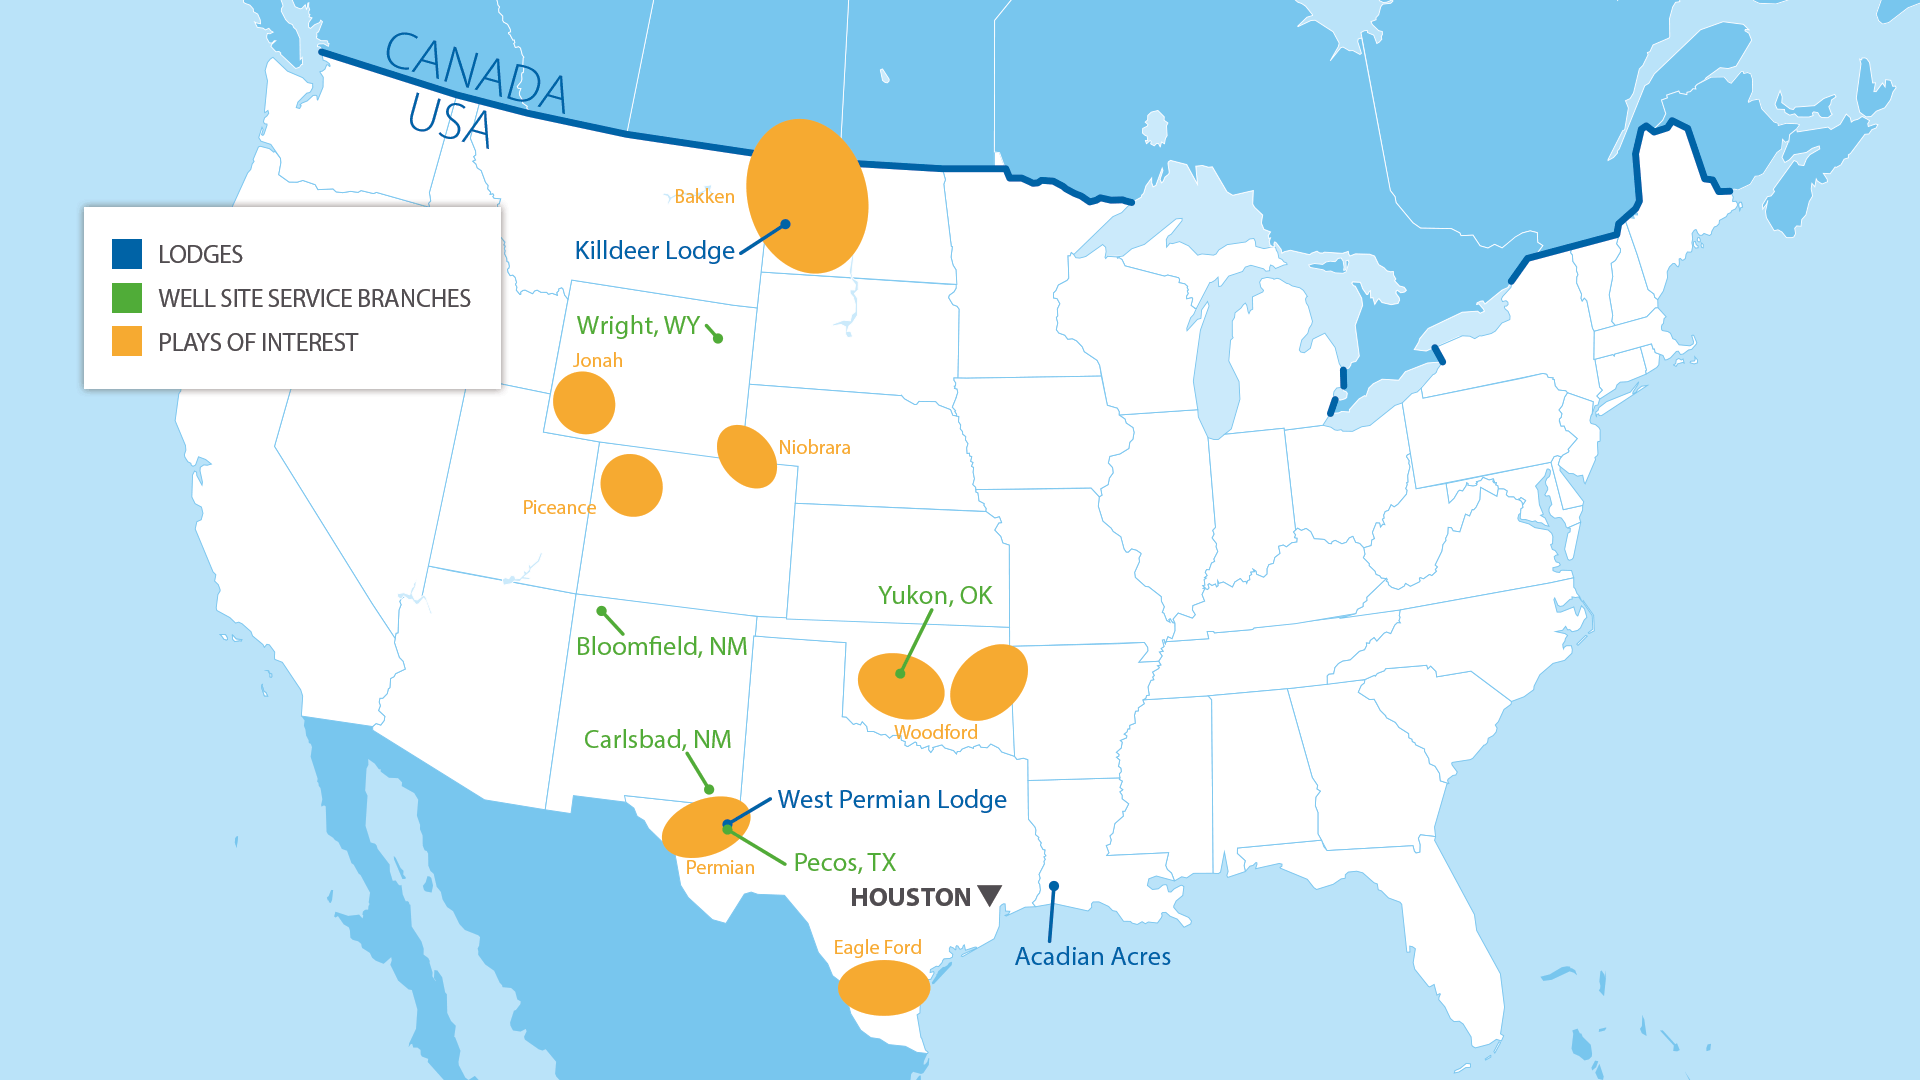
DuringIn the year ended December 31, 2020,first quarter of 2023, we sold our accommodation assets in Louisiana. In addition, in the second half of 2022, we sold both our U.S. business generated 5% of our revenue.wellsite services and offshore businesses. Our remaining U.S. business has operational exposureconsists of 235 rooms at our Killdeer Lodge, which supports completion activity in the Bakken. U.S. shale formations in the Permian Basin, the Mid-Continent, the Bakken and the Rockies. The business provides accommodations facilities with hospitality services and highly mobile smaller assets that follow drilling rigs andoil completion crews as well as accommodations, office and storage modules that are placed on offshore drilling rigs and production platforms. Our U.S. business also provides lodging and hospitality services to the downstream industry through a 300-room facility near Lake Charles, Louisiana.
U.S.Market
Onshore oil and natural gas development in the U.S. has historically been supported by local workforces traveling short to moderate distances to the worksites. With the development of substantial resources in regions such as the Bakken and Permian Basin, labor demand exceeded the local labor supply and accommodations infrastructure to support the demand. Consequently, demand for remote, scalable accommodations and hospitality services developed in the U.S. Demand for workforce accommodations in the U.S. has historically been tied to the level of oil and natural gas exploration and production activity which is primarily driven by oil and natural gas prices. Activity levels have been, and we expect will continue to be highly correlated with hydrocarbon commodity prices.
U.S.Locations
U.S.MobileAssets
Our business in the U.S. consists primarily of mobile assets, both in the lower 48 states, including the (1) Permian Basin region, (2) Mid-Continent region, (3) Bakken region and (4) the Rockies region. We provide a variety of sizes and configurations to meet the needs of E&P companies, completion companies, infrastructure construction projects and offshore drilling and completion activity.
With the recent volatility inimpacted by oil prices, pipeline capacity, federal energy policies and a resulting reduction in spending by E&P companies, we have exited the Bakken and reduced our presence in the Rockies regions for our mobile assets. Those assets will either be sold or transported to our Permian Basin and Mid-Continent district locations. This process is underway and we expect it to be completed during the first halfavailability of 2021.
Our mobile assets are rented on a per unit basis based on the number of days that a customer utilizes the asset. In cases where we provide food service or other hospitality services, the contract can provide for per unit pricing or cost-plus pricing. Customers are also typically responsible for mobilization and demobilization costs.
U.S. Lodges
| | | | | | | | | | | | | | | | | | | | | | | | | | |
| | | | | As of December 31, |
| | | State | | 2020 | | 2019 | | 2018 |
| West Permian | | TX | | 390 | | | 410 | | | 390 | |
| Acadian Acres | | LA | | 300 | | | 300 | | | 400 | |
| Killdeer | | ND | | 235 | | | 235 | | | 235 | |
| Total Rooms | | 925 | | | 945 | | | 1,025 | |
We had three lodges in the U.S. comprised of 925 rooms as of December 31, 2020. Our Killdeer Lodge provides rooms to the Bakken Shale region in North Dakota. Our West Permian Lodge supports the Permian Basin in West Texas. Our Acadian Acres Lodge provides rooms near Lake Charles, Louisianacapital to support the Louisiana downstream market.exploration and production completion plans.
Community Engagement
With a focus on long-term indigenousIndigenous community participation, our Canadian operations continue to work closely with a number of First Nations to develop mutually beneficial partnerships focused on revenue sharing, capacity building, employment and community investment and support. For over a decade, our Canadian operations supported Buffalo Metis Catering, a partnership with three Metis communities in the Regional Municipality of Wood Buffalo. Through this partnership, food and housekeeping services were delivered to three of our lodges. Beyond these services, this partnership provided a business incubator environment for a number of Metis business ventures. Our Canadian operations also procure services from a number
of other First Nations-owned, Metis-owned and member-owned businesses including water hauling, snow removal and security services. In 2020,2023, we purchased more than C$64.0 million in goods and services from the annual valueIndigenous business community, representing 27% of these contracts was approximatelyour total Canadian local spending, compared to C$40 million.66.2 million in goods and services from the Indigenous business community, representing 30% of our total Canadian local spending in 2022.
In 2021, the Fort McKay Metis community awarded Civeo with the inaugural 2020 Fort McKay Metis National President's Award. This award recognizes people or organizations who make a positive contribution to the well-being of the Metis community. In 2023 and in 2019, our indigenousIndigenous partnership initiatives were awardedearned Civeo a Gold level Progressive Aboriginal Relations (PAR) certification, by a jury comprised of indigenousIndigenous business people, which was supported by an unbiased, independent, third-party verification of our performance. In 2016, Civeo was awarded a Silver level PAR certification by the Canadian Council for Aboriginal Business (CCAB), demonstrating our commitment to the principles and practices established by the CCAB. In addition, in 2011 and 2012, we were recognized with awards from the Alberta Chamber of Commerce.
In 2018, Civeo entered into three new indigenousIndigenous partnerships in the oil sands region and two new partnerships in British Columbia and, in 2021, Civeo entered into a new partnership in British Columbia. Our partnerships in British Columbia are tied to accommodations contracts secured by Civeo for the Kitimat LNG Facility, and for the Coastal Gas LinkCGL pipeline project that originates in the North Montney region of north eastnorth-east British Columbia and the Trans Mountain expansion project that twins an existing pipeline between Edmonton, Alberta and Burnaby, British Columbia. Beyond revenue sharing, these arrangements provide procurement, employment, training, and ancillary business opportunities for indigenousIndigenous owned businesses.
In Australia, our community relations program also aims to build and maintain a positive social license to operate by consulting and engaging with local regional communities from project inception, through development, construction and operations. This is a major advantage for our business model, as it facilitates consistent communication, engenders trust and builds relationships to last throughout the resource lifecycle. There is an emphasis on developing partnerships that create a long-term sustainable outcome to address specific community needs. To that end, we partner with local municipalities to improve and expand municipal infrastructure. These improvements provide necessary infrastructure, allowing the local communities an opportunity to expand and improve. We also provide support to local community groups through sponsorship and in-kind contributions to local events and initiatives. In addition, all of our food suppliers are Australian companies and, where possible, are based locally. Through our membership with Supply Nation, a non-profit organization committed to supplier diversity and Indigenous business development, we directed approximately A$12.3 million in 2023, compared to A$9.5 million in 2022, into Indigenous-owned and operated companies, and we are always looking for more opportunities to partner with these businesses.
In addition, we have fivefour unincorporated joint venture partnerships with indigenousIndigenous landowners in Western Australia. TheseUnder these agreements, assistwe strive to develop the business capacity, project management skills and expertise of the indigenousIndigenous joint venture members and also provide local employment opportunities and training. ThreeOne of the fivefour unincorporated joint venture partnerships entitle indigenousentitles Indigenous landowners to a profit distribution calculated in accordance with the unincorporated joint venture deeds. TheAdditionally, three of the four remaining two agreements incentivize the joint venture members via milestone payments for business objectives achieved.
Customers and Competitors
Our customers primarily operate in oil sands mining and development, drilling, exploration and extraction of oil and natural gas and coal and other extractive industries. To a lesser extent, we also support other activities, including pipeline construction, forestry and humanitarian aid. Our largest customers in 20202023 were Suncor Energy and Fortescue Metals Group Ltd and Imperial Oil Limited (a company controlled by ExxonMobil Corporation)Ltd., who each accounted for more than 10% of our 20202023 revenues.
Our primary competitors in Canada in lodge and mobile asset hospitality services include ATCO, Black Diamond, Dexterra and Clean Harbors, Inc. Some of these competitors have one or two locations similar to our oil sands lodges; however, based on our estimates, these competitors do not have the breadth or scale of our lodge operations. In Canada, we also compete against Aramark, Sodexo, and Compass Group and Royal Camp Services for third-party facility management and hospitality services.
Our primary competitors in Australia for our village hospitality services are customer-owned and operated villages as well as Ausco Modular (a subsidiary of AlgecoModulaire Group), Fleetwood Corporation and Fleetwood Corporation.smaller independent village operators. We also compete against ISS, Sodexo, Compass Group, Northern Rise (as a division of Sirrom Corporation) and Cater Care for third-party facility management services.
In the U.S., we primarily offer our lodge and mobile asset hospitality services and compete against Peak Oilfield Services (a subsidiary of Select Energy Services), Stallion Oilfield Holdings, Inc., Target Hospitality, HB Rentals (a subsidiary of Superior Energy Services), Oil Patch and Black Diamond.
Historically, many customers have invested in their own accommodations. We estimate that our existing and potential customers own approximately 50% of the rooms available in both the Canadian oil sands and 50% of the rooms in the Australian coal mining regions.
Our Lodge and Village Contracts
During the year ended December 31, 2020,2023, revenues from our lodges and villages represented over 66%63% of our consolidated revenues. Our customers typically contract for hospitality services under take-or-pay or exclusivity contracts with terms that most often range from several months to three years. Our contract terms generally provide for a rentaldaily rate for a reserved room and an occupied room rate that compensates us for hospitality services, including meals,food service, housekeeping, utilities and maintenance for workers staying in the lodges and villages. In most multi-year contracts, our rates typically have annual escalation provisions to cover expected increases in labor and consumables costs over the contract term. Over the term of a take-or-pay contract, the customer commits to either a minimum number of rooms over a specified period or an aggregate number of room nights over the period. Over the term of an exclusivity contract, rather than receiving a minimum room commitment, we are the exclusive hospitality service provider for the customer's employees working on a specific project or projects. In some contracts, customers have a contractual right to terminate, rooms, for reasons other than a breach, in exchange for a termination fee. As of December 31, 2020, excluding exclusivityOur customers typically contract for hospitality services under contracts and contracts without minimum room commitments, we had commitments for 22% of our rentable rooms for 2021 and 14% of our rentable rooms for 2022.
As of December 31, 2020, we had 8,948 rooms under contract. The table below details the expiration of those contracts:
| | | | | |
| | Contracted Room Expiration |
| 2021 | 1,983 | |
| 2022 | 2,492 | |
| 2023 | 1,000 | |
| 2024 | — | |
| 2025 | — | |
| Thereafter | 3,473 | |
| Total | 8,948 | |
with terms that most often range from several months to twelve years. The contracts expire throughout the year, and for many of the near-term expirations, we are in the process of negotiating extensions or new commitments. We cannot assure that we can renew existing contracts or obtain new business on the same or better terms, if at all.
Long-Term Take-or-Pay Contracts. Over the term of a take-or-pay contract, the customer commits to either a minimum number of rooms over a specified period or an aggregate number of room nights over the period, generally for terms greater than 12 months. During the year ended December 31, 2023, we billed approximately 2.6 million room nights under our long-term take-or-pay contracts, which included 0.6 million room nights in excess of the take-or-pay minimums. For the year ended December 31, 2024, we have commitments for 1.7 million room nights under our long-term take-or-pay contracts.
Short-Term Take-or-Pay Contracts. Customers may contract with us on a take-or-pay basis for less than 12 months, particularly for turnaround projects. Similar to long-term take-or-pay contracts, the customer commits to either a minimum number of rooms over a specified period or an aggregate number of room nights over the period. During the year ended December 31, 2023, we billed approximately 0.7 million room nights under our short-term take-or-pay contracts. For the year ended December 31, 2024, we have commitments for 0.1 million room nights under our short-term take-or-pay contracts.
Exclusivity Contracts. Over the term of an exclusivity contract, rather than receiving a minimum room commitment, we are the exclusive hospitality service provider for the customer's employees working on a specific project or projects. During the year ended December 31, 2023, we billed approximately 1.7 million room nights under our exclusivity contracts.
Casual / Walk-ins. Customers without long-term committed contracts may utilize lodge/village rooms via short-term bookings at lodge/village casual or agreed rates. During the year ended December 31, 2023, we billed approximately 0.1 million room nights to casual or walk-in customers.
Our Integrated Services Contracts
During the year ended December 31, 2023, revenues from our customer-owned locations represented 26% of our consolidated revenues. Our contract terms generally provide for a per guest per day rate for hospitality services, including food service and housekeeping. Similar to our owned lodge and villages contracts, in most multi-year contracts, our rates typically have annual escalation provisions to cover increases in labor and consumables costs over the contract term. Our customers typically contract for hospitality services under exclusivity contracts with terms that most often range from several months to five years. During the year ended December 31, 2023, we billed approximately 2.6 million room nights under our integrated services exclusivity contracts.
Seasonality of Operations
Our operations are directly affected by seasonal weather. A portion of our Canadian operations is conducted during the winter months when the winter freeze in remote regions is required for customers’ activity to occur. The spring thaw in these frontier regions restricts operations in the second quarter and adversely affects our customers' operations and our ability to provide services. Customers’ maintenance activities in the oil sands region, such as shutdown and turnaround activity, are typically performed in the second and third quarters annually. Our Canadian operations have also been impacted by forest fires and flooding in the past five years. During the Australian rainy season between November and April, our operations in Queensland and the northern parts of Western Australia can be affected by cyclones, monsoons and resultant flooding. In the U.S., winter weather in the first quarter and the resulting spring break up in the second quarter have historically negatively impacted our Bakken and Rocky Mountain operations. Our U.S. offshore operations have historically been impacted by the Gulf of Mexico hurricane season from July through November.
Human Capital Resources
We believe that our employees are one of our greatest resources. As of December 31, 2020,2023, we had approximately 1,0001,600 full-time employees and approximately 1,000 hourly employees on a consolidated basis, 54%47% of whom are located in Canada, 42%
52% of whom are located in Australia and 4%1% of whom are located in the U.S. We were party to collective bargaining agreements covering 885798 employees located in Canada and 5881,020 employees located in Australia as of December 31, 2020.
Attracting, retaining and mentoring the talent required to address the needs of our business is the basis of our human capital strategy. Not only do we provide what we believe to be a competitive and well-rounded compensation package, but we also believe that our exceptional safety record attracts and retains exceptional talent.
As a company, we recognizeacknowledge the importancesignificance of a diverse workforce represented by peoplecomposed of individuals from differentvarious backgrounds, experiences, and waysperspectives. As many of looking atour projects in Canada and Australia operate in traditional territories, we work closely with Indigenous communities to actively explore mutually beneficial investment, employment, and business opportunities. Our ability to cultivate and strengthen relationships with Indigenous communities is vital to the world. During 2020, we formed a Diversity and Inclusion Committee to help us servesuccess of our employees, clients and communities better as we strive to build a culture of inclusion.business. In Canada, we are committed to hiring Indigenous Peoples and expanding our Indigenous workforce excluding corporate staff, to 10%. In 2020,2023, we reached 9%7% Indigenous employment in Canada, excluding corporate staff, in Canada despite challenging market conditions that resulted in reduced hiring in the region.staff. Approximately 11%6% of our total new hires in Canada were of Indigenous background during 2020. In addition, our Indigenous Procurement Policy in Canada helps foster strong community relationships while ensuring a local and diverse supply chain of business partners. In 2020, we purchased more than C$39 million in goods and services from the Indigenous business community, representing 25% of our total Canadian local spending. In Australia, all of our food suppliers are Australian companies and, where possible, are based locally. Through our membership with Supply Nation, a non-profit organization committed to supplier diversity and Indigenous business development, we have been able to direct approximately A$1.4 million each year into Indigenous-owned and operated companies, and we are always looking for more opportunities to partner with these businesses.2023.
Civeo strivesWe strive to offer competitive compensation, benefits and services that meet the needs of itsour employees, including shortshort- and long-term incentive packages, various defined contribution plans, healthcare benefits, and wellness and employee assistance programs. Management monitors market compensation and benefits in order to attract, retain, and promote employees and reduce turnover and its associated costs.
CiveoSafety is a foundational pillar of Civeo’s corporate culture. We are committed to operating in a safe, secure and responsible manner for the benefit of itsour employees, customers and the communities Civeo serves in Canada, Australiawe serve. Our commitment to safeguarding employees, contractors, and guests is demonstrated through our employee-named Making Zero Count initiative, which emphasizes the U.S. Because we are committedimportance of eliminating harm and focuses on the processes required to protecting the health and safety of our people, we operate in accordance with rigorous standards documented in an award-winning Health and Safety Process that has been recognized by industry associations as one of the best. In response to the COVID-19 pandemic, we have taken measures to help ensure the health and well-being of our employees, guests and contractors, including screening of individuals that enter our facilities, social distancing practices, enhanced cleaning and deep sanitization, the suspension of nonessential employee travel and implementation of work-from-home policies, where applicable. Our safety culture is driven by our leaders, in conjunction with active employee engagement.achieve exceptional performance.
At Civeo, we believe that investing in our peopleemployees is an investment infundamental to our own success. Our commitment to training and career development enables employees to grow and advance in their careers while supporting our industry-leadership position. Committed to the continuous improvement of our team, we provide training inprioritize the development of our workforce’s technical and managerial skills needed for employees' current rolescompetencies, with a specific focusan emphasis on safety, customer service, and leadership development. We also build competency required for future projectsOur learning and positions throughdevelopment program encompasses a range of learning modalities, including e-learning modules, face-to-face delivery andin-person training sessions, nationally certified programs as well as licensingand licensed training offeredprovided by external providers.partners.
Government Regulation
Our business is significantly affected by Canadian, Australian and U.S. laws and regulations at the federal, provincial, state and local levels relating to the oil, natural gas and mining industries, worker safety and environmental protection. Changes in these laws, including more stringent regulations and increased levels of enforcement of these laws and regulations, and the development of new laws and regulations could significantly affect our business and result in:
•increased difficulty securing required permits, approvals, licenses or other authorizations issued by federal, provincial and local authorities needed to carry out our operations or our customers' operations;
•increased compliance costs or additional operating restrictions associated with our operations or our customers’ operations;
•other increased costs to our business or our customers’ business;
•reduced demand for oil, natural gas, and other natural resources that our customers produce; and
•reduced demand for our services.
To the extent that these laws and regulations impose more stringent requirements or increased costs or delays upon our customers in the performance of their operations, the resulting demand for our services by those customers may be adversely affected, which impact could be significant and long-lasting. Moreover, climate change laws or regulations could increase the
cost of consuming, and thereby reduce demand for, oil and natural gas, which could reduce our customers’ demand for our services. We cannot predict changes in the level of enforcement of existing laws and regulations, how these laws and regulations may be interpreted or the effect changes in these laws and regulations may have on us or our customers or on our future operations or earnings. We also are not able to predict the extent to which new laws and regulations will be adopted or whether such new laws and regulations may impose more stringent or costly restrictions on our customers or our operations.
Our operations and the operations of our customers are subject to numerous stringent and comprehensive foreign, federal, provincial, state and local environmental laws and regulations governing the release or discharge of materials into the environment or otherwise relating to environmental protection. Numerous governmental agencies issue regulations to implement and enforce these laws, for which compliance is often costly yet critical. The violation of these laws and regulations may result in the denial or revocation of permits, issuance of corrective action orders, modification or cessation of operations,
assessment of administrative and civil penalties, and even criminal prosecution. We believe that we are in substantial compliance with existing environmental laws and regulations andAlthough we do not anticipate that future compliance with existing environmental laws and regulations will have a material effect on our financial condition, results of operations or cash flows over the short term. However,term, there can be no assurance that substantial costs for compliance or penalties for non-compliance with these existing requirements will not be incurred in the future by us or our customers. Moreover, it is possible that other developments, such as the adoption of stricter environmental laws, regulations and enforcement policies or more stringent enforcement of existing environmental laws and regulations, could result in additional costs or liabilities upon us or our customers that we cannot currently quantify.
Canadian Environmental Regulations
In Canada, the federal and provincial governments both have jurisdiction to regulate environmental matters. The provincial governments may also devolve jurisdiction over environmental matters to local governments. Our activities, or those of our customers, may be subject to environmental regulations imposed by these three levels of government. The following addresses updates to Canadian federal and provincial environmental regulations in 20202023 that may affect us or our customers.
Air Quality Management
The Government of Canada (Canada), the Government of Alberta (Alberta), and the Government of British Columbia (British Columbia) each have frameworks for air quality management that may affect us and our customers.
At the federal level, the Reduction in the Release of Volatile Organic Compounds Regulations (Petroleum Sector) were published in 20202020. Certain leak detection and are expected to takerepair provisions of the regulations took effect beginning in 2021.2021 and the regulations set additional monitoring and requirements for operators in 2022 and 2023. These regulations will require the implementation of comprehensive leak detection and repair (LDAR) programs as well as design and operating standards that prevent leaks at Canadian petroleum refineries, upgraders and certain petrochemical facilities and may affect our customers’ operations.
In addition to federal requirements, emissions from facilities in Alberta are subject to provincial regulation. The Alberta Energy Regulator (AER), which is responsible for regulating upstream oil and gas activity in Alberta, oversees compliance with Directive 60: Upstream Petroleum Industry Flaring, Incinerating, and Venting (Directive(Directive 60). This Directive applies to all upstream petroleum industry wells, facilities and pipelines as well as all oil sands schemes and operations with the exception of oil sands mining. Directive 60 requires operators to eliminate or reduce flaring associated with a wide variety of energy development activities and operations. In December 2018, the AER finalized amendments to its Directive 60 and Directive 017: Measurement Requirements for Oil and Gas Operations (Directive 17) as part of its role in implementing commitments from the Alberta government to reduce methane emissions from upstream oil and gas operations by 45% by 2025. These requirements, among other things, set limits on methane emissions from various facilities and require annual reporting of such emissions to the AER. The methane reduction requirements in Directive 60 took effect in 2020, with additional restrictions on vent gas emissions takinglimits took effect in 2022.on January 1, 2022 and additional vent gas limits took effect on January 1, 2023. Meeting these regulatory requirements may result in additional costs or liabilities for our customers’ operations.
Similarly, emissions from facilities in British Columbia are also subject to provincial regulation. The British Columbia Oil and Gas Commission (BCOGC)Energy Regulator (BCER) is responsible for regulating oil and gas activity in British Columbia. BCOGCBCER oversees compliance with the Drilling and Production Regulation, which is one of British Columbia's primary regulatory instruments governing all aspects of oil and natural gas drilling and production. Effective January 1, 2020, that regulation was amended to require operators to eliminate or reduce natural gas leaking or venting associated with a wide variety of equipment and activities in energy development. Under this regulation, new requirements are imposed for facilities detecting leaks and inspecting seals as well as restrictions or prohibitions on the types of equipment used for energy development. Some of these requirements took effect in 2022 and further requirements took effect on January 1, 2023. In addition, the BCER completed consultation in 2023 on proposed amendments to the Drilling and Production Regulation to maintain equivalency with federal requirements. Regulations designed to achieve a 45% reduction in methane emissions relative to 2014 levels are now in place. The BCER is currently conducting a regulatory review and engagement on the development of new regulations designed to achieve a 75% reduction in methane emissions from the oil and gas sector by 2030. Meeting these regulatory requirements may result in additional costs or liabilities for our customers’ operations.
Environmental Assessment of Major Projects
Following a review process that began in January of 2016, Canada introduced new legislation to "rebuild public trust" in Canada's environmental review process. In August 2019, the Canadian Environmental Impact Assessment Act, 2012 (CEAA 2012) was repealed and replaced with the federal Impact Assessment Act. The Impact Assessment Act and regulations made under that Act provide that certain new projects and expansions to existing projects – including oil sands mining and in situ projects, metallurgical mining projects, pipelines and other developments – will likely require a federal planning and assessment process to understand the environmental and social impacts of the project, as well as decision on whether those impacts are in the public interest.
There is considerable uncertainty about whether and howOne of the stated objectives of the Impact Assessment Act and its regulations will be administered and whetherwas to shorten review times for projects that are subject to review under that Act. However, concerns about lengthy reviews that require substantial information from project proponents remain even after the time and cost associated with completingimplementation of the planning, assessment and decision-making phases of that act will increase substantially compared to CEAA 2012.Impact Assessment Act. Our customers operate in the aforementioned industries and could be considering future projects that would be subject to the Impact Assessment Act. To the extent our customers are required to comply with this legislation, it is possible that the uncertainty regarding cost and timelines for navigating the planning, assessment, and decision-making processes may negatively impact our customers' decisions on whether to proceed with those projects.
In 2019, theThe Government of Alberta, initiated a challenge tosupported by the governments of Ontario and Saskatchewan, has challenged the constitutionality of the Impact Assessment Act and regulations made under that Act. The Alberta CourtIn October of Appeal has not yet issued2023, a decision in that case, and it is likely that any decision issued by that Court would be appealed tomajority of the Supreme Court of Canada.Canada (Court) concluded that a large portion of the regime created by the Impact Assessment Act was unconstitutional. The federal government subsequently issued interim guidance on the administration of the Impact Assessment Act and advised that it intended to amend the Impact Assessment Act to align with the Court's ruling. The federal government is expected to introduce legislation amending the Impact Assessment Act in 2024. As a result, there is significant uncertainty about the future application of Canada's federal environmental assessment legislation to our customers.
Climate Change Regulation
Scientific studies have suggested that emissions of greenhouse gases (GHG), including carbon dioxide and methane, may be contributing to warming of the Earth’s atmosphere and other climatic changes. In December 2015, 195 nations, including Canada, Australia, and the U.S., adopted the Paris Agreement at the 21st “Conference of the Parties” to the United Nations Convention on Climate Change (COP 21). The Paris Agreement does not set legally binding emission reduction targets but does set a goal of limiting global temperature increases to less than 2° Celsius. Canada announced that it is in favor of the decision of the COP 21 to endeavor to take action to further limit global temperature increases to less than 1.5° Celsius. The Paris Agreement also requires parties to submit Intended Nationally Determined Contributions (INDCs) which set out their emission reduction targets and to renew these INDCs, with the goal of increasing the reductions, every five years. The Paris Agreement does not legally bind the parties to reach their INDCs, nor does it prescribe the measures that must take to achieve them. These measures are left to each participating nation. In September 2016, Canada's new federal government confirmed that it would not commit to a more ambitious INDC than the preceding Conservative federal government. The government maintained this approach in 2017 revisions to Canada’s INDC submission taking into account the federal Pan-Canadian Framework on Clean Growth and Climate Change (PCF) adopted in 2016.
In March 2016, Canada and the Government of the United StatesU.S. jointly announced their intention to take action to reduce methane emissions from the oil and gas sector in an effort to meet their respective INDCs pursuant to the Paris Agreement. For its part, Canada announced its intention to reduce methane emissions from the oil and gas sector by 40-45 percent below 2012 levels by 2025. In 2018, the government introduced the Regulations Respecting Reduction in the Release of Methane and Certain Volatile Organic Compounds (Upstream Oil and Gas Sector) (“Federal Methane Regulations”)Regulations) to implement its methane commitment. The Federal Methane Regulations impose various quantity-based limits on the venting of natural gas (or in the case of well completions involving hydraulic fracturing, a ban on such venting) and include associated conservation, measurement, inspection and corrective action requirements. Certain requirements of the Federal Methane Regulations came into effect January 1, 2020, with others deferred untiland other emissions limits are now in place for certain equipment installed on or after January 1, 2023.
In March 2022, the federal government began consultation on a proposed strategy to expand coverage and increase stringency of methane reduction obligations in the oil and gas sector specifically, and is expected to issue draft regulations in 2023. In December 2023, the federal government published proposed amendments to the Federal Methane Regulations for public comment. The proposed amendments are intended to reduce methane emissions in Canada's upstream oil and gas sector by at least 75% below 2012 levels by 2030. To achieve that objective, the proposed amendments would prohibit venting natural gas to the environment, subject to limited exceptions. They would also impose requirements on hydrocarbon combustion systems and measures to reduce fugitive methane emissions. Draft regulations are expected to be published in 2024. These requirements may result in additional costs or liabilities for our customers’ operations.
In March 2016,2018, the federal government enacted the Greenhouse Gas Pollution Pricing Act (GGPPA), which came into force on January 1, 2019. This regime has two parts: an output-based pricing system for large industry and a regulatory fuel charge. This system serves as a further effort to"backstop" and applies in provinces and territories that request it and in those that do not have their own emissions pricing systems in place that meet Canada’s INDC, representatives of the federal and the majority of provincial governments committed to imposingstandards. This ensures that there is a uniform price on carbon pollution, beginning at $10 per tonne in 2018 and increasing at a rate of $10 annuallyemissions across the country. The backstop price under the GGPPA increased to $50 per tonne of CO2e in 2022. In December 2020,As of January 1, 2024, the Canada's federalbackstop price is $65 per tonne of CO2e. That price will increase to $80 in April 2024 and the current government announcedplan is to continue increasing that after 2022, the price on carbon pollution would increase by $15 per each year until it reaches $170/tonne annually, reaching $170 per tonneof CO2e in 2030.
To implement its INDC and PCF commitments,On November 19, 2020, the federal government introduced the Greenhouse Gas Pollution PricingCanadian Net-Zero Emissions Accountability Act, which as in Parliament. That Act was passed by Parliament and received Royal Assent on June 29, 2021 and binds the Government of its assent in June 2018 implementsCanada to a federal legislative carbon pricing “backstop”. This applies a benchmark carbon price in any province that does not establish an equivalent framework at or aboveprocess intended to help Canada achieve net-zero emissions by 2050. It also establishes rolling five-year emissions-reduction targets and requires the benchmark level. This allows GHG regulationgovernment to take place at the provincial level, where provinces may choose between an explicit price-based
system (as exists in British Columbia) or a cap-and-trade system (as exists in Quebec).develop plans to reach each target. The federal backstopgovernment is only being appliedrequired to provincessupport those efforts by creating a Net-Zero Advisory Body and by publishing annual reports that describe how departments and Crown corporations are considering the financial risks and opportunities of climate change in which no equivalent framework is in place.their decision-making.
In December 2020,At the federal government published draft regulations referred to as the Clean Fuel Standard (CFS), which form part of its plan to reduce emissions, accelerate the use of clean technologies and fuels, and create good jobs in a diversified economy. The CFS, which is expected to come into force in 2022, will require liquid fuel suppliers to gradually reduce the carbon intensity26th Conference of the fuels they produceParties to the UNFCCC (COP 26), held in Glasgow between October 31 and sell for use inNovember 13, 2021, Canada over time. Compliance with thispresented a strengthened climate plan and committed to an enhanced emissions reduction target of between 40 and 45 percent below 2005 levels by 2030. Following a 2021 federal election, the Government of Canada delivered a new regulation is expected to increase the price of liquid fuels which, in turn, could increase operating costs for our customers while potentially lowering demand for some of their products.
In Alberta, the previous provincial government's Climate Leadership Plan (CLP), was launchedThrone Speech in November 2015. This framework was approved as meeting the PCF benchmark and exempting Alberta from the federal backstop.2021 which reiterated its intent to take action that would "go further, faster" to fight climate change. Among other things, the CLP proposedfederal government pledged to cap and cut oil and gas sector emissions while accelerating on the path to 100 percent net zero electricity. In December 2023, the federal government announced that it intended to implement a national cap-and-trade system for oil and gas emissions in Canada and published a draft regulatory framework for managing GHG emissions by reducing specifiedpublic comment. Draft regulations are expected to be published in 2024. As currently proposed, the cap-and-trade system would apply to liquified natural gas emissions, relative to total production from facilities that emit over 100,000 tons of carbon dioxide equivalent per year. The details of this framework were set out in legislation and regulations issued after the CLP. The previous Alberta government then passed the Climate Leadership Act (CLA), implementing the broad economy-wide levy on GHG emissions, subject to limited exceptionsproducers as well as producers in the Oil Sands Emissions Limit Act, which imposes a 100 mega-ton annual limit on GHG emissions fromconventional oil, offshore, oil sands sites.and natural gas production and processing subsectors. The CLP also targeted the phasing out of coal-generated electricity (or theproposed cap-and-trade system would set oil and gas sector emissions therefrom) bylimits, to be phased in between 2026 and 2030. Producers would be required to reduce their emissions or purchase "allowances" from other facilities that have reduced their emissions. These requirements, if implemented, may result in additional costs or liabilities for our customers’ operations.
In addition, the previous Alberta provincialfederal government issuedamended the Carbon Competitiveness Incentive Regulation (CCIR)Canadian Environmental Protection Act, 1999 (“CEPA”) in 2023. In particular, the preamble to replaceCEPA now recognizes that every individual in Canada has a right to a healthy environment. The Government of Canada must now take into consideration this right, including the former Specified Gas Emitters Regulation. Likeprinciples of environmental justice, when making decisions under CEPA, including its predecessor,regulation of greenhouse gas emissions in Canada. Within two years, the CCIR soughtGovernment of Canada must develop an implementation framework on how this right will be upheld while administering CEPA. Until that framework is developed, there is significant uncertainty regarding how these changes to incentivize emissions reductions through the use of emissions intensity targets. Under CCIR, a company could meet the applicable emissions limits by making emissions intensity improvements at regulated facilities, offsetting GHG emissions by purchasing offset credits or emission performance credits in the open market, or acquiring “fund credits” (akinCEPA will be implemented, and their potential to allowances) by making payments for each ton of GHG emissions over the required reduction target to the Alberta Climate Change and Emissions Management Fund.affect our customers' operations.
In April 2019, the previous Alberta, government was replaced with a new conservative government following a general election. Consistent with its campaign promises, the new government repealed the CLA, thereby eliminating the provincially-imposed levy on GHG emissions. As a result of those actions by the new Alberta government, features of the federal backstop took effect in Alberta in January 2020. Features of the backstop also took effect at various points in 2019 in Ontario, New Brunswick, Manitoba, Saskatchewan, Yukon, Nunavut and Prince Edward Island. Alberta, Saskatchewan and OntarioGHGs are challenging the federal backstop in court on the basis that the federal government lacks the constitutional ability to implement the measure. The Supreme Court of Canada heard arguments on the constitutionality of the federal backstop in 2020 and is expected to release its decision in 2021. The outcome of this litigation is uncertain and could affect our customers’ compliance requirements in provinces subjectregulated pursuant to the backstop. In addition,Emissions Management and Climate Resilience Act and the Oil Sands Emissions Limit Act remains in force.
While the current Alberta government eliminated the provincially-imposed economy-wide levy on GHG emissions, facilities that emit more than 100,000 tons of GHG emissions in a calendar year continue to be subject to regulations that impose costs on those emissions. In particular, the current government replaced the CCIR with a new Technology Innovation and Emissions Reduction Regulation ("(TIER Regulation). In December 2019, the TIER Regulation"), which took effect on January 1, 2020.Regulation was deemed equivalent to the backstop prescribed by the federal GGPPA, meaning that facilities within Alberta subject to the TIER Regulation are not subject to the full costs of complying with the GGPPA. The TIER Regulation generally applies to Alberta-based facilities that emit over 100,000 tonnes of CO2e per year. Under the TIER Regulation, emissions from each facility are compared to either an industry-wide benchmark or a facility-specific benchmark.benchmark which effectively permits facilities to emit GHGs up to a certain amount without being subject to the provincial carbon price. Those benchmarks “tighten” resulting in more onerous compliance costs, every year. Facilities with emissions that exceed the industry-wide benchmark or facility-specific benchmark, as applicable, must rely on one or more of the compliance options established by the TIER Regulation.Regulation, such as purchase credits or offsets for each tonne of CO2e in excess of their limits. The Alberta government issues an order every year setting the price to acquire credits, which effectively dictates compliance options undercosts. In January 2023, the Alberta government published amendments to the TIER Regulation, are substantially the same as those which existed under the CCIR. Those facilities regulated under the CCIR were previously exempt from the Alberta-wide levy. Similarly, the federal government announced in December 2019 that those activities regulated under TIER would not be subjectincluding increases to the federal backstop. As noted, the federal backstop carbon price is expectedand increases to increase annually between 2021 and 2030. Inannual benchmark tightening rates. These changes were implemented in order to remain "equivalent"ensure that the TIER Regulation maintains equivalency with the framework established by GGPPA. Increases to the federal backstop, it is likely that the per tonne cost of carbon emissionsTIER Regulation credits and annual benchmark tightening rates may result in Alberta will need to increase at the sameadditional costs or liabilities for our customers’ operations. In addition, similar pace. The directincreases in stringency of provincial GHG regulatory frameworks within British Columbia and indirectSaskatchewan may result in additional costs of these regulatory changes may adversely affector liabilities for our operations and financial results as well as those of our customers with whom we conduct business.
Finally, it should be noted that some scientists have concluded that increasing concentrations of GHGs in the Earth’s atmosphere may produce climate changes that have significant physical effects, such as higher sea levels, increased frequency and severity of storms, droughts, floods and other climatic events. If any such effects were to occur, they could have an adverse effect on our operations and our financial condition.customers’ operations.
The Canadian Species at Risk Act is intended to prevent wildlife species in Canada from disappearing and to provide for the recovery of wildlife species that no longer exist in the wild in Canada, or that are endangered or threatened as a result of human activity, and to manage species of special concern to prevent them from becoming endangered or threatened. The
designation of previously unprotected species as threatened or endangered in areas of Canada where our customers’ oil and natural gas exploration and production operations are conducted could cause them to incur increased costs arising from species
protection measures or could result in limitations on their exploration and production activities, which could have an adverse impact on demand for our services.
In 2019, certain First Nations groups and environmental organizations commenced litigation intended to force the federal minister of environment to recommend that the federal government implement certain protections for woodland caribou habitat. That litigation was discontinued in 2020, with the federal and Alberta governments announcing an agreement to collaborate on developing measures to achieve woodland caribou conservation and recovery. Woodland caribou habitat covers large portions of several Canadian provinces including British Columbia, Alberta, and Saskatchewan. Many of our customers have existing or proposed developments in or near woodland caribou habitat. Conservation measures imposed by the federal government or Alberta governmentprovincial governments could affect the business of our customers with operations near caribou habitat.
Alberta’s Electricity MarketAbandonment and Remediation of Oil and Gas Infrastructure
As the lifecycle regulator for energy resource activities, the AER oversees closure requirements, including the abandonment and reclamation of wells, well sites, facilities, facility sites, and pipelines. Historically, the AER discharged this role through its Liability Management Rating Program (AB LMR Program). The AB LMR Program relied on the ratio of a company's assets and liabilities (Liability Management Ratio or LMR) to assess whether the company would be able to address closure obligations. Where a company's liabilities exceeded their assets (resulting in a LMR of less than 1.0), the AER could require the company to post security to bring the ratio to 1.0. The AB LMR Program was developed during a period of rapid growth in the province when companies were focused on well and infrastructure expansion. In recent years, it became clear that the LMR Program needed to be updated to reflect declining production and aging infrastructure.
As a result of the Supreme Court of Canada's decision in Orphan Well Association v Grant Thornton (also known as the Redwater decision), receivers and trustees can no longer avoid the AER's legislated authority to impose abandonment orders against licensees or to require a licensee to pay a security deposit before approving a license transfer when any such licensee is subject to formal insolvency proceedings. This means that insolvent estates can no longer disclaim assets that have reached the end of their productive lives (and therefore represent a net liability) in order to deal primarily with the remaining productive and valuable assets without first satisfying any abandonment and reclamation obligations associated with the insolvent estate's assets. In April 2020, the Government of Alberta passed the Liabilities Management Statutes Amendment Act, which places the burden of a defunct licensee's abandonment and reclamation obligations first on the defunct licensee's working interest partners, and second, the AER may order the orphan fund (Orphan Fund) established under the Oil and Gas Conservation Act (OGCA) to assume care and custody and accelerate the clean-up of wells or sites which do not have a responsible owner. These changes will come into force on proclamation.
As a result of the changing landscape and new direction from the Redwater decision, in July 2020, the Government of Alberta began implementing changes to its liability management policy. In particular, in July 2020, the Province released a new Liability Management Framework (AB LMF) which includes a series of mechanisms and requirements to improve and expedite reclamation efforts and to require industry to better manage clean-up of oil and gas wells, pipelines and facilities. Notably, the AB LMF provided policy direction allowing the AER to take "Licensee Special Action" to assist operators in managing their assets and maintaining operations under certain circumstances.
The previous government’s CLP setGovernment of Alberta followed the announcement of the AB LMF with amendments to the Oil and Gas Conservation Rules and the Pipeline Rules in late 2020. The changes to these rules fall into three broad categories: (i) they introduce "closure" as a target of 30 per cent of Alberta’s electricity generation coming from renewables by 2030. Toward attaining this goal,defined term, which captures both abandonment and reclamation; (ii) they expand the AER's authority to initiate and supervise closure; and (iii) they permit qualifying third parties on November 3, 2016, Alberta released the details of its Renewable Electricity Program (REP), which includedwhose property wells or facilities are located to request that licensees prepare a procurement process for renewable generation. The first procurement process, REP Round 1, took place in 2017 and awarded long-term, indexed-price power contracts to approximately 596 MW of wind generation capacity. The second process, REP 2, took place in 2018 and awarded contracts to 363 MW of wind capacity in 2018, with eligible projects having a minimum of 25% Indigenous equity ownership. The third, REP 3, also in 2018, was structured similarly to REP 1 and awarded contracts to 400 MW of wind capacity. Three out of four REP 1 projects came into commercial operation in 2019, with the fourth project, REP 2 and REP 3-procured capacity expected to come online later, in 2021 or 2022. Funding for the REP was supposed to come from the Climate Change and Emissions Management Fund described above, backstopped by the government’s General Revenue Fund, rather than from direct electricity charges to our customers.closure plan.
On June 10, 2019The AB LMF provided Government of Alberta policy direction on managing energy sector closure requirements. The AER implements and administers that policy through directives. In April 2021, the fourth REP round auctionAER made changes to Directive 67: Eligibility Requirements for Acquiring and Holding Energy Licenses and Approvals (Directive 67) in order to increase scrutiny the AER applies to ensure that authorization for oil and gas development is only granted to responsible parties. Those changes include additional requirements for industry to provide updated financial information when making certain applications to the AER and throughout the energy development lifecycle. As a result of the changes to Directive 67, the AER may revoke or restrict a company's eligibility to hold AER licenses if the AER determines that the licensee poses an "unreasonable risk", taking into account a broad range of financial and operational considerations.
In December 2021, the AER published a new Directive 88: Licensee Life-Cycle Management (Directive 88) and supporting guidance information to further support implementing the AB LMF. Among other things, Directive 88 establishes the AER's authority to conduct a holistic licensee assessment to inform regulatory decisions about a given licensee, including by conducting a "Licensee Capability Assessment." Directive 88 also establishes the Licensee Management Program contemplated in the AB LMF which enables the AER to proactively monitor licensees to identify those at risk of not meeting
their regulatory obligations and to use appropriate regulatory tools to address that risk. Finally, Directive 88 establishes the Inventory Reduction Program and allows the AER to set licensee-specific and industry-wide closure targets.
Complementing the AB LMF Program and associated directives, Alberta's OGCA establishes an orphan fund (Orphan Fund) to help pay the costs to suspend, abandon, remediate and reclaim a well, facility or pipeline included in the AB LMR Program if a licensee or working interest participant becomes insolvent or is unable to meet its obligations. The Orphan Fund was canceledoriginally conceived to be bankrolled by licensees in the AB LMR Program who contribute to a levy administered by the new conservative government. TheAER. However, given the increase in orphaned oil and natural gas assets, the Government of Alberta Electric System Operator continueshas loaned the Orphan Fund approximately $335 million to honor the REP contracts from Rounds 1-3. Funding for these contracts will now rely solely upon the General Revenue Fund, after the Climate Changecarry out abandonment and Emissions Management Fund was folded into the General Revenue Fund in October 2019. The REP’s funding structure currently limits that program’s direct impact on electricity prices. However, the coming-onlinereclamation work, of REP-subsidized generation could negatively affect the performancewhich, $121 million had been paid as of Alberta’s current electricity market. Negative impactsMay 2023. In response to the performanceCOVID-19 pandemic, the Government of Alberta's electricity market, should they materialize, couldAlberta also covered $113 million in levy payments that licensees would otherwise have owed to the Orphan Fund, corresponding to the levy payments due for the first six months of the AER's fiscal year. A separate orphan levy applies to persons holding licenses for large facilities. Collectively, these programs, the AB LMF, and associated directives are designed to minimize the risk to the Orphan Fund posed by the unfunded liabilities of licensees and to prevent the taxpayers of Alberta from incurring costs to suspend, abandon, remediate and reclaim wells, facilities or pipelines.
These and any other changes to the AER's approach to manages closure requirements for energy resource activities may result in increasedadditional costs or liabilities for our customers’ operations.
In British Columbia the BCER’s Comprehensive Liability Management Plan addresses liability management, improving the rate of inactive site restoration, and addressing orphan sites. The BCER uses a Liability Management Rating (LMR) program to our operationsevaluate each company’s ability to pay for site restoration. The BCER addresses dormant sites through the Dormancy and Shutdown Regulation, which ensures oil and natural gas producers responsibly bring their energy resource activities to regulatory closure within a reasonable time frame. The Dormant Sites Program is used to identify permit holders that are subject to the dormant site provisions of the Energy Resource Activities Act and the Dormancy and Shutdown Regulation. The regulation sets timelines for restoration and imposes requirements for decommissioning, site assessment, remediation and restoration. Like in Alberta, British Columbia’s Orphan Site Reclamation Fund is a levy on oil and natural gas producers that is used to pay the cost of restoring orphan sites in BC. If or when applicable to operations, ofany changes to the BCER’s approach to managing dormancy and closure requirements for energy resource activities may result in additional costs or liabilities for our customers going forward.customers’ operations.
Australian Environmental Regulations
Our Australian segment is regulated by general statutory environmental and land use controls at the federal, state and territory and local government levels which may result in land use approval, regulation of operations and compliance risk. These controls include: land use and urban design controls; controls to protect Australia’s natural environment, iconic places and Aboriginal and Torres Strait islander native title and heritage; the regulation of hard and liquid waste, including the requirement for trade waste and/or wastewater permits or licenses; the regulation of water, noise, heat, and atmospheric gases emissions; the regulation of the production, transport and storage of dangerous and hazardous materials (including asbestos); the regulation of pollution and site contamination and requirements to notify of and clean-up environmental contamination.
Federal Controls
At a federal level, the Environment Protection and Biodiversity Conservation Act 1999 (EPBC Act) is Australia’s key piece of environmental legislation. The EPBC Act protects of matters of national environmental significance, for example, threatened species and communities (e.g. Koalas), migratory species, Ramsar wetlands and world heritage properties. Activities that have the potential to impact matters protected by the EPBC Act trigger referral to the federal government for Environmental Impact Assessment (EIA).assessment and approval.
In October 2020, the findings of an independent review recommended reforms of the EPBC Act (Independent Review) recommended significant reforms including (but not limited to) introduction of legally binding ‘National Environmental Standards’ and, a ‘climate change’ referral trigger, measures to harness and recognize the importance of indigenous knowledge, stronger compliance and enforcement powers, and proposals for newrevised bilateral agreements with the States and Territories to streamline the assessment and approval process of some activities regulated by the EPBC Act approval process. Bills to effect many of the recommended reforms are currently before Parliament. Notably, the recommended climate change referral trigger will assist Australia fulfils its obligations under the Paris Agreement by triggering EIA of emissions-intensive activities. It will also introduceand criminal penalties for offenses relating to emissions-intensive actions.
In December 2022 the federal government announced its response to the Independent Review. This response proposes various changes to the EPBC Act in line with the Independent Review, for example, the introduction of ‘National Environmental Standards’, creation of a federal Environmental Protection Agency and the introduction of a requirement to
achieve ‘net positive’ outcomes. Several bills to effect some of the recommended reforms are currently before Parliament and a comprehensive draft bill is expected to be introduced in 2024 together with a draft of the proposed National Environmental Standards. Notably, the federal government is not presently proposing to introduce the climate change referral trigger recommended by the Independent Review.
If assented to,any of the recommended reforms take effect, our obligations under, and compliance with, the EPBC Act ought to be reviewed. However, its implications for our Australian operations are not anticipated to be significant.
Ongoing awareness of these reforms is important as the policylegislative and legislativepolicy changes may affect our customers’ operations and have impacts on the non-renewable resources sector generally.
There is an increasing emphasis from regulators on sustainability and energy efficiency in business operations. Federal requirements are now in place for the mandatory disclosure of energy performance under building rating schemes. These schemes require the tracking of specific environmental performance factors. Carbon reporting requirements currently exist for corporations which meet a reporting threshold for greenhouse gases or energy use or production for a reporting (financial) year under federal legislation.
From July 1, 2023, new obligations and reporting requirements took effect with respect to the ‘Safeguard Mechanism’ – Australia’s policy for reducing emissions from facilities that emit more than 100,000t CO2-e per financial year that has been in place since 2016. These reforms are intended to assist Australia meet its emissions reduction targets of 43% below 2005 levels by 2030 and may affect large scale industry customers.
The federal government has also proposed further climate-related disclosure requirements that are anticipated to take effect (for some companies) from mid-2024. These proposed disclosure requirements will oblige companies to disclose various climate-related information, including information about their greenhouse gas emissions, climate-related targets, offset contributions, transition plans, and information about strategies, plans and governance procedures/controls in place to monitor and manage climate-related risks and opportunities. If these reforms become law, we will have corporate reporting requirements in relation to these climate related matters, likely to commence in 2026.
State and Territory Controls
At a State and Territory level, our operations are authorized and regulated by layers of planning and environmental approvals. Queensland, New South Wales and Western Australia all have multiple acts regulating matters of the environment, conservation, vegetation management and protection of aboriginal and Torres Strait islandIslander use rights which are administered by each States’ independent environment protection regulator (e.g. Queensland’s Environmental Protection Agency)Department of Environment, Science and Innovation). If Parliament assentsamendments are made to the bill proposingEPBC Act to effect new bilateral agreements, under EPBC Act, the States and Territories will likely be given further power to assess and approve certain actions underregulated the EPBC Act.
Under state law, some specified activities, for example, sewage treatment works at our sites, may require regulation by way of environmental approvals. Such approvals may also impose monitoring and reporting obligations on the holder as well as obligations to rehabilitate the subject site once the regulated activity has ceased.
We must ensure that all necessary approvals, permits and licenses are in place to authorize our operations and that the conditions of those approvals, permits and licenses are complied with until the relevant operations cease (and are cleaned-up if necessary). Where approvals are not held and/or complied with, the operation may be unlawful and subject to penalties, including stop-work orders, remediation orders and financial penalties. Our Australian operations continue to comply with our existing approvals, permits and licenses.
We have a positive obligation under state legislation to notify of an incident causing (or threatening) serious or material environmental harm. Examples of materialnotifiable environment harm include effluent overflow, chemical leaks and chemical fires. Failure to discharge this obligation can attract significant sanctions and financial penalties.
There is an increasing emphasis from state and federal regulators on sustainability and energy efficiency in business operations. Federal requirements are now in place for the mandatory disclosure of energy performance under building rating schemes. These schemes require the tracking of specific environmental performance factors. Carbon reporting requirements currently exist for corporations which meet a reporting threshold for greenhouse gases or energy use or production for a reporting (financial) year under national legislation.
Local Government
At a local government level, our operations are subject to, and regulated by, local laws administered by local government authorities. Local laws may cover matters such as operation of certain activities, management of vegetation and natural and anthropogenic hazards, actionable nuisance and fencing. Local laws differ between each local government area and we must understand and operate within these laws as they apply to our operations Australia wide.
U.S. Environmental Regulations
The Clean Water Act, as amended, and analogous state laws impose restrictions and strict controls regarding the discharge of pollutants into state waters or waters of the U.S. The discharge of pollutants into jurisdictional waters is prohibited unless the discharge is permitted by the U.S. Environmental Protection Agency (EPA) or authorized state agencies. The EPA published a final rule outlining its position onIn addition, the federal jurisdictional reach over waters of the U.S. in June 2015. However, the EPA rescinded this rule in 2019 and promulgated the Navigable Waters Protection Rule in 2020. The Navigable Waters Protection Rule defined what waters qualify as navigable waters of the United States and are under Clean Water Act jurisdiction and has generally been viewed as narrowing the scope of waters of the United States as compared to the 2015 rule. Litigation in multiple federal district courts is currently challenging the rescission of the 2015 rule and the promulgation of the Navigable Waters Protection Rule. Many of our U.S. properties and operations require permits for discharges of wastewater and/or storm water, and we have developed a system for securing and maintaining these permits. In April 2020 a Montana federal judge vacated the U.S. Army Corps of Engineers (Corps) Nationwide Permit (NWP) 12 and enjoined the Corps from authorizing any dredge or fill activities under NWP 12 until the agency completed formal consultation with U.S. Fish and Wildlife Service (USFWS) under Endangered Species Act (ESA) regarding NWP 12 generally. The court later revised its order to vacate NWP 12 only as it relates to the construction of new oil and gas pipelines and that order is currently on appeal in the Ninth Circuit.
However, the Montana district court’s decision spawned other NWP 12-based challenges and may indicate that the rest of the NWPs, some of which are relied upon by oil and gas projects, are vulnerable to similar challenge. The Corps has proposed a new set of NWPs, which would replace the NWPs for dredge or fill discharges into waters of the United States that the Corps last issued and made available in 2017. However, the Corps has elected not to consult with USFWS at this time. If this status quo does not change, when the Corp re-issues the NWPs, the NWPs could be subject to the same legal challenges unless and until the ongoing litigation resolves the questions surrounding the need for a formal ESA consultation. The Clean Water Act and analogous state laws provide for administrative, civil and criminal penalties for unauthorized discharges and, together with the Oil Pollution Act of 1999, as amended, require the development and implementation of spill prevention and response plans and impose liability for the remedial costs and associated damages arising out of any unauthorized discharges.
GHG Emissions
The EPA has adopted rules requiring the monitoring and reporting of GHG emissions from specified large GHG emission sources in the U.S., including, offshore and onshore oil and natural gas production facilities, on an annual basis. In October 2015,December 2023, the EPA finalized rules that added new sourcesissued a final rule updating New Source Performance Standards (NSPS) and providing emission guidelines to the scope of the GHG monitoring and reporting requirements. These new sources include gathering and boosting facilities as well as completions and workovers from hydraulically fractured oil wells. In addition, the EPA has finalized new regulations that would further restrict GHG emissions, such as new standards forreduce methane and volatile organic compound (VOC) emissionsother pollutants from new and modifiedthe oil and gas sources, which the EPA published in June 2016. On September 11, 2018, the EPA proposed targeted improvements to the rule, including amendments to the rule’s fugitive emissions monitoring requirements, and is in the process of finalizing the amendments, which it originally expected to do in late 2019. Separately, in 2020, the EPA rescinded methane and volatile organic compound emissions standards for new and modified oil and gas transmission and storage infrastructure, as well as methane limits for new and modified oil and gas production and processing equipment. The EPA also relaxed requirements for oil and gas operators to monitor emissions leaks.
Additionally, in November 2016, the Bureau of Land Management (BLM) issued new regulations to reduce “waste” of natural gas, of which methane is a primary constituent, from venting, flaring and leaks during oil and natural gas production activities on onshore federal and Indian lands. In 2018, the BLM announced a revised rule which scaled back the waste-prevention requirements of the 2016 rule. This revised rule was vacated by a California federal district court in 2020, a decision which BLM has appealed to the Ninth Circuit Court of Appeals. Furthermore, separately, in October 2020, the federal district court of Wyoming vacated the original 2016 rule.
In October 2015, the EPA finalized the Clean Power Plan, which imposes additional obligations on the power generation sector to reduce GHG emissions. In August 2019, the EPA finalized the repeal of the 2015 regulations and replaced them with the Affordable Clean Energy rule (ACE), which designates heat rate improvement, or efficiency improvement, as the best system of emissions reduction for carbon dioxide from existing coal-fired electric utility generating units. Both the appropriateness of the repeal of the 2015 regulations and the adequacy of ACE are currently subject to litigation. While our operations are not directly affected by these actions, their impact on our oil and natural gas exploration and production customers could result in a decreased demand for the services that we provide.industry.
While the U.S. Congress has, from time to time, considered legislation to reduce emissions of GHGs, in recent years, there has not been significant activity in the form of adopted legislation to reduce GHG emissions at the federal level. In the absence of federal climate legislation in the U.S., a number of state and regional efforts have emerged that are aimed at tracking and/or reducing GHG emissions, including cap and trade programs that typically require major sources of GHG emissions, such as electric power plants, to acquire and surrender emission allowances in return for emitting those GHGs. The U.S. participated in the creation of the Paris Agreement at COP 21 in December 2015. Although the U.S. had withdrawn from the Paris Agreement, in November 2020, the Biden administration officially reentered the U.S. into the agreement in February 2021.
Although it is not possible at this time to predict how legislation or new regulations that may be adopted to address GHG emissions would impact our business, any such future laws and regulations could require us or our customers to incur increased operating costs, such as costs to purchase and operate emissions control systems, to acquire emission allowances or comply with new regulatory or reporting requirements. Any such legislation or regulatory programs could also increase the cost of consuming, and thereby reduce demand for oil and natural gas, which could reduce our customers’ demand for our services. Consequently, legislation and regulatory programs to reduce GHG emissions could have an adverse effect on our business, financial condition and results of operations.
Other Environmental Regulations
Our operations, as well as the operations of our customers, are also subject to various laws and regulations addressing the management, disposal and releases of regulated substances. For example, in the U.S.,substances, including the federal Resource Conservation and Recovery Act, as amended (RCRA) and comparable state statutes regulate the generation, storage, treatment, transportation, disposal and cleanup of hazardous and non-hazardous solid wastes. Under the auspices of the EPA, most states administer some or all of the provisions of RCRA, sometimes in conjunction with their own, more stringent requirements. Federal and state regulatory agencies can seek to impose administrative, civil and criminal penalties for alleged non-compliance with RCRA and analogous state requirements. In the course of our operations, we generate some amounts of ordinary industrial wastes, such as paint wastes, waste solvents and waste oils that may be regulated as hazardous wastes. Moreover,, the federal Comprehensive Environmental Response, Compensation and Liability Act, as amended (CERCLA), also known as the Superfund law, and comparable state laws impose liability, without regard to fault or legality of conduct, on classes of persons considered to be responsible for the release of a “hazardous substance” into the environment. These persons include the current and past owner or operator of the site where the release occurred and anyone who transported, disposed or arranged for the transport or disposal of a hazardous substance released at the site. Under CERCLA, such persons may be subject to joint and several strict liability for the costs of cleaning up the hazardous substances that have been released into the environment, for damages to natural resources and for the costs of certain health studies. CERCLA also authorizes the EPA and, in some instances, third parties to act in response to threats to the public health or the environment and to seek to recover from the responsible classes of persons the costs they incur. In addition, neighboring landowners and other third parties may file claims for personal injury and property damage allegedly caused by the hazardous substances released into the environment. We generate materials in the course of our operations that may qualify as hazardous substances. In the event of mismanagement or release of regulated substances upon properties where we conduct operations, we could become subject to liability and/or obligations under CERCLA, RCRA and/or analogous state laws. Under such laws, we could be required to undertake response or corrective measures, which could include removal of previously disposed substances and wastes, cleanup of contaminated property or performance of remedial operations to prevent future contamination.
The federal Endangered Species Act, as amended (ESA), restricts activities in the U.S. that may affect endangered or threatened species or their habitats. If endangered species are located in areas of the U.S. where our oil and natural gas exploration and production customers operate, such operations could be prohibited or delayed or expensive mitigation may be required. The designation of previously unprotected species as threatened or endangered or designation of previously unprotected habitat as critical habitat in areas of the U.S. where our customers’ oil and natural gas exploration and production operations are conducted could cause them to incur increased costs arising from species protection measures or could result in limitations on their exploration and production activities, which could have an adverse impact on demand for our services.
Hydraulic fracturing is a process sometimes used to stimulate production of hydrocarbons from tight formations.an important and common practice in the oil and gas industry. The process involves the injection of water, sand and chemicals under pressure into formationsa formation to fracture the surrounding rock and stimulate production. Hydraulicproduction of hydrocarbons. Certain environmental advocacy groups and regulatory agencies have suggested that additional federal, state and local laws and regulations may be needed to more closely regulate the hydraulic fracturing is typically regulated by state oilprocess, and natural gas regulators, buthave made claims that
hydraulic fracturing techniques are harmful to surface water and drinking water resources and may cause earthquakes. Various governmental entities (within and outside the U.S.) are in the process of studying, restricting, regulating or preparing to regulate hydraulic fracturing, directly or indirectly.
In the U.S., the EPA has assertedalready regulates certain hydraulic fracturing operations involving diesel under the Underground Injection Control program of the federal regulatory authority pursuant to the Safe Drinking Water Act (SDWA) over,Act. In January 2021, President Biden announced a moratorium on new oil and issuedgas leasing on federal lands and offshore waters pending completion of a comprehensive review and reconsideration of federal oil and gas permitting guidanceand leasing practices. In August 2022, a federal district judge in February 2014 for, certainLouisiana permanently enjoined the moratorium in the 13 states that filed a lawsuit against the action.
States and local governments may also seek to limit hydraulic fracturing activities involvingthrough time, place, and manner restrictions on operations or ban the useprocess altogether. The adoption of diesel fuels. In May 2014, EPA issued an advance noticelegislation or regulatory programs that restrict hydraulic fracturing could adversely affect, reduce or delay well drilling and completion activities, increase the cost of proposed rulemaking seeking comment ondrilling and production, and thereby reduce demand for our services. There also exists the development ofpotential for the Biden Administration to pursue new or amended laws, regulations, under the Toxic Substances Control Act (TSCA) to require companies to disclose information regarding the chemicals used in hydraulic fracturing. In March 2015, BLM issued a final ruleexecutive actions and other regulatory initiatives that imposes requirementscould impose more stringent restrictions on hydraulic fracturing, activitiesincluding potential restrictions on federal and Indian lands, including new requirements relating to public disclosure, wellbore integrity and handling of flowback water; similar final rules were published in November 2016 for hydraulic fracturing activities on National Park and National Wildlife Refuge System lands. In June 2016, the U.S. District Court for the District of Wyoming struck down the BLM final rule, finding that BLM lacked authority to promulgate the rule, but this ruling was vacated on appeal in September 2017. Regardless, BLM rescinded this rule in December 2017. In January 24, 2018, California and a coalition of environmental groups each filed lawsuits in the Northern District of California to challenge BLM’s rescission of the 2015 rule. The Northern District of California upheld the rescission in 2020, but this decision was then appealed to the Ninth Circuit Court of Appeals. In addition, Congress has from time to time considered legislation to provide for federal regulation of hydraulic fracturing under the SDWA and to require disclosure of chemicals used in the hydraulic fracturing process. Some states and local governments also have adopted or are considering adopting regulations to restrict or ban hydraulic fracturing in certain circumstances. Moreover, ongoing governmental reviews of the environmental impacts of hydraulic fracturing by EPAbanning new oil and other agencies could lead to further regulation of hydraulic fracturing. For example, in December 2016, the EPA released its final reportgas permitting on the potential impacts of hydraulic fracturing on drinking water resources. The final report concluded that hydraulic fracturing activities can impact drinking water under some circumstances, including large volume spills and inadequate mechanical integrity of wells.federal lands. While our operations are not directly affected by these actions, their impact on our oil and natural gas exploration and production customers could result in a decreased demand for the services that we provide.
ITEM 1A. Risk Factors
We are subject to various risks and hazards due to the nature of the business activities we conduct. The risks summarized and discussed below, any of which could materially and adversely affect our business, financial condition, cash flows and results of operations and the price of our shares, are not the only risks we face. We may experience additional risks and uncertainties not currently known to us or, as a result of developments occurring in the future, conditions that we currently deem to be immaterial may also materially and adversely affect our business, financial condition, cash flows and results of operations.
Risks in this section are grouped by category. Many risks affect more than one category and the risks are not in order of significance or probability of occurrence because they have been grouped by categories.
Summary of Risk Factors:
Set forth below is a summary of the risks more fully described in this Part I, Item 1A. “Risk Factors” of this Annual Report on Form 10-K. This summary should be read in connection with the Risk Factors more fully described below and should not be relied upon as an exhaustive summary of the material risks facing our business.
•Risks Related to Our Macroeconomic-Business Environment
◦Certain of our customers’ spending may be directly, and our business may be indirectly, affected by (i) volatile or low oil, metallurgical (met) coal, or natural gas prices or iron ore prices; (ii) increasing production costs; or (iii) unsuccessful exploration results.
◦We have been adversely affected by the coronavirus pandemic.The effects of public health crises, pandemics and epidemics may materially affect how we and our customers are operating our and their businesses.
•Risks Related to Our Customers
◦Our customers and their operations are exposed to a number of unique operating risks and challenges.
◦We depend on several significant customers.
◦Our failure to retain our current customers, renew our existing customer contracts and obtain new customer contracts, or the termination of existing contracts, could adversely affect our business.
◦Adverse events in areas where we operate could negatively impact our business, and our geographic concentration could limit the number of customers seeking our services.
◦We may be adversely affected if customers reduce their accommodations outsourcing.
•Risks Related to Our Operations
◦We operate in a highly competitive industry, and if we fail to compete effectively, our business will suffer.
◦Our operations may suffer due to over-capacity of certain types of accommodations assets.assets in certain regions.
◦Increased operating costs and limited cost recovery through pricing or contract terms may constrain our ability to make a profit.
◦Employee and customer labor problems could adversely affect us.
◦A failure to maintain food safety or comply with government regulations related to food and beverages or serving alcoholic beverages may subject us to liability.
◦The majority of our major Canadian lodges are located on land subject to leases.
◦We are susceptible to seasonal earnings volatility due to adverse weather conditions in our regions of operations.
◦Failure to maintain positive relationships with the indigenousIndigenous people in the areas where we operate could adversely affect our business.
◦Development of permanent infrastructure in the areas where we locate our assets could negatively impact our business.
◦We may be subject to risks associated with the transportation, installation and installationdemobilization of mobile accommodations.
◦Our business could be negatively impacted by security threats, including cybersecurity threats and other disruptions.
◦Our business could be disrupted by any failure of our information technology systems.
◦Loss of key members of our management could adversely affect our business.
•Financial/Accounting Risks
◦Our indebtedness could restrict our operations and make us more vulnerable to adverse economic conditions.
◦Currency exchange rate fluctuations could adversely affect our U.S. dollar reported results of operations and financial position.
◦We may not have adequate insurance for potential liabilities and insurance may not cover certain liabilities.
◦The cyclical nature of our business and a severe prolonged downturn has, and could in the future, negatively affect the value of our long-lived assets and our goodwill.
◦Our inability to control the inherent risks of identifying, acquiring and integrating businesses that we may acquire could adversely affect our operations.
◦We may not have adequate insurance for potential liabilitiesOur indebtedness could restrict our operations and insurance may not cover certain liabilities.make us more vulnerable to adverse economic conditions.
•Legal and Regulatory Risks
◦We do business in Canada and Australia, whose political and regulatory environments and compliance regimes differ from those in the United States.U.S.
◦We are subject to extensive and costly environmental laws and regulations.
◦We may be exposed to certain regulatory and financial risks related to climate change.
◦An accidental release of pollutants into the environment may cause us to incur significant costschange and liabilities.other environmental, social and governance (ESG) related matters.
•Risks Related to Our Common Shares
◦The market price and trading volume of our common shares may be volatile.
◦The rightspayment of holdersdividends and repurchases of our common shares are subordinate toeach within the rights of the holdersdiscretion of our preferred shares.Board of Directors, and there is no guarantee that we will pay any dividends or repurchase common shares in the future or at levels anticipated by our shareholders.
◦We are governed by the corporate laws in British Columbia, Canada.
◦Provisions contained in our articles and applicable Canadian and British Columbia laws could discourage a take-over attempt.
◦The enforcement of civil liabilities against Civeo may be more difficult.
•Risks Related to Our Structure
◦We are subject to various Canadian, Australian and other taxes.
◦We remain subject to changes in tax law (in various jurisdictions) and other factors that could impact our effective tax rate.
◦The Canada Revenue Agency (CRA) may disagree with our conclusions on tax treatment.
◦Future potential changes to U.S. tax laws could result in Civeo being treated as a U.S. corporation for U.S. federal income tax purposes.
Risk Factors:
Risks Related to Our Macroeconomic-BusinessMacroeconomic Business Environment
Certain of our customers’ spending may be directly, and our business may be indirectly, affected by (i) volatile or low oil, metallurgical (met) coal, or natural gas prices or iron ore prices; (ii) increasing production costs; or (iii) unsuccessful exploration results.
Demand for our services is sensitive to the level of exploration, development and production activity of, and the corresponding capital spending by, oil and gas and miningnatural resources companies. Our business typically supports customer projects that are capital intensive and require several years to generate first production, with production lasting for decades. The economic analyses conducted by our customers in Canadian oil sands, Australian mining and global liquefied natural gas (LNG) investment areas have historically assumed a relatively conservative longer-term price outlook for production from such projects to determine economic viability. The oil and gas and mining industries’ willingness of natural resources companies to explore, develop and produce depends largely upon the availability of attractive resource prospects and the prevailing view of future commodity prices, and expenditures by our oil and gas and miningnatural resources customers generally lag changes in commodity prices by at least three to six months. However, with the extreme global oil demand destruction in 2020 due to the COVID-19 coronavirus (COVID-19) pandemic, our oil and gas customers in North America have changed their spending and production plans and have reduced or deferred, and may continue to reduce or defer, major expenditures.
Prices for oil, metallurgical (met)met coal, LNG, natural gasiron ore and other natural resources are subject to large fluctuations in response to changes in global supply of and demand for these commodities. For the past several years, commodity prices have remained relatively low, and continue to be volatile. Global oil prices dropped to historically low levels in April 2020 due to severely reduced global oil demand, the resulting high global crude inventory levels, uncertainty around timing and slope of worldwide economic recovery after COVID-19 related economic shut-downs and effectiveness of production cuts by major oil producing countries, such as Saudi Arabia, Russia and the U.S. Other factors beyond our control that affect commodity prices include:
•worldwide economic activity including growth in and demand for oil, coal and other natural resources, particularly from developing countries, such as China and India;
•the level of activity, spending and natural resource developments in Australia and the Canadian oil sands;Canada;
•the level of global oil and gas exploration and production and the impact of government regulation or Organization of the Petroleum Exporting Companies (OPEC)Countries Plus (OPEC+) policies that impact production levels and oil prices;
•the availability of transportation infrastructure and refining capacity for oil, natural gas, LNG and coal;
•global weather conditions, natural disasters and global health concernsconcerns;
•geopolitical events such as the COVID-19 pandemic or any future disaster or pandemic;ongoing Russia/Ukraine and Israel/Hamas conflicts;
global reduction in demand for fossil fuels due to international efforts to address climate change;•rapid technological change and the timing and extent of energy resource development, including hydraulic fracturing of horizontally drilled wells in shale discoveries and LNG;
•development, commercialization, availability and availabilityeconomics of alternative fuels; and
•government, tax and environmental regulation, including climate change legislation and clean energy policies.
In 2018,As of February 23, 2024, the Government of Alberta announced it would mandate temporary curtailments ofWest Texas Intermediate (WTI) price was $77.54 and the province’s oil production. However, monthly production limits were put on holdWestern Canadian Select (WCS) price was $58.60, resulting in December 2020 until further notice, allowing operators to produce freely at their discretion while the government monitors production. Should forecasts show storage inventories approaching maximum capacity, the government may reintroduce production limits. The curtailment initially resulted in a narrowing of the discount (WCS Differential) at which Western Canadian Select (WCS)WCS trades relative to West Texas Intermediate (WTI) in December 2018, which increased in 2019 before narrowing again in the first quarterWTI of 2020. As of February 22, 2021, the WTI price was $61.49 and the WCS price was $49.95, resulting in a WCS Differential of $11.54.$18.94. Should the price of WTI decline or the WCS discount to WTI widen further, our oil sands customers may delay or eliminate additional investments, further reduce their spending in the oil sands region or curtail or shut-down additional existing operations.
We have been adversely affected by the coronavirus pandemic.The effects of public health crises, pandemics and epidemics may materially affect how we and our customers are operating our and their businesses.
The outbreak ofPublic health crises, pandemics and epidemics, such as the COVID-19 haspandemic, have adversely impacted and continues tomay in the future adversely impact, worldwide economic activity, including the operations of natural resources industrycompanies in Canada, Australia and the U.S. The actions taken to mitigate the spread of COVID-19 and the riskworldwide demand for oil and natural gas. Other effects of infection have altered,such public health crises, pandemics and are expected to continue to alter, governmentalepidemics include significant volatility and private-sector policies and behaviors in ways that have had a significant negative effect on oil consumption, such as government-imposed or voluntary social distancing and quarantining, stay-at-home orders, health and safety considerations, reduced travel and remote work policies. We have experienced, and expect to continue to experience, some resulting disruptions and increased costs to our business as a resultdisruption of the measures we have set in place to comply with governmental regulationsglobal financial markets; continued volatility of commodity prices and customer policies related to COVID-19. In addition, with lower and volatile oil prices due to reduced global oiluncertainties around OPEC+ production; disruption of operations resulting from decreased customer demand and uncertainty around the continued economic impact of COVID-19,labor shortages; supply chain disruptions or equipment shortages; reduced capital spending by oil and gas companiescompanies; and customer demand foremployee impacts from illness, travel restrictions, including border closures, and other community response measures.
The extent to which our services has been adversely affected. The ultimate extentbusiness operations and financial results may be affected by such public health crises, pandemics and epidemics depends on various factors beyond our control, such as the duration, severity and sustained geographic impact of the impact of COVID-19 on our business, financial condition and results of operations will depend largely on future developments, including the duration and spread of the outbreak in the countries in which we operate and the related impact on the oil and gas industry,outbreak; the impact and effectiveness of governmental actions designed to prevent the spread of COVID-19contain and treat such outbreaks, including government policies and restrictions; vaccine hesitancy, vaccine mandates, and voluntary or mandatory quarantines; and the development and availability of effective treatments and vaccines, all of which are highly uncertain and cannot be predicted with certainty at this time.global response surrounding such uncertainties.
Risks Related to Our Customers
Our customers and their operations are exposed to a number of unique operating risks and challenges which could also adversely affect us.
We could be materially adversely affected by disruptions to our customers’ operations. The price of and demand for natural resources produced by our customers may impact their desire and/or ability to continue producing existing projects or start new projects. Customers may also experience unexpected problems, higher costs or delays in commencing, developing or developingproducing a project. Additionally, the willingness of natural resources companies to explore, develop and produce may be impacted by pressures to limit increases in capital spending generally and on met coal and hydrocarbons in particular, as well as by cost overruns on past and current projects, which could adversely impact demand for our services. Operating risks and challenges our customers face, which may ultimately affect their need for the accommodations and services we provide, include:
•commodity price volatility;
•unforeseen and adverse geological, geotechnical, seismic and mining conditions;
•lack of availability or failure of the required infrastructure, including sourcing sufficient water or power, necessary to maintain or to expand their operations;
•the breakdown or shortage of equipment and labor necessary to maintain their operations;
•capital project cost overruns and cost inflation;
•risks associated with the natural resources industry being subject to laws and regulations, including those governing air and greenhouse gas emissions, as well as various regulatory approvals, including a government agency failing to grant an approval or failing to renew an existing approval, or the approval or renewal not being provided by the government agency in a timely manner or the government agency granting or renewing an approval subject to materially onerous conditions;
•risks to land titles, mining titles and use thereof as a result of native title claims;
•claims by persons living in close proximity to mining projects, which may have an impact on the consents granted; and
•interruptions to the operations of our customers caused by governmental action, industrial accidents, disputes or public health emergencies.
We depend on several significant customers.
We depend on several significant customers, including customers that operate in the oil and gas and mining industries, which has been adversely impacted by the effects of the COVID-19 pandemic.natural resources industry. The loss of any one of our largest customers in any of our business segments or a sustained decrease in demand by any of such customers could result in a substantial loss of revenues and could have a material adverse effect on our results of operations. In addition, the concentration of customers in the mining and oil and gas industriesnatural resources industry may impact our overall exposure to credit risk, either positively or negatively, in that customers may be similarly affected by changes in economic and industry conditions. With the current low andand/or volatile oil and gas prices, some of our customers may face liquidity issues, which could impair their ability to pay or otherwise perform on their obligations. Furthermore, some of our customers may be highly leveraged and subject to their own operating and regulatory risks, which increases the risk that they may default on their obligations to us. For a more detailed explanation of our customers, see “Business”“Business” in Item 1 of this annual report.
Our failure to retain our current customers, renew our existing customer contracts and obtain new customer contracts, or the termination of existing contracts, could adversely affect our business.
Our success depends on our ability to retain our current customers, renew or replace our existing customer contracts and obtain new business. Our ability to do so generally depends on a variety of factors, including overall customer expenditure levels and the quality, price and responsiveness of our services, as well as our ability to market these services effectively and differentiate ourselves from our competitors. We cannot assure you that we will be able to obtain new business, renew existing customer contracts at the same or higher levels of pricing, or at all, or that our current customers will not turn to competitors, cease operations, elect to self-operate(i) utilize their own, on-site accommodations or (ii) terminate contracts with us.
Our business is contract intensive and we are party to many contracts with customers. Due to the current volatile nature of commodity price environment,prices, our customers may not renew contracts on terms favorable to us or, in some cases, at all, and we may have difficulty obtaining new business. Several contracts have clauses that allow termination upon the payment of a termination fee. As a result, our customers may choose to terminate their contracts. The likelihood that a customer may seek to terminate a contract is increased during periods of market volatility like those we are currently experiencing. Additionally, our exclusivity contracts do not include minimum room commitments, so we receive payment only if the customer utilizes our services. Finally, while we periodically review our compliance with contract terms and provisions, if customers were to dispute our contract determinations, the resolution of such disputes in a manner adverse to our interests, including customers withholding payments or modification of payment terms, could negatively affect sales and operating results.
We did not renew the land lease associated with our McClelland Lake Lodge in Alberta, Canada, which expired in June 2023, in order to support our customer’s intent to mine the land where the lodge was located. In addition, the accompanying hospitality services contract at McClelland Lake Lodge expired in July 2023; however, we continued to provide hospitality services to the customer at our other owned lodges through January 31, 2024 under a short-term take-or-pay commitment. We completed the sale of the McClelland Lake Lodge assets in January 2024. Revenues associated with the 2023 room commitments at the lodge through July 2023 were approximately C$39 million.
Customer contract cancellations, reduced customer utilization, the failure to renew a significant number of our existing contracts or the failure to obtain new business would have a material adverse effect on our business and results of operations.
Due to the significant geographic concentration of our business, adverse events in areas where we operate could negatively impact our business, and our geographic concentration could limit the number of customers seeking our services.
Because of the concentration of our business in three relatively small geographic areas: the oil sands region of Alberta, Canada, and in the coal producing, Bowen Basin region of Queensland, Australia two relatively small geographic areas,and the iron ore producing, Pilbarra region of Western Australia, we have increased exposure in these areas to political, regulatory, environmental, labor, climate or natural disasters such as forest fires or flooding, events or developments that could disproportionately impact our operations and financial results. For example, in 2011 and 2017, cyclones and resulting flooding threatened our villages in Australia. AlsoSimilarly, in 2011 and 2016, forest fires in northern Alberta impacted areas near our Canadian oil sands lodges. DueMoreover, global climate change may result in significant natural disasters occurring more frequently or with greater intensity, such as drought, wildfires, storms, sea-level rise, and flooding. Many of the areas in which we operate are very remote with limited local supplies, including availability of water, electricity or natural gas necessary to operate our geographic concentration,business, and any significant adverse events such as those discussed above could impact our ability to obtain good or developments in our operating areas may disproportionately affect our financial results.services and personnel.
In addition, a limited number of potential customers operate in the areas in which our business is concentrated,located, and occupancy at each of our lodges may be constrained by the radius which potential customers are willing to transport their workers. Our geographic concentration could limit the number of customers seeking our services, and as to any single lodge or village, we
may have few potential customers. Therefore, we are subject to volatility in occupancy in any location based on the capital spending plans of a limited number of customers, based on their changing decisions as to whether to outsource or use their own company-owned accommodations and whether other potential customers move into that lodge’s radius.
We may be adversely affected if customers reduce their accommodations outsourcing.
Our business and growth strategies depend in large part on customers outsourcing some or all of the services that we provide. Many oil and gas and miningnatural resources companies in our core markets own their own accommodations facilities, while others outsource all or part of their accommodations requirements. Customers have largely built their own accommodations in the past but will outsource for additional capacity or if they perceive that outsourcing may provide quality services at a lower overall cost or allow them to
accelerate the timing of their projects. We cannot be certain that these customer preferences will continue or that customers that have previously outsourced accommodations will not decide to perform these functions themselves or only outsource accommodations during the development or construction phases of their projects. In addition, labor unions representing customer employees and contractors have, in the past, opposed outsourcing accommodations to the extent that the unions believe that third-party accommodations negatively impact union membership and recruiting. The reversal or reduction in customer outsourcing of accommodations could negatively impact our financial results and growth prospects.
Risks Related to Our Operations
We operate in a highly competitive industry, and if we fail to compete effectively, our business will suffer.
The workforce accommodations and hospitality industry in which we operate is highly competitive. To be successful, we must provide hospitality services that meet the specific needs of our customers at competitive prices. The principal competitive factors in the markets in which we operate are service quality, and availability, price, location, technical knowledge and experience and safety performance. We compete with international and regional competitors, several of which are significantly larger than we.us. These competitors offer similar services in the geographic regions in which we operate. Many oil and gas and miningnatural resources companies in our core markets own their own accommodations facilities and outsource their service requirements, while others outsource all or part of their accommodations requirements. As a result of competition, we may be unable to continue to provide our present services, to provide such services at historical operating margins or to acquire additional business opportunities, which could have a material adverse effect on our business, financial condition, results of operations and cash flows. Reduced levels of activity in the workforce accommodation industry can intensify competition and result in lower revenue to us.
Our operations may suffer due to over-capacity of certain types of accommodations assets.assets in certain regions.
The demand for and/or pricing of rooms and accommodation services is subject to the overall availability of rooms in the marketplace.a region. If demand for our assets were to decrease, or to the extent that we and our competitors increase ourhave capacity in excess of current demand, we may encounter decreased pricing for, or utilization of, our assets and services, which could adversely impact our operations and profits. The economic disruptionFor example, we experienced a decrease in customer demand in 2020 caused by the decline in the price of and demand for oil has impacted the activityaccommodations in the Canadian oil sands and our U.S. business as a result of the economic disruption caused by COVID-19, and we have seen decreased customer demand for accommodations in those areas, and we have experienced a corresponding significant decrease in our occupancy and profitability. Continued volatility in commodity price levels, any future global health crises, inflationary pressures, actions taken by OPEC+ to adjust production levels, geopolitical events such as the ongoing Russia/Ukraine and Israel/Hamas conflicts, and regulatory implications on such prices, among other factors, could cause our Canadian oil sands and pipeline customers to reduce production, delay expansionary and maintenance spending and defer additional investments in their oil sands assets, which would cause a decrease in customer demand for our accommodations.
Increased operating costs and limited cost recovery through pricing or contract terms may constrain our ability to make a profit.
Our profitability can be adversely affected to the extent we are faced with cost increases for food, wages and other labor related expenses, insurance, fuel and utilities, especially to the extent we are unable to recover such increased costs through increases in the prices for our services, due to one or more of general economic conditions, competitive conditions or contractual provisions in our customer contracts. SubstantialFor example, substantial increases in the cost of fuel and utilities have historically resulted in cost increases in our lodges and villages. From time to time
In the last eighteen months, we have experienced a significant increase in our food costs due to global inflationary pressures. While inflation has stabilized, and while we have been able to pass some of the increased costs onto our customers, we expect to continue to experience increases in our food costs. While we believe a portion of these increases were attributablecosts from time to time due to increasing fuel prices, we believe the increases also resulted from rising global food demand.demand, other general inflationary pressures and rising supply chain issues affecting supply of goods. In addition, food
prices can fluctuate as a result of foreign exchange rates and temporary changes in supply, including as a result of incidences of wildfires or severe weather such as droughts, heavy rains and late freezes, or other climate effects. Climate and natural disaster events, such as forest fires or flooding, have the ability to impact local crop production, limiting supply and therefore having an upward pressure on food prices. For example, large swathes of farmland across the Australian states of New South Wales, Queensland and Victoria in 2022 were inundated with flood waters, damaging wheat and other crops including fruit and vegetables.
A shortage of skilled labor could also result in higher wages due to more expensive temporary hire labor resources that would increase our labor costs, which could negatively affect our profitability. For example, we have recently been impacted by increased staff costs as a result of hospitality labor shortages in Australia due to low levels of immigration into Australia and, specifically, an acute shortage of skilled labor. The reduced levels of immigration and shortage of skilled labor subsequently led to an increased reliance on more expensive temporary labor hire resources and negatively affected our profitability. Additionally, an increased proportion of temporary labor hire resources has the effect of driving up costs due to a lack of efficiency. The nature of temporary labor hire resource positions are short term, with key skills unable to be retained in our lodges and villages due to higher staff turnover.
While our multi-year contracts often provide for annual escalation in our room rates for food, labor and utility inflation, we may be unable to fully recover costs, or the recovery may be delayed, and such increases would negatively impact our profitability on contracts that do not contain such inflation protections.
Employee and customer labor problems could adversely affect us.
Our business is labor intensive requiring a significant number of employees to perform housekeeping, janitorial and food servicesservice functions at our locations or locations that we manage. As our operations grow or our occupancy increases, we require additional staff to take care of our guests at a standard we deem appropriate and to operate safely. If we are unable to hire a sufficient labor force, we maycould be required to increase wages or use temporary labor at a higher cost and reduced efficiency. In recent years, we experienced, and expect to continue to experience, a shortage of labor for certain functions, inflationary pressures on wages, and an increasingly competitive labor market. The extent and duration of the effect of these labor market challenges are subject to numerous factors, including geopolitical events such as the ongoing Russia/Ukraine and Israel/Hamas conflicts, availability of qualified persons in the markets where we and our contracted service providers operate, inflation and unemployment levels within these markets and our reputation within the labor market. Inefficient operations or higherfurther increased labor costs wouldresulting from these labor market challenges could negatively impact our profitability and could damage our reputation with our customers.
Additionally, as of December 31, 2020,2023, we were party to collective bargaining agreements covering 885798 employees in Canada and 5881,020 employees in Australia. Efforts have been made from time to time to unionize other portions of our workforce. In addition, our facilities serving oil sands development work in Northern Alberta, Canada and mining operations in Australia
house both union and non-union customer employees. We have not experienced strikes, work stoppages or other slowdowns in the past, but we cannot guarantee that we will not experience such events in the future. A prolonged strike, work stoppage or other slowdown by our employees or by the employees of our customers could cause us to experience a disruption of our operations or adversely impact our reputation, which could adversely affect our business and results of operations. Additional unionization efforts and new collective bargaining agreements also could materially increase our costs or limit our flexibility. Collective bargaining agreements in our Canadian operations have individual expiration dates, but in no case extend beyond 2023.2026. Enterprise bargaining agreements in our Australian operations cover certain employees working at our villages in Queensland, New South Wales and Western Australia, as well as certain employees working at our integrated services customer ownedcustomer-owned sites in Western Australia and South Australia. These agreements either have individual expiration dates or continue until either party seeks to have such agreement cancelled, but in no case extend beyond 2022.2024.
A failure to maintain food safety or comply with government regulations related to food and beverages or serving alcoholic beverages may subject us to liability.
Claims of illness or injury relating to food quality or food handling are common in the food service industry, and a number of these claims may exist at any given time. Because food safety issues could be experienced at the source or by food suppliers or distributors, food safety could, in part, be out of our control. Regardless of the source or cause, any report of food-borne illness or other food safety issues such as food tampering or contamination at one of our locations could adversely impact our reputation, hindering our ability to renew contracts on favorable terms or to obtain new business, and have a negative impact on our sales.revenue. Future food product recalls and health concerns associated with food contamination may also increase our raw materials costs and, from time to time, disrupt our business.
A variety of regulations at various governmental levels relating to the handling, preparation and serving of food (including, in some cases, requirements relating to the temperature of food), cleanliness of food production facilities and hygiene of food-handling personnel are enforced primarily at the local public health department level. We can give no assurances that we are in full compliance with all applicable laws and regulations at all times or that we will be able to comply with any future laws and regulations. Furthermore, legislation and regulatory attention to food safety is very high. Additional or amended regulations in this area may significantly increase the cost of compliance or expose us to liabilities.
We serve alcoholic beverages at some of our facilities, and must comply with applicable licensing laws, as well as local service laws. These laws generally prohibit serving alcoholic beverages to certain persons such as a patron who is intoxicated or a minor. If we violate these laws, we may be liable to the patron and/or to third parties for the acts of the patron. We cannot guarantee that certain patrons will not be served or that liability for their acts will not be imposed on us. There can be no assurance that additional regulation in this area would not limit our activities in the future or significantly increase the cost of regulatory compliance. We must also obtain and comply with the terms of licenses in order to sell alcoholic beverages in the jurisdictions in which we serve alcoholic beverages. If we are unable to maintain food safety or comply with government regulations related to food, beverages or alcoholic beverages, the effect could be materially adverse to our business and results of operations.
The majority of our major Canadian lodges are located on land subject to leases. If we are unable to renew a lease or obtain permits necessary to operate on such leased land, we could be materially and adversely affected.
The majority of our major Canadian lodges are located on land subject to provincial leases. Accordingly, while we own the accommodations assets, we only own a leasehold in those properties. If we are found to be in breach of a lease, we could lose the right to use the property. In addition, our leases generally have an initial term of ten years and will expire between 20222024 and 20282030 unless extended. Unless we can extend the terms of these leases before their expiration, as to which no assurance can be given, we will lose our right to operate our facilities located on these properties upon expiration of the leases. In that event, we would be required to remove our accommodations assets and remediate the site.site at our own cost, which could be material.
We did not renew an expiring land lease associated with our McClelland Lake Lodge in Alberta, Canada, which expired in June 2023, in order to support our customer’s intent to mine the land where the lodge was located. As of December 31, 2020,2023, we had an asset retirement obligation (ARO) liability related to the McClelland Lake Lodge on our balance sheet of $15.0$0.3 million. Consistent with US GAAP,U.S. generally accepted accounting principles, this liability is the estimated present value of the amount of required asset removal and site remediation costs related to the retirement of assets at these locations.this location in 2023.
As of December 31, 2023, we had other ARO liabilities on our balance sheet of $16.2 million. Should the remediation requirement be accelerated, our near term cash obligation could be significantly larger than the liability currently on our balance sheet and could negatively impact our cash flows and liquidity.
Also, in certain areas in which we operate, we are required to seek permits from local government agencies in order to build a new lodge or operate an existing lodge on leased land. A proposed regulation in a Regional Municipality of Wood Buffalo, Alberta, where we have eight facilities, would require us to seek renewal of such permits every four years; however, this proposal was abandoned in late 2019, and no update has been provided. We can provide no assurances that we will be able to renew our leases or permits upon expiration on similar terms, or at all. If we are unable to renew our leases or permits on similar terms, it may have an adverse effect on our business and results of operations.
We are susceptible to seasonal earnings volatility due to adverse weather conditions in our regions of operations.
Our operations are directly affected by seasonal differences in weather in the areas in which we operate, most notably in Canada and Australia, and, to a lesser extent, the Permian Basin.operate. A portion of our Canadian operations is conducted during the winter months when the winter freeze in remote regions is required for exploration and production activity to occur. The spring thaw in these frontier regions restricts operations in the spring months and, as a result, adversely affects our operations and our ability to provide services in the second and, to a lesser extent, third quarters.quarter. During the Australian rainy season, generally between the months of November and April, our operations in Queensland and the northern parts of Western Australia can be affected by cyclones, monsoons and resultant flooding. Severe winter weather conditions in the Permian Basin of the United States can restrict access to work areas for our customers. Furthermore,Additionally, the areas in which we operate are susceptible to wildfires, which could interruptwildfires. Finally, global climate change may result in certain of these adverse weather conditions occurring more frequently or with greater intensity.If any of these conditions occur, our operations could be interrupted and our earnings may be adversely impact our earnings.impacted.
Failure to maintain positive relationships with the indigenousIndigenous people in the areas where we operate could adversely affect our business.
A component of our business strategy is based on developing and maintaining positive relationships with the indigenousIndigenous people and communities in the areas where we operate. These relationships are important to our operations and customers who desire to work on traditional indigenousIndigenous lands. The inability to develop and maintain relationships and to be in compliance with local requirements could have an adverse effect on our business and results of operations.
Development of permanent infrastructure in the areas where we locate our assets could negatively impact our business.
We specialize in providing hospitality services for workforces in remote areas which often lack the infrastructure typically available in nearby towns and cities. If permanent towns, cities and municipal infrastructure develop, grow or otherwise become available in the oil sands region of northern Alberta, Canada, the west coast of British Columbia or regions of Australia where we locate villages,operate, then demand for our hospitality services could decrease as customer employees move to the region and choose to utilize permanent housing and food services.service.
We may be subject to risks associated with the transportation, installation and installationdemobilization of mobile accommodations.
In connection with our Canadian and U.S. businesses, weWe currently have several contracts to transport and install modular, skid-mounted accommodations and central facilities that can be quickly configured to serve a multitude of shortshort- to medium-term accommodation needs. In connection with the transportation and installation of these facilities, we may be exposed to various risks, includingincluding:
•delays in necessary approvals to install the facilities or objections to our activities or those of our customers aired by aboriginal or community interests, environment and/or neighborhood groups which may cause delays in the granting of such approvals and/or the overall progress of a project;
•challenges during installation, including problems, defects, inclement weather conditions, land contamination, cultural heritage claims, difficult site access or industrial relations issues; and
•risks related to the quality of our materials and workmanship, including warranties and defect liability obligations.
Our business could be negatively impacted by security threats, including cybersecurity threats and other disruptions.
We face various security threats, including cybersecurity threats to gain unauthorized access to sensitive information or to render data or systems unusable or hold them for ransom; threats to the safety of our employees; threats to the security of our facilities and infrastructure or third-party facilities and infrastructure; and threats from terrorist acts. Although we utilize various procedures and controls to monitor these threats and mitigate our exposure to such threats, including cybersecurity insurance, there can be no assurance that these procedures and controls will be sufficient in preventing security threats from materializing. If any of these events were to materialize, they could lead to losses of sensitive information, critical infrastructure, personnel or capabilities essential to our operations and could have a material adverse effect on our reputation, competitive position, financial position, results of operations or cash flows. In addition, such events could result in litigation, regulatory action and potential liability, including liability under laws that protect the privacy of personal information, as well as the costs and operational consequences of implementing further data protection measures.
Cybersecurity attacks in particular are evolvingdevelop and evolve rapidly, including from emerging technologies, such as advanced forms of artificial intelligence. Such attacks include, but are not limited to, malicious software, attempts to gain unauthorized access to data, ransomware attacks and other electronic security breaches that could lead to disruptions in critical systems, unauthorized release of or denial of access to confidential or otherwise protected information and corruption of data. In 2018,We have experienced, and expect to continue to confront, efforts by hackers and other third parties to gain unauthorized access or deny access to, or otherwise disrupt, our information systems and networks. While we have not experienced a minor data security breach resulting from unauthorized access to our systems, which had no material impactcybersecurity incident in the last three years, a material cybersecurity incident could have a material adverse effect on our operations; however, there is no assurance thatbusiness, financial condition, results of operations or liquidity.
Our business could be disrupted by any failure of our information systems.
We depend on our information systems to actively manage our accommodation services, including with respect to administrative functions, financial and operational data, ordering and point of sale processing, to enhance our ability to optimize facility utilization, occupancy, costs of goods sold and average daily rate. The failure of our information systems to perform as anticipated could damage our reputation with our customers, disrupt our business or result in, among other things, decreased revenue and increased costs. Any such impacts will not be material infailure could harm our business, results of operations and financial condition. In addition, the future.delay or failure to implement information system upgrades and new systems effectively could disrupt our business, distract management’s focus and attention from business operations and growth initiatives, and increase our implementation
.
Loss of key members of our management could adversely affect our business.
We depend on the continued employment and performance of key members of our management. If any of our key managers resign or become unable to continue in their present roles and are not adequately replaced, our business operations could be materially adversely affected. We do not maintain “key man” life insurance for any of our officers.
Financial/Accounting Risks
Our indebtedness could restrict our operations and make us more vulnerable to adverse economic conditions.
We currently have a substantial amount of indebtedness. As of December 31, 2020, we had approximately $187.5 million outstanding under the term loan portion of our credit agreement (as amended from time to time, the Amended Credit Agreement), $63.6 million outstanding under the revolving portion of the Amended Credit Agreement, $4.5 million of outstanding letters of credit and capacity to borrow an additional $99.3 million under the revolving portion of the Amended Credit Agreement. If market or other economic conditions remain depressed or further deteriorate, our borrowing capacity may be further reduced.
Our Amended Credit Agreement contains, and any future indebtedness we incur may contain, a number of restrictive covenants that will impose significant operating and financial restrictions on us and may limit our ability to, among other things, borrow funds, dispose of assets, pay dividends and make certain investments. In addition, these covenants also may limit our ability to obtain future financings, make needed capital expenditures, withstand a continued downturn in our business or a downturn in the economy in general or otherwise conduct necessary corporate activities. Our ability to comply with these covenants may be affected by events beyond our control. Declines in commodity prices, or a prolonged period of commodity prices at depressed levels, could eventually result in our failing to meet one or more of the financial covenants under the Amended Credit Agreement, which could require us to refinance or amend such obligations resulting in the payment of consent fees or higher interest rates, or require us to raise additional capital at an inopportune time or on terms not favorable to us.
A failure to comply with these covenants, ratios or tests could also result in an event of default. A default under the Amended Credit Agreement, if not cured or waived, could result in acceleration of all indebtedness outstanding thereunder. The accelerated debt would become immediately due and payable. If that should occur, we may be unable to pay all such debt or to borrow sufficient funds to refinance it. Even if new financing were then available, it may not be on terms that are acceptable to us. In addition, in the event of an event of default under the Amended Credit Agreement, the lenders could foreclose on the collateral securing the credit facility and require repayment of all borrowings outstanding. If the amounts outstanding under the credit facility or any of our other indebtedness were to be accelerated, our assets may not be sufficient to repay in full the money owed to the lenders or to our other debt holders. Moreover, any new indebtedness we incur may impose financial restrictions and other covenants on us that may be more restrictive than our existing debt agreements.
Our ability to service our debt, including repaying outstanding borrowings under our Amended Credit Agreement at maturity, will depend upon, among other things, our future financial and operating performance, which will be affected by prevailing economic conditions and financial, business, regulatory and other factors, some of which are beyond our control. If our business does not generate sufficient cash flows from operations to enable us to meet our obligations under our indebtedness, we will be forced to take actions such as reducing or delaying business activities, acquisitions, investments and/or capital expenditures, selling assets, restructuring or refinancing our indebtedness or seeking additional equity capital. We may not be able to effect any of these remedies on satisfactory terms or at all, which could have a material adverse effect on our business, financial condition, results of operations and cash flows.
Currency exchange rate fluctuations could adversely affect our U.S. dollar reported results of operations and financial position.
Our reporting currency is the U.S. dollar, and we are exposed to currency exchange risk primarily between the U.S. dollar and the Canadian and Australian dollars. For the year ended December 31, 2020, 95%2023, 98% of our revenues originated from subsidiaries outside of the U.S. and were denominated in either the Canadian dollar or the Australian dollar. As a result, a material decrease in the value of these currencies relative to the U.S. dollar has had, and may have in the future, a negative impact on our reported revenues, net income, financial condition and cash flows. Any currency controls implemented by local monetary authorities in countries where we currently operate could also adversely affect our business, financial condition and results of operations. We may attempt to limit the risks of currency fluctuation where possible by entering into financial instruments to protect against foreign currency exposure, but, to date, we have not entered into any foreign currency financial
instruments. Our efforts to limit exchange risks may be unsuccessful, thereby exposing us to foreign currency fluctuations that could cause our results of operations, financial condition and cash flows to deteriorate.
We may not have adequate insurance for potential liabilities and insurance may not cover certain liabilities.
Our operations are subject to many hazards. In the ordinary course of business, we become the subject of various claims, lawsuits and administrative proceedings seeking damages or other remedies concerning our commercial operations, products, employees and other matters, including occasional claims by individuals alleging exposure to hazardous materials as a result of our products or operations. Some of these claims relate to the activities of businesses that we have acquired, even though these activities may have occurred prior to our acquisition of such businesses. We maintain insurance to cover many of our potential losses, including cyber risk insurance, and we are subject to various self-retentions and deductibles under our insurance policies. It is possible, however, that a judgment could be rendered against us in cases in which we could be uninsured and beyond the amounts that we currently have reserved or anticipate incurring for such matters. Even a partially uninsured or underinsured claim, if successful and of significant size, could have a material adverse effect on our results of operations or consolidated financial position. In addition, we are insured under the insurance policies of Oil States International, Inc. (Oil States) for occurrences prior to the completion of our spin-off from Oil States in May 2014 (the Spin-Off). The specifications and insured limits under those policies, however, may be insufficient for such claims. We also face other risks related to our insurance coverage, including (i) we may not be able to continue to obtain insurance on commercially reasonable terms; (ii) the counterparties to our insurance contracts may pose credit risks; (iii) we may incur losses from interruption of our business that exceed our insurance coverage; and (iv) we may not be able to procure insurance for certain risks due to various factors including insurance market constraints.
The cyclical nature of our business and a severe prolonged downturn has, and could in the future, negatively affect the value of our long-lived assets and our goodwill.
We recorded impairments of our long-lived assets of $50.5$1.4 million, $6.2$5.7 million and $28.7$7.9 million in 2020, 20192023, 2022 and 2018, respectively. We also recorded goodwill impairments of $93.6 million and $19.9 million in 2020 and 2019,2021, respectively. As of December 31, 2020,2023, goodwill at our Australian reporting unit represented 1% of total assets, or $8.7$7.7 million.
Factors that may cause us to recognize further impairment losses on our long-lived assets or on the goodwill at our Australian reporting unit include, among other things, extended periods of limited or no activity by our customers at our lodges or villages, increased or unanticipated competition, and downward forecast revisions or restructuring plans or if certain of our customers do not reach positive final investment decisions on projects with respect to which we have been awarded contracts to provide related accommodation, which may cause those customers to terminate the contracts.
Our inability to control the inherent risks of identifying, acquiring and integrating businesses that we may acquire, including any related increases in debt or issuances of equity securities, could adversely affect our operations.
Acquisitions have been, and our management believes acquisitions will continue to be, a key element of our growth strategy. We may not be able to identify and acquire acceptable acquisition candidates on favorable terms in the future. We may be required to incur substantial indebtedness to finance future acquisitions and also may issue equity securities in connection with such acquisitions. Such additional debt service requirements could impose a significant burden on our results of operations and financial condition. The issuance of additional equity securities could result in significant dilution to shareholders. In addition, overpayment of an acquisition could cause potential impairments which could affect our results of operations.
We expect to gain certain business, financial and strategic advantages as a result of business combinations we undertake, including synergies and operating efficiencies. Our forward-looking statements assume that we will successfully integrate our business acquisitions and realize these intended benefits. The success of any acquisitions we make depends, in large part, on our ability to realize the anticipated benefits, including operating synergies from combining our businesses, which were previously operated independently, and retaining and integrating key employees, vendors and customers from the acquired businesses. An inability to realize expected strategic advantages as a result of the acquisition would negatively affect the anticipated benefits of the acquisition.
Additionally, an acquisition may bring us into businesses we have not previously conducted or geographies in which we have not previously operated and expose us to additional business risks that are different from those we have previously experienced. Our future success depends, in part, upon our ability to manage this expanded business, which will pose substantial challenges for our management, including challenges related to the management and monitoring of new operations and associated increased costs and complexity. If we fail to manage any of these risks successfully, our business could be harmed. Our capitalization and results of operations may change significantly following an acquisition, and our shareholders may not have the opportunity to evaluate the economic, financial and other relevant information that we will consider in evaluating future acquisitions.
WeOur indebtedness could restrict our operations and make us more vulnerable to adverse economic conditions.
As of December 31, 2023, we had approximately $65.6 million outstanding under the revolving portion of our Syndicated Facility Agreement (Credit Agreement), $1.4 million of outstanding letters of credit and an additional $133.1 million in remaining capacity to borrow under the revolving portion of the Credit Agreement. If market or other economic conditions remain depressed or further deteriorate, our borrowing capacity may not have adequate insurance for potential liabilities and insurance may not cover certain liabilities.be reduced.
Our operationsCredit Agreement contains, and any future indebtedness we incur may contain, a number of restrictive covenants that impose significant operating and financial restrictions on us and may limit our ability to, among other things, borrow funds, dispose of assets, pay dividends and make certain investments. In addition, these covenants also may limit our ability to obtain future financings, make needed capital expenditures, withstand a continued downturn in our business or a downturn in the economy in general or otherwise conduct necessary corporate activities. Our ability to comply with these covenants may be affected by events beyond our control. Declines in commodity prices, or a prolonged period of commodity prices at depressed levels, could eventually result in our failing to meet one or more of the financial covenants under the Credit Agreement, which could require us to refinance or amend such obligations resulting in the payment of consent fees or higher interest rates, or require us to raise additional capital at an inopportune time or on terms not favorable to us.
A failure to comply with these covenants, ratios or tests could also result in an event of default. A default under the Credit Agreement, if not cured or waived, could result in acceleration of all indebtedness outstanding thereunder. The accelerated debt would become immediately due and payable. If that should occur, we may be unable to pay all such debt or to borrow sufficient funds to refinance it. Even if new financing were then available, it may not be on terms that are subjectacceptable to many hazards.us. In addition, in the ordinary courseevent of business,an event of default under the Credit Agreement, the lenders could foreclose on the collateral securing the credit facility and require repayment of all borrowings outstanding. If the amounts outstanding under the credit facility or any of our other indebtedness were to be accelerated, our assets may not be sufficient to repay in full the money owed to the lenders or to our other debt holders. Moreover, any new indebtedness we become the subject of various claims, lawsuits and administrative proceedings seeking damages or other remedies concerning our commercial operations, products, employeesincur may impose financial restrictions and other matters,covenants on us that may be more restrictive than our existing debt agreements.
Our ability to service our debt, including occasional claimsrepaying outstanding borrowings under our Credit Agreement at maturity, will depend upon, among other things, our future financial and operating performance, which will be affected by individuals alleging exposureprevailing economic conditions and financial, business, regulatory and other factors, some of which are beyond our control. If our business does not generate sufficient cash flows from operations to hazardous materialsenable us to meet our obligations under our indebtedness, we will be forced to take actions such as a result ofreducing or delaying business activities, including dividend payments and share repurchases,
acquisitions, investments and/or capital expenditures, selling assets, restructuring or refinancing our productsindebtedness or operations. Someseeking additional equity capital. We may not be able to effect any of these claims relate to the activities of businesses that we have acquired, even though these activities may have occurred prior to our acquisition of such businesses. We maintain insurance to cover many of our potential losses, including cyber risk insurance, and we are subject to various self-retentions and deductibles under our insurance policies. It is possible, however, that a judgment could be rendered against us in cases inremedies on satisfactory terms or at all, which we could be uninsured and beyond the amounts that we currently have reserved or anticipate incurring for such matters. Even a partially uninsured or underinsured claim, if successful and of significant size, could have a material adverse effect on our business, financial condition, results of operations or consolidated financial position. In addition, we are insured under the insurance policies of Oil States International, Inc. (Oil States) for occurrences prior to the completion of our spin-off from Oil States in May 2014 (the Spin-Off). The specifications and insured limits under those policies, however, may be insufficient for such claims. We also face other risks related to our insurance coverage, including (1) we may not be able to continue to obtain insurance on commercially reasonable terms; (2) the counterparties to our insurance contracts may pose credit risks; and (3) we may incur losses from interruption of our business that exceed our insurance coverage
Legal and Regulatory Risks
We do business in Canada and Australia, whose political and regulatory environments and compliance regimes differ from those in the United States.U.S.
A significant portion of our revenue is attributable to operations in Canada and Australia. These activities accounted for 95%98% of our consolidated revenue in the year ended December 31, 2020.2023. Risks associated with our operations in Canada and Australia include, but are not limited to, (1)(i) different taxing regimes; (2)(ii) changing political conditions at the federal, provincial or state level; (3)(iii) changing international and U.S. monetary policies; and (4)(iv) regional economic downturns.
The regulatory regimes in these countries are substantially different than those in the United States,U.S. and may be unfamiliar to U.S. investors. Violations of non-U.S. laws could result in monetary and criminal penalties against us or our subsidiaries and could damage our reputation and, therefore, our ability to do business.
We are subject to extensive and costly environmental laws and regulations that may require us to take actions that will adversely affect our results of operations.
All of our operations are significantly affected by stringent and complex foreign, federal, provincial, state and local laws and regulations governing the discharge of substances into the environment or otherwise relating to environmental protection. We could be exposed to liabilities for cleanup costs, natural resource damages and other damages as a result of our conduct that was lawful at the time it occurred or the conduct of, or conditions caused by, prior operators or other third-parties. There is inherent risk of environmental costs and liabilities in our business as a result of historical industry operations and waste disposal practices, which include air emissions and waste water discharges as well as our handling of petroleum hydrocarbons related to our operations. Certain environmental statutes impose joint and several strict liability for these costs. For example, an accidental release by us in the performance of services at one of our or our customers’ sites could subject us to substantial liabilities arising from environmental cleanup, restoration costs and natural resource damages, claims made by neighboring landowners and other third parties for personal injury and property damage and fines or penalties for related violations of environmental laws or regulations. We may not be able to recover some or any of these costs from insurance.
Environmental laws and regulations are subject to change in the future, possibly resulting in more stringent requirements. The implementation of new laws and regulations could result in materially increased costs, stricter standards and enforcement, increased reporting obligations, larger fines and liability and increased capital expenditures and operating costs, particularly for our customers, and could have an adverse effect on our business or demand for our services. See Item 1. “Business - Government Regulation” of this annual report for a more detailed description of our risks associated with environmental laws and regulations. It should also be noted that scientists have concluded that increasing concentrations of GHGsgreenhouse gases (GHG) in the earth’s atmosphere may produce climate changes that have significant physical effects, such as increased frequency and severity of storms, droughts, and floods and other climatic events.
Any failure by us to comply with applicable environmental laws and regulations may result in governmental authorities taking actions against our business that could adversely impact our business and results of operations, including the issuance of administrative, civil and criminal penalties; denial or revocation of permits or other authorizations; reduction or cessation of operations; and performance of site investigatory, remedial or other corrective actions.
We may be exposed to certain regulatory and financial risks related to climate change.change and other ESG-related matters.
Climate change isand other ESG-related matters are receiving increasing attention from the media, scientists and legislators alike, which has resulted in legislative, regulatory and other initiatives, including international agreements, to reduce greenhouse gas emissions, such as carbon dioxide and methane.methane, and proposed regulations to increase climate change reporting obligations. Significant focus is being made on companies that are active producers of fossil fuels, or companies which serve such producers.
Efforts have been made and continue to be made in the international community toward the adoption of international treaties or protocols that would address global climate change issues and impose reductions of hydrocarbon-based fuels, including plans developed in connection with the Paris climate conference in December 2015 and the Katowice climate conference in December 2018.fuels. There are a number of legislative and regulatory proposals to address greenhouse gas emissions, including increased fuel efficiency standards, carbon taxes or cap and trade systems, restrictive permitting, and incentives for renewable energy, which are in various phases of discussion or implementation. Moreover, such legislation, regulations and proposals are subject to frequent
change by regulatory authorities, including in connection with the change in the U.S. federal administration in January 2021.authorities. The outcome of Canadian, Australian and U.S. federal, regional, provincial and state actions to address global climate change could result in a variety of regulatory programs including potential new regulations, additional charges to fund energy efficiency activities, or other regulatory actions. These actions could both (1)(i) directly impact us due to increased costs associated with our operations, and (2)(ii) indirectly impact us due to increased costs of and/or reduced demand for our customers' operations, and resulting reduced demand for our services.
Any adoption of these or similar proposals by Canadian, Australian or U.S. federal, regional, provincial, state or statelocal governments mandating a substantial reduction in greenhouse gas emissions could have far-reaching and significant impacts on the energy industry, including negatively impacting the price of oil relative to other energy sources, reducing demand for hydrocarbons and other minerals or limiting drilling or mining in the areas in which we operate. Although it is not possible at
this time to predict how legislation or new regulations that may be adopted to address greenhouse gas emissions would impact our business, any such future laws and regulations could result in increased compliance costs or additional operating restrictions, and could have a material adverse effect on our business or demand for our services.
In addition, there have also been efforts in recent years to influence the investment community, including investment advisors and certain sovereign wealth, pension and endowment funds promoting divestment of fossil fuel equities and pressuring lenders to limit funding to companies engaged in the extraction of fossil fuel reserves. Such environmental activism and initiatives aimed at limiting climate change and reducing air pollution could interfere with our business activities, operations and ability to access capital. capital and assess acquisitions. Furthermore, members of the investment community, as well as political advocacy groups, are increasing their focus on ESG practices and disclosures by public companies, and concerns over climate change have resulted in, and are expected to continue to result in, the adoption of regulatory requirements for climate-related disclosures. As a result, we may continue to face increasing pressure regarding our ESG disclosures and practices, and mandatory reporting obligations could increase our compliance burden and costs. We publish an annual ESG Report, which outlines our progress and ongoing efforts to advance our ESG initiatives. Our disclosures on these matters rely on management’s expectations as of the date the statements are first made, as well as standards for measuring progress that are still in development, and may change or fail to be realized. These expectations and standards may continue to evolve. If our ESG disclosures and practices do not meet regulatory, investor or other stakeholder expectations and standards, which continue to evolve, it could have a material adverse effect on our business or demand for our services. At the same time, some stakeholders and regulators have increasingly expressed or pursued opposing views, legislation, and investment expectations with respect to ESG, including the enactment or proposal of “anti-ESG” legislation or policies. By publishing our annual ESG Report, our business may also face increased scrutiny related to ESG activities and be unable to satisfy all stakeholders. Additionally, members of the investment community may screen our ESG disclosures and performance before investing in our common shares.
See Item 1. “Business“Business - Government Regulation” of this annual report for a more detailed description of our climate-change related risks.
An accidental release of pollutants into the environment may cause us to incur significant costs and liabilities.
There is inherent risk of environmental costs and liabilities in our business as a result of (1) our handling of petroleum hydrocarbons, (2) air emissions and waste water discharges related to our operations, and (3) historical industry operations and waste disposal practices. Certain environmental statutes impose joint and several strict liability for these costs. For example, an accidental release by us in the performance of services at one of our or our customers’ sites could subject us to substantial liabilities arising from environmental cleanup, restoration costs and natural resource damages, claims made by neighboring landowners and other third parties for personal injury and property damage and fines or penalties for related violations of environmental laws or regulations. We may not be able to recover some or any of these costs from insurance.
Risks Related to Our Common Shares
The market price and trading volume of our common shares may be volatile.
On November 19, 2020, we effected the Reverse Share Split, where each twelve issued and outstanding common shares were converted into one common share. Our common shares began trading on a reverse share split-adjusted basis on November 19, 2020. All common share and per common share data included in this annual report have been retroactively adjusted to reflect the Reverse Share Split.
The market price of our common shares has historically experienced and may continue to experience volatility. For example, during 2019,2023, the market price of our common shares adjusted to reflect the Reverse Share Split, ranged from a low of $9.01$17.87 per share to a high of $34.20 per share. During 2020, the market price of our common shares, adjusted to reflect the Reverse Share Split, ranged from a low of $4.08 per share to a high of $18.48$36.88 per share. The market price of our common shares may be influenced by many factors, some of which are beyond our control, including those described above and the following:
•changes in financial estimates by analysts and our inability to meet those financial estimates;
•strategic actions by us or our competitors;
•announcements by us or our competitors of significant contracts, acquisitions, joint marketing relationships, joint ventures or capital commitments;
•variations in our quarterly operating results and those of our competitors;
•general economic and stock market conditions;
•risks related to our business and our industry, including those discussed above;
•changes in conditions or trends in our industry, markets or customers;
•geopolitical events or terrorist acts;acts, including cybersecurity threats;
•trading volume of our common shares;
•the majority of our common shares being held by a few shareholders;
•our policy on share repurchases and dividend payments;
•future sales of our common shares or other securities by us, members of our management team or our existing shareholders; and
•investor perceptions of the investment opportunity associated with our industry or common shares relative to other investment alternatives.
These broad market and industry factors may materially reduce the market price of our common shares, regardless of our operating performance. In addition, price volatility may be greater if the public float andour average daily trading volume of our common shares is low.on the New York Stock Exchange has historically been low, which may result in greater price volatility.
In addition, in recent years the stock market has experienced substantial price and volume fluctuations. This volatility has had a significant effect on the market prices of securities issued by many companies for reasons potentially unrelated to their operating performance. For example, our share price may experience substantial volatility due to uncertainty regarding commodity prices. These market fluctuations, regardless of the cause, may materially and adversely affect our share price, regardless of our operating results. Price volatility may cause the average price at which we repurchase our common shares (see Note 17 – Share Repurchase Programs and Dividends for a discussion of repurchases of our common shares) in a given period to exceed the share price at a given point in time. In addition, stock market volatility may impact our ability to access the capital markets in the future on acceptable terms or at all. Furthermore, the trading market for our common shares is influenced by the research and reports that industry or securities analysts publish about us or our business. If one or more of these analysts cease coverage of
our company or fail to publish reports on us regularly, we could lose visibility in the financial markets, which in turn could cause our share price or trading volume to decline.
The rightspayment of holdersdividends and repurchases of our common shares are subordinate toeach within the rights of the holdersdiscretion of our preferred shares.Board of Directors, and there is no guarantee that we will pay any dividends or repurchase common shares in the future or at levels anticipated by our shareholders.
The holdersamount and timing of all future payments of dividends or repurchases of common shares pursuant to our share repurchase program, if any, are each subject to the discretion of the preferred shares issued inBoard of Directors (Board) and will depend upon business conditions, results of operations, financial condition and other factors. Our Board may, without advance notice, discontinue the Noralta Acquisition have rights and preferences superior to thosepayment of the holders ofdividends or suspend or terminate our share repurchase program. There can be no assurance that we will make dividend payments or repurchase our common shares includingin the rightfuture. The payment of dividends on our common shares or repurchase of shares under our share repurchase program could diminish our cash reserves, which may impact our ability to receive a 2% annualfinance future growth and to pursue possible future strategic growth projects. In addition, any elimination of, or downward revision in, our dividend paid quarterly in cashpolicy or at our option, by increasingshare repurchase program could have an adverse effect on the preferred shares’ liquidation preference, or any combination thereof and the right to receive a liquidation preference prior to any distribution of our assets to the holdersmarket price of our common shares. In addition, holdersWhile the U.S. has imposed an excise tax on U.S. domestic corporations repurchasing stock, our share repurchase program is not currently subject to this tax. A similar 2% tax has been imposed in Canada, effective January 1, 2024, which applies to us and may impact the tax efficiency of the preferred shares may convert their shares into common shares at an initial conversion price of $39.60 per commonour share which may not be the fair market value of such shares at the time of conversion.repurchase program.
We are governed by the corporate laws in British Columbia, Canada which in some cases have a different effect on shareholders than the corporate laws in Delaware, United States.U.S.
There are material differences between the Business Corporations Act (British Columbia) (BCBCA) as compared to the Delaware General Corporation Law (DGCL). For example, someSome of these material differences include the following: (a)(i) for material corporate transactions (such as amalgamations, arrangements, the sale of all or substantially all of our undertaking, and other extraordinary corporate transactions), the BCBCA, subject to the provisions of our Articles,articles, generally requires two-thirds majority vote by shareholders, whereas DGCL generally only requires a majority vote of shareholders for similar material corporate transactions; and (b)(ii) under the BCBCA, a holder of 5% or more of our common shares can requisition a general meeting of shareholders for the purpose of transacting any business that may be transacted at a general meeting, whereas the DGCL does not give this right. We cannot predict if investors will find our common shares less attractive because of these material differences. If some investors find our common shares less attractive as a result, there may be a less active trading market for our common shares and our share price may be more volatile.
Provisions contained in our articles and applicable Canadian and British Columbia laws could discourage a take-over attempt, which may reduce or eliminate the likelihood of a change of control transaction and, therefore, the ability of our shareholders to sell their shares for a premium.
Provisions contained in our articles provide for a classified board of directors,Board, limitations on the removal of directors, limitations on shareholder proposals at meetings of shareholders and limitations on shareholder action by written consent, which could make it more difficult for a third-party to acquire control of us. Our articles, subject to the corporate law of British Columbia, also authorize our board of directorsBoard to issue series of preferred shares without shareholder approval. If our board of directorsBoard elects to issue preferred
shares, it could increase the difficulty for a third-party to acquire us, which may reduce or eliminate our shareholders’ ability to sell their common shares at a premium. In addition, in Canada, we may become subject to applicable securities laws, including National Instrument 62-104 Take-Over Bids and Issuer Bids of the Canadian Securities Administrators, which provide a heightened threshold for shareholder acceptance of third-party acquisition offers and could discourage take-over attempts that could result in a premium over the market price for our common shares.
As a British Columbia company, we may be subject to additional Canadian laws and regulations. The application of additional Canadian laws and regulations could make it more difficult for third parties to acquire control of us. For example, such laws and regulations may, depending on the circumstances, result in regulatory reviews of and may require regulatory approval for any proposed take-over attempts.
Any of the foregoing could prevent or delay a change of control and may deprive or limit strategic opportunities for our shareholders to sell their common shares and/or affect the market price of our common shares.
The enforcement of civil liabilities against Civeo may be more difficult.
Civeo is a British Columbia company and a substantial portion of our assets are located outside the U.S. As a result, investors could experience more difficulty enforcing judgments obtained against us in U.S. courts than would be the case for U.S. judgments obtained against a U.S. company. In addition, some claims may be more difficult to bring against Civeo in Canadian courts than it would be to bring similar claims against a U.S. company in a U.S. court.
Risks Related to Our Structure
We are subject to various Canadian, Australian and other taxes.
Our effective tax rates (including our Canadian and Australian tax rate) are dependent on a variety of factors, many of which are beyond our ability to control, such as changes in the rate of economic growth in Canada,jurisdictions in which we operate, currency exchange rate fluctuations (especially between Canadian and U.S. dollars and Australian and U.S. dollars), and significant changes in trade, monetary or fiscal policies of Canada and Australia, including changes in interest rates, withholding taxes, tax treaties and federal and provincial tax rates generally. The impact of these factors, individually and in the aggregate, is difficult to predict, in part because the occurrence of any number of the events or circumstances described in such factors may be (and, in fact, often seem to be) interrelated, and the impact to us of the occurrence of any one of these events or circumstances could be compounded or, alternatively, reduced, offset, or more than offset, by the occurrence of one or more of the other events or circumstances described in such factors.
Canada’s tax rules under the Income Tax Act (Canada) (the Canadian Tax Act) allow for favorable tax treatment insofar asrelated to the repatriation of certain dividends from foreign affiliates. If it becomes necessary or desirable to repatriate earnings from subsidiaries, repatriating earnings could, in certain circumstances, give rise to the imposition of potentially significant withholding taxes by the jurisdictions in which such amounts were earned, without our receiving the benefit of any offsetting tax credits, which could adversely impact our effective tax rate and cash flows. These tax rules are complicated and could change over time. Any such changes could have a material impact on our overall tax rate.
Canada has also introduced tax rules governing “foreign affiliate dumping” in the Canadian Tax Act that can have adverse tax consequences in respect of non-Canadian business activities and investments for Canadian corporations that are controlled by non-Canadian corporations. These rules would have a negative impact on us to the extent that we became controlled by a non-Canadian resident corporation.
We remain subject to changes in tax law (in various jurisdictions) and other factors that could impact our effective tax rate.
The tax laws of Canada, Australia and the U.S. could change in the future, and such changes could cause a material change in our effective corporate tax rate. As a result, our realized effective tax rate may be materially different from our current expectation. Our provision for income taxes will be based on certain estimates and assumptions made by management in consultation with our tax and other advisors. Our consolidated income tax rate will be affected by the amount of net income earned in Canada and our other operating jurisdictions, the availability of benefits under tax treaties, and the rates of taxes payable in respect of that income. We will enter into many transactions and arrangements in the ordinary course of business in respect of which the tax treatment is not entirely certain. We will therefore make estimates and judgments based on our knowledge and understanding of applicable tax laws and tax treaties, and the application of those tax laws and tax treaties to our business, in determining our consolidated tax provision. The final outcome of any audits by taxation authorities may differ from
the estimates and assumptions we may use in determining our consolidated tax provisions and accruals. This could result in a material adverse effect on our consolidated income tax provision, financial condition and the net income for the period in which such determinations are made.
The U.S. Congress, government agencies in non-U.S. jurisdictions where we and our affiliates do business, and the Organization for Economic Co-operation and Development (the “OECD”) have recently focused on issues related to the taxation of multinational corporations. OneFor example, is found in the areaOECD has proposed a two-pillar plan to reform international taxation, with proposals to ensure a fairer distribution of “base erosionprofits among countries and profit shifting”, where profits are claimed to be earned forimpose a floor on tax purposes in low-tax jurisdictions, or payments are made between affiliates fromcompetition through the introduction of a jurisdiction with high tax rates to a jurisdiction with lower tax rates.global minimum tax. As a result, the tax laws in the U.S. and other countries in which we and our affiliates do business could change on a prospective or retroactive basis (or both), and any such changes could materially adversely affect us.
The Canada Revenue Agency (CRA) may disagree with our conclusions on tax treatment, and the CRA has not provided (and we have not requested), a ruling on the Canadian tax aspects of our redomestication.
We completed our redomestication from Delaware to British Columbia, Canada in 2015 (the Redomicile Transaction). We do not believe that the Redomicile Transaction resulted in any material Canadian federal income tax liability to us; however, the CRA did not provide (and we did not request) a ruling on the Canadian tax aspects of the Redomicile Transaction, and there can be no assurance that the CRA will agree with our interpretation of the tax aspects of the Redomicile Transaction or any related matters associated therewith. If the CRA were to disagree with our views about the tax implications of the Redomicile Transaction, it could take the position that material Canadian federal income tax liabilities or amounts on account thereof are payable by us as a result of the Redomicile Transaction, in which case, we expect that we would contest such assessment. To contest such assessment, we would be required to remit cash equal to half of the amount in dispute, or provide security acceptable to the CRA, to prevent the CRA from seeking enforcement actions pending the dispute of such assessment. If we were unsuccessful in disputing the assessment, the implications could be materially adverse to us. The CRA has not provided (and we have not requested) a ruling on the Canadian tax aspects of the Redomicile Transaction. There can be no assurance that the CRA will agree with our interpretation of the tax aspects of the Redomicile Transaction or any related matters associated therewith.
Future potential changes to U.S. tax laws could result in Civeo being treated as a U.S. corporation for U.S. federal income tax purposes.
Although as noted above, we believe that we are treatedhave historically been regarded as a foreign corporation for U.S. federal income tax purposes, changes to Section 7874 of the Internal Revenue Code or the U.S. Treasury regulations promulgated thereunder, or official interpretations thereof, could adversely affect Civeo’s status as a foreign corporation for U.S. federal income tax purposes. For example, members of Congress from time to time have proposed changes to the Internal Revenue Code, and the U.S. Treasury has taken and may continue to take regulatory action, in connection with so-called inversion transactions. The timing and substance of any such change in law or regulatory action is uncertain. Any such change of law or regulatory action could adversely impact the treatment of Civeo as a foreign corporation for U.S. federal income tax purposes and could adversely impact its tax position and financial position and results in a material manner. The precise scope and application of any legislative or regulatory proposals will not be clear until they are actually issued, and, accordingly, until such legislation or regulations are issued and fully understood, we cannot be certain as to their potential impact. Any such changes could apply retroactively to a date prior to the date of the Redomicile Transaction. If Civeo were to be treated as a U.S. corporation for U.S. federal income tax purposes, it could be subject to substantially greater U.S. federal income tax liability.
ITEM 1B. Unresolved Staff Comments
None.
ITEM 1C. Cybersecurity
Risk Management and Strategy
We recognize the importance of developing, implementing and maintaining robust cybersecurity measures to safeguard our information systems and protect the confidentiality, integrity and availability of our data. Our processes for assessing, identifying, and managing material risks from cybersecurity threats have been integrated into our overall risk management system and processes. Cybersecurity events are collected, evaluated and, when appropriate, escalated to the Chief Information Security Officer (CISO) for impact analysis utilizing the cybersecurity risk management policy.
Cybersecurity risks are monitored and evaluated by management through an internal compliance program with oversight by internal audit. We engage a variety of cybersecurity partners to perform penetration testing and quarterly audits on our cybersecurity profile. These partnerships enable us to leverage specialized knowledge and insights, and are meant to help our cybersecurity strategies and processes in remaining risk appropriate. In order to promote a company-wide culture of cybersecurity risk management, management has also implemented a variety of required programs to both test and train our employees on cybersecurity fundamentals, including both annual and ongoing information security awareness training.
Our cybersecurity policies and procedures encompass data privacy, incident response, information security and risks from our use of third-party vendors. In order to help develop these policies and procedures, we monitor the privacy and cybersecurity laws, regulations and guidance applicable to us in the regions where we do business, as well as proposed privacy and cybersecurity laws, regulations, guidance and emerging risks.
We also have conducted a cyber breach simulation exercise with the assistance of a third party cybersecurity consultant. The exercise focused on incident management and communication processes. Company business functions, executive management and members of the Board participated. The goal was to identify opportunities for greater efficiency, coordination, and alignment.
We face risks from various security threats, including cybersecurity threats to gain unauthorized access to sensitive information or to render data or systems unusable or hold them for ransom. Cybersecurity attacks in particular develop and evolve rapidly, including from emerging technologies, such as advanced forms of artificial intelligence. Such attacks include, but are not limited to, malicious software, attempts to gain unauthorized access to data, ransomware attacks and other electronic security breaches that could lead to disruptions in critical systems, unauthorized release of or denial of access to confidential or otherwise protected information and corruption of data. We have experienced, and expect to continue to confront, efforts by hackers and other third parties to gain unauthorized access or deny access to, or otherwise disrupt, our information systems and networks. Risks from cybersecurity threats, including as a result of any previous cybersecurity incidents, have not materially affected us, including our business strategy, results of operations, or financial condition, but we face certain ongoing risks from cybersecurity threats that, if realized, are reasonably likely to have such an affect. See Part I, Item 1A, “Risk Factors,” under the heading “Risks Related to Our Operations - Our business could be negatively impacted by security threats, including cybersecurity threats and other disruptions” for more information regarding the risks we face.
As discussed in Part I, Item 1A, “Risk Factors,” under the heading “Financial/Accounting Risks – We may not have adequate insurance for potential liabilities and insurance may not cover certain liabilities,” we maintain cyber risk insurance to mitigate our exposure to these threats.
Governance
Risk oversight is a responsibility of the Board. The Board has delegated responsibility for monitoring technology and cybersecurity risks to the Audit Committee. The Board reviews the Company's cybersecurity risk posture, strategy and execution on at least an annual basis while the Audit Committee receives cybersecurity updates quarterly.
The CISO and executive management play a pivotal role in informing the Audit Committee on cybersecurity risks. Executive management, including the CISO, regularly meets with the Audit Committee to discuss cybersecurity risks, review quarterly cyber metrics and oversee progress against our annual action plans. These briefings may encompass a broad range of topics, including:
•Current cybersecurity landscape and emerging threats;
•Status of ongoing cybersecurity initiatives and strategies;
•Incident reports and learnings from any cybersecurity events; and
•Compliance with regulatory requirements and industry standards.
In addition to our scheduled meetings, the Audit Committee and executive management maintain an ongoing dialogue regarding emerging or potential cybersecurity risks.
Primary responsibility for assessing, monitoring and managing our cybersecurity risks rests with the CISO. Our CISO has cybersecurity expertise from over 18 years of experience in the field of cybersecurity. His background includes extensive experience as CISO at Civeo and previously for a Fortune 500 company. He also oversees our cybersecurity governance programs, assists with testing our compliance with applicable standards, leads our efforts to remediate known risks and leads our employee training program.
The CISO is informed about the latest developments in cybersecurity, including potential threats and innovative risk management techniques. The CISO implements and oversees processes for the monitoring of our information systems. This includes the deployment of advanced security measures and regular system audits to identify potential vulnerabilities. The Company deploys a Security Operations Center team who monitor and escalate cybersecurity events. In the event of a cybersecurity incident, the CISO is equipped with an incident response plan, which is intended to mitigate the impact of the incident and includes long-term strategies for remediation and prevention of future incidents.
The CISO regularly updates executive management on cybersecurity risks and incidents. Significant cybersecurity matters and certain strategic risk management decisions are escalated to the Audit Committee and the Board.
ITEM 2. Properties
The following table presents information about our principal properties and facilities as of December 31, 2020.2023. Except as indicated, we own all of the properties or facilities listed below. Each of the properties is encumbered by our secured credit facilities. See “Management’s Discussion and Analysis of Financial Condition and Results of Operations”Operations” in Item 7 and Note 11 – Debt to the notes to consolidated financial statements included in Item 8 of this annual report for additional information
concerning our credit facilities. For a discussion about how each of our business segments utilizes its respective properties, see Item 1, “Business”“Business” of this annual report.
| | | | | | | | | | | |
| Location | Approximate
Square
Footage/Acreage | | Description |
| Canada: | | | |
| Fort McMurray, Alberta (leased land) | 240 acres | | Wapasu Creek and Henday LodgesLodge |
| Fort McMurray, Alberta (leased land) | 138 acres | | Fort McMurray Village |
| Fort McMurray, Alberta (leased land) | 135 acres | | Conklin Lodge |
| Fort McMurray, Alberta (leased land) | 128 acres | | Beaver River and Athabasca Lodges |
| Fort McMurray, Alberta (leased land) | 78 acres | | McClelland Lake Lodge
| Kitimat, British Columbia | 59 acres | | Sitka Lodge |
| Fort McMurray, Alberta (leased land and lodges) | 58 acres | | Hudson and Borealis Lodges |
| Acheson, Alberta (lease) | 40 acres | | Office and warehouse |
Edmonton, AlbertaVanderhoof, British Columbia | 33 acres | | Manufacturing facilityStorage yard (1)
|
| Fort McMurray, Alberta (leased land) | 30 acres | | Greywolf Lodge |
Grimshaw, Alberta (lease) | 20 acres | | Equipment yard |
| Fort McMurray, Alberta (leased land) | 18 acres | | Anzac Lodge |
| Edmonton, Alberta (lease) | 86,376 sq. feet | | Office and warehousecommercial production kitchen |
| Calgary, Alberta (lease) | 7,000 sq. feet | | Office |
| Australia: | | | |
| Coppabella, Queensland, Australia | 192 acres | | Coppabella Village |
| Narrabri, New South Wales, Australia | 82 acres | | Narrabri Village |
| Boggabri, New South Wales, Australia | 52 acres | | Boggabri Village |
| Dysart, Queensland, Australia | 50 acres | | Dysart Village |
| Middlemount, Queensland, Australia | 37 acres | | Middlemount Village |
| Karratha, Western Australia, Australia (owned and leased land) | 34 acres | | Karratha Village |
Kambalda, Western Australia, Australia | 27 acres | | Kambalda Village |
| Nebo, Queensland, Australia | 26 acres | | Nebo Village |
| Moranbah, Queensland, Australia | 17 acres | | Moranbah Village |
| Sydney, New South Wales, Australia (lease) | 11,518 sq. feet | | Office |
| Perth, Western Australia, Australia (lease) | 8,9886,921 sq. feet | | Office |
| Brisbane, Queensland, Australia (lease) | 5,543 sq. feet | | Office |
United States:U.S.: | | | |
| Houston, Texas (lease) | 8,900 sq. feet | | Principal executive offices |
| Sulphur, Louisiana | 44 acres | | Acadian Acres Lodge and yardland only |
| Killdeer, North Dakota | 39 acres | | Killdeer Lodge |
Pecos, Texas (leased land) | 35 acres | | West Permian Lodge |
Yukon, Oklahoma (lease) | 12 acres | | Mobile asset facility and yard |
Belle Chasse, Louisiana | 10 acres | | Manufacturing facility and yard |
Carlsbad, New Mexico (lease) | 10 acres | | Mobile asset facility and yard |
LaSalle, Colorado (lease) | 6 acres | | Mobile asset facility and yard |
Pecos, Texas (lease) | 7 acres | | Mobile asset facility and yard |
Wright, Wyoming (lease) | 5 acres | | Mobile asset facility and yard |
Bloomfield, New Mexico (lease) | 2 acres | | Mobile asset facility and yard |
Longmont, Colorado (lease) | 4,377 sq. feet | | Office (2)
|
(1) This facility is under contract for sale at December 31, 2020. Such sale is expected to be completed in the first quarter of 2021.
(2) This lease expires at the end of February 2021 and is not expected to be renewed.
We also own various undeveloped properties in British Columbia.
We believe that our leases are at competitive or market rates and do not anticipate any difficulty in leasing additional suitable space upon expiration of our current lease terms.
Leased land for our lodge properties in Canada refers to land leased from the Alberta government. We also lease land for our Karratha Village from the state government in Australia. Generally, ourthese leases have an initial term of ten years and are scheduled to expire between 20212024 and 2028.
2030.
ITEM 3. Legal Proceedings
We are a party to various pending or threatened claims, lawsuits and administrative proceedings seeking damages or other remedies concerning our commercial operations, products, employees and other matters, including occasional claims by individuals alleging exposure to hazardous materials as a result of our products or operations. Some of these claims relate to matters occurring prior to our acquisition of businesses, and some relate to businesses we have sold. In certain cases, we are entitled to indemnification from the sellers of businesses, and in other cases, we have indemnified the buyers of businesses from us. Although we can give no assurance about the outcome of pending legal and administrative proceedings and the effect such outcomes may have on us, we believe that any ultimate liability resulting from the outcome of such proceedings, to the extent not otherwise provided for or covered by indemnity or insurance, will not have a material adverse effect on our consolidated financial position, results of operations or liquidity.
ITEM 4. Mine Safety Disclosures
Not applicable.
PART II
ITEM 5. Market for Registrant's Common Equity, Related Shareholder Matters and Issuer Purchases of Equity Securities
Market for Our Common Shares
Our common shares trade on the NYSENew York Stock Exchange under the trading symbol “CVEO”.
Holders of Record
As of February 22, 2021,23, 2024, there were 1921 holders of record of Civeo common shares.
Dividend Information
We do not currentlyintend to pay any cashregular quarterly dividends on our common shares.shares, with all future dividend payments subject to quarterly review and approval by our Board. The declaration and amount of all potential future dividends will be at the discretion of our board of directorsBoard and will depend upon many factors, including our financial condition, results of operations, cash flows, prospects, industry conditions, capital requirements of our business, covenants associated with certain debt obligations, legal requirements, regulatory constraints, industry practice and other factors the board of directorsBoard deems relevant. WeIn addition, our ability to pay cash dividends on common shares is limited by covenants in the Credit Agreement. Future agreements may also limit our ability to pay dividends, and we may incur incremental taxes if we are required to repatriate foreign earnings to pay such dividends. The amount per share of our dividend payments may be changed, or dividends may be suspended, without advance notice. The likelihood that dividends will be reduced or suspended is increased during periods of market weakness. There can givebe no assurancesassurance that we will continue to pay a dividend in the future.
The preferred shares we issued in the Noralta Acquisition are entitled to receive a 2% annual dividend on the liquidation preference (initially $10,000 per share), paid quarterly in cash or, at our option, by increasing the preferred shares’ liquidation preference, or any combination thereof. Quarterly dividends have been paid in-kind for each quarterly period beginning June 30, 2018 through December 31, 2020, thereby increasing the liquidation preference to $10,563 per share as of December 31, 2020. We currently expect to pay dividends on the preferred shares for the foreseeable future through an increase in liquidation preference rather than cash. For further information, see Note 19 - Preferred Shares to the notes to the consolidated financial statements included in Item 8 of this annual report.
Performance Graph
The share price performance shown on the graph is not necessarily indicative of future price performance. Information used in the graph was obtained from Research Data Group, Inc., a source believed to be reliable, but we are not responsible for any errors or omissions in such information.
The following performance graph and chart compare the cumulative total return to holders of our common shares with the cumulative total returns of the Standard & Poor's 500 Stock Index, Philadelphia OSX and with that of our peer group, for the period from December 31, 20152018 to December 31, 2020.2023. The graph and chart show the value, at the dates indicated, of $100 invested at December 31, 20152018 and assume the reinvestment of all dividends, as applicable.
Our peer group consists of Basic Energy Services, Inc., Black Diamond Group Limited, Dexterra Group Inc., Exterran Corporation, Forum Energy Technologies, Inc., Matrix Service Company, Newpark Resources, Inc., Nine Energy Service Inc., Quintana Energy Services Inc.(1), Oil States International, Inc., Precision Drilling Corporation, Select Energy Services Inc., Source Energy Services Ltd., Step Energy Services Ltd., Tetra Tech Inc. and Total Energy Services Inc.the following:
(1) This company was acquired in July 2020. | | | | | |
| Badger Daylighting Ltd. | Nine Energy Service, Inc. |
| Black Diamond Group Limited | North American Construction Group |
| Dexterra Group | Oil States International, Inc. |
| Enerflex Ltd. | Precision Drilling Corporation |
| Forum Energy Technologies, Inc. | Select Energy Services Inc. |
| Matrix Service Company | Target Hospitality Corp. |
McGrath RentCorp | Tetra Technologies, Inc. |
| Newpark Resources, Inc. | Total Energy Services Inc. |
| |
| Note: The current peer group remain unchanged for 2023 with the exception of the removal of Exterran Corporation, as they were acquired by Enerflex Ltd. |
| | | | | 12/31/15 | | 12/31/16 | | 12/31/17 | | 12/31/18 | | 12/31/19 | | 12/31/20 | | | 12/31/18 | | 12/31/19 | | 12/31/20 | | 12/31/21 | | 12/31/22 | | 12/31/23 |
| Civeo Corporation | Civeo Corporation | | $ | 100.00 | | | $ | 154.93 | | | $ | 192.25 | | | $ | 100.70 | | | $ | 90.85 | | | $ | 81.57 | |
| S&P 500 | S&P 500 | | $ | 100.00 | | | $ | 111.96 | | | $ | 136.40 | | | $ | 130.42 | | | $ | 171.49 | | | $ | 203.04 | |
| PHLX Oil Service Sector | PHLX Oil Service Sector | | $ | 100.00 | | | $ | 118.98 | | | $ | 98.51 | | | $ | 53.97 | | | $ | 53.67 | | | $ | 31.09 | |
| Current Peer Group | | $ | 100.00 | | | $ | 143.88 | | | $ | 124.27 | | | $ | 77.10 | | | $ | 85.50 | | | $ | 77.83 | |
| Peer Group | |
The performance graph above is furnished and not filed for purposes of the Securities Act and the Exchange Act. The performance graph is not soliciting material subject to Regulation 14A.
Unregistered Sales of Equity Securities and Use of Proceeds
None.
Repurchases of Registered Equity Securities by Registrant or its Affiliates in the Fourth Quarter
None.The following table provides information about purchases of our common shares during the three months ended December 31, 2023.
| | | | | | | | | | | | | | | | | | | | | |
| Total Number of Shares Purchased (1) | | Average Price Paid per Share | | Total number of shares purchased as part of publicly announced plans or programs | Maximum number of shares that may be purchased under the plans or programs | |
| October 1, 2023 - October 31, 2023 | 99,521 | | | $ | 19.84 | | | 99,521 | | 600,769 | | |
| November 1, 2023 - November 30, 2023 | 12,900 | | | $ | 19.71 | | | 12,900 | | 587,869 | | |
| December 1, 2023 - December 31, 2023 | 8,332 | | | $ | 21.50 | | | 8,332 | | 579,537 | | |
| Total | 120,753 | | | $ | 19.94 | | | 120,753 | | 579,537 | | |
(1) In August 2023, our Board authorized a common share repurchase program to repurchase up to 5.0% of our total common shares which were issued and outstanding at the time of approval, or 742,134 common shares, over a twelve month period. We repurchased an aggregate of 120,753 of our common shares outstanding for approximately $2.4 million during the three months ended December 31, 2023.
ITEM 6. Selected Financial DataReserved
Not applicable.
ITEM 7. Management’s Discussion and Analysis of Financial Condition and Results of Operations
“Management’s Discussion and Analysis of Financial Condition and Results of Operations” contains “forward-looking statements” within the meaning of Section 27A of the Securities Act and Section 21E of the Exchange Act that are based on management’s current expectations, estimates and projections about our business operations. Please readRead “Cautionary Statement Regarding Forward Looking Statements.” Our actual results may differ materially from those currently anticipated and expressed in such forward-looking statements as a result of numerous factors, including the known material factors set forth in Item 1A. “Risk Factors” of this annual report. You should read the following discussion and analysis together with our consolidated financial statements and the notes to those statements in Item 8 of this annual report.
This section of this annual report generally discusses key operating and financial data as of and for the years ended 20202023 and 20192022 and provides year-over-year comparisons for such periods. For a similar discussion and year-over-year comparisons to our 20182021 results, please refer to "Management’s Discussion and Analysis of Financial Condition and Results of Operations" in Part II, Item 7 of our Annual Report on Form 10-K for the year ended December 31, 2019,2022, filed with the SECSecurities and Exchange Commission on February 27, 2020.March 1, 2023.
Description of the Business
We provide hospitality services to the natural resources industry in Canada, Australia and the U.S. We provide a full suite of hospitality services for our guests in the natural resources industry, including lodging, catering and food service, housekeeping and maintenance at accommodation facilities that we or our customers own. In many cases, we provide services that support the day-to-day operations of accommodationthese facilities, such as laundry, facility management and maintenance, water and wastewater treatment, power generation, communication systems, security and logistics. We also offer development activities for workforce accommodation facilities, including site selection, permitting, engineering and design, manufacturing management and site construction, along with providing hospitality services once the facility is constructed.
We primarily operate in some of the world’s most active oil, metallurgical (met) coal, liquefied natural gas (LNG) and iron ore producing regions, where, in many cases, traditional accommodations and ourrelated infrastructure often are not accessible, sufficient or cost effective. Our customers include major and independent oil companies, mining companies, engineering companies and oilfield and mining service companies. We operate in threetwo principal reportingreportable business segments – Canada Australia and the U.S.
Reverse Share Split
On November 19, 2020, we effected a reverse share split where each twelve issued and outstanding common shares were converted into one common share (Reverse Share Split). Our common shares began trading on a reverse share split adjusted basis on November 19, 2020. All common share and per common share data included in this annual report have been retroactively adjusted to reflect the Reverse Share Split.
See Note 1 - Description of Business and Basis of Presentation to the notes to the consolidated financial statements in Item 8 of this annual report for further discussion regarding the Reverse Share Split.Australia.
Basis of Presentation
Unless otherwise stated or the context otherwise indicates: (i) all references in these consolidated financial statements to “Civeo,” “us,” “our” or “we” refer to Civeo Corporation and its consolidated subsidiaries; and (ii) all references in this annual report to “dollars” or “$” are to U.S.United States (U.S.) dollars.
Overview and Macroeconomic Environment
Demand for our services can be attributed to two phases of our customers’ projects: (1) the development or construction phase; and (2) the operations or production phase. Historically, initial demand for our hospitality services has been driven by our customers’ capital spending programs related to the construction and development of natural resource projects and associated infrastructure, as well as the exploration for oil and natural gas. Long-term demand for our services has been driven by natural resource production, maintenance and operation of those facilities as well as expansion of those sites. In general, industry capital spending programs are based on the outlook for commodity prices, production costs, economic growth, global commodity supply/demand, dynamics and estimates of resource production.production and the expectations of our customers' shareholders. As a result, demand for our hospitality services is largely sensitive to expected commodity prices, principally related to oil, met coal, LNG and iron ore.ore, and the resultant impact of these commodity price expectations on our customers’ spending. Other factors that can affect our business and financial results include the general global economic environment, including inflationary pressures, supply chain disruptions and labor shortages, volatility affecting the banking system and financial markets, availability of capital to the natural resource industry and regulatory changes in Canada, Australia the U.S. and other markets, including governmental measures introduced to fight climate change or to help slow the spread or mitigatechange.
Commodity Prices
There is continued uncertainty around commodity price levels, including the impact of COVID-19.
Our business is predominantly locatedinflationary pressures, actions taken by Organization of the Petroleum Exporting Countries Plus (OPEC+) to adjust production levels, geopolitical events such as the ongoing Russia/Ukraine and Israel/Hamas conflicts and rising geopolitical risks in northern Alberta, Canada; British Columbia, Canada; Queensland, Australia;the Middle East, U.S. oil production levels and Western Australia. We derive most ofregulatory implications on such prices. In particular, these items could cause our business from natural resource companies who are developing and producing oil sands, met coal, LNG and iron ore resources and, to a lesser extent, other hydrocarbon and mineral resources. Approximately 66% of our revenue is generated by our lodges in Canada and our villages in Australia. Where traditional accommodations and infrastructure are insufficient, inaccessible or cost ineffective, our lodge and village facilities provide comprehensive hospitality services similar to those found in an urban hotel. We typically contract our facilities to our customers on a fee-per-person-per-day basis that covers lodging and meals and is based on the duration of customer needs, which can range from several weeks to several years.
Generally, our core Canadian oil sands and Australian mining pipeline
customers are making significant capitalto reduce production, delay expansionary and maintenance spending and defer additional investments to developin their prospects, which have estimated reserve lives ranging from ten years to in excess of 30 years. Consequently, these investments are primarily dependent on those customers’ long-term views of commodity demand and prices.
The spread of COVID-19 and the response thereto have negatively impacted the global economy. The actions taken to mitigate the spread of COVID-19 and the risk of infection have altered, and are expected to continue to alter, governmental and private-sector policies and behaviors in ways that have had a significant negative effect on oil consumption, such as government-imposed or voluntary social distancing and quarantining, reduced travel and remote work policies. Additionally, global oil prices dropped to historically low levels in March and April 2020 due to severely reduced global oil demand, high global crude inventory levels, uncertainty around timing and slope of worldwide economic recovery after COVID-19 related economic shut-downs and effectiveness of production cuts by major oil producing countries, such as Saudi Arabia, Russia and the U.S. In mid-April 2020, OPEC+ (the combination of historical OPEC members and other significant oil producers, such as Russia) announced production cuts of up to approximately 10 million barrels per day. However, oil prices remained at depressed levels throughout most of 2020, before modest improvement late in the year and into early 2021. Prices are expected to remain relatively volatile throughout 2021.
The economic disruption caused by the spread of COVID-19 and decline in the price of and demand for oil have impacted the activity in the Canadian oil sands and we have seen a decrease in demand for rooms by our oil sands customers. The reduction in the occupancy at ourassets.
Recent Commodity Prices
Recent West Texas Intermediate (WTI) crude, Western Canadian oil sands lodges negatively impacted our business in 2020 and could continue to negatively impact our business if oil prices continue to remain volatile. Due to lower oil prices in 2020 and the economic disruption caused by COVID-19, we implemented certain cost containment initiatives, including salary and total compensation reductions of 20% for the Board and Chief Executive Officer for 2020 from March levels, salary reductions for senior management in Canada and the U.S., headcount reductions in North America of approximately 33% from March through December 2020, and decreases to 2020 capital spending by approximately 25%.
Despite the aforementioned negative impact of COVID-19 on the global economy, the impact on the Australian mining industry in 2020 was relatively muted. Due to strong Chinese steel demand, supply disruptions in other countries and limited COVID-19 cases in Australia, AustralianSelect (WCS) crude, met coal and iron ore activity was relatively buoyantpricing trends are as follows:
| | | | | | | | | | | | | | | | | | | | | | | | | | |
| | | Average Price (1) |
Quarter
ended | | WTI
Crude
(per bbl) | | WCS
Crude
(per bbl) | | Hard
Coking Coal
(Met Coal)
(per tonne) | | Iron
Ore
(per tonne) |
| First Quarter through February 23, 2024 | | $ | 74.99 | | | $ | 56.16 | | | $ | 323.93 | | | $ | 127.50 | |
| 12/31/2023 | | 78.55 | | | 55.31 | | | 332.24 | | | 122.24 | |
| 9/30/2023 | | 82.50 | | | 66.20 | | | 260.12 | | | 111.04 | |
| 6/30/2023 | | 73.54 | | | 60.25 | | | 243.54 | | | 106.98 | |
| 3/31/2023 | | 75.96 | | | 56.61 | | | 341.08 | | | 117.08 | |
| 12/31/2022 | | 82.82 | | | 54.72 | | | 276.19 | | | 94.93 | |
| 9/30/2022 | | 91.63 | | | 70.70 | | | 252.63 | | | 99.21 | |
| 6/30/2022 | | 108.77 | | | 92.89 | | | 464.61 | | | 128.80 | |
| 3/31/2022 | | 95.17 | | | 82.04 | | | 474.83 | | | 129.46 | |
| 12/31/2021 | | 77.31 | | | 60.84 | | | 371.95 | | | 104.88 | |
| 9/30/2021 | | 70.54 | | | 57.58 | | | 258.41 | | | 164.90 | |
| 6/30/2021 | | 66.19 | | | 53.27 | | | 136.44 | | | 195.97 | |
| 3/31/2021 | | 58.13 | | | 46.28 | | | 127.95 | | | 159.83 | |
| 12/31/2020 | | 42.63 | | | 31.34 | | | 109.37 | | | 128.24 | |
(1)Source: WTI crude prices are from U.S. Energy Information Administration, WCS crude prices and iron ore prices are from Bloomberg and hard coking coal prices are from IHS Markit.
WTI Crude.After reaching historic lows in 2020.
We continue to closely monitorearly 2020 during the start of the COVID-19 situationpandemic, global oil prices increased to above $100 per barrel in the second quarter 2022. In the second half of 2022 and have taken measuresthroughout 2023, oil prices declined due to help ensure(i) rising fears of a recession resulting from severe inflation and rising interest rates, (ii) resulting lower demand for oil and (iii) increasing U.S. oil production. In an effort to support the healthprice of oil amidst demand concerns, OPEC+ countries announced additional oil production cuts through the end of 2023. These production cuts, coupled with the rising geopolitical risks in the Middle East, resulted in increased oil prices in the third quarter and well-beingearly part of our employees, guests and contractors, including screeningthe fourth quarter of individuals that enter our facilities, social distancing practices, enhanced cleaning and deep sanitization,2023, before reducing in the suspensionlatter part of nonessential employee travel and implementationthe fourth quarter back to levels consistent with the first six months of work-from-home policies, where applicable.2023.
Alberta CanadaWCS Crude.. In Canada, Western Canadian Select (WCS)WCS crude is the benchmark price for our oil sands customers. Pricing for WCS is driven by several factors, including the underlying price for West Texas Intermediate (WTI)WTI crude, the availability of transportation infrastructure (consisting of pipelines and crude by railcar), refinery blending requirements and recent actions by the Alberta provincial government to limit oil production from the province.governmental regulation. Historically, WCS has traded at a discount to WTI, creating a “WCS Differential,” due to transportation costs and capacity restrictions to move Canadian heavy oil production to refineries, primarily along the U.S. Gulf Coast. The WCS Differential has varied depending on the extent of transportation capacity availability.
Certain expansionary oil pipeline projects have the potential to both drive incremental demand for mobile assets and to improve take-away capacity for Canadian oil sands producers over the longer term. While these pipeline projects, including Kinder Morgan’sThe Enbridge Line 3 replacement project was completed at the end of 2021 and the Trans Mountain Pipeline (TMX), have recently received incremental regulatory approvals, it is still not certain if any ofapproximately 98% complete, with mechanical completion expected to occur in the proposed pipeline projects will ultimately be completed. Certain segments of the TMX pipeline have begun construction; however, the construction timeline continuesfirst quarter 2024, commercial service expected to be delayed duebegin in April 2024 and volumes expected to the lack of agreement between the Canadian federal government, which supports the pipeline projects, and the British Columbia provincial government. The Canadian federal government acquired TMX pipeline in 2018, approved the expansion of the project and is currently working through the revised construction timeline. In April 2020, the Alberta provincial government announced its intentramp up to financially support the construction of the Keystone XL pipeline (KXL). The construction of this pipeline expansion was suspended due to the U.S.
Supreme Court refusing to renew a water permit for the KXL pipeline in July 2020. After President Biden's inauguration in January 2021, he implemented an executive order to revoke a necessary cross-border permit, canceling the project.full capacity by year end 2024.
WCS prices in the fourth quarter of 20202023 averaged $31.34$55.31 per barrel compared to a lowan average of $19.73$54.72 in the secondfourth quarter of 2020 and a high of $49.93 in the second quarter of 2018.2022. The WCS Differential decreased from $22.49$27.39 per barrel at the end of the fourth quarter of 20192022 to $15.35$19.35 at the end of the fourth quarter 2020. In 2018, the Government of Alberta announced it would mandate temporary curtailments of the province’s oil production. However, monthly production limits were put on hold in December 2020 until further notice, allowing operators to produce freely at their discretion while the government monitors production. Should forecasts show storage inventories approaching maximum capacity, the government may reintroduce production limits. The curtailment initially resulted in a narrowing WCS Differential in December 2018, which increased in 2019 before narrowing again in the first quarter of 2020.2023. As of February 22, 2021,23, 2024, the WTI price was $61.49$77.54 and the WCS price was $49.95,$58.60, resulting in a WCS Differential of $11.54.$18.94.
The depressed price levelsMet Coal. In Australia, 84% of both WTIour rooms are located in the Bowen Basin of Queensland, Australia and WCS materially impacted 2020 maintenanceprimarily serve met coal mines in that region. Met coal pricing and production spending and activity by Canadian operators and, therefore, demand for our hospitality services. While some of our Canadian oil sands customers conducted maintenance projectsgrowth in the thirdBowen Basin region is predominantly influenced
by the level of global steel production, which decreased by 0.1% during 2023 compared to 2022. The decrease year-over-year was the result of weaker production in December 2023 from China, offset by stronger production throughout 2023 from both Europe and Russia. As of February 23, 2024, met coal spot prices were $311.40 per tonne. Steel output is forecast to improve marginally through 2024, with large infrastructure rollouts in a number of major economies including the U.S. and India.
Met coal prices remained over $200 per tonne during 2023, which supported existing producers, and also assisted new and expansion projects. In the last quarter 2020, activity was negativelyof 2023, met coal prices averaged over $330 per tonne which continues to provide a positive short-term outlook for producing projects, though future investment could be impacted by the current environment. Customers began increasing production activityincrease in the fourth quarterQueensland royalty scheme introduced in 2022. Analysts forecast prices to remain elevated in the near term but to fall below $300 per tonne in 2024 as supply side pressures are expected to ease and Chinese met coal imports fall following high restocking levels.
Iron Ore. Iron ore prices remained consistently above $100 per tonne throughout 2023 and averaged over $130 per tonne in late December 2023, following a sustained period of 2020. Continued uncertainty, including about the impact of COVID-19,high prices. Analysts are forecasting 2024 prices to remain over $100 per tonne on average.
Other
Inflationary Pressures. During 2022 and commodity price volatility2023, inflationary pressures and regulatory complications could cause our Canadian oil sandssupply chain disruptions have been, and pipeline customers to reduce production, delay expansionary and maintenance spending and defer additional investments in their oil sands assets. Additionally, if oil prices do not improve or stabilize, the resulting impact could continue to negatively affectbe, experienced worldwide. Price increases resulting from inflation and supply chain concerns have, and are expected to continue to have, a negative impact on our labor and food costs, as well as consumable costs such as fuel. We are managing inflation risk with negotiated service scope changes and contractual protections.
Labor Shortages. In addition to the valuemacro inflationary impacts on labor costs noted above, during the COVID-19 pandemic, we were, and continue to be, impacted by increased staff costs as a result of our long-lived assets.hospitality labor shortages in Australia as government-imposed and voluntary social distancing and quarantining impacted travel. This labor shortage has been exacerbated by significantly reduced migration in and around Australia affecting labor availability, which has subsequently led to an increased reliance on more expensive temporary labor resources.
British Columbia, CanadaLNG.. Our Sitka Lodge supports the LNG Canada project and related pipeline projects. From a macroeconomic standpoint, LNG demand has continued to grow, despite the COVID-19 pandemic, reinforcing the need for the global LNG industry to expand access to natural gas. Evolving government energy policies around the world have amplified support for cleaner energy supply, creating more opportunities for natural gas and LNG. Accordingly,The conflict between Russia/Ukraine and Israel/Hamas has further highlighted the current view isneed for secure natural gas supply globally, particularly in Europe. Accordingly, additional investment in LNG supply will be needed to meet the resulting expected long-term LNG demand growth.
Currently, Western Canada does not have any operational LNG export facilities. LNG Canada (LNGC), a joint venture among Shell Canada Energy, an affiliate of Royal Dutch Shell plc (40 percent), and affiliates of PETRONAS, through its wholly-owned entity, North Montney LNG Limited Partnership (25 percent), PetroChina (15 percent), Mitsubishi Corporation (15 percent) and Korea Gas Corporation (5 percent), is currently constructing a liquefaction and export facility in Kitimat, British Columbia (Kitimat LNG Facility). The Kitimat LNG Facility is nearing completion and expected to be operational in 2024. British Columbia LNG activity and related pipeline projects are a material driver of activity for our Sitka Lodge, as well as for our mobile assets, which arewere contracted to serve several designated portions of the related pipeline construction activity. The actual timingmajority of when revenue is realizedour contracted commitments associated with the Coastal GasLink Pipeline, the pipeline constructed to transport natural gas feedstock to LNGC, were completed in the fourth quarter of 2023.
McClelland Lake Lodge. We did not renew an expiring land lease associated with our McClelland Lake Lodge in Alberta, Canada, which expired in June 2023, in order to support our customer’s intent to mine the land where the lodge was located. In addition, the accompanying hospitality services contract at McClelland Lake Lodge expired in July 2023; however, we continued to provide hospitality services to the customer at our other owned lodges through January 31, 2024 under a short-term take-or-pay commitment. Subsequent to this date, we have continued to provide such services at our other lodges; however, not pursuant to a take-or-pay commitment. Our assets were demobilized and completely removed from the Costal Gas Link pipelineexisting site in January 2024. During the third quarter of 2023, we entered into a definitive agreement to sell our McClelland Lake Lodge assets to a U.S.-based mining project for approximately C$49 million, or US$36 million. The transaction was completed in January 2024. During the third and Sitka Lodge contracts could be impacted by any delaysfourth quarters of 2023, we recognized $14.2 million in demobilization costs and received $28.2 million in cash proceeds associated with the sale. We expect to recognize the remaining demobilization costs and the proceeds of the sale in the constructionfirst quarter of 2024.
U.S. Business. In the Kitimat LNG Facility or the pipeline, including recent blockades that aim to delay pipeline construction.
first quarter of 2023, we sold our accommodation assets in Louisiana. In late March 2020, LNGC announced steps being taken to reduce the spread of COVID-19, including reduction of the workforce at the project site to essential personnel only. This resultedaddition, in a reduction in occupancy at our Sitka Lodge during the second quarterhalf of 2020. Occupancy at the Sitka Lodge returned to expected levels during July 20202022, we sold both our U.S. wellsite services and remained at expected levels thorough the end of 2020.
Australia.offshore businesses. Our remaining U.S. business supports completionIn Australia, 82% of our rooms are located in the Bowen Basin of Queensland, Australia and primarily serve met coal mines in that region. Met coal pricing and production growth in the Bowen Basin region is predominantly influenced by the levels of global steel production, which decreased by 0.9% during 2020 compared to 2019. As of February 22, 2021, met coal spot prices were $138.50 per metric tonne. Long-term demand for steel is expected to be driven by global infrastructure spending and increased steel consumption per capita in developing economies, such as China and India, whose current consumption per capita is a fraction of developed countries. In 2020, the impact of the outbreak of COVID-19 led to a high level of uncertainty for demand of iron ore and met coal. The impact on the demand for steel with the closure or curtailment of manufacturing in economies affected by COVID-19, which will only return to normal levels of consumption once jurisdictions lift quarantine requirements and manufacturing facilities are reopened, is also uncertain. However, a new round of stimulus spending in China and recovering steel production in other regions continues to support demand for raw materials, particularly iron ore.
Currently, China and Australia are in a trade dispute that has led to China implementing an unofficial trade embargo on Australian coal. China has historically accounted for approximately 22% of Australia’s met coal exports. The continuing uncertainty in the Chinese demand for Australian met coal led to a decrease in the met coal spot price to US$103 per tonne at December 31, 2020, though, as noted above, prices recovered somewhat to $138.50 per metric tonne at February 22, 2021. The softening of the met coal spot price has been exacerbated as Chinese mills and traders resell stranded Australian met coal at a discount. As a result, there is currently a shuffling of global export trade flows, coupled with growing demand for steel with an
infrastructure led recovery which may lead to near term volatility in Australian met coal spot pricing. If this dispute continues, it could continue to negatively impact pricing and demand for Australian met coal.
To date, we have not seen an overall material decline in occupancy at our Australian villages resulting from the COVID-19 pandemic or the Chinese trade dispute.
Activity in Western Australia is driven primarily by iron ore production, which is a key steel-making ingredient. As of February 22, 2021, iron ore spot prices were $168.48 per metric tonne.
On July 1, 2019, we acquired Action, a provider of integrated services to the mining industry in Western Australia. Accordingly, we also have contracts in place to service customer-owned villages in Western Australia which service primarily iron ore mines in addition to gold, lithium and nickel mines. We believe prices are currently at a level that may contribute to increased activity over the long term if our customers view these price levels as sustainable.
Met coal and iron ore prices to date have remained at levels that should support the current levels of occupancy in our Australia villages and the customer locations that we manage under our integrated services business. Accordingly, we plan to continue focusing on enhancing the quality of our operations, maintaining financial discipline, proactively managing our business as market conditions continue to evolve.
U.S. Our U.S. business supports oil shale drilling and completion activity and is primarily tied to WTI oil prices in the U.S. shale formations in the Permian Basin, the Mid-Continent, the Bakken and the Rockies. During 2019, theBakken. U.S. oil rig count and associated completion activity decreased due to the oil price decline in late 2018 and early 2019 coupled with other market dynamics negatively impacting exploration and production (E&P) spending, finishing the year at 677 rigs. In 2020, the U.S. oil rig count and associated completion activity further decreased due to the global oil price decline discussed above. Only 267 oil rigs were active at the end of 2020. The Permian Basin remains the most active U.S. unconventional play, representing 66% of the oil rigs active in the U.S. at the end of 2020. The lower U.S. rig count and decline in oil prices resulted in decreased U.S. oil production from an average of 12.2 million barrels per day in 2019 to an average of 11.3 million barrels per day in 2020. As of February 19, 2021, there were 305 active oil rigs in the U.S. (as measured by Bakerhughes.com). With the recent volatility in oil prices and a resulting reduction in spending by E&P companies, we have exited the Bakken and reduced our presence in the Rockies regions for our U.S. mobile assets. Those assets have either been sold or transported to our Permian Basin and Mid-Continent district locations. This process is underway and we expect it to be completed during the first half of 2021. U.S. oil shale drilling and completion activity will continue to be dependent on sustained higher WTIimpacted by oil prices, pipeline capacity, federal energy policies and sufficientavailability of capital to support E&P drillingexploration and production completion plans. In addition, consolidation among our E&P customer base in the U.S. has historically created short-term spending and activity dislocations. Should the current trend of industry consolidation continue, we may see activity, utilization and occupancy declines in the near term.
Recent Commodity Prices. Recent WTI crude, WCS crude and met coal pricing trends are as follows:
| | | | | | | | | | | | | | | | | | | | |
| | | Average Price (1) |
| | | | | | | Hard |
| Quarter | | WTI Crude | | WCS Crude | | Coking Coal (Met Coal) |
| ended | | (per bbl) | | (per bbl) | | (per tonne) |
| First Quarter through 2/22/2021 | | $ | 54.77 | | | $ | 42.14 | | | $ | 133.18 | |
| 12/31/2020 | | 42.63 | | | 31.34 | | | 109.37 | |
| 9/30/2020 | | 40.90 | | | 31.15 | | | 113.30 | |
| 6/30/2020 | | 27.95 | | | 19.73 | | | 120.27 | |
| 3/31/2020 | | 45.38 | | | 27.92 | | | 156.17 | |
| 12/31/2019 | | 56.85 | | | 37.94 | | | 141.39 | |
| 9/30/2019 | | 56.40 | | | 43.88 | | | 160.25 | |
| 6/30/2019 | | 59.89 | | | 47.39 | | | 204.78 | |
| 3/31/2019 | | 54.87 | | | 44.49 | | | 203.30 | |
| 12/31/2018 | | 59.32 | | | 25.66 | | | 223.02 | |
| 9/30/2018 | | 69.61 | | | 41.58 | | | 188.46 | |
| 6/30/2018 | | 67.97 | | | 49.93 | | | 189.41 | |
| 3/31/2018 | | 62.89 | | | 37.09 | | | 228.82 | |
| 12/31/2017 | | 55.28 | | | 38.65 | | | 202.33 | |
(1)Source: WTI crude prices are from U.S. Energy Information Administration (EIA), and WCS crude prices are from Bloomberg and hard coking coal prices are from IHS Markit.
Foreign Currency Exchange Rates. Exchange rates between the U.S. dollar and each of the Canadian dollar and the Australian dollar influence our U.S. dollar reported financial results. Our business has historically derived the vast majority of its revenues and operating income (loss) in Canada and Australia. These revenues and profits/losses are translated into U.S. dollars for U.S. GAAPgenerally accepted accounting principles financial reporting purposes. The following tables summarize the fluctuations in the exchange rates between the U.S. dollar and each of the Canadian dollar and the Australian dollar:
| | Year Ended December 31, |
| 2020 | | 2019 | | Change | | Percentage |
| Year Ended December 31, | | | Year Ended December 31, |
| 2023 | | | 2023 | | 2022 | | Change | | Percentage |
| Average Canadian dollar to U.S. dollar | Average Canadian dollar to U.S. dollar | $0.746 | | $0.754 | | (0.008) | | (1.1)% | Average Canadian dollar to U.S. dollar | $0.741 | | $0.769 | | (0.028) | | (3.6)% |
| Average Australian dollar to U.S. dollar | Average Australian dollar to U.S. dollar | $0.691 | | $0.695 | | (0.004) | | (0.6)% | Average Australian dollar to U.S. dollar | $0.665 | | $0.695 | | (0.030) | | (4.3)% |
| | | | | | | | | | | | | | | | | | | | | | | |
| As of December 31, |
| 2023 | | 2022 | | Change | | Percentage |
| Canadian dollar to U.S. dollar | $0.756 | | $0.738 | | 0.018 | | 2.4% |
| Australian dollar to U.S. dollar | $0.681 | | $0.679 | | 0.002 | | 0.2% |
| | | | | | | | | | | | | | | | | | | | | | | |
| As of December 31, |
| 2020 | | 2019 | | Change | | Percentage |
| Canadian dollar to U.S. dollar | $0.785 | | $0.770 | | 0.015 | | 2.0% |
| Australian dollar to U.S. dollar | $0.773 | | $0.700 | | 0.073 | | 10.4% |
These fluctuations of the Canadian and Australian dollars have had and will continue to have an impact on the translation of earnings generated from our Canadian and Australian subsidiaries and, therefore, our financial results.
Capital Expenditures. We continue to monitor the COVID-19 global pandemic and the responses thereto, the global economy, the price ofcommodity prices, demand for crude oil, met coal, LNG and iron ore, inflation and the resultant impact on the capital spending plans of our customers in order to plan our business activities. We currently expect that our 20212024 capital expenditures exclusivewill be in the range of any business acquisitions, will total approximately $20.0$30 million to $25.0$35 million, compared to 20202023 capital expenditures of $10.1$31.6 million. Our 2023 capital expenditures included approximately $10 million related to village enhancements in Australia, for which our customer has reimbursed us, resulting in a net negligible cash flow impact in 2023 for these expenditures. We may adjust our capital expenditure plans in the future as we continue to monitor customer activity.
See “Liquidity and Capital Resources” below for further discussion of 20212024 and 20202023 capital expenditures.
Results of Operations
Unless otherwise indicated, discussion of results for the year ended December 31, 20202023 is based on a comparison with the corresponding period of 2019.2022.
Results of Operations – Year Ended December 31, 20202023 Compared to Year Ended December 31, 20192022
| | | |
| | |
| | |
| | |
| | |
| | |
| | | | | Year Ended
December 31, |
| | | 2020 | | 2019 | | Change |
| | | | ($ in thousands) |
| Revenues | Revenues | | | | | |
| Revenues | |
| Revenues | |
| Canada | |
| Canada | |
| Canada | Canada | $ | 269,649 | | | $ | 325,651 | | | $ | (56,002) | |
| Australia | Australia | 234,542 | | | 156,093 | | | 78,449 | |
| U.S. | 25,538 | | | 45,811 | | | (20,273) | |
| Australia | |
| Australia | |
| Other | |
| Other | |
| Other | |
| Total revenues | |
| Total revenues | |
| Total revenues | Total revenues | 529,729 | | | 527,555 | | | 2,174 | |
| Costs and expenses | Costs and expenses | | | | | |
| Costs and expenses | |
| Costs and expenses | |
| Cost of sales and services | |
| Cost of sales and services | |
| Cost of sales and services | Cost of sales and services | | | | | |
| Canada | Canada | 209,283 | | | 239,624 | | | (30,341) | |
| Canada | |
| Canada | |
| Australia | Australia | 144,709 | | | 89,090 | | | 55,619 | |
| U.S. | 28,096 | | | 38,100 | | | (10,004) | |
| Australia | |
| Australia | |
| Other | |
| Other | |
| Other | |
| Total cost of sales and services | |
| Total cost of sales and services | |
| Total cost of sales and services | Total cost of sales and services | 382,088 | | | 366,814 | | | 15,274 | |
| Selling, general and administrative expenses | Selling, general and administrative expenses | 53,656 | | | 59,586 | | | (5,930) | |
| Selling, general and administrative expenses | |
| Selling, general and administrative expenses | |
| Depreciation and amortization expense | |
| Depreciation and amortization expense | |
| Depreciation and amortization expense | Depreciation and amortization expense | 96,547 | | | 123,768 | | | (27,221) | |
| Impairment expense | Impairment expense | 144,120 | | | 26,148 | | | 117,972 | |
| Impairment expense | |
| Impairment expense | |
| Gain on sale of McClelland Lake Lodge assets, net | |
| Gain on sale of McClelland Lake Lodge assets, net | |
| Gain on sale of McClelland Lake Lodge assets, net | |
| Other operating expense | |
| Other operating expense | |
| Other operating expense | Other operating expense | 506 | | | 290 | | | 216 | |
| Total costs and expenses | Total costs and expenses | 676,917 | | | 576,606 | | | 100,311 | |
| Operating loss | (147,188) | | | (49,051) | | | (98,137) | |
| Total costs and expenses | |
| Total costs and expenses | |
| Operating income | |
| Operating income | |
| Operating income | |
| | Interest expense and income, net | (17,050) | | | (27,305) | | | 10,255 | |
| Interest expense, net | |
| | Interest expense, net | |
| | Interest expense, net | |
| Other income | Other income | 20,823 | | | 7,281 | | | 13,542 | |
| Loss before income taxes | (143,415) | | | (69,075) | | | (74,340) | |
| Income tax benefit | 10,635 | | | 10,741 | | | (106) | |
| Net loss | (132,780) | | | (58,334) | | | (74,446) | |
| Less: Net income attributable to noncontrolling interest | 1,470 | | | 157 | | | 1,313 | |
| Net loss attributable to Civeo Corporation | (134,250) | | | (58,491) | | | (75,759) | |
| Other income | |
| Other income | |
| Income before income taxes | |
| Income before income taxes | |
| Income before income taxes | |
| Income tax expense | |
| Income tax expense | |
| Income tax expense | |
| Net income | |
| Net income | |
| Net income | |
| Less: Net income (expense) attributable to noncontrolling interest | |
| Less: Net income (expense) attributable to noncontrolling interest | |
| Less: Net income (expense) attributable to noncontrolling interest | |
| Net income attributable to Civeo Corporation | |
| Net income attributable to Civeo Corporation | |
| Net income attributable to Civeo Corporation | |
| Less: Dividends attributable to Class A preferred shares | Less: Dividends attributable to Class A preferred shares | 1,887 | | | 1,849 | | | 38 | |
| Net loss attributable to Civeo common shareholders | $ | (136,137) | | | $ | (60,340) | | | $ | (75,797) | |
| Less: Dividends attributable to Class A preferred shares | |
| Less: Dividends attributable to Class A preferred shares | |
| Net income attributable to Civeo common shareholders | |
| Net income attributable to Civeo common shareholders | |
| Net income attributable to Civeo common shareholders | |
We reported net lossincome attributable to Civeo for 20202023 of $136.1$30.2 million, or $9.64$2.01 per diluted share. As further discussed below, net lossincome included (i) a $93.6$28.3 million pre-tax loss ($93.6 million after-tax, or $6.63 per diluted share) resulting from the impairment of goodwill in our Canada segment included in Impairment expense, (ii) a $38.1 million pre-tax loss ($38.1 million after-tax, or $2.69 per diluted share) resulting from the impairment of long-lived assets in our Canada segment included in Impairment expense and (iii) a $12.4 million pre-tax loss ($12.4 million after-tax, or $0.88 per diluted share) resulting from the impairment of long-lived assets in our U.S. segment included in Impairment expense. Net loss was partially offset by $4.7 million pre-tax income ($4.7 million after-tax, or $0.33 per diluted share)net gains associated with the settlementsale of the McClelland Lake Lodge in Canada and (ii) a representations and warranties claim related to the Noralta acquisition included in our Canada segment in Other income.
We reported net loss attributable to Civeo for 2019 of $60.3 million, or $4.33 per diluted share. As further discussed below, net loss included (i) a $19.9$1.4 million pre-tax loss ($19.9 million after-tax, or $1.43 per diluted share) resulting from the impairment of goodwill in our Canada segment included in Impairment expense, (ii) a $6.2 million pre-tax loss ($6.1 million after-tax, or $0.44 per diluted share) resulting from the impairment of fixed assets included in Impairment expense, and (iii) a $0.2 million gain on saleexpense.
We reported net income attributable to Civeo for 2022 of assets related to the sale of a village in Australia and related $2.2 million, releaseor $0.21 loss per diluted share. As further discussed below, net income included a $5.7 million pre-tax loss resulting from the impairment of an asset retirement obligation (ARO) liability assumed by the buyer.fixed assets included in Impairment expense.
Revenues. Consolidated revenues increased $2.2$3.8 million, or 0%1%, in 20202023 compared to 2019.2022. This increase was primarily due to the full year impact in 2020 of our Australia integrated services business due to the Action acquisition completed in July 2019,(i) increased occupancy at our Civeo owned villages in the Australian Bowen Basin and Gunnedah Basin and (ii) increased activity at our integrated services villages in Australia and increased mobile asset activity from our pipeline
project in Canada.Western Australia. These items were partially offset by (i) decreased mobile asset activity from pipeline projects in Canada, (ii) lower revenue from reduced occupancybilled rooms at our Canadian lodges, in Canada resulting from the COVID-19 pandemic, lower oil prices and the global oil market dislocation. Additionally, lower(iii) reduced activity levels in certain markets in the U.S. operations due to the sale of our wellsite and offshore businesses in the second half of 2022 and (iv) a weaker Australian and Canadian dollarsdollar relative to the U.S. dollar in 20202023 compared to 2019 also offset the increased revenues. See the discussion of segment results of operations below for further information.
Cost of Sales and Services. Our consolidated cost of sales increased $15.3 million, or 4%, in 2020 compared to 2019. This increase was primarily due to increased activity at our Australian integrated services business due to the Action acquisition, increased occupancy at our Bowen Basin villages in Australia and increased mobile asset activity from our pipeline project in Canada. These items were partially offset by decreased cost of sales and services due to reduced occupancy at our oil sands lodges in Canada resulting from the COVID-19 pandemic and lower oil prices. Additionally, lower activity levels in certain markets in the U.S. and weaker Canadian dollars relative to the U.S. dollar in 2020 compared to 2019 offset the increased cost of sales and services.2022. See the discussion of segment results of operations below for further information.
Cost of Sales and Services. Our consolidated cost of sales and services increased $13.2 million, or 3%, in 2023 compared to 2022. This increase was primarily due to (i) increased occupancy at our Civeo owned villages in the Australian
Bowen Basin and Gunnedah Basin, (ii) increased activity at our integrated services villages in Western Australia and (iii) increased operating costs due to inflationary pressures in Australia. These items were partially offset by (i) reduced activity in the U.S. operations due to the sale of our wellsite and offshore businesses in the second half of 2022, (ii) lower costs related to reduced mobile asset activity in Canada, (iii) lower billed rooms at our Canadian lodges and (iv) a weaker Australian and Canadian dollar relative to the U.S. dollar in 2023 compared to 2022. See the discussion of segment results of operations below for further information.
Selling, General and Administrative Expenses. SG&A expense decreased $5.9increased $2.6 million, or 10%4%, in 20202023 compared to 2019.2022. This decreaseincrease was primarily due to higher compensation expense of $2.4 million, higher information technology expense of $2.3 million and higher incentive compensation costs of $2.0 million. The increase in compensation expense was primarily due to increased staff and recruitment costs. The increase in information technology expense was related to ongoing investment in our newly implemented human capital management (HCM) system and set-up costs incurred in a cloud computing arrangement for the HCM system, which are being amortized through SG&A expense instead of depreciation and amortization expense. These items were partially offset by lower share-based compensation expense travelof $3.9 million and entertainment expensesa weaker Australian and compensation expense, partially offset by higher incentive compensation costs.Canadian dollar relative to the U.S. dollar in 2023 compared to 2022 resulted in a $2.1 million decrease in SG&A expense. The decrease in share-based compensation expense was due to a reduction in the amount of phantom share awards outstanding and the reductionrelative decrease in our average stockshare price during 20202023 compared to 2019. The decrease in travel and entertainment expenses was largely a result of reduced travel due to COVID-19.2022.
Depreciation and Amortization Expense. Depreciation and amortization expense decreased $27.2$12.1 million, or 22%14%, in 20202023 compared to 2019.2022. The decrease was primarily due to (i) the impairmentsale of our wellsite and offshore businesses in the U.S. in the second half of 2022, (ii) certain long-livedassets becoming fully depreciated in Canada in the second quarter of 2023 and (iii) lower depreciation and amortization expense due to a weaker Australian and Canadian dollar relative to the U.S. dollar in 2023 compared to 2022. This was partially offset by the shortening of the useful lives on certain assets in Canada, andincluding the U.S. during the first quarter of 2020, (ii) the extension of the remaining life of certain long-lived accommodation assets in Canada during the fourth quarter of 2019 and (iii) certain assets and intangibles becoming fully depreciated during 2019. These items were partially offset by additional depreciation and intangible amortization expense related to our Action acquisition in 2019.McClelland Lake Lodge.
Impairment Expense. Impairment expense of $144.1 million in 2020 included the following items:
•Pre-taxWe recorded pre-tax impairment expense of $93.6$1.4 million related to the impairment of goodwill in our Canadian reporting unit.
•Pre-tax impairment expense of $38.1 million2023 associated with long-lived assets in our Canadian segment.
•Pre-taxthe U.S. We recorded pre-tax impairment expense of $12.4$5.7 million in 2022 associated with long-lived assets in the U.S. and our U.S. segment.
Impairment Expense. Impairment expense of $26.1 million in 2019 included the following items:
•Pre-tax impairment expense of $19.9 million related to the impairment of goodwill in our CanadianAustralian reporting unit.
•Pre-tax impairment expense of $0.7 million associated with long-lived assets in our Canadian segment.
•Pre-tax impairment expense of $5.5 million associated with long-lived assets in our Australian segment. This includes $1.0 million of impairment expense related to an error corrected in the second quarter 2019. We identified a liability related to an ARO at one of our villages in Australia that should have been recorded in 2011. We determined that the error was not material to our previously issued financial statements included in our Annual Report on Form 10-K for the year ended December 31, 2018, and therefore, corrected the error in the second quarter of 2019. Specifically, we recorded the following amounts in our second quarter 2019 unaudited consolidated statements of operations related to prior periods: (1) additional accretion expense related to the ARO of $0.9 million, (2) additional depreciation and amortization expense of $0.5 million related to amortization of the asset retirement cost and (3) additional impairment expense related to the impairment of the asset retirement cost of $1.0 million offset by recognition of an ARO liability totaling $2.3 million as of June 30, 2019.
See Note 4 - Impairment Charges to the notes to the consolidated financial statements included in Item 8 of this annual report for further discussion.
Gain on Sale of McClelland Lake Lodge Assets, net. We recorded $18.6 million in 2023 related to net gains associated with the sale of the McClelland Lake Lodge. The remaining net gains related to the sale of the McClelland Lake Lodge will be recognized in the first quarter of 2024.
OperatingLoss. Income. Operating lossincome increased $98.1$22.5 million, or 200%132%, in 20202023 compared to 20192022 primarily due to impairmentsa net gain on sale of goodwill and long-livedMcClelland Lake Lodge assets, partially offset by increased operating profithigher activity levels in Australia as well asand lower depreciation and amortization expense.and impairment expenses in 2023 compared to 2022. These items were partially offset by reduced mobile asset activity in Canada and increased operating costs due to inflationary pressures in 2023 compared to 2022.
Interest Expense and(Expense) Income, net. Net interest expense decreased $10.3increased $1.6 million, or 38%14%, in 20202023 compared to 20192022 primarily related to lower average debt levels and lowerhigher interest rates on term loan and revolving credit facility borrowings during 20202023 compared to 2019.2022, partially offset by lower average debt levels.
Other Income. Consolidated other income increased $8.7 million, or 170%, in 2023 compared to 2022. Other income increased $13.5in 2023 included $9.7 million or 186%, in 2020 compared to 2019, primarily due to $13.0 million of other income related to proceeds from the Canada Emergency Wage Subsidy (CEWS) and $4.7 million of other incomereimbursements associated with the settlementdismantlement of a representations and warranties claim related to the Noralta Acquisition, partially offset by smallerMcClelland Lake Lodge. In addition, 2023 included gains on sale of assets in 2020 compared to 2019. Other income in 2019 also included $2.6 million of other income related to proceeds from an insurance claim associated with maintenance-related operational issues and a gain on sale of assets related to the sale of our Acadian Acres accommodation assets in the U.S. and a village in Australia and related $2.2 million releasegain on the settlement of an ARO liability assumed byin Canada. Other income in 2022 included $4.7 million in gains on the buyer.sale of assets primarily related to our Kambalda village and undeveloped land holdings in Australia, our wellsite and offshore businesses in the U.S. and various mobile assets across Canada, Australia and the U.S.
Income Tax (Expense) Benefit. Our income tax benefitexpense for 20202023 totaled $10.6 million, or 7.4%26.3% of pretax loss,income, compared to a benefitan expense of $10.7$4.4 million, or 15.5%41.0% of pretax lossincome for 2019.2022. Our effective tax rate for 20202023 and 2022 was lowerhigher than the Canadian federal statutory rate of 15%, primarily due to a non-deductible Canadian goodwill impairment chargepre-tax income in Australia being taxed at the higher Australian income tax rate of $95.3 million, as well as30%. Additionally, due to the release of afull valuation allowance of $9.1 million againstallowances maintained in both Canada and the net deferredU.S., no tax assetsexpense or benefit was recorded related to pre-tax income in Australia. ThisCanada and the U.S. In 2023, tax expense in Canada and the U.S. was partially offset by a valuation allowance release of $6.4$1.7 million established against net deferredand $0.8 million, respectively. In 2022, tax assetsexpense in Canada
was offset by a valuation allowance release of $0.6 million and the tax benefit in the U.S. and Canada.
Our effective tax rate for 2019 was lower thanoffset by an increase to the Canadian combined federal and provincial statutory rate of 26.5%, primarily due to a non-deductible Canadian goodwill impairment charge of $19.9 million and a release of a valuation allowance of $2.3 million against the net deferred tax assets in Australia due to the Action acquisition. This was partially offset by pre-tax losses in Australia and the U.S. for which no tax benefit was recorded. As a result, a valuation allowance of $3.2 million was established against net deferred tax assets in the U.S. and Australia.$1.0 million.
Other Comprehensive Income (Loss). Other comprehensive income increased $6.2$28.0 million in 20202023 compared to 20192022 primarily as a result of foreign currency translation adjustments due to changes in the Canadian and Australian dollar exchange rates compared to the U.S. dollar. The Canadian dollar exchange rate compared to the U.S. dollar increased 2%2.4% in 20202023 compared to a 5% increase6.4% decrease in 2019.2022. The Australian dollar exchange rate compared to the U.S. dollar increased 10.4%0.2% in 20202023 compared to remaining flata 6.5% decrease in 2019.2022.
Segment Results of Operations – Canadian Segment
| | | | Year Ended
December 31, | | Year Ended
December 31, |
| | | 2020 | | 2019 | | Change | | 2023 | | 2022 | | Change |
| Revenues ($ in thousands) | Revenues ($ in thousands) | | | | | | Revenues ($ in thousands) | | | |
Accommodation revenue (1) | Accommodation revenue (1) | $ | 202,534 | | | $ | 281,577 | | | $ | (79,043) | |
Mobile facility rental revenue (2) | Mobile facility rental revenue (2) | 33,192 | | | 9,575 | | | 23,617 | |
Food service and other services revenue (3) | Food service and other services revenue (3) | 33,923 | | | 33,485 | | | 438 | |
Manufacturing revenue (4) | — | | | 1,014 | | | (1,014) | |
| | Total revenues | |
| Total revenues | |
| Total revenues | Total revenues | $ | 269,649 | | | $ | 325,651 | | | $ | (56,002) | |
| | Cost of sales and services ($ in thousands) | |
| Cost of sales and services ($ in thousands) | |
| Cost of sales and services ($ in thousands) | Cost of sales and services ($ in thousands) | | | | | | | | |
| Accommodation cost | Accommodation cost | $ | 143,213 | | | $ | 187,679 | | | $ | (44,466) | |
| Mobile facility rental cost | Mobile facility rental cost | 24,842 | | | 7,493 | | | 17,349 | |
| Food service and other services cost | Food service and other services cost | 30,616 | | | 30,595 | | | 21 | |
| Manufacturing cost | 611 | | | 1,025 | | | (414) | |
| | Indirect other cost | |
| Indirect other cost | |
| Indirect other cost | Indirect other cost | 10,001 | | | 12,832 | | | (2,831) | |
| Total cost of sales and services | Total cost of sales and services | $ | 209,283 | | | $ | 239,624 | | | $ | (30,341) | |
| | Gross margin as a % of revenues | Gross margin as a % of revenues | 22.4 | % | | 26.4 | % | | (4.0) | % |
| Gross margin as a % of revenues | |
| Gross margin as a % of revenues | | 21.5 | % | | 25.9 | % | | (4.4) | % |
| Average daily rate for lodges (5) | $ | 95 | | | $ | 91 | | | $ | 4 | |
Average daily rate for lodges (4) | |
Average daily rate for lodges (4) | |
Average daily rate for lodges (4) | |
| Total billed rooms for lodges (6) | 2,095,784 | | | 3,078,727 | | | (982,943) | |
Total billed rooms for lodges (5) | |
Total billed rooms for lodges (5) | |
Total billed rooms for lodges (5) | |
| | Average Canadian dollar to U.S. dollar | Average Canadian dollar to U.S. dollar | $ | 0.746 | | | $ | 0.754 | | | $ | (0.008) | |
| Average Canadian dollar to U.S. dollar | |
| Average Canadian dollar to U.S. dollar | |
(1)Includes revenues related to lodge rooms and hospitality services for owned rooms for the periods presented.
(2)Includes revenues related to mobile assets for the periods presented.
(3)Includes revenues related to food service, laundry and water and wastewater treatment services for the periods presented.
(4)Includes revenues related to modular construction and manufacturing services for the periods presented.
(5)Average daily rate is based on billed rooms and accommodation revenue.
(6)(5)Billed rooms represents total billed days for owned assets for the periods presented.
Our Canadian segment reported revenues in 20202023 that were $56.0$43.2 million, or 17%11%, lower than 2019. Excluding the impact of a weaker Canadian dollar exchange rate, the segment experienced a 16% decrease in revenues. This decrease was driven by reduced occupancy at our lodges related to lower oil prices and the COVID-19 pandemic.2022. The weakening of the average exchange rate for the Canadian dollar relative to the U.S. dollar by 1%3.6% in 20202023 compared to 20192022 resulted in a $2.6$13.9 million period-over-period decrease in revenues. Partially offsetting these items,Excluding the impact of the weaker Canadian exchange rate, the revenue decrease was favorably impacteddriven by increased(i) reduced mobile asset activity from a pipeline project.projects and (ii) lower billed rooms at our lodges.
Our Canadian segment cost of sales and services decreased $30.3$16.5 million, or 13%6%, in 20202023 compared to 2019.2022. The weakening of the average exchange rate for the Canadian dollar relative to the U.S. dollar by 1%3.6% in 20202023 compared to 20192022 resulted in a $2.1$10.8 million period-over-period decrease in cost of sales and services. Excluding the impact of the weaker Canadian exchange rate, the decreaseddecrease in cost of sales and services was driven by reduced occupancy at our lodges in the oil sands region and reduced indirect other costs from a continued focus on cost containment and operational efficiencies. These decreases were partially offset by increased mobile asset activity from a pipeline project and increasedlower costs related to the implementation of enhanced measures during the COVID-19 pandemic.reduced mobile asset activity and reduced activity at certain lodges.
Our Canadian segment gross margin as a percentage of revenues decreased from 26%25.9% in 20192022 to 22%21.5% in 2020.2023. This decrease was primarily driven by increasedreduced margins from our mobile asset activity as certain higher margin components were recognized over the initial contract terms through late 2022, with 2023 representing mobile camp activity winding down. In addition, mobile camp demobilization costs related toof approximately $6.5 million were incurred in the implementationsecond half of enhanced safety measures during the COVID-19 pandemic, as well as reduced operating efficiencies due to lower occupancy.
Segment Results of Operations – Australian Segment
| | | | Year Ended
December 31, | | Year Ended
December 31, |
| | | 2020 | | 2019 | | Change | | 2023 | | 2022 | | Change |
| Revenues ($ in thousands) | Revenues ($ in thousands) | | | | | |
Accommodation revenue (1) | Accommodation revenue (1) | $ | 144,070 | | | $ | 126,047 | | | $ | 18,023 | |
Accommodation revenue (1) | |
Accommodation revenue (1) | |
Food service and other services revenue (2) | Food service and other services revenue (2) | 90,472 | | | 30,046 | | | 60,426 | |
| Total revenues | Total revenues | $ | 234,542 | | | $ | 156,093 | | | $ | 78,449 | |
| | Cost of sales ($ in thousands) | Cost of sales ($ in thousands) | |
| Cost of sales ($ in thousands) | |
| Cost of sales ($ in thousands) | |
| Accommodation cost | |
| Accommodation cost | |
| Accommodation cost | Accommodation cost | 63,504 | | | 60,045 | | | 3,459 | |
| Food service and other services cost | Food service and other services cost | 77,358 | | | 26,073 | | | 51,285 | |
| Indirect other cost | Indirect other cost | 3,847 | | | 2,972 | | | 875 | |
| Total cost of sales and services | Total cost of sales and services | $ | 144,709 | | | $ | 89,090 | | | $ | 55,619 | |
| | Gross margin as a % of revenues | Gross margin as a % of revenues | 38.3 | % | | 42.9 | % | | (4.6) | % |
| Gross margin as a % of revenues | |
| Gross margin as a % of revenues | | 27.8 | % | | 27.8 | % | | — | % |
| Average daily rate for villages (3) | |
Average daily rate for villages (3) | |
Average daily rate for villages (3) | Average daily rate for villages (3) | $ | 73 | | | $ | 73 | | | $ | — | |
| Total billed rooms for villages (4) | Total billed rooms for villages (4) | 1,968,284 | | | 1,717,186 | | | 251,098 | |
Total billed rooms for villages (4) | |
Total billed rooms for villages (4) | |
| | Australian dollar to U.S. dollar | Australian dollar to U.S. dollar | $ | 0.691 | | | $ | 0.695 | | | $ | (0.004) | |
| Australian dollar to U.S. dollar | |
| Australian dollar to U.S. dollar | |
(1)Includes revenues related to village rooms and hospitality services for owned rooms for the periods presented.
(2)Includes revenues related to food service and other services, including facilities management, for the periods presented.
(3)Average daily rate is based on billed rooms and accommodation revenue.
(4)Billed rooms represents total billed days for owned assets for the periods presented.
Our Australian segment reported revenues in 20202023 that were $78.4$58.5 million, or 50%21%, higher than 2019. The increase in revenue was primarily due to our integrated services business, acquired July 1, 2019, which contributed $90.5 million in revenues in 2020 compared to the $30.0 million in 2019.2022. The weakening of the average exchange ratesrate for Australian dollars relative to the U.S. dollar by 1%4.3% in 2020the 2023 compared to 20192022 resulted in a $0.9$14.9 million year-over-overperiod-over-period decrease in revenues. In addition,Excluding the revenueimpact of the weaker Australian exchange rate, the increase in the Australian segment was driven by increased occupancyactivity at our Civeo owned villages in the Bowen Basin and Gunnedah Basin and our integrated services villages which was partially offset by decreased occupancy at ourin Western Australia villages.Australia.
Our Australian segment cost of sales and services increased $55.6$42.1 million, or 62%21%, in 20202023 compared to 2019.2022. The weakening of the average exchange rate for Australian dollars relative to the U.S. dollar by 4.3% in 2023 compared to 2022 resulted in a $10.8 million period-over-period decrease in cost of sales and services. Excluding the impact of the weaker Australian exchange rate, the increase in cost of sales and services was primarily due to our integrated services business. Increases related tolargely driven by increased occupancy at our Civeo owned villages in the Bowen Basin and Gunnedah Basin and our integrated services villages were partially offset by decreased occupancy at ourin Western Australia villages and the weakening of the Australian dollar.increased operating costs due to inflationary pressures.
Our Australian segment gross margin as a percentage of revenues decreased to 38%remained constant at 27.8% in 2020both 2023 and 2022. The increased revenue contribution in 2023 from 43% in 2019. This was primarily driven by our integrated services business, which has a service-only businessservice only-business model and therefore generates a lower overall gross marginmargins than theour accommodation business, partiallyhad a negative impact on margins in 2023. This negative impact was offset by improved margins at ourCiveo owned villages in the Bowen Basin villagesand Gunnedah Basin as a result of increased occupancy.
Segment Results of Operations – U.S.Segment
| | | | | | | | | | | | | | | | | | | | |
| | | Year Ended
December 31, |
| | | 2020 | | 2019 | | Change |
| Revenues ($ in thousands) | | $ | 25,538 | | | $ | 45,811 | | | $ | (20,273) | |
| | | | | | |
| Cost of sales ($ in thousands) | | $ | 28,096 | | | $ | 38,100 | | | $ | (10,004) | |
| | | | | | |
| Gross margin as a % of revenues | | (10.0) | % | | 16.8 | % | | (26.8) | % |
Our U.S. segment reported revenuesactivity and improved margins in 2020 that were $20.3 million, or 44%, lower than 2019. This was primarilythe integrated services business due to reduced occupancy atcosts realized from our West Permian, Killdeer and Acadian Acres lodges, reduced U.S. drilling activityinflation mitigation plan in the Bakken,
Rockies, Mid-Continent and West Permian markets affecting our wellsite business and reduced activity in our offshore rental business.year.
Our U.S. segment cost of sales decreased $10.0 million, or 26%, in 2020 compared to 2019. The decrease was driven by reduced occupancy at our West Permian and Killdeer lodges, reduced U.S. drilling activity in the Bakken, Rockies, Mid-Continent and West Permian markets affecting our wellsite business and reduced activity in our offshore rental business.
Our U.S. segment gross margin as a percentage of revenues decreased from 17% in 2019 to (10)% in 2020, primarily due to reduced activity at our lodges and wellsite markets and reduced operating efficiencies at lower activity levels.
Liquidity and Capital Resources
Our primary liquidity needs are to fund capital expenditures, which in the past have included expanding and improving our hospitality services, developing new lodges and villages and purchasing or leasing land, to pay dividends, to repurchase common shares and for general working capital needs. In addition, capital has been used to repay debt and fund strategic business acquisitions. In the future, capital may be required to move lodges from one site to another. Historically, our primary sources of funds have been available cash, cash flow from operations, borrowings under our Amended Credit Agreement and proceeds from equity issuances. In the future, we may seek to access the debt and equity capital markets from time to time to raise additional capital, increase liquidity, fund acquisitions or refinance debt.
The following summarizes our material future cash requirements at December 31, 2023, and the effect such obligations are expected to have on our liquidity and cash flow over the next five years (in thousands):
| | | | | | | | | | | | | | | | | | | | | | | | | | | | | |
| | Total | | Less Than 1
Year | | 1 – 3 Years | | 3 – 5 Years | | More
Than 5
Years |
| Debt maturities | $ | 65,554 | | | $ | — | | | $ | 65,554 | | | $ | — | | | $ | — | |
Interest payments(1) | 10,236 | | | 6,031 | | | 4,205 | | | — | | | — | |
| Purchase obligations | 11,064 | | | 11,064 | | | — | | | — | | | — | |
| Non-cancelable lease obligations | 15,713 | | | 4,563 | | | 6,531 | | | 4,065 | | | 554 | |
| Asset retirement obligations – expected cash payments | 68,645 | | | 2,576 | | | 2,066 | | | 2,365 | | | 61,638 | |
| Total contractual cash obligations | $ | 171,212 | | | $ | 24,234 | | | $ | 78,356 | | | $ | 6,430 | | | $ | 62,192 | |
(1)Interest payments due under the Credit Agreement, which matures on September 8, 2025; based on an interest rate of 9.2% for Canadian revolver borrowings.
Our debt or retire preferred shares.obligations at December 31, 2023 are reflected in our consolidated balance sheet, which is a part of our consolidated financial statements in Item 8 of this annual report. We have not entered into any material leases subsequent to December 31, 2023.
The following table summarizes our consolidated liquidity position as of December 31, 20202023 and 20192022 (in thousands):
| | | | | | | | | | | |
| December 31, |
| | 2020 | | 2019 |
Lender commitments (1) | $ | 167,300 | | | $ | 263,500 | |
Reductions in availability (2) | — | | | (6,591) | |
| Borrowings against revolving credit capacity | (63,556) | | | (134,117) | |
| Outstanding letters of credit | (4,487) | | | (2,031) | |
| Unused availability | 99,257 | | | 120,761 | |
| Cash and cash equivalents | 6,155 | | | 3,331 | |
| Total available liquidity | $ | 105,412 | | | $ | 124,092 | |
(1)As of December 31, 2020, we had two bank guarantee facilities totaling $3.0 million which mature on March 31, 2021. As of December 31, 2019, we had one bank guarantee totaling $2.0 million. We had bank guarantees of A$0.8 million and A$0.7 million under these facilities outstanding as of December 31, 2020 and 2019, respectively.
(2)As of December 31, 2020, there were no reductions in our availability under the Amended Credit Agreement. As of December 31, 2019, $6.6 million of our borrowing capacity under the Credit Agreement could not be utilized in order to maintain compliance with the maximum leverage ratio financial covenant in the Credit Agreement. | | | | | | | | | | | |
| December 31, |
| | 2023 | | 2022 |
| Lender commitments | $ | 200,000 | | | $ | 200,000 | |
| | | |
| Borrowings against revolving credit capacity | (65,554) | | | (102,505) | |
| Outstanding letters of credit | (1,353) | | | (1,365) | |
| Unused availability | 133,093 | | | 96,130 | |
| Cash and cash equivalents | 3,323 | | | 7,954 | |
| Total available liquidity | $ | 136,416 | | | $ | 104,084 | |
Cash totaling $117.4$96.6 million was provided by operations during 20202023 compared to $74.5$91.8 million provided by operations during 2019. The increase in operating2022. During 2023 and 2022, net cash flow in 2020 compared to 2019 was primarily due to higher cash provided by working capital, increased earnings from our Australian operations and proceeds from the CEWS. Net cash provided byused for working capital was $19.9 million during 2020 compared to net cash used by working capital of $14.3 million during 2019. The increase in cash provided by working capital in 2020 compared to 2019 is largely due to decreased accounts receivable balances in Canada.
Cash was used in investing activities during 2020 and 2019 in the amounts of $1.8$1.6 million and $38.6$13.9 million, respectively. The decrease in cash used for working capital in 2023 compared to 2022 is largely due to payments received from a customer for village enhancements in Australia and other working capital changes driven by timing of receipts and payments during 2023 compared to 2022.
Cash used in investing activities in 2020during 2023 totaled $14.5 million compared to 2019cash used in investing activities during 2022 of $8.9 million. The increase in cash used in investing activities was primarily due to lowerhigher capital expenditures and $4.7 million of other income associated with the settlement of a representations and warranties claim in 2020 related to the Noralta Acquisition. This compares to $16.9 million to fund the Action acquisition in 2019.expenditures. Capital expenditures totaled $10.1$31.6 million and $29.8$25.4 million during 20202023 and 2019,2022, respectively. The decreaseCapital expenditures in both periods were primarily related to maintenance. In addition, our 2023 capital expenditures included approximately $10 million related to customer-funded infrastructure upgrades in 2020 was related primarily to the completion of the Sitka Lodge expansion, which occurred during 2018 and 2019. In addition, weAustralia. We received net proceeds from the sale of property, plant and equipment of $3.7 million and $5.9$16.7 million during 20202023 primarily related to the sale of our McClelland Lake Lodge accommodation assets in Canada and 2019, respectively.Acadian Acres accommodation assets in the U.S., compared to $16.3 million during 2022 primarily related to the sale of our Kambalda village and undeveloped land holdings in Australia, unused corporate office space and various mobile assets in Canada and our wellsite and offshore businesses in the U.S.
We expect our capital expenditures for 2021, exclusive of any business acquisitions or any growth capital expenditures,2024 to be in the range of $20.0$30 million to $25.0$35 million, which excludes any unannounced and uncommitted projects, the spending for which is contingent on obtaining customer contracts.contracts or commitments. Whether planned expenditures will actually be spent in 20212024 depends on industry conditions, project approvals and schedules, customer room commitments and project and construction timing. We
expect to fund these capital expenditures with available cash, cash flow from operations and revolving credit borrowings under our Amended Credit Agreement. The foregoing capital expenditure forecast does not include any funds for strategic acquisitions, which we could pursue should the economic environment in our industry improve and the transaction economics are deemed to be attractive enough to us.us compared to the current capital allocation priorities of debt reduction and return of capital to shareholders. We continue to monitor the COVID-19 global pandemic and the responses thereto, the global economy, thecommodity prices, of and demand for crude oil, met coal, LNG and iron ore, inflation and the resultant impact on the capital spending plans of our customers in order to plan our business activities, and we may adjust our capital expenditure plans in the future.
The table below delineates historical capital expenditures split between expansionary and maintenance spending on our lodges and villages, mobile asset spending and other capital expenditures. We classify capital expenditures for the development of rooms and central facilities at our lodges and villages as expansion capital expenditures. Other capital expenditures in the table below relate to routine capital spending for support equipment, upgrades to infrastructure at our lodge and village properties and spending related to our manufacturing facilities, among other items.
Based on management’s judgment of capital spending classifications, we believe the following table represents the components of capital expenditures for the years ended December 31, 20202023 and 20192022 (in millions):
| | | | Year Ended December 31, | | Year Ended December 31, |
| | | 2020 | | 2019 | | 2023 | | 2022 |
| | | Expansion | | Maint | | Total | | Expansion | | Maint | | Total | | Expansion | | Maint | | Total | | Expansion | | Maint | | Total |
| Lodge/village | Lodge/village | $ | 1.5 | | | $ | 5.9 | | | $ | 7.4 | | | $ | 17.6 | | | $ | 5.1 | | | $ | 22.7 | |
| Mobile assets | Mobile assets | 0.7 | | | — | | | 0.7 | | | 1.4 | | | 0.5 | | 1.9 | Mobile assets | 1.3 | | | — | | — | | | 1.3 | | 1.3 | | | — | | — | | | 1.1 | | 1.1 | | | 1.1 | | 1.1 |
| Other | Other | 0.9 | | | 1.1 | | | 2.0 | | | 1.9 | | | 3.3 | | 5.2 | Other | 2.4 | | | 3.5 | | 3.5 | | | 5.9 | | 5.9 | | | 2.0 | | 2.0 | | | 2.4 | | 2.4 | | 4.4 |
| Total | Total | $ | 3.1 | | | $ | 7.0 | | | $ | 10.1 | | | $ | 20.9 | | | $ | 8.9 | | | $ | 29.8 | |
Expansion lodge and village spending in 20202023 was primarilylargely related to the purchase of previously rented rooms for a lodge in the U.S segment. Expansion lodge and village spending in 2019 was primarily related to the expansion of our Sitka lodge in British Columbia.customer-funded infrastructure upgrades at three Australian villages.
Maintenance lodge and village spending in 20202023 and 20192022 was primarily related toassociated with routine maintenance projects at our major properties.
Mobile asset spending in 2023 was primarily related to an asset storage yard purchased in Canada. Mobile asset spending in 2022 was primarily related to routine maintenance of our mobile assets in the U.S. and Canadian markets.
Other maintenance and expansion spending in 2020 and 20192023 was primarily related to miscellaneous equipment and supplies to support the day-to-day operations at our accommodation facilities.and laundry facilities and information technology infrastructure to support our business. Other maintenance and expansion spending in 2020 and 20192022 was primarily relatedassociated with mobilization of new sites at our integrated services business in Western Australia, purchases of miscellaneous equipment and supplies to support the day-to-day operations at our accommodation facilities and information technology infrastructure to support our business.
Net cash of $114.2 million wasCash used in financing activities during 20202023 of $86.8 million was primarily due to (i) net repayments under our revolving credit facilities of $70.3$37.8 million, (ii) repayments of term loan borrowings of $39.9$29.9 million, $1.5(iii) repurchases of our common shares of $11.6 million and (iv) dividend payments of $7.4 million. Cash used in financing activities during 2022 of $79.7 million was primarily due to settle(i) repayments of term loan borrowings of $30.4 million, (ii) repurchases of our preferred shares and our common shares of $30.6 million and $14.2 million, respectively, (iii) net repayments under our revolving credit facilities of $3.4 million, (iv) settlement of tax obligations on vested shares under our share-based compensation plans of $1.0 million and debt issuance costs(v) a cash dividend paid on our preferred shares in connection with the repurchase of $2.6 million related to our Amended Credit Agreement. Net cash of $44.6 million was used in financing activities during 2019 primarily due to net repayments under our revolving credit facilities of $3.5 million, repayments of term loan borrowings of $34.9 million, $4.3 million used to settle tax obligations on vested shares under our share-based compensation plans and debt issuance costs of $2.0 million related to our Credit Agreement.$0.1 million.
The following table summarizes the changes in debt outstanding during 20202023 (in thousands):
| | | | Canada | | Australia | | U.S. | | Total |
| Balance at December 31, 2019 | $ | 359,080 | | | $ | — | | | $ | — | | | $ | 359,080 | |
| | |
| | | Canada | | Australia | | | | Total |
| Balance as of December 31, 2022 | |
| Borrowings under revolving credit facilities | Borrowings under revolving credit facilities | 347,520 | | | 30,084 | | | — | | | 377,604 | |
| Repayments of borrowings under revolving credit facilities | Repayments of borrowings under revolving credit facilities | (434,155) | | | (13,759) | | | — | | | (447,914) | |
| Repayments of term loans | Repayments of term loans | (39,855) | | | — | | | — | | | (39,855) | |
| Translation | Translation | 729 | | | 1,442 | | | — | | | 2,171 | |
| Balance at December 31, 2020 | $ | 233,319 | | | $ | 17,767 | | | $ | — | | | $ | 251,086 | |
| Balance at December 31, 2023 | |
We believe that cash on hand and cash flow from operations will be sufficient to meet our anticipated liquidity needs infor the comingnext 12 months. If our plans or assumptions change, including as a result of the impact of COVID-19changes in our customers' capital spending or the declinechanges in the price of and demand for oil,natural resources, or are inaccurate, or if we make acquisitions, we may need to raise additional capital. Acquisitions have been, and our management believes acquisitions will continue to be, an element of our long-term business
strategy. The timing, size or success of any acquisition effort and the associated potential capital commitments are unpredictable and uncertain. We may seek to fund all or part of any such efforts with proceeds from debt and/or equity issuances or may issue equity directly to the sellers. Our ability to obtain capital for additional projects to implement
our growth strategy over the longer term will depend on our future operating performance, financial condition and, more broadly, on the availability of equity and debt financing. Capital availability will be affected by prevailing conditions in our industry, the global economy, the global financial markets and other factors, many of which are beyond our control. In addition, any additional debt service requirements we take on could be based on higher interest rates and shorter maturities and could impose a significant burden on our results of operations and financial condition, and the issuance of additional equity securities could result in significant dilution to shareholders.
Amended In August 2023, our Board authorized a common share repurchase program to repurchase up to 5.0% of our total common shares which are issued and outstanding, or 742,134 common shares, over a twelve month period. In addition, our Board declared quarterly dividends of $0.25 per common share to shareholders of record as of close of business on September 15, 2023 and November 27, 2023. Dividend payments of $3.7 million were made on both September 29, 2023 and December 18, 2023. The dividends are eligible dividends pursuant to the Income Tax Act (Canada). See Note 17 – Share Repurchase Programs and Dividends to the notes to the consolidated financial statements included in Item 8 of this annual report for further discussion.
Credit Agreement
As of December 31, 2019,2023, our Credit Agreement (as then amended to date, the Credit Agreement) provided for: (i) a $263.5$200.0 million revolving credit facility scheduled to mature on November 30, 2021 for certain lenders, allocated as follows: (A) a $20.0 million senior secured revolving credit facility in favor of certain of our U.S. subsidiaries, as borrowers; (B) a $183.5 million senior secured revolving credit facility in favor of Civeo and certain of our Canadian subsidiaries, as borrowers; and (C) a $60.0 million senior secured revolving credit facility in favor of one of our Australian subsidiaries, as borrower; and (ii) a $285.4 million term loan facility scheduled to mature on November 30, 2021 for certain lenders in favor of Civeo.
In September 2020, we entered into an amendment to our Credit Agreement, which reduced total lender commitments by $96.2 million.
As of December 31, 2020, our Credit Agreement, (as so amended, the Amended Credit Agreement) provided for: (i) a $167.3 million revolving credit facility scheduled to mature on May 30, 2023,8, 2025, allocated as follows: (A) a $10.0 million senior secured revolving credit facility in favor of certainone of our U.S. subsidiaries, as borrowers;borrower; (B) a $122.3$155.0 million senior secured revolving credit facility in favor of Civeo, and certain of our Canadian subsidiaries, as borrowers;borrower; and (C) a $35.0 million senior secured revolving credit facility in favor of one of our Australian subsidiaries, as borrower;borrower, and (ii) a $194.8C$100.0 million term loan facility, scheduled to maturewhich was fully repaid on May 30,December 31, 2023, for certain lenders in favor of Civeo.
U.S. dollar amounts outstanding under the facilities provided by the Amended Credit Agreement bear interest at a variable rate equal to the London Inter-Bank Offered Rate (LIBOR) plus a margin of 3.50% to 4.50% or a base rate plus 2.50% to 3.50%, in each case based on a ratio of our total debt to consolidated EBITDA (as defined in the Amended Credit Agreement). Canadian dollar amounts outstanding bear interest at a variable rate equal to a B/A Discount Rate (as defined in the Amended Credit Agreement) based on the Canadian Dollar Offered Rate (CDOR) plus a margin of 3.50% to 4.50%, or a Canadian Prime rate plus a margin of 2.50% to 3.50%, in each case based on a ratio of our total debt to consolidated EBITDA. Australian dollar amounts outstanding under the Amended Credit Agreement bear interest at a variable rate equal to the Bank Bill Swap Bid Rate plus a margin of 3.50% to 4.50%, based on a ratio of our total debt to consolidated EBITDA. The future transitions from LIBOR and CDOR as interest rate benchmarks is addressed in the Amended Credit Agreement and at such time the transition from LIBOR or CDOR takes place, we will endeavor with the administrative agent to establish an alternate rate of interest to LIBOR or CDOR that gives due consideration to (1) the then prevailing market convention for determining a rate of interest for syndicated loans in the United States at such time for the replacement of LIBOR and (2) any evolving or then existing convention for similar Canadian Dollar denominated syndicated credit facilities for the replacement of CDOR.
The Amended Credit Agreement contains customary affirmative and negative covenants that, among other things, limit or restrict: (i) indebtedness, liens and fundamental changes; (ii) asset sales; (iii) acquisitions of margin stock; (iv) specified acquisitions; (v) certain restrictive agreements; (vi) transactions with affiliates; and (vii) investments and other restricted payments, including dividends and other distributions. In addition, we must maintain an interest coverage ratio, defined as the ratio of consolidated EBITDA to consolidated interest expense, of at least 3.00 to 1.00 and a maximum leverage ratio, defined as the ratio of total debt to consolidated EBITDA, of no greater than 3.50 to 1.00. Following a qualified offering of indebtedness with gross proceeds in excess of $150.0 million, we will be required to maintain a maximum leverage ratio of no greater than 4.00 to 1.00 and a maximum senior secured ratio less than 2.50 to 1.00. Each of the factors considered in the calculations of these ratios are defined in the Amended Credit Agreement. EBITDA and consolidated interest, as defined, exclude goodwill and asset impairments, debt discount amortization, amortization of intangibles and other non-cash charges. We were in compliance with our covenants as of December 31, 2020.
Borrowings under the Amended Credit Agreement are secured by a pledge of substantially all of our assets and the assets of our subsidiaries. The obligations under the Amended Credit Agreement are guaranteed by our significant subsidiaries. As of December 31, 2020, we had eight lenders that were parties to the Amended Credit Agreement, with total commitments (including both revolving commitments and term commitments) ranging from $22.4 million to $71.1 million. As of
December 31, 2020,2023, we had outstanding letters of credit of $1.2$0.3 million under the U.SU.S. facility, $0.6 millionzero under the Australian facility and $2.7$1.1 million under the Canadian facility.
In addition to the Amended Credit Agreement, we have two bank guarantee facilities totaling $3.0 million which mature March 31, 2021. There were We also had outstanding bank guarantees of A$0.8 million under these facilities outstanding asthe Australian facility.
See Note 11 - Debt to the notes to the consolidated financial statements in Item 8 of December 31, 2020.this annual report for the terms of the Credit Agreement and further discussion regarding our debt.
Dividends
We intend to pay regular quarterly dividends on our common shares, with all future dividend payments subject to quarterly review and approval by our Board. The declaration and amount of all potential future dividends will be at the discretion of our Board of Directors and will depend upon many factors, including our financial condition, results of operations, cash flows, prospects, industry conditions, capital requirements of our business, covenants associated with certain debt obligations, legal requirements, regulatory constraints, industry practice and other factors the Board of Directors deems relevant. In addition, our ability to pay cash dividends on common or preferred shares is limited by covenants in the Amended Credit Agreement. Future agreements may also limit our ability to pay dividends, and we may incur incremental taxes if we are required to repatriate foreign earnings to pay such dividends. If we elect to pay dividends in the future, theThe amount per share of our dividend payments may be changed, or dividends may be suspended, without advance notice. The likelihood that dividends will be reduced or suspended is increased during periods of market weakness. There can be no assurance that we will continue to pay a dividend in the future.
The preferred shares we issued in the Noralta Acquisition are entitled to receive a 2% annual dividend on the liquidation preference (initially $10,000 per share), paid quarterly in cash or, at our option, by increasing the preferred shares’ liquidation preference, or any combination thereof. Quarterly dividends have been paid in-kind for each quarterly period beginning June 30, 2018 through December 31, 2020, thereby increasing the liquidation preference to $10,563 per share as of December 31, 2020. We currently expect to pay dividends on the preferred shares for the foreseeable future through an increase in liquidation preference rather than cash. For further information, see Note 19 - Preferred Shares to the notes to the consolidated financial statements included in Item 8 of this annual report for further information.
Effects of Inflation
Our revenues and results of operations have not been materially impacted by inflation in the past three years.
Off-Balance Sheet Arrangements
As of December 31, 2020, we had no off-balance sheet arrangements as defined in Item 303(a)(4)(ii) of Regulation S-K.
Contractual Obligations
The following summarizes our contractual obligations at December 31, 2020, and the effect such obligations are expected to have on our liquidity and cash flow over the next five years (in thousands):
| | | | | | | | | | | | | | | | | | | | | | | | | | | | | |
| | Total | | Less Than 1
Year | | 1 – 3 Years | | 3 – 5 Years | | More
Than 5
Years |
| Total debt | $ | 251,086 | | | $ | 35,052 | | | $ | 216,034 | | | $ | — | | | $ | — | |
Interest payments(1) | 21,267 | | | 9,428 | | | 11,839 | | | — | | | — | |
| Purchase obligations | 9,286 | | | 9,286 | | | — | | | — | | | — | |
| Non-cancelable operating lease obligations | 28,344 | | | 5,682 | | | 9,745 | | | 7,106 | | | 5,811 | |
| Asset retirement obligations – expected cash payments | 79,844 | | | 1,322 | | | 530 | | | 2,989 | | | 75,003 | |
| Total contractual cash obligations | $ | 389,827 | | | $ | 60,770 | | | $ | 238,148 | | | $ | 10,095 | | | $ | 80,814 | |
(1)Interest payments due under the Amended Credit Agreement, which matures on May 30, 2023; based on a weighted average interest rate of 4.0% for Canadian term loan, 4.1% for Canadian revolver borrowings and 3.6% for Australian revolver borrowings for the twelve month period ended December 31, 2020.
Our debt obligations at December 31, 2020 are reflected in our consolidated balance sheet, which is a part of our consolidated financial statements in Item 8 of this annual report. We have not entered into any material leases subsequent to December 31, 2020.
Critical Accounting Policies
Our consolidated financial statements in Item 8 of this annual report have been prepared in accordance with U.S. GAAP, which require that management make numerous estimates and assumptions. Actual results could differ from those estimates and assumptions, thus impacting our reported results of operations and financial position. The critical accounting policies and estimates described in this section are those that are most important to the depiction of our financial condition and results of operations and the application of which requires management’s most subjective judgments in making estimates about the effect of matters that are inherently uncertain. We describe our significant accounting policies more fully in Note 2 - Summary of Significant Accounting Policies to the notes to consolidated financial statements in Item 8 of this annual report.
Accounting for Contingencies
We have contingent liabilities and future claims for which we have made estimates of the amount of the eventual cost to liquidate these liabilities or claims. We make an assessment of our exposure and record a provision in our accounts to cover an expected loss when we believe a loss is probable and the amount of the loss can be reasonably estimated. These liabilities and claims sometimes involve threatened or actual litigation where damages have been quantified. Other claims or liabilities have been estimated based on their fair value or our experience in these matters and, when appropriate, the advice of outside counsel or other outside experts. Upon the ultimate resolution of these uncertainties, our future reported financial results will be impacted by the difference between our estimates and the actual amounts paid to settle a liability. Examples of areas where we have made important estimates of future liabilities include litigation, taxes, interest, insurance claims, warranty claims, contract claims and obligations.
Impairment ofTangible and Intangible Assets, including Goodwill
Goodwill. Goodwill represents the excess of the purchase price paid for acquired businesses over the allocated fair value of the related net assets after impairments, if applicable. We evaluate goodwill for impairment, at the reporting unit level, annually and when an event occurs or circumstances change to suggest that the carrying amount may not be recoverable. A reporting unit is the operating segment, or a business one level below that operating segment (the “component” level) if discrete financial information is prepared and regularly reviewed by management at the component level. Each segment of our business represents a separate reporting unit, and all three of our reporting units have or previously had goodwill.
In connection with the preparation of our financial statements for the three months ended March 31, 2020, we performed a quantitative goodwill impairment test as of March 31, 2020, and we reduced the value of our goodwill in our Canadian reporting unit to zero. Please see Note 4 – Impairment Charges to the notes to consolidated financial statements in Item 8 of this annual report for further discussion of goodwill impairments recorded in the years ended December 31, 2020 and 2019.
We conduct our annual impairment test as of November 30 of each year. We compare each reporting unit’s carrying amount, including goodwill, to the fair value of the reporting unit. If the carrying amount of the reporting unit exceeds its fair value, goodwill is impaired.
We are given the option to test for impairment of our goodwill by first performing a qualitative assessment to determine whether it is more likely than not (that is, likelihood of more than 50 percent) that the fair value of a reporting unit is less than its carrying amount, including goodwill. If it is determined that it is more likely than not that the fair value of a reporting unit is greater than its carrying amount, then performing the currently prescribed quantitative impairment test is unnecessary. In developing a qualitative assessment to meet the “more-likely-than-not” threshold, each reporting unit with goodwill is assessed separately and different relevant events and circumstances are evaluated for each unit. We have the option to bypass the qualitative assessment for any reporting unit in any period and proceed directly to performing the quantitative goodwill impairment test.
When performing our annual assessment on November 30, 2020, we performed the qualitative assessment related to our Australia reporting unit. All of our goodwill resides in our Australia reporting unit as of November 30, 2020. Qualitative factors that we considered as part of our assessment include industry and market conditions, macroeconomic conditions and financial performance of our business. After assessing these events and circumstances, we determined that it was more likely than not that the fair value of the Australia reporting unit was greater than its carrying value. Based on the interim quantitative testing performed as of March 31, 2020, the fair value of the Australia reporting unit exceeded its carrying value by 127%.
In performing the quantitative goodwill impairment test, we compare each reporting unit’s carrying amount, including goodwill, to the fair value of the reporting unit. Because none of our reporting units has a publicly quoted market price, we
must determine the value that willing buyers and sellers would place on the reporting unit through a routine sale process (a Level 3 fair value measurement). In our analysis, we target a fair value that represents the value that would be placed on the reporting unit by market participants, and value the reporting unit based on historical and projected results throughout a cycle, not the value of the reporting unit based on trough or peak earnings. The fair value of the reporting unit is estimated using a combination of (i) an analysis of trading multiples of comparable companies (Market Approach) and (ii) discounted projected cash flows (Income Approach). We also use acquisition multiples analyses in certain circumstances. The relative weighting of each approach reflects current industry and market conditions.
Market Approach - This valuation approach utilizes publicly traded comparable companies’ enterprise values, as compared to their recent and forecasted earnings before interest, taxes and depreciation (EBITDA) information. We use EBITDA because it is a widely used (1) key indicator of the cash generating capacity and (2) valuation metric of companies in our industry.
Income Approach - This valuation approach derives a present value of the reporting unit’s projected future annual cash flows over the next five years with a terminal value assumption. We use a variety of underlying assumptions to estimate these future cash flows, including assumptions relating to future economic market conditions, rates, occupancy levels, costs and expenses and capital expenditures. These assumptions can vary by each reporting unit depending on market conditions. In addition, a terminal value is estimated, using a Gordon Growth methodology with a long-term growth rate of 2%. We discount our projected cash flows using a long-term weighted average cost of capital based on our estimate of investment returns that would be required by a market participant. The discount rates used to value our reporting units for the March 31, 2020 interim goodwill impairment test ranged between 10.5% and 14.0%.
The fair value of our reporting units is affected by future oil, coal and natural gas prices, anticipated spending by our customers and the cost of capital. Our estimate of fair value requires us to use significant unobservable inputs, representative of Level 3 fair value measurements, including numerous assumptions with respect to future circumstances, such as industry and/or local market conditions that might directly impact each reporting unit’s operations in the future. We selected these valuation approaches because we believe the combination of these approaches and our best judgment regarding underlying assumptions and estimates provides us with the best estimate of fair value for each of our reporting units. We believe these valuation approaches are proven valuation techniques and methodologies for our industry and widely accepted by investors. The fair value of each reporting unit would change if our assumptions under these valuation approaches, or relative weighting of the valuation approaches, were materially modified. The following assumptions are significant to our evaluation process:
Business Projections - We make assumptions about the level of revenues, gross profit, operating expenses, as well as capital expenditures and net working capital requirements. These assumptions drive our planning assumptions and represent key inputs for developing our cash flow projections. These projections are developed using our internal business plans
over a five-year planning period that are updated at least annually;
Long-term Growth Rates - We also utilize an assumed long-term growth rate representing the expected rate at which our cash flow stream is projected to grow. These rates are used to calculate the terminal value and are added to the cash flows projected during our planning period; and
Discount Rates - The estimated future cash flows are then discounted at a rate that is consistent with a weighted-average cost of capital that is likely to be expected by market participants. The weighted-average cost of capital is an estimate of the overall after-tax rate of return required by equity and debt holders of a business enterprise.
Definite-Lived Tangible and Intangible Assets.Assets
The recoverability of the carrying values of tangible and intangible assets is assessed at an asset group level which represents the lowest level for which identifiable cash flows are largely independent of the cash flows of other assets and liabilities. Whenever, in management’s judgment, we review our assets for impairment in step one when events or changes in circumstances indicate that the carrying value of such asset groups may not be recoverable based on estimated future cash flows, an asset impairment evaluation is performed. Indicators of impairment might include persistent and sustained negative economic trends affecting the markets we serve, recurring cash flow losses or significantly lowered expectations of future cash flows expected to be generated by our assets. As part of the initial step, we also reevaluate the remaining useful lives and salvage values of our assets when indicators of impairment exist.
Identification of Asset Groups – The following summarizes the asset groups that we have identified in each of our reporting segments.
Our Canada segment consists of numerous lodges, as well as our mobile assets and our manufacturing facility.assets. These properties are grouped in the following asset groups:
•Core Region
◦Fort McMurray Village – North Athabasca
◦Beaver River Lodge – North Athabasca
◦Athabasca Lodge – North Athabasca
◦Hudson and Borealis Lodges – North Athabasca
•McClelland Lake Lodge – North Athabasca
•Wapasu Creek Lodge – North Athabasca
•Grey Wolf Lodge - North Athabasca
•Conklin Lodge – South Athabasca
•Anzac Lodge – South Athabasca
•Red Earth Lodge - South Athabasca
•Wabasca Lodge - South Athabasca
•Sitka Lodge – Kitimat, British Columbia
•Geetla camp – British Columbia
•Boundary camp – Saskatchewan
•Antler River camp – Manitoba
•Red Earth camp – Alberta
•Christina Lake camp – Alberta
•Mobile assets
•Noble manufacturing facility
•Various land holdings in British Columbia purchased in anticipation of potential LNG related projects
In general, the lodges are operated on a lodge by lodge basis. However, for one set of lodges (the Core Region, including Beaver River, Athabasca, Hudson and Borealis Lodges and Fort McMurray Village), there are no identifiable cash flows largely independent of the cash flows of other assets and liabilities for such lodges, and therefore, such lodges are combined into a single asset group. Factors such as proximity to each other, commonality of customers, common monitoring by management and operating decisions being made to optimize these lodges as a group result in these lodges being treated as a single asset group for the purposes of our impairment assessments.
Our Australia segment consists of nineeight villages in several regions within the country, as well as our integrated services assets and land banked assets. These properties are grouped in the following asset groups:
•Karratha – Pilbara Region, Western Australia
•Integrated services – Assets held on client owned sites in Western Australia
•Kambalda – Kambalda, Western and South Australia
•Gunnedah Basin
◦Narrabri – Gunnedah Basin, New South Wales
◦Boggabri – Gunnedah Basin, New South Wales
•Bowen Basin
◦Moranbah – Bowen Basin, Queensland
◦Dysart – Bowen Basin, Queensland
◦Nebo – Bowen Basin, Queensland
◦Coppabella – Bowen Basin, Queensland
◦Middlemount – Bowen Basin, Queensland
•Various non-operational sites acquired as part of Civeo’s land-banking strategy
In general, the villages are operated on a village by village basis, except for the villages located in the Bowen Basin (Moranbah, Dysart, Nebo, Coppabella and Middlemount) and the Gunnedah Basin (Narrabri and Boggabri). The villages in the Bowen and Gunnedah Basins contain significant levels of interdependency that allow these assets to be combined into cash generating units (asset groups). Factors such as commonality of customers, location, resource basins served and common monitoring by management result in the Bowen and Gunnedah Basins to be treated as single asset groups for the purposes of our impairment assessments. Integrated services assets provide catering and managed services to the mining industry in Western Australia and South Australia.
Our U.S. segment consists of lodges in three geographical areas, mobile assets in various geographical areas,a lodge, land and a wastewater treatment plant (WWTP). These properties are grouped in the following asset groups:
•West Permian Lodge – Texas
•Killdeer Lodge – North Dakota
•Acadian Acres Lodgeland – Louisiana
•Offshore – this asset group includes mobile assets which are utilized in the Gulf of Mexico
•Wellsites – this asset group includes mobile assets, primarily in the Permian Basin region, the Mid-Continent and the Rocky mountain corridor
•Killdeer WWTP – this asset group represents a WWTP in Killdeer, North Dakota, which was constructed in early 2014
Recoverability Assessment – In performing an impairment analysis, the second step is to compare each asset group’s carrying value to estimates of undiscounted future direct cash flows associated with the asset group over the remaining useful life of the asset group's primary asset. We use a variety of underlying assumptions to estimate these future cash flows, including assumptions relating to future economic market conditions, rates, occupancy levels, costs and expenses and capital expenditures. The estimates are consistent with those used for purposes of our goodwill impairment test, as further discussed in Goodwill, above.test.
Fair Value Determination – If, based on the assessment, the carrying values of any of our asset groups are determined to not be recoverable as a result of the undiscounted future cash flows not exceeding the net book value of the asset group, we proceed to the third step. In this step, we compare the fair value of the respective asset group to its carrying value. Our estimate of the fair value requires us to use significant unobservable inputs, representative of Level 3 fair value measurements, including numerous assumptions with respect to future circumstances, such as industry and/or local market conditions that might directly impact each of the asset groups’ operations in the future, and are therefore uncertain. In some cases our estimate of fair value is based on appraisals from third parties.
Our industry is cyclical and our estimates of the period over which future cash flows will be generated, as well as the predictability of these cash flows and our determination of whether a decline in value of our investment has occurred, can have a significant impact on the carrying value of these assets and, in periods of prolonged down cycles, may result in impairment losses. If this assessment indicates that the carrying values will not be recoverable, an impairment loss is recognized equal to the excess of the carrying value over the fair value of the asset group. The fair value of the asset group is based on prices of similar assets, if available, or discounted cash flows.
In estimating future cash flows, we make numerous assumptions with respect to future circumstances that might directly impact each of the asset groups’ operations in the future and are therefore uncertain. These assumptions with respect to future circumstances include future oil and coal prices, anticipated customer spending, and industry and/or local market conditions. These assumptions represent our best judgment based on the current facts and circumstances. However, different assumptions could result in a determination that the carrying values of additional asset groups are no longer recoverable based on estimated future cash flows. Our estimate of fair value is primarily calculated using the Income Approach, which derives a present value of the asset group based on the asset groups’ estimated future cash flows. We discounted our estimated future cash flows using a long-term weighted average cost of capital based on our estimate of investment returns required by a market participant. The discount rates used during the 2020 Canadian and U.S. segments long-lived asset impairment analysis ranged between 10.5% and 14.0%.
Please seeSee Note 4 – Impairment Charges to the notes to consolidated financial statements in Item 8 of this annual report for further discussion of impairments of definite-lived tangible and intangible assets recorded in the years ended December 31, 2020, 20192023, 2022 and 2018.2021.
Revenue and Cost Recognition
We generally recognize accommodation, mobile facility rental, food service and other services revenues over time as our customers simultaneously receive and consume benefits as we serve our customers because of continuous transfer of control to the customer. Revenue is recognized when control of the promised goods or services is transferred to our customers, in an amount that reflects the consideration we expect to be entitled to in exchange for those goods or services. We transfer control and recognize a sale based on a periodic (usually daily) room rate each night a customer stays in our rooms or when the services are rendered. In some contracts, rates may vary over the contract term. In these cases, revenue may be deferred and recognized on a straight-line basis over the contract term. A limited portion of our revenue is recognized at a point in time when control transfers to the customer related to small modular construction and manufacturing contracts, minor food service arrangements and optional purchases our customers make for incidental services offered at our accommodation and mobile facilities.
For significant projects, manufacturing revenues are recognized over time with progress towards completion measured using the cost based input method as the basis to recognize revenue and an estimated profit. Billings on such contracts in excess of costs incurred and estimated profits are classified as deferred revenue. Costs incurred and estimated profits in excess of billings on these contracts are recognized as unbilled receivables. Management believes this input method is the most appropriate measure of progress to the satisfaction of a performance obligation on larger modular construction and manufacturing contracts. Provisions for estimated losses on uncompleted contracts are made in the period in which such losses are determined. Changes in job performance, job conditions, estimated profitability and final contract settlements may result in revisions to projected costs and revenue and are recognized in the period in which the revisions to estimates are identified and the amounts can be reasonably estimated. Factors that may affect future project costs and margins include weather, production efficiencies, availability and costs of labor, materials and subcomponents. These factors can significantly impact the accuracy of our estimates and materially impact our future reported earnings.
Because of control transferring over time, the majority of our revenue is recognized based on the extent of progress towards completion of the performance obligation. At contract inception, we assess the goods and services promised in our contracts with customers and identify a performance obligation for each promise to transfer our customers a good or service (or bundle of goods or services) that is distinct. Our customers typically contract for hospitality services under take-or-pay contracts with terms that most often range from several months to threemultiple years. Our contract terms generally provide for a rental rate for a reserved room and an occupied room rate that compensates us for services provided. We typically contract our facilities to our customers on a fee per day basis where the goods and services promised include lodging and meals. To identify the performance obligations, we consider all of the goods and services promised in the context of the contract and the pattern of transfer to our customers.
Revenues exclude taxes assessed based on revenues such as sales or value added taxes.
Cost of services includes labor, food, utility costs, cleaning supplies, and other costs of operating our accommodations facilities. Cost of goods sold includes all direct material and labor costs and those costs related to contract performance, such as indirect labor, supplies, tools and repairs. Selling, general and administrative costs are charged to expense as incurred.
Estimation of Useful Lives
The selection of the useful lives of many of our assets requires the judgments of our operating personnel as to the length of these useful lives. Our judgment in this area is influenced by our historical experience in operating our assets, technological developments and expectations of future demand for the assets. Should our estimates be too long or short, we might eventually report a disproportionate number of losses or gains upon disposition or retirement of our long-lived assets. We reevaluate the remaining useful lives and salvage values of our assets when certain events occur that directly impact the useful lives and salvage values, including changes in operating condition, functional capability, impairment assessment and market and economic factors. We believe our estimates of useful lives are appropriate.
Share-Based Compensation
Our historic share-based compensation is based on participating in Civeo’s 2014 Equity Participation Plan (the Plan). Our disclosures reflect only our employees’ participation in the Plans. We are required to estimate the fair value of share compensation made pursuant to awards under the Plans. An initial estimate of the fair value of each option award, restricted share award or deferred share award determines the amount of share compensation expense we will recognize in the future. For stock option awards, which were all granted prior to our May 30, 2014 spin-off from Oil States, to estimate the value of the awards under the Plan, Oil States selected a fair value calculation model. Oil States chose the Black-Scholes option pricing model to value stock options awarded under the Plan. Oil States chose this model because option awards were made under
straightforward vesting terms, option prices and option lives. Utilizing the Black-Scholes option pricing model required Oil States to estimate the length of time options will remain outstanding, a risk free interest rate for the estimated period options are assumed to be outstanding, forfeiture rates, future dividends and the volatility of its common stock. All of these assumptions affect the amount and timing of future share-based compensation expense recognition. We have not made any option awards subsequent to May 30, 2014, but, in the event that we make future awards, we expect to utilize a similar valuation methodology. We will continually monitor our actual experience and change assumptions for future awards as we consider appropriate.
We also grant performance share awards under the Plan. Awards are earned in amounts between 0% and 200% of the participant’s target performance share award, based on the payout percentage associated with Civeo’s relative total shareholder return rank among a peer group of companies. The fair value of the awards was estimated using a Monte Carlo simulation pricing model. We chose this model because the performance awards contain complex vesting terms. Utilizing the Monte Carlo simulation pricing model required us to estimate the risk-free interest rate and the expected market price volatility of our common shares as well as the peer group of companies over a time period equal to the expected term of the award. The resulting cost is recognized over the period during which an employee is required to provide service in exchange for the awards, usually the vesting period. For additional details, see Note 18 – Share-Based Compensation to the notes to the consolidated financial statements included in Item 8 of this annual report.
Income Taxes
We follow the liability method of accounting for income taxes in accordance with current accounting standards regarding the accounting for income taxes. Under this method, deferred income taxes are recorded based upon the differences between the financial reporting and tax bases of assets and liabilities and are measured using the enacted tax rates and laws in effect at the time the underlying assets or liabilities are recovered or settled.
When our earnings from foreign subsidiaries are considered to be indefinitely reinvested, no provision for Canadian income taxes is made for these earnings. If any of the subsidiaries have a distribution of earnings in the form of dividends or otherwise, we wouldcould be subject to both Canadian income taxes (subject to an adjustment for foreign tax credits) and withholding taxes payable to various foreign countries. We do not expect to provide Canadian income taxes on future foreign earnings.
We record a valuation allowance in each reporting period when our management believes that it is more likely than not that any recorded deferred tax asset will not be realized. Our management will continue to evaluate the appropriateness of the valuation allowance in the future, based upon our current and historical operating results. Please seeresults and other potential sources of future taxable income. See Note 1514 – Income Taxes to the notes to consolidated financial statements in Item 8 of this annual report for further discussion.
In accounting for income taxes, we are required to estimate a liability for future income taxes for any uncertainty for potential income tax exposures. The calculation of our tax liabilities involves dealing with uncertainties in the application of complex tax regulations. We recognize liabilities for anticipated tax audit issues in the U.S.Canada and other tax jurisdictions based on our estimate of whether, and the extent to which, additional taxes will be due.due, including an accrual of interest and penalties, if applicable, related to the unrecognized tax benefits. If we ultimately determine that payment of these amounts is unnecessary, we reverse the liability and recognize a tax benefit during the period in which we determine that the liability is no longer necessary. We record an additional charge in our provision for taxes in the period in which we determine that the recorded tax liability is less than we expect the ultimate assessment to be.
Recent Accounting Pronouncements
Please seeSee Note 2 – Summary of Significant Accounting Policies – Recent Accounting Pronouncements to the notes to consolidated financial statements in Item 8 of this annual report for further discussion.
ITEM 7A. Quantitative and Qualitative Disclosures about Market Risk
Our principal market risks are our exposure to changes in interest rates and foreign currency exchange rates.
Interest Rate Risk
We have credit facilities that are subject to the risk of higher interest charges associated with increases in interest rates. As of December 31, 2020,2023, we had $251.1$65.6 million of outstanding floating-rate obligations under our credit facilities. These floating-rate obligations expose us to the risk of increased interest expense in the event of increases in short-term interest rates.
If floating interest rates increased by 100 basis points, our consolidated interest expense would increase by approximately $2.5$0.7 million annually, based on our floating-rate debt obligations and interest rates in effect as of December 31, 2020.2023.
Foreign Currency Exchange Rate Risk
Our operations are conducted in various countries around the world, and we receive revenue and pay expenses from these operations in a number of different currencies. As such, our earnings are subject to movements in foreign currency exchange rates when transactions are denominated in (i) currencies other than the U.S. dollar, which is our reporting currency, or (ii) the functional currency of our subsidiaries, which is not necessarily the U.S. dollar. Excluding intercompany balances, our Canadian dollar and Australian dollar functional currency net assets total approximately C$161234 million and A$298205 million, respectively, at December 31, 2020.2023. We use a sensitivity analysis model to measure the impact of a 10% adverse movement of foreign currency exchange rates against the United StatesU.S. dollar. A hypothetical 10% adverse change in the value of the Canadian dollar and Australian dollar relative to the U.S. dollar as of December 31, 20202023 would result in translation adjustments of approximately $16$23 million and $30$21 million, respectively, recorded in other comprehensive loss. Although we do not currently have any foreign exchange agreements outstanding, in order to reduce our exposure to fluctuations in currency exchange rates, we may enter into foreign exchange agreements with financial institutions in the future.
ITEM 8. Financial Statements and Supplementary Data
Our Consolidated Financial Statements and supplementary data appear on pages 7168 through 109100 of this Annual Report on Form 10-K and are incorporated by reference into this Item 8. Selected quarterly financial data is set forth in Note 22 – Quarterly Financial Information (Unaudited) to our Consolidated Financial Statements, which is incorporated herein by reference.
ITEM 9. Changes in and Disagreements With Accountants on Accounting and Financial Disclosure
There were no changes in or disagreements on any matters of accounting principles or financial statement disclosure between us and our independent auditors during our two most recent years or any subsequent interim period.
ITEM 9A. Controls and Procedures
(i) Evaluation of Disclosure Controls and Procedures
As of the end of the period covered by this annual report, we carried out an evaluation, under the supervision and with the participation of our management, including our Chief Executive Officer and Chief Financial Officer, of the effectiveness of the design and operation of our disclosure controls and procedures (as defined in Rules 13a-15(e) and 15d-15(e) under the Exchange Act). Our disclosure controls and procedures are designed to provide reasonable assurance that the information required to be disclosed by us in reports that we file under the Exchange Act is accumulated and communicated to our management, including our Chief Executive Officer and Chief Financial Officer, as appropriate, to allow timely decisions regarding required disclosure and is recorded, processed, summarized and reported within the time periods specified in the rules and forms of the SEC.Securities and Exchange Commission. Based upon that evaluation, our Chief Executive Officer and Chief Financial Officer concluded that our disclosure controls and procedures were effective as of December 31, 20202023 at the reasonable assurance level.
(ii) Internal Control Over Financial Reporting
(a) Management's annual report on internal control over financial reporting.
Our management is responsible for establishing and maintaining adequate internal control over financial reporting as defined in Rules 13a-15(f) and 15d-15(f) under the Exchange Act. Our internal control over financial reporting is a process designed to provide reasonable assurance regarding the reliability of financial reporting and the preparation of consolidated financial statements for external purposes in accordance with GAAP. Our internal control over financial reporting includes those policies and procedures that (i) pertain to the maintenance of records that, in reasonable detail, accurately and fairly reflect the transactions and dispositions of our assets; (ii) provide reasonable assurance that transactions are recorded as necessary to permit preparation of financial statements in accordance with GAAP, and that our receipts and expenditures are being made only in accordance with authorizations of management and our directors, and (iii) provide reasonable assurance regarding prevention or timely detection of unauthorized acquisition, use or disposition of our assets that could have a material effect on the consolidated financial statements.
Because of its inherent limitations, internal control over financial reporting may not prevent or detect misstatements. Also, projections of any evaluation of effectiveness to future periods are subject to the risk that controls may become inadequate because of changes in conditions, or that the degree of compliance with the policies or procedures may deteriorate. Accordingly, even effective internal control over financial reporting can only provide reasonable assurance of achieving their control objectives.
Under the supervision and with the participation of our management, including our Chief Executive Officer and Chief Financial Officer, an assessment of the effectiveness of our internal control over financial reporting as of December 31, 20202023 was conducted. In making this assessment, management used the criteria set forth by the Committee of Sponsoring Organizations of the Treadway Commission (COSO) in Internal Control–Integrated Framework (2013 Framework). Based on our assessment we believe that, as of December 31, 2020,2023, our internal control over financial reporting is effective based on those criteria.
(b) Attestation report of the registered public accounting firm.
The attestation report of Ernst & Young LLP, our independent registered public accounting firm, on our internal control over financial reporting is set forth in this annual report on page 7471 and is incorporated herein by reference.
(c) Changes in internal control over financial reporting.
During the three months ended December 31, 2020,2023, there were no changes in our internal control over financial reporting (as defined in Rules 13a-15(f) and 15d-15(f) of the Exchange Act) which have materially affected, or are reasonably likely to materially affect, our internal control over financial reporting.
ITEM 9B. Other Information
None.
ITEM9C.Disclosure Regarding Foreign Jurisdictions that Prevent Inspections
Not applicable.
PART III
ITEM 10. Directors, Executive Officers and Corporate Governance
The information required by Item 10 hereby is incorporated by reference to such information as set forth in the Company's Definitive Proxy Statement for the 20212024 Annual General Meeting of Shareholders.
The Board of Directors of the Company (the Board) has documented its governance practices by adopting several corporate governance policies. These governance policies, including the Company's Corporate Governance Guidelines, Corporate Code of Business Conduct and Ethics and Financial Code of Ethics for Senior Officers, as well as the charters for the committees of the Board (Audit Committee, Compensation Committee, Finance and Investment Committee and NominatingEnvironmental, Social, Governance and Corporate GovernanceNominating Committee) may also be viewed at the Company's website. The Financial Code of Ethics for Senior Officers applies to our principal executive officer, principal financial officer, principal accounting officer and certain other senior officers. We intend to disclose any amendments to or waivers from our Financial Code of Ethics for Senior Officers by posting such information on our website at www.civeo.com within four business days following the date of the amendment or waiver. Copies of such documents will be sent to shareholders free of charge upon written request to the corporate secretary at the address shown on the cover page of this annual report.
ITEM 11. Executive Compensation
The information required by Item 11 hereby is incorporated by reference to such information as set forth in the Company's Definitive Proxy Statement for the 20212024 Annual General Meeting of Shareholders.
ITEM 12. Security Ownership of Certain Beneficial Owners and Management and Related Shareholder Matters
The information required by Item 12 hereby is incorporated by reference to such information as set forth in the Company's Definitive Proxy Statement for the 20212024 Annual General Meeting of Shareholders.
ITEM 13. Certain Relationships and Related Transactions, and Director Independence
The information required by Item 13 hereby is incorporated by reference to such information as set forth in the Company's Definitive Proxy Statement for the 20212024 Annual General Meeting of Shareholders.
ITEM 14. Principal Accounting Fees and Services
The information required by Item 14 hereby is incorporated by reference to such information as set forth in the Company's Definitive Proxy Statement for the 20212024 Annual General Meeting of Shareholders.
PART IV
ITEM 15. Exhibits, Financial Statement Schedules
(a) Index to Financial Statements, Financial Statement Schedules and Exhibits
(1) Financial Statements: Reference is made to the index set forth on page 7168 of this Annual Report on Form 10-K.
(2) Financial Statement Schedules: No schedules have been included herein because the information required to be submitted has been included in the Consolidated Financial Statements or the Notes thereto, or the required information is inapplicable.
(3) Index of Exhibits: See Index of Exhibits, below, for a list of those exhibits filed herewith, which index also includes and identifies management contracts or compensatory plans or arrangements required to be filed as exhibits to this Annual Report on Form 10-K by Item 601 of Regulation S-K.
(b) Index of Exhibits
| | | | | | | | |
| Exhibit No. | | Description |
| | | |
| | |
| 2.1 | |
|
| | |
2.2 | | Share Purchase Agreement, dated November 26, 2017, by and among Civeo Corporation, Noralta Lodge Ltd., Torgerson Family Trust, 2073357 Alberta Ltd., 2073358 Alberta Ltd., 1818939 Alberta Ltd., 2040618 Alberta Ltd., 2040624 Alberta Ltd., 989677 Alberta Ltd. and Lance Torgerson (incorporated herein by reference to Exhibit 10.1 to the Current Report on Form 8-K (File No. 001-36246) filed on November 27, 2017).
|
| | |
2.32.2 | | Amending Agreement, dated March 15, 2018, among Civeo Corporation, the Torgerson Family Trust, 989677 Alberta Ltd., 1818939 Alberta Ltd., 2040618 Alberta Ltd., 2040624 Alberta Ltd., 2073357 Alberta Ltd., 2073358 Alberta Ltd., Lance Torgerson and Noralta Lodge Ltd. (incorporated herein by reference to Exhibit 10.1 to the Current Report on Form 8-K (File No. 001-36246) filed on March 16, 2018).
|
| | |
| 3.1 | |
|
| | |
| 3.2 | | |
| | |
| 3.3 | |
|
| | |
| 4.1 | |
|
| | |
| 4.2 | |
|
| | |
4.3*4.3 | | Description of Securities(incorporated herein by reference to Exhibit 4.3 to the Annual Report on Form 10-K (File No. 001-36246) filed on February 26, 2021). |
| | |
| 10.1† | | |
| | |
| | | | | | | | |
10.3†* | |
|
| | |
10.4†* | | |
| | |
| 10.5† | |
|
| | |
| 10.6† | |
|
| | |
| 10.7† | |
|
| | |
| 10.8† | |
|
| | |
| 10.9† | |
|
| | |
| 10.10† | |
|
| | |
| 10.11† | |
|
| | |
| 10.12† | |
|
| | |
| 10.13† | |
|
| | |
| 10.14† | | |
| | |
| 10.15† | |
|
| | |
10.16†* | | |
| | |
10.17† | |
|
| | |
10.18†*10.16† | | |
| | |
10.19†10.17† | |
|
| | |
| | | | | | | | |
10.23†10.19† | | |
| | |
10.24†10.20† | |
|
| | |
10.25†*10.21† | | |
| | |
10.2610.22 | | Amended and Restated Syndicated Facility Agreement, dated April 2, 2018,as of September 8, 2021, by and among Civeo Corporation, Civeo Pty Limited and certain of its subsidiaries,Civeo Management LLC, as borrowers,Borrowers, the guarantors party thereto, the lendersLenders named therein, Royal Bank of Canada, as Administrative Agent, and the other agents party thereto (incorporated herein by reference to Exhibit 10.1 to the Current Report on Form 8-K (File No. 001-36246) filed on April 2, 2018).
|
| | |
10.27 | | First Amendment to Amended and Restated Syndicated Facility Agreement, dated as of October 26, 2018, among Civeo Corporation and certain of its subsidiaries, as borrowers, the guarantors party thereto, the lenders named therein, Royal Bank of Canada, asU.S. Collateral Agent, Canadian Administrative Agent, Canadian Collateral Agent and the other agents party thereto (incorporated herein by reference to Exhibit 10.1 to the Current Report on Form 8-K (File No. 001-36246) filed on October 31, 2018).
|
10.28 | | Second Amendment to Amendedan Issuing Bank and Restated Syndicated Facility Agreement, datedRBC Europe Limited, as of September 30, 2019, among Civeo Corporation and certain of its subsidiaries, as borrowers, the guarantors party thereto, the lenders named therein, Royal Bank of Canada, asAustralian Administrative Agent, and the other agents party thereto (incorporated herein by reference to Exhibit 10.1 to the Current Report on Form 8-K (File No. 001-36246) filed on October 2, 2019). |
| | |
10.29 | | |
| | |
| 10.23† | | First Amendment to Syndicated Facility Agreement, dated as of March 31, 2023, among Civeo Corporation, Civeo Management LLC and Civeo Pty Limited, as Borrowers, certain subsidiary guarantors of the Borrowers party thereto, the Lenders party thereto, the Issuing Banks, the Swing Line Lenders, Royal Bank of Canada, as administrative agent for the U.S. Lenders, U.S. collateral agent, administrative agent for the Canadian Lenders and Canadian collateral agent and RBC Europe Limited, as administrative agent for the Australian Lenders and Australian collateral agent (incorporated herein by reference to Exhibit 10.1 to the Quarterly Report on Form 10-K (File No. 001-36246) filed on April 28, 2023). |
| | |
10.30†10.24† | | |
| | |
10.31†10.25† | | |
| | |
| 10.26† | | |
| | |
| 10.27† | |
|
| | |
| 10.28† | |
|
| | |
| 21.1* | | |
| | |
| 23.1* | | |
| | |
| 31.1* | | |
| | |
| 31.2* | | |
| | |
| 32.1** | | |
| | |
| | | | | | | | |
| 32.2** | | |
| | |
| 97.1* | | |
| | |
| 101.INS* | | Inline XBRL Instance Document |
| | |
| 101.SCH* | | Inline XBRL Taxonomy Extension Schema Document |
| | |
| 101.CAL* | | Inline XBRL Taxonomy Extension Calculation Linkbase Document |
| | |
| 101.DEF* | | Inline XBRL Taxonomy Extension Definition Linkbase Document |
| | |
| | | | | | | | |
| 101.LAB* | | Inline XBRL Taxonomy Extension Label Linkbase Document |
| | |
| 101.PRE* | | Inline XBRL Taxonomy Extension Presentation Linkbase Document |
| | |
| 104 | | Cover Page Interactive Data File (formatted as Inline XBRL and contained in Exhibit 101) |
| | | | | |
| * | Filed herewith. |
| † | Management contracts and compensatory plans and arrangements. |
| ** | Furnished herewith. |
PLEASE NOTE: Pursuant to the rules and regulations of the Securities and Exchange Commission, we have filed or incorporated by reference the agreements referenced above as exhibits to this Annual Report on Form 10-K. The agreements have been filed to provide investors with information regarding their respective terms. The agreements are not intended to provide any other factual information about Civeo or its business or operations. In particular, the assertions embodied in any representations, warranties and covenants contained in the agreements may be subject to qualifications with respect to knowledge and materiality different from those applicable to investors and may be qualified by information in confidential disclosure schedules not included with the exhibits. These disclosure schedules may contain information that modifies, qualifies and creates exceptions to the representations, warranties and covenants set forth in the agreements. Moreover, certain representations, warranties and covenants in the agreements may have been used for the purpose of allocating risk between the parties, rather than establishing matters as facts. In addition, information concerning the subject matter of the representations, warranties and covenants may have changed after the date of the respective agreement, which subsequent information may or may not be fully reflected in our public disclosures. Accordingly, investors should not rely on the representations, warranties and covenants in the agreements as characterizations of the actual state of facts about Civeo or its business or operations on the date hereof.
ITEM 16. Form 10-K Summary
None.
SIGNATURES
Pursuant to the requirements of Section 13 or 15 (d) of the Securities Exchange Act of 1934, the registrant has duly caused this report to be signed on its behalf by the undersigned, thereunto duly authorized on February 26, 2021.29, 2024.
| | | | | | | | | | | |
| | CIVEO CORPORATION | |
| | | | |
| | | | |
| | By | /s/ CAROLYN J. STONE | |
| | | Carolyn J. Stone | |
| | | Senior Vice President, Chief Financial Officer and Treasurer (Duly Authorized Officer and Principal Financial Officer)
|
| | | | | | | | |
| Signature | | Title |
| | | |
| /s/ RICHARD A. NAVARRE | | ChairmanChair of the Board |
| Richard A. Navarre | | |
| | | |
| /s/ BRADLEY J. DODSON | | Director, President &and Chief Executive Officer |
| Bradley J. Dodson | | (Principal Executive Officer) |
| | | |
| /s/ CAROLYN J. STONE | | Senior Vice President, Chief Financial Officer and Treasurer |
| Carolyn J. Stone | | (Principal Financial Officer and Accounting Officer) |
| | | |
| /s/ C. RONALD BLANKENSHIP | | Director |
| C. Ronald Blankenship | | |
| | |
| /s/ JAY K. GREWAL | | Director |
| Jay K. Grewal | | |
| | | |
| /s/ MARTIN A. LAMBERT | | Director |
| Martin A. Lambert | | |
| | |
| /s/ MICHAEL MONTELONGO | | Director |
| Michael Montelongo | | |
| | | |
| /s/ CONSTANCE B. MOORE | | Director |
| Constance B. Moore | | |
| | | |
| /s/ CHARLES SZALKOWSKI | | Director |
| Charles Szalkowski | | |
| | | |
| /s/ TIMOTHY O. WALL | | Director |
| Timothy O. Wall | | |
| | | |
CIVEO CORPORATION
INDEX TO CONSOLIDATED FINANCIAL STATEMENTS
CIVEO CORPORATION
Report of Independent Registered Public AccountingPublic Accounting Firm
To the Shareholders and the Board of Directors of Civeo Corporation
Opinion on the Financial Statements
We have audited the accompanying consolidated balance sheets of Civeo Corporation (“the Company”) as of December 31, 20202023 and 2019,2022, and the related consolidated statements of operations, comprehensive loss,income (loss), changes in shareholders' equity and cash flows for each of the three years in the period ended December 31, 2020,2023, and the related notes (collectively referred to as the “consolidated financial statements”). In our opinion, the consolidated financial statements present fairly, in all material respects, the financial position of the Company at December 31, 20202023 and 2019,2022, and the results of its operations and its cash flows for each of the three years in the period ended December 31, 2020,2023, in conformity with U.S. generally accepted accounting principles.
We also have audited, in accordance with the standards of the Public Company Accounting Oversight Board (United States) (PCAOB), the Company's internal control over financial reporting as of December 31, 2020,2023, based on criteria established in Internal Control-Integrated Framework issued by the Committee of Sponsoring Organizations of the Treadway Commission (2013 framework),and our report dated February 26, 202129, 2024 expressed an unqualified opinion thereon.
Basis for Opinion
These financial statements are the responsibility of the Company's management. Our responsibility is to express an opinion on the Company’s financial statements based on our audits. We are a public accounting firm registered with the PCAOB and are required to be independent with respect to the Company in accordance with the U.S. federal securities laws and the applicable rules and regulations of the Securities and Exchange Commission and the PCAOB.
We conducted our audits in accordance with the standards of the PCAOB. Those standards require that we plan and perform the audit to obtain reasonable assurance about whether the financial statements are free of material misstatement, whether due to error or fraud. Our audits included performing procedures to assess the risks of material misstatement of the financial statements, whether due to error or fraud, and performing procedures that respond to those risks. Such procedures included examining, on a test basis, evidence regarding the amounts and disclosures in the financial statements. Our audits also included evaluating the accounting principles used and significant estimates made by management, as well as evaluating the overall presentation of the financial statements. We believe that our audits provide a reasonable basis for our opinion.
Critical Audit MattersMatter
The critical audit mattersmatter communicated below are mattersis a matter arising from the current period audit of the financial statements that werewas communicated or required to be communicated to the audit committee and that: (1) relaterelates to accounts or disclosures that are material to the financial statements and (2) involved our especially challenging, subjective or complex judgments. The communication of the critical audit mattersmatter does not alter in any way our opinion on the consolidated financial statements, taken as a whole, and we are not, by communicating the critical audit mattersmatter below, providing a separate opinionsopinion on the critical audit mattersmatter or on the accounts or disclosures to which they relate.it relates.
| | | | | |
| ImpairmentRealizability of Long-livedDeferred Tax Assets |
| Description of the Matter | As more fully described in Note 42 and Note 14 to the consolidated financial statements, during 2020,at December 31, 2023, the Company recorded an impairmenthad deferred tax assets related to deductible temporary differences and net loss carryforwards of $46.2 million, net of a $78.8 million valuation allowance. Deferred tax assets are reduced by a valuation allowance if, based on certain long-livedthe weight of all available evidence, in management’s judgment it is more likely than not that some portion, or all, of the deferred tax assets groups in Canada and United States. A severe decline in overall market conditions duringwill not be realized.
Auditing management’s assessment of the first quarterrealizability of 2020 primarily due to the COVID-19 pandemic and lower oil prices resulted in a decline in forecasted demand for the Company’s services. As a result of these conditions, the Company evaluated long-livedits deferred tax assets with impairment indicators for recoverability and determined that certain asset groups were not recoverable. As a result, the Company recognized an impairment loss of $50.5 million, which is the amount by which the carrying value exceeded the estimated fair value of these asset groups.
|
| Auditing the Company's fixed asset impairment measurement was complex and involved a high degree of subjectivity because the estimates underlyingassessment process includes scheduling the determinationuse of fair value involvethe applicable deferred tax assets, which includes management’s judgments on significant assumptions. In particular,related to the Company’s fair value estimate is sensitive to significant assumptions, such as occupancy levels, average daily rates, operating margin,forecasted turns of both deferred tax assets and the weighted average cost of capital. |
deferred tax liabilities.
| | | | | |
| How We Addressed the Matter in Our Audit | We obtained an understanding, evaluated the design, and tested the operating effectiveness of controls over the Company's process used to determineassess the fair valuerealizability of the asset groups and measure the long-lived asset impairment.its deferred tax assets. For example, we tested controls over management's reviewscheduling of the significant assumptions underlying the fair value determination.future reversal of existing taxable temporary differences.
|
| To test the Company’s impairment measurementassessment of the asset groups,realizability of its deferred tax assets, our audit procedures included, among others, assessing the valuation methodology and testing the significant assumptions discussed herein. For example, we compared the significant assumptions used by management to current industry and economic trends as well as to the historical results related to the occupancy, average daily rates, and operating margin. We assessed the historical accuracy of management’s estimates and performed sensitivity analyses of significant assumptions to evaluate the impact on the estimate cash flows for the asset groups that would result from changes in the significant assumptions. We also involved our valuation specialists to assist in our evaluation of the weighted average cost of capital assumption as well as the methodology and fair value model used in the estimate. We further tested the completeness and accuracy of the underlying data inCompany’s scheduling of the impairment calculations.reversal of existing temporary taxable differences. With the assistance of our tax specialists, we verified the appropriateness of the projected usage of tax attributes and assessed the reasonableness of the timing of the reversal of the deferred tax liabilities into taxable income. |
| | | | | |
| Asset Retirement Obligations |
Description of the Matter | As more fully described in Note 14 to the consolidated financial statements, at December 31, 2020, the carrying value of the Company’s asset retirement obligations was $15.0 million. The Company reviews the asset retirement obligations at least annually, or more often if facts and circumstances change related to the assumptions used in estimating the obligation.
|
| Auditing the Company’s asset retirement obligation required us to make subjective auditor judgments because estimates underlying the determination of the obligation were based on assumptions unique to the assets, including assumptions about projected restoration costs and the projected timing of settlement costs used to measure the obligation. Actual costs incurred in future periods could differ from amounts estimated. |
How We Addressed the Matter in Our Audit | We obtained an understanding, evaluated the design, and tested the operating effectiveness of controls over the Company's process used to calculate and measure the asset retirement obligations. For example, we tested controls over the asset retirement obligation estimation process and management’s review of the significant assumptions used in the estimation of the liability, including the amount and timing of retirement costs.
|
| To test the asset retirement obligation valuation, our audit procedures included, among others, assessing the valuation methodology, testing the significant assumptions discussed above, and testing the underlying data used by the Company in its analyses. We verified consistency between the projected timing of the settlement costs and management’s operating plan and regulatory requirements. We compared management’s estimated restoration costs to recently incurred retirement costs, third-party vendor estimates, or publicly available data. In addition, we performed sensitivity analysis to evaluate the change in obligations based on changes in the underlying assumptions. |
/s/ Ernst & Young LLP
We have served as the Company’s auditor since 2013.
Houston, Texas
February 26, 202129, 2024
Report of Independent Registered Public Accounting Firm
To the Shareholders and the Board of Directors of Civeo Corporation
Opinion on Internal Control over Financial Reporting
We have audited Civeo Corporation’s internal control over financial reporting as of December 31, 2020,2023, based on criteria established in Internal Control-Integrated Framework issued by the Committee of Sponsoring Organizations of the Treadway Commission (2013 framework) (the COSO criteria). In our opinion, Civeo Corporation (“the Company”) maintained, in all material respects, effective internal control over financial reporting as of December 31, 2020,2023, based on the COSO criteria.
We also have audited, in accordance with the standards of the Public Company Accounting Oversight Board (United States) (PCAOB), the consolidated balance sheets of the Company as of December 31, 20202023 and 2019,2022, and the related consolidated statements of operations, comprehensive loss,income (loss), changes in shareholders' equity and cash flows for each of the three years in the period ended December 31, 2020,2023, and the related notes and our report dated February 26, 202129, 2024 expressed an unqualified opinion thereon.
Basis for Opinion
The Company’s management is responsible for maintaining effective internal control over financial reporting and for its assessment of the effectiveness of internal control over financial reporting included in the accompanying Management’s annual report on internal control over financial reporting. Our responsibility is to express an opinion on the Company’s internal control over financial reporting based on our audit. We are a public accounting firm registered with the PCAOB and are required to be independent with respect to the Company in accordance with the U.S. federal securities laws and the applicable rules and regulations of the Securities and Exchange Commission and the PCAOB.
We conducted our audit in accordance with the standards of the PCAOB. Those standards require that we plan and perform the audit to obtain reasonable assurance about whether effective internal control over financial reporting was maintained in all material respects.
Our audit included obtaining an understanding of internal control over financial reporting, assessing the risk that a material weakness exists, testing and evaluating the design and operating effectiveness of internal control based on the assessed risk, and performing such other procedures as we considered necessary in the circumstances. We believe that our audit provides a reasonable basis for our opinion.
Definition and Limitations of Internal Control Over Financial Reporting
A company’s internal control over financial reporting is a process designed to provide reasonable assurance regarding the reliability of financial reporting and the preparation of financial statements for external purposes in accordance with generally accepted accounting principles. A company’s internal control over financial reporting includes those policies and procedures that (1) pertain to the maintenance of records that, in reasonable detail, accurately and fairly reflect the transactions and dispositions of the assets of the company; (2) provide reasonable assurance that transactions are recorded as necessary to permit preparation of financial statements in accordance with generally accepted accounting principles, and that receipts and expenditures of the company are being made only in accordance with authorizations of management and directors of the company; and (3) provide reasonable assurance regarding prevention or timely detection of unauthorized acquisition, use, or disposition of the company’s assets that could have a material effect on the financial statements.
Because of its inherent limitations, internal control over financial reporting may not prevent or detect misstatements. Also, projections of any evaluation of effectiveness to future periods are subject to the risk that controls may become inadequate because of changes in conditions, or that the degree of compliance with the policies or procedures may deteriorate.
/s/ Ernst & Young LLP
Houston, Texas
February 26, 202129, 2024
CIVEO CORPORATION
CONSOLIDATED STATEMENTS OF OPERATIONS
(In Thousands, Except Per Share Amounts)
| | | | YEAR ENDED DECEMBER 31, | | YEAR ENDED DECEMBER 31, |
| | | 2020 | | 2019 | | 2018 | | 2023 | | 2022 | | 2021 |
| Revenues: | Revenues: | | | | | |
| Service and other | |
| Service and other | |
| Service and other | Service and other | $ | 505,401 | | | $ | 492,700 | | | $ | 428,829 | |
| Rental | Rental | 16,817 | | | 27,993 | | | 20,079 | |
| Product | Product | 7,511 | | | 6,862 | | | 17,784 | |
| | | 529,729 | | | 527,555 | | | 466,692 | |
| Costs and expenses: | Costs and expenses: | | | | | |
| Service and other costs | Service and other costs | 361,505 | | | 338,923 | | | 296,097 | |
| Service and other costs | |
| Service and other costs | |
| Rental costs | Rental costs | 14,971 | | | 22,510 | | | 21,472 | |
| Product costs | Product costs | 5,612 | | | 5,381 | | | 14,845 | |
| Selling, general and administrative expenses | Selling, general and administrative expenses | 53,656 | | | 59,586 | | | 67,036 | |
| Depreciation and amortization expense | Depreciation and amortization expense | 96,547 | | | 123,768 | | | 125,846 | |
| Impairment expense | Impairment expense | 144,120 | | | 26,148 | | | 28,661 | |
| Gain on sale of McClelland Lake Lodge assets, net | |
| Other operating expense | Other operating expense | 506 | | | 290 | | | 790 | |
| | | 676,917 | | | 576,606 | | | 554,747 | |
| Operating loss | (147,188) | | | (49,051) | | | (88,055) | |
| Operating income | |
| | Interest expense | |
| Interest expense | |
| Interest expense | Interest expense | (16,687) | | | (27,383) | | | (26,258) | |
| Loss on extinguishment of debt | Loss on extinguishment of debt | (383) | | | 0 | | | (748) | |
| Interest income | Interest income | 20 | | | 78 | | | 226 | |
| Other income | Other income | 20,823 | | | 7,281 | | | 1,623 | |
| Loss before income taxes | (143,415) | | | (69,075) | | | (113,212) | |
| Income tax benefit | 10,635 | | | 10,741 | | | 31,365 | |
| Net loss | (132,780) | | | (58,334) | | | (81,847) | |
| Less: Net income attributable to noncontrolling interest | 1,470 | | | 157 | | | 396 | |
| Net loss attributable to Civeo Corporation | (134,250) | | | (58,491) | | | (82,243) | |
| Income before income taxes | |
| Income tax expense | |
| Net income | |
| Less: Net income (loss) attributable to noncontrolling interest | |
| Net income attributable to Civeo Corporation | |
| Less: Dividends attributable to Class A preferred shares | Less: Dividends attributable to Class A preferred shares | 1,887 | | | 1,849 | | | 49,589 | |
| Net loss attributable to Civeo common shareholders | $ | (136,137) | | | $ | (60,340) | | | $ | (131,832) | |
| Net income (loss) attributable to Civeo common shareholders | |
| | Per Share Data (see Note 8) (1) | |
| Basic net loss per share attributable to Civeo Corporation common shareholders | $ | (9.64) | | | $ | (4.33) | | | $ | (10.06) | |
| Per Share Data (see Note 6) | |
| | Diluted net loss per share attributable to Civeo Corporation common shareholders | $ | (9.64) | | | $ | (4.33) | | | $ | (10.06) | |
| Per Share Data (see Note 6) | |
| | Per Share Data (see Note 6) | |
| Basic net income (loss) per share attributable to Civeo Corporation common shareholders | |
| Basic net income (loss) per share attributable to Civeo Corporation common shareholders | |
| Basic net income (loss) per share attributable to Civeo Corporation common shareholders | |
| | Diluted net income (loss) per share attributable to Civeo Corporation common shareholders | |
| Diluted net income (loss) per share attributable to Civeo Corporation common shareholders | |
| Diluted net income (loss) per share attributable to Civeo Corporation common shareholders | |
| | Weighted average number of common shares outstanding: | Weighted average number of common shares outstanding: | |
| Weighted average number of common shares outstanding: | |
| Weighted average number of common shares outstanding: | |
| Basic | |
| Basic | |
| Basic | Basic | 14,129 | | | 13,921 | | | 13,103 | |
| Diluted | Diluted | 14,129 | | | 13,921 | | | 13,103 | |
(1)Reflects our 1-for-12 reverse share split that became effective November 19, 2020. See Note 1 - Description of Business and Basis of Presentation to the notes to the consolidated financial statements in Item 8 of this annual report for further discussion.
The accompanying notes are an integral part of these financial statements.
CIVEO CORPORATION
CONSOLIDATED STATEMENTS OF COMPREHENSIVE LOSSINCOME (LOSS)
(In Thousands)
| | | | | | | | | | | | | | | | | |
| | YEAR ENDED DECEMBER 31, |
| | 2020 | | 2019 | | 2018 |
| | | | | |
| Net loss | $ | (132,780) | | | $ | (58,334) | | | $ | (81,847) | |
| | | | | |
| Other comprehensive income (loss), net of taxes: | | | | | |
| Foreign currency translation adjustment, net of 0 taxes | 14,266 | | | 8,076 | | | (43,036) | |
| Total other comprehensive income (loss), net of taxes | 14,266 | | | 8,076 | | | (43,036) | |
| | | | | |
| Comprehensive loss | (118,514) | | | (50,258) | | | (124,883) | |
| Less: Comprehensive income attributable to noncontrolling interest | 1,552 | | | 157 | | | 396 | |
| Comprehensive loss attributable to Civeo Corporation | $ | (120,066) | | | $ | (50,415) | | | $ | (125,279) | |
| | | | | | | | | | | | | | | | | |
| | YEAR ENDED DECEMBER 31, |
| | 2023 | | 2022 | | 2021 |
| | | | | |
| Net income | $ | 29,730 | | | $ | 6,330 | | | $ | 2,497 | |
| | | | | |
| Other comprehensive income (loss), net of taxes: | | | | | |
| Foreign currency translation adjustment, net of zero taxes | 4,532 | | | (23,486) | | | (12,936) | |
| Total other comprehensive income (loss), net of taxes | 4,532 | | | (23,486) | | | (12,936) | |
| | | | | |
| Comprehensive income (loss) | 34,262 | | | (17,156) | | | (10,439) | |
| Less: Comprehensive income (loss) attributable to noncontrolling interest | (367) | | | 2,151 | | | 1,105 | |
| Comprehensive income (loss) attributable to Civeo Corporation | $ | 34,629 | | | $ | (19,307) | | | $ | (11,544) | |
The accompanying notes are an integral part of these financial statements.
CIVEO CORPORATION
CONSOLIDATED BALANCE SHEETS
(In Thousands)
| | DECEMBER 31, |
| 2020 | | 2019 |
| | DECEMBER 31, | | | | DECEMBER 31, |
| | 2023 | | | | 2023 | | 2022 |
| ASSETS | ASSETS | | | | |
| | Current assets: | Current assets: | |
| | Current assets: | |
| | Current assets: | |
| Cash and cash equivalents | |
| Cash and cash equivalents | |
| Cash and cash equivalents | Cash and cash equivalents | | $ | 6,155 | | | $ | 3,331 | |
| Accounts receivable, net | Accounts receivable, net | | 89,782 | | | 99,493 | |
| Inventories | Inventories | | 6,181 | | | 5,877 | |
| Prepaid expenses | Prepaid expenses | | 7,020 | | | 7,247 | |
| Other current assets | Other current assets | | 6,165 | | | 7,904 | |
| Assets held for sale | Assets held for sale | | 3,910 | | | 7,589 | |
| Total current assets | Total current assets | | 119,213 | | | 131,441 | |
| | Property, plant and equipment, net | Property, plant and equipment, net | | 486,930 | | | 590,309 | |
| Property, plant and equipment, net | |
| Property, plant and equipment, net | |
| Goodwill | Goodwill | | 8,729 | | | 110,173 | |
| Other intangible assets, net | Other intangible assets, net | | 99,749 | | | 111,837 | |
| Operating lease right-of-use assets | Operating lease right-of-use assets | | 22,606 | | | 24,876 | |
| Other noncurrent assets | Other noncurrent assets | | 3,626 | | | 1,276 | |
| Total assets | Total assets | | $ | 740,853 | | | $ | 969,912 | |
| | LIABILITIES AND SHAREHOLDERS’ EQUITY | LIABILITIES AND SHAREHOLDERS’ EQUITY | |
| LIABILITIES AND SHAREHOLDERS’ EQUITY | |
| LIABILITIES AND SHAREHOLDERS’ EQUITY | |
| | Current liabilities: | Current liabilities: | |
| | Current liabilities: | |
| | Current liabilities: | |
| Accounts payable | |
| Accounts payable | |
| Accounts payable | Accounts payable | | $ | 42,056 | | | $ | 36,971 | |
| Accrued liabilities | Accrued liabilities | | 27,349 | | | 21,755 | |
| Income taxes | Income taxes | | 203 | | | 328 | |
| Current portion of long-term debt | Current portion of long-term debt | | 34,585 | | | 35,080 | |
| Deferred revenue | Deferred revenue | | 6,812 | | | 7,165 | |
| Other current liabilities | Other current liabilities | | 5,760 | | | 8,741 | |
| Total current liabilities | Total current liabilities | | 116,765 | | | 110,040 | |
| | Long-term debt, less current maturities | Long-term debt, less current maturities | | 214,000 | | | 321,792 | |
| Long-term debt, less current maturities | |
| Long-term debt, less current maturities | |
| Deferred income taxes | Deferred income taxes | | 0 | | | 9,452 | |
| Operating lease liabilities | Operating lease liabilities | | 19,834 | | | 21,231 | |
| Other noncurrent liabilities | Other noncurrent liabilities | | 14,897 | | | 16,592 | |
| Total liabilities | Total liabilities | | 365,496 | | | 479,107 | |
| | Commitments and contingencies (Note 16) | | 0 | | 0 |
| Commitments and contingencies (Note 15) | |
| Commitments and contingencies (Note 15) | |
| Commitments and contingencies (Note 15) | | | |
| | Shareholders’ Equity: | |
| Preferred shares (Class A Series 1, 0 par value; 50,000,000 shares authorized, 9,042 shares issued and outstanding, respectively; aggregate liquidation preference of $95,514,031 and $93,627,392 as of December 31, 2020 and 2019) | | 60,016 | | | 58,129 | |
Common shares (0 par value; 46,000,000 (1) shares authorized, 14,478,878 shares and 14,304,670 shares issued, respectively, and 14,215,169 shares and 14,129,700 shares outstanding, respectively) | | 0 | | | 0 | |
| Shareholders’ equity: | |
| Shareholders’ equity: | |
| Shareholders’ equity: | |
| Preferred shares (Class A Series 1) | |
| Preferred shares (Class A Series 1) | |
| Preferred shares (Class A Series 1) | |
| Common shares (no par value; 46,000,000 shares authorized, 15,046,756 shares and 15,584,176 shares issued, respectively, and 14,680,081 shares and 15,217,501 shares outstanding, respectively) | |
| Additional paid-in capital | Additional paid-in capital | | 1,578,315 | | | 1,572,249 | |
| Accumulated deficit | Accumulated deficit | | (907,727) | | | (771,590) | |
| Common shares held in treasury at cost, 263,709 and 174,970 shares, respectively | | (6,930) | | | (5,472) | |
| Common shares held in treasury at cost, 366,675 and 366,675 shares, respectively | |
| Accumulated other comprehensive loss | Accumulated other comprehensive loss | | (348,989) | | | (363,173) | |
| Total Civeo Corporation shareholders’ equity | Total Civeo Corporation shareholders’ equity | | 374,685 | | | 490,143 | |
| Noncontrolling interest | Noncontrolling interest | | 672 | | | 662 | |
| Total shareholders’ equity | Total shareholders’ equity | | 375,357 | | | 490,805 | |
| Total liabilities and shareholders’ equity | Total liabilities and shareholders’ equity | | $ | 740,853 | | | $ | 969,912 | |
(1)Reflects our 1-for-12 reverse share split that became effective November 19, 2020. See Note 1 - Description of Business and Basis of Presentation to the notes to the consolidated financial statements in Item 8 of this annual report for further discussion.
The accompanying notes are an integral part of these financial statements.
CIVEO CORPORATION
CONSOLIDATED STATEMENTS OF CHANGES IN
SHAREHOLDERS’ EQUITY
(In Thousands)
| | | | Attributable to Civeo | |
| | | Preferred Shares | | Common Shares | | |
| | | | | Par Value | | Additional
Paid-in
Capital | | Accumulated
Deficit | | Treasury
Shares | | Accumulated
Other
Comprehensive
Income (Loss) | | Noncontrolling
Interest | | Total
Shareholders’
Equity |
| Balance, December 31, 2017 | $ | 0 | | | $ | 0 | | | $ | 1,383,934 | | | $ | (579,113) | | | $ | (358) | | | $ | (328,213) | | | $ | 117 | | | $ | 476,367 | |
| | |
| | |
| | |
| | |
| | |
| | |
| Balance, December 31, 2020 | |
| Balance, December 31, 2020 | |
| Balance, December 31, 2020 | |
| Net income | |
| Net income | |
| Net income | |
| Currency translation adjustment | |
| Currency translation adjustment | |
| Currency translation adjustment | |
| Dividends paid | |
| Dividends paid | |
| Dividends paid | |
| Paid-in-kind dividends attributable to Class A preferred shares | |
| Paid-in-kind dividends attributable to Class A preferred shares | |
| Paid-in-kind dividends attributable to Class A preferred shares | |
| Common shares repurchases | |
| Common shares repurchases | |
| Common shares repurchases | |
| Share-based compensation | |
| Share-based compensation | |
| Share-based compensation | |
| Balance, December 31, 2021 | |
| Balance, December 31, 2021 | |
| Balance, December 31, 2021 | |
| Net income | |
| Net income | |
| Net income | |
| Currency translation adjustment | |
| Currency translation adjustment | |
| Currency translation adjustment | |
| Dividends paid | |
| Dividends paid | |
| Dividends paid | |
| Paid-in-kind dividends attributable to Class A preferred shares | |
| Paid-in-kind dividends attributable to Class A preferred shares | |
| Paid-in-kind dividends attributable to Class A preferred shares | |
| Preferred shares repurchased | |
| Preferred shares repurchased | |
| Preferred shares repurchased | |
| Preferred shares converted to common shares | |
| Preferred shares converted to common shares | |
| Preferred shares converted to common shares | |
| Common shares repurchases | |
| Common shares repurchases | |
| Common shares repurchases | |
| Share-based compensation | |
| Share-based compensation | |
| Share-based compensation | |
| Balance, December 31, 2022 | |
| Balance, December 31, 2022 | |
| Balance, December 31, 2022 | |
| Net income (loss) | |
| Net income (loss) | |
| Net income (loss) | Net income (loss) | — | | | — | | | — | | | (82,243) | | | — | | | — | | | 396 | | | (81,847) | |
| Currency translation adjustment | Currency translation adjustment | — | | | — | | | — | | | — | | | — | | | (43,036) | | | — | | | (43,036) | |
| Dividends paid | — | | | — | | | — | | | — | | | — | | | — | | | (513) | | | (513) | |
Cumulative effect of implementation of ASU 2014-09 | — | | | — | | | — | | | 394 | | | — | | | — | | | — | | | 394 | |
| Issuance of shares for acquisitions | 6,972 | | | — | | | 166,882 | | | — | | | — | | | — | | | — | | | 173,854 | |
| Dividends attributable to Class A preferred shares | 49,308 | | | — | | | 281 | | | (49,589) | | | — | | | — | | | — | | | — | |
| Share-based compensation | — | | | — | | | 11,036 | | | — | | | (831) | | | — | | | — | | | 10,205 | |
| Balance, December 31, 2018 | $ | 56,280 | | | $ | 0 | | | $ | 1,562,133 | | | $ | (710,551) | | | $ | (1,189) | | | $ | (371,249) | | | $ | 0 | | | $ | 535,424 | |
| Net income (loss) | — | | | — | | | — | | | (58,491) | | | — | | | — | | | 157 | | | (58,334) | |
| Currency translation adjustment | |
| Currency translation adjustment | Currency translation adjustment | — | | | — | | | — | | | — | | | — | | | 8,076 | | | — | | | 8,076 | |
| Dividends paid | Dividends paid | — | | | — | | | — | | | — | | | — | | | — | | | (182) | | | (182) | |
Cumulative effect of implementation of ASU 2016-02 | — | | | — | | | — | | | (699) | | | — | | | — | | | — | | | (699) | |
| Dividends attributable to Class A preferred shares | 1,849 | | | — | | | — | | | (1,849) | | | — | | | — | | | — | | | — | |
| Acquisition of noncontrolling interest | — | | | — | | | — | | | — | | | — | | | — | | | 687 | | | 687 | |
| Dividends paid | |
| Dividends paid | |
| Common shares repurchased | |
| Common shares repurchased | |
| Common shares repurchased | |
| Share-based compensation | Share-based compensation | — | | | — | | | 10,116 | | | — | | | (4,283) | | | — | | | — | | | 5,833 | |
| Balance, December 31, 2019 | $ | 58,129 | | | $ | 0 | | | $ | 1,572,249 | | | $ | (771,590) | | | $ | (5,472) | | | $ | (363,173) | | | $ | 662 | | | $ | 490,805 | |
| Net income (loss) | — | | | — | | | — | | | (134,250) | | | — | | | — | | | 1,470 | | | (132,780) | |
| Currency translation adjustment | — | | | — | | | — | | | — | | | — | | | 14,184 | | | 82 | | | 14,266 | |
| Dividends paid | — | | | — | | | — | | | — | | | — | | | — | | | (1,542) | | | (1,542) | |
| Dividends attributable to Class A preferred shares | 1,887 | | | — | | | — | | | (1,887) | | | — | | | — | | | — | | | — | |
| Share-based compensation | Share-based compensation | — | | | — | | | 6,066 | | | — | | | (1,458) | | | — | | | — | | | 4,608 | |
| Balance, December 31, 2020 | $ | 60,016 | | | $ | 0 | | | $ | 1,578,315 | | | $ | (907,727) | | | $ | (6,930) | | | $ | (348,989) | | | $ | 672 | | | $ | 375,357 | |
| Share-based compensation | |
| Balance, December 31, 2023 | |
| Balance, December 31, 2023 | |
| Balance, December 31, 2023 | |
| | | | Preferred
Shares | | Common Shares (in thousands) (1) | | Preferred
Shares | | Common Shares (in thousands) |
| Balance, December 31, 2017 | 0 | | | 11,022 | |
| Issuance of shares for acquisitions | 9,042 | | | 2,665 | |
| Balance, December 31, 2020 | |
| Share-based compensation | Share-based compensation | 0 | | | 141 | |
| Balance, December 31, 2018 | 9,042 | | | 13,828 | |
| Shares repurchased | |
| Balance, December 31, 2021 | |
| Share-based compensation | Share-based compensation | 0 | | | 302 | |
| Balance, December 31, 2019 | 9,042 | | | 14,130 | |
| Shares repurchased | |
| Preferred shares converted to common shares | |
| Balance, December 31, 2022 | |
| Share-based compensation | Share-based compensation | 0 | | | 85 | |
| Balance, December 31, 2020 | 9,042 | | | 14,215 | |
| Shares repurchased | |
| Balance, December 31, 2023 | |
(1)Reflects our 1-for-12 reverse share split that became effective November 19, 2020. See Note 1 - Description of Business and Basis of Presentation to the notes to the consolidated financial statements in Item 8 of this annual report for further discussion.
The accompanying notes are an integral part of these financial statements.
CIVEO CORPORATION
CONSOLIDATED STATEMENTS OF CASH FLOWS
(In Thousands)
| | | | YEAR ENDED DECEMBER 31, | | YEAR ENDED DECEMBER 31, |
| | | 2020 | | 2019 | | 2018 | | 2023 | | 2022 | | 2021 |
| Cash flows from operating activities: | Cash flows from operating activities: | | | | | |
| Net loss | $ | (132,780) | | | $ | (58,334) | | | $ | (81,847) | |
| Adjustments to reconcile net loss to net cash provided by operating activities: | |
| Net income | |
| Net income | |
| Net income | |
| Adjustments to reconcile net income to net cash provided by operating activities: | |
| Depreciation and amortization | |
| Depreciation and amortization | |
| Depreciation and amortization | Depreciation and amortization | 96,547 | | | 123,768 | | | 125,846 | |
| Impairment charges | Impairment charges | 144,120 | | | 26,148 | | | 28,661 | |
| | Loss on extinguishment of debt | Loss on extinguishment of debt | 383 | | | 0 | | | 748 | |
| Deferred income tax benefit | (11,122) | | | (11,713) | | | (31,403) | |
| Loss on extinguishment of debt | |
| Loss on extinguishment of debt | |
| Deferred income tax expense | |
| Non-cash compensation charge | Non-cash compensation charge | 6,066 | | | 10,116 | | | 11,036 | |
| Gain on disposals of assets | Gain on disposals of assets | (2,905) | | | (3,882) | | | (1,606) | |
| Provision (benefit) for credit losses, net of recoveries | 44 | | | (30) | | | (276) | |
| Provision for credit losses, net of recoveries | |
| Other, net | Other, net | (2,873) | | | 2,659 | | | 4,879 | |
| Changes in operating assets and liabilities: | Changes in operating assets and liabilities: | |
| Accounts receivable | |
| Accounts receivable | |
| Accounts receivable | Accounts receivable | 13,679 | | | (20,547) | | | 13,326 | |
| Inventories | Inventories | 171 | | | (87) | | | 3,376 | |
| Accounts payable and accrued liabilities | Accounts payable and accrued liabilities | 6,890 | | | 8,473 | | | (17,716) | |
| Taxes payable | Taxes payable | (134) | | | (75) | | | 5,310 | |
| Other current assets and liabilities, net | Other current assets and liabilities, net | (725) | | | (2,015) | | | (5,943) | |
| Net cash flows provided by operating activities | Net cash flows provided by operating activities | 117,361 | | | 74,481 | | | 54,391 | |
| | Cash flows from investing activities: | Cash flows from investing activities: | |
| Cash flows from investing activities: | |
| Cash flows from investing activities: | |
| Capital expenditures | Capital expenditures | (10,083) | | | (29,812) | | | (17,108) | |
| Payments related to acquisitions, net of cash acquired | 0 | | | (16,434) | | | (171,337) | |
| Capital expenditures | |
| Capital expenditures | |
| | Proceeds from disposition of property, plant and equipment | |
| Proceeds from disposition of property, plant and equipment | |
| Proceeds from disposition of property, plant and equipment | Proceeds from disposition of property, plant and equipment | 3,690 | | | 5,906 | | | 5,844 | |
| Other, net | Other, net | 4,619 | | | 1,762 | | | 654 | |
| Net cash flows used in investing activities | Net cash flows used in investing activities | (1,774) | | | (38,578) | | | (181,947) | |
| | Cash flows from financing activities: | Cash flows from financing activities: | |
| Cash flows from financing activities: | |
| Cash flows from financing activities: | |
| Revolving credit borrowings | |
| Revolving credit borrowings | |
| Revolving credit borrowings | Revolving credit borrowings | 377,604 | | | 381,615 | | | 358,312 | |
| Revolving credit repayments | Revolving credit repayments | (447,914) | | | (385,071) | | | (217,339) | |
| Term loan repayments | Term loan repayments | (39,855) | | | (34,942) | | | (26,609) | |
| Dividends paid | |
| Debt issuance costs | Debt issuance costs | (2,583) | | | (1,950) | | | (4,009) | |
| Repurchases of common shares | |
| Repurchases of preferred shares | |
| Other, net | Other, net | (1,458) | | | (4,283) | | | (832) | |
| Net cash flows provided by (used in) financing activities | (114,206) | | | (44,631) | | | 109,523 | |
| Net cash flows used in financing activities | |
| | Effect of exchange rate changes on cash | |
| Effect of exchange rate changes on cash | |
| Effect of exchange rate changes on cash | Effect of exchange rate changes on cash | 1,443 | | | (313) | | | (2,242) | |
| Net change in cash and cash equivalents | Net change in cash and cash equivalents | 2,824 | | | (9,041) | | | (20,275) | |
| Cash and cash equivalents, beginning of period | Cash and cash equivalents, beginning of period | 3,331 | | | 12,372 | | | 32,647 | |
| | Cash and cash equivalents, end of period | Cash and cash equivalents, end of period | $ | 6,155 | | | $ | 3,331 | | | $ | 12,372 | |
| Cash and cash equivalents, end of period | |
| Cash and cash equivalents, end of period | |
| | Non-cash investing activities: | Non-cash investing activities: | |
| Value of common shares issued as consideration for acquisitions | 0 | | | 0 | | | 119,797 | |
| Value of preferred shares issued as consideration for acquisition | 0 | | | 0 | | | 54,821 | |
| Non-cash investing activities: | |
| Non-cash investing activities: | |
| Capital expenditure additions accrued at end of period | |
| Capital expenditure additions accrued at end of period | |
| Capital expenditure additions accrued at end of period | Capital expenditure additions accrued at end of period | 933 | | | 0 | | | 0 | |
| | Non-cash financing activities: | Non-cash financing activities: | |
| Non-cash financing activities: | |
| Non-cash financing activities: | |
| Preferred dividends paid-in-kind | Preferred dividends paid-in-kind | 1,887 | | | 1,849 | | | 1,459 | |
| Preferred dividends paid-in-kind | |
| Preferred dividends paid-in-kind | |
The accompanying notes are an integral part of these financial statements.
1.DESCRIPTION OF BUSINESS AND BASIS OF PRESENTATION
Description of the Business
We provide hospitality services to the natural resources industry in Canada, Australia and the U.S. We provide a full suite of hospitality services for our guests in the natural resources industry, including lodging, catering and food service, housekeeping and maintenance at accommodation facilities that we or our customers own. In many cases, we provide services that support the day-to-day operations of accommodationthese facilities, such as laundry, facility management and maintenance, water and wastewater treatment, power generation, communication systems, security and logistics. We also offermanage development activities for workforce accommodation facilities, including site selection, permitting, engineering and design, manufacturing management and site construction, along with providing hospitality services once the facility is constructed. We primarily operate in some of the world’s most active oil, metallurgical (met) coal, liquefied natural gas (LNG) and iron ore producing regions, and our customers include major and independent oil companies, mining companies, engineering companies and oilfield and mining service companies. We operate in 3two principal reportable business segments – Canada Australia and the U.S.Australia.
Basis of Presentation
Unless otherwise stated or the context otherwise indicates: (i) all references in these consolidated financial statements to “Civeo,” “us,” “our” or “we” refer to Civeo Corporation and its consolidated subsidiaries; and (ii) all references in this report to “dollars” or “$” are to U.S. dollars.
Reverse Share Split
On November 19, 2020, we effected a reverse share split where each twelve issued and outstanding common shares were converted into one common share. Our common shares began trading on a reverse share split adjusted basis on November 19, 2020. A total of 14,215,169 common shares were issued and outstanding immediately after the reverse share split. No fractional shares were outstanding following the reverse share split. In lieu of any fractional share, the aggregate number of common shares that a holder was entitled to was, if the fraction was less than half a common share, rounded down to the next closest whole number of common shares, and if the fraction was at least half of a common share, rounded up to one whole common share.
The reverse share split did not affect the number of authorized or issued and outstanding shares of our preferred shares. As a result of the reverse share split, the conversion price for the Company’s outstanding Class A Series 1 preferred shares (Series A preferred shares) was automatically increased to $39.60 for each Series A preferred share (previously it was $3.30 per Series A preferred share).
All authorized, issued and outstanding shares and per share amounts contained in the accompanying consolidated financial statements have been adjusted to reflect this reverse share split for all prior periods presented.
2.SUMMARY OF SIGNIFICANT ACCOUNTING POLICIES
Cash
We consider all highly liquid investments purchased with an original maturity of three months or less to be cash equivalents.
Allowance for Credit Losses
We are exposed to credit losses primarily through the sale of our products and services. We maintain allowances for credit losses for estimated losses resulting from the inability of our customers to make required payments. If a trade receivable is deemed to be uncollectible, such receivable is charged-off against the allowance for credit losses account. Our expected loss allowance methodology for accounts receivable is developed using historical collection experience, current and future economic and market conditions and a review of the current status of customers' trade receivables. Due to the short-term nature of such receivables, the estimate of the amount of accounts receivable that may not be collected is based on an aging of the accounts receivable balances and the financial condition of customers. Additionally, specific allowance amounts are established to record the appropriate provision for customers that have a higher probability of default. If we have no previous experience with the customer, we typically obtain reports from various credit organizations to ensure that the customer has a history of paying its creditors. We may also request financial information, including combined financial statements or other documents, to ensure
that the customer has the means of making payment. If these factors do not indicate collection is reasonably assured, we generally would require a prepayment or other arrangement to support revenue recognition and recording of a trade receivable. If the financial condition of our customers were to deteriorate, adversely affecting their ability to make payments, additional allowances would be required.
Inventories
Inventories consist of work in process, raw materials and supplies and materials for the construction and operation of remote accommodation facilities. Inventories also include food, raw materials, labor, subcontractor charges manufacturing overhead and catering and other supplies needed for operation of our facilities. Inventories are carried at the lower of cost or market.net realizable value. The cost of inventories is determined on an average cost or specific-identification method.
Property, Plant and Equipment
Property, plant and equipment are stated at cost or at estimated fair market value at acquisition date if acquired in a business combination, and depreciation is computed, for assets owned or recorded under capital lease, using the straight-line method, after allowing for salvage value where applicable, over the estimated useful lives of the assets. Leasehold improvements are capitalized and amortized over the lesser of the life of the lease or the estimated useful life of the asset. During the first quarter of 2020, we extended the remaining useful life of certain long-lived accommodations assets in our U.S. segment. During the fourth quarter of 2019, we extended the remaining useful life of certain long-lived accommodations assets in our Canada segment.
We record the fair value of a liability, which reflects the estimated present value of the amount of asset removal and site reclamation costs related to the retirement of our assets, for an asset retirement obligation (ARO) when it is incurred (typically when the asset is installed). When the liability is initially recorded, we capitalize the associated asset retirement cost by increasing the carrying amount of the related property, plant and equipment. See Asset Retirement Obligations below for further discussion.
Expenditures for repairs and maintenance are charged to expense when incurred. Expenditures for major renewals and betterments, which extend the useful lives of existing equipment, are capitalized and depreciated. Upon retirement or disposition of property and equipment, the cost and related accumulated depreciation are removed from the accounts and any resulting gain or loss is recognized in the consolidated statements of operations.
Business Combinations
We evaluate acquisitions of assets and other similar transactions to assess whether or not the transaction should be accounted for as a business combination by assessing whether or not we have acquired inputs and processes that have the ability to create outputs. If determined to be a business combination, we account for a business acquisition under the acquisition method of accounting. The accounting rules governing business combinations require the acquiring entity in a business combination to recognize the fair value of all assets acquired and liabilities assumed and establish the acquisition date as the fair value measurement point. Accordingly, we recognize assets acquired and liabilities assumed in a business combination based on the fair value estimates as of the date of acquisition. Goodwill is measured as the excess of the fair value of the consideration paid over the fair value of the identified net assets, including intangible assets, acquired.
The fair value measurement of the identified net assets requires the significant use of estimates and is based on information that was available to management at the time the purchase price allocation was prepared. We utilize recognized valuation techniques, including the cost approach, the market approach and the income approach, to value the net assets acquired. The impact of changes to the estimated fair values of assets acquired and liabilities assumed is recorded in the reporting period in which the adjustment is identified. Final valuations of assets and liabilities are obtained and recorded within one year from the date of the acquisition.
Impairment of Long-Lived Assets
The recoverability of the carrying values of long-lived assets, including amortizable intangible assets, is assessed in step one whenever, in management’s judgment, events or changes in circumstances indicate that the carrying value of such asset groups may not be recoverable based on estimated future cash flows. If this assessment indicates that the carrying values will not be recoverable, as determined based on undiscounted cash flows over the remaining useful lives, an impairment loss is recognized. The impairment loss equals the excess of the carrying value over the fair value of the asset group.
In performing this analysis, the second step is to review asset groups are reviewed at the lowest level for which identifiable cash flows are largely independent of the cash flows of other assets and liabilities. For each asset group, we compare its carrying value to estimates of undiscounted future cash flows. We use a variety of underlying assumptions to estimate these future cash flows, including assumptions relating to future economic market conditions, rates, occupancy levels, costs and expenses and capital expenditures. The estimates are consistent with those used for purposes of our goodwill impairment test, as further discussed in Goodwill and Other Intangible Assets, below. Based on the assessment, if the carrying values of certain of our asset groups are determined to not be recoverable, we proceed to the thirdnext step. In this step, we compare the fair value of the respective asset group to its carrying value. The fair value of the asset groups are based on prices of similar assets, if available, or discounted future cash flows. Our estimate of the fair value requires us to use significant unobservable inputs, representative of Level 3 fair value measurements, including numerous assumptions with respect to future circumstances, such as industry and/or local market conditions that might directly impact each of the asset groups’ operations in the future.
See Note 4 – Impairment Charges for a discussion of impairment charges we recognized in 2020, 20192023, 2022 and 20182021 related to our long-lived assets.
Goodwill and Other Intangible Assets
Goodwill. Goodwill represents the excess of the purchase price paid for acquired businesses over the allocated fair value of the related net assets after impairments, if applicable. All of our goodwill as of December 31, 20202023 was included in our Australia reporting unit.
We evaluate goodwill for impairment, at the reporting unit level, annually and when an event occurs or circumstances change to suggest that the carrying amount may not be recoverable. A reporting unit is the operating segment, or a business one level below that operating segment (the “component” level) if discrete financial information is prepared and regularly reviewed by management at the component level. Each segment of our business represents a separate reporting unit.
In connection with the preparation of our financial statements for the three months ended March 31, 2020, we performed a quantitative goodwill impairment test as of March 31, 2020, which resulted in a reduction of the value of our goodwill in our Canadian reporting unit to 0. Please see Note 4 – Impairment Charges for further discussion of goodwill impairments recorded in the years ended December 31, 2020 and 2019.
We conduct our annual impairment test as of November 30 of each year. We compare each reporting unit’s carrying amount, including goodwill, to the fair value of the reporting unit. If the carrying amount of the reporting unit exceeds its fair value, goodwill is impaired.
We are given the option to test for impairment of our goodwill by first performing a qualitative assessment to determine whether it is more likely than not (that is, likelihood of more than 50 percent) that the fair value of a reporting unit is less than its carrying amount, including goodwill. If it is determined that it is more likely than not that the fair value of a reporting unit is greater than its carrying amount, then performing the currently prescribed quantitative impairment test is unnecessary. In developing a qualitative assessment to meet the “more-likely-than-not” threshold, each reporting unit with goodwill is assessed separately and different relevant events and circumstances are evaluated for each unit. We have the option to bypass the qualitative assessment for any reporting unit in any period and proceed directly to performing the quantitative goodwill impairment test.
When performing our annual assessment on November 30, 2020,2023, 2022 and 2021, we performed a qualitative assessment related to goodwill at our Australia reporting unit. Qualitative factors that we considered as part of our assessment included industry and market conditions, macroeconomic conditions and the financial performance of our Australian business. We also noted that, based on the interim quantitative testing performed as of March 31, 2020, the estimated fair value of the Australia reporting unit exceeded its carrying value by more than 125%. After assessing these events and circumstances, we determined that, as of November 30, 2023, it was more likely than not that the fair value of the Australia reporting unit was greater than its carrying value.
In performing the quantitative goodwill impairment test, we compare each reporting unit’s carrying amount, including goodwill, to the fair value of the reporting unit. Because none of our reporting units has a publicly quoted market price, we must determine the value that willing buyers and sellers would place on the reporting unit through a routine sale process (a Level 3 fair value measurement). In our analysis, we target a fair value that represents the value that would be placed on the reporting unit by market participants, and value the reporting unit based on historical and projected results throughout a cycle, not the value of the reporting unit based on trough or peak earnings. The fair value of the reporting unit is estimated using a
combination of (i) an analysis of trading multiples of comparable companies (Market Approach) and (ii) discounted projected cash flows (Income Approach). The relative weighting of each approach reflects current industry and market conditions.
Market Approach - This valuation approach utilizes publicly traded comparable companies’ enterprise values, as compared to their recent and forecasted earnings before interest, taxes and depreciation (EBITDA) information. We use EBITDA because it is a widely used key indicator of the cash generating capacity of companies in our industry.
Income Approach - This valuation approach derives a present value of the reporting unit’s projected future annual cash flows over the next five years with a terminal value assumption. We use a variety of underlying assumptions to estimate these future cash flows, including assumptions relating to future economic market conditions, rates, occupancy levels, costs and expenses and capital expenditures. These assumptions can vary by each reporting unit depending on market conditions. In addition, a terminal value is estimated, using a Gordon Growth methodology with a long-term growth rate of 2%.methodology. We discount our projected cash flows using a long-term weighted average cost of capital based on our estimate of investment returns that would be required by a market participant.
The fair value of our reporting units is affected by future oil, coal and natural gas prices, anticipated spending by our customers, and the cost of capital. Our estimate of fair value requires us to use significant unobservable inputs, representative of Level 3 fair value measurements, including numerous assumptions with respect to future circumstances, such as industry and/or local market conditions that might directly impact each of the reporting units’ operations in the future. We selected these valuation approaches because we believe the combination of these approaches and our best judgment regarding underlying assumptions and estimates provides us with the best estimate of fair value for each of our reporting units. We believe these valuation approaches are proven valuation techniques and methodologies for our industry and widely accepted by investors. The fair value of each reporting unit would change if our assumptions under these valuation approaches, or relative weighting of the valuation approaches, were materially modified.
Other Intangible Assets. We amortize the cost of other intangible assets using the straight-line method over their estimated useful lives unless such lives are deemed indefinite. For intangible assets that we amortize, we review the useful life of the intangible asset and evaluate each reporting period whether events and circumstances warrant a revision to the remaining useful life.
See Note 109 – Goodwill and Other Intangible Assets for further information.
Foreign Currency and Other Comprehensive Income
Gains and losses resulting from consolidated balance sheet translation of foreign operations where a foreign currency is the functional currency are included as a separate component of accumulated other comprehensive income within shareholders’ equity representingand represent substantially all of the balances within accumulated other comprehensive income. Remeasurements of intercompany loans denominated in a different currency than the functional currency of the entity that are of a long-term investment nature are recognized as other comprehensive income within shareholders’ equity. Gains and losses resulting from consolidated balance sheet remeasurements of assets and liabilities denominated in a different currency than the functional currency, other than intercompany loans that are of a long-term investment nature, are included in the consolidated statements of operations as incurred. For the years ended December 31, 2020, 2019,2023, 2022, and 2018,2021, we recognized approximately $0.5 million, $0.3$0.1 million and $0.8$0.3 million in foreign currency losses, respectively.
Foreign Currency Exchange Rate Risk
A significant portion of revenues, earnings and net investments in foreign affiliates are exposed to changes in foreign currency exchange rates. We seek to manage our foreign exchange risk in part through operational means, including managing expected local currency revenues in relation to local currency costs and local currency assets in relation to local currency liabilities. We have not entered into any foreign currency forward contracts.
Revenue and Cost Recognition
WeFor the majority of our operations and contracts, we generally recognize accommodation, mobile facility rental, food service and other services revenues over time as our customers simultaneously receive and consume benefits as we serve our customers because of continuous transfer of control to the customer. Revenue is recognized when control of the promised goods or services is transferred to our customers, in an amount that reflects the consideration we expect to be entitled to in exchange for those goods or services. We transfer control and recognize a sale based on a periodic (usually daily) room rate each night a customer stays in our rooms or when the services are rendered. In some contracts, rates may vary over the contract term. In these cases, revenue may be deferred and recognized on a straight-line basis over the contract term. A limited portion of our revenue is recognized at a point in time when control transfers to the customer related to small modular construction and manufacturing contracts, minor food service arrangements and optional purchases our customers make for incidental services offered at our accommodation and mobile facilities.
For significant construction projects, manufacturing revenues are recognized over time with progress towards completion measured using the cost based input method as the basis to recognize revenue and an estimated profit. Billings on such contracts in excess of costs incurred and estimated profits are classified as deferred revenue. Costs incurred and estimated profits in excess of billings on these contracts are recognized as unbilled receivables. Management believes this input method is the most appropriate measure of progress to the satisfaction of a performance obligation on larger modular construction and manufacturing contracts. Provisions for estimated losses on uncompleted contracts are made in the period in which such losses are determined. Changes in job performance, job conditions, estimated profitability and final contract settlements may result in revisions to projected costs and revenue and are recognized in the period in which the revisions to estimates are identified and the amounts can be reasonably estimated. Factors that may affect future project costs and margins include weather, production efficiencies, availability and costs of labor, materials and subcomponents. These factors can significantly impact the accuracy of our estimates and materially impact our future reported earnings.
Because of control transferring over time, the majority of our revenue is recognized based on the extent of progress towards completion of the performance obligation. At contract inception, we assess the goods and services promised in our contracts with customers and identify a performance obligation for each promise to transfer our customers a good or service (or bundle of goods or services) that is distinct. Our customers typically contract for hospitality services under take-or-pay contracts with terms that most often range from several months to threemultiple years. Our contract terms generally provide for a rental rate for a reserved room and an occupied room rate that compensates us for services provided. We typically contract our facilities to our customers on a fee per day basis where the goods and services promised include lodging and meals. To identify the performance obligations, we consider all of the goods and services promised in the context of the contract and the pattern of transfer to our customers.
Revenues exclude taxes assessed based on revenues such as sales or value added taxes.
Cost of services includes labor, food, utility costs, cleaning supplies and other costs of operating our accommodations facilities. Cost of goods sold includes all direct material and labor costs and those costs related to contract performance, such as indirect labor, supplies, tools and repairs. Selling, general and administrative costs are charged to expense as incurred.
Income Taxes
Our operations are subject to Canadian federal and provincial income taxes, as well as foreign income taxes. We determine the provision for income taxes using the asset and liability approach. Under this approach, deferred income taxes represent the expected future tax consequences of temporary differences between the carrying amounts and tax bases of assets and liabilities.
Valuation allowances are established when necessary to reduce deferred tax assets to the amounts expected to be realized. In assessing the need for a valuation allowance, we look to the future reversal of existing taxable temporary differences, taxable income in carryback years, the feasibility of tax planning strategies and estimated future taxable income. The valuation allowance can be affected by changes to tax laws, changes to statutory tax rates and changes to future taxable income estimates and historical losses.
We recognize tax benefits from uncertain tax positions only if it is more likely than not that the tax position will be sustained on examination by the taxing authorities, based on the technical merits of the position. The tax benefits recognized in the consolidated financial statements from such positions are measured based on the largest benefit that has a greater than 50% likelihood of being realized upon ultimate settlement. See Note 1514 – Income Taxes for further information.
Receivables and Concentration of Credit Risk
Based on the nature of our customer base, we do not believe that we have any significant concentrations of credit risk other than our concentration in the Canadian oil sands and Australian mining industries. We evaluate the credit-worthiness of our significant, new and existing customers’ financial condition and, generally, we do not require collateral from our customers. For the year ended December 31, 2020,2023, each of Suncor Energy and Fortescue Metals Group Ltd and Imperial OilLtd. accounted for more than 10% of our revenues. For the year ended December 31, 2019,2022, each of Suncor Energy, Imperial Oil and Fort Hills Energy LPFortescue Metals Group Ltd. accounted for more than 10% of our revenues. For the year ended December 31, 2018,2021, each of Suncor Energy, Imperial Oil Fort Hills Energy LP and Suncor Energy Inc.Fortescue Metals Group Ltd. accounted for more than 10% of our revenues.
Asset Retirement Obligations
We have AROs that we are required to perform under law or contract once an asset is permanently taken out of service. We initially record the liability at fair value, which reflects the estimated present value of the amount of asset removal and site reclamation costs related to the retirement of our assets, for an ARO when it is incurred (typically when the asset is installed). When the liability is initially recorded, we capitalize the associated asset retirement cost by increasing the carrying amount of the related property, plant and equipment. Over time, the liability increases for the change in its present value, while the capitalized cost depreciates over the useful life of the related asset. Accretion expense is recognized over the estimated productive life of the related assets. If the fair value of the estimated ARO changes, an adjustment is recorded to both the ARO and the capitalized asset retirement cost. Revisions in estimated liabilities can result from changes in estimated inflation rates, changes in service and equipment costs and changes in the estimated timing of settling the ARO. We utilize current retirement costs to estimate the expected cash outflows for retirement obligations. We estimate the ultimate productive life of the properties and a risk-adjusted discount rate in order to determine the current present value of the obligation.
We relieve ARO liabilities when the related obligations are settled. Most of these obligations are not expected to be paid until many years in the future and will be funded from general company resources at the time of removal. See Note 1412 – Asset Retirement Obligations for further discussion.
Share-Based Compensation
We sponsor an equity participation plan in which certain of our key employees and non-employee directors participate. We measure the cost of employee services received in exchange for an award ofservice-based equity instrumentsawards (typically restricted share awards and deferred share awards) based on the grant-date fair value of the award. The grant-date fair value is calculated based on our share price on the grant-date. The resulting cost is recognized over the period during which an employee or non-employee director is required to provide service in exchange for the awards, usually the vesting period.
We also grant performance share awards. For awards granted in 2023 and 2022, awards are earned in amounts between 0% and 200% of the participant’s target performance share award, based on (i) the payout percentage associated with Civeo’s relative total shareholder return (TSR) rank among a peer group of other companies and (ii) the payout percentage associated with Civeo's cumulative operating cash flow over the performance period relative to a preset target. Awards granted in 2021 are earned in amounts between 0% and 200% of the participant’s target performance share award, based on (i) the payout percentage associated with Civeo’s relative TSR rank among a peer group of other companies and (ii) the payout percentage associated with Civeo's cumulative free cash flow over the performance period relative to a preset target. The fair value of the TSR portion of each performance share is estimated using option-pricing models at the grant date. The fair value of the operating cash flow and free cash flow portion of each performance share is based on the closing market price of our common shares on the date of grant and adjusted throughout the performance period based on our estimate of the most probable outcome of such performance conditions. The resulting costs for each portion of the award are recognized over the period during which an employee is required to provide service in exchange for the awards, usually the vesting period.
Additionally, we grant phantom share units. All of the awards vest in equal annual installments and are accounted for as a liability based on the fair value of our share price. Participants granted phantom share units are entitled to a lump sum cash payment equal to the fair market value of a common share on the vesting date. The resulting cost is recognized over the period during which an employee is required to provide service in exchange for the awards, usually the vesting period.
We also grant performance share awards. These awards are earned in amounts between 0% and 200% of the participant’s target performance share award, based on the payout percentage associated with Civeo’s relative total shareholder return rank among a peer group of other companies. The fair value of the performance share is estimated using option-pricing models at the grant date. The resulting cost is recognized over the period during which an employee is required to provide service in exchange for the awards, usually the vesting period.
Additionally, we grant phantom shares. All of the awards vest in equal annual installments and are accounted for as a liability based on the fair value of our share price. Participants granted units of phantom shares are entitled to a lump sum cash payment equal to the fair market value of a common share on the vesting date.
Guarantees
Substantially all of our Canadian and U.S.United States (U.S.) subsidiaries are guarantors under our Amended Credit Agreement. See Note 11 – Debt.Debt for further discussion.
During the ordinary course of business, we also provide standby letters of credit or other guarantee instruments to certain parties as required for certain transactions initiated by us or our subsidiaries. As of December 31, 2020,2023, the maximum potential amount of future payments that we could be required to make under these guarantee agreements (letters(including letters of credit) was approximately $5.1$1.9 million. We have not recorded any liability in connection with these guarantee arrangements. We do not believe, based on historical experience and information currently available, that it is likely that any amounts will be required to be paid under these guarantee arrangements.
Use of Estimates
The preparation of consolidated financial statements in conformity with U.S. GAAPgenerally accepted accounting principles (U.S. GAAP) requires the use of estimates and assumptions by management in determining the reported amounts of assets and liabilities and disclosures of contingent assets and liabilities at the date of the consolidated financial statements and the reported amounts of revenues and expenses during the reporting period. Examples of a few such estimates include revenue and income recognized on the cost-based input method, estimates of the amount and timing of costs to be incurred for AROs, any valuation allowance recorded on net deferred tax assets, warranty claims, long-lived asset and goodwill impairments and allowance for credit losses. Actual results could materially differ from those estimates.
Accounting for Contingencies
We have contingent liabilities and future claims for which we have made estimates of the amount of the eventual cost to liquidate these liabilities or claims. We make an assessment of our exposure and record a provision in our accounts to cover an expected loss when we believe a loss is probable and the amount of the loss can be reasonably estimated. These liabilities and claims sometimes involve threatened or actual litigation where damages have been quantified. Other claims or liabilities have been estimated based on their fair value or our experience in these matters and, when appropriate, the advice of outside counsel or other outside experts. Upon the ultimate resolution of these uncertainties, our future reported financial results will be impacted by the difference between our estimates and the actual amounts paid to settle a liability. Examples of areas where we have made important estimates of future liabilities include litigation, taxes, interest, insurance claims, warranty claims, contract claims and obligations.
Recent Accounting Pronouncements
From time to time, new accounting pronouncements are issued by the Financial Accounting Standards Board (the FASB)(FASB), which are adopted by us as of the specified effective date. Unless otherwise discussed, management believes that the impact of recently issued standards or other guidance updates, which are not yet effective, will not have a material impact on our consolidated financial statements upon adoption.
In June 2016,November 2023, the FASB issued Accounting Standards Update (ASU) 2023-07, “Segment Reporting (Topic 280): Improvements to Reportable Segment Disclosures”, which updates reportable segment disclosure requirements primarily through enhanced disclosures about significant segment expenses. The amendments are effective for fiscal years beginning after December 15, 2023, and for interim periods within fiscal years beginning after December 15, 2024. Early adoption is permitted. The amendments should be applied retrospectively to all prior periods presented in the financial statements. We are currently evaluating this ASU to determine its impact on our disclosures.
In December 2023, the FASB issued ASU 2016-13, “Financial Instruments – Credit Losses” (ASU 2016-13). This new standard changes how companies measure credit losses2023-09, “Income Taxes (Topic 740): Improvements to Income Tax Disclosures”, which enhances effective tax rate reconciliation disclosure requirements and provides clarity to the disclosures of income taxes paid, income before taxes and provision for most financial assets and certain other instruments thatincome taxes. The amendments are not measured at fair value through net income. ASU 2016-13 is effective for financial statements issued for reporting periodsfiscal years beginning after December 15, 2019 and interim periods within the reporting periods.2024. Early adoption is permitted for annual financial statements that have not yet been issued or made available for issuance. The amendments in this update should be applied on a prospective basis. Retrospective application is permitted. We adoptedare currently evaluating this ASU 2016-13 as of January 1, 2020. The adoption of this new standard did not have a materialto determine its impact on our consolidated financial statements.
3.REVENUE
The following table disaggregates our revenue by our 3two reportable segments: Canada, Australiasegments (Canada and the U.S., andAustralia) into major categories for the years ended December 31, 2020, 20192023, 2022 and 20182021 (in thousands):
| | | | 2020 | | 2019 | | 2018 | | 2023 | | 2022 | | 2021 |
| Canada | Canada | | | | | | Canada | | | |
| Accommodation revenues | Accommodation revenues | $ | 202,534 | | | $ | 281,577 | | | $ | 266,899 | |
| Mobile facility rental revenues | Mobile facility rental revenues | 33,192 | | | 9,575 | | | 9,316 | |
| Food service and other services revenues | Food service and other services revenues | 33,923 | | | 33,485 | | | 15,601 | |
| Manufacturing revenues | 0 | | | 1,014 | | | 4,196 | |
| | Total Canada revenues | |
| Total Canada revenues | |
| Total Canada revenues | Total Canada revenues | 269,649 | | | 325,651 | | | 296,012 | |
| | Australia | Australia | |
| Australia | |
| Australia | |
| Accommodation revenues | |
| Accommodation revenues | |
| Accommodation revenues | Accommodation revenues | $ | 144,070 | | | $ | 126,047 | | | $ | 117,896 | |
| Food service and other services revenues | Food service and other services revenues | 90,472 | | | 30,046 | | | 1,342 | |
| Total Australia revenues | Total Australia revenues | 234,542 | | | 156,093 | | | 119,238 | |
| | U.S. | |
| Accommodation revenues | $ | 2,451 | | | $ | 12,462 | | | $ | 18,288 | |
| Mobile facility rental revenues | 16,837 | | | 28,119 | | | 20,389 | |
| Manufacturing revenues | 6,200 | | | 5,085 | | | 12,595 | |
| Food service and other services revenues | 50 | | | 145 | | | 170 | |
| Total U.S. revenues | 25,538 | | | 45,811 | | | 51,442 | |
| Other | |
| Other | |
| Other | |
| Other revenues | |
| Other revenues | |
| Other revenues | |
| | Total other revenues | |
| | Total other revenues | |
| | Total other revenues | |
| | Total revenues | Total revenues | $ | 529,729 | | | $ | 527,555 | | | $ | 466,692 | |
| Total revenues | |
| Total revenues | |
Our payment terms vary by the type and location of our customer and the products or services offered. The term between invoicing and when our performance obligations are satisfied is not significant. Payment terms are generally within 30 days and in most cases do not extend beyond 60 days. We do not have significant financing components or significant payment terms.
As of December 31, 2020,2023, for contracts that are greater than one year, the table below discloses the estimated revenues related to performance obligations that are unsatisfied (or partially unsatisfied) and when we expect to recognize the revenue. The table only includes revenue expected to be recognized from contracts where the quantity of service is certain (in thousands):
| | | | | | | | | | | | | | | | | | | | | | | | | | | | | |
| | For the years ending December 31, |
| | 2021 | | 2022 | | 2023 | | Thereafter | | Total |
| Revenue expected to be recognized as of December 31, 2020 | $ | 102,297 | | | $ | 68,705 | | | $ | 10,523 | | | $ | 0 | | | $ | 181,525 | |
| | | | | | | | | | | | | | | | | | | | | | | | | | | | | |
| | For the years ending December 31, |
| | 2024 | | 2025 | | 2026 | | Thereafter | | Total |
| Revenue expected to be recognized as of December 31, 2023 | $ | 166,047 | | | $ | 126,082 | | | $ | 95,196 | | | $ | 295,371 | | | $ | 682,696 | |
We applied the practical expedient and do not disclose consideration for remaining performance obligations with an original expected duration of one year or less. In addition, we do not estimate revenues expected to be recognized related to unsatisfied performance obligations for contracts without minimum room commitments. The table above represents only a portion of our expected future consolidated revenues and it is not necessarily indicative of the expected trend in total revenues.
4.IMPAIRMENT CHARGES
20202023 Impairment Charges
The following summarizes pre-tax impairment charges recorded during 2020,2023, which are included in Impairment expense in our consolidated statements of operations (in thousands):
| | Canada | | Australia | | U.S. | | Total |
| Quarter ended March 31, 2020 | | | | | | | |
| Goodwill | $ | 93,606 | | | $ | 0 | | | $ | 0 | | | $ | 93,606 | |
| | | | | U.S. | |
| | | | | U.S. | |
| | | | | U.S. | | | Total |
| Quarter ended December 31, 2023 | |
| Long-lived assets | |
| Long-lived assets | |
| Long-lived assets | Long-lived assets | 38,075 | | | 0 | | | 12,439 | | | 50,514 | |
| Total | Total | $ | 131,681 | | | $ | 0 | | | $ | 12,439 | | | $ | 144,120 | |
Quarter ended MarchDecember 31, 20202023. During the firstfourth quarter of 2020, we recorded impairment expense related to goodwill and long-lived assets.
The spread of the COVID-19 coronavirus (COVID-19) and the response thereto during the first quarter of 2020 negatively impacted the global economy. The resulting unprecedented decline in oil demand, coupled with disagreements between Saudi Arabia and Russia about production limits, resulted in a collapse of global oil prices in March 2020, thereby creating unprecedented downward pressure on stock prices in the energy industry, particularly small-cap companies with operations in the U.S. and Canada, such as Civeo. As a result, we experienced a sustained reduction of our share price during the first quarter of 2020. Our market capitalization implied an enterprise value which was significantly less than the sum of the estimated fair values of our reporting units, and we determined that an indicator of a goodwill impairment was present as of March 31, 2020. Accordingly, we performed an interim goodwill impairment test as of March 31, 2020, and the carrying amount of our Canadian reporting unit exceeded the reporting unit's fair value. Based on the results of the impairment test, we reduced the value of our goodwill in our Canadian reporting unit to 0 and recognized impairment expense in the first quarter of 2020 of $93.6 million.
Furthermore, as a result of the decline in global oil prices and forecasts for a potentially protracted period of lower prices, as well as the goodwill impairment in our Canadian segment, we determined all asset groups within this segment had experienced a trigger that indicated that the carrying values might not be recoverable. Accordingly, we assessed the carrying value of each asset group to determine if it continued to be recoverable based on estimated future cash flows. Based on the assessment, the carrying values of certain asset groups were determined to not be fully recoverable, and we proceeded to compare the estimated fair value of these asset groups to their respective carrying values. As a result, certain asset groups were written down to their estimated fair values of $43.5 million and2023, we recorded impairment expense of $38.1$1.4 million, related to these long-lived assets.
Also, as a result of the decline in global oil prices and forecasts for a potentially protracted period of lower prices, we reviewed all asset groupsland located in our U.S. segment to determine if an indicator of impairment had occurred that would indicate that the carrying values of the asset groups in the segment might not be recoverable. We determined that certain asset groups within the segment had experienced an indicator of impairment, and thus we assessed the carrying values of our long-lived assets in the U.S. to determine if they continued to be recoverable based on estimated future cash flows. Based on the assessment, the carrying values of certain of our U.S. asset groups were determined to not be recoverable, and we proceeded to compare the estimated fair values of the asset groups to their respective carrying values. Accordingly, these assets weremarket. The land was written down to theirits estimated fair valuesvalue (less costs to sell) of $12.5 million and we recorded impairment expense of $12.4 million during the first quarter of 2020 related to these long-lived assets.$5.9 million.
20192022 Impairment Charges
The following summarizes pre-tax impairment charges recorded during 2019,2022, which are included in Impairment expense in our consolidated statements of operations (in thousands):
| | | Canada | | Australia | | U.S. | | Total |
| Quarter ended June 30, 2019 | | | | | | | |
| | | Australia | |
| | | Australia | |
| | | Australia | | | U.S. | | Total |
| Quarter ended December 31, 2022 | |
| Long-lived assets | Long-lived assets | $ | 0 | | | $ | 5,546 | | | $ | 0 | | | $ | 5,546 | |
| Quarter ended December 31, 2019 | |
| Long-lived assets | Long-lived assets | 702 | | | 0 | | | 0 | | | 702 | |
| Goodwill | 19,900 | | | 0 | | | 0 | | | 19,900 | |
| Long-lived assets | |
| Total | Total | $ | 20,602 | | | $ | 5,546 | | | $ | 0 | | | $ | 26,148 | |
Quarter ended December 31, 20192022. In performing our annual goodwill impairment test as of November 30, 2019, we compared the fair value of our reporting units to their respective carrying values. The carrying amount of our Canadian reporting unit exceeded the reporting unit's fair value. Based on the results of the impairment test, we recognized an impairment expense of $19.9 million related to our Canadian reporting unit.
During the fourth quarter of 2019,2022, we recorded an impairment expense of $0.7$3.8 million, related to corporate office spacefixed assets in Canada. The facility is closed and recorded at the estimated fair value (less costs to sell) and was reduceda village located in Western Australia. At December 31, 2022, we identified an impairment trigger due to a recent appraisal report.
Quarter ended June 30, 2019. During the second quarter of 2019, we identified indicatorsan expiring contract that certain long-lived assets in Australia may be impaired due to market developments, including the non-renewal of certain land development approval agreements. We assessed the carrying values of the related assets to determine if they continued to be recoverable based on estimated future cash flows. Based on the assessment, the carrying values were determined towas not be fully recoverable, and we proceeded to compare the estimated fair value of the assets to their respective carrying values.renewed. Accordingly, the assets were written down to their estimated fair valuesvalue of $0.5$1.8 million. As a result of the analysis described above,In addition, we recorded an impairment expense of $4.5$1.9 million, related to fixed assets in a lodge located in our U.S. market. The lodge was written down to its estimated fair value (less costs to sell) of $7.7 million.
Additionally, during the second quarter of 2019, we identified a liability related to an ARO at one of our villages in Australia that should have been recorded in 2011. We determined that the error was not material to our previously issued financial statements included in our Annual Report on Form 10-K for the year ended December 31, 2018, and therefore, corrected the error in the second quarter of 2019. Specifically, we recorded the following amounts in the second quarter 2019 unaudited consolidated statement of operations related to prior periods: (1) additional accretion expense related to the ARO of $0.9 million, (2) additional depreciation and amortization expense of $0.5 million related to amortization of the related asset retirement cost and (3) additional impairment expense related to the impairment of the asset retirement cost of $1.0 million offset by recognition of an ARO liability totaling $2.3 million as of June 30, 2019.2021 Impairment Charges
2018 Impairment Charges
The following summarizes pre-tax impairment charges recorded during 2019,2021, which are included in Impairment expense in our consolidated statements of operations (in thousands):
| | | Canada | | Australia | | U.S. | | Total |
| Quarter ended March 31, 2018 | | | | | | | |
| | | Australia | |
| | | Australia | |
| | | Australia | | | | | Total |
| Quarter ended June 30, 2021 | |
| Long-lived assets | |
| Long-lived assets | |
| Long-lived assets | Long-lived assets | $ | 28,661 | | | $ | 0 | | | $ | 0 | | | $ | 28,661 | |
| Total | Total | $ | 28,661 | | | $ | 0 | | | $ | 0 | | | $ | 28,661 | |
Quarter ended March 31, 2018June 30, 2021. During the firstsecond quarter of 2018,2021, we recorded impairment expense of $7.9 million related to various undeveloped land positions and related permitting costs in Australia. At June 30, 2021, we identified an indicator thatimpairment trigger related to certain long-lived assets used in the Canadian oil sands may be impaired due to market developments, including expected customer commitments, occurring in the first quarter of 2018. For purposes of our impairment assessment, we separated two lodges that were previously treated as a single asset groupthese properties due to the lodges no longer being used togethercancellation of a significant thermal coal project in Australia and our negative expectations related to generate joint cash flows. We assessedother possible Australian thermal coal projects becoming viable in the carrying value ofnear term. Accordingly, the asset groupassets were written down to determine if it continued to be recoverable based on estimated future cash flows. Based on the assessment, the carrying value was determined to not be fully recoverable, and we proceeded to compare thetheir estimated fair value of the asset group to its respective carrying value. Accordingly, the value of one of the lodges was written down to its estimated fair value of 0. As a result of the analysis described above, we recorded an impairment expense of $28.7$2.4 million.
5.FAIR VALUE MEASUREMENTS
Our financial instruments consist of cash and cash equivalents, receivables, payables and debt instruments. We believe that the carrying values of these instruments on the accompanying consolidated balance sheets approximate their fair values.
As of December 31, 20202023 and 2019,2022, we believe the carrying value of our floating-rate debt outstanding under our term loans and revolving credit facilities approximates fair value because the terms include short-term interest rates and exclude penalties for prepayment. We estimated the fair value of our floating-rate term loan and revolving credit facilities using significant other observable inputs, representative of a Level 2 fair value measurement, including terms and credit spreads for these loans. In addition, the estimated fair value of our assets held for sale is based upon Level 2 fair value measurements, which include appraisals, broker price opinions and previous negotiations with third parties.
During the first quarter of 2020 and the fourth quarter of 2019, we recorded goodwill impairment charges related to one of our reporting units. Our estimates of fair value required us to use significant unobservable inputs, representative of Level 3 fair value measurements, including numerous assumptions with respect to future circumstances that might directly impact each of2023 and 2022 and the relevant asset groups’ operations in the future and are therefore uncertain. These assumptions with respect to future circumstances included future cash flows, oil, met coal and natural gas prices, anticipated spending by our customers, the cost of capital, and industry and/or local market conditions. We estimated the fair value when conducting the firstsecond quarter of 2020 goodwill impairment test primarily using an income approach and we used a combination of income and market approaches when conducting the fourth quarter of 2019 goodwill impairment test. The discount rates used to value our reporting units for the first quarter of 2020 and the fourth quarter of 2019 for the goodwill impairment test ranged between 10.5% and 14.0%.
During the first quarter of 2020, the fourth and second quarters of 2019 and the first quarter of 2018,2021, we wrote down certain long-lived assets to fair value. During the first quarter of 2020 and 2018, we estimated the fair value when conducting the long-lived asset impairment tests primarily using an income approach. We used a variety of unobservable inputs and underlying assumptions consistent with those discussed above for purposes of our goodwill impairment test. The discount rates used to value our Canadian and U.S. segments long-lived asset impairment analysis ranged between 11.0% and 14.0%. During the fourth quarter of 2019,2023 and 2022, our estimate of fair value of corporate office spacea property in Canadathe U.S. was based on broker price opinions or appraisals from third parties, which referenced available market information, such as listing agreements, offers, and duringpending and closed sales. During the second quarter of 2019,2021 and the fourth quarter of 2022, our estimate of fair value of land in Australia for assets that were impaired was based on appraisals from third parties.
See Note 2 – Summary of Significant Accounting Policies – Impairment of Long-Lived Assets and Note 2 – Summary of Significant Accounting Policies – Goodwill and Other Intangible Assets for further discussion of the significant judgments and assumptions used in calculating their fair value.
6.EARNINGS PER SHARE
For the year ended December 31, 2023, we calculated our basic earnings per share by dividing net income (loss) attributable to common shareholders, before allocation of earnings to participating earnings by the weighted average number of common shares outstanding. For diluted earnings per share, the basic shares outstanding are adjusted by adding all potentially dilutive securities.
For the years ended December 31 2022 and 2018,2021, a period during which we acquired certain assets and businesses and recorded them at fair value. Determining the fair value of assets acquired and liabilities assumed required the exercise of significant judgment, including the amount and timing of expected future cash flows, long-term growth rates and discount rates. The cash flows employedhad participating securities in the valuation are based onform of Class A preferred shares, we used the two-class method to calculate basic and diluted earnings per share. The two-class method requires a proportional share of net income to be allocated between common shares and participating securities. The proportional share to be allocated to participating securities is determined by dividing total weighted average participating securities by the sum of total weighted average common shares and participating securities.
Basic earnings per share is computed under the two-class method by dividing the net income (loss) attributable to common shareholders, after allocation of earnings to participating earnings by the weighted average number of common shares outstanding during the period. Net income attributable to common shareholders, after allocation of earnings to participating earnings represents our best estimatesnet income reduced by an allocation of future sales,current period earnings to participating securities as described above. No such adjustment is made during periods with a net loss, as the adjustment would be anti-dilutive.
Diluted earnings per share is computed under the two-class method by dividing diluted net income (loss) attributable to common shareholders, after reallocation adjustment for participating securities by the weighted average number of common shares outstanding, plus, for periods with net income attributable to common stockholders, the potential dilutive effects of share-based awards. In addition, we calculate the potential dilutive effect of any outstanding dilutive security under both the two-class method and cash flows after considering factors suchthe “if-converted” method, and we report the more dilutive of the methods as general market conditions, expected future customer orders, contractsour diluted earnings per share. We also apply the treasury stock method with suppliers, labor costs, changesrespect to certain share-based awards in working capital, long-term business plansthe calculation of diluted earnings per share, if dilutive.
On October 30, 2022, we repurchased 3,617 Series A preferred shares from the holders for approximately $30.6 million. The repurchase premium of $5.2 million was treated as a reduction to the numerator of net income (loss) attributable to Civeo common shareholders utilized in the calculation of earnings per share for the year ended December 31, 2022.
The calculation of earnings per share attributable to Civeo common shareholders is presented below for the years ended December 31, 2023, 2022 and recent operating performance. See Note 7 – Acquisitions2021 (in thousands, except per share amounts):
| | | | | | | | | | | | | | | | | |
| | 2023 | | 2022 | | 2021 |
| Numerator: | | | | | |
| Net income attributable to Civeo common shareholders, before allocation of earnings to participating securities | $ | 30,157 | | | $ | 2,226 | | | $ | (575) | |
| Less: premium paid for repurchase of preferred shares | — | | | (5,189) | | | — | |
| Less: income allocated to participating securities | — | | | — | | | — | |
| Net income (loss) attributable to Civeo Corporation common shareholders, after allocation of earnings to participating securities | $ | 30,157 | | | $ | (2,963) | | | $ | (575) | |
| Add: undistributed income attributable to participating securities | — | | | — | | | — | |
| Less: undistributed income reallocated to participating securities | — | | | — | | | — | |
| Diluted net income (loss) attributable to Civeo Corporation common shareholders, after reallocation adjustment for participating securities | $ | 30,157 | | | $ | (2,963) | | | $ | (575) | |
| | | | | |
| Denominator: | | | | | |
| Weighted average shares outstanding - basic | 14,906 | | | 14,002 | | | 14,232 | |
| Dilutive shares - share-based awards | 107 | | | — | | | — | |
| Weighted average shares outstanding - diluted | 15,013 | | | 14,002 | | | 14,232 | |
| | | | | |
Basic net income (loss) per share attributable to Civeo Corporation common shareholders (1) | $ | 2.02 | | | $ | (0.21) | | | $ | (0.04) | |
| | | | | |
Diluted net income (loss) per share attributable to Civeo Corporation common shareholders (1) | $ | 2.01 | | | $ | (0.21) | | | $ | (0.04) | |
(1)Computations may reflect rounding adjustments.
The following common share equivalents have been excluded from the calculation of weighted-average common shares outstanding because the effect is anti-dilutive for further information. the years ended December 31, 2023, 2022 and 2021 (in millions of shares):
| | | | | | | | | | | | | | | | | | | |
| | 2023 | | 2022 | | 2021 | | |
Share-based awards (1) | — | | | 0.2 | | | 0.2 | | | |
| Preferred shares | — | | | 2,240 | | | 2,461 | | | |
(1)Share-based awards for the year ended December 31, 2023 totaled fewer than 0.1 million shares.
6.7.DETAILS OF SELECTED BALANCE SHEET ACCOUNTS
Additional information regarding selected balance sheet accounts at December 31, 20202023 and 20192022 is presented below (in thousands):
| | | | December 31, 2020 | | December 31, 2019 | | December 31, 2023 | | December 31, 2022 |
| Accounts receivable, net: | Accounts receivable, net: | | | |
| Trade | Trade | $ | 66,071 | | | $ | 76,370 | |
| Trade | |
| Trade | |
| Unbilled revenue | Unbilled revenue | 22,565 | | | 23,041 | |
Other (1) | 1,421 | | | 335 | |
| Other | |
| Total accounts receivable | Total accounts receivable | 90,057 | | | 99,746 | |
| Allowance for credit losses | Allowance for credit losses | (275) | | | (253) | |
| Total accounts receivable, net | Total accounts receivable, net | $ | 89,782 | | | $ | 99,493 | |
| | | | | | | | | | | |
| | December 31, 2023 | | December 31, 2022 |
| Inventories: | | | |
| Finished goods and purchased products | $ | 5,648 | | | $ | 5,538 | |
| | | |
| Raw materials | 1,334 | | | 1,369 | |
| Total inventories | $ | 6,982 | | | $ | 6,907 | |
(1)As of December 31, 2020, Other accounts receivable includes a $1.1 million receivable related to the Canada Emergency Wage Subsidy (CEWS), a subsidy implemented by the Canadian government in response to the COVID-19 pandemic. Income related to the CEWS for the year ended December 31, 2020 was $13.0 million and is included in Other income on the accompanying consolidated statement of operations. | | | | | | | | | | | | | | | | | |
| | Estimated
Useful Life
(in years) | | December 31, 2023 | | December 31, 2022 |
| Property, plant and equipment, net: | | | | | |
| Land | | | $ | 27,988 | | | $ | 25,528 | |
| Accommodations assets | 3-15 | | 1,378,408 | | | 1,464,476 | |
| Buildings and leasehold improvements | 7-20 | | 14,603 | | | 15,516 | |
| Machinery and equipment | 4-7 | | 13,255 | | | 11,775 | |
| Office furniture and equipment | 3-7 | | 67,248 | | | 62,725 | |
| Vehicles | 3-5 | | 10,025 | | | 8,411 | |
| Construction in progress | | | 12,087 | | | 1,771 | |
| Total property, plant and equipment | | | 1,523,614 | | | 1,590,202 | |
| Accumulated depreciation | | | (1,253,051) | | | (1,288,312) | |
| Total property, plant and equipment, net | | | $ | 270,563 | | | $ | 301,890 | |
| | | | | | | | | | | |
| | December 31, 2023 | | December 31, 2022 |
| Accrued liabilities: | | | |
| Accrued compensation | $ | 33,854 | | | $ | 34,358 | |
| Accrued taxes, other than income taxes | 3,997 | | | 2,873 | |
| | | |
| Other | 2,672 | | | 1,980 | |
| Total accrued liabilities | $ | 40,523 | | | $ | 39,211 | |
91
| | | | | | | | | | | |
| | December 31, 2020 | | December 31, 2019 |
| Inventories: | | | |
| Finished goods and purchased products | $ | 5,047 | | | $ | 3,982 | |
| Work in process | 45 | | | 813 | |
| Raw materials | 1,089 | | | 1,082 | |
| Total inventories | $ | 6,181 | | | $ | 5,877 | |
| | | | | | | | | | | |
| December 31, 2023 | | December 31, 2022 |
| Contract liabilities (Deferred revenue): | | | |
Current contract liabilities (1) | $ | 4,849 | | | $ | 991 | |
Noncurrent contract liabilities (1) | 8,068 | | | — | |
| Total contract liabilities (Deferred revenue) | $ | 12,917 | | | $ | 991 | |
| | | | | | | | | | | | | | | | | |
| | Estimated
Useful Life
(in years) | | December 31, 2020 | | December 31, 2019 |
| Property, plant and equipment, net: | | | | | |
| Land | | | $ | 47,751 | | | $ | 43,147 | |
| Accommodations assets | 3-15 | | 1,737,620 | | | 1,696,425 | |
| Buildings and leasehold improvements | 7-20 | | 28,831 | | | 26,108 | |
| Machinery and equipment | 4-15 | | 12,784 | | | 12,060 | |
| Office furniture and equipment | 3-7 | | 61,850 | | | 58,005 | |
| Vehicles | 3-5 | | 15,363 | | | 14,604 | |
| Construction in progress | | | 5,523 | | | 4,286 | |
| Total property, plant and equipment | | | 1,909,722 | | | 1,854,635 | |
| Accumulated depreciation | | | (1,422,792) | | | (1,264,326) | |
| Total property, plant and equipment, net | | | $ | 486,930 | | | $ | 590,309 | |
(1)Current contract liabilities and Noncurrent contract liabilities are included in "Deferred revenue" and "Other noncurrent liabilities," respectively, in our consolidated balance sheets.
As
Deferred revenue typically consists of upfront payments received before we satisfy the associated performance obligation. The increase in deferred revenue from December 31, 2020, assets held2022 to December 31, 2023 was due to payments received from a customer for sale includes $3.9 millionvillage enhancements in Australia and a payment received from a customer related to our modular construction and manufacturing plant near Edmonton, Alberta, Canada.an asset transportation contract, which will all be recognized over the contracted terms.
| | | | | | | | | | | |
| | December 31, 2020 | | December 31, 2019 |
| Accrued liabilities: | | | |
| Accrued compensation | $ | 22,475 | | | $ | 17,169 | |
| Accrued taxes, other than income taxes | 3,099 | | | 3,152 | |
| | | |
| Other | 1,775 | | | 1,434 | |
| Total accrued liabilities | $ | 27,349 | | | $ | 21,755 | |
7.8.ACQUISITIONSASSETS HELD FOR SALE
As previously disclosedof December 31, 2023, assets held for sale included certain assets in Note 1 - Description of Business and Basis of Presentation, a 1-for-12 reverse share split became effective on November 19, 2020 for all authorized, issued and outstanding shares of Civeo common shares. Accordingly, all share amounts have been adjusted to reflect this reverse stock split for all prior periods presented.
Action
On July 1, 2019, we acquired Action, a provider of integrated services to the mining industry in Western Australia. We fundedU.S. These assets were recorded at the purchase price of $16.9 million in cash through a combination of cash on hand and borrowings under our revolving credit facility. Action's operations are reported as part of our Australia reporting business segment beginning on July 1, 2019, the date of acquisition.
This acquisition was accounted for in accordance with the acquisition method of accounting for business combinations, which required us to record the assets acquired and the liabilities assumed at their fair values at July 1, 2019. Our estimates of theestimated fair value less costs to sell, which exceeded or equaled their carry values. During the first quarter of 2023, we sold the accommodation assets in Louisiana. The land at this location remains in assets held for such assets and liabilities required significant assumptions and judgment. Based on the final purchase price allocation, intangible assets acquired totaled $8.4 million and consisted primarilysale as of customer contracts and a trade name. In addition, we recognized goodwill of $7.9 million.
Noralta
Description of Transaction. On April 2, 2018, we acquired the equity of Noralta. As a result of the Noralta Acquisition, we expanded our existing accommodations business in the Canadian oil sands market. The total consideration, which is subject to adjustment in accordance with the terms of the definitive agreement, included (i) C$207.7 million (or approximately US$161.2 million) in cash, subject to customary post-closing adjustments for working capital, indebtedness and transactions expenses, (ii) 2.7 million of our common shares, of which 1.1 million shares are held in escrow and will be released based on certain conditions related to Noralta customer contracts remaining in place, and (iii) 9,679 Class A Series 1 Preferred Shares (the Preferred Shares) with an initial liquidation preference of $96.8 million and initially convertible into 2.4 million of our common shares. We funded the cash consideration with cash on hand and borrowings under our revolving credit facility.December 31, 2023.
During the second quarter of 2020, $5.0 million in cash was released to us from escrow to cover certain agreed upon indemnification claims. As a result of this settlement, we recorded $4.7 million in Other income on the accompanying consolidated statement of operations for the year ended December 31, 2020. During the first quarter of 2019, $2.1 million in cash was released to us from escrow to cover certain agreed upon indemnification claims. During the fourth quarter of 2018, $10.4 million in cash, 0.2 million common shares and 637 Preferred Shares were released to us, and $1.2 million in cash, 15 thousand common shares and 55 Preferred Shares were released to the sellers, from escrow to cover purchase price adjustments related to employee compensation cost increases. During the third quarter of 2018, $3.62023, we entered into a definitive agreement to sell our McClelland Lake Lodge assets for approximately C$49 million, in cash was released to us from escrow to cover purchase price adjustmentsor US$36 million. The related to a working capital shortfall at closing.
The Noralta Acquisition was accounted for in accordance with the acquisition method of accounting for business combinations, and accordingly, the results of operations of Noralta were reported in our financial statements as part of our Canada reporting business segment beginning on April 2, 2018, the date of acquisition.assets had no remaining carrying value. During the year ended December 31, 2018,2023, we recorded approximately $85.8recognized $14.2 million in demobilization costs and received $28.2 million in cash proceeds associated with the sale. We expect to recognize the remaining demobilization costs and the proceeds of revenue and $31.5 million of gross marginthe sale in the accompanying consolidated statementsfirst quarter of operations related to the Noralta Acquisition.2024.
CalculationAs of Purchase Consideration. The total purchase consideration received byDecember 31, 2022, assets held for sale included certain assets in our Canadian business segment and the Noralta shareholders was based on the cash consideration and fair value of our common shares and Preferred Shares issued on April 2, 2018. The purchase consideration below reflects the fair value of common shares issued, which is based on the closing price on March 29, 2018 (the last business day prior to April 2, 2018) of our common shares of $45.24 per share andU.S. These assets were recorded at the estimated fair value less costs to sell, which exceeded their carrying values.
The following table summarizes the carrying amount as of Preferred Shares issued, which are valued at 61%December 31, 2023 and 2022 of the initial liquidation preference of the Preferred Shares of $96.8 million.assets classified as held for sale (in thousands):
A portion of the consideration paid, $11.6 million cash, 0.2 million common shares and 692 Preferred Shares, was initially held in escrow to support certain obligations of the sellers to compensate us for certain increased employee compensation costs expected to be incurred as a result of the union certification of certain classes of Noralta employees. As of April 2, 2018, we expected the escrowed amounts to be released to us within 12 months, and therefore, a receivable of $11.6 million related to the cash expected to be released was established. Additionally, no fair value has been allocated to such common shares or Preferred Shares portion of the consideration. As the $10.4 million of cash released to us during the fourth quarter of 2018 was less than the cash expected to be released as of April 2, 2018, we recognized a loss equal to the difference, adjusted for exchange rate changes, totaling $0.8 million. The loss is included in Other income in the accompanying consolidated statement of operations.
The purchase consideration and estimated fair value of Noralta’s net assets acquired as of April 2, 2018 is presented as follows:
| | | | | | | | | | | |
(In thousands, except per share data) | | | |
Common shares issued | 2,733 | | | |
Common share price as of March 29, 2018 | $ | 45.24 | | | |
Common share consideration | | | $ | 123,622 | |
Cash consideration (1)
| | | 157,539 | |
Preferred Share consideration | | | 59,042 | |
Total purchase consideration | | | $ | 340,203 | |
Less: Common shares held in escrow | | | (8,825) | |
Less: Cash held in escrow | | | (11,607) | |
Less: Preferred Shares held in escrow | | | (4,221) | |
Total purchase consideration | | | $ | 315,550 | |
(1)Net of $3.6 million in cash released to us to cover purchase price adjustments related to a working capital shortfall at closing.
Supplemental Pro Forma Financial Information (Unaudited). The following unaudited pro forma supplemental financial information presents the consolidated results of operations of the Company and Noralta as if the Noralta Acquisition had occurred on January 1, 2017. We have adjusted historical financial information to give effect to pro forma items that are directly attributable to the Noralta Acquisition and are expected to have a continuing impact on the consolidated results. These items include adjustments to record the incremental amortization and depreciation expense related to the increase in fair values of the acquired assets, interest expense related to borrowings under the Credit Agreement to fund the Noralta Acquisition and to reclassify certain items to conform to our financial reporting presentation. However, pro forma results do not include any anticipated cost savings or other effects of the planned integration of Noralta. The unaudited pro forma results do not purport to be indicative of the results of operations had the transaction occurred on the date indicated or of future results for the combined entities (in thousands, except per share data):
| | | | | | | |
| Year Ended December 31, (Unaudited) | | |
| Pro forma | | |
| 2018 | | |
Revenues | $ | 501,275 | | | |
Net loss attributable to Civeo Corporation common shareholders | (129,900) | | | |
Basic net loss per share attributable to Civeo Corporation common shareholders | $ | (9.96) | | | |
Diluted net loss per share attributable to Civeo Corporation common shareholders | $ | (9.96) | | | |
Included in the pro forma results above are certain adjustments due to the following: (i) increases in depreciation and amortization expense due to acquired intangibles and the increased recorded value of property, plant and equipment, (ii) increases in interest expense due to additional credit facility borrowings to fund the Noralta Acquisition, and (iii) decreases due to the exclusion of transaction costs.
Transaction Costs. During the year ended December 31, 2018, we recognized $9.1 million of costs in connection with the Noralta Acquisition that are included in Service and other costs ($1.0 million), Selling, general and administrative expenses ($7.2 million) and Other income ($0.9 million).
| | | | | | | | | | | |
| December 31, 2023 | | December 31, 2022 |
| Assets held for sale: | | | |
| Property, plant and equipment, net | $ | 5,873 | | | $ | 8,653 | |
| Total assets held for sale | $ | 5,873 | | | $ | 8,653 | |
8.EARNINGS PER SHARE
As previously disclosed in Note 1 - Description of Business and Basis of Presentation, a 1-for-12 reverse share split became effective on November 19, 2020 for all authorized, issued and outstanding shares of Civeo common shares. Accordingly, all share and per share amounts have been adjusted to reflect this reverse stock split for all prior periods presented.
We calculate basic and diluted earnings per share by applying the two-class method because we have participating securities in the form of Preferred Shares. Participating securities are allocated a proportional share of net income determined by dividing total weighted average participating securities by the sum of total weighted average common shares and participating securities. We also apply the treasury stock method with respect to certain share based awards in the calculation of diluted earnings per share, if dilutive.
The calculation of earnings per share attributable to Civeo common shareholders is presented below for the periods indicated (in thousands, except per share amounts):
| | | | | | | | | | | | | | | | | |
| | 2020 | | 2019 | | 2018 |
| Numerator: | | | | | |
| Net loss attributable to Civeo common shareholders | $ | (136,137) | | | $ | (60,340) | | | $ | (131,832) | |
| Less: income allocated to participating securities | 0 | | | 0 | | | 0 | |
| Basic net income loss attributable to Civeo Corporation common shareholders | $ | (136,137) | | | $ | (60,340) | | | $ | (131,832) | |
| Add: undistributed income attributable to participating securities | 0 | | | 0 | | | 0 | |
| Less: undistributed income reallocated to participating securities | 0 | | | 0 | | | 0 | |
| Diluted net loss attributable to Civeo Corporation common shareholders | $ | (136,137) | | | $ | (60,340) | | | $ | (131,832) | |
| | | | | |
| Denominator: | | | | | |
| Weighted average shares outstanding - basic | 14,129 | | | 13,921 | | | 13,103 | |
| Dilutive shares - share based awards | 0 | | | 0 | | | 0 | |
| Weighted average shares outstanding - diluted | 14,129 | | | 13,921 | | | 13,103 | |
| | | | | |
Basic net loss per share attributable to Civeo Corporation common shareholders (1) | $ | (9.64) | | | $ | (4.33) | | | $ | (10.06) | |
| | | | | |
Diluted net loss per share attributable to Civeo Corporation common shareholders (1) | $ | (9.64) | | | $ | (4.33) | | | $ | (10.06) | |
(1)Computations may reflect rounding adjustments.
When an entity has a net loss from continuing operations, it is prohibited from including potential common shares in the computation of diluted per share amounts. For the years ended December 31, 2020, 2019 and 2018, we excluded from the computation of diluted loss per share 0.4 million, 0.5 million and 0.8 million share-based awards, respectively, since the effect would have been anti-dilutive. Additionally, for the years ended December 31, 2020, 2019 and 2018, we excluded from the calculation the impact of converting the Preferred Shares into 2.4 million, 2.4 million and 2.5 million common shares, respectively, since the effect would have been anti-dilutive.
9.SUPPLEMENTAL CASH FLOW INFORMATION
Cash paid during the years ended December 31, 2020, 2019 and 2018 for interest and income taxes was as follows (in thousands):
| | | | | | | | | | | | | | | | | |
| | 2020 | | 2019 | | 2018 |
| Interest (net of amounts capitalized) | $ | 12,597 | | | $ | 23,882 | | | $ | 23,098 | |
| Net income taxes paid (refunds received) | 600 | | | 1,045 | | | (5,271) | |
10.GOODWILL AND OTHER INTANGIBLE ASSETS
Changes in the carrying amount of goodwill (all of which is in our Australia segment) from December 31, 20182021 to December 31, 20202023 are as follows (in thousands):
| | | | | | | | | | | | | | | | | | | | | | | |
| Canada | | Australia | | U.S. | | Total |
| Goodwill as of December 31, 2018 | $ | 114,207 | | | $ | 0 | | | $ | 0 | | | $ | 114,207 | |
Action acquisition (1) | 0 | | | 7,923 | | | 0 | | | 7,923 | |
Measurement period adjustments for prior year acquisition (2) | 2,676 | | | 0 | | | 0 | | | 2,676 | |
| Foreign currency translation | 5,255 | | | 12 | | | 0 | | | 5,267 | |
Goodwill impairment (3) | (19,900) | | | 0 | | | 0 | | | (19,900) | |
| Goodwill, net of $19.9 million accumulated impairment loss as of December 31, 2019 | $ | 102,238 | | | $ | 7,935 | | | $ | 0 | | | $ | 110,173 | |
| Foreign currency translation | (8,632) | | | 794 | | | 0 | | | (7,838) | |
Goodwill impairment (3) | (93,606) | | | 0 | | | 0 | | | (93,606) | |
| Goodwill, net of $113.5 million accumulated impairment loss as of December 31, 2020 | $ | 0 | | | $ | 8,729 | | | $ | 0 | | | $ | 8,729 | |
| | | | | | | | | | | |
| | | | | | | Total |
| Goodwill as of December 31, 2021 | | | | | | | $ | 8,204 | |
| Foreign currency translation | | | | | | | (532) | |
| Goodwill as of December 31, 2022 | | | | | | | $ | 7,672 | |
| Foreign currency translation | | | | | | | 18 | |
| Goodwill as of December 31, 2023 | | | | | | | $ | 7,690 | |
(1)See Note 7 – Acquisitions for further information.
(2)The measurement period adjustment related to the Noralta Acquisition was a result of the first quarter 2019 finalization of our purchase price allocation and valuation related to intangible assets acquired.
(3)See Note 4 – Impairment Charges for further information.
The following table presents the total amount of other intangible assets and the related accumulated amortization for major intangible asset classes as of December 31, 20202023 and 20192022 (in thousands):
| | | | | | | | | | | | | | | | | | | | | | | |
| December 31, | | December 31, |
| | 2020 | | 2019 |
| | Gross
Carrying
Amount | | Accumulated
Amortization | | Gross
Carrying
Amount | | Accumulated
Amortization |
| Amortizable Intangible Assets | | | | | | | |
| Customer relationships | $ | 44,817 | | | $ | (44,521) | | | $ | 41,693 | | | $ | (38,104) | |
| Trade name | 3,678 | | | (3,678) | | | 3,450 | | | (1,529) | |
| Contracts / agreements | 161,289 | | | (61,867) | | | 155,063 | | | (48,765) | |
| Total amortizable intangible assets | $ | 209,784 | | | $ | (110,066) | | | $ | 200,206 | | | $ | (88,398) | |
| | | | | | | |
| Indefinite-Lived Intangible Assets Not Subject to Amortization | | | | | | | |
| Licenses | 31 | | | — | | | 29 | | | — | |
| Total indefinite-lived intangible assets | 31 | | | — | | | 29 | | | — | |
| Total intangible assets | $ | 209,815 | | | $ | (110,066) | | | $ | 200,235 | | | $ | (88,398) | |
| | | | | | | | | | | | | | | | | | | | | | | |
| December 31, | | December 31, |
| | 2023 | | 2022 |
| | Gross
Carrying
Amount | | Accumulated
Amortization | | Gross
Carrying
Amount | | Accumulated
Amortization |
| Amortizable Intangible Assets | | | | | | | |
| Customer relationships | $ | 40,728 | | | $ | (40,728) | | | $ | 40,656 | | | $ | (40,656) | |
| Trade name | 3,363 | | | (3,363) | | | 3,324 | | | (3,324) | |
| Contracts / agreements | 143,725 | | | (65,754) | | | 149,356 | | | (67,637) | |
| Total amortizable intangible assets | $ | 187,816 | | | $ | (109,845) | | | $ | 193,336 | | | $ | (111,617) | |
| | | | | | | |
| Indefinite-Lived Intangible Assets Not Subject to Amortization | | | | | | | |
| Licenses | 28 | | | — | | | 28 | | | — | |
| Total indefinite-lived intangible assets | 28 | | | — | | | 28 | | | — | |
| Total intangible assets | $ | 187,844 | | | $ | (109,845) | | | $ | 193,364 | | | $ | (111,617) | |
The weighted average remaining amortization period for all intangible assets, other than indefinite-lived intangibles, was 16.914.1 years as of December 31, 20202023 and 16.815.0 years as of December 31, 2019.2022. Amortization expense was $14.1$5.8 million, $14.8$5.9 million and $17.6$6.0 million in the years ended December 31, 2020, 20192023, 2022 and 2018,2021, respectively.
As of December 31, 2020,2023, the estimated remaining amortization of our amortizable intangible assets was as follows (in thousands):
| | | | Year Ending
December 31, | | Year Ending
December 31, |
| 2021 | $ | 6,115 | |
| 2022 | 6,115 | |
| 2023 | 5,967 | |
| 2024 | 2024 | 5,967 | |
| 2025 | 2025 | 5,879 | |
| 2026 | |
| 2027 | |
| 2028 | |
| Thereafter | Thereafter | 69,675 | |
| Total | Total | $ | 99,718 | |
11.DEBT
As of December 31, 2020 and 2019, long-term debt consisted of the following (in thousands):
| | | | | | | | | | | |
| | December 31, 2020 | | December 31, 2019 |
| Canadian term loan, which matures on May 30, 2023; 3.125% of principal amounts set forth in September 3, 2020 amendment repayable per quarter; weighted average interest rate of 4.0% for the twelve-month period ended December 31, 2020 | 187,530 | | | 224,963 | |
| U.S. revolving credit facility, which matures on May 30, 2023; weighted average interest rate of 5.6% for the twelve-month period ended December 31, 2020 | 0 | | | 0 | |
| Canadian revolving credit facility, which matures on May 30, 2023; weighted average interest rate of 4.2% for the twelve-month period ended December 31, 2020 | 45,789 | | | 134,117 | |
| Australian revolving credit facility, which matures on May 30, 2023; weighted average interest rate of 3.6% for the twelve-month period ended December 31, 2020 | 17,767 | | | 0 | |
| | 251,086 | | | 359,080 | |
| Less: Unamortized debt issuance costs | 2,501 | | | 2,208 | |
| Total debt | 248,585 | | | 356,872 | |
| Less: Current portion of long-term debt, including unamortized debt issuance costs, net | 34,585 | | | 35,080 | |
| Long-term debt, less current maturities | $ | 214,000 | | | $ | 321,792 | |
Scheduled maturities of long-term debt as of December 31, 2020 are as follows (in thousands):
| | | | | |
| Year Ending
December 31, |
| 2021 | 35,052 | |
| 2022 | 35,052 | |
| 2023 | 180,982 | |
| | $ | 251,086 | |
CreditAgreement
As of December 31, 2019, our Credit Agreement provided for: (i) a $263.5 million revolving credit facility scheduled to mature on November 30, 2021 for certain lenders, allocated as follows: (A) a $20.0 million senior secured revolving credit facility in favor of certain of our U.S. subsidiaries, as borrowers; (B) a $183.5 million senior secured revolving credit facility in favor of Civeo and certain of our Canadian subsidiaries, as borrowers; and (C) a $60.0 million senior secured revolving credit facility in favor of one of our Australian subsidiaries, as borrower; and (ii) a $285.4 million term loan facility scheduled to mature on November 30, 2021 for certain lenders in favor of Civeo.
In September 2020, we entered into an amendment to our Credit Agreement, which reduced total lender commitments by $96.2 million.
Amended CreditAgreement
As of December 31, 2020, our Credit Agreement (as so amended, the Amended Credit Agreement), provided for: (i) a $167.3 million revolving credit facility scheduled to mature on May 30, 2023, allocated as follows: (A) a $10.0 million senior secured revolving credit facility in favor of certain of our U.S. subsidiaries, as borrowers; (B) a $122.3 million senior secured revolving credit facility in favor of Civeo and certain of our Canadian subsidiaries, as borrowers; and (C) a $35.0 million senior secured revolving credit facility in favor of one of our Australian subsidiaries, as borrower; and (ii) a $194.8 million term loan facility scheduled to mature on May 30, 2023 for certain lenders in favor of Civeo.
U.S. dollar amounts outstanding under the facilities provided by the Amended Credit Agreement bear interest at a variable rate equal to the London Inter-Bank Offered Rate (LIBOR) plus a margin of 3.50% to 4.50%, or a base rate plus 2.50% to 3.50%, in each case based on a ratio of our total debt to Consolidated EBITDA (as defined in the Amended Credit Agreement). Canadian dollar amounts outstanding bear interest at a variable rate equal to a B/A Discount Rate (as defined in the Amended Credit Agreement) based on the Canadian Dollar Offered Rate (CDOR) plus a margin of 3.50% to 4.50%, or a Canadian Prime rate plus a margin of 2.50% to 3.50%, in each case based on a ratio of our total debt to consolidated EBITDA. Australian dollar amounts outstanding under the Amended Credit Agreement bear interest at a variable rate equal to the Bank Bill Swap Bid Rate plus a margin of 3.50% to 4.50%, based on a ratio of our total debt to consolidated EBITDA. The future transitions from LIBOR and CDOR as interest rate benchmarks is addressed in the Amended Credit Agreement and at such time the transition from LIBOR or CDOR takes place, we will endeavor with the administrative agent to establish an alternate rate of interest to LIBOR or CDOR that gives due consideration to (1) the then prevailing market convention for determining a rate of interest for syndicated loans in the United States at such time for the replacement of LIBOR and (2) any evolving or then existing convention for similar Canadian Dollar denominated syndicated credit facilities for the replacement of CDOR.
The Amended Credit Agreement contains customary affirmative and negative covenants that, among other things, limit or restrict: (i) indebtedness, liens and fundamental changes; (ii) asset sales; (iii) acquisitions of margin stock; (iv) specified acquisitions; (v) certain restrictive agreements; (vi) transactions with affiliates; and (vii) investments and other restricted payments, including dividends and other distributions. In addition, we must maintain an interest coverage ratio, defined as the ratio of consolidated EBITDA to consolidated interest expense, of at least 3.00 to 1.00 and a maximum leverage ratio, defined as the ratio of total debt to consolidated EBITDA, of no greater than 3.50 to 1.00. Following a qualified offering of indebtedness with gross proceeds in excess of $150.0 million, we will be required to maintain a maximum leverage ratio of no greater than 4.00 to 1.00 and a maximum senior secured ratio less than 2.50 to 1.00. Each of the factors considered in the calculations of these ratios are defined in the Amended Credit Agreement. EBITDA and consolidated interest, as defined, exclude goodwill and asset impairments, debt discount amortization, amortization of intangibles and other non-cash charges. We were in compliance with our covenants as of December 31, 2020.
Borrowings under the Amended Credit Agreement are secured by a pledge of substantially all of our assets and the assets of our subsidiaries subject to customary exceptions. The obligations under the Amended Credit Agreement are guaranteed by our material subsidiaries. As of December 31, 2020, we had 8 lenders that were parties to the Amended Credit Agreement, with total commitments (including both revolving commitments and term commitments) ranging from $22.4 million to $71.1 million. As of December 31, 2020, we had outstanding letters of credit of $1.2 million under the U.S facility, $0.6 million under the Australian facility and $2.7 million under the Canadian facility.
In addition to the Amended Credit Agreement, we have 2 bank guarantee facilities totaling $3.0 million which mature March 31, 2021. There were bank guarantees of A$0.8 million under these facilities outstanding as of December 31, 2020.
12.10.LEASES
We have operating and finance leases covering certain land locations and various office facilities and equipment in our 3two reportable business segments. Our leases have remaining lease terms of one year to seven years, some of which include options to extend the leases for up to 10 years, and some of which include options to terminate the leases within 90 days. In addition, we do not recognize right-of-use assets or lease liabilities for leases with terms shorter than twelve months.
The components of lease expense were $6.8$4.2 million, $6.8$5.0 million and $6.8$5.9 million under operating leases for the years ended December 31, 2020, 20192023, 2022 and 2018,2021, respectively. The components of lease expense were $0.2 million, $0.0 million and $0.0 million under finance leases for the years ended December 31, 2023, 2022 and 2021, respectively. Included in the measurement of lease liabilities, we paid $6.9$4.6 million and $0.1 million in cash related to operating leases and finance leases during the year ended December 31, 2020.2023, respectively. Right-of-use assets obtained in exchange for new lease obligations related to operating leases during the year ended December 31, 20202023 were $2.0$0.6 million.
Supplemental balance sheet information related to leases were as follows (in thousands):
| | | |
| | | | December 31, 2020 | | December 31, 2019 | |
| Operating leases | Operating leases | | | | |
| Operating leases | |
| Operating leases | |
| Operating lease right-of-use assets | |
| Operating lease right-of-use assets | |
| Operating lease right-of-use assets | Operating lease right-of-use assets | $ | 22,606 | | | $ | 24,876 | | |
| | Other current liabilities | Other current liabilities | $ | 4,437 | | | $ | 5,543 | | |
| | Other current liabilities | |
| | Other current liabilities | |
| Operating lease liabilities | |
| Operating lease liabilities | |
| Operating lease liabilities | Operating lease liabilities | 19,834 | | | 21,231 | | |
| Total operating lease liabilities | Total operating lease liabilities | $ | 24,271 | | | $ | 26,774 | | |
| Total operating lease liabilities | |
| Total operating lease liabilities | |
| | Finance leases | |
| | Finance leases | |
| | Finance leases | |
| Other noncurrent assets | |
| Other noncurrent assets | |
| Other noncurrent assets | |
| | Other current liabilities | |
| | Other current liabilities | |
| | Other current liabilities | |
| Other noncurrent liabilities | |
| Other noncurrent liabilities | |
| Other noncurrent liabilities | |
| Total finance lease liabilities | |
| Total finance lease liabilities | |
| Total finance lease liabilities | |
| | Weighted average remaining lease term | |
| | Weighted average remaining lease term | |
| | Weighted average remaining lease term | Weighted average remaining lease term | | |
| Operating leases | Operating leases | 5.7 years | | 6.2 years | |
| Operating leases | |
| Operating leases | |
| Finance leases | |
| Finance leases | |
| Finance leases | |
| Weighted average discount rate | |
| Weighted average discount rate | |
| Weighted average discount rate | Weighted average discount rate | | |
| Operating leases | Operating leases | 5.4 | % | | 5.9 | % | |
| Operating leases | |
| Operating leases | |
| Finance leases | |
| Finance leases | |
| Finance leases | |
Maturities of operating lease liabilities at December 31, 2020,2023, were as follows (in thousands):
| | | | | |
| For the years ending December 31, | |
| 2021 | $ | 5,682 | |
| 2022 | 5,220 | |
| 2023 | 4,525 | |
| 2024 | 3,984 | |
| 2025 | 3,122 | |
| Thereafter | 5,811 | |
| Total lease payments | 28,344 | |
| Less imputed interest | 4,073 | |
| Total | $ | 24,271 | |
| | | | | | | | | | | | | | | | | |
| Year Ending December 31, | Operating Leases | | Finance Leases | | Total |
| 2024 | $ | 4,341 | | | $ | 222 | | | $ | 4,563 | |
| 2025 | 3,366 | | | 222 | | | 3,588 | |
| 2026 | 2,721 | | | 222 | | | 2,943 | |
| 2027 | 2,548 | | | 216 | | | 2,764 | |
| 2028 | 1,238 | | | 63 | | | 1,301 | |
| Thereafter | 554 | | | — | | | 554 | |
| Total lease payments | 14,768 | | | 945 | | | 15,713 | |
| Less imputed interest | 1,910 | | | 168 | | | 2,078 | |
| Total | $ | 12,858 | | | $ | 777 | | | $ | 13,635 | |
11.DEBT
As of December 31, 2023 and 2022, long-term debt consisted of the following (in thousands):
| | | | | | | | | | | |
| | December 31, 2023 | | December 31, 2022 |
| Canadian term loan; weighted average interest rate of 8.2% for the twelve-month period ended December 31, 2023 | $ | — | | | $ | 29,532 | |
| U.S. revolving credit facility; weighted average interest rate of 10.2% for the twelve-month period ended December 31, 2023 | — | | | — | |
| Canadian revolving credit facility; weighted average interest rate of 8.3% for the twelve-month period ended December 31, 2023 | 65,554 | | | 101,147 | |
| Australian revolving credit facility; weighted average interest rate of 6.8% for the twelve-month period ended December 31, 2023 | — | | | 1,358 | |
| | 65,554 | | | 132,037 | |
| Less: Unamortized debt issuance costs | — | | | 1,084 | |
| Total debt | 65,554 | | | 130,953 | |
| Less: Current portion of long-term debt, including unamortized debt issuance costs, net | — | | | 28,448 | |
| Long-term debt, less current maturities | $ | 65,554 | | | $ | 102,505 | |
Scheduled maturities of long-term debt as of December 31, 2023 are as follows (in thousands):
| | | | | |
| Year Ending
December 31, |
| 2024 | $ | — | |
| 2025 | 65,554 | |
| |
| | $ | 65,554 | |
Credit Agreement
As of December 31, 2023, our Credit Agreement (as then amended to date, the Credit Agreement) provided for: (i) a $200.0 million revolving credit facility scheduled to mature on September 8, 2025, allocated as follows: (A) a $10.0 million senior secured revolving credit facility in favor of one of our U.S. subsidiaries, as borrower; (B) a $155.0 million senior secured revolving credit facility in favor of Civeo, as borrower; and (C) a $35.0 million senior secured revolving credit facility in favor of one of our Australian subsidiaries, as borrower; and (ii) a C$100.0 million term loan facility, which was fully repaid, on December 31, 2023 in favor of Civeo.
The Credit Agreement was amended effective March 31, 2023 to, among other things, change the benchmark interest rate for certain U.S. dollar-denominated loans in each of the Australian Revolving Facility, Canadian Revolving Facility, and U.S. Revolving Facility from London Inter-Bank Offered Rate to Term Secured Overnight Financing Rate (SOFR).
U.S. dollar amounts outstanding under the facilities provided by the Credit Agreement bear interest at a variable rate equal to the Term SOFR plus a margin of 3.00% to 4.00%, or a base rate plus 2.00% to 3.00%, in each case based on a ratio of our total net debt to Consolidated EBITDA (as defined in the Credit Agreement). Canadian dollar amounts outstanding bear interest at a variable rate equal to a Bankers’ Acceptance Discount Rate (as defined in the Credit Agreement) based on the Canadian Dollar Offered Rate (CDOR) plus a margin of 3.00% to 4.00%, or a Canadian Prime rate plus a margin of 2.00% to 3.00%, in each case based on a ratio of our total net debt to Consolidated EBITDA. Australian dollar amounts outstanding under the Credit Agreement bear interest at a variable rate equal to the Bank Bill Swap Bid Rate plus a margin of 3.00% to 4.00%, based on a ratio of our total net debt to Consolidated EBITDA. The future transition from CDOR as an interest rate benchmark is addressed in the Credit Agreement and at such time the transition from CDOR takes place, an alternate benchmark will be established based on the first alternative of the following, plus a benchmark replacement adjustment, Term Canadian Overnight Repo Rate Average (CORRA) and Compound CORRA.
The Credit Agreement contains customary affirmative and negative covenants that, among other things, limit or restrict: (i) indebtedness, liens and fundamental changes; (ii) asset sales; (iii) specified acquisitions; (iv) certain restrictive agreements; (v) transactions with affiliates; and (vi) investments and other restricted payments, including dividends and other distributions. In addition, we must maintain a minimum interest coverage ratio, defined as the ratio of consolidated EBITDA to consolidated interest expense, of at least 3.00 to 1.00 and a maximum net leverage ratio, defined as the ratio of total net debt to Consolidated EBITDA, of no greater than 3.00 to 1.00. Following a qualified offering of indebtedness, we will be required to maintain a maximum leverage ratio of no greater than 3.50 to 1.00 and a maximum senior secured ratio less than 2.00 to 1.00. Each of the
factors considered in the calculations of these ratios are defined in the Credit Agreement. EBITDA and consolidated interest, as defined, exclude goodwill and asset impairments, debt discount amortization, amortization of intangibles and other non-cash charges. We were in compliance with our covenants as of December 31, 2023.
Borrowings under the Credit Agreement are secured by a pledge of substantially all of our assets and the assets of our subsidiaries subject to customary exceptions. The obligations under the Credit Agreement are guaranteed by our significant subsidiaries. As of December 31, 2023, we had seven lenders that were parties to the Credit Agreement, with total revolving commitments ranging from $16.1 million to $37.1 million. As of December 31, 2023, we had outstanding letters of credit of $0.3 million under the U.S. facility, zero under the Australian facility and $1.1 million under the Canadian facility. We also had outstanding bank guarantees of A$0.8 million under the Australian facility.
12.ASSET RETIREMENT OBLIGATIONS
AROs at December 31, 2023 and 2022 were (in thousands):
| | | | | | | | | | | |
| | 2023 | | 2022 |
| Asset retirement obligations | $ | 16,215 | | | $ | 18,113 | |
Less: Asset retirement obligations due within one year (1) | 2,576 | | | 4,550 | |
| Long-term asset retirement obligations | $ | 13,639 | | | $ | 13,563 | |
| | | | | |
| (1) | Classified as a current liability on the consolidated balance sheets, under the caption “Other current liabilities.” Balance at December 31, 2023 related to remediation work planned for 2024. |
Total accretion expense related to AROs was $1.1 million, $1.8 million and $1.4 million during the years ended December 31, 2023, 2022 and 2021, respectively.
During the years ended December 31, 2023, 2022 and 2021, our ARO changed as follows (in thousands):
| | | | | | | | | | | | | | | | | |
| | 2023 | | 2022 | | 2021 |
| Balance as of January 1 | $ | 18,113 | | | $ | 13,745 | | | $ | 14,993 | |
| Accretion of discount | 1,104 | | | 1,830 | | | 1,429 | |
| | | | | |
| Change in estimates of existing obligations | 1,366 | | | 4,138 | | | (763) | |
| Settlement of obligations | (4,756) | | | (455) | | | (1,943) | |
| Foreign currency translation | 388 | | | (1,145) | | | 29 | |
| Balance as of December 31 | $ | 16,215 | | | $ | 18,113 | | | $ | 13,745 | |
13.RETIREMENT PLANS
We sponsor various defined contribution plans. Participation in these plans is available to substantially all employees. A defined contribution plan is a post-employment benefit plan under which an entity pays fixed contributions into a separate entity and will generally have no legal or constructive obligation to pay further amounts. Obligations for contributions to defined contribution plans are recognized as an employee benefit expense in profit or loss in the periods during which services are rendered by employees. We recognized expense of $6.8$10.2 million, $5.3$8.2 million and $4.9$7.6 million related to matching contributions under our various defined contribution plans during the years ended December 31, 2020, 20192023, 2022 and 2018,2021, respectively.
Canadian Retirement Savings Plan
We offer a defined contribution retirement plan to our Canadian employees. In Canada, we contribute, on a matched basis, an amount up to 5% of each Canadian based, salaried employee’s earnings (base salary plus annual incentive compensation) to the legislated maximum for a Deferred Profit Sharing Plan (DPSP). The maximum for 20202023 was C$13,915.15,780. DPSP is a form of defined contribution retirement savings plan governed by Canadian federal tax legislation which provides for the deferral of tax on deposits and investment returns until removed from the plan to support retirement income. Employer contributions vest upon the completion of two years of service. Employee contributions are required in order to be eligible for the DPSP employer matching. Maximum employer matching (5% noted above) is attained with 6% employee contribution which would go into a Group Registered Retirement Savings Plan (GRRSP).Plan. The two plans work in tandem. Contributions to the “Retirement Savings Plan” for Canadian employees are subject to the annual maximum total registered savings limit of C$27,23030,780 in 20202023 as set out in the Canadian Tax Act.
Australian Retirement Savings Plan
Our Australian subsidiary contributes to various defined contribution plans for its employees in accordance with legislation governing the calculation of the Superannuation Guarantee Surcharge (SGC). SGC is contributed by the employer at a rate of 9.5%10.5% of the base salary of an employee, capped at the legislated maximum contribution base which is indexed annually.
Our Australian subsidiary makes no investment decisions on behalf of the employee and has no obligations other than to remit the defined contributions to the plan selected by each individual employee.
U.S. Retirement Savings Plan
We offer a defined contribution 401(k) retirement plan to substantially all of our U.S. employees. Participants may contribute from 1% to 75% of their base and cash incentive compensation (subject to Internal Revenue Service limitations), and we make matching contributions under this plan on the first 6% of the participant’s compensation (100% match of the first 4% employee contribution and 50% match on the next 2% contribution). Our matching contributions vest at a rate of 40% after two years of service and 20% per year for each of the employee’s next three years of service and are fully vested thereafter.
14.ASSET RETIREMENT OBLIGATIONS
AROs at December 31, 2020 and 2019 were (in thousands):
| | | | | | | | | | | |
| | 2020 | | 2019 |
| Asset retirement obligations | $ | 14,993 | | | $ | 18,796 | |
Less: Asset retirement obligations due within one year (1) | 1,322 | | | 3,197 | |
| Long-term asset retirement obligations | $ | 13,671 | | | $ | 15,599 | |
| | | | | |
(1) | Classified as a current liability on the consolidated balance sheets, under the caption “Other current liabilities.” Balance at December 31, 2020 related to remediation work planned for 2021. |
Total accretion expense related to AROs was $1.5 million, $1.5 million and $1.7 million during the years ended December 31, 2020, 2019 and 2018, respectively.
During the years ended December 31, 2020, 2019 and 2018, our ARO changed as follows (in thousands):
| | | | | | | | | | | | | | | | | |
| | 2020 | | 2019 | | 2018 |
| Balance as of January 1 | $ | 18,796 | | | $ | 18,381 | | | $ | 17,185 | |
| Accretion of discount | 1,526 | | | 1,538 | | | 1,689 | |
| New obligations | 0 | | | 497 | | | 6,629 | |
| Change in estimates of existing obligations | (3,961) | | | (1,989) | | | (4,336) | |
| Settlement of obligations | (1,771) | | | (462) | | | (1,013) | |
| Foreign currency translation | 403 | | | 831 | | | (1,773) | |
| Balance as of December 31 | $ | 14,993 | | | $ | 18,796 | | | $ | 18,381 | |
15.INCOME TAXES
The Company’s operations are conducted through various subsidiaries in a number of countries throughout the world. The Company has provided for income taxes based upon the tax laws and rates in the countries in which operations are conducted and income is earned.
Income tax benefit.expense (benefit). Pre-tax lossincome (loss) for the years ended December 31, 2020, 20192023, 2022 and 20182021 consisted of the following (in thousands):
| | | | 2020 | | 2019 | | 2018 | | 2023 | | 2022 | | 2021 |
| Canada operations | Canada operations | $ | (137,239) | | | $ | (60,372) | | | $ | (100,874) | |
| Foreign operations | Foreign operations | (6,176) | | | (8,703) | | | (12,338) | |
| Total | Total | $ | (143,415) | | | $ | (69,075) | | | $ | (113,212) | |
The components of the income tax expense (benefit) for the years ended December 31, 2020, 20192023, 2022 and 20182021 consisted of the following (in thousands):
| | | | 2020 | | 2019 | | 2018 | | 2023 | | 2022 | | 2021 |
| Current: | Current: | | | | | |
| Canada | |
| Canada | |
| Canada | Canada | $ | 391 | | | $ | 706 | | | $ | (1,151) | |
| Foreign | Foreign | 96 | | | 266 | | | 1,189 | |
| Total | Total | $ | 487 | | | $ | 972 | | | $ | 38 | |
| | Deferred: | Deferred: | |
| Deferred: | |
| Deferred: | |
| Canada | |
| Canada | |
| Canada | Canada | $ | (8,941) | | | $ | (9,399) | | | $ | (31,403) | |
| Foreign | Foreign | (2,181) | | | (2,314) | | | 0 | |
| Total | Total | $ | (11,122) | | | $ | (11,713) | | | $ | (31,403) | |
| | Net income tax benefit | $ | (10,635) | | | $ | (10,741) | | | $ | (31,365) | |
| Net income tax expense (benefit) | |
| Net income tax expense (benefit) | |
| Net income tax expense (benefit) | |
The net income tax benefitexpense (benefit) differs from an amount computed at Canadian statutory rates as follows for the years ended December 31, 2020, 20192023, 2022 and 20182021 (in thousands):
| | | |
| | | | 2020 | | 2019 | | 2018 |
| Canadian federal tax benefit at statutory rates | Canadian federal tax benefit at statutory rates | $ | (21,512) | | | 15.0 | % | | $ | (10,361) | | | 15.0 | % | | $ | (16,982) | | | 15.0 | % |
| Canadian federal tax benefit at statutory rates | |
| Canadian federal tax benefit at statutory rates | |
| Canadian provincial income tax | |
| Canadian provincial income tax | |
| Canadian provincial income tax | Canadian provincial income tax | (12,718) | | | 8.9 | % | | (5,158) | | | 7.5 | % | | (12,105) | | | 10.7 | % |
| Effect of foreign income tax, net | Effect of foreign income tax, net | 1,241 | | | (0.9) | % | | 55 | | | (0.1) | % | | (1,756) | | | 1.6 | % |
| Effect of foreign income tax, net | |
| Effect of foreign income tax, net | |
| Valuation allowance | |
| Valuation allowance | |
| Valuation allowance | |
| Noncontrolling interest | |
| Noncontrolling interest | |
| Noncontrolling interest | |
| | Valuation allowance | (1,355) | | | 0.9 | % | | 2,257 | | | (3.3) | % | | (622) | | | 0.5 | % |
| Enacted tax rate change - Canada | 0 | | | 0 | % | | (2,452) | | | 3.5 | % | | 0 | | | 0 | % |
| Non-deductible goodwill impairment | 22,984 | | | (16.0) | % | | 4,689 | | | (6.8) | % | | 0 | | | 0 | % |
| Non-deductible compensation | |
| | Non-deductible compensation | |
| | Non-deductible compensation | Non-deductible compensation | 310 | | | (0.2) | % | | 1,203 | | | (1.7) | % | | 181 | | | (0.2) | % |
| Unrealized intercompany foreign currency translation gain | Unrealized intercompany foreign currency translation gain | 991 | | | (0.7) | % | | (1,451) | | | 2.1 | % | | 0 | | | 0 | % |
| Non-taxable Noralta representations and warranties claim | (1,132) | | | 0.8 | % | | 0 | | | 0 | % | | 0 | | | 0 | % |
| Unrealized intercompany foreign currency translation gain | |
| Unrealized intercompany foreign currency translation gain | |
| | Deemed income from foreign subsidiaries | |
| | Deemed income from foreign subsidiaries | |
| | Deemed income from foreign subsidiaries | |
| Other, net | Other, net | 556 | | | (0.4) | % | | 477 | | | (0.7) | % | | (81) | | | 0.1 | % |
| Net income tax benefit | $ | (10,635) | | | 7.4 | % | | $ | (10,741) | | | 15.5 | % | | $ | (31,365) | | | 27.7 | % |
| Other, net | |
| Other, net | |
| Net income tax expense (benefit) | |
| Net income tax expense (benefit) | |
| Net income tax expense (benefit) | |
Canadian Rate Change. Effective July 1, 2019, the Province of Alberta introduced a four-year graduated decrease in the income tax rate from 12% to 8%, resulting in a decrease of our net deferred tax liability of $2.5 million during the year ended December 31, 2019. As part of Alberta’s Recovery Plan, the government accelerated the rate reduction to 8% effective July 1, 2020. As the impact of the full rate change was effectuated on our net deferred tax liability in 2019, the acceleration had no impact to our net deferred tax liability as of December 31, 2020.
Deferred Tax Liabilities and Assets. The significant items giving rise to the deferred tax assets and liabilities as of December 31, 20202023 and 20192022 are as follows (in thousands):
| | | | 2020 | | 2019 | | 2023 | | 2022 |
| Deferred tax assets: | Deferred tax assets: | | | |
| Net operating loss | |
| Net operating loss | |
| Net operating loss | Net operating loss | $ | 102,650 | | | $ | 97,920 | |
| Employee benefits | Employee benefits | 2,269 | | | 2,877 | |
| Deductible goodwill and other intangibles | Deductible goodwill and other intangibles | 55,471 | | | 50,024 | |
| Land | Land | 2,637 | | | 2,352 | |
| Other reserves | Other reserves | 6,701 | | | 6,644 | |
| Unearned revenue | 114 | | | 441 | |
| Deferred revenue | |
| Operating lease liabilities | Operating lease liabilities | 6,027 | | | 6,453 | |
| Capital losses | Capital losses | 1,343 | | | 1,056 | |
| Other | Other | 1,559 | | | 2,028 | |
| Deferred tax assets | Deferred tax assets | 178,771 | | | 169,795 | |
| Valuation allowance | Valuation allowance | (88,251) | | | (84,503) | |
| Deferred tax assets, net | Deferred tax assets, net | $ | 90,520 | | | $ | 85,292 | |
| Deferred tax liabilities: | Deferred tax liabilities: | | | |
| Intangibles | Intangibles | $ | (24,359) | | | $ | (26,242) | |
| Intangibles | |
| Intangibles | |
| Depreciation | Depreciation | (58,329) | | | (62,524) | |
| Operating lease right-of-use assets | Operating lease right-of-use assets | (5,599) | | | (5,978) | |
| Deferred tax liabilities | Deferred tax liabilities | (88,287) | | | (94,744) | |
Net deferred tax assets (liabilities), net (1) | $ | 2,233 | | | $ | (9,452) | |
| Net deferred tax liabilities, net | |
| | | | | |
(1) | Net deferred tax assets are classified as a noncurrent asset on the consolidated balance sheet, under the caption “Other noncurrent assets.” |
At December 31, 2023 and 2022, we had no undistributed earnings of foreign subsidiaries that would be subject to income tax upon distribution to Canada from a foreign subsidiary. As such, as of December 31, 2023 and 2022, we did not provide for deferred taxes on any such earnings of our foreign subsidiaries.
NOL Carryforwards. The following table summarizes net operating loss (NOL) carryforwards at December 31, 20202023 (in thousands):
| | | | | | | | | | | |
| | Amount | | Expiration Period |
| Net operating loss carryforwards: | | | |
| Canada – Federal and provincial | $ | 221,678144,242 | | | Begins to expire in 2035 |
| Australia | 101,607 | | Does not expire |
| U.S. – Federal | 36,03034,028 | | | Begins to expire in 2036 |
| U.S. – Federal | 25,60330,655 | | | Does not expire |
| U.S. – State, tax effected | 5,7426,073 | | | Begins to expire in 20212024 |
Change in Valuation Allowance. Realization of our deferred tax assets is dependent upon, among other things, our ability to generate taxable income of the appropriate character in the future.
Changes in our valuation allowance for the years ended December 31, 20202023 and 20192022 are as follows (in thousands):
| | | | | |
| | |
Balance as of December 31, 20182021 | $ | (82,833)(85,351) | |
| Change in income tax provision | (2,257)(153) | |
| Other change | 499 (1,178) | |
| Foreign currency translation | 883,777 | |
Balance as of December 31, 20192022 | (84,503)(82,905) | |
| Change in income tax provision | 1,3552,556 | |
| Other change | 1,6631,767 | |
| Foreign currency translation | (6,766)(187) | |
Balance as of December 31, 20202023 | $ | (88,251)(78,769) | |
As of each reporting date, management considers new evidence, both positive and negative, that could affect our view of the future realization of deferred tax assets. As of December 31, 2020, in part because in the current year we achieved three years of cumulative pre-tax income in the Australian federal tax jurisdiction,2023, management determined that there is not sufficient positive evidence to conclude that it is more likely than not that additionalthe Canadian and U.S. net deferred tax assets of $9.1 million are realizable. Werealizable, therefore reducedwe have maintained the valuation allowance accordingly in this jurisdiction.both of these jurisdictions. As of December 31, 2023, management determined that there is not sufficient evidence to conclude that it is more likely than not that the Australia deferred tax assets related to certain capital assets are realizable, therefore we have maintained a partial valuation allowance in Australia.
Indefinite Reinvestment of Earnings. At December 31, 2020 and 2019, we had 0 undistributed earnings of foreign subsidiaries subject to income tax in Canada.
Unrecognized Tax Benefits. We file tax returns in the jurisdictions in which they are required. All of these returns are subject to examination or audit and possible adjustment as a result of assessments by taxing authorities. We believe that we have recorded sufficient tax liabilities and do not expect the resolution of any examination or audit of our tax returns to have a material adverse effect on our operating results, financial condition or liquidity.
Our Canadian federal tax returns subsequent to 20132018 are subject to audit by the Canada Revenue Agency. Our Australian subsidiary’s federal income tax returns subsequent to 20162018 are open for review by the Australian Taxation Office. Our U.S. subsidiary’s federal tax returns subsequent to 20172019 are subject to audit by the USU.S. Internal Revenue Service.
The total amount of unrecognized tax benefits as of December 31, 2020, 20192023, 2022 and 20182021 was 0.zero. Unrecognized tax benefits, if recognized, would affect the effective tax rate. We accrue interest and penalties, if applicable, related to unrecognized tax benefits as a component of our provision for income taxes. As of December 31, 2020, 20192023, 2022 and 2018,2021, we had accrued 0zero of interest expense and penalties.
16.15.COMMITMENTS AND CONTINGENCIES
We are a party to various pending or threatened claims, lawsuits and administrative proceedings seeking damages or other remedies concerning our commercial operations, products, employees and other matters, including warranty and product liability claims as a result of our products or operations. Although we can give no assurance about the outcome of pending legal and administrative proceedings and the effect such outcomes may have on us, management believes that any ultimate liability resulting from the outcome of such proceedings, to the extent not otherwise provided for or covered by insurance, will not have a material adverse effect on our consolidated financial position, results of operations or liquidity.
16.PREFERRED SHARES
On April 2, 2018, we issued 9,679 Series A preferred shares as part of the acquisition of Noralta Lodge Ltd. (Noralta Acquisition). The Series A preferred shares had an initial liquidation preference of $10,000 per share. Holders of the Series A preferred shares were entitled to receive a 2% annual dividend on the liquidation preference paid quarterly in cash or, at our option, by increasing the Series A preferred shares’ liquidation preference or any combination thereof. During the fourth quarter of 2018, 637 Series A preferred shares initially held in escrow to support certain obligations of the Noralta Acquisition were released. On October 30, 2022, 3,617 Series A preferred shares were repurchased from the holders for approximately $30.6 million, which included accrued dividends of under $0.1 million. On December 13, 2022, the holders of the Series A preferred shares elected to convert the remaining 5,425 Series A preferred shares outstanding into 1,504,539 common shares. As of December 31, 2022, we had no Series A preferred shares outstanding.
During the years ended December 31, 2022 and 2021, we recognized preferred dividends on the Series A preferred shares as follows (in thousands):
| | | | | | | | | | | | | | | |
| | | 2022 | | 2021 |
| In-kind dividends | | | $ | 1,706 | | | $ | 1,925 | |
| Cash dividend on repurchased preferred shares | | | 65 | | | — | |
| Total preferred dividends | | | $ | 1,771 | | | $ | 1,925 | |
The Board of Directors (Board) elected to pay the dividends beginning June 30, 2018 through December 12, 2022 through an increase in the liquidation preference rather than in cash. The paid-in-kind dividend of $1.7 million and $1.9 million is included in Preferred dividends on the accompanying consolidated statements of operations for the years ended December 31, 2022 and 2021, respectively. On December 13, 2022, the holders of the Series A preferred shares converted all outstanding Series A preferred shares into common shares. Following such conversion, no further dividends were required to be paid.
17. SHARE REPURCHASE PROGRAMS AND DIVIDENDS
Share Repurchase Programs
In August 2023, 2022 and 2021, our Board authorized common share repurchase programs to repurchase up to 5.0% of our total common shares which were issued and outstanding, or approximately 742,000, 685,000 and 715,000 common shares, respectively, over a twelve month period.
The repurchase authorization allows repurchases from time to time in open market transactions, including pursuant to trading plans adopted in accordance with Rule 10b5-1 of the Securities Exchange Act of 1934. We have funded, and intend to continue to fund, repurchases through cash on hand and cash generated from operations. The common shares repurchased under the share repurchase programs are cancelled in the periods they are acquired and the payment is accounted for as an increase to accumulated deficit in our Consolidated Statements of Changes in Shareholders’ Equity in the period the payment is made.
The following table summarizes our common share repurchases pursuant to our share repurchase programs (in thousands, except per share data).
| | | | | | | | | | | | | | | | | |
| 2023 | | 2022 | | 2021 |
| Shares repurchased | 564 | | 124 | | 217 |
| Average price paid per share | $ | 20.60 | | | $ | 28.54 | | | $ | 21.38 | |
| Dollar-value of shares repurchased | $ | 11,634 | | | $ | 3,540 | | | $ | 4,649 | |
In addition to the shares repurchased pursuant to our share repurchase programs, we repurchased 374,753 common shares from a shareholder for approximately $10.7 million during the three months ended September 30, 2022.
Dividends
Our Board declared a quarterly dividend on October 27, 2023 of $0.25 per common share to shareholders of record as of close of business on November 27, 2023. The total cash payment of $3.7 million was paid on December 18, 2023. Our Board declared a quarterly dividend on September 5, 2023 of $0.25 per common share to shareholders of record as of close of business on September 15, 2023. The total cash payment of $3.7 million was paid on September 29, 2023. The dividends are eligible dividends pursuant to the Income Tax Act (Canada).
18.ACCUMULATED OTHER COMPREHENSIVE LOSS
Our accumulated other comprehensive loss decreased $14.2$4.5 million from $363.2$385.2 million at December 31, 20192022 to $349.0$380.7 million at December 31, 2020,2023, as a result of foreign currency exchange rate fluctuations. Changes in other comprehensive loss during 20202023 were primarily driven by the Australian dollar and Canadian dollar increasing in value compared to the U.S. dollar. Excluding intercompany balances, our Canadian dollar and Australian dollar functional currency net assets totaled approximately C$161234 million and A$298205 million, respectively, at December 31, 2020.2023.
18.19.SHARE-BASED COMPENSATION
As previously disclosed in Note 1 - Description of Business and Basis of Presentation, a 1-for-12 reverse share split became effective on November 19, 2020 for all authorized, issued and outstanding shares of Civeo common shares. Accordingly, all share and per share amounts have been adjusted to reflect this reverse stock split for all prior periods presented.
Certain key employees and non-employee directors participate in the Amended and Restated 2014 Equity Participation Plan of Civeo Corporation (the Civeo Plan). The Civeo Plan authorizes our Board of Directors and the Compensation Committee of our Board of Directors to approve grantsand grant awards of options, awards of restricted share awards,shares, performance share awards, phantom share awardsunits and dividend equivalents, awards of deferred share awards,shares, and share payments to our employees and non-employee directors. No more than 2.43.0 million Civeo common shares mayare authorized to be issued under the Civeo Plan.
Share-based compensation expense recognized in the years ended December 31, 2020, 20192023, 2022 and 20182021 totaled $8.4$11.8 million, $13.9$14.9 million and $16.4$9.9 million, respectively. Share-based compensation expense is reflected in Selling, general and administrative (SG&A) expense in our consolidated statements of operations. The total income tax benefit recognized in the consolidated statements of operations for share basedshare-based compensation arrangements was approximately $0.5$0.6 million, $0.7$0.8 million and $1.2$0.5 million for the years ended December 31, 2020, 20192023, 2022 and 2018,2021, respectively.
Optionsto Purchase Common SharesPhantom Share Units
NaN options were awarded in 2020, 2019 or 2018. The following table presents the changes in stock options outstanding and related information for our employees during the years ended December 31, 2020, 2019 and 2018:
| | | | | | | | | | | | | | | | | | | | | | | |
| | Options | | Weighted
Average
Exercise
Price Per
Share | | Weighted
Average
Contractual
Life (Years) | | Intrinsic
Value
(Thousands) |
| Outstanding Options at December 31, 2017 | 12,143 | | | $ | 215.59 | | | 4.5 | | $ | 0 | |
| | | | | | | |
| | | | | | | |
| | | | | | | |
| Outstanding Options at December 31, 2018 | 12,143 | | | $ | 215.59 | | | 3.3 | | $ | 0 | |
| | | | | | | |
| | | | | | | |
| | | | | | | |
| Outstanding Options at December 31, 2019 | 12,143 | | | $ | 215.59 | | | 2.3 | | $ | 0 | |
| | | | | | | |
| | | | | | | |
| Forfeited / Expired | (1,817) | | | 197.16 | | | | | |
| Outstanding Options at December 31, 2020 | 10,326 | | | $ | 218.83 | | | 1.4 | | $ | 0 | |
| | | | | | | |
| Exercisable Options at December 31, 2018 | 12,143 | | | $ | 215.59 | | | 3.3 | | $ | 0 | |
| Exercisable Options at December 31, 2019 | 12,143 | | | $ | 215.59 | | | 2.3 | | $ | 0 | |
| Exercisable Options at December 31, 2020 | 10,326 | | | $ | 218.83 | | | 1.4 | | $ | 0 | |
| | | | | | | |
As no options were exercised in the last three years, the total intrinsic value of options exercised by our employees during 2020, 2019 and 2018 was 0. Additionally, the tax benefits realized for the tax deduction from options exercised during 2020, 2019 and 2018 totaled 0.
At December 31, 2020, unrecognized compensation cost related to options was 0.
The following table summarizes information for outstanding options of our employees at December 31, 2020:
| | | | | | | | | | | | | | | | | | | | | | | | | | | | | | | | |
| | Options Outstanding | | Options Exercisable |
Range of Exercise
Prices | | Number
Outstanding as
of December 31,
2020 | | Weighted
Average
Remaining
Contractual
Life | | Weighted
Average
Exercise
Price | | Number
Exercisable
as of
December 31,
2020 | | Weighted
Average
Exercise
Price |
| $197.16 | | 3,441 | | | 0.13 | | $ | 197.16 | | | 3,441 | | | $ | 197.16 | |
| $209.76 | | 2,486 | | | 2.14 | | $ | 209.76 | | | 2,486 | | | $ | 209.76 | |
| $221.16 | | 2,295 | | | 1.13 | | $ | 221.16 | | | 2,295 | | | $ | 221.16 | |
| $262.44 | | 2,104 | | | 3.14 | | $ | 262.44 | | | 2,104 | | | $ | 262.44 | |
| $197.16 - 262.44 | | 10,326 | | | 1.45 | | $ | 218.83 | | | 10,326 | | | $ | 218.83 | |
Restricted ShareAwards/ Restricted Share Units/ Deferred ShareAwards
The following table presents the changes in restrictedWe grant phantom share unit awards, restricted share units and deferred share awards outstanding and related information for our employees and non-employee directors during the years ended December 31, 2020, 2019 and 2018:
| | | | | | | | | | | |
| | Number of
Awards/Units | | Weighted
Average Grant
Date Fair Value
Per Share |
| Nonvested shares at December 31, 2017 | 181,086 | | | $ | 42.29 | |
| Granted | 238,263 | | | 41.02 | |
| Vested | (103,741) | | | 46.76 | |
| Forfeited | (8,487) | | | 44.33 | |
| Nonvested shares at December 31, 2018 | 307,121 | | | $ | 39.73 | |
| Granted | 143,756 | | | 27.50 | |
| Vested | (135,943) | | | 39.10 | |
| Forfeited | (8,138) | | | 38.79 | |
| Nonvested shares at December 31, 2019 | 306,796 | | | $ | 34.31 | |
| Granted | 1,906 | | | 4.95 | |
| Vested | (186,551) | | | 33.78 | |
| Forfeited | (17,060) | | | 35.26 | |
| Nonvested shares at December 31, 2020 | 105,091 | | | $ | 34.56 | |
The weighted average grant date fair valuewhich vest a third per share for restricted share awards, restricted share units and deferred share awards granted during 2020, 2019 and 2018 was $4.95, $27.50 and $41.02, respectively. The total fair value of restricted share awards, restricted share units and deferred share awards vested during 2020, 2019 and 2018 was $2.6 million, $4.0 million and $3.8 million, respectively. At December 31, 2020, unrecognized compensation cost related to restricted share awards, restricted share units and deferred share awards was $1.3 million, which is expected to be recognizedyear over a weighted average period of 1.0 year.
Phantom Share Awards
three year period. Each phantom share unit award is equal in value to one common share. Upon vesting, each recipient will receive a lump sum cash payment equal to the fair market value of a common share on the respective vesting date.date in respect of each phantom share unit then vesting. These awards are accounted for as a liability that is remeasured at each reporting date until paid.
The following table presents the changes in phantom share unit awards outstanding and related information for our employees during the years ended December 31, 2020, 20192023, 2022 and 2018:2021:
| | | | | |
| | Number of Awards |
Nonvested shares at December 31, 20172020 | 379,370458,175 | |
| Granted | 0354,535 | |
| Vested | (189,408)(163,499) | |
| Forfeited | (1,079)(27,081) | |
Nonvested shares at December 31, 20182021 | 188,883622,130 | |
| Granted | 117,943335,098 | |
| Vested | (171,641)(270,382) | |
| Forfeited | (1,057)(27,558) | |
Nonvested shares at December 31, 20192022 | 134,128659,288 | |
| Granted | 413,569229,845 | |
| Vested | (55,977)(335,178) | |
| Forfeited | (33,545)(33,394) | |
Nonvested shares at December 31, 20202023 | 458,175520,561 | |
At December 31, 2020,2023, the balance of the liability for the phantom share awards was $2.2$5.7 million. For the years ended December 31, 2020, 20192023, 2022 and 2018,2021, we made phantom share cash payments of $0.9$10.4 million, $5.3$6.0 million and $8.2$3.1 million, respectively. At December 31, 2020,2023, unrecognized compensation cost related to phantom shares was $4.4$6.5 million, as remeasured at December 31, 2020,2023, which is expected to be recognized over a weighted average period of 2.01.6 years. The weighted average grant dategrant-date fair value per share of phantom shares granted during the years ended December 31, 2020, 20192023, 2022 and 20182021 was $15.84, $30.36$31.05, $21.97 and 0,$19.80, respectively.
Performance Share Awards
We grant performance share awards, which cliff vest inafter three years subject to attainment of applicable performance criteria. These awardsgoals. Awards granted in 2023 and 2022 will be earned in amounts between 0% and 200% of the participant’s target performance share award, based equally on (i) the payout percentage associated with Civeo’s relative TSR rank among a peer group of other companies and (ii) the payout percentage associated with Civeo's cumulative operating cash flow over the performance period relative to a preset target. Awards granted in 2021 are earned in amounts between 0% and 200% of the participant’s target performance share award, based on (i) the payout percentage associated with Civeo’s relative total shareholder return (TSR)TSR rank among a peer group of other companies. The resulting cost is recognizedcompanies and (ii) the payout percentage associated with Civeo's cumulative free cash flow over the performance period during which an employeerelative to a preset target. The grant-date fair value of the portion of the performance awards tied to
cumulative operating cash flow and free cash flow is requiredbased on target achievement and the closing market price of our common shares on the date of grant. We evaluate the probability of achieving the performance goals throughout the performance period and will adjust share-based compensation expense based on the number of shares expected to provide service in exchange forvest based on our estimate of the awards, usually the vesting period.most probable performance outcome.
The fair value of the TSR portion of each performance share award was estimated using a Monte Carlo simulation pricing model that uses the assumptions noted in the following table. The risk-free interest rate is based on the U.S. Treasury yield curve in effect for the expected term of the performance share at the time of grant. The dividend yield on our common shares was assumed to be zero since we dodid not currently pay dividends.dividends when the awards were granted. The expected market price volatility of our common shares was based on an estimate that considers the historical and implied volatility of our common shares as well as a peer group of companies over a time period equal to the expected term of the option.award. The initial TSR performance was based on historical performance of our common shares and the peer group’s common shares.
NaN performance share awards were granted in 2020.
| | | | | 2019 | | 2018 | | 2023 | | 2022 | | 2021 |
| Risk-free weighted interest rate | Risk-free weighted interest rate | | 2.5 | % | | 2.4 | % | Risk-free weighted interest rate | 4.4 | % | | 1.7 | % | | 0.2 | % |
| Expected volatility | Expected volatility | | 68.0 | % | | 79.0 | % | Expected volatility | 73.0 | % | | 78.0 | % | | 83.0 | % |
| Initial TSR | Initial TSR | | 0.7 | % | | (0.40) | % | Initial TSR | 4.1 | % | | 14.1 | % | | 27.1 | % |
The following table presents the changes in performance share awards outstanding and related information for our employees during the year ended December 31, 2020, 20192023, 2022 and 2018:2021:
| | | | Number of
Awards | | Weighted
Average Grant
Date Fair Value
Per Share | | Number of
Awards | | Weighted
Average Grant
Date Fair Value
Per Share |
| Nonvested shares at December 31, 2017 | 222,959 | | | $ | 42.86 | |
| Nonvested shares at December 31, 2020 | |
| Granted | Granted | 70,736 | | | 63.60 | |
Performance adjustment (1) | |
| Vested | Vested | 0 | | | 0 | |
| Forfeited | Forfeited | 0 | | | 0 | |
| Nonvested shares at December 31, 2018 | 293,695 | | | $ | 47.86 | |
| Nonvested shares at December 31, 2021 | |
| Granted | Granted | 98,717 | | | 44.76 | |
Performance adjustment (1)(2) | Performance adjustment (1)(2) | 160,156 | | | 35.20 | |
| Vested | Vested | (320,312) | | | 35.20 | |
| Forfeited | Forfeited | 0 | | | 0 | |
| Nonvested shares at December 31, 2019 | 232,256 | | | $ | 55.27 | |
| Nonvested shares at December 31, 2022 | |
| Granted | Granted | 0 | | | 0 | |
Performance adjustment (2)(3) | Performance adjustment (2)(3) | 47,101 | | | 62.40 | |
| Vested | (109,904) | | | 62.40 | |
Vested (3) | |
| Forfeited | Forfeited | (17,141) | | | 50.56 | |
| Nonvested shares at December 31, 2020 | 152,312 | | | $ | 52.86 | |
| Nonvested shares at December 31, 2023 | |
(1)Related to 20162018 performance share awards that vested in 2019,2021, which were paid out at 200%150% based on Civeo's TSR rank.
(2)Related to 20172019 performance share awards that vested in 2020,2022, which were paid out at 175%126% based on Civeo's TSR rank.
No performance share awards vested in 2023.
During the years ended December 31, 2020, 20192023, 2022 and 2018,2021, we recognized compensation expense associated with performance share awards totaling $2.7$3.4 million, $4.3$2.6 million and $4.6$2.4 million, respectively. At December 31, 2020,2023, unrecognized compensation cost related to performance share awards was $1.6$3.8 million, which is expected to be recognized over a weighted average period of 1.0 year.1.7 years.
Restricted ShareAwards/ Restricted Share Units/ Deferred ShareAwards
The following table presents the changes in restricted share awards, restricted share units and deferred share awards outstanding and related information for our employees and non-employee directors during the years ended December 31, 2023, 2022 and 2021:
| | | | | | | | | | | | |
| | Number of
Awards/Units | | Weighted
Average Grant
Date Fair Value
Per Share | |
| Nonvested shares at December 31, 2020 | 105,091 | | | $ | 34.56 | | |
| Granted | 59,027 | | | 17.58 | | |
| Vested | (77,304) | | | 35.76 | | |
| Forfeited | (1,957) | | | 30.36 | | |
| Nonvested shares at December 31, 2021 | 84,857 | | | $ | 21.76 | | |
| Granted | 40,465 | | | 25.64 | | |
| Vested | (86,290) | | | 21.83 | | |
| | | | |
| Nonvested shares at December 31, 2022 | 39,032 | | | $ | 25.62 | | |
| Granted | 50,336 | | | 21.02 | | |
| Vested | (39,770) | | | 25.53 | | |
| | | | |
| Nonvested shares at December 31, 2023 | 49,598 | | | $ | 21.02 | | |
The weighted average grant-date fair value per share for restricted share awards, restricted share units and deferred share awards granted during 2023, 2022 and 2021 was $21.02, $25.64 and $17.58, respectively. The total fair value of restricted share awards, restricted share units and deferred share awards vested during 2023, 2022 and 2021 was $0.9 million, $2.1 million and $1.5 million, respectively. At December 31, 2023, unrecognized compensation cost related to restricted share awards, restricted share units and deferred share awards was $0.4 million, which is expected to be recognized over a weighted average period of 0.4 years. In addition, at December 31, 2023, all nonvested shares were related to non-employee directors.
Optionsto Purchase Common Shares
No options were awarded or exercised in 2023, 2022 or 2021. We had 287 outstanding options at December 31, 2023 that expire in February 2024 with a weighted average exercise price per share of $262.44.
As no options were exercised in the last three years, the total intrinsic value of options exercised by our employees during 2023, 2022 and 2021 was zero. Additionally, the tax benefits realized for the tax deduction from options exercised during 2023, 2022 and 2021 totaled zero.
At December 31, 2023, unrecognized compensation cost related to options was zero.
19.20.PREFERRED SHARESSUPPLEMENTAL CASH FLOW INFORMATION
As further discussed in Note 7 – Acquisitions, onCash paid during the years ended December 31, 2023, 2022 and 2021 for interest and income taxes was as follows (in thousands):
| | | | | | | | | | | | | | | | | |
| | 2023 | | 2022 | | 2021 |
| Interest (net of amounts capitalized) | $ | 10,250 | | | $ | 9,226 | | | $ | 9,991 | |
| Net income taxes paid, net of refunds received | 251 | | | 220 | | | 334 | |
21.ACQUISITIONS
Noralta
On April 2, 2018, we issued 9,679 Preferred Shares as partacquired the equity of Noralta. As a result of the Noralta Acquisition.Acquisition, we expanded our existing accommodations business in the Canadian oil sands market. The Preferred Shares hadtotal consideration, which was subject to adjustment in accordance with the terms of the definitive agreement, included (i) C$207.7 million (or approximately US$161.2 million) in cash, subject to customary post-closing adjustments for working capital, indebtedness and transactions expenses, (ii) 2.7 million of our common shares, of which 1.1 million shares were held in escrow and released based on certain conditions related to Noralta customer contracts remaining in place, and (iii) 9,679 Series A preferred shares with an initial liquidation preference of $10,000 per share. Holders of the Preferred Shares are entitled to receive a 2% annual dividend on the liquidation preference paid quarterly in cash or, at our option, by increasing the Preferred Shares’ liquidation preference or any combination thereof. As of December 31, 2020, 9,042 Preferred Shares were outstanding. The decrease in Preferred Shares outstanding since the close of the Noralta Acquisition was due to the release of 637 Preferred Shares$96.8 million and initially held in escrow to support certain obligations of the Noralta Acquisition.
The Preferred Shares are convertible into our common shares at a conversion price of $39.60 per Preferred Share, subject to certain anti-dilution adjustments (the Conversion Price). We have the right to elect to convert the Preferred Shares into our common shares if the 15-day volume weighted average price2.4 million of our common shares is equal to or exceedsshares. We funded the Conversion Price. Holders of the Preferred Shares will have the right to convert the Preferred Shares intocash consideration with cash on hand and borrowings under our common shares at any time after 2 years from the date of issuance, and the Preferred Shares mandatorily convert after 5 years from the date of issuance. The Preferred Shares also convert automatically into our common shares upon a change of control of Civeo. We may, at any time and from time to time, redeem any or all of the Preferred Shares for cash at the liquidation preference, plus accrued and unpaid dividends.
The Preferred Shares do not have voting rights, except as statutorily required.
During the years ended December 31, 2020, 2019second quarters of each of 2023, 2022 and 2018, we recognized preferred dividends on2021, 0.4 million shares were released to the Preferred Shares as follows (in thousands): sellers from escrow.
| | | | | | | | | | | | | | | | | |
| 2020 | | 2019 | | 2018 |
| Deemed dividend on beneficial conversion feature at April 2, 2018 | $ | 0 | | | $ | 0 | | | $ | 47,849 | |
| In-kind dividends | 1,887 | | | 1,849 | | | 1,459 | |
| Deemed dividend on beneficial conversion feature related to in-kind dividend | 0 | | | 0 | | | 281 | |
| Total preferred dividends | $ | 1,887 | | | $ | 1,849 | | | $ | 49,589 | |
At the time the Preferred Shares were issued, we determined that a beneficial conversion feature existed as the fair value of the securities into which the Preferred Shares were convertible was greater than the effective conversion price on the issuance date. Accordingly, we recorded a beneficial conversion feature of $47.8 million. As the Preferred Shares do not have a stated redemption date, the discount is required to be recognized as a dividend over the minimum period from the date of issuance through the date of earliest conversion. Because the 15-day volume weighted average price of our common shares was greater than $39.60 on April 2, 2018, the earliest conversion date was determined to be April 2, 2018. Accordingly, we recorded a deemed dividend on April 2, 2018 totaling the discount of $47.8 million.
The Board of Directors elected to pay the dividends for each quarterly period beginning June 30, 2018 through December 31, 2020 through an increase in the liquidation preference rather than in cash. The paid-in-kind dividend of $1.9 million, $1.8 million and $1.5 million is included in Preferred dividends on the accompanying consolidated statements of operations for the years ended December 31, 2020, 2019 and 2018, respectively.
20.22.SEGMENT AND RELATED INFORMATION
In accordance with current accounting standards regarding disclosures about segments of an enterprise and related information, we have identified the followingtwo reportable segments:segments, Canada Australia and the U.S.,Australia, which represent our strategic focus on hospitality services and workforce accommodations. Prior to the first quarter of 2023, we presented the U.S. operating segment as a separate reportable segment. Our operating segment in the U.S. no longer meets the reportable segment quantitative thresholds required by U.S. GAAP and is included below within the Corporate, other and eliminations category. Prior periods have been updated to be consistent with the presentation for the year ended December 31, 2023.
Financial information by business segment for each of the three years ended December 31, 2020, 20192023, 2022 and 20182021 is summarized in the following table (in thousands):
| | | | Total
Revenues | | Depreciation and amortization | | Operating (loss) income | | Capital expenditures | | Total assets | | Total
Revenues | | Depreciation and amortization | | Operating (loss) income | | Capital expenditures | | Total assets |
| 2020 | | | | | | | | | |
| 2023 | |
| Canada | |
| Canada | |
| Canada | Canada | $ | 269,649 | | | $ | 52,009 | | | $ | (146,435) | | | $ | 2,201 | | | $ | 720,482 | |
| Australia | Australia | 234,542 | | | 40,747 | | | 27,804 | | | 5,470 | | | 281,180 | |
| U.S. | 25,538 | | | 3,240 | | | (23,151) | | | 1,557 | | | 26,801 | |
| Corporate and eliminations | 0 | | | 551 | | | (5,406) | | | 855 | | | (287,610) | |
| Corporate, other and eliminations | |
| Total | Total | $ | 529,729 | | | $ | 96,547 | | | $ | (147,188) | | | $ | 10,083 | | | $ | 740,853 | |
| | 2019 | |
| 2022 | |
| 2022 | |
| 2022 | |
| Canada | |
| Canada | |
| Canada | Canada | $ | 325,651 | | | $ | 66,557 | | | $ | (32,313) | | | $ | 22,124 | | | $ | 850,361 | |
| Australia | Australia | 156,093 | | | 39,116 | | | 517 | | | 3,456 | | | 278,268 | |
| U.S. | 45,811 | | | 10,987 | | | (11,214) | | | 3,104 | | | 46,862 | |
| Corporate and eliminations | 0 | | | 7,108 | | | (6,041) | | | 1,128 | | | (205,579) | |
| Corporate, other and eliminations | |
| Total | Total | $ | 527,555 | | | $ | 123,768 | | | $ | (49,051) | | | $ | 29,812 | | | $ | 969,912 | |
| | 2018 | |
| 2021 | |
| 2021 | |
| 2021 | |
| Canada | |
| Canada | |
| Canada | Canada | $ | 296,012 | | | $ | 66,980 | | | $ | (63,519) | | | $ | 6,025 | | | $ | 804,618 | |
| Australia | Australia | 119,238 | | | 40,441 | | | (1,950) | | | 4,658 | | | 292,271 | |
| U.S. | 51,442 | | | 10,626 | | | (8,640) | | | 5,388 | | | 60,282 | |
| Corporate and eliminations | 0 | | | 7,799 | | | (13,946) | | | 1,037 | | | (155,494) | |
| Corporate, other and eliminations | |
| Total | Total | $ | 466,692 | | | $ | 125,846 | | | $ | (88,055) | | | $ | 17,108 | | | $ | 1,001,677 | |
Financial information by geographic segment as of and for each of the three years ended December 31, 2020, 20192023, 2022 and 2018,2021, is summarized below (in thousands). Revenues in the U.S.Other revenues include export sales. Revenues are attributable to countries based on the location of the entity selling the products or performing the services. Long-lived assets are attributable to countries based on the physical location of the entity and its operating assets and do not include intercompany balances.
| | | | Canada | | Australia | | U.S. and
Other | | Total | | Canada | | Australia | | Other | | Total |
| 2020 | | | | | | | |
| 2023 | |
| Revenues from unaffiliated customers | |
| Revenues from unaffiliated customers | |
| Revenues from unaffiliated customers | Revenues from unaffiliated customers | $ | 269,649 | | | $ | 234,542 | | | $ | 25,538 | | | $ | 529,729 | |
| Long-lived assets | Long-lived assets | 368,636 | | | 229,629 | | | 23,375 | | | 621,640 | |
| | 2019 | |
| 2022 | |
| 2022 | |
| 2022 | |
| Revenues from unaffiliated customers | |
| Revenues from unaffiliated customers | |
| Revenues from unaffiliated customers | Revenues from unaffiliated customers | $ | 325,651 | | | $ | 156,093 | | | $ | 45,811 | | | $ | 527,555 | |
| Long-lived assets | Long-lived assets | 558,310 | | | 242,002 | | | 38,159 | | | 838,471 | |
| | 2018 | |
| 2021 | |
| 2021 | |
| 2021 | |
| Revenues from unaffiliated customers | |
| Revenues from unaffiliated customers | |
| Revenues from unaffiliated customers | Revenues from unaffiliated customers | $ | 296,012 | | | $ | 119,238 | | | $ | 51,442 | | | $ | 466,692 | |
| Long-lived assets | Long-lived assets | 580,644 | | | 263,094 | | | 50,142 | | | 893,880 | |
21.23.VALUATION ACCOUNTS
Activity in the valuation accounts was as follows (in thousands):
| | | | Balance at
Beginning
of Period | | Charged (Reduction) to
Costs and
Expenses | | Deductions
(Net of
Recoveries) | | Translation
and Other,
Net | | Balance
at End of
Period | | Balance at
Beginning
of Period | | Charged (Reduction) to
Costs and
Expenses | | Deductions
(Net of
Recoveries) | | Translation
and Other,
Net | | Balance
at End of
Period |
| Year Ended December 31, 2020: | | | | | | | | | |
| Year Ended December 31, 2023: | |
| Allowance for credit losses on accounts receivable | |
| Allowance for credit losses on accounts receivable | |
| Allowance for credit losses on accounts receivable | Allowance for credit losses on accounts receivable | $ | 253 | | | $ | 46 | | | $ | (44) | | | $ | 20 | | | $ | 275 | |
| Valuation allowance for deferred tax assets | Valuation allowance for deferred tax assets | 84,503 | | | (1,355) | | | (1,663) | | | 6,766 | | | 88,251 | |
| | Year Ended December 31, 2019: | |
| Year Ended December 31, 2022: | |
| Year Ended December 31, 2022: | |
| Year Ended December 31, 2022: | |
| Allowance for credit losses on accounts receivable | |
| Allowance for credit losses on accounts receivable | |
| Allowance for credit losses on accounts receivable | Allowance for credit losses on accounts receivable | $ | 376 | | | $ | (5) | | | $ | (122) | | | $ | 4 | | | $ | 253 | |
| Valuation allowance for deferred tax assets | Valuation allowance for deferred tax assets | 82,833 | | | 2,257 | | | (499) | | | (88) | | | 84,503 | |
| | Year Ended December 31, 2018: | |
| Year Ended December 31, 2021: | |
| Year Ended December 31, 2021: | |
| Year Ended December 31, 2021: | |
| Allowance for credit losses on accounts receivable | |
| Allowance for credit losses on accounts receivable | |
| Allowance for credit losses on accounts receivable | Allowance for credit losses on accounts receivable | $ | 1,338 | | | $ | (787) | | | $ | (143) | | | $ | (32) | | | $ | 376 | |
| Valuation allowance for deferred tax assets | Valuation allowance for deferred tax assets | 90,663 | | | (622) | | | (1,119) | | | (6,089) | | | 82,833 | |
22.QUARTERLY FINANCIAL INFORMATION(UNAUDITED)
The following table summarizes quarterly financial information for 2020 and 2019 (in thousands, except per share amounts):
| | | | | | | | | | | | | | | | | | | | | | | |
| | First
Quarter (3) | | Second
Quarter (4) | | Third
Quarter (5) | | Fourth
Quarter (6) |
| 2020 | | | | | | | |
| Revenues | $ | 138,792 | | | $ | 114,702 | | | $ | 142,857 | | | $ | 133,378 | |
Gross profit (1) | 35,479 | | | 31,569 | | | 45,423 | | | 35,170 | |
| Net (loss) income attributable to Civeo | (146,538) | | | 6,136 | | | 6,517 | | | (2,252) | |
Basic (loss) income per share (2) | (10.43) | | | 0.37 | | | 0.39 | | | (0.16) | |
Diluted (loss) income per share (2) | (10.43) | | | 0.37 | | | 0.39 | | | (0.16) | |
| | | | | | | |
| 2019 | | | | | | | |
| Revenues | $ | 108,550 | | | $ | 122,153 | | | $ | 148,163 | | | $ | 148,689 | |
Gross profit (1) | 28,920 | | | 36,913 | | | 48,683 | | | 46,225 | |
| Net (loss) income attributable to Civeo | (17,498) | | | (15,310) | | | 4,532 | | | (32,064) | |
Basic (loss) income per share (2) | (1.27) | | | (1.10) | | | 0.28 | | | (2.30) | |
Diluted (loss) income per share (2) | (1.27) | | | (1.10) | | | 0.28 | | | (2.30) | |
(1)Represents "revenues" less "product costs" and "service and other costs" included in our consolidated statements of operations.
(2)Per-share computations reflect the impact of our 1-for-12 reverse share split effective November 19, 2020. See Note 1 - Description of Business and Basis of Presentation for further discussion.
(3)In the first quarter of 2020, we recognized the following items:
•Goodwill impairment loss of $93.6 million ($93.6 million after-tax, or $6.67 per diluted share) related to our Canada reporting unit. The charge is included in Impairment expense on the accompanying consolidated statements of operations.
•A charge of $38.1 million ($38.1 million after-tax, or $2.71 per diluted share), related to assets in our Canada segment. The charge is included in Impairment expense on the accompanying consolidated statements of operations.
•A charge of $12.4 million ($12.4 million after-tax, or $0.89 per diluted share), related to assets in our U.S segment. The charge is included in Impairment expense on the accompanying consolidated statements of operations.
In the first quarter of 2019, there were no significant items recognized.
(4)In the second quarter of 2020, we recognized the following items:
•Income of $4.7 million ($4.7 million after-tax, or $0.33 per diluted share) associated with the settlement of a representations and warranties claim related to the Noralta Acquisition included in Other income.
In the second quarter of 2019, we recognized the following items:
•A charge of $4.5 million ($4.5 million after-tax, or $0.32 per diluted share), related to assets in our Australian segment. The charge is included in Impairment expense on the accompanying consolidated statements of operations.
•We identified a liability related to an ARO at one of our villages in Australia that should have been recorded in 2011. We determined that the error was not material to our previously issued financial statements included in our Annual Report on Form 10-K for the year ended December 31, 2018, and therefore, corrected the error in the second quarter of 2020. Specifically, we recorded: (1) additional accretion expense related to the ARO of $0.9 million, (2) additional depreciation and amortization expense of $0.5 million related to amortization of the related asset retirement cost and (3) additional impairment expense related to the impairment of the asset retirement cost of $1.0 million offset by recognition of an ARO liability totaling $2.3 million as of June 30, 2019.
(5)In the third quarter of 2020, there were no significant items recognized.
In the third quarter of 2019, we recognized the following items:
•A gain on sale of assets related to the sale of a village in Australia and related $2.2 million release of an ARO liability assumed by the buyer.
•Costs associated with the Action acquisition of $0.2 million ($0.2 million after-tax, or $0.02 per diluted share), included primarily in Selling, general and administrative expenses on the accompanying consolidated statements of operations.
(6)In the fourth quarter of 2020, there were no significant items recognized.
In the fourth quarter of 2019, we recognized the following items:
•Goodwill impairment loss of $19.9 million ($19.9 million after-tax, or $1.42 per diluted share) related to our Canada reporting unit. The charge is included in Impairment expense on the accompanying consolidated statements of operations.
•A charge of $0.7 million ($0.5 million after-tax, or $0.04 per diluted share), related to assets in our Canada segment. The charge is included in Impairment expense on the accompanying consolidated statements of operations.
•Costs associated with the Action acquisition of $0.2 million ($0.2 million after-tax, or $0.01 per diluted share), included primarily in Selling, general and administrative expenses on the accompanying consolidated statements of operations.
Amounts are calculated independently for each of the quarters presented. Therefore, the sum of the quarterly amounts may not equal the total calculated for the year.