UNITED STATES
SECURITIES AND EXCHANGE COMMISSION
Washington, D.C. 20549
FORM 10-K
(Mark One)
| | | | | |
| ☒ | ANNUAL REPORT PURSUANT TO SECTION 13 OR 15(d) OF THE SECURITIES EXCHANGE ACT OF 1934 |
For the fiscal year ended December 31, 20212023
OR
| | | | | |
| ☐ | TRANSITION REPORT PURSUANT TO SECTION 13 OR 15(d) OF THE SECURITIES EXCHANGE ACT OF 1934 |
For the transition period to
Commission File No. 001-36629
CAESARS ENTERTAINMENT, INC.
(Exact name of registrant as specified in its charter)
Delaware
(State or other jurisdiction of
incorporation or organization)
46-365678146-3657681
(I.R.S. Employer
Identification No.)
100 West Liberty Street, 12th Floor
Reno, Nevada 89501
(Address of principal executive offices)
Telephone: (775) 328-0100
(Registrant’s telephone number, including area code)
Securities registered pursuant to Section 12(b) of the Act:
| | | | | | | | | | | | | | |
| Title of each class | | Trading symbol | | Name of each exchange on which registered |
Common Stock, $.00001,$0.00001, par value | | CZR | | NASDAQ Stock Market |
Securities registered pursuant to section 12(g) of the Act: None
Indicate by check mark if the registrant is a well-known seasoned issuer, as defined in Rule 405 of the Securities Act. Yes ☒ No ☐
Indicate by check mark if the registrant is not required to file reports pursuant to Section 13 or Section 15(d) of the Act. Yes ☐ No ☒
Indicate by check mark whether the registrant (1) has filed reports required to be filed by Section 13 or 15(d) of the Securities Exchange Act of 1934 during the preceding 12 months (or for such shorter period that the registrant was required to file such reports), and (2) has been subject to such filing requirements for the past 90 days. Yes ☒ No ☐
Indicate by check mark whether the registrant has submitted electronically every Interactive Data File required to be submitted pursuant to Rule 405 of Regulation S-T (§232.405 of this chapter) during the preceding 12 months (or for such shorter period that the registrant was required to submit such files). Yes ☒ No ☐
Indicate by check mark whether the registrant is a large accelerated filer, an accelerated filer, a non-accelerated filer, a smaller reporting company, or emerging growth company. See the definitions of “large accelerated filer,” “accelerated filer,” “smaller reporting company” and “emerging growth company” in Rule 12b-2 of the Exchange Act.
| | | | | | | | | | | | | | | | | |
| Large accelerated filer | ☒ | Accelerated filer | ☐ | Non-accelerated filer | ☐ |
| Smaller reporting company | ☐ | Emerging growth company | ☐ | | |
If an emerging growth company, indicate by checkmark if the registrant has elected not to use the extended transition period for complying with any new or revised financial accounting standards provided pursuant to Section 13(a) of the Exchange Act. ☐
Indicate by check mark whether the registrant has filed a report on and attestation to its management’s assessment of the effectiveness of its internal control over financial reporting under Section 404(b) of the Sarbanes-Oxley Act (15 U.S.C. 7262(b)) by the registered public accounting firm that prepared or issued its audit report. ☒
If securities are registered pursuant to Section 12(b) of the Act, indicate by check mark whether the financial statements of the registrant included in the filing reflect the correction of an error to previously issued financial statements. ☐
Indicate by check mark whether any of those error corrections are restatements that require a recovery analysis of incentive-based compensation received by any of the registrant’s executive officers during the relevant recovery period pursuant to Section §240.10D-1(b). ☐
Indicate by check mark whether the registrant is a shell company (as defined in Rule 12b-2 of the Exchange Act). Yes ☐ No ☒
The aggregate market value of the common stock held by non-affiliates of the Registrant was $21.1$10.5 billion at June 30, 20212023 based upon the closing price for the shares of CZR’s common stock as reported by The Nasdaq Stock Market.
As of February 17, 2022,15, 2024, there were 214,123,451216,299,768 outstanding shares of the Registrant’s Common Stock, net of treasury shares.
Documents Incorporated by Reference
Portions of the Registrant’s definitive proxy statement to be filed with the Commission pursuant to Regulation 14A in connection with the Registrant’s Annual Meeting of Stockholders (the “Proxy Statement”) are incorporated by reference into Part III of this report. Such Proxy Statement will be filed with the Commission not later than 120 days after the conclusion of the Registrant’s fiscal year ended December 31, 2021.2023.
CAESARS ENTERTAINMENT, INC.
ANNUAL REPORT FOR THE YEAR ENDED DECEMBER 31, 20212023
TABLE OF CONTENTS
PART I
In this filing, Caesars Entertainment, Inc., a Delaware corporation, isand its subsidiaries may be referred to as the “Company,” “CEI,” “Caesars,” or the “Registrant,” and together with its subsidiaries may also be referred to as “we,” “us” or “our.“our” or the “Registrant.”
We also refer to (i) our Consolidated Financial Statements as our “Financial Statements,” (ii) our Consolidated Statements of Operations and Consolidated Statements of Comprehensive Income (Loss) as our “Statements of Operations,” (iii) our Consolidated Balance Sheets as our “Balance Sheets,” and (iv) our Consolidated Statements of Cash Flows as our “Statements of Cash Flows.Flows,” which are prepared in accordance with accounting principles generally accepted in the United States (“GAAP”). References to numbered “Notes” refer to Notes to our Consolidated Financial Statements included in Item 8.
Item 1. Business
Overview
We are a geographically diversified gaming and hospitality company that was founded in 1973 by the Carano family with the opening of the Eldorado Hotel Casino in Reno, Nevada. Beginning in 2005, we grew through a series of acquisitions, including the acquisition of MTR Gaming Group, Inc. in 2014, Isle of Capri Casinos, Inc. (“Isle” or “Isle of Capri”) in 2017, and Tropicana Entertainment, Inc. in 2018. On July 20, 2020, we completed the merger with2018, Caesars Entertainment Corporation (“Former Caesars”in 2020, and William Hill PLC (the “William Hill Acquisition”) pursuant to which Former Caesars became our wholly-owned subsidiary (the “Merger”) and we changed the Company’son April 22, 2021. Our ticker symbol on the NASDAQ Stock Market from “ERI” to “CZR”. On April 22, 2021, we completed the acquisition of William Hill PLC (the “William Hill Acquisition”).is “CZR.”
Our primary source of revenue is generated by our casino properties’ gaming operations, which includes our retail and online sports betting as well asand online gaming, and we utilize our hotels, restaurants, bars, entertainment, racing, retail shops and other services to attract customers to our properties.
As of December 31, 2023, we own, lease or manage an aggregate of 52 domestic properties in 18 states. We also operate and conduct sports wagering across 31 jurisdictions in North America, 25 of which offer online sports betting, and operate iGaming in five jurisdictions in North America. We continue to expand into additional markets as jurisdictions legalize forms of retail and online gaming and sports betting. In addition, we have other properties in North America that are authorized to use the brands and marks of Caesars Entertainment, Inc., as well as other non-gaming properties. We lease certain real property assets from third parties, including GLP Capital, L.P., the operating partnership of Gaming and Leisure Properties, Inc. (“GLPI”) and VICI Properties L.P., a Delaware limited partnership (“VICI”).
As of December 31, 2021, we own, lease or manage an aggregate of 52 domestic properties in 16 states with approximately 55,700 slot machines, video lottery terminals and e-tables, approximately 2,900 table games and approximately 47,700 hotel rooms. We also operate and conduct sports wagering across 21 states and domestic jurisdictions, 14 of which are mobile for sports betting, and operate regulated online real money gaming in five states. We continue to expand into additional markets as jurisdictions legalize forms of retail and online sports betting. In addition, we have other domestic and international properties that are authorized to use the brands and marks of Caesars Entertainment, Inc., as well as other non-gaming properties. See
Item 2, “Properties,” for more information about our properties.Significant Transactions in 2021
On September 30, 2020, the Company announced that it had reached an agreement with William Hill PLC on the terms of a recommended cash acquisition pursuant to which the Company would acquire the entire issued and to be issued share capital (other than shares owned by the Company or held in treasury) of William Hill PLC, in an all-cash transaction. On April 22, 2021, the Company completed the acquisition of William Hill PLC for £2.9 billion, or approximately $3.9 billion.
In connection with the William Hill Acquisition, on April 22, 2021, a newly formed subsidiary of the Company (the “Bridge Facility Borrower”) entered into a Credit Agreement (the “Bridge Credit Agreement”) with certain lenders party thereto and Deutsche Bank AG, London Branch, as administrative agent and collateral agent, pursuant to which the lenders party thereto provided the Debt Financing (as defined below). The Bridge Credit Agreement provides for (a) a 540-day £1.0 billion asset sale bridge facility, (b) a 60-day £503 million cash confirmation bridge facility and (c) a 540-day £116 million revolving credit facility (collectively, the “Debt Financing”). The proceeds of the bridge loan facilities provided under the Bridge Credit Agreement were used (i) to pay a portion of the cash consideration for the acquisition and (ii) to pay fees and expenses related to the acquisition and related transactions. The proceeds of the revolving credit facility under the Bridge Credit Agreement may be used for working capital and general corporate purposes. The £1.5 billion Interim Facilities Agreement (the “Interim Facilities Agreement”) entered into on October 6, 2020 with Deutsche Bank AG, London Branch and JPMorgan Chase Bank, N.A., and amended on December 11, 2020, was terminated upon the execution of the Bridge Credit Agreement. On May 12, 2021, we repaid the £503 million cash confirmation bridge facility. On June 14, 2021, the Company drew down the full £116 million from the revolving credit facility and the proceeds, in addition to excess Company cash, were used to make a partial repayment of the asset sale bridge facility in the amount of £700 million. Outstanding borrowings under the Bridge Credit Agreement are expected to be repaid upon the sale of William Hill’s non-U.S. operations including the UK and international online divisions and the retail betting shops (collectively, “William Hill International”), all of which are held for
sale as of the date of the closing of the William Hill Acquisition and reflected within discontinued operations. Certain investments acquired have been excluded from the held for sale asset group.
On September 8, 2021, the Company entered into an agreement to sell William Hill International to 888 Holdings Plc for approximately £2.2 billion. After repayment of the outstanding debt under the Bridge Credit Agreement, described above, the Company expects to receive approximately £835 million, or $1.2 billion, subject to any permitted leakage, which is customary for sale transactions in the UK. In order to manage the risk of changes in the GBP denominated sales price and expected proceeds, the Company has entered into foreign exchange forward contracts. The sale is subject to satisfaction of customary conditions, including receipt of the approval of shareholders of 888 Holdings Plc and regulatory approvals, and is expected to close in the second quarter of 2022.
On April 6, 2021, the Company consummated the sale of the equity interests of MontBleu Casino Resort & Spa (“MontBleu”) to Bally’s Corporation for $15 million, subject to a customary working capital adjustment, resulting in a gain of less than $1 million. The purchase price for MontBleu is due no later than the first anniversary of the consummation of the transaction. MontBleu was within the Regional segment.
On June 3, 2021, the Company consummated the sale of the real property and equity interests of Tropicana Evansville (“Evansville”) to GLPI and Bally’s Corporation (formerly “Twin River” or Twin River Worldwide Holdings, Inc.), respectively, for $480 million, resulting in a gain of $12 million. Evansville was within the Regional segment.
On September 3, 2021, the Company consummated the sale of Caesars Southern Indiana to the Eastern Band of Cherokee Indians (“EBCI”) for $250 million, subject to a customary working capital adjustment, resulting in a gain of $12 million. In connection with the transaction, the Company’s annual base rent payments to VICI Properties under the Regional Master Lease (as defined below) were reduced by $33 million. Additionally, the Company and EBCI extended their existing relationship by entering into a 10-year brand license agreement, with cancellation rights in exchange for a termination fee at the buyer’s discretion following the fifth anniversary of the agreement, for the continued use of the Caesars brand and Caesars Rewards loyalty program at Caesars Southern Indiana. Caesars Southern Indiana was previously reported within the Regional segment and subsequent to the sale, as a result of the license agreement relating to the continued use of the Caesars brand and Caesars Rewards loyalty program at Caesars Southern Indiana, is reported within the Managed and Branded segment.
On November 1, 2021, the Company and VICI consummated the sale of Harrah’s Louisiana Downs Casino, Racing & Entertainment (“Harrah’s Louisiana Downs”) to Rubico Acquisition Corp. for $22 million, subject to a customary working capital adjustment. The proceeds from the sale were split between the Company and VICI. The annual base rent payments under the Regional Lease between Caesars and VICI remain unchanged.
On August 26, 2021, the Company increased its ownership interest in CBAC Borrower, LLC (“Horseshoe Baltimore”), a property which it also manages, to approximately 75.8%. Caesars was subsequently determined to have a controlling financial interest in Horseshoe Baltimore and we began to consolidate the results of operations of the property following our change in ownership. Our previously held investment was remeasured as of the date of our change in ownership and the Company recognized a gain of $40 million during the year ended December 31, 2021. Management fees received prior to the consolidation event have been presented within our Managed and Branded segment. Following the increase in ownership, the operations of Horseshoe Baltimore are presented within the Regional segment.
On December 1, 2020, the Company entered into an agreement to sell the operations of Belle of Baton Rouge Casino & Hotel (“Baton Rouge”) to CQ Holding Company, Inc. The transaction has received regulatory approvals and is expected to close in the first quarter of 2022, subject to other customary closing conditions.
Developments related to COVID-19
In January 2020, an outbreak of a new strain of coronavirus (“COVID-19”) was identified and spread throughout much of the world, including the U.S. All of the Company’s casino properties were temporarily closed for the period from mid-March 2020 through mid-May 2020 due to orders issued by various government agencies and tribal bodies as part of certain precautionary measures intended to help slow the spread of COVID-19. During the year ended December 31, 2021, most of our properties experienced positive trends as restrictions on maximum capacities and amenities available were eased.
Following temporary furloughs and salary reductions during 2020, the Company has emphasized a focus on labor efficiencies as operations resumed. As properties began to reopen during the year ended December 31, 2020, certain capacity restrictions, mask mandates, sanitation guidelines, and the federal COVID-19 vaccine and testing emergency temporary standard were adhered to as required by governmental or tribal orders, directives, and guidelines.
The Company experienced positive operating trends in 2021, with a continued focus on operational efficiencies. Although we have experienced a decline in net income, Adjusted EBITDA and Adjusted EBITDA margins for the year ended December 31, 2021 exceeded pre-pandemic levels experienced in 2019 within our Las Vegas and Regional segments. However, certain revenue streams, such as convention and entertainment revenues, continued to be negatively impacted due to capacity restrictions in the first half of 2021. Future effects of COVID-19 from further outbreaks, including new variants, mask mandates or other restrictions are uncertain and could result in additional closures such as the temporary closure of Caesars Windsor from January 5, 2022 through January 31, 2022. Extensive closure periods impacting many of our properties would have a material adverse effect on future results of operations.
Business Operations
Our consolidated business is composed of five complementary businesses that reinforce, cross-promote, and build upon each other: casino, which includes our retail and online sports betting and iGaming, food and beverage, hotel, casino management services, entertainment, retail and entertainment and other business operations.
Casino Operations
Our casino operations generate revenues from approximately 55,70051,300 slot machines, and 2,9002,700 table games, including poker, as well assports betting from our retail and online sportsbooks, iGaming and other games such as keno, and race and online sportsbooks, all of which comprised approximately 61%55% of our total net revenues in 2021.2023. Slot revenues generate the majority of our casino revenues.
Retail and Online Sports Betting and iGaming
We previously entered into a 25-year agreement with William Hill PLC’s U.S. subsidiary, William Hill U.S. Holdco, Inc. (“William Hill US” and together with William Hill PLC, “William Hill”), which became effective January 29, 2019, and granted to William Hill the right to conduct betting activities, including operating sportsbooks, in retail channels and under certain skins for online channels with respect to our current and future properties and conduct certain real money online gaming activities. On April 22, 2021, we consummated our previously announced acquisition of William Hill PLC in an all-cash transaction. Prior to the transaction, we accounted for our investment in William Hill PLC as an investment in equity securities we accounted for our investment in William Hill US as an equity method investment.
Prior to the acquisition, William Hill operated 37 sportsbooks at our properties in eight states. Subsequent to the William Hill Acquisition, we operate and conduct retail and online sports wagering across 21 U.S. states and domestic31 jurisdictions in North America as of December 31, 2021. Additionally,2023. In addition to our online poker operations, we operate regulated online real money gaming businessesiGaming in five statesjurisdictions in North America and continue to leverage the World Series of Poker (“WSOP”) brand and license the WSOP trademarks for a variety of products and services. Players in markets such as New Jersey can playWe offer hundreds of online casino games including slots, table games, live dealer and video poker and we expect to similarly increase our product offerings in Pennsylvania, Michigan and additional states as iGaming is legalized.
Extensive usage of digital platforms, continued legalizationlegalized in additional states, and growing bettor demand are driving the market for online sports betting platforms in the United States and the William Hill Acquisition positioned us to address this growing market.states.
We launched our Caesars Sportsbook app on our owned and integrated technology platform we have labeled Liberty (“Liberty”). We have launched a significant marketing campaign with distinguished actors, athletes and media personalities promoting the launch of the Caesars Sportsbook app. in 2021. The app offers extensive pre-match and live markets, extensive odds and flexible limits, player props, and same-game parlays. In addition to the Caesars Sportsbook app, the Company and NYRABets LLC, the official online wagering platform of the New York Racing Association, Inc., launched the Caesars Racebook app in 2022. The Caesars Racebook app operates in 20 states and provides access for pari-mutuel wagering at over 300 racetracks around the world as well as livestreaming of races. Additionally, we launched our new Caesars Palace Online Casino application in states and territories where we operate iGaming in 2023. Wagers placed can earn credits towards the Caesars Rewards loyalty program or points which can be redeemed for free wagering credits. No customers under 21 years old are allowed to wager on any of our Caesars Sportsbook, Caesars Racebook and iGaming mobile apps. Growth in the Caesars Digital segment continues to be realized with the strategic expansion into new states as jurisdictions legalize retail and online sports betting and online horse race wagering.
Sports Brand Partnerships — Caesars Sportsbook has partnerships with the NFL, NBA, NHL, MLB, and several individual teams, while being the exclusive odds provider for ESPN and CBS Sports.teams. We continuehave continued to create new partnerships among collegiate and professional sports teams including theand, in 2021, entered into a 20-year exclusive naming-rights partnership that rebrandedbranding the Caesars Superdome. GrowthSuperdome in the Caesars Digital segment continues to be realized with the expansion into new states as jurisdictions legalize retail and online sports betting.
Sports Brand Partnerships — New Orleans. Our strategy includes developing local and national partnerships that align our sportsbooks, casinos, resorts and brands with sports fans. In 2019, we announcedWe have high-profile exclusive sports entertainment partnerships with the NFL, making Caesars the first-ever “Official Casino Sponsor” in the history of the league. This historic partnership combines the NFL’s legendary events with our properties to bring unique experiences to Caesarsour patrons. This includes exclusive rights to use NFL trademarks to promote our properties alsoand enabling Caesars to host exclusive special events and experiences. Caesars willWe expect to continue to host brand activations at prominent, high-profile NFL events, including the NFL Draft, NFL playoffs, and the Super Bowl during this multi-year partnership.
Food and Beverage Operations
Our food and beverage operations generate revenues from our dining venues, bars, nightclubs, and lounges located throughout our casinos and represented approximately 12%15% of our total net revenues in 2021.2023. Many of our properties include several dining options, ranging from upscale dining experiences to moderately-priced restaurants, some of which offer pickup or in-room delivery options.
Hotel Operations
Hotel operations generate revenues from hotel stays at our properties in our approximately 47,70044,700 guest rooms and suites worldwide and represented approximately 16%18% of our total net revenues in 2021.2023. Our properties operate at various price and service points, allowing us to host a variety of casino guests, who are visiting our properties for gaming and other casino entertainment options, and non-casino guests who are visiting our properties for other purposes, such as vacation travel or conventions.
Management and Branding Arrangements
We earn revenue from fees paid for the management of four domestic casinos.other hotels and casinos in North America. Managed properties represent Caesars-branded properties where we provide certain staffing and management services under management agreements. In addition, we authorize the use of certain brands and marks of Caesars Entertainment, Inc. Wefrom which we earn revenue from brand license fees received based on the arrangements.
Entertainment and Other Non-Gaming Operations
We provide a variety of retail and entertainment offerings at our properties. We operate various entertainment venues across the United States, including the Colosseum at Caesars Palace Las Vegas and ZapposBakkt Theater at Planet Hollywood.Hollywood Resort & Casino. These award-winning entertainment venues host or have announced plans to host, prominent headliners such as Adele, John Legend, Sting, Donny OsmondGarth Brooks, The Killers, Kelly Clarkson, Jerry Seinfeld, Shania Twain and Keith Urban.Miranda Lambert.
The LINQ Promenade is an open-air dining, entertainment, and retail development located between The LINQ Hotel & Casino and Flamingo Las Vegas, which features The High Roller, a 550-foot observation wheel, and Fly LINQ, the first and only zipline on the Las Vegas Strip. The retail stores offer guests a wide range of options from high-end brands and accessories to souvenirs and decorative items.
CAESARS FORUM is a 550,000 square-foot state-of-the-art conference center located at the center of the Las Vegas Strip. CAESARS FORUM can accommodate more than 10,000 participants and features more than 300,000 square feet of flexible meeting space, the two largest pillarless ballrooms in the world, a LEED silver-rating, andsilver-rated FORUM Plaza, and the first 100,000 square-foot outdoor meeting and event space in Las Vegas. Though currently available for use with no restrictions, COVID-19 related restrictions limited our ability to utilize the convention center and meeting space at full capacity during the first half
Market Activities
Trends
COVID-19 and Related ImpactsEconomic Factors Impacting Discretionary Spending — Gaming and other leisure activities we offer represent discretionary expenditures which may be sensitive to economic downturns. The extentresurgence of the ongoingOmicron variant of COVID-19 continued to impact the beginning of 2022, however, many of our properties experienced positive trends during much of the year ended December 31, 2022 including higher hotel occupancy and futurerates, particularly in Las Vegas, and increased gaming and food and beverage volumes coupled with improved product mix.
We continue to monitor the effects of COVID-19 on our businessrecent inflation and the casino resort industry and economy generallypossible implications on certain customers most affected by lower discretionary income. Although we have seen periods of reduced visitation from those customers, visitation from customers who are not as affected by inflation remains uncertain. While we experienced positive operating trends in 2021, we continuedsteady or has slightly improved. In addition, our leases with VICI are impacted by inflation as they are subject to see a prolonged impact of COVID-19annual escalators based on the economy,Consumer Price Index (“CPI”).
We are also continuing to monitor rising interest rates which have a direct impact on certain of our debt instruments, in addition to an effect on consumer spending. We evaluate projected changes in interest rates when entering into borrowing arrangements and manage our mix of fixed versus variable debt.
We continue to manage the economic challenges affecting our industry and our Company with increased challenges arising fromthat arise including labor shortages, higher labor costs, supply chain challenges, increasingdisruptions, increased costs of goods and services, inflation and rising interest rates, among other impacts. The continuing impact of COVID-19 and such related challenges on our business will depend on future developments, including but not limited to, the duration and severityFurther discussion of the outbreak or new variants, restrictions on operations imposed by governmental authorities, the potential for authorities reimposing stay at home orders, internationaleffects of these trends are described throughout this Form 10-K. The extent and domestic travel restrictions or additional restrictions in response to continued developments with COVID-19, the Company’s ability to adapt to evolving operating procedures and maintain adequate staffing in response to increased consumer demand and discretionary spending, the efficacy and acceptance of vaccines in response to any potential new variants, and the Company’s ability to adjust its cost structures for the duration of the outbreak’s effect on our operations. We also expect that our businessthese trends is uncertain and the casino resort industry and economy generally will continue to be impacted by shortages of labor, supply chain challenges, increasing costs of goods and services, inflation and rising interest rates and that such impacts may intensify.
Online Betting and Gaming — Online betting and gaming is a rapidly developing sector of the e-commerce industry and we believe the digital segment of the global betting and gaming industry will continue to grow in popularity and consumer confidence. The market for online betting platforms is being driven by the increased use of digital processes and global, growing bettor demand. We anticipate that the United States market will begincontinue to have a strong and steady uptake in active wagers as
state-by-state legislation in the United States continues to evolve in response to recent legislation resulting in new opportunities in the United States sports betting market. The extent and future effects of online betting and gaming on our casino properties is uncertain but we expect that our online betting and gaming offeringofferings will be complementary to our brick-and-mortar casino business.
Competition
The casino entertainment business is highly competitive. The industry is comprised of a diverse group of competitors that vary considerably in size and geographic diversity, quality of facilities and amenities available, marketing and growth strategies, and financial condition. In most regions, we compete directly with other casino facilities operating in the immediate and surrounding areas. There has been increased competition from openings of newly developed casinos and plans of development in certain regions, as well as increased competition from recent legalization of casino gambling and sports betting in states such as Nebraska. In Las Vegas, our largest jurisdiction, competition is expected to increase in the coming years. In response to changing trends, Las Vegas operators have been focused on expanding their non-gaming offerings, including upgrades to hotel rooms, new food and beverage offerings, and new entertainment offerings. There have also been openings and proposals for other large scale gaming and non-gaming development projects in Las Vegas by various other developers. Our Las Vegas Strip hotels and casinos also compete, in part, with each other.
In recent years, many casino operators, including us, have been reinvesting in existing facilities, developing or rebranding new casinos or complementary facilities, and acquiring established facilities. These reinvestment and expansion efforts combined with aggressive marketing strategies by us and many of our competitors have resulted in increased competition in many regions. As companies have completed new expansion projects, supply has grown at a faster pace than demand in some areas. The expansion of properties and entertainment venues into new jurisdictions also presents competitive issues.
Our properties also compete with legalized gaming from casinos located on Native American tribal lands. While the competitive impact on operations in Las Vegas from the continued growth of Native American gaming establishments in California remains uncertain, the proliferation of gaming in California and other areas located in the same regions as our properties could have an adverse effect on our results of operations. In some instances, particularly in the case of Native American casinos, our competitors pay lower taxes or no taxes. In addition, certain states have legalized, and others may legalize, casino gaming in specific areas, including metropolitan areas from which we traditionally attract customers. These factors create additional challenges for us in competing for customers and accessing cash flow or financing to fund improvements for our casino and entertainment products that enable us to remain competitive.
We also compete with other non-gaming resorts and vacation areas, various other entertainment businesses, and other forms of gaming, such as state lotteries, on-track and off-track wagering, video lottery terminals, and card parlors. Our non-gaming offerings also compete with other retail facilities, amusement attractions, food and beverage offerings, and entertainment venues. Internet gaming and sports betting also create additional competition for our brick-and-mortar operations.
We face significant competition in our online sports betting, online horse racing wagering and iGaming businesses in jurisdictions where we currently operate.operate and those jurisdictions in which we wish to expand. Although we have experienced recent success in obtaining approval for sports betting and iGaming licenses in new jurisdictions, new state launches may require significant upfront investment. Our investment into new markets is executed through promotional incentives, marketing and advertising spend to establish ourselves as an industry leader.may not be successful.
Resources Material to Business
Rewards Programs
We believe Caesars Rewards, with a networkone of more than 60 million people,the largest loyalty programs, enables us to compete more effectively and capture a larger share of our customers’ entertainment spending when they travel among regions or engage in online wagering and gaming versus that of a standalone property, and engage in online wagering and gaming, which is core to our cross-market strategy.
Members who have joined Caesars Rewards canmembers earn Reward Credits for qualifying gaming activity,activities, including sports betting, online gaming and iGaming apps and wagering in the Caesars Sportsbook and Caesars Racebook apps. Members also earn Reward Credits for qualifying hotel, dining and retail spending at all Caesars-affiliated propertiesCaesars Entertainment destinations in the United States Canada and Dubai. Members can also earn additionalCanada. Additionally, Reward Credits are earned when theymembers use their Caesars Rewards VISA credit card or make a purchase through a Caesars Rewards partner. Members can redeem their earned Reward Credits with Caesars for hotel amenities, retail and online casino free play and other items such as merchandise, gift cards, and travel.those same experiences.
Caesars Rewards is structured in tiersby member tier level (designated as Gold, Platinum, Diamond, Diamond Plus, Diamond Elite or Seven Stars), each and member value. This structure allows a member to progressively access the full range of benefits available across our portfolio of destinations as they progress through tier levels. Caesars Rewards is designed to cultivate a gratifying and frictionless relationship with increasingour customers, motivating members to enhance both their frequency of visits and expenditures. Additionally, member benefits and privileges. Members are provided promotional offers based on their Tier Level, their engagementdata is utilized in conjunction with Caesars-affiliated properties, aspects of their retail and online casino gaming play, and their preferred spending choices outside of gaming. Member information is also used in connection with variousdiverse marketing promotions, includingpromotions. This includes campaigns involvingspanning direct mail, email, our websites, mobile devices, social media, and interactive slot machines.
Intellectual Property and Resources
We use a variety of trade names, service marks, trademarks, patents and copyrights in our operations and believe that we have all the licensesrights necessary to conduct our continuing operations. The development of intellectual property is part of our overall business strategy. We regard our intellectual property to be an important element of our success. We have registered several service marks,file applications for and obtain patents, trademarks patents and copyrights within the United States Patent and Trademark Office or otherwise acquired the licenses to use those which are material to conduct our business. We also own patents relating to unique casino games.foreign countries where we believe filing for such protection is appropriate. While our business as a whole is not substantially dependent on any one patent, trademark, or copyright, we seek to establish and maintain our proprietary rights in our business operations and technology through the use of patents, trademarks, copyrights, and trade secret laws. We file applications for and obtain patents, trademarks, and copyrights in the United States and foreign countries where we believe filing for such protection is appropriate, including United States and foreign patent applications covering certain proprietary technology of Caesars Enterprise Services, LLC (“CES”). We also seek to maintain our trade secrets and confidential information by nondisclosure policies and through the use of appropriate confidentiality agreements. CES’Our United States patents have varying expiration dates.
We have not applied for the registration of all of our trademarks, copyrights, proprietary technology, or other intellectual property rights, as the case may be, and may not be successful in obtaining all intellectual property rights for which we have applied. Despite our efforts to protect our proprietary rights, parties may infringe upon our intellectual property and use information that we regard as proprietary, and our rights may be invalidated or unenforceable. The laws of some foreign countries do not protect proprietary rights or intellectual property to as great of an extent as do the laws of the United States. In addition, others may independently develop substantially equivalent intellectual property.
We own or have the right to use proprietary rights to a number of trademarks that we consider, along with the associated name recognition, to be valuable to our business, including Eldorado, Silver Legacy, Isle, Lady Luck, Tropicana, Circus Circus, Caesars, Flamingo, Harrah’s, Horseshoe, Paris, Planet Hollywood, Caesars Rewards, Caesars Sportsbook, William Hill WSOP, and a license for the Planet Hollywood trademark used in connection with the Planet Hollywood in Las Vegas.WSOP.
As of December 31, 2023, our Caesars Sportsbook and iGaming app is powered by our Liberty platform. We currently operate the Liberty platform in 14 mobile sports betting states. The Liberty platform resulted in a significant upgrade to our user interface and significant product upgrades including numerous pre-match and live markets, extensive odds and flexible limits, player props, and same-game parlays. Our Liberty platform also integrates customers with the Caesars Rewards loyalty program. In addition, we and NYRABets LLC, the official online wagering platform of the New York Racing Association, Inc., have launched the Caesars Racebook app in more than 20 jurisdictions. The Caesars Racebook app provides access for pari-mutuel wagering at over 300 racetracks around the world. Wagers placed can earn credits towards the Caesars Rewards loyalty program.
Industry Overview
Seasonality
We believe that business at our regional properties outside of Las Vegas is subject to seasonality, including seasonality based on the weather in the marketsregion in which they operate and the travel habits of visitors. Business in our properties can also fluctuate due to specific holidays or other significant events, such as Easter (particularlyparticularly when thea holiday falls in a different quarter than the prior year),year, the timing of the WSOP tournament (with respect to our Las Vegas properties), city-wide conventions, a large sporting eventevents or a concert,concerts, or visits by our premium players. We also believe that any seasonality, holiday, or other significant event may affect our various properties or regions differently. We may also experience seasonality with retail and online sports betting which coincides with certain sporting events, as well as seasons of professional and collegiate basketball and football.sports teams.
Gaming Licenses and Governmental Regulations
The gaming and racing industries are highly regulated, and we must maintain our licenses and pay gaming taxes to continue our operations. We are subject to extensive regulation under laws, rules and supervisory procedures. These laws, rules and regulations generally concern the responsibility, financial stability and characters of the owners, managers, and persons with financial interests in the gaming operations. If additional gaming regulations are adopted in a jurisdiction in which we operate, such regulations could impose restrictions or costs that could have a significant adverse effect on us. From time to time, various proposals have been introduced in legislatures of jurisdictions in which we have operations that, if enacted, could adversely affect the tax, regulatory, operational or other aspects of the gaming industry and us. We do not know whether or when such legislation will be enacted. Gaming companies are currently subject to significant state and local taxes and fees in addition to normal federal and state corporate income taxes, and such taxes and fees are subject to increase at any time. Any material increase in these taxes or fees could adversely affect us.
Some jurisdictions, including those in which we are licensed, empower their regulators to investigate participation by licensees in gaming outside their jurisdiction and require access to periodic reports respecting those gaming activities. Violations of laws in one jurisdiction could result in disciplinary action in other jurisdictions.
Under provisions of gaming laws in jurisdictions in which we have operations, and under our organizational documents, certain of our securities are subject to restriction on ownership which may be imposed by specified governmental authorities. The restrictions may require a holder of our securities to dispose of the securities or, if the holder refuses, or is unable to dispose of the securities, we may be required to repurchase the securities.
A more detailed description of the regulations to which we are subject is contained in Exhibit 99.1 to this Annual Report on Form 10-K, which is incorporated herein by reference.
Internal Revenue Service Regulations
The Internal Revenue Service requires operators of casinos and online sports betting apps located in the United States to file information returns for U.S. citizens, including names and addresses of winners for certain table games, keno, bingo, slot machine and retail and online sports betting winnings in excess of stipulated amounts. The Internal Revenue Service also requires operators to withhold taxes on some table games, keno, bingo, slot machine and retail and online sports betting winnings of nonresident aliens. We are unable to predict the extent to which these requirements, if extended, might impede or otherwise adversely affect operations of, and/or income from, other games.
Regulations adopted by the Financial Crimes Enforcement Network of the Treasury Department (“FINCEN”) requires the reporting of currency transactions in excess of $10,000 occurring within a gaming day, including identification of the patron by name and social security number. This reporting obligation began in May 1985 and may have resulted in the loss of gaming revenues to jurisdictions outside the United States which are exempt from the ambit of these regulations. In addition to currency transaction reporting requirements, suspicious financial activity is also required to be reported to FINCEN.
Other Laws and Regulations
Our businesses are subject to various federal, state and local laws and regulations in addition to gaming regulations. These laws and regulations include, but are not limited to, restrictions and conditions concerning alcoholic beverages, food service, smoking, environmental matters, employees and employment practices, currency transactions, taxation, zoning and building codes, and marketing and advertising. Such laws and regulations could change or could be interpreted differently in the future, or new laws and regulations could be enacted. Material changes, new laws or regulations, or material differences in interpretations by courts or governmental authorities could adversely affect our operating results.
The sale of alcoholic beverages is subject to licensing, control and regulation by applicable local regulatory agencies. All licenses are revocable and are not transferable. The agencies involved have full power to limit, condition, suspend or revoke any license, and any disciplinary action could, and revocation would, have a material adverse effect upon our operations.
We also deal with significant amounts of cash in our operations and are subject to various reporting and anti-money laundering regulations. Such laws and regulations could change or could be interpreted differently in the future, or new laws and regulations could be enacted. Material changes, new laws or regulations, or material differences in interpretations by courts or governmental authorities could adversely affect our operating results. See Item 1A, “Risk Factors,” for additional discussion.
Taxation
Gaming companies are typically subject to significant taxes and fees in addition to normal federal, state and local income taxes, and such taxes and fees are subject to increase at any time. We pay substantial taxes and fees with respect to our operations. From time to time, federal, state, local and provincial legislators and officials have proposed changes in tax laws, or in the administration of such laws, affecting the gaming industry. It is not possible to determine with certainty the likelihood of changes in tax laws or in the administration of such laws.
Environmental Matters
We are subject to various federal, state and local environmental, health and safety laws and regulations, including but not limited to air quality, indoor air quality, water quality, bulk storage of regulated materials, and disposal of waste, including hazardous waste. Such laws and regulations can impose liability on potentially responsible parties (owner/operators of real property) to clean up, or contribute to the cost of cleaning up, sites at which regulated materials were disposed of or released. In addition to investigation and remediation liabilities that could arise under such laws and regulations, we could face personal injury, property damage, fines or other claims by third parties concerning environmental compliance, contamination or exposure to hazardous conditions. Environmental regulatory violations also include monetary penalties assessed by the
jurisdictional regulatory agency and civil or criminal penalties for intentional negligence. Occasionally and under certain circumstances, we have investigated and remediated (or contributed to remediation costs) contamination located at or near our facilities. Examples included contamination related to underground storage tanks and groundwater contamination arising from prior uses of land on which certain facilities are located. In addition, we have and continue to contain, manage, and dispose of manure and wastewater generated by concentrated animal feeding operations due to our racetrack operations; manage, abate, or remove indoor air quality concerns such as mold, lead, or asbestos-containing materials; and manage operations within applicable environmental permitting requirements. Although we have incurred and expect to incur costs related to various environmental matters such as investigations, remediation, and management of hazardous materials or conditions known or discovered to exist at our properties, those costs have not had, and are not expected to have, a material adverse effect on our financial condition, results of operations or cash flow. However, such matters in the future could have a material adverse effect on our business.
Climate Change
There has been an increasing focus of international, national, state, regional and local regulatory bodies on greenhouse gas (“GHG”), including carbon dioxide and methane, emissions, and climate change issues. The United States is a member of the Paris Agreement, a climate accord reached at the Conference of the Parties (“COP 21”) in Paris, that set many new goals, and many related policies are still emerging. The Paris Agreement requires set GHG emission reduction goals every five years beginning in 2020. Stronger GHG emission targets were set at COP 26 in Glasgow in November 2021.
Future regulation could impose stringent standards to substantially reduce GHG emissions. Legislation to regulate GHG emissions has periodically been introduced in the U.S. Congress. The current Administration has taken steps to further regulate GHG emissions. Those reductions could be costly and difficult to implement or estimate.
Beyond financial and regulatory effects, the projected severe effects of climate change – such as property damage or supply chain issues stemming from extreme weather events – has already and may continue to directly affect our facilities and operations. Caesars recognizes the impacts of climate change and is engaged in long-term initiatives to identify, assess, and manage the risks and opportunities associated with climate change (see “Environmental Stewardship” below).
Reporting and Record-Keeping Requirements
We are required periodically to submit detailed financial and operating reports and furnish any other information about us and our subsidiaries that gaming authorities may require. We are required to maintain a current stock ledger that may be examined by gaming authorities at any time. If any securities are held in trust by an agent or by a nominee, the record holder may be required to disclose the identity of the beneficial owner to gaming authorities. A failure to make such disclosure may be grounds for finding the record holder unsuitable. Gaming authorities may, and in certain jurisdictions do, require certificates for our securities to bear a legend indicating that the securities are subject to specified gaming laws.
Human Capital Management
We aim to provide a workplace that is engaging, empowering, inclusive and respectful for all employees (our “Team Members”), embracing a culture of openness, passion for service and recognition. Our ongoing investment in professional training and development, safety, health and wellbeing, and Team Member recognition linked to guest satisfaction are all important drivers of our success in delivering strong financial results and creating value for our communities. We have approximately 49,000 employees at our domestic properties51,000 Team Members throughout our organization.organization, excluding the Team Members of certain of our tribal partners.
Labor Relations
Approximately 23,00024,000, or 47% of our employeesTeam Members, are covered by collective bargaining agreements with certain of our subsidiaries. The majority of these employees in various job positions are covered by the following agreements:
| | | | | | | | | | | | | | | | | | | | |
| Employee Group | | Approximate Number of Active Employees Represented | | Union | | Date on which Collective Bargaining Agreement Becomes Amendable |
| Las Vegas Culinary Employees | | 11,50011,000 | | Culinary Workers Union, Local 226 | | May 31, 2023September 30, 2028 |
| Atlantic City Food & Beverage and Hotel Employees | | 2,0005,400 | | UNITE HERE, Local 54 | | May 31, 20222026 |
| Las Vegas Dealers | | 2,000 | | United Auto Workers | | September 30, 2023* |
| Las Vegas Teamsters | | 1,100 | | Teamsters, Local 986 | | March 31, 2024 |
| Las Vegas Bartenders | | 1,300 | | Bartenders Union, Local 165 | | May 31, 2023 |
Las Vegas Dealers | | 2,100 | | United Auto Workers | | September 30, 20232028 |
We aim to support Team Member Engagement, Compensation, Benefits, Development, SafetyMembers throughout their career with Caesars. We are committed to providing opportunities to help Team Members achieve their professional goals. We maintain a wide range of channels for diverse recruiting, including outreach to academic institutions and Wellbeingnonprofits that help us source diverse candidates. Our leadership receives training on our inclusive and equitable talent management recruitment and retention processes. Additionally, to support hiring initiatives across the enterprise, we maintain a recruiting website that includes information describing our culture, benefits and diversity initiatives. The website highlights our commitment to corporate social responsibility (“CSR”) diversity, equity and inclusion (“DEI”), and we welcome candidates from all backgrounds.
We strive to inspire our Team Members through our mission, vision and values, and our Code of Commitment (described below). To evaluate our Team Member experience and our retention efforts, we monitor a number of employeeTeam Member measures, such as turnover rates and Team Member satisfaction. In 2021, we implemented newWe send out Team Member experience surveys to help us further understand the drivers of engagement and areas where we can improve. These surveys will beare completed on a regular basis alongside additional surveys targeted at specific events within a Team Member cycle includingsuch as new hires, anniversary milestoneshire onboarding and exit inquiries.
Our compensation and benefits programs are designed to attract, retain and motivate our Team Members. In addition to competitive salaries and wages, we provide a variety of short-term, long-term and incentive-based compensation programs to reward performance relative to key metrics relevant to our business. We offer comprehensive benefit options including, but not limited to, retirement savings plans, health insurance coverage (including medical, mental health, dental, vision and pharmacy), parental leave, educational assistance, training opportunities, and company-paid life insurance.insurance and a Team Member assistance program.
We place utmost importance on creating a safe workplace for our Team Members, embedding procedures so that all our Team Members have the awareness, knowledge and tools to make safe working a habit.
We also have maintainedmaintain a wellness program to help our Team Members improve their health and wellbeing. This program has demonstrated improved health metrics for participating employeesTeam Members and their covered family members helping reduce the cost of healthcare for Team Members and for the Company. Effective in 2022, we consolidated our group health plans and made significantWe continue to make enhancements to our offerings and wellness program includingprograms with a wide range of affordable options, mental health initiatives and expanded onsite and virtualprimary care clinics across the US.
Diversity, Equity and Inclusion
We embrace diversity and aim to create an inclusive working environment that celebrates all our Team Members as individuals. Our diversity, equity and inclusion (“DEI”) framework identifies five pillars of activity: advocacy, Team Members, suppliers, communities and guests for a holistic approach to embedding DEI in everything we do. We publish our DEI data in our annual Corporate Social Responsibility (“CSR”)CSR report (described below). Currently, 45%
We set goals to increase the representation of leadership roles in the Company are held by women and 43% are held by people of color excluding the recent acquisition of William Hill. In addition, we set our newin leadership roles (supervisory and above). Our 2025 goals around gender and racial diversity with a target ofoutlined 50% of leadershipmanagement roles to be held by women in both the mid-level and senior leadership populations, and 50% of leadership roles to be held by people of color by 2025.color. We also commitcommitted to increase the representation of people of color in senior leadership roles by 50%. Furthermore, in 2021 we became the first gaming company named as a “Best Place to Work for Disability Inclusion”As of December 31, 2023, 45% of mid-level roles and 29% of senior leadership roles in the 2021 Disability Equality Index.Company were held by women. Additionally, 44% of leadership roles were held by people of color and the representation of people of color in senior leadership positions has increased by 116% since October 2020.
Corporate Social Responsibility
Caesars’ Board of Directors (the “Board”) and senior executives view CSR as an integral element in the way we do business, inwith the belief that being a good corporate citizen helps protect the companyCompany against risk, contributes to improved performance and helps foster positive relationships with all those with whom we connect. The Board and our executive management are committed to being an industry leader in CSR (which includes diversity, equity and inclusion, social impact, and environmental sustainability). In 2021,2023, the Board and our leadership continued to engage with our CEO-level external CSR Advisory Board comprised of experts representing DEI, sustainability, business strategy, academia and investors, and used their guidance to confirm our CSR priorities. These priorities are reflected in our 12th14th annual CSR report, published in 20212023 in accordance with Global Reporting Initiative Standards.
CSR Committee of the Board
Following the Merger in July 2020, Caesars’ Board formedhas a CSR committee that defines the duties and responsibilities of the Board in supporting delivery of our corporate purpose and CSR strategy as well as CSR-related aspects of corporate governance such as Board diversity.
Code of Commitment
Caesars is committed to being a responsible corporate citizen and environmental steward through our CSR strategy, PEOPLE PLANET PLAY. This is reflected in our Code of Commitment which is our public pledge to our guests, Team Members, communities, business partners and all those we reach that we will honor the trust they have placed in us through ethical conduct and integrity. We commit to:
•PEOPLE: Supporting the wellbeing of our Team Members, guests and local communities.
•PLANET: Taking care of the world we all call home.
•PLAY: Creating memorable experiences for our guests and leading responsible gaming practices in the industry.
PEOPLE PLANET PLAY Strategy
Our PEOPLE PLANET PLAY strategy defines how we meet the obligations of our Code of Commitment and is aligned with global priorities articulated by the United Nations as the Sustainable Development Goals. PEOPLE PLANET PLAY establishes multi-year targets in key areas of impact, including science-based greenhouse gas emissions-reduction formally approved by the Science Based Targets Initiative (“SBTi”),goals aligning with global best practices on climate change action. We planIn 2022, we conducted a comprehensive CSR assessment to complete a stakeholder analysisevaluate our
assumptions. With the help of an external specialist, our assessment gathered input from internal and comprehensive doubleexternal stakeholders, reviewed multiple industry and environmental, social and governance (“ESG”) disclosures, standards and frameworks and yielded 21 material topics. Our materiality assessment in 2022, reflectingis available on our website at www.investor.caesars.com within the latest sustainability and social trends, transparency demands andESG resource hub on our business strategy that will also align with the investor community’s Environment,Corporate Social and Governance requirements. Following our stakeholder analysis and materiality assessment, we plan to revise our strategic goals under the PEOPLE PLANET PLAY framework, with the expectation that we will commit to additional multi-year targets beyond those we continue to advance.Responsibility page.
Responsible Gaming
For more than thirty years, Caesars has maintained its Responsible Gaming (“RG”) program. We train tens of thousands of Team Members each year and a cadrecohort of RG Ambassadors throughout our properties to identify guests in need of assistance and provide support. In recent years, Caesars has contributed to the National Center for Responsible Gaming, the National Council on Problem Gaming and other state programs to help advance responsible practices in the gaming industry. Caesars Digital also maintains responsible gaming programs tailored to each state in which it operates, participates in Caesars’ overarching Responsible Gaming program, and offers users in-application RG tools such as time on device restrictions and wagering limits. No customers under 21 years old are allowed to wager on any of our Caesars Sportsbook, Caesars Racebook and iGaming mobile apps.
Caesars maintains a comprehensive risk-based Bank Secrecy Act (“BSA”) and Anti-Money Laundering (“AML”) program. It includes strong governance and effective internal controls and procedures to comply with applicable BSA requirements, regulatory guidance, and any related laws, and to take measures to prevent its affiliated casinos from being used for money laundering or other criminal activity. Execution of the program is governed with reference to FINCEN’s guidance on the Culture of Compliance. CaesarsCaesars’ internal AML Policy, Know Your Customer Policy and BSA Identification Policy outline the Caesars AML Program and set the minimum standards for the related procedures and internal controls of the Caesars casino affiliates. EmployeesCertain employees are required to complete annual trainings related company policies, including AML.
Caesars also maintains a Code of Ethics and Business Conduct (the “Code”) that includes standards designed to deter wrongdoing and to promote, amongst other standards, honest and ethical conduct and full, fair, accurate, timely and understandable disclosure in reports and documents that the Company files with the Securities and Exchange Commission. Caesars’ Chief Legal Officer serves as the compliance officer of the Code and Caesars provides periodic training regarding the contents and importance of the Code.
Caesars also maintains an Amended and restatedRestated Gaming Compliance Plan (the “Plan”), which is approved by various gaming regulators. The Plan is designed to overseeimplement procedures to enhance the likelihood that no activities of the Company or any Affiliateaffiliate of the Company will impugn the reputation and integrity of Caesars. The Plan and also establishes a Compliance Committee that assists the Company in implementing its strict policy that its business be conducted with honesty and integrity, and in accordance with high moral, legal and ethical standards. Caesars’ Senior Vice President & Assistant General Counsel & SVP – Regulatory & Compliance serves as the Compliance Officer as defined by the Plan.
Environmental Stewardship
We take a proactive approach to environmental sustainability through our CodeGreen strategy established by Former Caesars in 2007, consistently improvingstriving to improve our performance across energy and GHG emissions efficiencies, reduction of water consumption and increasing diversion of waste diversion from landfills. Caesars recognizes the impact climate change can play both on our business and the guests we serve. Identifying, assessing, and managing the risks and opportunities therefore plays a vital role in our long-term strategic thinking on climate and water, and how we approach our CSR goals. Former Caesars adopted Science Based Targets (“SBTs”)Our goals are based in science as part of itsour strategy to reduce our environmental impact. TheseIn 2023, we began the process to establish new goals to align with a 1.5-degree Celsius limit to global warming, measured against a 2019 base-year and we expect to announce our new goals in 2024.
Our existing GHG targets, approvedestablished in 2018 to be in line with wellSBTi’s guidance to achieve a level of decarbonization required to keep global temperature increase below 2
degrees Celsius, per SBTi are (i) reducing absolute Scope 1 and 2 GHG emissions by 35% by 2025, and 100% by 2050, from a 2011 base-year and (ii) having 60% of suppliers by spend institute science-based GHG reduction targets for their operations by 2023. In 2022, we expect to establish a new baseline to reaffirm GHG emission reduction goals as a combined company. For 2020, following the Merger, we modeled our GHG emissions data to create an estimate for 2018 and prior years back to 2011. This enabled us to compare our progress against our SBTs using actual data from 2019 and 2020 against a modeled 2011 base year. Between 2011 and 2020,2022, Caesars estimated a reduction in absolute Scopes 1 and 2 GHG emissions of 36.1%.41.8%, thereby achieving our interim Scope 1 and 2 reduction target ahead of schedule. We recognizefell short of our supplier engagement goal; however, in 2023 we revisited our Scope 3 emissions and intend to set an absolute reduction target in 2024 as part of our new GHG goals that 2020 was an atypical yearbetter align with property closures and business interruptions resulting from COVID-19 that had a material impact on1.5-degree Celsius pathway.
To achieve our results. Caesars isgoals, we have taken initiatives such as pursuing renewable energy sources and low-carbon options, including on site solar developments. For example, we have contracts to purchase energy from solar covered parking canopies recently completed at two Atlantic City properties and we installed solar covered parking at Harrah’s Pompano Beach. Our long-term goals include a continued focus on energy efficiency and conservation as well as evaluating renewable energy supply opportunities for each of our properties in pursuitproperties.
We voluntarily participate in the CDP (formerly the Carbon Disclosure Project), an international nonprofit that runs a global disclosure system for investors, companies, and regions to manage their environmental impacts. In 2021,2023, Caesars scored an A forA-for water security and a B for climate change for our 2020 performance and earned a spot on the Supplier Engagement Leaderboard from CDP. Justchange. Approximately 2% of companies assessed by CDP makein 2023 made the A List and only 8% make the Supplier Engagement Leaderboard.for either climate change or water security.
We are engaged in extensive waste reduction efforts across our facilities, including recycling, food donation, and manure composting. In 2020,2022, we diverted 45%59% of our total waste from landfills.
Community Investment
Caesars contributes extensively to our local communities to help them develop and prosper, through funding community projects, employeeTeam Member volunteering and cash donations from the Caesars Foundation, a private foundation funded from our operating income. In 2021,2023, the Caesars Foundation contributed $1.8$3.7 million to communities across the United States. The Caesars Foundation also continued to support significant national relationships that support diversity, equity and inclusion. In addition, we donated $3.1 million generated from parking fees at Las Vegas properties to nine local nonprofit organizations. During 2020,2023, our Team Members volunteered over 91,00082,000 hours through the HERO program.
ManyWe focus on multi-faceted support of our community partners are long-term collaborations.non-profit partners. For example, in 2023 we have many years of partnership with Meals on Wheels Americademonstrated our commitment to combat the issues of senior hunger and isolation. We also partner with Clean the World to reduce waste from soap bars and plastics from our hotel operations, and Boys and Girls Club of America to support the mission of enabling young peopleBoys & Girls Clubs of America through regional giving to reach their full potential as productive, caring, responsible citizens.local Clubs, HERO volunteering, hosting fundraising events, collecting customer donations through Caesars Makes Change, in addition to providing several Caesars Foundation grants at the national and local levels, all totaling nearly $1 million in value to the organization and the communities where we operate.
We host national Economic Equity Tours through live webinars and on-line resources for thousandsseek to encourage DEI dialogue in our communities as part of women of color owned small businesses, and diverse non-profits. Expert-led webinars provided resources in the areas of financial empowerment, nonprofit organization development, and entrepreneurship.our advocacy approach to raise awareness. In Spring of 2022,2023, we will host ahosted our DEI Summit in alignment with our nonprofit andwhich bring together corporate partners, nonprofit partners, advocacy groups and suppliers in supporting and promoting efforts to support the advancement of inclusionadvance DEI initiatives. The Summit included several educational sessions and advocacypanel discussions led by notable DEI leaders and promotion and support of DEI.practitioners.
Available Information
We are required to file annual, quarterly and other current reports and information with the Securities and Exchange Commission (“SEC”). Because we submit filings to the SEC electronically, access to this information is available at the SEC’s website (www.sec.gov). This site contains reports and other information regarding issuers that file electronically with the SEC.
We make our Annual Reports on Form 10-K, our Quarterly Reports on Form 10-Q, our Current Reports on Form 8-K, and all amendments to these reports, available free of charge on our corporate website (www.caesars.com/corporate) as soon as reasonably practicable after such reports are filed with, or furnished to, the SEC. In addition, our Code of Ethics and Business Conduct and charters of the Audit Committee, Compensation Committee, Corporate Social Responsibility Committee, and the Nominating and Corporate Governance Committee are available on our website. We will provide reasonable quantities of electronic or paper copies of filings free of charge upon request. In addition, we will provide a copy of the above referenced charters to stockholders upon request.
References in this document to our website address do not incorporate by reference the information contained on the website into this Annual Report on Form 10-K.
Cautionary Statement Regarding Forward-Looking Information
This Annual Report on Form 10-K includes “forward-looking statements” within the meaning of Section 27A of the Securities Act of 1933, as amended, and Section 21E of the Securities Exchange Act of 1934, as amended. Forward-looking statements include statements regarding our strategies, objectives and plans for future development or acquisitions of properties or operations, as well as expectations, future operating results, trends and other information that is not historical information. When used in this report, the terms or phrases such as “anticipates,” “believes,” “projects,” “plans,” “intends,” “expects,” “might,” “may,” “estimates,” “could,” “should,” “would,” “will likely continue,” and variations of such words or similar expressions and their negative forms are intended to identify forward-looking statements. Specifically, forward-lookingThese statements may include, among others, statements concerning:are made on the basis of management’s current views and assumptions regarding future events.
•the impact of COVID-19 on our business and financial condition;
•projections of future results of operations or financial condition;
•expectations regarding our business and results of operations of our existing casino properties and prospects for future development;
•expectations regarding trends that will affect our markets and the gaming industry generally, including expansion of internet betting and gaming, and the impact of those trends on our business and results of operations;
•our ability to comply with the covenants in the agreements governing our outstanding indebtedness and leases;
•our ability to meet our projected debt service obligations, operating expenses, and maintenance capital expenditures;
•expectations regarding availability of capital resources;
•our ability to consummate the announced dispositions of William Hill International and Belle of Baton Rouge;
•our intention to pursue development opportunities and additional acquisitions and divestitures; and
•the impact of regulation on our business and our ability to receive and maintain necessary approvals for our existing properties and future projects and operation of online sportsbook, poker and gaming.
Any forward-lookingForward-looking statements are based upon certain underlying assumptions, including any assumptions mentioned with the specific statements, as of the date such statements were made. Such assumptions are in turn based upon internal estimates and analyses of market conditions and trends, management plans and strategies, economic conditions and other factors. Such forward-looking statements are only predictions and involve known and unknown risks and uncertainties, many of which are beyond our control, and are subject to change. By their nature, forward-looking statements involve risks and uncertainties because they relate to events and depend upon future circumstances that may not occur. Actual results and trends may differ materially from any future results, trends, performance or achievements expressed or implied by such statements. Forward-looking statements speak only as of the date they are made, and we assume no duty to update forward-looking statements. Forward-looking statements should not be regarded as a representation by us or any other person that the forward-looking statements will be achieved. Undue reliance should not be placed on any forward-looking statements. Some of the contingencies and uncertainties to which any forward-looking statement contained herein are subject include, but are not limited to, the following:
•our sensitivity to reductions in discretionary consumer spending as a result of downturns in the extenteconomy and durationother factors outside our control;
•projections of future results of operations or financial condition;
•expectations regarding our business and results of operations of our existing casino properties and prospects for future development;
•the impact of COVID-19,economic trends, inflation supply chain challenges and labor shortagespublic health emergencies on our business and financial condition;
•expectations regarding trends that will affect our market and the Company’sgaming industry generally, including expansion of internet betting and gaming, and the impact of those trends on our business and results of operations;
•our ability to comply with the covenants in the agreements governing our outstanding indebtedness and leases;
•our ability to meet our projected debt service obligations, operating expenses, and maintenance capital expenditures;
•expectations regarding availability of capital resources;
•our intention to pursue development opportunities and additional acquisitions and divestitures;
•the impact of regulation on our business and our ability to receive and maintain necessary approvals for our existing properties and future projects and operation of online sportsbook, poker and gaming.
•the impact of the Data Incident (as defined below) and any other future cybersecurity breaches on our business, financial conditions and results of operations;
•factors impacting our ability to successfully operate our digital betting and liquidity;iGaming platform and expand its user base;
•our ability to adapt to the very competitive environments in which we operate, including the online market;
•the impact of economic downturns and other factors that impact consumer spending;
•the impact of win rates and liability management risks on our results of operations;
•our reliance on third parties for strategic relationships and essential services;
•costs associated with investments in our online offerings and technological and strategic initiatives;
•risk relating to fraud, theft and cheating;
•our ability to collect gaming receivables from our credit customers;
•the impact of our substantial indebtedness and significant financial commitments, including our obligations under our lease arrangements;
•restrictions and limitations in agreements governing our debt and leased properties could significantly affect our ability to operate our business and our liquidity;
•financial, operational, regulatory or other potential challenges that may arise as a result of leasing of a number of our properties;
•the effect of disruptions or corruption to our information technology and other systems and infrastructure;
•the ability to identify suitable acquisition opportunities and realize growth and cost synergies from any future acquisitions;
•the impact of governmental regulation on our business and the cost of complying or the impact of failing to comply with such regulations;
•changes in gaming taxes and fees in jurisdictions in which we operate;
•risks relating to pending claims or future claims that may be brought against us;
•changes in interest rates and capital and credit markets;
•the effect of seasonal fluctuations;
•our particular sensitivity to energy and water prices;
•deterioration in our reputation or the reputation of our brands;
•potential compromises of our information systems or unauthorized access to confidential information and customer data;
•our reliance on information technology, particularly for our digital business;
•our ability to protect our intellectual property rights;
•our reliance on licenses to use the intellectual property of third parties and our ability to renew or extend our existing licenses;
•the effect of war, terrorist activity, acts of violence, natural disasters, public health emergencies and other catastrophic events;
•increased scrutiny and changing expectations regarding our environmental, social and governance practices and reporting;
•our reliance on key personnel and the intense competition to attract and retain management and key employees in the gaming industry;
•work stoppages and other labor problems;
•our ability to retain performers and other entertainment offerings on acceptable terms; and
•other factors described in Part II, Item 1A. “Risk Factors” contained herein and our reportsQuarterly Reports on Form 10-Q and Current Reports on Form 8-K filed with the SEC.
In light of these and other risks, uncertainties and assumptions, the forward-looking events discussed in this report might not occur. These forward-looking statements speak only as of the date on which this statement is made, even if subsequently made available on our website or otherwise, and we do not intend to update publicly any forward-looking statement to reflect events or circumstances that occur after the date on which the statement is made, except as may be required by law.
You should also be aware that while we from time to time communicate with securities analysts, we do not disclose to them any material non-public information, internal forecasts or other confidential business information. Therefore, you should not assume that we agree with any statement or report issued by any analyst, irrespective of the content of the statement or report. To the extent that reports issued by securities analysts contain projections, forecasts or opinions, those reports are not our responsibility and are not endorsed by us.
Item 1A. Risk Factors
Risks Relating to Operating Our Business
The outbreak of COVID-19 and COVID-19 related impacts have had, and are expected to continue to have, a significant impact on our operations and results of operations.
COVID-19 and mitigation measures recommended or required by public health officials to slow the spread of COVID-19 have materially adversely affected our operations. All of our casino properties were temporarily closed for the period from mid-March 2020 through mid-May 2020 due to orders issued by various government agencies and tribal bodies and, following re-opening of our properties, our operations have been affected by social distancing measures, including reduced gaming operations, limitations on number of customers present in our facilities, restrictions on hotel, food and beverage outlets and limits on events that would otherwise attract customers to our properties. While restrictions on our operations were eased in 2021 and we experienced positive operating trends during 2021, we continued to see a prolonged impact of COVID-19 on the economy, our industry and our Company, with increased challenges arising from labor shortages, supply chain challenges, increasing costs of goods and services, inflation and rising interest rates, among other impacts. The continuing impact of COVID-19 and such related challenges on our business will ultimately depend on future developments, including but not limited to, the duration and severity of the outbreak or new variants, restrictions on operations imposed by governmental authorities, the potential for authorities reimposing stay at home orders, international and domestic travel restrictions or additional restrictions in response to continued developments with the COVID-19 public health emergency, our ability to adapt to evolving operating procedures and maintain adequate staffing in response to increased customer demand, the impact on consumer demand and discretionary spending, the efficacy and acceptance of vaccines, and our ability to adjust our cost structures for the duration of any such interruption of our operations. The extent and duration of the impact of COVID-19 on our business is difficult to predict, but it could be significant and protracted, and we expect that our business and the casino resort industry and economy generally will continue to be impacted by shortages of labor, supply chain challenges, increasing costs of goods and services, inflation and rising interest rates and that such impacts may intensify.
We face substantial competition and expect that such competition will continue.
The gaming industry is highly competitive and competition is intense in most of the markets in which we operate. We compete with a variety of gaming operations, including land-based casinos, dockside casinos, riverboat casinos, casinos located on racing tracks, and casinos located on Native American reservations and other forms of legalized gaming such as video gaming terminals at bars, restaurants and truck stops and online gambling and sports betting. We also compete, to a lesser extent, with other forms of legalized gaming and entertainment such as bingo, pull tab games, card parlors, sportsbooks, fantasy sports websites, “cruise-to-nowhere”cruise line operations, pari-mutuel or telephonic betting on horse racing and dog racing, state-sponsored lotteries jai-alai and, in the future, may compete with gaming at other venues. In addition, we compete more generally with other forms of entertainment for the discretionary spending of our customers. In some instances, particularly in the case of Native American casinos, our competitors pay lower taxes or no taxes.
In recent years, many casino and online gaming operators, including us, have reinvested in existing jurisdictions to attract new customers or to gain market share, thereby increasing competition in those jurisdictions. In particular, we and other online betting and gaming operators have undertaken extensive marketing campaigns and made significant investments in customer acquisition through pricing and promotional policies. In addition, in response to changing trends, Las Vegas operators have been focused on expanding their non-gaming offerings, including upgrades to hotel rooms, new food and beverage offerings, and new entertainment offerings. The expansion of online betting and gaming in new jurisdictions and the growth of the number of competitors in the online betting and gaming market, the expansion of existing casino entertainment properties, the increase in the number of properties, and the aggressive marketing strategies of many of our competitors have increased competition in many markets in which we operate, and this intense competition is expected to continue. These competitive pressures have and are expected to continue to adversely affect our financial performance.
Our brick-and-mortar operations face increasing competition as a result of the expansion of legalized online gaming and betting, including our own online betting and gaming operations, in a number of the jurisdictions in which we operate. While we believe that we are well positioned to compete with new entrants to the betting and gaming market through our online betting and gaming offerings, the competitive dynamic is evolving and we cannot assure you that our results of operations will not be adversely impacted by the expansion of legalized online gaming and betting.
States that already have legalized casino gaming may further expand gaming, and other states that have not yet legalized gaming may do so in the future. We also compete with Native American gaming operations in California and other jurisdictions where Native American tribes operate large-scale gaming facilities or otherwise conduct gaming activities on Native American lands, which we expect will continue to expand. Further expansion of legalized casino gaming in jurisdictions in or near our
markets or changes to gaming laws in states in which we have operations and in states near our operations could increase competition and could adversely affect our operations.
Increased competition may require us to make substantial expenditures in marketing, customer development and capital projects to maintain and enhance the competitive positions of our online and brick and mortar operations to increase the attractiveness and add to the appeal of our facilities and product offerings. Because a significant portion of our cash flow is required to pay obligations under our outstanding indebtedness and our lease obligations, there can be no assurance that we will have sufficient funds to undertake, or that we will be able to obtain sufficient financing to fund, such expenditures. If we are unable to make such expenditures, our competitive position could be negatively affected.
Our business is sensitive to reductions in discretionary consumer spending as a result of downturns in the economy and other factors outside our control.
Consumer demand for casino hotel and racetrack properties and online betting and gaming is particularly sensitive to downturns in the economy and the associated impact on discretionary spending on leisure activities. Changes in discretionary consumer spending or consumer preferences brought about by factors such as perceived or actual general economic conditions, effects of declines in consumer confidence in the economy, the impact of high energy and food costs, rising interest rates, the increased cost of travel, decreased disposable consumer income and wealth, fears of war and future acts of terrorism, or widespread illnesses or epidemics, including COVID-19, can have a material adverse effect on leisure and business travel, discretionary spending and other areas of economic behavior that directly impact the gaming and entertainment industries in general and could further reduce customer demand for the amenities and products that we offer. In addition, increases in gasoline prices, including increases prompted by global political and economic instabilities, can adversely affect our casino operations because most of our patrons travel to our properties by car or on airlines that may pass on increases in fuel costs to passengers in the form of higher ticket prices.
Win rates (hold rates) for our casino operations depend on a variety of factors, some of which are beyond our control, and participation in the sports betting industry exposes us to trading, liability management and pricing risks. We may experience lower than expected profitability and potentially significant losses as a result of factors beyond our control or a failure to accurately determine odds.
The gaming industry is characterized by an element of chance. Accordingly, we employ theoretical win rates to estimate what a certain type of game, on average, will win or lose in the long run. In addition to the element of chance, win rates (hold percentages) are also affected by the spread of table limits and factors that are beyond our control, such as a player’s skill, experience, and behavior, the mix of games played, the financial resources of players, the volume of bets placed, and the amount of time players spend gambling. As a result of the variability in these factors, the actual win rates at our casinos may differ from the theoretical win rates we have estimated and could result in the winnings of our gaming customers exceeding those anticipated. The variability of win rates (hold rates) also have the potential to negatively impact our financial condition, results of operations, and cash flows.
Our fixed-odds betting products involve betting where winnings are paid on the basis of the amounts wagered and the odds quoted. Odds are determined with the objective of providing an average return to the bookmaker over a large number of events. However, there can be significant variation in gross win percentage event-by-event and day-by-day. We have systems and controls that seek to reduce the risk of daily losses occurring on a gross-win basis, but there can be no assurance that these will be effective in reducing our exposure to this risk. As a result we may experience (and we have from time to time experienced) significant losses with respect to individual events or betting outcomes, in particular if large individual bets are placed on an event or betting outcome or series of events or betting outcomes. Any significant losses on a gross-win basis could have a material adverse effect on our business, financial condition and results of operations.
In addition, the odds that we offer in our sportsbook operations may occasionally contain an obvious error. Examples of such errors are inverted lines between teams, or odds that are significantly different from the true odds of the outcome in a way that all reasonable persons would agree is an error. If regulatory restrictions do not permit us to void or re-settingre-set odds to correct odds on bets associated with large obvious errors in odds making, we could be subject to covering significant liabilities.
We rely on third parties to provide services that are essential to the operation of our online betting and gaming business, including, player account management, geolocation and identity verification, payment processing and sports data.
We rely on third parties to provide services that are essential to the operation of our online betting and gaming business, including player account management, geolocation and identity verification systems to ensure we comply with laws and regulations, processing deposits and withdrawals made by our online users and providing information regarding schedules, results, performance and outcomes of sporting events to determine when and how bets are settled. The software, systems and services provided by our third-party providers may not meet our expectations, contain errors or weaknesses, be compromised or
experience outages. A failure of such third-party systems to perform effectively, or any service interruption to those systems, could adversely affect our business by preventing users from accessing our online platform, delaying payment or resulting in errors in settling bets, which could give rise to regulatory issues relating to the operation of our business. By way of example, incorrect or misleading geolocation and identity verification data with respect to current or potential users received from third-party service providers may result in us inadvertently allowing access to our offerings to individuals who are not permitted to access them or otherwise inadvertently denying access to individuals who are permitted to access them, and errors or failures by our payment processors and sports data providers could result in a failure into timely and accurately process payments to and from users or errors in settling bets. Any such errors or failures could result in violations of applicable regulatory requirements and adversely affect our reputation and our ability to attract and retain our online users. Furthermore, negative publicity related to any of our third-party partners could adversely affect our reputation and brand, and could potentially lead to increased regulatory or litigation exposure.
In addition, if any of our third-party services providers terminates its relationship with us, is unable to maintain necessary regulatory approvals, or refuses to renew its agreement with us on commercially reasonable terms, we would have to find alternate service providers. We cannot be certain that we would be able to secure favorable terms from alternative service providers that are critical to the operation of our business or enter into alternative arrangements in a timely manner. Our digital business, results of operations and prospects would be adversely impacted by our inability or delay in securing replacement services that are sufficient to support our online business or are on comparable terms.
The growth of our digital business will depend, in part, on the success of our strategic relationships with third parties.
We rely on relationships with sports leagues and teams, media companies and other third parties in order to attract users to our offerings. InFor example, in 2019 we entered into an exclusive sports entertainment partnership with the NFL, making us the first ever “Official Casino Sponsor” in the history of the league and in 2020, we partnered with ESPN to integrate their digital platforms with our sportsbooks.league. These relationships, along with providers of online services, search engines, social media, directories and other websites and e-commerce businesses direct consumers to our offerings. While we
believe there are other third parties that could drive users to our online offerings, adding or transitioning to them may disrupt our business and increase our costs, and may require us to modify, limit or discontinue certain offerings. Furthermore, sports leagues, teams and venues may enter into exclusive partnerships with our competitors which could adversely affect our ability to offer certain types of wagers. In the event that any of our existing relationships or our future relationships fail to provide services to us in accordance with the terms of our arrangement, or at all, and we are not able to find suitable alternatives, this could impact our ability to cost effectively attract consumers could be impacted and harm our online betting and gaming business, financial condition, results of operations and prospects.prospects could be adversely affected.
The growth of our digital business will require investments in our online offerings, technology and strategic marketing initiatives, which could be costly and negatively impact the economics of our online business.
The online betting and gaming industry is subject to rapid and frequent changes in standards, technologies, products and service offerings, as well as in customer demands and preferences and regulations, which will require us to continually introduce and successfully implement new and innovative technologies, marketing strategies, product offerings and enhancements to remain competitive and effectively stimulate customer demand, acceptance and engagement. The process of developing new online offerings and systems is inherently complex and uncertain, and new offerings may not be well received by users, even if they are well-reviewed and of high quality. Developing new offerings and marketing strategies can also divert our management’s attention from other business issues and opportunities. New online offerings that attain market acceptance and aggressive marketing strategies implemented in the competitive online market environment could impact the mix of our existing business, including our casino business, or the share of our patron’s wallets in a manner that could negatively impact our results of operations. In addition, online betting and gaming operates in a competitive environment that requires significant investment in marketing initiatives, including free play and use of a variety of free and paid marketing channels, including television, radio, social media platforms, such as Facebook, Instagram, Twitter,X (formerly known as Twitter), and other digital channels. We cannot be sure that our investments in technology, products, service offerings and marketing initiatives will be successful or generate the return on investment that we expect. We have incurred losses in the past in our digital business and cannot be sure that our profitability will continue. If new or existing competitors offer more attractive offerings or engage in marketing initiatives that are better received by customers, we may lose users or users may decrease their spending on our offerings. Further, new customer demands, superior competitive offerings, new industry standards or changes in the regulatory environment could render our offerings unattractive, unmarketable or obsolete and require us to make substantial unanticipated changes to our technology or business model. Failure to adapt to a rapidly changing market or evolving customer demands, and costs required to be incurred to react to dynamic market conditions, could harm our business, financial condition, results of operations and prospects.
We face the risk of fraud, theft, and cheating.
We face the risk that gaming customers may attempt or commit fraud or theft or cheat in order to increase winnings. Such acts of fraud, theft, or cheating could involve the use of counterfeit chips or other tactics, possibly in collusion with our employees. Internal acts of cheating could also be conducted by employees through collusion with dealers, surveillance staff, floor managers, or other casino or gaming area staff. Additionally, we also face the risk that customers may attempt or commit fraud or theft with respect to our non-gaming offerings or against other customers. Such risks include stolen credit or charge cards or cash, falsified checks, theft of retail inventory and purchased goods, and unpaid or counterfeit receipts. Failure to discover such acts or schemes in a timely manner could result in losses in our operations. Negative publicity related to such acts or schemes could have an adverse effect on our reputation, potentially causing a material adverse effect on our business, financial condition, results of operations, and cash flows.
We extend credit to a portion of our customers, and we may not be able to collect gaming receivables from our credit customers.
We conduct our gaming activities on a credit and cash basis. Any such credit we extend is unsecured. High-stakes players typically are extended more credit than customers who tend to wager lower amounts. High-end gaming is more volatile than other forms of gaming, and variances in win-loss results attributable to high-end gaming may have a significant positive or negative impact on cash flow and earnings in a particular period. We extend credit to those customers whose level of play and financial resources warrant, in the opinion of management, an extension of credit. These large receivables could have a significant impact on our results of operations if deemed uncollectible. Gaming debts evidenced by a credit instrument, including what is commonly referred to as a “marker,” and judgments on gaming debts are enforceable under the current laws of the jurisdictions in which we allow play on a credit basis, and judgments on gaming debts in such jurisdictions are enforceable in all U.S. states under the Full Faith and Credit Clause of the U.S. Constitution; however, other jurisdictions may determine that enforcement of gaming debts is against public policy. Although courts of some foreign nations will enforce gaming debts directly and the assets in the U.S. of foreign debtors may be reached to satisfy a judgment, judgments on gaming debts from U.S. courts are not binding on the courts of many foreign nations.
In addition, in November 2017, the Chinese government adopted new rules to control the cross-border transportation of cash and bearer negotiable instruments, specifically to reduce the international transfer of cash in connection with activities that are illegal in China, including gambling. The Chinese government has recently taken steps to prohibit the transfer of cash for the payment of gaming debts. These developments may have the effect of reducing the collectability of gaming debts of players from China. It is unclear whether these and other measures will continue to be in effect or become more restrictive in the future. These and any future foreign currency control policy developments that may be implemented by foreign jurisdictions could significantly impact our business, financial condition and results of operations.
The outbreak of pandemics and other public health matters and related impacts have had, and may once again have, a significant impact on our operations and results of operations.
Public health issues and mitigation measures recommended or required by public health officials have had a material adverse effect on our operations. For example, all of our casino properties were temporarily closed for several weeks during 2020 due to orders issued by various government agencies and tribal bodies. Following re-opening of our properties, our operations were affected by social distancing measures, including reduced gaming operations, limitations on number of customers present in our facilities, restrictions on hotel, food and beverage outlets and limits on events that would otherwise attract customers to our properties. While restrictions on our operations were eased in 2021 and we experienced positive operating trends, prolonged impacts on the economy, our industry and our business continued, with increased challenges arising from labor shortages, higher labor costs, supply chain challenges, increasing costs of goods and services, inflation and rising interest rates, among other impacts. The extent and duration of the impact of such measures on our business is difficult to predict and such impacts may intensify.
Acts of terrorism, war, natural disasters, severe weather, and political, economic and military conditions may impede our ability to operate or may negatively impact our financial results.
Terrorist attacks and other acts of war or hostility have created many economic and political uncertainties. For example, a substantial number of the customers of our properties in Las Vegas use air travel. As a result of terrorist acts that occurred on September 11, 2001, domestic and international travel was severely disrupted, which resulted in a decrease in customer visits to our properties in Las Vegas. Visitation to Las Vegas also declined for a period of time following the mass shooting tragedy on October 1, 2017. We cannot predict the extent to which disruptions in air or other forms of travel as a result of any further terrorist act, security alerts or war, uprisings, or hostilities in places such as Iraq, Afghanistan, Israel, Ukraine, and/or Syria or other countries throughout the world, and governmental responses to those acts or hostilities, will directly or indirectly impact our business and operating results. For example, our operations in Cairo, Egypt, were negatively affected from the uprising there in January 2011. Aa third party that is responsible for our player account management has employees located internationally in Ukrainecountries impacted by such hostility and further negative developments in Ukrainesuch countries could negatively impact our digital business. As a consequence of the threat of terrorist attacks and other acts of war or hostility in the future, premiums for a variety of insurance products have increased, and some types of insurance aremay no longer be available. If any such event were to affect our properties, we would likely be adversely affected.
In addition, natural and man-made disasters such as major fires, floods, severe snowstorms, hurricanes, earthquakes, and oil spills could also adversely impact our business and operating results. Severe weather and natural disasters may increase in frequency and severity as a result of climate change. Such events could lead to the loss of use of one or more of our properties for an extended period of time and disrupt our ability to attract customers to certain of our gaming facilities. For example, our property in Lake Charles, Louisiana has beenwas closed sincein August 27, 2020 until December 2022 due to damage resulting from Hurricane Laura. Inadequate insurance or lack of available insurance for these and other certain types or levels of risk could expose us to significant losses in the event that a catastrophe occurred for which we are underinsured. In most cases, we have insurance that covers portions of any losses from a natural disaster, but it is subject to deductibles and maximum payouts in many cases. Although we may be covered by insurance from a natural disaster, the timing of our receipt of insurance proceeds,
if any, may be out of our control. In some cases, however, we may receive no proceeds from insurance. In addition, if such events increase in frequency and/or severity, insurance premiums may increase significantly or insurance may not be available to protect against future events. Further, if properties subject to our leases with VICI and GLPI are impacted by a casualty event, such leases require us to repair or restore the affected properties even if the cost of such repair or restoration exceeds the insurance proceeds that we receive. Under such circumstances, the rent under such leases is required to be paid during the period of repair or restoration even if all or a portion of the affected property is not operating. In addition to the damage caused to our properties by a casualty loss, we may suffer business disruption as a result of the casualty event or be subject to claims by third parties that may be injured or harmed. While we carry general liability insurance and business interruption insurance, there can be no assurance that insurance will be available or adequate to cover all loss and damage to which our business or our assets might be subjected and the timing and receipt of insurance proceeds, if any, may be out of our control.
Increased scrutiny and changing expectations from investors, consumers, employees, regulators, and others regarding our environmental, social and governance practices and reporting could cause us to incur additional costs, devote additional resources and expose us to additional risks, which could adversely impact our reputation, customer attraction and retention, access to capital and employee recruitment and retention.
Companies across all industries are facing increasing scrutiny related to their environmental, social and governance (“ESG”) practices and reporting. Investors, consumers, employees and other stakeholders have focused increasingly on ESG practices and placed increasing importance on the implications and social cost of their investments, purchases and other interactions with companies. With this increased focus, public reporting regarding ESG practices is becoming more broadly expected. If our ESG practices and reporting do not meet investor, consumer or employee expectations, which continue to evolve, our brand, reputation and customer retention may be negatively impacted.
As ESG best practices and reporting standards continue to develop, we may incur increasing costs related to ESG monitoring and reporting and compliance with ESG initiatives. We publish an annual Corporate Social Responsibility Report, which highlights, among other things, our climate change mitigation activities and how we are supporting our workforce, including our diversity, equity, inclusion, and belonging efforts. Our disclosures on these matters, or a failure to meet evolving stakeholder expectations for ESG practices and reporting, may potentially harm our reputation and customer relationships.
Furthermore, if our competitors’ ESG performance is perceived to be better than ours, potential or current investors may elect to invest with our competitors instead. In addition, in the event that we communicate certain initiatives or goals regarding ESG matters, we could fail, or be perceived to fail, in our achievement of such initiatives or goals, or we could be criticized for the scope of such initiatives or goals. If we fail to satisfy the expectations of investors, customers, employees and other stakeholders, or our initiatives are not executed as planned, our business, financial condition, results of operations and prospects could be adversely affected.
Our ability to achieve any ESG objective is subject to numerous risks, many of which are outside of our control. Examples of such risks include:
•the availability and cost of low- or non-carbon-based energy sources;
•the evolving regulatory requirements affecting ESG standards or disclosures;
•the availability of suppliers that can meet sustainability, diversity and other ESG standards that we may set;
•our ability to recruit, develop and retain diverse talent in our labor markets; and
•the success of our organic growth and acquisitions or dispositions of businesses or operations.
If we fail, or are perceived to be failing, to meet the standards or objectives included in any sustainability disclosure or the expectations of our various stakeholders, it could negatively impact our reputation, customer attraction and retention, access to capital and employee retention. In addition, new sustainability rules and regulations have been adopted and may continue to be introduced. Our failure to comply with any applicable rules or regulations could lead to penalties and adversely impact our reputation, customer attraction and retention, access to capital and employee retention.
Climate change regulations and greenhouse gas effects may adversely impact our operations.
We may become subject to legislation and regulation regarding climate change, and compliance with any new rules could be difficult, burdensome and costly. Concerned parties, such as legislators and regulators, stockholders and nongovernmental organizations, as well as companies in many business sectors, are considering ways to reduce greenhouse gas (“GHG”) emissions. Many states have announced or adopted programs to stabilize and reduce GHG emissions and, in the past, federal legislation has been proposed in Congress. We expect to incur increased energy, environmental and other costs and capital expenditures to comply with new regulations and legislation. Further, regulation of GHG emissions may limit our customers’ ability to travel to our properties (e.g. as a result of increased fuel costs or restrictions on transport-related emissions).
Our business may be subject to fluctuations due to seasonality and other factors that could result in volatility and have an adverse effect on our operating results.
Our business may fluctuate due to seasonality and other factors. Our casino business is impacted by weather conditions that may deter or prevent customers from reaching the facilities or undertaking trips, which would particularly affect customers who are traveling longer distances to visit our properties. Our casino business can also fluctuate due to specific holidays or other significant events, such as Easter (particularlyparticularly when the holiday falls in a different quarter than the prior year),year, the World Series of Poker tournament (with respect to our Las Vegas properties), city-wide conventions, a large sporting event or a concert, or visits by our premium players. Our sportsbook business may also be impacted by availability or scheduling of major sporting events or the cancellation or postponement of sporting events or races, including lockouts, strikes or similar disruptions. For example, our sports betting business could be adversely impacted if the 2022 Major League Baseball season does not begin on time or does not occur at all. Seasonality,
holiday, or other significant events may affect our digital operations, properties or regions differently. These factors, among other things, could adversely affect our business, financial condition, and operating results, cause volatility in the trading price of our stock and impact our cash flow from quarter to quarter.
Our business is particularly sensitive to energy or water prices and a rise in energythese prices could harm our operating results.
We are a large consumer of electricity, water and other energy and utility services and, therefore, higher energy prices may have an adverse effect on our results of operations. Accordingly, increases in energy costs may have a negative impact on our operating results. Additionally, higher electricity and gasoline prices that affect our customers may result in reduced visitation to our resorts and a reduction in our revenues. Further, our operations or the operations of our critical supplies could be negatively impacted by the duration of drought conditions, or other cause of water stress or shortages, such as those experienced in the southwest United States, or other areas in which we operate. We may be indirectly impacted by regulatory requirements aimed at reducing the impacts of climate change directed at up-stream utility providers, asand we could experience potentially higher utility, fuel, water and transportation costs.
Any deterioration in our reputation or the reputation of our brands could adversely impact our business, financial condition, or results of operations.
Our business is dependent on the quality and reputation of our Company and brands. Events beyond our control could affect the reputation of one or more of our properties, including our digital operations, or more generally impact our corporate or brand image. Other factors that could influence our reputation include the quality of the services we offer and our actions with regard to social issues such as diversity, human rights and support for local communities. Broad access to social media makes it easy for anyone to provide public feedback that can influence perceptions of us, our brands or our properties. It may be difficult to control or effectively manage negative publicity, regardless of whether it is accurate. Negative events and publicity could quickly and materially damage perceptions of us, our brands or our properties, which, in turn, could adversely impact our business, financial condition or results of operations through loss of customers, loss of business opportunities, lack of acceptance of our companyCompany to operate in host communities, employee retention or recruiting difficulties or other difficulties.
Risks Relating to Information Systems and Technology
Compromises of our information systems or unauthorized access to confidential information or our customers’ personal information could materially harm our reputation and business.
We collect and store confidential, personal information relating to our customers for various business purposes, including marketing and financial purposes, and credit card information for processing payments. For example, we handle, collect and store personal information in connection with our customers staying at our hotels and enrolling in Caesars Rewards. We may share this personal and confidential information with vendors or other third parties in connection with processing of transactions, operating certain aspects of our business, or for marketing purposes. Our collection and use of personal data are governed by state and federal privacy laws and regulations as well as the applicable laws and regulations in other countries in which we operate. Privacy law is subject to frequent changes and varies significantly by jurisdiction. We may incur significant costs in order to ensure compliance with the various applicable privacy requirements. In addition, privacy laws and regulations may limit our ability to market to our customers.
We assess and monitor the security of collection, storage, and transmission of customer information on an ongoing basis. We utilizebasis, including utilizing commercially available software and technologies to monitor, assess and secure our network. Further, some of the systems currently used for transmission and approval of payment card transactions and the technology utilized in payment cards themselves, all of which can put payment card data at risk, are determined and controlled by the payment card industry, and other such systems are determined and controlled by us. Although we havehad taken steps designed to safeguard our customers’ confidential personal information and important internal company data, on September 14, 2023, we announced that we identified suspicious activity in our information technology network resulting from a social engineering attack on one of our outsourced IT support vendors and that we determined that the unauthorized actor acquired a copy of, among other data, our loyalty program database, which includes driver’s license numbers and/or social security numbers for a significant number of members in the database (the “Data Incident”). We took steps to ensure that the stolen data was deleted by the unauthorized actor and are working with industry-leading third-party IT advisors, to harden our systems and implement corrective measures to protect against future attacks that could pose a threat to our systems. We have also taken steps to require that the specific outsourced IT support vendor involved in this matter implemented corrective measures to protect against future attacks that could pose a threat to our systems. While we took these actions, we cannot assure that the stolen data was deleted by the unauthorized actor or that our network and other systems and those of third parties, such as service providers, couldwill not be compromised, damaged, or disrupted by a third-party breach of our system security or that of a third-party provider or as a result of purposeful or accidental actions of third parties, our employees, or those employees of a third party, power outages, computer viruses, system failures, natural disasters, or other catastrophic events.events in the future. Our third-party information
system service providers face risks relating to cybersecurity similar to ours, and we do not directly control any of such parties’ information security operations. As an example, the Data Incident arose from a social engineering attack on one of our outsourced IT vendors. Advances in computer and software capabilities, encryption technology, new tools, and other developments may increase the risk of a future security breach. As a result of anythe Data Incident, customer information and other data was accessed by an unauthorized actor. Any future security breach may also result in customer information or other proprietary data may bebeing accessed or transmitted by or to a third party. Despite the measures we have implemented to safeguard our information, including actions taken following the Data Incident, there can be no assurance that we are adequately protecting our information.
As a result of the Data Incident, we have become subject to multiple lawsuits and inquiries from state regulators and we may become subject to additional lawsuits, claims and inquiries related to the Data Incident. While the Data Incident did not impact our customer-facing operations, we are unable to predict the full impact of the Data Incident, including any regulatory effects or changes in guest behavior in the future, including whether a change in our guests’ behavior could negatively impact our financial condition and results of operations on an ongoing basis.
We have cybersecurity insurance to respond to a breach which is designed to cover expenses associated with a cybersecurity incident, including costs related to notification, credit monitoring, investigation, crisis management, public relations and legal advice. We also carry other insurance which may cover ancillary aspects of cybersecurity events. While we have submitted claims for insurance coverage relating to the costs incurred as a result of the Data Incident, we are not certain of the extent to which such coverage or third-party indemnification will cover of such future costs.
Any future data security breaches giving rise to a loss, disclosure of, misappropriation of, or access to customers’ or other proprietary information or other breach of our information security could result in additional legal claims or legal proceedings, including regulatory investigations and actions, or liability for failure to comply with privacy and information security laws, including for failure to protect personal information or for misusing personal information which could disrupt our operations, damage our reputation, and expose us to additional claims from customers, financial institutions, regulators, payment card associations, employees, and other persons, any of which could have an adverse effect on our financial condition, results of operations, and cash flow.
We have cybersecurity insurance to respond to a breach which is designed to cover expenses around notification, credit monitoring, investigation, crisis management, public relations and legal advice. We also carry other insurance which may cover ancillary aspects of the event; however, damage Any such damages and claims arising from a future breach may not be completely covered or may exceed the amount of any insurance available.
Our operations, and particularly our digital betting and gaming operations, are reliant on information technology and other systems and services, and any failures, errors, defects or disruptions in our systems or services could adversely affect our operations.
Our technology infrastructure is critical to the performance of our digital betting and gaming operations and to user satisfaction and we rely significantly on our computer systems and software to receive and properly process internal and external data, including data related to Caesars Rewards. We devote significant resources to our technology infrastructure, but our systems may not be adequate to avoid performance delays or outages that could be harmful to our online business. In addition, while we believe we have taken appropriate steps, working with industry-leading third-party IT advisors, to harden our systems following the Data Incident and implement corrective measures to protect against future attacks that could pose a threat to our systems. We cannot assure you that thesuch measures or any additional measures we take to prevent cyber-attacks and protect our systems, data and user information and to prevent outages, data or information loss, fraud and to prevent or detect security breaches will be sufficient to ensure uninterrupted operation of our digital platform and provide absolute security. We have experienced, and we may in the future experience, website disruptions, outages and other performance problems due to a variety of factors, including infrastructure changes, human or software errors and capacity constraints. Disruptions from unauthorized access to, fraudulent manipulation of, or tampering with our computer systems and technological infrastructure, or those of third parties that provide support to our operations, could result in a wide range of negative outcomes, each of which could materially adversely affect the operation of our online business and our financial condition, results of operations and prospects.
Additionally, our computer systems and software may fail or may contain errors, bugs, flaws or corrupted data, and these defects may only become apparent after the launch of our online products. These types of issues could disrupt our operations or render a product unavailable when users attempt to access it or cause access to our offerings to be slower than our users expect. Inaccessibility or slow access to our products could make users less likely to return to our digital platform as often, if at all, or to recommend our offerings to other potential users, which could harm our brand perception, cause our users to stop utilizing our online offerings, divert our resources and delay market acceptance of our online offerings.
Our information systems are not fully redundant and our disaster recovery planning cannot account for all eventualities. If our systems are damaged, breached, attacked, interrupted, or otherwise cease to function properly, we may have to make a significant investment to repair or replace them, and may experience loss or corruption of critical data as well as suffer interruptions in our business operations in the interim.
We expect that we will continue to expand our online betting and gaming offerings as our user base grows and we enter into new markets, which will require an enhancement of our technical infrastructure, including network capacity and computing power, and may require additional reliance on third party providers to support the growth of our digital business and to satisfy our users’ needs. Such infrastructure expansion may be complex and costly, and unanticipated delays in completing these projects or availability of components may lead to increased project costs, operational inefficiencies, or interruptions in the delivery or degradation of the quality of our offerings. In addition, there may be issues related to our online infrastructure that are not identified during the testing phases of design and implementation and become evident after we have started to fully use the underlying equipment or software, which could impact the user experience or increase our costs. An inability to effectively scale our technical infrastructure to accommodate increased demands could adversely impact our ability to grow our digital betting and gaming business.
Our online business is dependent on the Internet and we rely on Amazon Web Services and other third-party technology, platforms and services to deliver our offerings to users.
A substantial portion of the infrastructure that is required to enable users to access our digital betting and gaming offerings is provided by third parties, including Internet service providers and other technology-based service providers. In particular, we currently host our online betting and gaming offerings and support our operations using Amazon Web Services (“AWS”) and other third-party technology, platforms and services. Our third-party providers may experience service interruptions, delays, outages or damage, including due to capacity constraints, an event causing an unusually high volume of Internet use (such as a pandemic or public health emergency), infrastructure changes or upgrades (such as 5G or 6G services), human or software errors, website hosting disruptions, natural disasters, cybersecurity attacks, terrorist attacks, power outages and similar events or acts of misconduct. We exercise little control over our third-party providers and any difficulties that these providers experience, including the potential of certain network traffic receiving priority over other traffic (i.e., lack of net neutrality), may adversely affect our business. Because our ability to provide our users with continuing and uninterrupted access to our platform is critical to the success of our digital business, we use our best efforts to ensure that our facilities and infrastructure and the facilities and infrastructure of our third-party providers support our current and expected operations and are designed to mitigate the impacts of system malfunctions. Nevertheless, there can be no guarantee that such systems will be able to meet the demand of our current and future digital business, the overall online betting and gaming industry and the growth of the Internet. Furthermore, if we do not maintain business relationships with our third-party providers, and in particular, AWS, we may not be able to secure required third-party services on terms that are acceptable to us or on an acceptable time frame. Any of these risks could result in a loss of revenue and cause us to incur unexpected costs that could be significant, which could have a material adverse effect on our online business, financial condition, results of operations and prospects.
Our online business model depends upon the continued compatibility between our apps and the major mobile operating systems and upon third-party platforms for the distribution of our product offerings, which depend on factors beyond our control such as the design of third-party operating systems and continued access to our apps on third-party distribution platforms like the Apple App Store.
Our digital business is dependent on the interoperability of our technology with popular mobile operating systems, technologies, networks and standards as our users access our online betting and gaming product offerings primarily on mobile devices. As a result, our business model depends upon the continued compatibility between our app and the major mobile operating systems, such as the Android and iOS operating systems, and we rely upon third-party platforms for distribution of our product offerings. We do not have formal or informal relationships with parties that control design of mobile devices and operating systems and there is no guarantee that popular mobile devices will start or continue to support or feature our product offerings. Any changes, bugs, technical or regulatory issues in such operating systems, our relationships with mobile manufacturers and carriers, or in their terms of service or policies that degrade our offerings’ functionality, reduce or eliminate our ability to distribute our offerings, give preferential treatment to competitive products, limit our ability to deliver high quality offerings, or impose fees or other charges related to delivering our offerings, could adversely affect our product usage and monetization on mobile devices. In addition, if any of the third-party platforms used for distribution of our product offerings were to limit or disable the availability of our app or advertising on their platforms, our ability to generate revenue could be harmed. These changes could materially impact the way we do business, and if we are unable to adjust to those changes quickly and effectively, there could be an adverse effect on our business, financial condition, results of operations and prospects.
Risks Related to Human Capital
We rely on our key personnel and we may face difficulties in attracting and retaining qualified employees for our casinos and race tracks.racetracks.
Our future success will depend upon, among other things, our ability to keep our senior executives and highly qualified employees. The operation of our business requires qualified executives, managers and skilled employees with gaming and horse
racing industry experience and qualifications who are able to obtain the requisite licenses and approval from the applicable gaming authorities. We compete with other potential employers for employees, and we may not succeed in hiring or retaining the executives and other employees that we need. A sudden loss of or inability to replace key employees could have a material adverse effect on our business, financial condition and results of operations. Moreover, there has from time to time been a shortage of skilled labor in our markets and the continued expansion of gaming near our facilities, including the expansion of Native American gaming and internet betting and gaming, may make it more difficult for us to attract qualified candidates. While we believe that we will continue to be able to attract and retain qualified employees, shortages of skilled labor will make it increasingly difficult and expensive to attract and retain the services of a satisfactory number of qualified employees, and we may incur higher costs than expected as a result.
Work stoppages and other labor problems could negatively impact our future profits.
As of December 31, 2021,2023, we had collective bargaining agreements covering approximately 23,00024,000 employees. A lengthy strike or other work stoppages at any of our casino properties could have an adverse effect on our business and results of operations. New contracts, such as the ones we signed in 2023, increase our labor costs.
From time to time, we have also experienced attempts by labor organizations to organize certain of our non-union employees. These efforts haveemployees, which has achieved some success to date.past success. We cannot provide any assurance that we will not experience additional and successful union activity in the future. The impact of this union activity is undetermined and could negatively impact our results of operations.
We cannot assure you that we will be able to retain our performers and other entertainment offerings on acceptable terms or at all.
Historically, our performers have drawn customers to our properties and have been a significant source of our revenue. We cannot assure you that we will be able to retain our performers or other shows on acceptable terms or at all. In addition, the third parties that we depend on for our properties’ entertainment offerings may become incapable or unwilling to provide their services at the level agreed upon or at all. Disruptions in the performance schedule can leave us without entertainment offerings, which could negatively impact our business.
Risks Relating to Our Capital Structure
Our substantial indebtedness and the fact that a significant portion of our cash flow is used to make interest payments and rent payments under our debt and lease agreements could adversely affect our ability to raise additional capital to fund our operations, limit our ability to react to changes in the economy or our industry and prevent us from making debt service payments and rent payments.
As of December 31, 20212023 we had $14.3$12.4 billion of outstanding indebtedness, in addition to leases with VICI and GLPI that require an annual rent payment of $1.2$1.3 billion in 20222024 and that are subject to annual escalation.escalation, including annual escalations based on the CPI. See Note 10 for a description of our obligations under our leases with VICI and GLPI and Note 12 for details regarding our debt outstanding and related restrictive covenants. As a result, a significant portion of our cash flow is applied to make interest payments with respect to our outstanding debt and payments under our leases. These financial obligations may have important negative consequences for us, including: •limiting our ability to use operating cash flow in other areas of our business because we must dedicate a significant portion of these funds to make payments on our debt and lease obligations;
•limiting our flexibility in planning for, or reacting to, changes in our businesses and the markets in which we operate;
•placing us at a competitive disadvantage compared to competitors with debt and rent obligations that are less than ours;
•increasing our vulnerability to, and limiting our ability to react to, changing market conditions, COVID-19 and other public health emergencies and related public health restrictions, changes in our industry and economic downturns;
•limiting our ability to obtain additional financing to fund working capital requirements, capital expenditures, debt service, acquisitions, general corporate or other obligations;
•subjecting us to a number of restrictive covenants that, among other things, require us to make capital expenditures and limit our ability to pay dividends and distributions, make acquisitions and dispositions, borrow additional funds and make other investments;
•exposing us to interest rate risk due to the variable interest rate on borrowings under our credit facilities; and
•affecting our ability to renew gaming and other licenses necessary to conduct our business.
Our ability to service our debt facilities,current and future levels of indebtedness will depend upon, among other things, our future financial and operating performance, which will be affected by prevailing economic conditions, including the CRC Revolving Credit Facility, matureinterest rate environment and financial, business, regulatory and other factors, some of which are beyond our control.
There is no assurance that we will generate cash flow from operations or that future debt or equity financings will be available to us to enable us to pay our indebtedness or to fund other needs and we may be forced to take actions such as reducing or delaying business activities, acquisitions, investments or capital expenditures, selling assets, restructuring or refinancing debt, reducing or discontinuing dividends we may pay in 2022.the future, or seeking additional equity capital. These actions may not be effected on satisfactory terms, or at all. Any inability to generate sufficient cash flow or refinance our indebtedness on favorable terms could have a material adverse effect on our business, results of operations and financial condition. While we expect to refinance or replace our debt facilities when they mature, we cannot be sure that we will be able to obtain financing on commercially reasonable terms.
Despite our current indebtedness levels, we and our subsidiaries may still incur significant additional indebtedness. Incurring more indebtedness could increase the risks associated with our substantial indebtedness.
We and our subsidiaries may be able to incur substantial additional indebtedness, including additional secured indebtedness, and may enter into financing obligations similar to our leases with VICI and GLPI in the future. As of December 31, 2021,2023, we had $2.0$2.1 billion of borrowing capacity under our revolving credit facilities, beforeCEI Revolving Credit Facility, after consideration of $23$70 million in outstanding letters of credit and $48$46 million committed for regulatory purposes, under our CEI Revolving Credit Facility and $69$40 million in outstanding letters of credit under our CRC Revolving Credit Facility.other reserves which is only available for certain permitted uses. Further, our existing debt agreements currently permit,
and we expect that agreements governing debt that we incur in the future will permit, us to incur certain other additional secured and unsecured debt. Further, we may incur other liabilities that do not constitute indebtedness. The risks that we face based on our outstanding indebtedness may intensify if we incur additional indebtedness or financing obligations in the future.
Our variable rate indebtedness exposes us to interest rate volatility, which could cause our debt service obligations to increase significantly.
Borrowings under certain of our facilities are at variable rates of interest and expose us to interest rate volatility. As of December 31, 2023, $3.2 billion of aggregate principal amount of our debt had variable rates. If interest rates increase, our debt service obligations on certain of our variable rate indebtedness will increase even though the amount borrowed remains the same. In addition, at the end of 2021, the administrator for London Interbank Offered Rate (“LIBOR”) ceased publishing one-week and two-month U.S. dollar LIBOR and will cease publishing all remaining U.S. dollar LIBOR tenors in mid-2023. Concurrently, the United Kingdom’s Financial Conduct Authority announced the cessation or loss of representativeness of the U.S. dollar LIBOR tenors from those dates. While we continue to monitor market developments to assess replacement rate options, the consequences of these developments with respect to LIBOR cannot be entirely predicted and may result in the level of interest payments on the portion of our indebtedness that bears interest at variable rates to be affected, which may adversely impact the amount of our interest payments under such debt.
A significant portion of our casinos are located on leased property. If we default on one or more leases, the applicable lessors could terminate the affected leases and we could lose possession of the affected casino.
We currently lease certain parcels of land on which a significant portion of our properties are located. As a ground lessee, we have the right to use the leased land; however, we do not hold fee ownership of the underlying land. Accordingly, we have no interest in the leased land or improvements thereon at the expiration of the ground leases. If our use of the land underlying our casino properties is disrupted permanently or for a significant period of time, then the value of our assets could be impaired and our business and operations could be adversely affected. Our leases provide that they may be terminated for a number of reasons, including failure to pay rent, taxes or other payment obligations or the breach of other covenants contained in the leases. In particular, our leases with GLPIVICI and VICIGLPI require annual rent payments of $1.2$1.3 billion in 2022,2024, which is subject to escalation annually, and obligate us to make specified minimum capital expenditures with respect to the leased properties. If our business and properties fail to generate sufficient earnings, the payments required to service the rent obligations under our leases with GLPIVICI and VICIGLPI could materially and adversely limit our ability to react to changes in our business and make acquisitions and investments in our properties. If we were to default on any one or more of these leases, the applicable lessors could terminate the affected leases and we could lose possession of the affected land and any improvements on the land, including the hotels and casinos. A termination of our ground leases or our leases with GLPI or VICI could result in a default under our debt agreements and could have a material adverse effect on our business, financial condition and results of operations. Further, in the event that any lessor of our leased properties, including GLPI or VICI, encounters financial, operational, regulatory or other challenges, there can be no assurance that such lessor will be able to comply with its obligations under the applicable lease.
Certain of our leases, including our leases with GLPIVICI and VICI,GLPI, are “triple-net” leases. Accordingly, in addition to rent, we are required to pay, among other things, the following: (1) lease payments to the underlying ground lessor for properties that are subject to ground leases; (2) facility maintenance costs; (3) all insurance premiums for insurance with respect to the leased properties and the business conducted on the leased properties; (4) taxes levied on or with respect to the leased properties (other than taxes on the income of the lessor); and (5) all utilities and other services necessary or appropriate for the leased properties and the business conducted on the leased properties. We are responsible for incurring the costs described in the preceding sentence notwithstanding the fact that many of the benefits received in exchange for such costs shall in part accrue to the lessor
as the owner of the associated facilities. In addition, we remain obligated for lease payments and other obligations under our leases with GLPIVICI and VICIGLPI and other ground leases even if one or more of such leased facilities is unprofitable or if we decide to withdraw from those locations. We could incur special charges relating to the closing of such facilities including lease termination costs, impairment charges and other special charges that would reduce our net income and could have a material adverse effect on our business, financial condition and results of operations.
Legal and Regulatory Risks
We are subject to extensive governmental regulation, taxation policies and licensing, and gaming authorities have significant control over our operations, which could have an adverse effect on our business.
Licensing Requirements. The ownership and operation of casino gaming, online betting and gaming, riverboat and horse racing facilities are subject to extensive federal, state and local regulation, and regulatory authorities at local, state and national levels have broad powers with respect to the licensing of gaming businesses. We currently hold all state and local licenses and related approvals necessary to conduct our present gaming operations, but we must periodically apply to renew many of our licenses and registrations. We cannot assure you that we will be able to obtain such renewals. Any failure to maintain or renew our
existing licenses, registrations, permits or approvals would have a material adverse effect on us. In addition, we are required to provide information relating to our operations to various gaming regulatory agencies. A failure to provide accurate information could result in the imposition of fines or other penalties by the relevant regulatory authority. Furthermore, if additional laws or regulations are adopted or existing laws or regulations are amended or interpreted differently, these regulations could impose additional restrictions or costs that could have a significant adverse effect on us.
Gaming authorities with jurisdiction over our operations may, in their discretion, require the holder of any securities issued by us to file applications, be investigated, and be found suitable to own our securities, and, if a holder is found unsuitable, we can be sanctioned, including the loss of approvals that are required for us to continue our gaming operations in the relevant jurisdictions, if such unsuitable person does not timely sell our securities. Our officers, directors and key employees are also subject to similar findings of unsuitability and the gaming authorities may require us to terminate the employment of any person who refuses to file appropriate applications. See “Item“Item 1 - Gaming Licenses and Governmental Regulations”Regulations” and Exhibit 99.1 for further description of the regulations to which we are subject. We may be required under applicable gaming laws and regulations to obtain approval of applicable gaming authorities to issue securities, incur debt and undertake other financing activities and our financing counterparties, including lenders, might be subject to various licensing and related approval procedures in the various jurisdictions in which we operate gaming facilities. Compliance with Other Laws. We are also subject to a variety of other federal, state and local laws, rules, regulations and ordinances that apply to non-gaming businesses, including restrictions enacted in response to COVD-19,public health concerns such as pandemics, zoning, environmental, construction and land-use laws and regulations governing smoking and the serving of alcoholic beverages. Our operations have been and may again be adversely impacted by regulations enacted to limit the spreadimpact of COVID-19.public health concerns. In addition, legislation in various forms to ban indoor tobacco smoking has been enacted or introduced in many states and local jurisdictions, including several of the jurisdictions in which we operate. If additional restrictions are enacted in our jurisdictions, we could experience a significant decrease in gaming revenue and operating results at our properties and, particularly if such restrictions are not applicable to all competitive facilities in that gaming market, our business could be materially adversely affected. The likelihood or outcome of similar legislation in other jurisdictions and referendums in the future cannot be predicted, though any additional limitations on our operations would be expected to negatively impact our financial performance.
Regulations adopted by FINCEN require us to report currency transactions in excess of $10,000 occurring within a gaming day. U.S. Treasury Department regulations also require us to report certain suspicious activity, including any transaction that exceeds $5,000, if we know, suspect or have reason to believe that the transaction involves funds from illegal activity or is designed to evade federal regulations or reporting requirements. Substantial penalties can be imposed if we fail to comply with these regulations. FINCEN has recently increased its focus on gaming companies.
We are required to report certain customer’s gambling winnings via formForm W-2G to comply with current Internal Revenue Service regulations. Should these regulations change, we would expect to incur additional costs to comply with the revised reporting requirements.
Taxation and Fees. In addition, gaming companies are generally subject to significant revenue-based taxes and fees in addition to normal federal, state and local income taxes, and such taxes and fees are subject to increase at any time. We pay substantial taxes and fees with respect to our operations. Tax laws are dynamic and subject to change as new laws are passed and new interpretations of the law are issued or applied, affecting the gaming industry. The large number of state and local governments with significant current or projected budget deficits makes it more likely that those governments that currently permit gaming will seek to fund such deficits with new or increased gaming taxes and/or property taxes and worsening economic conditions
could intensify those efforts. Any material increase, or the adoption of additional taxes or fees, could have a material adverse effect on our future financial results.
The growth of our online betting and gaming business will depend on expansion of online betting and gaming into new jurisdictions and our ability to obtain required licenses.
Our ability to achieve growth in our online betting and gaming business will depend, in large part, upon expansion of online betting and gaming into new jurisdictions, the terms of regulations relating to online betting and gaming and our ability to obtain required licenses. Following the 2018 decision of the U.S. Supreme Court to overturn the federal ban on sports betting, a number of jurisdictions have legalized sports betting and online gaming and we expect that additional jurisdictions may do so in the future. Our ability to further expand our sports betting and online operations is dependent on the adoption of regulations permitting such activities. However, the expansion of betting and online gaming in new jurisdictions is dependent on a number of factors that are beyond our control and there can be no assurances of when, or if, such regulations will be adopted or the terms of such regulations, including restrictions, tax rates and license fees and availability of such licenses to casino owners exclusively or at all.
We may not be able to protect the intellectual property rights we own or may be prevented from using intellectual property necessary for our business.
The development of intellectual property is part of our overall business strategy, and we regard our intellectual property to be an important element of our success. We rely primarily on trade secret, trademark, domain name, copyright, and contract law to protect the intellectual property and proprietary technology we own. We also actively pursue business opportunities in the United States and in international jurisdictions involving the licensing of our trademarks to third parties. It is possible that third parties may copy or otherwise obtain and use our intellectual property or proprietary technology without authorization or otherwise infringe on our rights. For example, while we have a policy of entering into confidentiality, intellectual property invention assignment, and/or non-competition and non-solicitation agreements or restrictions with our employees, independent contractors, and business partners, such agreements may not provide adequate protection or may be breached, or our proprietary technology may otherwise become available to or be independently developed by our competitors. In addition, the laws of some foreign countries may not protect proprietary rights or intellectual property to as great an extent as do the laws of the United States. Despite our efforts to protect our proprietary rights, the unauthorized use or reproduction of our trademarks could diminish the value of our trademarks and our market acceptance, competitive advantages, or goodwill, which could adversely affect our business.
Our technology contains software modules licensed to us by third-party authors under “open source” licenses. Use and distribution of open source software may entail greater risks than use of third-party commercial software, as open source licensors generally do not provide support, warranties, indemnification or other contractual protections regarding infringement claims or the quality of the code. In addition, the public availability of such software may make it easier for others to compromise our technology and, under certain open source licenses, we could be required to release the source code of our proprietary software to the public. This would allow our competitors to create similar offerings with lower development effort and time and ultimately could result in a loss of our competitive advantages.
Third parties have alleged and may in the future allege that we are infringing, misappropriating, or otherwise violating their intellectual property rights. Third parties may initiate litigation against us without warning or may send us letters or other communications that make allegations without initiating litigation. We may elect not to respond to these letters or other communications if we believe they are without merit, or we may attempt to resolve these disputes out of court by negotiating a license, but in either case it is possible that such disputes will ultimately result in litigation. Any such claims could interfere with our ability to use technology or intellectual property that is material to the operation of our business. Such claims may be made by competitors seeking to obtain a competitive advantage or by other parties, such as entities that purchase intellectual property assets for the purpose of bringing infringement claims. We also periodically employ individuals who were previously employed by our competitors or potential competitors, and we may therefore be subject to claims that such employees have used or disclosed the alleged trade secrets or other proprietary information of their former employers.
We may have to rely on litigation to enforce our intellectual property rights, protect our trade secrets, determine the validity and scope of the proprietary rights of others, or defend against claims of infringement or invalidity, including with respect to technology that we believe to be “open source”.source.” Any such litigation could result in substantial costs and the diversion of resources and the attention of management. If unsuccessful, such litigation could result in the loss of important intellectual property rights, require us to pay substantial damages, subject us to injunctions that prevent us from using certain intellectual property, require us to make admissions that affect our reputation in the marketplace, or require us to enter into license agreements that may not be available on favorable terms, re-engineer our technology or discontinue or delay the provision of our offerings. Finally, even if we prevail in any litigation, the remedy may not be commercially meaningful or fully compensate
us for the harm we suffer or the costs we incur. Any of the foregoing could have a material adverse effect on our business, financial condition and results of operations.
We rely on licenses to use the intellectual property rights of third parties which are incorporated into our products and services. Failure to renew or expand existing licenses may require us to modify, limit or discontinue certain offerings.
We rely on products, technologies and intellectual property that we license from third parties, for use in our business-to-business and business-to-consumers offerings. Certain of our offerings and services use intellectual property licensed from third parties and we expect that our future products will require the use of third-party intellectual property. The future success of our business may depend, in part, on our ability to obtain, retain and/or expand licenses for popular technologies and games in a competitive market. We cannot assure that third-party licenses that may be necessary or desirable for the operation of our products, or support for such licensed products and technologies, will be available to us on commercially reasonable terms, if at all. If we are unable to renew and/or expand existing licenses or obtain new licenses, including as a result of reluctance of third parties to subject themselves to regulatory review that may be required to operate as our supplier, we may be required to discontinue or limit our use of the products that include or incorporate the licensed intellectual property, which could adversely impact our business, results of operations and prospects.
We are or may become involved in legal proceedings that, if adversely adjudicated or settled, could impact our business and financial condition.
From time to time, we are named in lawsuits or other legal proceedings relating to our respective businesses. Some of these matters involve commercial or contractual disputes, intellectual property claims, legal compliance, personal injury claims, and employment claims. As with all legal proceedings, no assurances can be given as to the outcome of these matters. Moreover, legal proceedings can be expensive and time consuming, and we may not be successful in defending or prosecuting these lawsuits, which could result in settlements or damages that could significantly impact our business, financial condition and results of operations.
We cannot be sure that we will be able to dispose of the William Hill non-US operations on terms and conditions that are satisfactory to us or at all.
We previously announced that on September 9, 2021 we entered into an agreement to sell the William Hill International operations to 888 Holdings Plc (“888”) and that we intend to apply the proceeds of such sale to repay outstanding indebtedness. The transaction remains subject to the satisfaction of a number of conditions, most notably 888’s publication of a prospectus and shareholder circular recommending shareholder approval of the transaction, and receipt of that approval from 888’s shareholders. There can be no assurance that the transaction will be completed on the previously agreed upon terms and timeline, or that we will be able to consummate a sale of William Hill International in the near future or at all. If we do not expect the closing of the sale of William Hill International by October 14, 2022, the date in which the Bridge Credit Agreement matures, we expect to refinance the outstanding indebtedness under the Bridge Credit Agreement. We cannot guarantee the success of such refinancing.
Item 1B. Unresolved Staff Comments
None.
Item 1C. Cybersecurity
Risk management and strategy
We maintain a cybersecurity team responsible for the development and implementation of a program intended to protect the confidentiality, integrity and availability of our critical systems and information. A component of our program is a cybersecurity Incident Response Plan (“IRP”) which has been built by the team utilizing current and historical industry knowledge and experience.
Key elements of our risk management procedures and processes include:
•risk assessments to help mitigate material cybersecurity risks to our critical systems, information, services, and our broader enterprise IT environment;
•a team comprised of IT security, IT infrastructure, and IT compliance personnel principally responsible for directing (1) our cybersecurity risk assessment processes, (2) our security processes, and (3) our response to cybersecurity incidents;
•the use of external cybersecurity service providers, where appropriate, to assess, test or otherwise assist with aspects of our security processes;
•formal information security training program for all team members as well as supplemental training on specific matters such as phishing and email security best practices;
•a cybersecurity incident response plan and Security Operations Center (SOC) to respond to cybersecurity incidents;
•attack and response simulations at the technical level and execute tabletop response exercises at the management level;
•a third-party risk management process for service providers; and
•cybersecurity insurance to cover certain expenses in the event of a cybersecurity incident.
The cybersecurity team reports to the Chief Information Officer and in January 2024, we hired a Chief Information Security Officer (“CISO”) with significant experience in leading cybersecurity teams to assume the leadership of management’s responsibilities and governance discussed below.
We evaluate our cybersecurity risk management processes and continue to integrate our procedures into our overall enterprise risk management program, which shares common methodologies, reporting channels and governance processes that apply across the enterprise risk management program to other legal, compliance, strategic, operational, and financial risk areas.
Incidents are investigated by the cybersecurity team as they are identified and may be resolved or escalated based upon the specific details and severity of each incident. Incidents are evaluated throughout the investigation and remediation processes and incidents determined to be insignificant may be resolved by the cybersecurity team without further escalation at that time. Incidents determined to be more severe, such as those that may have compromised the confidentiality, integrity and availability of our critical systems and information, are escalated by the cybersecurity team to notify legal counsel, our Cybersecurity & Privacy Executive Steering Committee, our Board of Directors, or various regulators, as required.
Our cybersecurity team evaluates the risk profile of new third party service providers and maintains communication channels with key third party service providers to evaluate and respond to possible effects of incidents within a service provider’s organization. We rely on, and in certain cases require, our third parties to communicate such incidents timely.
As previously disclosed, on September 14, 2023, we announced that an unauthorized actor had gained access to our information technology network as a result of a social engineering attack on an outsourced IT support vendor used by the Company, and acquired a copy of, among other data, our loyalty program database (“Data Incident”). After detecting suspicious activity in our information technology network, we activated our IRP, which included containment measures, and commenced an investigation of the incident. We also notified law enforcement and state gaming regulators, engaged legal counsel and other third-party incident response and cybersecurity professionals, as well as forensic professionals.
We have received, and continue to pursue, reimbursements from insurance carriers for costs incurred as a result of the Data Incident. Based on our assessment, the incident has not had a material impact, and we do not believe the incident has materially affected or will materially affect us, including our operations, business strategy, results of operations, or financial condition.
As a result of the Data Incident, numerous putative class action lawsuits have been filed against us purporting to represent various classes of persons whose personal information was affected by the Data Incident. These class actions assert a variety of common law and statutory claims based on allegations that we failed to use reasonable security procedures and practices to safeguard customers’ personal information, and seek monetary and statutory damages, injunctive relief and other related relief. In addition to those putative class action lawsuits, individual claims have been filed or threatened against us as well.
We have also received inquiries from numerous state regulators related to the Data Incident. We are responding to these inquiries and cooperating fully with regulators. See Note 11 for further discussion. We face certain ongoing risks from cybersecurity threats that, if realized, are reasonably likely to materially affect us, including our operations, business strategy, results of operations, or financial condition.
Governance
Our Board considers cybersecurity risk as critical to the enterprise and is responsible for reviewing our cybersecurity risk profile, including management’s design, implementation and enforcement of our cybersecurity risk management program. The Board of Directors receives periodic updates from our Chief Information Officer (“CIO”) on cybersecurity risks and threats. Board members also receive periodic presentations on cybersecurity topics from our CIO, supported by our internal security staff, or external experts as part of the Board’s continuing education on topics that impact public companies.
The Board has determined that retaining responsibility for risks related to cybersecurity oversight is appropriate, given the complexity of the risks associated with cybersecurity and the attention required to appropriately review and monitor such risks. The full Board lends its collective experience and attention to discussing and overseeing potential risks identified by management and stays up to date on management’s risk-mitigation processes related to cybersecurity.
Our CIO supervises efforts to prevent, detect, mitigate, and remediate cybersecurity risks and incidents through various means, which include briefings from internal security personnel; threat intelligence and other information obtained from governmental, public or private sources, including external cybersecurity service providers; and alerts and reports produced by security tools deployed in the IT environment.
Our CIO is responsible for assessing and managing our material risks from cybersecurity threats. Our CIO has the primary responsibility for leading our overall cybersecurity risk management program and supervises both our internal cybersecurity personnel and our external cybersecurity service providers. Our CIO has significant global experience in managing and leading IT and cybersecurity teams. Members of the cybersecurity team hold various credentials and certificates with respect to information systems and they participate in continuing education.
Item 2. Properties
As of December 31, 2021,2023, the following are our properties, including domestic properties that were solddivested during the year. All amounts are approximations.
| | Property | Property | | Location | | Casino
Space–
Sq. Ft. | | Slot
Machines | | Table
Games | | Hotel
Rooms and
Suites | Property | | Location | | Casino
Space–
Sq. Ft. | | Slot
Machines | | Table
Games | | Hotel
Rooms and
Suites |
| Las Vegas Segment | Las Vegas Segment | | | | | | | | | | |
| Owned-Domestic | Owned-Domestic | |
| Bally’s Las Vegas | | Las Vegas, NV | | 68,400 | | | 840 | | | 60 | | | 2,810 | |
| Owned-Domestic | |
| Owned-Domestic | |
| The Cromwell | |
| The Cromwell | |
| The Cromwell | The Cromwell | | Las Vegas, NV | | 41,600 | | | 400 | | | 30 | | | 190 | |
| Flamingo Las Vegas | Flamingo Las Vegas | | Las Vegas, NV | | 72,300 | | | 800 | | | 60 | | | 3,450 | |
Horseshoe Las Vegas (a) | |
| The LINQ Hotel & Casino | The LINQ Hotel & Casino | | Las Vegas, NV | | 36,300 | | | 560 | | | 40 | | | 2,240 | |
| Paris Las Vegas | | Las Vegas, NV | | 95,300 | | | 870 | | | 80 | | | 2,920 | |
Paris Las Vegas (a) | |
| Planet Hollywood Resort & Casino | Planet Hollywood Resort & Casino | | Las Vegas, NV | | 64,500 | | | 970 | | | 80 | | | 2,500 | |
| Leased | Leased | |
| Caesars Palace Las Vegas | Caesars Palace Las Vegas | | Las Vegas, NV | | 124,200 | | | 1,400 | | | 180 | | | 3,970 | |
| Caesars Palace Las Vegas | |
| Caesars Palace Las Vegas | |
| Harrah’s Las Vegas | Harrah’s Las Vegas | | Las Vegas, NV | | 88,800 | | | 1,070 | | | 60 | | | 2,540 | |
| Rio All-Suite Hotel & Casino | | Las Vegas, NV | | 117,300 | | | 1,030 | | | 50 | | | 2,520 | |
Rio All-Suite Hotel & Casino (b) | |
| | Regional Segment | Regional Segment | |
| Regional Segment | |
| Regional Segment | |
| Owned-Domestic | Owned-Domestic | |
| Owned-Domestic | |
| Owned-Domestic | |
Caesars Virginia (c) | |
Caesars Virginia (c) | |
Caesars Virginia (c) | |
| Circus Circus Reno | Circus Circus Reno | | Reno, NV | | 65,500 | | | 500 | | | 10 | | | 1,570 | |
| Eldorado Gaming Scioto Downs | Eldorado Gaming Scioto Downs | | Columbus, OH | | 108,400 | | | 2,120 | | | — | | | — | |
| Eldorado Resort Casino Reno | Eldorado Resort Casino Reno | | Reno, NV | | 70,000 | | | 920 | | | 40 | | | 810 | |
| Grand Victoria Casino | Grand Victoria Casino | | Elgin, IL | | 35,600 | | | 850 | | | 40 | | | — | |
Harrah’s Columbus Nebraska (d) | |
| Harrah’s Hoosier Park Racing & Casino | Harrah’s Hoosier Park Racing & Casino | | Anderson, IN | | 55,300 | | | 1,300 | | | 30 | | | — | |
Horseshoe Baltimore (a) | Horseshoe Baltimore (a) | | Baltimore, MD | | 133,300 | | | 1,600 | | | 210 | | | — | |
| Indiana Grand | | Shelbyville, IN | | 80,100 | | | 1,480 | | | 70 | | | — | |
| Horseshoe Black Hawk | |
| Horseshoe Indianapolis | |
| Horseshoe Lake Charles | |
| Isle of Capri Casino Boonville | Isle of Capri Casino Boonville | | Boonville, MO | | 28,000 | | | 830 | | | 20 | | | 140 | |
Isle of Capri Casino Hotel Lake Charles (b) | | Westlake, LA | | 26,200 | | | 1,180 | | | 50 | | | 490 | |
| Isle of Capri Casino Lula | |
| Harrah’s Pompano Beach | |
| Lady Luck Casino - Black Hawk | |
| Silver Legacy Resort Casino | |
| Leased | |
| Caesars Atlantic City | |
| Caesars Atlantic City | |
| Caesars Atlantic City | |
| Harrah’s Atlantic City | |
| Harrah’s Council Bluffs | |
| Harrah’s Gulf Coast | |
| Harrah’s Joliet | |
| Harrah’s Lake Tahoe | |
| Harrah’s Laughlin | |
| Harrah’s Metropolis | |
| Harrah’s New Orleans | |
| Harrah’s North Kansas City | |
| Harrah’s Philadelphia | |
| Harveys Lake Tahoe | |
| Horseshoe Bossier City | |
| Horseshoe Council Bluffs | |
| Horseshoe Hammond | |
| Horseshoe St. Louis | |
| | | | | | | | | | | | | | | | | | | | | | | | | | | | | | | | |
| Property | | Location | | Casino
Space–
Sq. Ft. | | Slot
Machines | | Table
Games | | Hotel
Rooms and
Suites |
| Isle of Capri Casino Lula | | Lula, MS | | 57,000 | | | 860 | | | 20 | | | 170 | |
| Isle Casino Hotel - Black Hawk | | Black Hawk, CO | | 26,900 | | | 800 | | | 30 | | | 400 | |
| Isle Casino Racing Pompano Park | | Pompano Beach, FL | | 54,800 | | | 1,160 | | | 40 | | | — | |
| Lady Luck Casino - Black Hawk | | Black Hawk, CO | | 14,500 | | | 390 | | | 10 | | | — | |
| Silver Legacy Resort Casino | | Reno, NV | | 90,100 | | | 900 | | | 60 | | | 1,680 | |
Tropicana Evansville (c) | | Evansville, IN | | 46,300 | | | 720 | | | 20 | | | — | |
| Leased | | | | | | | | | | |
Belle of Baton Rouge Casino & Hotel (c) | | Baton Rouge, LA | | 28,500 | | | 570 | | | — | | | 290 | |
| Caesars Atlantic City | | Atlantic City, NJ | | 113,400 | | | 1,900 | | | 130 | | | 1,150 | |
| Harrah’s Atlantic City | | Atlantic City, NJ | | 150,100 | | | 1,860 | | | 130 | | | 2,590 | |
| Harrah’s Council Bluffs | | Council Bluffs, IA | | 23,100 | | | 510 | | | 20 | | | 250 | |
| Harrah’s Gulf Coast | | Biloxi, MS | | 31,900 | | | 600 | | | 30 | | | 500 | |
| Harrah’s Joliet | | Joliet, IL | | 39,000 | | | 880 | | | 20 | | | 200 | |
| Harrah’s Lake Tahoe | | Lake Tahoe, NV | | 53,600 | | | 720 | | | 60 | | | 510 | |
| Harrah’s Laughlin | | Laughlin, NV | | 58,200 | | | 760 | | | 40 | | | 1,510 | |
Harrah’s Louisiana Downs (c) | | Bossier City, LA | | 12,000 | | | 820 | | | — | | | — | |
| Harrah’s Metropolis | | Metropolis, IL | | 23,500 | | | 650 | | | 20 | | | 210 | |
| Harrah’s New Orleans | | New Orleans, LA | | 103,800 | | | 1,260 | | | 120 | | | 450 | |
| Harrah’s North Kansas City | | N. Kansas City, MO | | 60,100 | | | 960 | | | 60 | | | 390 | |
| Harrah’s Philadelphia | | Chester, PA | | 99,500 | | | 1,700 | | | 70 | | | — | |
| Harveys Lake Tahoe | | Lake Tahoe, NV | | 51,100 | | | 600 | | | 30 | | | 740 | |
| Horseshoe Bossier City | | Bossier City, LA | | 28,300 | | | 1,060 | | | 60 | | | 600 | |
| Horseshoe Council Bluffs | | Council Bluffs, IA | | 55,100 | | | 1,330 | | | 60 | | | 150 | |
| Horseshoe Hammond | | Hammond, IN | | 116,500 | | | 1,970 | | | 120 | | | — | |
| Horseshoe Tunica | | Tunica, MS | | 63,000 | | | 970 | | | 100 | | | 510 | |
| Isle Casino Bettendorf | | Bettendorf, IA | | 36,700 | | | 900 | | | 20 | | | 510 | |
| Isle Casino Waterloo | | Waterloo, IA | | 39,200 | | | 890 | | | 20 | | | 190 | |
| Lumière Place Casino | | St. Louis, MO | | 75,000 | | | 1,160 | | | 30 | | | 490 | |
MontBleu Casino Resort & Spa (c) | | Stateline, NV | | 40,500 | | | 210 | | | 10 | | | 440 | |
| Trop Casino Greenville | | Greenville, MS | | 22,800 | | | 470 | | | — | | | — | |
| Tropicana Atlantic City | | Atlantic City, NJ | | 121,700 | | | 2,020 | | | 120 | | | 2,360 | |
| Tropicana Laughlin Hotel & Casino | | Laughlin, NV | | 43,200 | | | 660 | | | 10 | | | 1,490 | |
| | | | | | | | | | |
| Managed and Branded Segment | | | | | | | | | | |
| Managed | | | | | | | | | | |
| Harrah’s Ak-Chin | | Phoenix, AZ | | 65,200 | | | 1,150 | | | 50 | | | 530 | |
| Harrah’s Cherokee | | Cherokee, NC | | 211,800 | | | 2,870 | | | 160 | | | 1,830 | |
| Harrah’s Cherokee Valley River | | Murphy, NC | | 66,000 | | | 1,000 | | | 60 | | | 300 | |
| Harrah’s Resort Southern California | | Funner, CA | | 72,900 | | | 1,490 | | | 50 | | | 1,090 | |
| Caesars Windsor | | Canada | | 100,000 | | | 1,670 | | | 50 | | | 760 | |
| Caesars Dubai | | United Arab Emirates | | — | | | — | | | — | | | 580 | |
| Branded | | | | | | | | | | |
Caesars Southern Indiana (d) | | Elizabeth, IN | | 74,400 | | | 1,100 | | | 90 | | | 500 | |
| Harrah’s Northern California | | Ione, CA | | 30,100 | | | 850 | | | 20 | | | — | |
| | | | | | | | | | |
| | | | | | | | | | |
| | | | | | | | | | |
| | | | | | | | | | |
| | | | | | | | | | |
| | | | | | | | | | |
| | | | | | | | | | |
| | | | | | | | | | |
| | | | | | | | | | |
| | | | | | | | | | | | | | | | | | | | | | | | | | | | | | | | |
| Property | | Location | | Casino
Space–
Sq. Ft. | | Slot
Machines | | Table
Games | | Hotel
Rooms and
Suites |
| Horseshoe Tunica | | Tunica, MS | | 63,000 | | | 930 | | | 90 | | | 510 | |
| Isle Casino Bettendorf | | Bettendorf, IA | | 41,200 | | | 870 | | | 20 | | | 510 | |
| Isle Casino Waterloo | | Waterloo, IA | | 39,200 | | | 820 | | | 20 | | | 190 | |
| Trop Casino Greenville | | Greenville, MS | | 22,800 | | | 450 | | | — | | | — | |
| Tropicana Atlantic City | | Atlantic City, NJ | | 121,100 | | | 1,630 | | | 100 | | | 2,360 | |
| Tropicana Laughlin Hotel & Casino | | Laughlin, NV | | 43,200 | | | 640 | | | 10 | | | 1,490 | |
| | | | | | | | | | |
| Managed and Branded Segment | | | | | | | | | | |
| Managed | | | | | | | | | | |
| Harrah’s Ak-Chin | | Phoenix, AZ | | 65,200 | | | 1,150 | | | 30 | | | 530 | |
| Harrah’s Cherokee | | Cherokee, NC | | 222,600 | | | 3,260 | | | 160 | | | 1,830 | |
| Harrah’s Cherokee Valley River | | Murphy, NC | | 66,000 | | | 970 | | | 50 | | | 300 | |
| Harrah’s Resort Southern California | | Funner, CA | | 72,900 | | | 1,450 | | | 50 | | | 1,090 | |
| Caesars Windsor | | Canada | | 100,000 | | | 1,680 | | | 80 | | | 760 | |
Caesars Dubai (e) | | United Arab Emirates | | — | | | — | | | — | | | 580 | |
| Branded | | | | | | | | | | |
| Caesars Southern Indiana | | Elizabeth, IN | | 74,400 | | | 980 | | | 90 | | | 500 | |
| Harrah’s Northern California | | Ione, CA | | 30,100 | | | 740 | | | 10 | | | — | |
| | | | | | | | | | |
| | | | | | | | | | |
| | | | | | | | | | |
| | | | | | | | | | |
| | | | | | | | | | |
| | | | | | | | | | |
| | | | | | | | | | |
| | | | | | | | | | |
| | | | | | | | | | |
____________________
(a)On August 26, 2021,In December 2023, the Company increased its ownership interest inrebranded a hotel tower as the Versailles tower and moved 750 rooms from Horseshoe BaltimoreLas Vegas to 75.8% and began to consolidate the property in our Regional segment following the change in ownership. Management fees prior to the consolidation of Horseshoe Baltimore have been reflected in the Managed and Branded segment.Paris Las Vegas.
(b)IsleAs of CapriOctober 2, 2023, Caesars no longer operates the Rio All-Suite Hotel & Casino Hotel Lake Charles (“Lake Charles”) has been temporarily closed sinceand all operations were assumed by the end of August 2020 due to damage from Hurricane Laura and will remain closed until the second half of 2022 whenlessor.
(c)Temporary gaming facility opened on May 15, 2023. The construction of a new land-based casinothe permanent facility of Caesars Virginia is expected to be complete.
(c)During the year ended December 31, 2021, these properties were sold or expected to sell. See Item 7. Management’s Discussion and Analysis of Financial Condition and Results of Operations - Overview for additional details.completed in late 2024.
(d)Temporary gaming facility opened on June 12, 2023. The sale of Caesars Southern Indiana closed on September 3, 2021 and the Company entered into a license agreement with the EBCI for the continued useconstruction of the Caesars brand and the Caesars Rewards loyalty program at Caesars Southern Indiana.
The properties listed above exclude international properties which have been sold or we have entered into agreements to sell. The sale of Caesars Entertainment UK, including the interest in Emerald Resort & Casino (together, “Caesars UK Group”) closed on July 16, 2021, in which the buyer assumed all liabilities associated with the Caesars UK Group. Additionally, on September 8, 2021, the Company entered into an agreement to sell William Hill International, whichHarrah’s Columbus Nebraska is expected to closebe completed in the second quarter of 2022.2024.
(e)On November 16, 2023, the Company exited the management agreement associated with Caesars Dubai and the property was renamed under new ownership.
Certain of our properties operate off-track betting locations, including Harrah’s Hoosier Park Racing & Casino, which operates Winner’s Circle Indianapolis and Winner’s Circle New Haven, and Horseshoe Indianapolis, which operates Winner’s Circle Clarksville. Other properties of ours include The LINQ Promenade, next to The LINQ Hotel & Casino (the “LINQ”) and the CAESARS FORUM conference center in our Las Vegas segment. The LINQ Promenade is an open-air dining, entertainment, and retail promenade located on the east side of the Las Vegas Strip that features the High Roller, a 550-foot observation wheel, and the Fly LINQ Zipline attraction. The CAESARS FORUM is a 550,000 square feet conference center with 300,000 square feet of flexible meeting space, two of the largest pillarless ballrooms in the world and direct access to the LINQ. We will also open our first non-gaming hotel experience in the first half of 2024 with the opening of Caesars Republic Scottsdale featuring more than 250 hotel rooms, approximately 20,000 square feet of event space and hotel amenities including, pools, bars, lounges, and celebrity partnered restaurants.
Item 3. Legal Proceedings
For a discussion of our “Legal Proceedings,” refer to Note 11 to our Financial Statements located elsewhere in this Annual Report on Form 10-K. Item 4. Mine Safety Disclosures
Not applicable.
PART II
Item 5. Market for Registrants’ Common Equity, Related Stockholder Matters and Issuer Purchases of Equity Securities
Our Common Stock is quoted on the NASDAQ Stock Market under the symbol “CZR”. As of February 17, 2022,15, 2024, there were approximately 321297 holders of record of our common stock.
We have not paid any cash dividends on our common stock. We intend to retain all of our earnings to finance the development of our business, and thus, do not anticipate paying cash dividends on our common stock for the foreseeable future. Payment of any cash dividends in the future will be at the discretion of our Board and will depend upon, among other things, our future earnings, operations and capital requirements, our general financial condition, general business conditions and restrictions that may be in place under our borrowing arrangements or existing lease agreements.
Equity Compensation Plan Information
We maintain long-term incentive plans which allow for granting stock-based compensation awards for directors, employees, officers, and consultants or advisers who render services to the Company or its subsidiaries, based on Company Common Stock, including performance-based and incentive stock options, restricted stock, or restricted stock units (“RSUs”), performance stock units (“PSUs”), market-based performance stock units (“MSUs”), stock appreciation rights, and other stock-based awards or dividend equivalents. Forfeitures are recorded in the period in which they occur. See Note 15 for a description of our stock-based compensation plans. The following table sets forth information as of December 31, 2021,2023, with respect to compensation plans under which equity securities that we have authorized for issuance.
| | Plan Category | Plan Category | | Number of securities to be issued upon exercise of outstanding options, warrants and rights (1) | | Weighted average exercise price of outstanding options, warrants and rights (2) | | Number of securities remaining
available for future issuance under
equity compensation plans (excluding
securities reflected in column (a)) | Plan Category | | Number of securities to be issued upon exercise of outstanding options, warrants and rights (1) | | Weighted average exercise price of outstanding options, warrants and rights (2) | | Number of securities remaining
available for future issuance under
equity compensation plans (excluding
securities reflected in column (a)) |
| | (a) | | (b) | | (c) |
| | (a) | | | | (a) | | (b) | | (c) |
| Equity compensation plans approved by security holders | Equity compensation plans approved by security holders | | 2,933,504 | | | $ | 20.69 | | | 5,093,651 | |
|
___________________
(1)Includes (i) 43,905 shares of common stock issuable upon exercise of outstanding options with a weighted-average exercise price of $20.69 and (ii) 2,889,599 unvested RSUs, PSUs, and MSUs.MSUs only, there were no outstanding options as of December 31, 2023.
(2)RSUs, PSUs, and MSUs do not have an exercise price and therefore are not included in the calculation of the weighted-average exercise price.
Changes to the Authorized Shares
On June 17, 2021, following receipt of required shareholder approvals, the Company amended its Certificate of Incorporation to increase the number of authorized shares of common stock from 300 million to 500 million, and authorize the issuance of up to 150 million shares of preferred stock. As of December 31, 2021,2023, no shares of preferred stock have been issued.
Share Repurchase Program
In November 2018, our Board authorized a common stock repurchase program of up to $150 million of stock (the “Share Repurchase Program”) pursuant to which we may, from time to time, repurchase shares of common stock on the open market (either with or without a 10b5-1 plan) or through privately negotiated transactions. The Share Repurchase Program has no time limit and may be suspended or discontinued at any time without notice. There is no minimum number of shares of common stock that we are required to repurchase under the Share Repurchase Program.
As of December 31, 2021,2023, we have acquired 223,823 shares of common stock under this program since 2018 at an aggregate value of $9 million and an average of $40.80 per share. No shares were repurchased during the years ended December 31, 20212023 or 2020.2022.
Transactions Related to Convertible Notes issued by Former CaesarsRecent Sales of Unregistered Securities
Prior to the Merger, Former Caesars issued $1.1 billion aggregate principal amount of 5% convertible senior notes maturing in 2024 (the “5% Convertible Notes”). The 5% Convertible Notes were convertible into the weighted average of the number of shares of Company Common Stock and an amount of cash actually received per share by holders of common stock of FormerNone.
Caesars that made elections for consideration in the Merger. During the year ended December 31, 2021, the Company converted the remaining outstanding aggregate principal amount of the 5% Convertible Notes, which resulted in cash payments of $367 million, net of approximately $12 million paid into our trust accounts, and the issuance of approximately 5 million shares of Company Common Stock.
Recent Sales of Unregistered Securities
None.
Stock Performance Graph
The graph depicted below compares the cumulative total stockholder return on our common stock with the cumulative total return on the Standard & Poor's 500 Stock Index (“S&P 500”) and the Dow Jones U.S. Gambling Total Stock Market Index (“Dow Jones U.S. Gambling”) for the period beginning on December 31, 20162018 and ending on December 31, 2021.2023. NASDAQ OMX furnished the data. The performance graph assumes a $100 investment in our stock and each of the two indices, respectively, on December 31, 2016,2018, and that all dividends were reinvested. Stock price performance, presented for the period from December 31, 20162018 to December 31, 2021,2023, is not necessarily indicative of future results.
The performance graph should not be deemed filed or incorporated by reference into any other of our filings under the Securities Act or the Exchange Act, unless we specifically incorporate the performance graph by reference therein.
Item 6. Selected Financial Data[Reserved]
Not used.
Item 7. Management’s Discussion and Analysis of Financial Condition and Results of Operations
The following discussion should be read in conjunction with, and is qualified in its entirety by, the audited consolidated financial statements and the notes thereto and other financial information included elsewhere in this Annual Report on Form 10-K.
Caesars Entertainment, Inc., a Delaware corporation, isand its subsidiaries, may be referred to as the “Company,” “CEI,” “Caesars,” “we,” “our,” “us,” or the “Registrant,” and together with its subsidiaries may also be referred to as “we,” “us” or “our.“Registrant.”
We also refer to (i) our Consolidated Financial Statements as our “Financial Statements,” (ii) our Consolidated Statements of Operations and Consolidated Statements of Comprehensive Income (Loss) as our “Statements of Operations,” (iii) our Consolidated Balance Sheets as our “Balance Sheets,” and (iv) our Consolidated Statements of Cash Flows as our “Statements of Cash Flows.” References to numbered “Notes” refer to Notes to our Consolidated Financial Statements included in
Item 8.8.
The statements in this discussion regarding our expectations of our future performance, liquidity and capital resources, and other non-historical statements are forward-looking statements. These forward-looking statements are subject to numerous risks and uncertainties. Our actual results may differ materially from those contained in or implied by any forward-looking statements. See Item 1A, “Risk Factors—CAUTIONARY STATEMENTS REGARDING FORWARD-LOOKING STATEMENTS,“Cautionary Statement Regarding Forward-Looking Information.” of this report.
Objective
This Management’s Discussion and Analysis of Financial Condition and Results of Operations (“MD&A”) is intended to be a narrative explanation of the financial statements and other statistical data that should be read in conjunction with the accompanying financial statements to enhance an investor’s understanding of our financial condition, changes in financial condition and results of operations. Our objectives are: (i) to provide a narrative explanation of our financial statements that will enable investors to see the Company through the eyes of management; (ii) to enhance the overall financial disclosure and provide the context within which financial information should be analyzed; and (iii) to provide information about the quality of, and potential variability of, our earnings and cash flows so that investors can ascertain the likelihood thatof whether past performance is indicative of future performance.
Overview
We are a geographically diversified gaming and hospitality company that was founded in 1973 by the Carano family with the opening of the Eldorado Hotel Casino in Reno, Nevada. Beginning in 2005, we grew through a series of acquisitions, including the acquisition of MTR Gaming Group, Inc. in 2014, Isle of Capri Casinos, Inc. (“Isle” or “Isle of Capri”) in 2017, and Tropicana Entertainment, Inc. in 2018. On July 20, 2020, we completed the merger with2018, Caesars Entertainment Corporation (“Former Caesars”in 2020, and William Hill PLC (the “William Hill Acquisition”) pursuant to which Former Caesars became our wholly-owned subsidiary (the “Merger”) and ouron April 22, 2021. Our ticker symbol on the NASDAQ Stock Market changed from “ERI” to “CZR”.
On April 22, 2021, we completed the acquisition of William Hill PLC for £2.9 billion, or approximately $3.9 billion (the “William Hill Acquisition”).is “CZR.”
We currently own, lease or manage an aggregate of 52 domestic properties in 1618 states with approximately 55,70051,300 slot machines, video lottery terminals and e-tables, approximately 2,9002,700 table games and approximately 47,70044,700 hotel rooms as of December 31, 2021.2023. In addition, we have other domestic and international properties in North America that are authorized to use the brands and marks of Caesars Entertainment, Inc., as well as other non-gaming properties. Our primary source of revenue is generated by our casino properties’ gaming operations, which includes our retail and online sports betting as well asand online gaming, and we utilize our hotels, restaurants, bars, entertainment, racing, retail shops and other services to attract customers to our properties.
As of December 31, 2021,2023, we owned 2022 of our casinos and leased 2624 casinos in the U.S. We lease 18 casinos from VICI Properties L.P., a Delaware limited partnership (“VICI”) pursuant to a regional lease, a Las Vegas lease and a Joliet lease. In addition, we lease seven(collectively, “VICI Leases”). We also lease six casinos from GLP Capital, L.P., the operating partnership of Gaming and Leisure Properties, Inc. (“GLPI”), pursuant to a Master Lease (as amended, the “GLPI Master Lease”) and a Lumière lease (together with the GLPI Master Lease, the “GLPI Leases”). Additionally, we leaseleased the Rio All-Suite Hotel & Casino (“Rio”) from a separate third party.party until October 2, 2023, at which time operations were assumed by the lessor. See descriptions below under the “GLPI Leases” and “VICI Leases.”
We also operate and conduct retail and online sports wagering across 21 states and domestic31 jurisdictions 14in North America, 25 of which are mobile foroffer online sports betting, andbetting. Additionally, we operate regulated online real money gamingiGaming in five states. Our recently launched Caesars Sportsbook app operates on the Liberty platform, which we acquiredjurisdictions in the William Hill Acquisition along with other technology platforms that we intend to migrate to the Liberty platform in the future, subject to required approvals.North America. The map below illustrates Caesars Digital’s presence as of December 31, 2021:2023:
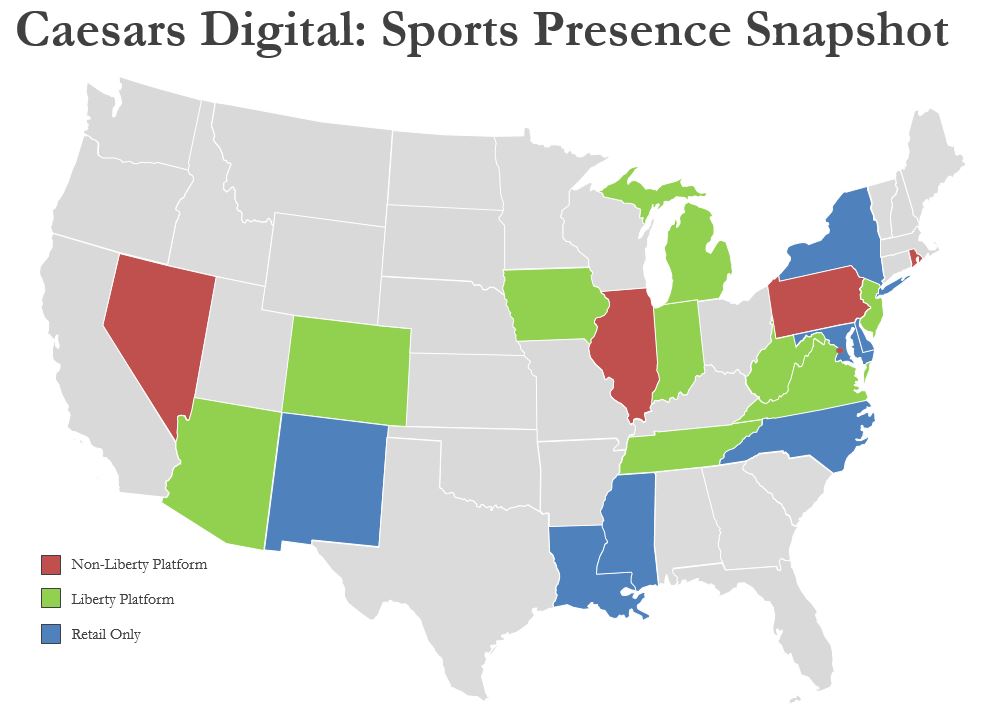

Subsequent toIn 2022, we partnered with NYRABets LLC, the official online wagering platform of the New York Racing Association, Inc., and have launched the Caesars Racebook app within 20 states as of December 31, 2021, we launched mobile sports betting on our Liberty platform in New York on January 8, 2022 and Louisiana on January 28, 2022 and2023. Caesars Racebook also went live with retail sports betting in Washington on February 10, 2022. Illinois in January 2024. The Caesars Racebook app provides access for pari-mutuel wagering at over 300 racetracks around the world as well as livestreaming of races. Wagers placed can earn credits towards our Caesars Rewards loyalty program or points which can be redeemed for free wagering credits.
We are also in the process of expandingcontinuing the expansion of our Caesars Digital footprint into other states in the near term.term with our Caesars Sportsbook, Caesars Racebook and iGaming mobile apps as jurisdictions legalize or provide necessary approvals. No customers under 21 years old are allowed to wager on any of our Caesars Sportsbook, Caesars Racebook and iGaming mobile apps.
We periodically divest of assets in order to raise capital or as a result of a determination that the assets are not core to our business. We also divested certain assets in connection with obtainingbusiness, or due to regulatory approvals related to closing of the Merger. Arequirements. The following is a summary of recently completed and planned divestitures of our properties as of December 31, 2021 is as follows:2023:
| | | | | | | | | | | | | | | | | | | | | | | |
| Segment | | Property | | Date Sold | | | | | Sales Price |
| Regional | | Presque Isle Downs & Casino (“Presque”) | | January 11, 2019 | | | | | $179 million
| | | | | | | | | |
| | | | | | | | | |
| | | | | | | | | |
| | | | | | | | | |
| | | | | | | | | |
| | | | | | | | | |
| Regional | | Lady Luck Casino Nemacolin (“Nemacolin”) | | March 8, 2019 | | | | | * |
Regional | | Mountaineer Casino, Racetrack and Resort (“Mountaineer”) | | December 6, 2019 | | | | | (a) |
Regional | | Isle Casino Cape Girardeau (“Cape Girardeau”) | | December 6, 2019 | | | | | (a) |
Regional | | Lady Luck Casino Caruthersville (“Caruthersville”) | | December 6, 2019 | | | | | (a) |
Regional | | Isle of Capri Casino Kansas City (“Kansas City”) | | July 1, 2020 | | | | | (b) |
Regional | | Lady Luck Casino Vicksburg (“Vicksburg”) | | July 1, 2020 | | | | | (b) |
Regional | | Eldorado Resort Casino Shreveport (“Eldorado Shreveport”) | | December 23, 2020 | | | | | $140 million |
Regional | | MontBleu Casino Resort & Spa (“MontBleu”) | | April 6, 2021 | | | | | $15 million |
| Regional | | Tropicana Evansville (“Evansville”) | | June 3, 2021 | | | | | $480 million |
| Regional | | Belle of Baton Rouge Casino & Hotel (“Baton Rouge”) | | N/AMay 5, 2022 | | | | | * |
| | | | | | | | | |
| Discontinued operations: | | | |
| | | | | | | | | |
| | | | | | | | | |
| Regional | | Harrah’s Reno | | September 30, 2020 | | | | | $42 million (c) |
Regional | | Bally’s Atlantic City | | November 18, 2020 | | | | | $25 million (c) |
Regional | | Harrah’s Louisiana Downs | | November 1, 2021 | | | | | $22 million (c)(a) |
| Regional | | Caesars Southern Indiana | | September 3, 2021 | | | | | $250 million |
| | | | | | | | | |
| N/A | | Caesars UK Group | | Emerald Resort & Casino | July 16, 2021 | | | | | * |
| N/A | | Caesars Entertainment UK | | July 16, 2021 | | | | | * |
N/A | | William Hill International | | N/AJuly 1, 2022 | | | | | £2.22.0 billion |
____________________
*Not meaningful.
(a)Mountaineer, Cape Girardeau and Caruthersville were sold for aggregate consideration of $385 million.
(b)Kansas City and Vicksburg were sold for aggregate consideration of $230 million.
(c)The proceeds of this sale were split between the Company and VICI.
In addition to the divestitures above, the operations of Rio were assumed by the lessor on October 2, 2023, and we exited our management agreement with Caesars Dubai on November 16, 2023. See Item 8. Financial Statements and Supplementary Data — Note 4 for further discussion on these key transactions and any applicable gain (loss) or impairment charges recorded. Merger and Acquisitions Related Activities
Acquisition of William Hill
On September 30, 2020, we announced that we had reached an agreement with William Hill PLC on the terms of a recommended cash acquisition pursuant to which we would acquire the entire issued and to be issued share capital (other than shares owned by us or held in treasury) of William Hill PLC, in an all-cash transaction. Acquisition
On April 22, 2021, the Companywe completed the acquisitionWilliam Hill Acquisition for cash consideration of approximately £2.9 billion, or approximately $3.9 billion, based on the GBP to USD exchange rate on the closing date..
We acquired William Hill PLC and its U.S. subsidiary, William Hill U.S. Holdco (“William Hill US” and together with William Hill PLC, “William Hill”) to better position the Company to address the extensive usage of digital platforms, continued legalization in additional states and jurisdictions, and growing bettor demand, which are driving the market for online sports betting platforms in the U.S. In connection withaddition, we continue to leverage the World Series of Poker (“WSOP”) brand and license the WSOP trademarks for a variety of products and services across these digital platforms. At the time that the William Hill Acquisition on April 22, 2021, a newly formed subsidiary of the Company entered into a Credit Agreement (the “Bridge Credit Agreement”) with certain lenders party theretowas consummated, our intent was to divest William Hill International and Deutsche Bank AG, London Branch, as administrative agent and collateral agent, pursuant to which the lenders party thereto provided the Debt Financing (as defined below). The Bridge Credit Agreement provides for (a) a 540-day £1.0 billion asset sale bridge facility, (b) a 60-day £503 million cash confirmation bridge facility and (c) a 540-day £116 million revolving credit facility (collectively, the “Debt Financing”). The proceeds of the bridge loan facilities provided under the Bridge Credit Agreementsuch its results were used (i) to pay a portion of the cash consideration for the acquisition and (ii) to pay fees and expenses related to the acquisition and related transactions. The proceeds of the revolving credit facility under the Bridge Credit Agreement may be used for working capital and general corporate purposes. The £1.5 billion Interim Facilities Agreement (“Interim Facilities Agreement”) entered into on October 6, 2020 with Deutsche Bank AG, London Branch and JPMorgan Chase Bank, N.A., and amended on December 11, 2020, was terminated upon the execution of the Bridge Credit Agreement. On May 12, 2021, the Company repaid the £503 million cash confirmation bridge facility. On June 14, 2021, the Company drew down the full £116 million from the revolving credit facility and the proceeds,presented in addition to excess Company cash, were used to make a partial repayment of the asset sale bridge facility in the amount of £700 million. Outstanding borrowings under the Bridge Credit Agreement are expected to be repaid upon the sale of William Hill’s non-U.S. operations including the UK and international online divisions and the retail betting shops (collectively, “William Hill International”), all of which are held for sale and reflected within
discontinued operations. Certain investments acquired will be excluded from the held for sale group.
On September 8, 2021, we entered into an agreement to sell William Hill International to 888 Holdings Plc for approximately £2.2 billion. After repayment ofOn April 7, 2022, we amended the outstanding debt under the Bridge Credit Agreement, described above, and other working capital adjustments, the Company expectsagreement to receive approximately £835 million, or $1.2 billion, subjectsell William Hill International to any permitted leakage, which is customary for sale transactions in the UK. The sale is subject to satisfaction of customary conditions, including receipt of the approval of shareholders of 888 Holdings Plc for a revised enterprise value of approximately £2.0 billion. During the year ended December 31, 2022, we recorded impairments to assets held for sale of $503 million within discontinued operations based on the revised and regulatory approvals, and is expectedfinal sales price. On July 1, 2022, we completed the sale of William Hill International to close in the second quarter of 2022.888 Holdings Plc.
We recognized acquisition-related transaction costs of $68$21 million and $8$68 million for the years ended December 31, 20212022 and 2020,2021, respectively, excluding additional transaction cost associated with sale of William Hill International. These costs were associated with legal, and professional services and certain severance and retention costs and were primarily recorded in Transaction costs and other operating costs inon our Statements of Operations.
Consolidation of Horseshoe Baltimore
On August 26, 2021, we increased our ownership interest in CBAC Borrower, LLC (“Horseshoe Baltimore”), a property which we also managed, to approximately 75.8% for cash consideration of $55 million. We were subsequently determined to have a controlling financial interest in Horseshoe Baltimore and have consolidated the results of operations of the property following our change in ownership. As a result of the increase in our ownership interest, our previously held investment was remeasured and we recognized a gain of $40 million for the year ended December 31, 2021. Management fees received priorSubsequent to the consolidation eventchange in ownership, we determined that we have a controlling financial interest and began to consolidate the operations of Horseshoe Baltimore.
Additionally, on July 10, 2023, we completed the acquisition of the remaining 24.2% equity ownership in Horseshoe Baltimore, utilizing cash on hand, for a total of $66 million.
Investments and Partnerships
We have investments in unconsolidated affiliates accounted for under the equity method which are recorded in Investment in and advances to unconsolidated affiliates on the Balance Sheets. Certain significant investments as of December 31, 2023 and 2022 are discussed below.
Pompano Joint Venture
In April 2018, we entered into a joint venture with Cordish Companies (“Cordish”) to plan and develop a mixed-use entertainment and hospitality destination expected to be located on unused land adjacent to the casino and racetrack at our Pompano property. As the managing member, Cordish will operate the business and manage the development, construction, financing, marketing, leasing, maintenance and day-to-day operation of the various phases of the project. Additionally, Cordish is responsible for the development of the master plan for the project with our input and will submit it for our review and approval. In October 2023 and June 2021, the joint venture issued capital calls and we contributed $3 million each, respectively, for a total of $7 million in cash contributions since inception of the joint venture. On February 12, 2021, we contributed 186 acres to the joint venture with a fair value of $61 million. Total contributions of approximately 209 acres of land have been presented within our Managedmade with a fair value of approximately $69 million, and Branded segment. Operations followingwe have no further obligation to contribute additional real estate or cash. During the consolidation event are presented within our Regional segment.
Merger with Caesars Entertainment Corporation
On July 20, 2020,year ended December 31, 2023, the Merger was consummated and Former Caesars became a wholly-owned subsidiary of ours. The strategic rationale for the Merger includes, but is not limitedCompany recorded income related to the following:
•Creationinvestment of $64 million, primarily due to the largest owner, operatorjoint venture’s gain on the sale of land. As of December 31, 2023 and manager of domestic gaming assets
•Diversification of the Company’s domestic footprint
•Access to iconic brands, rewards programs and new gaming opportunities expected to enhance customer experience
•Realization of significant identified synergies
The total purchase consideration for Former Caesars was $10.9 billion. The estimated purchase consideration2022, our investment in the acquisitionjoint venture was determined with reference to its acquisition date fair value.
We recognized acquisition-related transaction costs in connection with the Merger of $30 million, $160$147 million and $80 million, respectively, and is recorded in Investment in and advances to unconsolidated affiliates on the Balance Sheets.
While we hold a 50% variable interest in the joint venture, we are not the primary beneficiary; as such the investment in the joint venture is accounted for using the years ended December 31, 2021, 2020equity method. We participate evenly with Cordish in the profits and 2019, respectively.
Investmentslosses of the joint venture, which are included in Transaction and Partnershipsother costs on our Statements of Operations.
NeoGames
The acquired net assets of William Hill included an investment in NeoGames S.A. (“NeoGames”), a global leader of iLottery solutions and services to national and state-regulated lotteries, and other investments. On September 16, 2021, the Companywe sold a portion of itsour shares of NeoGames common stock for $136 million which decreased itsour ownership interest from 24.5% to approximately 8.4%. As of December 31, 2021, the Company held approximatelyAdditionally, on March 14, 2022 we sold our remaining 2 million shares of NeoGames common stock with aat fair value of $60for $26 million. The shares have a readily determinable fair value and, accordingly,During the Company remeasures the investment based on the publicly available share price (Level 1). For the yearyears ended December 31, 2022 and 2021, the Companywe recorded a losslosses related to the investment in NeoGames of $34 million and $54 million, respectively, which is included within Other income (loss) on the Statements of Operations.
The Stars Group/Flutter Entertainment
In November 2018, the Company entered into a 20-year agreement with The Stars Group Inc. (“TSG”) pursuant to which we agreed to provide TSG with options to obtain access to our second skin for online sports wagering and third skin for real money online gaming and poker, in each case with respect to states in which our properties are located. Under the terms of the agreement, we received 1 million TSG common shares. The fair value of the shares received was deferred and was recognized as revenue on a straight-line basis over the 20-year agreement term. In addition, we received a revenue share from the operation of the applicable verticals by TSG under our licenses. In December 2020, the Company sold a portion of these Flutter shares for net proceeds of $24 million.
On July 7, 2021, the Company sold all remaining Flutter shares for $9 million. The Company recorded a loss of $1 million during the year ended December 31, 2021, which is included within Other income (loss) on our Statements of Operations.
Pompano Joint Venture
In April 2018, the Company entered into a joint venture with Cordish Companies (“Cordish”) to plan and develop a mixed-use entertainment and hospitality destination expected to be located on unused land adjacent to the casino and racetrack at the Company’s Pompano property. As the managing member, Cordish will operate the business and manage the development, construction, financing, marketing, leasing, maintenance and day-to-day operation of the various phases of the project. Additionally, Cordish will be responsible for the development of the master plan for the project with the Company’s input and will submit it for the Company’s review and approval. In June 2021, the joint venture issued a capital call and we contributed $3 million, for a total of $4 million in cash since the inception of the joint venture. On February 12, 2021, the Company contributed 186 acres to the joint venture with a fair value of $61 million. Total contributions of approximately 206 acres of land have been made with a fair value of approximately $69 million, and the Company has no further obligation to contribute additional real estate or cash as of December 31, 2021. We entered into a short-term lease agreement in February 2021, which we can cancel at any time, to lease back a portion of the land from the joint venture.
While the Company holds a 50% variable interest in the joint venture, it is not the primary beneficiary; as such the investment in the joint venture is accounted for using the equity method. The Company participates evenly with Cordish in the profits and losses of the joint venture, which are included in Transaction costs and other operating costs on the Statements of Operations. As of December 31, 2021 and December 31, 2020, the Company’s investment in the joint venture is recorded in Investment in and advances to unconsolidated affiliates on the Balance Sheets.
Reportable Segments
Segment results in this MD&A are presented consistent with the way our management reviews operating results, assesses performance and makes decisions on a “significant market” basis. Management views each of the Company’s casinos as an operating segment. Operating segments are aggregated based on their similar economic characteristics, types of customers, types of services and products provided, and their management and reporting structure. Prior to the William Hill Acquisition, our principal operating activities occurred in three regionally-focused reportable segments: Las Vegas, Regional, and Managed, International, CIE, in addition to Corporate and Other.
The William Hill Acquisition and rebranding of our interactive business (formerly, Caesars Interactive Entertainment “CIE” and now, inclusive of William Hill US, “Caesars Digital”) expanded our access to conduct sports wagering and iGaming gaming operations. As a result, the Company has made a change to the composition of its reportable segments. The Las Vegas and Regional segments are substantially unchanged, while the former Managed, International and CIE reportable segment has been recast for all periods presented into two segments; Caesars Digital and Managed and Branded. Accordingly, ourOur principal operating activities occur in four reportable segments: (1) Las Vegas, (2) Regional, (3) Caesars Digital, and (4) Managed and Branded, in addition to Corporate and Other. See Item 2. “Properties” for listing of properties by segment.
Presentation of Financial Information
The financial information included in this Item 7 for the periods after our acquisitionsacquisition of Former Caesars on July 20, 2020, William Hill on April 22, 2021, and of the increase in our ownership percentage and subsequent consolidation of Horseshoe Baltimore on August 26, 2021, is not fully comparable to the periods prior to the acquisitions. In addition, the presentation of financial information herein for the periods after the Company’s salesdivestiture of various properties, described above, is not fully comparable to the periods prior to their respective sale dates. Refer to “Reportable Segments” above for a discussionthe date of changes to the Company’s reportable segments.divestiture.
This MD&A is intended to provide information to assist in better understanding and evaluating our financial condition and results of operations. Our historical operating results may not be indicative of our future results of operations because of the factors described in the preceding paragraph and the changing competitive landscape in each of our markets, including changes in market and societal trends, increased competition, as well as by factors or trends discussed elsewhere herein. We recommend that you read this MD&A in conjunctiontogether with our audited consolidated financial statements and the notes to those statements included in this Annual Report on Form 10-K.
Reclassifications
Certain reclassifications of prior year presentations have been made to conform to the current period presentation. In June 2021, the Indiana Gaming Commission amended its order that previously required the Company to sell a third casino asset in the state of Indiana. As a result, Horseshoe Hammond no longer meets the held for sale criteria. The assets and liabilities previously held
for sale have been reclassified as held and used for all periods presented measured at the lower of the carrying amount, adjusted for depreciation and amortization that would have been recognized had the assets been continuously classified as held and used, and the fair value at the date of the amended ruling. Additionally, amounts previously presented in discontinued operations have been reclassified into continuing operations for all periods presented.
Key Performance Metrics
Our primary source of revenue is generated by our gaming operations, which includes our retail and online sports betting as well asand online gaming. Additionally, we utilize our hotels, restaurants, bars, entertainment venues, retail shops, racing and other services to attract customers to our properties. Our operating results are highly dependent on the volume and quality of customers visiting and staying at, or visiting, our properties and using our sports betting, horse racing and iGaming applications.
Key performance metrics include volume indicators such as drop or handle, which refer to amounts wagered by our customers. The amount of volume we retain, which is not fully controllable by us, is recognized as casino revenues and is referred to as our win or hold. Slot win percentage is typically in the range of approximately 9% to 11% of slot handle for both the Las Vegas and Regional segments. Table game hold percentage is typically in the range of approximately 14%16% to 23% of table game drop in both the Las Vegas segment and 18% to 21% of table game drop in the Regional segment.segments. Sports betting hold is typically in the range of 5% to 9%10% and iGaming hold typically ranges from 3% to 4%5%. In addition, hotel occupancy, which is the average percentage of available hotel rooms occupied during a period, is a key indicator for our hotel business in the Las Vegas segment. See “Results of Operations” section below. Complimentary and discounted rooms are treated as occupied rooms in our calculation of hotel occupancy. The key metrics we utilize to measure our profitability and performance are Adjusted EBITDA and Adjusted EBITDA margin.
Significant Factors Impacting Financial Results
The following summary highlights the significant factors impacting our financial results during the years ended December 31, 2021, 20202023, 2022 and 2019.2021.
Acquisitions and Transaction Costs
•Acquisition of William Hill Acquisition – On April 22, 2021, the Companywe consummated its previously announcedthe acquisition of the entire issued and to be issued share capital (other than shares owned by the Company or held in treasury) of William Hill PLC, in an all-cash transaction of £2.9 billion, or approximately $3.9 billion. We recognized acquisition-related transaction costs of $68$21 million and $8$68 million for the years ended December 31, 20212022 and 2020,2021, respectively, excluding additional transaction costs associated with sale of William Hill International.
•Consolidation of Horseshoe Baltimore – On August 26, 2021, the Companywe increased itsour ownership interest in Horseshoe Baltimore to approximately 75.8%. Prior to the purchase, the Companywe held an interest in Horseshoe Baltimore of approximately 44.3% which was accounted for as an equity method investment. Subsequent to the change in ownership, the Company waswe determined towe have a controlling financial interest and has begun to consolidateconsolidated the operations of Horseshoe Baltimore. As a result of the consolidation, the Companywe recognized a gain of $40 million during the year ended December 31, 2021.
•Merger with Caesars Entertainment Corporation – The Merger closed Additionally, on July 20, 2020. The Company recognized acquisition-related transaction costs10, 2023, we completed the acquisition of the remaining 24.2% equity ownership in connection with the MergerHorseshoe Baltimore, utilizing cash on hand, for a total of $30 million, $160 million and $80 million for the years ended December 31, 2021, 2020 and 2019, respectively.$66 million.
Divestitures and Discontinued Operations
•Divestitures and Discontinued Operations – See “Overview”“Overview” section above for detail onof properties divested, or held for sale, including related discontinued operations. Financing•The operations of Rio were assumed by the lessor on October 2, 2023, and Leasewe exited our management agreement with Caesars Dubai on November 16, 2023.
Financing Transactions
•Debt Transactions– – In connection withWe continue to utilize free cash flow to reduce our leverage, extend the Merger, we issued new notes, entered intomaturity of our outstanding debt and balance our mix of fixed and variable debt. The following are the key financing transactions and their effects on our operations, from the use of free cash flow, unless otherwise noted:
◦Issued $2.0 billion CEI Senior Secured Notes due 2030 and amended the CEI Credit Agreement and incurred a new credit agreement and assumed certain of Former Caesars indebtedness. In addition, we terminated previously$2.5 billion CEI Term Loan B. Net proceeds received from these transactions were used to repay the $3.4 billion outstanding credit agreements and discharged outstanding notes. During 2021, we issued $1.2 billion in aggregate principal amount of 4.625% Senior Notes due 2029, we repriced the Incremental CRC Term Loan we fully convertedand the outstanding the 5% Convertible Notes, we purchased or redeemed the entire $1.7$1.0 billion in aggregateoutstanding principal amount of the CRC Incremental Term Loan on February 6, 2023.
◦Fully repaid $267 million of the outstanding CRC Notesprincipal balance of and we purchased $100the Baltimore Term Loan as of July 17, 2023.
◦Prepaid the outstanding $400 million in aggregate principal amount of CEI Senior Notes. As a result of these transactions, described more fully in the Liquidity and Capital Resources section below, we experienced some interest savings subsequent to these transactions. Additionally, we recorded a lossForum Convention Center Mortgage Loan on extinguishment of debt of $236 million andMay 1, 2023.
$197 million during◦For the years ended December 31, 2023, 2022 and 2021, we recorded extinguishment charges of $200 million, $85 million and 2020,$236 million, respectively, which isare recorded within Loss on extinguishment of debt on the StatementStatements of Operations.Operations due to the aforementioned activity.
•◦VICI Leases – Upon consummationRefer to the Liquidity and Capital Resources section below for further discussion of the Merger, CEI assumed obligations of certain real property assets leased from VICI by Former Caesars under various lease agreements. We recorded interest expense of $1.1 billion and $519 million for the years endedour recent debt transactions, including our financing transactions subsequent to December 31, 20212023, in which we issued $1.5 billion of new CEI Senior Secured Notes due 2032 and 2020, respectively, which was in excess ofa new $2.9 billion CEI Term Loan B-1. Net proceeds received from these transactions, together with borrowings under our CEI Revolving Credit Facility, were used to tender, redeem, repurchase, defease, and/or satisfy and discharge the cash lease payments as we continue to accrete upCEI Senior Secured Notes due 2025 and the liability during the earlier periods of the VICI Leases. Our VICI Leases also contain annual escalators based on the Consumer Price Index (“CPI”), with a floor of 2%.
•GLPI Leases – We have accounted for the GLPI Leases as deferred financing obligations. We recorded interest expense in the amount of $111 million, $104 million and $99 million during the years ended December 31, 2021, 2020 and 2019, respectively, which was in excess of the cash lease payments as we continue to accrete up the liability during the earlier periods of the GLPI Leases. Our GLPI Leases also contain an annual escalation provision based on stated rates ranging from 1.25% to 2.0% per year.CRC Senior Secured Notes.
Other Significant Factors
•COVID-19 Public Health Emergency –New Developments and Re-openings In January 2020, an outbreak of a new strain of coronavirus (“COVID-19”) was identified and has since spread throughout much– During the construction of the world, includingpermanent facilities for Caesars Virginia and Harrah’s Columbus Nebraska, we opened temporary gaming facilities during the U.S. Allsecond quarter of our casino properties were temporarily closed for2023. Caesars Virginia’s temporary facility opened on May 15, 2023 and Harrah’s Columbus Nebraska’s temporary facility opened on June 12, 2023. In addition to the period from mid-March 2020 through mid-May 2020 duetemporary facilities, the reopening of Horseshoe Lake Charles in December 2022 has contributed to orders issued by various government agenciesthe Regional segment’s performance when compared to the prior year period.
•Caesars Sportsbook, Caesars Racebook and tribal bodies as part of certain precautionary measures intended to help slow the spread of COVID-19.iGaming mobile apps – During the year ended December 31, 2021, most2023, we launched Caesars Sportsbook in new jurisdictions, migrated our sports betting platform to Liberty in Nevada, and launched our new online and mobile iGaming application, Caesars Palace Online Casino. As new states and jurisdictions have legalized sports betting, we have made varying degrees of upfront investments executed through marketing campaigns and promotional incentives to acquire new customers and establish our presence. For example, in connection with the launch of our propertiesCaesars Sportsbook app in New York and Louisiana in January 2022, we experienced positive trendsnegative net revenue in the first quarter of 2022 resulting from a substantial amount of bonus cash and matched deposits issued to customers as restrictionssign-on incentives, which exceeded our gaming win. We continue to adjust our level of investment during the launch period in new jurisdictions based, in part, on maximum capacitiesprior experience and amenities available were eased.
Following temporary furloughs and salary reductions during 2020,do not expect such investment to continue at elevated levels subsequent to the Company has emphasized a focus on labor efficiencies as operations resumed. As properties began to reopen duringinitial launch period. During the year ended December 31, 2020,2023, promotional and marketing expenses have significantly decreased as compared to the prior year period.
•Income Taxes – Management assesses the available positive and negative evidence to estimate if sufficient future taxable income will be generated to use existing deferred tax assets. During the second quarter of 2023, we evaluated our forecasted adjusted taxable income and objectively verifiable evidence and placed substantial weight on our 2022 and 2023 quarterly earnings, adjusted for non-recurring items, including the interest expense disallowed under current tax law. Accordingly, we determined it was more likely than not that a portion of the federal and state deferred tax assets will be realized and, as a result, during the second quarter of 2023, we reversed the valuation allowance related to these deferred tax assets and recorded an income tax benefit of $940 million. We are still carrying a valuation allowance on certain capacity restrictions, mask mandates, sanitation guidelines,federal and state deferred tax assets that are not more likely than not to be realized in the future. We have assessed the changes to the valuation allowance, including realization of the disallowed interest expense deferred tax asset, using the integrated approach.
•Economic Factors Impacting Discretionary Spending – Gaming and other leisure activities we offer represent discretionary expenditures which may be sensitive to economic downturns, such as the resurgence of the Omicron variant of COVID-19 that negatively impacted the first quarter of 2022. We also monitor recent trends, including higher inflation and interest rates, and the federal COVID-19 vaccinerelated effects on our customers, and testing emergency temporary standard were adhered to as required by governmental or tribal orders, directives, and guidelines.
We experienced positive operating trends in 2021, with a continued focus on operational efficiencies. Although we have experienced a decline in net income, Adjusted EBITDA and Adjusted EBITDA margins for the year ended December 31, 2021 exceeded pre-pandemic levels experienced in 2019 within our Las Vegas and Regional segments. However, certain revenue streams, such as convention and entertainment revenues, continued to be negatively impacted due to capacity restrictions in the first half of 2021. Future effects of COVID-19 from further outbreaks, including new variants, mask mandates or other restrictions are uncertain and could result in additional closures such as the temporary closure of Caesars Windsor from January 5, 2022 through January 31, 2022. Extensive closure periods impacting many of our properties would have a material adverse effect on future results of operations.
•Impairment Charges – As a result of COVID-19,our finalized and approved capital and operating plans and the completion of our 2023 annual impairment testing, we recognized impairment charges during the year ended December 31, 2023 in our Regional segment. These impairments were primarily due to a decrease in projected cash flows at certain regional properties mainly due to increased competition. We identified one reporting unit where the estimated fair value of the associated gaming rights was less than the carrying value and recorded an impairment of $81 million. In addition, we identified one reporting unit with an estimated fair value below its carrying value, resulting in total impairment of $14 million to goodwill.
During the year ended December 31, 2022, the Company recognized impairment charges in our Regional segment related to goodwill and trade namesgaming rights totaling $100$78 million and $16$30 million, respectively, duringdue to an increase in the year ended December 31, 2020. In addition,related discount rates, which represents the higher required cost of capital as a result of entering agreements to sell properties in our Regional segment, impairment charges totaling $99 million were recorded during the year ended December 31, 2020 due to the carrying value exceeding the net sales proceeds. macroeconomic environment and projected outlook.
In December 2021, the Companywe approved a capital plan which included the planned rebranding of certain of our properties, which is expected to be substantially complete by December 31, 2022. The Companyproperties. We utilized an income approach to determine the fair value of the trademarks subject to rebranding based on their expected future cash flows, which resulted in an impairment charge of $102 million. The adjusted carrying values of these trademarks, previously considered to have indefinite lives, have begun to be amortized over their respective remaining useful lives.million during the year ended December 31, 2021.
•Weather and Construction Disruption – During the thirdfirst quarter of 2021,2023, our Regional segment was negatively impacted by natural disasters including Hurricane Idasevere winter weather, particularly in Louisiananorthern Nevada, which caused poor and Mississippi and wildfires in the Lake Tahoe area. Harrah’s New Orleans, Harrah’sunsafe travel conditions reducing visitation to our Lake Tahoe and Harvey’s Lake Tahoe all experienced temporary closures which lasted slightly more than one week. Additionally, in late August 2020, our Regional segment was negatively impactedReno properties. During the year ended December 31, 2022, we reached a final settlement agreement with the insurance carriers for the damage and disruption caused by Hurricane Laura causing severe damage to our Lake Charles which will remain closed untilproperty in 2020 for a total amount of $128 million, before our insurance deductible of $25 million. We recorded gains of $38 million and $21 million during the second half of 2022 when construction of a new land-based casino is expected to be complete. During the yearyears ended December 31, 2022 and 2021, we received insurance proceedsrespectively, which are included in Transaction and other costs in our Statements of $44 million related to damaged fixed assets and remediation costs. The Company also recorded a gain of $21 millionOperations, as proceeds received for the cost to replace damaged property were in excess of the respective carrying value of the assets.
•Caesars Sportsbook Launch and Rebranding – In connection with the launch and rebranding of the Caesars Sportsbook app during the year ended December 31, 2021, our Caesars Digital segment initiated a significant marketing campaign with distinguished actors, athletes and other media personalities. As new states and jurisdictions
have legalized sports betting, we have made significant upfront investment which has been executed through the marketing campaign and promotional incentives to establish ourselves as an industry leader.
•Post-Merger Synergies – We continue to identify operating and cost efficiencies, including savings from the purchasing power of the combined Caesars organization and targeted integrated marketing strategies, as well as the elimination of redundant costs such as accounting and professional expenses, certain payroll costs, and other corporate costs. As a result, we experienced margin improvements in our results of operations for the year ended December 31, 2021.
Results of Operations
The following table highlights the results of our operations:
| | Years Ended December 31, |
| Years Ended December 31, | | | Years Ended December 31, |
| (Dollars in millions) | (Dollars in millions) | 2021 | | 2020 | | 2019 | (Dollars in millions) | 2023 | | 2022 | | 2021 |
| Net revenues: | Net revenues: | | | | | |
| Las Vegas | |
| Las Vegas | |
| Las Vegas | Las Vegas | $ | 3,409 | | | $ | 751 | | | $ | — | |
| Regional | Regional | 5,537 | | | 2,660 | | | 2,494 | |
| Caesars Digital | Caesars Digital | 337 | | | 95 | | | 26 | |
| Managed and Branded | Managed and Branded | 278 | | | 107 | | | — | |
Corporate and Other (a) | Corporate and Other (a) | 9 | | | 15 | | | 8 | |
| Total | Total | $ | 9,570 | | | $ | 3,628 | | | $ | 2,528 | |
| | Net income (loss) | Net income (loss) | $ | (1,016) | | | $ | (1,758) | | | $ | 81 | |
| Net income (loss) | |
| Net income (loss) | |
| Adjusted EBITDA (b): | Adjusted EBITDA (b): | |
Adjusted EBITDA (b): | |
Adjusted EBITDA (b): | |
| Las Vegas | |
| Las Vegas | |
| Las Vegas | Las Vegas | $ | 1,568 | | | $ | 133 | | | $ | — | |
| Regional | Regional | 1,979 | | | 711 | | | 719 | |
| Caesars Digital | Caesars Digital | (476) | | | 26 | | | 13 | |
| Managed and Branded | Managed and Branded | 87 | | | 25 | | | — | |
Corporate and Other (a) | Corporate and Other (a) | (168) | | | (101) | | | (35) | |
| Total Segment Adjusted EBITDA | $ | 2,990 | | | $ | 794 | | | $ | 697 | |
| Total | |
| Net income (loss) margin (c) | (10.6) | % | | (48.5) | % | | 3.2 | % |
| Net income (loss) margin | |
| Net income (loss) margin | |
| Net income (loss) margin | | 7.2 | % | | (8.4) | % | | (10.6) | % |
| Adjusted EBITDA margin | Adjusted EBITDA margin | 31.2 | % | | 21.9 | % | | 27.6 | % | Adjusted EBITDA margin | 34.2 | % | | 30.0 | % | | 31.2 | % |
___________________
(a)Corporate and Other includes revenues related to certain licensing arrangements and various revenue sharing agreements. Corporate and Other Adjusted EBITDA includes corporate overhead costs, which consist of certain expenses, such as: payroll, professional fees and other general and administrative expenses.
(b)See the “Supplemental Unaudited Presentation of Consolidated Adjusted Earnings before Interest, Taxes, Depreciation and Amortization (“Adjusted EBITDA”)” discussion later in this MD&A for a description of Adjusted EBITDA and a reconciliation of net income (loss) to Adjusted EBITDA related margins.
(c)Net income (loss) margin is calculated as net income (loss) divided by net revenues.EBITDA.
Consolidated comparison for the years ended December 31, 2021, 20202023, 2022 and 20192021
Net Revenues
Net revenues were as follows:
| | | | | | | | | | | | | | | | | | | | | | | | | | | | | | | | | | | | | | | | | |
| Years Ended December 31, | | Variance | | Percent Change | | Variance | | Percent Change |
| (Dollars in millions) | 2021 | | 2020 | | 2019 | | 2021 vs 2020 | | 2020 vs 2019 |
| Casino and pari-mutuel commissions | $ | 5,827 | | | $ | 2,482 | | | $ | 1,808 | | | $ | 3,345 | | | 134.8 | % | | $ | 674 | | | 37.3 | % |
| Food and beverage | 1,140 | | | 342 | | | 301 | | | 798 | | | * | | 41 | | | 13.6 | % |
| Hotel | 1,551 | | | 450 | | | 300 | | | 1,101 | | | * | | 150 | | | 50.0 | % |
| Other | 1,052 | | | 354 | | | 119 | | | 698 | | | 197.2 | % | | 235 | | | 197.5 | % |
| Net Revenues | $ | 9,570 | | | $ | 3,628 | | | $ | 2,528 | | | $ | 5,942 | | | 163.8 | % | | $ | 1,100 | | | 43.5 | % |
___________________
* Not meaningful. | | | | | | | | | | | | | | | | | | | | | | | | | | | | | | | | | | | | | | | | | |
| Years Ended December 31, | | Variance | | Percent Change | | Variance | | Percent Change |
| (Dollars in millions) | 2023 | | 2022 | | 2021 | | 2023 vs 2022 | | 2022 vs 2021 |
| Casino | $ | 6,367 | | | $ | 5,997 | | | $ | 5,827 | | | $ | 370 | | | 6.2 | % | | $ | 170 | | | 2.9 | % |
| Food and beverage | 1,728 | | | 1,596 | | | 1,140 | | | 132 | | | 8.3 | % | | 456 | | | 40.0 | % |
| Hotel | 2,090 | | | 1,957 | | | 1,551 | | | 133 | | | 6.8 | % | | 406 | | | 26.2 | % |
| Other | 1,343 | | | 1,271 | | | 1,052 | | | 72 | | | 5.7 | % | | 219 | | | 20.8 | % |
| Net Revenues | $ | 11,528 | | | $ | 10,821 | | | $ | 9,570 | | | $ | 707 | | | 6.5 | % | | $ | 1,251 | | | 13.1 | % |
Consolidated net revenues increased for the year ended December 31, 20212023 primarily due to recent acquisitions includinghigher gaming revenues in the Merger on July 20, 2020, the William Hill Acquisition on April 22, 2021,Caesars Digital segment resulting from higher sports betting hold and the consolidation of Horseshoe Baltimore on August 26, 2021, offset by the divestiture of certain properties discussed above. In addition, net revenues for the year ended December 31, 2020 were negatively impacted by the COVID-19 public health emergency. Alladditional state launches of our casino propertiesonline and retail Caesars Sportsbooks. Promotional allowances offered during launches in new jurisdictions were temporarily closed forsignificantly reduced year over year. Hotel occupancy rates within the periodLas Vegas segment continued to improve as compared to the same prior year periods and also contributed to the increase in net revenues. The Regional segment benefited from mid-March 2020 through mid-May 2020. Further, manythe opening of our properties were operating under restrictive guidelines through the first half of 2021 due to orders issued by various government agenciestwo temporary gaming facilities, Caesars Virginia on May 15, 2023 and tribal bodies as part of certain precautionary measures intended to help slow the spread of COVID-19. Local and state regulations and the implementation of social distancing and health and safety protocols in response to COVID-19 resulted in reduced gaming capacity and hotel occupancyHarrah’s Columbus Nebraska on June 12, 2023, as well as limitations on the operationreopening of food and beverage outlets, live entertainment events, and conventions. AsHorseshoe Lake Charles in December 2022. Further, the Omicron variant of December 31, 2021,COVID-19 negatively impacted prior year results during the first quarter of 2022 across substantially all of our properties, have resumed certain operations,including disruptions to group and conventions, banquets, and scheduled concert events. These improved results were partially offset by increased competition associated with new casino resorts opening in some of our regional markets, construction disruptions, and inclement weather across the extent permitted,country, particularly in northern Nevada, which restricted travel in the first quarter of 2023. The Company continues to expand partnerships with the exception of Lake Charles which was severely damaged by Hurricane Lauraiconic entertainers to host concerts and will remain closed until the second half of 2022 when construction of aperformances, and celebrity chefs to offer new land-based casino is expectedfood and beverage venues to be completed.drive new and repeat visitation to our properties.
Operating Expenses
Operating expenses were as follows:
| | Years Ended December 31, | | Variance | | Percent Change | | Variance | | Percent Change |
| Years Ended December 31, | | | Years Ended December 31, | | Variance | | Percent Change | | Variance | | Percent Change |
| (Dollars in millions) | (Dollars in millions) | 2021 | | 2020 | | 2019 | | 2021 vs 2020 | | 2020 vs 2019 | (Dollars in millions) | 2023 | | 2022 | | 2021 | | 2023 vs 2022 | | 2022 vs 2021 |
| Casino and pari-mutuel commissions | $ | 3,129 | | | $ | 1,271 | | | $ | 905 | | | $ | 1,858 | | | 146.2 | % | | $ | 366 | | | 40.4 | % |
| Casino | | Casino | $ | 3,342 | | | $ | 3,526 | | | $ | 3,129 | | | $ | (184) | | | (5.2) | % | | $ | 397 | | | 12.7 | % |
| Food and beverage | Food and beverage | 707 | | | 265 | | | 239 | | | 442 | | | 166.8 | % | | 26 | | | 10.9 | % | Food and beverage | 1,049 | | | 935 | | 935 | | | 707 | | 707 | | | 114 | | 114 | | | 12.2 | | 12.2 | % | | 228 | | | 32.2 | | 32.2 | % |
| Hotel | Hotel | 438 | | | 170 | | | 99 | | | 268 | | | 157.6 | % | | 71 | | | 71.7 | % | Hotel | 570 | | | 529 | | 529 | | | 438 | | 438 | | | 41 | | 41 | | | 7.8 | | 7.8 | % | | 91 | | | 20.8 | | 20.8 | % |
| Other | Other | 373 | | | 140 | | | 46 | | | 233 | | | 166.4 | % | | 94 | | | * | Other | 434 | | | 411 | | 411 | | | 373 | | 373 | | | 23 | | 23 | | | 5.6 | | 5.6 | % | | 38 | | | 10.2 | | 10.2 | % |
| General and administrative | General and administrative | 1,782 | | | 902 | | | 503 | | | 880 | | | 97.6 | % | | 399 | | | 79.3 | % | General and administrative | 2,012 | | | 2,068 | | 2,068 | | | 1,782 | | 1,782 | | | (56) | | (56) | | | (2.7) | | (2.7) | % | | 286 | | | 16.0 | | 16.0 | % |
| Corporate | Corporate | 309 | | | 195 | | | 66 | | | 114 | | | 58.5 | % | | 129 | | | 195.5 | % | Corporate | 306 | | | 286 | | 286 | | | 309 | | 309 | | | 20 | | 20 | | | 7.0 | | 7.0 | % | | (23) | | | (7.4) | | (7.4) | % |
| Impairment charges | Impairment charges | 102 | | | 215 | | | 1 | | | (113) | | | (52.6) | % | | 214 | | | * | Impairment charges | 95 | | | 108 | | 108 | | | 102 | | 102 | | | (13) | | (13) | | | (12.0) | | (12.0) | % | | 6 | | | 5.9 | | 5.9 | % |
| Depreciation and amortization | Depreciation and amortization | 1,126 | | | 583 | | | 222 | | | 543 | | | 93.1 | % | | 361 | | | 162.6 | % | Depreciation and amortization | 1,261 | | | 1,205 | | 1,205 | | | 1,126 | | 1,126 | | | 56 | | 56 | | | 4.6 | | 4.6 | % | | 79 | | | 7.0 | | 7.0 | % |
| Transaction costs and other operating costs | 144 | | | 270 | | | 37 | | | (126) | | | (46.7) | % | | 233 | | | * |
| Transaction and other costs, net | | Transaction and other costs, net | (13) | | | 14 | | | 144 | | | (27) | | | * | | (130) | | | (90.3) | % |
| Total operating expenses | Total operating expenses | $ | 8,110 | | | $ | 4,011 | | | $ | 2,118 | | | $ | 4,099 | | | 102.2 | % | | $ | 1,893 | | | 89.4 | % | Total operating expenses | $ | 9,056 | | | $ | | $ | 9,082 | | | $ | | $ | 8,110 | | | $ | | $ | (26) | | | (0.3) | | (0.3) | % | | $ | 972 | | | 12.0 | | 12.0 | % |
* Not meaningful.
Casino and pari-mutuel expenses consist primarily of salaries and wages associated with our gaming operations, gaming taxes and marketing and promotions and gaming taxes. Hotel expenses consist principally of salaries, wages and supplies associated withattributable to our hotel operations.Caesars Digital segment. Food and beverage expenses consist principally of salaries and wages and costs of goods sold associated with our food and beverage operations. Hotel expenses consist principally of salaries and wages, supplies and costs of services associated with our hotel operations. Other expenses consist principally of salaries and wages and costs of goods sold associated with our retail, entertainment and other operations.
Casino and pari-mutuel, hotel, food and beverage, and other expenses decreased for the year ended December 31, 2021 increased year over year2023 as a result of our recent acquisitions, including the Merger, the William Hill Acquisition, and the consolidation of Horseshoe Baltimore. In addition, the reopening of substantially all of our propertiescompared to the extent permitted by regulations governing the applicable jurisdiction, the partial return of our workforce, andsame prior year period due to a reduction in advertising costs consisting of television, radio and internet marketing campaigns directly attributable tofrom the launch and rebrandingpromotion of our Caesars Sportsbook app contributed
2022. Food and beverage and hotel expenses have increased in connection with increased revenues; however, we continue to the increase noted. These increases were partially offset as the Company focusedfocus on labor efficiencies to manage rising labor costs and post-merger synergies, as described above. Additionally, during the year ended December 31, 2021, the Company managedstrategically manage our marketing and advertising spend to reduce our casino expenses. Similarly, we continue to manage recent increases in food costs and effectively improved margins by focusing on efficiencies within food and beverage venues and menu options.
General and administrative expenses include items such as information technology, facility maintenance, utilities, property and liability insurance, expenses for administrative departments such as accounting, compliance, purchasing, human resources, legal, and internal audit, and property taxes. General and administrative expenses also include other marketing expenses not directlyindirectly related to our gaming and non-gaming operations.
General and administrative expenses for the year ended December 31, 2021 increased year over year as the result of the reopening of all of our properties to the extent permitted by regulations governing the applicable jurisdiction, the Merger, the William Hill Acquisition and the consolidation of Horseshoe Baltimore. These increases were partially offset by a reduced cost structure implemented by the Company while our properties were temporarily closed due to the impact of COVID-19. Additionally, synergies associated with the combined companies from the Merger and the Company’s focus on labor efficiencies and expense savings resulted in reductions to certain administrative costs for the year ended December 31, 2021.
Corporate expenses include unallocated expenses such as payroll, inclusive of the annual bonus, plans, stock-based compensation, professional fees, and other various expenses not directly related to the Company’s operations. For the year ended December 31, 2021 compared to the same prior year period, corporate expenses increased primarily due to the Merger, the William Hill Acquisition and the consolidation of Horseshoe Baltimore. In addition, payroll costs increased as compared to the prior year period due to performance-based incentives and higher costs in the labor market. These costs have been partially offset by a decline in the corporate headcount.
For the year ended December 31, 2021 compared to the same prior year period, depreciation and amortization expense increased primarily due to the recent acquisitions, including the Merger, the William Hill Acquisition, and the consolidation of Horseshoe Baltimore.
Transaction costs and other operating costs, primarily included expenses related to the William Hill Acquisitionnet for the year ended December 31, 20212023 primarily includes non-cash changes in equity method investments and a gain of $29 million associated with proceeds received from the sale of a potential insurance recovery. Offsetting these costs related toare non-cash losses on the Mergerwrite down and disposal of assets and pre-opening costs in connection with new temporary facility openings. Transaction and other costs, net for the year ended December 31, 2020.
Impairment charges2022 primarily represents professional services for integration activities and various contract exit or termination costs, offset by a $38 million gain in 2021 relate to the rebrandingfirst quarter of certain of our properties. Impairment charges in 2020 relate to the impairment of goodwill and trade names recognized due to a triggering event2022 resulting from COVID-19 and agreements to sell properties wherebyinsurance proceeds received in excess of the respective carrying value exceeded the estimated net sales proceeds.of damaged assets associated with our Lake Charles property.
Other Expense
Other expense was as follows:
| | Years Ended December 31, | | Variance | | Percent Change | | Variance | | Percent Change |
| Years Ended December 31, | | | Years Ended December 31, | | Variance | | Percent Change | | Variance | | Percent Change |
| (Dollars in millions) | (Dollars in millions) | 2021 | | 2020 | | 2019 | | 2021 vs 2020 | | 2020 vs 2019 | (Dollars in millions) | 2023 | | 2022 | | 2021 | | 2023 vs 2022 | | 2022 vs 2021 |
| Interest expense, net | Interest expense, net | $ | (2,295) | | | $ | (1,202) | | | $ | (286) | | | $ | (1,093) | | | (90.9) | % | | $ | (916) | | | * | Interest expense, net | $ | (2,342) | | | $ | | $ | (2,265) | | | $ | | $ | (2,295) | | | $ | | $ | (77) | | | (3.4) | | (3.4) | % | | $ | 30 | | | 1.3 | | 1.3 | % |
| Loss on extinguishment of debt | Loss on extinguishment of debt | (236) | | | (197) | | | (8) | | | (39) | | | (19.8) | % | | (189) | | | * | Loss on extinguishment of debt | (200) | | | (85) | | (85) | | | (236) | | (236) | | | (115) | | (115) | | | (135.3) | | (135.3) | % | | 151 | | | 64.0 | | 64.0 | % |
| Other income (loss) | Other income (loss) | (198) | | | 176 | | | 9 | | | (374) | | | * | | 167 | | | * | Other income (loss) | 10 | | | 46 | | 46 | | | (198) | | (198) | | | (36) | | (36) | | | (78.3) | | (78.3) | % | | 244 | | | * | | * |
| Benefit (provision) for income taxes | 283 | | | (132) | | | (44) | | | 415 | | | * | | (88) | | | (200.0) | % |
| Benefit for income taxes | | Benefit for income taxes | 888 | | | 41 | | | 283 | | | 847 | | | * | | (242) | | | (85.5) | % |
___________________
* Not meaningful.
For the year ended December 31, 2021,2023, interest expense, net increased year over year as a result of the Merger, the William Hill Acquisition and the consolidation of Horseshoe Baltimore. Outstanding debt assumed, additional debt raised, and assumeddue to annual escalators in our financing obligations resultedrelated to our VICI Leases, including escalators based on the Consumer Price Index (“CPI”) that take effect in the increase inNovember of each year. In addition, although we have reduced our outstanding debt, rising interest expense. The increase was partially offset by reductionrates have negatively impacted our borrowing rates and resulted in interest expense duerelated to debt service to be flat compared to the extinguishment of the 5% Convertible Notes, early extinguishment of the CRC Notes, partial repayment of the CEI Senior Notes and the repricing of CRC Incremental Term Loan.prior year.
For the yearyears ended December 31, 2021, the2023 and 2022, loss on extinguishment of debt was primarily related to early repayment premiums, and extinguishment of deferred financing costs and discounts associated with the prepayments of the CRC NotesCaesars Resort Collection (“CRC”) Term Loan and CEI Senior Notes, the repricing of the CRC Incremental Term Loan, andLoan. In addition, on July 17, 2023, we repaid the early extinguishment of the 5% Convertible Notes. The loss on extinguishment of debtBaltimore Term Loan.
Other income decreased for the year ended December 31, 2020 was related2023, as compared to the payment of outstanding debt in connection with the Merger.
For the year ended December 31, 2021, other income (loss) fluctuated year overprior year, mainly due to a loss onchange in the fair value of foreign exchange forward contracts and a gain related to the resolution of a disputed claims liability, offset by the change in fair value of investments, all of which were recorded in the prior year.
The income tax benefit was $888 million for 2023 and a loss on the change$41 million for 2022. The reported income tax benefit in fair value of the derivative liability related to the 5% Convertible Notes.
The effective tax rate was 22.3% for 2021, (8.2%) for 2020, and 35.2% for 2019. The effective tax rate in 20202023 differed from the statutory
rate of 21%income tax benefit primarily due to
an increase inthe partial release of federal and state valuation allowances. During the second quarter of 2023, we reversed the valuation allowance
against therelated to certain deferred tax assets
due to the seriesand recorded a one-time income tax benefit of
transactions with VICI during the year. Such transactions did$940 million, as we determined it was more likely than not
occur in 2021.that a portion of our federal and state deferred tax assets would be realized. Refer to
Item 8. - Note 17 for the effective income tax rate reconciliation.Segment comparison for the years ended December 31, 2021, 2020 and 2019
Las Vegas Segment
| | | | | | | | | | | | | | | | | | | | | | | | | | | | | | | | | | | | | | | | | |
| Years Ended December 31, | | Variance | | Percent Change | | Variance | | Percent Change |
| (Dollars in millions) | 2021 | | 2020 | | 2019 | | 2021 vs 2020 | | 2020 vs 2019 |
| Revenues: | | | | | | | | | | | | | |
| Casino and pari-mutuel commissions | $ | 1,226 | | | $ | 319 | | | $ | — | | | $ | 907 | | | * | | $ | 319 | | | * |
| Food and beverage | 702 | | | 130 | | | — | | | 572 | | | * | | 130 | | | * |
| Hotel | 968 | | | 186 | | | — | | | 782 | | | * | | 186 | | | * |
| Other | 513 | | | 116 | | | — | | | 397 | | | * | | 116 | | | * |
| Net revenues | $ | 3,409 | | | $ | 751 | | | $ | — | | | $ | 2,658 | | | * | | $ | 751 | | | * |
| | | | | | | | | | | | | |
| Table game drop | $ | 3,088 | | | $ | 1,082 | | | $ | — | | | $ | 2,006 | | | 185.4 | % | | $ | 1,082 | | | * |
| Table game hold % | 20.2 | % | | 16.6 | % | | — | % | | | | 3.6 pts | | | | 16.6 pts |
| Slot handle | $ | 10,309 | | | $ | 3,498 | | | $ | — | | | $ | 6,811 | | | 194.7 | % | | $ | 3,498 | | | * |
| | | | | | | | | | | | | |
| Hotel occupancy | 82.1 | % | | 47.2 | % | | — | % | | | | 34.9 pts | | | | 47.2 pts |
| | | | | | | | | | | | | |
| Adjusted EBITDA | $ | 1,568 | | | $ | 133 | | | $ | — | | | $ | 1,435 | | | * | | $ | 133 | | | * |
| Adjusted EBITDA margin | 46.0 | % | | 17.7 | % | | — | % | | | | 28.3 pts | | | | 17.7 pts |
| | | | | | | | | | | | | |
| Net income (loss) attributable to Caesars | $ | 641 | | | $ | (287) | | | $ | — | | | $ | 928 | | | * | | $ | (287) | | | * |
___________________
* Not meaningful.
Las Vegas segment’s net revenues and Adjusted EBITDA increased as a result of the Merger and reopening of all of our Las Vegas properties in accordance with state and local regulations as of December 31, 2021. In June 2021, convention and entertainment venues began to reopen as COVID-19 capacity restrictions were lifted.
During the year ended December 31, 2021, all of our reopened properties in the Las Vegas segment experienced an increase in net revenues and Adjusted EBITDA compared to Former Caesars’ prior year results as all properties were temporarily closed for a portion of 2020. Slot win percentage in Las Vegas during the year ended December 31, 2021 was within our typical range and hotel occupancy trended upward compared to 2020. Additionally, pent up demand positively impacted our results of operations in the Las Vegas segment for the year ended December 31, 2021. These positive trends, however, may not be sustained due to increasing costs and continuing uncertainty relating to COVID-19.
Regional Segment
| | | | | | | | | | | | | | | | | | | | | | | | | | | | | | | | | | | | | | | | | |
| Years Ended December 31, | | Variance | | Percent Change | | Variance | | Percent Change |
| (Dollars in millions) | 2021 | | 2020 | | 2019 | | 2021 vs 2020 | | 2020 vs 2019 |
| Revenues: | | | | | | | | | | | | | |
| Casino and pari-mutuel commissions | $ | 4,305 | | | $ | 2,079 | | | $ | 1,782 | | | $ | 2,226 | | | 107.1 | % | | $ | 297 | | | 16.7 | % |
| Food and beverage | 438 | | | 211 | | | 301 | | | 227 | | | 107.6 | % | | (90) | | | (29.9) | % |
| Hotel | 583 | | | 264 | | | 300 | | | 319 | | | 120.8 | % | | (36) | | | (12.0) | % |
| Other | 211 | | | 106 | | | 111 | | | 105 | | | 99.1 | % | | (5) | | | (4.5) | % |
| Net revenues | $ | 5,537 | | | $ | 2,660 | | | $ | 2,494 | | | $ | 2,877 | | | 108.2 | % | | $ | 166 | | | 6.7 | % |
| | | | | | | | | | | | | |
| Table game drop | $ | 4,349 | | | $ | 2,386 | | | $ | 1,328 | | | $ | 1,963 | | | 82.3 | % | | $ | 1,058 | | | 79.7 | % |
| Table game hold % | 21.1 | % | | 20.6 | % | | 19.1 | % | | | | 0.5 pts | | | | 1.5 pts |
| Slot handle | $ | 44,667 | | | $ | 24,441 | | | $ | 16,955 | | | $ | 20,226 | | | 82.8 | % | | $ | 7,486 | | | 44.2 | % |
| | | | | | | | | | | | | |
| Adjusted EBITDA | $ | 1,979 | | | $ | 711 | | | $ | 719 | | | $ | 1,268 | | | 178.3 | % | | $ | (8) | | | (1.1) | % |
| Adjusted EBITDA margin | 35.7 | % | | 26.7 | % | | 28.8 | % | | | | 9 pts | | | | (2.1) pts |
| | | | | | | | | | | | | |
| Net income (loss) attributable to Caesars | $ | 637 | | | $ | (349) | | | $ | 385 | | | $ | 986 | | | * | | $ | (734) | | | * |
___________________
* Not meaningful.
Regional segment’s net revenues and Adjusted EBITDA increased for the year ended December 31, 2021 compared to the same prior year period as a result of the Merger and consolidation of Horseshoe Baltimore. The increase was slightly offset by divestitures of certain properties and closures of certain properties due to Hurricane Ida and the Caldor fire. As of December 31, 2021, all of our properties in our Regional segment reopened, with the exception of Lake Charles which closed due to severe damage from Hurricane Laura and will remain closed until the second half of 2022 when construction of a new land-based casino is expected to be completed. Slot win percentage in the Regional segment during the year ended December 31, 2021 was within our typical range. Additionally, pent up demand positively impacted our results of operations in the Regional segment for the year ended December 31, 2021. These positive trends, however, may not be sustained due to increasing costs and continuing uncertainty relating to COVID-19.
For the year ended December 31, 2021, our Regional segment’s net revenues, Adjusted EBITDA and Adjusted EBITDA margin increased compared to the prior year across all properties, including Former Caesars, due to reductions in workforce and marketing costs, synergies from the purchasing power of the combined Caesars organization, and the Company’s focus on higher margin food and beverage offerings.
Caesars Digital Segment
| | | | | | | | | | | | | | | | | | | | | | | | | | | | | | | | | | | | | | | | | |
| Years Ended December 31, | | Variance | | Percent Change | | Variance | | Percent Change |
| (Dollars in millions) | 2021 | | 2020 | | 2019 | | 2021 vs 2020 | | 2020 vs 2019 |
| Revenues: | | | | | | | | | | | | | |
| Casino and pari-mutuel commissions | $ | 296 | | | $ | 84 | | | $ | 26 | | | $ | 212 | | | * | | $ | 58 | | | * |
| | | | | | | | | | | | | |
| Other | 41 | | | 11 | | | — | | | 30 | | | * | | 11 | | | * |
| Net revenues | $ | 337 | | | $ | 95 | | | $ | 26 | | | $ | 242 | | | * | | $ | 69 | | | * |
| | | | | | | | | | | | | |
Sports betting handle (a) | $ | 6,046 | | | $ | 30 | | | $ | — | | | $ | 6,016 | | | * | | $ | 30 | | | * |
| iGaming handle | 5,621 | | | 2,448 | | | 1,040 | | | 3,173 | | | 129.6 | % | | 1,408 | | | 135.4 | % |
| | | | | | | | | | | | | |
| Adjusted EBITDA | $ | (476) | | | $ | 26 | | | $ | 13 | | | $ | (502) | | | * | | $ | 13 | | | 100.0 | % |
| Adjusted EBITDA margin | (141.2) | % | | 27.4 | % | | 50.0 | % | | | | * | | | | (22.6) pts |
| | | | | | | | | | | | | |
| Net income (loss) attributable to Caesars | $ | (580) | | | $ | 26 | | | $ | 13 | | | $ | (606) | | | * | | $ | 13 | | | 100.0 | % |
___________________
* Not meaningful.
Segment comparison for the years ended December 31, 2023, 2022 and 2021
Las Vegas Segment
| | | | | | | | | | | | | | | | | | | | | | | | | | | | | | | | | | | | | | | | | |
| Years Ended December 31, | | Variance | | Percent Change | | Variance | | Percent Change |
| (Dollars in millions) | 2023 | | 2022 | | 2021 | | 2023 vs 2022 | | 2022 vs 2021 |
| Revenues: | | | | | | | | | | | | | |
| Casino | $ | 1,212 | | | $ | 1,247 | | | $ | 1,226 | | | $ | (35) | | | (2.8) | % | | $ | 21 | | | 1.7 | % |
| Food and beverage | 1,152 | | | 1,063 | | | 702 | | | 89 | | | 8.4 | % | | 361 | | | 51.4 | % |
| Hotel | 1,447 | | | 1,341 | | | 968 | | | 106 | | | 7.9 | % | | 373 | | | 38.5 | % |
| Other | 659 | | | 636 | | | 513 | | | 23 | | | 3.6 | % | | 123 | | | 24.0 | % |
| Net revenues | $ | 4,470 | | | $ | 4,287 | | | $ | 3,409 | | | $ | 183 | | | 4.3 | % | | $ | 878 | | | 25.8 | % |
| | | | | | | | | | | | | |
| Table game drop | $ | 3,428 | | | $ | 3,464 | | | $ | 3,088 | | | $ | (36) | | | (1.0) | % | | $ | 376 | | | 12.2 | % |
| Table game hold % | 22.2 | % | | 22.0 | % | | 20.2 | % | | | | 0.2 pts | | | | 1.8 pts |
| Slot handle | $ | 11,057 | | | $ | 10,718 | | | $ | 10,309 | | | $ | 339 | | | 3.2 | % | | $ | 409 | | | 4.0 | % |
| | | | | | | | | | | | | |
| Hotel occupancy | 96.8 | % | | 92.2 | % | | 82.1 | % | | | | 4.6 pts | | | | 10.1 pts |
| | | | | | | | | | | | | |
| Adjusted EBITDA | $ | 2,016 | | | $ | 1,964 | | | $ | 1,568 | | | $ | 52 | | | 2.6 | % | | $ | 396 | | | 25.3 | % |
| Adjusted EBITDA margin | 45.1 | % | | 45.8 | % | | 46.0 | % | | | | (0.7) pts | | | | (0.2) pts |
| | | | | | | | | | | | | |
| Net income attributable to Caesars | $ | 1,042 | | | $ | 1,021 | | | $ | 641 | | | $ | 21 | | | 2.1 | % | | $ | 380 | | | 59.3 | % |
The Las Vegas segment’s net revenues, net income and Adjusted EBITDA increased year over year primarily due to higher hotel, food and beverage and entertainment revenues. The increase in food and beverage revenues was mainly driven by higher restaurant covers and improved product mix associated with the additions of new casual and premier dining venues. Other revenue increased primarily due to entertainment revenues attributable to an increase in both the quality and number of headliner performances in the current year compared to prior year. In addition, during the first quarter of 2022, the resurgence of the Omicron variant of COVID-19 had a significant negative impact on visitation, group and conventions, and scheduled concert events. As a result, the Las Vegas segment experienced increased visitation during 2023 compared to the prior year which has driven higher hotel occupancy, improved room rates, higher food and beverage revenues and additional entertainment revenues.
The increases in net revenues, net income and Adjusted EBITDA were partially offset by growth in overall union and non-union wages and headcount. Additionally, our Las Vegas segment experienced challenges in the middle of 2023, related to construction disruption and roadwork on the Las Vegas Strip. As a result, the Las Vegas segment’s Adjusted EBITDA margin decreased slightly as compared to the prior year.
Slot win percentage in the Las Vegas segment during the year ended December 31, 2023 was within our typical range.
Regional Segment
| | | | | | | | | | | | | | | | | | | | | | | | | | | | | | | | | | | | | | | | | |
| Years Ended December 31, | | Variance | | Percent Change | | Variance | | Percent Change |
| (Dollars in millions) | 2023 | | 2022 | | 2021 | | 2023 vs 2022 | | 2022 vs 2021 |
| Revenues: | | | | | | | | | | | | | |
| Casino | $ | 4,272 | | | $ | 4,291 | | | $ | 4,305 | | | $ | (19) | | | (0.4) | % | | $ | (14) | | | (0.3) | % |
| Food and beverage | 576 | | | 533 | | | 438 | | | 43 | | | 8.1 | % | | 95 | | | 21.7 | % |
| Hotel | 643 | | | 616 | | | 583 | | | 27 | | | 4.4 | % | | 33 | | | 5.7 | % |
| Other | 287 | | | 264 | | | 211 | | | 23 | | | 8.7 | % | | 53 | | | 25.1 | % |
| Net revenues | $ | 5,778 | | | $ | 5,704 | | | $ | 5,537 | | | $ | 74 | | | 1.3 | % | | $ | 167 | | | 3.0 | % |
| | | | | | | | | | | | | |
| Table game drop | $ | 4,188 | | | $ | 4,270 | | | $ | 4,163 | | | $ | (82) | | | (1.9) | % | | $ | 107 | | | 2.6 | % |
| Table game hold % | 21.7 | % | | 22.0 | % | | 21.0 | % | | | | (0.3) pts | | | | 1 pts |
| Slot handle | $ | 43,211 | | | $ | 42,853 | | | $ | 42,873 | | | $ | 358 | | | 0.8 | % | | $ | (20) | | | — | % |
| | | | | | | | | | | | | |
| Adjusted EBITDA | $ | 1,962 | | | $ | 1,985 | | | $ | 1,979 | | | $ | (23) | | | (1.2) | % | | $ | 6 | | | 0.3 | % |
| Adjusted EBITDA margin | 34.0 | % | | 34.8 | % | | 35.7 | % | | | | (0.8) pts | | | | (0.9) pts |
| | | | | | | | | | | | | |
| Net income attributable to Caesars | $ | 377 | | | $ | 463 | | | $ | 637 | | | $ | (86) | | | (18.6) | % | | $ | (174) | | | (27.3) | % |
The Regional segment’s net revenues increased for the year ended December 31, 2023 compared to the same prior year period, primarily related to incremental net revenues generated from the reopening of Horseshoe Lake Charles in the fourth quarter of 2022 and the opening of our temporary gaming facilities at Caesars Virginia on May 15, 2023 and Harrah’s Columbus Nebraska on June 12, 2023. These increases were partially offset by competition associated with new casino resorts opening in some of our regional markets, construction disruption from renovation projects at certain of our properties and inclement weather across the country, particularly in northern Nevada, which restricted travel in the first quarter of 2023. In addition, wage and headcount increases resulted in higher labor costs during the current year. Increased interest expense associated with our VICI Leases and additional depreciation expense related to our new gaming facilities led to a decline in net income as compared to the same prior year period. As a result, Adjusted EBITDA decreased as compared to the prior year.
Slot win percentage in the Regional segment during the year ended December 31, 2023 was within our typical range.
Caesars Digital Segment
| | | | | | | | | | | | | | | | | | | | | | | | | | | | | | | | | | | | | | | | | |
| Years Ended December 31, | | Variance | | Percent Change | | Variance | | Percent Change |
| (Dollars in millions) | 2023 | | 2022 | | 2021 | | 2023 vs 2022 | | 2022 vs 2021 |
| Revenues: | | | | | | | | | | | | | |
Casino (a) | $ | 886 | | | $ | 462 | | | $ | 296 | | | $ | 424 | | | 91.8 | % | | $ | 166 | | | 56.1 | % |
| | | | | | | | | | | | | |
| Other | 87 | | | 86 | | | 41 | | | 1 | | | 1.2 | % | | 45 | | | 109.8 | % |
| Net revenues | $ | 973 | | | $ | 548 | | | $ | 337 | | | $ | 425 | | | 77.6 | % | | $ | 211 | | | 62.6 | % |
| | | | | | | | | | | | | |
Sports betting handle (b) | $ | 12,089 | | | $ | 12,801 | | | $ | 6,046 | | | $ | (712) | | | (5.6) | % | | $ | 6,755 | | | 111.7 | % |
| Sports betting hold % | 6.3 | % | | 5.4 | % | | 4.3 | % | | | | 0.9 pts | | | | 1.1 pts |
| | | | | | | | | | | | | |
| iGaming handle | $ | 10,622 | | | $ | 8,073 | | | $ | 5,621 | | | $ | 2,549 | | | 31.6 | % | | $ | 2,452 | | | 43.6 | % |
| iGaming hold % | 3.1 | % | | 3.2 | % | | 3.3 | % | | | | (0.1) pts | | | | (0.1) pts |
| | | | | | | | | | | | | |
| Adjusted EBITDA | $ | 38 | | | $ | (666) | | | $ | (476) | | | $ | 704 | | | * | | $ | (190) | | | (39.9) | % |
| Adjusted EBITDA margin | 3.9 | % | | (121.5) | % | | (141.2) | % | | | | * | | | | 19.7 pts |
| | | | | | | | | | | | | |
| Net loss attributable to Caesars | $ | (91) | | | $ | (790) | | | $ | (580) | | | $ | 699 | | | 88.5 | % | | $ | (210) | | | (36.2) | % |
___________________
* Not meaningful.
(a)Includes total promotional and complimentary incentives related to sports betting, iGaming, and poker of $253 million, $542 million and $187 million for the year ended December 31, 2023, 2022 and 2021, respectively. Promotional and complimentary incentives for poker were $14 million, $21 million and $18 million for the year ended December 31, 2023, 2022 and 2021, respectively.
(b)Caesars Digital generated an additional $1.1 billion, $1.2 billion and $706 million of sports betting handle for the year ended December 31, 2023, 2022 and 2021, respectively, which is not included in this table, for the year ended December 31, 2021, for select wholly-owned and third-party operations for which Caesars Digital provides services and we receive all.all, or a share of, the net profits. Hold related to these operations was 10.4%, 11.0% and 9.7% for the year ended December 31, 2023, 2022 and 2021, respectively. Sports betting handle includes $45 million, $50 million and $40 million for the year ended December 31, 2023, 2022 and 2021, respectively, related to horse racing and pari-mutuel wagers.
Caesars Digital includes Caesarsreflects the operations for retail and mobile sports betting, online casino,iGaming, poker, and online poker. It is comprised of thehorse racing, which includes our Caesars interactive business acquired in the Merger, operations acquired in the William Hill AcquisitionSportsbook, Caesars Racebook and historical iGaming at Tropicana Atlantic City. mobile apps.
Caesars Digital’s sports betting handle, iGaming handle, and net revenues, increased significantlynet loss, Adjusted EBITDA, and Adjusted EBITDA margin improved for the year ended December 31, 20212023, as compared to the same prior year, periodprimarily due to the acquisitions and the recent marketing launch of our new sportsbook. However, net revenues for the year ended December 31, 2021 were negatively impacted by ahigher sports betting hold percentage thatcombined with lower year over year promotional and marketing expenses for launches in new states and jurisdictions in 2023. The increase in iGaming handle was belowslightly offset by decreased hold during the period. During the third quarter of 2023, we completed the migration of sports betting operations in Nevada to the Liberty platform and launched our typical range. The low hold percentage was drivennew Caesars Palace Online Casino application in states and territories where we operate iGaming.
We experienced negative net revenue in the first quarter of 2022 as a result of increased promotional offerings for new state launches in New York and Louisiana. We have refined our promotional intensity during the launch period in new jurisdictions based, in part, by increased oddson prior experience and profit boosts, which are promotional enhancements that improve odds or wager payouts for customers. In addition, our hold percentage was negatively impacted by competitive pricing strategies and lower than typical hold in certain betting markets. iGaming hold percentage for the year ended December 31, 2021 was within our typical range.do not expect such investments to continue at elevated levels subsequent to initial launch periods.
In connection with the launch of our Caesars branded sportsbook and iGaming applications, we deployed a significant level of marketing spend to build brand awareness and acquire and retain customers. As sports betting and online casinos expand through increased state or jurisdictional legalization, new product launches, and customer adoption, growthvariations in hold percentages and increases in promotional and marketing and promotional costsexpenses in highly competitive markets during promotional periods may negatively impactsimpact Caesars DigitalDigital’s net revenues, net income, Adjusted EBITDA and Adjusted EBITDA marginsmargin in comparison to current or prior periods.
Sports betting and iGaming hold percentages for the year ended December 31, 2023 were within our typical range.
Managed and Branded Segment
| | Years Ended December 31, | | Variance | | Percent Change | | Variance | | Percent Change |
| Years Ended December 31, | | | Years Ended December 31, | | Variance | | Percent Change | | Variance | | Percent Change |
| (Dollars in millions) | (Dollars in millions) | 2021 | | 2020 | | 2019 | | 2021 vs 2020 | | 2020 vs 2019 | (Dollars in millions) | 2023 | | 2022 | | 2021 | | 2023 vs 2022 | | 2022 vs 2021 |
| Revenues: | Revenues: | | | | | | | | | |
| | Food and beverage | $ | — | | | $ | 1 | | | $ | — | | | $ | (1) | | | (100.0) | % | | $ | 1 | | | * |
| | Other | |
| | Other | |
| | | Other | Other | 278 | | | 106 | | | — | | | 172 | | | 162.3 | % | | 106 | | | * | $ | 307 | | | $ | | $ | 282 | | | $ | | $ | 278 | | | $ | | $ | 25 | | | 8.9 | | 8.9 | % | | $ | 4 | | | 1.4 | | 1.4 | % |
| Net revenues | Net revenues | $ | 278 | | | $ | 107 | | | $ | — | | | $ | 171 | | | 159.8 | % | | $ | 107 | | | * | Net revenues | $ | 307 | | | $ | | $ | 282 | | | $ | | $ | 278 | | | $ | | $ | 25 | | | 8.9 | | 8.9 | % | | $ | 4 | | | 1.4 | | 1.4 | % |
| | Adjusted EBITDA | Adjusted EBITDA | $ | 87 | | | $ | 25 | | | $ | — | | | $ | 62 | | | * | | $ | 25 | | | * |
| Adjusted EBITDA | |
| Adjusted EBITDA | | $ | 76 | | | $ | 84 | | | $ | 87 | | | $ | (8) | | | (9.5) | % | | $ | (3) | | | (3.4) | % |
| Adjusted EBITDA margin | Adjusted EBITDA margin | 31.3 | % | | 23.4 | % | | — | % | | 7.9 pts | | 23.4 pts | Adjusted EBITDA margin | 24.8 | % | | 29.8 | % | | 31.3 | % | | | | (5) pts | | | | (1.5) pts |
| | Net income attributable to Caesars | $ | 68 | | | $ | 29 | | | $ | — | | | $ | 39 | | | 134.5 | % | | $ | 29 | | | * |
| Net income (loss) attributable to Caesars | |
| Net income (loss) attributable to Caesars | |
| Net income (loss) attributable to Caesars | | $ | 101 | | | $ | (301) | | | $ | 68 | | | $ | 402 | | | * | | $ | (369) | | | * |
___________________
* Not meaningful.
We manage several properties and license rights to the use of our brands. These revenue agreements typically include reimbursement of certain costs that we incur directly. Such costs are primarily related to payroll costs incurred on behalf of the properties under management. The revenue related to these reimbursable management costs has a direct impact on our evaluation of Adjusted EBITDA margin which, when excluded, reflects margins typically realized from such agreements. The table below presents the amount included in net revenues and total operating expenses related to these reimbursable costs.
| | | | | | | | | | | | | | | | | | | | | | | | | | | | | | | | | | | | | | | | | |
| Years Ended December 31, | | Variance | | Percent Change | | Variance | | Percent Change |
| (Dollars in millions) | 2021 | | 2020 | | 2019 | | 2021 vs 2020 | | 2020 vs 2019 |
| Reimbursable management revenue | $ | 191 | | | $ | 73 | | | $ | — | | | $ | 118 | | | 161.6 | % | | $ | 73 | | | * |
| Reimbursable management cost | 191 | | | 73 | | | — | | | 118 | | | 161.6 | % | | 73 | | | * |
___________________
* Not meaningful.
Managed and Branded segment’s net revenues and Adjusted EBITDA increased as a result In September 2023, we recorded $25 million of additional other revenue related to the Merger. Upon the consolidation of Horseshoe Baltimore, the operations of the property are included in the Regional segment above and management revenue is eliminated upon consolidation. Additionally, in connection with the closing of the sale of Caesars Southern Indiana on September 3, 2021, the Company and the Eastern Band of Cherokee Indians (“EBCI”) extended their existing relationship by entering into a 10-year brand license agreement, with cancellation rights in exchange for a termination fee at the buyer’s discretion following the fifth anniversary of the agreement, for the continued use of the Caesars brand and Caesars Rewards loyalty program at Caesars Southern Indiana. Caesars Southern Indiana was previously reported within the Regional segment and subsequent to the sale, as a result of the licenseDubai management agreement, relating to the continued use of the Caesars brand and Caesars Rewards loyalty program at Caesars Southern Indiana, is reported within the Managed and Brandedwhich has been excluded from Adjusted EBITDA.
segment. All of our managed properties have reopened as of December 31, 2021, however, a subsequent temporary closure of Caesars Windsor occurred from January 5, 2022 through January 31, 2022 due to COVID - 19.
For the year ended December 31, 2021, net revenues and Adjusted EBITDA for Managed and Branded increased as compared to Former Caesars’ prior period. | | | | | | | | | | | | | | | | | | | | | | | | | | | | | | | | | | | | | | | | | |
| Years Ended December 31, | | Variance | | Percent Change | | Variance | | Percent Change |
| (Dollars in millions) | 2023 | | 2022 | | 2021 | | 2023 vs 2022 | | 2022 vs 2021 |
| Reimbursable management revenue | $ | 206 | | | $ | 198 | | | $ | 191 | | | $ | 8 | | | 4.0 | % | | $ | 7 | | | 3.7 | % |
| Reimbursable management cost | 206 | | | 198 | | | 191 | | | 8 | | | 4.0 | % | | 7 | | | 3.7 | % |
Corporate & Other
| | Years Ended December 31, | | Variance | | Percent Change | | Variance | | Percent Change |
| Years Ended December 31, | | | Years Ended December 31, | | Variance | | Percent Change | | Variance | | Percent Change |
| (Dollars in millions) | (Dollars in millions) | 2021 | | 2020 | | 2019 | | 2021 vs 2020 | | 2020 vs 2019 | (Dollars in millions) | 2023 | | 2022 | | 2021 | | 2023 vs 2022 | | 2022 vs 2021 |
| Revenues: | Revenues: | | | | | | | | | |
| Casino | |
| Casino | |
| Casino | | $ | (3) | | | $ | (3) | | | $ | — | | | $ | — | | | — | % | | $ | (3) | | | * |
| | Other | |
| Other | |
| Other | Other | $ | 9 | | | $ | 15 | | | $ | 8 | | | $ | (6) | | | (40.0) | % | | $ | 7 | | | 87.5 | % | 3 | | | 3 | | 3 | | | 9 | | 9 | | | — | | — | | | — | | — | % | | (6) | | | (66.7) | | (66.7) | % |
| Net revenues | Net revenues | $ | 9 | | | $ | 15 | | | $ | 8 | | | $ | (6) | | | (40.0) | % | | $ | 7 | | | 87.5 | % | Net revenues | $ | — | | | $ | | $ | — | | | $ | | $ | 9 | | | $ | | $ | — | | | * | | * | | $ | (9) | | | (100.0) | | (100.0) | % |
| | Adjusted EBITDA | Adjusted EBITDA | $ | (168) | | | $ | (101) | | | $ | (35) | | | $ | (67) | | | (66.3) | % | | $ | (66) | | | (188.6) | % |
| Adjusted EBITDA | |
| Adjusted EBITDA | | $ | (154) | | | $ | (124) | | | $ | (168) | | | $ | (30) | | | (24.2) | % | | $ | 44 | | | 26.2 | % |
___________________
* Not meaningful.
Supplemental Unaudited Presentation of Consolidated Adjusted Earnings before Interest, Taxes, Depreciation and Amortization (“Adjusted EBITDA”) for the Years Ended December 31, 2021, 20202023, 2022 and 20192021
Adjusted EBITDA (described below), a non-GAAP financial measure, has been presented as a supplemental disclosure because it is a widely used measure of performance and basis for valuation of companies in our industry and we believe that this non-GAAP supplemental information will be helpful in understanding our ongoing operating results. Management has historically used Adjusted EBITDA when evaluating operating performance because we believe that the inclusion or exclusion of certain recurring and non-recurring items is necessary to provide a full understanding of our core operating results and as a means to evaluate period-to-period results. Adjusted EBITDA represents net income (loss) before interest income or interest expense net of interest capitalized, (benefit) provision for income taxes, unrealized (gain) loss on investments and marketable securities, depreciation and amortization, stock-based compensation expense, (gain) loss on extinguishment of debt, impairment charges, other (income) loss, net income (loss) attributable to noncontrolling interests, transaction expenses, severance expense, selling costs associated with theour acquisitions, developments, and divestitures, of properties, equity in income (loss) of unconsolidated affiliates, (gain) loss on the sale or disposal of property and equipment, (gain) loss related to divestitures,non-cash changes in the fair value of certain derivatives and certain non-recurring expenses such as sign-on and retention bonuses, business optimization expenses and transformation expenses, certain litigation awards and settlements, losses on inventory associated with properties temporarily closed as a result of the COVID-19 public health emergency, contract exit or termination costs, and certain regulatory settlements.equity method investments. Adjusted EBITDA also excludes the expense associated with certain of our leases as these transactions were accounted for as financing obligations and the associated expense is included in interest expense. Adjusted EBITDA is not
a measure of performance or liquidity calculated in accordance with GAAP. Adjusted EBITDA is unaudited and should not be considered an alternative to, or more meaningful than, net income (loss) as an indicator of our operating performance. Uses of cash flows that are not reflected in Adjusted EBITDA include capital expenditures, interest payments, income taxes, debt principal repayments, and payments under our leases with affiliates of GLPI and VICI Properties Inc. and certain regulatory gaming assessments,GLPI, which can be significant. As a result, Adjusted EBITDA should not be considered as a measure of our liquidity. Other companies that provide EBITDA information may calculate Adjusted EBITDA differently than we do. The definition of Adjusted EBITDA may not be the same as the definitions used in any of our debt agreements.
The following table summarizes our Adjusted EBITDA for the years ended December 31, 2021, 20202023, 2022 and 2019, respectively,2021 in addition to reconciling net income (loss) to Adjusted EBITDA in accordance with GAAP (unaudited):
| | Year Ended December 31, 2021 |
| Years Ended December 31, | | | Years Ended December 31, |
| (In millions) | (In millions) | CEI | | Pre-Cons. Baltimore (d) | | Pre-Acq. WH US (e) | | Less: Divest. (f) | | Total (g) | (In millions) | 2023 | | 2022 | | 2021 |
| Net loss attributable to Caesars | $ | (1,019) | | | $ | (32) | | | $ | (33) | | | $ | (7) | | | $ | (1,091) | |
| Net income attributable to noncontrolling interests | 3 | | | — | | | — | | | — | | | 3 | |
| Net income (loss) attributable to Caesars | |
| Net income (loss) attributable to noncontrolling interests | |
| Discontinued operations, net of income taxes | Discontinued operations, net of income taxes | 30 | | | — | | | — | | | (23) | | | 7 | |
| Benefit for income taxes | Benefit for income taxes | (283) | | | — | | | (2) | | | — | | | (285) | |
Other (income) loss (a) | Other (income) loss (a) | 198 | | | 40 | | | (2) | | | — | | | 236 | |
| Loss on extinguishment of debt | Loss on extinguishment of debt | 236 | | | — | | | — | | | — | | | 236 | |
| Interest expense, net | Interest expense, net | 2,295 | | | 9 | | | — | | | — | | | 2,304 | |
| Impairment charges | Impairment charges | 102 | | | — | | | — | | | — | | | 102 | |
| Depreciation and amortization | Depreciation and amortization | 1,126 | | | 10 | | | 8 | | | — | | | 1,144 | |
Transaction costs and other operating costs (b) | 144 | | | 6 | | | 27 | | | — | | | 177 | |
Transaction costs and other (b) | |
| Stock-based compensation expense | Stock-based compensation expense | 82 | | | — | | | — | | | — | | | 82 | |
Other items (c) | 76 | | | — | | | 2 | | | — | | | 78 | |
| | Adjusted EBITDA | Adjusted EBITDA | $ | 2,990 | | | $ | 33 | | | $ | — | | | $ | (30) | | | $ | 2,993 | |
| Adjusted EBITDA | |
| Adjusted EBITDA | |
Pre-consolidation, pre-acquisition, and pre-disposition EBITDA, net (c) | |
| Total Adjusted EBITDA | |
| | | | | | | | | | | | | | | | | | | | | | | | | | | | | | | | | | | |
| Year Ended December 31, 2020 |
| (In millions) | CEI | | Pre-Cons. Baltimore (d) | | Pre-Acq. WH US (e) | | Pre-Acq. CEC (h) | | Less: Divest. (f) | | Total (g) |
| Net income (loss) attributable to Caesars | $ | (1,757) | | | $ | (11) | | | $ | (5) | | | $ | (1,059) | | | $ | 264 | | | $ | (2,568) | |
| Net income (loss) attributable to noncontrolling interests | (1) | | | — | | | — | | | (67) | | | 63 | | | (5) | |
| Discontinued operations, net of income taxes | 20 | | | — | | | — | | | — | | | (20) | | | — | |
| (Benefit) provision for income taxes | 132 | | | — | | | (7) | | | (224) | | | 1 | | | (98) | |
Other income (a) | (176) | | | (10) | | | (3) | | | (45) | | | (19) | | | (253) | |
| Loss on extinguishment of debt | 197 | | | — | | | — | | | — | | | — | | | 197 | |
| Interest expense, net | 1,202 | | | 15 | | | 1 | | | 750 | | | (72) | | | 1,896 | |
| Depreciation and amortization | 583 | | | 16 | | | 22 | | | 559 | | | (43) | | | 1,137 | |
| Impairment charges | 215 | | | — | | | — | | | 189 | | | (203) | | | 201 | |
Transaction costs and other operating costs (b) | 270 | | | 1 | | | 23 | | | 71 | | | (6) | | | 359 | |
| Stock-based compensation expense | 79 | | | 1 | | | — | | | 26 | | | — | | | 106 | |
Other items (c) | 30 | | | (1) | | | — | | | 54 | | | (3) | | | 80 | |
| Adjusted EBITDA | $ | 794 | | | $ | 11 | | | $ | 31 | | | $ | 254 | | | $ | (38) | | | $ | 1,052 | |
| | | | | | | | | | | | | | | | | | | | | | | | | | | | | | | | | | | |
| Year Ended December 31, 2019 |
| (In millions) | CEI | | Pre-Cons. Baltimore (d) | | Pre-Acq. WH US (e) | | Pre-Acq. CEC (h) | | Less: Divest. (f) | | Total (g) |
| Net income (loss) attributable to Caesars | $ | 81 | | | $ | (1) | | | $ | 1 | | | $ | (1,195) | | | $ | 53 | | | $ | (1,061) | |
| Net income (loss) attributable to noncontrolling interests | — | | | — | | | — | | | (3) | | | 3 | | | — | |
| | | | | | | | | | | |
| (Benefit) provision for income taxes | 44 | | | — | | | (1) | | | (141) | | | (47) | | | (145) | |
Other (income) loss (a) | (9) | | | (1) | | | (3) | | | 587 | | | 3 | | | 577 | |
| Loss on extinguishment of debt | 8 | | | — | | | — | | | — | | | — | | | 8 | |
| Interest expense, net | 286 | | | 19 | | | — | | | 1,370 | | | (83) | | | 1,592 | |
| Depreciation and amortization | 222 | | | 25 | | | 17 | | | 1,021 | | | (97) | | | 1,188 | |
| Impairment charges | 1 | | | — | | | — | | | 468 | | | (50) | | | 419 | |
Transaction costs and other operating costs (b) | 37 | | | — | | | 1 | | | 136 | | | (31) | | | 143 | |
| Stock-based compensation expense | 20 | | | — | | | — | | | 88 | | | (1) | | | 107 | |
Other items (c) | 7 | | | — | | | — | | | 80 | | (2) | | | 85 | |
| Adjusted EBITDA | $ | 697 | | | $ | 42 | | | $ | 15 | | | $ | 2,411 | | | $ | (252) | | | $ | 2,913 | |
| | | | | | | | | | | |
| | | | | | | | | | | |
| | | | | | | | | | | |
| | | | | | | | | | | |
____________________
(a)Other (income) loss primarily includes the net changes in fair value of (i) investments changes in fair value ofheld by the Company, (ii) foreign exchange forward contracts, (iii) a disputed claims liability, and (iv) the derivative liability related to the 5% Convertible Notes,convertible notes, which were fully converted during the year ended December 31, 2021, and gains and losses onthe change in the foreign currency exchange.exchange rate associated with restricted cash held in GBP associated with our acquisition of William Hill.
(b)Transaction costs and other operating costs primarily representincludes (i) net proceeds received in exchange for participation rights in a potential insurance recovery, (ii) proceeds received for the termination of the Caesars Dubai management agreement, (iii) insurance proceeds received in excess of the respective carrying value of damaged assets associated with the Lake Charles property, (iv) costs related to non-cash losses on the William Hill Acquisitionwrite down and the Merger,disposal of assets, professional services for transaction and integration costs, various contract exit or license termination exit costs, professional services, other acquisition costs, and severance costs.pre-opening costs in connection with new temporary facility openings, and (v) non-cash changes in equity method investments.
(c)Other items primarily represent certain consulting and legal fees, rent for non-operating assets, relocation expenses, retention bonuses, and business optimization expenses.
(d)Represents resultsResults of operations for Horseshoe Baltimore for periods prior to theits consolidation resulting from the Company’s increase in its ownership interest on August 26, 2021. Such figures are based on unaudited internal financial statements2021 and have not been reviewed by the Company’s auditors and do not conform to GAAP.
(e)Pre-acquisition William Hill represents results of operations for William Hill prior to the acquisition. Such figuresits acquisition on April 22, 2021 are based on unaudited internal financial statements and have not been reviewed by the Company’s auditors and, for the 2021, 2020 and 2019 periods, do not conformadded to GAAP.
(f)Divestitures includeAdjusted EBITDA. The results of operations for certainof divested properties divested.prior to their respective divestiture dates are subtracted from Adjusted EBITDA. See Item 7 - Overview above. Such figures are based on unaudited internal financial statements and have not been reviewed by the Company’s auditors and do not conform to GAAP.
(g)Such presentation does not conform to GAAP orfor the Securities and Exchange Commission rules for pro forma presentation; however, we believe that theperiods presented. The additional financial information will be helpfulis included to investors in comparingenable the comparison of current results with results of prior periods. This is non-GAAP data and should not be considered a substitute for data prepared in accordance with GAAP, but should be viewed in addition to the results of operations reported by the Company.
(h)Pre-acquisition CEC represents results of operations for Former Caesars prior to the Merger. Such figures are based on unaudited internal financial statements and have not been reviewed by the Company’s auditors and, for the 2020 and 2019 periods, do not conform to GAAP.
Liquidity and Capital Resources
We are a holding company and our only significant assets are ownership interests in our subsidiaries. Our ability to fund our obligations depends on existing cash on hand, contracted asset sales, cash flows from our subsidiaries and our ability to raise capital. Our primary sources of liquidity and capital resources are existing cash on hand, cash flows from operations, availability of borrowings under our revolving credit facilities,facility, proceeds from the issuance of debt and equity securities and proceeds from completed asset sales. Our cash requirements may fluctuate significantly depending on our decisions with respect to business acquisitions or divestitures and strategic capital and marketing investments.
As of December 31, 2021,2023, our cash on hand and revolving borrowing capacity were as follows:
| | | | | |
| (In millions) | December 31, 20212023 |
| Cash and cash equivalents | $ | 1,0701,005 | |
Revolver capacity (a) | 2,0302,210 | |
| Revolver capacity committed to letters of credit | (92)(70) | |
| Revolver capacity committed as regulatory requirement | (48)(46) | |
| Total | $ | 2,9603,099 | |
___________________
(a)Revolver capacity includes $995 million$2.25 billion under our CEI Revolving Credit Facility, as amended, maturing in July 2025, $1,025January 2028, less $40 million under our CRC Revolving Credit Facility, maturing in December 2022 and $10 million under our Baltimore Revolving Credit Facility, maturing in July 2022.reserved for specific purposes.
During the year ended December 31, 2021,2023, our operating activities generated operating cash inflows of $1.2$1.8 billion, as compared to operating cash outflowsinflows of $561 million$1.0 billion during the year ended December 31, 20202022 due to the results of operations described aboveabove.
On February 6, 2023, we entered into an Incremental Assumption Agreement No. 2 pursuant to which we incurred a new senior secured term loan facility in additionan aggregate principal amount of $2.5 billion (the “CEI Term Loan B” and, together with the CEI Term Loan A, the “CEI Term Loans”) as a new term loan under the CEI Credit Agreement. The CEI Term Loan B requires scheduled quarterly principal payments in amounts equal to 0.25% of the original aggregate principal amount of the CEI Term Loan B, with the balance payable at maturity. Borrowings under the CEI Term Loan B bear interest, paid monthly, at a rate equal to, at our option, either (a) a forward-looking term rate based on the Adjusted Term SOFR, subject to a floor of 0.50% or (b) a base rate (the “TLB Base Rate”) determined by reference to the Merger, William Hill Acquisitionhighest of (i) the “Prime Rate” in the United States, (ii) the federal funds rate plus 0.50% per annum and consolidation of Horseshoe Baltimore. In addition, we continue to improve our financial position and reduce our operating costs related to our debt through accelerated repayments, amendments to existing debt agreements and obtaining favorable rates on new borrowings which has resulted(iii) the one-month Adjusted Term SOFR plus 1.00% per annum, in andeach case, plus an applicable margin. Such applicable margin is expected to continue to provide, interest expense savings.
On September 21, 2021, CRC entered into a second amendment related to the CRC Incremental Term Loan to reduce the interest rate margins to 3.50%3.25% per annum in the case of any London Inter-bank Offered Rate (“LIBOR”)Adjusted Term SOFR loan or 2.50%and 2.25% per annum in the case of any base rate loan.TLB Base Rate loan, subject to one 0.25% step-down based on our net total leverage ratio. The CEI Term Loan B was issued at a price of 99.0% of the principal amount and will mature in February 2030.
On February 6, 2023, concurrently with the issuance of the CEI Term Loan B, we issued $2.0 billion in aggregate principal amount of 7.00% senior secured notes (the “CEI Senior Secured Notes due 2030”) pursuant to an indenture by and among the Company, the subsidiary guarantors party thereto from time to time, U.S. Bank Trust Company, National Association, as trustee, and U.S. Bank National Association, as collateral agent. The CEI Senior Secured Notes due 2030 rank equally with all existing and future first-priority lien obligations of the Company and the subsidiary guarantors. The CEI Senior Secured Notes due 2030 will mature in February 2030, with interest paid semi-annually on February 15 and August 15 of each year, commencing August 15, 2023.
The net proceeds from the CEI Term Loan B, along with the net proceeds from the issuance of the CEI Senior Secured Notes due 2030 described above, were used to repay the outstanding principal balance, including accrued and unpaid interest, of both the CRC Term Loan and the CRC Incremental Term Loan. Upon the termination of the CRC Term Loan and the CRC Incremental Term Loan, iswe recorded a LIBOR based loan of which the amendment lowers our annual interest cost by reducing the applicable margin by 100 basis points from 4.50% to 3.50%.
During the year ended December 31, 2021, the Company purchased or redeemed all $1.7 billion 5.25% senior notes due 2025 (the “CRC Notes”) and recognized a $199 million loss on the early extinguishment of debt.debt of $197 million.
DuringOn May 1, 2023, we elected to prepay the year ended December 31, 2021,outstanding $400 million Convention Center Mortgage Loan utilizing cash on hand.
On July 10, 2023, we completed the Company purchasedacquisition of the remaining 24.2% equity ownership in Horseshoe Baltimore, utilizing cash on hand, for a total of $100 million in$66 million. On July 17, 2023, we permanently repaid the outstanding principal amountbalance of the $1.8 billion 8.125% Senior Notes due 2027 (the “CEI Senior Notes”) andBaltimore Term Loan. In connection with the Companyrepayment, we recognized a $14$3 million loss on the early extinguishment of debt.
On September 24, 2021, the Company issued $1.2 billionFebruary 6, 2024, we entered into an Incremental Assumption Agreement No. 3 pursuant to which we incurred a new senior secured incremental term loan in an aggregate principal amount of 4.625% Senior Notes due 2029$2.9 billion (the “Senior Notes”“CEI Term Loan B-1”) pursuantunder the CEI Credit Agreement. The CEI Term Loan B-1 requires quarterly principal payments in amounts equal to an indenture dated as of September 24, 2021 between the Company and U.S. Bank National Association, as Trustee. The Senior Notes will mature on October 15, 2029 with interest payable on April 15 and October 15 of each year, commencing April 15, 2022. Proceeds from the issuance0.25% of the Senior Notes, as well as cash on hand, was used to repay the CRC Notes, as described above.
As a result of our increased ownership interest in Horseshoe Baltimore, we began to consolidate theoriginal aggregate principal amount of Horseshoe Baltimore’s senior secured term loan facility (the “Baltimore Term Loan”) and amounts outstanding, if any, under Horseshoe Baltimore’s senior secured revolving credit facility (the “Baltimore Revolving Credit Facility”). The Baltimorethe CEI Term Loan matures in 2024 and isB-1, with the balance payable at maturity. Borrowings under the CEI Term Loan B-1 bear interest at a rate equal to, at our option, either (a) a forward-looking term rate based on the Term SOFR, subject to a variablefloor of 0.50% or (b) a base rate (the “TLB-1 Base Rate”) determined by reference to the highest of interest calculated as LIBOR(i) the “Prime Rate” in the United States, (ii) the federal funds rate plus 4.00%.0.50% per annum and (iii) the one-month Term SOFR plus 1.00% per annum, in each case, plus an applicable margin. Such applicable margin is 2.75% per annum in the case of any Term SOFR loan and 1.75% per annum in the case of any TLB-1 Base Rate loan. The Baltimore Revolving Credit Facility has borrowing capacityCEI Term Loan B-1 was issued at a price of up to $10 million available, matures in 2022, and is subject to a variable rate of interest calculated as LIBOR plus 6.00%. As of December 31, 2021, there was $10 million of available borrowing capacity under the Baltimore Revolving Credit Facility.
On September 30, 2020, the Company announced that it had reached an agreement with William Hill PLC on the terms of a recommended cash acquisition pursuant to which the Company would acquire the entire issued and to be issued share capital (other than shares owned by the Company or held in treasury) of William Hill PLC, in an all-cash transaction. On April 22, 2021, the Company completed the acquisition of William Hill PLC for £2.9 billion, or approximately $3.9 billion.
In connection with the William Hill Acquisition, on April 22, 2021, a newly formed subsidiary99.75% of the Company (the “Bridge Facility Borrower”) entered into a Credit Agreement (the “Bridge Credit Agreement”) with certain lenders party theretoprincipal amount and Deutsche Bank AG, London Branch, as administrative agent and collateral agent, pursuant to which the lenders party thereto provided the Debt Financing (as defined below). The Bridge Credit Agreement provides for (a) a 540-day £1.0 billion asset sale bridge facility, (b) a 60-day £503 million cash confirmation bridge facility and (c) a 540-day £116 million revolving credit facility (collectively, the “Debt Financing”). The proceeds of the bridge loan facilities provided under the Bridge Credit Agreement were used (i) to pay a portion of the cash consideration for the acquisition and (ii) to pay fees and expenses related to the acquisition and related transactions. The proceeds of the revolving credit facility under the Bridge Credit Agreement may be used for working capital and general corporate purposes. The £1.5 billion Interim Facilities Agreement (the “Interim Facilities Agreement”) entered intowill mature on OctoberFebruary 6, 2020 with Deutsche Bank AG, London Branch and JPMorgan Chase Bank, N.A., and amended on December 11, 2020, was terminated upon the execution of the Bridge Credit Agreement. On May 12, 2021, we repaid the £503 million cash confirmation bridge facility. On June 14, 2021, the Company drew down the full £116 million from the revolving credit facility and the proceeds, in addition to excess Company cash, were used to make a partial repayment of the asset sale bridge facility in the amount of £700 million. Outstanding borrowings under the Bridge Credit Agreement are expected to be repaid upon the sale of William Hill International. Certain investments acquired have been excluded from the held for sale asset group. On September 8, 2021, the Company entered into an agreement to sell William Hill International to 888 Holdings Plc for approximately £2.2 billion. After repayment of the outstanding debt under the Bridge Credit Agreement, described above, the Company expects to receive approximately £835 million, or $1.2 billion, subject to any permitted leakage, which is customary for sale transactions in the UK. In order to manage the risk of changes in the GBP denominated sales price and expected proceeds, the Company has entered into foreign exchange forward contracts. The sale is subject to satisfaction of customary conditions, including receipt of the approval of shareholders of 888 Holdings Plc and regulatory approvals, and is expected to close in the second quarter of 2022.2031.
Additionally, on February 6, 2024, we issued $1.5 billion in aggregate principal amount of 6.50% senior secured notes due 2032 (the “CEI Senior Secured Notes due 2032”) pursuant to an indenture by and among the Company, the subsidiary guarantors party thereto, U.S. Bank Trust Company, National Association, as trustee, and U.S. Bank National Association, as collateral agent. The CEI Senior Secured Notes due 2032 rank equally with all existing and future first-priority lien obligations of the Company and the subsidiary guarantors. The CEI Senior Secured Notes due 2032 will mature on February 15, 2032, with interest paid semi-annually on February 15 and August 15 of each year, commencing August 15, 2024.
The net proceeds from the issuance of the CEI Senior Secured Notes due 2032 and the net proceeds from the CEI Term Loan B-1, together with borrowings under the CEI Revolving Credit Facility, were used to tender, redeem, repurchase, defease, and/or satisfy and discharge any and all of the principal amounts, including accrued and unpaid interest, related expenses and fees of both the 5.75% Senior Secured Notes due 2025 (the “CRC Senior Secured Notes”) and the 6.25% Senior Secured Notes due 2025 (the “CEI Senior Secured Notes due 2025”). As a result of these transactions, we estimate that we will incur approximately $50 million of loss on early extinguishment of debt.
We expect that our primary capital requirements going forward will relate to the expansion and maintenance of our properties, taxes, servicing our outstanding indebtedness, and rent payments under our GLPI Master Lease, the VICI Leases and other leases. We make capital expenditures and perform continuing refurbishment and maintenance at our properties to maintain our quality standards. Our capital expenditure requirements for 20222024 are expected to increase compared to prior periods as a result of increasedinclude expansion projects, the rebranding of certain properties, implementation and migration of states to our Liberty platformhotel renovations and continued investment into new markets with our Caesars Sportsbook and iGaming applications in our Caesars Digital segment. In addition, we may, from time to time, seek to repurchase or prepay our outstanding indebtedness. Any such purchases or prepayments may be funded by existing cash balances or the incurrence of debt. The amount and timing of any repurchase will be based on business and market conditions, capital availability, compliance with debt covenants and other considerations.
We have agreements with certain professional sports leagues and teams, sporting event facilities and media companies for tickets, suites, and advertising, marketing, promotional and sponsorship opportunities including communication with partner customer databases. Additionally, a selection of such partnerships provide us with exclusivity to access the aforementioned rights within the casino and/or sports betting category. As of December 31, 2023 and 2022, obligations related to these agreements were $605 million and $898 million, respectively, with contracts extending through 2040. These obligations include leasing of event suites that are generally considered short term leases for which we do not record a right of use asset or lease liability. We recognize expenses in the period services are received in accordance with the various agreements. In addition, assets or liabilities may be recorded related to the timing of payments as required by the respective agreement.
We continue to expand into new markets with projects such as our partnership with the Eastern Band of Cherokee Indians to build and develop Caesars Virginia which is estimated to open a permanent facility in late 2024. The permanent development has a budget of $650 million and is expected to include a premier destination resort casino along with a 320-room hotel and world-class casino floor including 1,300 slot machines, 85 live table games, a WSOP Poker Room, a Caesars Sportsbook, a live entertainment theater and 40,000 square feet of meeting and convention space. Additionally, we are developing Harrah’s Columbus Nebraska which is a casino development expected to feature a new one-mile horse racing surface, a 40,000-square-foot-casino and sportsbook with more than 400 slot machines and 20 table games, as well as a restaurant and retail space, with an official opening in the second quarter of 2024. In the second quarter of 2023, temporary gaming facilities for Caesars Virginia and Harrah’s Columbus Nebraska opened while the permanent facilities are being constructed.
In 2020, we funded $400 million tointo escrow as of the closing of the Merger and have begun to utilize those funds in accordance withfor a three year capital expenditure plan in the state of New Jersey. This amount is currentlyThe capital plan included in restricted cash in Other assets, net. Assignificant room renovations at both Caesars Atlantic City and Harrah’s Atlantic City, as well as the addition of new restaurants with celebrity partners. During the year ended December 31, 2021,2023, we met our restricted cash balancecommitment and exhausted the remaining funds in the escrow account was $297 million for future capital expenditures in New Jersey.account.
As a condition of the extension of the casino operating contract and ground lease for Harrah’s New Orleans, we are also required to make a capital investment of $325 million inon or around Harrah’s New Orleans by July 15, 2024. In connection with theThe capital investment in Harrah’s New Orleans, construction has begun and we are ininvolves the processrebranding of rebranding the property asto Caesars New Orleans which we expect to be complete in 2024.
On August 27, 2020, Hurricane Laura made landfall on Lake Charlesincludes a renovation and full interior and exterior redesign, an updated casino floor, new culinary experiences and a new 340-room hotel tower. The project has a current capital plan of approximately $430 million and, as a Category 4 storm. The hurricane severely damaged Lake Charles and the Company has begun to receive insurance proceeds related to, in part, estimated damages and repairs thatof December 31, 2023, total capital expenditures have been incurred to$289 million since the property. A portionproject began.
We continue to expand into new markets with projects such as Caesars Virginia, which is expected to be a $500 million premier destination resort casino. The property plans to include a 500 room hotel and casino including slot machines, table games, WSOP Room and Caesars Sportsbook. Additionally, Caesars announced the plans to expand into Nebraska with a $75 million development of a Harrah’s casino and racetrack.50
Cash spentused for capital expenditures totaled $5201.3 billion, $952 million $164 million, $171and $520 million for the years ended December 31, 2021,2023, 20202022 and 2019,2021, respectively, related to our growth, renovation, maintenance, and other capital projects. Due, in part, to constraints on the supply chain, certain projects and planned spend during 2021 are expected to be incurred during 2022. The following table summarizes our estimates for 20222024 capital expenditures:
| | (In millions) | (In millions) | Low | | High | (In millions) | Low | | High |
| Atlantic City | $ | 240 | | | $ | 260 | |
| Indiana racing operations | 5 | | | 10 | |
| Total estimated capital expenditures from restricted cash | 245 | | | 270 | |
| Growth and renovation projects | Growth and renovation projects | 605 | | | 755 | |
| Caesars Digital | Caesars Digital | 115 | | | 135 | |
| Maintenance projects | Maintenance projects | 290 | | | 340 | |
| Total estimated capital expenditures from unrestricted cash and insurance proceeds | 1,010 | | | 1,230 | |
| Total estimated capital expenditures from unrestricted cash | |
| Caesars Virginia (a) | |
Caesars Virginia (a) | |
Caesars Virginia (a) | |
| | Total | Total | $ | 1,255 | | | $ | 1,500 | |
| Total | |
| Total | |
(a)We expect the joint venture to enter into a new credit facility, of approximately $375 million to $425 million, to fund future Caesars Virginia capital expenditures alongside ongoing cash flows from the temporary casino’s operations.
A significant portion of our liquidity needs are for debt service and payments associated with our leases. Our estimated debt service (including principal and interest) is approximately $840$915 million for 20222024. We also lease certain real property assets from third parties, including VICI and GLPI. The VICI Leases are subject to annual escalations, that take effect in November of each year, based on the CPI. We estimate our lease payments to VICI and GLPI to be approximately $1.2$1.3 billion for 20222024.
On June 21, 2021, the Company delivered a notice of mandatory conversion to the trustee of the 5% Convertible Notes to convert all outstanding notes on June 24, 2021. All outstanding notes, at the election of either the Company or the holder, were subject to conversion into approximately 0.014 shares of the Company’s Common Stock (“Company Common Stock”) and approximately $1.17 of cash per $1.00 principal amount of the 5% Convertible Notes. During the year ended December 31, 2021, the Company converted the remaining outstanding aggregate principal amount of the 5% Convertible Notes, which resulted in cash payments of $367 million, net of approximately $12 million paid into our trust accounts and the issuance of approximately 5 million shares of Company Common Stock.
The CompanyWe have periodically divestsdivested assets that it does not consider core to its business to raise capital or, in someprevious cases, to comply with conditions, terms, obligations or restrictions imposed by antitrust, gaming and other regulatory entities. We have
divested of several international properties includingIf an interest in a Korea joint venture and the Caesars UK Group, which includes Emerald Resort & Casino. The sale of the Caesars UK Group closed on July 16, 2021, and the buyer assumed all liabilities associated with the Caesars UK Group. We also expect to divest of William Hill International in the second quarter of 2022, as described above.
On April 6, 2021, the Company consummated the sale of the equity interests of MontBleu for $15 million. The purchase price is due no later than the first anniversary of the consummation of the transaction.
On September 3, 2020, the Company and VICI entered into an agreement to sell the equity interests of Harrah’s Louisiana Downs to Rubico Acquisition Corp. for $22 million, subject to a customary working capital adjustment. The proceeds were split between the Company and VICI. On November 1, 2021, the sale of Harrah’s Louisiana Downs was completed. The annual base rent payments under the Regional lease between Caesars and VICI remain unchanged.
On June 3, 2021, the Company consummated the sale of the real property and equity interests of Evansville to GLPI and Bally’s Corporation, respectively, for $480 million in cash, subject to a customary working capital adjustment, resulting in a gain of $12 million.
On December 1, 2020, the Company entered into a definitive agreement to sell the operations of Baton Rouge to CQ Holding Company, Inc. The transaction has received regulatory approvals and is expected to close in the first quarter of 2022, subject to other customary closing conditions.
On December 24, 2020, the Company entered into an agreement to sell the equity interests of Caesars Southern Indiana to the EBCI for $250 million, subject to customary purchase price adjustments. On September 3, 2021, the Company completed the sale of Caesars Southern Indiana resulting in a gain of $12 million. In connection with this transaction, the Company’s annual base rent payments to VICI Properties under the Regional Master Lease were reduced by $33 million.
If the agreed upon selling price for future divestitures does not exceed the carrying value of the assets, we may be required to record additional impairment charges in future periods which may be material.
We expect that our current liquidity, cash flows from operations,including availability of borrowings under our committed credit facilitiesfacility and proceedscash flows from the announced asset salesoperations will be sufficient to fund our operations, capital requirements and service our outstanding indebtedness for the next twelve months. However, we cannot be certain that the COVID-19 public health emergency will not adversely affect our business, financial condition and results of operations or cause disruption in the financial markets that could adversely affect ability to access additional capital.
Debt and Master Lease Covenant Compliance
The Caesars Resort Collection (“CRC”)Senior Credit Agreement,Facilities, the CEI Revolving Credit Facility, the Baltimore Term Loan B, and the indentures related togoverning the CEICRC Senior Secured Notes, the CEI Senior Secured Notes due 2025, the CRCCEI Senior Secured Notes due 2030, the CEI Senior Notes due 2027, and the CEI Senior Notes due 2029 contain covenants which are standard and customary for these types of agreements. These include negative covenants, which, subject to certain exceptions and baskets, limit our ability to (among other items) incur additional indebtedness, make investments, make restricted payments, including dividends, grant liens, sell assets and make acquisitions.
The CRCFollowing the Third Amendment, the Amended CEI Revolving Credit Facility and the CEI Revolving Credit FacilityTerm Loan A include a maximum first-priority net senior securedtotal leverage ratio financial covenant of 6.35:7.25:1 which isuntil December 31, 2024 and 6.50:1 from and after December 31, 2024. In addition, the Amended CEI Revolving Credit Facility and the CEI Term Loan A include a minimum fixed charge coverage ratio financial covenant of 1.75:1 until December 31, 2024 and 2.0:1 from and after December 31, 2024. From and after the repayment of the CEI Term Loan A, the financial covenants applicable to the Amended CEI Revolving Credit Facility will be tested solely to the extent that certain testing conditions are satisfied. The Baltimore Revolving Credit Facility includes a senior secured leverage ratio financial covenant of 5.0:1. Failure to comply with such covenants could result in an acceleration of the maturity of indebtedness outstanding under the relevant debt document. As of December 31, 2023, we were not subject to any debt covenants with respect to the new CEI Term Loan B-1 or the CEI Senior Secured Notes due 2032.
The GLPI Leases and VICI Leases contain certain covenants requiring minimum capital expenditures based on a percentage of net revenues along with maintaining certain financial ratios.
The Bridge Credit Agreement associated with the planned divestiture of William Hill International, which is presented within liabilities held for sale, includes a financial covenant requiring the Bridge Facility Borrower to comply with a maximum total net leverage ratio of 10.50 to 1.00. The borrowings under the Bridge Credit Agreement are guaranteed by the Bridge Facility Borrower and the Bridge Facility Borrower’s material wholly-owned subsidiaries (subject to exceptions), and are secured by a pledge of substantially all of the existing and future property and assets of the Bridge Facility Borrower and the guarantors (subject to exceptions). Additionally, no financial covenants are related to the $943 million of debt from the two trust deeds assumed in the William Hill Acquisition, which are also held for sale.
As of December 31, 2021,2023, we were in compliance with all of the applicable financial covenants described above.
Share Repurchase Program
OnIn November 8, 2018, ourthe Board of Directors authorized a $150 million common stock repurchase program (the “Share Repurchase Program”) pursuant to which we may, from time to time, repurchase shares of common stock on the open market (either with or without a 10b5-1 plan) or through privately negotiated transactions. The Share Repurchase Program has no time limit and may be suspended or discontinued at any time without notice. There is no minimum number of shares of common stock that we are required to repurchase under the Share Repurchase Program.
As of December 31, 2021,2023, we have acquired 223,823 shares of common stock under the program at an aggregate value of $9 million and an average of $40.80 per share. No shares were repurchased during the years ended December 31, 20212023 or 2020.2022.
Debt Obligations and Leases
BaltimoreCEI Term LoanLoans and BaltimoreCEI Revolving Credit Facility
AsCEI is party to a resultcredit agreement, dated as of ourJuly 20, 2020, with JPMorgan Chase Bank, N.A., as administrative agent, U.S. Bank National Association, as collateral agent, and certain banks and other financial institutions and lenders party thereto (the “CEI Credit Agreement”), which, as amended, provides for the CEI Revolving Credit Facility in an aggregate principal amount of $2.25 billion (the “CEI Revolving Credit Facility”). The CEI Revolving Credit Facility contains reserves of $40 million which are available only for certain permitted uses.
On October 5, 2022, Caesars entered into a third amendment to the CEI Credit Agreement (the “Third Amendment”) pursuant to which we (a) incurred a senior secured term loan in an aggregate principal amount of $750 million (the “CEI Term Loan A”) as a new term loan under the credit agreement, (b) amended and extended the CEI Revolving Credit Facility under the CEI Credit Agreement (the CEI Revolving Credit Facility, as so amended, the “Amended CEI Revolving Credit Facility” and, together with the CEI Term Loan A, the “Senior Credit Facilities”), (c) increased ownership interest in Horseshoe Baltimore, we began to consolidate the aggregate principal amount of Horseshoe Baltimore’sthe CEI Revolving Credit Facility to $2.25 billion, and (d) made certain other amendments to the CEI Credit Agreement. Both the Amended CEI Revolving Credit Facility and the new CEI Term Loan A mature on January 31, 2028, subject to a springing maturity in the event certain other long-term debt of Caesars is not extended or repaid. The Amended CEI Revolving Credit Facility includes a letter of credit sub-facility of $388 million. The CEI Term Loan A requires scheduled quarterly payments in amounts equal to 1.25% of the original aggregate principal amount of the CEI Term Loan A, with the balance payable at maturity. We may make voluntary prepayments of the CEI Term Loan A at any time prior to maturity at par.
Borrowings under the Senior Credit Facilities bear interest, paid monthly, at a rate equal to, at our option, either (a) a forward-looking term rate based on Secured Overnight Financing Rate (“Term SOFR”) for the applicable interest period plus an adjustment of 0.10% per annum (“Adjusted Term SOFR”), subject to a floor of 0% or (b) a base rate (the “Base Rate”) determined by reference to the highest of (i) the rate of interest per annum last quoted by The Wall Street Journal as the “Prime Rate” in the United States, (ii) the federal funds rate plus 0.50% per annum and (iii) the one-month Adjusted Term SOFR plus 1.00% per annum, in each case, plus an applicable margin. Such applicable margin is 2.25% per annum in the case of any Adjusted Term SOFR loan and 1.25% per annum in the case of any Base Rate loan, subject to three 0.25% step-downs based on our net total leverage ratio. In addition, on a quarterly basis, we are required to pay each lender under the Amended CEI Revolving Credit Facility a commitment fee in respect of any unused commitments under the Amended CEI Revolving Credit Facility in the amount of 0.35% per annum of the principal amount of the unused commitments of such lender, subject to three 0.05% step-downs based on our net total leverage ratio.
On February 6, 2023, Caesars entered into an Incremental Assumption Agreement No. 2 pursuant to which we incurred a new senior secured term loan facility in an aggregate principal amount of $2.5 billion (the “Baltimore Term Loan”) and amount outstanding, if any, under Horseshoe Baltimore’s senior secured revolving credit facility (the “Baltimore Revolving Credit Facility”). The Baltimore“CEI Term Loan matures in 2024B” and, is subject totogether with the CEI Term Loan A, the “CEI Term Loans”) as a variable rate of interest calculated as LIBOR plus 4.00%. The Baltimore Revolving Credit Facility has borrowing capacity of up to $10 million available and matures in 2022, subject to a variable rate of interest calculated as LIBOR plus 6.00%. As of December 31, 2021, there was $10 million of available borrowing capacitynew term loan under the Baltimore RevolvingCEI Credit Facility.
CRC Term Loans and CRC Revolving Credit Facility
CRC is party to the Credit Agreement, dated as of December 22, 2017 (as amended, the “CRC Credit Agreement”), which included a $1.0 billion five-year revolving credit facility (the “CRC Revolving Credit Facility”) and an initial $4.7 billion seven-year first lien term loan (the “CRC Term Loan”), which was increased by $1.8 billion pursuant to an incremental agreement executed in connection with the Merger (the “CRC Incremental Term Loan”).
Agreement. The CRCCEI Term Loan matures in December 2024 and the CRC Incremental Term Loan matures in July 2025. The CRC Revolving Credit Facility matures in December 2022 and includes a $400 million letter of credit sub-facility. The CRC Term Loan and the CRC Incremental Term Loan requireB requires scheduled quarterly principal payments in amounts equal to 0.25% of the original aggregate principal amount of the CEI Term Loan B, with the balance duepayable at maturity. Borrowings under the CEI Term Loan B bear interest, paid monthly, at a rate equal to, at the our option, either (a) a forward-looking term rate based on the Adjusted Term SOFR, subject to a floor of 0.50% or (b) a base rate (the “TLB Base Rate”) determined by reference to the highest of (i) the “Prime Rate” in the United States, (ii) the federal funds rate plus 0.50% per annum and (iii) the one-month Adjusted Term SOFR plus 1.00% per annum, in each case, plus an applicable margin. Such applicable margin is 3.25% per annum in the case of any Adjusted Term SOFR loan and 2.25% per annum in the case of any TLB Base Rate loan, subject to one 0.25% step-down based on our net total leverage ratio. The CEI Term Loan B was issued at a price of 99.0% of the principal amount and will mature in February 2030.
The net proceeds from the CEI Term Loan B, along with the net proceeds from the issuance of the CEI Senior Secured Notes due 2030 described below, were used to repay the outstanding principal balance, including accrued and unpaid interest, of both the CRC Term Loan and the CRC Incremental Term Loan.
During the year ended December 31, 2023, we utilized and fully repaid the CEI Revolving Credit Facility. Such activity is presented in the financing section in the Statements of Cash Flows. As of December 31, 2023, we had $2.1 billion of available borrowing capacity under the CEI Revolving Credit Facility, after consideration of $70 million in outstanding letters of credit, $46 million committed for regulatory purposes and the reserves described above.
Subsequent Amendment to the CEI Credit Agreement and issuance of New Senior Secured Notes
On February 6, 2024, we entered into an Incremental Assumption Agreement No. 3 pursuant to which we incurred a new senior secured incremental term loan in an aggregate principal amount of $2.9 billion (the “CEI Term Loan B-1”) under the CEI Credit Agreement. The CEI Term Loan B-1 requires quarterly principal payments in amounts equal to 0.25% of the original aggregate principal amount of the CEI Term Loan B-1, with the balance payable at maturity. Borrowings under the CEI Term Loan B-1 bear interest at a rate equal to, at our option, either (a) a forward-looking term rate based on the Term SOFR, subject to a floor of 0.50% or (b) a base rate (the “TLB-1 Base Rate”) determined by reference to the highest of (i) the “Prime Rate” in the United States, (ii) the federal funds rate plus 0.50% per annum and (iii) the one-month Term SOFR plus 1.00% per annum, in each case, plus an applicable margin. Such applicable margin is 2.75% per annum in the case of any Term SOFR loan and 1.75% per annum in the case of any TLB-1 Base Rate loan. The CEI Term Loan B-1 was issued at a price of 99.75% of the principal amount and will mature on February 6, 2031.
Additionally, on February 6, 2024, we issued $1.5 billion in aggregate principal amount of 6.50% of senior secured notes due 2032 (the “CEI Senior Secured Notes due 2032”) pursuant to an indenture by and among the Company, the subsidiary guarantors party thereto, U.S. Bank Trust Company, National Association, as trustee, and U.S. Bank National Association, as collateral agent. The CEI Senior Secured Notes due 2032 rank equally with all existing and future first-priority lien obligations of the Company and the subsidiary guarantors. The CEI Senior Secured Notes due 2032 will mature on February 15, 2032, with interest paid semi-annually on February 15 and August 15 of each year, commencing August 15, 2024.
The net proceeds from the issuance of the CEI Senior Secured Notes due 2032 and the net proceeds from the CEI Term Loan B-1, together with borrowings under the CEI Revolving Credit Facility, were used to tender, redeem, repurchase, defease, and/or satisfy and discharge any and all of the principal amounts, including accrued and unpaid interest, related expenses and fees of both the 5.75% Senior Secured Notes due 2025 (the “CRC Senior Secured Notes”) and the 6.25% Senior Secured Notes due 2025 (the “CEI Senior Secured Notes due 2025”). As a result of these transactions, we estimate that it will incur approximately $50 million of loss on early extinguishment of debt.
CRC Senior Secured Notes due 2025
On July 6, 2020, Colt Merger Sub, Inc. (the “Escrow Issuer”) issued $1.0 billion in aggregate principal amount of the CRC Senior Secured Notes pursuant to an indenture, dated July 6, 2020, by and among the Escrow Issuer, U.S. Bank National Association, as trustee and Credit Suisse AG, Cayman Islands Branch, as collateral agent. The CRC Senior Secured Notes ranked equally with all existing and future first priority lien obligations of CRC, CRC Finco, Inc. and the subsidiary guarantors. The CRC Senior Secured Notes were set to mature on July 1, 2025 with interest payable semi-annually in cash in arrears on January 1 and July 1 of each year.
On February 16, 2024, we completed the tender and/or redemption of the CRC Senior Secured Notes with proceeds from a new CEI Term Loan B-1, new CEI Senior Secured Notes due 2032, and borrowings under the CEI Revolving Credit Facility, as needed. See “Subsequent Amendment to the CEI Credit Agreement also includes customary voluntary and mandatory prepayment provisions,issuance of New Senior Secured Notes” above.
CEI Senior Secured Notes due 2025
On July 6, 2020, the Escrow Issuer issued $3.4 billion in aggregate principal amount of the CEI Senior Secured Notes due 2025 pursuant to an indenture, dated July 6, 2020, by and among the Escrow Issuer, U.S. Bank National Association, as trustee, and U.S. Bank National Association, as collateral agent. The CEI Senior Secured Notes due 2025 ranked equally with all existing and future first-priority lien obligations of the Company and the subsidiary guarantors. The CEI Senior Secured Notes due 2025 were set to mature on July 1, 2025 with interest payable semi-annually in cash in arrears on January 1 and July 1 of each year. On April 5, 2023, we purchased $1 million in principal amount of the CEI Senior Secured Notes due 2025.
On February 7, 2024, we completed the tender, redemption, and/or satisfaction and discharge of the CEI Senior Secured Notes due 2025 with proceeds from a new CEI Term Loan B-1, new CEI Senior Secured Notes due 2032, and borrowings under the CEI Revolving Credit Facility, as needed. See “Subsequent Amendment to the CEI Credit Agreement and issuance of New Senior Secured Notes” above.
CEI Senior Secured Notes due 2030
On February 6, 2023, concurrently with the issuance of the CEI Term Loan B, we issued $2.0 billion in aggregate principal amount of 7.00% senior secured notes (the “CEI Senior Secured Notes due 2030”) pursuant to an indenture by and among the Company, the subsidiary guarantors party thereto from time to time, U.S. Bank Trust Company, National Association, as trustee, and U.S. Bank National Association, as collateral agent. The CEI Senior Secured Notes due 2030 rank equally with all existing and future first-priority lien obligations of the Company and the subsidiary guarantors. The CEI Senior Secured Notes due 2030 will mature in February 2030, with interest paid semi-annually on February 15 and August 15 of each year, commencing August 15, 2023.
Baltimore Term Loan and Baltimore Revolving Credit Facility
On July 17, 2023, following the acquisition of the remaining 24.2% equity interest in Horseshoe Baltimore, we permanently repaid the outstanding principal balance of Horseshoe Baltimore’s senior secured term loan facility (the “Baltimore Term Loan”). In connection with the repayment, we recognized a $3 million loss on the early extinguishment of debt. The Baltimore Term Loan was subject to certain exceptions.a variable rate of interest calculated as London Interbank Offered Rate (“LIBOR”) plus 4.00% until May 1, 2023, when the Baltimore Term Loan’s benchmark interest rate was amended from LIBOR to the Adjusted Term SOFR plus an applicable adjustment. In addition, Horseshoe Baltimore’s senior secured revolving credit facility (the “Baltimore Revolving Credit Facility”) matured on July 7, 2023. The Baltimore Revolving Credit Facility had borrowing capacity of up to $10 million, subject to a variable rate of interest calculated as Term SOFR plus 4.00%.
Convention Center Mortgage Loan
On September 18, 2020, we entered into a loan agreement with VICI, to borrow a 5-year, $400 million Forum Convention Center mortgage loan (the “Mortgage Loan”). The Mortgage Loan bears interest at a rate of, initially, 7.7% per annum, which was set to escalate annually on the anniversary of the closing date up to a maximum interest rate of 8.3% per annum. On May 1, 2023, we elected to prepay the outstanding $400 million Mortgage Loan utilizing cash on hand. In connection with the repayment, we extended VICI’s call right relating to the CAESARS FORUM convention center from December 31, 2026 to December 31, 2028.
CRC Term Loan and CRC Incremental Term Loan
Caesars Resort Collection (“CRC”) was party to a credit agreement, dated as of December 22, 2017 (as amended, the “CRC Credit Agreement”), which provided for, among other things, an initial $4.7 billion seven-year senior secured term loan (the “CRC Term Loan”), and an incremental $1.8 billion five-year senior secured term loan (the “CRC Incremental Term Loan”).
The CRC Term Loan and the CRC Incremental Term Loan were subject to the terms described below prior to repayment. We repaid the $3.4 billion outstanding principal amount of the CRC Term Loan and the $1.0 billion outstanding principal amount of the CRC Incremental Term Loan on February 6, 2023, with proceeds from a new CEI Term Loan B and new CEI Senior Secured Notes due 2030, both of which are described above. Upon the termination of the CRC Term Loan and the CRC Incremental Term Loan, we recorded a loss on extinguishment of debt of $197 million.
Borrowings under the CRC Credit Agreement bearwere subject to interest at a rate equal to either (a) LIBOR adjusted for certain additional costs, subject to a floor of 0% or (b) a base rate determined by reference to the highest of (i) the federal funds rate plus 0.50%, (ii) the prime rate as determined by Credit Suisse AG, Cayman Islands Branch, as administrative agent under the CRC Credit Agreement and (iii) the one-month adjusted LIBOR rate plus 1.00%, in each case plus an applicable margin. Such applicable margin shall bewas (a) with respect to the CRC Term Loan, 2.75% per annum in the case of any LIBOR loan or 1.75% per annum in the case of any base rate loan and (b) with respect to the CRC Incremental Term Loan, 4.50% per annum in the case of any LIBOR loan or 3.50% in the case of any base rate loan and (c) in the case of the CRC Revolving Credit Facility, 2.25% per annum in the case of any LIBOR loan and 1.25% per annum in the case of any base rate loan, subject in the case of the CRC Revolving Credit Facility to two 0.125% step-downs based on CRC’s senior secured leverage ratio (“SSLR”), the ratio of first lien senior secured net debt to adjusted earnings before interest, taxes, depreciation and amortization. The CRC Revolving Credit Facility is subject to a financial covenant discussed below. On September 21, 2021, CRC entered into a second amendment related to the CRC Incremental Term Loan to reduce the interest rate margins to 3.50% per annum in the case of any LIBOR loan or 2.50% per annum in the case of any base rate loan. The CRC Term Loan and the CRC Incremental Term Loan are LIBOR based loans as of December 31, 2021.
In addition, CRC is required to pay a commitment fee in respect of any commitments under the CRC Revolving Credit Facility in the amount of 0.50% of the principal amount of the commitments, subject to step-downs to 0.375% and 0.25% based upon CRC’s SSLR. CRC is also required to pay customary agency fees as well as letter of credit participation fees computed at a rate per annum equal to the applicable margin for LIBOR borrowings on the dollar equivalent of the daily stated amount of outstanding letters of credit, plus such letter of credit issuer’s customary documentary and processing fees and charges and a fronting fee in an amount equal to 0.125% of the daily stated amount of such letter of credit.
We had $956 million of available borrowing capacity, after consideration of $69 million in outstanding letters of credit under the CRC Revolving Credit Facility, as of December 31, 2021.
CEI Revolving Credit Facility
On July 20, 2020, we entered into a new credit agreement with JPMorgan Chase Bank, N.A., as administrative agent, U.S. Bank National Association, as collateral agent, and certain banks and other financial institutions and lenders party thereto, as well as an incremental amendment thereto, which provide for a five-year CEI Revolving Credit Facility for an aggregate principal amount of $1.2 billion (the “CEI Revolving Credit Facility”). On November 10, 2021, we amended the CEI Revolving Credit Facility to establish reserves in the total amount of $190 million which are available only for permitted use. The CEI Revolving Credit Facility matures in July 2025 and includes a letter of credit sub-facility of $250 million.
The interest rate per annum applicable under the CEI Revolving Credit Facility, at the Company’s option is either (a) LIBOR adjusted for certain additional costs, subject to a floor of 0% or (b) a base rate determined by reference to the highest of (i) the federal funds rate plus 0.50%, (ii) the prime rate as determined by JPMorgan Chase Bank, N.A. and (iii) the one-month adjusted LIBOR rate plus 1.00%, in each case plus an applicable margin. Such applicable margin shall be 3.25% per annum in the case of any LIBOR loan and 2.25% per annum in the case of any base rate loan, subject to three 0.25% step-downs based on the Company’s total leverage ratio.
Additionally, we are required to pay a commitment fee in respect of any unused commitments under the CEI Revolving Credit Facility in the amount of 0.50% of principal amount of the commitments of all lenders, subject to a step-down to 0.375% based upon the Company’s total leverage ratio. We are also required to pay customary agency fees as well as letter of credit participation fees computed at a rate per annum equal to the applicable margin for LIBOR borrowings on the dollar equivalent of the daily stated amount of outstanding letters of credit, plus such letter of credit issuer’s customary documentary and processing fees and charges and a fronting fee in an amount equal to 0.125% of the daily stated amount of such letter of credit.
We had $924 million of available borrowing capacity under the CEI Revolving Credit Facility, after consideration of $23 million in outstanding letters of credit, $48 million committed for regulatory purposes and the reserves described above, as of December 31, 2021.
CEI Senior Secured Notes due 2025
On July 6, 2020, the Escrow Issuer issued $3.4 billion in aggregate principal amount of 6.25% Senior Secured Notes due 2025 pursuant to an indenture dated July 6, 2020 (the “CEI Senior Secured Notes”), by and among the Escrow Issuer, U.S. Bank National Association, as trustee, and U.S. Bank National Association, as collateral agent. The Company assumed the rights and obligations under the CEI Senior Secured Notes and the indenture governing such notes on July 20, 2020. The CEI Senior Secured Notes will mature on July 1, 2025 with interest payable semi-annually in cash in arrears on January 1 and July 1 of each year.
CEI Senior Notes due 2027
On July 6, 2020, the Escrow Issuer issued $1.8 billion in aggregate principal amount of 8.125% Senior Notes due 2027 pursuant to an indenture, dated July 6, 2020 (the “CEI Senior Notes”Notes due 2027”), by and between the Escrow Issuer and U.S. Bank National Association, as trustee. We assumed the rights and obligations under theThe CEI Senior Notes due 2027 rank equally with all existing and future senior unsecured indebtedness of the Company and the indenture governing thesubsidiary guarantors. The CEI Senior Notes on July 20, 2020. The CEI Secured Notesdue 2027 will mature on July 1, 2027 with interest payable semi-annually in cash in arrears on January 1 and July 1 of each year. In September 2021, the Company began to repurchase CEI Senior Notes on the open market and, as of December 31, 2021, a total of $100 million in principal amount of CEI Senior Notes was purchased and the Company recognized a $14 million loss on the early extinguishment of debt.
CRC Senior Secured Notes due 2025
On July 6, 2020, the Escrow Issuer issued $1.0 billion in aggregate principal amount of 5.75% Senior Notes due 2025 pursuant to an indenture, dated July 6, 2020 (the “CRC Senior Secured Notes”), by and among the Escrow Issuer, U.S. Bank National Association, as trustee and Credit Suisse AG, Cayman Islands Branch, as collateral agent. In connection with the consummation of the Merger, CRC assumed the rights and obligations under the CRC Senior Secured Notes and the indenture governing such notes. The CRC Senior Secured Notes will mature on July 1, 2025 with interest payable semi-annually in cash in arrears on January 1 and July 1 of each year.
5% Convertible Notes
On October 6, 2017, Former Caesars issued $1.1 billion aggregate principal amount of 5.00% convertible senior notes maturing in 2024 (the “5% Convertible Notes”).
The 5% Convertible Notes were convertible into approximately 0.014 shares of the Company’s Common Stock (“Company Common Stock”) and approximately $1.17 of cash per $1.00 principal amount of the 5% Convertible Notes. During the year
ended December 31, 2021, the Company converted the remaining outstanding aggregate principal amount of the 5% Convertible Notes, which resulted in cash payments of $367 million, net of approximately $12 million paid into our trust accounts and the issuance of approximately 5 million shares of Company Common Stock. The fair value of the shares contributed to, and held in, the trust was $14 million, which is included within Treasury stock. The Company recognized a loss on the change in fair value of the derivative liability of $16 million recorded in Other income (loss) and a $23 million loss on extinguishment of debt, related to the unamortized discount, on the Statement of Operations.
CRC Notes
On October 16, 2017, CRC issued $1.7 billion aggregate principal amount of 5.25% senior notes due 2025 (the “CRC Notes”). During the year ended December 31, 2021, the Company purchased or redeemed all $1.7 billion of the CRC Notes and recognized a $199 million loss on the early extinguishment of debt.
CEI Senior Notes due 2029
On September 24, 2021, the Companywe issued $1.2 billion in aggregate principal amount of 4.625% Senior Notes due 2029 (the “Senior Notes”“CEI Senior Notes due 2029”) pursuant to an indenture dated as of September 24, 2021 between the Companyus and U.S. Bank National Association, as Trustee.trustee. The CEI Senior Notes due 2029 rank equally with all existing and future senior unsecured indebtedness of the Company and the subsidiary guarantors. The CEI Senior Notes due 2029 will mature on October 15, 2029 with interest payable on April 15 and October 15 of each year, commencing April 15, 2022. Proceeds from the issuance of the Senior Notes, as well as cash on hand, was used to repay the CRC Notes, as described above.
Convention Center Mortgage Loan
On September 18, 2020, we entered into a loan agreement with VICI to borrow a five-year, $400 million Forum Convention Center mortgage loan (the “Mortgage Loan”). The Mortgage Loan bears interest at a rate of, initially, 7.7% per annum, which escalates annually to a maximum interest rate of 8.3% per annum. Beginning October 1, 2021, the Mortgage Loan is subject to an interest rate of 7.854% for the next twelve months.year.
VICI Leases
CEI leases certain real property assets from VICI under the following agreements: (i) for a portfolio of properties located throughout the United States (the “Regional Lease”), (ii) for Caesars Palace Las Vegas and Harrah’s Las Vegas (the “Las Vegas Lease”), and (iii) for Harrah’s Joliet Hotel & Casino (the “Joliet Lease”)., collectively, VICI Leases. The lease agreements, inclusive of all amendments, include (i) a 15-year initial term with four five-year renewal options, (ii) initial annual fixed rent payments of $1.1 billion, subject to annual escalation provisions based on the CPI and a 2% floor commencingwhich commenced in lease year two of the initial termterms and (iii) a variable element based on net revenues of the underlying leased properties, commencing in lease year eight of the initial term.
The Regional Lease includes a put-call optionPut-Call Right Agreement whereby the Companywe may require VICI to purchase and lease back (as lessor) or whereby VICI may require the Companyus to sell to VICI and lease back (as lessee) the real estate components of the gaming and racetrack facilities of Harrah’s Hoosier Park Racing & Casino and Indiana Grand (“CentaurHorseshoe Indianapolis (the “Centaur properties”). Election to exercise the option by either party must be made during the election period beginning January 1, 2022 and ending December 31, 2024. Upon either party exercising their option, the Centaur properties would be sold at a price in accordance with the agreement and leased back to CEI in accordance to the pre-existing terms and conditions of the Regional Lease.Put-Call Right Agreement.
The sale of Caesars Southern Indiana to EBCI for $250 million was finalized on September 3, 2021 and as a result of the sale, Caesars’ annual payments to VICI Properties under the Regional Lease decreased by $33 million and variable rent under the lease shall exclude net revenue attributable to Caesars Southern Indiana.
Our VICI Leases are accounted for as a financing obligation and totaled $11.1$11.4 billion as of December 31, 2021.2023. See Note 10 to our Financial Statements for additional information about our VICI Leases and related matters. GLPI Leases
The GLPI Master Lease, encompassing a portfolio of properties within the United States, provides for the lease of land, buildings, structures and other improvements on the land, (including barges and riverboats), easements and similar appurtenances to the land and improvements relating to the operation of the leased properties. The GLPI Master Lease, inclusive of all amendments, provides for (i) an initial term of 20 years (through September 2038), with four five-year renewals at the Company’sour option, (ii) annual land and building base rent of $24 million and $63 million, respectively, (iii) escalating provisions of building base rent equal to 101.25% of the rent for the preceding year for lease years five and six, 101.75% for lease years seven and eight and 102% for each lease year thereafter and (iv) relief from the operating, capital expenditure and financial covenants in the event of involuntary closures. The GLPI Master Lease does not provide us with an option to purchase the leased property or the ability to terminate its obligations under the GLPI Master Lease prior to its expiration without GLPI’s consent.
the equity interests of Baton Rouge. On November 13, 2023, a third amendment to the GLPI Master Lease was entered into as a result of the sale and removal of Baton Rouge from the properties included under the GLPI Master Lease.The Lumière Lease was entered into by the Companyus and GLPI, whereby the Companywe sold the real estate underlying Horseshoe St. Louis, formerly known as Lumière, to GLPI and leased back the property under a long-term financing obligation. The Lumière Lease, inclusive of all amendments, provides for (i) an initial term commencing on September 29, 2020 and ending on October 31, 2033, (ii) four five-year renewal options, (iii) annual rent payments of $23 million, (iv) escalation provisions commencing in lease year two equal to 101.25% of the rent for the preceding year for lease years two through five, 101.75% for lease years six and seven and 102% for each lease year thereafter, (v) maintaining a minimum of 1.20:1 adjusted revenue to rent ratio and (vi) certain relief under the financial covenant in the event of involuntary closures.
The GLPI Leases are accounted for as financing obligations and totaled $1.2$1.3 billion as of December 31, 2021.2023. See Note 10 to our Financial Statements for additional information about our GLPI Leases and related matters. Other Liquidity Matters
We are faced with certain contingencies, from time to time, involving litigation, claims, assessments, environmental remediation or compliance. These commitments and contingencies are discussed in greater detail in “Part I, Item 3. Legal Proceedings” and Note 11 to our Financial Statements, both of which are included elsewhere in this Annual Report on Form 10-K. In addition, new competition among retail and online operations may have a material adverse effect on our revenues and could have a similar adverse effect on our liquidity. See “Part I, Item 1A. Risk Factors—Risks Related to Our Business” which is included elsewhere in this Annual Report on Form 10-K.
Critical Accounting Policies and Estimates
We prepare our financial statements in conformity with GAAP. In preparing our financial statements, we have made our best estimates and judgments of the amounts and disclosures included in the financial statements, giving regard to materiality. When more than one accounting principle, or method of its application, is generally accepted, we select the principle or method that we consider to be the most appropriate under specific circumstances. Application of these accounting principles requires us to make estimates about the future resolution of existing uncertainties. Certain of our accounting policies, including those in connection with business combinations, certain fair value measurements, income taxes, long-lived assets, goodwill and indefinite lived intangible assets, long-lived assets, allowance for doubtful accounts related to certain gaming receivables, self-insurance reserves, and litigation, claims and assessments require that we apply significant judgment in defining the appropriate assumptions for calculating financial estimates.
We consider accounting estimates to be critical accounting policies when:
•the estimates involve matters that are highly uncertain at the time the accounting estimate is made; and
•different estimates or changes to estimates could have a material impact on the reported financial position, changes in financial position, or results of operations.
By their nature, these judgments and estimates are subject to an inherent degree of uncertainty. Our judgments and estimates are based on our historical experience, terms of existing contracts, observance of trends in the industry, information gathered from customer behavior, and information available from other outside sources, as appropriate. Due to the inherent uncertainty involving judgments and estimates, actual results may differ from those estimates.
Our most critical accounting estimates and assumptions are in the following areas:
Business Combinations
We applied the provisions of Accounting Standards Codification (“ASC”) Topic 805, “Business Combinations,” in the accounting for our acquisitions of Former Caesars, William Hill PLC, and our additional interest in Horseshoe Baltimore. It required us to recognize the assets acquired and the liabilities assumed at their acquisition date fair values, which were determined using market, income, and cost approaches, or a combination. Goodwill as of the respective acquisition dates was measured as the excess of consideration transferred over the net of the acquisition date fair values of the assets acquired and the liabilities assumed. Goodwill is generally the result of expected synergies of the combined company or an assembled workforce.
Indefinite-lived intangible assets acquired primarily include trademarks, Caesars Rewards acquired in the Merger, customer relationships and gaming rights. The fair value for these intangible assets was determined using either the relief from royalty method and excess earnings method under the income approach or a replacement cost market approach.
Acquired trademarks, developed technology and Caesars Rewards were valued using the relief from royalty method, which presumes that without ownership of such trademarks, technology, or loyalty program, we would have to make a stream of
payments to a third party in return for the right to use their name, technology, or program. By virtue of this asset, we avoid any such payments and record the related intangible value of the Company’s ownership of the brand name, technology, or program.
Customer relationships were valued using the cost approach and the incremental cash flow method under the income approach. The incremental cash flow method compares the prospective cash flows with and without the customer relationships in place to estimate the fair value of the customer relationships, with the fair value assumed to be equal to the discounted cash flows of the business that would be lost if the customer relationships were not in place and needed to be replaced.
Gaming rights include our gaming licenses in various jurisdictions and may have indefinite lives or an estimated useful life. The fair value of the gaming rights was determined using the excess earnings or replacement cost methodology, based on whether the license resides in gaming jurisdictions where competition is limited to a specified number of licensed gaming operators. The excess earnings methodology is an income approach that estimates the projected cash flows of the business attributable to the gaming license intangible asset, which is net of charges for the use of other identifiable assets of the business including working capital, fixed assets and other intangible assets. The replacement cost of the gaming license was used as an indicator of fair value.
Trade receivables and payables and other current and noncurrent assets and liabilities were valued at the existing carrying values as they represented the estimated fair value of those items at the acquisition date. Assets and liabilities held for sale are recorded at fair value, less costs to sell, based on the agreements reached as of the acquisition date, or an income approach.
The fair value of the financing obligations were calculated as the net present value of both the fixed base rent payments and the forecasted variable payments plus the expected residual value of the land and building returned at the end of the expected usage period.
Reacquired rights were valued using the excess earnings method that reflects the present value of the future profit William Hill expected to earn over the remaining term of the contract, adjusted for returns of other assets that contribute to the generation of this profit, such as working capital, fixed assets and other intangible assets. The forecasted profit used within the valuation was adjusted for the settlement of the preexisting relationship as a component of the purchase consideration.
Fair value of land was determined using the sales comparable approach. The market data is then adjusted for any significant differences, to the extent known, between the identified comparable sites and the site being valued. The value of building and site improvements was estimated via the income approach. Other personal property assets such as furniture, gaming and computer equipment, fixtures, computer software, and restaurant equipment were valued using the cost approach which is based on replacement or reproduction costs of the asset. The cost approach is an estimation of fair value developed by computing the current cost of replacing a property and subtracting any depreciation resulting from one or more of the following factors: physical deterioration, functional obsolescence, and/or economic obsolescence.
Assets and liabilities which are designated as held for sale on an acquisition date are also measured at fair value, utilizing similar market, income and cost approaches described above, based on the underlying asset class held for sale.
Cash flow estimates are significant to many valuations described above and may include forecasts with assumptions regarding factors such as recent and budgeted operating performance, future growth rates, and the determination of appropriate discount rates to estimate fair value. These inputs involve significant assumptions including the future effects of COVID-19 as well as the realization of synergies anticipated from a business combination, which may not be realized as projected. Certain assumptions, such as the effects of COVID-19, may be beyond our control.
Fair Value Measurements
We use interest rate swaps, which are derivative instruments classified as hedging transactions, to limit our exposure to interest rate risk. Derivative instruments are recognized in the financial statements at fair value. The estimated fair values of our derivative instruments are based on market prices obtained from dealer quotes. Such quotes represent the estimated amounts we would receive or pay to terminate the contracts. Our derivative instruments contain a credit risk that the counterparties may be unable to meet the terms of the agreements. We minimize that risk by evaluating the creditworthiness of our counterparties, which are limited to major banks and financial institutions. The fair values of our derivative instruments are adjusted for the credit rating of the counterparty, if the derivative is an asset, or adjusted for the credit rating of the Company, if the derivative is a liability.
See Note 8 for more details regarding fair value measurements and Item 7A for quantitative and qualitative disclosures about market risk.
Income Taxes
We and our subsidiaries file income tax returns with federal, state and foreign jurisdictions. Our income tax returns are subject to examination by the Internal Revenue Service (“IRS”) and other tax authorities. Positions taken in tax returns are sometimes subject to uncertainty in the tax laws and may not ultimately be accepted by the IRS or other tax authorities. See Note 17 in the accompanying consolidated financial statements for a discussion of the status and impact of examinations by tax authorities. We record income taxes under the asset and liability method, whereby deferred tax assets and liabilities are recognized based on the expected future tax consequences of temporary differences between the financial statement carrying amounts of existing assets and liabilities and their respective tax bases, and as attributable to operating loss and tax credit carryforwards. We reduce the carrying amounts of deferred tax assets by a valuation allowance if, based on the available evidence, it is more likely than not that such assets will not be realized. Accordingly,Management assesses the need to establish valuation allowances for deferred tax assets is assessed periodically based on the “more likely than not” realization threshold. This assessment considers, among other matters, the nature, frequency, and severity of current and cumulative losses, forecasts of future profitability, the duration of statutory carryforward periods, our experience with operating loss and tax credit carryforwards not expiring unused, and tax planning alternatives.
When there is a recent history of operating lossesavailable positive and negative normalized earnings and a returnevidence to operating profitability has not yet been demonstrated, we cannot rely on projections ofestimate if sufficient future taxable earnings for purposes of assessing recoverability of ourincome will be generated to use existing deferred tax assets. In such cases,During the second quarter of 2023, we use systematic and logical methods to estimate when deferred tax liabilities will reverse and generateevaluated our forecasted adjusted taxable income and whenobjectively verifiable evidence and placed substantial weight on our 2022 and 2023 quarterly earnings, adjusted for non-recurring items, including the interest expense disallowed under current tax law. Accordingly, we determined it was more likely than not that a portion of the federal and state deferred tax assets will reversebe realized and, generateas a result, during the second quarter of 2023, we reversed the valuation allowance related to these deferred tax deductions. Our most significantassets and recorded an income tax benefit of $940 million. We are still carrying a valuation allowance on certain federal and state deferred tax assets that are not more likely than not to be realized in the future. We have assessed the changes to the valuation allowance, including realization of the disallowed interest expense deferred tax asset, relates tousing the failed sale-leaseback obligation with VICIintegrated approach.
As of December 31, 2023, the Company had federal and GLPI (see Note 10). The reversalstate net operating loss carryforwards of this deferred$872 million and $9.0 billion, respectively, and federal general business tax asset requires judgmentcredit and estimates and has a material impactresearch tax credit carryforwards of $145 million, which will expire on the determination of the amount of valuation allowance required.various dates as follows:
| | | | | | | | | | | | | | | | | |
| Year of Expiration | Net Operating Losses | | Tax Credits |
| (In millions) | Federal | | States | | Federal |
| 2024-2028 | $ | — | | | $ | 604 | | | $ | 8 | |
| 2029-2033 | 238 | | | 1,590 | | | 39 | |
| 2034-2043 | 168 | | | 4,560 | | | 98 | |
| Do not expire | 466 | | | 2,279 | | | — | |
| $ | 872 | | | $ | 9,033 | | | $ | 145 | |
Under the applicable accounting standards, we may recognize the tax benefit from an uncertain tax position only if it is more-likely-than-notmore likely than not that the tax position will be sustained on examination by the taxing authorities based on the technical merits of the position. The tax benefits recognized in the financial statements from such a position should be measured based on the largest benefit that has a greater than 50% likelihood of being realized upon ultimate settlement. The accounting standards also
provide guidance on de-recognition, classification, interest and penalties on income taxes, accounting in interim periods and disclosure requirements for uncertain tax positions.
Goodwill and Other Indefinite-lived Intangible Assets
Assessing goodwill and indefinite-lived intangible assets for impairment is a process that requires significant judgment and involves detailed qualitative and quantitative business-specific analysis and many individual assumptions which fluctuate between assessments.
We determine the estimated fair value of each reporting unit based on a combination of EBITDA, valuation multiples, and estimated future cash flows discounted at rates commensurate with the capital structure and cost of capital of comparable market participants, giving appropriate consideration to the prevailing borrowing rates within the casino industry in general. We also evaluate the aggregate fair value of all of our reporting units and other non-operating assets in comparison to our aggregate debt and equity market capitalization at the test date. EBITDA multiples and discounted cash flows are common measures used to value businesses in our industry.
We determine the fair value of our indefinite-lived intangible assets using either the relief from royalty method or the excess earnings method under the income approach or replacement cost market approach. The determination of fair value of our reporting units and indefinite-lived intangible assets requires management to make significant assumptions and estimates around the forecasts as well as the selection of discount rates and valuation multiples. Changes in these estimates could have a significant impact on the fair value of our reporting units, intangible assets and result in potential impairment.
Forecasts and the determination of appropriate discount rates and valuation multiples used to determine the fair value of our reporting units and indefinite-lived intangible assets involves significant assumptions and estimates. Assumptions include those used to assess effects of changes in the competitive environment, capital projects and new developments which may not be realized at the projected rate.
We completed our annual impairment tests as of October 1, 2023. The estimated fair values of certain of our indefinite lived intangible assets and reporting units decreased primarily due to a decrease in projected future cash flows at certain regional properties due to increased competition. Accordingly, we identified one reporting unit with which the estimated fair value of the associated gaming rights was less than the carrying value and recorded an impairment of $81 million. In addition, we identified one reporting unit where the estimated fair value of the respective reporting unit was below the carrying value and recorded a total impairment of $14 million to goodwill. These reporting units are within the Regional segment.
As of October 1, 2023, three reporting units in the Regional segment with goodwill totaling $1.1 billion had fair values that did not significantly exceed their respective carrying values. In addition, we identified a trademark totaling $114 million in the Las Vegas segment and a gaming right totaling $91 million in the Regional segment that do not significantly exceed their respective carrying values. The reporting units and indefinite lived intangible assets with carrying values that do not significantly exceed their estimated fair values are primarily assets acquired in the Merger when our discount rate was approximately 9.5%. The discount rate used in our annual impairment testing as of October 1, 2023 was approximately 10.5%. To the extent gaming volumes deteriorate in the near future, discount rates increase significantly, or we do not meet our projected performance, we may recognize further impairments, and such impairments could be material. The discount rate represents the most sensitive input in our estimates and an increase of 1% to the discount rate would result in impairments of approximately $40 million on the assets that do not significantly exceed their carrying values. In addition, $1.0 billion of goodwill within our Regional segment is associated with reporting units with zero or negative carrying values. See Note 7 for additional information. Long-Lived Assets
We have significant capital invested in our long-lived assets, and judgments are made in determining the estimated useful lives of assets, salvage values to be assigned to assets, and if or when an asset has been impaired. The accuracy of these estimates affects the amount of depreciation and amortization expense recognized in our financial results and whether we have a gain or loss on the disposal of an asset. We assign lives to our assets based on our standard policy, which is established by management as representative of the useful life of each category of asset. We review the carrying value of our long-lived assets whenever events and circumstances indicate that the carrying value of an asset may not be recoverable from the estimated future cash flows expected to result from its use and eventual disposition. The factors considered by management in performing this assessment include current operating results, trends and prospects, planned construction and renovation projects, as well as the effect of obsolescence, demand, competition, and other economic, legal, and regulatory factors. In estimating expected future cash flows for determining whether an asset is impaired, assets are grouped at the lowest level of identifiable cash flows, which, for most of our assets, is the individual property. See Note 6 for additional information. Goodwill and Other Indefinite-lived Intangible Assets
Assessing goodwill and indefinite-lived intangible assets for impairment is a process that requires significant judgment and involves detailed qualitative and quantitative business-specific analysis and many individual assumptions which fluctuate between assessments.
We determine the estimated fair value of each reporting unit based on a combination of EBITDA, valuation multiples, and estimated future cash flows discounted at rates commensurate with the capital structure and cost of capital of comparable market participants, giving appropriate consideration to the prevailing borrowing rates within the casino industry in general. We also evaluate the aggregate fair value of all of our reporting units and other non-operating assets in comparison to our aggregate debt and equity market capitalization at the test date. EBITDA multiples and discounted cash flows are common measures used to value businesses in our industry.
We determine the fair value of our indefinite-lived intangible assets using either the relief from royalty method or the excess earnings method under the income approach or replacement cost market approach. The determination of fair value of our
reporting units and indefinite-lived intangible assets requires management to make significant assumptions and estimates around the forecasts as well as the selection of discount rates and valuation multiples. Changes in these estimates could have a significant impact on the fair value of our reporting units, intangible assets and result in potential impairment.
Forecasts and the determination of appropriate discount rates and valuation multiples used to determine the fair value of our reporting units and indefinite-lived intangible assets involves significant assumptions and estimates. Assumptions include those used to assess future effects of COVID-19 as well as the realization of synergies anticipated from acquisitions which may not be realized at the projected rate.
We acquired William Hill PLC on April 22, 2021 and allocated the total purchase consideration transferred to the identifiable assets acquired and liabilities assumed based on their respective fair values and therefore, the fair value of the acquired reporting units and indefinite-lived intangible assets do not significantly exceed their respective carrying values. As of October 1, 2021, one other reporting unit in the Regional Segment with goodwill totaling $420 million had a fair value that did not significantly exceed its respective carrying values. To the extent gaming volumes deteriorate in the near future, discount rates increase significantly, or we do not meet our projected performance, we may recognize further impairments, and such impairments could be material. In addition, $352 million of goodwill within our Regional segment is associated with reporting units with zero or negative carrying value. See Note 7 for additional information.
Allowance for Doubtful Accounts - Gaming
We reserve an estimated amount for gaming receivables that may not be collected to reduce the Company’s receivables to their net carrying amount. Methodologies for estimating the allowance for doubtful accounts range from specific reserves to various percentages applied to aged receivables. Historical collection rates and reasonable forecasts are considered, as are customer relationships, in determining specific reserves.reserves to reflect current expected credit loss. As with many estimates, management must make judgments about potential actions by third parties in establishing and evaluating our reserves for allowance for doubtful accounts. As of December 31, 2021,2023, a 5% increase or decrease to the allowance determined based on a percentage of aged receivables would change the reserve by approximately $14$15 million.
Self-Insurance Reserves
We are self-insured for various levels of general liability, employee medical insurance coverage and workers’ compensation coverage. Insurance claims and reserves include accruals of estimated settlements for known claims, as well as accruals of estimates for claims incurred but not yet reported. We utilize independent consultants to assist management in its determination of estimated insurance liabilities. While the total cost of claims incurred depends on future developments, in managements’ opinion, recorded reserves are adequate to cover future claims payments. Self-insurance reserves for employee medical claims, workers’ compensations and general liability claims are included self-insurance claims and reserves within Accrued other liabilities on the Balance Sheets. See Note 9.
The assumptions including those related to the COVID-19 public health emergency, utilized by our actuaries are subject to significant uncertainty and if outcomes differ from these assumptions or events develop or progress in a negative manner, the Company could experience a material adverse effect and additional liabilities may be recorded in the future.
Litigation, Claims and Assessments
We utilize estimates for litigation, claims and assessments. These estimates are based on our knowledge and experience regarding current and past events, as well as assumptions about future events. If our assessment of such a matter should change, we may have to change the estimates, which may have an adverse effect on our financial position, results of operations or cash flows. Actual results could differ from these estimates.
Recently Issued Accounting Pronouncements
Item 7A. Quantitative and Qualitative Disclosures About Market Risk
Market risk is the risk of loss arising from adverse changes in market rates and prices, such as interest rates, foreign currency exchange rates and commodity prices. We are exposed to changes in interest rates primarily from variable rate long-term debt arrangements. Our exposure to foreign exchangeWe manage our interest rate risk is attributable to funds held in operatingby monitoring interest rates, including future projected rates, and escrow accounts, as well as the previously announced sales priceadjust our mix of William Hill International, which are denominated in British Pounds (GBP).
fixed and variable rate borrowings.Interest Rate Risk
As of December 31, 2021,2023, the face value of our long-term debt was $14.3$12.4 billion, including variable-rate long-term borrowings of $6.6$3.2 billion. No amounts were outstanding under our revolving credit facilities.
As a result of the Merger, we assumed Former Caesars’ interest rate swaps, of which four interest rate swap agreements are currently in place to fix the interest rate on $1.3 billion of variable rate debt. As a result, net of these interest rate swaps, $5.3 billion of debt remains subject to variable interest rates, as of December 31, 2021, for the term of the agreements. See Note 12 for additional information. The difference to be paid or received under the terms of the interest rate swap agreements is accrued as interest rates change and recognized as an adjustment to interest expense as settlements occur. Changes in the variable interest rates to be received pursuant to the terms of the interest rate swap agreements will have a corresponding effect on future cash flows.
We do not purchase or hold any derivative financial instruments for trading purposes.facility.
The table below provides information as of December 31, 20212023 about our fixed rate and variable rate financial instruments that are sensitive to changes in interest rates, including the cash flows associated with amortization the notional amounts of interest rate derivative instruments, and related weighted average interest rates. Principal amounts are used to calculate the payments to be exchanged under the related agreements and weighted average variable rates are based on implied forward rates in the yield curve as of December 31, 20212023 and should not be considered a predictor of actual future interest rates.
| | | | | | | | | | | | | | | | | | | | | | | | | | | | | | | | | | | | | | | | | | | | | | | | | | |
| | Expected Maturity Date | | | | |
| (Dollars in millions) | | 2022 | | 2023 | | 2024 | | 2025 | | 2026 | | Thereafter | | Total | | Fair Value |
| Liabilities | | | | | | | | | | | | | | | | |
| Long-term debt | | | | | | | | | | | | | | | | |
| Fixed rate | | $ | 2 | | | $ | 2 | | | $ | 2 | | | $ | 4,802 | | | $ | 3 | | | $ | 2,940 | | | $ | 7,751 | | | $ | 8,156 | |
| Average interest rate | | 6.5 | % | | 6.4 | % | | 6.5 | % | | 9.2 | % | | 6.7 | % | | 6.6 | % | | 7.6 | % | | |
| Variable rate | | $ | 68 | | | $ | 68 | | | $ | 4,712 | | | $ | 1,724 | | | $ | — | | | $ | — | | | $ | 6,572 | | | $ | 6,557 | |
| Average interest rate | | 3.7 | % | | 4.4 | % | | 7.2 | % | | 5.9 | % | | — | % | | — | % | | 4.9 | % | | |
| Interest Rate Derivatives | | | | | | | | | | | | | | | | |
| Interest rate swaps | | | | | | | | | | | | | | | | |
Variable to fixed (a) | | $ | 1,250 | | | $ | — | | | $ | — | | | $ | — | | | $ | — | | | $ | — | | | $ | 1,250 | | | |
| Average pay rate | | 2.7 | % | | — | % | | — | % | | — | % | | — | % | | — | % | | 2.7 | % | | |
| Average receive rate | | 0.5 | % | | — | % | | — | % | | — | % | | — | % | | — | % | | 0.5 | % | | |
| | | | | | | | | | | | | | | | |
| | | | | | | | | | | | | | | | | | | | | | | | | | | | | | | | | | | | | | | | | | | | | | | | | | |
| | Expected Maturity Date | | | | |
| (Dollars in millions) | | 2024 | | 2025 (a) | | 2026 | | 2027 | | 2028 | | Thereafter | | Total | | Fair Value |
| Liabilities | | | | | | | | | | | | | | | | |
| Long-term debt | | | | | | | | | | | | | | | | |
| Fixed rate | | $ | 2 | | | $ | 4,390 | | | $ | 2 | | | $ | 1,613 | | | $ | 2 | | | $ | 3,237 | | | $ | 9,246 | | | $ | 9,230 | |
| Average interest rate | | 4.3 | % | | 6.1 | % | | 4.3 | % | | 8.1 | % | | 4.3 | % | | 6.1 | % | | 6.5 | % | | |
| Variable rate | | $ | 63 | | | $ | 63 | | | $ | 63 | | | $ | 63 | | | $ | 585 | | | $ | 2,356 | | | $ | 3,193 | | | $ | 3,186 | |
| Average interest rate | | 6.9 | % | | 5.7 | % | | 5.4 | % | | 5.5 | % | | 4.9 | % | | 6.7 | % | | 6.5 | % | | |
| | | | | | | | | | | | | | | | |
| | | | | | | | | | | | | | | | |
| | | | | | | | | | | | | | | | |
| | | | | | | | | | | | | | | | |
| | | | | | | | | | | | | | | | |
| | | | | | | | | | | | | | | | |
____________________(a)These amounts representMaturities of $4.4 billion in 2025 of fixed rate were repaid with the interestnet proceeds of the $2.9 billion CEI Term Loan B-1 and the $1.5 billion CEI Senior Secured Notes due 2032. Following these transactions, the balance of fixed rate swap notional amounts that mature atdebt decreased by $2.9 billion and the endbalance of 2022. See Note 12 for additional information.variable rate debt increased by $3.0 billion.
As of December 31, 2021,2023, borrowings outstanding under our CEI credit facilitiesagreement were variable-rate borrowings. Assuming a 100 basis-point increase in LIBOR,Term SOFR, our annual interest cost would change by $53approximately $32 million based on gross amounts outstanding at December 31, 2021.2023.
LIBOR is expected to be discontinued by lending institutions after December 31, 2021We do not purchase or hold any derivative financial instruments for new debt agreements and after June 30, 2023 no additional LIBOR rates will be available. We have variable rate debt instruments which are subject to LIBOR interest rates plus a margin or base rate. Our CRC Credit Facility contains alternative rates in the event that LIBOR is no longer available. The Baltimore Term Loan has been amended and we intend to work with our lenders to ensure any transition away from LIBOR will have minimal impact on our financial condition, but can provide no assurances regarding the impact of the discontinuation of LIBOR. Our interest rate swaps mature on December 31, 2022.
Foreign Exchange Rate Risks
The Company has entered into several foreign exchange forward contracts with third parties to hedge the risk of fluctuations in the foreign exchange rates between USD and GBP and to fix the exchange rate for a portion of the funds used in the William Hill Acquisition, repayment of related debt, and expected proceeds of the sale of the international operations. The Company entered into a foreign exchange forward contract to purchase £724 million at a contracted exchange rate, which was settled on June 11, 2021 and December 31, 2021. As of December 31, 2021, the Company is contracted to sell a total of £790 million at fixed exchange rates. These contracts are to hedge the risk of fluctuations in the foreign exchange rate related to a portion of the expected proceeds from the sale of William Hill International. The forward term of these contracts ends in March 2022.trading purposes.
Item 8. Financial Statements and Supplementary Data
INDEX TO CONSOLIDATED FINANCIAL STATEMENTS OF
CAESARS ENTERTAINMENT, INC.
Report of Independent Registered Public Accounting FirmREPORT OF INDEPENDENT REGISTERED PUBLIC ACCOUNTING FIRM
To the stockholders and the Board of Directors of Caesars Entertainment, Inc.
Opinion on the Financial Statements
We have audited the accompanying consolidated balance sheets of Caesars Entertainment, Inc. and subsidiaries (the “Company”) as of December 31, 20212023 and 2020,2022, the related consolidated statements of operations, comprehensive income (loss), stockholders’ equity, and cash flowflows for each of the twothree years in the period ended December 31, 2021,2023, and the related notes and the schedule listed in the Index at Item 15 (collectively referred to as the “financial statements”). In our opinion, the financial statements present fairly, in all material respects, the financial position of the Company as of December 31, 20212023 and 2020,2022, and the results of its operations and its cash flowflows for each of the twothree years in the period ended December 31, 2021,2023, in conformity with accounting principles generally accepted in the United States of America.
We have also audited, in accordance with the standards of the Public Company Accounting Oversight Board (United States) (“PCAOB”), the Company's internal control over financial reporting as of December 31, 2021,2023, based on criteria established in Internal Control — Integrated Framework (2013) issued by the Committee of Sponsoring Organizations of the Treadway Commission and our report dated February 23, 2022,20, 2024, expressed an unqualified opinion on the Company’s internal control over financial reporting.
Basis for Opinion
These financial statements are the responsibility of the Company's management. Our responsibility is to express an opinion on the Company’s financial statements based on our audits. We are a public accounting firm registered with the PCAOB and are required to be independent with respect to the Company in accordance with the U.S. federal securities laws and the applicable rules and regulations of the Securities and Exchange Commission and the PCAOB.
We conducted our audits in accordance with the standards of the PCAOB. Those standards require that we plan and perform the audit to obtain reasonable assurance about whether the financial statements are free of material misstatement, whether due to error or fraud. Our audits included performing procedures to assess the risks of material misstatement of the financial statements, whether due to error or fraud, and performing procedures that respond to those risks. Such procedures included examining, on a test basis, evidence regarding the amounts and disclosures in the financial statements. Our audits also included evaluating the accounting principles used and significant estimates made by management, as well as evaluating the overall presentation of the financial statements. We believe that our audits provide a reasonable basis for our opinion.
Critical Audit Matters
The critical audit matters communicated below are matters arising from the current-period audit of the financial statements that were communicated or required to be communicated to the audit committee and that (1) relate to accounts or disclosures that are material to the financial statements and (2) involved our especially challenging, subjective, or complex judgments. The communication of critical audit matters does not alter in any way our opinion on the financial statements, taken as a whole, and we are not, by communicating the critical audit matters below, providing a separate opinionopinions on the critical audit matters or on the accounts or disclosures to which they relate.
Acquisition of William Hill PLCIncome Taxes – Valuation Allowance – Refer to Notes 1 and 3Note 17 to the Financial Statements
Critical Audit Matter Description
On September 30, 2020,The Company records income taxes under the asset and liability method, whereby deferred income taxes reflect the net tax effects of temporary differences between the carrying amounts of assets and liabilities for financial reporting purposes and the amounts used for income tax purposes. The carrying amounts of deferred tax assets are reduced by a valuation allowance if, based on the available evidence, it is more likely than not that such assets will not be realized. The Company assesses the available positive and negative evidence to estimate if sufficient future taxable income will be generated to use existing deferred tax assets. During the second quarter of 2023, the Company announceddetermined it was more likely than not that it had reached an agreement with William Hill PLC ona portion of the terms offederal and state deferred tax assets will be realized in the future. As a recommended cash acquisition pursuant to whichresult, the Company would acquirereversed the entire issuedvaluation allowance related to these deferred tax assets and torecorded a net income tax benefit of $940 million.
We identified that management’s determination that a portion of the deferred tax assets will be issued share capital (other than shares owned by the Company or held in treasury) of William Hill PLC, in an all-cash transaction. On April 22, 2021, the Company completed the acquisition of William Hill PLC for £2.9 billion, or approximately $3.9 billion.
The Company previously held equity interests in William Hill PLC and William Hill U.S. Holdco Inc. (a William Hill PLC subsidiary). Accordingly, the acquisition is accounted forrealized as a business combination achieved in stages, or a “step acquisition”. The estimated purchase consideration allocated to the assets acquired and liabilities assumed based on their respective fair values. The Company used market, income, and cost approaches, or a combination in the determining the fair valuescritical audit matter because of the assets acquiredsignificant management judgements in assessing the available positive and liabilities assumed. These approachesnegative evidence that sufficient taxable income will be generated. This required managementa higher degree of auditor judgement and an increased extent of effort, including the need to make significant assumptions andinvolve our income tax specialists, when performing procedures to evaluate the reasonableness of managements estimates around expected cash flows and projected financial results related to online sports betting and iGaming in the United States (US) (collectively, the “forecasts”) as well as the selection of a discount rate. Changes in these assumptions and estimates could have a significant impact on the fair value of the intangible assets and assigned goodwill. Therefore, auditing the forecasts andfuture taxable income.
the selection of discount rates involved a higher degree of auditor judgment and subjectivity as well as an increased level of audit effort, including the involvement of valuation specialists.
How the Critical Audit Matter Was Addressed in the Audit
Our audit procedures related to managements determination that in the forecasts and the selection of the discount rate selected by management to determine the fair value of the intangible assets and assigned goodwillcurrent year it is more likely than not that sufficient future taxable income will be generated included the following, among others:
•We tested the effectiveness of the Company’s internalmanagements controls over the forecasts and the selection of discount rates.over:
•◦We evaluated management’s ability to accurately forecast by comparing actual results to management’s historical forecasts.
•We evaluated the assumptions and estimates includedThe determination of whether it is more likely than not that sufficient income will be generated in the forecasts by: 1) comparingfuture to realize the forecasts to information included in the Company’s communications to the Board of Directors, gaming industry reports, and analyst reports for the Company and certain of its peer companies; 2) comparing management’s assumptions regarding the dates for legalization of online sports betting and iGaming and the estimated market size for certain states in the US to gaming industry reports; 3) comparing forecasted market share with the Company’s historical market share; and 4) conducting inquiries with management.
•With the assistance of our valuationtax specialists, we evaluatedperformed the discount rates selectedfollowing:
◦Evaluated the reasonableness of methods, assumptions, and judgements used by management including assessing the impactto determine whether a reversal of their valuation allowance was appropriate.
◦Evaluated management’s assessment and weighting of the uncertaintypositive and negative evidence used to conclude if a valuation allowance was necessary.
◦Evaluated the realizability of deferred tax assets, including the application of tax laws and the projections of future income.
◦Evaluated whether the estimates of future taxable income were consistent with evidence obtained in the forecasts, testing the market-based source information underlying the selectionother areas of the discount rates and the mathematical accuracy of the discount rate calculations, and developing a range of independent estimates and comparing those to the discount rates selected by management.audit.
Goodwill and Indefinite-lived Intangible Assets – Refer to Note 7 to the Financial Statements
Critical Audit Matter Description
The Company reviews goodwill and indefinite-lived intangible assets for impairment at least annually and between annual test dates in certain circumstances. The Company performs its goodwill impairment test by comparing the fair value of each reporting unit with itsto the carrying amount. The Company determines the estimatedestablished fair value of each reporting unit based on a combination of earnings before interest, taxes, depreciation, and amortization (“EBITDA”), valuation multiples, and estimated future cash flows discounted at rates commensurate with the capital structure and cost of capital of comparable market participants, giving appropriate consideration toconsidering the prevailing borrowing rates within the casino industry in general.general, and expected sales proceeds. The Company alsofurther evaluates the aggregate fair value of all of its reporting units and other non-operating assets in comparison to its aggregate debt and equity market capitalization at the test date.
Indefinite-lived intangible assets consist primarily of trademarks, Caesars Rewards, and gaming rights. The Company uses the Excess Earnings Method and Cost Approach to determine the estimated fair value of gaming rights and uses the relief from royalty method to determine the estimated fair value of trademarks and Caesars Rewards.
The Company performed its annual goodwill impairment assessment as of October 1, 2021 and determined that the fair value of each reporting unit was in excess of its carrying value.2023. The Company’s goodwill balance was $11,076$10,990 million as of December 31, 2021,2023 of which $1,016we identified: (1) $1.3 billion and $105 million was related to two reporting units withinin the Las Vegas segment and one reporting unit in the Regional segment, whichrespectively, had estimated fair values that did not significantly exceed their respectivecarrying values and (2) $1.2 billion related to one Reporting Unit in the Caesars Digital segment which had an increased level of sensitivity with management forecasts and selected discount rate and valuation multiples.
The Company’s indefinite-lived intangibles balance was $3,577 million as of December 31, 2023, of which trademarks totaling $254 million and $523 million in the Las Vegas and Corporate segments, respectively, had estimated fair values that did not significantly exceed their carrying values.
The EBITDAdetermination of the Company’s reporting units and indefinite-lived intangible assets fair value requires management to make significant assumptions and estimates around forecasts and the selection of discount rates and valuation multiples used to determine the fair value of the reporting units involved significant assumptions and estimates.multiples. Therefore, our audit procedures to evaluate the reasonableness of management’s EBITDA forecasts required a higher degree of auditor judgment, as well as an increased level of audit effort, and the need to use of more experienced audit professionals. In addition, the selection of discount rates and valuation multiples involved a higher degree of auditor judgment and subjectivityprofessionals, as well as an increased level of audit effort, including the involvement of valuation specialists.
How the Critical Audit Matter Was Addressed in the Audit
Our audit procedures related to management’s financial projections for these twoforecasts and the selection of discount rates and valuation multiples used by management to determine the fair value of the Company’s reporting units within the segment,and indefinite-lived intangible assets included the following, among others:
•We tested the effectiveness of the Company’s internal controls over thevaluation inputs including management’s forecasts and the selection of discount rates and valuation multiples.
•We evaluated management’s ability to accurately forecast EBITDA by comparing actual results to management’s historical forecasts.projections to actual performance.
•We evaluated the reasonableness of the assumptions and estimates included in management’s forecasts by: 1) comparing the
◦Comparing forecasts to information included in the Company’s communications to the Board of Directors, gamingprojected information in industry reports, and analyst reports for the Company and certain of its peer companies; 2) conductingcompanies.
◦Conducting inquiries with property management; and 3) evaluating management’s estimate ofmanagement.
◦Considering the impact of changes in the competitive, regulatory, and economic environment on management’s projections.
◦Assessing the reasonableness of strategic plans incorporated by management into the projections.
◦Evaluating management’s estimate and the impact of any related expansion of gaming activities by analyzing historical information.
•With the assistance of our valuation specialists, we evaluated the discount rates and valuation multiples selected by management including assessingby:
◦Assessing the impact of the uncertainty in the forecasts on the discount rates, and valuation multiples,including testing the underlying market-based source information underlyingused in the selection of both the discount rates and valuation multiples and the mathematical accuracy of the discount rate and valuation multiple calculations, and developingcalculations.
◦Developing a range of independent estimates and comparing those to the discount rates and valuation multiples selected by management.
/s/ DELOITTE & TOUCHE LLP
Las Vegas, Nevada
February 23, 202220, 2024
We have served as the Company’s auditor since 2020.
Report of Independent Registered Public Accounting Firm
The Board of Directors and Stockholders
Caesars Entertainment, Inc.
Opinion on the Financial Statements
We have audited the accompanying consolidated statements of operations, comprehensive income (loss), stockholders’ equity and cash flows for the year ended December 31, 2019 of Caesars Entertainment, Inc., (formerly Eldorado Resorts Inc.) (the Company), and the related notes and the financial statement schedule listed in the Index at Item 15 (a)(ii) (collectively referred to as the “consolidated financial statements”). In our opinion, the consolidated financial statements present fairly, in all material respects the results of the Company’s operations and its cash flows for the year ended December 31, 2019, in conformity with U.S. generally accepted accounting principles.
Basis for Opinion
These financial statements are the responsibility of the Company's management. Our responsibility is to express an opinion on the Company’s financial statements based on our audit. We are a public accounting firm registered with the PCAOB and are required to be independent with respect to the Company in accordance with the U.S. federal securities laws and the applicable rules and regulations of the Securities and Exchange Commission and the PCAOB.
We conducted our audit in accordance with the standards of the PCAOB. Those standards require that we plan and perform the audit to obtain reasonable assurance about whether the financial statements are free of material misstatement, whether due to error or fraud. Our audit included performing procedures to assess the risks of material misstatement of the financial statements, whether due to error or fraud, and performing procedures that respond to those risks. Such procedures included examining, on a test basis, evidence regarding the amounts and disclosures in the financial statements. Our audit also included evaluating the accounting principles used and significant estimates made by management, as well as evaluating the overall presentation of the financial statements. We believe that our audit provides a reasonable basis for our opinion.
/s/ Ernst & Young LLP
We served as the Company’s auditor from 2011 to 2020.
Las Vegas, Nevada
February 27, 2020
CAESARS ENTERTAINMENT, INC.
CONSOLIDATED BALANCE SHEETS
| | (Dollars in millions) | December 31,
2021 | | December 31,
2020 |
| December 31, | | | December 31, |
| (Dollars in millions, except par value) | | (Dollars in millions, except par value) | 2023 | | 2022 |
| ASSETS | ASSETS | | | |
| CURRENT ASSETS: | CURRENT ASSETS: | |
| CURRENT ASSETS: | |
| CURRENT ASSETS: | |
| Cash and cash equivalents | Cash and cash equivalents | $ | 1,070 | | | $ | 1,776 | |
| Restricted cash and investments | 319 | | | 2,021 | |
| Cash and cash equivalents | |
| Cash and cash equivalents | |
| Restricted cash | |
| Accounts receivable, net | Accounts receivable, net | 472 | | | 342 | |
| Due from affiliates | — | | | 44 | |
| | Inventories | |
| Inventories | |
| Inventories | Inventories | 42 | | | 44 | |
| Prepayments and other current assets | Prepayments and other current assets | 290 | | | 253 | |
| Assets held for sale ($0 and $130 attributable to our VIEs) | 3,771 | | | 1,583 | |
| | Total current assets | |
| Total current assets | |
| Total current assets | Total current assets | 5,964 | | | 6,063 | |
| Investments in and advances to unconsolidated affiliates | Investments in and advances to unconsolidated affiliates | 158 | | | 173 | |
| Property and equipment, net | Property and equipment, net | 14,601 | | | 14,735 | |
| Gaming rights and other intangibles, net | 4,920 | | | 4,283 | |
| Goodwill | Goodwill | 11,076 | | | 9,864 | |
| Other assets, net | 1,312 | | | 1,267 | |
| | Intangible assets other than goodwill | |
| Deferred tax asset | |
| Other long-term assets, net | |
| Total assets | Total assets | $ | 38,031 | | | $ | 36,385 | |
| LIABILITIES AND STOCKHOLDERS’ EQUITY | LIABILITIES AND STOCKHOLDERS’ EQUITY | | | |
| CURRENT LIABILITIES: | CURRENT LIABILITIES: | |
| CURRENT LIABILITIES: | |
| CURRENT LIABILITIES: | |
| Accounts payable | |
| Accounts payable | |
| Accounts payable | Accounts payable | $ | 254 | | | $ | 167 | |
| Accrued interest | Accrued interest | 320 | | | 229 | |
| Accrued other liabilities | Accrued other liabilities | 1,973 | | | 1,263 | |
| Current portion of long-term debt | Current portion of long-term debt | 70 | | | 67 | |
| Liabilities related to assets held for sale ($0 and $130 attributable to our VIEs) | 2,680 | | | 787 | |
| | Total current liabilities | |
| Total current liabilities | |
| Total current liabilities | Total current liabilities | 5,297 | | | 2,513 | |
| Long-term financing obligation | Long-term financing obligation | 12,424 | | | 12,295 | |
| Long-term debt | Long-term debt | 13,722 | | | 14,073 | |
| Deferred income taxes | 1,111 | | | 1,166 | |
| Deferred tax liability | |
| Other long-term liabilities | Other long-term liabilities | 936 | | | 1,304 | |
| Total liabilities | Total liabilities | 33,490 | | | 31,351 | |
| Commitments and contingencies (Note 11) | 0 | | 0 |
Commitments and contingencies (Note 11) | | Commitments and contingencies (Note 11) | | | |
| STOCKHOLDERS' EQUITY: | STOCKHOLDERS' EQUITY: | |
| Common stock, par value $0.00001, 500,000,000 shares authorized, 213,779,848 and 208,049,417 issued and outstanding, net of treasury shares | — | | | — | |
| Paid-in capital | 6,877 | | | 6,382 | |
| Preferred stock, $0.00001 par value, 150,000,000 shares authorized, no shares issued and outstanding | |
| Preferred stock, $0.00001 par value, 150,000,000 shares authorized, no shares issued and outstanding | |
| Preferred stock, $0.00001 par value, 150,000,000 shares authorized, no shares issued and outstanding | |
| Common stock, $0.00001 par value, 500,000,000 shares authorized, 215,800,650 and 214,671,754 issued and outstanding, net of treasury shares | |
| Additional paid-in capital | |
| Accumulated deficit | Accumulated deficit | (2,410) | | | (1,391) | |
| Treasury stock at cost, 363,016 and 223,823 shares held | (23) | | | (9) | |
| Treasury stock at cost, 363,016 and 363,016 shares held | |
| Accumulated other comprehensive income | Accumulated other comprehensive income | 36 | | | 34 | |
| Caesars stockholders' equity | Caesars stockholders' equity | 4,480 | | | 5,016 | |
| Noncontrolling interests | Noncontrolling interests | 61 | | | 18 | |
| Total stockholders’ equity | Total stockholders’ equity | 4,541 | | | 5,034 | |
| Total liabilities and stockholders’ equity | Total liabilities and stockholders’ equity | $ | 38,031 | | | $ | 36,385 | |
The accompanying notes are an integral part of these consolidated financial statements.
CAESARS ENTERTAINMENT, INC.
CONSOLIDATED STATEMENTS OF OPERATIONS
| | Years Ended December 31, |
| Years Ended December 31, | | | Years Ended December 31, |
| (In millions, except per share data) | (In millions, except per share data) | 2021 | | 2020 | | 2019 | (In millions, except per share data) | 2023 | | 2022 | | 2021 |
| REVENUES: | | | | | |
| Casino and pari-mutuel commissions | $ | 5,827 | | | $ | 2,482 | | | $ | 1,808 | |
| NET REVENUES: | |
| Casino | |
| Casino | |
| Casino | |
| Food and beverage | Food and beverage | 1,140 | | | 342 | | | 301 | |
| Hotel | Hotel | 1,551 | | | 450 | | | 300 | |
| Other | Other | 1,052 | | | 354 | | | 119 | |
| Net revenues | Net revenues | 9,570 | | | 3,628 | | | 2,528 | |
| EXPENSES: | | | | | |
| Casino and pari-mutuel commissions | 3,129 | | | 1,271 | | | 905 | |
| OPERATING EXPENSES: | |
| Casino | |
| Casino | |
| Casino | |
| Food and beverage | Food and beverage | 707 | | | 265 | | | 239 | |
| Hotel | Hotel | 438 | | | 170 | | | 99 | |
| Other | Other | 373 | | | 140 | | | 46 | |
| General and administrative | General and administrative | 1,782 | | | 902 | | | 503 | |
| Corporate | Corporate | 309 | | | 195 | | | 66 | |
| Impairment charges | Impairment charges | 102 | | | 215 | | | 1 | |
| Depreciation and amortization | Depreciation and amortization | 1,126 | | | 583 | | | 222 | |
| Transaction costs and other operating costs | 144 | | | 270 | | | 37 | |
| Transaction and other costs, net | |
| Total operating expenses | Total operating expenses | 8,110 | | | 4,011 | | | 2,118 | |
| | Operating income (loss) | 1,460 | | | (383) | | | 410 | |
| Operating income | |
| | Operating income | |
| | Operating income | |
| OTHER EXPENSE: | OTHER EXPENSE: | |
| Interest expense, net | |
| Interest expense, net | |
| Interest expense, net | Interest expense, net | (2,295) | | | (1,202) | | | (286) | |
| Loss on extinguishment of debt | Loss on extinguishment of debt | (236) | | | (197) | | | (8) | |
| Other income (loss) | Other income (loss) | (198) | | | 176 | | | 9 | |
| Total other expense | Total other expense | (2,729) | | | (1,223) | | | (285) | |
| Income (loss) from continuing operations before income taxes | (1,269) | | | (1,606) | | | 125 | |
| Benefit (provision) for income taxes | 283 | | | (132) | | | (44) | |
| Net income (loss) from continuing operations, net of income taxes | (986) | | | (1,738) | | | 81 | |
| Loss from continuing operations before income taxes | |
| Benefit for income taxes | |
| Income (loss) from continuing operations, net of income taxes | |
| Discontinued operations, net of income taxes | Discontinued operations, net of income taxes | (30) | | | (20) | | | — | |
| Net income (loss) | Net income (loss) | (1,016) | | | (1,758) | | | 81 | |
| Net (income) loss attributable to noncontrolling interests | Net (income) loss attributable to noncontrolling interests | (3) | | | 1 | | | — | |
| Net income (loss) attributable to Caesars | Net income (loss) attributable to Caesars | $ | (1,019) | | | $ | (1,757) | | | $ | 81 | |
| Net income (loss) per share - basic and diluted: | Net income (loss) per share - basic and diluted: | | | | | |
| Basic income (loss) per share from continuing operations | |
| Basic income (loss) per share from continuing operations | |
| Basic income (loss) per share from continuing operations | Basic income (loss) per share from continuing operations | $ | (4.69) | | | $ | (13.35) | | | $ | 1.04 | |
| Basic loss per share from discontinued operations | Basic loss per share from discontinued operations | (0.14) | | | (0.15) | | | — | |
| Basic income (loss) per share | Basic income (loss) per share | $ | (4.83) | | | $ | (13.50) | | | $ | 1.04 | |
| Diluted income (loss) per share from continuing operations | Diluted income (loss) per share from continuing operations | $ | (4.69) | | | $ | (13.35) | | | $ | 1.03 | |
| Diluted loss per share from discontinued operations | Diluted loss per share from discontinued operations | (0.14) | | | (0.15) | | | — | |
| Diluted income (loss) per share | Diluted income (loss) per share | $ | (4.83) | | | $ | (13.50) | | | $ | 1.03 | |
| Weighted average basic shares outstanding | Weighted average basic shares outstanding | 211 | | | 130 | | | 78 | |
| Weighted average diluted shares outstanding | Weighted average diluted shares outstanding | 211 | | | 130 | | | 79 | |
The accompanying notes are an integral part of these consolidated financial statements.
CAESARS ENTERTAINMENT, INC.
CONSOLIDATED STATEMENTS OF COMPREHENSIVE INCOME (LOSS)
| | Years Ended December 31, |
| Years Ended December 31, | | | Years Ended December 31, |
| (In millions) | (In millions) | 2021 | | 2020 | | 2019 | (In millions) | 2023 | | 2022 | | 2021 |
| Net income (loss) | Net income (loss) | $ | (1,016) | | | $ | (1,758) | | | $ | 81 | |
| Foreign currency translation adjustments | Foreign currency translation adjustments | (45) | | | 9 | | | — | |
| Change in fair market value of interest rate swaps, net of tax | Change in fair market value of interest rate swaps, net of tax | 47 | | | 26 | | | — | |
| Other | Other | (1) | | | — | | | — | |
| Other comprehensive income, net of tax | Other comprehensive income, net of tax | 1 | | | 35 | | | — | |
| Comprehensive income (loss) | Comprehensive income (loss) | (1,015) | | | (1,723) | | | 81 | |
| Amounts attributable to noncontrolling interests: | Amounts attributable to noncontrolling interests: | | | | | |
| Net (income) loss attributable to noncontrolling interests | Net (income) loss attributable to noncontrolling interests | (3) | | | 1 | | | — | |
| Net (income) loss attributable to noncontrolling interests | |
| Net (income) loss attributable to noncontrolling interests | |
| Foreign currency translation adjustments | Foreign currency translation adjustments | 1 | | | (1) | | | — | |
| Comprehensive income attributable to noncontrolling interests | (2) | | | — | | | — | |
| Comprehensive (income) loss attributable to noncontrolling interests | |
| Comprehensive income (loss) attributable to Caesars | Comprehensive income (loss) attributable to Caesars | $ | (1,017) | | | $ | (1,723) | | | $ | 81 | |
The accompanying notes are an integral part of these consolidated financial statements.
CAESARS ENTERTAINMENT, INC.
CONSOLIDATED STATEMENTS OF STOCKHOLDERS’ EQUITY
| | Caesars Stockholders' Equity | |
| Preferred Stock | |
| Preferred Stock | |
| Preferred Stock | |
| (In millions) | |
| (In millions) | |
| (In millions) | | Shares | | Amount | | Shares | | Amount | | Additional Paid-in Capital | | Accumulated Deficit | | Accumulated Other Comprehensive Income | | Amount | | Noncontrolling Interests | | Total Stockholders' Equity |
| Balance, January 1, 2021 | |
| Stock-based compensation | |
| Issuance of common stock, net | |
| Net income (loss) | |
| | | Caesars Stockholders' Equity | |
| Other comprehensive income (loss), net of tax | |
| | Common Stock | | Treasury Stock | |
| (In millions) | Shares | | Amount | | Paid-in Capital | | Retained Earnings (Accumulated Deficit) | | Accumulated Other Comprehensive Income | | Amount | | Noncontrolling interests | | Total Stockholders' Equity |
| Balance, January 1, 2019 | 77 | | | $ | — | | | $ | 748 | | | $ | 290 | | | $ | — | | | $ | (9) | | | $ | — | | | $ | 1,029 | |
| Cumulative change in accounting principle, net of tax | — | | | — | | | — | | | (5) | | | — | | | — | | | — | | | (5) | |
| Issuance of restricted stock units | 1 | | | — | | | 20 | | | — | | | — | | | — | | | — | | | 20 | |
| Other comprehensive income (loss), net of tax | |
| | Other comprehensive income (loss), net of tax | |
| Shares withheld related to net share settlement of stock awards | |
| Transactions with noncontrolling interests | |
| | Balance, December 31, 2021 | |
| Balance, December 31, 2021 | |
| Balance, December 31, 2021 | |
| Stock-based compensation | |
| | Net loss | |
| Net loss | |
| Net loss | |
| Other comprehensive income (loss), net of tax | |
| Shares withheld related to net share settlement of stock awards | |
| Transactions with noncontrolling interests | |
| Balance, December 31, 2022 | |
| Stock-based compensation | |
| | Net income | Net income | — | | | — | | | — | | | 81 | | | — | | | — | | | — | | | 81 | |
| | Shares withheld related to net share settlement of stock awards | — | | | — | | | (8) | | | — | | | — | | | — | | | — | | | (8) | |
| Balance, December 31, 2019 | 78 | | | — | | | 760 | | | 366 | | | — | | | (9) | | | — | | | 1,117 | |
| Issuance of restricted stock units | 1 | | | — | | | 72 | | | — | | | — | | | — | | | — | | | 72 | |
| Issuance of common stock, net | 67 | | | — | | | 3,172 | | | — | | | — | | | — | | | — | | | 3,172 | |
| Net loss | — | | | — | | | — | | | (1,757) | | | — | | | — | | | (1) | | | (1,758) | |
| Shares issued to Former Caesars shareholders | 62 | | | — | | | 2,381 | | | — | | | — | | | — | | | — | | | 2,381 | |
| Former Caesars replacement awards | — | | | — | | | 24 | | | — | | | — | | | — | | | — | | | 24 | |
| Other comprehensive income, net of tax | — | | | — | | | — | | | — | | | 34 | | | — | | | 1 | | | 35 | |
| Shares withheld related to net share settlement of stock awards | — | | | — | | | (16) | | | — | | | — | | | — | | | — | | | (16) | |
| Acquired noncontrolling interests | — | | | — | | | (18) | | | — | | | — | | | — | | | 18 | | | — | |
| Other | — | | | — | | | 7 | | | — | | | — | | | — | | | — | | | 7 | |
| Balance, December 31, 2020 | 208 | | | — | | | 6,382 | | | (1,391) | | | 34 | | | (9) | | | 18 | | | 5,034 | |
| Issuance of restricted stock units | 1 | | | — | | | 83 | | | — | | | — | | | — | | | — | | | 83 | |
| Issuance of common stock, net | 5 | | | — | | | 456 | | | — | | | — | | | (14) | | | — | | | 442 | |
| Net income (loss) | — | | | — | | | — | | | (1,019) | | | — | | | — | | | 3 | | | (1,016) | |
| Net income | |
| Net income | |
| Other comprehensive income, net of tax | Other comprehensive income, net of tax | — | | | — | | | — | | | — | | | 2 | | | — | | | (1) | | | 1 | |
| Shares withheld related to net share settlement of stock awards | Shares withheld related to net share settlement of stock awards | — | | | — | | | (44) | | | — | | | — | | | — | | | — | | | (44) | |
| Transactions with noncontrolling interests | Transactions with noncontrolling interests | — | | | — | | | — | | | — | | | — | | | — | | | 41 | | | 41 | |
| Balance, December 31, 2021 | 214 | | | $ | — | | | $ | 6,877 | | | $ | (2,410) | | | $ | 36 | | | $ | (23) | | | $ | 61 | | | $ | 4,541 | |
| Balance, December 31, 2023 | |
The accompanying notes are an integral part of these consolidated financial statements.
CAESARS ENTERTAINMENT, INC.
CONSOLIDATED STATEMENTS OF CASH FLOWS
| | Years Ended December 31, |
| Years Ended December 31, | | | Years Ended December 31, |
| (In millions) | (In millions) | 2021 | | 2020 | | 2019 | (In millions) | 2023 | | 2022 | | 2021 |
| CASH FLOWS FROM OPERATING ACTIVITIES: | CASH FLOWS FROM OPERATING ACTIVITIES: | | | | | |
| Net income (loss) | Net income (loss) | $ | (1,016) | | | $ | (1,758) | | | $ | 81 | |
| Net income (loss) | |
| Net income (loss) | |
| Adjustments to reconcile net income (loss) to net cash provided by operating activities: | Adjustments to reconcile net income (loss) to net cash provided by operating activities: | |
| Loss from discontinued operations | 30 | | | 20 | | | — | |
| Discontinued operations, net of income taxes | |
| Discontinued operations, net of income taxes | |
| Discontinued operations, net of income taxes | |
| Depreciation and amortization | Depreciation and amortization | 1,126 | | | 583 | | | 222 | |
| Amortization of deferred financing costs and discounts | Amortization of deferred financing costs and discounts | 347 | | | 156 | | | 18 | |
| Provision for doubtful accounts | Provision for doubtful accounts | 26 | | | 29 | | | 1 | |
| Deferred revenue | (4) | | | (11) | | | (7) | |
| | Loss on extinguishment of debt | |
| | Loss on extinguishment of debt | |
| | Loss on extinguishment of debt | Loss on extinguishment of debt | 236 | | | 197 | | | 8 | |
| Non-cash lease amortization | Non-cash lease amortization | 39 | | | 14 | | | 3 | |
| (Gain) loss on investments | (Gain) loss on investments | 107 | | | (34) | | | (9) | |
| Stock compensation expense | 82 | | | 79 | | | 20 | |
| (Gain) loss on sale of businesses and disposal of property and equipment | 11 | | | (7) | | | (50) | |
| Stock-based compensation expense | |
| Loss on sale of businesses and disposal of property and equipment | |
| Impairment charges | Impairment charges | 102 | | | 215 | | | 1 | |
| (Benefit) provision for deferred income taxes | (283) | | | 176 | | | (2) | |
| Deferred income taxes | |
| (Gain) loss on derivatives | (Gain) loss on derivatives | 127 | | | (9) | | | — | |
| Foreign currency transaction gain | Foreign currency transaction gain | (21) | | | (129) | | | — | |
| Other non-cash adjustments to net income (loss) | (8) | | | (2) | | | 3 | |
| Other non-cash adjustments to net (income) loss | |
| Change in operating assets and liabilities: | Change in operating assets and liabilities: | |
| Accounts receivable | |
| Accounts receivable | |
| Accounts receivable | Accounts receivable | (135) | | | (70) | | | 5 | |
| Prepaid expenses and other assets | Prepaid expenses and other assets | (67) | | | 9 | | | 10 | |
| Income taxes (receivable) payable | Income taxes (receivable) payable | 13 | | | (40) | | | (22) | |
| Accounts payable, accrued expenses and other liabilities | Accounts payable, accrued expenses and other liabilities | 486 | | | 25 | | | 31 | |
| Other | Other | 1 | | | (4) | | | — | |
| Net cash provided by (used in) operating activities | 1,199 | | | (561) | | | 313 | |
| Net cash provided by operating activities | |
| | CASH FLOWS FROM INVESTING ACTIVITIES: | CASH FLOWS FROM INVESTING ACTIVITIES: | |
| Purchase of property and equipment, net | (520) | | | (164) | | | (171) | |
| Former Caesars acquisition, net of cash acquired | — | | | (6,314) | | | — | |
| William Hill acquisition, net of cash acquired | (1,581) | | | — | | | — | |
| CASH FLOWS FROM INVESTING ACTIVITIES: | |
| CASH FLOWS FROM INVESTING ACTIVITIES: | |
| Purchase of property and equipment | |
| Purchase of property and equipment | |
| Purchase of property and equipment | |
| | Acquisition of William Hill, net of cash acquired | |
| Acquisition of William Hill, net of cash acquired | |
| Acquisition of William Hill, net of cash acquired | |
| Purchase of additional interest in Horseshoe Baltimore, net of cash consolidated | Purchase of additional interest in Horseshoe Baltimore, net of cash consolidated | (5) | | | — | | | — | |
| Acquisition of gaming rights and trademarks | Acquisition of gaming rights and trademarks | (312) | | | (35) | | | — | |
| | Proceeds from sale of businesses, property and equipment, net of cash sold | Proceeds from sale of businesses, property and equipment, net of cash sold | 726 | | | 366 | | | 536 | |
| Proceeds from sale of businesses, property and equipment, net of cash sold | |
| Proceeds from sale of businesses, property and equipment, net of cash sold | |
| Proceeds from the sale of investments | Proceeds from the sale of investments | 239 | | | 25 | | | 5 | |
| | Proceeds from insurance related to property damage | Proceeds from insurance related to property damage | 44 | | | 17 | | | — | |
| Proceeds from insurance related to property damage | |
| Proceeds from insurance related to property damage | |
| Investments in unconsolidated affiliates | Investments in unconsolidated affiliates | (39) | | | (1) | | | (1) | |
| Other | Other | — | | | 6 | | | — | |
| Net cash provided by (used in) investing activities | (1,448) | | | (6,100) | | | 369 | |
| Net cash used in investing activities | |
| | CASH FLOWS FROM FINANCING ACTIVITIES: | CASH FLOWS FROM FINANCING ACTIVITIES: | |
| CASH FLOWS FROM FINANCING ACTIVITIES: | |
| CASH FLOWS FROM FINANCING ACTIVITIES: | |
| Proceeds from long-term debt and revolving credit facilities | |
| Proceeds from long-term debt and revolving credit facilities | |
| Proceeds from long-term debt and revolving credit facilities | Proceeds from long-term debt and revolving credit facilities | 1,308 | | | 9,765 | | | 33 | |
| Repayments of long-term debt and revolving credit facilities | Repayments of long-term debt and revolving credit facilities | (1,977) | | | (3,742) | | | (736) | |
| Proceeds from sale-leaseback financing arrangement | — | | | 3,224 | | | — | |
| | Financing obligation payments | |
| Financing obligation payments | |
| Financing obligation payments | Financing obligation payments | (5) | | | (49) | | | — | |
| Debt issuance and extinguishment costs | Debt issuance and extinguishment costs | (56) | | | (356) | | | (1) | |
| Proceeds from issuance of common stock | Proceeds from issuance of common stock | 3 | | | 2,718 | | | — | |
| Cash paid to settle convertible notes | Cash paid to settle convertible notes | (367) | | | (903) | | | — | |
| Taxes paid related to net share settlement of equity awards | Taxes paid related to net share settlement of equity awards | (45) | | | (16) | | | (8) | |
| | Payments to acquire ownership interest in subsidiary | |
| Payments to acquire ownership interest in subsidiary | |
| Payments to acquire ownership interest in subsidiary | |
| Contributions from noncontrolling interest owners | |
| Distributions to noncontrolling interest | Distributions to noncontrolling interest | (2) | | | — | | | — | |
| Net cash provided by (used in) financing activities | (1,141) | | | 10,641 | | | (712) | |
| Net cash used in financing activities | |
|
| | Years Ended December 31, |
| Years Ended December 31, | | | Years Ended December 31, |
| (In millions) | (In millions) | 2021 | | 2020 | | 2019 | (In millions) | 2023 | | 2022 | | 2021 |
| CASH FLOWS FROM DISCONTINUED OPERATIONS: | CASH FLOWS FROM DISCONTINUED OPERATIONS: | | | | | |
| Cash flows from operating activities | |
| Cash flows from operating activities | |
| Cash flows from operating activities | Cash flows from operating activities | (27) | | | (21) | | | — | |
| Cash flows from investing activities | Cash flows from investing activities | (1,475) | | | (5) | | | — | |
| Cash flows from financing activities | Cash flows from financing activities | 591 | | | — | | | — | |
| Net cash from discontinued operations | Net cash from discontinued operations | (911) | | | (26) | | | — | |
| Change in cash, cash equivalents, and restricted cash classified as assets held for sale | Change in cash, cash equivalents, and restricted cash classified as assets held for sale | 10 | | | (20) | | | — | |
| Effect of foreign currency exchange rates on cash | Effect of foreign currency exchange rates on cash | 32 | | | 129 | | | — | |
| Increase (decrease) in cash, cash equivalents and restricted cash | (2,259) | | | 4,063 | | | (30) | |
| Decrease in cash, cash equivalents and restricted cash | |
| Cash, cash equivalents and restricted cash, beginning of period | Cash, cash equivalents and restricted cash, beginning of period | 4,280 | | | 217 | | | 247 | |
| Cash, cash equivalents and restricted cash, end of period | Cash, cash equivalents and restricted cash, end of period | $ | 2,021 | | | $ | 4,280 | | | $ | 217 | |
| | RECONCILIATION OF CASH, CASH EQUIVALENTS AND RESTRICTED CASH TO AMOUNTS REPORTED WITHIN THE CONSOLIDATED BALANCE SHEETS: | RECONCILIATION OF CASH, CASH EQUIVALENTS AND RESTRICTED CASH TO AMOUNTS REPORTED WITHIN THE CONSOLIDATED BALANCE SHEETS: | |
| RECONCILIATION OF CASH, CASH EQUIVALENTS AND RESTRICTED CASH TO AMOUNTS REPORTED WITHIN THE CONSOLIDATED BALANCE SHEETS: | |
| RECONCILIATION OF CASH, CASH EQUIVALENTS AND RESTRICTED CASH TO AMOUNTS REPORTED WITHIN THE CONSOLIDATED BALANCE SHEETS: | |
| Cash and cash equivalents | |
| Cash and cash equivalents | |
| Cash and cash equivalents | Cash and cash equivalents | $ | 1,070 | | | $ | 1,776 | | | $ | 206 | |
| Restricted cash | Restricted cash | 319 | | | 2,021 | | | 4 | |
| Restricted and escrow cash included in other noncurrent assets | Restricted and escrow cash included in other noncurrent assets | 323 | | | 437 | | | 7 | |
| Cash and cash equivalents and restricted cash in discontinued operations | Cash and cash equivalents and restricted cash in discontinued operations | 309 | | | 46 | | | — | |
| Total cash, cash equivalents and restricted cash | Total cash, cash equivalents and restricted cash | $ | 2,021 | | | $ | 4,280 | | | $ | 217 | |
| | SUPPLEMENTAL DISCLOSURE OF CASH FLOW INFORMATION: | SUPPLEMENTAL DISCLOSURE OF CASH FLOW INFORMATION: | |
| Interest paid | $ | 1,923 | | | $ | 892 | | | $ | 277 | |
| Income taxes (refunded) paid, net | 9 | | | (7) | | | 51 | |
| SUPPLEMENTAL DISCLOSURE OF CASH FLOW INFORMATION: | |
| SUPPLEMENTAL DISCLOSURE OF CASH FLOW INFORMATION: | |
| Cash interest paid for debt | |
| Cash interest paid for debt | |
| Cash interest paid for debt | |
| Cash interest paid for rent related to financing obligations | |
| Income taxes paid, net | |
| NON-CASH INVESTING AND FINANCING ACTIVITIES: | NON-CASH INVESTING AND FINANCING ACTIVITIES: | |
| Payables for capital expenditures | Payables for capital expenditures | 100 | | | 40 | | | 11 | |
| Exchange for sale-leaseback financing obligation | — | | | 246 | | | — | |
| Payables for capital expenditures | |
| Payables for capital expenditures | |
| | Convertible notes settled with shares | |
| Convertible notes settled with shares | |
| Convertible notes settled with shares | Convertible notes settled with shares | 440 | | | 454 | | | — | |
| Land contributed to joint venture | Land contributed to joint venture | 61 | | | — | | | — | |
| Shares issued to Former Caesars shareholders | — | | | 2,381 | | | — | |
|
The accompanying notes are an integral part of these consolidated financial statements.
CAESARS ENTERTAINMENT, INC.
NOTES TO CONSOLIDATED FINANCIAL STATEMENTS
The accompanying consolidated financial statements include the accounts of Caesars Entertainment, Inc., a Delaware corporation, and its consolidated subsidiaries which may be referred to as the “Company,” “CEI,” “Caesars,” “we,” “our,” “us,” or “us”the “Registrant” within these financial statements.
We also refer to (i) our Consolidated Financial Statements as our “Financial Statements,” (ii) our Consolidated Statements of Operations and Consolidated Statements of Comprehensive Income (Loss) as our “Statements of Operations,” (iii) our Consolidated Balance Sheets as our “Balance Sheets,” and (iv) our Consolidated Statements of Cash Flows as our “Statements of Cash Flows.Flows,” which are prepared in accordance with accounting principles generally accepted in the United States (“GAAP”). References to numbered “Notes” refer to Notes to our Consolidated Financial Statements included herein.
Note 1. Organization and Basis of Presentation
Organization
The Company is a geographically diversified gaming and hospitality company that was founded in 1973 by the Carano family with the opening of the Eldorado Hotel Casino in Reno, Nevada. Beginning in 2005, the Company grew through a series of acquisitions, including the acquisition of MTR Gaming Group, Inc. in 2014, Isle of Capri Casinos, Inc. (“Isle” or “Isle of Capri”) in 2017, and Tropicana Entertainment, Inc. in 2018. On July 20, 2020, the Company completed the merger with2018, Caesars Entertainment Corporation (“Former Caesars”in 2020, and William Hill PLC (the “William Hill Acquisition”) pursuant to which Former Caesars became a wholly-owned subsidiary of the Company (the “Merger”) and the Company changed theon April 22, 2021. The Company’s ticker symbol on the NASDAQ Stock Market from “ERI” tois “CZR”.
On April 22, 2021, the Company completed the acquisition of William Hill PLC for £2.9 billion, or approximately $3.9 billion (the “William Hill Acquisition”). See below for further discussion of the William Hill Acquisition.
The Company owns, leases, brands or manages an aggregate of 52 domestic properties in 1618 states with approximately 55,70051,300 slot machines, video lottery terminals and e-tables, approximately 2,9002,700 table games and approximately 47,70044,700 hotel rooms as of December 31, 2021.2023. The Company operates and conducts sports wagering across 21 states and domestic31 jurisdictions 14in North America, 25 of which are mobile foroffer online sports betting, and operates regulated online real money gaming businessesiGaming in 5 states.five jurisdictions in North America. In addition, we havethe Company has other domestic and international properties in North America that are authorized to use the brands and marks of Caesars Entertainment, Inc., as well as other non-gaming properties. The Company’s primary source of revenue is generated by ourits casino properties’ gaming operations, which includes retail and online sports betting as well asand online gaming, and the Company utilizes its hotels, restaurants, bars, entertainment, racing, retail shops and other services to attract customers to its properties.
The Company’s operations for retail and mobileonline sports betting, online casino,iGaming, and online poker are included under the Caesars Digital segment. The Company has made significant investments into the interactive business in recent years with, the completion of the Merger andamong other investments, the William Hill Acquisition. The Company has launched a significantAcquisition, strategic expansion into new markets as legalization permits, and marketing campaigncampaigns with distinguished actors, former athletes and media personalities promoting the launch of the Caesars Sportsbook app. The app offers numerous pre-match and live markets, extensive odds and flexible limits, player props, and same-game parlays. Caesars Sportsbook has partnerships with the NFL, NBA, NHL and MLB while being the exclusive odds provider for ESPN and CBS Sports. The Company also expects to continue to create new partnerships among collegiate and professional sports teams and recently entered into the exclusive naming-rights partnership that rebranded the Caesars Superdome. The Company expects to continue to expand its operations in the Caesars Digital segment as new jurisdictions legalize retail and online gaming and sports betting.
The Company has divested certain properties and other assets, including non-core properties and divestitures required by regulatory agencies. See Note 4 for a discussion of properties recently sold or currently held for sale and Note 19 for segment information. William Hill Acquisition
On September 30, 2020, the Company announced that it had reached an agreement with William Hill PLC on the terms of a recommended cash acquisition pursuant to which the Company would acquire the entire issued and to be issued share capital (other than shares owned by the Company or held in treasury) of William Hill PLC, in an all-cash transaction. On April 22, 2021, the Company completed the acquisition of William Hill PLC for £2.9 billion, or approximately $3.9 billion. See Note 3.
In connection with the William Hill Acquisition, on April 22, 2021, a newly formed subsidiary of the Company (the “Bridge Facility Borrower”) entered into a Credit Agreement (the “Bridge Credit Agreement”) with certain lenders party thereto and Deutsche Bank AG, London Branch, as administrative agent and collateral agent, pursuant to which the lenders party thereto provided the Debt Financing (as defined below). The Bridge Credit Agreement provides for (a) a 540-day £1.0 billion asset sale bridge facility, (b) a 60-day £503 million cash confirmation bridge facility and (c) a 540-day £116 million revolving credit
CAESARS ENTERTAINMENT, INC.
NOTES TO CONSOLIDATED FINANCIAL STATEMENTS (CONTINUED)
facility (collectively, the “Debt Financing”). The proceeds of the bridge loan facilities provided under the Bridge Credit Agreement were used (i) to pay a portion of the cash consideration for the acquisition and (ii) to pay fees and expenses related to the acquisition and related transactions. The proceeds of the revolving credit facility under the Bridge Credit Agreement may be used for working capital and general corporate purposes. The £1.5 billion Interim Facilities Agreement (the “Interim Facilities Agreement”) entered into on October 6, 2020 with Deutsche Bank AG, London Branch and JPMorgan Chase Bank, N.A., and amended on December 11, 2020, was terminated upon the execution of the Bridge Credit Agreement. On May 12, 2021, we repaid the £503 million cash confirmation bridge facility. On June 14, 2021, the Company drew down the full £116 million from the revolving credit facility and the proceeds, in addition to excess Company cash, were used to make a partial repayment of the asset sale bridge facility in the amount of £700 million. Outstanding borrowings under the Bridge Credit Agreement are expected to be repaid upon the sale of William Hill’s non-U.S. operations including the UK and international online divisions and the retail betting shops (collectively, “William Hill International”), all of which are held for sale as of the date of the closing of the William Hill Acquisition and reflected within discontinued operations. See Note 4. Certain investments acquired have been excluded from the held for sale asset group. See Note 8 for investments in which the Company elected to apply the fair value option.
On September 8, 2021, the Company entered into an agreement to sell William Hill International to 888 Holdings Plc for approximately £2.2 billion. After repayment of the outstanding debt under the Bridge Credit Agreement, described above, the Company expects to receive approximately £835 million, or $1.2 billion, subject to any permitted leakage, which is customary for sale transactions in the UK. In order to manage the risk of changes in the GBP denominated sales price and expected proceeds, the Company has entered into foreign exchange forward contracts. See Note 8. The sale is subject to satisfaction of customary conditions, including receipt of the approval of shareholders of 888 Holdings Plc and regulatory approvals, and is expected to close in the second quarter of 2022.
Consolidation of Horseshoe Baltimore
On August 26, 2021, the Company increased its ownership interest in CBAC Borrower, LLC (“Horseshoe Baltimore”), a property which it also manages, to approximately 75.8%. Caesars was subsequently determined to have a controlling financial interest in Horseshoe Baltimore and we began to consolidate the results of operations of the property following our change in ownership. See Note 3. Our previously held investment was remeasured as of the date of the change in ownership and the Company recognized a gain of $40 million during the year ended December 31, 2021. Management fees received prior to the consolidation event have been presented within the Managed and Branded segment. Following the increase in ownership, the operations of Horseshoe Baltimore are presented within the Regional segment.
Basis of Presentation
Our Financial Statements are prepared in accordance with accounting principles generally accepted in the United States, (“GAAP”), which requires management to make estimates and assumptions that affect the reported amounts of assets, liabilities, revenues, and expenses and the disclosure of contingent assets and liabilities. Management believes the accounting estimates are appropriate and reasonably determined. Actual amounts could materially differ from those estimates.
The William Hill Acquisition and rebranding of our interactive business (formerly, Caesars Interactive Entertainment “CIE” and now, inclusive of William Hill US, “Caesars Digital”) expanded our access to conduct sports wagering and iGaming operations. As a result, the Company has made a change to the composition of its reportable segments. The Las Vegas and Regional segments are substantially unchanged, while the former Managed, International and CIE reportable segment has been recast for all periods presented into two segments: Caesars Digital and Managed and Branded. As a result of the sale of Caesars Entertainment UK, including the interest in Emerald Resort & Casino (together, “Caesars UK Group”) and the announced sale of William Hill International, international operations of our non-managed properties are classified as discontinued operations. See Note 19 for a listing of properties included in each segment and the determination of our segments.
The presentation of financial information herein for the periods after the Company’s acquisitions of Former Caesars on July 20, 2020, William Hill on April 22, 2021 and the acquisition of an additional interest in Horseshoe Baltimore on August 26, 2021 is not fully comparable to the periods prior to the respective acquisitions. In addition, the presentation of financial information herein for the periods after the Company’s salesor before divestitures of various properties is not fully comparable to the periods prior to their respective purchase or after the sale dates. See Note 3 for further discussion of the acquisitions and related transactions and Note 4 for properties recently sold or currently held for sale.divested. Consolidation of Subsidiaries and Variable Interest Entities
Our Financial Statements include the accounts of Caesars Entertainment, Inc. and its subsidiaries after elimination of all intercompany accounts and transactions. See Note 2 for policy on consolidation of subsidiaries.
CAESARS ENTERTAINMENT, INC.
NOTES TO CONSOLIDATED FINANCIAL STATEMENTS (CONTINUED)
We consolidate all subsidiaries in which we have a controlling financial interest and variable interest entities (“VIEs”) for which we or one of our consolidated subsidiaries is the primary beneficiary. Control generally equates to ownership percentage, whereby (i) affiliates that are more than 50% owned are consolidated; (ii) investments in affiliates of 50% or less but greater than 20% are generally accounted for using the equity method where we have determined that we have significant influence over the entities; and (iii) investments in affiliates of 20% or less are generally accounted for as investments in equity securities.
We consider ourselves the primary beneficiary of a VIE when we have both the power to direct the activities that most significantly affect the results of the VIE and the right to receive benefits or the obligation to absorb losses of the entity that could be potentially significant to the VIE. We review our investments for VIE consideration if a reconsideration event occurs to determine if the investment continues to qualify as a VIE. If we determine an investment no longer qualifies as a VIE, there may be a material effect to our financial statements.
Consolidation of Korea Joint Venture
The Company was a member in a joint venture to acquire, develop, own, and operate a casino resort project in Incheon, South Korea (the “Korea JV”). We previously determined that the Korea JV was a VIE and the Company was the primary beneficiary, and therefore, we previously consolidated the Korea JV into our financial statements. As of December 31, 2020, the assets and liabilities of the Korea JV were classified as held for sale and consisted of $130 million of Property and equipment and Other assets and $130 million of current and other long-term liabilities. We sold our interest in the Korea JV on January 21, 2021 and derecognized its assets and liabilities from our Balance Sheets. There was no gain or loss associated with the sale.
Developments Related to COVID-19
In January 2020, an outbreak of a new strain of coronavirus (“COVID-19”) was identified and spread throughout much of the world, including the U.S. All of the Company’s casino properties were temporarily closed for the period from mid-March 2020 through mid-May 2020 due to orders issued by various government agencies and tribal bodies as part of certain precautionary measures intended to help slow the spread of COVID-19. During the year ended December 31, 2021, most of our properties experienced positive trends as restrictions on maximum capacities and amenities available were eased.
Following temporary furloughs and salary reductions during 2020, the Company has emphasized a focus on labor efficiencies as operations resumed. As properties began to reopen during the year ended December 31, 2020, certain capacity restrictions, mask mandates, sanitation guidelines, and the federal COVID-19 vaccine and testing emergency temporary standard were adhered to as required by governmental or tribal orders, directives, and guidelines.
The Company experienced positive operating trends in 2021, with a continued focus on operational efficiencies. Although the Company has experienced a decline in net income, Adjusted EBITDA and Adjusted EBITDA margins for the year ended December 31, 2021 exceeded pre-pandemic levels experienced in 2019 within our Las Vegas and Regional segments. However, certain revenue streams, such as convention and entertainment revenues, continued to be negatively impacted due to capacity restrictions in the first half of 2021. Future effects of COVID-19 from further outbreaks, including new variants, mask mandates or other restrictions are uncertain and could result in additional closures such as the temporary closure of Caesars Windsor from January 5, 2022 through January 31, 2022. Extensive closure periods impacting many of our properties would have a material adverse effect on future results of operations.
Note 2. Summary of Significant Accounting Policies
Additional significant accounting policy disclosures are provided within the applicable notesNotes to the Financial Statements.
Consolidation of Subsidiaries and Variable Interest Entities
We consolidate all subsidiaries in which we have a controlling financial interest and variable interest entities (“VIEs”) for which we or one of our consolidated subsidiaries is the primary beneficiary. Control generally equates to ownership percentage, whereby (i) affiliates that are more than 50% owned are consolidated; (ii) investments in affiliates of 50% or less but greater than 20% are generally accounted for using the equity method where we have determined that we have significant influence over the entities; and (iii) investments in affiliates of 20% or less are generally accounted for as investments in equity securities.
We consider ourselves the primary beneficiary of a VIE when we have both the power to direct the activities that most significantly affect the results of the VIE and the right to receive benefits or the obligation to absorb losses of the entity that could be potentially significant to the VIE. We review investments for VIE consideration if a reconsideration event occurs to determine if the investment qualifies, or continues to qualify, as a VIE. If we determine an investment qualifies, or no longer qualifies, as a VIE, there may be a material effect to our Financial Statements.
Cash and Cash Equivalents
Cash equivalents include investments in money market funds that can be redeemed immediately at the current net asset value per share. A money market fund is a mutual fund whose investments are primarily in short-term debt securities designed to maximize current income with liquidity and capital preservation, usually maintaining per share net asset value at a constant amount, such as one dollar. Cash and cash equivalents also include cash maintained for gaming operations. The carrying amounts approximate the fair value because of the short maturity of those instruments (Level 1). Cash and cash equivalents also include cash maintained for gaming operations.
Restricted Cash and Investments
Restricted cash includes cash equivalents held in certificates of deposit and cashaccounts or money market type funds, that are not subject to remeasurement on a recurring basis, which are restricted under certain operating agreements or restricted for future capital expenditures in the normal course of business.
Investments consist primarily of debt and equity securities, held by the Company’s captive insurance subsidiaries, which are regularly purchased with the intention to resell in the short term. Restricted investments included shares acquired in conjunction
CAESARS ENTERTAINMENT, INC.
NOTES TO CONSOLIDATED FINANCIAL STATEMENTS (CONTINUED)
with the Company’s sports betting agreements with William Hill that contained restrictions related to the ability to liquidate shares within a specified timeframe. As a result of the William Hill Acquisition, no restricted investments are held as of December 31, 2021. Trading securities are carried at fair value with changes in fair value recognized in current period income (See Note 8).
Advertising
Advertising costs are expensed in the period the advertising initially takes place. Advertising costs were $518$259 million, $64$571 million and $29$518 million for the years ended December 31, 2021, 20202023, 2022 and 2019,2021, respectively, and are included within operating expenses. During the yearyears ended December 31, 2022 and 2021, the Company launched significant television, radio and internet marketing campaigns promoting the Caesars Sportsbook. Advertising costs related to the Caesars Digital segment are primarily recorded in Casino and pari-mutuel commissions expense.
ReclassificationsInterest Expense, Net
Certain reclassifications of prior year presentations have been made to conform to the current period presentation. In June 2021, the Indiana Gaming Commission amended its order that previously required the Company to sell a third casino asset in the state. As a result, Horseshoe Hammond no longer meets the held for sale criteria. The assets and liabilities held for sale have been reclassified as held and used for all periods presented measured at the lower of the carrying amount, adjusted for depreciation and amortization that would have been recognized had the assets been continuously classified as held and used, and the fair value at the date of the amended ruling. Additionally, amounts previously presented in discontinued operations have been reclassified into continuing operations for all relevant periods presented. | | | | | | | | | | | | | | | | | |
| Years Ended December 31, |
| (In millions) | 2023 | | 2022 | | 2021 |
| Interest expense | $ | 2,394 | | | $ | 2,303 | | | $ | 2,320 | |
| Capitalized interest | (40) | | | (26) | | | (9) | |
| Interest income | (12) | | | (12) | | | (16) | |
| Total interest expense, net | $ | 2,342 | | | $ | 2,265 | | | $ | 2,295 | |
Recently Issued Accounting Pronouncements
Pronouncements Implemented in 2021
Effective January 1, 2021, we adopted Accounting Standards Updates (“ASU”) 2018-14, Compensation – Retirement Benefits – Defined Benefit Plans – General and ASU 2020-06, Debt with Conversion and Other Options and Derivatives and Hedging, which did not have a material effect on our Financial Statements.
Pronouncements to Be Implemented in Future Periods
In March 2020,December 2023, the FASBFinancial Accounting Standards Board (“FASB”) issued ASU 2020-04 (amended through January 2021), Reference Rate Reform. TheAccounting Standards Update (“ASU”) 2023-09, “Income Taxes: Improvements to Income Tax Disclosures,” which requires disaggregated information about an entity’s effective tax rate reconciliation as well as information on income taxes paid. These updates apply to all entities subject to income taxes and will be effective for annual periods beginning after December 15, 2024. Early adoption is permitted. Updates will be applied on a prospective basis with the option to apply the standard retrospectively. We do not expect the amendments in this update are intended to provide relief to the companies that have contracts, hedging relationships or other transactions that reference the London Inter-bank Offered Rate (“LIBOR”) or another reference rate which is expected to be discontinued because of reference rate reform on a prospective basis. The amendments provide optional expedients and exceptions for applying GAAP to contracts, hedging relationships, and other transactions if certain criteria are met. The adoption of, and future elections under, ASU 2020-04 are not expected to have a material impact on our Financial Statements asStatements.
CAESARS ENTERTAINMENT, INC.
NOTES TO CONSOLIDATED FINANCIAL STATEMENTS (CONTINUED)
In November 2023, the standard will ease, if warranted,FASB issued ASU 2023-07, “Segment Reporting: Improvements to Reportable Segment Disclosures,” which requires public entities to disclose information about their reportable segments’ significant expenses on an interim and annual basis. This guidance is effective for years beginning after December 15, 2023, and interim period within years beginning after December 15, 2024. Early adoption is permitted. Amendments in this update should be applied retrospectively to all prior periods presented in the requirements for accounting forfinancial statements. We do not expect the future effects of the rate reform. The amendments in this update are effective as of March 12, 2020 and companies may elect to apply the amendments prospectively through December 31, 2022. We have not yet adopted this new guidance as of December 31, 2021.
LIBOR is expected to be discontinued by lending institutions after December 31, 2021 for new debt agreements and after June 30, 2023 no additional LIBOR rates will be available. We have variable rate debt instruments which are subject to LIBOR interest rates plus a margin or base rate. Our CRC Credit Facility contains alternative rates in the event that LIBOR is no longer available. The Baltimore Term Loan has been amended and we intend to work with our lenders to ensure any transition away from LIBOR will have minimalmaterial impact on our financial condition, but can provideFinancial Statements.
In October 2023, the FASB issued ASU 2023-06, “Disclosure Improvements: Codification Amendments In Response to the SEC’s Disclosure Update and Simplification Initiative,” to clarify or improve disclosure and presentation requirements on a variety of topics and align the requirements in the FASB accounting standard codification with the Securities and Exchange Commission regulations. This guidance is effective for the Company no assurances regardinglater than June 30, 2027. We do not expect the amendments in this update to have a material impact of the discontinuation of LIBOR. Our interest rate swaps mature on December 31, 2022.our Financial Statements.
Note 3. Acquisitions, Purchase Price Accounting and Pro forma Information
Acquisition of William Hill
On April 22, 2021, we completed the previously announced acquisition of William Hill PLC for cash consideration of approximately £2.9 billion, or approximately $3.9 billion, based on the GBP to USD exchange rate on the closing date. Restricted cash which was held in escrow as of December 31, 2020 was used to complete the acquisition.
Prior to the acquisition,We acquired William Hill PLC’sPLC and its U.S. subsidiary, William Hill U.S. Holdco Inc. (“William Hill US” and together with William Hill PLC, “William Hill”) operated 37 sportsbooks at our propertiesto better position the Company to address the extensive usage of digital platforms, continued legalization in 8 states. Subsequent to the William Hill Acquisition, we conducted sports wagering in 21additional states and domestic jurisdictions, acrossand growing bettor demand, which are driving the market for online sports betting platforms in the U.S. as of December 31, 2021. Additionally,In addition, we operated regulated online real money gaming businesses in 5 states as of December 31, 2021 and we
CAESARS ENTERTAINMENT, INC.
NOTES TO CONSOLIDATED FINANCIAL STATEMENTS (CONTINUED)
continue to leverage the World Series of Poker (“WSOP”) brand and license the WSOP trademarks for a variety of products and services. Extensive usage ofservices across these digital platforms, continued legalization in additional states, and growing bettor demand are drivingplatforms. At the market for online sports betting platforms in the U.S. andtime that the William Hill Acquisition positioned uswas consummated, the Company’s intent was to address this growing market. divest William Hill International.
On September 8, 2021, the Company entered into an agreement to sell William Hill International to 888 Holdings Plc for approximately £2.2 billion. TheOn April 7, 2022, the Company amended the agreement to sell William Hill International to 888 Holdings Plc for a revised enterprise value of approximately £2.0 billion. During the year ended December 31, 2022, the Company recorded impairments to assets held for sale is subjectof $503 million within discontinued operations based on the revised and final sales price. On July 1, 2022, the Company completed the sale of William Hill International to satisfaction of customary conditions, including receipt of888 Holdings Plc.
Prior to the approval of shareholders and regulatory approvals, and is expected to close inacquisition, the second quarter of 2022.
The Company previously held an equity interestaccounted for its investment in William Hill PLC as an investment in equity securities and William Hill US (see Note 5).as an equity method investment. Accordingly, the acquisition iswas accounted for as a business combination achieved in stages, or a “step acquisition.”
As mentioned above, the total purchase consideration for William Hill was approximately $3.9 billion. The estimated purchase consideration in the acquisition was determined with reference to its acquisition date fair value.
| | | | | |
| (In millions) | Consideration |
Cash for outstanding William Hill common stock(a) | $ | 3,909 | |
| Fair value of William Hill equity awards | 30 | |
| Settlement of preexisting relationships (net of receivable/payable) | 7 | |
| Settlement of preexisting relationships (net of previously held equity investment and off-market settlement) | (34) | |
| Total purchase consideration | $ | 3,912 | |
Preliminary____________________
(a)William Hill common stock of approximately 1.0 billion shares as of the acquisition date was paid at £2.72 per share, or approximately $3.77 per share using the GBP to USD exchange rate on the acquisition date.
CAESARS ENTERTAINMENT, INC.
NOTES TO CONSOLIDATED FINANCIAL STATEMENTS (CONTINUED)
Final Purchase Price Allocation
The purchase price allocation for William Hill is preliminary as it relates to determining the fair value of certain assets and liabilities, including goodwill, and is subject to change. The fair values are based on management’s analysis, including preliminary work performed by third-party valuation specialists, which are subject to finalizationand were finalized over the one-year measurement period. The following table summarizes the preliminary allocation of the purchase consideration to the identifiable assets acquired and liabilities assumed of William Hill, with the excess recorded as goodwill as of December 31, 2021:2022:
| | | | | |
| (In millions) | Fair Value |
| Other current assets | $ | 164 | |
| Assets held for sale | 4,337 | |
| Property and equipment, net | 55 | |
| Goodwill | 1,1481,154 | |
Intangible assets (a) | 565 | |
| Other noncurrent assets | 317 | |
| Total assets | $ | 6,5866,592 | |
| |
| Other current liabilities | $ | 242 | |
Liabilities related to assets held for sale (b) | 2,142 | |
| Deferred income taxes | 245251 | |
| Other noncurrent liabilities | 35 | |
| Total liabilities | 2,6642,670 | |
| Noncontrolling interests | 10 | |
| Net assets acquired | $ | 3,912 | |
____________________
(a)Intangible assets consist of gaming rights valued at $80 million, trademarks valued at $27 million, developed technology valued at $110 million, reacquired rights valued at $280 million and customeruser relationships valued at $68 million.
(b)Includes the fair value of debt of $1.1 billion related to William Hill International at the acquisition date.
The preliminary purchase price allocation is subject to a measurement period and has since been revised. Assets and liabilities held for sale noted above are substantially all related to William Hill International and during the fourth quarter ended December 31, 2021, management has revised the estimated fair value of the William Hill International operations which has resulted in changes in net assets and the allocation of goodwill. The net impact of these changes was an increase of $4 million to other current assets, a $38 million decrease to assets held for sale, a $46 million increase to goodwill, a $10 million increase to other noncurrent assets, a $7 million decrease to other current liabilities, a $12 million increase to liabilities related to assets held for sale, and a $17 million increase to deferred income taxes. The effect of these revisions during the quarter did not have an impact on our Statements of Operations.
CAESARS ENTERTAINMENT, INC.
NOTES TO CONSOLIDATED FINANCIAL STATEMENTS (CONTINUED)
The fair values of the assets acquired and liabilities assumed were determined using the market, income, and cost approaches, or a combination. Valuation methodologies under both a market and income approach used for the identifiable net assets acquired in the William Hill acquisitionAcquisition make use of Level 3 inputs, such as expected cash flows and projected financial results. The market approach indicates value for a subject asset based on available market pricing for comparable assets.
Trade receivables and payables and other current and noncurrent assets and liabilities were valued at the existing carrying values as they represented the estimated fair value of those items at the William Hill acquisition date.
Assets and liabilities held for sale substantially representrepresented William Hill International which has been initiallywas valued using a combination of approaches including a market approach based on valuation multiples and EBITDA, the relief from royalty method and the replacement cost method. In addition to the approaches described, our estimates have beenwere updated to reflect the sale price of William Hill International in the proposed sale to 888 Holdings Plc, described above.
The acquired net assets of William Hill included certain investments in common stock. Investments with a publicly available share price were valued using the share price on the acquisition date. Investments without publicly available share data were valued at their carrying value, which approximated fair value.
Other personal property assets such as furniture, equipment, computer hardware, and fixtures were valued using a cost approach which determined that the carrying values represented fair value of those items at the William Hill acquisition date.
Trademarks and developed technology were valued using the relief from royalty method, which presumes that without ownership of such trademarks or technology, the Company would have to make a series of payments to the assets’ owner in return for the right to use their brand or technology. By virtue of their ownership of the respective intangible assets, the Company avoids any such payments and records the related intangible value. The estimated useful lives of the trademarks and developed technology arewere approximately 15 years and six years, respectively, from the acquisition date.
Online user relationships are valued using a cost approach based on the estimated marketing and promotional cost to acquire the new active user base if the user relationships were not already in place and needed to be replaced. We estimateestimated the useful life of the user relationships to be approximately three years from the acquisition date.
CAESARS ENTERTAINMENT, INC.
NOTES TO CONSOLIDATED FINANCIAL STATEMENTS (CONTINUED)
Operating agreements with non-Caesars entities allowed William Hill to operate retail and online sportsbooks as well as online gaming within certain states. These agreements arewere valued using the excess earnings method, estimating the projected profits of the business attributable to the rights afforded through the agreements, adjusted for returns of other assets that contribute to the generation of this profit, such as working capital, fixed assets and other intangible assets. We estimateestimated the useful life of these operating agreements to be approximately 20 years from the acquisition date and have included them within amortizing gaming rights.
The reacquired rights intangible asset represents the estimated fair value of the Company’s share of the William Hill’s forecasted profits arising from the prior contractual arrangement with the Company to operate retail and online sportsbooks and online gaming. This fair value estimate was determined using the excess earnings method, an income-based approach that reflects the present value of the future profit William Hill expected to earn over the remaining term of the contract, adjusted for returns of other assets that contribute to the generation of this profit, such as working capital, fixed assets and other intangible assets. The forecasted profit used within thisthe valuation iswas adjusted for the settlement of the preexisting relationship noted previously in the calculation of the purchase consideration in order to avoid double counting of thisthe settlement. Reacquired rights are amortizable over the remaining contractual period of the contract in which the rights were granted and estimated to be approximately 24 years from the acquisition date.
Goodwill is the result of expected synergies from the operations of the combined company and future customer relationships including the brand names and strategic partner relationships of Caesars and the technology and assembled workforce of William Hill. The goodwill acquired will not generate amortization deductions for income tax purposes.
The fair value of long-term debt assumed has beenwas calculated based on market quotes.
The Company recognized acquisition-related transaction costs of $68$21 million and $8$68 million for the years ended December 31, 20212022 and 2020,2021, respectively, excluding additional transaction costs associated with sale of William Hill International. These costs were primarily associated with legal, and professional services, and certain severance and retention costs and were primarily recorded in Transaction costs and other operating costs, net in our Statements of Operations.
For the period of April 22, 2021 through December 31, 2021, the operations of William Hill generated net revenues of $183 million, excluding discontinued operations (see Note 4)4), and a net loss of $415 million.
CAESARS ENTERTAINMENT, INC.
NOTES TO CONSOLIDATED FINANCIAL STATEMENTS (CONTINUED)
Unaudited Pro Forma Financial Information
The following unaudited pro forma financial information is presented to illustrate the estimated effects of the William Hill Acquisition as if it had occurred on January 1, 2020. The pro forma amounts include the historical operating results of the Company and William Hill prior to the acquisition, with adjustments directly attributable to the acquisition. The pro forma results include adjustments and consequential tax effects to reflect incremental amortization expense to be incurred based on preliminary fair values of the identifiable intangible assets acquired, eliminate gains and losses related to certain investments and adjustments to the timing of acquisition related costs and expenses incurred during the year ended December 31, 2021. The unaudited pro forma financial information is not necessarily indicative of the financial position or results that would have occurred had the William Hill Acquisition been consummated as of the dates indicated, nor is it indicative of any future results. TheIn addition, the unaudited pro forma financial information does not includereflect the operationsexpected realization of William Hill International as such operations were expected to be divested uponany synergies or cost savings associated with the acquisition date.acquisition.
| | | | | | | | | | | |
| Years Ended December 31, |
| (In millions) | 2021 | | 2020 |
| Net revenues | $ | 9,696 | | | $ | 3,834 | |
| Net loss | (893) | | | (1,991) | |
| Net loss attributable to Caesars | (896) | | | (1,989) | |
| | | | | | | |
| (In millions) | Year Ended December 31, 2021 | | |
| Net revenues | $ | 9,696 | | | |
| Net loss | (893) | | | |
| Net loss attributable to Caesars | (896) | | | |
Consolidation of Horseshoe Baltimore
On July 10, 2023, the Company completed the acquisition of the remaining 24.2% equity ownership in Horseshoe Baltimore, utilizing cash on hand, for a total of $66 million.
On August 26, 2021 (the “Consolidation Date”), the Company increased its ownership interest in Horseshoe Baltimore, a property which it also manages,managed, to approximately 75.8% for cash consideration of $55 million. Our previously held investment was remeasured as of the date of the change in ownership and the Company recognized a gain of $40 million during the year ended December 31, 2021. Subsequent to the change in ownership, the Company was determined to have a controlling financial interest and has begunbegan to consolidate the operations of Horseshoe Baltimore.
CAESARS ENTERTAINMENT, INC.
NOTES TO CONSOLIDATED FINANCIAL STATEMENTS (CONTINUED)
Prior to the purchase, the Company held an interest in Horseshoe Baltimore of approximately 44.3% which was accounted for as an equity method investment. Our previously held investment was remeasured as of the date of our change in ownership and the Company recorded a gain of approximately $40 million, which was recorded in Other income (loss) on our Statements of Operations.
| | | | | |
| (In millions) | Consideration |
| Cash for additional ownership interest | $ | 55 | |
| Preexisting relationships (net of receivable/payable) | 18 | |
| Preexisting relationships (net of previously held equity investment) | 81 | |
| Total purchase consideration | $ | 154 | |
PreliminaryFinal Purchase Price Allocation
The purchase price allocation for Horseshoe Baltimore is preliminary as it relates to determining the fair value of certain assets and liabilities, including potential goodwill, and is subject to change. The estimated fair values are based on management’s analysis, including preliminary work performed by a third-party valuation specialist, which is subject to finalizationand were finalized over the one-year measurement period. The following table summarizes the preliminary allocation of the purchase consideration to the
CAESARS ENTERTAINMENT, INC.
NOTES TO CONSOLIDATED FINANCIAL STATEMENTS (CONTINUED)
identifiable assets and liabilities of Horseshoe Baltimore, with any potential excess recorded as goodwill as of December 31, 2021:2022:
| | | | | |
| (In millions) | Fair Value |
| Current assets | $ | 60 | |
| Property and equipment, net | 317 | |
| Goodwill | 63 | |
Intangible assets (a) | 53 | |
| Other noncurrent assets | 183 | |
| Total assets | $ | 676 | |
| |
| Current liabilities | $ | 26 | |
| Long-term debt | 272 | |
| Other long-term liabilities | 182 | |
| Total liabilities | 480 | |
| Noncontrolling interests | 42 | |
| Net assets acquired | $ | 154 | |
____________________
(a)Intangible assets consist of gaming rights valued at $43 million and customer relationships valued at $10 million.
As noted above, the preliminary purchase price allocation is subject to a measurement period and our estimates as of September 30, 2021 have been revised. The net impact of these changes in our preliminary valuations was a $102 million increase to property and equipment, net, a $63 million increase to goodwill, a $188 million decrease to intangible assets, a $47 million increase to other noncurrent assets, and a $24 million increase in other long-term liabilities. The effect of these revisions during the quarter did not have a material impact on our Statements of Operations.
The fair values of the assets acquired and liabilities assumed were determined using the market, income, and cost approaches, or a combination. Valuation methodologies under both a market and income approach used for the identifiable net assets acquired in theof Horseshoe Baltimore acquisitionon the Consolidation Date make use of Level 3 inputs, such as expected cash flows and projected financial results. The market approach indicates value for a subject asset based on available market pricing for comparable assets.
Trade receivables and payables and other current and noncurrent assets and liabilities were valued at the existing carrying values as they represented the estimated fair value of those items aton the Horseshoe Baltimore acquisition date.Consolidation Date.
Other personal property assets such as furniture, equipment, computer hardware, and fixtures were valued at the existing carrying values as they closely represented the estimated fair value of those items aton the Horseshoe Baltimore acquisition date. Consolidation Date.
The fair value of the buildings and improvements were estimated via the income approach. The remaining estimated useful life of the buildings and improvements on the Consolidation Date is 40 years.
The right of use asset and operating lease liability related to a ground lease for the site on which Horseshoe Baltimore is located was recorded at fair value and will be amortized over the estimated remaining useful life due to changes in the underlying fair value and estimated remaining useful life of the building and improvements. Renewal options are considered to be reasonably certain. The income approach was used to determine fair value, based on the estimated present value of the future lease payments over the lease term, including renewal options, using an incremental borrowing rate of approximately 7.6%.
Customer relationships are valued using an income approach, comparing the prospective cash flows with and without the customer relationships in place to estimate the fair value of the customer relationships, with the fair value assumed to be equal to the discounted cash flows of the business that would be lost if the customer relationships were not in place and needed to be replaced. We estimate the useful life of these customer relationships to be approximately seven years.years from the Consolidation Date.
CAESARS ENTERTAINMENT, INC.
NOTES TO CONSOLIDATED FINANCIAL STATEMENTS (CONTINUED)
The fair value of the gaming rights was determined using the excess earnings method, which is an income approach methodology that estimates the projected cash flows of the business attributable to the gaming license intangible asset, which is net of charges for the use of other identifiable assets of the business including working capital, fixed assets and other intangible assets. The acquired gaming rights are considered to have an indefinite life.
The goodwill acquired will generate amortization deductions for income tax purposes.
The fair value of long-term debt has been calculated based on market quotes.
CAESARS ENTERTAINMENT, INC.
NOTES TO CONSOLIDATED FINANCIAL STATEMENTS (CONTINUED)
For the period of August 26, 2021 through December 31, 2021, the operations of Horseshoe Baltimore generated net revenues of $72 million, and a net income of $4 million.
Unaudited Pro Forma Financial Information
The following unaudited pro forma financial information is presented to illustrate the estimated effects of the Horseshoe Baltimore consolidation as if it had occurred on January 1, 2020. The pro forma amounts include the historical operating results of the Company and Horseshoe Baltimore prior to the consolidation. The pro forma results include adjustments and consequential tax effects to reflect incremental amortization expense to be incurred based on preliminary fair values of the identifiable intangible assets acquired and the adjustments to eliminate certain revenues and expenses which are considered intercompany activities. The unaudited pro forma financial information is not necessarily indicative of the financial results that would have occurred had the consolidation of Horseshoe Baltimore occurred as of the dates indicated, nor is it indicative of any future results. In addition, the unaudited pro forma financial information does not reflect the expected realization of any synergies or cost savings associated with the consolidation.
| | | | | | | | | | | |
| Years Ended December 31, |
| (In millions) | 2021 | | 2020 |
| Net revenues | $ | 9,693 | | | $ | 3,764 | |
| Net loss | (1,049) | | | (1,784) | |
| Net loss attributable to Caesars | (1,056) | | | (1,778) | |
Merger with Caesars Entertainment Corporation
On July 20, 2020, the Merger was consummated and Former Caesars became a wholly-owned subsidiary of the Company. The strategic rationale for the Merger includes, but is not limited to, the following:
•Creation of the largest owner, operator and manager of domestic gaming assets
•Diversification of the Company’s domestic footprint
•Access to iconic brands, rewards programs and new gaming opportunities expected to enhance customer experience
•Realization of significant identified synergies
The total purchase consideration for Former Caesars was $10.9 billion. The estimated purchase consideration in the acquisition was determined with reference to its acquisition date fair value.
| | | | | | | |
| (In millions) | ConsiderationYear Ended December 31, 2021 | | |
Cash consideration paidNet revenues | $ | 6,0909,693 | |
| Shares issued to Former Caesars shareholders (a)
| 2,381 |
Cash paid to retire Former Caesars debt | 2,356 | |
Other consideration paid | 48 | |
Total purchase consideration | $ | 10,875 | |
____________________
(a)Former Caesars common stock was converted into the right to receive approximately 0.3085 shares of the Company’s Common Stock, with a value equal to approximately $12.41 in cash (based on the volume weighted average price per share of the Company’s Common Stock for the ten trading days ending on July 16, 2020).
CAESARS ENTERTAINMENT, INC.
NOTES TO CONSOLIDATED FINANCIAL STATEMENTS (CONTINUED)
Final Purchase Price Allocation
The fair values are based on management’s analysis including work performed by third party valuation specialists, which were finalized over the one-year measurement period. The following table summarizes the allocation of the purchase consideration to the identifiable assets acquired and liabilities assumed of Former Caesars, with the excess recorded as goodwill as of December 31, 2021:
| | | | | | | |
(In millions) | Fair Value | | |
Current and other assets | $ | 3,540 | | | |
Property and equipment | 13,096 | | | |
| | | |
Goodwill | 9,064 | | | |
Intangible assets (a)
| 3,394 | | | |
Other noncurrent assets | 710 | | | |
Total assets | $ | 29,804 | | | |
| | | |
Current liabilities | $ | 1,771 | | | |
Financing obligation | 8,149 | | | |
Long-term debt | 6,591 | | | |
Noncurrent liabilities | 2,400 | | | |
Total liabilities | 18,911 | | | |
Noncontrolling interests | 18 | | | |
Net assets acquiredloss | $(1,049) | | | |
| Net loss attributable to Caesars | 10,875 (1,056) | | | |
____________________
(a)Intangible assets consist of gaming rights valued at $396 million, trade names valued at $2.1 billion, the Caesars Rewards programs valued at $523 million and customer relationships valued at $425 million.
The fair values of the assets acquired and liabilities assumed were determined using the market, income, and cost approaches, or a combination. Valuation methodologies under both a market and income approach used for the identifiable net assets acquired in the Former Caesars acquisition make use of Level 3 inputs, such as expected cash flows and projected financial results. The market approach indicates value for a subject asset based on available market pricing for comparable assets.
Trade receivables and payables and other current and noncurrent assets and liabilities were valued at the existing carrying values as they represented the estimated fair value of those items at the Former Caesars acquisition date. Assets and liabilities held for sale are recorded at fair value, less costs to sell, based on the agreements reached as of the acquisition date, or an income approach.
Certain financial assets acquired were determined to have experienced more than insignificant deterioration of credit quality since origination. A reconciliation of the difference between the purchase price of financial assets, including acquired markers, and the face value of the assets is as follows:
| | | | | |
Purchase price of financial assets | $ | 95 | |
Allowance for credit losses at the acquisition date based on the acquirer’s assessment | 89 | |
Discount attributable to other factors | 2 | |
Face value of financial assets | $ | 186 | |
The fair value of land was determined using the sales comparable approach. The market data is then adjusted for any significant differences, to the extent known, between the identified comparable sites and the site being valued. The value of building and site improvements was estimated via the income approach. Other personal property assets such as furniture, gaming and computer equipment, fixtures, computer software, and restaurant equipment were valued using the cost approach which is based on replacement or reproduction costs of the asset. The cost approach is an estimation of fair value developed by computing the current cost of replacing a property and subtracting any depreciation resulting from one or more of the following factors: physical deterioration, functional obsolescence, and/or economic obsolescence.
Non-amortizing intangible assets acquired primarily include trademarks, Caesars Rewards and gaming rights. The fair value for these intangible assets was determined using either the relief from royalty method and excess earnings method under the income approach or a replacement cost market approach.
Trademarks and Caesars Rewards were valued using the relief from royalty method, which presumes that without ownership of such trademarks or loyalty program, the Company would have to make a stream of payments to a brand or franchise owner in
CAESARS ENTERTAINMENT, INC.
NOTES TO CONSOLIDATED FINANCIAL STATEMENTS (CONTINUED)
return for the right to use their name or program. By virtue of this asset, the Company avoids any such payments and records the related intangible value of the Company’s ownership of the brand name or program. The acquired trademarks, including Caesars Rewards are indefinite lived intangible assets.
Customer relationships are valued using an income approach, comparing the prospective cash flows with and without the customer relationships in place to estimate the fair value of the customer relationships, with the fair value assumed to be equal to the discounted cash flows of the business that would be lost if the customer relationships were not in place and needed to be replaced. We estimate the useful life of these customer relationships to be approximately seven years from the Merger date.
Gaming rights include our gaming licenses in various jurisdictions and may have indefinite lives or an estimated useful life. The fair value of the gaming rights was determined using the excess earnings or replacement cost methodology, based on whether the license resides in gaming jurisdictions where competition is limited to a specified number of licensed gaming operators. The excess earnings methodology is an income approach methodology that estimates the projected cash flows of the business attributable to the gaming license intangible asset, which is net of charges for the use of other identifiable assets of the business including working capital, fixed assets and other intangible assets. The replacement cost of the gaming license was used as an indicator of fair value. The acquired gaming rights have indefinite lives, with the exception of one jurisdiction in which we estimate the useful life of the license to be approximately 34 years from the Merger date.
Goodwill is the result of expected synergies from the operations of the combined company and the assembled workforce of Former Caesars. The final assignment of goodwill to reporting units has not been completed. The goodwill acquired will not generate amortization deductions for income tax purposes.
The fair value of long-term debt has been calculated based on market quotes. The fair value of the financing obligations were calculated as the net present value of both the fixed base rent payments and the forecasted variable payments plus the expected residual value of the land and building returned at the end of the expected usage period.
The Company recognized acquisition-related transaction costs of $30 million, $160 million and $80 million for the years ended December 31, 2021, 2020 and 2019, respectively, in connection with the Merger. Transaction costs were associated with legal, IT costs, internal labor and professional services and were recorded in Transaction costs and other operating costs in our Statements of Operations.
For the period of July 20, 2020 through December 31, 2020, the properties of Former Caesars generated net revenues of $2.1 billion, excluding discontinued operations, and a net loss of $1.2 billion.
Unaudited Pro Forma Information
The following unaudited pro forma financial information is presented to illustrate the estimated effects of the acquisition of Former Caesars as if it had occurred on January 1, 2019. The pro forma amounts include the historical operating results of the Company and Former Caesars prior to the acquisition, with adjustments directly attributable to the acquisition. The pro forma results include adjustments and consequential tax effects to reflect incremental depreciation and amortization expense to be incurred based on preliminary fair values of the identifiable property and equipment and intangible assets acquired, the incremental interest expense associated with the issuance of debt to finance the acquisition and the adjustments to exclude acquisition related costs incurred during the year ended December 31, 2020 as if incurred on January 1, 2019. The unaudited pro forma financial information is not necessarily indicative of what the consolidated results of operations of the combined company were, nor does it reflect the expected realization of any synergies or cost savings associated with the acquisition.
| | | | | | | | | | | | | |
| Years Ended December 31, | | |
| (In millions) | 2020 | | 2019 | | |
| Net revenues | $ | 5,926 | | | $ | 10,534 | | | |
| Net loss | (2,738) | | | (1,069) | | | |
| Net loss attributable to Caesars | (2,670) | | | (1,065) | | | |
Note 4. AssetsDivestitures and Liabilities Held for SaleDiscontinued Operations
The Company periodically divests assets that it does not consider core to its business to raise capital or, in someprevious cases, to comply with conditions, terms, obligations or restrictions imposed by antitrust, gaming and other regulatory entities. The carrying value of assets that meet the criteria for assetnet assets held for sale are compared to the expected selling price and any expected losses are recorded immediately. Gains or losses associated with the disposal of assets held for sale are recorded within other operating costs, unless the assets represent a discontinued operation.
CAESARS ENTERTAINMENT, INC.
NOTES TO CONSOLIDATED FINANCIAL STATEMENTS (CONTINUED)
Held for sale - Continuing operations
Rio, Baton Rouge, Evansville and MontBleu Divestitures
On December 1, 2020,October 2, 2023, the Company’s lease term related to certain assets of Rio All-Suite Hotel & Casino (“Rio”) ended and all operations were assumed by the lessor. Rio was reported within the Las Vegas segment.
On May 5, 2022, the Company entered into a definitive agreement to sellconsummated the operationssale of the equity interests of Belle of Baton Rouge Casino & Hotel (“Baton Rouge”) to CQ Holding Company, Inc. As a result, an impairment charge totaling $50 million was recorded during the year ended December 31, 2020 due to the carrying value exceeding the estimated net sales proceeds. The transaction has received regulatory approvals and is expected to close in the first quarter of 2022, subject to other customary closing conditions. Baton Rouge met the requirements for presentation as assets held for sale as of December 31, 2021.
The assets and liabilities held for sale within continuing operations, accounted for at carrying value unless fair value is lower, were as follows as of December 31, 2021 and 2020:
| | | | | | | | | | | |
|
| Baton Rouge |
| (In millions) | December 31, 2021 | | December 31, 2020 |
| Assets: | | | |
| | | |
| | | |
| | | |
| | | |
| | | |
| | | |
| Cash | $ | 3 | | | $ | 2 | |
| Property and equipment, net | 2 | | | 2 | |
| | | |
| | | |
| Other assets, net | 1 | | | 1 | |
| Assets held for sale | $ | 6 | | | $ | 5 | |
| Liabilities: | | | |
| Current liabilities | $ | 3 | | | $ | 2 | |
| | | |
| | | |
| | | |
| | | |
| | | |
| Other long-term liabilities | 1 | | | 1 | |
| Liabilities related to assets held for sale | $ | 4 | | | $ | 3 | |
The following information presents the net revenues and net loss of our held for sale property, with operations included in continuing operations, that has not been sold:
| | | | | | | | | | | |
|
| Baton Rouge |
| Years Ended December 31, |
| (In millions) | 2021 | | 2020 |
| Net revenues | $ | 17 | | | $ | 15 | |
| Net loss | (2) | | | (70) | |
Held for sale - Sold
Presque, Nemacolin, Mountaineer, Caruthersville, Cape Girardeau, Kansas City, Vicksburg, Shreveport, MontBleu, and Evansville Divestitures
The sale of Presque Isle Downs & Casino (“Presque”) closed on January 11, 2019, resulting in a gain on saleloss of $22 million, net of final working capital adjustments, for the year ended December 31, 2019. The sale of Lady Luck Casino Nemacolin (“Nemacolin”) closed on March 8, 2019 resulting in a gain of less than $1 million on the sale, net of final working capital adjustments, for the year ended December 31, 2019. The sales of Mountaineer Casino, Racetrack and Resort (“Mountaineer”), Lady Luck Casino Caruthersville (“Caruthersville”) and Isle Casino Cape Girardeau (“Cape Girardeau”) were consummated on December 6, 2019, resulting in a gain of $29 million for the year ended December 31, 2019. On July 1, 2020, the Company consummated the sale of the equity interests of the entities that hold Lady Luck Casino Vicksburg (“Vicksburg”) and Isle of Capri Kansas City (“Kansas City”) to Bally’s Corporation (formerly Twin River Worldwide Holdings, Inc.) for $230 million resulting in a gain of $8$3 million. On December 23, 2020, the Company consummated the sale of Eldorado Shreveport (“Shreveport”) to Bally's Corporation for $140 million resulting in a gain of $29 million.
On April 24, 2020, the Company entered into a definitive agreement to sell the equity interests of MontBleu Casino Resort & Spa (“MontBleu”) to Bally’s Corporation. As a result, an impairment charge totaling $45 million was recorded during the year ended December 31, 2020 due to the carrying value exceeding the estimated net sales proceeds. On April 6, 2021, the Company consummated the sale of the equity interests of MontBleu to Bally’s Corporation for $15 million, subject to a customary working capital adjustment, resulting in a gain of less than $1 million. The purchase price for MontBleu is due no later than the first anniversary of the consummation of the transaction.
On June 3, 2021, the Company consummated the sale of the real property and equity interests of Tropicana Evansville (“Evansville”) to Gaming and Leisure Properties, Inc. (“GLPI”) and Bally’s Corporation, respectively, for $480 million, subject to a customary working capital adjustment, resulting in a gain of $12 million.
CAESARS ENTERTAINMENT, INC.
NOTES TO CONSOLIDATED FINANCIAL STATEMENTS (CONTINUED)
the equity interests of MontBleu Casino Resort & Spa (“MontBleu”) to Bally’s Corporation for $15 million, resulting in a gain of less than $1 million. The Company received the payment in full on April 5, 2022.Prior to their respective closing dates, Presque, Nemacolin, Mountaineer, Caruthersville, Cape Girardeau, Kansas City, Vicksburg, Shreveport,Baton Rouge, Evansville and MontBleu and Evansville met the requirements for presentation as assets held for sale. However, they did not meet the requirements for presentation as discontinued operations. All properties were previously reported in the Regional segment.
CAESARS ENTERTAINMENT, INC.
NOTES TO CONSOLIDATED FINANCIAL STATEMENTS (CONTINUED)
The following information presents the net revenues and net income (loss) of previously held for sale properties, which were recently sold:recent divestitures:
| | | | | | | | | | | | | | | | | |
|
| | | | | | | Year Ended December 31, 2021 |
| (In millions) | | | | | | | Evansville | | MontBleu |
| Net revenues | | | | | | | $ | 58 | | | $ | 11 | |
| Net income | | | | | | | 26 | | | 4 | |
| | | | | |
| Year Ended December 31, 2023 |
| (In millions) | Rio |
| Net revenues | $ | 145 | |
| Net income | 15 | |
| | | Year Ended December 31, 2020 |
| Year Ended December 31, 2022 | | | Year Ended December 31, 2022 |
| (In millions) | (In millions) | | Kansas City | | Vicksburg | | Shreveport | | Evansville | | MontBleu | (In millions) | Rio | | Baton Rouge |
| Net revenues | Net revenues | | $ | 18 | | | $ | 7 | | | $ | 68 | | | $ | 98 | | | $ | 31 | |
| Net income (loss) | Net income (loss) | | 3 | | | (1) | | | 12 | | | (5) | | | (42) | |
| | | Year Ended December 31, 2019 |
| Year Ended December 31, 2021 | |
| Year Ended December 31, 2021 | |
| Year Ended December 31, 2021 | |
| (In millions) | (In millions) | Presque | | Nemacolin | | Mountaineer | | Cape
Girardeau | | Caruthersville | | Kansas City | | Vicksburg | (In millions) | Rio | | Baton Rouge | | Evansville | | MontBleu |
| Net revenues | Net revenues | $ | 3 | | | $ | 5 | | | $ | 118 | | | $ | 54 | | | $ | 33 | | | $ | 63 | | | $ | 21 | |
| Net income (loss) | Net income (loss) | — | | | (1) | | | 11 | | | 8 | | | 5 | | | 11 | | | (1) | |
The assets and liabilities held for sale were as follows as of December 31, 2020:
| | | | | | | | | | | | | |
|
| December 31, 2020 |
| (In millions) | Evansville | | MontBleu | | |
| Assets: | | | | | |
| Cash | $ | 7 | | | $ | 3 | | | |
| | | | | |
| | | | | |
| | | | | |
| | | | | |
| Property and equipment, net | 302 | | | 37 | | | |
| Goodwill | 9 | | | — | | | |
| Gaming licenses and other intangibles, net | 138 | | | — | | | |
| Other assets, net | 49 | | | 32 | | | |
| Assets held for sale | $ | 505 | | | $ | 72 | | | |
| Liabilities: | | | | | |
| | | | | |
| | | | | |
| Other liabilities | $ | 12 | | | $ | 8 | | | |
| | | | | |
| Long-term lease obligation | 24 | | | 63 | | | |
| | | | | |
| Liabilities related to assets held for sale | $ | 36 | | | $ | 71 | | | |
Held for sale - Discontinued operations
On July 20, 2020, the closing date of the Merger,merger between Eldorado Hotel Casino and Caesars Entertainment Corporation (the “Merger”), Harrah’s Louisiana Downs, Caesars UK group, which includes Emerald Resorts & Casino,Southern Indiana and Caesars Southern IndianaUK Group, met held for sale criteria. The operations of these properties, areuntil their respective date of divestiture, have been presented within discontinued operations. In addition, at the time that the William Hill Acquisition was consummated, the Company’s intent was to divest William Hill International. Accordingly, the assets and liabilities of these reporting units were classified as held for sale with operations presented within discontinued operations.
On September 3, 2020,November 1, 2021, the Company and VICI Properties L.P., a Delaware limited partnership (“VICI”) entered into an agreement to sellconsummated the sale of the equity interests of Harrah’s Louisiana Downs to Rubico Acquisition Corp. for $22 million subject to a customary working capital adjustment. On November 1, 2021, the sale of Harrah’s Louisiana Downs was completed and the proceeds were split between the Company and VICI.VICI Properties L.P., a Delaware limited partnership (“VICI”). The annual base rent payments under the Regional leaseMaster Lease between Caesars and VICI remainremained unchanged.
On December 24, 2020,September 3, 2021, the Company entered into an agreement to sellconsummated the sale of the equity interests of Caesars Southern Indiana to the Eastern Band of Cherokee Indians (“EBCI”) for $250 million, subject to customary purchase price adjustments. On September 3, 2021, the Company completed the sale of Caesars Southern Indiana, resulting in a gain of $12 million. In connection with this transaction, the Company’s annual base rent payments to VICI Properties under the Regional Master Lease were reduced by $33 million. Additionally, the Company and EBCI extended their existing relationship by enteringentered into a 10-year brand license agreement, with cancellation rights in exchange for a termination fee at the buyer’s discretion following the fifth
CAESARS ENTERTAINMENT, INC.
NOTES TO CONSOLIDATED FINANCIAL STATEMENTS (CONTINUED)
anniversary of the agreement, for the continued use of the Caesars brand and Caesars Rewards loyalty program at Caesars Southern Indiana. Caesars Southern Indiana was previously reported withinThe agreement contains cancellation rights in exchange for a termination fee at the Regional segment and subsequent tobuyer’s discretion following the sale, as a resultfifth anniversary of the license agreement relating to the continued use of the Caesars brand and Caesars Rewards loyalty program at Caesars Southern Indiana, is reported within the Managed and Branded segment.agreement.
On July 16, 2021, the Company completed the sale of Caesars UK Group, in which the buyer assumed all liabilities associated with the Caesars UK Group, and we recorded an impairment of $14 million within discontinued operations.
At the time that the William Hill Acquisition was consummated, the Company’s intent was to divest William Hill International. Accordingly, the assets and liabilities of William Hill International are classified as held for sale with operations presented within discontinued operations. See Note 1 and Note 2.
The following information presents the net revenues and net income (loss) for the Company’s properties that are part of discontinued operations for the year ended December 31, 2022 and 2021:
| | | | | |
| |
| Year Ended December 31, 2022 |
| (In millions) | William Hill International |
| Net revenues | $ | 820 | |
| Net loss | (448) | |
| | | | | | | | | | | | | | | | | | | | | | | |
| | |
| Year Ended December 31, 2021 |
| (In millions) | Harrah’s Louisiana Downs | | Caesars UK Group | | Caesars Southern Indiana | | William Hill International |
| Net revenues | $ | 48 | | | $ | 30 | | | $ | 155 | | | $ | 1,221 | |
| Net income (loss) | 10 | | | (30) | | | 27 | | | (18) | |
The assets and liabilities held for sale as discontinued operations, accounted for at carrying value unless fair value was lower, were as follows as | | | | | | | | | | | | | | | | | |
|
| December 31, 2020 |
| (In millions) | Harrah’s Louisiana Downs | | Caesars UK Group | | Caesars Southern Indiana |
| Assets held for sale | $ | 25 | | | $ | 255 | | | $ | 589 | |
| | | | | |
| | | | | |
Liabilities related to assets held for sale (a) | 12 | | | 193 | | | 345 | |
____________________
(a)We have included $5 million and $331 million of deferred finance obligations as held for sale liabilities for and Harrah’s Louisiana Downs and Caesars Southern Indiana, respectively, which represent the estimated liability derecognized upon completion of the divestitures.Contents
Not included in the above table are assets and liabilities held for sale of $3.8 billion and $2.7 billion, respectively, related to William Hill International. Liabilities held for sale include $617 million of debt related to the asset sale bridge facility and the revolving credit facility, which are expected to be repaid upon the sale of William Hill International, as described in Note 1. The Bridge Credit Agreement includes a financial covenant requiring the Bridge Facility Borrower to maintain a maximum total net leverage ratio of 10.50 to 1.00. The borrowings under the Bridge Credit Agreement are guaranteed by the Bridge Facility Borrower and its material wholly-owned subsidiaries (subject to exceptions), and are secured by a pledge of substantially all of the existing and future property and assets of the Bridge Facility Borrower and the guarantors (subject to exceptions). In addition, $943 million of debt is held for sale related to two trust deeds assumed in the William Hill Acquisition. One trust deed relates to £350 million aggregate principal amount of 4.750% Senior Notes due 2026, and the other trust deed relates to £350 million aggregate principal amount of 4.875% Senior Notes due 2023. Each of the trust deeds contain a put option due to a change in control which allowed noteholders to require the Company to purchase the notes at 101% of the principal amount with interest accrued. The put period with respect to the William Hill Acquisition expired on July 26, 2021, and approximately £1 million of debt was repurchased. As of December 31, 2021, the Company was in compliance with the financial covenant related to the Bridge Credit Agreement and no financial covenants were noted related to the two trust deeds assumed in the William Hill Acquisition.77
CAESARS ENTERTAINMENT, INC.
NOTES TO CONSOLIDATED FINANCIAL STATEMENTS (CONTINUED)
Note 5. Investments in and Advances to Unconsolidated Affiliates
William Hill
The Company previously entered into a 25-year agreement with William Hill, which became effective January 29, 2019, and granted to William Hill the right to conduct betting activities, including operating our sportsbooks,has investments in retail channels under certain skins for online channels with respect to the Company’s current and future properties, and conduct certain real money online gaming activities. On April 22, 2021, the Company consummated its previously announced acquisition of William Hill PLC in an all-cash transaction. Prior to the acquisition, the Companyunconsolidated affiliates accounted for its investmentunder the equity method which are recorded in William Hill PLC as an investmentInvestment in equity securities. Additionally, we accounted for our investment in William Hill US as an equity method
CAESARS ENTERTAINMENT, INC.
NOTES TO CONSOLIDATED FINANCIAL STATEMENTS (CONTINUED)
investment priorand advances to the William Hill Acquisition. See Note 3 for further detailunconsolidated affiliates on the consideration transferred and the allocation of the purchase price.
NeoGames
The acquired net assets of William Hill included an investment in NeoGames S.A. (“NeoGames”), a global leader of iLottery solutions and services to national and state-regulated lotteries, and other investments. On September 16, 2021, the Company sold a portion of its shares of NeoGames common stock for $136 million which decreased its ownership interest from 24.5% to approximately 8.4%. AsBalance Sheets. Certain significant investments as of December 31, 2021, the Company held approximately 2 million shares of NeoGames common stock with a fair value of $60 million. The shares have a readily determinable fair value2023 and accordingly, the Company remeasures the investment based on the publicly available share price (Level 1). See Note 8. For the year ended December 31, 2021, the Company recorded a loss related to the investment in NeoGames of $54 million, which is included within Other income (loss) on the Statements of Operations.2022 are discussed below.
Pompano Joint Venture
In April 2018, the Company entered into a joint venture with Cordish Companies (“Cordish”) to plan and develop a mixed-use entertainment and hospitality destination expected to be located on unused land adjacent to the casino and racetrack at the Company’s Pompano property. As the managing member, Cordish will operate the business and manage the development, construction, financing, marketing, leasing, maintenance and day-to-day operation of the various phases of the project. Additionally, Cordish will be responsible for the development of the master plan for the project with the Company’s input and will submit it for the Company’s review and approval. In June 2021, the joint venture issued a capital call and we contributed $3 million, for a total of $4 million in cash contributions since inception of the joint venture. On February 12, 2021, the Company contributed 186 acres to the joint venture with a fair value of $61 million. Total contributions of approximately 206 acres of land have been made with a fair value of approximately $69 million, and the Company has no further obligation to contribute additional real estate or cash as of December 31, 2021. We entered into a short-term lease agreement in February 2021, which we can cancel at any time, to lease back a portion of the land from the joint venture.
While the Company holds a 50% variable interest in the joint venture, it is not the primary beneficiary; as such the investment in the joint venture is accounted for using the equity method. The Company participates evenly with Cordish in the profits and losses of the joint venture, which are included in Transaction costs and other operating costs on the Statements of Operations.
As of December 31, 2023, the Company has contributed a total of $7 million in cash contributions since inception of the joint venture, which includes capital calls totaling $3 million each in October 2023 and June 2021 andthat the Company elected to participate in. Additionally, the Company has contributed approximately 209 acres of land with a total fair value of approximately $69 million, which includes a contribution of 186 acres of land, with a fair value of $61 million, on February 12, 2021. The Company has no further obligation to contribute additional real estate or cash. During the year ended December 31, 2020,2023, the Company recorded $64 million of income related to the investment, primarily due to the joint venture’s gain on the sale of a land parcel. As of December 31, 2023 and 2022, the Company’s investment in the joint venture was $147 million and $80 million, respectively.
NeoGames
The acquired net assets of William Hill included an investment in NeoGames S.A. (“NeoGames”), a global leader of iLottery solutions and services to national and state-regulated lotteries, and other investments. On September 16, 2021, the Company sold a portion of its shares of NeoGames common stock for $136 million which decreased its ownership interest from 24.5% to approximately 8.4%. Additionally, on March 14, 2022 the Company sold its remaining 2 million shares at fair value for $26 million. During the years ended December 31, 2022 and 2021, the Company recorded losses related to the investment in NeoGames of $34 million and $54 million, respectively, which is recordedincluded within Other income (loss) in Investment in and advances to unconsolidated affiliates on the Balance Sheets.Statements of Operations.
Note 6. Property and Equipment
Property and equipment are stated at cost, except for assets acquired in our business combinations which were adjusted for fair value under ASCAccounting Standards Codification (“ASC”) 805. Internal use software costs are capitalized during the application development stage. Costs of major improvements are capitalized, while costs of normal repairs and maintenance are charged to expense as incurred. Depreciation is computed using the straight-line method over the estimated useful life of the asset as noted in the table below, or the term of the lease, whichever is less. Costs of major improvements are capitalized, while costs of normal repairs and maintenance are charged to expense as incurred. Gains or losses on the disposal of property and equipment are included in operating income.
Our property and equipment is subject to various operating leases for which we Useful lives of each asset class are the lessor. We lease our property and equipment related to our hotel rooms, convention space and retail space through various short-term and long-term operating leases. See Note 10 for further discussion of our leases.generally as follows:
| | | | | |
| Buildings and improvements | 3 to 40 years |
| Land improvements | 12 to 40 years |
| Furniture, fixtures and equipment | 3 to 15 years |
| Riverboats | 30 years |
A portion of our property and equipment is subject to various operating leases for which we are the lessor. Leased property includes our hotel rooms, convention space and retail space through various short-term and long-term operating leases. See Note 10 for further discussion of our leases.
CAESARS ENTERTAINMENT, INC.
NOTES TO CONSOLIDATED FINANCIAL STATEMENTS (CONTINUED)
The Company evaluates its property and equipment and other long-lived assets for impairment based on its classification as held for sale or to be held and used. Several criteria must be met before an asset is classified as held for sale, including that management with the appropriate authority commits to a plan to sell the asset at a reasonable price in relation to its fair value and is actively seeking a buyer. For assets held for sale, the Company recognizes the asset at the lower of carrying value or fair market value less costs to sell, as estimated based on comparable asset sales, offers received, or a discounted cash flow model. For assets to be held and used, the Company reviews for impairment whenever indicators of impairment exist. The Company then compares the estimated future cash flows of the asset, on an undiscounted basis, to the carrying value of the asset. If the undiscounted cash flows exceed the carrying value, no impairment is indicated. If the undiscounted cash flows do not exceed the carrying value, then an impairment charge may be recorded for any difference between fair value and the carrying value. All
CAESARS ENTERTAINMENT, INC.
NOTES TO CONSOLIDATED FINANCIAL STATEMENTS (CONTINUED)
recognized impairment losses
whether for assets held for sale or assets to be held and used, are recorded as operating expenses, unless the assets represent a discontinued operation.
For the year ended December 31, 2019, an impairment charge of $1 million was recorded related to non-operating real property located in Pennsylvania. For the year ended December 31, 2020, we recorded a tangible asset impairment of $4 million related to the sale of a corporate airplane. See
Note 4 for further discussion of impairment on assets previously held for sale. | | Property and Equipment, Net | Property and Equipment, Net | | |
| December 31, |
| December 31, | |
| December 31, | |
| December 31, | |
| (In millions) | (In millions) | 2021 | | 2020 | (In millions) | 2023 | | 2022 |
| Land | Land | $ | 2,125 | | | $ | 2,187 | |
| Buildings, riverboats, and leasehold and land improvements | Buildings, riverboats, and leasehold and land improvements | 12,433 | | | 12,059 | |
| Furniture, fixtures, and equipment | Furniture, fixtures, and equipment | 1,650 | | | 1,419 | |
| Construction in progress | Construction in progress | 395 | | | 118 | |
| Total property and equipment | Total property and equipment | 16,603 | | | 15,783 | |
| Less: accumulated depreciation | Less: accumulated depreciation | (2,002) | | | (1,048) | |
| Total property and equipment, net | Total property and equipment, net | $ | 14,601 | | | $ | 14,735 | |
|
| | Depreciation Expense | Depreciation Expense | |
| Years Ended December 31, |
| Years Ended December 31, | |
| Years Ended December 31, | |
| Years Ended December 31, | |
| (In millions) | (In millions) | 2021 | | 2020 | | 2019 | (In millions) | 2023 | | 2022 | | 2021 |
| Depreciation expense | Depreciation expense | $ | 987 | | | $ | 527 | | | $ | 191 | |
|
Depreciation is calculated using the straight-line method over the shorter of the estimated useful life of the asset or the related lease.
Note 7. Goodwill and Intangible Assets, net
The purchase price of an acquisition is allocated to the underlying assets acquired and liabilities assumed based upon their estimated fair values at the date of acquisition. The Company determines the estimated fair values after review and consideration of relevant information including discounted cash flows, quoted market prices, and estimates made by management. To the extent the purchase price exceeds the fair value of the net identifiable tangible and intangible assets acquired and liabilities assumed, such excess is recorded as goodwill.
Goodwill and indefinite-lived intangible assets must be reviewed for impairment at least annually and between annual test dates in certain circumstances. The Company performs its annual impairment tests as of October 1 of each fiscal year. The Company performs this assessment more frequently if impairment indicators exist. We utilized ana combined income approach using a discounted cash flow method and a guideline public company method to determine the fair value of our goodwill. The Company performed the annual goodwill impairment test by comparing the fair value of each reporting unit with its carrying amount. The Company determines the estimated fair value of each reporting unit based on a combination of earnings before interest, taxes, depreciation and amortization (“EBITDA”), valuation multiples, and estimated future cash flows discounted at rates commensurate with the capital structure and cost of capital of comparable market participants, giving appropriate consideration to the prevailing borrowing rates within the casino industry in general.general, and expected sales proceeds. The Company also evaluates the aggregate fair value of all of its reporting units and other non-operating assets in comparison to its aggregate debt and equity market capitalization at the test date. EBITDA multiples and discounted cash flows are common measures used to value businesses in the industry.
Indefinite-lived intangible assets consist primarily of trademarks, Caesars Rewards and expenditures associated with obtaining racing and gaming licenses. Indefinite-lived intangible assets are not subject to amortization but are subject to an annual impairment test. If the carrying amount of an indefinite-lived intangible asset exceeds its fair value, an impairment loss is recognized in an amount equal to that excess amount.
Trademarks and Caesars Rewards were valued using the relief from royalty method, which presumes that without ownership of such trademarks or loyalty program, the Company would have to make a stream of payments to a brand or franchise owner in return for the right to use their name or program. By virtue of this asset, the Company avoids any such payments and records the related intangible value of the Company’s ownership of the brand name or program.
CAESARS ENTERTAINMENT, INC.
NOTES TO CONSOLIDATED FINANCIAL STATEMENTS (CONTINUED)
Gaming rights represent intangible assets acquired from the purchase of a gaming entity located in a gaming jurisdiction where competition is limited, such as when only a limited number of gaming operators are allowed to operate in the jurisdiction. These gaming license rights are not subject to amortization as the Company has determined that they have indefinite useful lives. For gaming jurisdictions with high barriers of renewal of the gaming rights, such as material costs of renewal, the gaming rights are deemed to have a finite useful life and are amortized over the expected useful life. We used the Excess Earnings Method and a Cost Approach for estimating fair value for these gaming rights.
CAESARS ENTERTAINMENT, INC.
NOTES TO CONSOLIDATED FINANCIAL STATEMENTS (CONTINUED)
Finite-lived intangible assets consist of trade names, and customer relationships, reacquired rights, and technology acquired in business combinations. Amortization is recorded using the straight-line method over the estimated useful life of the asset. The Company evaluates for impairment whenever indicators of impairment exist. When indicators are noted, the Company then compares estimated future cash flows, undiscounted, to the carrying value of the asset. If the undiscounted cash flows exceed the carrying value, no impairment is recorded. Impairment charges are presented on the statements of operations.
As a result of the finalized and approved capital and operating plans and the completion of the annual impairment testing for the year ended December 31, 2023, the Company recognized impairment charges in our Regional segment. These impairments were primarily due to a decrease in projected future cash flows at certain regional properties due increased competition. The Company identified one reporting unit with an estimated fair value of the associated gaming rights below the carrying value and recorded an impairment of $81 million. In addition, the Company identified one reporting unit with an estimated fair value below its carrying value and we recorded an impairment of $14 million to goodwill.
During the year ended December 31, 2022, the Company recognized impairment charges in our Regional segment related to goodwill and gaming rights totaling $78 million and $30 million, respectively, due to an increase in the related discount rates, which represents the higher required cost of capital as a result of the macroeconomic environment and projected outlook.
In December 2021, the Company approved a capital plan which included the planned rebranding of certain of our properties, which is expected to be substantially complete by December 31, 2022.properties. The Company utilized an income approach to determine the fair value of the trademarks subject to rebranding based on their expected future cash flows, which resulted in an impairment charge of $102 million.million during the year ended December 31, 2021. The adjusted carrying values of these trademarks previously considered to have indefinite lives, have begun to bewere amortized over their respective remaining useful lives.
During 2020, the Company recognized impairment charges in our Regional segment related to goodwill and trade names totaling $100 million and $16 million, respectively, due to declines in recent performance and the expected impact on future cash flows as a result of COVID-19.
When assets are deemed to be held for sale, any associated intangible assets, including goodwill, are reclassified to Assets held for sale on our Balance Sheets (see Note 4).
| | | | | | | | | | | | | | | | | | | | | | | | | | | | | |
| Changes in Carrying Value of Goodwill by Segment | | | | | | | | |
| (In millions) | Las Vegas | | Regional | | Caesars Digital | | Managed and Branded | | CEI Total |
| Gross Goodwill: | | | | | | | | | |
| Balance as of January 1, 2020 | $ | — | | | $ | 922 | | | $ | — | | | $ | — | | | $ | 922 | |
| | | | | | | | | |
| Transferred to assets held for sale | — | | | (18) | | | — | | | — | | | (18) | |
Acquired (a) | 6,873 | | | 2,141 | | | 50 | | | — | | | 9,064 | |
| Balance as of December 31, 2020 | 6,873 | | | 3,045 | | | 50 | | | — | | | 9,968 | |
| Accumulated Impairment: | | | | | | | | | |
| Balance as of January 1, 2020 | — | | | (12) | | | — | | | — | | | (12) | |
| Impairment | — | | | (100) | | | — | | | — | | | (100) | |
| Transferred to assets held for sale | — | | | 8 | | | — | | | — | | | 8 | |
| Balance as of December 31, 2020 | — | | | (104) | | | — | | | — | | | (104) | |
| Net carrying value, as of December 31, 2020 | $ | 6,873 | | | $ | 2,941 | | | $ | 50 | | | $ | — | | | $ | 9,864 | |
| | | | | | | | | |
| Gross Goodwill: | | | | | | | | | |
| Balance as of January 1, 2021 | $ | 6,873 | | | $ | 3,045 | | | $ | 50 | | | $ | — | | | $ | 9,968 | |
| | | | | | | | | |
Acquired (a) | — | | | 63 | | | 1,148 | | | — | | | 1,211 | |
| Other | 16 | | | (15) | | | — | | | — | | | 1 | |
| Balance as of December 31, 2021 | 6,889 | | | 3,093 | | | 1,198 | | | — | | | 11,180 | |
| Accumulated Impairment: | | | | | | | | | |
| Balance as of January 1, 2021 | — | | | (104) | | | — | | | — | | | (104) | |
| | | | | | | | | |
| | | | | | | | | |
| Balance as of December 31, 2021 | — | | | (104) | | | — | | | — | | | (104) | |
| | | | | | | | | |
Net carrying value, as of December 31, 2021 (b) | $ | 6,889 | | | $ | 2,989 | | | $ | 1,198 | | | $ | — | | | $ | 11,076 | |
| | | | | | | | | | | | | | | | | | | | | | | | | | | | | |
| Changes in Carrying Value of Goodwill by Segment | | | | | | | | |
| (In millions) | Las Vegas | | Regional | | Caesars Digital | | Managed and Branded | | CEI Total |
| Gross Goodwill: | | | | | | | | | |
| Balance as of January 1, 2022 | $ | 6,889 | | | $ | 3,093 | | | $ | 1,198 | | | $ | — | | | $ | 11,180 | |
| | | | | | | | | |
Other (a) | — | | | — | | | 6 | | | — | | | 6 | |
| Balance as of December 31, 2022 | 6,889 | | | 3,093 | | | 1,204 | | | — | | | 11,186 | |
| Accumulated Impairment: | | | | | | | | | |
| Balance as of January 1, 2022 | — | | | (104) | | | — | | | — | | | (104) | |
| Impairment | — | | | (78) | | | — | | | — | | | (78) | |
| Balance as of December 31, 2022 | — | | | (182) | | | — | | | — | | | (182) | |
| Net carrying value, as of December 31, 2022 | $ | 6,889 | | | $ | 2,911 | | | $ | 1,204 | | | $ | — | | | $ | 11,004 | |
| | | | | | | | | |
| Gross Goodwill: | | | | | | | | | |
| Balance as of January 1, 2023 | $ | 6,889 | | | $ | 3,093 | | | $ | 1,204 | | | $ | — | | | $ | 11,186 | |
| | | | | | | | | |
| Other | — | | | — | | | — | | | — | | | — | |
| Balance as of December 31, 2023 | 6,889 | | | 3,093 | | | 1,204 | | | — | | | 11,186 | |
| Accumulated Impairment: | | | | | | | | | |
| Balance as of January 1, 2023 | — | | | (182) | | | — | | | — | | | (182) | |
| Impairment | — | | | (14) | | | — | | | — | | | (14) | |
| | | | | | | | | |
| Balance as of December 31, 2023 | — | | | (196) | | | — | | | — | | | (196) | |
| | | | | | | | | |
Net carrying value, as of December 31, 2023 (b) | $ | 6,889 | | | $ | 2,897 | | | $ | 1,204 | | | $ | — | | | $ | 10,990 | |
____________________
(a)See Note 3 for further detail. Purchase price allocation finalized in 2022.
(b)$352 million1.0 billion of goodwill within our Regional segment is associated with reporting units with zero or negative carrying value.
CAESARS ENTERTAINMENT, INC.
NOTES TO CONSOLIDATED FINANCIAL STATEMENTS (CONTINUED)
| Changes in Carrying Value of Intangible Assets Other than Goodwill | | Amortizing | | Non-Amortizing | | Total |
| Changes in Carrying Amount of Intangible Assets Other than Goodwill | | Changes in Carrying Amount of Intangible Assets Other than Goodwill |
| Amortizing | | | Amortizing | | Non-Amortizing | | Total |
| (In millions) | (In millions) | 2021 | | 2020 | | 2021 | | 2020 | | 2021 | | 2020 | (In millions) | 2023 | | 2022 | | 2023 | | 2022 | | 2023 | | 2022 |
| Balance as of January 1 | Balance as of January 1 | $ | 501 | | | $ | 53 | | | $ | 3,782 | | | $ | 1,058 | | | $ | 4,283 | | | $ | 1,111 | |
| Impairment | Impairment | — | | | — | | | (102) | | | (22) | | | (102) | | | (22) | |
| Amortization expense | Amortization expense | (139) | | | (56) | | | — | | | — | | | (139) | | | (56) | |
| Transferred to assets held for sale | — | | | (5) | | | — | | | (174) | | | — | | | (179) | |
Acquired (a) | 575 | | | 489 | | | 43 | | | 2,905 | | | 618 | | | 3,394 | |
Acquisition of gaming rights and trademarks (b) | 253 | | | 20 | | | 50 | | | 15 | | | 303 | | | 35 | |
| | Acquisition of gaming rights and trademarks | |
| | Acquisition of gaming rights and trademarks | |
| | Acquisition of gaming rights and trademarks | |
| | Other | Other | 19 | | | — | | | (62) | | | — | | | (43) | | | — | |
| Other | |
| Other | |
| Balance as of December 31 | Balance as of December 31 | $ | 1,209 | | | $ | 501 | | | $ | 3,711 | | | $ | 3,782 | | | $ | 4,920 | | | $ | 4,283 | |
____________________
(a)See Note 3 for further detail.
(b)Includes acquired royalty-free license of Planet Hollywood Trademark with an estimated useful life of 15 years and other gaming rights.
| Gross Carrying Value and Accumulated Amortization of Intangible Assets Other Than Goodwill | | December 31, 2021 | | December 31, 2020 |
| Gross Carrying Amount and Accumulated Amortization of Intangible Assets Other Than Goodwill | | Gross Carrying Amount and Accumulated Amortization of Intangible Assets Other Than Goodwill |
| December 31, 2023 | | | December 31, 2023 | | December 31, 2022 |
| (Dollars in millions) | (Dollars in millions) | Useful Life | | Gross Carrying Amount | | Accumulated Amortization | | Net Carrying Amount | | Gross Carrying Amount | | Accumulated Amortization | | Net Carrying Amount | (Dollars in millions) | Useful Life | | Gross Carrying Amount | | Accumulated Amortization | | Net Carrying Amount | | Gross Carrying Amount | | Accumulated Amortization | | Net Carrying Amount |
| Amortizing intangible assets | Amortizing intangible assets | | | | | | | | | | | | | |
| Customer relationships | Customer relationships | 3 - 7 years | | $ | 587 | | | $ | (187) | | | $ | 400 | | | $ | 510 | | | $ | (92) | | | $ | 418 | |
| Gaming rights and others | 20 - 34 years | | 174 | | | (7) | | | 167 | | | 84 | | | (1) | | | 83 | |
| Customer relationships | |
| Customer relationships | |
| Gaming rights and other | |
| Trademarks | Trademarks | 15 years | | 322 | | | (21) | | | 301 | | | — | | | — | | | — | |
| Reacquired rights | Reacquired rights | 24 years | | 250 | | | (7) | | | 243 | | | — | | | — | | | — | |
| Technology | Technology | 6 years | | 110 | | | (12) | | | 98 | | | — | | | — | | | — | |
| $ | 1,443 | | | $ | (234) | | | 1,209 | | | $ | 594 | | | $ | (93) | | | 501 | |
| | | $ | |
| | Non-amortizing intangible assets | Non-amortizing intangible assets | |
| Non-amortizing intangible assets | |
| Non-amortizing intangible assets | |
| Trademarks | |
| Trademarks | |
| Trademarks | Trademarks | | 1,998 | | | 2,161 | |
| Gaming rights | Gaming rights | | 1,190 | | | 1,098 | |
| Caesars Rewards | Caesars Rewards | | 523 | | | 523 | |
| 3,711 | | | 3,782 | |
| | | | | | | 3,577 | |
| Total amortizing and non-amortizing intangible assets, net | Total amortizing and non-amortizing intangible assets, net | | $ | 4,920 | | | $ | 4,283 | |
Amortization expense with respect to intangible assets for the years ended December 31, 2023, 2022 and 2021 2020 and 2019 totaled $139$144 million, $56$187 million and $30$139 million, respectively, which is included in depreciationDepreciation and amortization in the Statements of Operations.
| | | | | | | | | | | | | | | | | | | | | | | | | | | | | |
| Estimated Five-Year Amortization |
| Years Ended December 31, |
| (In millions) | 2022 | | 2023 | | 2024 | | 2025 | | 2026 |
| Estimated annual amortization expense | $ | 184 | | | $ | 138 | | | $ | 123 | | | $ | 116 | | | $ | 116 | |
| | | | | | | | | | | | | | | | | | | | | | | | | | | | | |
| Estimated Five-Year Amortization |
| Years Ended December 31, |
| (In millions) | 2024 | | 2025 | | 2026 | | 2027 | | 2028 |
| Estimated annual amortization expense | $ | 130 | | | $ | 122 | | | $ | 122 | | | $ | 80 | | | $ | 43 | |
CAESARS ENTERTAINMENT, INC.
NOTES TO CONSOLIDATED FINANCIAL STATEMENTS (CONTINUED)
Note 8. Fair Value Measurements
Items Measured at Fair Value on a Recurring Basis
The following table sets forth the assets and liabilities measured at fair value on a recurring basis, by input level, in the Balance Sheets at December 31, 2021 and 2020:
| | | | | | | | | | | | | | | | | | | | | | | |
| (In millions) | December 31, 2021 |
| Assets: | Level 1 | | Level 2 | | Level 3 | | Total |
| Restricted cash and investments | $ | 1 | | | $ | 1 | | | $ | — | | | $ | 2 | |
| Marketable securities | 69 | | | 9 | | | — | | | 78 | |
| Derivative instruments - FX forward | — | | | 1 | | | — | | | 1 | |
| Total assets at fair value | $ | 70 | | | $ | 11 | | | $ | — | | | $ | 81 | |
| Liabilities: | | | | | | | |
| Derivative instruments - interest rate swaps | $ | — | | | $ | 28 | | | $ | — | | | $ | 28 | |
| Derivative instruments - FX forwards | — | | | 16 | | | — | | | 16 | |
| | | | | | | |
| Total liabilities at fair value | $ | — | | | $ | 44 | | | $ | — | | | $ | 44 | |
| | | | | | | | | | | | | | | | | | | | | | | |
| (In millions) | December 31, 2020 |
| Assets: | Level 1 | | Level 2 | | Level 3 | | Total |
| Restricted cash and investments | $ | 1 | | | $ | 3 | | | $ | 44 | | | $ | 48 | |
| Marketable securities | 23 | | | 10 | | | — | | | 33 | |
| Derivative instruments - FX forward | — | | | 40 | | | — | | | 40 | |
| Total assets at fair value | $ | 24 | | | $ | 53 | | | $ | 44 | | | $ | 121 | |
| Liabilities: | | | | | | | |
| Derivative instruments - 5% Convertible Notes | $ | — | | | $ | 326 | | | $ | — | | | $ | 326 | |
| Derivative instruments - interest rate swaps | — | | | 90 | | | — | | | 90 | |
| Total liabilities at fair value | $ | — | | | $ | 416 | | | $ | — | | | $ | 416 | |
| | | | | | | | | | | |
| Change in restricted investments using Level 3 inputs |
| (In millions) | Level 3 Investment | | Level 3 Other Liabilities |
| Fair value of investment at December 31, 2019 | $ | 29 | | | $ | — | |
| Value of additional investment received | 5 | | | 2 | |
| Released from restrictions | (8) | | | (4) | |
| Unrealized gain | 18 | | | 2 | |
| Fair value of investment at December 31, 2020 | 44 | | | — | |
| Change in fair value | 7 | | | — | |
| Acquisition of William Hill | (51) | | | — | |
| | | |
| Fair value at December 31, 2021 | $ | — | | | $ | — | |
Restricted Cash and Investments
The estimated fair values of the Company’s restricted cash and investments are based upon quoted prices available in active markets (Level 1), or quoted prices for similar assets in active and inactive markets (Level 2), or quoted prices available in active markets adjusted for time restrictions related to the sale of the investment (Level 3) and represent the amounts the Company would expect to receive if the Company sold the restricted cash and investments. Restricted cash classified as Level 1 includes cash equivalents held in short-term certificate of deposit accounts or money market type funds. Restricted cash that is not subject to remeasurement on a recurring basis is not included in the table above. Restricted investments included shares acquired in conjunction with the Company’s sports betting agreements that contained restrictions related to the ability to liquidate shares within a specified timeframe. As a result of the William Hill Acquisition, no restricted investments are held as of December 31, 2021.
Marketable Securities
Marketable securities consist primarily of trading securities held by the Company’s captive insurance subsidiary and investments acquired in the William Hill Acquisition (see Note 5). These investments also include collateral for several escrow and trust agreements with third-party beneficiaries.deferred compensation plans. The estimated fair values of the Company’s marketable securities are
CAESARS ENTERTAINMENT, INC.
NOTES TO CONSOLIDATED FINANCIAL STATEMENTS (CONTINUED)
determined on an individual asset basis based upon quoted prices of identical assets available in active markets (Level 1), quoted prices of identical assets in inactive markets, or quoted prices for similar assets in active and inactive markets (Level 2), and represent the amounts the Company would expect to receive if the Company sold these marketable securities. As of December 31, 2023 and 2022, the Company held $2 million in Level 1 securities and as of December 31, 2022 held an additional $2 million in Level 2 securities.
The Company held common shares of Flutter Entertainment PLC, (“Flutter”), which is a publicly traded company with a readily determinable share price. The Flutter shares contained certain restrictions which expired in December 2020. As such, the shares were transferred from a Level 3 investment to a Level 1 investment. There were no other transfers between Level 1, Level 2 and Level 3 investments. During the year ended December 31, 2020, the Company sold a portion of these shares for $24 million and recorded a gain of $14 million. As of December 31, 2020, the fair value of shares held was $10 million, and was included in Prepayments and other current assets on the Balance Sheets.
On July 7, 2021, the Company sold thesethe remaining shares for $9 million and recorded a loss of $1 million duringon the year ended December 31, 2021.sale date. Gains and losses have been included in Other income (loss) onin the Statements of Operations.
Derivative Instruments
The Company does not purchase or hold any derivative financial instruments for trading purposes.
5% Convertible Notes - Derivative LiabilityOn October 6, 2017, Former Caesars issued $1.1 billion aggregate principal amount of 5% convertible senior notes maturing in 2024 (“5% Convertible Notes”) which contained a derivative liability. On June 29, 2021, all outstanding 5% Convertible Notes were converted as a result of our mandatory conversion. See Note 12 for further discussion. The derivative liability associated with the conversion feature no longer exists following the mandatory conversion.81
CAESARS ENTERTAINMENT, INC.
NOTES TO CONSOLIDATED FINANCIAL STATEMENTS (CONTINUED)
Forward contracts
The Company has entered into several foreign exchange forward contracts with third parties to hedge the risk of fluctuations in the foreign exchange rates between USD and GBP and to fixGBP. During the exchange rate for a portion of the funds used in the William Hill Acquisition, repayment of related debt, and expected proceeds of the sale of the international operations. Three of these forward contracts to purchase £724 million at a contracted exchange rate were settled on June 11, 2021 andyears ended December 31, 2021, resulting in total gains of $38 million, which were recorded in the Other income (loss) on the Statements of Operations.
As of December 31,2022 and 2021, the Company is contractedrecorded a gain of $73 million and $23 million, respectively to sell a total of £790 million at fixed exchange rates. These contracts are to hedge the risk of fluctuations in the foreign exchange rate, related to a portion of the expected proceeds from the sale of William Hill International. The forward term of these contracts ends in March 2022. The Company recorded a loss of $15 million during the year ended December 31, 2021, related to these forward contracts, which was recorded in the Other income (loss) onin the Statements of Operations. All forward contracts were settled as of July 1, 2022.
Interest Rate Swap Derivatives
WeThe Company assumed Former Caesars’Caesars Entertainment Corporation’s interest rate swaps to manage the mix of assumed debt between fixed and variable rate instruments. As ofDuring the year ended December 31, 2021, we have 42022, the Company was party to four interest rate swap agreements to fix the interest rate on $1.3 billion of variable rate debt related to the CRC Credit Agreement. The interest rate swaps arewere designated as cash flow hedging instruments. The difference to be paid or received under the terms of the interest rate swap agreements iswas accrued as interest rates changechanged and recognized as an adjustment to interest expense at settlement. Changes in the variable interest rates to be received pursuant to the termsThe term of the interest rate swap agreements will have a corresponding effectswaps ended on future cash flows.
The major terms of the interest rate swap agreements as of December 31, 2021 were as follows:
| | | | | | | | | | | | | | | | | | | | | | | | | | | | |
| Effective Date | | Notional Amount (In millions) | | Fixed Rate Paid | | Variable Rate Received as of
December 31, 2021 | | | | Maturity Date |
| | | | | | | | | | |
| | | | | | | | | | |
| | | | | | | | | | |
| 1/1/2019 | | 250 | | 2.274% | | 0.09038% | | | | 12/31/2022 |
| | | | | | | | | | |
| | | | | | | | | | |
| 1/1/2019 | | 200 | | 2.828% | | 0.09038% | | | | 12/31/2022 |
| 1/1/2019 | | 200 | | 2.828% | | 0.09038% | | | | 12/31/2022 |
| 1/1/2019 | | 600 | | 2.739% | | 0.09038% | | | | 12/31/2022 |
| | | | | | | | | | |
Valuation Methodology
The estimated fair values of our interest rate swap derivative instruments arewere derived from market prices obtained from dealer quotes for similar, but not identical, assets or liabilities. Such quotes representrepresented the estimated amounts we would receive or pay
CAESARS ENTERTAINMENT, INC.
NOTES TO CONSOLIDATED FINANCIAL STATEMENTS (CONTINUED)
to terminate the contracts. The interest rate swap derivative instruments arewere included in either Other long-term assets, net or Other long-term liabilities on our Balance Sheets. Our derivatives arewere recorded at their fair values, adjusted for the credit rating of the counterparty if the derivative iswas an asset, or adjusted for the credit rating of the Company if the derivative iswas a liability. None of our derivative instruments arewere offset and all were classified as Level 2.
Financial Statement Effect
The effect of derivative instrumentsinterest rate swaps designated as hedging instruments on the Balance Sheets for amounts transferred into Accumulated other comprehensive income (loss) (“AOCI”) before tax was a gain of $62 million and $34$28 million during the yearsyear ended December 31, 2021 and 2020, respectively.2022. AOCI reclassified to Interest expense on the Statements of Operations was $59 million and $31$12 million for yearsyear ended December 31, 2021 and 2020, respectively. As of December 31, 2021 and 2020, the interest rate swaps derivative liability of $28 million and $90 million, respectively, was recorded in Other long-term liabilities.2022. Net settlement of these interest rate swaps resultsresulted in the reclassification of deferred gains and losses within AOCI to be reclassified to the income statement as a component of interest expense as settlements occur. The estimated amount of existing gains or losses that are reported in AOCI at the reporting date that are expected to be reclassified into earnings within the next 12 months is approximately $28 million.settlement occurred.
Accumulated Other Comprehensive Income
The changes in AOCI by component, net of tax, for the periods through December 31, 20212023 and 20202022 are shown below.
| | | (In millions) | (In millions) | Unrealized Net Gains on Derivative Instruments | | Foreign Currency Translation Adjustments | | Other | | Total |
| Balances as of December 31, 2019 | $ | — | | | $ | — | | | $ | — | | | $ | — | |
| Other comprehensive income (loss) before reclassifications | (5) | | | 8 | | | — | | | 3 | |
| (In millions) | |
| (In millions) | | Unrealized Net Gains on Derivative Instruments | | Foreign Currency Translation Adjustments | | Other | | Total |
| Balances as of December 31, 2021 | |
| Other comprehensive income before reclassifications | |
| Amounts reclassified from accumulated other comprehensive income | Amounts reclassified from accumulated other comprehensive income | 31 | | | — | | | — | | | 31 | |
| Total other comprehensive income, net of tax | Total other comprehensive income, net of tax | 26 | | | 8 | | | — | | | 34 | |
| Balances as of December 31, 2020 | $ | 26 | | | $ | 8 | | | $ | — | | | $ | 34 | |
| Balances as of December 31, 2022 | |
| | Other comprehensive loss before reclassifications | (12) | | | (44) | | | (1) | | | (57) | |
| Amounts reclassified from accumulated other comprehensive income | 59 | | | — | | | — | | | 59 | |
| Total other comprehensive income (loss), net of tax | 47 | | | (44) | | | (1) | | | 2 | |
| Balances as of December 31, 2021 | $ | 73 | | | $ | (36) | | | $ | (1) | | | $ | 36 | |
| Other comprehensive income before reclassifications | |
| | Other comprehensive income before reclassifications | |
| | Other comprehensive income before reclassifications | |
| | Total other comprehensive income, net of tax | |
| Total other comprehensive income, net of tax | |
| Total other comprehensive income, net of tax | |
| Balances as of December 31, 2023 | |
CAESARS ENTERTAINMENT, INC.
NOTES TO CONSOLIDATED FINANCIAL STATEMENTS (CONTINUED)
Note 9. Accrued Other Liabilities
Accrued other liabilities consisted of the following:
| | December 31, |
| December 31, | | | December 31, |
| (In millions) | (In millions) | 2021 | | 2020 | (In millions) | 2023 | | 2022 |
| Contract and contract related liabilities (See Note 13) | Contract and contract related liabilities (See Note 13) | $ | 614 | | | $ | 251 | |
| Accrued payroll and other related liabilities | Accrued payroll and other related liabilities | 377 | | | 180 | |
| Self-insurance claims and reserves (See Note 11) | 221 | | | 223 | |
| Accrued taxes | Accrued taxes | 183 | | | 172 | |
Self-insurance claims and reserves (See Note 11) | |
| Disputed claims liability | |
Operating lease liability (See Note 10) | |
| Accrued marketing | Accrued marketing | 159 | | | 16 | |
| Disputed claims liability | 50 | | | 51 | |
| Operating lease liability | 49 | | | 53 | |
| Exit cost accrual | 12 | | | 28 | |
| | Other accruals | |
| Other accruals | |
| Other accruals | Other accruals | 308 | | | 289 | |
| Total accrued other liabilities | Total accrued other liabilities | $ | 1,973 | | | $ | 1,263 | |
Disputed Claims Liability and Exit Cost Accrual
The disputed claims liability and exit cost accrual were assumed liabilities of Former Caesars. The disputed claims liability represents certain remaining unsecured claims related to Former Caesars Entertainment Corporation’s bankruptcy assumed from the Merger for which we have estimated the fair value of the remaining liability. Exit costs are related to the unbundling of electric service provided by NV Energy and an Iowa greyhound pari-mutuel racing fund which we assumed from the Merger and other system contracts.
CAESARS ENTERTAINMENT, INC.
NOTES TO CONSOLIDATED FINANCIAL STATEMENTS (CONTINUED)
Note 10. Leases
The Company has operating and finance leases for various real estate and equipment. Certain of the Company’s lease agreements include rental payments based on a percentage of sales over specified contractual amounts, rental payments adjusted periodically for inflation and rental payments based on usage. The Company’s leases include options to extend the lease term one month to 7574 years. The Company’s lease agreements do not contain any material restrictive covenants, other than those described below.
Lessee Arrangements
Operating Leases
We leaseThe Company leases real estate and equipment used in our operations from third parties. As of December 31, 2021,2023, the remaining term of ourthe Company’s operating leases ranged from 1 to 7568 years with various extension options available, if we electthe Company elects to exercise them. However, ourthe Company’s remaining terms only include extension options that we have determined are reasonably certain as of December 31, 2021.2023. In addition to minimum rental commitments, certain of ourthe Company’s operating leases provide for contingent rentals based on a percentage of revenues in excess of specified amounts. We doThe Company does not include costs associated with our non-lease components in ourthe lease costs disclosed in the table below. During the years ended December 31, 20212023 and December 31, 2020, we2022, the Company obtained $13$41 million and $38$43 million, respectively, of right-of-use (“ROU”) assets in exchange for new lease liabilities. During the years ended December 31, 2023 and 2022, the Company disposed of $7 million and $12 million, respectively, of ROU assets and lease liabilities.
Leases recorded on the balance sheet consist of the following:
| | | | | December 31, | | | | | | December 31, |
| (In millions) | (In millions) | | Classification on the Balance Sheet | | December 31, 2021 | | December 31, 2020 | (In millions) | | Classification on the Balance Sheet | | 2023 | | 2022 |
| Assets: | Assets: | | | | | | |
Operating lease ROU assets (a) | Operating lease ROU assets (a) | | Other assets, net | | $ | 662 | | | $ | 457 | |
Operating lease ROU assets (a) | |
Operating lease ROU assets (a) | |
| | Liabilities: | Liabilities: | |
| Liabilities: | |
| Liabilities: | |
Current operating lease liabilities (a) | |
Current operating lease liabilities (a) | |
Current operating lease liabilities (a) | Current operating lease liabilities (a) | | Accrued other liabilities | | 49 | | | 53 | |
| Non-current operating lease liabilities (a) | Non-current operating lease liabilities (a) | | Other long-term liabilities | | 726 | | | 516 | |
Non-current operating lease liabilities (a) | |
Non-current operating lease liabilities (a) | |
|
___________________
(a)As noted above, we havethe Company has elected the short-term lease measurement and recognition exemption and do not establish ROU assets or liabilities for operating leases with terms of 12 months or less.
| | | | | | | | | | | |
| Lease Terms and Discount Rate | December 31, |
| 2021 | | 2020 |
| Weighted Average Remaining Lease Term (in years) | 28.8 | | 25.6 |
| | | |
| | | |
| Weighted Average Discount Rate | 8.1 | % | | 8.4 | % |
| | | |
| | | |
| | | | | | | | | | | | |
| Components of Lease Expense | | | | |
| | Years Ended December 31, |
| (In millions) | | 2021 | | 2020 |
| | | | |
| Operating lease expense | | $ | 128 | | | $ | 53 | |
| Short-term and variable lease expense | | 104 | | | 50 | |
| | | | |
| | | | |
| | | | |
| Total operating lease costs | | $ | 232 | | | $ | 103 | |
Supplemental cash flow information related to leases is as follows:
| | | | | | | | | | | |
| Cash payments included in the measurement of lease liabilities | | | |
| Years Ended December 31, |
| (In millions) | 2021 | | 2020 |
| | | |
| Operating cash flows for operating leases | $ | 96 | | | $ | 49 | |
| | | |
CAESARS ENTERTAINMENT, INC.
NOTES TO CONSOLIDATED FINANCIAL STATEMENTS (CONTINUED)
| | | | | |
| Maturities of Lease Liabilities | |
| (In millions) | Operating Leases |
| |
| 2022 | $ | 108 | |
| 2023 | 104 | |
| 2024 | 69 | |
| 2025 | 65 | |
| 2026 | 64 | |
| Thereafter | 2,011 | |
| Total future minimum lease payments | 2,421 | |
| Less: present value factor | (1,646) | |
| Total lease liability | $ | 775 | |
| | | | | | | | | | | |
| Lease Terms and Discount Rate | December 31, |
| 2023 | | 2022 |
| Weighted Average Remaining Lease Term (in years) | 32.1 | | 32.2 |
| | | |
| | | |
| Weighted Average Discount Rate | 8.1 | % | | 8.3 | % |
| | | |
| | | |
| | | | | | | | | | | | | | | | | |
| Components of Lease Expense | | | | | |
| Years Ended December 31, |
| (In millions) | 2023 | | 2022 | | 2021 |
| Operating lease expense | $ | 96 | | | $ | 132 | | | $ | 128 | |
| Short-term and variable lease expense | 159 | | | 138 | | | 104 | |
| Total operating lease costs | $ | 255 | | | $ | 270 | | | $ | 232 | |
Supplemental cash flow information related to leases is as follows:
| | | | | | | | | | | | | | | | | |
| Cash payments included in the measurement of lease liabilities | | | | | |
| Years Ended December 31, |
| (In millions) | 2023 | | 2022 | | 2021 |
| Operating cash flows for operating leases | $ | 116 | | | $ | 110 | | | $ | 96 | |
| | | | | |
| Maturities of Lease Liabilities | |
| (In millions) | Operating Leases |
| |
| 2024 | $ | 81 | |
| 2025 | 77 | |
| 2026 | 76 | |
| 2027 | 76 | |
| 2028 | 74 | |
| Thereafter | 1,919 | |
| Total future minimum lease payments | 2,303 | |
| Less: present value factor | (1,552) | |
| Total lease liability | $ | 751 | |
Finance Leases
We haveThe Company has finance leases for certain equipment and real estate. As of December 31, 2021, our2023, the Company’s finance leases had remaining lease terms of up to approximately 3735 years, some of which include options to extend the lease terms in one month increments. Our finance lease ROU assets and liabilities were $40 million and $43 million as of December 31, 2021, respectively, and $64 million for bothThe Company’s finance lease ROU assets and liabilities were $69 million and $77 million as of December 31, 2020.2023, respectively, and $73 million and $78 million as of December 31, 2022, respectively.
Financing Obligations
VICI Leases & Golf Course Use Agreement
The fair value of the real estate assets and the related failed sale-leaseback financing obligations were estimated based on the present value of the estimated future lease payments over the lease term of 15 years, plus renewal options, using an imputed discount rate of approximately 11.01%.
CEI leases certain real property assets from VICI under the following agreements: (i) for a portfolio of properties located throughout the United States (the “Regional Lease”), (ii) for Caesars Palace Las Vegas and Harrah’s Las Vegas (the “Las Vegas Lease”), and (iii) for Harrah’s Joliet Hotel & Casino (the “Joliet Lease”), (collectively, “VICI Leases”). The lease agreements, inclusive of all amendments, include (i) a 15-year initial term with 4four five-year renewal options, (ii) initial annual fixed rent payments of $1.1 billion, subject to annual escalation provisions based on the Consumer Price Index (“CPI”) and a 2% floor commencingwhich commenced in lease year 2two of the initial termterms and (iii) a variable element based on net revenues of the underlying leased properties, commencing in lease year 8eight of the initial term.
CAESARS ENTERTAINMENT, INC.
NOTES TO CONSOLIDATED FINANCIAL STATEMENTS (CONTINUED)
The Regional Lease includes a put-call optionPut-Call Right Agreement whereby the Company may require VICI to purchase and lease back (as lessor) or whereby VICI may require the Company to sell to VICI and lease back (as lessee) the real estate components of the gaming and racetrack facilities of Harrah’s Hoosier Park Racing & Casino and Indiana Grand (“CentaurHorseshoe Indianapolis (the “Centaur properties”). Election to exercise the option by either party must be made during the election period beginning January 1, 2022 and ending December 31, 2024. Upon either party exercising their option, the Centaur properties would be sold at a price in accordance with the agreement and leased back to CEI in accordance to the pre-existing terms and conditions of the Regional Lease.
The sale of Caesars Southern Indiana to EBCI for $250 million was finalized on September 3, 2021 and as a result of the sale, Caesars’ annual payments to VICI Properties under the Regional Lease decreased by $33 million and variable rent under the lease shall exclude net revenue attributable to Caesars Southern Indiana.Put-Call Right Agreement.
The Golf Course Use Agreement between the Company and VICI encompassing four golf courses in three states, has a 35-year term (inclusive of all renewal periods), whereby the Company agrees to pay (i) aninitial annual membership fee of $11and use fees totaling $14 million, subject to annual escalation provisions based onsimilar to those described above in the CPI and a 2% floor (ii) annual use fees of $3 million, including escalation provisions based on the CPI and a 2% floor commencing on the second lease year through and including the final lease year and (iii)Regional Lease, as well as certain per-round fees as set forth in the agreement. Furthermore, the term of the Golf Course Use Agreement was extended such that there will be 15 years remaining until the expiration of the initial term.
GLPI Leases
The fair value of the real estate assets and the related failed sale-leaseback financing obligations were estimated based on the present value of the estimated future lease payments over the lease term of 35 years, including renewal options, using an imputed discount rate of approximately 9.75%. The value of the failed sale-leaseback financing obligations is dependent upon assumptions regarding the amount of the lease payments and the estimated discount rate of the lease payments required by a market participant.
CAESARS ENTERTAINMENT, INC.
NOTES TO CONSOLIDATED FINANCIAL STATEMENTS (CONTINUED)
CEI leases certain real property assets from GLPI under the Master Lease (as amended, the “GLPI Master Lease”). The GLPI Master Lease, encompassing a portfolio of properties within the United States, provides for the lease of land, buildings, structures and other improvements on the land, (including barges and riverboats), easements and similar appurtenances to the land and improvements relating to the operation of the leased properties. The GLPI Master Lease, inclusive of all amendments, provides for (i) an initial term of 20 years (through September 2038), with 4four five-year renewals at the Company’s option, (ii) annual land and building base rent of $24 million and $63 million, respectively, (iii) escalating provisions of building base rent equal to 101.25% of the rent for the preceding year for lease years 5five and 6,six, 101.75% for lease years 7seven and 8eight and 102% for each lease year thereafter and (iv) relief from the operating, capital expenditure and financial covenants in the event of involuntary closures. The GLPI Master Lease does not provide the Company with an option to purchase the leased property or the ability to terminate its obligations under the GLPI Master Lease prior to its expiration without GLPI’s consent.
On May 5, 2022, the Company consummated the sale of the equity interests of Baton Rouge. On November 13, 2023, a third amended and restated master lease was entered into as a result of the removal of Baton Rouge from the properties included under the GLPI Master Lease.
The Lumière Lease was entered into by the Company and GLPI, whereby the Company sold the real estate underlying Horseshoe St. Louis, formerly known as Lumière, to GLPI and leased back the property under a long-term financing obligation. The Lumière Lease, inclusive of all amendments, provides for (i) an initial term commencing on September 29, 2020 and ending on October 31, 2033, (ii) 4four five-year renewal options, (iii) annual rent payments of $23 million, (iv) escalation provisions commencing in lease year 2two equal to 101.25% of the rent for the preceding year for lease years 2two through 5,five, 101.75% for lease years 6six and 7seven and 102% for each lease year thereafter, (v) maintaining a minimum of 1.20:1 adjusted revenue to rent ratio and (vi) certain relief under the financial covenant in the event of involuntary closures.
The Company continues to reflect the real estate assets related to the failed sale-lease back transactions on the Balance Sheets in Property and equipment, net as if the Company was the legal owner, and continues to recognize depreciation expense over their estimated useful lives.
The future minimum payments related to the GLPI Leases, including the Lumière Lease, and VICI Leases financing obligation, as amended, at December 31, 20212023 were as follows:
| | (In millions) | (In millions) | GLPI Leases | | VICI Leases | (In millions) | GLPI Leases | | VICI Leases |
| 2022 | $ | 110 | | | $ | 1,066 | |
| 2023 | 111 | | | 1,087 | |
| 2024 | 2024 | 112 | | | 1,107 | |
| 2025 | 2025 | 113 | | | 1,120 | |
| 2026 | 2026 | 115 | | | 1,136 | |
| 2027 | |
| 2028 | |
| Thereafter | Thereafter | 4,604 | | | 42,808 | |
| Total future payments | Total future payments | 5,165 | | | 48,324 | |
| Less: Amounts representing interest | Less: Amounts representing interest | (4,172) | | | (38,079) | |
| Plus: Residual values | Plus: Residual values | 240 | | | 893 | |
| Financing obligation | Financing obligation | $ | 1,233 | | | $ | 11,138 | |
CAESARS ENTERTAINMENT, INC.
NOTES TO CONSOLIDATED FINANCIAL STATEMENTS (CONTINUED)
Cash payments made relating to ourthe Company’s long-term financing obligations during the years ended December 31, 20212023, 2022 and 20202021 were as follows:
| | GLPI Leases (a) | | VICI Leases (a) |
| December 31, | | December 31, |
| GLPI Leases (a) | | | GLPI Leases (a) | | VICI Leases (a) |
| December 31, | | | December 31, |
| (In millions) | (In millions) | 2021 | | 2020 | | 2021 | | 2020 | (In millions) | 2023 | | 2022 | | 2021 | | 2023 | | 2022 | | 2021 |
| Cash paid for principal | Cash paid for principal | $ | — | | | $ | — | | | $ | 1 | | | $ | 49 | |
| Cash paid for interest | Cash paid for interest | 109 | | | 93 | | | 983 | | | 472 | |
____________________
(a)For the initial periods of the GLPIVICI and VICIGLPI Leases, cash payments are less than the interest expense recognized, which causes the failed-sale leaseback obligation to increase during the initial years of the lease term.
Lease Covenants
The GLPI Leases and VICI Leases contain certain covenants requiring minimum capital expenditures based on a percentage of net revenues along with maintaining certain financial ratios. The Company was in compliance with all applicable covenants as of December 31, 2021.
Lessor Arrangements
Lodging Arrangements
Lodging arrangements are considered short-term and generally consist of lease and nonlease components. The lease component is the predominant component of the arrangement and consists of the fees charged for lodging. The nonlease components primarily consist of resort fees and other miscellaneous items. As the timing and pattern of transfer of both the lease and nonlease components are over the course of the lease term, we have elected to combine the revenue generated from lease and nonlease components into a single lease component based on the predominant component in the arrangement. During the years ended December 31, 20212023, 2022 and 2020,2021, we recognized $1.6$2.1 billion, $2.0 billion and $450 million,$1.6 billion, respectively, in lease revenue related to lodging arrangements, which is included in Hotel revenues in the Statements of Operations.
Conventions
Convention arrangements are considered short-term and generally consist of lease and nonlease components. The lease component is the predominant component of the arrangement and consists of fees charged for the use of meeting space. The nonlease components primarily consist of food and beverage and audio/visual services. Revenue from conventions is included in OtherFood and beverage revenue in the Statement of Operations, and during the years ended December 31, 20212023, 2022 and 2020, we recognized $7 million and $3 million, respectively, in2021, lease revenue related to conventions.conventions was $40 million, $34 million and $7 million, respectively.
Real Estate Operating Leases
We enter into long-term real estate leasing arrangements with third-party lessees at our properties. As of December 31, 2021,2023, the remaining terms of these operating leases ranged from 1 to 8482 years, some of which include options to extend the lease term for up to five years. In addition to minimum rental commitments, certain of our operating leases provide for contingent payments including contingent rentals based on a percentage of revenues in excess of specified amounts and reimbursements for common area maintenance and utilities charges. As the timing and pattern of transfer of both the lease and nonlease components are over the course of the lease term, we have elected to combine the revenue generated from lease and nonlease components into a single lease component based on the predominant component in the arrangement. In addition, to maintain the value of our leased assets, certain leases include specific maintenance requirements of the lessees or maintenance is performed by the Company on behalf of the lessees. During the years ended December 31, 20212023, 2022 and 2020,2021, we recognized $149$166 million, $168 million and $41$149 million, respectively, of real estate lease revenue, which is included in Other revenue in the Statement of Operations. Real estate lease revenue includes $45$68 million, $64 million and $13$45 million respectively, of variable rental income for the years ended December 31, 2023, 2022 and 2021, and 2020.respectively.
| | | | | |
| Maturities of Lease Receivables | |
| (In millions) | Operating Leases |
| 2022 | $ | 62 | |
| 2023 | 58 | |
| 2024 | 52 | |
| 2025 | 46 | |
| 2026 | 45 | |
| Thereafter | 704 | |
| Total | $ | 967 | |
CAESARS ENTERTAINMENT, INC.
NOTES TO CONSOLIDATED FINANCIAL STATEMENTS (CONTINUED)
| | | | | |
| Maturities of Lease Receivables | |
| (In millions) | Operating Leases |
| 2024 | $ | 70 | |
| 2025 | 64 | |
| 2026 | 62 | |
| 2027 | 56 | |
| 2028 | 50 | |
| Thereafter | 689 | |
| Total | $ | 991 | |
Note 11. Litigation, Commitments and Contingencies
Litigation
General
We are a party to various legal proceedings, which have arisen in the normal course of our business. Such proceedings can be costly, time consuming and unpredictable and, therefore, no assurance can be given that the final outcome of such proceedings will not materially impact our consolidated financial condition or results of operations. Estimated losses are accrued for these proceedings when the loss is probable and can be estimated. While we maintain insurance coverage that we believe is adequate to mitigate the risks of such proceedings, no assurance can be given that the amount or scope of existing insurance coverage will be sufficient to cover losses arising from such matters. The current liability for the estimated losses associated with these proceedings is not material to our consolidated financial condition and those estimated losses are not expected to have a material impact on our results of operations.
Cybersecurity Incident
On September 14, 2023, we announced that an unauthorized actor had gained access to our information technology network as a result of a social engineering attack on an outsourced IT support vendor used by the Company, and acquired a copy of, among other data, our loyalty program database (“Data Incident”).
As a result of the Data Incident, numerous putative class action lawsuits have been filed against us purporting to represent various classes of persons whose personal information was affected by the Data Incident. These putative class actions assert a variety of common law and statutory claims based on allegations that we failed to use reasonable security procedures and practices to safeguard customers’ personal information, and seek monetary and statutory damages, injunctive relief and other related relief. In addition to those putative class action lawsuits, individual claims have been filed or threatened against us as well.
In addition, we have received inquiries from numerous state regulators related to the Data Incident. We have responded or are in the process of responding to these inquiries and are cooperating fully with regulators.
While we intend to vigorously defend ourselves in the above-described proceedings, we believe it is reasonably possible that we may incur losses associated therewith. It is not possible at this time to estimate the amount of loss or range of loss, if any, that might result from adverse judgments, settlements, or other resolution given the stage of these proceedings, the absence of specific allegations regarding the alleged damages, the uncertainty as to the certification of a class or classes and the size of any certified class, if applicable, and/or the lack of resolution of significant factual and legal issues. Moreover, additional lawsuits and claims related to the Data Incident may be asserted and governmental agencies may open additional inquiries or investigations into the Data Incident. We have received, and continue to pursue, reimbursements from insurance carriers for costs incurred as a result of the Data Incident.
We have incurred, and may continue to incur, certain expenses related to the Data Incident, including expenses to respond to, remediate and investigate this matter. The full scope of the costs and related impacts of this incident, including the extent to which these costs will be offset by our cybersecurity insurance or potential indemnification claims against third parties, has not been determined. We are unable to predict the full impact of this incident and its impact on guest behavior in the future, including whether a change in our guests’ behavior could negatively impact our financial condition and results of operations on an ongoing basis. Based on our assessment, the incident has not had a material impact, and we do not believe the incident has materially affected or will materially affect us, including our operations, business strategy, results of operations, or financial condition.
CAESARS ENTERTAINMENT, INC.
NOTES TO CONSOLIDATED FINANCIAL STATEMENTS (CONTINUED)
COVID-19 Insurance Claims
The COVID-19 public health emergency had a significant impact on the Company’s business and employees, as well as the communities where the Company operates and serves. The Company purchased broad property insurance coverage to protect against “all risk of physical loss or damage” and resulting business interruption, unless specifically excluded by policies. The Company submitted claims for losses incurred as a result of the COVID-19 public health emergency which are expected to exceed $2 billion. The insurance carriers under the Company’s insurance policies have asserted that the policies do not cover losses incurred by the Company as a result of the COVID-19 public health emergency and have refused to make payments under the applicable policies. Therefore, on March 19, 2021, the Company filed a lawsuit against its insurance carriers in the state court in Clark County, Nevada. On June 8, 2021, the Company filed an amended complaint. Litigation is proceeding and there can be no assurance as to the outcome of the litigation.
Contractual Commitments
Capital Commitments
Harrah’s New Orleans
In April 2020, the Company and the State of Louisiana, by and through the Louisiana Gaming Control Board, entered into an Amended and Restated Casino Operating Contract. Additionally, the Company, New Orleans Building Corporation and the City entered into a Second Amended and Restated Lease Agreement. Based on these amendments related to Harrah’s New Orleans, the Company is required to make certain payments and to make a capital investment of $325 million on or around Harrah’s New Orleans by July 15, 2024. In connection with theThe capital investment in Harrah’s New Orleans, construction has begun and we are inwill involve the processrebranding of rebranding the property asto Caesars New Orleans which we expect to be complete in 2024.includes a renovation and full interior and exterior redesign, updated casino floor, new culinary experiences and a new 340 room hotel tower. The project has a current capital plan of approximately $430 million, and as of December 31, 2023, total capital expenditures have been $289 million since the project began.
Atlantic City
As required by the New Jersey Gaming Control Board, in connection with its approval of2020, the Merger, weCompany funded $400 million in escrow to provide funds for a three year capital expenditure plan in the state of New Jersey. This amount is currentlyThe capital plan included in restricted cash in Other assets, net. Assignificant room renovations at both Caesars Atlantic City and Harrah’s Atlantic City, as well as the addition of new restaurants with celebrity partners. During the year ended December 31, 2021, our restricted cash balance2023, the Company met its commitment and exhausted the remaining funds in the escrow account was $297 million for future capital expenditures in New Jersey.account.
Sports Sponsorship/Partnership Obligations
We haveThe Company has agreements with certain professional sports leagues and teams, sporting event facilities and media companies for tickets, suites, and advertising, marketing, promotional and sponsorship opportunities including communication with partner customer databases. Additionally, a selection of such partnerships provide Caesars with exclusivity to access the aforementioned rights within the casino and/or sports betting category. In connection with the launch of the Caesars Sportsbook app, we entered into a significant marketing campaign with distinguished actors, athletes and other media personalities. As of December 31, 2021,2023 and 2022, obligations related to these agreements were $997$605 million which include obligations assumed in the William Hill Acquisition,and $898 million, respectively, with contracts extending through 2040. These obligations include leasing of event suites that are generally considered short term leases for which we do not record a right of use asset or lease liability. We recognizeThe Company recognizes expenses in the period services are received in accordance with the various agreements. In addition, assets or liabilities may be recorded related to the timing of payments as required by the respective agreement.
Self-Insurance
We areThe Company is self-insured for workers compensation and other risk insurance, as well as health insurance and general liability. OurThe Company’s total estimated self-insurance liability was $221$200 million and $223$203 million as of December 31, 20212023 and 2020,2022, respectively, which is included in Accrued other liabilities onin our Balance Sheets.
The assumptions including those related to the COVID-19 public health emergency, utilized by our actuaries are subject to significant uncertainty and if outcomes differ from these assumptions or events develop or progress in a negative manner, the Company could experience a material adverse effect and additional liabilities may be recorded in the future.
Contingent LiabilitiesContingencies
Weather disruptionDisruption - Lake Charles
On August 27, 2020, Hurricane Laura made landfall on Lake Charles as a Category 4 storm severely damaging the Isle of Capri Casino Lake Charles (“Lake Charles”). During the year ended December 31, 2021, the2022, the Company reached a final settlement agreement with the insurance carriers for a total amount of $128 million, before our insurance deductible of $25 million. The Company has received insurance proceedsa total of $44$103 million related to damaged fixed assets, remediation costs and remediation costs. business interruption.
The Company also recorded a gaingains of $38 million and $21 million asduring the years ended December 31, 2022 and
Table2021, respectively, which are included in Transaction and other costs, net in our Statements of Contents95
CAESARS ENTERTAINMENT, INC.
NOTES TO CONSOLIDATED FINANCIAL STATEMENTS (CONTINUED)
Operations, as proceeds received for the cost to replace damaged property were in excess of the respective carrying value of the assets. The property will remain closed until the second half of 2022 when construction of aour new land-based casino, is expected to be complete.Horseshoe Lake Charles, was completed and reopened in December 2022.
CAESARS ENTERTAINMENT, INC.
NOTES TO CONSOLIDATED FINANCIAL STATEMENTS (CONTINUED)
Note 12. Long-Term Debt
| | | | | | | | | | | | | | | | | | | | | | | | | | | | | |
| December 31, 2021 | | December 31, 2020 |
| (Dollars in millions) | Final Maturity | | Rates | | Face Value | | Book Value | | Book Value |
| Secured Debt | | | | | | | | | |
| Baltimore Revolving Credit Facility | 2022 | | variable | | $ | — | | | $ | — | | | $ | — | |
| CRC Revolving Credit Facility | 2022 | | variable | | — | | | — | | | — | |
| Baltimore Term Loan | 2024 | | variable | | 282 | | | 275 | | | — | |
| CRC Term Loan | 2024 | | variable | | 4,512 | | | 4,190 | | | 4,133 | |
| CEI Revolving Credit Facility | 2025 | | variable | | — | | | — | | | — | |
| CRC Incremental Term Loan | 2025 | | variable | | 1,778 | | | 1,705 | | | 1,707 | |
| CRC Senior Secured Notes | 2025 | | 5.75% | | 1,000 | | | 985 | | | 981 | |
| CEI Senior Secured Notes | 2025 | | 6.25% | | 3,400 | | | 3,346 | | | 3,333 | |
| Convention Center Mortgage Loan | 2025 | | 7.85% | | 400 | | | 399 | | | 397 | |
| Unsecured Debt | | | | | | | | | |
| 5% Convertible Notes | 2024 | | 5.00% | | — | | | — | | | 288 | |
| CRC Notes | 2025 | | 5.25% | | — | | | — | | | 1,499 | |
| CEI Senior Notes | 2027 | | 8.125% | | 1,700 | | | 1,673 | | | 1,768 | |
| Senior Notes | 2029 | | 4.625% | | 1,200 | | | 1,183 | | | — | |
| Special Improvement District Bonds | 2037 | | 4.30% | | 49 | | | 49 | | | 51 | |
| Long-term notes and other payables | | | | | 2 | | | 2 | | | 2 | |
| Total debt | | 14,323 | | | 13,807 | | | 14,159 | |
| Current portion of long-term debt | | (70) | | | (70) | | | (67) | |
| Deferred finance charges associated with the CEI Revolving Credit Facility | | — | | | (15) | | | (19) | |
| Long-term debt | | $ | 14,253 | | | $ | 13,722 | | | $ | 14,073 | |
| | | | | | |
| Unamortized premiums, discounts and deferred finance charges | | | | $ | 531 | | | $ | 883 | |
| Fair value | | $ | 14,713 | | | | | |
| | | | | | | | | | | | | | | | | | | | | | | | | | | | | | | | | | | | | | | | | |
| Annual Estimated Debt Service Requirements | | | | |
| Years Ended December 31, | | | | |
| (In millions) | 2022 | | 2023 | | 2024 | | 2025 | | 2026 | | Thereafter | | Total |
| Annual maturities of long-term debt | $ | 70 | | | $ | 70 | | | $ | 4,714 | | | $ | 6,526 | | | $ | 3 | | | $ | 2,940 | | | $ | 14,323 | |
| Estimated interest payments | 770 | | | 790 | | | 790 | | | 540 | | | 200 | | | 320 | | | 3,410 | |
Total debt service obligation (a) | $ | 840 | | | $ | 860 | | | $ | 5,504 | | | $ | 7,066 | | | $ | 203 | | | $ | 3,260 | | | $ | 17,733 | |
| | | | | | | | | | | | | | | | | | | | | | | | | | | | | |
| December 31, 2023 | | December 31, 2022 |
| (Dollars in millions) | Final Maturity | | Rates | | Face Value | | Book Value | | Book Value |
| Secured Debt | | | | | | | | | |
| CEI Revolving Credit Facility | 2028 | | variable | | $ | — | | | $ | — | | | $ | — | |
| CEI Term Loan A | 2028 | | variable | | 712 | | | 710 | | | 747 | |
| CEI Term Loan B | 2030 | | variable | | 2,481 | | | 2,432 | | | — | |
CRC Senior Secured Notes (a) | 2025 | | 5.75% | | 989 | | | 983 | | | 979 | |
CEI Senior Secured Notes due 2025 (a) | 2025 | | 6.25% | | 3,399 | | | 3,374 | | | 3,360 | |
| CEI Senior Secured Notes due 2030 | 2030 | | 7.00% | | 2,000 | | | 1,978 | | | — | |
| Baltimore Revolving Credit Facility | N/A | | N/A | | — | | | — | | | — | |
| Baltimore Term Loan | N/A | | N/A | | — | | | — | | | 262 | |
| Convention Center Mortgage Loan | N/A | | N/A | | — | | | — | | | 400 | |
| CRC Incremental Term Loan | N/A | | N/A | | — | | | — | | | 972 | |
| CRC Term Loan | N/A | | N/A | | — | | | — | | | 3,243 | |
| Unsecured Debt | | | | | | | | | |
| CEI Senior Notes due 2027 | 2027 | | 8.125% | | 1,611 | | | 1,593 | | | 1,589 | |
| CEI Senior Notes due 2029 | 2029 | | 4.625% | | 1,200 | | | 1,188 | | | 1,186 | |
| Special Improvement District Bonds | 2037 | | 4.30% | | 45 | | | 45 | | | 47 | |
| Long-term notes and other payables | | | | | 2 | | | 2 | | | 2 | |
| Total debt | | 12,439 | | | 12,305 | | | 12,787 | |
| Current portion of long-term debt | | (65) | | | (65) | | | (108) | |
| Deferred finance charges associated with the CEI Revolving Credit Facility | | — | | | (16) | | | (20) | |
| Long-term debt | | $ | 12,374 | | | $ | 12,224 | | | $ | 12,659 | |
| | | | | | |
| Unamortized discounts and deferred finance charges | | | | $ | 150 | | | $ | 318 | |
| Fair value | | $ | 12,416 | | | | | |
____________________
(a)Refer to “Subsequent Amendment to the CEI Credit Agreement and issuance of New Senior Secured Notes” for a discussion of the repayment of these notes.
| | | | | | | | | | | | | | | | | | | | | | | | | | | | | | | | | | | | | | | | | |
| Annual Estimated Debt Service Requirements | | | | |
| Years Ended December 31, | | | | |
| (In millions) | 2024 | | 2025 (a) | | 2026 | | 2027 | | 2028 | | Thereafter | | Total |
| Annual maturities of long-term debt | $ | 65 | | | $ | 4,453 | | | $ | 65 | | | $ | 1,676 | | | $ | 587 | | | $ | 5,593 | | | $ | 12,439 | |
| Estimated interest payments | 850 | | | 800 | | | 520 | | | 510 | | | 360 | | | 450 | | | 3,490 | |
Total debt service obligation (b) | $ | 915 | | | $ | 5,253 | | | $ | 585 | | | $ | 2,186 | | | $ | 947 | | | $ | 6,043 | | | $ | 15,929 | |
____________________
(a)Maturities of $4.4 billion in 2025 were repaid with the net proceeds of the $2.9 billion CEI Term Loan B-1 and the $1.5 billion CEI Senior Secured Notes, due 2032. See “Subsequent Amendment to the CEI Credit Agreement and issuance of New Senior Secured Notes” below.
(b)Debt principal payments are estimated amounts based on contractual maturity and scheduled repayment dates. Interest payments are estimated based on the forward-looking LIBORSOFR curve, where applicable, and include the estimated impact of the 4 interest rate swap agreements related to our CRC Credit Facility (see Note 8).applicable. Actual payments may differ from these estimates.
Current Portion of Long-Term Debt
The current portion of long-term debt as of December 31, 20212023 includes the principal payments on the term loans, other unsecured borrowings, and special improvement district bonds that are contractually due within 12 months. The Company may, from time to time, seek to repurchase or prepay its outstanding indebtedness. Any such purchases or repayments may be funded by existing cash balances or the incurrence of debt. The amount and timing of any repurchase will be based on business and market conditions, capital availability, compliance with debt covenants and other considerations.
CAESARS ENTERTAINMENT, INC.
NOTES TO CONSOLIDATED FINANCIAL STATEMENTS (CONTINUED)
Debt Discounts or Premiums and Deferred Finance Charges
Debt discounts or premiums and deferred finance charges incurred in connection with the issuance of debt are amortized to interest expense based on the related debt agreements primarily using the effective interest method. Unamortized discounts are written off and included in our gain or loss calculations to the extent we extinguish debt prior to itsthe original maturity date.or scheduled payment dates.
Net amortization of the debt issuance costs and the discount and/or premium associated with the Company’s indebtedness totaled $48 million, $139 million and $177 million for the years ended December 31, 2023, 2022 and 2021, respectively. Amortization of debt issuance costs is computed using the effective interest method and is included in interest expense.
Fair Value
The fair value of debt has been calculated primarily based on the borrowing rates available as of December 31, 20212023 and based on market quotes of our publicly traded debt. We classify the fair value of debt within Level 1 and Level 2 in the fair value hierarchy.
Terms of Outstanding Debt
CEI Term Loans and CEI Revolving Credit Facility
CEI is party to a credit agreement, dated as of July 20, 2020, with JPMorgan Chase Bank, N.A., as administrative agent, U.S. Bank National Association, as collateral agent, and certain banks and other financial institutions and lenders party thereto (the “CEI Credit Agreement”), which, as amended, provides for the CEI Revolving Credit Facility in an aggregate principal amount of $2.25 billion (the “CEI Revolving Credit Facility”). The CEI Revolving Credit Facility contains reserves of $40 million which are available only for certain permitted uses.
On October 5, 2022, Caesars entered into a third amendment to the CEI Credit Agreement (the “Third Amendment”) pursuant to which the Company (a) incurred a senior secured term loan in an aggregate principal amount of $750 million (the “CEI Term Loan A”) as a new term loan under the credit agreement, (b) amended and extended the CEI Revolving Credit Facility under the CEI Credit Agreement (the CEI Revolving Credit Facility, as so amended, the “Amended CEI Revolving Credit Facility” and, together with the CEI Term Loan A, the “Senior Credit Facilities”), (c) increased the aggregate principal amount of the CEI Revolving Credit Facility to $2.25 billion, and (d) made certain other amendments to the CEI Credit Agreement. Both the Amended CEI Revolving Credit Facility and the new CEI Term Loan A mature on January 31, 2028, subject to a springing maturity in the event certain other long-term debt of Caesars is not extended or repaid. The Amended CEI Revolving Credit Facility includes a letter of credit sub-facility of $388 million. The CEI Term Loan A requires scheduled quarterly payments in amounts equal to 1.25% of the original aggregate principal amount of the CEI Term Loan A, with the balance payable at maturity. The Company may make voluntary prepayments of the CEI Term Loan A at any time prior to maturity at par.
Borrowings under the Senior Credit Facilities bear interest paid monthly, at a rate equal to, at the Company’s option, either (a) a forward-looking term rate based on Secured Overnight Financing Rate (“Term SOFR”) for the applicable interest period plus an adjustment of 0.10% per annum (“Adjusted Term SOFR”), subject to a floor of 0% or (b) a base rate (the “Base Rate”) determined by reference to the highest of (i) the rate of interest per annum last quoted by The Wall Street Journal as the Prime Rate in the United States, (ii) the federal funds rate plus 0.50% per annum and (iii) the one-month Adjusted Term SOFR plus 1.00% per annum, in each case, plus an applicable margin. Such applicable margin is 2.25% per annum in the case of any Adjusted Term SOFR loan and 1.25% per annum in the case of any Base Rate loan, subject to three 0.25% step-downs based on the Company’s net total leverage ratio. In addition, on a quarterly basis, the Company is required to pay each lender under the Amended CEI Revolving Credit Facility a commitment fee in respect of any unused commitments under the Amended CEI Revolving Credit Facility in the amount of 0.35% per annum of the principal amount of the unused commitments of such lender, subject to three 0.05% step-downs based on the Company’s net total leverage ratio.
CAESARS ENTERTAINMENT, INC.
NOTES TO CONSOLIDATED FINANCIAL STATEMENTS (CONTINUED)
On February 6, 2023, Caesars entered into an Incremental Assumption Agreement No. 2 pursuant to which the Company incurred a new senior secured term loan facility in an aggregate principal amount of $2.5 billion (the “CEI Term Loan B” and, together with the CEI Term Loan A, the “CEI Term Loans”) as a new term loan under the CEI Credit Agreement. The CEI Term Loan B requires scheduled quarterly principal payments in amounts equal to 0.25% of the original aggregate principal amount of the CEI Term Loan B, with the balance payable at maturity. Borrowings under the CEI Term Loan B bear interest, paid monthly, at a rate equal to, at the Company’s option, either (a) a forward-looking term rate based on the Adjusted Term SOFR, subject to a floor of 0.50% or (b) a base rate (the “TLB Base Rate”) determined by reference to the highest of (i) the “Prime Rate” in the United States, (ii) the federal funds rate plus 0.50% per annum and (iii) the one-month Adjusted Term SOFR plus 1.00% per annum, in each case, plus an applicable margin. Such applicable margin is 3.25% per annum in the case of any Adjusted Term SOFR loan and 2.25% per annum in the case of any TLB Base Rate loan, subject to one 0.25% step-down based on the Company’s net total leverage ratio. The CEI Term Loan B was issued at a price of 99.0% of the principal amount and will mature in February 2030.
The net proceeds from the CEI Term Loan B, along with the net proceeds from the issuance of the CEI Senior Secured Notes due 2030 described below, were used to repay the outstanding principal balance, including accrued and unpaid interest, of both the CRC Term Loan and the CRC Incremental Term Loan.
During the year ended December 31, 2023, the Company utilized and fully repaid the CEI Revolving Credit Facility. Such activity is presented in the financing section in the Statements of Cash Flows. As of December 31, 2023, the Company had $2.1 billion of available borrowing capacity under the CEI Revolving Credit Facility, after consideration of $70 million in outstanding letters of credit, $46 million committed for regulatory purposes and the reserves described above.
Subsequent Amendment to the CEI Credit Agreement and issuance of New Senior Secured Notes
On February 6, 2024, the Company entered into an Incremental Assumption Agreement No. 3 pursuant to which the Company incurred a new senior secured incremental term loan in an aggregate principal amount of $2.9 billion (the “CEI Term Loan B-1”) under the CEI Credit Agreement. The CEI Term Loan B-1 requires quarterly principal payments in amounts equal to 0.25% of the original aggregate principal amount of the CEI Term Loan B-1, with the balance payable at maturity. Borrowings under the CEI Term Loan B-1 bear interest at a rate equal to, at the Company’s option, either (a) a forward-looking term rate based on the Term SOFR, subject to a floor of 0.50% or (b) a base rate (the “TLB-1 Base Rate”) determined by reference to the highest of (i) the “Prime Rate” in the United States, (ii) the federal funds rate plus 0.50% per annum and (iii) the one-month Term SOFR plus 1.00% per annum, in each case, plus an applicable margin. Such applicable margin is 2.75% per annum in the case of any Term SOFR loan and 1.75% per annum in the case of any TLB-1 Base Rate loan. The CEI Term Loan B-1 was issued at a price of 99.75% of the principal amount and will mature on February 6, 2031.
Additionally, on February 6, 2024, the Company issued $1.5 billion in aggregate principal amount of 6.50% senior secured notes due 2032 (the “CEI Senior Secured Notes due 2032”) pursuant to an indenture by and among the Company, the subsidiary guarantors party thereto, U.S. Bank Trust Company, National Association, as trustee, and U.S. Bank National Association, as collateral agent. The CEI Senior Secured Notes due 2032 rank equally with all existing and future first-priority lien obligations of the Company and the subsidiary guarantors. The CEI Senior Secured Notes due 2032 will mature on February 15, 2032, with interest paid semi-annually on February 15 and August 15 of each year, commencing August 15, 2024.
The net proceeds from the issuance of the CEI Senior Secured Notes due 2032 and the net proceeds from the CEI Term Loan B-1, together with borrowings under the CEI Revolving Credit Facility, were used to tender, redeem, repurchase, defease, and/or satisfy and discharge any and all of the principal amounts, including accrued and unpaid interest, related expenses and fees of both the 5.75% Senior Secured Notes due 2025 (the “CRC Senior Secured Notes”) and the 6.25% Senior Secured Notes due 2025 (the “CEI Senior Secured Notes due 2025”). As a result of these transactions, the Company estimates that it will incur approximately $50 million of loss on early extinguishment of debt.
CRC Senior Secured Notes due 2025
On July 6, 2020, Colt Merger Sub, Inc. (the “Escrow Issuer”) issued $1.0 billion in aggregate principal amount of the CRC Senior Secured Notes pursuant to an indenture, dated July 6, 2020, by and among the Escrow Issuer, U.S. Bank National Association, as trustee and Credit Suisse AG, Cayman Islands Branch, as collateral agent. The CRC Senior Secured Notes ranked equally with all existing and future first priority lien obligations of CRC, CRC Finco, Inc. and the subsidiary guarantors. The CRC Senior Secured Notes were set to mature on July 1, 2025, with interest payable semi-annually in cash in arrears on January 1 and July 1 of each year.
On February 16, 2024, the Company completed the tender and/or redemption of the CRC Senior Secured Notes with proceeds from a new CEI Term Loan B-1, new CEI Senior Secured Notes due 2032 and borrowings under the CEI Revolving Credit
CAESARS ENTERTAINMENT, INC.
NOTES TO CONSOLIDATED FINANCIAL STATEMENTS (CONTINUED)
Facility, as needed. See “Subsequent Amendment to the CEI Credit Agreement and issuance of New Senior Secured Notes” above.
CEI Senior Secured Notes due 2025
On July 6, 2020, the Escrow Issuer issued $3.4 billion in aggregate principal amount of the CEI Senior Secured Notes due 2025 pursuant to an indenture dated July 6, 2020, by and among the Escrow Issuer, U.S. Bank National Association, as trustee, and U.S. Bank National Association, as collateral agent. The CEI Senior Secured Notes due 2025 ranked equally with all existing and future first-priority lien obligations of the Company and the subsidiary guarantors. The CEI Senior Secured Notes due 2025 were set to mature on July 1, 2025, with interest payable semi-annually in cash in arrears on January 1 and July 1 of each year. On April 5, 2023, the Company purchased $1 million in principal amount of the CEI Senior Secured Notes due 2025.
On February 7, 2024, the Company completed the tender, redemption, and/or satisfaction and discharge of all of the CEI Senior Secured Notes due 2025 with proceeds from a new CEI Term Loan B-1, new CEI Senior Secured Notes due 2032 and borrowings under the CEI Revolving Credit Facility, as needed. See “Subsequent Amendment to the CEI Credit Agreement and issuance of New Senior Secured Notes” above.
CEI Senior Secured Notes due 2030
On February 6, 2023, concurrently with the issuance of the CEI Term Loan B, the Company issued $2.0 billion in aggregate principal amount of 7.00% senior secured notes (the “CEI Senior Secured Notes due 2030”) pursuant to an indenture by and among the Company, the subsidiary guarantors party thereto from time to time, U.S. Bank Trust Company, National Association, as trustee, and U.S. Bank National Association, as collateral agent. The CEI Senior Secured Notes due 2030 rank equally with all existing and future first-priority lien obligations of the Company and the subsidiary guarantors. The CEI Senior Secured Notes due 2030 will mature in February 2030, with interest paid semi-annually on February 15 and August 15 of each year, commencing August 15, 2023.
Baltimore Term Loan and Baltimore Revolving Credit Facility
As a resultOn July 17, 2023, following the acquisition of our increased ownershipthe remaining 24.2% equity interest in Horseshoe Baltimore, we began to consolidate the aggregateCompany permanently repaid the outstanding principal amountbalance of Horseshoe Baltimore’s senior secured term loan facility (the “Baltimore Term Loan”) and amount outstanding, if any, under. In connection with the repayment, the Company recognized a $3 million loss on the early extinguishment of debt. The Baltimore Term Loan was subject to a variable rate of interest calculated as London Interbank Offered Rate (“LIBOR”) plus 4.00% until May 1, 2023, when the Baltimore Term Loan’s benchmark interest rate was amended from LIBOR to the Adjusted Term SOFR plus an applicable adjustment. In addition, Horseshoe Baltimore’s senior secured revolving credit facility (the “Baltimore Revolving Credit Facility”). matured on July 7, 2023. The Baltimore Term Loan matures in 2024 and isRevolving Credit Facility had borrowing capacity of up to $10 million, subject to a variable rate of interest calculated as LIBORTerm SOFR plus 4.00%.
Convention Center Mortgage Loan
On September 18, 2020, the Company entered into a loan agreement with VICI, to borrow a 5-year, $400 million Forum Convention Center mortgage loan (the “Mortgage Loan”). The Baltimore Revolving Credit Facility has borrowing capacityMortgage Loan bears interest at a rate of, initially, 7.7% per annum, which was set to escalate annually on the anniversary of the closing date up to $10 million available and matures in 2022, subject to a variablemaximum interest rate of interest calculated as LIBOR plus 6.00%. As of8.3% per annum. On May 1, 2023, the Company elected to prepay the outstanding $400 million Mortgage Loan utilizing cash on hand. In connection with the repayment, the Company extended VICI’s call right relating to the CAESARS FORUM convention center from December 31, 2021, there was $10 million of available borrowing capacity under the Baltimore Revolving Credit Facility.2026 to December 31, 2028.
CRC Term LoansLoan and CRC Revolving Credit FacilityIncremental Term Loan
CRC isCaesars Resort Collection (“CRC”) was party to a credit agreement, dated as of December 22, 2017 (as amended, the “CRC Credit Agreement”), which included a $1.0 billion five-year revolving credit facility (the “CRC Revolving Credit Facility”) andprovided for, among other things, an initial $4.7 billion seven-year first liensenior secured term loan (the “CRC Term Loan”), which was increased byand an incremental $1.8 billion pursuant to an incremental agreement executed in connection with the Mergerfive-year senior secured term loan (the “CRC Incremental Term Loan”).
The CRC Term Loan matures in December 2024 and the CRC Incremental Term Loan matures in July 2025.were subject to the terms described below prior to repayment. The Company repaid the $3.4 billion outstanding principal amount of the CRC Revolving Credit Facility matures in December 2022Term Loan and includesthe $1.0 billion outstanding principal amount of the CRC Incremental Term Loan on February 6, 2023, with proceeds from a $400 million letternew CEI Term Loan B and new CEI Senior Secured Notes due 2030, both of credit sub-facility. Thewhich are described above. Upon the termination of the CRC Term Loan and the CRC Incremental Term Loan, require scheduled quarterly principal payments in amounts equal to 0.25%the Company recorded a loss on extinguishment of the original aggregate principal amount, with the balance due at maturity. The CRC Credit Agreement also includes customary voluntary and mandatory prepayment provisions, subject to certain exceptions.debt of $197 million.
Borrowings under the CRC Credit Agreement bearwere subject to interest at a rate equal to either (a) LIBOR adjusted for certain additional costs, subject to a floor of 0% or (b) a base rate determined by reference to the highest of (i) the federal funds rate plus 0.50%, (ii) the prime rate as determined by Credit Suisse AG, Cayman Islands Branch, as administrative agent under the
CAESARS ENTERTAINMENT, INC.
NOTES TO CONSOLIDATED FINANCIAL STATEMENTS (CONTINUED)
CRC Credit Agreement and (iii) the one-month adjusted LIBOR rate plus 1.00%, in each case plus an applicable margin. Such applicable margin shall bewas (a) with respect to the CRC Term Loan, 2.75% per annum in the case of any LIBOR loan or 1.75% per annum in the case of any base rate loan and (b) with respect to the CRC Incremental Term Loan, 4.50% per annum in the case of any LIBOR loan or 3.50% in the case of any base rate loan and (c) in the case of the CRC Revolving Credit Facility, 2.25% per annum in the case of any LIBOR loan and 1.25% per annum in the case of any base rate loan, subject in the case of the CRC Revolving Credit Facility to two 0.125% step-downs based on CRC’s senior secured leverage ratio (“SSLR”), the ratio of first lien senior secured net debt to adjusted earnings before interest, taxes, depreciation and amortization. The CRC Revolving Credit Facility is subject to a financial covenant discussed below. On September 21, 2021, CRC entered into a second amendment related to the CRC Incremental Term Loan to reduce the interest rate margins to 3.50% per annum in the case of any LIBOR loan or 2.50% per annum in the case of any base rate loan. The CRC Term Loan and the CRC Incremental Term Loan are LIBOR based loans as of December 31, 2021.
In addition, CRC is required to pay a commitment fee in respect of any commitments under the CRC Revolving Credit Facility in the amount of 0.50% of the principal amount of the commitments, subject to step-downs to 0.375% and 0.25% based upon CRC’s SSLR. CRC is also required to pay customary agency fees as well as letter of credit participation fees computed at a rate per annum equal to the applicable margin for LIBOR borrowings on the dollar equivalent of the daily stated amount of outstanding letters of credit, plus such letter of credit issuer’s customary documentary and processing fees and charges and a fronting fee in an amount equal to 0.125% of the daily stated amount of such letter of credit.
The Company had $956 million of available borrowing capacity, after consideration of $69 million in outstanding letters of credit under the CRC Revolving Credit Facility as of December 31, 2021.
CAESARS ENTERTAINMENT, INC.
NOTES TO CONSOLIDATED FINANCIAL STATEMENTS (CONTINUED)
CEI Revolving Credit Facility
On July 20, 2020, the Escrow Issuer entered into a new credit agreement with JPMorgan Chase Bank, N.A., as administrative agent, U.S. Bank National Association, as collateral agent, and certain banks and other financial institutions and lenders party thereto, which provide for a five-year CEI Revolving Credit Facility in an aggregate principal amount of $1.2 billion (the “CEI Revolving Credit Facility”). On November 10, 2021, the Company amended the CEI Revolving Credit Facility to establish reserves in the total amount of $190 million which are available only for permitted use. The CEI Revolving Credit Facility matures in July 2025 and includes a letter of credit sub-facility of $250 million.
The interest rate per annum applicable under the CEI Revolving Credit Facility, at the Company’s option is either (a) LIBOR adjusted for certain additional costs, subject to a floor of 0% or (b) a base rate determined by reference to the highest of (i) the federal funds rate plus 0.50%, (ii) the prime rate as determined by JPMorgan Chase Bank, N.A. and (iii) the one-month adjusted LIBOR rate plus 1.00%, in each case plus an applicable margin. Such applicable margin shall be 3.25% per annum in the case of any LIBOR loan and 2.25% per annum in the case of any base rate loan, subject to three 0.25% step-downs based on the Company’s total leverage ratio.
Additionally, the Company is required to pay a commitment fee in respect of any unused commitments under the CEI Revolving Credit Facility in the amount of 0.50% of principal amount of the commitments of all lenders, subject to a step-down to 0.375% based upon the Company’s total leverage ratio. The Company is also required to pay customary agency fees as well as letter of credit participation fees computed at a rate per annum equal to the applicable margin for LIBOR borrowings on the dollar equivalent of the daily stated amount of outstanding letters of credit, plus such letter of credit issuer’s customary documentary and processing fees and charges and a fronting fee in an amount equal to 0.125% of the daily stated amount of such letter of credit.
As of December 31, 2021, the Company had $924 million of available borrowing capacity under the CEI Revolving Credit Facility, after consideration of $23 million in outstanding letters of credit, $48 million committed for regulatory purposes and the reserves described above.
CRC Senior Secured Notes due 2025
On July 6, 2020, the Company issued $1.0 billion in aggregate principal amount of 5.75% Senior Notes due 2025 pursuant to an indenture, dated July 6, 2020 (the “CRC Senior Secured Notes”), by and among the Escrow Issuer, U.S. Bank National Association, as trustee and Credit Suisse AG, Cayman Islands Branch, as collateral agent. In connection with the consummation of the Merger, CRC assumed the rights and obligations under the CRC Senior Secured Notes and the indenture governing such notes. The CRC Senior Secured Notes will mature on July 1, 2025 with interest payable semi-annually in cash in arrears on January 1 and July 1 of each year.
CEI Senior Secured Notes due 2025
On July 6, 2020, the Escrow Issuer issued $3.4 billion in aggregate principal amount of 6.25% Senior Secured Notes due 2025 pursuant to an indenture dated July 6, 2020 (the “CEI Senior Secured Notes”), by and among the Escrow Issuer, U.S. Bank National Association, as trustee, and U.S. Bank National Association, as collateral agent. The Company assumed the rights and obligations under the CEI Senior Secured Notes and the indenture governing such notes on July 20, 2020. The CEI Senior Secured Notes will mature on July 1, 2025 with interest payable semi-annually in cash in arrears on January 1 and July 1 of each year.
Convention Center Mortgage Loan
On September 18, 2020, the Company entered into a loan agreement with VICI to borrow a 5-year, $400 million Forum Convention Center mortgage loan (the “Mortgage Loan”). The Mortgage Loan bears interest at a rate of, initially, 7.7% per annum, which escalates annually to a maximum interest rate of 8.3% per annum. Beginning October 1, 2021, the Mortgage Loan is subject to an interest rate of 7.854% for the next twelve months.
5% Convertible Notes
On October 6, 2017, Former Caesars issued $1.1 billion aggregate principal amount of 5% Convertible Notes maturing in 2024.
The 5% Convertible Notes were convertible into approximately 0.014 shares of the Company’s Common Stock (“Company Common Stock”) and approximately $1.17 of cash per $1.00 principal amount of the 5% Convertible Notes. During the year ended December 31, 2021, the Company converted the remaining outstanding aggregate principal amount of the 5% Convertible Notes, which resulted in cash payments of $367 million, net of approximately $12 million paid into our trust accounts and the issuance of approximately 5 million shares of Company Common Stock. The fair value of the shares
CAESARS ENTERTAINMENT, INC.
NOTES TO CONSOLIDATED FINANCIAL STATEMENTS (CONTINUED)
contributed to, and held in, the trust was $14 million, which is included within Treasury stock. The Company recognized a loss on the change in fair value of the derivative liability of $16 million recorded in Other income (loss) and a $23 million loss on extinguishment of debt, related to the unamortized discount, on the Statement of Operations.
CRC Notes
On October 16, 2017, CRC issued $1.7 billion aggregate principal amount of 5.25% senior notes due 2025 (the “CRC Notes”). During the year ended December 31, 2021, the Company purchased or redeemed all $1.7 billion of the CRC Notes and recognized a $199 million loss on the early extinguishment of debt.
CEI Senior Notes due 2027
On July 6, 2020, the Escrow Issuer issued $1.8 billion in aggregate principal amount of 8.125% Senior Notes due 2027 pursuant to an indenture, dated July 6, 2020 (the “CEI Senior Notes”Notes due 2027”), by and between the Escrow Issuer and U.S. Bank National Association, as trustee. The Company assumed the rights and obligations under the CEI Senior Notes due 2027 rank equally with all existing and future senior unsecured indebtedness of the Company and the indenture governing such notes on July 20, 2020.subsidiary guarantors. The CEI SecuredSenior Notes due 2027 will mature on July 1, 2027 with interest payable semi-annually in cash in arrears on January 1 and July 1 of each year. In September 2021, the Company began to repurchase
CEI Senior Notes on the open market and, as of December 31, 2021, a total of $100 million in principal amount of CEI Senior Notes was purchased and the Company recognized a $14 million loss on the early extinguishment of debt.
Senior Notes due 2029
On September 24, 2021, the Company issued $1.2 billion in aggregate principal amount of 4.625% Senior Notes due 2029 (the “Senior Notes”“CEI Senior Notes due 2029”) pursuant to an indenture dated as of September 24, 2021 between the Company and U.S. Bank National Association, as Trustee.trustee. The CEI Senior Notes due 2029 rank equally with all existing and future senior unsecured indebtedness of the Company and the subsidiary guarantors. The CEI Senior Notes due 2029 will mature on October 15, 2029 with interest payable on April 15 and October 15 of each year, commencing April 15, 2022. Proceeds from the issuance of the Senior Notes,year.
| | | | | | | | | | | | | |
| Summary of Debt and Revolving Credit Facility Cash Flows from Financing Activities in 2023 |
| (In millions) | Proceeds | | Repayments (a) | | |
| CEI Revolving Credit Facility | $ | 960 | | | $ | 960 | | | |
| CEI Term Loan A | — | | | 38 | | | |
| CEI Term Loan B | 2,500 | | | 19 | | | |
| CEI Senior Secured Notes due 2025 | — | | | 1 | | | |
| CEI Senior Secured Notes due 2030 | 2,000 | | | — | | | |
| Baltimore Term Loan | — | | | 267 | | | |
| Mortgage Loan | — | | | 400 | | | |
| CRC Incremental Term Loan | — | | | 1,004 | | | |
| CRC Term Loan | — | | | 3,415 | | | |
| | | | | |
| | | | | |
| Special Improvement District Bonds | — | | | 2 | | | |
| Total | $ | 5,460 | | | $ | 6,106 | | | |
____________________(a)Includes contractually scheduled repayments as well as cash on hand, was used to repay the CRC Notes, as described above.
Net amortization of the debt issuance costs and the discount and/or premium associated with the Company’s indebtedness totaled $177 million, $80 million and $8 million for the years ended December 31, 2021, 2020 and 2019, respectively. Amortization of debt issuance costs is computed using the effective interest method and is included in interest expense.
| | | | | | | | | | | | | | | | | |
| Summary of Debt and Revolving Credit Facility Cash Flows from Financing Activities in 2021 |
| (In millions) | Proceeds | | Repayments | | Debt issuance and extinguishment costs |
| | | | | |
| | | | | |
| Senior Notes | $ | 1,200 | | | $ | — | | | $ | 17 | |
| CRC Notes | — | | | 1,700 | | | 24 | |
| CEI Senior Notes | — | | | 100 | | | 13 | |
| CRC Term Loan | — | | | 47 | | | — | |
| | | | | |
| CRC Incremental Term Loan | 108 | | | 126 | | | 2 | |
| | | | | |
| | | | | |
| | | | | |
| | | | | |
| Baltimore Term Loan | — | | | 2 | | | — | |
| Special Improvement District Bonds | — | | | 2 | | | — | |
| Total | $ | 1,308 | | | $ | 1,977 | | | $ | 56 | |
Debt Covenant Compliance
The CRCSenior Credit Agreement,Facilities, the CEI Revolving Credit Facility, the Baltimore Term Loan B and the indentures governing the CEICRC Senior Secured Notes, the CEI Senior Secured Notes due 2025, the CRCCEI Senior Secured Notes due 2030, the CEI Senior Notes due 2027, and the CEI Senior Notes due 2029 contain covenants which are standard and customary for these types of agreements. These include negative covenants, which, subject to certain exceptions and baskets, limit the Company’s and its subsidiaries’ ability to (among other items) incur additional indebtedness, make investments, make restricted payments, including dividends, grant liens, sell assets and make acquisitions.
The CRCFollowing the Third Amendment, the Amended CEI Revolving Credit Facility and the CEI Revolving Credit FacilityTerm Loan A include a maximum first-priority net senior securedtotal leverage ratio financial covenant of 6.35:7.25:1 which isuntil December 31, 2024 and 6.50:1 from and after December 31, 2024. In addition, the Amended CEI Revolving Credit Facility and the CEI Term Loan A include a minimum fixed charge coverage ratio financial covenant of 1.75:1 until December 31, 2024 and 2.0:1 from and after December 31, 2024. From and after the repayment of the CEI Term Loan A, the financial covenants applicable to the Amended CEI Revolving Credit Facility will be tested solely to the extent that certain testing conditions are satisfied. The Baltimore Revolving Credit Facility includes a senior secured leverage ratio financial covenant of 5.0:1. Failure to comply with such covenants could result in an acceleration of the maturity of indebtedness outstanding under the relevant debt document. As of December 31, 2023, we were not subject to any debt covenants with respect to the new CEI Term Loan B-1 or the CEI Senior Secured Notes due 2032.
As of December 31, 2021,2023, the Company was in compliance with all of the applicable financial covenants described above.
CAESARS ENTERTAINMENT, INC.
NOTES TO CONSOLIDATED FINANCIAL STATEMENTS (CONTINUED)
Guarantees
The Senior Credit Facilities, the CEI Revolving Credit FacilityTerm Loan B, the CEI Senior Secured Notes due 2025 and the CEI Senior Secured Notes due 2030 are guaranteed on a senior secured basis by each existing and future material wholly-owned domestic subsidiary of CEIthe Company (subject to certain exceptions)exceptions including CRC and its subsidiaries) and are secured by substantially all of the existing and future property and assets of CEIthe Company and its subsidiary guarantors (subject to certain exceptions). The CEI Senior Notes due 2027 and the CEI Senior Notes due 2029 are guaranteed on a senior unsecured basis by such subsidiaries.
The CRC Credit Agreement andPrior to the repayments on February 6, 2024, the CRC Senior Secured Notes arewere guaranteed on a senior secured basis by each existing and future material wholly-owned domestic subsidiary of CRC (subject to certain exceptions) and arewere secured by substantially all of the existing and future property and assets of CRC and its subsidiary guarantors (subject to certain exceptions). The CRC Credit Agreement and the CRC Senior Secured Notes arewere also guaranteed on a senior unsecured basis by CEI.the Company. As of December 31, 2023, there were no guarantees with respect to the CEI Term Loan B-1 or the CEI Senior Secured Notes due 2032.
Note 13. Revenue Recognition
Accounting Policies
Casino Revenues
Our casino revenues consistsconsist of gaming wagers, pari-mutuel commissions, sports betting and iGaming wagers. The Company recognizes as casino revenue the net win from these gaming activities, which is the difference between gaming wins and losses, not the total amount wagered. Progressive jackpots are accrued and charged to revenue at the time the obligation to pay the jackpot is established. Gaming revenues are recognized net of free bets, free play, matched deposits, and other similar incentives to its customers. During significant promotional periods, such as entering new jurisdictions with our Caesars Sportsbook app,or Caesars Racebook apps, such activity could result in negative net gaming revenue. Such periods are not expected to be long in duration.duration as our level of investment during these promotional periods is within our discretion. Pari-mutuel commissions consist of commissions earned from thoroughbred and harness racing and importing of simulcast signals from other race tracksracetracks and are recognized at the time wagers are made. Such commissions are a designated portion of the wagering handle as determined by state racing commissions and are shown net of the taxes assessed by state and local agencies, as well as purses and other contractual amounts paid to horsemen associations. The Company recognizes revenues from fees earned through the exporting of simulcast signals to other race tracksracetracks at the time wagers are made, which are recorded on a gross basis. Such fees are based upon a predetermined percentage of handle as contracted with the other race tracks.racetracks.
Non-gaming Revenues
Hotel, food and beverage, and other operating revenues are recognized as services are performed and is the net amount collected from the customer for such goods and services. Hotel, food and beverage services have been determined to be separate, stand-alone performance obligations and are recorded as revenue as the good or service is transferred to the customer over the customer’s stay at the hotel or when the delivery is made for the food and beverage. Advance deposits for future hotel occupancy, convention space or food and beverage services contractcontracts are recorded as deferred income until revenue recognition criteria has been met. The Company also provides goods and services that may include multiple performance obligations, such as for packages, for which revenues are allocated on a pro rata basis based on each service’s stand-alonestandalone selling price.price (“SSP”).
Sales and other taxes collected from customers on behalf of governmental authorities are accounted for on a net basis and are not included in net revenues or operating expenses.
The Company’s Statement of Operations presents net revenue disaggregated by type or nature of the good or service. A summary of net revenues disaggregated by type of revenue and reportable segment is presented below. We recast previously reported segment amounts to conform to the way management assesses results and allocates resources for the current year. Refer to Note 1 and Note 19 for additional information on the Company’s reportable segments. | | Year Ended December 31, 2021 |
| Year Ended December 31, 2023 | | | Year Ended December 31, 2023 |
| (In millions) | (In millions) | Las Vegas | | Regional | | Caesars Digital | | Managed and Branded | | Corporate and Other | | Total | (In millions) | Las Vegas | | Regional | | Caesars Digital | | Managed and Branded | | Corporate and Other | | Total |
| Casino and pari-mutuel commissions | $ | 1,226 | | | $ | 4,305 | | | $ | 296 | | | $ | — | | | $ | — | | | $ | 5,827 | |
| Casino | |
| Food and beverage | Food and beverage | 702 | | | 438 | | | — | | | — | | | — | | | 1,140 | |
| Hotel | Hotel | 968 | | | 583 | | | — | | | — | | | — | | | 1,551 | |
| Other | Other | 513 | | | 211 | | | 41 | | | 278 | | | 9 | | | 1,052 | |
| | Net revenues | Net revenues | $ | 3,409 | | | $ | 5,537 | | | $ | 337 | | | $ | 278 | | | $ | 9 | | | $ | 9,570 | |
| | Net revenues | |
| | Net revenues | |
CAESARS ENTERTAINMENT, INC.
NOTES TO CONSOLIDATED FINANCIAL STATEMENTS (CONTINUED)
| | Year Ended December 31, 2020 |
| Year Ended December 31, 2022 | | | Year Ended December 31, 2022 |
| (In millions) | (In millions) | Las Vegas | | Regional | | Caesars Digital | | Managed and Branded | | Corporate and Other | | Total | (In millions) | Las Vegas | | Regional | | Caesars Digital | | Managed and Branded | | Corporate and Other | | Total |
| Casino and pari-mutuel commissions | $ | 319 | | | $ | 2,079 | | | $ | 84 | | | $ | — | | | $ | — | | | $ | 2,482 | |
| Casino | |
| Food and beverage | Food and beverage | 130 | | | 211 | | | — | | | 1 | | | — | | | 342 | |
| Hotel | Hotel | 186 | | | 264 | | | — | | | — | | | — | | | 450 | |
| Other | Other | 116 | | | 106 | | | 11 | | | 106 | | | 15 | | | 354 | |
| Net revenues | Net revenues | $ | 751 | | | $ | 2,660 | | | $ | 95 | | | $ | 107 | | | $ | 15 | | | $ | 3,628 | |
| | Year Ended December 31, 2019 |
| Year Ended December 31, 2021 | | | Year Ended December 31, 2021 |
| (In millions) | (In millions) | Las Vegas | | Regional | | Caesars Digital | | Managed and Branded | | Corporate and Other | | Total | (In millions) | Las Vegas | | Regional | | Caesars Digital | | Managed and Branded | | Corporate and Other | | Total |
| Casino and pari-mutuel commissions | $ | — | | | $ | 1,782 | | | $ | 26 | | | $ | — | | | $ | — | | | $ | 1,808 | |
| Casino | |
| Food and beverage | Food and beverage | — | | | 301 | | | — | | | — | | | — | | | 301 | |
| Hotel | Hotel | — | | | 300 | | | — | | | — | | | — | | | 300 | |
| Other | Other | — | | | 111 | | | — | | | — | | | 8 | | | 119 | |
| | Net revenues | Net revenues | $ | — | | | $ | 2,494 | | | $ | 26 | | | $ | — | | | $ | 8 | | | $ | 2,528 | |
| | Net revenues | |
| | Net revenues | |
Accounts Receivable and Credit Risk
We issue credit to approved casino customers following investigations of creditworthiness. Business or economic conditions or other significant events could affect the collectability of these receivables. Accounts receivable are non-interest bearing and are initially recorded at cost.
Marker play represents a meaningful portion of our overall table games volume. We maintain strict controls over the issuance of markers and aggressively pursue collection from those customers who fail to pay their marker balances timely. These collection efforts include the mailing of statements and delinquency notices personal contacts,and the use of personal contacts, outside collection agencies and civil litigation. Markers are generally legally enforceable instruments in the United States. Markers are not legally enforceable instruments in some foreign countries, but the United States assets of foreign customers may be reached to satisfy judgments entered in the United States. We consider the likelihood and difficulty of enforceability, among other factors, when we issue credit to customers who are not residents of the United States.
Trade receivables, including casino and hotel receivables, are typically non-interest bearing. Accounts are written off when management deems the account to be uncollectible. Recoveries of accounts previously written off are recorded when received. Management believes that as of December 31, 2023 and 2022, no significant concentrations of credit risk related to receivables existed.
Reserve for Uncollectible Accounts Receivable
An estimated allowance for doubtful accounts is maintained to reduce the Company’s receivables to their carrying amount, which approximates fair value. The allowance is estimated based on specific review of customer accounts, historical collection experience, customer relationships and reasonable forecasts which consider current economic and business conditions. Management believes that as of December 31, 2021 and 2020, no significant concentrations ofconditions to reflect current expected credit risk related to receivables existed.
Reserve for Uncollectible Accounts Receivable
We reserve an estimated amount for receivables that may not be collected. Methodologies for estimating bad debt reserves range from specific reserves to various percentages applied to aged receivables. Historical collection rates are considered, as are customer relationships, in determining specific reserves.loss. As with many estimates, management must make judgments about potential actions by third parties in establishing and evaluating our reserves for bad debts.
| | Accounts Receivable, Net | Accounts Receivable, Net | |
| December 31, |
| December 31, | |
| December 31, | |
| December 31, | |
| (In millions) | (In millions) | 2021 | | 2020 | (In millions) | 2023 | | 2022 |
| Casino and pari-mutuel commissions | $ | 168 | | | $ | 137 | |
| Casino | |
| Food and beverage and hotel | Food and beverage and hotel | 100 | | | 25 | |
| Other | Other | 204 | | | 180 | |
| Accounts receivable, net | Accounts receivable, net | $ | 472 | | | $ | 342 | |
CAESARS ENTERTAINMENT, INC.
NOTES TO CONSOLIDATED FINANCIAL STATEMENTS (CONTINUED)
| | Allowance for Doubtful Accounts | Allowance for Doubtful Accounts | |
| (In millions) | (In millions) | Contracts | | Other (a) | | Total |
| Balance as of January 1, 2019 | $ | 2 | | | $ | 2 | | | $ | 4 | |
| | Provision for doubtful accounts | 1 | | | — | | | 1 | |
| Write-offs less recoveries | 1 | | | (1) | | | — | |
| Balance as of December 31, 2019 | 4 | | | 1 | | | 5 | |
| Former Caesars consolidation | 95 | | | 35 | | | 130 | |
| Provision for doubtful accounts | 18 | | | 11 | | | 29 | |
| Write-offs less recoveries | 3 | | | (29) | | | (26) | |
| Balance as of December 31, 2020 | 120 | | | 18 | | | 138 | |
| (In millions) | |
| (In millions) | | Contracts | | Other (a) | | Total |
| Balance as of January 1, 2021 | |
| Provision for doubtful accounts | Provision for doubtful accounts | 16 | | | 10 | | | 26 | |
| Write-offs less recoveries | Write-offs less recoveries | (26) | | | (8) | | | (34) | |
| Balance as of December 31, 2021 | Balance as of December 31, 2021 | $ | 110 | | | $ | 20 | | | $ | 130 | |
| Provision for doubtful accounts | |
| Write-offs less recoveries | |
| Balance as of December 31, 2022 | |
| Provision for doubtful accounts | |
| Write-offs less recoveries | |
| Balance as of December 31, 2023 | |
____________________
(a)“Other” includes allowance associated with lease receivables under ASC 842. See Note 10 for further details. Contract and Contract Related Liabilities
The Company records contract or contract-related liabilities related to differences between the timing of cash receipts from the customer and the recognition of revenue. The Company generally has three types of liabilities related to contracts with customers: (1) outstanding chip liability, which represents the amounts owed in exchange for gaming chips held by a customer,customers,(2) Caesars Rewards player loyalty program obligations, subsequently combined as Caesars Rewards, which representsrepresent the deferred allocation of revenue relating to reward credits granted to Caesars Rewards members based on on-property spending,certain types of customer spend, including online and retail gaming, hotel, dining, retail shopping, and player loyalty program incentives earned, and (3) customer deposits and other deferred revenue, which is primarily represents funds deposited by customers related to gaming play and advance payments received for goods and services yet to be provided (such as advance ticket sales, deposits on rooms and convention space, unpaid wagers, iGaming deposits, or future sports bets), these. These liabilities are generally expected to be recognized as revenue within one year of being purchased, earned, or deposited and are recorded within accrued other liabilities on the Company’s Balance Sheets. Liabilities expected to be recognized as revenue beyond one year of being purchased, earned, or deposited are recorded within other long-term liabilities on the Company’s Balance Sheets.
Outstanding Chip Liability
The Company recognizes the impact on gaming revenues on an annual basis to reflect an estimate of the change in the value of outstanding chips that are not expected to be redeemed. This estimate is determined by measuring the difference between the total value of chips placed in service less the value of chips under our control. This measurement is performed on an annual basis utilizing a methodology in which a consistent formula is applied to estimate the percentage of chips not in our custody that are not expected to be redeemed. In addition to the formula, certain judgments are made with regard to various denominations and souvenir chips. The outstanding chip liability is included in accrued other liabilities on the Balance Sheets.
Caesars Rewards Loyalty Program
Caesars Rewards grants Reward Credits to Caesars Rewards Members based on on-property spending,various types of customer spend, including online and retail gaming, hotel, dining, and retail shopping at all Caesars-affiliated properties. Members may redeem Reward Credits for complimentary or discounted goods and services such as rooms, food and beverages, merchandise, free play, entertainment, and travel accommodations. Members are able to accumulate Reward Credits over time that they may redeem at their discretion under the terms of the program. A member’s Reward Credit balance is forfeited if the member does not earn at least one Reward Credit during a continuous six-month period.
Because of the significance of the Caesars Rewards program and the ability for customers to accumulate Reward Credits based on their past play, we have determined that Reward Credits granted in conjunction with other earning activity represent a performance obligation. As a result, for transactions in which Reward Credits are earned, we allocate a portion of the transaction price to the Reward Credits that are earned based upon the relative standalone selling prices (“SSP”)SSP of the goods and services involved. When the activity underlying the “earning” of the Reward Credits has a wide range of selling prices and is highly variable, such as in the case of gaming activities, we use the residual approach in this allocation by computing the value of the Reward Credits as described below and allocating the residual amount to the gaming activity. This allocation results in a significant portion of the transaction price being deferred and presented as a Contract liability on our accompanying Balance Sheets. Any amounts allocated to Contract liabilities areis recognized as revenue when the Reward Credits are redeemed in accordance with the specific recognition policy of the activity for which the credits are redeemed.
CAESARS ENTERTAINMENT, INC.
NOTES TO CONSOLIDATED FINANCIAL STATEMENTS (CONTINUED)
Our Caesars Rewards loyalty program includes various tiers that offer different benefits, and members are able to earn credits towards tier status, which generally enables them to receive discounts similar to those provided as complimentaries described below. We have determined that any such discounts received as a result of tier status do not represent material rights, and therefore, we do not account for them as distinct performance obligations.
We have determined the SSP of a Reward Credit by computing the redemption value of credits expected to be redeemed. Because Reward Credits are not otherwise independently sold, we analyzed all Reward Credit redemption activity over the preceding calendar year and determined the redemption value based on the fair market value of the goods and services for which the Reward Credits were redeemed. We have applied the practical expedient under the portfolio approach to our Reward Credit transactions because of the similarity of gaming and other transactions and the homogeneity of Reward Credits.
As part of determining the SSP for Reward Credits, we also determined that there is generally an amount of Reward Credits that is not redeemed, which is considered “breakage.” We recognize the expected breakage proportionally with the pattern of revenue recognized related to the redemption of Reward Credits. We periodically reassess our customer behaviors and revise our expectations as deemed necessary on a prospective basis.
The following table summarizes the activity related to contract and contract-related liabilities:
| | Outstanding Chip Liability | | Caesars Rewards | | Customer Deposits and Other Deferred Revenue |
| Outstanding Chip Liability | | | Outstanding Chip Liability | | Caesars Rewards | | Customer Deposits and Other Deferred Revenue |
| (In millions) | (In millions) | 2021 | | 2020 | | 2021 | | 2020 | | 2021 | | 2020 | (In millions) | 2023 | | 2022 | | 2023 | | 2022 | | 2023 | | 2022 |
| Balance at January 1 | Balance at January 1 | $ | 34 | | | $ | 10 | | | $ | 94 | | | $ | 13 | | | $ | 310 | | | $ | 172 | |
| Balance at December 31 | Balance at December 31 | 48 | | | 34 | | | 91 | | | 94 | | | 560 | | | 310 | |
| Increase (decrease) | Increase (decrease) | $ | 14 | | | $ | 24 | | | $ | (3) | | | $ | 81 | | | $ | 250 | | | $ | 138 | |
The December 31, 2021 balances exclude liabilities related to assets held for sale recordedCustomer deposits and other deferred revenues increased in 2021 and 2020 (see Note 4). The significant change in contract and contract-related liabilities during the year ended December 31, 2021 was2022 primarily due to our expansion in the Caesars Digital segment fromwith the legalization of retail and online sports betting in new states. The significant change in customer deposits and other deferred revenue during the year ended December 31, 2020 was primarily attributed to the liabilities assumed subsequent to the Merger.
Complimentaries
The Company offers discretionary coupons and other discretionary complimentaries to customers outside of the loyalty program such as matching deposits, free bets and free play. Such complimentaries are provided in conjunction with other revenue‑earning activities and are generally provided to encourage additional customer spending on those activities. Accordingly, the Company allocates a portion of the transaction price received from such customers to the complimentary goods and services. The Company performs this allocation based on the SSP of the underlying goods and services, which is determined based upon the weighted-average cash sales prices received for similar services at similar points during the year. The retail value of complimentary food, beverage, hotel rooms and other services provided to customers is recognized as a reduction of revenues for the department which issued the complimentary and revenue for the department redeemed. Complimentaries provided by third parties at the discretion and under the control of the Company isare recorded as an expense when incurred.
The Company’s revenues included complimentaries and loyalty point redemptions totaling $1.4 billion, $1.2 billion and $1.0 billion $406 million and $292 million for the years ended December 31, 2021, 20202023, 2022 and 2019,2021, respectively.
Note 14. Earnings per Share
Basic earnings per share (“EPS”) is computed by dividing net income (loss) by the weighted average shares outstanding during the reporting period. Diluted EPS is computed similarly to basic EPS except that the weighted average shares outstanding are increased to include additional shares from the assumed exercise of stock options and the assumed vesting of restricted share units, if dilutive. The number of additional shares is calculated by assuming that outstanding stock options were exercised, that outstanding restricted share units were released and that the proceeds from such activities were used to acquire shares of common stock at the average market price during the reporting period.
For a period in which the Company generated a net loss from continuing operations, the weighted average shares outstanding - basic was used in calculating diluted loss per share because using diluted shares would have been anti-dilutive to loss per share.
CAESARS ENTERTAINMENT, INC.
NOTES TO CONSOLIDATED FINANCIAL STATEMENTS (CONTINUED)
The following table illustrates the required disclosure of the reconciliation of the numerators and denominators of the basic and diluted net income (loss) per share computations during the years ended December 31, 2021, 20202023, 2022 and 2019:2021:
| | Years Ended December 31, |
| Years Ended December 31, | | | Years Ended December 31, |
| (In millions, except per share amounts) | (In millions, except per share amounts) | 2021 | | 2020 | | 2019 | (In millions, except per share amounts) | 2023 | | 2022 | | 2021 |
| Net income (loss) from continuing operations attributable to Caesars, net of income taxes | Net income (loss) from continuing operations attributable to Caesars, net of income taxes | $ | (989) | | | $ | (1,737) | | | $ | 81 | |
| Discontinued operations, net of income taxes | Discontinued operations, net of income taxes | (30) | | | (20) | | | — | |
| Net income (loss) attributable to Caesars | Net income (loss) attributable to Caesars | $ | (1,019) | | | $ | (1,757) | | | $ | 81 | |
| Shares outstanding: | Shares outstanding: | | | | | |
| Weighted average shares outstanding – basic | Weighted average shares outstanding – basic | 211 | | | 130 | | | 78 | |
| Weighted average shares outstanding – basic | |
| Weighted average shares outstanding – basic | |
| Effect of dilutive securities: | Effect of dilutive securities: | |
| Stock-based compensation awards | |
| Stock-based compensation awards | |
| Stock-based compensation awards | Stock-based compensation awards | — | | | — | | | 1 | |
| Weighted average shares outstanding – diluted | Weighted average shares outstanding – diluted | 211 | | | 130 | | | 79 | |
| | Basic income (loss) per share from continuing operations | |
| Basic income (loss) per share from continuing operations | |
| Basic income (loss) per share from continuing operations | Basic income (loss) per share from continuing operations | $ | (4.69) | | | $ | (13.35) | | | $ | 1.04 | |
| Basic loss per share from discontinued operations | Basic loss per share from discontinued operations | (0.14) | | | (0.15) | | | — | |
| Net income (loss) per common share attributable to common stockholders – basic: | Net income (loss) per common share attributable to common stockholders – basic: | $ | (4.83) | | | $ | (13.50) | | | $ | 1.04 | |
| | Diluted income (loss) per share from continuing operations | Diluted income (loss) per share from continuing operations | $ | (4.69) | | | $ | (13.35) | | | $ | 1.03 | |
| Diluted income (loss) per share from continuing operations | |
| Diluted income (loss) per share from continuing operations | |
| Diluted loss per share from discontinued operations | Diluted loss per share from discontinued operations | (0.14) | | | (0.15) | | | — | |
| Net income (loss) per common share attributable to common stockholders – diluted: | Net income (loss) per common share attributable to common stockholders – diluted: | $ | (4.83) | | | $ | (13.50) | | | $ | 1.03 | |
| | Weighted-Average Number of Anti-Dilutive Shares Excluded from Calculation of EPS | Weighted-Average Number of Anti-Dilutive Shares Excluded from Calculation of EPS | |
| Years Ended December 31, |
| Years Ended December 31, | |
| Years Ended December 31, | |
| Years Ended December 31, | |
| (In millions) | (In millions) | 2021 | | 2020 | | 2019 | (In millions) | 2023 | | 2022 | | 2021 |
| | Stock-based compensation awards | Stock-based compensation awards | 3 | | | 9 | | | — | |
| | 5% Convertible notes | — | | | 4 | | | — | |
| Total anti-dilutive common stock | Total anti-dilutive common stock | 3 | | | 13 | | | — | |
Note 15. Stock-Based Compensation and Stockholders’ Equity
Stock-Based Awards
The Company maintains long-term incentive plans which allow for granting stock-based compensation awards for directors, employees, officers, and consultants or advisers who render services to the Company or its subsidiaries, based on Company Common Stock, including performance-based and incentive stock options, restricted stock, or restricted stock units (“RSUs”), performance stock units (“PSUs”), market-based performance stock units (“MSUs”), stock appreciation rights, and other stock-based awards or dividend equivalents. Forfeitures are recognized in the period in which they occur.
Performance Incentive Plans
In 2015, theThe Board of Directors (“Board”) adopted, and the Company’s stockholders approved, ERI’sthe 2015 Equity Incentive Plan, (“2015 Plan”). In 2019, the Company’s Board approved, and the Company’s stockholders approved, theas amended and restated 2015 Plan. The amendment to the 2015 Planin 2019 (the “2015 Plan”), which allows for 3 million shares available for grant, plus the numberto be granted as part of shares available for issuance under the 2015 Plan on the date the Company’s stockholders approved the amendment.long-term incentive plan. As of December 31, 2021,2023, the Company had 54 million shares available for grant under the 2015 Plan.
Equity awards granted to employees and executive officers generally vest within threeone to fourthree years from the grant date either ratably on each anniversary, or entirely at the end of the service period. Awards may also contain performance conditions in addition to time based vesting conditions. Performance awards relate to the achievement of defined levels of performance and will vest and become payable at the end of the vesting period. Performance awards may contain targeted performance levels, which may ultimately vest within a range of 0% to 200% of the target award, based on defined operating metrics or market performance as compared to a peer group. RSUs granted to non-employee directors generally vest immediately and are issued on the vesting date, or may be deferred.
Total stock-based compensation expense in the accompanying Statements of Operations was $82$104 million, $79$101 million and $20$82 million during the years ended December 31, 2021, 20202023, 2022 and 2019,2021, respectively. These amounts are included in corporateCorporate expenses and, in the case of certain property positions, General and administrative expenses in the Company’s Statements of Operations.
CAESARS ENTERTAINMENT, INC.
NOTES TO CONSOLIDATED FINANCIAL STATEMENTS (CONTINUED)
expenses and, in the case of certain property positions, general and administrative expenses in the Company’s Statements of Operations.
Restricted Stock Unit Activity
During the year ended December 31, 2021, as part of the annual incentive program,2023, the Company granted RSUs to employees of the Company with an aggregate fair value of $79$78 million. Each RSU represents the right to receive payment in respect of one share of the Company’s Common Stock.
A summary of the RSUs activity for the year ended December 31, 20212023 is presented in the following table:
| | | | Units | | Weighted Average Grant Date Fair Value (a) | | Units | | Weighted Average Grant Date Fair Value (a) |
| Unvested outstanding as of December 31, 2020 | 2,414,111 | | | $ | 42.55 | |
| Unvested outstanding as of December 31, 2022 | |
Granted (b) | Granted (b) | 927,016 | | | 86.37 | |
| | Vested | Vested | (1,136,673) | | | 33.49 | |
| Forfeited | Forfeited | (113,847) | | | 54.34 | |
| Unvested outstanding as of December 31, 2021 | 2,090,607 | | | 61.47 | |
| Unvested outstanding as of December 31, 2023 | |
____________________
(a)Represents the weighted-average grant date fair value of RSUs, which is the share price of our common stock on the grant date.
(b)Included are 23,13934,167 RSUs granted to non-employee members of the Board during the year ended December 31, 2021.2023.
Performance Stock Unit Activity
During the year ended December 31, 2021,2023, the Company granted approximately 81 thousand PSUs that are scheduled to vest in three years fromemployees of the grant date.Company with an aggregate fair value of $9 million as of December 31, 2023. On the vesting date, recipients will receive between 0% and 200% of the target number of PSUs granted, in the form of Company Common Stock, based on the achievement of specified performance conditions. The fair value of the PSUs is based on the market price of our common stock when a mutual understanding of the key terms and conditions of the awards between the Company and recipient is achieved. The awards are remeasured each period until such an understanding is reached. The aggregate value of PSUs granted during the year ended December 31, 2021 was $9 million.
A summary of the PSUs activity for the year ended December 31, 20212023 is presented in the following table:
| | | | Units | | Weighted Average Grant Date Fair Value (a) | | Units | | Weighted Average Grant Date Fair Value (a) |
Unvested outstanding as of December 31, 2020 (b) | 500,483 | | | $ | 48.32 | |
| Unvested outstanding as of December 31, 2022 | |
| Granted | Granted | 81,006 | | | 112.28 | |
| | Performance Adjustment | |
| Vested | |
| Vested | |
| Vested | Vested | (161,556) | | | 37.49 | |
| Forfeited | Forfeited | (2,864) | | | 73.21 | |
| Unvested outstanding as of December 31, 2021 | 417,069 | | | 62.20 | |
| Unvested outstanding as of December 31, 2023 | |
____________________
(a)GrantThis represents the weighted-average grant date fair value for which compensation expense of these unvested awards is measured,PSUs where the grant date has not been achieved. This representsachieved or the quoted market price of our common stock on the dated indicated.
(b)PSUs were presented with RSUs as of December 31, 2020 in the 2020 Annual Report.balance sheet date for PSUs where a grant date has not been achieved.
Market-Based Stock Unit Activity
During the year ended December 31, 2021,2023, the Company granted approximately 147 thousand MSUs that are scheduled to cliff vest in three years fromemployees of the grant date.Company with an aggregate fair value of $31 million. On the vesting date, recipients will receive between 0% and 200% of the granted MSUs in the form of Company Common Stock based on the achievement of specified market and service conditions. Based on the terms and conditions of the awards, the grant date fair value of the MSUs was determined using a Monte Carlo simulation model. Key assumptions for the Monte Carlo simulation model are the risk-free interest rate, expected volatility, expected dividends and correlation coefficient. The effect of market conditions is considered in determining the grant date fair value, which is not subsequently revised based on actual performance. The aggregate value of MSUs granted during the year ended December 31, 2021 was $15 million.
CAESARS ENTERTAINMENT, INC.
NOTES TO CONSOLIDATED FINANCIAL STATEMENTS (CONTINUED)
A summary of the MSUs activity for the year ended December 31, 20212023 is presented in the following table:
| | Units | | Weighted- Average Fair Value (a) |
| Unvested outstanding as of December 31, 2020 | 446,087 | | | $ | 49.37 | |
| Units | | | Units | | Weighted- Average Fair Value (a) |
| Unvested outstanding as of December 31, 2022 | |
| Granted | Granted | 147,471 | | | 102.98 | |
| | Performance Adjustment | |
| Vested | |
| Vested | |
| Vested | Vested | (208,866) | | | 28.56 | |
| Forfeited | Forfeited | (2,769) | | | 84.12 | |
| Unvested outstanding as of December 31, 2021 | 381,923 | | | 77.09 | |
| Unvested outstanding as of December 31, 2023 | |
____________________
(a)Represents the grant date fair value determined using a Monte Carlo simulation model.
| | | | | | | | | | | | | | | | | | | | | | | | | |
| Stock Option Activity | | | | | | | | | |
| Shares | | Weighted Average Exercise Price | | | | Weighted Average Remaining Contractual Term (years) | | Aggregate Intrinsic Value
(in millions) |
| Outstanding as of December 31, 2020 | 176,724 | | | $ | 22.57 | | | | | 1.71 | | $ | 9 | |
| | | | | | | | | |
| Exercised | (114,884) | | | 22.64 | | | | | | | |
| Forfeited | (1,233) | | | 26.65 | | | | | | | |
| Expired | (16,702) | | | 26.67 | | | | | | | |
| Outstanding as of December 31, 2021 | 43,905 | | | 20.69 | | | | | 1.05 | | 3 | |
| Vested and expected to vest as of December 31, 2021 | 43,905 | | | 20.69 | | | | | 1.05 | | 3 | |
| Exercisable as of December 31, 2021 | 42,610 | | | 20.84 | | | | | 1.05 | | 3 | |
| | | | | | | | | | | | | | | | | | | | | | | | | |
| Stock Option Activity | | | | | | | | | |
| Shares | | Weighted Average Exercise Price | | | | Weighted Average Remaining Contractual Term (years) | | Aggregate Intrinsic Value
(in millions) |
| Outstanding as of December 31, 2022 | 88 | | | $ | 30.63 | | | | | 0.14 | | $ | — | |
| Exercised | (88) | | | 30.63 | | | | | | | |
| | | | | | | | | |
| | | | | | | | | |
| Outstanding as of December 31, 2023 | — | | | — | | | | | 0 | | — | |
| Vested and expected to vest as of December 31, 2023 | — | | | — | | | | | 0 | | — | |
| Exercisable as of December 31, 2023 | — | | | — | | | | | 0 | | — | |
| | Stock Option Exercises | Stock Option Exercises | |
| Years Ended December 31, |
| Years Ended December 31, | |
| Years Ended December 31, | |
| Years Ended December 31, | |
| (Dollars in millions) | (Dollars in millions) | 2021 | | 2020 | | 2019 | (Dollars in millions) | 2023 | | 2022 | | 2021 |
| | Option Exercises: | Option Exercises: | | | | | |
| | Option Exercises: | |
| | Option Exercises: | |
| Number of options exercised | |
| Number of options exercised | |
| Number of options exercised | Number of options exercised | 114,884 | | | 70,608 | | | — | |
| Cash received for options exercised | Cash received for options exercised | $ | 3 | | | $ | 1 | | | $ | — | |
| Aggregate intrinsic value of options exercised | Aggregate intrinsic value of options exercised | $ | 9 | | | $ | 5 | | | $ | — | |
|
Unrecognized Compensation Cost
As of December 31, 2021,2023, the Company had $120$98 million of unrecognized compensation expense, which is expected to be recognized over a weighted-average period of 1.41.7 years.
Common Stock Offerings
On June 19, 2020, the Company completed the public offering of 20,700,000 shares (including the shares sold pursuant to the underwriters’ overallotment option) of Company Common Stock, at an offering price of $39.00 per share, which provided $772 million of proceeds, net of fees and estimated expenses of $35 million.
On October 1, 2020, the Company completed the public offering of 35,650,000 shares (including the shares sold pursuant to the underwriters’ overallotment option) of Company Common Stock, at an offering price of $56.00 per share, which provided $1.9 billion of proceeds, net of fees and estimated expenses of $50 million.
Changes to the Authorized Shares
On June 17, 2021, following receipt of required shareholder approvals, the Company amended its Certificate of Incorporation to increase the number of authorized shares of common stock from 300 million to 500 million, andmillion.
Preferred Stock
On June 17, 2021, following receipt of required shareholder approvals, the Company amended its Certificate of Incorporation to authorize the issuance of up to 150 million shares of preferred stock. As of December 31, 2021, 0 shares of preferred stock have been issued.
Share Repurchase Program
In November 2018, the Board authorized a $150 million common stock repurchase program (the “Share Repurchase Program”) pursuant to which the Company may, from time to time, repurchase shares of common stock on the open market (either with or
CAESARS ENTERTAINMENT, INC.
NOTES TO CONSOLIDATED FINANCIAL STATEMENTS (CONTINUED)
without a 10b5-1 plan) or through privately negotiated transactions. The Share Repurchase Program has no time limit and may be suspended or discontinued at any time without notice. There is no minimum number of shares of common stock that the Company is required to repurchase under the Share Repurchase Program.
As of December 31, 2021,2023, the Company has acquired 223,823 shares of common stock at an aggregate value of $9 million and an average of $40.80 per share. No shares were repurchased during the years ended December 31, 20212023 or 2020.2022.
CAESARS ENTERTAINMENT, INC.
NOTES TO CONSOLIDATED FINANCIAL STATEMENTS (CONTINUED)
Note 16. Employee Benefit Plans
401(k) Plans
The Company offers several savings and retirement plansa 401(k) plan to substantially all employees who are not covered by collective bargaining agreements, who meet certain eligibility requirements, namely terms of service. All existing savings and retirement plans transitioned into the Caesars Entertainment, Inc. 401(k) Plan with Prudential Retirement. Under the 401(k) plan, the Company matches contributions equal to 50% of the first 6% as outlined per plan documents.
The Company’s matching contribution expense totaled $27$29 million, $11$29 million and $6$27 million for the years ended December 31, 2021, 20202023, 2022 and 2019,2021, respectively.
Defined-Benefit Plans
Scioto Downs sponsors a noncontributory defined-benefit plan covering all full-time employees meeting certain age and service requirements. On May 31, 2001, the plan was amended to freeze eligibility, accrual of years of service and benefits. As of December 31, 2021,2023, the fair value of the plan assets was $1 million, and the fair value of the benefit obligationsobligation was $1 million. The plan assets are comprised primarily of money market and mutual funds whose values are determined based on quoted market prices and are classified in Level 1 of the fair value hierarchy. We did not make cash contributions to the Scioto Downs pension plan during 2021, 20202023, 2022 and 2019.2021.
In addition, the Company also sponsors a defined-benefit plan for certain Tropicana Atlantic City employees under a Variable Annuity Pension Plan. As of December 31, 2021,2023, the fair value of both, the plan assets was $25 million and benefit obligations was $21totaled $20 million. Contributions to the plan were less than$2 million for the years ended December 31, 2023 and 2022 and $1 million for the year ended December 31, 2021 and $2 million for the year ended December 31, 2020.
The Company participated in a defined-benefit plan for employees of the London Clubs International subsidiary that provided benefits based on final pensionable salary. As of December 31, 2020, the plan had a net pension liability of $20 million, which was recorded within liabilities held for sale on our Balance Sheets. For the year ended December 31, 2020, we contributed $4 million to the plan. On July 16, 2021, the Company completed the sale of Caesars UK Group, in which the buyer assumed all liabilities associated with the Caesars UK Group.2021.
Deferred Compensation Plans
CEI assumed Former Caesarstwo active deferred compensation plans, the Caesars Entertainment Corporation Executive Supplemental Savings Plan III (“ESSP III”) and the Caesars Entertainment Corporation Outside Director Deferred Compensation Plan. These plans are unfunded, non-qualified deferred compensation plans. Payment obligations pursuant to the plans are unsecured general obligations of the Company and affiliates of the Company employing participants in the ESSP III. The liability as of December 31, 20212023 and 20202022 was $3$5 million and $2 million, respectively, which was recorded in Deferred credits and other liabilities.Other long-term liabilities in the Balance Sheets.
As of December 31, 2021,2023, certain current and former employees of Caesars, and our subsidiaries and affiliates, have balances under: (i) the Harrah’s Entertainment, Inc. Executive Supplemental Savings Plan, (ii) the Harrah’s Entertainment, Inc. Executive Supplemental Savings Plan II, (iii) the Park Place Entertainment Corporation Executive Deferred Compensation Plan, (iv) the Harrah’s Entertainment, Inc. Deferred Compensation Plan, and (v) the Harrah’s Entertainment, Inc. Executive Deferred Compensation Plan (collectively, the “existing deferred compensation plans”). These plans are deferred compensation plans that allowallowed certain employees an opportunity to save for retirement and other purposes.
Each of the plans is now frozen and is no longer accepting contributions. However, participants may still earn returns on existing plan balances based upon their selected investment alternatives, which are reflected in their deferral accounts. The total liability recorded in Deferred credits and otherOther long-term liabilities in the Balance Sheets for these plans was $43$31 million and $49$33 million as of December 31, 20212023 and 2020,2022, respectively.
CAESARS ENTERTAINMENT, INC.
NOTES TO CONSOLIDATED FINANCIAL STATEMENTS (CONTINUED)
Trust Assets
CEI is a party to a trust agreement (the “Trust Agreement”) and an escrow agreement with respect to all five of the existing deferred compensation plans (the “Escrow Agreement”), each structured as a so-called “rabbi trust” arrangements,arrangement, which holds assets that may be used to satisfy obligations under the existing deferred compensation plans above. Amounts held pursuant to the Trust Agreement and the Escrow Agreement were $87$67 million and $94$60 million, respectively, as of December 31, 20212023 and 20202022, respectively, and have been reflected within Deferred charges and otherOther long-term assets, onnet in the Balance Sheets.
CAESARS ENTERTAINMENT, INC.
NOTES TO CONSOLIDATED FINANCIAL STATEMENTS (CONTINUED)
Multi-employer Pension Plans
As a result of the Merger, theThe Company continues to contributecontributes to a number of multi-employer defined benefit pension plans under the terms of collective bargaining agreements that cover union-represented employees of Former Caesars. Prior to the Merger, no significant contributions were made to such plans.employees. The risks of participating in these multi-employer plans are different from a single-employer plan in the following respects:
i.Assets contributed to the multi-employer plan by one employer may be used to provide benefits to employees of other participating employers.
ii.If a participating employer stops contributing to the plan, the unfunded obligations of the plan may be borne by the remaining participating employers.
iii.If the Company chooses to stop participating in some of its multi-employer plans, the Company may be required to pay those plans an amount based on the underfunding of the plan, referred to as a “withdrawal liability.”
| | Multi-employer Pension Plan Participation | Multi-employer Pension Plan Participation | Multi-employer Pension Plan Participation |
| Pension Protection Act Zone Status (a) | | Contributions (In millions) | |
| | | | Pension Protection Act Zone Status (a) | |
| Pension Fund | Pension Fund | | EIN/Pension Plan Number | | 2021 | | FIP/RP Status (b) | | 2021 | | 2020 | | Surcharge Imposed | | Expiration Date of Collective Bargaining Agreement (c) |
Southern Nevada Culinary and Bartenders Pension Plan (d)(e) | | 88-6016617/001 | | Green | | No | | $ | 18 | | | $ | 5 | | | No | | May 31, 2023 |
| Legacy Plan of the UNITE HERE Retirement Fund (d)(f) | | 82-0994119/001 | | Red | | Yes | | 9 | | | 4 | | No | | Various up to May 31, 2023 |
| | Pension Fund | |
| Pension Fund | | | EIN/Pension Plan Number | | 2023 | | FIP/RP Status (b) | | 2023 | | 2022 | | 2021 | | Surcharge Imposed | | Expiration Date of Collective Bargaining Agreement (c) |
Southern Nevada Culinary and Bartenders Pension Plan (d) | | Southern Nevada Culinary and Bartenders Pension Plan (d) | | 88-6016617/001 | | Green | | No | | $ | 26 | | | $ | 24 | | | $ | 18 | | | No | | September 30, 2028 |
Legacy Plan of the UNITE HERE Retirement Fund (d)(e) | | Legacy Plan of the UNITE HERE Retirement Fund (d)(e) | | 82-0994119/001 | | Red | | Yes | | 10 | | | 9 | | No | | Various up to May 31, 2026 |
| Central Pension Fund of the IUOE & Participating Employers | Central Pension Fund of the IUOE & Participating Employers | | 36-6052390/001 | | Green | | No | | 6 | | | — | | | N/A | | March 31, 2021 | Central Pension Fund of the IUOE & Participating Employers | | 36-6052390/001 | | Green | | No | | 7 | | | 7 | | 7 | | | 6 | | 6 | | | N/A | | N/A | | March 31, 2024 |
| Western Conference of Teamsters Pension Plan | Western Conference of Teamsters Pension Plan | | 91-6145047/001 | | Green | | No | | 5 | | | — | | | N/A | | Various up to August 31, 2024 | Western Conference of Teamsters Pension Plan | | 91-6145047/001 | | Green | | No | | 7 | | | 6 | | 6 | | | 5 | | 5 | | | N/A | | N/A | | March 31, 2024 |
Local 68 Engineers Union Pension Plan (d)(g) | | 51-0176618/001 | | Yellow | | Yes | | 1 | | | — | | | No | | April 30, 2022 |
| | Painters IUPAT | |
| Painters IUPAT | |
| Painters IUPAT | Painters IUPAT | | 52-6073909/001 | | Yellow | | Yes | | 1 | | | — | | | No | | Various up to June 30, 2026 | | 52-6073909/001 | | Yellow | | No | | 1 | | | 1 | | 1 | | | 1 | | 1 | | | No | | No | | Various up to June 30, 2026 |
| Other Funds | Other Funds | | 1 | | | 5 | |
| Total Contributions | Total Contributions | | $ | 41 | | | $ | 14 | | |
| Total Contributions | |
| Total Contributions | |
____________________
(a)Represents the Pension Protection Act zone status for applicable plan year beginning January 1, except where noted otherwise. The zone status is based on information that the Company received from the plan administrator and is certified by the plan’s actuary. Among other factors, plans in the red zone are generally less than 65% funded, plans in the yellow zone are between 65% and less than 80% funded, and plans in the green zone are at least 80% funded. All plans detailed in the table above utilized extended amortization provisions to calculate zone status.
(b)Indicates plans for which a financial improvement plan (“FIP”) or a rehabilitation plan (“RP”) is either pending or has been implemented.
(c)The terms of the current agreement continue indefinitely until either party provides appropriate notice of intent to terminate the contract.
(d)Prior to the Merger, Former Caesars provided more than 5% of the total contributions for the plan year ended December 31, 2019.
(e)The Company provided more than 5% of the total contributions for the plan year ended December 31, 20202022 and as of the date the financial statements were issued, Forms 5500 were not available for the 20212023 plan year.
(f)(e)The HEREIU Pension Fund consists of two separate plans, the Legacy Plan of the HEREIU Pension Fund and the Adjustable Plan of the HEREIU Pension Fund. CEI makes a single contribution to the HEREIU Pension Fund, the Trustees of which allocate such contribution between the Legacy Plan and the Adjustable Plan. The contribution amount reflected to the Legacy Plan is the aggregate contribution made to the HEREIU Pension Fund before such allocation between the Legacy Plan and the Adjustable Plan of the HEREIU Pension Fund.
(g)Plan years begin July 1.
CAESARS ENTERTAINMENT, INC.
NOTES TO CONSOLIDATED FINANCIAL STATEMENTS (CONTINUED)
Note 17. Income Taxes
The components of the Company’s provision for income taxes for the years ended December 31, 2021, 20202023, 2022 and 20192021 are presented below.
| | Components of Income (Loss) Before Income Taxes | Components of Income (Loss) Before Income Taxes | Years Ended December 31, | Components of Income (Loss) Before Income Taxes | Years Ended December 31, |
| (In millions) | (In millions) | 2021 | | 2020 | | 2019 | (In millions) | 2023 | | 2022 | | 2021 |
| United States | United States | $ | (1,272) | | | $ | (1,608) | | | $ | 125 | |
| Outside of the U.S. | Outside of the U.S. | 3 | | | 2 | | | — | |
| $ | (1,269) | | | $ | (1,606) | | | $ | 125 | |
| $ | |
| | | | | | | | | | | | | | | | | |
| Income Tax Provision (Benefit) | Years Ended December 31, |
| (In millions) | 2021 | | 2020 | | 2019 |
| United States | | | | | |
| Current | | | | | |
| Federal | $ | (1) | | | $ | (43) | | | $ | 31 | |
| State & Local | (2) | | | (24) | | | 14 | |
| Deferred | | | | | |
| Federal | (219) | | | 208 | | | 5 | |
| State & Local | (106) | | | (11) | | | (6) | |
| Outside of the U.S. | | | | | |
| Current | 2 | | | 2 | | | — | |
| Deferred | 43 | | | — | | | — | |
| $ | (283) | | | $ | 132 | | | $ | 44 | |
| | | | | | | | | | | | | | | | | |
| Allocation of Income Tax Provision (Benefit) | Years Ended December 31, |
| (In millions) | 2021 | | 2020 | | 2019 |
| Income tax provision (benefit) applicable to: | | | | | |
| Income from operations | $ | (283) | | | $ | 132 | | | $ | 44 | |
| Discontinued operations | 19 | | | (9) | | | — | |
| Other comprehensive income | 3 | | | 8 | | | — | |
CAESARS ENTERTAINMENT, INC.
NOTES TO CONSOLIDATED FINANCIAL STATEMENTS (CONTINUED)
| | | | | | | | | | | | | | | | | |
| Income Tax Provision (Benefit) from Continuing Operations | Years Ended December 31, |
| (In millions) | 2023 | | 2022 | | 2021 |
| United States | | | | | |
| Current | | | | | |
| Federal | $ | — | | | $ | — | | | $ | (1) | |
| State & Local | 23 | | | 7 | | | (2) | |
| Deferred | | | | | |
| Federal | (754) | | | (57) | | | (219) | |
| State & Local | (166) | | | 2 | | | (106) | |
| Outside of the U.S. | | | | | |
| Current | 9 | | | 7 | | | 2 | |
| Deferred | — | | | — | | | 43 | |
| $ | (888) | | | $ | (41) | | | $ | (283) | |
The following is an allocation of the total income tax provision (benefit) for the years ended December 31, 2023, 2022 and 2021:
| | | | | | | | | | | | | | | | | |
| Years Ended December 31, |
| (In millions) | 2023 | | 2022 | | 2021 |
| Income tax provision (benefit) applicable to: | | | | | |
| Income from continuing operations | $ | (888) | | | $ | (41) | | | $ | (283) | |
| Discontinued operations | — | | | (50) | | | 19 | |
| Additional paid-in capital | (12) | | | — | | | — | |
| Other comprehensive income | 1 | | | (30) | | | 3 | |
The following is a reconciliation of the statutory federal income tax rateof 21% to the Company’s effectivereported income tax rateprovision (benefit) for the years ended December 31, 2021, 20202023, 2022 and 2019:2021:
| | | | | | | | | | | | | | | | | |
| Effective Income Tax Rate Reconciliation | Years Ended December 31, |
| 2021 | | 2020 | | 2019 |
| Federal statutory rate | 21.0 | % | | 21.0 | % | | 21.0 | % |
| State and local taxes | 4.2 | % | | 5.4 | % | | 5.5 | % |
| Stock compensation | 0.5 | % | | (0.1) | % | | 1.8 | % |
| Goodwill impairment and dispositions | — | % | | (1.6) | % | | 7.4 | % |
| Nondeductible transaction expenses | — | % | | (0.5) | % | | — | % |
| Nondeductible convertible notes costs | (3.3) | % | | (1.0) | % | | — | % |
| Decrease in uncertain tax positions | 0.4 | % | | 0.9 | % | | — | % |
| Change in tax rates from change in tax law | (1.2) | % | | — | % | | — | % |
| Deferred tax benefit of foreign subsidiaries held for sale | — | % | | 1.0 | % | | — | % |
| Valuation allowance | 2.6 | % | | (33.9) | % | | 1.8 | % |
| Deferred tax recognition on life insurance | (1.3) | % | | — | % | | — | % |
| Tax credits | 0.4 | % | | 0.1 | % | | (1.1) | % |
| Other | (1.0) | % | | 0.5 | % | | (1.2) | % |
| Effective income tax rate | 22.3 | % | | (8.2) | % | | 35.2 | % |
| | | | | | | | | | | | | | | | | |
| Years Ended December 31, |
| (In millions) | 2023 | | 2022 | | 2021 |
| Federal statutory income tax provision (benefit) | $ | (13) | | | $ | (118) | | | $ | (267) | |
| State and local income tax provision (benefit) | (13) | | | 1 | | | (54) | |
| Nondeductible compensation and benefits | 16 | | | 13 | | | 3 | |
| Goodwill impairment | 3 | | | 3 | | | — | |
| | | | | |
| Nondeductible convertible notes costs | — | | | — | | | 42 | |
| Decrease in uncertain tax positions | — | | | (1) | | | (6) | |
| Change in tax rates from change in tax law before valuation allowance | 25 | | | 86 | | | 15 | |
| Foreign taxes | 3 | | | 6 | | | 3 | |
| Deferred tax adjustment related to William Hill acquisition | — | | | 30 | | | — | |
| Minority interests | (9) | | | 3 | | | — | |
| Valuation allowance | (889) | | | (55) | | | (34) | |
| Tax credits | (14) | | | (10) | | | (5) | |
| Deferred tax recognition on life insurance | — | | | — | | | 17 | |
| Other | 3 | | | 1 | | | 3 | |
| Reported income tax provision (benefit) | $ | (888) | | | $ | (41) | | | $ | (283) | |
CAESARS ENTERTAINMENT, INC.
NOTES TO CONSOLIDATED FINANCIAL STATEMENTS (CONTINUED)
Deferred income taxes reflect the net tax effects of temporary differences between the carrying amounts of assets and liabilities for financial reporting purposes and the amounts used for income tax purposes. Significant components of the Company’s net deferred taxes at December 31, 20212023 and 20202022 are as follows:
| | As of December 31, |
| As of December 31, | | | As of December 31, |
| (In millions) | (In millions) | 2021 | | 2020 | (In millions) | 2023 | | 2022 |
| Deferred tax assets: | Deferred tax assets: | | | |
| Loss carryforwards | Loss carryforwards | $ | 1,006 | | | $ | 1,071 | |
| Foreign investment - held for sale | — | | | 74 | |
| Loss carryforwards | |
| Loss carryforwards | |
| Excess business interest expense | Excess business interest expense | 180 | | | 61 | |
| Credit carryforwards | Credit carryforwards | 114 | | | 106 | |
| Financing obligation | Financing obligation | 2,517 | | | 2,557 | |
| Long-term lease obligation | Long-term lease obligation | 161 | | | 187 | |
| Other | Other | 330 | | | 289 | |
| 4,308 | | | 4,345 | |
| 4,194 | |
| Deferred tax liabilities: | Deferred tax liabilities: | | | |
| Identified intangibles | Identified intangibles | (1,111) | | | (836) | |
| Other debt-related items | (35) | | | (108) | |
| Foreign investment - held for sale | (139) | | | — | |
| Identified intangibles | |
| Identified intangibles | |
| | Fixed assets | |
| Fixed assets | |
| Fixed assets | Fixed assets | (2,212) | | | (2,424) | |
| Right-of-use assets | Right-of-use assets | (131) | | | (154) | |
| Other | Other | (103) | | | (68) | |
| (3,731) | | | (3,590) | |
| (3,329) | |
| Valuation allowance | Valuation allowance | (1,840) | | | (1,921) | |
| Net deferred tax liabilities | Net deferred tax liabilities | $ | (1,263) | | | $ | (1,166) | |
The net deferred tax liabilities above are presented inManagement assesses the Balance Sheets as follows:
| | | | | | | | | | | |
| As of December 31, |
| (In millions) | 2021 | | 2020 |
| Deferred income taxes | $ | (1,111) | | | $ | (1,166) | |
| Assets held for sale | 7 | | | 1 | |
| Liabilities related to assets held for sale | (159) | | | (1) | |
| Net deferred tax liabilities | $ | (1,263) | | | $ | (1,166) | |
As a result of the Merger, the Company assumed $767 million of additional net deferred tax liabilities, net of valuation allowances, plus $24 million in additional accruals for uncertain tax positions including accrued interest. As a result of the William Hill Acquisition, the Company assumed $377 million of additional net deferred tax liabilities net of valuation allowances, plus $34 million in additional accruals for uncertain tax positions including accrued interest. Of the deferred tax liabilities and uncertain tax positions recorded due to the William Hill Acquisition, $132 million and $34 million, respectively, have been presented in Liabilities related to assets held for sale.
A valuation allowance is recognized if, based on the weight of available evidence, it is more-likely-than-not that some portion, or all, of the deferred tax asset will not be realized. Management must analyze all available positive and negative evidence regarding realizationto estimate if sufficient future taxable income will be generated to use existing deferred tax assets. During the second quarter of 2023, the Company evaluated its forecasted adjusted taxable income and objectively verifiable evidence and placed substantial weight on its 2022 and 2023 quarterly earnings, adjusted for non-recurring items, including the interest expense disallowed under current tax law. Accordingly, the Company determined it was more likely than not that a portion of the federal and state deferred tax assets will be realized and, as a result, during the second quarter of 2023, the Company reversed the valuation allowance related to these deferred tax assets and makerecorded an assessmentincome tax benefit of the likelihood of sufficient future taxable income. We have provided$940 million. The Company is still carrying a valuation allowance on certain federal state, and foreignstate deferred tax assets that wereare not deemed realizable based upon estimatesmore likely than not to be realized in the future. The Company has assessed the changes to the valuation allowance, including realization of future taxable income.the disallowed interest expense deferred tax asset, using the integrated approach.
As of December 31, 2021,2023, the Company had federal and state net operating loss carryforwards of $2.4 billion and $9.4 billion, respectively. The federal and state net operating loss carryforwards include $450$872 million and $2.2$9.0 billion, respectively, that do not expire. The remaining federal and state net operating loss carryforwards will begin to expire in 2032 and 2022, respectively. As of December 31, 2021, the Company had federal general business tax credit and research tax credit carryforwards of $116$145 million, which begin towill expire in 2029.on various dates as follows:
As of December 31, 2021, the Company had foreign net operating loss carryforwards of $60 million. The foreign net operating loss carryforwards include $58 million that do not expire. The remaining $2 million foreign net operating losses begin to expire in 2033.
CAESARS ENTERTAINMENT, INC.
NOTES TO CONSOLIDATED FINANCIAL STATEMENTS (CONTINUED)
| | | | | | | | | | | | | | | | | |
| Year of Expiration | Net Operating Losses | | Tax Credits |
| (In millions) | Federal | | States | | Federal |
| 2024-2028 | $ | — | | | $ | 604 | | | $ | 8 | |
| 2029-2033 | 238 | | | 1,590 | | | 39 | |
| 2034-2043 | 168 | | | 4,560 | | | 98 | |
| Do not expire | 466 | | | 2,279 | | | — | |
| $ | 872 | | | $ | 9,033 | | | $ | 145 | |
In general, Section 382 of the Internal Revenue Code provides an annual limitation with respect to the ability of a corporation to utilize its net operating loss carryovers, as well as certain built-in losses, against future taxable income in the event of a change in ownership. The Merger in July 2020 and the William Hill Acquisition in April 2021 resulted in a change in ownership for purposes of Section 382, making its provisions applicable to the Company. However, itIt is unlikely that the annual limitation on tax attribute usage resulting from the acquisition will adversely affect the Company’s ability to utilize its net operating loss carryovers against its future taxable income.
| | | | | | | | | | | | | | | | | |
| Reconciliation of Unrecognized Tax Benefits | Years Ended December 31, |
| (In millions) | 2021 | | 2020 | | 2019 |
| Balance as of beginning of year | $ | 137 | | | $ | — | | | $ | — | |
| Acquisition of Caesars Entertainment Corporation | — | | | 152 | | | — | |
| Acquisition of William Hill | 32 | | | — | | | — | |
| Additions based on tax positions related to the current year | 4 | | | — | | | — | |
| Additions for tax positions of prior years | 5 | | | 1 | | | — | |
| Reductions for tax positions for prior years | (8) | | | — | | | — | |
| Settlements | — | | | (4) | | | — | |
| Expiration of statutes | (13) | | | (12) | | | — | |
| Balance as of end of year | $ | 157 | | | $ | 137 | | | $ | — | |
CAESARS ENTERTAINMENT, INC.
NOTES TO CONSOLIDATED FINANCIAL STATEMENTS (CONTINUED)
| | | | | | | | | | | | | | | | | |
| Reconciliation of Unrecognized Tax Benefits | Years Ended December 31, |
| (In millions) | 2023 | | 2022 | | 2021 |
| Balance as of beginning of year | $ | 128 | | | $ | 157 | | | $ | 137 | |
| | | | | |
| Acquisition of William Hill | — | | | — | | | 32 | |
| Sale of William Hill International | — | | | (24) | | | — | |
| Additions based on tax positions related to the current year | — | | | 3 | | | 4 | |
| Additions for tax positions of prior years | 1 | | | 1 | | | 5 | |
| Reductions for tax positions for prior years | (5) | | | (8) | | | (8) | |
| | | | | |
| Expiration of statutes | — | | | (1) | | | (13) | |
| Balance as of end of year | $ | 124 | | | $ | 128 | | | $ | 157 | |
We classify reserves for tax uncertainties within Other long-term liabilities in our Balance Sheets, separate from any related income tax payable, deferred tax asset, or Deferred income taxes. Included in the $157 million of unrecognizeddeferred tax benefits as of the end of 2021 is $21 million related to discontinued operations.liability. Reserve amounts relate to any potential income tax liabilities resulting from uncertain tax positions as well as potential interest or penalties associated with those liabilities.
We accrue interest and penalties related to unrecognized tax benefits in income tax expense. During 2023, we decreased our unrecognized tax benefits by $4 million, primarily due to the noncash settlement of a state audit. During 2022, we decreased our unrecognized tax benefits by $29 million, primarily due to the sale of William Hill International. During 2021, we increased our accrualunrecognized tax benefits by $20 million, primarily due to the William Hill Acquisition. During 2020, we increased our accrual by $137 million, primarily as a result of the Merger. There was no accrual during 2019. There was an accrual for the payment of interest and penalties of $2 million and $2 million as of December 31, 20212023 and December 31, 2020, respectively.2022. Included in the balances of unrecognized tax benefits as of December 31, 20212023 and December 31, 20202022 was $117$112 million and $123$115 million, respectively, of unrecognized tax benefits that, if recognized, would impact the effective tax rate.
In 2021, the Organization for Economic Co-operation and Development (the “OECD”) established an Inclusive Framework on Base Erosion and Profit Shifting and agreed on a two-pillar solution (“Pillar Two”) to global taxation, focusing on global profit allocation and a 15% global minimum effective tax rate. The OECD issued Pillar Two model rules and continues to release guidance on these rules. While the US has not yet adopted the Pillar Two rules, various other countries around the world are enacting legislation. We will continue to analyze the law to determine potential impacts. We currently do not expect the Framework to have a material impact on our effective tax rate or our financial statements.
The Company, including its subsidiaries, files tax returns with federal, state and foreign jurisdictions. The Company does not have tax sharing agreements with the other members within the consolidated group. With few exceptions, the Company is no longer subject to US federal or state and local tax assessments by tax authorities for years before 2018. The tax years 2016 to 2021 remain subject to examination in Gibraltar and Malta. The tax years 2020 to 2021 remain subject to examination in the United Kingdom.2020. We believe that it is reasonably possible that the unrecognized tax benefits liability will not materially change within the next 12 months. Audit outcomes and the timing of audit settlements are subject to significant uncertainty. Although we believe that adequate provision has been made for such issues, there is the possibility that the ultimate resolution of such issues could have an adverse effect on our earnings. Conversely, if these issues are resolved favorably in the future, the related provision would be reduced, thus having a favorable impact on earnings.
Note 18. Related Parties
REI
As of December 31, 2021, Recreational Enterprises, Inc. (“REI”) owned approximately 4.0% of outstanding common stock of the Company. The directors of REI are the Company’s Executive Chairman of the Board, Gary L. Carano, its Chief Executive Officer and Board member, Thomas R. Reeg, and its former Senior Vice President of Regional Operations, Gene Carano. In addition, Gary L. Carano also serves as the Vice President of REI and Gene Carano also serves as the Secretary and Treasurer of REI. Members of the Carano family, including Gary L. Carano and Gene Carano, own the equity interests in REI. For each of the years ended December 31, 2021, 2020 and 2019, there were no related party transactions between the Company and the Carano family other than compensation, including salary and equity incentives and the CSY Lease listed below.Party Transactions
C. S. & Y. Associates
The Company owns the entire parcel on which Eldorado Resort Casino Reno is located, except for approximately 30,000 square feet which is leased from C. S. & Y. Associates (“CSY”) which is an entity partially owned by REI (the “CSY Lease”). CSY is a general partnership in which a trust has an approximate 27% interest. The Company’s Executive Chairman of the Board, Gary L. Carano, and his siblings are direct or indirect beneficiaries of the trust. The CSY Lease expires on June 30, 2057. Annual rent pursuant to the CSY Lease is currently $0.6 million, paid quarterly.monthly. Annual rent is subject to periodic rent escalations of 1 to 2 percent through the term of the lease. Commensurate with its interest, the trust receives directly from the Company approximately 27% of the rent paid by the Company. As of December 31, 20212023 and 20202022 there were no amounts due to or from CSY.
CVA Holdco, LLC
In May 2023, the Company entered into a joint venture, CVA Holdco, LLC, with EBCI and an additional minority partner, to construct, own and operate a gaming facility in Danville, Virginia (“Caesars Virginia”). Caesars Virginia opened in a temporary facility on May 15, 2023 which will be replaced by a permanent facility that is currently under construction and is estimated to open in late 2024. As the managing member, the Company will operate the business and manage the development, construction, financing, marketing, leasing, maintenance and day-to-day operation of the various phases of the project. While the Company holds a 49.5% variable interest in the joint venture, it is the primary beneficiary; as such, the joint venture’s operations are included in the Financial Statements, with a minority interest recorded reflecting the operations attributed to the other partners.
CAESARS ENTERTAINMENT, INC.
NOTES TO CONSOLIDATED FINANCIAL STATEMENTS (CONTINUED)
Transactions with Horseshoe Baltimore
The Company held an interestparticipates ratably, based on ownership percentage, with the partners in Horseshoe Baltimore of approximately 44.3%, which was accounted for as an equity method investment, prior to our acquisition of an additional interestthe profits and subsequent consolidation on August 26, 2021. These related party transactions included items such as casino management fees, reimbursement of various costs incurred on behalf of Horseshoe Baltimore, and the allocation of other general corporate expenses.
Transactions with NeoGames
The Company holds an interest in NeoGames (see Note 5). NeoGames provides the player account management system to our wholly-owned Liberty platform. We have a dedicated team of programmers at NeoGames working on enhancements to our player account management system on our behalf, for which NeoGames is compensated under a services agreement.
Due from/to Affiliates
Amounts due from or to affiliates for each counterparty represent the net receivable or payable aslosses of the end of the reporting period primarily resulting from the transactions described above and settled on a net basis by each counterparty in accordance with the legal and contractual restrictions governing transactions by and among the Company’s consolidated entities.joint venture. As of December 31, 2020, Due from affiliates, net was $442023, the Company has received $116 million in contributions for the project and represented transactions with Horseshoe BaltimoreEBCI and William Hill. Amounts due from/the other minority partners are obligated to William Hill and Horseshoe Baltimore eliminate upon consolidation. See Note 3.contribute additional cash totaling $8 million to the joint venture.
Note 19. Segment Information
The executive decision maker of the Company reviews operating results, assesses performance and makes decisions on a “significant market” basis. Management views each of the Company’s casinos as an operating segment. Operating segments are aggregated based on their similar economic characteristics, types of customers, types of services and products provided, and their management and reporting structure. Prior to the William Hill Acquisition, our principal operating activities occurred in 3 regionally-focused reportable segments: Las Vegas, Regional, and Managed, International, CIE, in addition to Corporate and Other. Following the William Hill Acquisition, theThe Company’s principal operating activities occur in 4four reportable segments. The reportable segments are based on the similar characteristics of the operating segments with the way management assesses these results and allocates resources, which is a consolidated view that adjusts for the effect of certain transactions between these reportable segments within Caesars: (1) Las Vegas, (2) Regional, (3) Caesars Digital, and (4) Managed and Branded, in addition to Corporate and Other. See table below for a summary of these segments. Also, see Note 4, Note 6 and Note 7 for a discussion of the impairment of intangibles and long-lived assets related to certain segments. The following table sets forth certain information regarding our properties (listed by segment in which each property is reported) as of December 31, 2021:
CAESARS ENTERTAINMENT, INC.
NOTES TO CONSOLIDATED FINANCIAL STATEMENTS (CONTINUED)
2023: | | | | | | | | | | | | | | | | | | | | |
| Las Vegas | | Regional | | Managed and Branded |
Bally’s Las Vegas | | Belle of Baton Rouge Casino & Hotel(a)
| | Horseshoe Bossier City | | Managed |
| Caesars Palace Las Vegas | | Caesars Atlantic City | | Harveys Lake Tahoe | | Horseshoe Council Bluffs | Harrah’s Ak-ChinManaged |
| The Cromwell | | Caesars Virginia (a) | | Circus Circus Reno | Horseshoe HammondBaltimore | | Harrah’s CherokeeAk-Chin |
| Flamingo Las Vegas | | Circus Circus Reno | | Horseshoe Black Hawk | | Harrah’s Cherokee |
| Harrah’s Las Vegas | | Eldorado Gaming Scioto Downs | | Horseshoe Bossier City | | Horseshoe Tunica | Harrah’s Cherokee Valley River |
Harrah’sHorseshoe Las Vegas | | Eldorado Resort Casino Reno | | Horseshoe Council Bluffs | | Indiana Grand | Harrah’s Resort Southern California |
| The LINQ Hotel & Casino | | Grand Victoria Casino | | Isle Casino BettendorfHorseshoe Hammond | | Caesars Windsor |
| Paris Las Vegas | | Harrah’s Atlantic City | | Horseshoe Indianapolis | | Isle of Capri Casino BoonvilleBranded | | Caesars Dubai |
| Planet Hollywood Resort & Casino | | Harrah’s Columbus Nebraska (b) | | Horseshoe Lake Charles | | Caesars Southern Indiana |
| | Harrah’s Council Bluffs | | Horseshoe St. Louis | | Isle of Capri Casino Hotel Lake Charles (c)
| Branded |
Rio All-Suite Hotel & Casino | | Harrah’s Gulf Coast | | Isle of Capri Casino Lula | | Caesars Southern Indiana (d)
|
| | Harrah’s Joliet | | Isle Casino Hotel - Blackhawk | | Harrah’s Northern California |
| Caesars Digital | | Harrah’s Lake TahoeGulf Coast | | Isle Casino Racing Pompano ParkHorseshoe Tunica | | |
| Caesars Digital | | Harrah’s Hoosier Park Racing & Casino | | Isle Casino Bettendorf | | |
| | Harrah’s Joliet | | Isle of Capri Casino Boonville | | |
| | Harrah’s Lake Tahoe | | Isle of Capri Casino Lula | | |
| | Harrah’s Laughlin | | Isle Casino Waterloo | | |
| | Harrah’s Metropolis | | Harrah’s Louisiana Downs (a)
| | Lady Luck Casino - Black Hawk | | |
| | Harrah’s Metropolis | | Lumière Place Casino | | |
| | Harrah’s New Orleans | | MontBleu Casino Resort & Spa (a)
| | |
| | Harrah’s North Kansas City | | Silver Legacy Resort Casino | | |
| | Harrah’s PhiladelphiaNorth Kansas City | | Trop Casino Greenville | | |
| | Harrah’s Philadelphia | | Harveys Lake Tahoe | | Tropicana Atlantic City | | |
| | Harrah’s Hoosier Park Racing & CasinoPompano Beach | | Tropicana Evansville (a)
| | |
| | Horseshoe Baltimore (c)
| | Tropicana Laughlin Hotel & Casino | | |
___________________
(a)During the year ended December 31, 2021, these properties were sold or held for sale. See Note 4 for additional details.
(b)On August 26, 2021, the Company increased its ownership interest in Horseshoe Baltimore to 75.8% and began to consolidate the property in our Regional segment following the change in ownership. Management fees prior to the consolidation of Horseshoe Baltimore have been reflected in the Managed and Branded segment.
(c)Lake Charles has been temporarily closed since the end of August 2020 due to damage from Hurricane Laura and will remain closed until the second half of 2022 whenTemporary gaming facility opened on May 15, 2023. The construction of a new land-based casinothe permanent facility of Caesars Virginia is expected to be complete.completed in late 2024.
(d)(b)Temporary gaming facility opened on June 12, 2023. The sale of Caesars Southern Indiana closed on September 3, 2021 and the Company entered into a license agreement with the Eastern Band of Cherokee Indians for the continued useconstruction of the Caesars brand and the Caesars Rewards loyalty program at Caesars Southern Indiana.
The properties listed above exclude the discontinued operations, including previous international properties which have been sold, or we have entered into agreements to sell. The salepermanent facility of Caesars UK Group closed on July 16, 2021, in which the buyer assumed all liabilities associated with the Caesars UK Group. Additionally, on September 8, 2021, the Company entered into an agreement to sell William Hill International, whichHarrah’s Columbus Nebraska is expected to closebe completed in the second quarter of 2022.2024.
Certain of our properties operate off-track betting locations, including Harrah’s Hoosier Park Racing & Casino, which operates Winner’s Circle Indianapolis and Winner’s Circle New Haven; and Indiana Grand,Horseshoe Indianapolis, which operates Winner’s Circle Clarksville. The LINQ Promenade listed above in our Las Vegas segment, is an open-air dining, entertainment, and retail promenade located on the east side of the Las Vegas Strip next to The LINQ Hotel & Casino (the “LINQ”) that features the High Roller, a 550-foot observation wheel, and the Fly LINQ Zipline attraction. We also own the CAESARS FORUM conference center, which is a 550,000 square feet conference center with 300,000 square feet of flexible meeting space, 2two of the largest pillarless ballrooms in the world and direct access to the LINQ. Caesars will also open its first non-gaming hotel experience in the first half of 2024 with the opening of Caesars Republic Scottsdale featuring more than 250 hotel rooms, approximately 20,000 square feet of event space and hotel amenities including, pools, bars, lounges, and celebrity partnered restaurants.
CAESARS ENTERTAINMENT, INC.
NOTES TO CONSOLIDATED FINANCIAL STATEMENTS (CONTINUED)
“Corporate and Other” includes certain unallocated corporate overhead costs and other adjustments, including eliminations of transactions among segments, to reconcile to the Company’s consolidated results.
CAESARS ENTERTAINMENT, INC.
NOTES TO CONSOLIDATED FINANCIAL STATEMENTS (CONTINUED)
The following table sets forth, for the periods indicated, certain operating data for the Company’s 4four reportable segments, in addition to Corporate and Other. We recast previously reported segment amounts to conform to the way management assesses results and allocates resources for the current year.
| | Years Ended December 31, |
| Years Ended December 31, | | | Years Ended December 31, |
| (In millions) | (In millions) | 2021 | | 2020 | | 2019 | (In millions) | 2023 | | 2022 | | 2021 |
| Las Vegas: | Las Vegas: | | | | | |
| Net revenues | |
| Net revenues | |
| Net revenues | Net revenues | $ | 3,409 | | | $ | 751 | | | $ | — | |
| Adjusted EBITDA | Adjusted EBITDA | 1,568 | | | 133 | | | — | |
| Regional: | Regional: | |
| Net revenues | Net revenues | 5,537 | | | 2,660 | | | 2,494 | |
| Net revenues | |
| Net revenues | |
| Adjusted EBITDA | Adjusted EBITDA | 1,979 | | | 711 | | | 719 | |
| Caesars Digital: | Caesars Digital: | |
| Net revenues | |
| Net revenues | |
| Net revenues | Net revenues | 337 | | | 95 | | | 26 | |
| Adjusted EBITDA | Adjusted EBITDA | (476) | | | 26 | | | 13 | |
| Managed and Branded: | Managed and Branded: | |
| Net revenues | Net revenues | 278 | | | 107 | | | — | |
| Net revenues | |
| Net revenues | |
| Adjusted EBITDA | Adjusted EBITDA | 87 | | | 25 | | | — | |
| Corporate and Other: | Corporate and Other: | |
| Net revenues | Net revenues | 9 | | | 15 | | | 8 | |
| Net revenues | |
| Net revenues | |
| Adjusted EBITDA | Adjusted EBITDA | (168) | | | (101) | | | (35) | |
Reconciliation of Adjusted EBITDA - By Segment to Net Income (Loss) Attributable to Caesars to Adjusted EBITDA by Segment
Adjusted EBITDA is presented as a measure of the Company’s performance. Adjusted EBITDA is defined as revenues less certain operating expenses and is comprised of net income (loss) before (i) interest income and interest expense, net of interest capitalized, and interest income, (ii) income tax (benefit) provision, (iii) depreciation and amortization, and (iv) certain items that we do not consider indicative of our ongoing operating performance at an operating property level.
In evaluating Adjusted EBITDA you should be aware that, in the future, we may incur expenses that are the same or similar to some of the adjustments in this presentation. The presentation of Adjusted EBITDA should not be construed as an inference that future results will be unaffected by unusual or unexpected items.
Adjusted EBITDA is a financial measure commonly used in our industry and should not be construed as an alternative to net income (loss) as an indicator of operating performance or as an alternative to cash flow provided by operating activities as a measure of liquidity (as determined in accordance with GAAP). Adjusted EBITDA may not be comparable to similarly titled measures reported by other companies within the industry. Adjusted EBITDA is included because management uses Adjusted EBITDA to measure performance and allocate resources, and believes that Adjusted EBITDA provides investors with additional information consistent with that used by management.
CAESARS ENTERTAINMENT, INC.
NOTES TO CONSOLIDATED FINANCIAL STATEMENTS (CONTINUED)
| | Years Ended December 31, | | | Years Ended December 31, |
| (In millions) | | (In millions) | 2023 | | 2022 | | 2021 |
| Net income (loss) attributable to Caesars | |
| Net income (loss) attributable to noncontrolling interests | |
| Net loss from discontinued operations | |
| Benefit for income taxes | |
Other (income) loss (a) | |
| Loss on extinguishment of debt | |
| Interest expense, net | |
| Depreciation and amortization | |
| Impairment charges | |
Transaction costs and other (b) | |
| Stock-based compensation expense | |
| Adjusted EBITDA | |
| | Years Ended December 31, |
| (In millions) | 2021 | | 2020 | | 2019 |
| Adjusted EBITDA by Segment: | Adjusted EBITDA by Segment: | | | | | |
| Adjusted EBITDA by Segment: | |
| Adjusted EBITDA by Segment: | |
| Las Vegas | |
| Las Vegas | |
| Las Vegas | Las Vegas | $ | 1,568 | | | $ | 133 | | | $ | — | |
| Regional | Regional | 1,979 | | | 711 | | | 719 | |
| Caesars Digital | Caesars Digital | (476) | | | 26 | | | 13 | |
| Managed and Branded | Managed and Branded | 87 | | | 25 | | | — | |
| Corporate and Other | Corporate and Other | (168) | | | (101) | | | (35) | |
| 2,990 | | | 794 | | | 697 | |
| Reconciliation to net income (loss) attributable to Caesars: | | | | | |
| Net (income) loss attributable to noncontrolling interests | (3) | | | 1 | | | — | |
| Net loss from discontinued operations | (30) | | | (20) | | | — | |
| Benefit (provision) for income taxes | 283 | | | (132) | | | (44) | |
Other income (loss) (a) | (198) | | | 176 | | | 9 | |
| Loss on extinguishment of debt | (236) | | | (197) | | | (8) | |
| Interest expense, net | (2,295) | | | (1,202) | | | (286) | |
| Depreciation and amortization | (1,126) | | | (583) | | | (222) | |
| Impairment charges | (102) | | | (215) | | | (1) | |
Transaction costs and other operating costs (b) | (144) | | | (270) | | | (37) | |
| Stock-based compensation expense | (82) | | | (79) | | | (20) | |
Other items (c) | (76) | | | (30) | | | (7) | |
| Net income (loss) attributable to Caesars | $ | (1,019) | | | $ | (1,757) | | | $ | 81 | |
____________________
(a)Other income (loss) for(income) loss primarily includes the year ended December 31, 2021 primarily represents a loss on the changenet changes in fair value of (i) investments held by the Company (ii) foreign exchange forward contracts (iii) a disputed claims liability, and a loss on the change in fair value of(iv) the derivative liability related to the 5% Convertible Notes.convertible notes, which were fully converted during the year ended December 31, 2021, and the change in the foreign exchange rate associated with restricted cash held in GBP associated with our acquisition of William Hill.
(b)Transaction costs and other operating costsprimarily includes (i) net proceeds received in exchange for participation rights in a potential insurance recovery, (ii) proceeds received for the year ended December 31, 2021 primarily representtermination of the Caesars Dubai management agreement, (iii) insurance proceeds received in excess of the respective carrying value of damaged assets associated with the Lake Charles property, (iv) costs related to non-cash losses on the William Hill Acquisitionwrite down and the Merger,disposal of assets, professional services for transaction and integration costs, various contract exit or license termination exit costs, professional services, other acquisition costs, and severance costs.pre-opening costs in connection with new temporary facility openings and (v) non-cash changes in equity method investments.
(c)Other items primarily represent certain consulting and legal fees, rent for non-operating assets, relocation expenses, retention bonuses, and business optimization expenses. | | | | | | | | | | | | | | | | | |
| Capital Expenditures, Net - By Segment | | | | | |
| Years Ended December 31, |
| (In millions) | 2023 | | 2022 | | 2021 |
| Las Vegas | $ | 257 | | | $ | 165 | | | $ | 85 | |
| Regional | 839 | | | 597 | | | 327 | |
| Caesars Digital | 100 | | | 106 | | | 67 | |
| | | | | |
| Corporate and Other | 68 | | | 84 | | | 39 | |
Total (a) | $ | 1,264 | | | $ | 952 | | | $ | 518 | |
| | | | | | | | | | | | | | | | | |
| Capital Expenditures, Net - By Segment | | | | | |
| Years Ended December 31, |
| (In millions) | 2021 | | 2020 | | 2019 |
| Las Vegas | $ | 85 | | | $ | 32 | | | $ | — | |
Regional (a) | 327 | | | 104 | | | 166 | |
| Caesars Digital | 67 | | | — | | | — | |
| Managed and Branded | — | | | — | | | — | |
| Corporate and Other | 39 | | | 33 | | | 5 | |
| Total | $ | 518 | | | $ | 169 | | | $ | 171 | |
_______________________________________
(a)Includes $2 million and $5 million of capital expenditures related to properties classified asassociated with our discontinued operations, forwhere applicable.
| | | | | | | | | | | |
| Total Assets - By Segment | | | |
| December 31, |
| (In millions) | 2023 | | 2022 |
| Las Vegas | $ | 24,230 | | | $ | 23,547 | |
| Regional | 15,291 | | | 14,908 | |
| Caesars Digital | 1,095 | | | 1,200 | |
Managed and Branded | 224 | | | 140 | |
Corporate and Other (a) | (7,474) | | | (6,268) | |
| Total | $ | 33,366 | | | $ | 33,527 | |
____________________
(a)Includes eliminations of transactions among segments, to reconcile to the years ended December 31, 2021 and 2020, respectively.Company’s consolidated results.
| | | | | | | | | | | |
| Total Assets - By Segment | | | |
| December 31, |
| (In millions) | 2021 | | 2020 |
| Las Vegas | $ | 22,374 | | | $ | 21,464 | |
| Regional | 14,419 | | | 13,732 | |
| Caesars Digital | 1,878 | | | 323 | |
| Managed and Branded | 3,527 | | | 225 | |
| Corporate and Other | (4,167) | | | 641 | |
| Total | $ | 38,031 | | | $ | 36,385 | |
Item 9. Changes in and Disagreements with Accountants on Accounting and Financial Disclosure
None.
Item 9A. Controls and Procedures
Evaluation of Disclosure Controls and Procedures
We have established and maintain disclosure controls and procedures that are designed to ensure that information required to be disclosed in our reports that we file under the Securities Exchange Act of 1934, as amended (the “Exchange Act”), is recorded, processed, summarized, evaluated and reported within the time periods specified in the rules and forms of the SEC, and that such information is accumulated and communicated to management, including our Chief Executive Officer and Chief Financial Officer, as appropriate to allow timely decisions regarding required disclosure.
In designing and evaluating the disclosure controls and procedures, management recognizes that any controls and procedures, no matter how well designed and operated, can provide only reasonable assurance of achieving the desired control objectives, and management necessarily is required to apply its judgment in evaluating the cost-benefit relationship of possible controls and procedures.
We carried out an evaluation, under the supervision andManagement, with the participation of our Chief Executive Officer (principal executive officer) and Chief Financial Officer, (principal financial officer), ofevaluated the effectiveness of our disclosure controls and procedures (as defined under the Exchange Actin Rules 13a-15(e) and 15d-15(e)) promulgated under the Exchange Act) as of the end of the period covered by this Form 10-K Annual Report.December 31, 2023. Based on this evaluation,these evaluations, our Chief Executive Officer and Chief Financial Officer have concluded that our disclosure controls and procedures required by Rules 13a-15(e) and 15d-15(e) were effective as of the end of the period covered by this Form 10-K Annual Report are effective to ensure that the information required to be disclosed by us in the reports that we file under the Exchange Act is recorded, processed, summarized, evaluated and reported within the time periods specified in SEC rules and forms and that such information is accumulated and communicated to management, including our Chief Executive Officer and Chief Financial Officer, to allow timely decisions regarding required disclosure.December 31, 2023, at a reasonable assurance level.
Management’s Annual Report on Internal Control over Financial Reporting
Management of the Company is responsible for establishing and maintaining adequate internal control over financial reporting (asas defined in Rules 13a-15(e)13a-15(f) or 15d-15(e)15d-15(f) promulgated under the Exchange Act) for Caesars Entertainment, Inc. and its subsidiaries.Act. This system is designed to provide reasonable assurance to the Company’s management regarding the reliability of financial reporting and the preparation of consolidated financial statements for external purposes.
The Company completed its acquisition of William Hill PLC on April 22, 2021. Accordingly, the acquired assets and liabilities of William Hill are includedpurposes in our consolidated balance sheet as of December 31, 2021 and the results of its operations and cash flows are reported in our consolidated statement of operations and cash flows for the year ended December 31, 2021 from the date of acquisition. At the time that the William Hill Acquisition was consummated, the Company’s intent was to divest William Hill International. Accordingly, the assets and liabilities of William Hill International are classified as held for sale with operations presented within discontinued operations. We are in the process of integrating policies, processes, information technology systems and other components of internal controls over financial reporting of the combined business. Management will continue to evaluate our internal control over financial reporting as we complete our integration. In accordance with SEC staff guidance permitting a company to exclude an acquired business from management’s assessment of the effectiveness of internal control over financial reporting for the year in which the acquisition is completed, management has excluded William Hill from its internal control assessment. William Hill represents 14% of Caesars Entertainment, Inc.’s consolidated assets as of December 31, 2021, and 2% of Caesars Entertainment, Inc.’s net revenue for the year ended December 31, 2021.US GAAP.
Management, with the participation of our Chief Executive Officer and Chief Financial Officer, evaluated and assessed the effectiveness of our internal control over financial reporting as of the end of the period covered by this Form 10-K Annual Report based upon the framework set forth in the Internal Control-Integrated Framework issued in 2013 by the Committee of Sponsoring Organization of the Treadway Commission. Based on thistheir evaluation and assessment, management believesthey concluded that, as of December 31, 2021,2023, our internal control over financial reporting was effective based on those criteria.
Deloitte & Touche LLP, an independent registered public accounting firm, has auditedissued an attestation report on our internal control over financial reporting as of December 31, 2021, as stated in its2023, which report which follows below.
Changes in Internal Control Over Financial Reporting
Except as noted below, during the quarter endedAs of December 31, 2021,2023, there were no significant changes in our internal control over financial reporting that have materially affected, or are reasonably likely to materially affect, our internal control over financial reporting.
On April 22, 2021, we completed the acquisition of William Hill PLC. See Item 8., “Notes to Consolidated Financial Statements”, Note 3, “Acquisitions, Purchase Price Accounting and Pro forma Information” for discussion of the acquisition and related financial data. The Company is in the process of integrating William Hill PLC into our internal controls over financial reporting. As a result of these integration activities, certain controls will be evaluated and may be changed.
Excluding the William Hill Acquisition, there were no changes in our internal controls over financial reporting that have materially affected, or are reasonable likely to materially affect, our internal controls over financial reporting.
Report of Independent Registered Public Accounting FirmREPORT OF INDEPENDENT REGISTERED PUBLIC ACCOUNTING FIRM
To the stockholders and the Board of Directors of Caesars Entertainment, Inc.:
Opinion on Internal Control over Financial Reporting
We have audited the internal control over financial reporting of Caesars Entertainment, Inc., and subsidiaries (the “Company”) as of December 31, 2021,2023, based on criteria established in Internal Control — Integrated Framework (2013) issued by the Committee of Sponsoring Organizations of the Treadway Commission (“COSO”). In our opinion, the Company maintained, in all material respects, effective internal control over financial reporting as of December 31, 2021,2023, based on criteria established in Internal Control — Integrated Framework (2013) issued by COSO.
We have also audited, in accordance with the standards of the Public Company Accounting Oversight Board (United States) (“PCAOB”), the consolidated financial statements as of and for the year ended December 31, 2021,2023, of the Company and our report dated February 23, 2022,20, 2024, expressed an unqualified opinion on those financial statements.
As described in Management’s Annual Report on Internal Control over Financial Reporting, management excluded from its assessment the internal control over financial reporting at William Hill PLC, which was acquired on April 22, 2021, and whose financial statements constitute 14% of the Company’s consolidated assets as of December 31, 2021, and 2% of the Company’s net revenues for the year ended December 31, 2021. Accordingly, our audit did not include the internal control over financial reporting at William Hill PLC.
Basis for Opinion
The Company’s management is responsible for maintaining effective internal control over financial reporting and for its assessment of the effectiveness of internal control over financial reporting, included in the accompanying Management’s Annual Report on Internal Control over Financial Reporting. Our responsibility is to express an opinion on the Company’s internal control over financial reporting based on our audit. We are a public accounting firm registered with the PCAOB and are required to be independent with respect to the Company in accordance with the U.S. federal securities laws and the applicable rules and regulations of the Securities and Exchange Commission and the PCAOB.
We conducted our audit in accordance with the standards of the PCAOB. Those standards require that we plan and perform the audit to obtain reasonable assurance about whether effective internal control over financial reporting was maintained in all material respects. Our audit included obtaining an understanding of internal control over financial reporting, assessing the risk that a material weakness exists, testing and evaluating the design and operating effectiveness of internal control based on the assessed risk, and performing such other procedures as we considered necessary in the circumstances. We believe that our audit provides a reasonable basis for our opinion.
Definition and Limitations of Internal Control over Financial Reporting
A company’s internal control over financial reporting is a process designed to provide reasonable assurance regarding the reliability of financial reporting and the preparation of financial statements for external purposes in accordance with generally accepted accounting principles. A company’s internal control over financial reporting includes those policies and procedures that (1) pertain to the maintenance of records that, in reasonable detail, accurately and fairly reflect the transactions and dispositions of the assets of the company; (2) provide reasonable assurance that transactions are recorded as necessary to permit preparation of financial statements in accordance with generally accepted accounting principles, and that receipts and expenditures of the company are being made only in accordance with authorizations of management and directors of the company; and (3) provide reasonable assurance regarding prevention or timely detection of unauthorized acquisition, use, or disposition of the company’s assets that could have a material effect on the financial statements.
Because of its inherent limitations, internal control over financial reporting may not prevent or detect misstatements. Also, projections of any evaluation of effectiveness to future periods are subject to the risk that controls may become inadequate because of changes in conditions, or that the degree of compliance with the policies or procedures may deteriorate.
/s/ DELOITTE & TOUCHE LLP
Las Vegas, Nevada
February 23, 202220, 2024
Item 9B. Other Information
Not applicable.Rule 10b5-1 Trading Plans
For the three months ended December 31, 2023, none of our directors or officers (as defined in Rule 16a-1(f) of the Exchange Act) adopted, modified or terminated a “Rule 10b5-1 trading arrangement” or “non-Rule 10b5-1 trading arrangement,” as defined in Item 408 of Regulation S-K.
Item 9C. Disclosure Regarding Foreign Jurisdictions that Prevent Inspections
Not applicable.
PART III
Item 10. Directors, Executive Officers and Corporate Governance
The information required by this Item is hereby incorporated by reference to our definitive Proxy Statement for our Annual Meeting of Stockholders (our “Proxy Statement”) to be filed with the Securities and Exchange Commission no later than April 30, 2022,29, 2024, pursuant to Regulation 14A under the Securities Act.
We have adopted a code of ethics and business conduct applicable to all directors and employees, including the Chief Executive Officer, Chief Financial Officer and Principal Accounting Officer. The code of business conduct and ethics is posted on our website, http://www.caesars.com/corporate (accessible through the “Governance” caption of the Investors page) and a printed copy will be delivered on request by writing to the Corporate Secretary at Caesars Entertainment, Inc., c/o Corporate Secretary, 100 West Liberty Street, 12th Floor, Reno, NV 89501. We intend to satisfy the disclosure requirement regarding certain amendments to, or waivers from, provisions of its code of business conduct and ethics by posting such information on our website.
Item 11. Executive Compensation
The information required by this Item is hereby incorporated by reference to our Proxy Statement, to be filed with the Securities and Exchange Commission no later than April 30, 2022,29, 2024, pursuant to Regulation 14A under the Securities Act.
Item 12. Security Ownership of Certain Beneficial Owners and Management and Related Stockholder Matters
The information required by this Item is hereby incorporated by reference to our Proxy Statement, to be filed with the Securities and Exchange Commission no later than April 30, 2022,29, 2024, pursuant to Regulation 14A under the Securities Act.
Item 13. Certain Relationships and Related Transactions, and Director Independence
The information required by this Item is hereby incorporated by reference to our Proxy Statement, to be filed with the Securities and Exchange Commission no later than April 30, 2022,29, 2024, pursuant to Regulation 14A under the Securities Act.
Item 14. Principal Accounting Fees and Services
The information about aggregate fees billed to us by our principal accountant, Deloitte & Touche LLP (PCAOB ID No. 34) is incorporated herein by reference to our Proxy Statement, to be filed with the Securities and Exchange Commission no later than April 30, 2022,29, 2024, pursuant to Regulation 14A under the Securities Act.
PART IV
Item 15. Exhibits and Financial Statement Schedules
| | |
| (a)(i) Financial Statements |
| Included in Part II (Item 8) of this Annual Report on Form 10-K: |
|
|
|
|
|
|
|
| (a)(ii) Financial Statement Schedule |
|
|
| We have omitted schedules other than the ones listed above because they are not required or are not applicable, or the required information is shown in the financial statements or notes to the financial statements. |
| (a)(iii) Exhibits |
| | | | | | | | | | | | | | |
Exhibit Number | | Description of Exhibit | | Method of Filing |
| | | | |
| 2.1 | | | | Previously filed on Form 8-K filed on June 25, 2019. |
| | | | |
| 2.2 | | | | Previously filed on Form 8-K filed on August 16, 2019. |
| | | | |
| 3.1 | | | | Previously filed on Form 10-Q filed on August 4, 2021. |
| | | | |
3.2 | | | | Previously filed on Form 8-K filed on July 21, 2020.June 16, 2023. |
| | | | |
| 3.2 | | | | Previously filed on Form 8-K filed on August 1, 2022. |
| | | | |
| 4.1 | | | | Filed herewith. |
| | | | |
4.24.2†† | | | | Previously filed on Form 8-K filed on July 7, 2020. |
| | | | |
4.34.3†† | | First Supplemental Indenture, dated as of July 20, 2020, to Indenture (6.25% CEI Senior Secured Notes due 2025), dated as of July 6, 2020, by and among Colt Merger Sub, Inc., Eldorado Resorts, Inc., the subsidiary guarantors party thereto and U.S. Bank National Association.Association, as trustee and collateral agent. | | Previously filed on Form 8-K filed on July 21, 2020. |
| | | | |
| 4.4†† | | | | | Previously filed on Form 10-K filed on February 22, 2023. |
| | | | |
| 4.5†† | | 4.4Third Supplemental Indenture, dated as of November 3, 2023, to Indenture (6.250% CEI Senior Secured Notes due 2025), dated as of July 6, 2020, by and among Caesars Entertainment, Inc., the subsidiary guarantors party thereto and U.S. Bank Trust Company, National Association, as trustee, and U.S. Bank National Association, as collateral agent. | | Previously filed on Form 8-K filed on February 7, 2024. |
| | | | |
| 4.6 | | | | Previously filed on Form 8-K filed on July 7, 2020. |
| | | | |
4.54.7 | | First Supplemental Indenture, dated as of July 20, 2020, to Indenture (8.125% CEI Senior Notes due 2027), dated as of July 6, 2020, by and among Colt Merger Sub, Inc., Eldorado Resorts, Inc., the subsidiary guarantors party thereto and U.S. Bank National Association.Association, as trustee. | | Previously filed on Form 8-K filed on July 21, 2020. |
| | | | |
| 4.8 | | | | | Previously filed on Form 10-K filed on February 22, 2023. |
| | | | |
| 4.9 | | | | Filed herewith. |
| | | | |
| 4.10††† | | | | Previously filed on Form 8-K filed on July 7, 2020. |
| | | | |
4.74.11††† | | First Supplemental Indenture, dated as of July 20, 2020, to Indenture (5.75% CRC Secured Notes due 2025), dated as of July 6, 2020, by and among Colt Merger Sub, Inc., CRC Finco, Inc., Caesars Resort Collection, LLC, the subsidiary guarantors party thereto, U.S. Bank National Association, as trustee, and Credit Suisse AG, Cayman Islands Branch.Branch, as collateral agent. | | Previously filed on Form 8-K filed on July 21, 2020. |
| | | | |
4.84.12††† | | Second Supplemental Indenture, dated as of August 6, 2021, to Indenture (5.75% CRC Secured Notes due 2025), dated as of July 6, 2020, by and among Caesars Entertainment, Inc., CRC Finco, Inc.,Caesars Resort Collection, LLC the subsidiary guarantors party thereto,and U.S. Bank National Association, as trustee and Credit Suisse AG, Cayman Islands Branch.collateral agent. | | Previously filed on Form 8-K filed on August 10, 2021. |
| | | | |
4.94.13 | | | | Previously filed on Form 8-K filed on September 27, 2021. |
| | | | |
| 4.14 | | | | Previously filed on Form 8-K filed on October 5, 2022. |
| | | | |
| 4.15 | | | | Filed herewith. |
| | | | |
| | | | | | | | | | | | | | |
Exhibit Number | | Description of Exhibit | | Method of Filing |
| 4.16 | | Indenture (7.00% Senior Secured Notes due 2030), dated as of February 6, 2023, by and among Caesars Entertainment, Inc., the subsidiary guarantors party thereto, U.S. Bank Trust Company, National Association, as trustee, and U.S. Bank National Association, as collateral agent. | | Previously filed on Form 8-K filed on February 6, 2023. |
| | | | |
| 4.17 | | First Supplemental Indenture (7.00% CEI Senior Secured Notes due 2030), dated as of March 24, 2023, to Indenture, dated as of February 6, 2023, by and among Caesars Entertainment, Inc., the subsidiary guarantors party thereto, U.S. Bank Trust Company, National Association, as Trustee, and U.S. Bank National Association, as Collateral Agent. | | Previously filed on Form 10-Q filed on May 3, 2023. |
| | | | |
| 4.18 | | Second Supplemental Indenture (7.00% CEI Senior Secured Notes due 2030), dated as of November 3, 2023, to Indenture, dated as of February 6, 2023, by and among Caesars Entertainment, Inc., the subsidiary guarantors party thereto, U.S. Bank Trust Company, National Association, as Trustee, and U.S. Bank National Association, as Collateral Agent. | | Filed herewith. |
| | | | |
| 4.19 | | Indenture (6.50% CEI Senior Secured Notes due 2032), dated as of February 6, 2024, by and among Caesars Entertainment, Inc., the subsidiary guarantors party thereto, U.S. Bank Trust Company, National Association, as Trustee, and U.S. Bank National Association, as Collateral Agent. | | Previously filed on Form 8-K filed on February 7, 2024. |
| | | | |
| 10.1 | | Second Amendment to Lease (CPLV) (which includes a conformed copy of the Las Vegas Lease (conformed through the Second Amendment), dated as of July 20, 2020, by and among CPLV Property Owner LLC, Claudine Propco LLC, Propco TRS LLC, Desert Palace LLC, CEOC, LLC and CEOC, LLC.Harrah’s Las Vegas, LLC | | Previously filed on Form 8-K filed on July 21, 20202020. |
| | | | |
| 10.2 | | Third Amendment to Lease, (Las Vegas), dated as of September 30, 2020, by and among CPLV Property Owner LLC, Claudine Propco LLC, Propco TRS LLC, Desert Palace LLC, CEOC, LLC and CEOC,Harrah’s Las Vegas, LLC. | | Previously filed on Form 10-Q filed on November 9, 2020. |
| | | | |
| 10.3 | | Fourth Amendment to Lease, (Las Vegas), dated as of November 18, 2020, by and among CPLV Property Owner LLC, Claudine Propco LLC, Propco TRS LLC, Desert Palace LLC, CEOC, LLC and CEOC,Harrah’s Las Vegas, LLC. | | Previously filed on Form 10-K on March 1, 2021. |
| | | | |
| 10.4 | | Fifth Amendment to Lease, (Las Vegas) dated as of September 3, 2021, by and among CPLV Property Owner LLC, Claudine Propco LLC, Propco TRS LLC, Desert Palace LLC, CEOC, LLC and CEOC,Harrah’s Las Vegas, LLC. | | Previously filed on Form 10-Q on November 5, 2021. |
| | | | |
| 10.5 | | | | Filed herewith.Previously filed on Form 10-K filed on February 24, 2022. |
| | | | |
| 10.6 | | | | Previously filed on Form 8-K filed on July 21, 2020. |
| | | | |
| 10.7** | | Fifth Amendment to Lease (Non-CPLV) (which includes a conformed copy of the Regional Lease (conformed through the Fifth Amendment), dated as of July 20, 2020, by and among the entities listed on SchedulesSchedule A attached thereto, Harrah’s Atlantic City LLC, New Laughlin Owner LLC, Harrah’s New Orleans LLC, the entities listed on Schedule B attached thereto, Harrah’s Atlantic City Operating Company, LLC, Harrah’s Laughlin, LLC, Jazz Casino Company, L.L.C. and B thereto and Propco TRS LLC.LLC. | | Previously filed on Form 8-K filed on July 21, 2020. |
| | | | |
| 10.8** | | | | Previously filed on Form 10-Q filed on November 9, 2020. |
| | | | |
| 10.9 | | | | Previously filed on Form 10-K on March 1, 2021. |
| | | | |
| 10.10 | | | | Previously filed on Form 10-Q on November 5, 2021. |
| | | | |
| 10.11 | | | | Filed herewithPreviously filed on Form 10-K filed on February 24, 2022. |
| | | | |
| | | | | | | | | | | | | | |
Exhibit
Number
| | Description of Exhibit | | Method of Filing |
| 10.12 | | | | Filed herewithPreviously filed on Form 10-K filed on February 24, 2022. |
| | | | |
| 10.13 | | | | Previously filed on Form 10-Q filed on November 2, 2022. |
| | | | |
| | | | | | | | | | | | | | |
Exhibit Number | | Description of Exhibit | | Method of Filing |
| 10.14 | | | | Previously filed on Form 10-Q filed on May 3, 2023. |
| | | | |
| 10.15 | | | | Previously filed on Form 8-K filed on July 21, 2020. |
| | | | |
10.14*10.16** | | | | Previously filed on Form 8-K filed on July 21, 2020. |
| | | | |
10.15*10.17** | | Third Amendment to Lease, (Joliet), dated as of September 30, 2020, to Lease (Joliet), dated as of October 7, 2017, by and betweenamong Harrah’s Joliet Landco LLC, and Des Plaines Development Limited Partnership.Partnership, CEOC, LLC and Propco TRS LLC. | | Previously filed on Form 10-Q filed on November 9, 2020. |
| | | | |
10.1610.18 | | Fourth Amendment to Lease, (Joliet), dated as of November 18, 2020, to Lease (Joliet), dated as of October 7, 2017, by and betweenamong Harrah’s Joliet Landco LLC, and Des Plaines Development Limited Partnership.Partnership, CEOC, LLC and Propco TRS LLC. | | Previously filed on Form10-K on March 1, 2021. |
| | | | |
10.1710.19 | | | | Previously filed on Form 10-Q on November 5, 2021 |
| | | | |
10.1810.20 | | | | Filed herewith.Previously filed on Form 10-K filed on February 24, 2022. |
| | | | |
10.1910.21 | | | | Previously filed on Form 8-K filed on July 21, 2020. |
| | | | |
10.20*10.22* | | | | Previously filed on Form 8-K filed on July 21, 2020. |
| | | | |
10.2110.23 | | | | Previously filed on Form 8-K filed on July 21, 2020. |
| | | | |
10.2210.24 | | Second Amendment dated as of July 20, 2020, to Golf Course Use Agreement, dated as of October 6, 2017,July 20, 2020, by and among Rio Secco LLC, Cascata LLC, Chariot Run LLC, Grand Bear LLC, Caesars Enterprise Services, LLC, CEOC, LLC and, solely for purposes of Section 2.1(c) thereof, Caesars License Company, LLC. | | Previously filed on Form 8-K filed on July 21, 2020. |
| | | | |
10.23*10.25* | | | | Previously filed on Form 8-K filed on July 21, 2020. |
| | | | |
10.24*10.26* | | | | Previously filed on Form 8-K filed on September 18, 2020. |
| | | | |
10.25*10.27* | | | | Previously filed on Form 8-K filed on July 21, 2020. |
| | | | |
10.2610.28 | | First Amendment to Third Amended and Restated Omnibus License and Enterprise Services Agreement, dated as of July 20, 2020, by and among Caesars Enterprise Services, LLC, CEOC, LLC, Caesars Resort Collection, LLC, Caesars License Company, LLC and Caesars World LLC (including as Exhibit A thereto a conformed copy of the Third Amended and Restated Omnibus License and Enterprise Services Agreement, dated as of December 26, 2018, as amended). | | Previously filed on Form 8-K filed by Caesars Holdings, Inc. on July 21, 2020. |
| | | | |
10.2710.29 | | Credit Agreement, dated as of July 20, 2020, by and among Eldorado Resorts, Inc., the lenders party thereto from time to time, JPMorgan Chase Bank, N.A., as administrative agent, and U.S. Bank National Association, as collateral agent. | | Previously filed on Form 8-K filed on July 21, 2020. |
| | | | |
10.2810.30 | | | | Previously filed on Form 8-K filed on July 21, 2020. |
| | | | |
10.2910.31 | | | | Previously filed on Form 8-K filed on November 10, 2021. |
| | | | |
10.3010.32 | | | | Previously filed on Form 8-K filed on January 27, 2022. |
| | | | |
10.3110.33 | | Credit Agreement, dated as of December 22, 2017, by and among Caesars Resort Collection, LLC, the other borrowers from time to time party thereto, the lenders party thereto, and Credit Suisse, AG, Cayman Islands Branch, as administrative agent. | | Previously filed on Form 8-K filed by Caesars Holdings, Inc. on December 22, 2017. |
| | | | |
10.32 | | FirstThird Amendment to Credit Agreement, dated as of June 15, 2020,October 5, 2022, by and among Caesars Resort Collection, LLC, the subsidiary loan parties party thereto, the lenders party thereto and Credit Suisse AG, Cayman Islands Branch, as administrative agent. | | Previously filed on Form 8-K filed by Caesars Holdings,Entertainment, Inc. on June 15, 2020. |
| | | | |
10.33 | | | | Previously filed on Form 8-K filed on September 27, 2021 |
| | | | |
| | | | | | | | | | | | | | |
Exhibit
Number
| | Description of Exhibit | | Method of Filing |
10.34 | | Incremental Assumption Agreement No. 1, dated as of July 20, 2020, by and among Caesars Resort Collection, LLC,, the subsidiary guarantors party thereto, the lenders party thereto and Credit Suisse AG, Cayman Islands Branch,JPMorgan Chase Bank, N.A., as administrative agent. | | Previously filed on Form 8-K filed on July 21, 2020.October 5, 2022. |
| | | | |
10.3510.34* | | Incremental Assumption Agreement No. 2, dated as of July 20, 2020,February 6, 2023, by and among Caesars Resort Collection, LLC,Entertainment, Inc., the subsidiary guarantors party thereto, the lenderlenders party thereto and Credit Suisse AG, Cayman Islands Branch,JPMorgan Chase Bank, N.A., as administrative agent. | | Previously filed on Form 8-K filed on July 21, 2020.February 6, 2023. |
| | | | |
| | | | | | | | | | | | | | |
Exhibit Number | | Description of Exhibit | | | Method of Filing |
10.3610.35* | | GuaranteeIncremental Assumption Agreement No. 3, dated as of AugustFebruary 6, 2021,2024, by and among Caesars Entertainment, Inc. in favor of U.S., the subsidiary guarantors party thereto, the lenders party thereto and JPMorgan Chase Bank, National Agent,N.A., as collateraladministrative agent. | | Previously filed on Form 8-K filed on August 10, 2021.February 7, 2024. |
| | | | |
10.3710.36 | | | | Previously filed on Form 8-K filed by Caesars Holdings, Inc. on October 13, 2017. |
| | | | |
| 10.37 | | | | |
| | | | |
10.38 | | | | Previously filed on Form 8-K filed by Caesars Holdings, Inc. on April 6, 2020. |
| | | | |
10.3910.38 | | | | Previously filed on Form 8-K/A filed by Caesars Holdings, Inc. on April 14, 2020. |
| | | | |
10.40†10.39† | | | | Previously filed on Form S-1/A filed by Caesars Holdings, Inc. on February 2, 2012. |
| | | | |
10.41† | | | | Previously filed on Form 8-K filed by Caesars Holdings, Inc. on July 25, 2012. |
| | | | |
10.42† | | | | Previously filed on Form 8-K filed by Caesars Holdings, Inc. on May 20, 2015. |
| | | | |
10.43† | | | | Previously filed on Form 8-K filed by Caesars Holdings, Inc. on May 20, 2016. |
| | | | |
10.44† | | | | Previously filed on Form 10-Q filed by Caesars Holdings, Inc. on August 2, 2016. |
| | | | |
| | | | |
| | | | |
10.45† | | | | Previously filed on Form 8-K filed by Isle of Capri Casinos, Inc. on October 9, 2015. |
| | | | |
10.46† | | | | Previously filed on Form 10-K filed by Isle of Capri Casinos, Inc. on June 17, 2015. |
| | | | |
10.47† | | | | Previously filed on Form S-8 filed by Caesars Holdings, Inc. on October 6, 2017. |
| | | | |
10.48† | | | | Previously filed on Form 8-K filed by Caesars Holdings, Inc. on April 6, 2018. |
| | | | |
10.49† | | | | Previously filed on Form S-8 filed by Caesars Holdings, Inc. on December 13, 2018. |
| | | | |
10.50†10.40† | | | | Previously filed on Form S-8 filed by Caesars Holdings, Inc. on December 13, 2018. |
| | | | |
10.51†10.41† | | | | Previously filed on Form 8-K filed by Caesars Acquisition Company on April 16, 2014. |
| | | | |
10.52† | | | | Previously filed on Form S-8 POS filed on June 29, 2019. |
| | | | |
| | | | | | | | | | | | | | |
Exhibit
Number
10.42† | | Description of Exhibit | | Method of Filing |
10.53† | | | | Previously filed on Form 10-Q filed on November 9, 2020. |
| | | | |
10.54†10.43† | | | | Previously filed on Form 10-K filed on February 28, 2020. |
| | | | |
10.55†10.44† | | | | Previously filed on Form 10-K on March 1, 2021. |
| | | | |
10.56†10.45† | | | | Previously filed on Form 10-K on March 1, 2021. |
| | | | |
10.57†10.46† | | | | Previously filed on Form 10-K filed on February 28, 2020. |
| | | | |
10.58†10.47† | | | | Previously filed on Registration Statement Form S-1 filed by Eldorado Resorts, Inc. June 14, 2015. |
| | | | |
10.59†10.48† | | | | Previously filed on Form 10-K filed on March 1, 2019. |
| | | | |
10.6010.49† | | | | Previously filed on Form 8-K filed on May 1, 2017. |
| | | | |
10.61† | | | | Previously filed on Form 8-K on January 4, 2022. |
| | | | |
10.62† | | | | Previously filed on Form 8-K on January 4, 2022.Filed herewith. |
| | | | |
10.63†10.50† | | | | Previously filed on Form 8-K filed on January 4, 2022.Filed herewith. |
| | | | |
10.64†10.51† | | | | Filed herewith. |
| | | | |
| 10.52† | | | | Previously filed on Form 8-K filed on January 4,March 1, 2022. |
| | | | |
10.65†10.53† | | | | Previously filed on Form 8-K filed on January 4, 2022. |
| | | | |
10.66† | | | | Filed herewith. |
| | | | |
| 10.54† | | | | Previously filed on Form 8-K filed on January 4, 2022.Filed herewith. |
| | | | |
| | | | | | | | | | | | | | |
Exhibit Number | | Description of Exhibit | | | Method of Filing |
10.6710.55 | | Amended and Restated Omnibus Amendment to Leases, dated as of October 27, 2020, by and among the entities listed on scheduleSchedule A attached thereto CPLV Property Owner LLC, Claudine Propco LLC, Harrah’s Joliet Landco LLC, CEOC, LLC, the entities listed on scheduleSchedule B attached thereto, Desert Palace LLC, Harrah’s Las Vegas, LLC, and Des Plaines Development Limited Partnership.Partnership and Propco TRS LLC. | | Previously filed on Form 10-Q filed on November 9, 2020. |
| | | | |
10.6810.56 | | SecondThird Amended and Restated Master Lease, dated as of December 18, 2020,November 13, 2023, by and betweenamong Tropicana Entertainment, Inc., IOC Black Hawk County, Inc., Isle of Capri Bettendorf, L.C. and GLP Capital L.P. | | Filed herewith. |
| | | | |
10.69w
14.1 | | | | Previously filed on Form 8-K on April 26, 2021. |
| | | | |
10.70 | | | | Filed herewith. |
| | | | |
10.71 | | | | Previously filed on Form 8-K filed on April 26, 2021. |
| | | | |
10.72 | | | | Previously filed on Form 8-K filed on April 26, 2021. |
| | | | |
14 | | | | Filed herewith. |
| | | | |
| 21 | | | |
| | | | |
| 21.1 | | | | Filed herewith. |
| | | | |
| 23.1 | | | | Filed herewith. |
| | | | |
23.2 | | | | Filed herewith. |
| | | | |
| 31.1 | | | | Filed herewith. |
| | | | | | | | | | | | | | |
Exhibit
Number
| | Description of Exhibit | | Method of Filing |
| | | | |
| 31.2 | | | | Filed herewith. |
| | | | |
| 32.1 | | | | Filed herewith. |
| | | | |
| 32.2 | | | | Filed herewith. |
| | | | |
| 97.1 | | | | Filed herewith. |
| | | | |
| 99.1 | | | | Filed herewith. |
| | | | |
99.2 | | | | Filed herewith. |
| | | | |
| 101.1 | | Inline XBRL Instance Document | | Filed herewith. |
| | | | |
| 101.2 | | Inline XBRL Taxonomy Extension Schema Document | | Filed herewith. |
| | | | |
| 101.3 | | Inline XBRL Taxonomy Extension Calculation Linkbase Document | | Filed herewith. |
| | | | |
| 101.4 | | Inline XBRL Taxonomy Extension Definition Linkbase Document | | Filed herewith. |
| | | | |
| 101.5 | | Inline XBRL Taxonomy Extension Label Linkbase Document | | Filed herewith. |
| | | | |
| 101.6 | | Inline XBRL Taxonomy Extension Presentation Linkbase Document | | Filed herewith. |
| | | | |
| 104 | | Cover Page Interactive Data File (embedded within the Inline XBRL document) | | Filed herewith. |
______________________
| | | | | | | | |
| † | | Denotes a management contract or compensatory plan or arrangement. |
| †† | | On February 7, 2024, the CEI Senior Secured Notes due 2025 and the related amendments/incremental assumption agreements and the guarantees agreement were terminated. |
| ††† | | On February 16, 2024, the CRC Secured Notes due 2025 and the related amendments/incremental assumption agreements and the guarantees agreement were terminated. |
| * | | Certain schedules and exhibits have been omitted pursuant to Item 601(a)(5) of Regulation S-K. |
| ** | | Portions of this exhibit have been omitted pursuant to Item 601(b)(10)(iv) of Regulation S-K because such information is (i) not material and (ii) could be competitively harmful if publicly disclosed. |
| w | | Annexes, schedules and/or exhibits have been omitted pursuant to Item 601(b)(2) of Regulation S-K. |
Item 16. Form 10-K Summary
None.
Schedule I
CONDENSED FINANCIAL INFORMATION OF REGISTRANT PARENT COMPANY ONLY
CAESARS ENTERTAINMENT, INC.
CONDENSED BALANCE SHEETS
| | As of December 31, |
| As of December 31, | | | As of December 31, |
| (In millions) | (In millions) | 2021 | | 2020 | (In millions) | 2023 | | 2022 |
| ASSETS | ASSETS | | | |
| Current assets | Current assets | $ | 221 | | | $ | 3,038 | |
| Current assets | |
| Current assets | |
| | | Investment in and advances to unconsolidated affiliates | |
| | Investment in and advances to unconsolidated affiliates | |
| | Investment in and advances to unconsolidated affiliates | Investment in and advances to unconsolidated affiliates | 60 | | | 128 | |
| Investment in subsidiaries | Investment in subsidiaries | 10,311 | | | 6,798 | |
| Property and equipment, net | Property and equipment, net | 8 | | | 18 | |
| | Other assets, net | 333 | | | 513 | |
| Long-term intercompany notes | |
| Long-term intercompany notes | |
| Long-term intercompany notes | |
| Other long-term assets, net | |
| Total assets | Total assets | $ | 10,933 | | | $ | 10,495 | |
| | LIABILITIES AND STOCKHOLDERS’ EQUITY | LIABILITIES AND STOCKHOLDERS’ EQUITY | |
| LIABILITIES AND STOCKHOLDERS’ EQUITY | |
| LIABILITIES AND STOCKHOLDERS’ EQUITY | |
| Current liabilities | |
| Current liabilities | |
| Current liabilities | Current liabilities | $ | 228 | | | $ | 231 | |
| | Long-term debt, less current portion | 6,190 | | | 5,084 | |
| Deferred income taxes | — | | | 4 | |
| Long-term debt | |
| | Long-term debt | |
| | Long-term debt | |
| | Other long-term liabilities | |
| Other long-term liabilities | |
| Other long-term liabilities | Other long-term liabilities | 35 | | | 160 | |
| Total liabilities | Total liabilities | 6,453 | | | 5,479 | |
| Total stockholders’ equity | Total stockholders’ equity | 4,480 | | | 5,016 | |
| Total liabilities and stockholders’ equity | Total liabilities and stockholders’ equity | $ | 10,933 | | | $ | 10,495 | |
See accompanying Notes to Condensed Financial Information.
Schedule I
CONDENSED FINANCIAL INFORMATION OF REGISTRANT PARENT COMPANY ONLY
CAESARS ENTERTAINMENT, INC.
CONDENSED STATEMENTS OF OPERATIONS
| | Years Ended December 31, |
| Years Ended December 31, | | | Years Ended December 31, |
| (In millions) | (In millions) | 2021 | | 2020 | | 2019 | (In millions) | 2023 | | 2022 | | 2021 |
| Net revenues | Net revenues | $ | 4 | | | $ | 7 | | | $ | 7 | |
| | Expenses: | Expenses: | |
| Expenses: | |
| Expenses: | |
| Corporate expense | Corporate expense | 43 | | | 71 | | | 65 | |
| Management fee | — | | | (36) | | | (22) | |
| Corporate expense | |
| Corporate expense | |
| Depreciation and amortization | Depreciation and amortization | 6 | | | 6 | | | 5 | |
| Transaction costs and other operating costs | 60 | | | 113 | | | 57 | |
| Transaction and other costs, net | |
| Total operating expenses | Total operating expenses | 109 | | | 154 | | | 105 | |
| Operating loss | (105) | | | (147) | | | (98) | |
| Operating income (loss) | |
| Other expense: | Other expense: | |
| Interest expense | Interest expense | (395) | | | (257) | | | (141) | |
| Gain (loss) on interests in subsidiaries | (437) | | | (1,346) | | | 210 | |
| Interest expense | |
| Interest expense | |
| Income (loss) on interests in subsidiaries | |
| Loss on extinguishment of debt | Loss on extinguishment of debt | (14) | | | (132) | | | (8) | |
| Other income (loss) | Other income (loss) | (72) | | | 197 | | | 9 | |
| Loss from operations before income taxes | (1,023) | | | (1,685) | | | (28) | |
| Income tax benefit (provision) | 4 | | | (72) | | | 109 | |
| Income (loss) from operations before income taxes | |
| Benefit for income taxes | |
| Net income (loss) | Net income (loss) | $ | (1,019) | | | $ | (1,757) | | | $ | 81 | |
See accompanying Notes to Condensed Financial Information.
Schedule I
CONDENSED FINANCIAL INFORMATION OF REGISTRANT PARENT COMPANY ONLY
CAESARS ENTERTAINMENT, INC.
CONDENSED STATEMENTS OF CASH FLOWS
| | Years Ended December 31, |
| Years Ended December 31, | | | Years Ended December 31, |
| (In millions) | (In millions) | 2021 | | 2020 | | 2019 | (In millions) | 2023 | | 2022 | | 2021 |
| Cash flows used in operating activities | Cash flows used in operating activities | $ | (448) | | | $ | (296) | | | $ | (64) | |
| Cash flows from investing activities | Cash flows from investing activities | | | | | |
| Issuance of long-term intercompany notes | |
| Issuance of long-term intercompany notes | |
| Issuance of long-term intercompany notes | |
| Collections from long-term intercompany notes | |
| Purchase of property and equipment, net | |
| William Hill Acquisition | |
| | Purchase of property and equipment, net | (1) | | | (8) | | | (5) | |
| Former Caesars acquisition | — | | | (8,470) | | | — | |
| William Hill Acquisition | (3,938) | | | — | | | — | |
| Investments in unconsolidated affiliates | — | | | — | | | (1) | |
| Proceeds from sale of businesses, property and equipment, net of cash sold | |
| Proceeds from sale of businesses, property and equipment, net of cash sold | |
| Proceeds from sale of businesses, property and equipment, net of cash sold | Proceeds from sale of businesses, property and equipment, net of cash sold | — | | | — | | | (209) | |
| | Proceeds from the sale of investments | |
| Proceeds from the sale of investments | |
| Proceeds from the sale of investments | |
| Cash flows provided by (used in) investing activities | |
| Cash flows from financing activities | |
| | Proceeds from the sale of investments | 89 | | | 24 | | | — | |
| Proceeds from long-term debt and revolving credit facilities | |
| | Cash flows used in investing activities | (3,850) | | | (8,454) | | | (215) | |
| Cash flows from financing activities | | | | | |
| Proceeds from long-term debt and revolving credit facilities | |
| | Proceeds from long-term debt and revolving credit facilities | Proceeds from long-term debt and revolving credit facilities | 1,200 | | | 9,365 | | | 33 | |
| Debt issuance and extinguishment costs | Debt issuance and extinguishment costs | (17) | | | (353) | | | (1) | |
| Repayments of long-term debt and revolving credit facilities | Repayments of long-term debt and revolving credit facilities | (100) | | | (3,339) | | | (736) | |
| Net proceeds from related parties | 705 | | | 1,320 | | | 1,022 | |
| Net proceeds (repayments) with related parties | |
| Cash paid to settle convertible notes | Cash paid to settle convertible notes | (367) | | | (903) | | | — | |
| Proceeds from sale-leaseback financing arrangement | — | | | 3,219 | | | — | |
| | Taxes paid related to net share settlement of equity awards | |
| | Taxes paid related to net share settlement of equity awards | |
| | Taxes paid related to net share settlement of equity awards | Taxes paid related to net share settlement of equity awards | (45) | | | (16) | | | (8) | |
| | Proceeds from issuance of common stock | Proceeds from issuance of common stock | 3 | | | 2,718 | | | — | |
| Proceeds from issuance of common stock | |
| Proceeds from issuance of common stock | |
| | Cash flows provided by financing activities | Cash flows provided by financing activities | 1,379 | | | 12,011 | | | 310 | |
| Effect of foreign currency exchange rates on cash | — | | | 129 | | | — | |
| Net increase (decrease) in cash, cash equivalents, and restricted cash | (2,919) | | | 3,390 | | | 31 | |
| | Cash flows provided by financing activities | |
| | Cash flows provided by financing activities | |
| | Decrease in cash, cash equivalents, and restricted cash | |
| Decrease in cash, cash equivalents, and restricted cash | |
| Decrease in cash, cash equivalents, and restricted cash | |
| Cash, cash equivalents, and restricted cash, beginning of period | Cash, cash equivalents, and restricted cash, beginning of period | 3,434 | | | 44 | | | 13 | |
| Cash, cash equivalents, and restricted cash, end of period | Cash, cash equivalents, and restricted cash, end of period | $ | 515 | | | $ | 3,434 | | | $ | 44 | |
| | RECONCILIATION OF CASH, CASH EQUIVALENTS AND RESTRICTED CASH TO AMOUNTS REPORTED WITHIN THE CONDENSED BALANCE SHEETS | RECONCILIATION OF CASH, CASH EQUIVALENTS AND RESTRICTED CASH TO AMOUNTS REPORTED WITHIN THE CONDENSED BALANCE SHEETS | |
| RECONCILIATION OF CASH, CASH EQUIVALENTS AND RESTRICTED CASH TO AMOUNTS REPORTED WITHIN THE CONDENSED BALANCE SHEETS | |
| RECONCILIATION OF CASH, CASH EQUIVALENTS AND RESTRICTED CASH TO AMOUNTS REPORTED WITHIN THE CONDENSED BALANCE SHEETS | |
| Cash and cash equivalents in current assets | Cash and cash equivalents in current assets | $ | 199 | | | $ | 1,114 | | | $ | 44 | |
| Restricted cash in current assets | — | | | 1,895 | | | — | |
| Restricted and escrow cash included in other assets, net | 316 | | | 425 | | | — | |
| Cash and cash equivalents in current assets | |
| Cash and cash equivalents in current assets | |
| | Restricted and escrow cash included in other long-term assets, net | |
| Restricted and escrow cash included in other long-term assets, net | |
| Restricted and escrow cash included in other long-term assets, net | |
| Total cash, cash equivalents and restricted cash | Total cash, cash equivalents and restricted cash | $ | 515 | | | $ | 3,434 | | | $ | 44 | |
See accompanying Notes to Condensed Financial Information.
Schedule I
CONDENSED FINANCIAL INFORMATION OF REGISTRANT PARENT COMPANY ONLY
CAESARS ENTERTAINMENT, INC.
NOTES TO CONDENSED FINANCIAL INFORMATION
1.Background and basis of presentation
These condensed parent company financial statements have been prepared in accordance with Rule 12-04, Schedule 1 of Regulation S-X, as the restricted net assets of Caesars Entertainment, Inc. and its subsidiaries exceed 25% of the consolidated net assets of Caesars Entertainment, Inc. and its subsidiaries (the “Company”). This information should be read in conjunction with the Company’s consolidated financial statements included elsewhere in this filing.
2.Restricted net assets of subsidiaries
Certain of the Company’s subsidiaries have restrictions on their ability to pay dividends or make intercompany loans and advances pursuant to financing arrangements and regulatory restrictions. The amount of restricted net assets the Company’s consolidated subsidiaries held as of December 31, 20212023 was approximately $4.4 billion. $4.5 billion. Such restrictions are on net assets of Caesars Entertainment, Inc. and its subsidiaries. The amount of restricted net assets in the Company’s unconsolidated subsidiaries was not material to the financial statements.
3.Commitments, contingencies, and long-term obligations
For a discussion of the Company’s commitments, contingencies, and long-term obligations under its credit facilities, see Note 11 and Note 12 of the Company’s consolidated financial statements.
SIGNATURES
Pursuant to the requirements of Sections 13 or 15(d) of the Securities Exchange Act of 1934, the registrant has duly caused this report to be signed on its behalf by the undersigned, thereunto duly authorized.
| | | | | | | | |
| CAESARS ENTERTAINMENT, INC. |
| | |
| By: | /s/ Thomas R. Reeg |
Dated: February 23, 202220, 2024 | | Thomas R. Reeg Chief Executive Officer |
Pursuant to the requirements of the Securities Exchange Act of 1934, this report has been signed below by the following persons on behalf of the registrant and in the capacities and on the dates indicated.
| | | | | | | | | | | | | | |
| Signature | | Title | | Date |
| | | | |
| | | | |
| /s/ Thomas R. Reeg | | Chief Executive Officer (Principal Executive Officer) and Director | | February 23, 202220, 2024 |
| Thomas R. Reeg | | |
| | | | |
| /s/ Bret Yunker | | Chief Financial Officer (Principal Financial Officer) | | February 23, 202220, 2024 |
| Bret Yunker | | |
| | | | |
| /s/ Stephanie D. Lepori | | Chief Administrative and Accounting Officer (Principal Accounting Officer) | | February 23, 202220, 2024 |
| Stephanie D. Lepori | | |
| | | | |
| /s/ Gary L. Carano | | Executive Chairman of the Board | | February 23, 202220, 2024 |
| Gary L. Carano | | |
| | | | |
| /s/ Bonnie Biumi | | Director | | February 23, 202220, 2024 |
| Bonnie Biumi | | |
| | | | |
| /s/ Jan Jones Blackhurst | | Director | | February 23, 202220, 2024 |
| Jan Jones Blackhurst | | |
| | | | |
| /s/ Frank J. Fahrenkopf Jr. | | Director | | February 23, 202220, 2024 |
| Frank J. Fahrenkopf Jr. | | |
| | | | |
| /s/ Don Kornstein | | Director | | February 23, 202220, 2024 |
| Don Kornstein | | |
| | | | |
| /s/ Courtney Mather | | Director | | February 23, 202220, 2024 |
| Courtney Mather | | |
| | | | |
/s/ Sandra Douglass Morgan | | Director | | February 23, 2022 |
Sandra Douglass Morgan | | |
| | | | |
| /s/ Michael E. Pegram | | Director | | February 23, 202220, 2024 |
| Michael E. Pegram | | |
| | | | |
| /s/ David P. Tomick | | Director | | February 23, 202220, 2024 |
| David P. Tomick | | |