UNITED STATES
SECURITIES AND EXCHANGE COMMISSION
Washington, D.C. 20549
FORM 10-K
| | | | | | | | | | | | | | |
| (Mark One) | | | | |
| ☑ | ANNUAL REPORT PURSUANT TO SECTION 13 OR 15(d) OF THE SECURITIES EXCHANGE ACT OF 1934 | | | |
SECURITIES EXCHANGE ACT OF 1934
For the fiscal year ended June 30, 20172020
OR
| | | | | | | | | | | | | | |
| ☐ | TRANSITION REPORT PURSUANT TO SECTION 13 OR 15(d) OF THE SECURITIES EXCHANGE ACT OF 1934 | | | |
For the transition period to
Commission file number: 001-36290
MALIBU BOATS, INC.
(Exact Name of Registrant as specified in its charter)
|
| | | | | | | | | | | | | | | | | | | |
| Delaware | | 5075 Kimberly Way,
Loudon, Tennessee 37774 | Loudon, | Tennessee | 37774 | | 46-4024640 |
(State or other jurisdiction of
incorporation or organization)
| | (Address of principal executive offices,
including zip code)
| | | | | (I.R.S. Employer
Identification No.)
|
| | (865) 458-5478 | | |
| | (Registrant’s telephone number,
including area code)
| | |
|
| | | | |
Securities Registered Pursuant to Section 12(b) of the Act:(865) | 458-5478 |
| (Registrant’s telephone number, including area code) | |
Securities registered pursuant to Section 12(b) of the Act:
| | | | | | | | |
| Title of each class | Trading Symbol(s) | Name of each exchange on which registered |
Class A Common Stock, ($0.01 par value per share)$0.01 | MBUU | NASDAQNasdaq Global Select Market |
Indicate by check mark if the registrant is a well-known seasoned issuer, as defined in Rule 405 of the Securities Act. Yes ¨þ No þ¨
Indicate by check mark if the registrant is not required to file reports pursuant to Section 13 or Section 15(d) of the Act. Yes ¨ No þ
Indicate by check mark whether the registrant (1) has filed all reports required to be filed by Section 13 or 15(d) of the Securities Exchange Act of 1934 during the preceding 12 months (or for such shorter period that the registrant was required to file such reports), and (2) has been subject to such filing requirements for the past 90 days. Yes þ No ¨
Indicate by check mark whether the registrant has submitted electronically and posted on its corporate Web site, if any, every Interactive Data File required to be submitted and posted pursuant to Rule 405 of Regulation S-T (§232.405 of this chapter) during the preceding 12 months (or for such shorter period that the registrant was required to submit and post such files). Yes þ No ¨
Indicate by check mark if disclosure of delinquent filers pursuant to Item 405 of Regulation S-K is not contained herein, and will not be contained, to the best of registrant's knowledge, in the definitive proxy or information statements incorporated by reference in Part III of this Form 10-K or any amendment to this Form 10-K. þ
Indicate by check mark whether the registrant is a large accelerated filer, an accelerated filer, a non-accelerated filer, smaller reporting company or an emerging growth company. See the definitions of “large accelerated filer,” “accelerated filer,” “smaller reporting company” and “emerging growth company” in Rule 12b-2 of the Exchange Act:
| | | | | | | | | | | | | | | | | | | | |
| Large accelerated filer | | ☑ | | Accelerated filer | | ☐ |
| | | | | | |
| Non-accelerated filer | | ☐ | | Smaller reporting company | | ☐ |
| | | | | | |
| Emerging growth company | | ☐ | | | | |
| | | | | | |
Large accelerated filer | | ¨ | | Accelerated filer | | þ |
| | | |
Non-accelerated filer | | ¨ (Do not check if a smaller reporting company)
| | Smaller reporting company | | ¨ |
| | | | | | |
Emerging growth company | | þ | | | | |
| | | | | | |
If an emerging growth company, indicate by check mark if the registrant has elected not to use the extended transition period for complying with any new or revised financial accounting standards provided pursuant to Section 13(a) of the Exchange Act. þ¨ | | | | | | |
| | | | | |
| Indicate by a check mark whether the registrant has filed a report on and attestation to its management's assessment of the effectiveness of its internal control over financial reporting under Section 404(b) of the Sarbanes-Oxley Act (15 U.S.C. 7262(b)) by the registered public accounting firm that prepared or issued its audit report. | ☑ |
| | | | | | | | | | | | | | |
Indicate by check mark whether the registrant is a shell company (as defined in Rule 12b-2 of the Exchange Act). | Yes ¨ | ☐ | Noþ | ☑ |
As of December 31, 2016,2019, the last business day of the registrant’s most recently completed second fiscal quarter, the aggregate value of the registrant’s common stock held by non-affiliates was approximately $303.0 $830.9 million, based on the number of shares of Class A common stock held by non-affiliates as of December 31, 20162019 and the closing price of the registrant’s Class A common stock on the NASDAQNasdaq Global Select Market on December 31, 2016.2019. Shares held by each executive officer, director and by each person who owns 10% or more of the outstanding Class A common stock have been excluded in that such persons may be deemed to be affiliates. This determination of affiliate status is not necessarily a conclusive determination for other purposes. The number of outstanding shares of the registrant’s Class A common stock, par value $0.01 per share, and Class B common stock, par value $0.01, as of September 6, 2017August 28, 2020 was 20,287,03020,620,752 and 18, 13, respectively.
DOCUMENTS INCORPORATED BY REFERENCE
Portions of the registrant’s Proxy Statement for the 20172020 Annual Meeting of Stockholders are incorporated into Part III of this Annual Report on Form 10-K where indicated. Such proxy statement will be filed with the Securities and Exchange Commission within 120 days of the registrant’s fiscal year ended June 30, 2017.2020.
TABLE OF CONTENTS
SPECIAL NOTE REGARDING FORWARD-LOOKING STATEMENTS
This Annual Report on Form 10-K contains forward-looking statements. All statements other than statements of historical facts contained in this Form 10-K are forward-looking statements, including statements regarding expected benefitsthe effects of our acquisition of Cobalt Boats, LLC,the COVID-19 pandemic on us; demand for our products and expected industry trends, our business strategy and plans, our prospective products or products under development, our vertical integration initiatives, our acquisition strategy and management’s objectives for future operations. In particular, many of the statements under the headings “Item 1A. Risk Factors,” “Item 7. Management’s Discussion and Analysis of Financial Condition and Results of Operations” and “Item 1.”
Business” constitute forward-looking statements. In some cases, you can identify forward-looking statements by terminology such as “may,” “will,” “should,” “expects,” “plans,” “anticipates,” “believes,” “estimates,” “predicts,” “potential,” “continue,” the negative of these terms, or by other similar expressions that convey uncertainty of future events or outcomes to identify these forward-looking statements. These statements are only predictions, involving known and unknown risks, uncertainties and other factors that may cause our or our industry’s actual results, levels of activity, performance or achievements to be materially different from any future results, levels of activity, performance or achievements expressed or implied by these forward-looking statements. Such factors include, but are not limited to: the successful integrationeffects of Cobalt Boats, LLC into our business;the COVID-19 pandemic on us; general industry, economic and business conditions; significant fluctuations in our annual and quarterly financial results; unfavorable weather conditions;conditions, policies impacting access to waterways and shelter-in-place orders; our reliance on our network of independent dealers and increasing competition for dealers; the financial health of our dealers and their continued access to financing; our obligation to repurchase inventory of certain dealers; the success of our failureengine integration strategy; our reliance on certain suppliers for our engines and outboard motors; our reliance on third-party suppliers for raw materials and components and any interruption of our informal supply arrangements; our ability to managemeet our manufacturing levels while addressing the seasonal retail pattern forworkforce needs; exposure to workers' compensation claims and other workplace liabilities; our products;ability to grow our business through acquisitions and integrate such acquisitions to fully realize their expected benefits; our growth strategy which may require us to secure significant additional capital; our large fixed cost base; intense competition within our industry; increased consumer preference for used boats or the supply of new boats by competitors in excess of demand; the successful introduction of new products; the success of our engines integration strategy; competition with other activities for consumers’ scarce leisure time; the continued strength of our brands; our ability to execute our manufacturing strategy successfully; our ability to meet our manufacturing workforce needs; our reliance on third-party suppliers and ability to obtain adequate raw materials and components; our exposure to claims for product liability and warranty claims; our dependence on key personnel; our ability to grow our business through acquisitions or strategic alliances and new partnerships; our growth strategy which may require us to secure significant additional capital; our ability to protect our intellectual property; disruptions to our network and information systems; exposure to workers' compensation claims and other workplace liabilities; risks inherent in operating in foreign jurisdictions; rising concern regarding international tariffs; changes in currency exchange rates; an increase in energy and fuel costs; any failure to comply with laws and regulations including environmental and other regulatory requirements; a natural disaster, global pandemic or other disruption at our manufacturing facilities; increases in income tax rates or changes in income tax laws; covenants in our credit facilitiesagreement governing our revolving credit facility and term loan which may limit our operating flexibility; our variable rate indebtedness which subjects us to interest rate risk; our status as an “emerging growth company”; and any failure to maintain effective internal control over financial reporting or disclosure controls or procedures.
We discuss many of these factors, risks and uncertainties in greater detail under the heading “Item 1A. Risk Factors” and elsewhere in this Form 10-K. These factors expressly qualify as forward-looking statements attributable to us or persons acting on our behalf.
You should not rely on forward-looking statements as predictions of future events. Although we believe that the expectations reflected in the forward-looking statements are reasonable, we cannot guarantee future results, levels of activity, performance or achievements. Actual results may differ materially from those suggested by the forward-looking statements for various reasons, including those discussed under “Item 1A. Risk Factors” in this Form 10-K. Except as required by law, we assume no obligation to update forward-looking statements for any reason after the date of this Form 10-K to conform these statements to actual results or to changes in our expectations.
PART I.
Item 1. Business
Unless otherwise expressly indicated or the context otherwise requires, in this Annual Report on Form 10-K:
•we use the terms “Malibu Boats,” the “Company,” “we,” “us,” “our” or similar references to refer (1) prior to the consummation of our IPO on February 5, 2014, to Malibu Boats Holdings, LLC, or the LLC, and its consolidated subsidiaries and (2) after our IPO, to Malibu Boats, Inc. and its consolidated subsidiaries;
•we refer to our initial public offering of Class A common stock on February 5, 2014, as our “IPO”;
•we refer to the owners of membership interests in the LLC immediately prior to the consummation of the IPO, collectively, as our “pre-IPO owners”;
•we refer to owners of membership interests in the LLC (the "LLC Units"), collectively, as our “LLC members”;
•references to “fiscal year” refer to the fiscal year of Malibu Boats, which ends on June 30. Fiscal year 2013 for the LLC ended on June 30 2013. Fiscal years 2014, 2015, 2016of each year;
•we refer to our Malibu branded boats as "Malibu", our Axis Wake Research branded boats as "Axis", our Cobalt branded boats as "Cobalt", and 2017 ended on June 30, 2014, 2015, 2016 and 2017 respectively;our Pursuit branded boats as "Pursuit";
•we use the term “recreational powerboat industry” to refer to our industry group, which includes performance sport boats, sterndrive and outboard boats;
•we use the term “performance sport boat category” to refer to ourthe industry category, consisting primarily of fiberglass boats equipped with inboard propulsion and ranging from 19 feet to 26 feet in length, which we believe most closely corresponds to (1) the inboard ski/wakeboard category, as defined and tracked by the National Marine Manufacturers Association, or NMMA, and (2) the inboard skiboat category, as defined and tracked by Statistical Surveys, Inc., or SSI;
•we use the terms “sterndrive” and “outboard” to refer to our newly expandedthe industry category, consisting primarily of sterndrive and outboard boats ranging from 20 feet to 40 feet, which most closely corresponds to (1) the sterndrive and outboard categories, as defined and tracked by NMMA, and (2) the sterndrive and outboard propulsion categories, as defined and tracked by SSI; and
•references to certain market and industry data presented in this Form 10-K are determined as follows: (1) U.S. boat sales and unit volume for the overall powerboat industry and any powerboat category during any calendar year are based on retail boat market data from the NMMA; (2) U.S. market share and unit volume for the overall powerboat industry and any powerboat category during any fiscal year ended June 30 or any calendar year ended December 31 are based on comparable same-state retail boat registration data from SSI, as reported by the 50 states for which data was available as of the date of this Form 10-K; and (3) market share among U.S. manufacturers of exports to international markets of boats in any powerboat category for any period is based on data from the Port Import Export Reporting Service, available through March 31, 2017,2020, and excludes such data for Australia and New Zealand.
This Annual Report on Form 10-K includes our trademarks, such as “Surf Gate,” “Wakesetter,” “SurfBand,” “Swim Step,” and “TrueWave” which are protected under applicable intellectual property laws and are the property of Malibu Boats. This Form 10-K also contains trademarks, service marks, trade names and copyrights of other companies, which are the property of their respective owners. Solely for convenience, trademarks and trade names referred to in this Form 10-K may appear without the ® or TM symbols, but such references are not intended to indicate, in any way, that we will not assert, to the fullest extent under applicable law, our rights or the right of the applicable licensor to these trademarks and trade names.
Our Company
We are a leading designer, manufacturer and marketer of a diverse range of recreational powerboats, including performance sport boats, sterndrive and outboard boats.boats under four brands—Malibu, Axis, Cobalt, and Pursuit. We have the #1 market share position in the United States in the performance sport boat category through our Malibu and Axis Wake Research (“Axis”) brands. With our recent acquisition of Cobalt Boats, LLC (“Cobalt”) in July 2017, we also havebrands and the #1 market share position in the United States through our Cobalt brand in the 24’—29’ segment of the sterndrive category.category through our Cobalt brand, and we are among the leading market share positions in the fiberglass outboard fishing boat market with our Pursuit brand. Our boatsproduct portfolio of premium brands are used for a broad range of recreational boating activities including, among others, water sports includingsuch as water skiing, wakeboarding and wake surfing, as well as general recreational boating.boating and fishing. Our passion for consistent innovation, which has led to propriety technology such as Surf Gate, has allowed us to expand the market for our
products by introducing consumers to new and exciting recreational activities. We believe we have been a consistent innovator in the recreational powerboat industry, designingdesign products that appeal to an expanding range of recreational boaters and water sports enthusiasts whose passion for boating and water sports is a key aspect of their lifestyle. We believe many of our innovations, such as our
proprietary Surf Gate technology launched in 2012, expand the market for our products by introducing consumers to newlifestyle and exciting recreational activities. We also added another strong brand in Cobalt with a versatile lineup of boats, further deepening our product portfolio, expanding our addressable market, and ultimately, our ability to provide consumers with a better customer-inspired experience. We believe that theWith performance, quality, value and multi-purpose features, of our boats positionproduct portfolio has us well positioned to broaden our addressable market and achieve our goal of increasing our market share in the expanding recreational boating industry.
We sell our boats under three brands—Malibu; Axis; and Cobalt. Our flagship Malibu boats offer our latest innovations in performance, comfort and convenience, and are designed for consumers seeking a premium performance sport boat experience. Retail prices of our Malibu boats typically range from $50,000 to $180,000. We launched ourOur Axis boats in 2009 to appeal to consumers who desire a more affordable performance sport boat product but still demand high performance, functional simplicity and the option to upgrade key features. Retail prices of our Axis boats typically range from $50,000 to $95,000. Our Cobalt boats consist of mid to large-sized luxury cruisers and bowriders that we believe offer the ultimate experience in comfort, performance and quality. Our Pursuit boats expand our product offerings into the saltwater outboard fishing market and include center console, dual console and offshore models. Retail prices for our Cobalt boats typicallyboat models range from $50,000 $60,000 to $700,000.$800,000.
Our boats are constructed of fiberglass, available in a range of sizes, hull designs and propulsion systems (i.e., inboard, sterndrive and outboard). We employ experienced product development and engineering teams that enable us to offer a range of models across each of our brands while consistently introducing innovative features in our product offerings. Our engineering teamteams closely collaboratescollaborate with our manufacturing personnel in order to improve product quality and process efficiencies. The results of this collaboration are reflected in our receipt of numerous industry awards, including the "WSIA Innovation of Year"Boating Industry Magazine's "Top Product" award for the Malibu Command CenterM240 in 20172020, Pursuit S 378 in 2020, Malibu 25 LSV in 2019, Surf Band in 2018 and the Boating Industry's "Top Product Award" for theour Integrated Surf Platform ("ISP") in 2016.2016, as well as the Boating Industry's Best New and Innovative Products in 2019 for the Cobalt A29. We have also been recognized as Sounding Trade Only Today’s “2019 Top Most Innovative Marine Companies,” and we earned the honors of "WSIA Innovation of Year" award for our Malibu M240 M-Line Hull with Surf Gate Fusion in 2020, Malibu Monsoon Engines in 2019 and our Malibu Command Center in 2017.
We sell our boats through a dealer network that we believe is the strongest in the recreational powerboat industry. As of July 1, 2017,2020, our Malibu and Axis brand distribution channel consisted of 126 independent dealers operating in 146 locations in North America and we had 59 independentover 350 dealer locations across 40 countries outside of North America, including Australia. Our Malibu and Axis brand boats are the exclusive performance sport boats offered by the majority of our dealers. Our acquisition of Cobalt has allowed us to expand into Cobalt’s strong network which consists of 111 independent dealers operating 142 locations worldwide with a large percentage of those dealers having the #1 or #2 market share in their respective markets. The acquisition of Cobalt has increased our total independent dealer network to over 300 locations globally. Our dealer base is an important part of our consumers’ experience, our marketing efforts and our brands. We devote significant time and resources to find, develop and improve the performance of our dealers and believe our dealer network gives us a distinct competitive advantage.
Financial Information About SegmentsImpact of COVID-19 Pandemic
We currently reportThe COVID-19 pandemic has significantly impacted health and economic conditions throughout the United States and world, and it had a significant impact on our operations and financial results for fiscal year 2020. On March 24, 2020, we elected to suspend operations at all of our facilities, and we subsequently resumed operations at our facilities in late April and May 2020. As a result of the suspension of our production of boats, our net sales declined by $30.9 million, or 4.5%, and our unit sales decreased by 918 units, or 12.5%, for fiscal year 2020 compared to fiscal 2019. However, sales at our dealers, while impacted negatively by COVID-19 in late March and through April, improved materially from May through July 2020 and that increase has depleted inventory at our dealers.
For more information on how the COVID-19 pandemic has impacted us and may continue to impact us, see the risk factor “The COVID-19 pandemic is adversely affecting, and is expected to continue to adversely affect, our operations, and those of our dealers and suppliers, thereby adversely affecting our business, financial condition and results of operationsoperations.” under two reportable segments called U.S.Part I. Item 1A. of this Form 10- K, and Australia segments based on their respective geographic manufacturing footprints. Each segment participates in the manufacturing, distribution, marketing“Management’s Discussion and saleAnalysis of MalibuFinancial Conditions and Axis performance sport boats. The U.S. operating segment primarily serves markets in North America, South America, Europe, and Asia while the Australia operating segment principally serves the Australian and New Zealand markets. The segment and geographic information required herein is contained in Note 17 - Segment Reporting, in the notes to our consolidated financial statements.
We acquired Cobalt in July 2017, and asResults of Operations--Impact of the dateCOVID-19 Pandemic” under Part I., Item 7. of this report, we have not made a final assessment as to the number of reportable segments the Company will have in accordance with Accounting Standards Codification ("ASC") 280, Segment Reporting, going forward.Form 10-K.
Our Market Opportunity
During calendar year 2016,2019, retail sales of new recreational powerboats in the United States totaled $8.2$11.3 billion. Of the recreational powerboat categories defined and tracked by the NMMA, our core market corresponds most directly towe serve the inboard ski/wakeboard category, which we refer to as thetop three categories of outboard, sterndrive and performance sport boat category. We serve this categoryrepresenting an addressable market of nearly $9.8 billion in retail sales through our Malibu, Axis, Cobalt, and CobaltPursuit brands. Through our Cobalt brand, we also now directly access the larger outboard and sterndrive categories, which together accounted for $5.5 billion in retail sales in calendar year 2016. Combined, our product portfolio allows us to meaningfully access an addressable market that represented nearly $6.6 billion of sales in 2016. The following table illustrates the size of our addressable market in units and retail sales for calendar year 2016:2019:
|
| | | | | | | |
| Powerboat Category | | Unit Sales | | Retail Sales |
| | | | | (Dollars in millions) |
| Outboard | | 160,900 |
| | $ | 4,659 |
|
| Sterndrive | | 12,200 |
| | 878 |
|
| Performance sport boat | | 8,700 |
| | 818 |
|
| Jet boat | | 5,000 |
| | 205 |
|
| Total addressable market | | 186,800 |
| | $ | 6,560 |
|
We believe we are well-positioned to benefit from trends in our addressable market, including:
Improving Macroeconomic Environment Driving Increased Consumer Demand for Boats. Following the economic downturn, the recreational powerboat industry has grown and is projected to continue to recover by the NMMA. While domestic sales of recreational powerboats in 2016 grew to approximately 186,800 units, they remained 37% below the historical peak 2006 sales volume of approximately 298,000 units. Within our primary category, performance sport boats, units grew to approximately 8,700 in 2016, 34% below the category's historical peak 2006 sales volume of 13,100, We believe there remains significant opportunity for growth from increased consumer demand in the recreational powerboat industry as the economy improves, but there are numerous variables that have potential to impact future growth.
Size and Strong Growth of Outboard Category. The outboard category of the recreational powerboat industry is the largest category, measured both by unit sales and retail sales. In 2016, outboard boats represented approximately 86% of total units sold and approximately 71% of total retail sales in the United States. Additionally, the outboard category has been one of the strongest performers of the recreational powerboat industry over the past several years. The chart below illustrates the performance of the outboard category based on retail sales since 2010, growing, on average, 7.7% in each of the past six years:

With our recent Cobalt acquisition, we now have a product line designed specifically to target the outboard category of the recreational powerboat industry. We believe the outboard category will continue to be the largest and one of the strongest categories of the recreational powerboat industry, and that significant opportunity remains for us to enhance our outboard product portfolio and dealer distribution network to capitalize on the outboard category’s performance.
Increasing Ages of Used Boats Driving New Boat Sales. In 2016, according to NMMA retail sales data, new recreational powerboats accounted for approximately one out of five recreational powerboat sales in the United States compared to an average of approximately one out of four between 2002 and 2008. We believe the shift toward purchasing more used boats during the economic downturn helped cause the average age of recreational powerboats in use to increase from 15 years in 1997 to over 21 years today. We believe that as the recreational powerboat industry continues its ongoing recovery and older boats reach the end of their usable lives, we expect consumer purchases of new boats to shift back toward historic levels benefiting new boat manufacturers. | | | | | | | | | | | | | | |
| Recreational Powerboat Category | | Unit Sales | | Retail Sales |
| | | | (Dollars in millions) |
| Outboard | | 172,700 | | | $ | 7,656 | |
| Sterndrive | | 10,100 | | | 883 | |
| Performance sport boat | | 11,100 | | | 1,232 | |
| Jet boat | | 5,900 | | | 289 | |
| Cruisers | | 1,600 | | | 1,269 | |
| Total addressable market | | 201,400 | | | $ | 11,329 | |
Our Strengths
#1Leading Market Share Position in Performance Sport Boat CategoryPositions. According to SSI, we have held the number one market share position, based on unit volume, in the United States among manufacturers of performance sport boats for each calendar yearsyear since 2010 including 2016.2019. We have grown our U.S. market share in this category through our Malibu and Axis brands from 24.4%24.5% in 2010 to 33.0%32.7% in 2016. The following table reflects our U.S.2019. Furthermore, we also hold the number one market share in the performance sport boat category compared to the market share of our competitors for the periods shown:
|
| | | | | | | | | | | | | | | | | | | | | |
| | | U.S. Market Share in Performance Sport Boat Category |
| Manufacturer/Brand(s) | | 2010 | | 2011 | | 2012 | | 2013 | | 2014 | | 2015 | | 2016 |
| | | | | | | | | | | | | | | |
| Malibu Boats/Malibu and Axis | | 24.4 | % | | 29.0 | % | | 30.8 | % | | 33.0 | % | | 32.0 | % | | 32.0 | % | | 33.0 | % |
Correct Craft, Inc./Nautique1 | | 23.1 |
| | 19.9 |
| | 19.6 |
| | 20.6 |
| | 23.0 |
| | 21.6 |
| | 21.9 |
|
| MasterCraft Boat Company, LLC/MasterCraft | | 23.3 |
| | 23.9 |
| | 21.8 |
| | 20.0 |
| | 20.5 |
| | 21.7 |
| | 21.5 |
|
| Skier's Choice, Inc./Supra and Moomba | | 16.7 |
| | 15.6 |
| | 14.7 |
| | 12.6 |
| | 12.0 |
| | 12.8 |
| | 12.2 |
|
| All others | | 12.5 |
| | 11.6 |
| | 13.1 |
| | 13.8 |
| | 12.5 |
| | 11.9 |
| | 11.4 |
|
| Total | | 100.0 | % | | 100.0 | % | | 100.0 | % | | 100.0 | % | | 100.0 | % | | 100.0 | % | | 100.0 | % |
|
| | |
(1) | | In June 2015, Correct Craft acquired majority interest in both Centurion Boats and Supreme Boats. Accordingly, market share for Ski Supreme, Centurion, and Nautique Boat Company, Inc. ("Nautique") are reflected combined here for all periods for better comparison. |
In addition, our 48% market share of performance sport boat exports to international markets for the 12 months ended March 31, 2017 was the highest among U.S. manufacturers and was more than the market share of our top two competitors combined.
#1 Market Share Position in the 24’—29’ Segment of the Sterndrive Boat Category. Our recent acquisition of Cobalt has established us as a market leader in the sterndrive category. According to SSI, our Cobalt brand holds the highest market share for sterndrive boatsposition in the 24’—29’ segment a segment that we believe isof the largest segment within the overall sterndrive boat category, by retail sales dollars. Since 2010,through our Cobalt brand according to SSI. Cobalt has expanded its market share in this segment from 14.2% in 2010 to 29.2%35.0% in 2016. The following table reflects2019. With our U.S.Pursuit brand we hold the number two market share position in the offshore boat category for calendar year 2019. Pursuit has expanded its market share in the 24’—29’this segment of the sterndrive boat category comparedfrom 17.7% in 2010 to the market share of our competitors for the periods shown (certain totals for the table below will not sum to exactly 100% due to rounding):18.8% in 2019.
|
| | | | | | | | | | | | | | | | | | | | | |
| | | U.S. Market Share in Sterndrive 24'-29' Segment |
| Manufacturer/Brand(s) | | 2010 | | 2011 | | 2012 | | 2013 | | 2014 | | 2015 | | 2016 |
| (units sold) | | | | | | | | | | | | | | |
| Cobalt Boats | | 14.2 | % | | 18.3 | % | | 18.1 | % | | 21.0 | % | | 27.0 | % | | 27.8 | % | | 29.2 | % |
| Sea Ray | | 18.6 |
| | 20.7 |
| | 20.6 |
| | 17.2 |
| | 16.6 |
| | 16.5 |
| | 15.4 |
|
| Chaparral | | 12.7 |
| | 16.7 |
| | 15.7 |
| | 18.0 |
| | 16.1 |
| | 14.9 |
| | 14.0 |
|
| Regal Boats | | 5.1 |
| | 5.9 |
| | 7.5 |
| | 8.1 |
| | 6.9 |
| | 9.3 |
| | 8.9 |
|
| Crownline | | 6.4 |
| | 6.7 |
| | 8.5 |
| | 7.5 |
| | 6.9 |
| | 7.5 |
| | 8.4 |
|
| Monterey | | 3.6 |
| | 4.9 |
| | 5.6 |
| | 6.7 |
| | 6.1 |
| | 6.4 |
| | 6.9 |
|
| All Others | | 39.4 |
| | 26.8 |
| | 24.0 |
| | 21.6 |
| | 20.4 |
| | 17.7 |
| | 17.1 |
|
| Total | | 100.0 | % | | 100.0 | % | | 100.0 | % | | 100.0 | % | | 100.0 | % | | 100.0 | % | | 100.0 | % |
Industry-leading Product Design and Innovation. We believe that our innovation in the design of new boat models and new features has been a key to our success, helping us increase our market share within our categories and generally broaden the appeal of our products among recreational boaters. As a result of the features we have introduced, we believe thatsuch as our Integrated Surf Platform which includes patented Surf Gate and Power Wedge technology along with tailored swim steps and hard tank ballast, our boats arecan be used for an increasingly wide range of activities andactivities. At the same time they are increasingly easier to use, while maintaining the highhighest level of performance characteristics that consumers expect. Additionally, by introducing new boat models across our portfolio of brands in a range of price points, sizes, bow and hull designs, engine propulsion, and optional performance features, we believe we have enhanced consumers’ ability to select a boat suited to their individual preferences. Our commitment to and consistency in, developing new boat models and introducing new features are reflected in several notable achievements, including:
release of our patented Surf Gate technology in 2012, which allows users to surf on either side of the boat’s wake, generates a better quality surf wavefact we consistently and was the WSIA Innovation of the Year in 2013;
launch of the Axis brand of boats in 2009, designed from the ground up to be an entry-level product, which has already captured a 11.3% share of the U.S. market in our category as of December 31, 2016;
evolution of our patented Power Wedge, introduced in 2006 into the industry leading Integrated Surf Platform that includes an array of exclusive Malibu technology—Power Wedge II, Surf Gate, Surf Band and Command Center—and provides our consumers with the ability to customize the size and shape of their wakes and waves;
successfulsuccessfully bring multiple new model introductions eachyear after year. For model year 2017, we launched four new Malibu models: the Malibu Wakesetter 24 MXZ, the Malibu Wakesetter 22 MXZ, and the Malibu Wakesetter 21 VLX were all launched in the summer of 2016; and the Malibu Response TXi was launched in November of 2016. For model year 2017, five new Cobalt models were launched: the Gateway Series CS1, the A Series A36, the SD-SC Series 23SC and 25SC Outboards, and the WSS Surf Series CS3WSS Surf; and
a strong new expected product lineup for model year 2018 that includes a new Axis T22, a new Axis A24, an unidentified Malibu introduction and the launch of the new Wakesetter 23 LSV. In addition, Cobalt expects to announce three new models for model year 2018.
Focus on VerticalVertical Integration Opportunities. We have vertically integrated severala number of key components of our manufacturing process, including the manufacturing of our own engines, boat trailers, towers and tower accessories, machined and billet parts, and tooling. Most recently, we announced anWe began including our engines, branded as Malibu Monsoon engines, in our Malibu and Axis boats for model year 2019. We believe our engine marinization initiative to vertically integratewill reduce our reliance on our previous engine marinizationsuppliers for our Malibu and Axis brands.brands while reducing the risk that a change in cost or production from any engine supplier for such brands could adversely affect our business. Recently we began producing soft grip flooring for our Malibu, Axis and new Cobalt models. Vertical integration of key components of our boats gives us the ability to increase incremental margin per boat sold by reducing our cost base and improving the efficiency of our manufacturing process. Additionally, it allows us to have greater control over design, consumer customization options, construction quality, and our supply chain. For example, if our engine marinization initiative is implemented, our reliance on our two engine suppliers for Malibu and Axis will be significantly diminished, reducing the risk that a change in cost or production from any engine supplier could adversely affect our business. We continually review our manufacturing process to identify opportunities for additional vertical integration investments.investments across our portfolio of premium brands.
Intellectual Property. A key element of our growth and increased market share has been our intellectual property, which we believe is the best in our industry. Among the most innovative and sought after features on our boats has been Surf Gate. Together with Power Wedge and Surf Band, we believe that these patented technologies will continue to drive demand for our
products and increased margins. Withincrease margins across our brands. In fiscal 2018 we acquired Swim Step, through our acquisition of Cobalt we have acquired additional valuable intellectual property, such as Swim Step,which further increasingincreases the appeal of our product portfolio. Consequently, there is an increased need to vigorously defend our patents and other intellectual property to ensure we maintain our competitive edge. Because of the appeal of these technologies, we have entered into agreements to license them to other manufacturers within the performance sport boat category. We believe licensing our products provides us with a significant strategic advantage over our competitors by allowing us to expand into other markets and broadening the appeal of these technologies into segments that would not otherwise have them, thereby eventually creating a path to a Malibu purchase.
Strong Dealer Network. We have worked diligently with our dealers to developcultivate one of the strongest distribution networks in the recreational powerboat industry. We believe that our Malibu and Axis brand distribution network of 146 North American dealer locations and 59 international dealer locations as of July 1, 2017 allows us to distribute our performance sport boat products more broadly and effectively than our competitors. For calendar year 2016, our Malibu and Axis brand dealers held or tied for the #1 market share position for the performance sport boat category in 70 of 119 U.S. markets. Our Cobalt distribution network includes 142 worldwide dealer locations. Of those, 22 Cobalt dealers are ranked in Boating Industry’s Top 100 Dealers survey, with six Cobalt dealers ranked in the top 10. We continually review our geographic coverage to identify opportunities for expansion and improvement, and will, where necessary, add dealer locations to address previously underserved markets or replace underperforming dealers.
Highly Recognized Brands. We believe our Malibu, Axis, Cobalt and CobaltPursuit brands are widely recognized in the recreational powerboat industry, which helps us reach a growing number of target consumers. For over 30 years, our Malibu brand has generated a loyal following of recreational boaters and water sports enthusiasts who value the brand’s premium performance and features. Ourfeatures, while our Axis brand has grown rapidly as consumers have been drawn to its more affordable price point and available optional features. Our newly-acquiredWe also acquired two well-known brands in Cobalt brandand Pursuit. Cobalt has developed into one of the industry’s most recognizable and respected brands over its 50-year history. We believe thatFor over the appeal of our superior performancepast 40 years, Pursuit has established a premium brand through its extensive dealer network and innovative products combined with our history with boating enthusiasts and professional water sports athletes contributeslongstanding commitment to our brand awareness with dealers and consumers.customers. We are able to build on thisour brand recognition and support through a series of marketing initiatives coordinated with our dealers or executed directly by us. Our marketing efforts are conducted using an array of strategies, which include digital advertising, social media engagement, advertisements in endemic media and the sponsorship of grass-roots boating and watersport events. Additionally, our boats, their innovative features, our sponsored athletes and our dealers all frequently win industry awards, which we believe further boosts our brand recognition and reputation for excellence. We believe our marketing strategies and accomplishments enhance our profile in the industry, strengthen our credibility with consumers and dealers, and increase the appeal of our brands.
Diverse Product Offering. Our acquisition of Cobalt broadens our product portfolio, allowing usWe are able to engage consumers inacross multiple categories within the recreational powerboat industry. Malibu operatesand Axis are market leaders in the performance sport boat category, controlling the highest market share. Cobalt is the market leaderoperates in the 24’—29’ segment of the sterndrive category and has recentlyalso expanded its product portfolio beyond traditional sterndrive boats with the introduction of itsinto wake surfing and outboard product lines, increasing Cobalt’s addressable market. Overall, we believe our acquisition of Cobalt diversifies our product offering and consumer base, while simultaneously building a collectively strongerPursuit competes in the saltwater outboard fishing boat manufacturer.
Compelling Marginsmarket with center console, dual console and Cash Flow. Our net income margin was 8.0% and 11.0% for fiscal years 2016 and 2017, respectively. Our adjusted EBITDA margin was 19.1% and 19.8% for fiscal years 2016 and 2017, respectively. For the definition of adjusted EBITDA margin and a reconciliation to net income, see “Item 7. Management’s Discussion and Analysis of Financial Condition and Results of Operations - GAAP Reconciliation of Non-GAAP Financial Measures.” We also produced $35.6 million and $35.9 million of net cash from operating activities for fiscal years 2016 and 2017, respectively. We have previously executed, and continue to execute, on an array of initiatives focused on reducing our costs and improving the efficiency of our manufacturing process, enabling us to maintain attractive margins and strong cash flows. These efforts include vertical integration of engines, trailers, towers and tower accessories production, giving us the ability to increase incremental margin per boat sold. In addition, our low capital expenditure requirements and highly efficient working capital cycle have allowed us to generate significant excess cash flow from operations, excluding one-time litigation costs incurred in each of fiscal years 2016 and 2017. We believe our strong cash flow increases our financial stability and provides us with more flexibility to invest in growth initiatives. We further believe our experience implementing operational improvements and vertical integration initiatives to expand margin will positively impact the performance of our recently acquired Cobalt subsidiary. Significant opportunities for operational and financial improvement exist within the Cobalt business and include sourcing and procurement, lamination, assembly processes personnel management, and vertical integration.
Highly Experienced Management Team. Our experienced management team has demonstrated its ability to navigate various economic cycles, identify, create and integrate new product innovations, improve financial performance, optimize operations, enhance our distribution model and recruit top industry talent. Our Chief Executive Officer, Jack Springer, joined Malibu Boats in 2009 and has assembled an executive team with strong, complementary talents and experience. This team has
led a workforce that we believe has produced superior results, including market share gains, sales growth and profitability improvement.offshore models.
Our Strategy
We intend to capitalize on the recovery in the recreational powerboat industry through the following strategies:
Continue to Develop New and Innovative Products in Our Categories. We intend to continue developing and introducing new and innovative products—both new boat models to better address a broader range of consumers and new features to deliver better performance, functionality, convenience, comfort and safety to our consumers. We believe that new products and features are important to the growth of our market share, the continued expansion of our categories and our ability to maintain attractive margins.
Our product development strategy consists of a two-pronged approach. First, we seek to introduce new boat models to target unaddressed or underserved segments of the recreational powerboat industry, while also updating and refreshing our existing boat models regularly. For example, we introduced Axis-branded boats starting in 2009 to address the entry-level segment of the performance sport boat category, we launched the Malibu Wakesetter MXZ product line in 2012 to enter the premium “picklefork” bow design segment of the performance sport boat category, and we released the Malibu M235 in 2016 to deliver luxury and performance in the ultra-premium segment of the performance sport boat category. Second, we seek to develop and integrate innovative new featuresor enhanced optional feature offerings into our boats, such asboats. For our Malibu and Axis brands this includes Surf Gate, Malibu Touch Command Center, Power Wedge III, Tower Mister, Fast Fill Ballast System, G5 Tower and Power Wedge. Overintegrated flip down Swim Step. For Cobalt, it includes outboard propulsion models to expand its addressable market. Cobalt has been able to achieve growth in recent years partly by pivoting and expanding into the past two years, westerndrive surfing category through its Cobalt Surf series, which now features Surf Gate. In addition, other new features have continued these strategies by introducing eightincluded Splash and Stow and a new models,electronic flip down Swim Step for model year 2021 boats. For the Pursuit brand, the focus has been on expanding our award winning Dual Console, Sport and Offshore product offerings that continue to combine innovative features and dependable performance in refined designs that accommodate a broad array of activities on the water, including three in the Axis line, and we have enhanced our optional feature offerings withElectric Sliding Entertainment Center on the new Power Wedge II and the industry’s first 12-inch touchscreen dash system. For our 2017 model year, we released the Wakesetter 22 MXZ, the Wakesetter 24 MXZ, the Wakesetter 21VLX and the Malibu Response TXi.S 378. We intend to continue releasing new products and features multiple times during the year, which we believe enhances our reputation as a leading-edge boat manufacturer and provides us with a competitive advantage. For our 2018 model year, which began July 1, 2017, we released the newly redesigned Wakesetter 23 LSV, Axis T22 and the Axis A24 and, in November 2017, we expect to launch a new Malibu model. In addition, our initiative to produce our own engines, announced in November 2016, is well underway and we expect to continue our vertical integration strategy focused on delivering better quality and value to our consumers while enhancing margins.
Our recent acquisition of Cobalt is consistent with this strategy, given Cobalt’s strong track record of producing innovative new products and refreshing existing boat models. Cobalt has established a leading market position in the sterndrive category, having progressively updated its portfolio with new models in line with emerging industry trends. In 2017, Cobalt launched a series of Cobalt-branded outboard propulsion models to expand its addressable market. Cobalt has been able to achieve growth in recent years partly by pivoting and expanding into the performance sport boat category through its new Cobalt Surf series, combining new surf features into successful preexisting CS3, R3, R5 and R7 models.
Further Strengthen Our Dealer Network. Our goal is to achieve and maintain leading market share in each of the categories in which we operate. We continually assess our distribution network and believe we take the actions necessary to achieve our goal. We intend to strengthen our current footprint by selectively recruiting market-leading dealers who currently sell our competitors’ products. In addition, we plan to continue expanding our dealer network in certain geographic areas to increase consumer access and service in strategic markets. Our recent acquisition of Cobalt improves our overall dealer network, as Cobalt distributes through a large percentage of dealers with #1 or #2 market share in their respective markets. We believe our targeted initiatives to enhance and grow our dealer network organically andacross all of our integration of Cobalt’s dealer networkbrands will increase unit sales in the future.
Continue to Seek Vertical Integration Opportunities. Over the past several years, we have focused on expanding our vertical integration capabilities, having brought in-house the production of towers and tower accessories, trailers, machined and billet parts, and, most recently, we announced an initiative to begin marinizingproducing our own engines for our Malibu and Axis brand boats. boats and soft grip flooring for our Malibu, Axis and new Cobalt models. Additional vertical integration opportunities exist across our product portfolio and we are aggressively monitoring these opportunities. With our recent acquisition of Cobalt, we believe opportunities exist to leverage Malibu’s vertical integration investments, including manufacturing towers and tower accessories, trailers, and machined and billet parts for Cobalt boats.
Selectively Pursue Strategic Acquisitions. One of our growth strategies is to drive growth in our business through targeted acquisitions that add value while considering our existing brands and product portfolio. We have focused on growth through acquisitions both domestically and abroad, as evidenced by our recentacquisition of Pursuit in October 2018, our acquisition of Cobalt in July 2017 and our October 2014 acquisition of our Australian licensee.licensee in October 2014. The primary objectives of our acquisitions are to expand our presence in new or adjacent categories, to expand into other product lines and business that may benefit from our
operating strengths, and to increase the size of our addressable market. When we identify potential acquisitions, we attempt to target companies with a leading market share, strong cash flows, and an experienced management team and workforce that provide a fit with our existing operations. After completing an acquisition, we focus on integrating the company with our existing business to provide additional value to the
combined entity through cost savings and revenue synergies, such as the optimization of manufacturing operations, improved processes around product development, enhancement of our existing dealer distribution network, administrative cost savings, shared procurement, vertical integration and cross-selling opportunities.
Accelerate International Expansion. Based on our U.S. leadership position, brand recognition, diverse, innovative product offering and distribution strengths, we believe that we are well-positioned to increase our international sales. Our 48% market share of performance sport boat exports to international markets for the twelve months ended March 31, 2017 was the highest among U.S. manufacturers and is supported by an extensive international distribution network of 59 international dealer locations for our Malibu and Axis brand boats. We believe we can increase our international sales both by promoting our products in developed markets where we have a well-established dealer base, such as Western Europe, and by penetrating new and emerging markets where we expect rising consumer incomes to increase demand for recreational products, such as Asia and South America. Our recent acquisition of Cobalt also expands the product offering that we may offer to dealers and allows us the ability to cross-sell into our existing dealer networks where appropriate.
Our Products and Brands
We design, manufacture and sell recreational powerboats, including performance sport boats, sterndrive and outboard boats thatacross four world-renowned brands: Malibu, Axis, Cobalt and Pursuit. We believe we believe deliver superior performance for general recreational purposes with a significant focus on water sports, including wakeboarding, water skiing and wake surfing. We market our boats under three brands:surfing
Malibu, our flagship brand, dates to our inception in 1982, primarily targeting consumers seeking a premium7
as well as general recreational boating experience and offering our latest innovations in performance, comfort and convenience;
Axis, which we launched as a new brand in 2009, targets a younger demographic and provides them with a more affordably priced, entry-level boat that provides high performance, functional simplicity and the option to upgrade key features; and
Cobalt, which we acquired in July 2017, has built a longstanding culture of excellence throughout its 50-year history by providing a range of luxury sterndrive and outboard boats.
fishing. In addition, we also offer various accessories and aftermarket parts.
Boat Models
We believe our boats are renowned for their performance, design, innovative technology, quality and ability to provide consumers a high-quality boating experience at varying price points. We currently offer a number of recreational powerboat models across our three brands, which provide consumers with a variety of options across length, hull type, bow type, horsepower and seating capacity in addition to customizable designs and features available for upgrade across our models. The following table provides an overview of our most popular product offerings by brand: | | | | | | | | | | | | | | | | | | | | | | | | | | |
| Brand | | Number of
Models | | Lengths | | Retail Price
Range
(In thousands) | | Description |
| Malibu | | 11 | | 20'-25' | | $60-$210 | | Founded in 1982, Malibu targets consumers seeking a premium boating experience with our latest innovations in performance, comfort and convenience. Malibu is comprised of three product lines: |
| | | | | |
Brand | | Number• Wakesetter Series - Our line of
Models
| Lengths | Propulsion Types | Bow Types | Retail Price
Range
(In thousands) highly-customizable boats offering our most innovative technologies and premium features, with the newest color options and interior finishes.
|
Malibu | 11 | 20'-25' | Inboard | Traditional, Picklefork | $50-$180 | | | • M Series - Our line of ultra-premium towboats, featuring the Malibu M240, loaded with every technologically innovative feature we offer including our Integrated Surf Platform, premium luxury interiors, most advanced helm in the industry, and our most powerful engine. |
Axis | 5 | 20’-24’ | Inboard | Traditional,
Picklefork | $50-$95 | | | • Response Series - Our line of high-performance water ski focused towboats completely redesigned in 2017. |
CobaltAxis | 18 | 20’-40’5 | Sterndrive/Outboard | Traditional20’-24’ | | $50-65-$700115 | | Launched in 2009, Axis was formed to target a younger demographic by providing a more affordably priced, high quality, entry-level boat with high performance, functional simplicity and the option to upgrade key features such as Surf Gate. Axis currently features five models. |
| Cobalt | | 16 | | 20’-36’ | | $60-$450 | | Founded in 1967, Cobalt is a premium luxury sterndrive and outboard boat manufacturer available in five product lines: |
| | | | | | | | • Gateway Series - Our entry level fiberglass sterndrive sporting the refined quality of Cobalt boats. The Gateway series is designed to allow for the comfort, convenience, and performance typically found on much larger Cobalt boats while allowing for an “athletic” use. |
| | | | | | | | • R Series - Our mid-range premium fiberglass sterndrive boat in the largest segment that has a sleek, powerful look with a smooth ride and exceptional performance. |
| | | | | | | | • A Series - Our super premium fiberglass sterndrive boat that blends yacht-like qualities with a unique, powerful look as well as a smooth ride and exceptional performance. |
| | | | | | | | • SC Series - Our line of outboard boats designed for increased saltwater durability and ease of maintenance. |
| | | | | | | | • Surf Series - Focused on watersports and based on our Gateway Series and R Series. Features a sport tower for higher tow point, storage racks, integrated billet board racks, optional tower lights, ballast, surf systems and directional speakers with a look designed to appeal to our youngercustomers |
| Pursuit | | 15 | | 22'-44' | | $80-$800 | | Launched in 1977, Pursuit is a premium brand of saltwater outboard fishing boats available in three product lines: |
| | | | | | | | • Sport Center Console Series - Our center console series provides a central helm and open hull to provide 360-degree access to thewater and is ideal forfishing. |
| | | | | | | | • Dual Console Series - Our dual console series offers a versatile design ideal for casual cruising and entertainment provided by the superior and comfortable seating yet makes for an ideal fishing boat. |
| | | | | | | | • Offshore Series - Our offshore series combines seaworthiness and fishability with the luxury of a cruiser and is designed for the conditions of the open sea and rigged with equipment for offshore fishing trips. |
Malibu Brand. Malibu is our flagship line of performance sport boats offering eleven models through three product series: the Wakesetter series, the M series, and the Response series. The Wakesetter series is our premium, top selling series designed for consumers seeking the highest-performance water sport boat and a luxury boating experience. Wakesetters offer consumers a highly-customizable boat with our most innovative technologies and premium features, with the newest color options and interior finishes. The M series, featuring the Malibu M235, is our line of ultra-premium towboats, built from the ground up by a team of our designers, engineers, and athletes, and designed to provide consumers with a seamless blend of beauty, luxury, and power. The M series is loaded with every technologically innovative feature we offer including our Integrated Surf Platform, premium luxury interiors, most advanced helm in the industry, and our most powerful engine. The Response series, completely redesigned in 2017, was designed for consumers who desire a high-performance water ski focused boat. Primarily because of its direct
drive engine setup, the Response series produces the smallest wake of any of our boats and is designed to accommodate both professional and recreational skiers by allowing for an athlete’s best performance at a range of boat speeds and line lengths.
AxisBrand. After the continued success with our Wakesetter series, we identified a market opportunity in entry-level performance sport boats and, in 2009, launched our Axis brand. We designed Axis for consumers who desire a lower price point, but who still demand high performance, functional simplicity and the option to upgrade their boats to have key features such as Surf Gate. The Axis series currently has five available models and we plan to refine these models continually as well as add new ones as we build out the brand. We believe the Axis series successfully provides consumers with a high quality water sport and boating experience at an attractive price, as evidenced by its #4 market position in the performance sport boat category after only seven years on the market.
Cobalt Brand. Cobalt is our premium line of luxury sterndrive and outboard boats available in five product lines: the Gateway Series, the R series, the A series, the SD-SC series, and the WSS/Surf Series. The Gateway series is an entry level fiberglass sterndrive boat designed for budget-conscious consumers who desire the refined quality of Cobalt boats, but at shorter lengths and a lower price point. The Gateway series is designed to allow for the comfort, convenience, and performance typically found on much larger Cobalt boats while allowing for an “athletic” use. The R series, the brand’s largest segment, is a mid-range premium fiberglass sterndrive boat constructed using a composite Kevlar and a Z-thane barrier coat that blends a sleek, powerful look with a smooth ride and exceptional performance. The combination of innovative features, performance, and design have enabled Cobalt to achieve the #1 market share with the R5. The A series is our super premium fiberglass sterndrive boat line constructed using a multi-part hull mold in composite Kevlar and with a Z-thane barrier coat that blends yacht-like qualities with a unique, powerful look as well as a smooth ride and exceptional performance. The SD-SC series includes outboard boats designed for increased saltwater durability and ease of maintenance to better penetrate saltwater markets. The WSS Surf series is an offering focused on watersports and is based on our Gateway Series and R Series featuring a sport tower for higher tow point, storage racks, integrated billet board racks, optional tower lights, ballast, surf systems and directional speakers with a look designed to appeal to our younger customers.
Innovative Features
In addition to the standard features included on all of our boats, we offer consumers the ability to upgrade our base models by adding certaina full selection of our full line of innovative optional features designed to enhance performance, functionality and the overall boating experience. We believe our innovative features drive our high average selling prices. Some of these include:
Among our most successful and most innovative has been Surf Gate.Gate. Introduced in July
2012 and initially patented in September 2013, Surf Gate is available as an optional feature on all Malibu Wakesetter models and Axis brand boats. Surf Gate has revolutionized the increasingly popular sport of wake surfing. Prior to Surf Gate, boaters needed to empty ballast tanks on one side of the boat and shift passengers around to lean the boat to create a larger, more pronounced surf-quality wake. By employing precisely engineered and electronically controlled panels, Surf Gate alleviates this time-consuming and cumbersome process, allowing boaters to easily surf behind an evenly weighted boat without the need to wait for ballast changes. Recent enhancements to Surf Gate have improved upon the system’s actuators, allowing for easier and faster transfer, as well as the installation of an indicator horn and optional light signaling, which alert riders to wave transfers. For the 2016 model year, we introduced our patented Surf Band technology that allows the rider to control the surf wave, shape, size and side. In 2013,Some of our other notable innovations include Power Wedge III, G5/GX Tower, Electronic Dashboard Controls, Swim Step, Tower Mister, Splash and Stow and TrueWave. We won the WatersportsBoating Industry Association namedMagazine's "Top Product" award for the Malibu M240 in 2020, Pursuit S 378 in 2020, Malibu 25 LSV in 2019, Surf GateBand in 2018 and for our Integrated Surf Platform ("ISP") in 2016, as well as the Boating Industry's Best New and Innovative Products in 2019 for the Cobalt A29. We have also been recognized as Sounding Trade Only Today’s “2019 Top Most Innovative Marine Companies,” and we earned the honors of "WSIA Innovation of Year" award for the Year.
Manual Wedge/Power Wedge. Our patented Manual Wedge and Power Wedge allow riders to customize their wakes by simulating up to 1,200 pounds of ballast weight in the transom of their boats. Used in conjunctionMalibu M240 M-Line Hull with Surf Gate wake surfers are able to customize the sizeFusion in 2020, Malibu Monsoon Engines in 2019 and shape of the wave. The Manual Wedge is available on all Malibu and Axis brand boats. Unlike our Manual Wedge, the Power Wedge, available exclusively on our Malibu line, is fully automated and integrated within the Malibu Touch Command system, increasing functionality and ease-of-use for the driver. Re-engineered for model year 2015, we released the Power Wedge II. It features a larger foil and a 21% surface-area increase, which equates to an additional 300 pounds of simulated ballast, for a total of 1,500 pounds of wake-creating water displacement. In addition, a new upward angle increases lift, allowing the driver to achieve a fully loaded boat planing much faster.
G3/G4 Tower. Our G3 Towers, available on Malibu brand boats, are fully customizable with speakers, power lights and racks, enhancing the overall style, performance and functionality of our boats. Our G3 Tower can easily be folded down by one person with its weightless, gas spring-assisted design, making the G3 Tower safe and easy to store. We are the only manufacturer of performance sport boats that produces towers in-house, allowing us to control this critical design element of our boats. For model year 2015, we offered a new G4 Tower featuring aerospace aluminum and an
internal honeycomb structure to provide the optimal strength-to-weight ratio, making the G4 three times more rigid than its predecessor. The new design contains automatic visible locks, a fully integrated wiring harness, Z5 Bimini compatibility, and zero pinch points. The new G4 has an aggressive design yet preserves ease of use by taking less than 30 pounds of force to lift, lower, and latch.
Electronic Dashboard Controls. Every boat in our Wakesetter series is equipped with our MaliView and Malibu Touch Command ("MTC") systems, which function as an electronic command center that enhances the driver’s experience by providing simple and quick control of all systems on board, including the Power Wedge and Surf Gate systems, rider presets, music, lighting and navigation. For the model year 2015, we were first to market with a 12-inch touchscreen. It joined our seven-inch MTC to form the display for our new Command Center giving the driver endless data in an easy-to-navigate interface. Every major feature is on the home screen, menu paths have been streamlined and each component meets IP60 water-intrusion standards. Built with more processing power, higher levels of integration, a feature-packed new operating system and powerful wireless connectivity, the new Command Center represents the most advanced screen technology available on performance sport boats.
Surf Band. Malibu’s exclusive, patented Surf Band allows a rider to strap a buoyant, hi-viz wristband and tap a simple, intuitive remote interface to take command of all aspects of the rider's surfing experience. At the same time, the interface enables the driver to monitor the rider through alerts on the electronic command center, eliminating the need for hand-signals to the spotters or driver. If the rider is wakeboarding, the Surf Band lets the rider adjust the Power Wedge II and control speed.
Swim Step. Cobalt's patented Swim Step deploys and retracts in seconds. It is outfitted in electropolished 316 stainless steel. The design provides a safe anchor for all water borne activities.
TrueWave. Every boat in Cobalt’s WSS Surf line comes with TrueWave technology, a feature that is currently patent pending. TrueWave is an automated control surf system that adjusts the bi-axis surf tabs to create the optimum surf wake either on the left or right side. TrueWave creates a fully customizable wake that provides smooth transitions, a wide push zone, and a solid pop, helping keep the boat evenly weighted and allows boaters to switch from each side in seconds without the need to re-distribute ballast and people.
2017.We also offer an array of less technological, but nonetheless value-added boat features such as gelcoat upgrades, upholstery upgrades, engine drivetrain enhancements (such as silent exhaust tips, propeller upgrades and closed cooling engine configuration), sound system upgrades, Biminibimini tops, boat covers and trailers which further increase the level of customization afforded to consumers.
Our Dealer Network
We rely on independent dealers to sell our products. We establish performance criteria that our dealers must meet as part of their dealer agreements to ensure our dealer network remains the strongest in the industry. As a member of our network, dealers in North America may qualify for floor plan financing programs, rebates, seasonal discounts, promotional co-op payments and other allowances. We believe our Malibu and Axis dealer network is the most extensive in the performance sport boat category. We recently established aIn Europe, dealers may qualify for floor plan financing program for our dealers in Europe, which weprograms. We expect this will strengthen our dealers ability to sell our products in Europe. The majorityWe believe our dealer network is the most extensive in the market.
North America
As of July 1, 2020, our Malibu and Axis dealers, including nine in our top ten markets, are exclusive to Malibu and Axis brand boats withindealer network consisted of over 250 dealer locations servicing the performance sport boat, category, highlightingsterndrive, and outboard markets strategically located throughout the commitmentU.S. and Canada. Approximately 50% of our key dealers to our boats. Similarly, many Cobalt dealers have long-standing relationships with Cobalt and derive a significant portion of their income from the Cobalt brand.
North America
In North America, we had a total of 146 dealer locations for our Malibu and Axis brands as of July 1, 2017. Of these locations, 17% sell our products exclusively, 65% are multi-line locations that only carry non-competitive brands and products and 17% sell our brands as well as other performance sport boat brands. Approximately 32% of our Malibu and Axis dealer locations have been with us, or with Cobalt and Pursuit prior to our acquisition of them, for over ten years. For calendarOur top ten dealers represented 38.5%, 39.6% and 37.8%, of our net sales for fiscal year 2016, our2020, 2019 and 2018, respectively. The top ten dealers for each of Malibu, and Axis dealers held or tied for the #1 market share position for the performance sport boat category in 70 of 119 U.S. markets. In July 2017, we acquired Cobalt and added their dealership network. OurPursuit represented approximately 45.8%, 45.3% and 82.7%, respectively, of net sales in fiscal year 2020. The top ten dealers for each segment are not the same across all segments. Sales to our dealers under common control of OneWater Marine, Inc. represented approximately 15.2%, 15.1% and 10.7% of consolidated net sales in fiscal years 2020, 2019, and 2018 respectively including approximately 7.6%, 15.7% and 34.5% of consolidated sales in fiscal year 2020 for Malibu, Cobalt distribution network includes 115 North American dealer locations. Of those, 22 Cobalt dealers are ranked in Boating Industry’s Top 100 Dealers survey, with six Cobalt dealers ranked in the top 10.and Pursuit, respectively.
We consistently review our distribution network to identify opportunities to expand our geographic footprint and improve our coverage of the market. We believe that our diverse product offering and strong market position in each region of the United States helped us capitalize on growth opportunities as our industry recovered from the economic downturn. We have the ability to opportunistically add new dealers and new dealer locations to previously underserved markets and use data and performance metrics to monitor dealer performance. We believe our outstanding dealer network allows us to distribute our products more efficiently than our competitors.
We do not have a significant concentration of sales among our dealers. For fiscal year 2017, our top ten Malibu and Axis brand dealers accounted for 40.6% of our units sold and none of our dealers accounted for more than 6.8% of our total sales volume.
We believe that our strong market position in each region of the United States will help us capitalize on growth opportunities as our industry continues to recover from the economic downturn. In particular, we expect to generate continued growth in the southwestern United States (which includes California), a region that experienced the most pronounced decline in sales of new performance sport boats and where we have our highest regional market share.
International
We have an extensive international distribution network for our Malibu, Axis, Cobalt and CobaltPursuit brands. As of July 1, 2017, we had 59 international2020, our dealer network consisted of over 100 dealer locations in 40 countries, includingthroughout Europe, Asia, Middle East, South America, South Africa, and Australia/New Zealand for our Malibu and Axis brands.Zealand. We service our independent dealers in the Australian and New Zealand markets who sell our Malibu and Axis brand boats through our Australian operations acquired in October 2014. Including our Australia operations, international unit volumes for Malibu and Axis brands accounted for approximately 9.0% and 8.0% of our total unit volume for fiscal years 2017 and 2016, respectively. Our Cobalt brand, which was acquired in July 2017, has 27 dealer locations in 24 countries, including Europe, South America, South Africa, Australia, and China.
Dealer Management
Our relationship with our dealers is governed through dealer agreements. Each dealer agreement has a finite term lasting between one and three years. Our dealer agreements also are typically terminable without cause by the dealer at any timewith 60 days’ prior notice and by us with 90 days’ prior notice.for a dealer failing to meet performance criteria. We may also generally terminate these agreements
immediately for cause upon certain events. Pursuant to our dealer agreements, the dealers typically agree to, among other things:
•represent our products at specified boat shows;
•market our products only to retail end users in a specific geographic territory;
•promote and demonstrate our products to consumers;
•place a specified minimum number of orders of our Malibu, Axis and/or Cobalt brand products during the term of the agreement in exchange for rebate or discount eligibility that varies according to the level of volume they commit to purchase;
•provide us with regular updates regarding the number and type of our products in their inventory;
•maintain a service department to service our products, and perform all appropriate warranty service and repairs; and
•indemnify us for certain claims.
Our dealer network, including all additions, renewals, non-renewals or terminations, is managed by our sales personnel. Our Malibu and Axis sales team operatesteams operate using a semi-annual dealer review process involving our senior management team. Each individual dealer is reviewed semi-annually with a broad assessment across multiple key elements, including the dealer’s geographic region, market share and customer service ratings, to identify underperforming dealers for remediation and to manage the transition process when non-renewal or termination is a necessary step. The Cobalt sales team manages their dealer network in a similar manner that is less formal than our Malibu and Axis process.
We have developed a system of financial incentives for our dealers based on customer satisfaction and achievement of best practices. Our brands employ dealer incentive programs that have been refined through decades of experience at each brand and may, from time to time, include the following elements:
•Rebates and DiscountDiscounts. Our domestic dealers agree to annual commitment volumesvolume commitments that places each dealer into a certain rebateare used to determine applicable rebates or discount tier and determines its prospective rebate or discount amount.discounts. The structure of the dealer incentive depends on the brand represented. If a dealer meets its annual commitment volume commitments as well as other terms of the rebatedealer performance program, the dealer is entitled to the specified amounts subject to full compliance with our programs. Failure to meet the commitment volume or other terms of the program may result in partial or complete forfeiture of the dealer’s rebate or discount.
•Co-op. Dealers of the Malibu, Axis and AxisPursuit product line may earn certain co-op reimbursements upon reaching a specified level of qualifying expenditures.
•Free flooring. Our dealers that take delivery of current model year boats in the offseason, typically July through spring,April, are entitled to have us pay the interest to floor the boat until the earlier of (1) the retail sale of the unit or (2) a date near the end
of the current model year. This program is an additional incentive to encourage dealers to order in the offseason and helps us balance our seasonal production.
Our dealer incentive programs are also structured to promote more evenly distributed ordering throughout the fiscal year, which allows us to achieve better level-loading of our production and thereby generate plant operating efficiencies. In addition, these programs may offer further rewards for dealers who are exclusive to our brands.
Floor Plan Financing
Our North American dealers often purchase boats through floor plan financing programs with third-party floor plan financing providers. During fiscal year 2017, approximately 88%2020, approximately 85% of our domesticNorth American shipments were made pursuant to floor plan financing programs through which our dealers participate. These programs allow dealers across our brands to establish lines of credit with third-party lenders to purchase inventory. Under these programs, a dealer draws on the floor plan facility upon the purchase of our boats and the lender pays the invoice price of the boats. As is typical in our industry, we have entered into repurchase agreements with certain floor plan financing providers to our dealers. Under the terms of these arrangements, in the event a lender repossesses a boat from a dealer that has defaulted on its floor financing arrangement and is able to deliver the repossessed boat to us, we are obligated to repurchase the boat from the lender. Our obligation to repurchase such repossessed products for the unpaid balance of our original invoice price for the boat is subject to reduction or limitation based on the age and condition of the boat at the time of repurchase, and in certain cases by an aggregate cap on repurchase obligations associated with a particular floor financing program.
Our exposure under repurchase agreements with third-party lenders is mitigated by our ability to reposition inventory with a newnew dealer in the event that a repurchase event occurs. The primary cost to us of a repurchase event is any margin loss on the
resale of a repurchased unit. Historically, we have been able to resell repurchased boats at an amount that exceeds our cost. In addition, the historical margin loss on the resale of a repurchased unit, which isunits has often less thanbeen below 10% of the repurchaserepurchased amount. For fiscal year 2017,2020, we repurchased two units from a lender of one of our former dealers and those units were subsequently resold in fiscal year 2020 above their cost and at a minimal margin loss. For fiscal year 2019, we repurchased eight units from a lender of two of our former dealers and those units were subsequently resold in fiscal year 2020 above their cost and at minimal margin loss. For fiscal year 2018, we did not repurchase any boats under our repurchase agreements.
Marketing and Sales
We believe that providing a high level of service to our dealers and end consumers is essential to maintaining our reputation. Our sales personnel receive training on the latest Malibu, Axis, Cobalt, and CobaltPursuit products and technologies, as well as training on our competitors’ products and technologies, and attend trade shows to increase their market knowledge. This training is then passed along to our dealers to ensure a consistent marketing message and leverage our marketing expenditures. Malibu, Axis, Cobalt and CobaltPursuit enjoy strong brand awareness, as evidenced by our substantial market share in their respective categories.
Our marketing strategy focuses on strengthening and promoting the Malibu and Axis brands in the performance sport boat marketplace and the Cobalt brandand Pursuit brands in the outboard and sterndrive marketplaces. In addition to the Malibu, Axis, Cobalt, and CobaltPursuit websites and traditional marketing channels such as print advertising and tradeshows, we maintain an active digital advertising and social media platform for all brands, including use of Facebook and Twitter to increase brand awareness, foster loyalty and build a community of users. In addition, we benefit from various Malibu, Axis, Cobalt Malibu and AxisPursuit user-generated videos and photos that are uploaded to websites including YouTube, Vimeo and Instagram. As strategies and marketing plans are developed for our brands and our products, our internal marketing and communications group works to ensure brand cohesion and consistency. We believe that our marketing initiatives, as well as our strategic focus on product innovation, performance and quality attracts aspiring and enthusiast consumers to our brands and products.
Another element of our marketing strategy for the performance sport boat category involves specialized promotions at competitive water sports events, and individual and team sponsorships. Our leading position in the performance sport boat category is supported by our sponsorship of some of the most prestigious water sports competitions, including the Malibu Evolution Pro Series, Malibu Open and in conjunction with the World Wide Wake Association, the Malibu Riders Experience, which we believe positively influences the purchasing habits of enthusiasts and other consumers seeking high-performance products. These events feature some of the most popular figures in water sports, drawing large audiences of enthusiasts to a variety of sites around the country. Further, these events are focused on fan and retail consumer engagement and offer interactive, experiential opportunities for consumers to experience watersports behind our product. To aid in driving brand awareness we also sponsor a team of elite male and female athletes from the professional water sports tours. Team Malibu includes legendary wakeboarders such Raphael Derome and Tarah Mikacich, along with World Wakeskate Champion and two-time Masters Champion Brian Grubb. Additionally, leading members of the team are World Champion waterskiers Thomas Degaspari and World Record Holder Regina Jaquess. The Axis Wake Research Pro Team includes watersports legends like King of the Cable, Best Wake Park Rider, and Wake Park World Series Champion Tom Fooshee. We believe that the performance of our products has been demonstrated by, and our brands benefit from, the success of professional athletes who use our products.
Further, the Cobalt brand has engaged in a year-long marketing campaign to celebrate its 50th anniversary in 2017.
Product Development and Engineering
We are strategically and financially committed to innovation, as reflected in our dedicated product development and engineering groupteams located in Tennessee, Kansas, California, and Florida and evidenced by our track record of new product introduction. Our product development and engineering group spans both our Tennessee headquarters and our Kansas and California facilities and comprises 20 professionals. These individuals bring to our product development efforts significant expertise across core disciplines, including boat design, trailer design, computer-aided design, electrical engineering and mechanical engineering. They are responsible for execution of all facets of our new product strategy, including designing new and refreshed boat models and new features, engineering these designs for manufacturing and integrating new features into our boats. In addition, our Chief Executive Officer and Chief Operating Officer are actively involved in the product development process and integration into manufacturing.
We take a disciplined approach to the management of our product development strategy. We use a formalized phase gate process, overseen by a dedicated project manager, to develop, evaluate and implement new product ideas for both boat models and innovative features. Application of the phase gate process requires management to establish an overall timeline that is sub-divided into milestones, or “gates,” for product development. Setting milestones at certain intervals in the product development process ensures that each phase of development occurs in an organized manner and enables management to become aware of and address any issues in a timely fashion, which facilitates on-time, on-target release of new products with expected return on investment. Extensive testing and coordination with our manufacturing group are important elements of our product development process, which we believe enable us to minimize the risk associated with the release of new products. Our phase gate process also facilitates our introduction of new boat models and features throughout the year, which we believe provides us with a competitive advantage in the marketplace. Finally, in addition to our process for managing new product introductions in a given fiscal year, we also engage in longer-term product life cycle and product portfolio planning.
Manufacturing
OurMalibu has five manufacturing efforts are led by our Chief Operating Officer, who brings more than 30 years of experiencefacilities located in the manufacture offour U.S. states and Australia. We produce performance sport boats. We manufactureboats through our Malibu and Axis boatsbrands at both our Tennessee and Australia manufacturing facilities and sterndrive and outboard boats through our Cobalt boatsbrand at our Kansas facility.manufacturing facility and our Pursuit brand in Fort Pierce, Florida. We completed expansion projects at our facilities in Kansas and Florida during fiscal year 2020. For our Malibu and Axis brands, we manufacture towers, tower accessories and stainless steel and aluminum billet for our Malibu and Axis brands at our California facility. We manufacturerfacility and engines and trailers at our Tennessee facility for our Malibu and Axis brands.
Malibu and Axisfacility.
Our Malibu and Axis boats are built through a continuous flow manufacturing process that encompasses fabrication, assembly, quality management and testing. Each boat is produced over a seven-dayon an established cycle depending on model that includes the fabrication of the hull and deck through gelcoat application and fiberglass lamination, grinding and hole cutting, installation of components, rigging, finishing, detailing and on-the-water testing. Production of cruisers occurs on a dedicated line that allows for the increased time needed to add the additional content required for production of larger boats. Trailers are also produced in a continuous flow manufacturing process involving cutting and bending of the main frame from raw top grade carbon steel,
painting using our state of the art system and installation of components. We manufacture certain components and subassemblies for our boats, such as upholstery, stainless steel and aluminum billet and towers. We procure other components, such as engines and electronic controls, from third-party vendors and install them on the boat.
We acquired As noted elsewhere, we are marinizing our tower and tower accessory manufacturing capabilityown engines for our Malibu and Axis brands. Our tower-related manufacturing in 2009 through the acquisition of certain assets of Titan Wake Accessories, which had been one of our suppliers. Tower-related manufacturing occurs in our Merced-based machine shop, where we useCalifornia uses multiple computer-controlled machines to cut all of the aluminum parts required for tower assembly. We are the only performance sport boat company that manufacturers towers in-house. We believe that the vertical integration of these components is a distinct competitive advantage that allows us to control key design elements of our boats and generate higher margins.
We focus on worker safety in our operations. From July 1, 2012 to June 30, 2017, we recorded 3,812,460 consecutive man-hours with only two lost-time accidents, an accomplishment that has reduced workers’ compensation claims and warranty costs, as our most experienced employees continue to remain on the job.
Cobalt
All Cobalt boats, except cruiser boats, are built through a continuous flow manufacturing process that encompasses fabrication, assembly, quality management and testing. Each boat is produced over a 14 day cycle that includes the fabrication of the hull and deck through gelcoat application and fiberglass lamination, grinding and hole cutting, installation of components, rigging, finishing, detailing and in-water testing. Production of cruisers occurs on a dedicated line that allows for
the increased time needed to add the additional content required for production of larger boats. Our plan to integrate Cobalt includes the integration of best practices that will be shared across facilities. We expect bidirectional flow of best practices over the coming years to enhance Cobalt’s operations, as well as Malibu’s operations.
We are committed to continuous improvement in our operations, and we believe our efforts in this regard have resulted in higher gross margins. Specifically, we have increased labor efficiency and reduced cost of materials and reduced warranty claims.materials. Our production engineers evaluate and seek to optimize the configuration of our production line given our production volumes and model mix. We use disciplined mold maintenance procedures to maintain the usable life of our molds and to reduce surface defects that would require rework. We have instituted scrap material reduction and recovery processes, both internally and with our supplier base, helping to manage our material costs. Finally, we have implemented a quality management system to ensure that proper procedures and control measures are in place to deliver consistent, high-quality product, especially as our production volumes have increased.
Suppliers
We purchase a wide variety of raw materials from our supplier base, including resins, fiberglass, hydrocarbon feedstocks and steel, as well as product parts and components, such as engines and electronic controls, through a sales order process.
We have not experienced any material shortages in any of our raw materials, product parts or components. Temporary shortages, when they do occur, usually involve manufacturers of these products adjusting model mixes, introducing new product lines or limiting production in response to an industry-wide reduction in boat demand.
The most significant component used in manufacturing our boats, based on cost, are engines. We maintain a strong and long-standing relationship with our primary supplier of engines from whom we purchased approximately 64% of our engines for fiscal year 2017, and we have also developed a relationship with a second supplier from whom we sourced approximately 36% of our engines for fiscal year 2017. As is typical in our industry, our engine suppliers are marinizers of engines that they procure from larger engine block manufacturers, such as General Motors Corporation.
As a further step inThrough our vertical integration strategy,initiative to marinize our own engines, we entered into an engine supply agreement with General Motors LLC (“General Motors”) in November 2016 for the supply of enginesengine blocks to us for use in our Malibu and Axis brand boats beginning as early aswhich began in our model year 2019 and will continue through model year 2023. We will be solely responsible for integrating the engines for marine use. We intend to continue to purchase engines from our two current suppliers for at least model years 2017 and 2018. We adopted this strategy in order to more directly control product path (design, innovation, calibration and integration) of our largest dollar procured part, to differentiate our product from our competitors, and to increase our ability to respond to ongoing changes in the marketplace.
Pursuant to the engine supply agreement, we will submit purchase orders for engines to General Motors and, so long as we are not in breach of the engine supply agreement, General Motors will deliver engines pursuant to the purchase orders. No minimum amount of engines is required to be ordered by us and the parties must discuss any potential capacity increases above 7,000 engines annually.
The engine supply agreement will expire on November 14, 2023, unless terminated earlier by either party as permitted under the terms of the agreement. General Motors may terminate the engine supply agreement due to market conditions with at least eighteen (18) months’ advanced written notice. Either party may terminate the agreement as a result of a change of control of Malibu Boats, Inc., as defined in the agreement, with at least eighteen (18) months’ advanced written notice. Either party may also terminate the engine supply agreement due to breach of the other party upon written notice and after providing 60 days to cure any breach. General Motors may also suspend engine deliveries to Malibu Boats in the event of a force majeure, as defined in the engine supply agreement.
General Motors will provide up to a one-year warranty on the engines supplied to us and we have agreed to indemnify General Motors for claims and costs arising from or relating to the engines resulting from our actions.
In September 2019, in response to the United Auto Workers' ("UAW") strike against General Motors, we entered into purchase agreements with two suppliers for additional engines to supplement our inventory as General Motors suspended delivery of engine blocks to us during the UAW strike. These agreements were fulfilled and completed during fiscal year 2020 and we have since continued the agreement with General Motors once their operations resumed after the labor strike.
In August 2018, in connection with our acquisition of Pursuit, we entered into a joint marketing agreement with Yamaha Motor Corporation, U.S.A., or Yamaha. Under our agreement with Yamaha, in exchange for certain incentives we have agreed to purchase Yamaha outboard engines for use in at least 90% of all Pursuit and Cobalt branded boats that are pre-equipped with outboard motors when sold by us. We must pay penalties to Yamaha if we do not achieve pre-determined purchase volume targets for each year of the agreement and for the entire term of the agreement, which is scheduled to expire on June 30, 2023, unless renewed by both parties. No such penalties have been paid to date.
We have not experienced any material shortages in any of our raw materials, product parts or components. Temporary shortages, when they do occur, usually involve manufacturers of these products adjusting model mixes, introducing new product lines or limiting production in response to an industry-wide reduction in boat demand.
Insurance and Product Warranties
We carry various insurance policies, including policies to cover general products liability, workers’ compensation and other casualty and property risks, to protect against certain risks of loss consistent with the exposures associated with the nature and scope of our operations. Our policies are generally based on our safety record as well as market trends in the insurance industry and are subject to certain deductibles, limits and policy terms and conditions.
Effective for model year 2016, we began providingOur Malibu and Axis brand boats have a limited warranty for a period up to five years for both Malibu and Axis brand boats. For model years prior to 2016, we provided a limited warranty for a period of up to three years for our Malibuyears. Our Cobalt brand boats and two years for our Axis boats. During the warranty period, we reimburse dealers and Malibu Boats
authorized service facilities for all or a portion of the cost of repair or replacement performed on the products (mainly composed of parts or accessories provided by us and labor costs incurred by dealers or Malibu Boats authorized service facilities). Some materials, components or parts of the boat that are not covered by our limited product warranties are separately warranted by their manufacturers or suppliers. These other warranties include warranties covering engines and other components. For Cobalt boats, we providehave (1) a structural warranty of up to ten years which covers hull/the hull, deck joints, bulkheads, floor, transom, stringers, and motor mount. In addition, we providemount, and (2) a five year bow-to-stern warranty on all components manufactured or purchased (excluding hull and deck structural components), including canvas and upholstery. Gelcoat is covered up to three years. Like ouryears for Cobalt and one year for Malibu and Axis brands, someAxis. Pursuit brand boats have a (1) limited warranty for a period of up to five years on structural components such as the hull, deck and defects in the gelcoat surface of the hull bottom, and (2) a bow-to-stern warranty of two years (excluding hull and deck structural components). For each boat brand, there are certain materials, components or parts of the boat that are not covered by our limited product warrantieswarranty and certain components or parts that are separately warranted by their manufacturersthe manufacturer or suppliers. These other warranties include warranties covering enginessupplier (such as the engine). Engines that we manufacture for Malibu and other components.Axis models have a limited warranty of up to five years or five-hundred hours.
Intellectual Property
We rely on a combination of patent, trademark and copyright protection, trade secret laws, confidentiality procedures and contractual provisions to protect our rights in our brand, products and proprietary technology. This is an important part of our business and we intend to continue protecting our intellectual property. We currently hold 2336 U.S. patents, four Australian patents, one Canadian patent and fiveone Japanese patent. We also have eight pending U.S. patent applications.applications and one pending European patent application.
We own 3245 registered trademarks in various countries around the world.world, including 21 U.S. trademarks, five Australian trademarks, six Canadian trademarks and three European trademarks, all owned by Malibu. Additionally, Cobalt owns six U.S. trademarks and Pursuit owns four U.S. trademarks. Such trademarks may endure in perpetuity on a country-by-country basis, provided that we comply with all statutory maintenance requirements, including continued use of each trademark in each such country. We currently do not own any registered copyrights.also have nine pending trademark applications in the U.S.
Competition
The recreational powerboat industry, including the performance sport boat, sterndrive and outboard categories, is highly competitive for consumers and dealers. Competition affects our ability to succeed in the markets we currently serve and new markets that we may enter in the future. We compete with several large manufacturers that may have greater financial, marketing and other resources than we do. We compete with large manufacturers who are represented by dealers in the markets in which we now operate and into which we plan to expand. We also compete with a wide variety of small, independent manufacturers. Competition in our industry is based primarily on brand name, price and product performance. For more information, see Item 1A. “Risk Factors—Risks Related to Our Business—Our industry is characterized by intense competition, which affects our sales and profits.”
Environmental, Safety and Regulatory Matters
Our operations and products are subject to extensive environmental, health and safety regulation under various federal, commonwealth, state, and local statutes, ordinances, rules and regulations in the United States and Australia where we manufacture our boats, and in other foreign jurisdictions where we sell our products. We believe we are in material compliance with those requirements. However, we cannot be certain that costs and expenses required for us to comply with such requirements in the future, including for any new or modified regulatory requirements, or to address newly discovered environmental conditions, will not have a material adverse effect on our business, financial condition, operating results, or cash flow. The regulatory programs to which we are subject include the following:
Hazardous Materials and Waste
Certain materials used in our manufacturing, including the resins used in production of our boats, are toxic, flammable, corrosive or reactive and are classified as hazardous materials by the national, state and local governments in those jurisdictions where we manufacture our products. The handling, storage, release, treatment and recycling or disposal of these substances and wastes from our operations are regulated in the United States by the United States Environmental Protection Agency (“USEPA”), and state and local environmental agencies. The handling, storage, release, treatment and recycling or disposal of these substances and wastes from our operations are regulated in Australia by the Australian Department of Environment and Energy, the New South Wales EPAEnvironmental Protection Agency and other state and local authorities. Failure by us to properly handle, store, release, treat, recycle or dispose of our hazardous materials and wastes could result in liability for us, including
fines, penalties, or obligations to investigate and remediate any contamination originating from our operations or facilities. We are not aware of any material contamination at our current or former facilities for which we could be liable under environmental laws or regulations, and we currently are not undertaking any remediation or investigation activities in connection with any contamination. Future spills or accidents or the discovery of currently unknown conditions or non-compliance could, however, could give rise to investigation and remediation obligations or related liabilities.
Air Quality
In the United States, the federal Clean Air Act (“CAA”) and corresponding state and local laws and rules regulate emissions of air pollutants. Because our manufacturing operations involve molding and coating of fiberglass materials, which involves the emission of certain volatile organic compounds, hazardous air pollutants, and particulate matter, we are required to maintain and comply with a CAA operating permit (Title V permit) for our Tennessee, facilityKansas and Florida facilities and local air permits for our California facilities. Our air permits generally require us to monitor our emissions and periodically certify that our emissions are within specified limits. To date, we have not had material difficulty complying with those limits.
The USEPA and the California Air Resources Board (“CARB”) have adopted regulations stipulating that many marine propulsion engines and watercraft meet certain air emission standards. Some of these standards require fitting a catalytic converter to the engine. These regulations also require, among other things, that engine manufacturers provide a warranty that their engines meet USEPA and CARB emission standards. The engines used in our products are subject to these regulations. CARB also recently adopted an evaporative emissions regulation that applies to all MY 2018 spark-ignition marine watercraft with permanently installed fuel tanks sold in California. The new regulation requires subject boat manufacturers to use specific CARB-certified components for the fuel systems in their boats, or to certify the boat meets a related performance standard. The USEPA and CARB emissions regulations have increased the cost to manufacture our products.
OSHA
In the United States, the Occupational Safety and Health Administration (“OSHA”) standards address workplace safety generally, and limit the amount of emissions to which an employee may be exposed without the need for respiratory protection or upgraded plant ventilation. Our facilities are regularly inspected by OSHA and by state and local inspection agencies and departments. We believe that our facilities comply in all material aspects with these regulations. Although capital expenditures related to compliance with environmental and safety laws are expected to increase, we do not currently anticipate any material expenditure will be required to continue to comply with existing OSHA environmental or safety regulations in connection with our existing manufacturing facilities.
At our New South Wales, Australia (“NSW”) facility, employee health and safety is regulated by SafeWork NSW, which also has requirements that limit the amount of certain emissions to which an employee may be exposed without the need for respiratory protection or upgraded plant ventilation. In addition, SafeWork NSW provides licensing and registration for potentially dangerous work, investigates workplace incidents, and enforces work health and safety laws in NSW. Our NSW facilities are regularlycan be routinely inspected by SafeWork NSW. We believe that our facilities comply in all material aspects with these requirements.
Boat Design and Manufacturing Standards
Powerboats sold in the United States must be manufactured to meet the standards of certification required by the United States Coast Guard. In addition, boats manufactured for sale in the European Community must be certified to meet the European Community’s imported manufactured products standards. These certifications specify standards for the design and construction of powerboats. We believe that all of our boats meet these standards. In addition, safety of recreational boats in the United States is subject to federal regulation under the Boat Safety Act of 1971, which requires boat manufacturers to recall products for replacement of parts or components that have demonstrated defects affecting safety. We have instituted recalls for defective component parts produced by certain of our third-party suppliers.suppliers, including a recall on our fuel pumps supplied by a third party during fiscal year 2019. None of theour recalls hashave had a material adverse effectimpact on our Company.us.
Employees
As of July 31, 2017,2020, 2019 and 2018, we employed 1,244 people, 492 of whom work at our facilities in Tennessee, 640 of whom work at our Cobalt facilities in Kansas, 43 of whom work at our California site, 64 of whom work at our Australia facilityhad approximately 1,795, 1,835 and five who work remotely. As of July 31, 2017, approximately 13.5%1,345 employees worldwide, respectively. None of our employees were salaried and 86.5% were hourly workers. As of June 30, 2017 and 2016, we had 586 and 540 employees, respectively.are party to a collective bargaining agreement. We believe we maintain excellentthat our relations with our employees.employees are good.
Organizational Structure
Malibu Boats, Inc. was incorporated as a Delaware corporation on November 1, 2013 in anticipation of our IPO to serve as a holding company that owns only an interest in Malibu Boats Holdings, LLC. Immediately after the completion of our IPO and
the recapitalization we completed in connection with our IPO, Malibu Boats, Inc. held approximately 49.3% of the economic interest in the LLC, which has since increased to approximately 93.4%96.6% of the economic interest in the LLC as of June 30, 2017.2020.
The certificate of incorporation of Malibu Boats, Inc. authorizes two classes of common stock, Class A Common Stock and Class B Common Stock. Holders of our Class A Common Stock and our Class B Common Stock have voting power over
Malibu Boats, Inc., the sole managing member of the LLC, at a level that is consistent with their overall equity ownership of our business. In connection with our IPO and the recapitalization we completed in connection with our IPO, Malibu Boats, Inc. issued to each pre-IPO owner, for nominal consideration, one share of Class B Common Stock of Malibu Boats, Inc., each of which provides its owner with no economic rights but entitles the holder to one vote on matters presented to stockholders of Malibu Boats, Inc. for each LLC Unit held by such holder. Pursuant to our certificate of incorporation and bylaws, each share of Class A Common Stock entitles the holder to one vote with respect to each matter presented to our stockholders on which the holders of Class A Common Stock are entitled to vote. Each holder of Class B Common Stock is entitled to the number of votes equal to the total number of LLC units held by such holder multiplied by the exchange rate specified in the exchange agreement with respect to each matter presented to our stockholders on which the holders of Class B Common Stock are entitled to vote. Accordingly, the holders of LLC Units collectively have a number of votes that is equal to the aggregate number of LLC Units that they hold. As the LLC members sell LLC Units to us or subsequently exchange LLC Units for shares of Class A Common Stock of Malibu Boats, Inc. pursuant to the exchange agreement described below, the voting power afforded to them by their shares of Class B Common Stock is automatically and correspondingly reduced. Subject to any rights that may be applicable to any then outstanding preferred stock, our Class A and Class B Common Stock vote as a single class on all matters presented to our stockholders for their vote or approval, except as otherwise provided in our certificate of incorporation or bylaws or required by applicable law. In addition, subject to preferences that may apply to any shares of preferred stock outstanding at the time, the holders of our Class A Common Stock are entitled to share equally, identically and ratably in any dividends or distributions (including in the event of any voluntary or involuntary liquidation, dissolution or winding up of our affairs) that our board of directors may determine to issue from time to time, while holders of our Class B Common Stock do not have any right to receive dividends or other distributions.
As noted above, Malibu Boats, Inc. is a holding company with a controlling equity interest in the LLC. Malibu Boats, Inc., as sole managing member of the LLC, operates and controls all of the business and affairs and consolidates the financial results of the LLC. The limited liability company agreement of the LLC provides that it may be amended, supplemented, waived or modified by the written consent of Malibu Boats, Inc., as managing member of the LLC, in its sole discretion without the approval of any other holder of LLC Units, except that no amendment may materially and adversely affect the rights of a holder of LLC Units, other than on a pro rata basis with other holders of LLC Units, without the consent of such holder (unless more than one holder is so affected, then the consent of a majority of such affected holders is required). Pursuant to the limited liability company agreement of the LLC, Malibu Boats, Inc. has the right to determine when distributions (other than tax distributions) will be made to the members of the LLC and the amount of any such distributions. If Malibu Boats, Inc. authorizes a distribution, such distribution will be made to the members of the LLC (including Malibu Boats, Inc.) pro rata in accordance with the percentages of their respective LLC Units.
The diagram below depicts our current organizational structure, as of June 30, 2017:
2020:

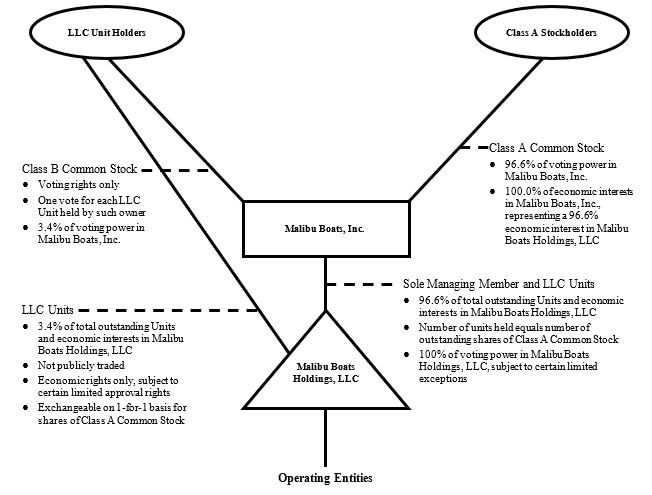
Our organizational structure allows the LLC members to retain their equity ownership in the LLC, an entity that is classified as a partnership for U.S. federal income tax purposes, in the form of LLC Units. Holders of Class A Common Stock, by contrast, hold their equity ownership in Malibu Boats, Inc., a Delaware corporation that is a domestic corporation for U.S. federal income tax purposes, in the form of shares of Class A Common Stock. The holders of LLC Units, including Malibu Boats, Inc., will incur U.S. federal, state and local income taxes on their proportionate share of any taxable income of the LLC. Net profits and net losses of the LLC will generally be allocated to the LLC’s members (including Malibu Boats, Inc.) pro rata in accordance with the percentages of their respective limited liability company interests. The limited liability company agreement provides for cash distributions to the holders of LLC Units if Malibu Boats, Inc. determines that the taxable income of the LLC will give rise to taxable income for its members. In accordance with the limited liability company agreement, we intend to cause the LLC to make cash distributions to the holders of LLC Units for purposes of funding their tax obligations in respect of the income of the LLC that is allocated to them. Generally, these tax distributions will be computed based on our estimate of the taxable income of the LLC allocable to such holder of LLC Units multiplied by an assumed tax rate equal to the highest effective marginal combined U.S. federal, state and local income tax rate prescribed for an individual or corporate resident in Los Angeles, California (taking into account the nondeductibility of certain expenses and the character of our income). For purposes of determining the taxable income of the LLC, such determination will be made by generally disregarding any adjustment to the taxable income of any member of the LLC that arises under the tax basis adjustment rules of the Internal Revenue Code of 1986, as amended, or the Code and is attributable to the acquisition by such member of an interest in the LLC in a sale or exchange transaction.
Exchanges and Other Transactions with Holders of LLC Units
In connection with our IPO and the recapitalization we completed in connection with our IPO, we entered into an exchange agreement with the pre-IPO owners of the LLC under which (subject to the terms of the exchange agreement) each pre-IPO owner (or its permitted transferee) has the right to exchange its LLC Units for shares of our Class A Common Stock on a one-
for-oneone-for-one basis, subject to customary conversion rate adjustments for stock splits, stock dividends and reclassifications, or, at our option, except in the event of a change in control, for a cash payment equal to the market value of the Class A Common Stock. The exchange agreement provides, however, that such exchanges must be for a minimum of the lesser of 1,000 LLC Units, all
of the LLC Units held by the holder, or such amount as we determine to be acceptable. The exchange agreement also provides that an LLC member will not have the right to exchange LLC Units if Malibu Boats, Inc. determines that such exchange would be prohibited by law or regulation or would violate other agreements with Malibu Boats, Inc. to which the LLC member may be subject or any of our written policies related to unlawful or insider trading. The exchange agreement also provides that Malibu Boats, Inc. may impose additional restrictions on exchanges that it determines to be necessary or advisable so that the LLC is not treated as a “publicly traded partnership” for U.S. federal income tax purposes. In addition, pursuant to the limited liability company agreement of the LLC, Malibu Boats, Inc., as managing member of the LLC, has the right to require all members of the LLC to exchange their LLC Units for Class A Common Stock in accordance with the terms of the exchange agreement, subject to the consent of the holders of a majority of outstanding LLC Units other than those held by Malibu Boats, Inc.
As a result of exchanges of LLC Units into Class A Common Stock and purchases by Malibu Boats, Inc. of LLC Units from holders of LLC Units, Malibu Boats, Inc. will become entitled to a proportionate share of the existing tax basis of the assets of the LLC at the time of such exchanges or purchases. In addition, such exchanges and purchases of LLC Units are expected to result in increases in the tax basis of the assets of the LLC that otherwise would not have been available. These increases in tax basis may reduce the amount of tax that Malibu Boats, Inc. would otherwise be required to pay in the future. These increases in tax basis may also decrease gains (or increase losses) on future dispositions of certain capital assets to the extent tax basis is allocated to those capital assets. We have entered into a tax receivable agreement with the pre-IPO owners (or their permitted assignees) that provides for the payment by Malibu Boats, Inc. to the pre-IPO owners (or their permitted assignees) of 85% of the amount of the benefits, if any, that Malibu Boats, Inc. is deemed to realize as a result of (1) increases in tax basis and (2) certain other tax benefits related to our entering into the tax receivable agreement, including tax benefits attributable to payments under the tax receivable agreement. These payment obligations are obligations of Malibu Boats, Inc. and not of the LLC.
Available Information
Our Annual Report on Form 10-K, Quarterly Reports on Form 10-Q, Current Reports on Form 8-K and amendments to reports filed or furnished pursuant to Sections 13(a) and 15(d) of the Securities Exchange Act of 1934, as amended, or the Exchange Act are available on our web site at www.malibuboats.com, free of charge, as soon as reasonably practicable after the electronic filing of these reports with, or furnishing of these reports to, the Securities and Exchange Commission, or the SEC. Any materials we file with the SEC are available at the SEC’s Public Reference Room at 100 F Street, NE, Washington, DC 20549. Additional information about the operation of the Public Reference Room can also be obtained by calling the SEC at 1-800-SEC-0330. In addition, the SEC maintains a web site at www.sec.gov that contains reports, proxy and information statements, and other information regarding issuers that file electronically with the SEC, including us.
Item 1A. Risk Factors
The following describes the risks and uncertainties that could cause our actual results to differ materially from those presented in our forward-looking statements. The risks and uncertainties described below are not the only ones we face but do represent those risks and uncertainties that we believe are material to us. Additional risks and uncertainties not presently known to us or that we currently deem immaterial may also harm our business.
Risks Related to Our Business
GeneralThe COVID-19 pandemic is adversely affecting, and is expected to continue to adversely affect, our operations, and those of our dealers and suppliers, thereby adversely affecting our business, financial condition and results of operations.
The COVID-19 pandemic has significantly impacted health and economic conditions throughout the United States and the world. Consumer fear about becoming ill with the virus and recommendations and/or mandates from federal, state and local authorities to avoid large gatherings of people or self-quarantine have been imposed.
We suspended operations at all of our facilities on March 24, 2020. We resumed operations at our Loudon, Tennessee facility (Malibu and Axis boats) on April 20, 2020, our Neodesha, Kansas facility (Cobalt boats) on April 27, 2020 and our Fort Pierce, Florida facility (Pursuit boats) on May 4, 2020. Our temporary closure resulted in a reduction in our production of boats that we were not able to fully recover during fiscal year 2020 and resulted in corresponding delays for delivery of our boats to dealers. As a result, our net sales and unit volume decreased 39.1% and 43.9%, respectively, during the fourth quarter of fiscal year 2020 compared to the fourth quarter of fiscal year 2019. For the fiscal year ended June 30, 2020, we recognized a decrease in net sales of $30.9 million, or 4.5%, and a decrease of 918 units, or 12.5%, in unit volume compared to fiscal year 2019.
While a number of government measures and recommendations have since been lifted or scaled back since the beginning of the pandemic, intermittent or sustained resurgence of COVID-19 in the United States may result in the reinstatement of certain restrictions or voluntary operational halts in response to efforts to reduce the spread of COVID-19. It is unclear how long these restrictions or halting of operations may remain in place and they may remain in place in some form for an extended period of time. As a result, our manufacturing facilities, our dealers, or our suppliers may have to suspend operations again, whether voluntarily or as a result of federal, state or local mandates, and such closures could extend for a longer term than the prior shutdown of our facilities. If such shutdowns occur, the COVID-19 pandemic could negatively impact our financial results in fiscal year 2021.
While we cannot predict the ultimate impact of the COVID-19 virus on our business at this time, the pandemic and related efforts to mitigate the pandemic have impacted and may continue to impact our business in a number of ways, including but not limited to:
•decreasingconsumerconfidenceasaresultoftheeconomicimpactofthepandemic,whichcouldresultinadecrease in consumer demand for recreationalboats;
•disruptingourmanufacturingprocesses,ashasalreadyoccurredwiththetemporaryclosuresofourfacilitiesandthe delay of supplies beingreceived;
•adversely impacting the financial health of our dealers who typically require financing to purchase ourboats;
•adverselyimpactingthebusinessofoursuppliers,whichcouldresultinamongotherthings,delaysfordeliveryofraw materials and components needed for the production of ourboats;
•impacting our ability to maintain our workforce during this uncertaintime;
•increasing employee absenteeism due to fear ofinfection;
•increasing possible lawsuits or regulatory actions due to COVID-19 spread in theworkplace;
•suffering from reputational risk if we experience COVID-19 spread in ourworkplace;
•increasing the possibility of cybersecurity-related events such as COVID-19 themed phishing attacks and other security challenges resulting from a number of our employees and suppliers working remotely; and
•adversely impacting the productivity of management and our employees that are working remotely, including impactingourabilitytomaintainourfinancialreportingprocessesandrelatedcontrolsandourabilitytomanagecomplex accounting issues presented by the COVID-19 pandemic.
Any or all of these items may occur, which individually or in the aggregate, may have a material adverse effect on our business, financial condition, results of operations and cash flows. These risks could accelerate or intensify depending on the severity and length of the pandemic. In addition, the United States could experience a resurgence of the COVID-19 virus and if the rate of infections continue to rise, these factors likely will be exacerbated.
In late March 2020, we elected to draw the then remaining available funds of $98.8 million from our revolving credit facility to ensure we maintained financial flexibility in light of the uncertainty resulting from the COVID-19 pandemic. We have since repaid $110 million and as of August 27, 2020, we have approximately $110.0 million available for borrowing under our revolving credit facility, along with $49.9 million of cash on hand. We may need to borrow more under our revolving credit facility depending on the severity and length of the pandemic. Our cash position will depend on multiple factors, including our ability to continue operations and production of boats, the COVID-19 pandemic’s effects on our dealers and customers, the availability of sufficient amounts of financing, and our operating performance. Further, our dealers may seek credit support or other assurances from us that could affect our costs of doing business or liquidity. As a result of the impacts of the COVID-19 pandemic, we may be required to raise additional capital and such additional debt financing may not be available on commercially reasonable terms, if at all.
As a result of the COVID-19 outbreak, we may be required to record future impairment charges to long-lived assets depending on future events. In addition, depending on the ongoing impact of the pandemic, we may also be required to reserve for credit losses and/or repurchase commitments. Any material increase in our reserves could have a corresponding effect on our results of operations.
The ultimate magnitude of COVID-19, including the extent of its impact on our financial condition and results of operations, which could be material, will depend on all of the factors noted above, including other factors that we may not be able to forecast at this time. While we expect the impacts of COVID-19 to have an adverse effect on our business, financial condition and results of operations, we are unable to predict the extent of these impacts at this time.
Any potential government crisis relief assistance to help mitigate the adverse impacts of the COVID-19 pandemic could impose significant limitations on our corporate activities, may dilute our stockholders and may not be on terms favorable to us.
Numerous government-sponsored crisis relief programs have been implemented in an effort to mitigate the adverse impacts of the COVID-19 pandemic and others are being considered. If any government agrees to provide crisis relief assistance that we accept, it may impose certain requirements on the recipients of the aid including restrictions on executive officer compensation, share buybacks, dividends, prepayment of debt, limitations on debt, and other similar restrictions that will apply for a period of time after the aid is repaid or redeemed in full. We cannot assure you that any such government crisis relief assistance will not significantly limit our corporate activities or be on terms that are favorable to us. Such restrictions and terms could adversely impact our business and operations. In addition, such funding could involve the issuance of warrants, which will be dilutive to our stockholders.
Weak general economic conditions, particularly in the United States, affectcan negatively impact our industry, demand for our products, and our business and results of operations.
Demand for new recreational powerboats has been significantlycan be negatively influenced in the recent past by weak economic conditions, low consumer confidence and high unemployment, and increased market volatility worldwide, especially in the United States.States, and by increased market volatility worldwide. The COVID-19 pandemic has caused a significant economic slowdown and the beginning of a global recession, which could be of an unknown duration. We recognized a decrease in net sales in the fourth quarter of fiscal year 2020 as a result of facility closures related to the pandemic, but retail sales of our boats have remained strong during this period as consumers have turned to boating and other outdoor activities for leisure and entertainment alternatives during the pandemic. If, however, the economic slowdown continues for an extended duration or worsens, sales of our boats could be negatively impacted during fiscal year 2021. In times of economic uncertainty and contraction, like we are currently experiencing, consumers tend to have less discretionary income and defer or avoid expenditures for discretionary items, such as our products.boats. Sales of our products are highly sensitive to personal discretionary spending levels, and our success depends on general economic conditions and overall consumer confidence and personal income levels.levels, especially in the United States and in the specific regional markets where we sell our products. Any deterioration in general economic conditions that diminishes consumer confidence or discretionary income mayis likely to reduce our sales and adversely affect our business, financial condition and results of operations. We cannot predictIf general economic conditions deteriorate further, for instance, due to the durationincreased severity or strengthlength of anthe pandemic, it may exacerbate the impact on our business and may delay significantly any potential economic recovery, either in the United States or in the specific markets where we sell our products.recovery.
In addition, consumers often finance purchases of our productsboats and accordingly, consumer credit market conditions alsocan influence demand for our boats. As a result of the U.S. recession in the recent past, there are fewer lenders, tighter underwriting and loan
approval criteria and greater down payments required than in the past. If credit conditions worsen, which could occur in response to the COVID-19 pandemic, and adversely affect the ability of consumers to finance potential purchases at acceptable terms and interest rates, it could result in a decrease in the sales of our products.
Our annual and quarterly financial results are subject to significant fluctuations depending on various factors, many of which are beyond our control.
Our sales and operating results can vary significantly from quarter to quarter and year to year depending on various factors, many of which are beyond our control. These factors include, but are not limited to:
•seasonal consumer demand for ourproducts;
•discretionary spendinghabits;
•changes in pricing in, or the availability of supply in, the used powerboatmarket;
•failure to maintain a premium brandimage;
•disruption in the operation of our manufacturing facilities;facilities, such as our temporary shutdown of facilities due to the COVID-19 pandemic;
•variations in the timing and volume of oursales;
•the timing of our expenditures in anticipation of futuresales;
•sales promotions by us and ourcompetitors;
•changes in competitive and economic conditionsgenerally;
•changes in trade policy or the imposition of additional tariffs;
•consumer preferences and competition for consumers’ leisure time;and
•changes in the cost or availability of ourlabor.
As a result, our results of operations may decline quickly and significantly in response to changes in order patterns or rapid decreases in demand for our products. We anticipate that fluctuations in operating results will continue in the future.
In addition to the factors noted above, unfavorable weather conditions, policies impacting access to waterways and shelter-in-place orders may have a material adverse effect on our business, financial condition, and results of operations, especially during the peak boating season.
Adverse weather conditions in any year in any particular geographic region may adversely affect sales in that region, especially during the peak boating season. Sales of our products are generally stronger just before and during spring and summer, which represent the peak boating months in most of our markets, and favorable weather during these months generally has a positive effect on consumer demand. Conversely, unseasonably cool weather, excessive rainfall, reduced rainfall levels, or drought conditions during these periods may close area boating locations or render boating dangerous or inconvenient, thereby generally reducing consumer demand for our products. Our annual results would be materially and adversely affected if our net sales were to fall below expected seasonal levels during these periods. We may also experience more pronounced seasonal fluctuation in net sales in the future as we continue to expand our businesses. Additionally, to the extent that unfavorable weather conditions are exacerbated by global climate change or otherwise, our sales may be affected to a greater degree than we have previously experienced. There can be no assurance that weather conditions will not have a material effect on the sales of any of our products.
Many of our customers use our Malibu, Axis and Cobalt boats for recreational water activities and our Pursuit boats for fishing. Regulatory or commercial policies and practices impacting access to water, including availability of slip locations and/or the ability to transfer boats among different waterways, access to fisheries, or the ability to fish in some areas could negatively affect demand for our products. Further, in response to the COVID-19 pandemic shelter-in-place orders were in effect for part of spring 2020 and social distancing policies continue to be in effect during the summer months. These policies and regulations resulted in the closure of our facilities and closure of our dealers and sales of our boats were negatively
impacted during the fourth quarter of fiscal year 2020. Sales of our boats could be impacted during fiscal year 2021 as a result of the continuation and in some cases reinstatement of shelter-in-place orders and social distancing policies.
We depend on our network of independent dealers, face increasing competition for dealers and have little control over their activities.
Substantially all of our sales are derived from our network of independent dealers. We have agreements with the dealers in our network that typically provide for one-year terms, although some agreements have a term of up to three years. ForOur top ten dealers represented 38.5%, 39.6% and 37.8%, of our net sales for fiscal years 2017, 2016year 2020, 2019 and 2015, our2018, respectively. The top ten dealers for each of Malibu, Cobalt and Axis brands accounted for 40.6%Pursuit represented approximately 45.8%, 31.9%45.3% and 33.7%82.7%, respectively, of our total units sold. For Cobalt'snet sales in fiscal years 2017, 2016 and 2015, Cobalt'syear 2020. The top ten dealers account for 41.8%each segment are not the same across all segments. Sales to our dealers under common control of OneWater Marine, Inc. represented approximately 15.2%, 39.2%15.1% and 35.4%10.7% of consolidated net sales in fiscal years 2020, 2019, and 2018 respectively including approximately 7.6%, respectively,15.7% and 34.5% of Cobalt's total units sold. consolidated sales in fiscal year 2020 for Malibu, Cobalt and Pursuit, respectively. The loss of a significant number of these dealers could have a material adverse effect on our financial condition and results of operations. The number of dealers supporting our products and the quality of their marketing and servicing efforts are essential to our ability to generate sales.
Competition for dealers among recreational powerboat manufacturers continues to increase based on the quality, price, value and availability of the manufacturers' products, the manufacturers' attention to customer service and the marketing support that the manufacturer provides to the dealers. We face intense competition from other recreational powerboat manufacturers in attracting and
retaining dealers, and we cannot assure you that we will be able to attract or retain relationships with qualified and successful dealers. We cannot assure you that we will be able to maintain or improve our relationship with our dealers or our market share position. In addition, independent dealers in the recreational powerboat industry have experienced significant consolidation in recent years, which could result in the loss of one or more of our dealers in the future if the surviving entity in any such consolidation purchases similar products from a competitor. A substantial deterioration in the number of dealers or quality of our network of dealers including our network of Cobalt dealers, would have a material adverse effect on our business, financial condition and results of operations.
Our success depends, in part, upon the financial health of our dealers and their continued access to financing.
Because we sell nearly all of our products through dealers, the financial health of our dealers including our dealers of Cobalt products, is critical to our success. Our business, financial condition and results of operations may be adversely affected if the financial health of the dealers that sell our products suffers. Their financial health may suffer for a variety of reasons, including a downturn in general economic conditions, rising interest rates, higher rents, increased labor costs and taxes, compliance with regulations and personal financial issues.
In addition, our dealers have experienced disruptions to their operations during the pandemic, including temporary closures during which they were either unable or significantly limited in their ability to sell our boats. Our dealers may experience closures again if there are further federal, state or local mandates to suspend operations in light of the increasing rate of infections of COVID-19 in the United States.
Our dealers also require adequate liquidity to finance their operations, including purchases of our products.boats. Dealers are subject to numerous risks and uncertainties that could unfavorably affect their liquidity positions, including, among other things, continued access to adequate financing sources on a timely basis on reasonable terms. These sources of financing are vital to our ability to sell products through our distribution network. Access to floor plan financing generally facilitates our dealers’ ability to purchase boats from us, and their financed purchases reduce our working capital requirements. If floor plan financing were not available to our dealers, our sales and our working capital levels would be adversely affected. The availability and terms of financing offered by our dealers’ floor plan financing providers will continue tomay be influenced by:
•theirabilitytoaccesscertaincapitalmarketsandtofundtheiroperationsinacost-effectivemanner;
•changes in a cost-effective manner;interest rates;
•the performance of their overall creditportfolios;
•their willingness to accept the risks associated with lending to dealers;and
•the overall creditworthiness of thosedealers.
The COVID-19 pandemic has the potential to cause a strain on some of our dealers’ liquidity and depending on the length and severity of the pandemic, it may result in financing sources becoming less available to our dealers on reasonable terms, or at all.
We may be required to repurchase inventory of certain dealers.
Many of our dealers have floor plan financing arrangements with third-party finance companies that enable the dealers to purchase our products. In connection with these agreements, we may have an obligation to repurchase our products from a finance company under certain circumstances, and we may not have any control over the timing or amount of any repurchase obligation nor have access to capital on terms acceptable to us to satisfy any repurchase obligation. This obligation is triggered if a dealer defaults on its debt obligations to a finance company, the finance company repossesses the boat and the boat is returned to us. Our obligation to repurchase a repossessed boat for the unpaid balance of our original invoice price for the boat is subject to reduction or limitation based on the age and condition of the boat at the time of repurchase, and in certain cases by an aggregate cap on repurchase obligations associated with a particular floor plan financing program. If our dealers suffer material economic harm during the COVID-19 pandemic, the dealers may no longer be able to continue in business or, even if they are, they may not be able to maintain their payment obligations under their floor plan financing arrangements and the boats could be repossessed by the floor plan financing provider and returned to us. If boats are returned to us, it would have an adverse impact on our net sales and could result in downward pressure on pricing of our boats. For fiscal year 2016,2020, we agreed to repurchase threerepurchased two units from thea lender of one of our former dealers and those units were subsequently resold in fiscal year 2020 above their cost and at a minimal margin loss. For fiscal year 2019, we repurchased eight units from a lender of two of our former dealers resultingand those units were subsequently resold in combined losses of $0.03 million. Other than these repurchase commitments, we have not repurchased any units from lenders since July 1, 2010. There is no assurance that a dealer will notfiscal year 2020 above their cost and at minimal margin loss.
One or more dealers may default on the terms of a credit line in the future. In addition, applicable laws regulating dealer relations may also require us to repurchase our products from our dealers under certain circumstances, and we may not have any control over the timing or amount of any repurchase obligation nor have access to capital on terms acceptable to us to satisfy any repurchase obligation. If we were obligatedare required to repurchase a significant number of units under any repurchase agreement or under applicable dealer laws, our business, operating results and financial condition could be adversely affected.
We rely solely on General Motors for the supply of Malibu and Axis engines, which we integrate for marine use.
The availability and cost of engines used in the manufacture of our boats are critical. We purchase engines from General Motors LLC that we then prepare for marine use for our Malibu and Axis boats. Our current agreement with General Motors LLC provides us with engines through model year 2023. If we failare required to managereplace General Motors as our manufacturing levels while still addressingengine supplier for any reason, it could cause a decrease in products available for sale or an increase in our cost of sales, either of which could adversely affect our business, financial condition and results of operations. During fiscal year 2020 we experienced interruption to our engine supply as a result of the seasonal retail patternUnited Auto Workers’ strike against General Motors. During the UAW strike, General Motors suspended delivery of engine blocks to us and we incurred $2.6 million in costs by entering into purchase agreements with two suppliers for additional engines to supplement our inventory of engine blocks for Malibu and Axis boats. General Motors and Unifor, which represents the Canadian autoworkers, have a labor agreement which expires in September 2020 and the parties are currently in negotiations. If the Canadian autoworkers were to strike against General Motors upon expiration of the labor agreement we could experience another interruption to our engine supply which could cause a decrease in products available for sale or an increase in our cost of sales, either of which could adversely affect our business, financial condition and results of operations.
We have agreed to purchase substantially all of our outboard motors from Yamaha, which makes us reliant on Yamaha for our supply of outboard engines.
In August 2018, we entered into a joint marketing agreement with Yamaha Motor Corporation, U.S.A., or Yamaha, that became effective upon completion of our acquisition of Pursuit. Under our agreement with Yamaha, in exchange for certain incentives, we have agreed to purchase Yamaha outboard engines for use in at least 90% of all Pursuit and Cobalt branded boats that are pre-equipped with outboard motors when sold by us. While we believe that this agreement with Yamaha will provide the engines we need for our Cobalt boats and Pursuit boats, Yamaha could potentially exert significant bargaining power over quality, warranty claims, or other terms relating to the outboard engines we use. We also must pay penalties to Yamaha if we do not achieve pre-determined purchase volume targets for each year of the agreement and for the entire term of the agreement, which is scheduled to expire on June 30, 2023, unless extended by both parties. We may not be able to meet the purchase volume targets, which would require us to pay penalties to Yamaha.
In addition to General Motors and Yamaha, we rely on other third-party suppliers and may be unable to obtain adequate raw materials and components.
We depend on third-party suppliers to provide components and raw materials essential to the construction of our boats. Historically, we have not entered into long-term agreements with our suppliers, but have developed 90-day forecast models with our major suppliers to minimize disruptions in our supply chain. While we believe that our relationships with our current suppliers are sufficient to provide the materials necessary to meet present production demand, we cannot assure you that these
relationships will continue or that the quantity or quality of materials available from these suppliers will be sufficient to meet our future needs.
Any number of factors, including labor disruptions, catastrophic weather events, the occurrence of a pandemic or contagious disease, contractual or other disputes, unfavorable economic or industry conditions, delivery delays or other performance problems or financial difficulties or solvency problems, could disrupt our suppliers’ operations and lead to uncertainty in our supply chain or cause supply disruptions for us, which could, in turn, disrupt our operations. During the COVID-19 pandemic, many of our suppliers experienced temporary closures, with the potential to delay our ability to receive certain components and materials that are essential to the construction of our boats. In addition, the temporary shutdown of our facilities resulted in an inability for us to receive supplies from our vendors. If we do not receive sufficient supplies of materials for production of our boats or if we are required to replace one or more suppliers of any key components or raw materials, it could cause a disruption to our production schedule or cause us to alter productions schedules or suspend production entirely, thereby decreasing products available for sale or causing an increase in the cost of sales, either of which could adversely affect our business, financial condition and margins may suffer.results of operations.
The seasonality of retail demand forIn addition to the above factors, our products, together with our goal of balancingsuppliers could face increased costs or an inability to meet required production throughoutlevels due to the year, requires us to manage our manufacturingtariffs the U.S. has imposed on certain foreign goods, including raw materials and allocate our products to our dealer network to address anticipated retail demand. Our dealers must manage seasonal changes in consumer demand and inventory. If our dealers reduce their inventories in response to weakness in retail demand, we could be required to reduce our production, resulting in lower rates of absorption of fixed costscomponents used in our manufacturing process. This could negatively impact our cost of sales, by increasing the price of raw materials and therefore, lower margins. As a result, we must balance the economiescomponents used in our supply chain.
Termination or interruption of level production with the seasonal retail sales pattern experienced by our dealers. Failure to adjust manufacturing levels adequately mayinformal supply arrangements could have a material adverse effect on our financial condition andbusiness or results of operations.
We have informal supply arrangements with many of our suppliers. In the event of a termination of the supply arrangement, there can be no assurance that alternate supply arrangements will be made on satisfactory terms. If we need to enter into supply arrangements on unsatisfactory terms, or if there are any delays to our supply arrangements, it could adversely affect our business and operating results.
Our ability to meet our manufacturing workforce needs is crucial to our results of operations and future sales and profitability.
We rely on the existence of an available hourly workforce to manufacture our boats. We cannot assure you that we will be able to attract and retain qualified employees to meet current or future manufacturing needs at a reasonable cost, or at all. For instance, although there are currently high unemployment rates in the regions where we have manufacturing facilities, it is difficult to retain skilled employees. Also, although none of our employees are currently covered by collective bargaining agreements, we cannot assure you that our employees will not elect to be represented by labor unions in the future. Additionally, competition for qualified employees could require us to pay higher wages to attract a sufficient number of employees.Significant increases in manufacturing workforce costs could materially adversely affect our business, financial condition or results of operations.
As a result of the COVID-19 pandemic, we suspended operations at all our facilities on March 24, 2020. While we have resumed operations at all our facilities, we have continued to implement safety precautions, including enhanced and more frequent cleaning of our facilities, providing facemasks to each employee, enforcing social distancing guidelines and screening employees for potential symptoms. These additional safety precautions have resulted in increases in manufacturing workforce costs and may also impact the productivity and profitability at our facilities. In addition, we may experience higher levels of absenteeism during the pandemic due to the fear of becoming ill, which may further impact our manufacturing operations.
The nature of our business exposes us to workers' compensation claims and other workplace liabilities.
Certain materials we use require our employees to handle potentially hazardous or toxic substances. While our employees who handle these and other potentially hazardous or toxic materials receive specialized training and wear protective clothing, there is still a risk that they, or others, may be exposed to these substances. Exposure to these substances could result in significant injury to our employees and damage to our property or the property of others, including natural resource damage. Our personnel are also at risk for other workplace-related injuries, including slips and falls. We have in the past been, and may in the future be, subject to fines, penalties, and other liabilities in connection with any such injury or damage. While we have implemented safety precautions at our facilities following their reopening after the temporary closures in March 2020 due to the COVID-19 pandemic, we may also be subject to possible lawsuits or regulatory actions or suffer from reputational risk if we experience COVID-19 spread in our workplace. We may be unable to maintain insurance for these potential liabilities on acceptable terms or such insurance may not provide adequate protection against potential liabilities.
We have grown our business through acquisitions; however we may not be successful in completing future acquisitions or integrating future acquisitions in a way that fully realizes their expected benefits to our business.
A key part of our growth strategy, as shown by our acquisition of Pursuit in 2018, of Cobalt in 2017 and of our Australian licensee in 2014, has been to acquire other companies that expand our consumer base, enter new product categories or obtain other competitive advantages. We expect to continue to acquire companies as an element of our growth strategy; however, we may not be able to identify future acquisition candidates or strategic partners as part of our growth strategy that are suitable to our business, or we may not be able to obtain financing on satisfactory terms to complete such acquisitions.
Acquisitions also involve special risks, including risks associated with unanticipated challenges, liabilities and contingencies, and diversion of management attention and resources from our existing operations.If we fail to conduct due diligence on our potential targets effectively, we may, for example, not identify problems at target companies, or fail to recognize incompatibilities or other obstacles to successful integration. Our inability to successfully integrate future acquisitions within the intended timeframes or at all could impede us from realizing all of the benefits of those acquisitions and could severely weaken our business operations. The integration process may disrupt our business and, if implemented ineffectively, may preclude realization of the full benefits expected by us and could harm our results of operations. In addition, the overall integration of the combining companies may result in unanticipated problems, expenses, liabilities and competitive responses and may cause our stock price to decline.Even if the operations of an acquisition are integrated successfully, we may not realize the full benefits of the acquisition, including the synergies, cost savings or growth opportunities that we expect.
Our growth strategy may require us to secure significant additional capital, the amount of which will depend upon the size, timing, and structure of future acquisitions or vertical integrations and our working capital and general corporate needs.
Our growth strategy includes the possible acquisition of other businesses, such as our acquisitions of Cobalt and Pursuit, and the potential integration of new product lines or related products to our boats, such as our initiatives to integrate the production of our own engines and trailers for our Malibu and Axis models. These actions may require us to secure significant additional capital through the borrowing of money or the issuance of equity. Any borrowings made to finance future strategic initiatives could make us more vulnerable to a downturn in our operating results, a downturn in economic conditions, or increases in interest rates on borrowings that are subject to interest rate fluctuations. If our cash flow from operations is insufficient to meet our debt service requirements, we could then be required to sell additional equity securities, refinance our obligations or dispose of assets in order to meet our debt service requirements. Adequate financing may not be available if and when we need it or may not be available on terms acceptable to us. The failure to obtain sufficient financing on favorable terms and conditions could have a material adverse effect on our growth prospects.
Further, we could choose to finance acquisitions or other strategic initiatives, in whole or in part through the issuance of our Class A Common Stock or securities convertible into or exercisable for our Class A Common Stock. If we do so, existing stockholders will experience dilution in the voting power of their Class A Common Stock and earnings per share could be negatively impacted. The extent to which we will be able and willing to use our Class A Common Stock for acquisitions and other strategic initiatives will depend on the market value of our Class A Common Stock and the willingness of potential third parties to accept our Class A Common Stock as full or partial consideration. Our inability to use our Class A Common Stock as consideration, to generate cash from operations, or to obtain additional funding through debt or equity financings in order to pursue our strategic initiatives could materially limit our growth.
We have a large fixed cost base that will affect our profitability if our sales decrease.
The fixed cost levels of operating a recreational powerboat manufacturer can put pressure on profit margins when sales and production decline. Our profitability depends, in part, on our ability to spread fixed costs over a sufficiently large number of products sold and shipped, and if we make a decision to reduce our rate of production, gross or net margins could be negatively affected. Consequently, decreased demand or the need to reduce production can lower our ability to absorb fixed costs and materially impact our financial condition or results of operations.
Our industry is characterized by intense competition, which affects our sales and profits.
The recreational powerboat industry, and in particular the performance sport boat category, is highly competitive for consumers and dealers. We also compete against consumer demand for used boats. Competition affects our ability to succeed in both the markets we currently serve, including the saltwater outboard fishing boat market in which Pursuit competes, and new markets that we may enter in the future. Competition is based primarily on brand name, price, product selection and product performance. We compete with several large manufacturers that may have greater financial, marketing and other resources than we do and who are represented by dealers in the markets in which we now operate and into which we plan to expand. We also compete with a variety of small, independent manufacturers. We cannot assure you that we will not face greater competition from existing large or small manufacturers or that we will be able to compete successfully with new competitors. Our failure to compete effectively with our current and future competitors would adversely affect our business, financial condition and results of operations.
Our sales may be adversely impacted by increased consumer preference for used boats or the supply of new boats by competitors in excess of demand.
During the recent economic downturn that commenced in 2008, we observed a shift in consumer demand toward purchasing more used boats, primarily because prices for used boats are typically lower than retail prices for new boats. If this were to occur again, especially in light of the current economic downturn caused by the COVID-19 pandemic, it could have the effect of reducing demand among retail purchasers for our new boats. Also, while we have taken steps designed to balance production volumes for our boats with demand, our competitors could choose to reduce the price of their products, which could have the effect of reducing demand for our new boats. Reduced demand for new boats could lead to reduced sales by us, which could adversely affect our business, results of operations or financial condition.
Our sales and profitability depend, in part, on the successful introduction of new products.
Market acceptance of our products depends on our technological innovation and our ability to implement technology in our boats. Our sales and profitability may be adversely affected by difficulties or delays in product development, such as an inability to develop viable or innovative new products. Our failure to introduce new technologies and product offerings that our markets desire could adversely affect our business, financial condition and results of operations. Also, we believe we have been able to achieve higher margins in part as a result of the introduction of new features or enhancements to our existing boat models. If we fail to introduce new features or those we introduce fail to gain market acceptance, our margins may suffer.
In addition, some of our direct competitors and indirect competitors may have significantly more resources to develop and patent new technologies. It is possible that our competitors will develop and patent equivalent or superior technologies and other products that compete with ours. They may assert these patents against us and we may be required to license these patents on unfavorable terms or cease using the technology covered by these patents, either of which would harm our competitive position and may materially adversely affect our business.
We also cannot be certain that our products or technologies have not infringed or will not infringe the proprietary rights of others.Any such infringement could cause third parties, including our competitors, to bring claims against us, resulting in significant costs and potential damages.
We compete with a variety of other activities for consumers’ scarce leisure time.
Our boats are used for recreational and sport purposes, and demand for our boats may be adversely affected by competition from other activities that occupy consumers’ leisure time and by changes in consumer life style, usage pattern or taste.Similarly, an overall decrease in consumer leisure time may reduce consumers’ willingness to purchase and enjoy our products.
Our success depends upon the continued strength of our brands —- Malibu, Axis, Cobalt and Cobalt —Pursuit - and the value of our brands and sales of our products could be diminished if we, the athletes who use our products or the sports and activities in which our products are used, are associated with negative publicity.
We believe that our brands —, - Malibu, Axis, Cobalt and Cobalt —Pursuit - are significant contributors to the success of our business and that maintaining and enhancing our brands are important to expanding our consumer and dealer base. Failure to continue to protect our brands may adversely affect our business, financial condition and results of operations.
Negative publicity, including that resulting from recalls or from severe injuries or deathaccidents occurring in the sports and activities in which our products are used, could negatively affect our reputation and result in restrictions recalls or bans on the use of our products. Further,For instance, during fiscal year 2019 we announced a recall with respect to fuel pumps supplied to us by a third-party vendor and used in certain Malibu and Axis models. While the recall also impacted other manufacturers in the recreational powerboat industry, our announcement of the recall could adversely impact the reputation of our brands.
In addition, actions taken by athletes associated with our products that harm the reputations of those athletes could also harm our brand image and adversely affect our financial condition. If the popularity of the sports and activities for which we design, manufacture and sell products were to decrease as a result of these risks or any negative publicity, sales of our products could decrease, which could have an adverse effect on our net revenue, profitability and operating results. In addition,Further, if we become exposed to additional claims and litigation relating to the use of our products, our reputation may be adversely affected by such claims, whether or not successful, including by generating potential negative publicity about our products, which could adversely impact our business and financial condition.
We may not be able to execute our manufacturing strategy successfully, which could cause the profitability of our products to suffer.
Our manufacturing strategy is designed to improve product quality and increase productivity, while reducing costs and increasing flexibility to respond to ongoing changes in the marketplace. To implement this strategy, we must be successful in our continuous improvement efforts, which depend on the involvement of management, production employees and suppliers. In addition, we began manufacturing our own trailers for model year 2016 and have entered into an engine supply agreement with General Motors LLC for the development
As part of our own engines. Because the integration ofmanufacturing strategy, we commenced an initiative in 2016 to produce our trailer manufacturing is relatively new to us, we must continue to seek ways to improve our trailer production. Further, our vertical integration strategy for our engines may not be successful. Any inability to achieve these objectives could adversely impact the profitability of our products and our ability to deliver desirable products to our consumers.
Our engine integration strategy will require significant cash expenditures and we may not be able to execute our strategy successfully, which could cause our profitability to suffer.
In November, 2016, we entered an engine supply agreement with General Motors LLC for theown supply of engines to us for use in our Malibu and Axis brand performance sportsmodels. Our engines, branded as Malibu Monsoon engines, were in all Malibu and Axis boats beginning as early asfor model year 2019 through model year 2023. Unlike our current strategy that purchases engines prepared for marine use, we will be solely responsible for integrating the engines purchased from General Motors for marine use. We adopted this strategy in order to more directly control product path (design, innovation, calibration and integration) of our largest dollar procured part, to differentiate our product from our competitors, and to increase our ability to respond to ongoing changes in the marketplace.
2020. This strategy will requirerequired significant additional capital. We purchased an additional facility adjacent to our current manufacturing facility for the production of our engines. We expect a total investment through expenditures, working capital, and capital expenses of approximately $18.0 million for the three years after entering the engine supply agreement, which we intend to finance with cash from operations and our revolving credit facility. In addition, this strategy will increaseincreased the fixed costs of our operations. And, becauseoperations, and may still require further capital investment. Because the integration of engines into our manufacturing process is new to us, we must be successful in continuous improvement efforts, which depend on the involvement of management, production employees and suppliers. IfWe are in the early stages of this strategy and if we are not successful in implementing our engine integration strategy, it could adversely impact the profitability of our products and our ability to deliver desirable products to our consumers.
As a resultAny inability to achieve our objectives under our manufacturing strategy could adversely impact the profitability of our engine integration strategy, we will rely solely on General Motors for the supply ofproducts and our engines, which we will then integrate for marine use.
The availability and cost of engines used in the manufacture of our boats are critical. For fiscal years 2017, 2016 and 2015, we purchased approximately 64%, 60% and 62%, respectively, of the engines for our boats from a single supplier. These engines were prepared for marine use as purchased. Starting as soon as model year 2019, we will begin purchasing engines solely from General Motors LLC and we will prepare the engines for marine use. If we are required to replace General Motors for any reason, it could cause a decrease in products available for sale or an increase in our cost of sales, either of which could adversely affect our business, financial condition and results of operations.
Our ability to meet our manufacturing workforce needs is crucialdeliver desirable products to our results of operations and future sales and profitability.
We rely on the existence of an available hourly workforce to manufacture our boats. We cannot assure you that we will be able to attract and retain qualified employees to meet current or future manufacturing needs at a reasonable cost, or at all. Although none of our employees is currently covered by collective bargaining agreements, we cannot assure you that our employees will not elect to be represented by labor unions in the future. Additionally, competition for qualified employees could require us to pay higher wages to attract a sufficient number of employees. Significant increases in manufacturing workforce costs could materially adversely affect our business, financial condition or results of operations.
We rely on third-party suppliers and may be unable to obtain adequate raw materials and components.
We depend on third-party suppliers to provide components and raw materials essential to the construction of our boats. Historically, we have not entered into long-term agreements with our suppliers, but have developed 90-day forecast models with our major suppliers to minimize disruptions in our supply chain. While we believe that our relationships with our current suppliers are sufficient to provide the materials necessary to meet present production demand, we cannot assure you that these relationships will continue or that the quantity or quality of materials available from these suppliers will be sufficient to meet our future needs, irrespective of whether we successfully implement our growth strategy. In particular, the availability and cost of engines used in the manufacture of our boats are critical. For fiscal years 2017, 2016 and 2015 we purchased approximately 64%, 60% and 62%, respectively, of the engines for our boats from a single supplier.Even with our engine integration strategy, we intend to continue to purchase engines from our two current suppliers for at least model years 2017 and 2018. If we are required to replace these suppliers or the supplier of any other key components or raw materials, it could cause a decrease in products available for sale or an increase in the cost of sales, either of which could adversely affect our business, financial condition and results of operations even as our engines development initiative continues.
Termination or interruption of informal supply arrangements could have a material adverse effect on our business or results of operations.
We have informal supply arrangements with many of our suppliers. In the event of a termination of the
supply arrangement, there can be no assurance that alternate supply arrangements will be made on satisfactory terms.
If we need to enter into supply arrangements on unsatisfactory terms, or if there are any delays to our supply
arrangements, it could adversely affect our business and operating results.consumers.
Product liability, warranty, personal injury, property damage and recall claims may materially affect our financial condition and damage our reputation.
We are engaged in a business that exposes us to claims for product liability and warranty claims in the event our products actually or allegedly fail to perform as expected or the use of our products results, or is alleged to result, in property damage, personal injury or death. In the past, we have provided limited product warranties, generally covering periods from 12 to 36 months for
Our Malibu and Axis brand boats and 12 to 24 months for Axis brand boats. Effective July 1, 2015, we began providinghave a limited warranty for a period up to five years. Prior to fiscal year 2016, we provided a limited warranty for a period of up to three years to our consumers for both our Malibu and Axis brand boats manufactured after this point in time.and two years for our Axis boats. We expect the extension of our warranty coverage period to increase our obligations to cover warranty claims over time resulting in an increase in our reserve to cover these warranty claims.
ForOur Cobalt brand boats we provide limitedhave (1) a structural warranty for a period of up to ten years on structural components such as hull/which covers the hull, deck joints, bulkheads, floor, transom, stringers, and motor mount, and up to(2) a five year bow-to-stern warranty on all components manufactured or purchased components,(excluding hull and deck structural components), including canvas and upholstery. Gelcoat is covered up to three years.years for Cobalt and one year for Malibu and Axis. Pursuit brand boats have (1) a limited warranty for a period of up to five years on structural components such as the hull, deck and defects in the gelcoat surface of the hull bottom, and (2) a bow-to-stern warranty of two year (excluding hull and deck structural components). For each boat brand, there are certain materials, components or parts of the boat that are not covered by our warranty and certain components or parts that are separately warranted by the manufacturer or supplier (such as the engine). Engines that we manufacture for Malibu and Axis models have a limited warranty of up to five years or five-hundred hours.
Our standard warranties require us or our dealers to repair or replace defective products during such warranty periods at no cost to the consumer. Although we maintain product and general liability insurance of the types and in the amounts that we believe are customary for the industry, we are not fully insured against all such potential claims. We may experience legal claims in excess of our insurance coverage or claims that are not covered by insurance, either of which could adversely affect our business, financial condition and results of operations. Adverse determination of material product liability and warranty claims made against us could have a material adverse effect on our financial condition and harm our reputation. In addition, if any of our products are, or are alleged to be, defective, we may be required to participate in a recall of that product if the defect or alleged defect relates to safety. TheseFor example, in fiscal year 2019 we had to announce a recall on fuel pumps supplied to us by a third-party vendor and used in certain Malibu and Axis boats. While this recall has not had a material impact on our business, financial condition or results of operations, future recalls or other claims we face could be costly to us and require substantial management attention.
We depend uponon key personnel and we may not be able to retain them or to attract, assimilate, and retain highly qualified employees in the future.
Our future success will depend in significant part upon the continued service of our senior management team and our continuing ability to attract, assimilate, and retain highly qualified and skilled managerial, product development, manufacturing, and marketing and other personnel. The loss of the services of any members of our senior management or other key personnel or the inability to hire or retainedretain qualified personnel in the future could adversely affect our business, financial condition, and results of operations.
We Ourrelianceuponpatents,trademarklawsandcontractualprovisionstoprotectourproprietaryrightsmay attempt to grow our business through acquisitions or strategic alliances and new partnerships, such as our acquisitions of Cobalt and our Australia licensee, which we may notbe successful in completing or integrating.
We may in the future explore acquisitions and strategic alliances, similar to our acquisitions of Cobalt in July 2017 and our Australian licensee in fiscal year 2015, that will enable us to acquire complementary skills and capabilities, offer new products, expand our consumer base, enter new product categories or geographic markets and obtain other competitive advantages. We cannot assure you, however, that we will identify acquisition candidates or strategic partners that are suitable to our business, obtain financing on satisfactory terms, complete acquisitions or strategic alliances or successfully integrate acquired operations into our existing operations. Once integrated, acquired operations may not achieve anticipated levels of sales or profitability, or otherwise perform as expected. Acquisitions also involve special risks, including risks associated with unanticipated challenges, liabilities and contingencies, and diversion of management attention and resources from our existing operations.
Our results after the acquisition of Cobalt may suffer if we do not effectively manage our expanded operations following the acquisition.
The size of our business has increased significantly as a result of our acquisition of Cobalt in July 2017. Our future success depends, in part, upon our ability to manage this expanded business, which will pose substantial challenges for management, including challenges related to the management and monitoring of additional operations and associated increased costs and complexity. There can be no assurances we will be successful or that we will realize the expected benefits currently anticipated from the acquisition of Cobalt.
We have and will continue to incur significant acquisition-related integration costs in connection with the acquisition of Cobalt and significant transaction expenses in connection with the negotiation and consummation of the acquisition of Cobalt and the related financing transactions.
We are currently implementing a plan to integrate the operations of Cobalt. In connection with that plan, we anticipate that we will incur certain non-recurring charges in connection with the integration of Cobalt; however, we cannot currently identify the timing, nature and amount of all such charges. Further, we have incurred significant transaction costs relating to negotiating and completing the acquisition of Cobalt. These integration costs and transaction expenses will be charged as an expense in the period incurred. The significant transaction costs and integration costs could materially affect our results of operations in the period in which such charges are recorded. Although we believe that the elimination of duplicative costs, as well as the realization of other efficiencies related to the integration of the business, will offset incremental transaction and integration costs over time, this net benefit may not be achieved in the near term, or at all.
The Cobalt business may underperform relative to our expectations.
We may not be able to maintain the levels of revenue, earnings or operating efficiency that we and Cobalt have achieved or might achieve separately. The business and financial performance of Cobalt are subject to certain risks and uncertainties, including the risk of the loss of, or changes to, its relationships with its dealers and suppliers, increased product liability and warranty claims, and negative publicity or other events that could diminish the value of the Cobalt brand. We may be unable to achieve the same growth, revenues and profitability that Cobalt has achieved in the past.
The pro forma financial information we filed on our Amendment No. 1 to Form 8-K on July 12, 2017 may not be indicative of our future results with Cobalt.
The pro forma financial information we filed on our Amendment No.1 to Form 8-K on July 12, 2017 may not reflect what our results of operations, financial position and cash flows would have been after giving effect to the acquisition of Cobalt and the related financing during the periods presented or be indicative of what our results of operations, financial position and cash flows may be in the future. We have made adjustments based upon available information and made assumptions that we believe are reasonable to reflect these factors, among others, in the pro forma financial information. However, our assumptions may not prove to be accurate and, accordingly, the pro forma information may not be indicative of what our results of operations, cash flows or financial condition actually would have been after giving effect to the acquisition of Cobalt and the related financing nor be a reliable indicator of what our results of operations, cash flows and financial condition actually may be in the future.
Our growth strategy may require us to secure significant additional capital, the amount of which will depend upon the size, timing, and structure of future acquisitions or vertical integrations and our working capital and general corporate needs.
Our growth strategy could include acquiring businesses, like our acquisitions of Cobalt in July 2017 and our Australian licensee in fiscal year 2015, and the integration of new product lines or related products to our boats, such as the integration of the manufacturing of our own trailers beginning with model year 2016 and our initiative to integrate the production of our own
engines as soon as model year 2019. These actions may require us to secure significant additional capital through the borrowing of money or the issuance of equity.
Any borrowings made to finance future strategic initiatives could make us more vulnerable to a downturn in our operating results, a downturn in economic conditions, or increases in interest rates on borrowings that are subject to interest rate fluctuations. If our cash flow from operations is insufficient to meet our debt service requirements, we could then be required to sell additional equity securities, refinance our obligations or dispose of assets in order to meet our debt service requirements. Adequate financing may not be available if and when we need it or may not be available on terms acceptable to us. The failure to obtain sufficient financing on favorable terms and conditions could have a material adverse effect on our growth prospects.
Further, we could choose to finance acquisitions or other strategic initiatives, in whole or in part through the issuance of our Class A Common Stock or securities convertible into or exercisable for our Class A Common Stock. If we do so, existing stockholders will experience dilution in the voting power of their Class A Common Stock and earnings per share could be negatively impacted. The extent to which we will be able and willing to use our Class A Common Stock for acquisitions and other strategic initiatives will depend on the market value of our Class A Common Stock and the willingness of potential third parties to accept our Class A Common Stock as full or partial consideration. Our inability to use our Class A Common Stock as consideration, to generate cash from operations, or to obtain additional funding through debt or equity financings in order to pursue our strategic initiatives could materially limit our growth.
Our reliance upon patents, trademark laws and contractual provisions to protect our proprietary rights may not be sufficient to protect our intellectual property from others who may sell similar products and may lead to costly litigation. We are
currently, andmaybeinthefuture,partytolawsuitsandotherintellectualpropertyrightsclaimsthatareexpensiveandtime-consuming.
We hold patents and trademarks relating to various aspects of our products and believe that proprietary technical know-how is important to our business. Proprietary rights relating to our products are protected from unauthorized use by third parties only to the extent that they are covered by valid and enforceable patents or trademarks or are maintained in confidence as trade secrets. We cannot be certain that we will be issued any patents from any pending or future patent applications owned by or licensed to us or that the claims allowed under any issued patents will be sufficiently broad to protect our technology. In the absence of enforceable patent or trademark protection, we may be vulnerable to competitors who attempt to copy our products, gain access to our trade secrets and know-how or diminish our brand through unauthorized use of our trademarks, all of which could adversely affect our business. Accordingly, we may need to engage in future litigation to enforce intellectual property rights, to protect trade secrets or to determine the validity and scope of proprietary rights of others. For example, in May 2017 we settled two Tennessee lawsuits in which we were previously a plaintiff alleging infringement by a competitor of our patent rights in certain wake surfing technology. For more information, see Note 15 to our audited consolidated financial statements included elsewhere in this Annual Report.
We also rely on unpatented proprietary technology. It is possible that others will independently develop the same or similar technology or otherwise obtain access to our unpatented technology. To protect our trade secrets and other proprietary information, we require employees, consultants, advisors and collaborators to enter into confidentialityconfidentiality agreements. We cannot assure you that these agreements will provide meaningful protection for our trade secrets, know-how, or other proprietary information in the event of any unauthorized use, misappropriation, or disclosure of such trade secrets, know-how, or other proprietary information. If we are unable to maintain the proprietary nature of our technologies, we could be materially adversely affected.
In addition, others may initiate litigation or other proceedings to challenge the validity of our patents, or allege that we infringe their patents, or they may use their resources to design comparable products that do not infringe our patents. We may incur substantial costs if our competitors initiate litigation to challenge the validity of our patents, or allege that we infringe their patents, or if we initiate any proceedings to protect our proprietary rights. As an example, we entered into a settlement agreement in September 2014 and agreed to pay $20.0 million in cash for settlement of a lawsuit alleging patent infringement and related claims against us in connection with windshields installed in our boats that we purchased from a third party supplier. If the outcome of any litigation challenging our patents is unfavorable to us, our business, financial condition and results of operations could be adversely affected.
We rely on network and information systems and other technologies for our business activities and certain events, such as computer hackings, viruses or other destructive or disruptive software or activities may disrupt our operations, which could have a material adverse effect on our business, financial condition and results of operations.
Network and information systems and other technologies are important to our business activities and operations. Network and information systems-related events, such as computer hackings, cyber threats, security breaches, viruses, or other destructive or disruptive software, process breakdowns or malicious or other activities could result in a disruption of our
services and operations or improper disclosure of personal data or confidential information, which could damage our reputation and require us to expend resources to remedy any such breaches. Moreover, the amount and scope of insurance we maintain against losses resulting from any such events or security breaches may not be sufficient to cover our losses or otherwise adequately compensate us for any disruptions to our businesses that may result, and the occurrence of any such events or security breaches could have a material adverse effect on our business and results of operations. The risk of these systems-related events and security breaches occurring has intensified, in part because we maintain certain information necessary to conduct our businesses in digital form stored on cloud servers. While we develop and maintain systems seeking to prevent systems-related events and security breaches from occurring, the development and maintenance of these systems is costly and requires ongoing monitoring and updating as technologies change and efforts to overcome security measures become more sophisticated. Despite these efforts, there can be no assurance that disruptions and security breaches will not occur in the future. Moreover, we may provide certain confidential, proprietary and personal information to third parties in connection with our businesses, and while we obtain assurances that these third parties will protect this information, there is a risk that this information may be compromised. The occurrence of any of such network or information systems-related events or security breaches could have a material adverse effect on our business, financial condition and results of operations.
The natureAdditionally, there is an increased risk that we may experience cybersecurity-related events such as COVID-19 themed phishing attacks and other security challenges as a result of most of our employees and our service providers working remotely from non-corporate managed networks during the ongoing COVID-19 pandemic and potentially continuing working remotely even after the COVID-19 pandemic has subsided.
We are also subject to laws and regulations in the United States and other countries concerning the handling of personal information, including laws that require us to notify governmental authorities and/or affected individuals of data breaches involving certain personal information. These laws and regulations include, for example, the European General Data Protection Regulation (GDPR), effective May 25, 2018, and the California Consumer Privacy Act (CCPA), effective January 1, 2020. Regulatory actions or litigation seeking to impose significant penalties could be brought against us in the event of a data breach or alleged non-compliance with such laws and regulations.
We are planning to begin the implementation of a new enterprise resource planning (ERP) system and if we are not able to successfully develop and manage that implementation, it could adversely affect our business or results of operations.
We are planning to begin the process of designing and implementing a new ERP system. This project will require significant capital and human resources, the re-engineering of many processes of our business, exposesand the attention of our management and other personnel who would otherwise be focused on other aspects of our business. The implementation may be more expensive and take longer to fully implement than we originally plan, resulting in increased capital investment, higher fees and expenses of third parties, delayed deployment scheduling, and more on-going maintenance expense once implemented, and, as such, it will be difficult for us to workers' compensation claimsestimate the ultimate costs and other workplace liabilities.
Certain materialsschedules. If for any reason portions of the implementation are not successful, we use require our employeescould be required to handle potentially hazardous or toxic substances. While our employees who handle these and other potentially hazardous or toxic materials receive specialized training and wear protective clothing, there is still a risk that they, or others, may be exposed to these substances. Exposure to these substances could result in significant injury to our employees and damage to our property or the property of others, including natural resource damage. Our personnel are also at risk for other workplace-related injuries, including slips and falls. We have in the past been, and may in the future be, subject to fines, penalties, and other liabilities in connection with any such injury or damage. Although we currently maintain what we believe to be suitable and adequate insurance in excess of our self-insured amounts, we may be unable to maintain such insurance on acceptable terms or such insurance may not provide adequate protection against potential liabilities.expense rather than capitalize related amounts.
Our international markets require significant management attention, expose us to difficulties presented by international economic, political, legal and business factors, and may not be successful or produce desired levels of sales and profitability.
We currently sell our products throughout the world. Our total sales outside North America were less than 10% ofof our total revenueforfiscalyears 2017, 2016 2020,2019and 2015. 2018.Internationalmarketshavebeen,andwillcontinuetobe,afocusforsalesgrowth. We believe many opportunities exist in the international markets, and over time we intend for international sales to comprise a larger percentage of our total revenue. Several factors, including weakened international economic conditions and the strength of the U.S. dollar, could adversely affect such growth. The expansion of our existing international operations and entry into additional international markets requiresignificantmanagementattention.Someofthecountriesinwhichwemarketandourdistributors or licensee sellourproductsareto some degree subject to political, economic or social instability. Our international operations expose us and our representatives, agents and distributors to risks inherent in operating in foreign jurisdictions. These risks include, but are not limitedto:
•the strength of the U.S. dollar could make our products more expensive in international markets and thereby reduce consumer demand;
•increased costs of customizing products for foreigncountries;
•economic and social instability, and public health crises, including the outbreak of pandemic or contagious disease such as COVID-19;
•unfamiliarity with local demographics, consumer preferences and discretionary spendingpatterns;
•difficulties in attracting customers due to a reduced level of customer familiarity with ourbrand;
•competition with new, unfamiliarcompetitors;
•the imposition of additional foreign governmental controls or regulations, including rules relating to environmental, healthandsafetymattersandregulationsandotherlawsapplicabletopublicly-tradedcompanies,suchastheForeign Corrupt Practices Act, or theFCPA;
•neworenhancedtraderestrictionsandrestrictionsontheactivitiesofforeignagents,representativesand distributors;
distributors, including the imposition of additional or newtariffs;
•theimpositionofincreasesincostlyandlengthyimportandexportlicensingandothercompliancerequirements, customs duties and tariffs, license obligations and other non-tariff barriers totrade;
•laws and business practices favoring localcompanies;
•longerpaymentcyclesanddifficultiesinenforcingagreementsandcollectingreceivablesthroughcertainforeign legal systems;and
•difficulties in enforcing or defending intellectual propertyrights.
Our international operations may not produce desired levels of total sales, or one or more of the foregoing factors may harm our business, financial condition or results of operations.
Rising concern regarding international tariffs could materially and adversely affect our business and results of operations.
The current political landscape has introduced significant uncertainty with respect to future trade regulations, including the imposition by the U.S. of tariffs and penalties on products manufactured outside the U.S., and existing international trade agreements, as shown by Brexit in Europe. The institution of global trade tariffs (including, but not limited to, the Trump Administration's tariffs on Europe and Canada on certain products from the U.S.), trade sanctions, new or onerous trade restrictions, embargoes and other stringent government controls carries the risk of negatively affecting global economic conditions, which could have a negative impact on our business and results of operations. In addition, certain foreign governments have imposed tariffs on certain U.S. goods and may take additional retaliatory trade actions stemming from the tariffs, which could increase the pricing of our products and result in decreased consumer demand for our products outside of the United States, which could materially and adversely affect our business and results of operations.
Changes in currency exchange rates can adversely affect our results.
A portion of our sales are denominated in a currency other than the U.S. dollar. Consequently, a strong U.S. dollar may adversely affect reported revenues. We also maintain a portion of our manufacturing operations in Australia which partially mitigates the impact of a strengthening U.S. dollar in that country. A portion of our selling, general and administrative costs are transacted in Australian dollars as a result. We also sell U.S. manufactured products into certain international markets in U.S. dollars, including the sale of products into Canada, Europe and Latin America. Demand for our products in these markets may also be adversely affected by a strengthening U.S. dollar. For example, we have experienced decreased demand in Canada due to the weakening Canadian dollar and demand is weak in other areas of the world, notably South America, South Africa and Europe. We do not currently use hedging or other derivative instruments to mitigate our foreign currency risks.
An increase in energy and fuel costs may adversely affect our business, financial condition and results of operations.
Higher energy costs result in increases in operating expenses at our manufacturing facility and in the expense of shipping products to our dealers. In addition, increases in energy costs may adversely affect the pricing and availability of petroleum-based raw materials, such as resins and foams, that are used in our products. Also, higher fuel prices may have an adverse effect on demand for our boats, as they increase the cost of ownership and operation.
We are subject to U.S. and other anti-corruption laws, trade controls, economic sanctions and similar laws and regulations, including those in the jurisdictions where we operate. Our failure to comply with these laws and regulations could subject us to civil, criminal and administrative penalties and harm our reputation.
Doing business on a worldwide basis requires us to comply with the laws and regulations of various foreign jurisdictions. These laws and regulations place restrictions on our operations, trade practices, partners and investment decisions. In particular, our operations are subject to U.S. and foreign anti-corruption and trade control laws and regulations, such as the FCPA, export controls and economic sanctions programs, including those administered by the U.S. Treasury Department’s Office of Foreign Assets Control, or the OFAC. As a result of doing business in foreign countries and with foreign partners, we are exposed to a heightened risk of violating anti-corruption and trade control laws and sanctions regulations.
The FCPA prohibits us from providing anything of value to foreign officials for the purposes of obtaining or retaining business or securing any improper business advantage. It also requires us to keep books and records that accurately and fairly reflect our transactions.
Economic sanctions programs restrict our business dealings with certain sanctioned countries, persons and entities. In addition, because we act through dealers and distributors, we face the risk that our dealers, distributors or consumers might further distribute our products to a sanctioned person or entity, or an ultimate end-user in a sanctioned country, which might subject us to an investigation concerning compliance with OFAC or other sanctions regulations.
Violations of anti-corruption and trade control laws and sanctions regulations are punishable by civil penalties, including fines, denial of export privileges, injunctions, asset seizures, debarment from government contracts and revocations or restrictions of licenses, as well as criminal fines and imprisonment. We cannot assure you that all of our local, strategic or joint partners will comply with these laws and regulations, in which case we could be held liable for actions taken inside or outside of the United States, even though our partners may not be subject to these laws. Such a violation could materially and adversely affect our reputation, business, results of operations and financial condition. Our continued international expansion, including in developing countries, and our development of new partnerships and joint venture relationships worldwide, could increase the risk of FCPA or OFAC violations in the future.
If we are unable to comply with environmental and other regulatory requirements, our business may be exposed to material liability or fines.
We are subject to extensive regulation, including product safety, environmental and health and safety requirements under various federal, state, local and foreign statutes, ordinances and regulations. While weWe believe that we are in material compliance with all applicable federal, state, local and foreign regulatory requirements, we cannot assure you that we will be able to continue to comply with applicable regulatorysuch requirements. ComplianceContinued compliance with regulatory requirements could increase the cost of our products, which in turn, may reduce consumer demand, or could materially increase the cost of operations. The failure to comply with applicable regulatory requirements could cause us to incur significant fines or penalties, impose obligations to
conduct remedial or corrective actions, or, in extreme circumstances, result in revocation of our permits or injunctions preventing some or all of our operations. In addition, the components of our boats must meet certain regulatory standards, including air emission standards for boat engines and fuel systems. Failure to meet these standards could result in an inability to sell our boats in key markets, which would adversely affect our business. In addition, legal requirements are constantly evolving, and changes in laws, regulations or policies, or changes in interpretations of the foregoing, could alsoresult in compliance shortfalls, increase our costs or create liabilities where none exists today.
As with boat construction in general, our manufacturing processes involve the use, handling, storage and contracting for recycling or disposal of hazardous substances and wastes. The failure to manage or dispose of such hazardous substances and wastes properly could expose us to material liability or fines, including liability for personal injury or property damage due to exposure to hazardous substances, damages to natural resources, or for the investigation and remediation of environmental conditions. Under certain environmental laws, we may be liable for remediation of contamination at sites where our hazardous wastes have been disposed or at our current or former facilities, regardless of whether such facilities are owned or leased or whether we caused the condition of contamination. We have not been notified of and are otherwise currently not aware of any contamination at our current or former facilities, or at any other location, for which we could have any material liability under environmental laws or regulations, and we currently are not undertaking any remediation or investigation activities in connection with any contamination. Also, the components in our boats may become subject to more stringent environmental regulations. For example, boat engines and other emission producing components may be subject to more stringent emissions standards, which could increase the cost of our engines, components and our products, which, in turn, may reduce consumer demand for our products.
The Occupational Safety and Health Administration (OSHA) imposes standards of conduct for and regulates workplace safety, including physical safety and limits on the amount of emissions to which an employee may be exposed without the need for respiratory protection or upgraded plant ventilation. Our facilities are regularly inspected by OSHA and by state and local inspection agencies and departments. We believe that our facilities comply in all material aspects with these regulations.
A natural disaster, global pandemic or other disruption at our manufacturing facilities could adversely affect our business, financial condition and results of operations.
We rely on the continuous operation of manufacturingour facilities in Tennessee, Kansas, California, Florida and Australia. Any natural disaster, global pandemic or other serious disruption to our facilities due to fire, flood, earthquake or any other unforeseen circumstances could adversely affect our business, financial condition and results of operations. The COVID-19 pandemic has significantly impacted health and economic conditions throughout the United States. As a result of the pandemic, we suspended operations at all of our facilities on March 24, 2020. We have since resumed operations at all our facilities. The disruption we experienced during our temporary closure resulted in a reduction in our production of boats that we were not able to fully recover during fiscal year 2020. The temporary shutdown of our facilities also resulted in delays for delivery of our boats to dealers and inability to receive supplies from our vendors. We cannot assure you that we will not have to suspend our operations again, whether voluntarily or as a result of federal, state or local mandates, and such closures could extend for a longer term than the prior shutdown of our facilities.
Changes in climate could also adversely affect our operations by limiting or increasing the costs associated with equipment or fuel supplies. In addition, adverse weather conditions, such as increased frequency and/or severity of storms, or floods could impair our ability to operate by damaging our facilities and equipment or restricting product delivery to customers. The occurrence of any disruption at our manufacturing facilities, even for a short period of time, may have an adverse effect on our productivity and profitability, during and after the period of the disruption. These disruptions may also cause personal injury and loss of life, severe damage to or destruction of property and equipment and environmental damage. Although we maintain property, casualty and business interruption insurance of the types and in the amounts that we believe are customary for the industry, we are not fully insured against all potential natural disasters or other disruptions to our manufacturing facilities.
Increases in income tax rates or changes in income tax laws or enforcement could have a material adverse impact on our financial results.
Changes in domestic and international tax legislation could expose us to additional tax liability and could impact the amount of our tax receivable agreement liability. Although we monitor changes in tax laws and work to mitigate the impact of proposed changes, such changes may negatively impact our financial results. In addition, any increase in individual income tax
rates, such as those implemented in the United States at the beginning of 2013, would negatively affect our potential consumers’ discretionary income and could decrease the demand for our products.
OurThe credit facilities containagreement governing our revolving credit facility and term loan contains restrictive covenants which may limit our operating flexibility; failure to comply with covenantsflexibility and may result in our lenders restricting or terminatingimpair our ability to borrow under such credit facilities.access sufficient capital to operate our business.
In the past, weWe have relied uponon and continue to rely on our existingterm loan and revolving credit facilitiesfacility to provide us with adequate liquidity to operate our business. The availabilityOur credit agreement governing our revolving credit facility and term loan contains restrictive covenants that limit our ability to, among other things, incur additional debt and additional liens on property and make future payments of borrowing amounts underdividends or distributions on our capital stock. Further, the credit facilities are dependent uponagreement requires compliance with thefinancial covenants, including a minimum ratio of EBITDA to fixed charges and a maximum ratio of total debt to EBITDA.
These covenants set forth inmay affect our credit agreement.ability to operate and finance our business as we deem appropriate. Violation of thosethese covenants whether as a resultcould constitute an event of operating losses or otherwise, could result indefault under the credit agreement governing our revolving credit facility and term loan. If there were an event of default under the credit agreement, our lenders restricting or terminating our borrowing ability under our credit facilities. If our lenderscould reduce or terminate our access to amounts under our credit facilities or declare all of the indebtedness outstanding under our revolving credit facility and term loan immediately due and payable. We may not have sufficient funds available, or we may not have access to sufficient capital from other sources, to fund our working capital and other needs and we may need to secure additional capital or financing to fundcontinue funding our operations or to repay outstanding debt under our credit facilities. We cannot assure you thatany accelerated debt. Even if we willcould obtain additional financing, the terms of the financing may not be successful in ensuring our availability to amounts under our credit facilities or in connection with raising additional capital and that any amount, if raised, will be sufficient to meet our cash needs or on terms as favorable as have historically been available to us. In addition, substantially all of our assets are subject to liens securing our revolving credit facility and term loan. If amounts outstanding under the revolving credit facility or term loan were accelerated, our lenders could foreclose on these liens and we are not able to maintaincould lose substantially all of our borrowing availabilityassets. Any event of default under the credit agreement governing our revolving credit facilities or raise additional capital when needed,facility and term loan could have a material adverse effect on our business, financial condition and operations will be materially and adversely affected.results of operations.
Our variable rate indebtedness subjects us to interest rate risk, which could cause our debt service obligations to increase significantly.
Borrowings under our revolving credit facility and term loan are at variable rates of interest and expose us to interest rate risk. Interest rates are currently at historicallyrelatively low levels. If interest rates increase, our debt service obligations on the variable rate indebtedness will
increase even though the amount borrowed remains the same, and our net income and cash flows, including cash available for servicing our indebtedness, will correspondingly decrease. We managepreviously managed our exposure to interest rate movements on our term loan through the use of an interest rate swap agreement on a notional amount of $39.5$39.3 million, equal to half of our term loan obligation under our previously existing amended and restated credit agreement entered intowhich matured on April 2, 2015 and recently refinanced on June 28, 2016. We have elected not to designate our interest rate swap as a hedge; therefore, changes in the fair value of the derivative instrument may cause volatility in our interest expense based on fluctuations in interest rates.March 31, 2020. In the future, we may enter into similar interest rate swaps that involve the exchange of floating for fixed rate interest payments in order to reduce future interest rate volatility on the remaining unhedged portion of our term loan; however, there is no guarantee we may take such action and we may not fully mitigate our interest rate risk. A hypothetical 1% increase in LIBOR over the 1.52% floorLondon Interbank Offered Rate, or LIBOR could increase our annual interest expense and related cash flows by approximately $0.2$0.8 million based on the unhedged portion of the amounts outstanding under our credit facility as of June 30, 2017.2020.
We are an “emerging growth company”The Chief Executive of the U.K. Financial Conduct Authority (the “FCA”), which regulates LIBOR, has announced that the FCA will no longer persuade or compel banks to submit rates for the calculation of LIBOR after 2021. That announcement indicates that the continuation of LIBOR on the current basis cannot and we cannotwill not be certainguaranteed after 2021. Moreover, it is possible that LIBOR will be discontinued or modified prior to 2021. All of our $83.8 million of debt outstanding under our credit agreement as of June 30, 2020 bears interest at a floating rate that uses LIBOR as the applicable reference rate to calculate the interest. Our credit agreement provides that, if the reduced disclosure requirements applicableadministrative agent has determined that adequate means do not exist for ascertaining LIBOR or that LIBOR does not adequately and fairly reflect the cost to emerging growth companies will make our Class A Common Stock less attractive to investors.
We are an “emerging growth company” as defined in the Jumpstart Our Business Startups Act,lenders for making, funding or the JOBS Act. We have taken, and for as long as we continue to be an emerging growth company, we may choose to take, advantage of certain exemptions from various reporting requirements applicable to other public companies but not to emerging growth companies, which includes, among other things:
exemption from the auditor attestation requirements under Section 404 of the Sarbanes-Oxley Act;
reduced disclosure obligations regarding executive compensation in our periodic reports and proxy statements;
exemption from the requirements of holding non-binding stockholder votes on executive compensation arrangements; and
exemption from any public rules requiring mandatory audit firm rotation and auditor discussion and analysis and, unless the SEC otherwise determines, any future audit rules that may be adopted by the Public Company Accounting Oversight Board.
We could be an emerging growth company until the last day of the fiscal year following the fifth anniversary after our initial public offering (June 30, 2019) or until the earliest of (1) the last day of the fiscal year in which we have annual gross revenue of $1 billion or more, (2) the date on which we have, during the previous three-year period, issued more than $1 billion in non-convertible debt or (3) the date on which we are deemed to be a large accelerated filer under the federal securities laws. We will qualify as a large accelerated filer as of the first day of the first fiscal year after we have more than $700 million in outstanding common equity held by our non-affiliates. The valuemaintaining their loans, then all of our outstanding common equityloans under the credit agreement will be measured each yearconverted into loans that accrue interest at the alternative base rate on the last day of such interest period that determination is made. Further, the lenders under our second fiscal quarter.credit agreement will no longer be obligated to make loans using LIBOR as the applicable reference rate. In addition, our tax receivable agreement provides that, if for any reason the LLC is not able to make a tax distribution in an amount that is sufficient to make any required payment under the tax receivable agreement or we otherwise lack sufficient funds, interest would accrue on any unpaid amounts at LIBOR plus 500 basis points until they are paid. Our tax receivable agreement, however, does not provide for an alternative reference rate to LIBOR and, while we do not currently anticipate failing to pay any amounts owed under our tax receivable agreement, it is unclear how we would determine interest on any such amounts should we fail to pay as required under our tax receivable agreement.
UnderIf the JOBS Act, emerging growth companies are also permittedrate used to electcalculate interest on our outstanding floating rate debt under our credit agreement that currently uses LIBOR were to delay adoption of new or revised accounting standards until companies that are not subject to periodic reporting obligations are required to comply, if such accounting standards apply to non-reporting companies. We have made an irrevocable decision to opt out of this extended transition period for complying with new or revised accounting standards.
We cannot predict if investors will find our Class A Common Stock less attractive if we rely on these exemptions. If some investors find our Class A Common Stock less attractiveincrease by 1.0% either as a result thereof an increase in LIBOR or the result of the use of the alternative base rate, we would expect to incur additional interest expense on such indebtedness as of June 30, 2020 of approximately $0.8 million on an annualized basis. While we do not expect the potential impact of any LIBOR transition to have a material effect on our financial results based on our currently outstanding debt, uncertainty as to the nature of potential changes to LIBOR, fallback
provisions, alternative reference rates or other reforms could adversely impact our interest expense on our floating rate debt that currently uses LIBOR as the applicable reference rate. In addition, any alternative reference rates to LIBOR may be less active trading market forresult in interest that does not correlate over time with the payments that would have been made on our Class A Common Stockindebtedness if LIBOR was available in its current form. Further, the discontinuance or modification of LIBOR and uncertainty of an alternative reference rate may result in the increase in the cost of future indebtedness, which could have a material adverse effect on our stock price may be more volatile.financial condition, cash flow and results of operations. We intend to closely monitor the financial markets and the use of fallback provisions and alternative reference rates in 2020 in anticipation of the discontinuance or modification of LIBOR by the end of 2021.
Failure to maintain effective internal control over financial reporting or disclosure controls and procedures could have a material adverse effect on our business and stock price.
Section 404(a)404 of the Sarbanes-Oxley Act requires us to provide an annual management assessment of the effectiveness of our internal control over financial reporting and also requires our independent registered public accounting firm to attest to the effectiveness of our internal control over financial reporting. Management is similarly required to review disclosure controls, which are controls established to ensure that information required to be disclosed in SEC reports is recorded, processed, summarized and reported in a timely manner. Additionally, once we are no longer an emerging growth company, as defined by the JOBS Act, our independent registered public accounting firm will be required pursuant to Section 404(b) of the Sarbanes-Oxley Act to attest to the effectiveness of our internal control over financial reporting on an annual basis.
If we fail to maintain the adequacy of our internal controls, as suchsuch standards are modified, supplemented or amended from time to time, we may not be able to ensure that we can conclude on an ongoing basis that we have effective internal control over financial reporting. The existence of any material weakness could require management to devote significant time and incur significant expense to remediate any such material weakness and management may not be able to remediate any such material
weakness in a timely manner. The existence of any material weakness in our internal control over financial reporting could also result in errors in our financial statements that could require us to restate our financial statements, cause us to fail to meet our reporting obligations, and cause stockholders to lose confidence in our reported financial information, all of which could materially and adversely affect our business and stock price. In addition, if our independent registered public accounting firm is
unable to provide an unqualified attestation report on our internal controls, after we cease to be an emerging growth company, investors could lose confidence in our financial information and the price of our stock could decline.
We incur significant increased costs as a result of being a public company, and our management devotes substantial time to comply with the laws and regulations affecting public companies. We expect our costs to increase after we are no longer an emerging growth company.
We became a public company on January 30, 2014. As a public company, we have incurred significant legal, accounting and other expenses that we did not incur as a private company, including costs associated with public company reporting and corporate governance requirements, in order to comply with the rules and regulations imposed by the Sarbanes-Oxley Act, as well as rules implemented by the SEC and Nasdaq. We expect these costs to increase after we cease to qualify as an emerging growth company. Our management and other personnel devote a substantial amount of time to these compliance initiatives and our legal and accounting compliance costs have increased. It is likely that we will need to hire additional staff in the areas of investor relations, legal and accounting as we continue to operate as a public company. We also believe it is more difficult and expensive for us to obtain director and liability insurance as a public company, and we may be required to accept reduced policy limits and coverage or incur substantially higher costs to obtain the same or similar coverage. As a result, it may be more difficult for us to attract and retain qualified individuals to serve on our board of directors or as executive officers. We are currently evaluating and monitoring developments with respect to these rules, and we cannot predict or estimate the amount of additional costs we may incur in the future or the timing of such costs.
The Sarbanes-Oxley Act requires, among other things, that we maintain effective internal controls over financial reporting and disclosure controls and procedures. In particular, as a public company, we are required to perform system and process evaluations and testing of our internal control over financial reporting to allow management and our independent registered public accounting firm to report on the effectiveness of our internal controls over financial reporting, as required by Section 404 of the Sarbanes-Oxley Act. As an emerging growth company, we are not required to comply with the auditor attestation provisions of Section 404. Our testing, or the subsequent testing by our independent registered public accounting firm, may reveal deficiencies in our internal control over financial reporting that are deemed to be material weaknesses. Our compliance with Section 404 requires that we incur substantial accounting expense and management time on compliance-related issues. Moreover, if we are not able to comply with the requirements of Section 404 in a timely manner, or if we or our independent registered public accounting firm identify deficiencies in our internal control over financial reporting that are deemed to be material weaknesses, we could lose investor confidence in the accuracy and completeness of our financial reports, which could cause our stock price to decline.
When we cease to qualify as an emerging growth company, we expect to incur additional expenses and devote increased management effort toward ensuring compliance with them. We cannot predict or estimate the amount of additional costs we may incur as a result of becoming a public company or the timing of such costs.
Risks Related to Our Organizational Structure
Our only material asset is our interest in the LLC, and we are accordingly dependent upon distributions from the LLC to pay taxes, make payments under the tax receivable agreement or pay dividends.
Malibu Boats, Inc. is a holding company and has no material assets other than our ownership of LLC Units. Malibu Boats, Inc. has no independent means of generating revenue. We intend to cause the LLC to make distributions to its unit holders in an amount sufficient to cover all applicable taxes at assumed tax rates, payments under the tax receivable agreement and dividends, if any, declared by us. To the extent that we need funds, and the LLC is restricted from making such distributions under applicable law or regulation or under the terms of its financing arrangements, or is otherwise unable to provide such funds, it could materially adversely affect our liquidity and financial condition. For example, our credit agreement generally prohibits the LLC, Malibu Boats, LLC, Malibu Australian Acquisition Corp., Cobalt Boats, LLC and Malibu Domestic International Sales Corp.PB Holdco, LLC from paying dividends or making distributions. Our credit facilityagreement permits, however, (i) distributions based on a member’s allocated taxable income, (ii) distributions to fund payments that are required under the LLC’s tax receivable agreement, (iii) purchase of stock or stock options of the LLC from former officers, directors or employees of loan parties or payments pursuant to stock option and other benefit plans up to $2,000,000$2.0 million in any fiscal year, and (iv) share repurchase payments up to $20,000,000$35.0 million in any fiscal year subject to one-year carry forward and compliance with other financial covenants. In addition, the LLC may make dividends and distributions of up to $6,000,000$10.0 million in any fiscal year, subject to compliance with other financial covenants.
We will be required to pay the pre-IPO owners (or any permitted assignee) assignee) for certain tax benefits pursuant to our tax receivable agreement with them, and the amounts we may pay could be significant.
We entered into a tax receivable agreement with the pre-IPO owners (or their permitted assignees) that provides for the payment by us to the pre-IPO owners (or any permitted assignee) of 85% of the tax benefits, if any, that we are deemed to realize as a result of (1) the increases in tax basis resulting from our purchases or exchanges of LLC Units and (2) certain other tax benefits related to our entering into the tax receivable agreement, including tax benefits attributable to payments under the tax receivable agreement. These payment obligations are our obligations and not of the LLC. For purposes of the agreement, the benefit deemed realized by us will be computed by comparing our actual income tax liability (calculated with certain assumptions) to the amount of such taxes that we would have been required to pay had there been no increase to the tax basis of the assets of the LLC as a result of the purchases or exchanges, and had we not entered into the tax receivable agreement. Estimating the amount of payments that may be made under the tax receivable agreement is by its nature imprecise, insofar as
the calculation of amounts payable depends on a variety of factors. The actual increase in tax basis, as well as the amount and timing of any payments under the agreement, will vary depending upon a number of factors, including:
•thetimingofpurchasesorexchanges-for -forinstance,theincreaseinanytaxdeductionswillvarydependingonthefair value, which may fluctuate over time, of the depreciable or amortizable assets of the LLC at the time of each purchase orexchange;
•the price of shares of our Class A Common Stock at the time of the purchase or exchange-the - the increase in any tax deductions,aswellasthetaxbasisincreaseinotherassets,oftheLLCisdirectlyrelatedtothepriceofsharesofour Class A Common Stock at the time of the purchase orexchange;
•theextenttowhichsuchpurchasesorexchangesaretaxable-if -ifanexchangeorpurchaseisnottaxableforany reason, increased deductions will not be available;and
•theamountandtimingofourincome-the -thecorporatetaxpayerwillberequiredtopay85%ofthedeemedbenefitsas and when deemed realized. If we do not have taxable income, we generally will not be required (absent a change of control or other circumstances requiring an early termination payment) to make payments under the tax receivable agreement for that taxable year because no benefit will have been realized. However, any tax benefits that do not result in realized benefits in a given tax year will likely generate tax attributes that may be utilized to generate benefits in previous or future tax years. The utilization of such tax attributes will result in payments under the tax receivableagreement.
For more information see Note 23 to our audited consolidated financial statements included elsewhere in this Annual Report.
We expect that the payments that we may make under the tax receivable agreement may be substantial. Assuming no material changes in the relevant tax law, and that we earn sufficient taxable income to realize all tax benefits that are subject to the agreement, we expect that future payments under the tax receivable agreement relating to the purchases by Malibu Boats, Inc. of LLC Units will be approximately $82.3$49.7 million over the next 18seventeen (17) years. Future payments to pre-IPO owners (or their permitted assignees) in respect of subsequent exchanges or purchases would be in addition to these amounts and are expected to be substantial. The foregoing numbers are merely estimates and the actual payments could differ materially. It is possible that future transactions or events, such as changes in tax legislation, could increase or decrease the actual tax benefits realized and the corresponding tax receivable agreement payments. For example, during the fourthsecond quarter of fiscal year end 2017,2018, the state of TennesseeU.S. Congress enacted tax legislation called the Tax Cuts and Jobs Act of 2017 ("the Tax Act") on December 22, 2017, which, amongotherprovisions,loweredourU.S.corporatetaxratefrom35%to21%,effectiveJanuary1,2018.TheTaxActlowered the estimated tax rate used in computingto compute our future tax obligations and, in turn, reduced the future tax benefit expected to be realizedbyusrelatedtoincreasedtaxbasisfromprevioussalesandexchangesofLLCUnitsbypre-IPO owners. The change in ownersofthe underlying tax rate assumptions used to estimate our tax receivable agreement liability resulted in a decrease in such liability of $8.1 million during the fourth quarter of fiscal year 2017.LLC.
Further, there may be a material negative effect on our liquidity if distributions to us by the LLC are not sufficient to permit us to make payments under the tax receivable agreement after we have paid taxes. For example, we may have an obligation to make tax receivable agreement payments for a certain amount while receiving distributions from the LLC in a lesser amount, which would negatively affect our liquidity. The payments under the tax receivable agreement are not conditioned upon the pre-IPO owners'owners’ (or any permitted assignees’) continued ownership of us.
We are required to make a good faith effort to ensure that we have sufficient cash available to make any required payments under the tax receivable agreement. The limited liability company agreement of the LLC requires the LLC to make “tax distributions” which, in the ordinary course, will be sufficient to pay our actual tax liability and to fund required payments under the tax receivable agreement. If for any reason the LLC is not able to make a tax distribution in an amount that is
sufficient to make any required payment under the tax receivable agreement or we otherwise lack sufficient funds, interest would accrue on any unpaid amounts at the London Interbank Offered Rate, or LIBOR, plus 500 basis points until they are paid.
In certain cases, payments under the tax receivable agreement to the pre-IPO owners (or any permitted assignees) of LLC Units may be accelerated or significantly exceed the actual benefits we realize in respect of the tax attributes subject to the tax receivable agreement.
The tax receivable agreement provides that, in the event that we exercise our right to early termination of the tax receivable agreement, or in the event of a change in control or a material breach by us of our obligations under the tax receivable agreement, the tax receivable agreement will terminate, and we will be required to make a lump-sum payment equal to the
present value of all forecasted future payments that would have otherwise been made under the tax receivable agreement, which lump-sum payment would be based on certain assumptions, including those relating to our future taxable income. The change in control payment and termination payments to the pre-IPO owners (or any permitted assignees) could be substantial and could exceed the actual tax benefits that we receive as a result of acquiring the LLC Units because the amounts of such payments would be calculated assuming that we would have been able to use the potential tax benefits each year for the remainder of the amortization periods applicable to the basis increases, and that tax rates applicable to us would be the same as they were in the year of the termination. In these situations, our obligations under the tax receivable agreement could have a substantial negative impact on our liquidity. There can be no assurance that we will be able to finance our obligations under the tax receivable agreement.
Payments under the tax receivable agreement will be based on the tax reporting positions that we determine. Although we are not aware of any issue that would cause the Internal Revenue Service, or the IRS, to challenge a tax basis increase, Malibu Boats, Inc. will not be reimbursed for any payments previously made under the tax receivable agreement. As a result, in certain circumstances, payments could be made under the tax receivable agreement in excess of the benefits that Malibu Boats, Inc. actually realizes in respect of (1) the increases in tax basis resulting from our purchases or exchanges of LLC Units and (2) certain other tax benefits related to our entering into the tax receivable agreement, including tax benefits attributable to payments under the tax receivable agreement.
Risks Related to Our Class A Common Stock
Our stock price may be volatile and stockholders may be unable to sell shares at or above the price at which they purchased them.
Our stock price ranged from $12.13$18.02 per share to $29.50$56.93 per share during fiscal year 2017.2020. The market price of our Class A Common Stock could be subject to wide fluctuations in response to the many risk factors listed in this section, and others beyond our control, including:
•the impact of COVID-19 on our ability to integrate our recent acquisition of Cobalt into our business;
operations, consumer demand and general economic market and industry conditions;
•actual or anticipated fluctuations in our financial condition and results ofoperations;
•addition or loss of consumers ordealers;
•actual or anticipated changes in our rate of growth relative to ourcompetitors;
•additions or departures of keypersonnel;
•failure to introduce new products, or for those products to achieve marketacceptance;
•disputesorotherdevelopmentsrelatedtoproprietaryrights,includingpatents,litigationmattersandourabilityto obtain intellectual property protection for ourtechnologies;
•announcementsbyusorourcompetitorsofsignificantacquisitions,strategicpartnerships,jointventuresorcapital commitments;
•fluctuations in the valuation of companies perceived by investors to be comparable tous;
•changes in applicable laws orregulations;
•issuance of new or updated research or reports by securitiesanalysts;
•sales of our Class A Common Stock by us or our stockholders;and
•share price and volume fluctuations attributable to inconsistent trading volume levels of our shares; and
the expiration of contractual lock-up agreements with our executive officers, directors and stockholders.shares.
Further, the stock markets may experience extreme price and volume fluctuations that can affect the market prices of equity securities. These fluctuations can be unrelated or disproportionate to the operating performance of those companies. These broad market and industry fluctuations, as well as general economic, political and market conditions such as recessions, interest rate changes or international currency fluctuations, could harm the market price of our Class A Common Stock.
In the past, companies that have experienced volatility in the market price of their stock have been subject to securities class action litigation. We may be the target of this type of litigation in the future. Securities litigation against us could result in substantial costs and divert our management’s attention from other business concerns, which could harm our business.
If securities or industry analysts do not publish research or reports about our business, or publish negative reports about our business, our share price and trading volume could decline.
The trading market for our Class A Common Stock willmay depend on the research and reports that securities or industry analysts publish about us or our business. We do not have any control over these analysts. If one or more of the analysts who cover us downgrade our shares or change their opinion of our shares, our share price would likely decline. If one or more of these analysts cease coverage of our company or fail to regularly publish research or reports on us, we could lose visibility in the financial markets, which could cause our stock price or trading volume to decline.
Future sales of our Class A Common Stock in the public market could cause our share price to fall; furthermore, you may be diluted by future issuances of Class A Common Stock in connection with our incentive plans, acquisitions or otherwise.
Sales of a substantial number of shares of our Class A Common Stock in the public market, in particular sales by our directors, officers or other affiliates,, or the perception that these sales might occur, could depress the market price of our Class A Common Stock and could impair our ability to raise capital through the sale of additional equity securities. Furthermore, any Class A Common Stock that we issue in connection with our Long-Term Incentive Plan or other equity incentive plans that we may adopt in the future, our acquisitions or otherwise would dilute the percentage ownership of holders of our Class A Common Stock.
Our governing documents and Delaware law could prevent a takeover that stockholders consider favorable and could also reduce the market price of our stock.
Our certificate of incorporation and bylaws contain certain provisions that could delay or prevent a change in control. These provisions could also make it more difficult for stockholders to elect directors and take other corporate actions. These provisions include, without limitation:
•a classified boardstructure;
•arequirementthatstockholdersmustprovideadvancenoticetoproposenominationsorhaveotherbusiness considered at a meeting ofstockholders;
•supermajoritystockholderapprovaltoamendourbylawsorcertainprovisionsinourcertificateofincorporation;and
•authorization of blank check preferredstock.
In addition, we are subject to the provisions of Section 203 of the Delaware General Corporation Law. These provisions may prohibit large stockholders, in particular those owning 15% or more of our outstanding Class A Common Stock, from engaging in certain business combinations without the approval of substantially all of our stockholders for a certain period of time.
These and other provisions in our certificate of incorporation, bylaws and under Delaware law could discourage potential takeover attempts, reduce the price that investors might be willing to pay for shares of our Class A Common Stock in the future and result in the market price being lower than it would be without these provisions.
We currently do not intend to pay dividends on our Class A Common Stock and, consequently, the only opportunity for stockholders to achieve a return on their investment is if the price of our Class A Common Stock appreciates.
We currently do not plan to declare or pay dividends on shares of our Class A Common Stock in the foreseeable future.
Further, because we are a holding company, our ability to pay dividends depends on our receipt of cash distributions from the LLC and the LLC also relies on its subsidiaries for receipt of cash for distributions. This may further restrict our ability to pay dividends as a result of the laws of the jurisdiction of organization of the LLC and its subsidiaries, agreements of the LLC or its subsidiaries or covenants under our, the LLC’s or its subsidiaries’ existing or future indebtedness. For example, our credit agreement generally prohibits the LLC, Malibu Boats, LLC, Malibu Australian Acquisition Corp., Cobalt Boats, LLC and Malibu Domestic International Sales Corp.PB Holdco, LLC from paying dividends or making distributions. Our credit agreement permits, however, (i) distributions based on a member’s allocated taxable income, (ii) distributions to fund payments that are required under the LLC’s tax receivable agreement, (iii) purchase of stock or stock options of the LLC from former officers, directors or employees of loan parties or payments pursuant to stock option and other benefit plans up to $2,000,000$2.0 million in any fiscal year, and (iv) share repurchase
payments up to $20,000,000$35.0 million in any fiscal year subject to one-year carry forward and compliance with other financial covenants. In addition, the LLC may make dividends and distributions of up to $6,000,000$10.0 million in any fiscal year, subject to compliance with other financial covenants. Consequently, for stockholders the only opportunity to achieve a return on the shares they purchase will be if the market price of our Class A Common Stock appreciates and they sell their shares at a profit.
Item 1B. Unresolved Staff Comments
Not applicable.None.
Item 2. Properties
Tennessee
Our Malibu and Axis boats are manufactured and tested onin Loudon, Tennessee. We lease the lake at the site ofproperty where we have our 197,300 square-foot primary manufacturing facility located in Loudon, Tennessee. Our primary facilitythat is used to manufacture Malibu and Axis boats. This property also includes warehouse and office space. The property is leased pursuant to a lease agreement that has a term through March 31, 2028, with the option to extend for three additional terms of ten years each.
On April 1, 2016, we completed an addition toWe also own 112,000 square-feet of space neighboring our warehouse and loadingmanufacturing facility on 16 acres of land we own in Loudon, Tennessee. The facility contains approximately 42,000 square feet of production, warehouseTennessee that we use for our trailer and office space and is used primarily for trailer manufacturing and handling and shipping of our finished boats. Theseengine production. Our Tennessee facilities are used in our U.S.Malibu segment.
On November 10, 2016,Kansas
Our Cobalt boats are manufactured in Neodesha, Kansas. We own the property in Neodesha, where we completed the purchase of an additional facility in Loudon, Tennessee. The facility contains approximately 70,000have four manufacturing facilities aggregating 493,000 square feet of production, warehouse and officemanufacturing space, and is utilized for our vertical integration initiatives. This facility isincluding a 42,000 square foot expansion completed in June 2020. Our Neodesha facilities are used in our U.S.Cobalt segment.
Florida
Our Pursuit boats are manufactured in Fort Pierce, Florida. We own the property in Fort Pierce, where we have six manufacturing facilities aggregating 392,100 square feet of manufacturing space, including 181,000 square feet of a new manufacturing facility completed in June 2020. Our Fort Pierce facilities are used in our Pursuit segment.
California
We lease a 172,500 square-foot facility in Merced, California pursuant to a lease agreement that has a term through March 31, 2028, with the option to extend for three additional terms of ten years each. Our Merced site houses both our product development team that focuses on design innovations as well as our tower and tower accessory manufacturing operations. The components assembled at this site are delivered to our facilities in Tennessee and our Australian licensee.subsidiary. Our Merced site is used in both our U.S. and Australia segments.Malibu segment.
Australia
We manufacture and test boats at two facilities in Albury, Australia with combined square-footage of 68,222.68,200. Each facility is leased pursuant to a lease agreement and each with a term through October 22, 2024, with two 5-yearfive-year options to extend lease term. TheseOur Albury facilities are used in our AustraliaMalibu segment.
Kansas
On July 6, 2017, we completed the acquisition of Cobalt and its manufacturing facilities. Cobalt boats are manufactured in Neodesha, Kansas with four locations providing 451,000 square feet of manufacturing space.
Item 3. Legal Proceedings
The discussion of legal matters under the section entitled "Legal Proceedings" is incorporated by reference from Note 1518 of our audited consolidated financial statements included elsewhere in this Annual Report.Report on Form 10-K.
Item 4. Mine Safety Disclosures
Not Applicable.
PART II.
Item 5. Market for Registrant's Common Equity, Related Stockholder Matters and Issuer Purchases of Equity Securities
Market Information
Our Class A Common Stock has beenis listed on the NASDAQNasdaq Global Select Market under the symbol “MBUU” since January 31, 2014. Prior to that date, there was no public trading market for our Class A Common Stock. The following table sets forth, for the periods indicated, the high and low sales prices of our Class A Common Stock as reported by the NASDAQ Global Select Market since our initial public offering:"MBUU".
|
| | | | | | | |
| | High | | Low |
| Fiscal Year 2016 | | | |
| First Quarter | $ | 21.47 |
| | $ | 13.57 |
|
| Second Quarter | $ | 16.83 |
| | $ | 12.90 |
|
| Third Quarter | $ | 16.71 |
| | $ | 11.97 |
|
| Fourth Quarter | $ | 18.08 |
| | $ | 11.38 |
|
| | | | |
| Fiscal Year 2017 | | | |
| First Quarter | $ | 16.78 |
| | $ | 12.13 |
|
| Second Quarter | $ | 20.10 |
| | $ | 14.12 |
|
| Third Quarter | $ | 22.95 |
| | $ | 17.17 |
|
| Fourth Quarter | $ | 29.50 |
| | $ | 21.39 |
|
On September 6, 2017,August 28, 2020, the last reported sale price on the NASDAQNasdaq Global Select Market of our Class A Common Stock was $26.79$55.32 per share. As of September 6, 2017,August 28, 2020, we had approximately seven holders of record of our Class A Common Stock and 18 13 holders of record of our Class B Common Stock. The actual number of stockholders is greater than this number of record holders, and includes stockholders who are beneficial owners, but whose shares are held in street name by brokers and other nominees. This number of holders of record also does not include stockholders whose shares may be held in trust by other entities.
Dividends
Malibu Boats, Inc. has never declared or paid any cash dividends on its capital stock. We currently anticipate that we will retain all of our future earnings for use in the expansion and operation of our business and do not anticipate paying any cash dividends in the foreseeable future. Any future determination to declare cash dividends will be made at the discretion of our board of directors, subject to applicable law and will depend on our financial condition, results of operations, capital requirements, general business conditions and other factors that our board of directors may deem relevant. In addition, our credit facility restricts our ability to pay dividends on our capital stock in certain cases.
Malibu Boats, Inc. is a holding company and has no material assets other than its ownership of LLC Units. We intend to cause the LLC to make distributions to us in an amount sufficient to cover cash dividends, if any, declared by us. If the LLC makes such distributions to Malibu Boats, Inc., the other holders of LLC Units will be entitled to receive equivalent distributions on a pro rata basis.
Our credit agreement governing our credit facility generally prohibits the LLC and our other subsidiaries from paying dividends or making distributions to us. Our credit agreement permits, however, (i) distributions based on a member’s allocated taxable income, (ii) distributions to fund payments that are required under the LLC’s tax receivable agreement, (iii) purchase of stock or stock options of the LLC from former officers, directors or employees of loan parties or payments pursuant to stock option and other benefit plans up to $2,000,000 in any fiscal year, and (iv) share repurchase payments up to $20,000,000 in any fiscal year subject to one-year carry forward and compliance with other financial covenants. In addition, the LLC may make dividends and distributions of up to $6,000,000 in any fiscal year, subject to compliance with other financial covenants.
Stock Performance Graph
The stock price performance graph below shall not be deemed soliciting material or to be filed with the SEC or subject to Regulation 14A or 14C under the Exchange Act or to the liabilities of Section 18 of the Exchange Act, nor shall it be incorporated by reference into any past or future filing under the Securities Act of 1933, as amended, or the Securities Act or the Exchange Act, except to the extent we specifically request that it be treated as soliciting material or specifically incorporate it by reference into a filing under the Securities Act or the Exchange Act.
The following graph shows the cumulative total stockholder return of an investment of $100 in cash at market close on January 31, 2014 (the first dayat the end of tradingeach of our Class A Common Stock), throughthe years within the five-year period ended June 30, 20172020 for (i) our Class A Common Stock, and (ii) performance of the Russell 2000 Index and (iii) the Dow Jones Recreational Vehicle Index for the same period.Product Index. Pursuant to applicable SEC rules, all values assume reinvestment of the full amount of all dividends, however no dividends have been declared on our Class A Common Stock to date. The stockholder return shown on the graph below is not necessarily indicative of future performance, and we do not make or endorse any predictions as to future stockholder returns.
Issuer Purchases of Equity Securities
We did not repurchase any stock during the quarter ended June 30, 2017. The stock repurchase program which was authorized by2020. On June 18, 2019, our Board of Directors on Februaryauthorized a stock repurchase program to allow for the repurchase of up to $35.0 million of our Class A Common Stock and the
LLC's LLC Units (the “Repurchase Program”) for the period from July 1, 20162019 to July 1, 2020. During the fiscal year ended June 30, 2020, we repurchased 483,679 shares of Class A Common Stock for $13.8 million in cash including related fees and expenses. This repurchase program expired on February 8, 2017.July 1, 2020. On August 27, 2020, our Board of Directors authorized a new stock repurchase program (the "New Repurchase Program") for the repurchase of up to $50.0 million of Class A Common Stock and the LLC Units for the period from September 2, 2020 to July 1, 2021. No shares have been repurchased under the New Repurchase Program.
Unregistered Sales of Equity Securities
On May 18, 2020, in connection with the exchange of limited liability company interests of the LLC by a member of the LLC, the Company issued a total of 12,500 shares of its Class A Common Stock, par value $0.01 per share for nominal consideration to such member in reliance on the exemption under Section 4(a)(2) of the Securities Act.
On May 19, 2020, in connection with the exchange of limited liability company interests of the LLC by a member of the LLC, the Company issued a total of 20,000 shares of its Class A Common Stock, par value $0.01 per share for nominal consideration to such member in reliance on the exemption under Section 4(a)(2) of the Securities Act.
On May 19, 2020, in connection with the exchange of limited liability company interests of the LLC by a member of the LLC, the Company issued a total of 1,000 shares of its Class A Common Stock, par value $0.01 per share for nominal consideration to such member in reliance on the exemption under Section 4(a)(2) of the Securities Act.
On May 20, 2020, in connection with the exchange of limited liability company interests of the LLC by a member of the LLC, the Company issued a total of 25,000 shares of its Class A Common Stock, par value $0.01 per share for nominal consideration to such member in reliance on the exemption under Section 4(a)(2) of the Securities Act.
Equity Compensation Plan Information
Equity compensation plan information required by this Item 5 will be included in our definitive proxy statement for our annual meeting of stockholders, which will be filed with the SEC no later than 120 days after the end of our fiscal year ended June 30, 20172020 (the "Proxy Statement"), and is incorporated herein by reference.
Item 6. Selected Financial Data
The following table presents our selected financial data. The table should be read in conjunction with "Item 7. Management’s Discussion and Analysis of Financial Condition and Results of Operations," and "Item 8. Financial Statements and Supplementary Data," of this Annual Report on Form 10-K.
The selected financial data below does not reflect the financial results for Cobalt Boats, LLC, which we acquired on July 6, 2017. The audited consolidated financial statements of Cobalt Boats, LLC as of and for each of the fiscal years ended September 30, 2014, 2015 and 2016, the unaudited condensed consolidated financial statements of Cobalt Boats, LLC as of March 31, 2017 and for each of the six months ended March 31, 2016 and 2017, and the unaudited pro forma financial information of Malibu Boats, Inc. giving effect to the acquisition of Cobalt and related transactions as if it occurred on July 1, 2015, in each case together with the notes related thereto, appear in our Current Report on Form 8-K/A filed on July 12, 2017. | | | | | | | | | | | | | | | | | | | | | | | | | | | | | |
| | Fiscal Year Ended June 30, | | | | | | | | |
| | 2020 | | 2019 | | 2018 | | 2017 | | 2016 |
| | | | | | | | | |
| | (Dollars in thousands) | | | | | | | | |
| Consolidated statement of operations and comprehensive income data: | | | | | | | | | |
| Net sales | $ | 653,163 | | | $ | 684,016 | | | $ | 497,002 | | | $ | 281,937 | | | $ | 252,965 | |
| Cost of sales | 503,893 | | | 517,746 | | | 376,660 | | | 206,899 | | | 186,145 | |
| Gross profit | 149,270 | | | 166,270 | | | 120,342 | | | 75,038 | | | 66,820 | |
| Operating expenses: | | | | | | | | | |
| Selling and marketing | 17,917 | | | 17,946 | | | 13,718 | | | 8,619 | | | 7,475 | |
| General and administrative | 39,912 | | | 44,256 | | | 31,359 | | | 24,783 | | | 21,256 | |
| Amortization | 6,131 | | | 5,956 | | | 5,198 | | | 2,198 | | | 2,185 | |
| Operating income | 85,310 | | | 98,112 | | | 70,067 | | | 39,438 | | | 35,904 | |
| Other (income) expense, net | 1,578 | | | 6,315 | | | (19,320) | | | (9,230) | | | 3,808 | |
| Net income before income tax expense | 83,732 | | | 91,797 | | | 89,387 | | | 48,668 | | | 32,096 | |
| Income tax expense | 19,076 | | | 22,096 | | | 58,418 | | | 17,593 | | | 11,801 | |
| Net income | 64,656 | | | 69,701 | | | 30,969 | | | 31,075 | | | 20,295 | |
Net income attributable to non-controlling interest 1 | 3,094 | | | 3,635 | | | 3,356 | | | 2,717 | | | 2,253 | |
| Net income attributable to Malibu Boats, Inc. | $ | 61,562 | | | $ | 66,066 | | | $ | 27,613 | | | $ | 28,358 | | | $ | 18,042 | |
| | | | | | | | | |
| Net income available to Class A Common Stock per share: | | | | | | | | | |
| Basic | $ | 2.98 | | | $ | 3.17 | | | $ | 1.37 | | | $ | 1.59 | | | $ | 1.01 | |
| Diluted | $ | 2.95 | | | $ | 3.15 | | | $ | 1.36 | | | $ | 1.58 | | | $ | 1.00 | |
| | | | | | | | | |
| Weighted average shares outstanding used in computing net income per share: | | | | | | | | | |
| Basic | 20,662,750 | | | 20,832,445 | | | 20,179,381 | | | 17,846,894 | | | 17,934,580 | |
| Diluted | 20,852,361 | | | 20,966,539 | | | 20,281,210 | | | 17,951,332 | | | 17,985,427 | |
| | | | | | | | | |
| Consolidated balance sheet data: | | | | | | | | | |
| Total assets | $ | 477,346 | | | $ | 451,314 | | | $ | 365,768 | | | $ | 223,663 | | | $ | 222,326 | |
| Total current liabilities | 70,163 | | | 75,332 | | | 65,386 | | | 39,185 | | | 47,829 | |
| Total long-term liabilities | 145,656 | | | 165,629 | | | 160,511 | | | 132,242 | | | 154,468 | |
| Total stockholders’/members' equity | 261,527 | | | 210,353 | | | 139,871 | | | 52,236 | | | 20,029 | |
| | | | | | | | | |
| Additional financial and other data: | | | | | | | | | |
| Unit volume | 6.444 | | | 7,362 | | | 6,292 | | | 3,815 | | | 3,569 | |
| Gross margin | 22.8 | % | | 24.3 | % | | 24.2 | % | | 26.6 | % | | 26.4 | % |
Adjusted EBITDA 2 | $ | 110,947 | | | $ | 125,895 | | | $ | 92,718 | | | $ | 55,721 | | | $ | 48,231 | |
Adjusted EBITDA margin 2 | 17.0 | % | | 18.4 | % | | 18.7 | % | | 19.8 | % | | 19.1 | % |
Adjusted fully distributed net income per share 2 | $ | 3.29 | | | $ | 3.76 | | | $ | 2.60 | | | $ | 1.56 | | | $ | 1.32�� | |
|
| | | | | | | | | | | | | | | | | | | |
| | Fiscal Year Ended June 30,
|
| | 2017 | | 2016 | | 2015 | | 2014 (1) | | 2013 |
| | (Dollars in thousands) |
| Consolidated statement of operations and comprehensive income (loss) data: | | | | | | | | | |
| Net sales | $ | 281,937 |
| | $ | 252,965 |
| | $ | 228,621 |
| | $ | 190,935 |
| | $ | 167,012 |
|
| Cost of sales | 206,899 |
| | 186,145 |
| | 168,192 |
| | 140,141 |
| | 123,412 |
|
| Gross profit | 75,038 |
| | 66,820 |
| | 60,429 |
| | 50,794 |
| | 43,600 |
|
| Operating expenses: | | | | | |
| | |
| | |
|
| Selling and marketing | 8,619 |
| | 7,475 |
| | 7,007 |
| | 6,098 |
| | 4,937 |
|
| General and administrative | 24,783 |
| | 21,256 |
| | 19,809 |
| | 39,974 |
| | 14,177 |
|
| Amortization | 2,198 |
| | 2,185 |
| | 2,463 |
| | 5,177 |
| | 5,178 |
|
| Operating income (loss) | 39,438 |
| | 35,904 |
| | 31,150 |
| | (455 | ) | | 19,308 |
|
| Other income (expense), net | 9,230 |
| | (3,808 | ) | | 696 |
| | (2,953 | ) | | (1,324 | ) |
| Net income (loss) before income tax expense (benefit) | 48,668 |
| | 32,096 |
| | 31,846 |
| | (3,408 | ) | | 17,984 |
|
| Income tax expense (benefit) | 17,593 |
| | 11,801 |
| | 8,663 |
| | (2,220 | ) | | — |
|
| Net income (loss) | 31,075 |
| | 20,295 |
| | 23,183 |
| | (1,188 | ) | | 17,984 |
|
Net income attributable to non-controlling interest 2 | 2,717 |
| | 2,253 |
| | 8,522 |
| | 3,488 |
| | 17,984 |
|
| Net income (loss) attributable to Malibu Boats, Inc. | $ | 28,358 |
| | $ | 18,042 |
| | $ | 14,661 |
| | $ | (4,676 | ) | | $ | — |
|
| | | | | | | | | | |
Net income (loss) available to Class A Common Stock per share 3: | | | | | | | For Period from February 5, 2014 to June 30, 2014 | | |
| Basic | $ | 1.59 |
| | $ | 1.01 |
| | $ | 0.93 |
| | $ | (0.42 | ) | | |
|
| Diluted | $ | 1.58 |
| | $ | 1.00 |
| | $ | 0.93 |
| | $ | (0.42 | ) | | |
|
| | | | | | | | | | |
| Weighted average shares outstanding used in computing net income (loss) per share: | | | | | | | | | |
| Basic | 17,846,894 |
| | 17,934,580 |
| | 15,732,531 |
| | 11,055,310 |
| | |
| Diluted | 17,951,332 |
| | 17,985,427 |
| | 15,741,018 |
| | 11,055,310 |
| | |
| | | | | | | | | | |
| Consolidated balance sheet data: | | | | | |
| | |
| | |
|
| Total assets | $ | 223,663 |
| | $ | 222,326 |
| | $ | 200,314 |
| | $ | 84,801 |
| | $ | 65,927 |
|
| Total liabilities | 171,427 |
| | 202,297 |
| | 199,029 |
| | 56,731 |
| | 45,913 |
|
| Total stockholders’/members' equity | 52,236 |
| | 20,029 |
| | 1,285 |
| | 28,070 |
| | 20,014 |
|
| | | | | | | | | | |
| Additional financial and other data: | | | | | | | | | |
| Unit volume | 3,815 |
| | 3,569 |
| | 3,404 |
| | 2,910 |
| | 2,672 |
|
| Gross margin | 26.6 | % | | 26.4 | % | | 26.4 | % | | 26.6 | % | | 26.1 | % |
Adjusted EBITDA 4 | $ | 55,721 |
| | $ | 48,231 |
| | $ | 43,648 |
| | $ | 37,272 |
| | $ | 31,758 |
|
Adjusted EBITDA margin 4 | 19.8 | % | | 19.1 | % | | 19.1 | % | | 19.5 | % | | 19.0 | % |
Adjusted fully distributed net income per share 4 | $ | 1.56 |
| | $ | 1.32 |
| | $ | 1.11 |
| | $ | 0.78 |
| | $ | 0.68 |
|
|
| | | | |
| (1) | On February 5, 2014, we completed our initial public offering of Class A common stock. Immediately prior to the closing of the IPO, a new single class of LLC Units was allocated among the pre-IPO owners of the LLC in exchange for their prior membership interests of the LLC based upon the liquidation value of the LLC, assuming it was liquidated at the time of the IPO with a value implied by the initial public offering price of the shares of Class A Common Stock sold in the IPO. Immediately prior to the closing of the IPO, there were 17,071,424 LLC Units issued and outstanding. |
(2) | For the period after the IPO on February 5, 2014, theThe non-controlling interest represents the portion of earnings or (loss) attributable to the economic interest held by the non-controlling LLC Unit holders. The weighted average non-controlling interest attributable to ownership interests in the LLC was 3.8%, 4.1%, 5.3%, 7.0%, 11.1%, 36.8% and 50.7%11.1% for the fiscal years ended June 30, 2020, 2019, 2018, 2017, 2016, 2015 and for the period from February 5, 2014 (the date of our IPO) to June 30, 2014, respectively.2016. The non-controlling interest was 3.4%, 3.8%, 4.8%, 6.6% as of June 30, 2017,and 7.4% as of June 30, 20162020, 2019, 2018, 2017, and 2015 and 50.7% as of June 30, 2014, respectively. Since all of the earnings prior to and up to February 5, 2014 were entirely allocable to the LLC Unit holders, we updated our historical presentation to attribute these earnings to the non-controlling interest accordingly.2016. |
(3) | As noted above, all earnings (loss) prior and up to February 5, 2014, the date of completion of the IPO, were entirely allocable to the non-controlling interest. As a result, earnings (loss) per share information attributable to these historical periods is not comparable to earnings (loss) per share information attributable to the Company after the IPO and, as such, has been omitted. |
(4)(2) | Adjusted EBITDA, adjusted EBITDA margin, and adjusted fully distributed net income per share are non-GAAP financial measures. For definitions of adjusted EBITDA, adjusted EBITDA margin, and adjusted fully distributed net income and a reconciliation of each measure to net income for the fiscal years ended June 30, 2020, 2019, and 2018, see “Item 7. Management’s Discussion and Analysis of Financial Condition and Results of Operations-GAAP Reconciliation of Non-GAAP Financial Measures.” For a reconciliation of each measure to net income for the fiscal years ended June 30, 2017 and 2016, see “Item 7. Management’s Discussion and Analysis of Financial Condition and Results of Operations-GAAP Reconciliation of Non-GAAP Financial Measures” in our Annual Report on Form 10-K for the fiscal year ended June 30, 2018. |
Item 7. Management's Discussion and Analysis of Financial Condition and Results of Operations
Overview
We are a leading designer, manufacturer and marketer of a diverse range of recreational powerboats, including performance sport boats, sterndrive and outboard boats. We haveare the #1 market share positionleader in the United States in the performance sport boat category through our Malibu and Axis brands. With our recent acquisition of Cobalt, we also haveWake Research boat brands, the #1 market share positionleader in the United States in the 20’ - 40’ segment of the sterndrive boat category through our Cobalt brand and are among the market leaders in the 24’—29’ segmentfiberglass outboard fishing boat market with our Pursuit brand. Our product portfolio of the sterndrive category. Our boatspremium brands are used for a broad range of recreational boating activities including, among others, water sports, including water skiing, wakeboarding and wake surfing, as well as general recreational boating.boating and fishing. Our passion for consistent innovation, which has led to propriety technology such as Surf Gate, has allowed us to expand the market for our products by introducing consumers to new and exciting recreational activities. We believe we have been a consistent innovator in the recreational powerboat industry, designingdesign products that appeal to an expanding range of recreational boaters and water sports enthusiasts whose passion for boating and water sports is a key aspectcomponent of their lifestyle. We believe many of our innovations, such as our proprietary Surf Gate technology launched in 2012, expand the market for our products by introducing consumers to newactive lifestyle and exciting recreational activities. In July 2017, we added another strong brand in Cobalt with a versatile lineup of boats, further deepening our product portfolio, expanding our addressable market, and ultimately, our ability to provide consumers with a better customer-inspired experience. With performance, quality, value and multi-purpose features, our product portfolio has us well positioned to broaden our addressable market and achieve our goal of increasing our market share in the expanding recreational boating industry.
We currently sell our boats under threefour brands—Malibu; Axis; Cobalt; and Cobalt.Pursuit. Our flagship Malibu boats offer our latest innovations in performance, comfort and convenience, and are designed for consumers seeking a premium performance sport boat experience. Retail prices of our Malibu boats typically range from $50,000$60,000 to $180,000. We launched our$210,000. Our Axis boats in 2009 to appeal to consumers who desire a more affordable performance sport boat product but still demand high performance, functional simplicity and the option to upgrade key features. Retail prices of our Axis boats typically range from $50,000$65,000 to $95,000.$115,000. Our Cobalt boats consist of mid to large-sized luxury cruisers and bowriders that we believe offer the ultimate experience in comfort, performance and quality. Retail prices for our Cobalt boats typically range from $50,000$60,000 to $700,000.$450,000. Our Pursuit boats expand our product offerings into the saltwater outboard fishing market and include center console, dual console and offshore models. Retail prices for our Pursuit boats typically range from $80,000 to $800,000.
We sell our boats through a dealer network that we believe is the strongest in the recreational powerboat category. As of July 1, 2017,2020, our Malibu and Axis brandworldwide distribution channel consisted of 126 independent dealers operating in 146 locations in North America and we had 59 independentover 350 dealer locations across 40 countries outsideglobally. Our dealer base is an important part of North America, including Australia. Our acquisitionour consumers’ experience, our marketing efforts and our brands. We devote significant time and resources to find, develop and improve the performance of Cobalt has allowed us to expand into Cobalt’s strong network which consists of 111 independentour dealers operating 142 locations worldwide.
We have undergone significant growth since we were founded in 1982 and began building custom ski boats in a small shop in Merced, California. Beginning in 2009, under the leadership of new management, we implemented several measures designed to improve our cost structure, increase our operating leverage, enhance our product offerings and brands, and strengthenbelieve our dealer network. We have also continued to build on our legacy of innovation and invested in product development and process improvements from the evolution of our patented Power Wedge introduced in 2006, to the release ofnetwork gives us a distinct competitive advantage.
our patented Surf Gate technology in 2012, to the integration of the manufacturing of our towers and trailers and our current initiative to integrate our engine production. We believe our innovative features drive our high average selling prices.
As a result of our innovation, process improvements and strong dealer network and management team, among other reasons, we have achieved fiscal year 20172020 net sales, net income and adjusted EBITDA of $281.9$653.2 million, $31.1$64.7 million and $55.7$110.9 million, respectively, compared to $253.0which were a decrease from $684.0 million,, $20.3 $69.7 million and $48.2$125.9 million, respectively, for fiscal year 2016 and $228.6 million, $23.2 million and $43.6 million, respectively, for fiscal year 2015. For2019. The decrease from 2019 to 2020 resulted primarily from the fiscal year ended June 30, 2017, net sales increased 11.5%, gross margin as a percentageadverse impacts of sales increased to 26.6%, net income increased 53.1% and adjusted EBITDA increased 15.5% compared to the fiscal year ended June 30, 2016. Our results for fiscal years 2017, 2016 and 2015 includeCOVID-19 pandemic, including the impact of the temporary shutdown of our Australian licensee since its acquisition on October 23, 2014.facilities. For the definition of adjusted EBITDA and a reconciliation to net income, see “GAAP Reconciliation of Non-GAAP Financial Measures.”
Components of Results of Operations
Net Sales
We generate revenue fromhave three reportable segments, Malibu, Cobalt and Pursuit. The Malibu segment participates in the manufacturing, distribution, marketing and sale of Malibu and Axis performance sports boats tothroughout the world. The Cobalt and Pursuit
segments participate in the manufacturing, distribution, marketing and sale of Cobalt and Pursuit boats, respectively, throughout the world. Malibu is our dealers. The substantial majoritylargest segment and represented 54.3%, 54.8% and 63.7% of our net sales are derived from the salefor fiscal years 2020, 2019, and 2018 respectively. We acquired Cobalt in July 2017 and it represented 26.8%, 30.2% and 36.3% of boats, including optional features includedour net sales for fiscal years 2020, 2019 and 2018, respectively. We acquired Pursuit in October 2018 and it represented 18.9% and 15.0% of our net sales for fiscal years 2020 and 2019, respectively.
We revised our segment reporting at the timebeginning of fiscal year 2020 to conform to changes in our internal management reporting based on our boat manufacturing operations. Prior to this change in reporting segments, we had four reportable segments, Malibu U.S., Malibu Australia, Cobalt and Pursuit. We now aggregate Malibu U.S. and Malibu Australia into one reportable segment as they have similar economic characteristics and qualitative factors. All segment information in this Annual Report on Form 10-K prior to July 1, 2019 has been revised to conform to our current reporting segments for comparison purposes. Additional segment information is contained in Note 20 - Segment Reporting, in the notes to our consolidated financial statements included elsewhere in this Annual Report on Form 10-K.
Impact of the initial wholesale purchase ofCOVID-19 Pandemic
The COVID-19 pandemic has significantly impacted health and economic conditions throughout the boat. Net sales consists ofUnited States and the following:
Gross sales from:
Boat sales—consists of sales of boatsworld, and it had a significant impact on our operations and financial results for fiscal year 2020. On March 24, 2020, we elected to our dealer network. In addition, nearlysuspend operations at all of our boat sales include optional feature upgrades purchased by the consumer, such asfacilities. We resumed operations at our Integrated Surf Platform which includes Surf GateLoudon, Tennessee facility (Malibu and Power Wedge II, which increase the average selling price ofAxis boats) on April 20, 2020, our boats;
Trailers, partsNeodesha, Kansas facility (Cobalt boats) on April 27, 2020 and accessories sales—consists of sales of boat trailers we manufacture and replacement and aftermarket boat parts and accessories to our dealer network; and
Royalty income—consists of royalties attributable to license agreements with various boat manufacturers, including Nautique, Chaparral, Mastercraft, and Tige related to the use of our intellectual property.
Net sales are net of:
Sales returns—consists primarily of contractual repurchases of boats either repossessed by the floor plan financing provider from the dealer or returned by the dealer under our warranty program; and
Rebates, free flooring and discounts—consists of incentives, including rebates and free flooring, we provide to our dealers based on sales of eligible products. If a dealer meets its monthly or quarterly commitment volume based on tier, as well as other terms of the rebate program, the dealer is entitled to a specified rebate tied to each tier. Our dealers that take delivery of current model year boats in the offseason, typically July through April in the U.S., are entitled to have us pay the interest to floor the boat until the earlier of (1) the sale of the unit or (2) a date near the end of the current model year, which incentive we refer to as “free flooring.” From time to time, we may extend the flooring program to eligible models beyond the offseason period. For more information, see "Item 1. Business - Dealer Management."
Cost of Sales
Our cost of sales includes all of the costs to manufacture our products, including raw materials, components, supplies, direct labor and factory overhead. For components and accessories manufactured by third-party vendors, such costs represent the amounts invoiced by the vendors. Shipping costs and depreciation expense related to manufacturing equipment and facilities are also included in cost of sales. Warranty costs associated with the repair or replacement of our boats under warranty are also included in cost of sales.
Operating Expenses
Our operating expenses include selling and marketing, and general and administrative costs. Each of these items includes personnel and related expenses, supplies, non-manufacturing overhead, third-party professional fees and various other operating expenses. Further, selling and marketing expenditures include the cost of advertising and various promotional sales incentive programs. General and administrative expenses include, among other things, salaries, benefits and other personnel related expenses for employees engaged in product development, engineering, finance, information technology, human resources and executive management. Other costs include outside legal and accounting fees, investor relations, risk
management (insurance) and other administrative costs. General and administrative expenses also include product development expenses associated with our engines vertical integration initiative and acquisition or integration related expenses.
Other Income (Expense), Net
Other income (expense), net consists of interest expense and other income or expense, net. Interest expense consists of interest charged under our outstanding debt, interest on our interest rate swap arrangement, changes in the fair value of our interest rate swap we entered into on July 1, 2015, and amortization of deferred financing costs on our credit facilities. Other income includes a portion of the amounts received from the settlement of our litigation with Mastercraft Boat Company, LLC ("Mastercraft") entered intoFort Pierce, Florida facility (Pursuit boats) on May 2, 2017,4, 2020. We also elected to draw the amount receivedthen remaining available funds of $98.8 million from Nautique related to our litigation settlement entered into on February 6, 2015, and a fourth quarter 2017 adjustment to our tax receivable agreement liability.
Income Taxes
Malibu Boats, Inc. is subject to U.S. federal and state income tax in multiple jurisdictions with respect to our allocable share of any net taxable income of the LLC. The LLC is a pass-through entity for federal purposes but incurs income tax in certain state jurisdictions. The income tax provision reflects a reported effective income tax rate of 36.2%, 36.8% and 27.2% attributable to Malibu Boats, Inc.'s share of income for fiscal years 2017, 2016 and 2015, respectively. The reported effective tax rates differ from the statutory federal income tax rate of 35% primarily due to the impact of the non-controlling interest and state income taxes attributable to the LLC, including the benefit of deductions under Section 199 of the Internal Revenue Code of 1986, as amended (the "Internal Revenue Code") and recording of a valuation allowance related to the outside basis in the LLC. Our effective tax rate also reflects the impact of the Company's share of the LLC's permanent items such as stock compensation expense attributable to profits interests. In fiscal year 2015, our effective tax rate was impacted by nondeductible offering costs, acquisition related costs, and the impact of an out-of-period tax adjustment associated with benefits recognized for the Tennessee jobs tax credit that are not expected to be recurring in nature.
Net Income Attributable to Non-controlling Interest
As of June 30, 2017, we had a 93.4% controlling economic interest and 100% voting interest in the LLC. As of June 30, 2016 and 2015, we had a 92.6% controlling economic interest and 100% voting interest in the LLC. We consolidate the LLC's operating results for financial statement purposes. Net income attributable to non-controlling interest represents the portion of net income attributable to the LLC members.
Recent Developments
Cobalt Acquisition
On July 6, 2017, Malibu Boats, LLC, our wholly owned indirect subsidiary, completed the purchase of all of the outstanding equity interests of Cobalt for a purchase price of $130.0 million. The purchase price is subject to certain adjustments, including customary adjustments for the amount of working capital in the business at the closing date and subject to adjustment for any judgment or settlement in connection with a pending litigation matter between Cobalt and Sea Ray Boats, Inc. and Brunswick Corporation. We paid $1.0 million of the purchase price in 39,262 newly issued shares of our Class A common stock and the remainder of the purchase price was paid using cash and borrowings under our new Second Amended and Restated Credit Facility that we entered into in connection with the acquisition. Mr. William Paxson St. Clair, Jr., a former owner of Cobalt, was appointed as a director of Malibu Boats, Inc. and as President of Cobalt upon completion of our acquisition of Cobalt.
Refinancing of Credit Facility
On June 28, 2017, Malibu Boats, LLC, as the borrower, entered into a Second Amended and Restated Credit Agreement with SunTrust Bank, as administrative agent, swingline lender and issuing bank. The credit agreement provides us with a term loan facility in an aggregate principal amount of $160.0 million ($55.0 million of which was drawn on June 28, 2017 to refinance the outstanding loans under our prior credit facility and $105.0 million of which was drawn on July 6, 2017 to fund the payment of the purchase price for the acquisition of Cobalt, as well as to pay certain fees and expenses related to entering into the credit agreement) and a revolving credit facility of upin late March 2020 to $35.0 million. Eachensure we maintained financial flexibility in light of the term loans anduncertainty resulting from the COVID-19 pandemic. We subsequently repaid $110.0 million on the revolving credit facility in June 2020.
Our financial results for fiscal year 2020 were impacted by the COVID-19 pandemic. The temporary shutdown of our facilities in the second half of 2020 resulted in a decrease in production that we were not able to fully recover during fiscal year 2020. We were not able to ship boats to our dealers during the suspension of our operations, which negatively impacted our net sales. As a result, our net sales and unit volume decreased 39.1% and 43.9%, respectively, during the fourth quarter of fiscal year 2020 compared to the fourth quarter of fiscal year 2019. For the year ended June 30, 2020, we recognized a decrease of $30.9 million, or 4.5%, in net sales and a decrease of 918 units, or 12.5%, in unit volume compared to fiscal year 2019. While costs of sales also declined, we still recognized a decrease in gross profit of $16.6 million, or 10.0%, for fiscal year 2020 compared to fiscal year 2019, primarily related to the declines in sales volumes resulting from our suspension of operations.
Notwithstanding our lower net sales resulting from our decrease in production, our dealers continued to experience strong demand for our boats during the summer months. While sales were negatively impacted by COVID-19 in late March and through April, retail sales improved materially from May through July 2020. Consumers turned to boating as a form of outdoor, socially distanced recreation during the COVID-19 pandemic. The increase in retail sales combined with our lower wholesale shipment levels during the fourth quarter of fiscal year 2020 resulted in lower inventory levels at our dealers as of June 30, 2020 compared to last year. We expect these lower inventory levels, while having the potential to impact retail sales in the near-term, will provide us strong order flow for our model year 2021 product, unless consumer demand meaningfully decreases.
In addition to our operations, the COVID-19 pandemic also impacted and may continue to impact the operations of our dealers and suppliers. While some of our dealers and suppliers had to suspend their operations during the pandemic, many continued to operate and we are not aware of any of our dealers or suppliers that have closed permanently.
We believe we are well-positioned to withstand any further disruptions that may occur as result of the ongoing pandemic. We have approximately $49.9 million of cash on hand as of August 27, 2020 and approximately $110.0 million available for borrowing under our revolving credit facility as of June 30, 2020. Further, we have a maturity dateflexible cost structure that allows us to more closely align our costs with wholesale shipments. The ultimate impact of July 1, 2022.
Equity Offering
On August 14, 2017,COVID-19 on our financial condition and results of operations, however, will depend on a number of factors, including factors that we completed a registered offering of 2,300,000 sharesmay not be able to forecast at this time. See the risk factor “The COVID-19 pandemic is adversely affecting, and is expected to continue to adversely affect, our operations, and those of our Class A Common Stock (which included 300,000 sharesdealers and suppliers, thereby adversely affecting our business, financial condition and results of Class A Common Stock issued upon the exercise by the underwritersoperations.” under Part I. Item 1A. of an option to purchase such additional shares of Class A Common Stock) to several underwriters, represented by Raymond James & Associates, Inc.this Form 10-K.
and SunTrust Robinson Humphrey, Inc., at a price of $24.05 per share, after deducting underwriter discounts and commissions.
The net proceeds from the offering, after deducting underwriting discounts and commissions was $55.3 million. Of the net proceeds received from the offering, we used $50.0 million to voluntarily prepay amounts outstanding on our term loans under the Second Amended and Restated Credit Agreement and used the remaining net proceeds for general working capital purposes. We exercised our option to apply the prepayment to principal installments on our term loans through December 31, 2021 and a portion of principal installments due on March 31, 2022.
Outlook
Industry-wide marine retail registrations continue to recover from the years following the global financial crisis. According to Statistical Surveys, Inc., domestic retail registration volumes of performance sport boats, fiberglass sterndrive and fiberglass outboards increased at a compound annual growth rate of approximately 6%5.2% between 2011 and 2016,2019, for the 50 reporting states. This hasWhile domestic retail registration volumes for new recreational powerboats decreased in 2019, total retail sales dollars
increased in 2019, according to NMMA. These increases have been led by growth in our core market, performance sport boats, having produced a double digitdouble-digit compound annual growth rate over that period. Domesticbetween 2011 and 2019. While the growth rate was negatively impacted by weak sales in March and April 2020 due to COVID-19, we believe domestic retail demand growth has otherwise continued in performance sport boats for calendar year 2017, however,2020, in part because consumers have turned to boating as a form of outdoor, socially distanced recreation during the pace is not as strong as that of calendar years 2012 through 2016.COVID-19 pandemic. Fiberglass sterndrive and outboard boats, the target markets for our Cobalt and Pursuit branded product,products, have seen their combined market grow at a 5%4.5% compound annual growth rate between 2011 and 2016.2019. That growth has been driven by the outboard market where Pursuit is focused and Cobalt is a new entrant and where we plan to meaningfully expand our market share in the future. While Cobalt’s primary market for sterndrive propulsion has been challenged, but their performance has beencontinues to be helped by market share gains and they continue to see registration growth. During 2019 the overallfiberglass outboard market growth has been driven by outboard propulsion,was approximately flat year-over-year, but, in foot lengths 23 feet and greater, where they are a new entrant.Pursuit and Cobalt compete, the market continues to grow. We expect the growing demand for our products to continue, albeit at a lower pace than the past eight years.
Regardless of retail market growth rates, the combination of continued strong retail market activity this summer and there arethe temporary suspension of our operations from March through May 2020, has depleted inventory levels at our dealers below prior year levels and we expect to see meaningful wholesale demand to restock our dealer inventories through fiscal year 2021 and potentially beyond. While we expect lower dealer inventory levels will support fiscal year 2021 financial performance, numerous other variables that have the potential to impact our volumes, both positively and negatively. For example, we believe the substantial decrease in the price of oil, and the broad strength of the U.S. dollar and recently implemented tariffs has resulted in reduced demand for our boats in certain markets. To date, growth in our domestic market has offset the significantly diminished demand from economies that are driven by the oil industry and international markets. Consumer confidence, expanded or eroded, is a variable that couldcan also impact demand for our products in both directions. Other challenges that could impact demand for recreational powerboats include higher interest rates reducing retail consumer appetite for our product, the availability of credit to our dealers and retail consumers, fuel costs, a meaningful reduction in the value of global or domestic equity markets, the continued acceptance of our new products in the recreational boating market, our ability to compete in the competitive power boating industry, and the costs of labor and certain of our raw materials and key components.
Since 2008, we have increased our market share among manufacturers of performance sport boats due to new product development, improved distribution, new models, and innovative features. As the market for our product has recovered our competitors have become more aggressive in their product introductions, increased their distribution and begun to competelaunched surf systems competitive with our patented Surf Gate system. This competitive environment has continued throughout the past few years, but in 20152019 and our share was up only slightly. However, during calendar year 2016 our domestic market share increased meaningfully as a result of continued execution with well-received new models, innovative featuresyear-to-date 2020 strong performance from Malibu and management ofAxis have expanded our dealer network. While we believe we are positioned to continue to gain market share over time, our market share in the performance sport boat segment will be challenged to grow in the near-term because of the significant increase in market share that we accomplished during calendar year 2016. We continue to maintain a strong lead over our nearest competitor in terms of market positionshare in the performance sport boats category. We believe our new product pipeline, strong dealer network and believe that we areability to manage our business through the COVID-19 pandemic leaves us well positioned to maintain and potentially expand our industry leading market position given our strong dealer network and new product pipeline.in performance sports boats. In addition, we continue to be the market share leader in both the premium and value-oriented product sub-categories.
We also believe our track record of expanding our market share due to new product development, improved distribution, new models, and innovative features is directly transferable to our Cobalt acquisition.and Pursuit acquisitions. While Cobalt is theand Pursuit are market share leaderleaders in the 24’-29’ sterndrive market,certain areas, we believe our experience positions us to execute a strategy to drive enhanced share in that core foot length segment as well as in other areas of opportunityby expanding both the Cobalt and Pursuit product offerings with different foot lengths, different boat types and different propulsion technologies, namely outboard boats.technologies. Our efforts to refine Cobalt’s new product development efforts to maximize share gainsat Cobalt and Pursuit will take time and our ability to influence near-term model introductions is limited, but we have already begun to execute on this strategy. With respect to Cobalt, we have included Splash and Stow and a new electronic flip down Swim Step for model year 2021 boats. For the Pursuit brand, our focus has been on expanding the award winning Dual Console, Sport and Offshore product offerings that continue to combine innovative features and dependable performance in refined designs that accommodate a broad array of activities on the water, including the Electric Sliding Entertainment Center on the new S 378. We believe enhancing new product development combined with diligent management of the Cobalt and Pursuit dealer networknetworks positions us to meaningfully improve our share of the sterndrive and outboard markets over time.
Factors Affecting Our Results of Operations
We believe that our results of operations and our growth prospects are affected by a number of factors, which we discuss below.
Economic Environment and Consumer Demand
Our product sales are impacted by general economic conditions, which affect the demand for our products, the demand for optional features, the availability of credit for our dealers and retail consumers, and overall consumer confidence. Consumer spending, especially purchases of discretionary items, tends to decline during recessionary periods and tends to increase during
expansionary periods. The recreational boatingpowerboat industry which was adversely affected byhas shown continued growth from 2010 through 2019 based on retail sales. While there is uncertainty surrounding the economic downturn in 2008 and
2009, has had a sustained recovery period since 2010. In recent years, the performance sport boat category has grown faster than the overall powerboat market. In 2015, domestic sales of new performance sport boats increased by 10% compared to 2014, while new unit sales of all other powerboats grew 7% over the same period. More recently, new unit sales of performance sport boats increased 12% for 2016 compared to the same period in 2015, while new unit sales of all other powerboats increased 3% over the same period. With the acquisition of Cobalt in July 2017,COVID-19 pandemic we captured significant, growing market position in adjacent markets including premium stern drive, outboard and inboard cruisers. Whereas growthbelieve we are well positioned strategically in the sterndrive segment decreased 3%recreational powerboat market with brands that are market leaders in 2016 when compared to fiscal 2015, increased demand for the 24'-29' boats in the sterndrive category enabled Cobalt to achieve market share gains over the last four years. As of 2016, our leading market share in the 24'-29' boats segment of the sterndrive category was almost 30%. While there is no guarantee that our market will continue to grow, we expect to benefit from the recovery in the boating industry and from improved consumer confidence levels.their segments.
New Product Development and Innovation
Our long-term revenue prospects are based in part on our ability to develop new products and technological enhancements that meet the demands of existing and new consumers. Developing and introducing new boat models and features that deliver improved performance and convenience are essential to leveraging the value of our Malibu, Axis, and Cobalt brands. By introducing new boat models, we are able to appeal to a new and broader range of consumers and focus on underserved or adjacent segments of the broader powerboat category. To keep product fresh and at the forefront of technological innovation in the boating industry, we aim to introduce at least 4a number of new boat models per year. We also believe we are able to capture additional value from the sale of each boat through the introduction of new features, which we believe permits us to raiseresults in increased average selling prices and enhances ourimproved margins. We allocate most of our product development costs to new model and feature designs, usually with a specific consumer base and market in mind. We use industry data to analyze our markets and evaluate revenue potential from each major project we undertake. Our product development cycle, or the time from initial concept to volume production, can be up to two years. As a result, our development costs, which may be significant, may not be offset by corresponding new sales during the same periods. Once new designs and technologies become available to our consumers, we typically realize revenue from these products from one year up to 15 years. We may not, however, realize our revenue expectations from each innovation. We believe our close communication with our consumers, dealers and sponsored athletes regarding their future product desires enhances the efficiency of our product development expenditures.
Product Mix
Historically, we have been successful in leveragingLeveraging our robust product offering and features to enhance our sales growth and gross margins. Our product mix, as it relates to our brands, types of boats and features, not only makes our offerings attractive to consumers but also helps drive higher sales and margins. Historically, we have been able to realize higher sales and margins when we sell larger boats compared to our smaller boats, our premium Malibu brandbrands compared to our entry-level Axis brandbrands and our boats that are fully-equipped with optional features. We expect this to continue with the addition of our Cobalt brand. We will strive to continue to develop new features and models and maintain an attractive product mix that optimizes sales growth and margins.
Ability to Manage Manufacturing Costs, Sales Cycles and Inventory Levels
Our results of operations are affected by our ability to manage our manufacturing costs effectively and to respond to changing sales cycles. Our product costs vary based on the costs of supplies and raw materials, as well as labor costs. We have implemented various initiatives to reduce our cost base and improve the efficiency of our manufacturing process. For example, we re-engineered the manufacturing process in our Tennessee facility to reduce labor hours per boat producedWe are continuously monitoring and the amount of re-work required. We continuously monitor and reviewreviewing our manufacturing processes to identify improvements and create additional efficiencies. During fiscal year 2020, we expanded our facilities in Kansas and Florida for our Cobalt and Pursuit operations, respectively. We expect these expanded facilities will allow us to introducecontinue improving the manufacturing process improvements to our new Kansas facility that manufactures Cobalt boats as we integrate them into our operations and with our suppliers.at each of these locations. We rely on our insights into the market gleaned from dealer inventory levels, industry reports about anticipated demand for our products in the upcoming sales cycle and our own estimates and assumptions in formulating our manufacturing plan for the following fiscal year. Throughout our consumer sales cycle, which reaches its peak from March through August of each year, we adjust our manufacturing activities in order to adapt to variability in demand.
Dealer Network, Dealer Financing and Incentives
We rely on our dealer network to distribute and sell our products. We believe we have developed the strongest distribution network in the performance sport boat category. To improve and expand our network and compete effectively for dealers, we regularly monitor and assess the performance of our dealers and evaluate dealer locations and geographic coverage in order to identify potential market opportunities. Our acquisitionacquisitions of Cobalt and Pursuit has allowed us to expand into Cobalt’seach of their strong dealer networknetworks as well. We intend to continue to add dealers in new territories in the United States as well as internationally, which we believe will result in increased unit sales.
Our dealers are exposed to seasonal variations in consumer demand for boats. As discussed above under “Ability to Manage Manufacturing Costs, Sales Cycles and Inventory Levels,” weWe address anticipated demand for our products and manage our manufacturing in order to mitigate seasonal variations. We also use our dealer incentive programs to encourage dealers to order in the off-season by providing floor plan financing relief, which typically permits dealers to take delivery of current model year boats between July 1 and April 30 on an interest-free basis for a specified period. We also offer our dealers other incentives, including rebates, seasonal discounts, promotional co-op arrangements and other allowances. We facilitate floor plan financing programs for many of our dealers by entering into repurchase agreements with certain third-party lenders, which enable our dealers, under certain circumstances, to establish lines of credit with the third-party lenders to purchase inventory. Under these floor plan financing programs, a dealer draws on the floor plan facility upon the purchase of
our boats and the lender pays the invoice price of the boats. During fiscal year 2017, no units were repurchased from our Malibu or Axis dealers. For fiscal year 2016, we agreed to repurchase three units from the lender of two of our former dealers resulting in combined losses of $0.03 million. Other than these repurchase commitments, we have not repurchased any units from lenders since July 1, 2010. We will continue to review and refine our dealer incentive offerings and monitor any exposures arising under these arrangements.
Vertical Integration
In the first quarterWe have vertically integrated a number of fiscal 2015, we commenced full trailer manufacturing operations and no longer purchase trailers from a third party supplier. This expansionkey components of our business has allowed us to reduce or eliminate certain costs, improvemanufacturing process, including the qualitymanufacturing of boat trailers, used with our boatstowers and generate various other margintower accessories, machined and product opportunities to make us more responsive to our customers’ needsbillet parts, and competitive.
On November 14, 2016, we entered into an engine supply agreement with General Motors for the supply of engine blocks, with the intention of marinizingtooling. We began producing our own engines for use in our performance sports boats. This initiative provides us with the next significant vertical integration opportunity which will allow us to control the design, performance, and customization of future engine offerings, providing us direct access to the engine block manufacturer that has been supplying the industry for decades, making our engines unique to Malibu and Axis brands. We expect to begin using thesemodels. Our engines, branded as Malibu Monsoon engines, were in our boat as early asMalibu and Axis boats for model year 2019. Our plan currently calls for us to invest up to $18.0 million for three years after entering into the agreement with General Motors. To facilitate the marinization of engines, we acquired a 70,000 square foot facility adjacent to our boat manufacturing operations in Loudon, Tennessee. Once operational, we2020. We believe our inboard engine manufacturing businessmarinization initiative will bereduce our reliance on our previous engine suppliers for our Malibu and Axis brands while reducing the largestrisk that a change in the industry, providing the immediate operational advantagescost or production from any engine supplier for such brands could adversely affect our business. Recently we began producing soft grip flooring for our Malibu, Axis and new Cobalt models.
Vertical integration of scale. Our scale, along withkey components of our engineering team, will provide Malibu withboats gives us the ability to provide an affordableincrease incremental margin per boat sold by reducing our cost base and unique offeringimproving the efficiency of our manufacturing process. Additionally, it allows us to have greater control over design, consumer customization options, construction quality, and our supply chain. We believe our engine marinization initiative will reduce our reliance on our previous engine suppliers for our Malibu and Axis brands while reducing the risk that a change in cost or production from any engine supplier for such brands could adversely affect our business. We continually review our manufacturing process to identify opportunities for additional vertical integration investments across our portfolio of premium brands.
Components of Results of Operations
Net Sales
We generate revenue from the sale of boats to our dealers. The substantial majority of our net sales are derived from the sale of boats, including optional features included at the time of the initial wholesale purchase of the boat. Net sales consists of the following:
•Gross sales from:
•Boat and trailer sales—consists of sales of boats and trailers to our dealer network. Nearly all of our boat sales include optional feature upgrades purchased by the consumer, which increase the average selling price of our boats; and
•Parts and other sales—consists of sales of replacement and aftermarket boat parts and accessories to our dealer network; and consists of royalty income earned from license agreements with various boat manufacturers, including Nautique, Chaparral, Mastercraft, and Tige related to the use of our intellectual property.
•Net sales are net of:
•Sales returns—consists primarily of contractual repurchases of boats either repossessed by the floor plan financing provider from the dealer or returned by the dealer under our warranty program; and
•Rebates, free flooring and discounts—consists of incentives, rebates and free flooring, we provide to our dealers based on sales of eligible products. For our Malibu and Axis models, if a domestic dealer meets its monthly or quarterly commitment volume, as well as other terms of the dealer performance program, the dealer is entitled to a specified rebate. Cobalt dealers are entitled to volume-based discounts taken at the time of invoice. For our Pursuit models, if a dealer meets its quarterly or annual retail customers.volume goals, the dealer is entitled to a specific rebate applied to their wholesale volume purchased from Pursuit. For Malibu and Cobalt models and select Pursuit models, our dealers that take delivery of current model year boats in the offseason, typically July through April in the U.S., are also entitled to have us pay the interest to floor the boat until the earlier of (1) the sale of the unit or (2) a date near the end of the current model year, which incentive we refer to as “free flooring.” From time to time, we may extend the flooring program to eligible models beyond the offseason period. For more information, see "Item 1. Business - Dealer Management."
Cost of Sales
Our cost of sales includes all of the costs to manufacture our products, including raw materials, components, supplies, direct labor and factory overhead. For components and accessories manufactured by third-party vendors, such costs represent the amounts invoiced by the vendors. Shipping costs and depreciation expense related to manufacturing equipment and facilities are also included in cost of sales. Warranty costs associated with the repair or replacement of our boats under warranty are also included in cost of sales.
Operating Expenses
Our operating expenses include selling and marketing, and general and administrative costs. Each of these items includes personnel and related expenses, supplies, non-manufacturing overhead, third-party professional fees and various other operating expenses. Further, selling and marketing expenditures include the cost of advertising and various promotional sales incentive programs. General and administrative expenses include, among other things, salaries, benefits and other personnel related expenses for employees engaged in product development, engineering, finance, information technology, human resources and executive management. Other costs include outside legal and accounting fees, investor relations, risk management (insurance) and other administrative costs. General and administrative expenses also include product development expenses associated with our engines vertical integration initiative and acquisition or integration related expenses.
Other (Income) Expense, Net
Other (income) expense, net consists of interest expense and other income or expense, net. Interest expense consists of interest charged under our outstanding debt, interest on our interest rate swap arrangement and change in the fair value of our interest rate swap we entered into on July 1, 2015, which matured on March 31,2020, and amortization of deferred financing costs on our credit facilities. Other income or expense includes adjustments to our tax receivable agreement liability.
Income Taxes
Malibu Boats, Inc. is subject to U.S. federal and state income tax in multiple jurisdictions with respect to our allocable share of any net taxable income of the LLC. The LLC is a pass-through entity for federal purposes but incurs income tax in certain state jurisdictions.
Net Income Attributable to Non-controlling Interest
As of June 30, 2020 and 2019, we had a 96.6% and 96.2% controlling economic interest and 100% voting interest in the LLC. We consolidate the LLC's operating results for financial statement purposes. Net income attributable to non-controlling interest represents the portion of net income attributable to the LLC members.
Results of Operations
The table below sets forth our consolidated results of operations, expressed in thousands (except unit volume and net sales per unit) and as a percentage of net sales, for the periods presented. Our consolidated financial results for these periods are not necessarily indicative of the consolidated financial results that we will achieve in future periods. Certain totals for the table below will not sum to exactly 100% due to rounding.
| | | | | | | | | | | | | | | | | | | | | | | | | | | | | | | | | | | | | | | | | | | | | | |
| | | | | | | | | | Fiscal Year Ended June 30, | | | | | | | | | | |
| | | | | | | | | | 2020 | | | | 2019 | | | | 2018 | | |
| | | | | | | | | | $ | | % Revenue | | $ | | % Revenue | | $ | | % Revenue |
| Net sales | | | | | | | | | | 653,163 | | | 100.0 | % | | 684,016 | | | 100.0 | % | | 497,002 | | | 100.0 | % |
| Cost of sales | | | | | | | | | | 503,893 | | | 77.2 | % | | 517,746 | | | 75.7 | % | | 376,660 | | | 75.8 | % |
| Gross profit | | | | | | | | | | 149,270 | | | 22.8 | % | | 166,270 | | | 24.3 | % | | 120,342 | | | 24.2 | % |
| Operating expenses: | | | | | | | | | | | | | | | | | | | | |
| Selling and marketing | | | | | | | | | | 17,917 | | | 2.8 | % | | 17,946 | | | 2.6 | % | | 13,718 | | | 2.8 | % |
| General and administrative | | | | | | | | | | 39,912 | | | 6.1 | % | | 44,256 | | | 6.5 | % | | 31,359 | | | 6.3 | % |
| Amortization | | | | | | | | | | 6,131 | | | 0.9 | % | | 5,956 | | | 0.9 | % | | 5,198 | | | 1.0 | % |
| Operating income | | | | | | | | | | 85,310 | | | 13.0 | % | | 98,112 | | | 14.3 | % | | 70,067 | | | 14.1 | % |
| Other (income) expense: | | | | | | | | | | | | | | | | | | | | |
| Other | | | | | | | | | | (2,310) | | | (0.4) | % | | (149) | | | — | % | | (24,705) | | | (5.0) | % |
| Interest expense | | | | | | | | | | 3,888 | | | 0.6 | % | | 6,464 | | | 0.9 | % | | 5,385 | | | 1.1 | % |
| Other (income) expense, net | | | | | | | | | | 1,578 | | | 0.2 | % | | 6,315 | | | 0.9 | % | | (19,320) | | | (3.9) | % |
| Net income before provision for income taxes | | | | | | | | | | 83,732 | | | 12.8 | % | | 91,797 | | | 13.4 | % | | 89,387 | | | 18.0 | % |
| Income tax provision | | | | | | | | | | 19,076 | | | 2.9 | % | | 22,096 | | | 3.2 | % | | 58,418 | | | 11.8 | % |
| Net income | | | | | | | | | | 64,656 | | | 9.9 | % | | 69,701 | | | 10.2 | % | | 30,969 | | | 6.2 | % |
| Net income attributable to non-controlling interest | | | | | | | | | | 3,094 | | | 0.5 | % | | 3,635 | | | 0.5 | % | | 3,356 | | | 0.7 | % |
| Net income attributable to Malibu Boats, Inc. | | | | | | | | | | 61,562 | | | 9.4 | % | | 66,066 | | | 9.7 | % | | 27,613 | | | 5.6 | % |
| | | | | | | | | | | | | | | | | | | | |
| | | | | | | | | | Fiscal Year Ended June 30, | | | | | | | | | | |
| | | | | | | | | | 2020 | | | | 2019 | | | | 2018 | | |
| | | | | | | | | | Unit Volumes | | % Total | | Unit Volumes | | % Total | | Unit Volumes | | % Total |
| Volume by Segment | | | | | | | | | | | | | | | | | | | | |
| Malibu | | | | | | | | | | 3,980 | | | 61.8 | % | | 4,547 | | | 61.7 | % | | 4,060 | | | 64.5 | % |
| Cobalt | | | | | | | | | | 1,956 | | | 30.3 | % | | 2,409 | | | 32.8 | % | | 2,232 | | | 35.5 | % |
Pursuit 1 | | | | | | | | | | 508 | | | 7.9 | % | | 406 | | | 5.5 | % | | — | | | — | % |
| Total Units | | | | | | | | | | 6,444 | | | | | 7,362 | | | | | 6,292 | | | |
| | | | | | | | | | | | | | | | | | | | |
| Net sales per unit | | | | | | | | | | $ | 101,360 | | | | | $ | 92,912 | | | | | $ | 78,990 | | | |
(1) We acquired substantially all of the assets of Pursuit on October 15, 2018. |
| | | | | | | | | | | | | | | | | | | | | |
| | | Fiscal Year Ended June 30, |
| | | 2017 | | 2016 | | 2015 |
| | | $ | | % Revenue | | $ | | % Revenue | | $ | | % Revenue |
| Net sales | | 281,937 |
| | 100.0 | % | | 252,965 |
| | 100.0 | % | | 228,621 |
| | 100.0 | % |
| Cost of sales | | 206,899 |
| | 73.4 | % | | 186,145 |
| | 73.6 | % | | 168,192 |
| | 73.6 | % |
| Gross profit | | 75,038 |
| | 26.6 | % | | 66,820 |
| | 26.4 | % | | 60,429 |
| | 26.4 | % |
| Operating expenses: | | | | | | | | | | | | |
| Selling and marketing | | 8,619 |
| | 3.1 | % | | 7,475 |
| | 3.0 | % | | 7,007 |
| | 3.1 | % |
| General and administrative | | 24,783 |
| | 8.8 | % | | 21,256 |
| | 8.4 | % | | 19,809 |
| | 8.7 | % |
| Amortization | | 2,198 |
| | 0.8 | % | | 2,185 |
| | 0.9 | % | | 2,463 |
| | 1.1 | % |
| Operating income | | 39,438 |
| | 14.0 | % | | 35,904 |
| | 14.2 | % | | 31,150 |
| | 13.6 | % |
| Other income (expense): | | | | | | | | | | | | |
| Other | | 10,789 |
| | 3.8 | % | | 76 |
| | — | % | | 1,650 |
| | 0.7 | % |
| Interest expense | | (1,559 | ) | | (0.6 | )% | | (3,884 | ) | | (1.5 | )% | | (954 | ) | | (0.4 | )% |
| Other income (expense), net | | 9,230 |
| | 3.3 | % | | (3,808 | ) | | (1.5 | )% | | 696 |
| | 0.3 | % |
| Net income before provision for income taxes | | 48,668 |
| | 17.3 | % | | 32,096 |
| | 12.7 | % | | 31,846 |
| | 13.9 | % |
| Income tax provision | | 17,593 |
| | 6.2 | % | | 11,801 |
| | 4.7 | % | | 8,663 |
| | 3.8 | % |
| Net income | | 31,075 |
| | 11.0 | % | | 20,295 |
| | 8.0 | % | | 23,183 |
| | 10.1 | % |
| Net income attributable to non-controlling interest | | 2,717 |
| | 1.0 | % | | 2,253 |
| | 0.9 | % | | 8,522 |
| | 3.7 | % |
| Net income attributable to Malibu Boats, Inc. | | 28,358 |
| | 10.1 | % | | 18,042 |
| | 7.1 | % | | 14,661 |
| | 6.4 | % |
| | | | | | | | | | | | | |
| | | Fiscal Year Ended June 30, |
| | | 2017 | | 2016 | | 2015 |
| | | Unit Volumes | | % Total | | Unit Volumes | | % Total | | Unit Volumes | | % Total |
| Volume by Segment | | | | | | | | | | | | |
| US | | 3,505 |
| | 91.9 | % | | 3,255 |
| | 91.2 | % | | 3,179 |
| | 93.4 | % |
| Australia | | 310 |
| | 8.1 | % | | 314 |
| | 8.8 | % | | 225 |
| | 6.6 | % |
| Total Units | | 3,815 |
| | | | 3,569 |
| | | | 3,404 |
| | |
| | | | | | | | | | | | | |
| Volume by Brand | | | | | | | | | | | | |
| Malibu | | 2,698 |
| | 70.7 | % | | 2,388 |
| | 66.9 | % | | 2,325 |
| | 68.3 | % |
| Axis | | 1,117 |
| | 29.3 | % | | 1,181 |
| | 33.1 | % | | 1,079 |
| | 31.7 | % |
| Total Units | | 3,815 |
| | | | 3,569 |
| | | | 3,404 |
| | |
| | | | | | | | | | | | | |
| Net sales per unit | | $ | 73,902 |
| | | | $ | 70,878 |
| | | | $ | 67,162 |
| | |
Comparison of the Fiscal Year Ended June 30, 20172020 to the Fiscal Year Ended June 30, 20162019
Net Sales
Net sales for fiscal year 2017 increased $29.02020 decreased $30.9 million, or 11.5%4.5%, to $281.9$653.2 million, compared to fiscal year 2016. Included in net sales for fiscal years 2017 and 2016 were net sales of $23.0 million and $20.8 million, respectively, attributable to our Australian business.2019. Unit volume for fiscal year 2017 increased 2462020 decreased 918 units, or 6.9%12.5%, to 3,8156,444 units compared to fiscal year 2016.2019. The decrease in net sales and unit volumes was driven primarily by the temporary shutdown of our facilities in the second half of fiscal year 2020 as a result of the COVID-19 pandemic. As a result of our suspension of operations, we were not able to ship boats to our dealers during the period of shut-down, which negatively impacted our net sales for the second half of fiscal year 2020. In addition to the pandemic, but to a lesser effect, we also had planned lower production rates at Cobalt to reduce wholesale shipments and dealer inventories that negatively impacted sales versus the prior year period. This decrease in net sales was partially offset by a higher average selling price due to model mix and an increase in sales at Pursuit from a full year of results in fiscal year 2020 compared with nine months in fiscal year 2019 since its acquisition date on October 15, 2018.
Net sales attributable to our Malibu segment decreased $19.9 million, or 5.3%, to $354.8 million for fiscal year 2020 compared to fiscal year 2019. Unit volumes attributable to our Malibu segment decreased 567 units for fiscal year 2020 compared to fiscal year 2019. The decrease in net sales and unit volumes was driven by the temporary shutdown of our Loudon,
Tennessee facility in the second half of fiscal year 2020 as a result of the COVID-19 pandemic. This decrease in Malibu net sales was partially offset primarily by our product mix of new, larger Malibu and Axis models.
Net sales from our Cobalt segment decreased $31.8 million, or 15.4%, to $174.8 million for fiscal year 2020 compared to fiscal year 2019. Unit volumes attributable to Cobalt decreased 453 units for fiscal year 2020 compared to fiscal year 2019. The decrease in net sales and unit volumes was driven primarily by the temporary shutdown of our Neodesha, Kansas facility in the second half of fiscal year 2020 as a result of the COVID-19 pandemic. In addition to the pandemic, but to a lesser effect, we also had planned lower production rates at Cobalt to reduce wholesale shipments and dealer inventories that negatively impacted sales versus the prior year period. The decrease was partially offset by year-over-year price increases on our Cobalt models.
Net sales from our Pursuit segment increased $20.8 million, or 20.3%, to $123.6 million for fiscal year 2020 compared to fiscal year 2019. Unit volumes attributable to Pursuit increased 102 units for fiscal year 2020 compared to fiscal year 2019. The increase in units wasPursuit net sales resulted from a full year of sales from Pursuit in fiscal year 2020 compared to a partial nine months in fiscal year 2019 since our acquisition of Pursuit on October 15, 2018. The increase in net sales and unit volumes were partially offset by the lower average selling price due to the mix of models sold and the temporary shutdown of our Fort Pierce, Florida facility in the second half of fiscal year 2020 as a result of the COVID-19 pandemic.
Our overall net sales per unit increased 9.1% to $101,360 per unit for fiscal year 2020 compared to fiscal year 2019. Net sales per unit for our Malibu segment increased 8.2% to $89,138 per unit for fiscal year 2020 compared to fiscal year 2019, primarily driven by demandhigher sales for our new, more expensive models such as the Malibu Wakesetter 21 VLX and 22 and 24 MXZs and optional features. Net sales per unit for our Cobalt segment increased 4.2% to $89,350 per unit for fiscal year 2017 increased 4.3% to $73,9022020 compared to fiscal year 2016, primarily2019, driven by year over yearyear-over-year price increases, a mix shift from Axis to Malibu, and lower discount activity, offset by higher rebate expense associated with our new rebate program for model year 2017.increases. Net sales per unit in the U.S., excluding salesfor our Pursuit segment decreased 3.9% to our Australian operations, increased 3.6% to $73,878$243,358 per unit for fiscal year 2017 as2020 compared to fiscal year 2016.2019, primarily driven by lower average selling price due to the mix of models sold.
Cost of Sales
Cost of sales for fiscal year 2017 increased $20.82020 decreased $13.9 million, or 11.1%2.7%, to $206.9$503.9 million compared to fiscal year 2016.2019. The increasedecrease in cost of sales wasresulted primarily driven by increasedfrom lower unit volumes higher material contentfor Malibu, Axis and labor hours driven by the mix shift from Axis to Malibu as well as higher warranty expense. IncludedCobalt. The decrease in costcosts of sales were $0.3 millionwas partially offset by incremental costs contributed by Pursuit for the full year of fiscal year 2020 compared to only nine months for fiscal year 2019 since its acquisition in October 2018 and increased costs relatedincurred to ourreplace engines vertical integration initiative.during the United Auto Workers’ strike against General Motors.
Gross Profit
Gross profit for fiscal year 2017 increased $8.22020 decreased $17.0 million, or 12.3%10.2%, compared to fiscal year 2016.2019. The increasedecrease in gross profit resulted primarily from higher volumes.was due mainly to lower unit volumes in fiscal year 2020 as described above and increased costs incurred to replace engines during the United Auto Workers’ strike against General Motors. Gross margin fordecreased 150 basis points from 24.3% in fiscal 2019 to 22.8% in fiscal year 2017 increased 20 basis points to 26.6% compared to fiscal year 2016 due primarily to lower material cost margin, offset partially by higher labor and warranty expenses.2020.
Operating Expenses
Selling and marketing expense for fiscal year 2017 increased $1.1 million, or 15.3%, to $8.62020 remained flat at $17.9 million compared to fiscal year 2016 primarily due to increased payroll, commissions and related costs attributable to additional headcount.2019. As a percentage of sales, salesselling and marketing expense increased 1020 basis points from 3.0%2.6% for fiscal year 20162019 to 3.1%2.8% for the fiscal year 2017.2020. General and administrative expense for fiscal year 2017 increased $3.52020 decreased $4.3 million, or 16.6%9.8%, to $24.8$39.9 million compared to fiscal year 2016.2019. The increasedecrease in general and administrative expenses was driven in part by an increase in acquisitionlargely due to expenses related expenses tied to ourthe acquisition of Cobalt Boats on July 6, 2017, product development activities in connection with our engines vertical integration initiative, increased legal expenses for our Mastercraft litigation which was settled in the fourth quarterPursuit in fiscal year 2017, and higher incentive compensation,2019 that were not incurred during fiscal year 2020, partially offset by a $1.1 million reduction in the Marine Power Holding, LLC (“Marine Power”) litigation judgment following a court verdict in the second quarter ofincremental general and administrative expenses attributable to Pursuit during fiscal year 20172020. As a percentage of sales, general and lower stock compensation expense associated, in part, with share-based equity awards granted in the second quarter ofadministrative expenses decreased 40 basis points to 6.1% for fiscal year 2016.
Other Income (Expense), Net
Other income, net2020 compared to 6.5% for the fiscal year 20172019. Amortization expense for fiscal year 2020 increased $13.0$0.2 million, to $9.2 millionor 2.9%, compared to fiscal year 2016.2019, due to additional amortization from intangible assets acquired as a result of the Pursuit acquisition for the full year in fiscal year 2020.
Other (Income) Expense, Net
Other expense, net for fiscal year 2020 decreased by $4.7 million, or 75.0% to $1.6 million as compared to fiscal year 2019. The increase in other income, netdecrease was primarily due to decreased interest expense of $2.6 million and a $8.1$1.7 million net decrease inadjustment to our tax receivable agreement liability, related to tax legislation enactedwhich resulted in us recognizing a corresponding amount as other income during the fourth quarter of fiscal year 2017 which lowered2020. Interest expense decreased due to a lower interest rate and lower average outstanding debt during fiscal year 2020 compared to fiscal year 2019. The adjustment to our tax receivable agreement liability was the result of a decrease in the estimated tax rate used to estimatein computing our future tax obligations and, in turn, a decrease in the future tax benefit expectedwe expect to be realized by us on increasedpay under our tax basis from previous sales and exchangesreceivable agreement to our pre-IPO owners.
Provision for Income Taxes
Our provision for income taxes for fiscal year 2017 increased $5.82020 decreased $3.0 million, to $17.6$19.1 million compared to fiscal year 2016. The increase in our provision for income taxes reflects an increase in2019. This decrease was primarily driven by lower pre-tax book income forearnings and reduced U.S. state taxes. For fiscal year 2017, as2020, our effective tax rate was similar for fiscal year 2017 compared to fiscal year 2016, 36.2% and 36.8%, respectively. The reported effective tax rates differsof 22.8% differed from the statutory federal income tax rate of 35%21% primarily due to the impact of U.S. state taxes. This increase in tax rate was partially offset by the benefits of the foreign derived intangible income deduction, the research and development tax credit, a windfall benefit generated by certain stock based compensation, and the impact of non-controlling interest and stateinterests in the LLC. For fiscal year 2019, our effective tax rate of 24.1% differed from the statutory federal income taxes attributabletax rate of 21% primarily due to the LLC on our shareimpact of U.S. state taxes. This increase was partially offset by the benefits of the LLC'sforeign derived intangible income deduction, the research and also includesdevelopment tax credit and the benefitimpact of deductions under Section 199 ofnon-controlling interests in the Internal Revenue Code.LLC.
Non-controlling interest
Non-controlling interest represents the ownership interests of the members of the LLC other than us and the amount recorded as non-controlling interest in our consolidated statements of operations and comprehensive income is computed by multiplying pre-tax income for the applicable fiscal year 2017 by the percentage ownership in the LLC not directly attributable to us. For fiscal years 20172020 and 2016,2019, the weighted average non-controlling interest attributable to ownership interests in the LLC not directly attributable to us was 7.0%3.8% and 11.1%4.1%, respectively.
Comparison of the Fiscal Year Ended June 30, 20162019 to the Fiscal Year Ended June 30, 20152018
Net Sales
Net sales for fiscal year 20162019 increased $24.3$187.0 million, or 10.6%37.6%, to $253.0$684.0 million, compared to fiscal year 2015. Included in net sales for fiscal years 2016 and 2015 were net sales of $20.8 million and $14.9 million, respectively, attributable to our Australian operations acquired in October 2014.2018. Unit volume for fiscal year 20162019 increased 1651,070 units, or 4.8%17.0%, to 3,5697,362 units compared to fiscal year 2015. Of the 165 units added, 89 units were added as a result of our Australian business and the
remainder of the increase was primarily due to a demand-driven2018. The increase in net sales and unit volumes was driven primarily by our daily production rate over the prioracquisition of Pursuit in October 2018, as well as increased demand for our Malibu, Axis and Cobalt brands coupled with year-over-year price increases.
Net sales attributable to our Malibu segment increased $58.0 million, or 18.3%, to $374.6 million for fiscal year bolstered2019 compared to fiscal year 2018. Unit volumes attributable to our Malibu segment increased 487 units for fiscal year 2019 compared to fiscal year 2018. The increase in net sales and unit volume for Malibu was driven primarily by the strong demand for new larger models such as the M235 and 25 LSV, offsetoptional features, which led to a higher net sales per unit for Malibu and Axis models. Net sales was also impacted by currency-driven challengesyear-over-year price increases on all of our Malibu and Axis models.
Net sales from our Cobalt segment increased $26.2 million, or 14.6%, to $206.6 million for fiscal year 2019 compared to fiscal year 2018. Unit volumes attributable to Cobalt increased 177 units for fiscal year 2019 compared to fiscal year 2018. The increase in international markets outsideCobalt net sales and unit volume was driven primarily by strong demand for our R series models. Net sales was also impacted by year-over-year price increases on all of Australia, including Canada.our Cobalt models.
Net sales and unit volume contributed by Pursuit since its acquisition on October 15, 2018 were $102.8 million and 406 units, respectively, for fiscal year 2019.
Our overall net sales per unit increased 17.6% to $92,912 per unit for fiscal year 2019 compared to fiscal year 2018. Net sales per unit for our Malibu segment increased 5.6% to $82,386 per unit for fiscal year 2016 increased approximately 5.5% to $70,8782019 compared to fiscal year 2015, primarily2018, driven by strong demand for new models and optional features and year-over-year price increases. Net sales per unit for our Cobalt segment increased 6.2% to $85,761 per unit for fiscal year over2019 compared to fiscal year price increases and our increased2018, driven by a favorable mix of larger model sales,R series models which carryhave a higher average selling price and increased demand for optional features and trailers, partially offset by our Australian operations, which carry a lower average sellingas well as year-over-year price per unit.increases. Net sales per unit in the U.S., excluding sales to our Australia operations, increased 1.9% to $71,311for Pursuit for fiscal year 2016 as compared to fiscal year 2015. The increase2019 was primarily driven by higher prices on new model year product, the increased mix of larger model sales, and increased demand for optional features and trailers, partially offset by increased discount activity on, among others, international sales to offset the impact of negative foreign currency fluctuations on sales prices attributable to a strengthened U.S. dollar and increased sales of our Axis brand which carry a lower average selling price than our Malibu brand.$253,219.
Cost of Sales
Cost of sales for fiscal year 20162019 increased $18.0$141.1 million, or 10.7%37.5%, to $186.1$517.7 million compared to fiscal year 2015.2018. The increase in cost of sales was duedriven primarily to increasedby incremental costs contributed by Pursuit since its acquisition in October 2018 and an increase in unit volumes driven by higher throughput at our U.S. operationsMalibu, Axis and the addition of our Australian business in the second quarter of fiscal year 2015. Cost of sales per unit for our U.S. operations on a stand-alone basis increased approximately 6.9% for fiscal year 2016 compared to fiscal year 2015 driven by the mix of larger model sales, which have higher material content and labor hours, and the extension of our warranty period of coverage from three to five years for model year 2016, offset by lower trailer cost per unit created from manufacturing efficiencies.Cobalt businesses.
Gross Profit
Gross profit for fiscal year 20162019 increased $6.4$45.9 million, or 10.6%38.2%, compared to fiscal year 2015.2018. The increase in gross profit resulted primarily fromwas due mainly to higher volumes.unit volumes in the businesses mentioned above. Gross margin forincreased 10 basis points from 24.2% in fiscal 2018 to 24.3% in fiscal year 2016 was unchanged at 26.4% compared2019 due to our gross margins increasing for our comparable businesses primarily as a result of our operational efficiency initiatives offset by $0.9 million of additional expense related to the fair value step up of Pursuit inventory acquired and sold during fiscal year 2015 as gains associated with our mix2019.
Operating Expenses
Selling and marketing expense for fiscal year 20162019 increased $0.5$4.2 million, or 6.7%30.8%, to $7.5$17.9 million compared to fiscal year 20152018 due primarily due to increased event sponsorship.the incremental expenses from Pursuit since its acquisition. As a percentage of sales, selling and marketing expense decreased 20 basis points from 2.8% for fiscal year 2018 to 2.6% for fiscal year 2019. General and administrative expense for fiscal year 20162019 increased $1.4$12.9 million, or 7.3%41.1%, to $21.3$44.3 million compared to fiscal year 20152018. The increase in general and administrative expenses was largely due to a $3.3 million charge related to a judgment rendered against us in the Marine Power litigation (see Note 15 to our consolidated financial statements included elsewhere in this Annual Report), higher payroll related expenses attributed to higher headcount, stock compensation costs,incremental general and operatingadministrative expenses attributable to Pursuit since its acquisition, integration related expenses for our acquisition of Pursuit, which we completed in October 2018 and higher legal expenses related mostly to intellectual property litigation. As a fullpercentage of sales, general and administrative expenses increased 20 basis points to 6.5% for fiscal year of activity at our Australian operations, offset by decreases in offering and acquisition related costs.2019 compared to 6.3% for fiscal year 2018. Amortization expense for fiscal year 2016 decreased $0.32019 increased $0.8 million, or 11.3%14.6%, compared to $2.2 million primarilyfiscal year 2018, due to the fulladditional amortization in the first quarter of fiscal year 2015 of our dealer relationship intangible acquired in 2006, offset by amortization attributable tofrom intangible assets acquired inas a result of the acquisition of our Australian licensee in October 2014.Pursuit acquisition.
Other Income (Expense),(Income) Expense, Net
Other expense, net for the fiscal year 2016 increased $4.52019 changed by $25.6 million to $3.8expense of $6.3 million as compared to income of $19.3 million in fiscal year 2015.2018. The increase in other expense, netchange was primarily due to a decrease$24.6 million reduction in other income related to the settlement of our patent infringement lawsuit with Nautique in February 2015 and an increase in interest expense associated with our $80.0 million term loan entered into in April 2015,tax receivable agreement liability for fiscal year 2018, which resulted in us recognizing a corresponding amount as other income. The reduction of our tax receivable agreement liability primarily resulted from a decrease in the estimated tax rate used in computing our future tax obligations as a result of the Tax Act, which, in turn, decreased the future tax benefit we expect to realize related to our increased tax basis from previous sales and exchanges of LLC Units by our pre-IPO owners. For fiscal year 2019 we recognized higher interest expense on our loans because of an overall higher average outstanding debt forprincipal balance compared to fiscal year 2016 than for fiscal year 2015. The balance2018, as a result of our $50.0 million of borrowing under our revolving credit facility to finance a portion of the increase in other expense, net is attributable to an increase inpurchase price for Pursuit. This higher interest expense related to the changewas partially offset by other income we recognized from an adjustment in our tax receivable agreement liability as a result of a decrease in the fair value ofestimated tax rate used in computing our interest rate swapfuture tax obligations and, in turn, a decrease in the future tax benefit we entered into on July 1, 2015.expect to pay under our tax receivable agreement with pre-IPO owners.
Provision for Income Taxes
Our provision for income taxes for fiscal year 2016 increased $3.12019 decreased $36.3 million, to $11.8$22.1 million compared to fiscal year 2015. The2018. For fiscal year 2018, we recorded a non-cash increase to income tax expense of $44.5 million for the remeasurement of deferred taxes on the enactment date of the Tax Act and deferred tax impact related to the reduction in our provision for income taxes reflects an increase inthe tax receivable agreement liability. For fiscal year 2019, our effective tax rate which was 36.8% for fiscal year 2016 compared to 27.2% for fiscal year 2015. The reported effective tax rates differsof 24.1% differed from the statutory federal income tax rate of 35%21% primarily due to the impact of U.S. state taxes. This increase was partially offset by the benefits of the foreign derived intangible income deduction, the research and development tax credit and the impact of non-controlling interests in the LLC. For fiscal year 2018, our effective tax rate of 65.4% differed from the blended statutory federal income tax rate of approximately 28% primarily due to the impact of the Tax Act adopted in January 2018 and the impact of the additional jurisdictions in which we were taxed as a result of the Cobalt acquisition in July 2017. Our effective tax rate was also impacted, to a lesser extent, by the non-controlling interest,interests in the LLC, state income taxes attributable to the LLC, and the benefit of deductions under Section 199 of the Internal Revenue Code. Additionally, ourOur effective tax ratesrate also reflectreflects the impact of our share of the LLC's permanent items such as stock-basedstock compensation expense attributable to profits interests. We note that in fiscal year 2015, our effective tax rate was impacted by nondeductible offering costs, acquisition related costs, and the impact
of an out-of-period tax adjustment associated with benefits recognized for the Tennessee jobs tax credit that are not expected to be recurring in nature.
Non-controlling interest
Non-controlling interest represents the ownership interests of the members of the LLC other than us and the amount recorded as non-controlling interest in our consolidated statements of operations and comprehensive income (loss) is computed by multiplying pre-tax income for the applicable fiscal year 2016 by the percentage ownership in the LLC not directly attributable to us. For fiscal years 20162019 and 2015,2018, the weighted average non-controlling interest attributable to ownership interests in the LLC not directly attributable to us was 11.1%4.1% and 36.8%5.3%, respectively.
GAAP Reconciliation of Non-GAAP Financial Measures
Adjusted EBITDA
Adjusted EBITDA and adjusted EBITDA margin are non-GAAP financial measures that are used by management as well as by investors, commercial bankers, industry analysts and other users of our financial statements.
We define adjusted EBITDA as net income before interest expense, income taxes, depreciation, amortization and non-cash, non-recurring or non-operating expenses, including certain professional fees, litigation related expenses, acquisition and integration related expenses, non-cashnon- cash compensation expense, offering related expenses, expenses related to our engine development initiative, expenses related to interruption to our engine supply during the labor strike by UAW against General Motors and adjustments to our tax receivable agreement liability. We define adjusted EBITDA margin as adjusted EBITDA divided by net sales. Adjusted EBITDA and adjusted EBITDA margin are not measures of net income as determined by GAAP. Management believes adjusted EBITDA and adjusted EBITDA margin allow investors to evaluate the company’s operating performance and compare our results of operations from period to period on a consistent basis by excluding items that management does not believe are indicative of our core operating performance. Management uses Adjusted EBITDA to assist in highlighting trends in our operating results without regard to our financing methods, capital structure and non-recurring or non-operating expenses. We exclude the items listed above from net income in arriving at adjusted EBITDA because these amounts can vary substantially from company to company within our industry depending upon accounting methods and book values of assets, capital structures, the methods by which assets were acquired and other factors. Adjusted EBITDA has limitations as an analytical tool and should not be considered as an alternative to, or more meaningful than, net income as determined in accordance with GAAP or as an indicator of our liquidity. Certain items excluded from adjusted EBITDA are significant components in understanding and assessing a company’s financial performance, such as a company’s cost of capital and tax structure, as well as the historical costs of depreciable assets. Our presentation of adjusted EBITDA and adjusted EBITDA margin should not be construed as an inference that our results will be unaffected by unusual or non-recurring items. Our computations of adjusted EBITDA and adjusted EBITDA margin may not be comparable to other similarly titled measures of other companies.
The following table sets forth a reconciliation of net income as determined in accordance with GAAP to adjusted EBITDA and adjusted EBITDA margin for the periods indicated (dollars in thousands): | | | | | Fiscal Year Ended June 30, | | | | Fiscal Year Ended June 30, | |
| | | 2017 | | 2016 | | 2015 | | | | 2020 | | 2019 | | 2018 |
| Net income | | $ | 31,075 |
| | $ | 20,295 |
| | $ | 23,183 |
| Net income | | | $ | 64,656 | | | $ | 69,701 | | | $ | 30,969 | |
| Income tax provision | | 17,593 |
| | 11,801 |
| | 8,663 |
| |
Income tax provision 1 | | Income tax provision 1 | | | 19,076 | | | 22,096 | | | 58,418 | |
| Interest expense | | 1,559 |
| | 3,884 |
| | 954 |
| Interest expense | | | 3,888 | | | 6,464 | | | 5,385 | |
| Depreciation | | 4,550 |
| | 3,339 |
| | 2,427 |
| Depreciation | | | 12,249 | | | 10,004 | | | 7,656 | |
| Amortization | | 2,198 |
| | 2,185 |
| | 2,463 |
| Amortization | | | 6,131 | | | 5,956 | | | 5,198 | |
Professional fees and litigation settlements 1 | | 1,038 |
| | 1,111 |
| | 2,654 |
| |
Marine Power litigation judgment 2 | | (1,093 | ) | | 3,268 |
| | — |
| |
Professional fees and litigation settlements 2 | | Professional fees and litigation settlements 2 | | | 1,013 | | | 739 | | | 26 | |
Acquisition and integration related expenses 3 | | 3,056 |
| | 401 |
| | 1,676 |
| Acquisition and integration related expenses 3 | | | — | | | 5,245 | | | 2,859 | |
Stock-based compensation expense 4 | | 1,396 |
| | 1,947 |
| | 1,467 |
| Stock-based compensation expense 4 | | | 3,042 | | | 2,607 | | | 1,973 | |
Offering related expenses 5 | | — |
| | — |
| | 161 |
| |
UAW strike impact 5 | | UAW strike impact 5 | | | 2,564 | | | — | | | — | |
Engine development 6 | | 2,489 |
| | — |
| | — |
| Engine development 6 | | | — | | | 3,186 | | | 4,871 | |
Adjustment to tax receivable agreement liability 7 | | (8,140 | ) | | — |
| | — |
| Adjustment to tax receivable agreement liability 7 | | | (1,672) | | | (103) | | | (24,637) | |
| Adjusted EBITDA | | $ | 55,721 |
| | $ | 48,231 |
| | $ | 43,648 |
| Adjusted EBITDA | | | $ | 110,947 | | | $ | 125,895 | | | $ | 92,718 | |
| Adjusted EBITDA margin | | 19.8 | % | | 19.1 | % | | 19.1 | % | Adjusted EBITDA margin | | | 17.0 | % | | 18.4 | % | | 18.7 | % |
|
| | | | |
| (1) | Represents legalProvision for income taxes for fiscal years 2020, 2019 and advisory fees2018 reflect the impact of the Tax Act adopted in December 2017, which among other items, lowered the U.S. corporate income tax rate from 35% to 21%, effective January 1, 2018. For fiscal year 2018, we recorded an increase to income tax expense of $44.5 million for the remeasurement of deferred taxes on the enactment date of the Tax Act and the deferred tax impact related to our litigation with Mastercraft, Nautique, and Pacific Coast Marine Windshields Ltd. ("PCMW"), offset by the portion ofreduction in the $2.3 million settlement received from Nautique for past infringement claims under the Nautique Settlement Agreement entered into on February 6, 2015 and settlement received from Mastercraft under the Mastercraft Settlement and License Agreement entered into on May 2, 2017. For more information about legal proceedings, refertax receivable agreement liability. Refer to Note 1513 of our consolidated financial statements included elsewhere in this Annual Report. |
| (2) | Represents a charge recorded inFor fiscal 2016years 2020 and 2019, represents legal and advisory fees related to a judgment rendered against us in connectionour litigation with a lawsuit by Marine Power, a former engine supplier, on August 18, 2016Skier's Choice, Inc. For fiscal year 2018, represents legal and the reduction of that chargeadvisory fees related to $2.2 million, the amount ultimately settled and paid in the fourth quarter of fiscal 2017.our litigation with MasterCraft. For more information, seerefer to Note 15 to18 of our consolidated financial statements included elsewhere in this Annual Report. |
| (3) | RepresentsFor fiscal year 2019, represents integration costs and legal, professional and advisory fees incurred in connection with our acquisition of Cobalt Boats, which was completedPursuit on July 6, 2017,October 15, 2018. For fiscal year 2018, represents integration costs and legal, professional and advisory fees as well as integration costs incurred in connection in with our acquisition of Malibu Boats Pty. Ltd.Pursuit and our acquisition of Cobalt on July 6, 2017. Integration related expenses for fiscal year 2019 include post-acquisition adjustments to cost of goods sold of $0.9 million for the fair value step up of Pursuit inventory acquired, most of which was completed on October 23, 2014.sold during the second quarter of fiscal year 2019. Integration related expenses for fiscal year 2018 include post-acquisition adjustments to cost of goods sold of $1.5 million for the fair value step up of Cobalt inventory acquired, most of which was sold during the first quarter of fiscal year 2018. |
| (4) | Represents equity-based incentives awarded to certain of our employees under the Malibu Boats, Inc. Long-Term Incentive Plan and profit interests issued under the previously existing limited liability company agreement of the LLC. SeeFor more information, refer to Note 13 to16 of our consolidated financial statements included elsewhere in this Annual Report. |
| (5) | Includes legal and advisoryFor fiscal year 2020, represents costs incurred in connection with interruption to our equity offeringsengine supply during the UAW strike against General Motors. We purchase engines from General Motors LLC that we then prepare for marine use for our Malibu and equity tender offer completed in fiscal year 2015. There were no such offeringsAxis boats. During the UAW strike, General Motors suspended delivery of engine blocks to us and we incurred costs by entering into purchase agreements with two suppliers for fiscal years 2016 or 2017.additional engines to supplement our inventory of engine blocks for Malibu and Axis boats. |
| (6) | Represents costs incurred in connection with our vertical integration of engines including product development costs and supplier transition performance incentives. |
| (7) | RepresentsFor fiscal years 2020 and 2019, we recognized other income from an adjustment in our tax receivable agreement liability as a result of a decrease in the estimated tax rate used in computing our future tax obligations and in turn, a decrease in the future tax benefit we expect to pay under our tax receivable agreement with pre-IPO owners. For fiscal year 2019, the rate decrease was mainly offset by an increase to other expense for tax receivable agreement liability stemmingderived by future tax benefits from Tennessee net operating losses at Malibu Boats, Inc. For fiscal year 2018, we recognized other income as a result of a decrease in our estimated tax legislation enactedreceivable agreement liability. The reduction in our tax receivable agreement liability resulted primarily from the adoption of the Tax Act during the fourthsecond quarter of fiscal 2017year 2018, which reduceddecreased the estimated tax rate appliedused in computing our future tax obligations and, in turn, decreased the future tax benefit expectedwe expect to be realized by us onrealize related to increased tax basis from previous sales and exchanges of LLC Units by theour pre-IPO owners. Refer to Note 912 of our consolidated financial statements included elsewhere in this AnnualReport. |
Adjusted Fully Distributed Net Income
We define Adjusted Fully Distributed Net Income as net income attributable to Malibu Boats, Inc. (i) excluding income tax expense, (ii) excluding the effect of non-recurring or non-cash items, (iii) assuming the exchange of all LLC units into shares of Class A Common Stock, which results in the elimination of non-controlling interest in the LLC, and (iv) reflecting an adjustment for income tax expense on fully distributed net income before income taxes at our estimated effective income tax rate. Adjusted Fully Distributed Net Income is a non-GAAP financial measure because it represents net income attributable to Malibu Boats, Inc., before non-recurring or non-cash items and the effects of non-controlling interests in the LLC.
We use Adjusted Fully Distributed Net Income to facilitate a comparison of our operating performance on a consistent basis from period to period that, when viewed in combination with our results prepared in accordance with GAAP, provides a more complete understanding of factors and trends affecting our business than GAAP measures alone.
We believe Adjusted Fully Distributed Net Income assists our board of directors, management and investors in comparing our net income on a consistent basis from period to period because it removes non-cash or non-recurring items, and eliminates the variability of non-controlling interest as a result of member owner exchanges of LLC Units into shares of Class A Common Stock.
In addition, because Adjusted Fully Distributed Net Income is susceptible to varying calculations, the Adjusted Fully Distributed Net Income measures, as presented in this Annual Report, may differ from and may, therefore, not be comparable to similarly titled measures used by other companies.
The following table shows the reconciliation of the numerator and denominator for net income available to Class A Common Stock per share to Adjusted Fully Distributed Net Income per Share of Class A Common Stock for the periods presented (in thousands except share and per share data):
| | | | | Fiscal Year Ended June 30, | | | Fiscal Year Ended June 30, | |
| | | 2017 | | 2016 | | 2015 | | | 2020 | | 2019 | | 2018 |
| Reconciliation of numerator for net income available to Class A Common Stock per share to Adjusted Fully Distributed Net Income per Share of Class A Common Stock: | | | | | | | Reconciliation of numerator for net income available to Class A Common Stock per share to Adjusted Fully Distributed Net Income per Share of Class A Common Stock: | | | | | | | |
| Net income attributable to Malibu Boats, Inc. | | $ | 28,358 |
| | $ | 18,042 |
| | $ | 14,661 |
| Net income attributable to Malibu Boats, Inc. | | | $ | 61,562 | | | $ | 66,066 | | | $ | 27,613 | |
| Income tax provision | | 17,593 |
| | 11,801 |
| | 8,663 |
| |
Professional fees and litigation settlements 1 | | 1,038 |
| | 1,111 |
| | 2,654 |
| |
Marine Power litigation judgment 2 | | (1,093 | ) | | 3,268 |
| | — |
| |
Income tax provision 1 | | Income tax provision 1 | | | 19,076 | | | 22,096 | | | 58,418 | |
Professional fees and litigation settlements 2 | | Professional fees and litigation settlements 2 | | | 1,013 | | | 739 | | | 26 | |
Acquisition and integration related expenses 3 | | 3,056 |
| | 401 |
| | 1,676 |
| Acquisition and integration related expenses 3 | | | 4,262 | | | 9,506 | | | 5,719 | |
Fair value adjustment for interest rate swap 4 | | (912 | ) | | 863 |
| | — |
| Fair value adjustment for interest rate swap 4 | | | 68 | | | 350 | | | (369) | |
Stock-based compensation expense 5 | | 1,396 |
| | 1,947 |
| | 1,467 |
| Stock-based compensation expense 5 | | | 3,042 | | | 2,607 | | | 1,973 | |
Offering related expenses 6 | | — |
| | — |
| | 161 |
| |
Engine development 7 | | 2,489 |
| | — |
| | — |
| |
Engine development 6 | | Engine development 6 | | | — | | | 3,186 | | | 4,871 | |
UAW strike impact 7 | | UAW strike impact 7 | | | 2,564 | | | — | | | — | |
Adjustment to tax receivable agreement liability 8 | | (8,140 | ) | | — |
| | — |
| Adjustment to tax receivable agreement liability 8 | | | (1,672) | | | (103) | | | (24,637) | |
Net income attributable to non-controlling interest 9 | | 2,717 |
| | 2,253 |
| | 8,522 |
| Net income attributable to non-controlling interest 9 | | | 3,094 | | | 3,635 | | | 3,356 | |
| Fully distributed net income before income taxes | | 46,502 |
| | 39,686 |
| | 37,804 |
| Fully distributed net income before income taxes | | | 93,009 | | | 108,082 | | | 76,970 | |
Income tax expense on fully distributed income before income taxes 10 | | 16,508 |
| | 14,089 |
| | 13,420 |
| Income tax expense on fully distributed income before income taxes 10 | | | 21,857 | | | 26,048 | | | 20,908 | |
| Adjusted Fully Distributed Net Income | | $ | 29,994 |
| | $ | 25,597 |
| | $ | 24,384 |
| Adjusted Fully Distributed Net Income | | | $ | 71,152 | | | $ | 82,034 | | | $ | 56,062 | |
| | | | | Fiscal Year Ended June 30, | | | Fiscal Year Ended June 30, | |
| | | 2017 | | 2016 | | 2015 | | | 2020 | | 2019 | | 2018 |
| Reconciliation of denominator for net income available to Class A Common Stock per share to Adjusted Fully Distributed Net Income per Share of Class A Common Stock: | | | | | | | Reconciliation of denominator for net income available to Class A Common Stock per share to Adjusted Fully Distributed Net Income per Share of Class A Common Stock: | | | | | | | |
| Weighted average shares outstanding of Class A Common Stock used for basic net income per share: | | 17,844,774 |
| | 17,934,580 |
| | 15,732,531 |
| |
Weighted average shares outstanding of Class A Common Stock used for basic net income per share: 11 | | Weighted average shares outstanding of Class A Common Stock used for basic net income per share: 11 | | | 20,662,750 | | | 20,832,445 | | | 20,189,879 | |
| Adjustments to weighted average shares of Class A Common Stock: | | | | | | | Adjustments to weighted average shares of Class A Common Stock: | | | |
Weighted-average LLC units held by non-controlling unit holders 11 | | 1,338,907 |
| | 1,407,311 |
| | 6,194,270 |
| |
Weighted-average unvested restricted stock awards issued to management 12 | | 112,859 |
| | 48,466 |
| | — |
| |
Weighted-average LLC units held by non-controlling unit holders 12 | | Weighted-average LLC units held by non-controlling unit holders 12 | | | 806,943 | | | 880,144 | | | 1,138,917 | |
Weighted-average unvested restricted stock awards issued to management 13 | | Weighted-average unvested restricted stock awards issued to management 13 | | | 155,433 | | | 130,520 | | | 132,673 | |
| Adjusted weighted average shares of Class A Common Stock outstanding used in computing Adjusted Fully Distributed Net Income per Share of Class A Common Stock: | | 19,296,540 |
| | 19,390,357 |
| | 21,926,801 |
| Adjusted weighted average shares of Class A Common Stock outstanding used in computing Adjusted Fully Distributed Net Income per Share of Class A Common Stock: | | | 21,625,126 | | | 21,843,109 | | | 21,461,469 | |
The following table shows the reconciliation of net income available to Class A Common Stock per share to Adjusted Fully Distributed Net Income per Share of Class A Common Stock for the periods presented:
| | | | | | | | | | | | | | | | | | | | | | | | |
| | | | | | Fiscal Year Ended June 30, | | | | |
| | | | | | 2020 | | 2019 | | 2018 |
| Net income available to Class A Common Stock per share | | | | | | $ | 2.98 | | | $ | 3.17 | | | $ | 1.37 | |
| Impact of adjustments: | | | | | | | | | | |
Income tax provision 1 | | | | | | 0.92 | | | 1.06 | | | 2.89 | |
Professional fees and litigation settlements 2 | | | | | | 0.05 | | | 0.04 | | | — | |
Acquisition and integration related expenses 3 | | | | | | 0.21 | | | 0.46 | | | 0.28 | |
Fair value adjustment for interest rate swap 4 | | | | | | — | | | 0.02 | | | (0.02) | |
Stock-based compensation expense 5 | | | | | | 0.15 | | | 0.13 | | | 0.10 | |
Engine development 6 | | | | | | — | | | 0.15 | | | 0.24 | |
UAW strike impact 7 | | | | | | 0.12 | | | — | | | — | |
Adjustment to tax receivable agreement liability 8 | | | | | | (0.08) | | | — | | | (1.22) | |
Net income attributable to non-controlling interest 9 | | | | | | 0.15 | | | 0.17 | | | 0.17 | |
| Fully distributed net income per share before income taxes | | | | | | 4.50 | | | 5.20 | | | 3.81 | |
Impact of income tax expense on fully distributed income before income taxes 10 | | | | | | (1.06) | | | (1.25) | | | (1.04) | |
Impact of increased share count 14 | | | | | | (0.15) | | | (0.19) | | | (0.17) | |
| Adjusted Fully Distributed Net Income per Share of Class A Common Stock | | | | | | $ | 3.29 | | | $ | 3.76 | | | $ | 2.60 | |
|
| | | | | | | | | | | | |
| | | Fiscal Year Ended June 30, |
| | | 2017 | | 2016 | | 2015 |
| Net income available to Class A Common Stock per share | | $ | 1.59 |
| | $ | 1.01 |
| | $ | 0.93 |
|
| Impact of adjustments: | | | | | | |
| Income tax provision | | 0.99 |
| | 0.66 |
| | 0.55 |
|
Professional fees and litigation settlements 1 | | 0.06 |
| | 0.06 |
| | 0.17 |
|
Marine Power litigation judgment 2 | | (0.06 | ) | | 0.18 |
| | — |
|
Acquisition and integration related expenses 3 | | 0.17 |
| | 0.02 |
| | 0.11 |
|
Fair value adjustment for interest rate swap 4 | | (0.05 | ) | | 0.05 |
| | — |
|
Stock-based compensation expense 5 | | 0.08 |
| | 0.11 |
| | 0.09 |
|
Offering related expenses 6 | | — |
| | — |
| | 0.01 |
|
Engine development 7 | | 0.14 |
| | — |
| | — |
|
Adjustment to tax receivable agreement liability 8 | | (0.46 | ) | | — |
| | — |
|
Net income attributable to non-controlling interest 9 | | 0.15 |
| | 0.13 |
| | 0.54 |
|
| Fully distributed net income per share before income taxes | | 2.61 |
| | 2.21 |
| | 2.40 |
|
Impact of income tax expense on fully distributed income before income taxes 10 | | (0.92 | ) | | (0.79 | ) | | (0.85 | ) |
Impact of increased share count 13 | | $ | (0.13 | ) | | $ | (0.11 | ) | | $ | (0.44 | ) |
| Adjusted Fully Distributed Net Income per Share of Class A Common Stock | | $ | 1.56 |
| | $ | 1.32 |
| | $ | 1.11 |
|
| | | | | |
| |
| (1) | Represents legalProvision for income taxes for fiscal years 2020, 2019 and advisory fees2018 reflect the impact of the Tax Act adopted in December 2017, which among other items, lowered the U.S. corporate income tax rate from 35% to 21%, effective January 1, 2018. For fiscal year 2018, we recorded an increase to income tax expense of $44.5 million for the remeasurement of deferred taxes on the enactment date of the Tax Act and the deferred tax impact related to our litigation with Mastercraft, Nautique and PCMW, offset by the portion ofreduction in the $2.3 million settlement received from Nautique for past infringement claims under the Nautique Settlement Agreement entered into on February 6, 2015 and settlement received from Mastercraft under the Mastercraft Settlement and License Agreement entered into on May 2, 2017. For more information about legal proceedings, refertax receivable agreement liability. Refer to Note 1513 of our consolidated financial statements included elsewhere in this Annual Report. |
| (2) | Represents a charge recorded inFor fiscal 2016years 2020 and 2019, represents legal and advisory fees related to a judgment rendered against us in connectionour litigation with a lawsuit by Marine Power, a former engine supplier, on August 18, 2016Skier's Choice, Inc. For fiscal year 2018, represents legal and the reduction of that chargeadvisory fees related to $2.2 million, the amount ultimately settled and paid in the fourth quarter of fiscal 2017.our litigation with MasterCraft. For more information, seerefer to Note 15 to18 of our consolidated financial statements included elsewhere in this Annual Report. |
| (3) | RepresentsFor fiscal year 2020 represents amortization of intangibles acquired in connection with the acquisition of Pursuit and Cobalt. For fiscal year 2019, represents integration costs and legal, professional and advisory fees incurred in connection with our acquisition of Cobalt Boats, which was completedPursuit on July 6, 2017,October 15, 2018. For fiscal year 2018, represents integration costs and legal, professional and advisory fees as well as integration costs incurred in connection in with our acquisition of Malibu Boats Pty. Ltd.Pursuit and our acquisition of Cobalt on July 6, 2017. Integration related expenses for fiscal year 2019 include post-acquisition adjustments to cost of goods sold of $0.9 million for the fair value step up of inventory acquired, most of which was completed on October 23, 2014.sold during the second quarter of fiscal year 2019 and $1.3 million in depreciation and amortization associated with our fair value step up of property, plant and equipment and intangibles acquired in connection with the acquisition of Pursuit. In addition, for fiscal year 2019 integration related expenses includes $3.0 million in amortization associated with intangibles acquired in connection with the acquisition of Cobalt. Integration related expenses for fiscal year 2018 include post-acquisition adjustments to cost of goods sold of $1.5 million for the fair value step up of inventory acquired, most of which was sold during the first quarter of fiscal year 2018. In addition, for fiscal year 2018 integration related expenses includes $2.9 million in depreciation and amortization associated with our fair value step up of property, plant and equipment and intangibles acquired in connection with the acquisition of Cobalt. |
| (4) | Represents the change in the fair value of our interest rate swap entered into on July 1, 2015. The swap matured on March 31, 2020. |
| (5) | Represents equity-based incentives awarded to certain of our employees under the Malibu Boats, Inc. Long-Term Incentive Plan and profit interests issued under the previously existing limited liability company agreement of the LLC. SeeFor more information, refer to Note 13 to16 of our consolidated financial statements included elsewhere in this Annual Report. |
| (6) | Includes legal and advisory costs incurred in connection with our equity offerings and equity tender offer completed in fiscal year 2015. There were no such offerings for fiscal years 2016 or 2017. |
(7) | Represents costs incurred in connection with our vertical integration of engines including product development costs and supplier transition performance incentives. |
(8)(7) | RepresentsFor fiscal year 2020, represents costs incurred in connection with interruption to our engine supply during the UAW strike against General Motors. We purchase engines from General Motors LLC that we then prepare for marine use for our Malibu and Axis boats. During the UAW strike, General Motors suspended delivery of engine blocks to us and we incurred costs by entering into purchase agreements with two suppliers for additional engines to supplement our inventory of engine blocks for Malibu and Axis boats. |
| (8) | For fiscal years 2020 and 2019, we recognized other income from an adjustment in our tax receivable agreement liability as a result of a decrease in the estimated tax rate used in computing our future tax obligations and in turn, a decrease in the future tax benefit we expect to pay under our tax receivable agreement with pre-IPO owners. For fiscal 2019, the rate decrease was mainly offset by an increase to other expense for tax receivable agreement liability stemmingderived by future tax benefits from Tennessee net operating losses at Malibu Boats, Inc. For fiscal year 2018, we recognized other income as a result of a decrease in our estimated tax legislation enactedreceivable agreement liability. The reduction in our tax receivable agreement liability resulted primarily from the adoption of the Tax Act during the fourthsecond quarter of fiscal 2017year 2018, which reduceddecreased the estimated tax rate appliedused in computing our future tax obligations and, in turn, decreased the future tax benefit expectedwe expect to be realized by us onrealize related to increased tax basis from previous sales and exchanges of LLC Units by theour pre-IPO owners. Refer to Note 912 of our consolidated financial statements included elsewhere in this AnnualReport. |
| (9) | Reflects the elimination of the non-controlling interest in the LLC as if all LLC members had fully exchanged their LLC Units for shares of Class A Common Stock. |
| (10) | Reflects income tax expense at an estimated normalized annual effective income tax rate of 35.5%23.5% of income before taxes for fiscal year 2020, 24.1% of income before taxes for fiscal year 2019 and 27.2% of income before income taxes for the fiscal years ended June 30, 2017, 2016 and 2015,year 2018, in each case assuming the conversion of all LLC Units into shares of Class A Common Stock. The estimated normalized annual effective income tax rate for fiscal year 2020 is based on the federal statutory rate plus a blended state rate adjusted for the research and development tax credit, the foreign derived intangible income deduction, and foreign income taxes attributable to our Australian subsidiary. The estimated normalized annual effective income tax rate for fiscal year 2019 is based on the federal statutory rate plus a blended state rate adjusted for the research and development tax credit and foreign income taxes attributable to our Australian subsidiary. The estimated normalized effective income tax rate for fiscal year 2018 is based on the federal statutory rate plus a blended state rate adjusted for deductions under Section 199 of the Internal Revenue Code, of 1986, as amended, state taxes attributable to the LLC, and foreign income taxes attributable to our Australian based subsidiary. |
| (11) | The difference in weighted average shares outstanding for fiscal year 2018, relates to the difference in the weighting of shares outstanding of Class A Common Stock during this period for the calculation of basic net income per share for our financial statements and basic net income per share for adjusted fully distributed net income. |
| (12) | Represents the weighted average shares outstanding of LLC Units held by non-controlling interests assuming they were exchanged into Class A Common Stock on a one-for-one basis. |
(12)(13) | Represents the weighted average unvested restricted stock awards included in outstanding shares during the applicable period that were convertible into Class A Common Stock and granted to members of managementmanagement. |
(13)(14) | Reflects impact of increased share counts assuming the exchange of all weighted average shares outstanding of LLC Units into shares of Class A Common Stock and the conversion of all weighted average unvested restricted stock awards included in outstanding shares granted to members of management. |
Quarterly Results of Operations
The table below sets forth our unaudited quarterly consolidated statements of operations and comprehensive income data for each of the eight quarters through the period ended June 30, 2017. The unaudited quarterly consolidated statements of operations and comprehensive income data were prepared on a basis consistent with the audited consolidated financial statements included elsewhere in this Annual Report on Form 10-K. In the opinion of management, the quarterly financial information reflects all adjustments, consisting only of normal recurring adjustments, necessary for a fair presentation of this data. This information should be read in conjunction with the audited consolidated financial statements and related notes included elsewhere in this Annual Report. The historical results presented below are not necessarily indicative of the results to be expected for any future period, and the results for any interim period may not necessarily be indicative of the results of operations for a full year. The numbers in this table may not foot due to rounding differences.
|
| | | | | | | | | | | | | | | | | | | | | | | | | | | | | | | |
| | Three Months Ended (Unaudited) |
| | June 30,
2017 | | Mar. 31,
2017 | | Dec. 31,
2016 | | Sept. 30,
2016 | | June 30,
2016 | | Mar. 31,
2016 | | Dec. 31,
2015 | | Sept. 30,
2015 |
| Net sales | $ | 75,106 |
| | $ | 77,149 |
| | $ | 67,661 |
| | $ | 62,021 |
| | $ | 66,680 |
| | $ | 68,539 |
| | $ | 60,506 |
| | $ | 57,240 |
|
| Gross profit | 20,040 |
| | 21,362 |
| | 17,813 |
| | 15,823 |
| | 17,825 |
| | 18,406 |
| | 15,879 |
| | 14,710 |
|
| Operating income | 7,965 |
| | 13,026 |
| | 11,661 |
| | 6,786 |
| | 7,825 |
| | 11,825 |
| | 8,979 |
| | 7,275 |
|
| Net income | 10,266 |
| | 8,846 |
| | 7,737 |
| | 4,226 |
| | 4,090 |
| | 6,507 |
| | 5,718 |
| | 3,980 |
|
| Net income attributable to non-controlling interest | 602 |
| | 833 |
| | 836 |
| | 446 |
| | 486 |
| | 731 |
| | 614 |
| | 422 |
|
| Net income attributable to Malibu Boats, Inc. | $ | 9,664 |
| | $ | 8,013 |
| | $ | 6,901 |
| | $ | 3,780 |
| | $ | 3,604 |
| | $ | 5,776 |
| | $ | 5,104 |
| | $ | 3,558 |
|
Liquidity and Capital Resources
Our primary sources of funds are cash provided by operating activities and borrowings under our revolving credit facility.agreement. Our primary use of funds has been for capital investments, repayments under our debt repayments, andarrangements, acquisitions, cash distributions
to members of the LLC. We also recently refinancedLLC and cash payments under our credit facility and increased the amount of our term loans outstanding to fund our purchase of Cobalt in July 2017. tax receivable agreement. The following table summarizes the cash flows from operating, investing and financing activities (dollars in thousands):
| | | | | | | | | | | | | | | | | |
| | Fiscal Year Ended June 30, | | | | |
| | 2020 | | 2019 | | 2018 |
| Total cash provided by (used in): | | | | | |
| Operating activities | $ | 94,141 | | | $ | 81,500 | | | $ | 58,455 | |
| Investment activities | (40,394) | | | (118,011) | | | (135,856) | |
| Financing activities | (47,323) | | | 2,375 | | | 106,202 | |
| Impact of currency exchange rates on cash balances | (29) | | | (95) | | | — | |
| Increase (decrease) in cash | $ | 6,395 | | | $ | (34,231) | | | $ | 28,801 | |
|
| | | | | | | | | | | |
| | Fiscal Year Ended June 30, |
| | 2017 | | 2016 | | 2015 |
| Total cash provided by (used in): | | | | | |
| Operating activities | $ | 35,856 |
| | $ | 35,602 |
| | $ | 12,552 |
|
| Investment activities | (9,246 | ) | | (5,990 | ) | | (17,129 | ) |
| Financing activities | (19,719 | ) | | (12,022 | ) | | 742 |
|
| Impact of currency exchange rates on cash balances | 10 |
| | (56 | ) | | 49 |
|
| Increase (decrease) in cash | $ | 6,901 |
| | $ | 17,534 |
| | $ | (3,786 | ) |
Comparison of the Fiscal Year Ended June 30, 20172020 to the Fiscal Year Ended June 30, 20162019
Operating Activities
Net cash from operating activities was $35.9$94.1 million for fiscal year 2017,2020, compared to $35.6$81.5 million for the same period in 2016,2019, an increase of $0.3$12.6 million. The increase in cash provided by operating activities primarily resulted from changesa net increase in operating assets and liabilities of $0.9$13.0 million related to the timing of collections of accounts receivables, payments for accruals and payables, and purchases of inventory and an increase of $4.6 million in non-cash items primarily related to depreciation, amortization, deferred tax assets and non-cash compensation offset by $1.3a $5.0 million increasedecrease in net income (after consideration of non-cash items included in net income). Net cash from operating activities was reduced by $1.9 million for the settlement of a lawsuit with Marine Power, a former engine supplier, related to an amended judgment against us on August 18, 2016.income.
Investing Activities
Net cash used for investing activities was $9.2$40.4 million for fiscal year 20172020 compared to $6.0$118.0 million for the same period in 2016, an increase2019, a decrease of $3.3$77.6 million. The increasedecrease in cash used for investing activities was primarily duerelated to the purchase ofprice paid for Pursuit in October 2018, partially offset by an additional facilityincrease in Loudon, Tennessee and related capital improvements and investments for our vertical integration initiatives. Remaining capital outlays consistedexpenditures in fiscal year 2020 consisting of normal purchases for manufacturing infrastructure, molds, and equipment.equipment and expansion activities at Cobalt and Pursuit.
Financing Activities
Net cash used inby financing activities was $19.7$47.3 million for fiscal year 20172020 compared to net cash used inprovided by financing activities of $12.0$2.4 million for fiscal year 2016,2019, a decrease in cashchange of $7.7$49.7 million. During fiscal year 2017,2020, we made principal payments on our prior term loan of $72.0received $103.8 million and receivedin proceeds of $55.0 million from our new term loancredit facility primarily to provide financial flexibility in connection with our Second Amendedlight of the current uncertainty resulting from the COVID-19 pandemic. We repaid $110 million of revolving debt and Restated Credit Agreement entered into on June 28, 2017. In addition, during fiscal year 2017, we paid $1.5 million in distributions to LLC unit holders. During fiscal year 2016, we made principal payments on our prior term loan of $6.5 million, paid distributions to LLC unit holders of $1.4 million and repurchased $4.0$13.8 million of our Class A Common Stock under a shareour previously announced stock repurchase program.
stock options during fiscal year 2020. During fiscal year 2019, we received $55.0 million in proceeds from our credit facility primarily to fund the acquisition of Pursuit, which we subsequently repaid during the same fiscal year. We also converted $35.0 million from term debt to our revolving credit facility in May 2019. We also paid $1.8 million in distributions to LLC unit holders and $1.2 million on taxes for shares withheld on restricted stock vestings and we received $0.7 million proceeds from the exercise of stock options.
Comparison of the Fiscal Year Ended June 30, 20162019 to the Fiscal Year Ended June 30, 20152018
Operating Activities
Net cash from operating activities was $35.6$81.5 million for fiscal year 2016,2019, compared to $12.6$58.5 million for the same period in 2015,2018, an increase of $23.0 million.The increase in cash provided fromby operating activities was primarily due to our one-time payment of $20.0 million in fiscal year 2015 to settle the PCMW litigation. Excluding the settlement payment, cash flowsresulted from operating activities increased $3.0 million in fiscal year 2016 compared to fiscal year 2015, mostly due to changes in working capital offset by payments of $2.8 million under our tax receivable agreement. Thean increase in working capital was primarily due to a decrease in net cash usedincome of $7.5$38.7 million, related to payments made for accounts payable and a decrease in cash used related to inventory purchases of $2.9 million,partially offset by a decreaselower amount of $3.0 millionnon-cash expenses included in net income and an increase in the net use of cash related to the timing of collections onof accounts receivablereceivables, payments for accruals and increased paymentspayables, and purchases of income taxes.inventory.
Investing Activities
Net cash used for investing activities was $6.0$118.0 million for fiscal year 20162019 compared to $17.1$135.9 million for the same period in 2015,2018, a decrease of $11.1$17.8 million. The decrease in cash used infor investing activities was primarily related to the acquisitionlower purchase price paid for Pursuit in October 2018 compared to the purchase price paid for Cobalt in July 2017, partially offset by
an increase in capital outlaysexpenditures consisting of normal purchases for property, plant, and equipment which include boat molds, expansion of our trailer manufacturing infrastructure and a mezzanine addition in the main facility at our Loudon, Tennessee plant in fiscal year 2016.expansion activities, molds, and equipment.
Financing Activities
Net cash used inprovided by financing activities was $12.0$2.4 million for fiscal year 20162019 compared to net cash provided fromby financing activities of $0.7$106.2 million for fiscal year 2015,2018, a decrease in cash of $12.7$103.8 million. During the fiscal year 2016,ended June 30, 2019, we made principal paymentsreceived $55.0 million in proceeds from our revolving credit facility of which $50.0 million was used to fund the acquisition of Pursuit. We also converted $35.0 million from term debt to our revolving credit facility in May 2019. We have repaid $50.0 million on our prior term loan of $6.5revolving credit facility during fiscal year 2019. We paid $1.8 million paidin distributions to LLC unit holders and $1.2 million on taxes for shares withheld on restricted stock vestings and we received $0.7 million proceeds from the exercise of $1.4 million and repurchased $4.0 million of our Class A Common Stock under a share repurchase program.stock options for fiscal year 2019. During fiscal year 2015,2018, we utilized $20.0received proceeds of $105.0 million underfrom our revolving credit facility to fund the PCMW settlement agreement and acquisition of Cobalt and $55.3 million in proceeds from our Australian licensee. During this same period, we paid distributions to LLC unit holders of $3.6 million and completed two equity offerings, including a follow-on and secondary, foroffering, which we received net proceeds of $133.0used to repay $50.0 million and used those proceeds to purchase LLC Units directly from existing holders of LLC Units. In addition, we consummated an equity tender offer using proceeds of $80.0 million fromon our outstanding term loan entered into on April 2, 2015 to repurchase our Class A Common Stock.debt. In connection with thesethe term debt and equity offerings and the equity tender offer,offering, we paid $1.5$1.1 million and $0.7 million in legal and advisory costs, upon their completion. There were no such offeringsrespectively. In addition, during the fiscal year 2016.2018, we paid $1.6 million in distributions to LLC unit holders.
Loans and Commitments
We currently have a revolving credit facility with borrowing capacity of up to $120.0 million and a $75.0 million term loan outstanding. As of June 30, 2020, we had $8.8 million outstanding under our revolving credit facility and $1.2 million in outstanding letters of credit. On March 19, 2020, we elected to draw the then remaining available funds of $98.8 million from the revolving credit facility. In June 28, 2017,2020, we repaid $110.0 million on the revolving credit facility. The revolving credit facility matures on July 1, 2024 and the term loan matures on July 1, 2022. The revolving credit facility and term loan are governed by a credit agreement (the “Credit Agreement”) with Malibu Boats, LLC (“Boats LLC”) as the borrower (the “Borrower”), entered into a Second Amended and Restated Credit Agreement withTruist Financial Corp. (previously known as SunTrust Bank,Bank), as the administrative agent, swingline lender and issuing bank,bank. The obligations of Boats LLC under the Credit Agreement are guaranteed by the LLC, and, subject to refinance our prior credit facilitycertain exceptions, the present and to provide funds for our purchasefuture domestic subsidiaries of Cobalt. The credit agreement provides the Borrower a term loan facility in an aggregate principal amount of $160.0 million, $55.0 million of which was drawn on June 28, 2017 to refinance the outstanding loans under our prior credit facilityBoats LLC, and $105.0 million of which was drawn on July 6, 2017 to fund the paymentall such obligations are secured by substantially all of the purchase price for our acquisition of Cobalt, as well as to pay certain fees and expenses related to entering into the new credit agreement and a revolving credit facility of up to $35.0 million. Eachassets of the term loansLLC, Boats LLC and such subsidiary guarantors. Malibu Boats, Inc. is not a party to the revolving credit facility have a maturity date of July 1, 2022. The Borrower has the option to request lenders to increase the amount availableCredit Agreement.
Borrowings under the revolving credit facility by, or obtain incremental term loans of, up to $50.0 million, subject to the terms of the credit agreement and only if existing or new lenders choose to provide additional term or revolving commitments.
Borrowings under our credit agreementCredit Agreement bear interest at a rate equal to either, at the Borrower’sour option, (i) the highest of the prime rate, the Federal Funds Rate plus 0.5%, or one-month LIBOR plus 1% (the “Base Rate”) or (ii) LIBOR, in each case plus an applicable margin ranging from 1.75%1.25% to 3.00%2.25% with respect to LIBOR borrowings and 0.75%0.25% to 2.00%1.25% with respect to Base Rate borrowings. The applicable margin will be based upon the consolidated leverage ratio of the LLC and its subsidiaries calculated on a consolidated basis. As of June 30, 2017,2020, the interest rate on ourthe term loans was 3.72%loan and revolving credit facility was 1.66%. The Borrower will also be We are required to pay a commitment fee for theany unused portion of the revolving credit facility and on the daily amount of the unused delayed draw term loan during the availability period, which will range from 0.25%0.20% to 0.50%0.40% per annum, depending on the LLC’s and its subsidiaries’ consolidated leverage ratio. As with our prior credit facility, Malibu Boats, Inc. is not a party to the new credit agreement, and the obligations of the Borrower under the credit agreement are guaranteed by the LLC, and, subject to certain exceptions, the present and future domestic subsidiaries of the Borrower, and all such obligations are secured by substantially all of the assets of the LLC, the Borrower and such subsidiary guarantors.
The credit agreementCredit Agreement permits prepayment of the term loansloan without any penalties. The $55.0On August 17, 2017 we made a voluntary principal payment on the term loan in the amount of $50.0 million with a portion of the net proceeds from our equity offering completed on August 14, 2017. We exercised our option to apply the prepayment in forward order to principal installments on our term loan through December 31, 2021 and a portion of the principal installments due on March 31, 2022. As a result, the term loan is subject to a quarterly installmentsinstallment of approximately $700 per quarter until$3.0 million on March 31, 2019, then approximately $1,000 per quarter until June 30, 2021,2022 and approximately $1,400 per quarter through March 31, 2021. The $105.0 million term loan is subject to quarterly installments of approximately $1,300 per quarter until March 31, 2019, then approximately $2,000 per quarter until June 30, 2021, and approximately $2,600 per quarter through March 31, 2022. Thethe balance of boththe term loansloan is due on the scheduled maturity date of July 1, 2022. The credit agreementCredit Agreement is also subject to prepayments from the net cash proceeds received by the BorrowerBoats LLC or any guarantors from certain asset sales and recovery events, subject to certain reinvestment rights, and from excess cash flow, subject to the terms and conditions of the credit agreement. On August 17, 2017 the Borrower made a voluntary principal payment on the term loans in the amount of $50.0 million with a portion of the net proceeds from our equity offering completed on August 14, 2017. We exercised our option to apply the prepayment to principal installments on our term loans through December 31, 2021 and a portion of the principal installments due on March 31, 2022. As of August 31, 2017,June 30, 2020, the outstanding principal amount of ourthe term loansloan and revolving credit facility was $110.0$83.8 million.
The credit agreementCredit Agreement contains certain customary representations and warranties, and notice requirements for the occurrence of specific events such as the occurrence of any event of default, or pending or threatened litigation. The credit agreementCredit Agreement also requires compliance with certain customary financial covenants, including a minimum ratio of EBITDA to fixed charges and a maximum ratio of total debt to EBITDA. The credit agreementCredit Agreement contains certain restrictive covenants, which, among other things, place limits on certain activities of the loan parties under the credit agreement,Credit Agreement, such as the incurrence of additional indebtedness and additional liens on property and limit the future payment of dividends or distributions. For example, the credit agreementCredit Agreement generally prohibits theMalibu Boats Holdings, LLC, the BorrowerBoats LLC and the subsidiary guarantors from paying dividends or making distributions, including to the Company.us. The credit facility permits, however, (i) distributions based on a member’s allocated taxable income, (ii) distributions to fund payments that are required under the LLC’s tax receivable agreement, (iii) purchase of stock or stock options of the LLC from former officers, directors or employees of loan parties or payments pursuant to stock option and other benefit plans up to $2,000,000$2.0 million in any fiscal year, and (iv) share repurchase payments up to $20,000,000$35.0 million in any fiscal year subject to one-year carry forward and compliance with
other financial covenants. In addition, the LLC may make dividends and distributions of up to $6,000,000$10.0 million in any fiscal year, subject to compliance with other financial covenants.
Potential Impact of LIBOR Transition
The Chief Executive of the U.K. Financial Conduct Authority (the “FCA”), which regulates the London Interbank Offered Rate, or LIBOR, has announced that the FCA will no longer persuade or compel banks to submit rates for the calculation of LIBOR after 2021. That announcement indicates that the continuation of LIBOR on the current basis cannot and will not be guaranteed after 2021. Moreover, it is possible that LIBOR will be discontinued or modified prior to 2021.
All of our $83.8 million of debt outstanding under our Credit Agreement as of June 30, 2020 bears interest at a floating rate that uses LIBOR as the applicable reference rate to calculate the interest. Our Credit Agreement provides that, if the administrative agent has determined that adequate means do not exist for ascertaining LIBOR or that LIBOR does not adequately and fairly reflect the cost to lenders for making, funding or maintaining their loans, then all of our outstanding loans under the Credit Agreement will be converted into loans that accrue interest at the alternative Base Rate described above under “Loans and Commitments” on the last day of such interest period that determination is made. Further, the lenders under our Credit Agreement will no longer be obligated to make loans using LIBOR as the applicable reference rate.
In addition, our tax receivable agreement provides that, if for any reason the LLC is not able to make a tax distribution in an amount that is sufficient to make any required payment under the tax receivable agreement or we otherwise lack sufficient funds, interest would accrue on any unpaid amounts at LIBOR plus 500 basis points until they are paid. Our tax receivable agreement, however, does not provide for an alternative reference rate to LIBOR and, while we do not currently anticipate failing to pay any amounts owed under our tax receivable agreement, it is unclear how we would determine interest on any such amounts should we fail to pay as required under our tax receivable agreement.
If the rate used to calculate interest on our outstanding floating rate debt under our Credit Agreement that currently uses LIBOR were to increase by 1.0% either as a result of an increase in LIBOR or the result of the use of the alternative Base Rate, we would expect to incur additional interest expense on such indebtedness as of June 30, 2020 of approximately $0.8 million on an annualized basis. While we do not expect the potential impact of any LIBOR transition to have a material effect on our financial results based on our currently outstanding debt, uncertainty as to the nature of potential changes to LIBOR, fallback provisions, alternative reference rates or other reforms could adversely impact our interest expense on our floating rate debt that currently uses LIBOR as the applicable reference rate. In addition, any alternative reference rates to LIBOR may result in interest that does not correlate over time with the payments that would have been made on our indebtedness if LIBOR was available in its current form. Further, the discontinuance or modification of LIBOR and uncertainty of an alternative reference rate may result in the increase in the cost of future indebtedness, which could have a material adverse effect on our financial condition, cash flow and results of operations. We intend to closely monitor the financial markets and the use of fallback provisions and alternative reference rates in 2020 in anticipation of the discontinuance or modification of LIBOR by the end of 2021.
Future Liquidity Needs and Capital Expenditures
Management believes that our existing cash borrowing capacity under our revolving credit facility and cash flows from operations will be sufficient to fund our operations for the next 12 months. Our future capital requirements will depend on many factors, including the general economic environment in which we operate and our ability to generate cash flow from operations. Factors impacting our cash flow from operations include, but are not limited to, our growth rate and the timing and extent of operating expenses.
We estimate that approximately $4.3$3.6 million will be due under the tax receivable agreement within the next 12 months. In accordance with the tax receivable agreement, the next payment is anticipated to occur approximately 75 days after filing the federal tax return which is due on MarchApril 15, 2018. Management expects minimal effect2021.
Our future capital requirements will depend on many factors, including the general economic environment in which we operate and our ability to generate cash flow from operations, which are more uncertain as a result of the COVID-19 pandemic and its impact on the general economy. Our liquidity needs during this uncertain time will depend on multiple factors, including our ability to continue operations and production of boats, the COVID-19 pandemic’s effects on our future liquiditydealers, suppliers and capital resources.retail customers, the availability of sufficient amounts of financing, and our operating performance.
Stock Repurchase Program
On June 18, 2019, our Board of Directors authorized a stock repurchase program to allow for the repurchase of up to $35.0 million of our Class A Common Stock and the LLC's LLC Units (the “Repurchase Program”) for the period from July 1, 2019 to July 1, 2020. During the fiscal year ended June 30, 2020, we repurchased 483,679 shares of Class A Common Stock for $13.8 million in cash including related fees and expenses. This repurchase program expired on July 1, 2020. On August 27, 2020, our Board of Directors authorized a new stock repurchase program for the repurchase of up to $50.0 million of Class A Common Stock and the LLC Units for the period from September 2, 2020 to July 1, 2021. No shares have been repurchased under the New Repurchase Program.
Capital Resources
Management expects our capital expenditures for fiscal year 20182021 to be higherless than our 2017 capital expenditures for fiscal year 2020 primarily driven by expected investmentfacility expansion projects at Cobalt and Pursuit completed in our engine facility and expenditures. With respect to our engine vertical integration strategy, we expect a total investment, including investments already made to date, through expenditures, working capital, and capital expenses of approximately $18.0 million through fiscal year 2019, which we intend2020. Capital expenditures for fiscal year 2021 are expected to finance with cash from operationsconsist primarily of the completion of ongoing projects, new tooling, and our revolving credit facility.expenditures to increase production capacity to accommodate future growth.
Off-Balance Sheet Arrangements
Repurchase Commitments
In connection with our dealers’ wholesale floor plan financing of boats, we have entered into repurchase agreements with various lending institutions. The repurchase commitment is on an individual unit basis with a term from the date it is financed by the lending institution through payment date by the dealer, generally not exceeding two and a half years. Such agreements are customary in the industry and our exposure to loss under such agreements is limited by the resale value of the inventory which is required to be repurchased. Refer to Note 1518 to the audited consolidated financial statements included elsewhere in this Annual Report for further information on repurchase commitments.
Contractual Obligations and Commitments
As of June 30, 2017,2020, our continuing contractual obligations were as follows:
|
| | | | | | | | | | | | | | | | | | | |
| | Payments Due by Period |
| | Total | | Less than 1 Year | | 1-3 Years | | 3-5 Years | | More than 5 Years |
| | (In thousands) |
Term debt 1 | $ | 55,000 |
| | $ | 2,750 |
| | $ | 7,219 |
| | $ | 8,250 |
| | $ | 36,781 |
|
Interest expense 2 | 8,751 |
| | 2,051 |
| | 3,713 |
| | 2,987 |
| | — |
|
Operating leases 3 | 24,057 |
| | 2,263 |
| | 4,599 |
| | 4,618 |
| | 12,577 |
|
Purchase obligations 4 | 19,135 |
| | 19,135 |
| | — |
| | — |
| | — |
|
Payments pursuant to tax receivable agreement 5 | 82,291 |
| | 4,332 |
| | 9,115 |
| | 9,706 |
| | 59,138 |
|
| Total | $ | 189,234 |
| | $ | 30,531 |
| | $ | 24,646 |
| | $ | 25,561 |
| | $ | 108,496 |
|
| | | | | | | | | | | | | | | | | | | | | | | | | | | | | |
| Payments Due by Period | | | | | | | | |
| Total | | Less than 1 Year | | 1-3 Years | | 3-5 Years | | More than 5 Years |
| | | | | | | | | |
| (In thousands) | | | | | | | | |
Long-term debt 1 | $ | 83,800 | | | $ | — | | | $ | 75,000 | | | $ | 8,800 | | | $ | — | |
Interest expense 2 | 3,011 | | | 1,370 | | | 1,497 | | | 144 | | | — | |
Operating leases 3 | 18,273 | | | 2,548 | | | 4,833 | | | 4,878 | | | 6,014 | |
Purchase obligations 4 | 61,615 | | | 61,615 | | | — | | | — | | | — | |
Payments pursuant to tax receivable agreement 5 | 49,665 | | | 3,589 | | | 7,586 | | | 8,063 | | | 30,427 | |
| Total | $ | 216,364 | | | $ | 69,122 | | | $ | 88,916 | | | $ | 21,885 | | | $ | 36,441 | |
|
| | | | |
| (1) | Principal payments on our outstanding bank debt per terms of our Credit Agreement, which is comprised of a $75.0 million term loansloan and $120.0 million revolving credit facility, of which $8.8 million was outstanding as of June 30, 2020. Assumes no additional borrowings or repayments under our New Credit Agreement entered into in June 2017.revolving credit facility prior to its maturity. The term loans matureloan matures on July 1, 2022.2022 and the revolving credit facility matures on July 1, 2024. |
| (2) | Interest payments on our outstanding term loan and revolving credit facility under our credit agreement. Our term loan and revolving credit facility bear interest at variable rates. We had no amounts outstanding underhave calculated future interest obligations based on the interest rate for our term loan and revolving credit facility as of June 30, 2017. We may borrow up2020. |
| (3) | Pursuant to $35.0 million under our revolving credit facility which matures onthe adoption of ASC Topic 842, Leases, as of July 1, 2022.2019 our lease liability for all leases with terms greater than 12 months as represented on the balance sheet respective of maturity. |
(2)(4) | Interest payments on our outstanding term loans under our credit agreement. |
(3) | We sold our two primary manufacturing and office facilities for a total of $18.3 million in 2008, which resulted in a gain of $0.7 million. Simultaneous with the sale, we entered into an agreement to lease back the buildings for an initial term of 20 years. The net gain of $0.2 million has been deferred and is being amortized in proportion to rent charged over the initial lease term. |
(4) | As part of the normal course of business, we enter into purchase orders from a variety of suppliers, primarily for raw materials, in order to manage our various operating needs. The orders are expected to be purchased throughout fiscal year 2018.2021. |
| (5) | In connection withReflects amounts owed under our IPO in fiscal 2014,tax receivables agreement that we entered into a tax receivable agreement with theour pre-IPO owners at the time of our IPO. Under the LLC that provides for the payment by us totax receivables agreement, we pay the pre-IPO owners (or any permitted assignees) of 85% of the amount of cash savings, if any, in U.S. federal, state and local income tax or franchise tax that we actually realize, or in some circumstances are deemed to realize, as a result of an expected increase in our share of tax basis in LLC’s tangible and intangible assets, including increases attributable to payments made under the tax receivable agreement. These obligations will not be paid if we do not realize cash tax savings. |
Subsequent to June 30, 2017, we borrowed an additional $105.0 million under our term loan facility in July 2017 to fund the purchase of Cobalt and we made a voluntary principal prepayment of $50.0 million on our outstanding term loans with a portion of the net proceeds from our equity offering completed in August 2017. The following table reflects the amounts owed on our term loans and related interest, after giving effect to the additional borrowings under our term loan facility and the voluntary prepayment.
|
| | | | | | | | | | | | | | | | | | | | | |
| | Payments Due by Period |
| | Total | | Less than 1 Year | | 1-3 Years | | 3-5 Years | | More than 5 Years |
| | (In thousands) |
Term debt 1 | $ | 60,000 |
| | $ | — |
| | $ | — |
| | $ | 3,000 |
| | $ | 57,000 |
|
Interest expense 2 | 20,423 |
| | 4,258 |
| | 8,154 |
| | 8,011 |
| | — |
|
Operating leases 3 | 24,057 |
| | 2,263 |
| | 4,599 |
| | 4,618 |
| | 12,577 |
|
Purchase obligations 4 | 19,135 |
| | 19,135 |
| | — |
| | — |
| | — |
|
Payments pursuant to tax receivable agreement 5 | 82,291 |
| | 4,332 |
| | 9,115 |
| | 9,706 |
| | 59,138 |
|
| Total | $ | 205,906 |
| | $ | 29,988 |
| | $ | 21,868 |
| | $ | 25,335 |
| $ | — |
| $ | 128,715 |
|
|
| |
(1) | Principal payments on our outstanding term loans under our New Credit Agreement entered into in June 2017, after giving effect to the $105.0 million additional borrowings under the term loan in July 2017 and the $50.0 million voluntary principal prepayment on the term loans in August 2017. We had no amounts outstanding under our revolving credit facility as of August 31, 2017. We may borrow up to $35.0 million under our revolving credit facility which matures on July 1, 2022. |
(2) | Interest payments on our outstanding term loans under our credit agreement. |
(3) | We sold our two primary manufacturing and office facilities for a total of $18.3 million in 2008, which resulted in a gain of $0.7 million. Simultaneous with the sale, we entered into an agreement to lease back the buildings for an initial term of 20 years. The net gain of $0.2 million has been deferred and is being amortized in proportion to rent charged over the initial lease term. |
(4) | As part of the normal course of business, we enter into purchase orders from a variety of suppliers, primarily for raw materials, in order to manage our various operating needs. The orders are expected to be purchased throughout fiscal year 2018. |
(5) | In connection with our IPO in fiscal 2014, we entered into a tax receivable agreement with the pre-IPO owners of the LLC that provides for the payment by us to the pre-IPO owners (or any permitted assignees) of 85% of the amount of cash savings, if any, in U.S. federal, state and local income tax or franchise tax that we actually realize, or in some circumstances are deemed to realize, as a result of an expected increase in our share of tax basis in LLC’s tangible and intangible assets, including increases attributable to payments made under the tax receivable agreement. These obligations will not be paid if we do not realize cash tax savings. |
Our dealers have arrangements with certain finance companies to provide secured floor plan financing for the purchase of our products. These arrangements indirectly provide liquidity to us by financing dealer purchases of our products, thereby minimizing the use of our working capital in the form of accounts receivable. A majority of our sales are financed under similar arrangements, pursuant to which we receive payment within a few days of shipment of the product. We have agreed to repurchase products repossessed by the finance companies if a dealer defaults on its debt obligations to a finance company and the boat is returned to us, subject to certain limitations. Our financial exposure under these agreements is limited to the difference between the amounts unpaid by the dealer with respect to the repossessed product plus costs of repossession and the
amount received on the resale of the repossessed product. DuringFor fiscal year 2016,2020, we agreed to repurchase threerepurchased two units from thea lender of one of our former dealers and those units were subsequently resold in fiscal year 2020 above their cost and at a minimal margin loss. For fiscal year 2019, we repurchased eight units from a lender of two of our former dealers resulting in combined losses of $0.03 million. Noand those units were repurchased forsubsequently resold in fiscal years 2017year 2020 above their cost and 2015. at minimal margin loss. For fiscal year 2018, we did not repurchase any units under our repurchase agreements. An adverse change in retail sales could require us to repurchase repossessed units upon an event of default by any of our dealers, subject to the annual limitation.
Seasonality
Our dealers experience seasonality in their business. Retail demand for boats is seasonal, with a significant majority of sales occurring during peak boating season, which coincides with our first and fourth fiscal quarters. In order to minimize the impact of this seasonality on our business, we manage our manufacturing processes and structure dealer incentives to tie our annual volume rebates program to consistent ordering patterns, encouraging dealers to purchase our products throughout the year. In this regard, we may offer free flooring incentives to dealers from the beginning of our model year through April 30 of each year. Further, in the event that a dealer does not consistently order units throughout the year, such dealer’s rebate is materially reduced. We may offer off-season retail promotions to our dealers in seasonally slow months, during and ahead of boat shows, to encourage retail demand.
Emerging Growth Company
We are an “emerging growth company,” as defined in the JOBS Act. For as long as we are an “emerging growth company,” we may take advantage of certain exemptions from various reporting requirements that are applicable to other public companies that are not “emerging growth companies,” including, but not limited to, not being required to comply with the auditor attestation requirements of Section 404(b) of the Sarbanes-Oxley Act, reduced disclosure obligations regarding executive compensation in our periodic reports and proxy statements and exemptions from the requirements of holding stockholder advisory “say-on-pay” votes on executive compensation and stockholder advisory votes on golden parachute compensation.
The JOBS Act also provides that an “emerging growth company” can utilize the extended transition period provided in Section 7(a)(2)(B) of the Securities Act, for complying with new or revised accounting standards. Pursuant to Section 107 of the JOBS Act, we have chosen to “opt out” of such extended transition period and, as a result, we will comply with new or revised accounting standards on the relevant dates on which adoption of such standards is required for companies that are not “emerging growth companies.” Under the JOBS Act, our decision to opt out of the extended transition period for complying with new or revised accounting standards is irrevocable.
We will continue to be an emerging growth company until the earliest to occur of (i) the last day of the fiscal year during which we had total annual gross revenues of at least $1 billion (as indexed for inflation), (ii) the last day of the fiscal year following the fifth anniversary of the closing of the IPO, (iii) the date on which we have, during the previous three-year period, issued more than $1 billion in non-convertible debt or (iv) the date on which we are deemed to be a "large accelerated filer," as defined under the Exchange Act. Accordingly, we could remain an "emerging growth company" until as late as June 30, 2019.
Inflation
The market prices of certain materials and components used in manufacturing our products, especially resins that are made with hydrocarbon feedstocks, copper, aluminum and stainless steel, can be volatile. Historically, however, inflation has not had a material effect on our results of operations. Significant increases in inflation, particularly those related to wages and increases in the cost of raw materials, could have an adverse impact on our business, financial condition and results of operations.
New boat buyers often finance their purchases. Inflation typically results in higher interest rates that could translate into an increased cost of boat ownership. Should inflation and increased interest rates occur, prospective consumers may choose to forgo or delay their purchases or buy a less expensive boat in the event credit is not available to finance their boat purchases.
Critical Accounting Policies
Our discussion and analysis of our financial condition and results of operations are based upon our consolidated financial statements, which have been prepared in accordance with GAAP. These principles require us to make estimates and judgments that affect the reported amounts of assets, liabilities, expenses and cash flows, and related disclosure of contingent assets and liabilities. Our estimates include those related to goodwill,business combinations, revenue recognition, dealer incentives, product repurchasesincome taxes, tax receivable agreement liability, and warranty claims. We base our estimates on historical experience and on various other assumptions that we believe to be reasonable under the circumstances. Actual results may differ from these estimates. To the extent that there are material differences between these estimates and our actual results, our future financial statements will be affected.
We believe that of our significant accounting policies, which are described in the notes to our audited consolidated financial statements appearing elsewhere in this Annual Report, the accounting policies listed below involve a greater degree of judgment and complexity. Accordingly, we believe these are the most critical to understand and evaluate fully our financial condition and results of operations.
GoodwillRevenue Recognition
GoodwillRevenue is an asset representingrecognized as performance obligations under the future economic benefits arising from other assets acquired in a business combination thatterms of contracts with customers are not individually identified and separately recognized. Goodwill amounts are not amortized, but rather are evaluated for potential impairment on an annual basis, assatisfied; this occurs when control of June 30, in accordance with the provisions of ASC Topic 350, Intangibles—Goodwill and Other. Under the guidance, the Company may assess qualitative factors to determine whether itpromised goods (boats, parts, or other) is more likely than not that the fair value of a reporting unit is less than its carrying amount. If this assessment indicates the possibility of impairment, the income approach to test for goodwill impairment would be used. Under the income approach, management calculates the fair value of its reporting units based on the present value of estimated future cash flows. If the fair value of an individual reporting unit exceeds the carrying value of the net assets including goodwill assigned to that unit, goodwill is not impaired. If the carrying value of the reporting unit’s net assets including goodwill exceeds the fair value of the reporting unit, then management determines the implied fair value of the reporting unit’s goodwill. If the carrying value of the reporting unit’s goodwill exceeds its implied fair value, then the Company would record an impairment loss equaltransferred to the difference. We did not recognize any goodwill impairment chargescustomer. Revenue is measured as the amount of consideration we expect to receive in the fiscal years ended June 30, 2017, 2016 and 2015.
Revenue Recognition
exchange for transferring goods or providing services. We generally manufacture products based on specific orders from dealers and often ship completed products only after receiving credit approval from third-party financial institutions or those participatinginstitutions. The amount of consideration we receive and revenue we recognize varies with changes in floor financing programs. Revenue associated with salesmarketing incentives and rebates we offer to our dealers financed through either source is primarily recorded when all of the following conditions have been met:
an order for a product has been received;
a common carrier signs the delivery ticket accepting responsibility for the product; and
the product is removed from our property for delivery.
These conditions are generally met when title passes, which is when boats are shipped to dealers in accordance with shipping terms, which are primarily free on board shipping point. their customers.
Dealers generally have no rights to return unsold boats. From time to time, however, we may accept returns in limited circumstances and at our discretion under our warranty policy, which generally limits returns to instances of manufacturing defects. We estimate the costs that may be incurred under our basic limited warranty and record a liability in the amount of such costs at the time the product revenue is recognized. We may also be obligated, in the event of default by a dealer, to accept returns of unsold boats under our repurchase commitment to floor financing providers, whichwho are able to obtain such boats
through foreclosure. We accrue estimated lossesreturns when a loss,repurchase and return, due to the default of one of our dealers, is determined to be probable and the amount of the lossreturn is reasonably estimable. Historically, product returns resulting from repurchases made under the floorplan financing program, have not been material and the returned boats have been subsequently resold above their cost. Refer to Notes 7Note 9 and 15 to our audited consolidated financial statements included elsewhere in this Annual Report for more informationNote 18 related to our product warranty and repurchase commitment obligations, respectively.
Revenue from boat part sales is recorded as the product is shipped from our location, which is free on board shipping point. Revenue associated with sales of materials, parts, boats or engine products sold under our exclusive manufacturing and distribution agreement with our Australian licensee prior to the closing date of its acquisition were recognized under free-on-board port of disembarkment terms, the point at which the risks of ownership and loss passed to the licensee. Revenue from our Australia operations recognized after the acquisition date issubsidiary are eliminated in consolidation. We also earned royalties from our Australian licensee prior to its acquisition, which were accrued on a monthly basis based on a percentage of the licensee’s gross sales. Royalties earned were paid to us on a quarterly basis. Royalty income earned after the acquisition date is eliminated in consolidation.
Revenue associated with sales to the independent representative responsible for international sales is recognized in accordance with free on board shipping point terms, the point at which the risks of ownership and loss pass to the representative. A fixed percentage discount is earned by the independent representative at the time of shipment to the representative as a reduction in the price of the boat and is recorded in our consolidated statement of operations as a reduction in sales.
Dealer Incentives
We provide for various structured dealer rebate and sales promotions incentives, which are recognized as a reduction in net sales, at the time of sale to the dealer. Examples of such programs include rebates, seasonal discounts, promotional co-op arrangements and other allowances. Dealer rebates and sales promotion expenses are estimated basedearn royalties on current programs and historical achievement and/or usage rates. Actual results may differ from these estimates if market conditions dictate the need to enhance or reduce sales promotion and incentive programs or if dealer achievement or other items vary from historical trends. Free floor financing incentives are estimated at the time of sale to the dealer based on the expected expense to us over the term of the free flooring period and are recognized as a reduction in sales.
Income Taxes
Malibu Boats, Inc. is taxed as a C corporation for U.S. income tax purposes and is therefore subject to both federal and state taxation at a corporate level. The LLC, our direct, wholly owned subsidiary, continues to operate in the United States as a partnership for U.S. federal income tax purposes.
We file various federal and state tax returns, including some returns that are consolidated with subsidiaries. We account for the current and deferred tax effects of such returns using the asset and liability method. Significant judgments and estimates are required in determining our current and deferred tax assets and liabilities, which reflect our best assessment of the estimated future taxes we will pay. These estimates are updated throughout the year to consider income tax return filings, our geographic mix of earnings, legislative changes and other relevant items.
We recognize deferred tax assets and liabilities based on the differences between the financial statement carrying amounts of assets and liabilities and the amounts applicable for income tax purposes. Deferred tax assets represent items to be realized as a tax deduction or credit in future tax returns. Realization of the deferred tax assets ultimately depends on the existence of sufficient taxable income of the appropriate character in either the carryback or carryforward period.
Each quarter we analyze the likelihood that our deferred tax assets will be realized. A valuation allowance is recorded if, based on the weight of all available positive and negative evidence, it is more likely than not (a likelihood of more than 50%) that some portion, or all, of a deferred tax asset will not be realized. A summary of our deferred tax assets is included in Note 10 to our audited consolidated financial statements included elsewhere in this Annual Report.
On an annual basis, we perform a comprehensive analysis of all forms of positive and negative evidence based on year end results. During each interim period, we update our annual analysis for significant changes in the positive and negative evidence.
If we later determine that realization is more likely than not for deferred tax assets with a valuation allowance, the related valuation allowance will be reduced. Conversely, if we determine that it is more likely than not that we will not be able to realize a portion of our deferred tax assets, we will increase the valuation allowance.
We recognize a tax benefit associated with an uncertain tax position when, in our judgment, it is more likely than not that the position will be sustained based upon the technical merits of the position. For a tax position that meets the more-likely-than-not recognition threshold, we initially and subsequently measure the income tax benefit as the largest amount that we judge to
have a greater than 50% likelihood of being realized. Our liability associated with unrecognized tax benefits is adjusted periodically due to changing circumstances, such as the progress of tax audits, case law developments and new or emerging legislation. Such adjustments are recognized entirely in the period in which they are identified. Our income tax provision includes the net impact of changes in the liability for unrecognized tax benefits.
The Company has filed federal and state income tax returns that remain open to examination for years 2014 through 2016, while its subsidiaries, Malibu Boats Holdings, LLC and Malibu Boats Pty Ltd., remain open to examination for years 2013 through 2016. The Company is currently undergoing an IRS examination of its June 30, 2015 return which began in the fourth quarter of fiscal 2017. While it is often difficult to predict the final outcome or the timing of resolution of any particular tax matter, we believe our liability for unrecognized tax benefits is adequate.
We consider an issue to be resolved at the earlier of the issue being “effectively settled,” settlement of an examination, or the expiration of the statute of limitations. Upon resolution, unrecognized tax benefits will be reversed as a discrete event.
Our liability for unrecognized tax benefits is generally presented as noncurrent. However, if we anticipate paying cash within one year to settle an uncertain tax position, the liability is presented as current. We classify interest and penalties recognized on the liability for unrecognized tax benefits as income tax expense.
Tax Receivable Agreement
As a result of exchanges of LLC Units into Class A Common Stock and purchases by us of LLC Units from holders of LLC Units, we will become entitled to a proportionate share of the existing tax basis of the assets of the LLC at the time of such exchanges or purchases. In addition, such exchanges or purchases of LLC Units are expected to result in increases in the tax basis of the assets of the LLC that otherwise would not have been available. These increases in tax basis may reduce the amount of tax that we would otherwise be required to pay in the future. These increases in tax basis may also decrease gains (or increase losses) on future dispositions of certain capital assets to the extent tax basis is allocated to those capital assets.
In connectionboats shipped with our IPO and the recapitalization we completed in connection with our IPO, we entered into a tax receivable agreement with the pre-IPO owners of the LLC that provides for the payment by us to the pre-IPO owners (or any permitted assignees) of 85% of the amount of the benefits, if any, that we are deemed to realize as a result of (i) increases in tax basis and (ii) certain other tax benefits, including those attributable to payments,proprietary wake surfing technology under the tax receivable agreement. These contractual payment obligations are our obligations and are not obligations of the LLC, and are accounted for in accordance with ASC 450, Contingencies, since the obligations were deemed to be probable and reasonably estimable. For purposes of the tax receivable agreement, the benefit deemed realized by us will be computed by comparing our actual income tax liability (calculated with certain assumptions) to the amount of such taxes that we would have been required to pay had there been no increase to the tax basis of the assets of the LLC as a result of the purchases or exchanges, and had we not entered into the tax receivable agreement.
The timing and/or amount of aggregate payments due under the tax receivable agreement may vary based on a number of factors, including the amount and timing of the taxable income we generate in the future and the tax rate then applicable and amortizable basis.
The term of the tax receivable agreement will continue until all such tax benefits have been utilized or expired, unless we exercise our right to terminate the tax receivable agreement for an amount based on the agreed payments remaining to be made under the agreement. In certain mergers, asset sales or other forms of business combinations or other changes of control, we (or our successor) would owe to the pre-IPO owners of the LLC (or any permitted assignees) a lump-sum payment equal to the present value of all forecasted future payments that would have otherwise been made under the tax receivable agreement that would be based on certain assumptions, including a deemed exchange of all LLC Units and that we would have had sufficient taxable income to fully utilize the deductions arising from the increased tax basis and other tax benefits related to entering into the tax receivable agreement.
Repurchase Commitments
In connection with our dealers’ wholesale floor plan financing of boats, we have entered into repurchaselicensing agreements with various lending institutions.marine manufacturers. Royalty income is recognized when products are used or sold with our patented technology by these other boat manufacturers and industry suppliers. The repurchase commitment is on an individual unit basis with a term fromusage of our technology satisfies the date it is financed by the lending institution through payment date by the dealer, generally not exceeding two and a half years. Such agreements are customaryperformance obligation in the industry and our exposure to loss under such agreements is limited by the resale value of the inventory which is required to be repurchased. During fiscal year 2017, we did not repurchase any units from dealers. During fiscal year 2016, we agreed to repurchase three units from the lender of two of our former dealers for combined losses of less than $0.03
million. Other than the three units repurchased from two of our former dealers for less than $0.03 million in fiscal year 2016, we have not repurchased another unit from lenders since July 1, 2010.contract.
Product Warranties
Effective for model year 2016, the Company began providingOur Malibu and Axis brand boats have a limited warranty for a period up to five years. Our Cobalt brand boats have (1) a structural warranty of up to ten years which covers the hull, deck joints, bulkheads, floor, transom, stringers, and motor mount, and (2) a five year bow-to-stern warranty on all components manufactured or purchased (excluding hull and deck structural components), including canvas and upholstery. Gelcoat is covered up to three years for bothCobalt and one year for Malibu and AxisAxis. Pursuit brand boats. For model years prior to 2016, the Company providedboats have (1) a limited warranty for a period of up to threefive years for its Malibu brand boatson structural components such as the hull, deck and defects in the gelcoat surface of the hull bottom and (2) a bow-to-stern warranty of two years (excluding hull and deck structural components). For each boat brand, there are certain materials, components or parts of the boat that are not covered by our warranty and certain components or parts that are separately warranted by the manufacturer or supplier (such as the engine). Engines that we manufacture for itsMalibu and Axis products. models have a limited warranty of up to five years or five-hundred hours.
Our standard warranties require us or our dealers to repair or replace defective products during the warranty period at no cost to the consumer. We estimate thewarranty costs that may be incurred under our basic limited warrantywe expect to incur and record as a liability in the amount offor such costs at the time the product revenue is recognized. We utilize historical claims trends and analytical tools to develop the estimate of our warranty obligation on a per boat basis, by brand and warranty year. Factors that affect our warranty liability include the number of units sold, historical and anticipated rates of warranty claims and cost per claim. We utilize historical trends and analytical tools to assist in determining the appropriate warranty liability. The extension of our warranty coverage period is expected to continue to increase our obligations to cover warranty claims over time resulting in an increase in our reserve to cover these warranty claims. We periodically assess the adequacy of theour recorded warranty liabilities by brand and will adjust the amounts as necessary based onnecessary. Beginning in model year 2016, we increased the best available informationterm of our limited warranty for Malibu brand boats from three years to five years and trends.for Axis brand boats from two years to five years. Beginning in model year 2018, we increased the term of our bow-to-stern warranty for Cobalt brand boats from three years to five years. As a result of these changes, all of our Malibu, Axis and Cobalt brand boats with historical claims experience that are no longer covered under warranty had warranty terms shorter than the current warranty term of five years. Accordingly, we have little to no historical claims experience for warranty years four and five, and as such, these estimates give rise to a higher level of estimation uncertainty. Future warranty claims may differ from our estimate of the warranty liability, which could lead to changes in the Company’s warranty liability in future periods. A hypothetical change of a 10% increase or decrease to our estimate of the warranty liability as of June 30, 2020 would have affected net income for the fiscal year ended June 30, 2020 by approximately $2.1 million.
New Accounting Pronouncements
See "Part II, Item 8. Financial Statements and Supplementary Data—Note 1—Organization, Basis of Presentation, and Summary of Significant Accounting Policies—New Accounting Pronouncements.”
Item 7A. Quantitative and Qualitative Disclosures About Market Risk
Market risk represents the risk of loss that may impact our financial condition through adverse changes in financial market prices and rates and inflation. Changes in these factors could cause fluctuations in our results of operations and cash flows. In the ordinary course of business, we are primarily exposed to foreign exchange rate and interest rate risks. We manage our exposure to these market risks through regular operating and financing activities. In the past, we have also attempted to reduce our market risks through hedging instruments such as interest rate swaps.
Foreign Exchange Rate Risk
We have operations both within the United States and Australia, and we are exposed to market risks in the ordinary course of our business. These risks primarily include foreign exchange rate and inflation risks. Our Australian operations purchase key components from our U.S. operations, as well as other U.S. based suppliers, and pay for these purchases in U.S. dollars. Fluctuations in the foreign exchange rate of the U.S. dollar against the Australian dollar have resulted in a foreign currency transaction gain of $0.1 million in foreign currency translation in the fiscal year ended June 30, 2020. We had a flat foreign currency translation for fiscal year 2019 and a loss of $0.1 million and $0.2 million for the fiscal years ended June 30, 2017, 2016 and 2015, respectively.year 2018. We are also subject to risks relating to changes in the general economic conditions in the countries where we conduct business. To reduce certain of these risks to our Australian operations, we monitor, on a regular basis, the financial condition and position of the subsidiary. We do not use derivative instruments to mitigate the impact of our foreign exchange rate risk exposures.
Additionally, the assets and liabilities of our Australian subsidiary are translated at the foreign exchange rate in effect at the balance sheet date. Translation gains and losses are reflected as a component of accumulated other comprehensive loss in the stockholders’ equity section of the accompanying consolidated balance sheets. Revenues and expenses of our foreign subsidiary are translated at the average foreign exchange rate in effect for each month of the quarter. Certain assets and liabilities related to intercompany positions reported on our consolidated balance sheet that are denominated in a currency other than the functional currency are translated at the foreign exchange rates at the balance sheet date and the associated gains and losses are included in net income.
Interest Rate Risk
We are subject to interest rate risk in connection with borrowings under our revolving credit agreementfacility and term loan, which bearsbear interest at variable rates. At June 30, 2017,2020, we had a $55.0 million$75.0 million of term loan outstanding under our term loan facility and no$8.8 million outstanding debt under our revolving credit facility. As of June 30, 2017,2020, the undrawn borrowing availabilityamount under theour revolving line of credit facility was $35.0$111.2 million. Borrowings under the term loan and revolving credit facility bear interest at our option of (i) the highest of the prime rate, the Federal Funds Rate plus 0.5%, or one-month LIBOR plus 1%, which is the Base Rate, or (ii) LIBOR, in each case plus an applicable margin ranging from 1.00%0.25% to 1.75%1.25% with respect to Base Rate borrowings and 2.00%1.25% to 2.75%2.25% with respect to LIBOR borrowings. Therefore, our income and cash flows will be exposed to changes in interest rates to the extent that we do not have effective hedging arrangements in place.
At June 30, 2017,2020, the interest rate on our term loan and revolving credit facility was 3.72%1.66%. Based on a sensitivity analysis at June 30, 2017,2020, assuming no amounts are outstanding under our revolving credit facility for a full year, a 100 basis point increase in interest rates would increase our annual interest expense by approximately $0.2 million. Subsequent to June 30, 2017, we refinanced our credit agreement and increased our outstanding term loan to $160.0 $0.8 million outstanding and subsequently made a voluntary prepayment of $50.0 million on our term loans with the proceeds of our equity offering completed in August 2017. As of August 31, 2017, we had $110.0 million outstanding under our term loan and no amounts outstanding under our revolving credit facility. At August 31, 2017, the interest rate on our term loans was 3.73%. Based on a sensitivity analysis at August 31, 2017, assuming no amounts are outstanding under our revolving credit facility for a full year, a 100 basis point increase in interest rates would increase our annual interest expense by approximately $0.8 million.
On July 1, 2015, we entered into a 5-year floating to fixed interest rate swap with a certain counterparty to the previously existing credit agreement to mitigate the risk of interest rate fluctuations associated with our variable rate long term debt. The swap has an effective start date of July 1, 2015 and is based on a one-month LIBOR rate versus a 1.52% fixed rate on a notional value of $39.3 million, which under terms of the previously existing credit agreement iswas equal to 50% of the outstanding balance of theour term loan at the time of the swap arrangement. The swap matured on March 31, 2020. For the fiscal year ended June 30, 2017,2020, we recorded a gainloss of $0.9$0.1 million for the change in fair value of the interest rate swap, which is included in interest expense in the consolidated statements of operations and comprehensive income (loss).
income.
Item 8. Financial Statements and Supplementary Data
INDEX TO FINANCIAL STATEMENTS
MALIBU BOATS, INC. AND SUBSIDIARIES
Report of Management on Internal Control Over Financial Reporting
Malibu Boats, Inc.'s (the "Company") management is responsible for establishing and maintaining adequate internal control over financial reporting as defined in Rule 13a-15(f) under the Securities Exchange Act of 1934, as amended. Internal control over financial reporting is a process to provide reasonable assurance regarding the reliability of the Company's financial reporting for external purposes in accordance with U.S. generally accepted accounting principles. Because of its inherent limitations, internal control over financial reporting may not prevent or detect misstatements. Projections of any evaluation of effectiveness to future periods are subject to the risk that controls may become inadequate because of changes in conditions, or that the degree of compliance with the policies or procedures may deteriorate.
The Company's management, including its chief executive officer and chief financial officer, assessed the effectiveness of the Company's internal control over financial reporting as of June 30, 2020. In making this assessment, the Company used the criteria set forth by the Committee of Sponsoring Organizations of the Treadway Commission ("COSO") in Internal Control-Integrated Framework (2013).
Based on such assessment the Company's management has concluded that, as of June 30, 2020, its internal control over financial reporting is effective based on those criteria.
The effectiveness of internal control over financial reporting as of June 30, 2020 has been audited by KPMG LLP, an independent registered public accounting firm, as stated in its attestation report, which is included herein.
Malibu Boats, Inc.
Loudon, Tennessee
August 31, 2020
Report of Independent Registered Public Accounting Firm
To the Stockholders and Board of Directors and Shareholders
Malibu Boats, Inc.:
Opinion on Internal Control Over Financial Reporting
We have audited the accompanying consolidated statements of operations and comprehensive income, stockholders' equity, and cash flows for the year ended June 30, 2015 of Malibu Boats, Inc. and subsidiaries (collectively,subsidiaries’ (the Company) internal control over financial reporting as of June 30, 2020, based on criteria established in Internal Control – Integrated Framework (2013) issued by the financial statements). These financial statements are the responsibilityCommittee of Sponsoring Organizations of the Company's management. Our responsibility is to express anTreadway Commission. In our opinion, on thesethe Company maintained, in all material respects, effective internal control over financial statementsreporting as of June 30, 2020, based on our audit.
criteria established in Internal Control – Integrated Framework (2013) issued by the Committee of Sponsoring Organizations of the Treadway Commission.
We conducted our auditalso have audited, in accordance with the standards of the Public Company Accounting Oversight Board (United States). (PCAOB), the consolidated balance sheets of the Company as of June 30, 2020 and 2019, the related consolidated statements of operations and comprehensive income, stockholders’ equity, and cash flows for each of the years in the three-year period ended June 30, 2020, and the related notes (collectively, the consolidated financial statements), and our report dated August 31, 2020 expressed an unqualified opinion on those consolidated financial statements.
Basis for Opinion
The Company’s management is responsible for maintaining effective internal control over financial reporting and for its assessment of the effectiveness of internal control over financial reporting, included in the accompanying Management’s Report on Internal Control over Financial Reporting. Our responsibility is to express an opinion on the Company’s internal control over financial reporting based on our audit. We are a public accounting firm registered with the PCAOB and are required to be independent with respect to the Company in accordance with the U.S. federal securities laws and the applicable rules and regulations of the Securities and Exchange Commission and the PCAOB.
We conducted our audit in accordance with the standards of the PCAOB. Those standards require that we plan and perform the audit to obtain reasonable assurance about whether effective internal control over financial reporting was maintained in all material respects. Our audit of internal control over financial reporting included obtaining an understanding of internal control over financial reporting, assessing the financial statements are freerisk that a material weakness exists, and testing and evaluating the design and operating effectiveness of material misstatement. Aninternal control based on the assessed risk. Our audit includes examining, on a test basis, evidence supporting the amounts and disclosuresalso included performing such other procedures as we considered necessary in the financial statements. An audit also includes assessing the accounting principles used and significant estimates made by management, as well as evaluating the overall financial statement presentation.circumstances. We believe that our audit provides a reasonable basis for our opinion.
Definition and Limitations of Internal Control Over Financial Reporting
In our opinion,A company’s internal control over financial reporting is a process designed to provide reasonable assurance regarding the consolidatedreliability of financial reporting and the preparation of financial statements referred to above present fairly,for external purposes in all material respects, the results of operations of Malibu Boats, Inc. and subsidiaries and their cash flows for the year ended June 30, 2015, in conformityaccordance with U.S. generally accepted accounting principles. A company’s internal control over financial reporting includes those policies and procedures that (1) pertain to the maintenance of records that, in reasonable detail, accurately and fairly reflect the transactions and dispositions of the assets of the company; (2) provide reasonable assurance that transactions are recorded as necessary to permit preparation of financial statements in accordance with generally accepted accounting principles, and that receipts and expenditures of the company are being made only in accordance with authorizations of management and directors of the company; and (3) provide reasonable assurance regarding prevention or timely detection of unauthorized acquisition, use, or disposition of the company’s assets that could have a material effect on the financial statements.
Because of its inherent limitations, internal control over financial reporting may not prevent or detect misstatements. Also, projections of any evaluation of effectiveness to future periods are subject to the risk that controls may become inadequate because of changes in conditions, or that the degree of compliance with the policies or procedures may deteriorate.
/s/ RSM USKPMG LLP
Indianapolis, IndianaKnoxville, Tennessee
September 9, 2015, except for note 1, under the heading Immaterial Correction of Error, which is dated September 7, 2017August 31, 2020
Report of Independent Registered Public Accounting Firm
TheTo the Stockholders and Board of Directors and Stockholders of
Malibu Boats, Inc.:
Opinion on the Consolidated Financial Statements
We have audited the accompanying consolidated balance sheets of Malibu Boats, Inc. and subsidiaries (the Company) as of June 30, 20172020 and 2016, and2019, the related consolidated statements of operations and comprehensive income, stockholders’ equity, and cash flows for each of the years then ended. in the three-year period ended June 30, 2020, and the related notes (collectively, the consolidated financial statements). In our opinion, the consolidated financial statements present fairly, in all material respects, the financial position of the Company as of June 30, 2020 and 2019, and the results of its operations and its cash flows for each of the years in the three-year period ended June 30, 2020, in conformity with U.S. generally accepted accounting principles.
We also have audited, in accordance with the standards of the Public Company Accounting Oversight Board (United States) (PCAOB), the Company’s internal control over financial reporting as of June 30, 2020, based on criteria established in Internal Control – Integrated Framework (2013) issued by the Committee of Sponsoring Organizations of the Treadway Commission, and our report dated August 31, 2020 expressed an unqualified opinion on the effectiveness of the Company’s internal control over financial reporting.
Change in Accounting Principle
As discussed in Note 1 to the consolidated financial statements, the Company has changed its method of accounting for leases as of July 1, 2019 due to the adoption of Accounting Standards Codification Topic 842, Leases.
Basis for Opinion
These consolidated financial statements are the responsibility of the Company’s management. Our responsibility is to express an opinion on these consolidated financial statements based on our audits.
We are a public accounting firm registered with the PCAOB and are required to be independent with respect to the Company in accordance with the U.S. federal securities laws and the applicable rules and regulations of the Securities and Exchange Commission and the PCAOB.
We conducted our audits in accordance with the standards of the Public Company Accounting Oversight Board (United States).PCAOB. Those standards require that we plan and perform the audit to obtain reasonable assurance about whether the consolidated financial statements are free of material misstatement. An audit includesmisstatement, whether due to error or fraud. Our audits included performing procedures to assess the risks of material misstatement of the consolidated financial statements, whether due to error or fraud, and performing procedures that respond to those risks. Such procedures included examining, on a test basis, evidence supportingregarding the amounts and disclosures in the consolidated financial statements. An auditOur audits also includes assessingincluded evaluating the accounting principles used and significant estimates made by management, as well as evaluating the overall presentation of the consolidated financial statement presentation.statements. We believe that our audits provide a reasonable basis for our opinion.
Critical Audit Matter
In our opinion,The critical audit matter communicated below is a matter arising from the current period audit of the consolidated financial statements referredthat was communicated or required to above present fairly,be communicated to the audit committee and that: (1) relates to accounts or disclosures that are material to the consolidated financial statements and (2) involved our especially challenging, subjective, or complex judgments. The communication of a critical audit matter does not alter in all material respects,any way our opinion on the consolidated financial positionstatements, taken as a whole, and we are not, by communicating the critical audit matter below, providing a separate opinion on the critical audit matter or on the accounts or disclosures to which it relates.
Evaluation of Malibu Boats, Inc. and subsidiariescertain assumptions underlying the product warranty liability for certain brands
As discussed in Note 9 to the consolidated financial statements, the Company’s product warranty liability as of June 30, 20172020 was $27.5 million. The product warranty liability represents estimated future costs to repair or replace defective products during the warranty period for each boat sold. The Company’s estimated future costs to repair or replace defective products includes assumptions regarding the anticipated warranty costs per boat by brand.
We identified the evaluation of the anticipated warranty costs per boat that are used to estimate the product warranty liability for Malibu, Axis and Cobalt branded boats as a critical audit matter. A higher degree of subjective auditor judgment was required to evaluate the Company’s estimate of the anticipated warranty costs per boat, due to the nature of the audit evidence. Specifically, for Axis and Malibu model years prior to 2016, historical claims experience only exists for a warranty term of two and three years, respectively. For Cobalt model years prior to 2018, historical claims experience only exists for
a warranty term of three years. This historical claims experience is shorter in duration than the five-year warranty term associated with the Company’s current warranty program.
The following are the primary procedures we performed to address this critical audit matter. We evaluated the design and tested the operating effectiveness of certain internal controls over the Company’s warranty accrual process. This included controls over the development of the assumptions used to estimate the warranty cost per boat for warranty years four and five, for which little or no historical claims experience exists. We performed sensitivity analyses to assess the potential for possible changes to these assumptions on the product warranty liability. We assessed the Company’s historical claims experience and the resultsrelationship between the historical warranty costs per boat incurred by warranty year. We further assessed the Company’s assumptions underlying the anticipated warranty costs per boat for warranty years four and five by considering warranty claims received after year-end but before the consolidated financial statements were issued, to identify trends not considered by the Company when it developed its assumptions. We also compared the Company’s prior year product warranty liability related to claims expected to be incurred in the current year to actual claims received in the current year to evaluate the historical accuracy of their operations and their cash flows for the years then ended in conformity with U.S. generally accepted accounting principles.
Company’s estimates.
/s/ KPMG LLP
We have served as the Company’s auditor since 2015.
Knoxville, Tennessee
September 7, 2017August 31, 2020
MALIBU BOATS, INC. AND SUBSIDIARIES
Consolidated Statements of Operations and Comprehensive Income
(In thousands, except share data)
| | | | | | | | | | | | | | | | | | | | | | | |
| | | | | | Fiscal Year Ended June 30, | | | | |
| | | | | | 2020 | | 2019 | | 2018 |
| Net sales | | | | | $ | 653,163 | | | $ | 684,016 | | | $ | 497,002 | |
| Cost of sales | | | | | 503,893 | | | 517,746 | | | 376,660 | |
| Gross profit | | | | | 149,270 | | | 166,270 | | | 120,342 | |
| Operating expenses: | | | | | | | | | |
| Selling and marketing | | | | | 17,917 | | | 17,946 | | | 13,718 | |
| General and administrative | | | | | 39,912 | | | 44,256 | | | 31,359 | |
| Amortization | | | | | 6,131 | | | 5,956 | | | 5,198 | |
| Operating income | | | | | 85,310 | | | 98,112 | | | 70,067 | |
| Other (income) expense, net: | | | | | | | | | |
| Other income, net | | | | | (2,310) | | | (149) | | | (24,705) | |
| Interest expense | | | | | 3,888 | | | 6,464 | | | 5,385 | |
| Other (income) expense, net | | | | | 1,578 | | | 6,315 | | | (19,320) | |
| Net income before provision for income taxes | | | | | 83,732 | | | 91,797 | | | 89,387 | |
| Income tax provision | | | | | 19,076 | | | 22,096 | | | 58,418 | |
| Net income | | | | | 64,656 | | | 69,701 | | | 30,969 | |
| Net income attributable to non-controlling interest | | | | | 3,094 | | | 3,635 | | | 3,356 | |
| Net income attributable to Malibu Boats, Inc. | | | | | $ | 61,562 | | | $ | 66,066 | | | $ | 27,613 | |
| | | | | | | | | |
| Comprehensive income: | | | | | | | | | |
| Net income | | | | | $ | 64,656 | | | $ | 69,701 | | | $ | 30,969 | |
| Other comprehensive income (loss), net of tax: | | | | | | | | | |
| Change in cumulative translation adjustment | | | | | (304) | | | (844) | | | (621) | |
| Other comprehensive income (loss), net of tax | | | | | (304) | | | (844) | | | (621) | |
| Comprehensive income, net of tax | | | | | 64,352 | | | 68,857 | | | 30,348 | |
| Less: comprehensive income attributable to non-controlling interest, net of tax | | | | | 3,083 | | | 3,591 | | | 3,328 | |
| Comprehensive income attributable to Malibu Boats, Inc., net of tax | | | | | $ | 61,269 | | | $ | 65,266 | | | $ | 27,020 | |
| | | | | | | | | |
| | | | | | | | | |
| | | | | | | | | |
| | | | | | | | | |
| | | | | | | | | |
| Weighted average shares outstanding used in computing net income per share: | | | | | | | | | |
| Basic | | | | | 20,662,750 | | | 20,832,445 | | | 20,179,381 | |
| Diluted | | | | | 20,852,361 | | | 20,966,539 | | | 20,281,210 | |
| Net income available to Class A Common Stock per share: | | | | | | | | | |
| Basic | | | | | $ | 2.98 | | | $ | 3.17 | | | $ | 1.37 | |
| Diluted | | | | | $ | 2.95 | | | $ | 3.15 | | | $ | 1.36 | |
|
| | | | | | | | | | | | |
| | | Fiscal Year Ended June 30, |
| | | 2017 | | 2016 | | 2015 |
| Net sales | | $ | 281,937 |
| | $ | 252,965 |
| | $ | 228,621 |
|
| Cost of sales | | 206,899 |
| | 186,145 |
| | 168,192 |
|
| Gross profit | | 75,038 |
| | 66,820 |
| | 60,429 |
|
| Operating expenses: | | |
| | |
| | |
| Selling and marketing | | 8,619 |
| | 7,475 |
| | 7,007 |
|
| General and administrative | | 24,783 |
| | 21,256 |
| | 19,809 |
|
| Amortization | | 2,198 |
| | 2,185 |
| | 2,463 |
|
| Operating income | | 39,438 |
| | 35,904 |
| | 31,150 |
|
| Other income (expense): | | |
| | |
| | |
| Other | | 10,789 |
| | 76 |
| | 1,650 |
|
| Interest expense | | (1,559 | ) | | (3,884 | ) | | (954 | ) |
| Other income (expense) | | 9,230 |
| | (3,808 | ) | | 696 |
|
| Net income before provision for income taxes | | 48,668 |
| | 32,096 |
| | 31,846 |
|
| Income tax provision | | 17,593 |
| | 11,801 |
| | 8,663 |
|
| Net income | | 31,075 |
| | 20,295 |
| | 23,183 |
|
| Net income attributable to non-controlling interest | | 2,717 |
| | 2,253 |
| | 8,522 |
|
| Net income attributable to Malibu Boats, Inc. | | $ | 28,358 |
| | $ | 18,042 |
| | $ | 14,661 |
|
| | | | | | | |
| Comprehensive income: |
| Net income | | $ | 31,075 |
| | $ | 20,295 |
| | $ | 23,183 |
|
| Other comprehensive income (loss), net of tax: | | | | | | |
| Change in cumulative translation adjustment | | 469 |
| | (390 | ) | | (2,081 | ) |
| Other comprehensive income (loss), net of tax | | 469 |
| | (390 | ) | | (2,081 | ) |
| Comprehensive income, net of tax | | 31,544 |
| | 19,905 |
| | 21,102 |
|
| Less: comprehensive income attributable to non-controlling interest, net of tax | | 2,758 |
| | 2,214 |
| | 7,757 |
|
| Comprehensive income attributable to Malibu Boats, Inc., net of tax | | $ | 28,786 |
| | $ | 17,691 |
| | $ | 13,345 |
|
| | | | | | | |
| Weighted average shares outstanding used in computing net income per share: | | |
| Basic | | 17,846,894 |
| | 17,934,580 |
| | 15,732,531 |
|
| Diluted | | 17,951,332 |
| | 17,985,427 |
| | 15,741,018 |
|
| Net income available to Class A Common Stock per share: | | |
| Basic | | $ | 1.59 |
| | $ | 1.01 |
| | $ | 0.93 |
|
| Diluted | | $ | 1.58 |
| | $ | 1.00 |
| | $ | 0.93 |
|
The accompanying notes are an integral part of these Consolidated Financial Statements.
MALIBU BOATS, INC. AND SUBSIDIARIES
Consolidated Balance Sheets
(In thousands, except share data) | | | | June 30, 2017 | | June 30, 2016 | | June 30, 2020 | | June 30, 2019 |
| Assets | |
| | |
| Assets | | | |
| Current assets | |
| | |
| Current assets | | | |
| Cash | $ | 32,822 |
| | $ | 25,921 |
| Cash | $ | 33,787 | | | $ | 27,392 | |
| Trade receivables, net | 9,846 |
| | 14,690 |
| Trade receivables, net | 13,767 | | | 27,961 | |
| Inventories, net | 23,835 |
| | 20,431 |
| Inventories, net | 72,946 | | | 67,768 | |
| | Prepaid expenses and other current assets | 2,470 |
| | 2,707 |
| Prepaid expenses and other current assets | 3,954 | | | 4,530 | |
| Income tax receivable | 1,111 |
| | 965 |
| |
| | Total current assets | 70,084 |
| | 64,714 |
| Total current assets | 124,454 | | | 127,651 | |
| Property and equipment, net | 24,123 |
| | 17,813 |
| Property and equipment, net | 94,310 | | | 65,756 | |
| Goodwill | 12,692 |
| | 12,470 |
| Goodwill | 51,273 | | | 51,404 | |
| Other intangible assets, net | 9,597 |
| | 11,703 |
| Other intangible assets, net | 139,892 | | | 146,061 | |
| Deferred tax assets | 107,088 |
| | 115,594 |
| Deferred tax assets | 52,935 | | | 60,407 | |
| Other assets | 79 |
| | 32 |
| Other assets | 14,482 | | | 35 | |
| Total assets | $ | 223,663 |
| | $ | 222,326 |
| Total assets | $ | 477,346 | | | $ | 451,314 | |
| Liabilities | |
| | |
| Liabilities | | | |
| Current liabilities | |
| | |
| Current liabilities | | | |
| Current maturities of long-term debt | $ | — |
| | $ | 8,000 |
| |
| | Accounts payable | 12,722 |
| | 16,158 |
| Accounts payable | $ | 15,846 | | | $ | 21,174 | |
| Accrued expenses | 21,616 |
| | 19,055 |
| Accrued expenses | 50,485 | | | 49,097 | |
| | Income tax and distribution payable | 515 |
| | 427 |
| Income tax and distribution payable | 243 | | | 1,469 | |
| Payable pursuant to tax receivable agreement, current portion | 4,332 |
| | 4,189 |
| Payable pursuant to tax receivable agreement, current portion | 3,589 | | | 3,592 | |
| | Total current liabilities | 39,185 |
| | 47,829 |
| Total current liabilities | 70,163 | | | 75,332 | |
| Deferred tax liabilities | 552 |
| | 685 |
| Deferred tax liabilities | 14 | | | 145 | |
| Other liabilities | 328 |
| | 1,136 |
| Other liabilities | 16,727 | | | 1,689 | |
| Payable pursuant to tax receivable agreement, less current portion | 77,959 |
| | 89,561 |
| Payable pursuant to tax receivable agreement, less current portion | 46,076 | | | 50,162 | |
| Long-term debt, less current maturities | 53,403 |
| | 63,086 |
| |
| Long-term debt | | Long-term debt | 82,839 | | | 113,633 | |
| Total liabilities | 171,427 |
| | 202,297 |
| Total liabilities | 215,819 | | | 240,961 | |
| Commitments and contingencies (See Note 15) |
|
| |
|
| |
| Commitments and contingencies (See Note 18) | | Commitments and contingencies (See Note 18) | | | |
| Stockholders' Equity | |
| | |
| Stockholders' Equity | | | |
| Class A Common Stock, par value $0.01 per share, 100,000,000 shares authorized; 17,937,687 shares issued and outstanding as of June 30, 2017; 17,690,874 shares issued and outstanding as of June 30, 2016 | 179 |
| | 176 |
| |
| Class B Common Stock, par value $0.01 per share, 25,000,000 shares authorized; 19 shares issued and outstanding as of June 30, 2017; 23 shares issued and outstanding as of June 30, 2016 | — |
| | — |
| |
| Preferred Stock, par value $0.01 per share; 25,000,000 shares authorized; no shares issued and outstanding as of June 30, 2017; no shares issued and outstanding as of June 30, 2016 | — |
| | — |
| |
| Class A Common Stock, par value $0.01 per share, 100,000,000 shares authorized; 20,595,969 shares issued and outstanding as of June 30, 2020; 20,852,640 shares issued and outstanding as of June 30, 2019 | | Class A Common Stock, par value $0.01 per share, 100,000,000 shares authorized; 20,595,969 shares issued and outstanding as of June 30, 2020; 20,852,640 shares issued and outstanding as of June 30, 2019 | 204 | | | 207 | |
| Class B Common Stock, par value $0.01 per share, 25,000,000 shares authorized; 15 shares issued and outstanding as of June 30, 2020; 15 shares issued and outstanding as of June 30, 2019 | | Class B Common Stock, par value $0.01 per share, 25,000,000 shares authorized; 15 shares issued and outstanding as of June 30, 2020; 15 shares issued and outstanding as of June 30, 2019 | 0 | | | 0 | |
| Preferred Stock, par value $0.01 per share; 25,000,000 shares authorized; no shares issued and outstanding as of June 30, 2020; 0 shares issued and outstanding as of June 30, 2019 | | Preferred Stock, par value $0.01 per share; 25,000,000 shares authorized; no shares issued and outstanding as of June 30, 2020; 0 shares issued and outstanding as of June 30, 2019 | 0 | | | 0 | |
| | Additional paid in capital | 50,836 |
| | 45,947 |
| Additional paid in capital | 103,797 | | | 113,004 | |
| Accumulated other comprehensive loss | (2,002 | ) | | (2,471 | ) | Accumulated other comprehensive loss | (3,132) | | | (2,828) | |
| Accumulated earnings (deficit) | 151 |
| | (28,302 | ) | |
| Accumulated earnings | | Accumulated earnings | 153,711 | | | 93,852 | |
| Total stockholders' equity attributable to Malibu Boats, Inc. | 49,164 |
| | 15,350 |
| Total stockholders' equity attributable to Malibu Boats, Inc. | 254,580 | | | 204,235 | |
| Non-controlling interest | 3,072 |
| | 4,679 |
| Non-controlling interest | 6,947 | | | 6,118 | |
| Total stockholders’ equity | 52,236 |
| | 20,029 |
| Total stockholders’ equity | 261,527 | | | 210,353 | |
| Total liabilities and stockholders' equity | $ | 223,663 |
| | $ | 222,326 |
| Total liabilities and stockholders' equity | $ | 477,346 | | | $ | 451,314 | |
The accompanying notes are an integral part of these Consolidated Financial Statements.
MALIBU BOATS, INC. AND SUBSIDIARIES
Consolidated Statements of Stockholders' Equity
(In thousands, except number of Class B shares)
|
| | | | | | | | | | | | | | | | | | | | | | | | | | | | | | | | | | | |
| | Common Stock | | Additional Paid In Capital | | Non-controlling Interest in LLC | | Accumulated Earnings (Deficit) | | Accumulated Other Comprehensive Loss | | Treasury Stock | | Total Stockholders Equity |
| | Class A | | Class B | | | | | | |
| | Shares | Amount | | Shares | Amount | | | | | | |
| Balance at June 30, 2014 | 11,064 |
| $ | 110 |
| | 44 |
| $ | — |
| | $ | 23,835 |
| | $ | 8,801 |
| | $ | (4,676 | ) | | $ | — |
| | $ | — |
| | $ | 28,070 |
|
| Net income | | | | | | | | | 8,522 |
| | 14,661 |
| | | | | | 23,183 |
|
| Issuance of Class A Common Stock for public offerings, net of underwriting discounts | 4,371 |
| 73 |
| | | | | 133,289 |
| | | | | | | | | | 133,362 |
|
| Purchase of Class A Common Stock from selling shareholders | | | | | | | (56,526 | ) | | | | | | | | | | (56,526 | ) |
| Purchase of units from existing LLC Unit holders | | | | | | | (76,836 | ) | | | | | | | | | | (76,836 | ) |
| Exchange of LLC Units for Class A Common Stock | 5,583 |
| 26 |
| | | | | (26 | ) | | | | | | | | | | — |
|
| Repurchase of Class A Common Stock | | | | | | | | | | | | | | | (71,523 | ) | | (71,523 | ) |
| Retirement of treasury shares | (3,333 | ) | (33 | ) | | | | | (15,266 | ) | | | | (56,224 | ) | | | | 71,523 |
| | — |
|
| Reallocation of non-controlling interest from selling shareholders acquired in offerings 1 | | | | | | | 11,687 |
| | $ | (11,687 | ) | | | | | | | | — |
|
| Stock based compensation |
|
| | | | | | 1,467 |
| | | | | | | | | | 1,467 |
|
| Issuances of equity for services | 3 |
| | | | | | 252 |
| | | | | | | | | | 252 |
|
| Cancellation of Class B Common Stock | | | | (20 | ) | | | | | | | | | | | | | — |
|
| Capitalized offering costs | | | | | | | (1,498 | ) | | | | | | | | | | (1,498 | ) |
| Increase in payable pursuant to the tax receivable agreement | | | | | | | (82,834 | ) | | | | | | | | | | (82,834 | ) |
| | | | | | | | | | | | | | | | | | | | | | | | | | | | | | | | | | | | | | | | | | | | | | | |
| Malibu Boats, Inc. | | | | | | | | | | | | | | |
| Common Stock | | | | | | Additional Paid In Capital | | Non-controlling Interest in LLC | | Accumulated Earnings (Deficit) | | Accumulated Other Comprehensive Loss | | Total Stockholders Equity |
| Class A | | | Class B | | | | | | | | | | | |
| Shares | Amount | | Shares | Amount | | | | | | | | | | |
| Balance at June 30, 2017 | 17,938 | | $ | 179 | | | 19 | | $ | 0 | | | $ | 48,328 | | | $ | 4,941 | | | $ | 151 | | | $ | (1,363) | | | $ | 52,236 | |
| Net Income | — | | — | | | — | | — | | | — | | | 3,356 | | | 27,613 | | | — | | | 30,969 | |
| Stock based compensation, net of withholding taxes on vested equity awards | 56 | | 1 | | | — | | — | | | 1,282 | | | — | | | — | | | — | | | 1,283 | |
| Issuances of equity for services | 5 | | — | | | — | | — | | | 867 | | | — | | | — | | | — | | | 867 | |
| Issuance of Class A common stock for acquisition | 39 | | — | | | — | | — | | | 1,000 | | | — | | | — | | | — | | | 1,000 | |
| Issuance of Class A Common Stock for Offerings, net of underwriting discounts | 2,300 | | 23 | | | — | | — | | | 55,294 | | | — | | | — | | | — | | | 55,317 | |
| Capitalized Offering costs | — | | — | | | — | | — | | | (650) | | | — | | | — | | | — | | | (650) | |
| Increase in payable pursuant to the tax receivable agreement | — | | — | | | — | | — | | | (1,685) | | | — | | | — | | | — | | | (1,685) | |
| Increase in deferred tax asset from step-up in tax basis | — | | — | | | — | | — | | | 3,004 | | | — | | | — | | | — | | | 3,004 | |
| Exchange of LLC Units for Class A Common Stock | 217 | | 1 | | | — | | — | | | 920 | | | (920) | | | — | | | — | | | 1 | |
| Cancellation of Class B Common Stock | — | | — | | | (2) | | — | | | — | | | — | | | — | | | — | | | 0 | |
| Distributions to LLC Unit holders | — | | — | | | — | | — | | | — | | | (1,852) | | | 25 | | | — | | | (1,827) | |
| Foreign currency translation adjustment | — | | — | | | — | | — | | | — | | | (23) | | | — | | | (621) | | | (644) | |
| Balance at June 30, 2018 | 20,555 | | 204 | | | 17 | | 0 | | | 108,360 | | | 5,502 | | | 27,789 | | | (1,984) | | | 139,871 | |
| Net Income | — | | — | | | — | | — | | | — | | | 3,635 | | | 66,066 | | | — | | | 69,701 | |
| Stock based compensation, net of withholding taxes on vested equity awards | 55 | | 1 | | | — | | — | | | 1,376 | | | — | | | — | | | — | | | 1,377 | |
| Issuances of equity for services | — | | — | | | — | | — | | | 784 | | | — | | | — | | | — | | | 784 | |
| Issuance of equity for exercise of options | 29 | | — | | | — | | — | | | 749 | | | — | | | — | | | — | | | 749 | |
| | | | | | | | | | | | | | | | | | | | | | | | | | | | | | | | | | | | | | | | | | | | | | | |
| Increase in payable pursuant to the tax receivable agreement | — | | — | | | — | | — | | | (2,676) | | | — | | | — | | | — | | | (2,676) | |
| Increase in deferred tax asset from step-up in tax basis | — | | — | | | — | | — | | | 3,275 | | | — | | | — | | | — | | | 3,275 | |
| Exchange of LLC Units for Class A Common Stock | 214 | | 2 | | | — | | — | | | 1,136 | | | (1,136) | | | — | | | — | | | 2 | |
| Cancellation of Class B Common Stock | — | | — | | | (2) | | — | | | — | | | — | | | — | | | — | | | 0 | |
| Distributions to LLC Unit holders | — | | — | | | — | | — | | | — | | | (1,845) | | | (3) | | | — | | | (1,848) | |
| Foreign currency translation adjustment | — | | — | | | — | | — | | | — | | | (38) | | | — | | | (844) | | | (882) | |
| Balance at June 30, 2019 | 20,853 | | 207 | | | 15 | | 0 | | | 113,004 | | | 6,118 | | | 93,852 | | | (2,828) | | | 210,353 | |
| Net income | — | | — | | | — | | — | | | — | | | 3,094 | | | 61,562 | | | — | | | 64,656 | |
| Stock based compensation, net of withholding taxes on vested equity awards | 112 | | 1 | | | — | | — | | | 2,191 | | | — | | | — | | | — | | | 2,192 | |
| Issuances of equity for services | 2 | | — | | | — | | — | | | 851 | | | — | | | — | | | — | | | 851 | |
| Issuance of equity for exercise of options | 12 | | — | | | — | | — | | | 377 | | | — | | | — | | | — | | | 377 | |
| Repurchase and retirement of common stock | (483) | | (5) | | | — | | — | | | (13,828) | | | — | | | — | | | — | | | (13,833) | |
| Cumulative-effect transition adjustment for ASC 842 | — | | — | | | — | | — | | | — | | | — | | | (1,703) | | | — | | | (1,703) | |
| Increase in payable pursuant to the tax receivable agreement | — | | — | | | — | | — | | | (1,041) | | | — | | | — | | | — | | | (1,041) | |
| Increase in deferred tax asset from step-up in tax basis | — | | — | | | — | | — | | | 1,364 | | | — | | | — | | | — | | | 1,364 | |
| Exchange of LLC Units for Class A Common Stock | 100 | | 1 | | | — | | — | | | 879 | | | (879) | | | — | | | — | | | 1 | |
| Distributions to LLC Unit holders | — | | — | | | — | | — | | | — | | | (1,370) | | | — | | | — | | | (1,370) | |
| Foreign currency translation adjustment | — | | — | | | — | | — | | | — | | | (16) | | | — | | | (304) | | | (320) | |
| Balance at June 30, 2020 | 20,596 | | $ | 204 | | | 15 | | $ | 0 | | | $ | 103,797 | | | $ | 6,947 | | | $ | 153,711 | | | $ | (3,132) | | | $ | 261,527 | |
|
| | | | | | | | | | | | | | | | | | | | | | | | | | | | | | | | | | | |
Increase in deferred tax asset from step-up in tax basis 1 | | | | | | | 106,977 |
| | | | | | | | | | 106,977 |
|
| Distributions to LLC Unit holders | | | | | | | (31 | ) | | (1,738 | ) | | | | | | | | (1,769 | ) |
| Issuance of Class A Common Stock for acquisition | 171 |
| 2 |
| | | | | 2,835 |
| | | | | | | | | | 2,837 |
|
| Foreign currency translation adjustment | | | | | | | | | | | | | (2,081 | ) | | | | (2,081 | ) |
| Balance at June 30, 2015 | 17,859 |
| $ | 178 |
| | 24 |
| $ | — |
| | $ | 47,325 |
| | $ | 3,898 |
| | $ | (46,239 | ) | | $ | (2,081 | ) | | $ | — |
| | $ | 3,081 |
|
| Net income | | | | | | | | | 2,253 |
| | 18,042 |
| | | | | | 20,295 |
|
| Stock based compensation, net of withholding taxes on vested equity awards | 96 |
| 1 |
| | | | | 1,791 |
| | | | | | | | | | 1,792 |
|
| Issuances of equity for services | 9 |
| | | | | | 751 |
| | | | | | | | | | 751 |
|
| Increase in payable pursuant to the tax receivable agreement | | | | | | | (118 | ) | | | | | | | | | | (118 | ) |
| Increase in deferred tax asset from step-up in tax basis | | | | | | | 140 |
| | | | | | | | | | 140 |
|
| Exchange of LLC Units for Class A Common Stock | 14 |
| | | | | | 39 |
| | (39 | ) | | | | | | | | — |
|
| Cancellation of Class B Common Stock | | | | (1 | ) | | | | | | | | | | | | | — |
|
| Distributions to LLC Unit holders | | | | | | | | | (1,433 | ) | | (105 | ) | | | | | | (1,538 | ) |
| Repurchase and retirement of common stock | (288 | ) | (3 | ) | | | | | (3,981 | ) | | | | | | | | | | (3,984 | ) |
| Foreign currency translation adjustment | | | | | | | | | | | | | (390 | ) | | | | (390 | ) |
| Balance at June 30, 2016 | 17,690 |
| $ | 176 |
| | 23 |
| $ | — |
| | $ | 45,947 |
| | $ | 4,679 |
| | $ | (28,302 | ) | | $ | (2,471 | ) | | $ | — |
| | $ | 20,029 |
|
| Net Income | | | | | | | | | 2,717 |
| | 28,358 |
| | | | | | 31,075 |
|
| Stock based compensation | 96 |
| 1 |
| | | | | 1,134 |
| | | | | | | | | | 1,135 |
|
|
| | | | | | | | | | | | | | | | | | | | | | | | | | | | | | | | | | | |
| Issuances of equity for services | 7 |
| | | | | | 688 |
| | | | | | | | | | 688 |
|
| Increase in payable pursuant to the tax receivable agreement | | | | | | | (960 | ) | | | | | | | | | | (960 | ) |
| Increase in deferred tax asset from step-up in tax basis | | | | | | | 1,238 |
| | | | | | | | | | 1,238 |
|
| Exchange of LLC for Class A | 145 |
| 2 |
| | | | | 2,789 |
| | (2,789 | ) | | | | | | | | 2 |
|
| Cancellation of Class B Common Stock | | | | (4 | ) | | | | | | | | | | | | | — |
|
| Tax distributions | | | | | | | | | (1,535 | ) | | 95 |
| | | | | | (1,440 | ) |
| Translation adjustment | | | | | | | | | | | | | 469 |
| | | | 469 |
|
| Balance at June 30, 2017 | 17,938 |
| $ | 179 |
|
| 19 |
| $ | — |
|
| $ | 50,836 |
|
| $ | 3,072 |
|
| $ | 151 |
|
| $ | (2,002 | ) |
| $ | — |
| | $ | 52,236 |
|
1As revised. Refer to Note 1 for information on immaterial correction of errors in prior period.
The accompanying notes are an integral part of these Consolidated Financial Statements.
MALIBU BOATS, INC. AND SUBSIDIARIES
Consolidated Statements of Cash Flows
|
| | | | | | | | | | | | | |
| | | Fiscal Year Ended June 30, |
| | | 2017 | | 2016 | | 2015 |
| Operating activities: | | | | | | |
| Net income | | $ | 31,075 |
| | $ | 20,295 |
| | $ | 23,183 |
|
| Adjustments to reconcile net income to net cash provided by operating activities: | | | | | | |
| Non-cash compensation expense | | 1,396 |
| | 1,947 |
| | 1,467 |
|
| Non-cash compensation to directors | | 688 |
| | 751 |
| | 252 |
|
| Non-cash litigation payable | | (1,330 | ) | | 3,268 |
| | — |
|
| Depreciation | | 4,550 |
| | 3,339 |
| | 2,427 |
|
| Amortization of intangible assets | | 2,198 |
| | 2,185 |
| | 2,463 |
|
| Gain on sale-leaseback transaction | | (10 | ) | | (10 | ) | | (7 | ) |
| Amortization of deferred financing costs | | 243 |
| | 244 |
| | 71 |
|
| Change in fair value of derivative | | (912 | ) | | 863 |
| | — |
|
| Deferred income taxes | | 9,577 |
| | 5,176 |
| | 7,933 |
|
| Adjustment to tax receivable agreement liability | | (8,140 | ) | | — |
| | — |
|
| Gain on sale of equipment | | 4 |
| | (29 | ) | | — |
|
| Change in operating assets and liabilities (excluding effects of acquisition): | | | | | | |
| Trade receivables | | 4,870 |
| | (5,211 | ) | | (2,170 | ) |
| Inventories | | (3,300 | ) | | (52 | ) | | (2,884 | ) |
| Prepaid expenses and other assets | | (26 | ) | | (859 | ) | | 879 |
|
| Accounts payable | | (5,018 | ) | | 7,003 |
| | (366 | ) |
| Accrued expenses | | 5,890 |
| | 1,388 |
| | (9 | ) |
| Income taxes receivable and payable | | 253 |
| | (1,873 | ) | | (801 | ) |
| Other liabilities | | 65 |
| | 8 |
| | 114 |
|
| Payment pursuant to tax receivable agreement | | (4,279 | ) | | (2,831 | ) | | — |
|
| Litigation settlement | | (1,938 | ) | | — |
| | (20,000 | ) |
| Net cash provided by operating activities | | 35,856 |
| | 35,602 |
| | 12,552 |
|
| Investing activities: | | | | | | |
| Purchases of property and equipment | | (9,262 | ) | | (6,176 | ) | | (5,366 | ) |
| Proceeds from sale of property and equipment | | 16 |
| | 186 |
| | — |
|
| Acquisition of Canadian trademark | | — |
| | — |
| | (100 | ) |
| Payment for acquisition, net of cash acquired | | — |
| | — |
| | (11,663 | ) |
| Net cash used in investing activities | | (9,246 | ) | | (5,990 | ) | | (17,129 | ) |
| Financing activities: | | | | | | |
| Principal payments on long-term borrowings | | (72,000 | ) | | (6,500 | ) | | (21,500 | ) |
| Proceeds from long-term borrowings | | 55,000 |
| | — |
| | 100,000 |
|
| Payment of deferred financing costs | | (926 | ) | | — |
| | (1,224 | ) |
| Proceeds from issuance of Class A Common Stock in offerings, net of underwriting discounts | | — |
| | — |
| | 133,362 |
|
| Purchase of units from existing LLC Unit holders | | — |
| | — |
| | (133,362 | ) |
| Payment of costs directly associated with offerings | | — |
| | — |
| | (1,498 | ) |
| Cash paid for tax withholdings | | (258 | ) | | (156 | ) | | — |
|
| Distributions to non-controlling LLC Unit holders | | (1,535 | ) | | (1,385 | ) | | (3,630 | ) |
| Repurchase of common stock | | — |
| | (3,981 | ) | — |
| (71,406 | ) |
| Net cash (used in) provided by financing activities | | (19,719 | ) | | (12,022 | ) | | 742 |
|
| Effect of exchange rate changes on cash | | 10 |
| | (56 | ) | | 49 |
|
| Changes in cash | | 6,901 |
| | 17,534 |
| | (3,786 | ) |
| Cash—Beginning of period | | 25,921 |
| | 8,387 |
| | 12,173 |
|
| Cash—End of period | | $ | 32,822 |
| | $ | 25,921 |
| | $ | 8,387 |
|
| | | | | | | |
| Supplemental cash flow information: | | | | | | |
| Cash paid for interest | | $ | 2,296 |
| | $ | 3,136 |
| | $ | 494 |
|
| | | | | | | | | | | | | Fiscal Year Ended June 30, | |
| | | | | 2020 | | 2019 | | 2018 |
| Operating activities: | | Operating activities: | | | | | | |
| Net income | | Net income | | $ | 64,656 | | | $ | 69,701 | | | $ | 30,969 | |
| Adjustments to reconcile net income to net cash provided by operating activities: | | Adjustments to reconcile net income to net cash provided by operating activities: | |
| Non-cash compensation expense | | Non-cash compensation expense | | 3,042 | | | 2,607 | | | 1,973 | |
| Non-cash compensation to directors | | Non-cash compensation to directors | | 829 | | | 791 | | | 834 | |
| | Depreciation | | Depreciation | | 12,249 | | | 10,004 | | | 7,656 | |
| Amortization | | Amortization | | 6,131 | | | 5,956 | | | 5,198 | |
| Deferred income taxes | | Deferred income taxes | | 8,715 | | | 6,794 | | | 45,793 | |
| Adjustment to tax receivable agreement liability | | Adjustment to tax receivable agreement liability | | (1,672) | | | (103) | | | (24,637) | |
| Other items, net | | Other items, net | | 2,211 | | | 802 | | | 793 | |
| Change in operating assets and liabilities (excluding effects of acquisition): | | Change in operating assets and liabilities (excluding effects of acquisition): | |
| Trade receivables | | Trade receivables | | 14,193 | | | (3,041) | | | (12,181) | |
| Inventories | | Inventories | | (5,263) | | | (15,410) | | | (6,336) | |
| Prepaid expenses and other assets | | Prepaid expenses and other assets | | 551 | | | (786) | | | (447) | |
| Accounts payable | | Accounts payable | | (5,812) | | | (2,791) | | | 4,612 | |
| Accrued expenses | | Accrued expenses | | (239) | | | 9,598 | | | 6,547 | |
| Income taxes receivable and payable | | Income taxes receivable and payable | | (1,164) | | | 125 | | | 1,723 | |
| Other liabilities | | Other liabilities | | (828) | | | 1,118 | | | 251 | |
| Payment pursuant to tax receivable agreement | | Payment pursuant to tax receivable agreement | | (3,458) | | | (3,865) | | | (4,293) | |
| | Net cash provided by operating activities | | Net cash provided by operating activities | | 94,141 | | | 81,500 | | | 58,455 | |
| Investing activities: | | Investing activities: | | | | | | |
| Purchases of property and equipment | | Purchases of property and equipment | | (41,291) | | | (17,938) | | | (10,449) | |
| Proceeds from sale of property and equipment | | Proceeds from sale of property and equipment | | 897 | | | 0 | | | 145 | |
| Payment for acquisition, net of cash acquired | | Payment for acquisition, net of cash acquired | | | | (100,073) | | | (125,552) | |
| Net cash used in investing activities | | Net cash used in investing activities | | (40,394) | | | (118,011) | | | (135,856) | |
| Financing activities: | | Financing activities: | | | | | | |
| Principal payments on long-term borrowings | | Principal payments on long-term borrowings | | 0 | | | (35,000) | | | (50,000) | |
| Proceeds from long-term borrowings | | Proceeds from long-term borrowings | | 0 | | | 0 | | | 105,000 | |
| Payment of deferred financing costs | | Payment of deferred financing costs | | 0 | | | (370) | | | (1,148) | |
| Proceeds from revolving credit facility | | Proceeds from revolving credit facility | | 103,800 | | | 90,000 | | | 0 | |
| Payments on revolving credit facility | | Payments on revolving credit facility | | (135,000) | | | (50,000) | | | 0 | |
| Proceeds from issuance of Class A Common Stock in offerings, net of underwriting discounts | | Proceeds from issuance of Class A Common Stock in offerings, net of underwriting discounts | | 0 | | | 0 | | | 55,317 | |
| Payment of costs directly associated with offerings | | Payment of costs directly associated with offerings | | 0 | | | 0 | | | (650) | |
| Repurchase and retirement of Class A Common Stock | | Repurchase and retirement of Class A Common Stock | | (13,833) | | | 0 | | | 0 | |
| Cash paid for tax withholdings | | Cash paid for tax withholdings | | (831) | | | (1,219) | | | (691) | |
| Distributions to non-controlling LLC Unit holders | | Distributions to non-controlling LLC Unit holders | | (1,836) | | | (1,785) | | | (1,626) | |
| Proceeds received from exercise of stock options | | Proceeds received from exercise of stock options | | 377 | | | 749 | | | 0 | |
| Net cash provided by (used in) by financing activities | | Net cash provided by (used in) by financing activities | | (47,323) | | | 2,375 | | | 106,202 | |
| Effect of exchange rate changes on cash | | Effect of exchange rate changes on cash | | (29) | | | (95) | | | 0 | |
| Changes in cash | | Changes in cash | | 6,395 | | | (34,231) | | | 28,801 | |
| Cash—Beginning of period | | Cash—Beginning of period | | 27,392 | | | 61,623 | | | 32,822 | |
| Cash—End of period | | Cash—End of period | | $ | 33,787 | | | $ | 27,392 | | | $ | 61,623 | |
| Supplemental cash flow information: | | Supplemental cash flow information: | | | | | | |
| Cash paid for interest | | Cash paid for interest | | $ | 3,810 | | | $ | 6,011 | | | $ | 4,352 | |
| Cash paid for income taxes | | 7,175 |
| | 8,122 |
| | 1,439 |
| Cash paid for income taxes | | 10,529 | | | 14,173 | | | 9,887 | |
| Non-cash investing and financing activities: | | | | | | | |
| Non-cash operating, investing and financing activities: | | Non-cash operating, investing and financing activities: | |
| | Establishment of deferred tax assets from step-up in tax basis | | 1,238 |
| | 140 |
| | 106,977 |
| Establishment of deferred tax assets from step-up in tax basis | | 1,364 | | | 3,275 | | | 3,004 | |
| Establishment of amounts payable under tax receivable agreements | | 960 |
| | 111 |
| | 82,834 |
| Establishment of amounts payable under tax receivable agreements | | 1,041 | | | 2,676 | | | 1,685 | |
| Equity issued as consideration for acquisition | | — |
| | — |
| | 2,837 |
| Equity issued as consideration for acquisition | | 0 | | | 0 | | | 1,000 | |
| Exchange of LLC Units for Class A Common Stock | Exchange of LLC Units for Class A Common Stock | 2,789 |
| | 39 |
| | 111,118 |
| Exchange of LLC Units for Class A Common Stock | | 879 | | | 1,136 | | | 920 | |
| Tax distributions payable to non-controlling LLC Unit holders | | 309 |
| | 341 |
| | 147 |
| Tax distributions payable to non-controlling LLC Unit holders | | 104 | | | 568 | | | 511 | |
| | Capital expenditures in accounts payable | | 1,598 |
| | 218 |
| | — |
| Capital expenditures in accounts payable | | 1,129 | | | 647 | | | 1,053 | |
| Accrued costs related to repurchase of common stock | | — |
| | — |
| | 117 |
| |
|
The accompanying notes are an integral part of these Consolidated Financial Statements.
MALIBU BOATS, INC. AND SUBSIDIARIES
Notes to Consolidated Financial Statements
(Dollars in thousands, except per unit and per share data)
1. Organization, Basis of Presentation, and Summary of Significant Accounting Policies
Organization
Malibu Boats, Inc. (together with its subsidiaries, the “Company” or "Malibu"), a Delaware corporation formed on November 1, 2013, is the sole managing member of Malibu Boats Holdings, LLC, a Delaware limited liability company (the "LLC"). The Company operates and controls all of the LLC's business and affairs and, therefore, pursuant to Financial Accounting Standards Board ("FASB") Accounting Standards Codification (“ASC”) Topic 810, Consolidation, consolidates the financial results of the LLC and its subsidiaries, and records a non-controlling interest for the economic interest in the Company held by the non-controlling holders of units in the LLC ("LLC Units"). Malibu Boats Holdings, LLC was formed in 2006 with Malibu's acquisition by an investor group, including affiliates of Black Canyon Capital LLC, Horizon Holdings, LLC and then-current management. The LLC, through its wholly owned subsidiary, Malibu Boats, LLC, is engaged in the design, engineering, manufacturing and marketing of innovative, high-quality, recreational powerboats that are sold through a world-wide network of independent dealers. On October 23, 2014,July 6, 2017, the Company acquired all the outstanding sharesunits of MalibuCobalt Boats, Pty. Ltd. (the "Licensee"LLC (“Cobalt”), Malibu's Australian licensee manufacturer with exclusive distributions rights in Australia further expanding the Company's product offering across a broader segment of the recreational boating industry including performance sport boats, sterndrive and New Zealand markets.outboard boats. As a result of the acquisition, the Company also consolidates the financial results of Cobalt. On October 15, 2018, the Licensee.Company's subsidiary Malibu Boats, LLC, purchased the assets of Pursuit Boats ("Pursuit") from S2 Yachts, Inc., expanding the Company's product offering into the fiberglass outboard fishing boat market. Refer to Note 4. The Company reports its results of operations under two3 reportable segments called U.S.segments: Malibu, Cobalt, and AustraliaPursuit based on their respectiveboat manufacturing footprints. Each segment participates in the manufacturing, distribution, marketing and sale of recreational powerboats. The U.S. operating segment primarily serves markets in North America, South America, Europe, and Asia while the Australia operating segment principally serves the Australian and New Zealand markets.operations.
Cobalt Boats Acquisition
On June 28, 2017, Malibu Boats, LLC, a wholly owned indirect subsidiary of the Company entered into an agreement to acquire all of the outstanding units of Cobalt Boats, LLC (“Cobalt”) pursuant to a unit purchase agreement, dated as of June 28, 2017, for an aggregate purchase price of $130,000, subject to customary adjustments for the amount of working capital in the business at the closing date and subject to adjustment for any judgment or settlement in connection with a pending litigation matter between Cobalt and Sea Ray Boats, Inc. and Brunswick Corporation (the "Acquisition"). Cobalt is a world class brand engaged in the design, engineering, manufacturing and marketing of premium, high-quality, water sport boats, cruisers, bowriders, and outboard boats that are sold through a world-wide network of independent dealers. Under the terms of the unit purchase agreement, a portion of the purchase price for the Acquisition equal to $1,000 would be paid through the issuance of shares of the Company’s Class A common stock, based on the closing price of the shares of Class A common stock of the Company on June 27, 2017, or $25.47. The balance of the purchase price for the Acquisition would be paid with cash and borrowings under its New Credit Agreement. Refer to Note 8 for more information on the Company's New Credit Agreement. The Acquisition was completed on July 6, 2017. A portion of the purchase price was deposited into escrow accounts to secure certain post-closing obligations of the Sellers. Refer to Note 19 for further information on the closing of the Acquisition.
Basis of Presentation
The accompanying consolidated financial statements of the Company have been prepared in accordance with U.S. generally acceptingaccepted accounting principles ("GAAP"). Certain reclassifications have been made to the prior period presentation to conform to the current period presentation. Units and shares are presented as whole numbers while all dollar amounts are presented in thousands, unless otherwise noted.
Principles of Consolidation
The accompanying consolidated financial statements include the operations and accounts of the Company and all subsidiaries thereof. All intercompany balances and transactions have been eliminated upon consolidation.
Segment Reporting
The Company has 3 reportable segments, Malibu, Cobalt and Pursuit. The Malibu segment participates in the manufacturing, distribution, marketing and sale of Malibu and Axis performance sports boats throughout the world. The Cobalt and Pursuit segments participate in the manufacturing, distribution, marketing and sale of Cobalt and Pursuit boats, respectively, throughout the world.
The Company revised its segment reporting effective July 1, 2019 to conform to changes in its internal management reporting based on the Company’s boat manufacturing operations. Prior to this change in reporting segments, the Company had 4 reportable segments, Malibu U.S., Malibu Australia, Cobalt and Pursuit. The Company now aggregates Malibu U.S. and Malibu Australia into 1 reportable segment as they have similar economic characteristics and qualitative factors. All segment information in the accompanying consolidated financial statements has been revised to conform to the Company’s current reporting segments for comparison purposes. Additional segment information is contained in Note 20.
Use of Estimates
The preparation of financial statements in conformity with GAAP requires management to make estimates and assumptions that affect the reported amounts of assets and liabilities and disclosure of contingent assets and liabilities as of the date of the financial statements and the reported amounts of revenues and expenses during the reporting period. Actual results could differ from those estimates, and such differences could be material.
Immaterial Correction of Error
For fiscal year 2016, the Company identified an immaterial error related to the understatement of deferred tax assets and paid in capital attributable to a book to tax difference in its investment in the LLC. The correction of this error resulted in an increase in deferred tax assets of $1,796 with a corresponding increase for the same amount in additional paid in capital within stockholders' equity on the audited consolidated balance sheet as of June 30, 2016 and within the statement of stockholders' equity for fiscal year 2015.
Certain Significant Risks and Uncertainties
The Company is subject to those risks common in manufacturing-driven markets, including, but not limited to, competitive forces, dependence on key personnel, consumer demand for its products, the successful protection of its proprietary technologies, compliance with government regulations and the possibility of not being able to obtain additional financing if and when needed.
Concentration of Credit and Business Risk
A majority of the Company’s sales are made pursuant to floor plan financing programs in which the Company participates on behalf of its dealers through a contingent repurchase agreement with various third-party financing institutions. Under these arrangements, a dealer establishes a line of credit with one or more of these third-party lenders for the purchase of dealer boat inventory. When a dealer purchases and takes delivery of a boat pursuant to a floor plan financing arrangement, it draws against its line of credit and the lender pays the invoice cost of the boat directly to the Company within approximately two weeks. For dealers that use local floor plan financing programs or pay cash, the Company may extend credit without collateral under the dealer agreement based on the Company’s evaluation of the dealer’s credit risk and past payment history. The Company maintains allowances for potential credit losses that it believes are adequate. See Trade Accounts Receivable section within this footnote for more information.
As of June 30, 2017, theThe Company’s distribution channel consisted of 205 independenttop ten dealers locations worldwide. No single dealer accounted for more than 6.8%represented 38.5%, 5.3%39.6% and 4.7%37.8%, of the Company’s unit volumenet sales for the fiscal years ended June 30, 2017, 20162020, 2019 and 2015,2018, respectively. The Company’s top tenSales to our dealers under common control of OneWater Marine, Inc. represented 40.6%approximately 15.2%, 31.9%15.1% and 33.7%,10.7% of the Company’s volume forconsolidated net sales in the fiscal years ended June 30, 20172020, 20162019, and 2015,2018 respectively.
Cash
The Company considers all highly liquid investments purchased with an original maturity of 90 days or less to be cash equivalents. Cash equivalents are stated at cost, which approximates fair value. As of June 30, 20172020 and 2016,2019, no highly liquid investments were held and the entire balance consists of traditional cash.
At June 30, 20172020 and 2016,2019, substantially all cash on hand was held by onetwo financial institution.institutions. This cash on deposit may be, at times, in excess of insurance limits provided by the FDIC.
Trade Accounts Receivable
Trade receivables are carried at original invoice amount less an estimate made for doubtful receivables based on a review of all outstanding amounts on a monthly basis. As of June 30, 20172020 and 2016,2019, the allowance for doubtful receivables was $44$0 and $89,$69, respectively. Management determines the allowance for doubtful accounts by identifying troubled accounts and by using historical experience applied to an aging of accounts. Trade receivables are written off when deemed uncollectible. Recoveries of trade receivables previously written off are recorded when received. A trade receivable is considered to be past due if any portion of the receivable balance is outstanding beyond customer terms.
Inventories
Inventories are stated at the lower of cost or net realizable value, determined on the first in, first out (“FIFO”) basis. Manufacturing cost includes materials, labor and manufacturing overhead. Unallocated overhead and abnormal costs are expensed as incurred.
Capitalization of Offering Costs
Capitalized offering costs are costs directly attributable to the Company's shelf registration statement and equity offerings. For the fiscal year ended June 30, 2015, these costs were related to the Company's IPO. As of June 30, 20172020 and 2016, $1082019, $140 of costs directly attributable to the Company's shelf registration statement and equity offerings were capitalized as prepaid assets. Upon closing of the offerings, these costs are netted against the proceeds and, as such, are reclassified into additional paid in capital. For the fiscal year ended June 30, 2017 and 2016,2019, the Company incurred no offering costs. Remaining costs attributable
capitalized $60 related to the Company'sa shelf registration statement will bestatement. For the fiscal year ended June 30, 2018 the Company netted $650 against the proceeds of future offerings under the shelf registration statement based on the number of shares sold in the offering and total number of shares available for issuance under the shelf registration statement. Refer to Note 1215 for additional information regarding the Company's equity offerings.
Property and Equipment
Property and equipment acquired outside of acquisition are stated at cost. When property and equipment is retired or otherwise disposed of, the related cost and accumulated depreciation is removed from the accounts and any resulting gain or loss is accounted for in the statement of operations and comprehensive income. Major additions are capitalized; maintenance, repairs and minor improvements are charged to operating expenses as incurred if they do not increase the life or productivity of the related capitalized asset. Depreciation on leasehold improvements is computed using the straight-line method based on the lesser of the remaining lease term or the estimated useful life and depreciation of equipment is computed using the straight-line method over the estimated useful life as follows:
|
| | |
| | Years |
Building | | 20 |
Leasehold improvements | | Shorter of useful life or lease term |
Machinery and equipment | | 3-5 |
Furniture and fixtures | | 3-5 |
The Company accounts for the impairment and disposition of long-lived assets in accordance with ASC Topic 360, Property, Plant, and Equipment. In accordance with ASC Topic 360, long-lived assets to be held are reviewed for events or changes in circumstances that indicate that their carrying value may not be recoverable. The Company periodically reviews for indicators and, if indicators are present, tests the carrying value of long-lived assets, assessing their net realizable values based on estimated undiscounted cash flows over their remaining estimated useful lives. If the carrying amount of an asset exceeds its estimated undiscounted future cash flows, an impairment charge is measured as the amount by which the carrying amount of the asset exceeds the fair value of the asset, based on discounted cash flows. No impairment charges were recorded for the fiscal years ended June 30, 2017, 2016 and 2015 in the Company’s consolidated financial statements.
Goodwill
Goodwill is an asset representing the future economic benefits arising from other assets acquired in a business combination that are not individually identified and separately recognized. Goodwill amounts are not amortized, but rather are evaluated for potential impairment on an annual basis, as of June 30, in accordance with the provisions of ASC Topic 350, Intangibles—Goodwill and Other. Under the guidance, the Company may assess qualitative factors to determine whether it is more likely than not that the fair value of a reporting unit is less than its carrying amount. If this assessment indicates the possibility of impairment, the income approach to test for goodwill impairment would be used. Under the income approach, management calculates the fair value of its reporting units based on the present value of estimated future cash flows. If the fair value of an individual reporting unit exceeds the carrying value of the net assets including goodwill assigned to that unit, goodwill is not impaired. If the carrying value of the reporting unit’s net assets including goodwill exceeds the fair value of the reporting unit,
then management determines the implied fair value of the reporting unit’s goodwill. If the carrying value of the reporting unit’s goodwill exceeds its implied fair value, then the Company would record an impairment loss equal to the difference. For fiscal yearyears ended June 30, 2017,2020 and 2019, the Company performed a qualitative assessment which indicated that the fair value of its reporting units more likely than not exceeded their respective carrying amounts. The Company did not0t recognize any goodwill impairment charges in the fiscal years ended June 30, 2017, 20162020, 2019 and 2015.2018.
Intangible Assets
Intangible assets consist primarily of relationships, reacquired franchise rights, product trade names, legal and contractual rights surrounding a patent and a non-compete agreement. These assets are recorded at their estimated fair values at the acquisition dates using the income approach. TheseDefinite lived intangible assets are being amortized using the straight-line method based on their estimated useful lives ranging from 5 to 1520 years. The estimated useful lives of the acquired dealer relationships consider the average length of dealer relationships at the time of acquisition, historical rates of dealer attrition and retention, the Company’s history of renewal and extension of dealer relationships, as well as competitive and economic factors resulting in a range of useful lives. The useful life of reacquired franchise rights is based on the remainder of the contractual term of the Licensee's exclusive manufacturing and distributors agreement with the Company. The estimated useful lives of the Company’s product trade names are based on a number of factors including technological obsolescence and the competitive environment. The estimated useful lives of legal and contractual rights are estimated based on the benefits that the patent provides for its remaining terms unless competitive, technological obsolescence or other factors indicate a shorter life. The useful life of the
non-compete agreement is based on a ten-year agreement entered into by the Company and former owner of the Licensee as part of the acquisition. In addition we have indefinite lived intangible assets for acquired trade names.
Management, assisted by third-party valuation specialists, determined the estimated fair values of separately identifiable intangible assets at the date of acquisition under the income approach. Significant data and assumptions used in the valuations included cost, market and income comparisons, discount rates, royalty rates and management forecasts. Discount rates for each intangible asset were selected based on judgment of relative risk and approximate rates of returns investors in the subject assets might require. The royalty rates were developed using weighted average rates, which were based on historical and projected sales and profits of products sold and management’s assessment of the intangibles’ importance to the sales and profitability of the product. Management provided forecasts of financial data pertaining to assets, liabilities and income statement balances to be utilized in the valuations. While management believes the assumptions, estimates, appraisal methods and ensuing results are appropriate and represent the best evidence of fair value in the circumstances, modification or use of other assumptions or methods could have yielded different results.
The carrying amount of definite lived intangible assets are reviewed whenever circumstances arise that indicate the carrying amount of an asset may not be recoverable. The carrying value of these assets is compared to the undiscounted future cash flows the assets are expected to generate. If the asset is considered to be impaired, the carrying value is compared to the fair value and this difference is recognized as an impairment loss. Intangible assets not subject to amortization are assessed for impairment at least annually and whenever events or changes in circumstances indicate that it is more likely than not that an asset may be impaired. The impairment test for indefinite-lived intangible assets consists of a comparison of the fair value of the intangible asset with its carrying amount. An impairment loss is recognized for the amount by which the carrying value exceeds the fair value of the asset.
There was no0 impairment loss recognized on intangible assets for the fiscal years ended June 30, 2017, 20162020, 2019 and 2015.
Debt Issuance Costs
On June 28, 2017, Malibu Boats, LLC modified its Previously Existing Credit Agreement and entered into its New Credit Agreement. Refer to Note 8 for more information on the Company's New Credit Agreement. In connection with the debt modification, the Company capitalized an additional $926 in debt issuance costs. These costs are being amortized over the term of the underlying agreements using the effective interest method. Unamortized debt issuance costs at June 30, 2017 and 2016 were $1,597 and $914, respectively, and are presented as a direct deduction from the carrying amount of the Company's outstanding debt.
Accrued Expenses
The Company’s accrued expenses consist of the following as of June 30, 2017 and 2016: |
| | | | | | | |
| | As of June 30, |
| | 2017 | | 2016 |
| Warranties | $ | 10,050 |
| | $ | 8,083 |
|
| Dealer incentives | 3,295 |
| | 4,016 |
|
| Accrued compensation | 4,262 |
| | 2,647 |
|
| Accrued legal and professional fees | 2,569 |
| | 462 |
|
| Accrued litigation | — |
| | 3,268 |
|
| Accrued interest | 18 |
| | 32 |
|
| Other accrued expenses | 1,422 |
| | 547 |
|
| Total accrued expenses | $ | 21,616 |
| | $ | 19,055 |
|
Product Warranties
Effective for model year 2016, the Company began providing a limited warranty for a period up to five years for both Malibu and Axis brand boats. For model years prior to 2016, the Company provided a limited warranty for a period of up to three years for its Malibu brand boats and two years for its Axis products. Refer to Note 7 for more information.2018.
Dealer Incentives
The Company provides for various structured dealer rebate and sales promotions incentives, which are recognized as a reductioncomponent of sales in net sales,measuring the amount of consideration the Company expects to receive in exchange for transferring goods, at the time of sale to the dealer. Examples of such programs include rebates, seasonal discounts, promotional co-op arrangements and other allowances. Dealer rebates and sales promotion expenses are estimated based on current programs and historical achievement and/or usage rates. Actual results may differ from these estimates if market conditions dictate the need to enhance or reduce sales promotion and incentive programs or if dealer achievement or other items vary from historical trends.
Free floor financing incentives include payments to the lenders providing floor plan financing to the dealers or directly to the dealers themselves. Free floor financing incentives are estimated at the time of sale to the dealer based on the expected expense to the Company over the term of the free flooring period ending in April each year, and are recognized as a reduction in sales. The Company accounts for both incentive payments directly to dealers and payment to third party lenders in this manner.
Changes in the Company’s accrual for dealer rebates were as follows:
| | | | As of June 30, | | Fiscal Year Ended June 30, | |
| | 2017 | | 2016 | | 2020 | | 2019 | | 2018 |
| Balance at beginning of year | $ | 3,912 |
| | $ | 3,165 |
| Balance at beginning of year | $ | 6,376 | | | $ | 5,559 | | | $ | 3,178 | |
| Add: Additions to dealer rebate incentive provision | 12,960 |
| | 6,440 |
| |
| Add: Dealer rebate incentive | | Add: Dealer rebate incentive | 19,555 | | | 20,712 | | | 15,713 | |
| Additions for Pursuit acquisition | | Additions for Pursuit acquisition | 0 | | | 205 | | | 0 | |
| Less: Dealer rebates paid | (13,694 | ) | | (5,693 | ) | Less: Dealer rebates paid | (19,066) | | | (20,100) | | | (13,332) | |
| Balance at end of year | $ | 3,178 |
| | $ | 3,912 |
| Balance at end of year | $ | 6,865 | | | $ | 6,376 | | | $ | 5,559 | |
Changes in the Company’s accrual for flooringfloor financing were as follows: |
| | | | | | | |
| | As of June 30, |
| | 2017 | | 2016 |
| Balance at beginning of year | $ | 104 |
| | $ | — |
|
| Add: Additions to flooring provision | 4,288 |
| | 3,407 |
|
| Less: Flooring paid | (4,275 | ) | | (3,303 | ) |
| Balance at end of year | $ | 117 |
| | $ | 104 |
|
Accrued litigation
In connection with a judgment rendered in a lawsuit with a former engine supplier, Marine Power Holding, LLC ("Marine Power"), the Company recorded a charge of $3,268 during the fiscal year ended June 30, 2016. On May 27, 2017, the Company and Marine Power entered into a final settlement agreement whereby the Company agreed to pay $2,175 to settle all claims related to the litigation. No further losses are accrued as of June 30, 2017. Refer to "Legal Proceedings" in Note 15 for more information. | | | | | | | | | | | | | | | | | |
| | Fiscal Year Ended June 30, | | | | |
| | 2020 | | 2019 | | 2018 |
| Balance at beginning of year | $ | 681 | | | $ | 211 | | | $ | 117 | |
| Add: Flooring incentive | 9,492 | | | 8,526 | | | 5,813 | |
| Additions for Cobalt acquisition | 0 | | | 0 | | | 132 | |
| Less: Flooring paid | (9,454) | | | (8,056) | | | (5,851) | |
| Balance at end of year | $ | 719 | | | $ | 681 | | | $ | 211 | |
Tax Receivable Agreement
As a result of exchanges of LLC Units into Class A Common Stock and purchases by the Company of LLC Units from holders of LLC Units, the Company will become entitled to a proportionate share of the existing tax basis of the assets of the LLC at the time of such exchanges or purchases. In addition, such exchanges or purchases of LLC Units are expected to result in increases in the tax basis of the assets of the LLC that otherwise would not have been available. These increases in tax basis may reduce the amount of tax that the Company would otherwise be required to pay in the future. These increases in tax basis may also decrease gains (or increase losses) on future dispositions of certain capital assets to the extent tax basis is allocated to those capital assets.
In connection with the Company's IPO and the recapitalization the Company completed in connection with its IPO, the Company entered into a tax receivable agreement with the pre-IPO owners of the LLC that provides for the payment by the Company to the pre-IPO owners (or any permitted assignees) of 85% of the amount of the benefits, if any, that the Company deems to realize as a result of (i) increases in tax basis and (ii) certain other tax benefits, including those attributable to payments, under the tax receivable agreement. These contractual payment obligations are the Company's obligations and are not obligations of the LLC, and are accounted for in accordance with ASC 450, Contingencies, since the obligations were deemed to be probable and reasonably estimable. For purposes of the tax receivable agreement, the benefit deemed realized by the Company will be computed by comparing its actual income tax liability (calculated with certain assumptions) to the amount of such taxes that it would have been required to pay had there been no increase to the tax basis of the assets of the LLC as a result of the purchases or exchanges, and had the Company not entered into the tax receivable agreement.
The timing and/or amount of aggregate payments due under the tax receivable agreement may vary based on a number of factors, including the amount and timing of the taxable income the Company generates in the future and the tax rate then applicable and amortizable basis.
The term of the tax receivable agreement will continue until all such tax benefits have been utilized or expired, unless the Company exercises its right to terminate the tax receivable agreement for an amount based on the agreed payments remaining to be made under the agreement. In certain mergers, asset sales or other forms of business combinations or other changes of control, the Company (or its successor) would owe to the pre-IPO owners of the LLC (or any permitted assignees) a lump-sum payment equal to the present value of all forecasted future payments that would have otherwise been made under the tax receivable agreement that would be based on certain assumptions, including a deemed exchange of all LLC Units and that the Company would have had sufficient taxable income to fully utilize the deductions arising from the increased tax basis and other tax benefits related to entering into the tax receivable agreement.
Income Taxes
Malibu Boats, Inc. is taxed as a C corporation for U.S. income tax purposes and is therefore subject to both federal and state taxation at a corporate level. Following the IPO, the LLC continues to operate in the United States as a partnership for U.S. federal income tax purposes.
The Company files various federal and state tax returns, including some returns that are consolidated with subsidiaries. The Company accounts for the current and deferred tax effects of such returns using the asset and liability method. Significant judgments and estimates are required in determining the Company's current and deferred tax assets and liabilities, which reflect management's best assessment of the estimated future taxes it will pay. These estimates are updated throughout the year to consider income tax return filings, its geographic mix of earnings, legislative changes and other relevant items.
The Company recognizes deferred tax assets and liabilities based on the differences between the financial statement carrying amounts of assets and liabilities and the amounts applicable for income tax purposes. Deferred tax assets represent items to be realized as a tax deduction or credit in future tax returns. Realization of the deferred tax assets ultimately depends on the existence of sufficient taxable income of the appropriate character in either the carryback or carryforward period.
Each quarter the Company analyzes the likelihood that its deferred tax assets will be realized. A valuation allowance is recorded if, based on the weight of all available positive and negative evidence, it is more likely than not (a likelihood of more than 50%) that some portion, or all, of a deferred tax asset will not be realized (see Note 10)13).
On an annual basis, the Company performs a comprehensive analysis of all forms of positive and negative evidence based on year end results. During each interim period, the Company updates its annual analysis for significant changes in the positive and negative evidence.
If the Company later determines that realization is more likely than not for deferred tax assets with a valuation allowance, the related valuation allowance will be reduced. Conversely, if the Company determines that it is more likely than not that the Company will not be able to realize a portion of our deferred tax assets, the Company will increase the valuation allowance.
The Company recognizes a tax benefit associated with an uncertain tax position when, in its judgment, it is more likely than not that the position will be sustained based upon the technical merits of the position. For a tax position that meets the more-likely-than-not recognition threshold, the Company initially and subsequently measures the income tax benefit as the largest amount that it judges to have a greater than 50% likelihood of being realized. The liability associated with unrecognized tax benefits is adjusted periodically due to changing circumstances, such as the progress of tax audits, case law developments and new or emerging legislation. Such adjustments are recognized entirely in the period in which they are identified. The Company's income tax provision includes the net impact of changes in the liability for unrecognized tax benefits.
The Company closed the IRS examination of its June 30, 2015 return during the fourth quarter of fiscal 2019, resulting in an immaterial adjustment to its tax liability. The Company has filed federal and state income tax returns that remain open to examination for fiscal years 20142017 through 2016,2019, while its subsidiaries, Malibu Boats Holdings, LLC and Malibu Boats Pty Ltd., remain open to examination for years 20132016 through 2016. The Company is currently undergoing an IRS examination of its June 30, 2015 return which began in the fourth quarter of fiscal 2017. While it is often difficult to predict the final outcome or the timing of resolution of any particular tax matter, the Company believes its liability for unrecognized tax benefits is adequate. 2019.
The Company considers an issue to be resolved at the earlier of the issue being “effectively settled,” settlement of an examination, or the expiration of the statute of limitations. Upon resolution, unrecognized tax benefits will be reversed as a discrete event.
The Company's liability for unrecognized tax benefits is generally presented as noncurrent. However, if it anticipates paying cash within one year to settle an uncertain tax position, the liability is presented as current. The Company classifies interest and penalties recognized on the liability for unrecognized tax benefits as income tax expense.
Revenue Recognition
Revenue is recognized as performance obligations under the terms of contracts with customers are satisfied; this occurs when control of promised goods (boats, parts, or other) is transferred to the customer, which is upon shipment. Revenue is measured as the amount of consideration we expect to receive in exchange for transferring goods or providing services. The Company generally manufactures products based on specific orders from dealers and often ships completed products only after receiving credit approval from financial institutions. Revenue is primarily recorded when allThe amount of consideration the following conditions have been met:
an order for a product has been received;
a common carrier signs the delivery ticket accepting responsibility for the product;Company receives and
the product is removed from the Company’s property for delivery.
These conditions are generally met when title passes, which is when boats are shipped revenue it recognizes varies with changes in marketing incentives and rebates it offers to its dealers in accordance with shipping terms, which are primarily free on board shipping point.and their customers.
Dealers generally have no rights to return unsold boats. From time to time, however, the Company may accept returns in limited circumstances and at the Company’s discretion under its warranty policy, which generally limits returns to instances of manufacturing defects. The Company estimates the costs that may be incurred under its basic limited warranty and records as a liability the amount of such costs at the time the product revenue is recognized. The Company may be obligated, in the event of default by a dealer, to accept returns of unsold boats under its repurchase commitment to floor financing providers, who are able to obtain such boats through foreclosure. The Company accrues estimated lossesreturns when a loss,repurchase and return, due to the default of one of its dealers, is determined to be probable and the amount of the lossreturn is reasonably estimable. Historically, product returns, resulting from repurchases made under the floorplan financing program, have not been material and the returned boats have been subsequently resold above their cost. Refer to Note 79 and Note 1518 related to the Company’s product warranty and repurchase commitment obligations, respectively.
Revenue from boat part sales is recorded as the product is shipped from the Company’s location, which is free on board shipping point.
Revenue associated with sales of materials, parts, boats or engine products sold under the Company’s exclusive manufacturing and distribution agreement with its acquired Australian licenseesubsidiary are eliminated in consolidation. Revenue associated with sales to the independent representative responsible for international sales is recognized in accordance with free on board shipping point terms, the point at which the risks of ownership and loss pass to the representative. A fixed percentage discount is earned by the independent representative at the time of shipment to the representative as a reduction in the price of the boat and is recorded in the Company's consolidated statement of operations as a reduction in sales.
The Company earns royalties on boats shipped with the Company's proprietary wake surfing technology under licensing agreements with various marine manufacturers. Royalty income is recordedrecognized when earned as net salesproducts are used or sold with our patented technology by other boat manufacturers and industry suppliers. The usage of our technology satisfies the performance obligation in the Company's consolidated statement of operations and comprehensive income.contract.
See Note 2 for more information.
Delivery Costs
Shipping and freight costs are included in cost of sales in the accompanying consolidated statements of operations and comprehensive income.
Advertising Costs
Advertising costs are expensed as incurred. Advertising expenses are included in selling and marketing expenses and were not material for the fiscal years ended June 30, 2017, 2016,2020, 2019, and 2015.
Derivative Instruments
The Company follows the guidance set forth in ASC Topic 815, Derivatives and Hedging, which requires that an entity recognize all derivatives as either assets or liabilities in the balance sheet and measure those instruments at fair value. Changes in fair value of derivatives are recorded each period in current earnings or other comprehensive income (loss), depending on whether the derivative is designated as part of a hedge transaction and, if it is, depending on the type of hedge transaction. On July 1, 2015, the Company entered into a 5 year floating to fixed interest rate swap with a bank who is a counterparty to the Company's Previously Existing Credit Agreement. Refer to Note 8 for additional information.2018.
Fair Value of Financial Instruments
Financial instruments for which the Company did not elect the fair value option include accounts receivable, prepaid expenses and other current assets, short-term credit facilities, accounts payable, accrued expenses and other current liabilities. The carrying amounts of these financial instruments approximate their fair values as a result of their short-term nature or variable interest rates. On June 28, 2017, the Company modified its debt agreement and entered into a variable rate term loan for $55,000 of which $55,000 was outstanding as of June 30, 2017. On April 2, 2015, the Company entered into a variable rate
term loan for $80,000, of which $72,000 was outstanding on June 30, 2016. The carrying value of the Company’s debt as of June 30, 2017 approximated its fair value.See Note 8 for more information.
Fair Value Measurements
The Company applies the provisions of ASC Topic 820, Fair Value Measurements and Disclosures,, for fair value measurements of financial assets and financial liabilities, and for fair value measurements of nonfinancial items that are recognized or disclosed at fair value in the financial statements on a recurring basis. ASC Topic 820 defines fair value as the price that would be received to sell an asset or paid to transfer a liability in an orderly transaction between market participants at the measurement date. ASC Topic 820 also establishes a framework for measuring fair value and expands disclosures about fair value measurements. In addition to the financial assets and liabilities measured on a recurring basis, certain nonfinancial assets and liabilities are to be measured at fair value on a nonrecurring basis in accordance with applicable GAAP. This includes items such as nonfinancial assets and liabilities initially measured at fair value in a business combination (but not measured at fair value in subsequent periods) and nonfinancial long-lived asset groups measured at fair value for an impairment assessment. In general, non-financial assets including goodwill, other intangible assets and property and equipment are measured at fair value when there is an indication of impairment and are recorded at fair value only when any impairment is recognized. See Note 1114 for more information.
Equity-Based Compensation
The Company expenses employee share-based awards under ASC Topic 718, Compensation—Stock Compensation, which requires compensation cost for the grant-date fair value of share-based awards to be recognized over the requisite service period. The Company estimated the grant date fair value of the share-based awards issued in the form of profit interests granted prior to November 1, 2013 using the Black-Scholes option pricing model and those granted on November 1, 2013 under the Probability-Weighted Expected Return method. Stock options granted to executives on June 29, 2017, November 6, 2017, August 22, 2018 and January 14, 2019 were valued using the Black-Scholes option pricing model. Stock awards granted on November 22, 2019 based on total shareholder return were valued using a Monte Carlo simulation. The fair value of restricted stock unit awards granted under the Company's Long Term Incentive Plan ("Incentive Plan") are measured based on the market price of the Company’s stock on the grant date. See Note 1316 for more information.
Earnings Per Share
Basic earnings per share is computed by dividing net income attributable to Malibu Boats, Inc. by the weighted average shares outstanding during the period. Diluted earnings per share is computed by dividing net income attributable to Malibu Boats, Inc., adjusted as necessary for the impact of potentially dilutive securities, by the weighted-average shares outstanding during the period and the impact of securities that would have a dilutive effect on earnings per share. See Note 14 for further discussion.
Repurchase Commitments
In connection with its dealers’ wholesale floor-plan financing of boats, the Company has entered into repurchase agreements with various lending institutions. The repurchase commitment is on an individual unit basis with a term from the date it is financed by the lending institution through payment date by the dealer, generally not exceeding two and a half years. The total amount financed under the floor financing programs with repurchase obligations was $107,923 and $80,429 as of June 30, 2017 and 2016, respectively. Such agreements are customary in the industry and the Company’s exposure to loss under such agreements is limited by contractual caps and the resale value of the inventory which is required to be repurchased. During the fiscal year ended June 30, 2017, the Company did not repurchase any units. During the fiscal year ended June 30, 2016, the Company agreed to repurchase three units from the lender of two of its former dealers. There were no units repurchased during the fiscal year ended June 30, 2015. See Note 15 for more information.
Segment Reporting
The Company reports its results of operations under two reportable segments, U.S. and Australia, based on their respective manufacturing footprints. Each segment participates in the manufacturing, distribution, marketing and sale of recreational powerboats. The U.S. operating segment primarily serves markets in North America, South America, Europe, and Asia while the Australia operating segment principally serves the Australian and New Zealand markets.
Foreign Currency Translation
The functional currency for the Company's consolidated foreign subsidiary is the applicable local currency. The assets and liabilities are translated at the foreign exchange rate in effect at the applicable reporting date, and the consolidated statements of operations and comprehensive income and cash flows are translated at the average exchange rate in effect during the applicable
period. Exchange rate fluctuations on translating the foreign currency financial statements into U.S. dollars that result in unrealized gains or losses are referred to as translation adjustments. Cumulative translation adjustments are reflected as a
component of "Accumulated other comprehensive loss," in the stockholders' equity section of the accompanying consolidated balance sheets and periodic changes are included in comprehensive income.
Comprehensive Income
Components of comprehensive income include net income and foreign currency translation adjustments. The Company has chosen to disclose comprehensive income in a single continuous statement of operations and comprehensive income.
COVID-19 Pandemic
In March 2020, the World Health Organization characterized the coronavirus (“COVID-19”) a pandemic, and the President of the United States declared the COVID-19 outbreak a national emergency. The COVID-19 pandemic has significantly impacted health and economic conditions throughout the United States. The COVID-19 pandemic has impacted the Company’s operations and financial results. Due to the impact of the COVID-19 pandemic, the Company elected to suspend operations at all of its facilities on March 24, 2020, which impacted the second half of fiscal year 2020. The shut-down continued into the fourth quarter with operations resuming between late April and early May, depending on the facility. Due to the rapidly changing business environment, unprecedented market volatility and heightened degree of uncertainty resulting from COVID-19, the Company cannot reasonably estimate the length or severity of the pandemic or its impact on the Company’s liquidity, results of operations, and financial condition, which could have a material adverse effect.
Recent Accounting Pronouncements
In May 2014,On July 1, 2018, the FASB and International Accounting Standards Board jointly issued a finalCompany adopted the new accounting standard, on revenue recognition, Accounting Standards Update ("ASU") 2014-09, ASC Topic 606, Revenue from Contracts with Customers (Topic 606), and all the related amendments (“ASC 606”) and applied the provisions of the standard to all contracts using the modified retrospective method. The cumulative effect of adopting the new revenue standard was immaterial and no adjustment has been recorded to the opening balance of retained earnings. Prior year information has not been restated and continues to be reported under the accounting standards in effect for those periods. Substantially all of the Company’s revenue continues to be recognized at a point in time when the product is either shipped or received from the Company's facilities and control of the product is transferred to the customer. New controls and processes designed to meet the requirements of the standard were implemented, and the required new disclosures are presented in Note 2. The adoption of ASC Topic 606 did not have a material impact on the amounts reported in the Company's consolidated financial position, results of operations or cash flows.
On July 1, 2019, the Company adopted the new accounting standard, ASC Topic 842, Leases, which outlinessuperseded the requirements in ASC Topic 840, Leases. ASC Topic 842 requires lessees to recognize on the balance sheet a single comprehensiveright-of-use asset, representing its right to use the underlying asset for the lease term, and a lease liability for all leases with terms greater than 12 months. The guidance also requires qualitative and quantitative disclosures designed to assess the amount, timing, and uncertainty of cash flows arising from leases. The Company applied the modified retrospective transition method which allowed for the election of the application of practical expedients, which among other things, allowed the Company to carry forward the historical lease classification. Under this new transition method, at the adoption date the Company recognized a cumulative-effect adjustment to the opening balance of retained earnings. The adoption of ASC Topic 842 did not have a material impact on the Company’s consolidated results of operations, equity or cash flows as of the adoption date. Under the optional transition approach, comparative information was not restated, but will continue to be reported under the standards in effect for those periods. See Note 11 for further information regarding the Company’s leases.
In June 2016, the FASB issued ASU 2016-13, Financial Instruments - Credit Losses (Topic 326): Measurement of Credit Losses on Financial Instruments, and in November 2018 issued a subsequent amendment, ASU 2018-19, Codification Improvements to Topic 326, Financial Instruments - Credit Losses. ASU 2016-13 significantly changes how entities will measure credit losses for most financial assets and certain other instruments that are not measured at fair value through net income. ASU 2016-13 will replace today’s “incurred loss” approach with an “expected loss” model for entitiesinstruments measured at amortized cost. ASU 2018-19 will affect loans, debt securities, trade receivables, net investments in leases, off balance sheet credit exposures, reinsurance receivables, and any other financial assets not excluded from the scope of this amendment that have the contractual right to use in accounting for revenue arising from contracts with customers. This standard will supersede most current revenue recognition guidance. Under the new standard, entities are required to identify the contract with a customer; identify the separate performance obligations in the contract; determine the transaction price; allocate the transaction price to the separate performance obligations in the contract; and recognize the appropriate amount of revenue when (or as) the entity satisfies each performance obligation. The standardreceive cash. ASU 2016-13 is effective for fiscal years and interim periods beginning after December 15, 2017. Entities have2019, and is effective for the option of using either the retrospective or cumulative effect transition method.Company’s fiscal year beginning July 1, 2020. The Company has completed a preliminary assessmentadoption of the ASU is not expected to have a material impact on the Company’s consolidated financial position, results of ASU 2014-09 and does not anticipate theoperations, equity or cash flows.
There are no other new accounting pronouncements that are expected to have a significant impact will be significant toon the Company's consolidated financial statements accounting policies or processes. The Company expects to adopt ASU 2014-09 for the Company's fiscal year beginning July 1, 2018, and expects to adopt the guidance using the modified retrospective approach.related disclosures.
In July 2015, the FASB issued ASU 2015-11, Simplifying the Measurement of Inventory. This ASU changes the measurement principle for inventories valued under the first-in, first-out or weighted-average methods from the lower of cost or market to the lower of cost and net realizable value. Net realizable value is defined by the FASB as estimated selling prices in the ordinary course of business, less reasonably predictable costs of completion, disposal and transportation. This ASU does not change the measurement principles for inventories valued under the last-in, first-out method. The Company adopted ASU 2015-11 on April 1, 2017. The adoption did not have a material impact.
In February 2016, the FASB issued ASU 2016-02, Leases (Topic 842). This guidance establishes a right-of-use (“ROU”) model that requires a lessee to record a ROU asset and a lease liability on the balance sheet for all leases with terms longer than 12 months. Leases will be classified as either finance or operating, with classification affecting the pattern of expense recognition in the statement of operations and comprehensive income. The new standard is effective for fiscal years beginning after December 15, 2018, including interim periods within those fiscal years. A modified retrospective transition approach is required for lessees for capital and operating leases existing at, or entered into after, the beginning of the earliest comparative period presented in the financial statements, with certain practical expedients available. The Company is currently assessing the potential impact of this ASU on its consolidated financial statements and footnote disclosures.
In August 2016, the FASB issued ASU 2016-15, Statement of Cash Flows (Topic 230): Classification of Certain Cash Receipts and Cash Payments. This ASU is effective for fiscal years beginning after December 15, 2017 and interim periods within those fiscal years with early adoption permitted. This guidance provides specific classification of how certain cash receipts and cash payments are presented in the statement of cash flows. The ASU should be applied using a retrospective transition method. If it is impracticable to apply the amendments retrospectively for some of the cash flow issues, the amendments for those issues should then be applied prospectively at the earliest date practicable. The Company is currently assessing the potential impact of this ASU on its presentation of the consolidated statement of cash flows.
In January 2017, the FASB issued ASU 2017-01, Business Combinations (Topic 805): Clarifying the Definition of a Business. The guidance clarifies the definition of a business that provides a two-step analysis in the determination of whether an acquisition or derecognition is a business or an asset. The update removes the evaluation of whether a market participant could replace any missing elements and provides a framework to assist entities in evaluating whether both an input and a substantive process are present. This guidance is effective for annual reporting periods beginning after December 15, 2017, including interim periods within those annual reporting periods and early adoption is permitted for transactions that meet specified criteria. This guidance is to be applied on a prospective basis for transactions that occur after the effective date.
In January 2017, the FASB issued ASU 2017-04, Intangibles - Goodwill and Other (Topic 350): Simplifying the Test for Goodwill Impairment. The purpose of this ASU is to simplify the subsequent measurement of goodwill by removing the second step of the two-step impairment test. The amendment should be applied on a prospective basis. This ASU is effective for fiscal years beginning after December 15, 2019, including interim periods within that year. Early adoption is permitted for interim or
2. Revenue Recognition
The following table disaggregates the Company's revenue by major product type and geography:
annual goodwill impairment tests performed | | | | | | | | | | | | | | | | | | | | | | | |
| Fiscal Year Ended June 30, 2020 | | | | | | |
| Malibu | | Cobalt | | Pursuit | | Consolidated |
| Revenue by product: | | | | | | | |
| Boat and trailer sales | $ | 341,886 | | | $ | 172,267 | | | $ | 122,850 | | | $ | 637,003 | |
| Part and other sales | 12,883 | | | 2,501 | | | 776 | | | 16,160 | |
| Total revenue | $ | 354,769 | | | $ | 174,768 | | | $ | 123,626 | | | $ | 653,163 | |
| | | | | | | |
| Revenue by geography: | | | | | | | |
| North America | $ | 327,049 | | | $ | 167,755 | | | $ | 115,363 | | | $ | 610,167 | |
| International | 27,720 | | | 7,013 | | | 8,263 | | | 42,996 | |
| Total revenue | $ | 354,769 | | | $ | 174,768 | | | $ | 123,626 | | | $ | 653,163 | |
| | | | | | | | | | | | | | | | | | | | | | | |
| Fiscal Year Ended June 30, 2019 | | | | | | |
| Malibu | | Cobalt | | Pursuit | | Consolidated |
| Revenue by product: | | | | | | | |
| Boat and trailer sales | $ | 362,200 | | | $ | 203,825 | | | $ | 102,070 | | | $ | 668,095 | |
| Part and other sales | 12,411 | | | 2,773 | | | 737 | | | 15,921 | |
| Total revenue | $ | 374,611 | | | $ | 206,598 | | | $ | 102,807 | | | $ | 684,016 | |
| | | | | | | |
| Revenue by geography: | | | | | | | |
| North America | $ | 341,190 | | | $ | 196,734 | | | $ | 93,003 | | | $ | 630,927 | |
| International | 33,421 | | | 9,864 | | | 9,804 | | | 53,089 | |
| Total revenue | $ | 374,611 | | | $ | 206,598 | | | $ | 102,807 | | | $ | 684,016 | |
Boat and Trailer Sales
Consists of sales of boats and trailers to the Company's dealer network, net of sales returns, discounts, rebates and free flooring incentives. Boat and trailer sales also includes optional boat features. Sales returns consist of boats returned by dealers under our warranty program. Rebates, free flooring and discounts are incentives that the Company provides to its dealers based on testing dates after January 1, 2017. The Company has electedsales of eligible products.
Part and Other Sales
Consists primarily of parts and accessories sales, royalty income and clothing sales. Parts and accessories sales include replacement and aftermarket boat parts and accessories sold to early adopt for the goodwill impairment tests performed asCompany's dealer network. Royalty income is earned from license agreements with various boat manufacturers, including Nautique, Chaparral, Mastercraft, and Tige related to the use of June 30, 2017.the Company's intellectual property.
2.3. Non-controlling Interest
The non-controlling interest on the consolidated statement of operations and comprehensive income represents the portion of earnings or loss attributable to the economic interest in the Company's subsidiary, Malibu Boats Holdings, LLC, held by the non-controlling LLC Unit holders. Non-controlling interest on the consolidated balance sheets represents the portion of net assets of the Company attributable to the non-controlling LLC Unit holders, based on the portion of the LLC Units owned by such Unit holders. The ownership of Malibu Boats Holdings, LLC is summarized as follows:
| | | | As of June 30, 2017 | | As of June 30, 2016 | | As of June 30, 2020 | | | As of June 30, 2019 | |
| | Units | | Ownership % | | Units | | Ownership % | | Units | | Ownership % | | Units | | Ownership % |
| Non-controlling LLC unit holders ownership in Malibu Boats Holdings, LLC | 1,260,627 | | 6.6 | % | | 1,404,923 | | 7.4 | % | Non-controlling LLC unit holders ownership in Malibu Boats Holdings, LLC | 730,652 | | 3.4 | % | | 830,152 | | 3.8 | % |
| Malibu Boats, Inc. ownership in Malibu Boats Holdings, LLC | 17,937,687 | | 93.4 | % | | 17,690,874 | | 92.6 | % | Malibu Boats, Inc. ownership in Malibu Boats Holdings, LLC | 20,595,969 | | 96.6 | % | | 20,852,640 | | 96.2 | % |
| | 19,198,314 | | 100.0 | % | | 19,095,797 | | 100.0 | % | | 21,326,621 | | 100.0 | % | | 21,682,792 | | 100.0 | % |
|
| | | | |
| Balance of non-controlling interest as of June 30, 2015 | | $ | 3,898 |
|
| Allocation of income to non-controlling LLC Unit holders for period | | 2,253 |
|
| Distributions paid and payable to non-controlling LLC Unit holders for period | | (1,433 | ) |
| Reallocation of non-controlling interest from selling shareholders acquired in offerings | | (39 | ) |
| Balance of non-controlling interest as of June 30, 2016 | | 4,679 |
|
| Allocation of income to non-controlling LLC Unit holders for period | | 2,717 |
|
| Distributions paid and payable to non-controlling LLC Unit holders for period | | (1,535 | ) |
| Reallocation of non-controlling ownership interests in exchange for Class A Common Stock | | (2,789 | ) |
| Balance of non-controlling interest as of June 30, 2017 | | $ | 3,072 |
|
| | | | | | | | |
| Balance of non-controlling interest as of June 30, 2018 | | $ | 5,502 | |
| Allocation of income to non-controlling LLC Unit holders for period | | 3,635 | |
| Distributions paid and payable to non-controlling LLC Unit holders for period | | (1,845) | |
| | |
| Reallocation of non-controlling interest | | (1,174) | |
| Balance of non-controlling interest as of June 30, 2019 | | 6,118 | |
| Allocation of income to non-controlling LLC Unit holders for period | | 3,094 | |
| Distributions paid and payable to non-controlling LLC Unit holders for period | | (1,370) | |
| Reallocation of non-controlling interest | | (895) | |
| Balance of non-controlling interest as of June 30, 2020 | | $ | 6,947 | |
Issuance of Additional LLC Units
Under the first amended and restated limited liability company agreement of the LLC, Agreement,as amended (the "LLC Agreement'), the Company is required to cause the LLC to issue additional LLC Units to the Company when the Company issues additional shares of Class A Common Stock. Other than in connection with the issuance of Class A Common Stock in connection with an equity incentive program, the Company must contribute to the LLC net proceeds and property, if any, received by the Company with respect to the issuance of such additional shares of Class A Common Stock. The Company shallmust cause the LLC to issue a number of LLC Units equal to the number of shares of Class A Common Stock issued such that, at all times, the number of LLC Units held by the Company equals the number of outstanding shares of Class A Common Stock. During the fiscal year ended June 30, 2017,2020, the Company caused the LLC issuedto issue a total of 252,686242,741 LLC Units to the Company in connection with (i) the Company's issuance of Class A Common Stock to a non-employee director for hisher services, (ii) the issuance of Class A Common Stock for the vesting of awards granted under the Malibu Boats, Inc. Long-Term Incentive Plan (the "Incentive Plan"), (iii) the issuance of restricted Class A Common Stock granted under the Incentive Plan, and (iv) the issuance of Class A Common Stock to various LLC Unit holders for exchangesin exchange of their LLC Units.Units and (v) the issuance of Class A Common Stock for the exercise of options granted under the Incentive Plan. During fiscal year 2017, 5,8732020, 15,733 LLC Units were canceled in connection with the vesting of share-based equity awards to satisfy employee tax withholding requirements and the retirement of 5,87315,733 treasury shares in accordance with the LLC Agreement. During the fiscal year ended June 30, 2020, 483,679 LLC Units were redeemed and canceled by the LLC in connection with the purchase and retirement of 483,679 treasury shares under the Company's stock repurchase program.
Distributions and Other Payments to Non-controlling Unit Holders
Distributions for Taxes
As a limited liability company (treated as a partnership for income tax purposes), Malibu Boats Holdings, LLC does not incur significant federal, state or local income taxes, as these taxes are primarily the obligations of its members. As authorized by the LLC Agreement, the LLC is required to distribute cash, to the extent that the LLC has cash available, on a pro rata basis, to its members to the extent necessary to cover the members’ tax liabilities, if any, with respect to their share of LLC earnings. The LLC makes such tax distributions to its members based on an estimated tax rate and projections of taxable income. If the
actual taxable income of the LLC multiplied by the estimated tax rate exceedexceeds the tax distributions made in a calendar year, the LLC may make true-up distributions to its members, if cash or borrowings isare available for such purposes. As of June 30, 20172020 and 2016,2019, tax distributions payable to non-controlling LLC Unit holders were $309$104 and $341,$568, respectively. During the fiscal years ended June 30, 2017, 2016,2020, 2019, and 2015,2018, tax distributions paid to the non-controlling LLC Unit holders were $1,226, $1,239,$1,836, $1,785, and $3,630,$1,647, respectively.
Other Distributions
Pursuant to the LLC Agreement, the Company has the right to determine when distributions will be made to LLC members and the amount of any such distributions. If the Company authorizes a distribution, such distribution will be made to the members of the LLC (including the Company) pro rata in accordance with the percentages of their respective LLC units.
3. Acquisition4. Acquisitions
Pursuit
On October 23, 2014,15, 2018, the Company acquired allcompleted its acquisition of the outstanding sharesassets of Malibu Boats Pty Ltd., the Company's exclusive licensee in Australia since 1995. The Licensee had the exclusive right to manufacture and distribute Malibu and Axis products and spare parts in Australia and New Zealand. The acquisition provides direct control of the Company's brand worldwide and provides it with a strong footprint for future growth internationally in Asia. Pursuit. The aggregate purchase price for the transaction was$16,142, consisting of $13,305 in $100,073, funded with cash and $2,837 in equity equal to 170,889 shares ofborrowings under the Company's Class A Common Stock based on a closing stockcredit agreement. The aggregate purchase price of $17.11 per share. Under the share sale agreement, the number of shares issued was based on the average closing price of shares of the Class A Common Stocksubject to certain adjustments, including customary adjustments for the 20 days immediately prior to, but not including,amount of working capital in the business at the closing date of the acquisition. Of the consideration paid in stock, 71.43% is restricted from sale for a period of 2 years from the acquisition date. The Company funded a portion of the purchase price payable in cash with additional borrowings under its revolving credit facility. The Company accounted for the transaction in accordance with ASC 805, Business Combinations.
The total consideration given to the former ownerowners of the LicenseePursuit has been allocated to the assets acquired and liabilities assumed based on their estimatedestimates of fair valuesvalue as of the date of the acquisitionacquisition. The measurements of fair value were determined based upon estimates utilizing the assistance of third party valuation specialists.
The following table summarizes the purchase price allocation based on the estimated fair values of the assets acquired and liabilities of the LicenseePursuit assumed at the acquisition date:
| | | | | |
| Consideration: | |
| Cash consideration paid | $ | 100,073 | |
| |
| Recognized amounts of identifiable assets acquired and liabilities assumed, at fair value: | |
| |
| |
| Inventories | $ | 8,332 | |
| Other current assets | 350 | |
| Property, plant and equipment | 17,454 | |
| Identifiable intangible assets | 57,900 | |
| Current liabilities | (3,488) | |
| Fair value of assets acquired and liabilities assumed | 80,548 | |
| Goodwill | 19,525 | |
| Total purchase price | $ | 100,073 | |
|
| | | |
| Consideration: | |
| Cash consideration paid | $ | 13,305 |
|
Equity consideration paid 1 | 2,837 |
|
| Fair value of total consideration transferred | $ | 16,142 |
|
| | |
| Recognized amounts of identifiable assets acquired and (liabilities assumed), at fair value: | |
| Cash | 1,642 |
|
| Accounts receivable | 878 |
|
| Inventories | 5,023 |
|
| Other current assets | 195 |
|
| Net property, plant, and equipment | 1,191 |
|
| Identifiable intangible assets | 4,558 |
|
| Other assets | 45 |
|
| Current liabilities | (3,908 | ) |
| Deferred tax liabilities | (1,407 | ) |
| Other liabilities | (34 | ) |
| Fair value of assets acquired and liabilities assumed | 8,183 |
|
| Goodwill | 7,959 |
|
| Total purchase price | $ | 16,142 |
|
1 In accordance with ASC Topic 820, the fair value of the equity consideration paid reflects a discount to take into account the effect of the 2 year sale restriction on 71.43% of the consideration paid in stock. The measurement period adjustment of $87 was made in the fourth quarter of fiscal year 2015 which also reduced goodwill.
The fair value estimates for the Company's identifiable intangible assets acquired as part of the acquisition are as follows: |
| | | | | |
| | Estimates of Fair Value | | Estimated Useful Life (in years) |
| Reacquired franchise rights | $ | 1,579 |
| | 5 |
| Dealer relationships | 2,808 |
| | 15 |
| Non-compete agreement | 61 |
| | 10 |
| Backlog | 110 |
| | 0.3 |
| Total | $ | 4,558 |
| | |
| | | | | | | | | | | |
| Estimates of Fair Value | | Estimated Useful Life (in years) |
| Definite-lived intangibles: | | | |
| Dealer relationships | $ | 25,400 | | | 20 |
| Total definite-lived intangibles | 25,400 | | | |
| Indefinite-lived intangible: | | | |
| Trade name | 32,500 | | | |
| Total other intangible assets | $ | 57,900 | | | |
The value allocated to inventories reflects the estimated fair value of the acquired inventory based on the expected sales price of the inventory, less an estimated cost to complete and a reasonable profit margin. The fair value of the identifiable intangible assets were determined based on the following approaches:
Reacquired Franchise Rights - The reacquired franchise rights intangible asset represents the value assigned to the remainder of the contractual term of the Licensee's exclusive manufacturing and distributors agreement with the Company and was determined using the multi-period excess earnings method under the income approach. No gain or loss was recognized on the reacquisition of the Company's franchise rights.
Dealer Relationships - The value associated with the Licensee'sPursuit's dealer relationships is attributed to its long standing dealer distribution network. The estimate of fair value assigned to this asset was determined using the income approach, which requires an estimate or forecast of the expected future cash flows from the dealer relationships through the application of the distributor method under the multi-period excess earnings approach. The estimated remaining useful life of dealer relationships is approximately twenty years.
Trade Name - As part The value attributed to Pursuit's trade name was determined using a variation of the acquisition,income approach called the Licensee entered into a ten-year non-compete agreement with its former owner. relief from royalty method, which requires an estimate or forecast of the expected future cash flows. The trade name has an indefinite life.
The fair value of the non-compete agreement was determined using the with or without method under the income approach which discounted future cash flows attributable to unfavorable impact of the agreement had it not been in place.
Backlog - Backlog relates to the value of orders not yet shipped by Licensee at the acquisition date, and the fair values were based on an excess earnings approach associated with those orders. Backlog related assets are being recognized commensurate with recognition of the revenue for the orders on which the backlog intangible assets were determined.
The fair value of thesedefinite-lived intangible assets are being amortized using athe straight-line method to general and administrative expenses over their estimated useful lives. Indefinite-lived intangible assets are not amortized, but instead are evaluated for potential impairment on an annual basis in accordance with the provisions of ASC Topic 350, Intangibles—Goodwill and Other. The weighted average useful life of identifiable definite-lived intangible assets acquired was 11.120 years. Goodwill of $7,959$19,525 arising from the acquisition consists of expected synergies and cost savings as well as intangible assets that do not qualify for separate recognition, such as assembled workforce,recognition. The indefinite-lived intangible asset and was allocated to the Company’s Australian operating segment. None of the goodwill isacquired are expected to be deductible for income tax purposes.
Acquisition-related costs of $824, all of which were$2,848 and $329 incurred by the Company infor fiscal year 2015,years ended June 30, 2019 and 2018, respectively, related to the Pursuit acquisition, were expensed in the periods prior to the acquisition of Malibu Boats Pty Ltd.,period incurred, and are included in selling, general and administrative expenses in the consolidated statement of operations and comprehensive income for the fiscal year ended June 30, 2015.income.
Pro Forma Financial Information (unaudited):
The following unaudited pro forma financial consolidated results of operations for the fiscal yearyears ended June 30, 20152020 and 2019, assumes that the acquisition of LicenseePursuit occurred as of July 1, 2014.2017. The unaudited pro forma financial information combines historical results of Malibu and Pursuit, with adjustments for depreciation and amortization attributable to preliminary fair value estimates on acquired tangible and intangible assets and eliminations of intercompany sales and cost of sales for the respective periods. Non-recurring pro forma adjustments associated with the fair value step up of inventory were included in the reported pro forma cost of sales and earnings. The unaudited pro forma financial information is presented for informational purposes only and is not indicative of the results of operations that would have been achieved if the acquisition had taken place at the beginning of fiscal year 2015
2018 or of the results that may occur in the future: | | | | | | Fiscal Year Ended June 30, | |
| | | For the Fiscal Year Ended
June 30, 2015 | | 2020 | | 2019 | | 2018 | |
| Net sales | | $ | 233,688 |
| Net sales | $ | 653,163 | | | $ | 725,658 | | | $ | 620,908 | | |
| Net income | | 24,174 |
| Net income | 64,656 | | | 73,672 | | | 33,618 | | |
| Net income attributable to Malibu Boats, Inc. | | 15,463 |
| Net income attributable to Malibu Boats, Inc. | 61,562 | | | 69,830 | | | 29,871 | | |
| Basic earnings per share | | $ | 0.98 |
| Basic earnings per share | $ | 2.98 | | | $ | 3.35 | | | $ | 1.48 | | |
| Diluted earnings per share | | $ | 0.98 |
| Diluted earnings per share | $ | 2.95 | | | $ | 3.33 | | | $ | 1.47 | | |
4. Inventories
Inventories consistedOn July 6, 2017, the Company completed its acquisition of Cobalt. The aggregate purchase price for the transaction was $130,525, consisting of $129,525 funded with cash and borrowings under the Company's credit agreement and $1,000 in equity equal to 39,262 shares of the following:Company's Class A Common Stock based on a closing stock price of $25.47 per share on June 27, 2017. The aggregate purchase price was subject to certain adjustments, including customary adjustments for the amount of working capital in the business at the closing date and subject to adjustment for any judgment or settlement in connection with a pending litigation matter between Cobalt and Sea Ray Boats, Inc. and Brunswick Corporation. William Paxson St. Clair, Jr., a former owner of Cobalt, was appointed as a director to the Company's Board of Directors and as President of Cobalt. The Company accounted for the transaction in accordance with ASC 805, Business Combinations.
|
| | | | | | | |
| | As of June 30, |
| | 2017 | | 2016 |
| Raw materials | $ | 15,643 |
| | $ | 14,858 |
|
| Work in progress | 2,068 |
| | 1,250 |
|
| Finished goods | 6,124 |
| | 4,323 |
|
| Total inventories | $ | 23,835 |
| | $ | 20,431 |
|
5. PropertyThe total consideration given to the former members of Cobalt has been allocated to the assets acquired and Equipment
Property and equipment, net consistedliabilities assumed based on estimated fair values as of the date of the acquisition. The measurements of fair value were determined based upon estimates utilizing the assistance of third party valuation specialists.
The following table summarizes the purchase price allocation based on the estimated fair values of the assets acquired and liabilities of Cobalt assumed at the acquisition date:
|
| | | | | | | | |
| | | As of June 30, |
| | | 2017 | | 2016 |
| Land | | $ | 367 |
| | $ | 254 |
|
| Leasehold improvements | | 11,009 |
| | 7,168 |
|
| Machinery and equipment | | 22,844 |
| | 20,035 |
|
| Furniture and fixtures | | 3,536 |
| | 2,765 |
|
| Construction in process | | 3,646 |
| | 356 |
|
| | | 41,402 |
| | 30,578 |
|
| Less accumulated depreciation | | (17,279 | ) | | (12,765 | ) |
| | | $ | 24,123 |
| | $ | 17,813 |
|
| | | | | |
| Consideration: | |
| Cash consideration paid | $ | 129,525 | |
| Equity consideration paid | 1,000 | |
| Fair value of total consideration transferred | $ | 130,525 | |
| |
| Recognized amounts of identifiable assets acquired and liabilities assumed, at fair value: | |
| Cash | $ | 3,973 | |
| Trade receivables | 2,329 | |
| Inventories | 14,343 | |
| Other current assets | 363 | |
| Property, plant, and equipment | 12,934 | |
| Identifiable intangible assets | 89,900 | |
| |
| Current liabilities | (13,108) | |
| |
| |
| Fair value of assets acquired and liabilities assumed | 110,734 | |
| Goodwill | 19,791 | |
| Total purchase price | $ | 130,525 | |
Depreciation expenseThe fair value estimates for the Company's identifiable intangible assets acquired as part of the acquisition are as follows:
| | | | | | | | | | | |
| Estimates of Fair Value | | Estimated Useful Life (in years) |
| Definite-lived intangibles | | | |
| Dealer relationships | $ | 56,300 | | | 20 |
| Patent | 2,600 | | | 15 |
| Total definite-lived intangibles | 58,900 | | | |
| Indefinite-lived intangible: | | | |
| Trade name | 31,000 | | | |
| Total other intangible assets | $ | 89,900 | | | |
The value allocated to inventories reflects the estimated fair value of the acquired inventory based on the expected sales price of the inventory, less an estimated cost to complete and a reasonable profit margin. The fair value of the identifiable intangible assets were determined based on the following approaches:
Dealer Relationships - The value associated with Cobalt's dealer relationships is attributed to its long standing dealer distribution network. The estimate of fair value assigned to this asset was $4,550, $3,339determined using the income approach, which requires an estimate or forecast of the expected future cash flows from the dealer relationships through the application of the multi-period excess earnings approach. The estimated remaining useful life of dealer relationships is approximately twenty years.
Patent - The value associated with the patented technology was based on financial projections and $2,427the patent's estimated remaining legal life of approximately fifteen years using a variation of the income approach called the royalty savings method.
Trade Name - The value attributed to Cobalt's trade name was determined using a variation of the income approach called the relief from royalty method, which requires an estimate or forecast of the expected future cash flows. The trade name has an indefinite life.
The fair value of the definite-lived intangible assets are being amortized using the straight-line method to general and administrative expenses over their estimated useful lives. Indefinite-lived intangible assets are not amortized, but instead are evaluated for potential impairment on an annual basis in accordance with the provisions of ASC Topic 350, Intangibles—Goodwill and Other. The weighted average useful life of identifiable definite-lived intangible assets acquired was 19.8 years. Goodwill of $19,791 arising from the acquisition consists of expected synergies and cost savings as well as intangible assets that do not qualify for separate recognition. The indefinite-lived intangible asset and goodwill acquired are deductible for income tax purposes.
Acquisition-related costs of $489 and $3,056 incurred by the Company for fiscal years ended June 30, 2019 and 2018, were expensed as incurred, and are included in general and administrative expenses in the consolidated statements of operations and comprehensive income.
Pro Forma Financial Information (unaudited):
The following unaudited pro forma consolidated results of operations for the fiscal years ended June 30, 2017, 20162020, 2019 and 2015,2018, assumes that the acquisition of Cobalt occurred as of July 1, 2017. The unaudited pro forma consolidated financial information combines historical results of Malibu and Cobalt, with adjustments for depreciation and amortization attributable to preliminary fair value estimates on acquired tangible and intangible assets for the respective periods. Non-recurring pro forma adjustments associated with the fair value step up of inventory were included in the reported pro forma cost of sales and earnings. The unaudited pro forma financial information is presented for informational purposes only and is not indicative of the results of operations that would have been achieved if the acquisition had taken place at the beginning of fiscal year 2018 or the results that may occur in the future:
| | | | | | | | | | | | | | | | | |
| Fiscal Year Ended June 30, | | | | |
| 2020 | | 2019 | | 2018 |
| Net sales | $ | 653,163 | | | $ | 684,016 | | | $ | 497,002 | |
| Net income | 64,656 | | | 69,701 | | | 30,696 | |
| Net income attributable to Malibu Boats, Inc. | 61,562 | | | 66,066 | | | 27,361 | |
| Basic earnings per share | $ | 2.98 | | | $ | 3.17 | | | $ | 1.36 | |
| Diluted earnings per share | $ | 2.95 | | | $ | 3.15 | | | $ | 1.35 | |
5. Inventories
Inventories are stated at the lower of cost or net realizable value, determined on the first in, first out (“FIFO”) basis. Manufacturing cost includes materials, labor and manufacturing overhead. Unallocated overhead and abnormal costs are expensed as incurred. Inventories consisted of the following:
| | | | | | | | | | | |
| | As of June 30, | | |
| 2020 | | 2019 |
| Raw materials | $ | 52,530 | | | $ | 45,910 | |
| Work in progress | 10,778 | | | 10,839 | |
| Finished goods | 9,638 | | | 11,019 | |
| Total inventories | $ | 72,946 | | | $ | 67,768 | |
6. Property, Plant, and Equipment
Property, plant, and equipment acquired outside of acquisition are stated at cost. When property, plant, and equipment is retired or otherwise disposed of, the related cost and accumulated depreciation is removed from the accounts and any resulting gain or loss is accounted for in the statement of operations and comprehensive income. Major additions are capitalized; maintenance, repairs and minor improvements are charged to operating expenses as incurred if they do not increase the life or productivity of the related capitalized asset. Depreciation on leasehold improvements is computed using the straight-line method based on the lesser of the remaining lease term or the estimated useful life and depreciation of equipment is computed using the straight-line method over the estimated useful life as follows:
| | | | | | | | |
| | Years |
| Building | | 20 |
| Leasehold improvements | | Shorter of useful life or lease term |
| Machinery and equipment | | 3-5 |
| Furniture and fixtures | | 3-5 |
The Company accounts for the impairment and disposition of long-lived assets in accordance with ASC Topic 360, Property, Plant, and Equipment. In accordance with ASC Topic 360, long-lived assets to be held are reviewed for events or changes in circumstances that indicate that their carrying value may not be recoverable. The Company periodically reviews for indicators and, if indicators are present, tests the carrying value of long-lived assets, assessing their net realizable values based
on estimated undiscounted cash flows over their remaining estimated useful lives. If the carrying amount of an asset exceeds its estimated undiscounted future cash flows, an impairment charge is measured as the amount by which the carrying amount of the asset exceeds the fair value of the asset, based on discounted cash flows. NaN impairment charges were recorded for the fiscal years ended June 30, 2020, 2019 and 2018 in the Company’s consolidated financial statement.
Property, plant, and equipment, net consisted of the following:
| | | | | | | | | | | |
| As of June 30, | | |
| | 2020 | | 2019 |
| Land | $ | 2,540 | | | $ | 2,194 | |
| Building and leasehold improvements | 54,318 | | | 28,957 | |
| Machinery and equipment | 55,831 | | | 46,618 | |
| Furniture and fixtures | 7,031 | | | 6,734 | |
| Construction in process | 10,470 | | | 9,764 | |
| 130,190 | | | 94,267 | |
| Less accumulated depreciation | (35,880) | | | (28,511) | |
| $ | 94,310 | | | $ | 65,756 | |
Depreciation expense was $12,249, $10,004 and $7,656 for the fiscal years ended June 30, 2020, 2019 and 2018, respectively, substantially all of which was recorded in cost of sales. During fiscal year 2020 the Company disposed of various assets with a net book value of $958 and recorded a loss of $61 related to these disposals. During fiscal year 2019, the Company disposed of various molds for models not currently in production with 0 net book value.
Sale-Leaseback Transaction
In March 2008, the Company sold its two2 primary manufacturing and office facilities for a total of $18,250, which resulted in a gain of $726. Expenses incurred related to the sale were $523. Simultaneous with the sale, the Company entered into an agreement to lease back the buildings for an initial term of 20 years. The net gain on this transaction of $203 hashad been deferred and is being amortized over the initial lease term. On July 1, 2019, as part of lease implementation under Topic 842 the Company recognized the unamortized portion of the gain on the sale leaseback of $89. For the fiscal years ended June 30, 2017, 20162019 and 2015,2018, the realized gain recognized was $10 and $10 and $7, respectively.
6.7. Goodwill and Other Intangible Assets
The changes in the carrying amount of goodwill for the fiscal yearyears ended June 30, 20172020 and 2019 were as follows: |
| | | |
| Goodwill as of June 30, 2015 | $ | 12,665 |
|
| Effect of foreign currency changes on goodwill | (195 | ) |
| Goodwill as of June 30, 2016 | 12,470 |
|
| Effect of foreign currency changes on goodwill | 222 |
|
| Goodwill as of June 30, 2017 | $ | 12,692 |
|
| | | | | |
| Goodwill as of June 30, 2018 | $ | 32,230 | |
| Addition related to the acquisition of Pursuit | 19,525 | |
| Effect of foreign currency changes on goodwill | (351) | |
| Goodwill as of June 30, 2019 | 51,404 | |
| |
| Effect of foreign currency changes on goodwill | (131) | |
| Goodwill as of June 30, 2020 | $ | 51,273 | |
The components of other intangible assets were as follows:
| | | | As of June 30, | | Estimated Useful Life (in years) | | Weighted Average Remaining Useful Life (in years) | | As of June 30, | | | Estimated Useful Life (in years) | | Weighted Average Remaining Useful Life (in years) |
| | 2017 | | 2016 | | | | 2020 | | 2019 | | | | |
| Reacquired franchise rights | $ | 1,383 |
| | $ | 1,339 |
| | 5 | | 2.3 | Reacquired franchise rights | $ | 0 | | | $ | 1,264 | | | 5 | | 0.0 |
| Dealer relationships | 29,852 |
| | 29,773 |
| | 8-15 | | 12.3 | Dealer relationships | 111,293 | | | 111,339 | | | 8-20 | | 17.3 |
| Patent | 1,386 |
| | 1,386 |
| | 12 | | 1.1 | Patent | 3,986 | | | 3,986 | | | 12-15 | | 12.0 |
| Trade name | 24,667 |
| | 24,667 |
| | 15 | | 4.2 | Trade name | 24,667 | | | 24,667 | | | 15 | | 1.4 |
| Non-compete agreement | 54 |
| | 52 |
| | 10 | | 7.3 | Non-compete agreement | 48 | | | 49 | | | 10 | | 4.3 |
| Backlog | 96 |
| | 93 |
| | 0.3 | | 0.0 | |
| | Total | 57,438 |
| | 57,310 |
| | Total | 139,994 | | | 141,305 | | |
| Less: Accumulated amortization | (47,841 | ) | | (45,607 | ) | | Less: Accumulated amortization | (63,602) | | | (58,744) | | |
| Total other intangible assets, net | $ | 9,597 |
| | $ | 11,703 |
| | |
| Total definite-lived intangible assets, net | | Total definite-lived intangible assets, net | 76,392 | | | 82,561 | | |
| Indefinite-lived intangible: | | Indefinite-lived intangible: | |
| Trade names | | Trade names | 63,500 | | | 63,500 | | |
| Total other intangible assets | | Total other intangible assets | $ | 139,892 | | | $ | 146,061 | | |
Amortization expense recognized on all amortizable intangibles was $2,198, $2,185$6,131, $5,956 and $2,463$5,198 for the fiscal years ended June 30, 2017, 20162020, 2019 and 2015,2018, respectively.
Estimated future amortization expenses as of June 30, 20172020 are as follows:
| | | | | | | | |
| Fiscal Year | | As of June 30, 2020 |
| 2021 | | $ | 6,054 | |
| 2022 | | 4,553 | |
| 2023 | | 4,417 | |
| 2024 | | 4,417 | |
| 2025 | | 4,413 | |
| Thereafter | | 52,538 | |
| | $ | 76,392 | |
8. Accrued Expenses
|
| | | | |
| Fiscal Year | | As of June 30, 2017 |
| 2018 | | $ | 2,206 |
|
| 2019 | | 1,909 |
|
| 2020 | | 1,814 |
|
| 2021 | | 1,814 |
|
| 2022 | | 366 |
|
| Thereafter | | 1,488 |
|
| | | $ | 9,597 |
|
| | | | | | | | | | | |
| As of June 30, | | |
| | 2020 | | 2019 |
| Warranties | $ | 27,500 | | | $ | 23,820 | |
| Dealer incentives | 7,777 | | | 7,394 | |
| Accrued compensation | 9,885 | | | 13,122 | |
| Current operating lease liabilities | 2,006 | | | — | |
| Accrued legal and professional fees | 1,055 | | | 740 | |
| Accrued interest | 0 | | | 161 | |
| Other accrued expenses | 2,262 | | | 3,860 | |
| Total accrued expenses | $ | 50,485 | | | $ | 49,097 | |
7.
9. Product Warranties
Effective for model year 2016, the Company began providingThe Company's Malibu and Axis brand boats have a limited warranty for a period up to five years. The Company's Cobalt brand boats have (1) a structural warranty of up to ten years which covers the hull, deck joints, bulkheads, floor, transom, stringers, and motor mount, and (2) a five year bow-to-stern warranty on all components manufactured or purchased (excluding hull and deck structural components), including canvas and upholstery. Gelcoat is covered up to three years for bothCobalt and one year for Malibu and AxisAxis. Pursuit brand boats. For model years prior to 2016, the Company providedboats have (1) a limited warranty for a period of up to threefive years for its Malibu brand boatson structural
components such as the hull, deck and defects in the gelcoat surface of the hull bottom and (2) a bow-to-stern warranty of two years (excluding hull and deck structural components). For each boat brand, there are certain materials, components or parts of the boat that are not covered by our warranty and certain components or parts that are separately warranted by the manufacturer or supplier (such as the engine). Engines that we manufacture for itsMalibu and Axis products. models have a limited warranty of up to five years or five-hundred hours.
The Company’s standard warranties require the Companyit or its dealers to repair or replace defective products during suchthe warranty period at no cost to the consumer. The CompanyCopmany estimates thewarranty costs that may be incurred under its basic limited warrantyit expects to incur and records asrecord a liability in the amount offor such costs at the time the product revenue is recognized. The Company utilizes historical claims trends and analytical tools to develop the estimate of its warranty obligation on a per boat basis, by brand and warranty year. Factors that affect the Company’s warranty liability include the number of units sold, historical and anticipated rates of warranty claims and cost per claim. The Company assesses the adequacy of its recorded warranty liabilities by brand on a quarterly basis and adjustsadjust the amounts as necessary. TheBeginning in model year 2016, the Company utilizesincreased the term of its limited warranty for Malibu brand boats from three years to five years and for Axis brand boats from two years to five years. Beginning in model year 2018, the Company increased the term of its bow-to-stern warranty for Cobalt brand boats from three years to five years. As a result of these changes, all of the Company’s Malibu, Axis and Cobalt brand boats with historical claims trendsexperience that are no longer covered under warranty had warranty terms shorter than the current warranty term of five years. Accordingly, the Company has little to no historical claims experience for warranty years four and analytical toolsfive, and as such, these estimates give rise to assista higher level of estimation uncertainty. Future warranty claims may differ from our estimate of the warranty liability, which could lead to changes in determining the appropriateCompany’s warranty liability.liability in future periods.
Changes in the Company’s product warranty liability, which are included in accrued expenses in the accompanying consolidated balance sheet, were as follows:
| | | | | | | | | | | | | | | | | | | | |
| | | Fiscal Year Ended June 30, | | | | |
| | 2020 | | 2019 | | 2018 |
| Beginning balance | | $ | 23,820 | | | $ | 17,217 | | | $ | 10,050 | |
| Add: Warranty Expense | | 14,339 | | | 12,331 | | | 9,861 | |
| Additions for Cobalt acquisition | | 0 | | | 0 | | | 4,404 | |
| Additions for Pursuit acquisition | | 0 | | | 1,872 | | | 0 | |
| Less: Warranty claims paid | | (10,659) | | | (7,600) | | | (7,098) | |
| Ending balance | | $ | 27,500 | | | $ | 23,820 | | | $ | 17,217 | |
|
| | | | | | | |
| | As of June 30, |
| | 2017 | | 2016 |
| Beginning balance | $ | 8,083 |
| | $ | 6,610 |
|
| Add: Warranty Expense | 6,472 |
| | 5,237 |
|
| Less: Warranty claims paid | (4,505 | ) | | (3,764 | ) |
| Ending balance | $ | 10,050 |
| | $ | 8,083 |
|
8.10. Financing
Outstanding debt consisted of the following:
| | | | | | | | | | As of June 30, | |
| | | As of June 30, | | | | 2020 | | 2019 |
| | | 2017 | | 2016 | |
| Term loan | | $ | 55,000 |
| | $ | 72,000 |
| Term loan | | | $ | 75,000 | | | $ | 75,000 | |
| Revolving credit loan | | Revolving credit loan | | | 8,800 | | | 40,000 | |
| Less unamortized debt issuance costs | | (1,597 | ) | | (914 | ) | Less unamortized debt issuance costs | | | (961) | | | (1,367) | |
| Total debt | | 53,403 |
| | 71,086 |
| Total debt | | | 82,839 | | | 113,633 | |
| Less current maturities | | — |
| | (8,000 | ) | Less current maturities | | | 0 | | | 0 | |
| Long term debt less current maturities | | $ | 53,403 |
| | $ | 63,086 |
| Long term debt less current maturities | | | $ | 82,839 | | | $ | 113,633 | |
Long-Term Debt
Previously Existing Credit Agreement.The Company currently has a revolving credit facility with borrowing capacity of up to $120,000 and a $75,000 term loan outstanding. As of June 30, 2020, the Company had $8,800 outstanding under its revolving credit facility and $1,185 in outstanding letters of credit. On April 2, 2015, Malibu Boats, LLC, asMarch 19, 2020, the borrower ("Borrower"), entered into aCompany elected to draw the then remaining available funds of $98,800 from the revolving credit agreement with a syndicate of banks led by SunTrust Bank that included afacility. In June 2020, the Company repaid $110,000 on the revolving credit facility. The revolving credit facility matures on July 1, 2024 and the term loan matures on July 1, 2022. The revolving credit facility and term loan are governed by a credit agreement (the “Previously Existing Credit“Credit Agreement”). The Previously Existing Credit Agreement was refinanced with Malibu Boats, LLC (“Boats LLC”) as the borrower and replaced withTruist Financial Corp. (previously known as SunTrust Bank), as the Second Amendedadministrative agent, swingline lender and Restated Credit Agreement entered between the LLC, the Borrower, certain subsidiaries of the Borrower, as guarantors, and a syndicate of banks led by SunTrust Bank (the “New Credit Agreement”), which is described further below. The proceeds from the Previously Existing Credit Agreement were used to repurchase the Company's Class A Common Stock and refinance amounts outstanding under the previously existing revolving credit facility with the sameissuing bank. The obligations of the BorrowerBoats LLC under the Amended and Restated Credit Agreement were guaranteed by its parent, Malibu Boats Holdings, LLC, and its subsidiaries, Malibu Boats Domestic International Sales Corp. and Malibu Australia Acquisition Corp. Malibu Boats, Inc. was not a party to the Prior Credit Agreement. The lending arrangements were required to beare guaranteed by the LLC, and, subject to certain exceptions, the present and future domestic subsidiaries of the BorrowerBoats LLC, and wereall such obligations are secured by substantially all of the assets of the LLC, Boats LLC and such subsidiary guarantors. Malibu Boats, Inc. is not a party to the Borrower, Malibu Domestic International Sales Corp., and thoseCredit Agreement.
The Previously Existing Credit Agreement was comprised of a $25,000 revolving commitment and a $80,000 term loan. Borrowings under the Previously Existing Credit Agreement accrued interest at a rate equal to either, at the Borrower's option, (i) the highest of the prime rate, the Federal Funds Rate plus 0.5%, or one-month LIBOR plus 1.00% (the “Base Rate”) or (ii) LIBOR, in each case plus an applicable margin ranging from 1.00% to 1.75% with respect to Base Rate borrowings and 2.00% to 2.75% with respect to LIBOR borrowings. The applicable margin was based upon the consolidated leverage ratio of the LLC and its subsidiaries calculated on a consolidated basis. The Borrower was also required to pay a commitment fee for the unused portion of the revolving credit facility, which ranged from 0.25% to 0.40%, per annum, depending on the LLC’s and its subsidiaries’ consolidated leverage ratio. At June 30, 2016 and 2015, the interest rate on the term loan was 2.96% and 2.77%, respectively, and the weighted average interest rate on the term loan was 2.83% for fiscal year 2016 and 3.08% for fiscal year 2015.
In connection with the Previously Existing Credit Agreement, the Company capitalized $1,224 in deferred financing costs. The unamortized balance as of June 30, 2017 for these costs was$671.
New Credit Agreement. On June 28, 2017, Malibu Boats, LLC as the borrower, entered into the New Credit Agreement. The New Credit Agreement provides the Borrower a term loan facility in an aggregate principal amount $160,000 ($55,000 of which was drawn on June 28, 2017 to refinance the loans under the New Credit Agreement and $105,000 of which was drawn on July 6, 2017 to fund the payment of the purchase price for the Cobalt Acquisition, as well as to pay certain fees and expenses related to entering into the New Credit Agreement) and a revolving credit facility of up to $35,000. Each of the term loans and the revolving credit facility are scheduled to mature, on July 1, 2022. The Borrower has the option to request lenders to increase the amount available under the revolving credit facility by, or obtain incremental term loans of, up to $50,000, subject to the terms of the New Credit Agreement and only if existing or new lenders choose to provide additional term or revolving commitments.
Borrowings under the New Credit Agreement bear interest at a rate equal to either, at the Borrower’sCompany's option, (i) the highest of the prime rate, the Federal Funds Rate plus 0.5%, or one-month LIBOR plus 1% (the “Base Rate”) or (ii) LIBOR, in each case plus an applicable margin ranging from 1.75%1.25% to 3.00%2.25% with respect to LIBOR borrowings and 0.75%0.25% to 2.00%1.25% with respect to Base Rate borrowings. The applicable margin will be based upon the consolidated leverage ratio of the LLC and its subsidiaries calculated on a consolidated basis. As of June 30, 2020, the interest rate on the Company’s term loan and revolving credit facility was 1.66%.The Borrower will also beCompany is required to pay a commitment fee for theany unused portion of the revolving credit facility and on the daily amount of the unused delayed draw term loan during the availability period, which will range from 0.25%0.20% to 0.50%0.40% per annum, depending on the LLC’s and its subsidiaries’ consolidated leverage ratio. As with the Previously Existing Credit Agreement, the Company is not a party to the New Credit Agreement, and the obligations of the Borrower under the Credit Agreement are guaranteed by the LLC, and, subject to certain exceptions, the present and future domestic subsidiaries of the Borrower, and all such obligations are secured by substantially all of the assets
of the LLC, the Borrower and such subsidiary guarantors pursuant to the Second Amended and Restated Security Agreement, by and among the Borrower, the LLC, the subsidiary guarantors, and SunTrust Bank, as administrative agent, dated as of June 28, 2017, and other collateral documents.
The New Credit Agreement permits prepayment of the new term loan facility and delayed draw term loan without any penalties. On August 17, 2017 the Company made a voluntary principal payment on the term loan in the amount of $50,000 with a portion of the net proceeds from its equity offering completed on August 14, 2017. The $55,000Company exercised its option to apply the prepayment in forward order to principal installments on its term loan through December 31, 2021 and a portion of the principal installments due on March 31, 2022. As a result, the term loan is subject to a quarterly installmentsinstallment of approximately $700 per quarter until$3,000 on March 31, 2019, then approximately $1,000 per quarter until June 30, 2021,2022 and approximately $1,400 per quarter through March 31, 2021. The $105,000 term loan is subject to quarterly installments of approximately $1,300 per quarter until March 31, 2019, then approximately $2,000 per quarter until June 30, 2021, and approximately $2,600 per quarter through March 31, 2022. Thethe balance of boththe term loansloan is due on the scheduled maturity date of July 1, 2022. The New Credit Agreement is also subject to prepayments from the net cash proceeds received by the BorrowerBoats LLC or any guarantors from certain asset sales and recovery events, subject to certain reinvestment rights, and from excess cash flow, subject to the terms and conditions of the New Credit Agreement.
As of June 30, 2020, the outstanding principal amount of the Company’s term loan and revolving credit facility was $83,800.
The New Credit Agreement contains certain customary representations and warranties, and notice requirements for the occurrence of specific events such as the occurrence of any event of default, or pending or threatened litigation. The New Credit Agreement also requires compliance with certain customary financial covenants, including a minimum ratio of EBITDA to fixed charges and a maximum ratio of total debt to EBITDA. The New Credit Agreement contains certain restrictive covenants, which, among other things, place limits on certain activities of the loan parties under the New Credit Agreement, such as the incurrence of additional indebtedness and additional liens on property and limit the future payment of dividends or distributions. For example, the New Credit Agreement generally prohibits the LLC, the BorrowerBoats LLC and the subsidiary guarantors from paying dividends or making distributions, including to the Company. The credit facility permits, however, (i) distributions based on a member’s allocated taxable income, (ii) distributions to fund payments that are required under the LLC’s tax receivable agreement, (iii) purchase of stock or stock options of the LLC from former officers, directors or employees of loan parties or payments pursuant to stock option and other benefit plans up to $2,000 in any fiscal year, and (iv) share repurchase payments up to $20,000$35,000 in any fiscal year subject to one-year carry forward and compliance with other financial covenants. In addition, the LLC may make dividends and distributions of up to $6,000$10,000 in any fiscal year, subject to compliance with other financial covenants.
In connection with entering into the New Credit Agreement, the Company capitalized $926$2,074 in deferred financing costs.costs during fiscal 2017. These costs, in addition to the unamortized balance from Previously Existing Credit Agreementrelated to costs associated with the Company's previous credit facility of $671, are being amortized over the term of the New Credit Agreement into interest expense using the effective interest method and presented as a direct offset to the total debt outstanding on the consolidated balance sheet.
As described above, the Company used proceeds from an offering on August 24, 2017 to repay $50,000 on its term loan under the Credit Agreement and exercised its option to apply the prepayment to principal installments through December 31, 2021, and a portion of principal installments due on March 31, 2022. Accordingly, no principal payments are required under the Credit Agreement until March 31, 2022, and as such, all borrowings as of June 30, 2020 and June 30, 2019, are reflected as noncurrent. The $50,000 repayment resulted in a write off of deferred financing costs of $829 in fiscal year 2018, which was included in amortization expense on the consolidated statement of operations and comprehensive income.
On May 8, 2019, the Company entered into the Second Incremental Facility Amendment and Second Amendment (the “Amendment”) to the Credit Agreement dated as of June 28, 2017. The Amendment converted $35,000 of the outstanding principal amount under the term loan to outstanding borrowings under the revolving credit facility, increased the borrowing capacity of the revolving credit facility by $35,000 and extended the maturity date of the revolving credit facility by two years to July 1, 2024. In connection with the Amendment, the Company wrote off $137 of deferred financing costs and capitalized an additional $370 of deferred financing cost related to insubstantial modification leaving an unamortized balance of $1,367 in deferred financing costs. These are being amortized into interest expense using the effective interest method and presented as a direct offset to the total debt outstanding on the consolidated balance sheet.
Covenant Compliance
As of June 30, 20172020 and 2016,2019, the Company was in compliance with the covenants contained in the New Credit Agreement and Previously Existing Credit Agreement, respectively.Agreement.
Interest Rate Swap
On July 1, 2015, the Company entered into a five year floating to fixed interest rate swap with an effective start date of July 1, 2015. The swap is based on a one-month LIBOR rate versus a 1.52% fixed rate on a notional value of $39,250, which under terms of the Previously Existing Credit Agreementpreviously existing credit agreement is equal to 50% of the outstanding balance of the term loan at the time of the swap arrangement. Under ASC Topic 815, Derivatives and Hedging, all derivative instruments are recorded on the consolidated balance sheets at fair value as either short term or long term assets or liabilities based on their anticipated settlement date. Refer to Fair Value Measurements in Note 11.14. The Company has elected not to designate its interest rate swap as a hedge; therefore, changes in the fair value of the derivative instrument are being recognized in earnings in the Company's consolidated statements of operations and comprehensive income. The swap matured on March 31, 2020. For the fiscal years endedyear ended June 30, 20172020 and 2016,2019, the Company recorded a gain of $912 andrecord a loss of $863,$68 and $350, respectively, for the change in fair value of the interest rate swap, which is included in interest expense in the consolidated statements of operations and comprehensive income.
9.11. Leases
The Company leases certain manufacturing facilities, warehouses, office space, land, and equipment. The Company determines if a contract is a lease or contains an embedded lease at the inception of the agreement. The Company recorded right-of-use assets, included in other assets on the balance sheet, totaling $16,142 as of July 1, 2019. Leases with an initial term of 12 months or less are not recorded on the balance sheet. The Company does not separate non-lease components from the lease components to which they relate, and instead accounts for each separate lease and non-lease component associated with that lease component as a single lease component for all underlying asset classes. The Company's lease liabilities do not include future lease payments related to options to extend or terminate lease agreements as it is not reasonably certain those options will be exercised. Lease expense recorded in the fiscal year ended June 30, 2020 under ASC Topic 842 was not materially different from lease expense that would have been recorded under the previous lease accounting standard.
Other information concerning the Company's operating leases accounted for under ASC Topic 842 is as follows (in thousands):
| | | | | | | | | | | | | | | | | | | | |
| Classification | | | | | | As of June 30, 2020 |
| Assets | | | | | | |
| Right-of-use assets | | Other assets | | | | $ | 14,315 | |
| | | | | | |
| Liabilities | | | | | | |
| Current operating lease liabilities | | Accrued expenses | | | | $ | 2,006 | |
| Long-term operating lease liabilities | | Other liabilities | | | | 14,013 | |
| Total lease liabilities | | | | | | $ | 16,019 | |
| | | | | | | | | | | | | | | | | | | | |
| Classification | | | | | | Fiscal Year Ended June 30, 2020 |
Operating lease costs (1) | | Cost of sales | | | | $ | 1,966 | |
| | Selling, general and administrative | | | | 863 | |
| | | | | | |
| Sublease income | | Other income (expense) | | | | 38 | |
| | | | | | |
| Cash paid for amounts included in the measurement of operating lease liabilities | | Cash flows from operating activities | | | | 2,606 | |
(1)Includes short-term leases, which are insignificant, and are not included in the lease liability.
The lease liability for operating leases that contain variable escalating rental payments with scheduled increases that are based on the lesser of a stated percentage increase or the cumulative increase in an index, are determined using the stated percentage increase.
The weighted average remaining lease term is 7.27 years. The weighted average discount rate determined based on the Company's incremental borrowing rate is 3.65%, as of June 30, 2020.
Future annual minimum lease payments for the following fiscal years as of June 30, 2020 are as follows:
| | | | | | | | |
| | | Amount |
| 2021 | | $ | 2,548 | |
| 2022 | | 2,391 | |
| 2023 | | 2,442 | |
| 2024 | | 2,570 | |
| 2025 | | 2,308 | |
| 2026 and thereafter | | 6,014 | |
| Total | | 18,273 | |
| Less imputed interest | | (2,254) | |
| Present value of lease liabilities | | $ | 16,019 | |
The following represents the Company's future minimum rental payments at June 30, 2019 for agreements classified as operating leases under ASC Topic 840:
| | | | | | | | |
| | | Amount |
| 2020 | | $ | 2,552 | |
| 2021 | | 2,541 | |
| 2022 | | 2,432 | |
| 2023 | | 2,489 | |
| 2024 | | 2,649 | |
| 2025 and thereafter | | 8,577 | |
| Total | | $ | 21,240 | |
12. Tax Receivable Agreement Liability
The Company has a Tax Receivable Agreement with the pre-IPO owners of the LLC that provides for the payment by the Company to the pre-IPO owners (or their permitted assignees) of 85% of the amount of the benefits, if any, that the Company is deemed to realize as a result of (i) increases in tax basis and (ii) certain other tax benefits related to the Company entering into the Tax Receivable Agreement, including those attributable to payments under the Tax Receivable Agreement. These contractual payment obligations are obligations of the Company and not of the LLC. The Company's Tax Receivable
Agreement liability was determined on an undiscounted basis in accordance with ASC 450, Contingencies, since the contractual payment obligations were deemed to be probable and reasonably estimable.
For purposes of the Tax Receivable Agreement, the benefit deemed realized by the Company will beis computed by comparing the actual income tax liability of the Company (calculated with certain assumptions) to the amount of such taxes that the Company would have been required to pay had there been no increase to the tax basis of the assets of the LLC as a result of the purchases or exchanges, and had the Company not entered into the Tax Receivable Agreement.
The following table reflects the changes to the Company's Tax Receivable Agreement liability: | | | | As of June 30, | | As of June 30, | |
| | 2017 | | 2016 | | 2020 | | 2019 |
| Beginning balance | $ | 93,750 |
| | $ | 96,470 |
| Beginning balance | $ | 53,754 | | | $ | 55,046 | |
| Additions (reductions) to tax receivable agreement: | | | | Additions (reductions) to tax receivable agreement: | |
| | Exchange of LLC Units for Class A Common Stock | 960 |
| | 111 |
| Exchange of LLC Units for Class A Common Stock | 1,041 | | | 2,676 | |
| Adjustment for change in estimated tax rate | (8,140 | ) | | — |
| Adjustment for change in estimated tax rate | (1,672) | | | (103) | |
| Payment under tax receivable agreement | (4,279 | ) | | (2,831 | ) | Payment under tax receivable agreement | (3,458) | | | (3,865) | |
| | 82,291 |
| | 93,750 |
| | 49,665 | | | 53,754 | |
| Less current portion under tax receivable agreement | (4,332 | ) | | (4,189 | ) | Less current portion under tax receivable agreement | (3,589) | | | (3,592) | |
| Ending balance | $ | 77,959 |
| | $ | 89,561 |
| Ending balance | $ | 46,076 | | | $ | 50,162 | |
The Tax Receivable Agreement further provides that, upon certain mergers, asset sales or other forms of business combinations or other changes of control, the Company (or its successor) would owe to the pre-IPO owners of the LLC a lump-sum payment equal to the present value of all forecasted future payments that would have otherwise been made under the Tax
Receivable Agreement that would be based on certain assumptions, including a deemed exchange of LLC Units and that the Company would have sufficient taxable income to fully utilize the deductions arising from the increased tax basis and other tax benefits related to entering into the Tax Receivable Agreement. The Company also is entitled to terminate the Tax Receivable Agreement, which, if terminated, would obligate the Company to make early termination payments to the pre-IPO owners of the LLC. In addition, a pre-IPO owner may elect to unilaterally terminate the Tax Receivable Agreement with respect to such pre-IPO owner, which would obligate the Company to pay to such existing owner certain payments for tax benefits received through the taxable year of the election.
DuringWhen estimating the fourth quarter of fiscal year end 2017, the state of Tennessee enacted tax legislation that provided for an alternative single sales apportionment formula for manufacturers, such as the LLC, that are engaged in qualifying activities within the state for the purpose of reducing their estimated future tax obligation in Tennessee. The Company intends to utilize the new apportionment formula, which will lower the estimatedexpected tax rate usedto use in computing its future tax obligations and, in turn, reduceorder to determine the future tax benefit expected to be realized byrecognized from the Company related toCompany’s increased tax basis from previous sales andas a result of exchanges of LLC Units by the pre-IPO owners. When estimatingowners of the expected reduction in taxes paid from the increased tax basis,LLC, the Company continuously monitors changes in theirits overall tax posture, including changes resulting from new legislation and changes as a result of new jurisdictions in tax legislation. The change inwhich the underlying tax-rate assumptions usedCompany is subject to estimate the Tax Receivable Agreement liability, resulted in a decrease in the Tax Receivable Agreement liability of $8,140 during the fourth quarter of fiscal year ended June 30, 2017, and is included in other income, net in the accompanying consolidated statements of operations and comprehensive income.tax.
As of June 30, 2017,2020 and 2019, the Company recorded deferred tax assets of $109,375$111,511 and $110,545, respectively, associated with basis differences in assets upon acquiring an interest in Malibu Boats Holdings, LLC and pursuant to making an election under Section 754 of the Internal Revenue Code of 1986 (the "Internal Revenue Code"), as amended. These basis differences are included in the overall partnership basis differences disclosed in Note 10.13. The aggregate Tax Receivable Agreement liability represents 85% of the tax benefits that the Company expects to receive in connection with the Section 754 election. In accordance with the Tax Receivable Agreement, the next annual payment is anticipated approximately 75 days after filing the federal tax return due by April 15, 2018.2021.
10.13. Income Taxes
Malibu Boats, Inc. is taxed as a C corporation for U.S. income tax purposes and is therefore subject to both federal and state taxation at a corporate level. The LLC continues to operate in the United States as a partnership for U.S. federal income tax purposes.
InIncome taxes are computed in accordance with ASC Topic 740, Income Taxes, income taxes are recognized forand reflect the amountnet tax effects of taxes payable for the current year and for the impact of deferred tax liabilities and assets, which represent future tax consequences of events that have been recognized differently intemporary differences between the financial statements than for tax purposes. Deferred taxreporting carrying amounts of assets and liabilities are established usingand the enacted statutorycorresponding income tax rates and are adjusted for any changes in such rates in the period of change. Therefore, tax expense andamounts. The Company has deferred tax assets and liabilities reflect such status. In November 2015, the FASB issued an update to their accounting guidance on income taxesand maintains valuation allowances where it is more likely than not that eliminated the requirement for companies to present deferred income tax assets and liabilities as current and noncurrent inall or a classified balance sheet. Instead, companies are required to classify allportion of deferred tax assets will not be realized. To the extent the Company determines that it will not realize the benefit of some or all of its deferred tax assets, such deferred tax assets will be adjusted through the Company’s provision for income taxes in the period in which this determination is made.
On December 22, 2017, the Tax Act was enacted which, among a number of its provisions, lowered the U.S. corporate tax rate from 35% to 21%, effective January 1, 2018. The Company's statutory tax rate for each of fiscal years 2020 and liabilities2019 was 21% as noncurrent.a result of the change in statutory rates. For fiscal year 2018, the Company recorded an increase to income tax expense of $44,500 for the remeasurement of deferred taxes on the enactment date and the deferred tax impact related to the reduction in the tax receivables agreement liability.
On March 27, 2020, the Coronavirus Aid, Relief, and Economic Security Act (CARES Act) was signed into law. The CARES Act contains significant business tax provisions, including modifications to the rules limiting the deductibility of net operating losses (NOLs), expensing of qualified improvement property (QIP) and business interest in Internal Revenue Code Sections 172(a) and 163(j), respectively. The effects of the new legislation are recognized upon enactment. The Company early adopted this guidance as of the beginning of the fourth quarter ofdid not recognize any significant impact to income tax expense for fiscal year 2016 on a retrospective basis. The application resulted in a reclassification of $629 for2020 relating to the fiscal year ended June 30, 2016 from current deferred tax asset to noncurrent on the consolidated balance sheet.CARES Act.
The components of provision for income taxes are as follows:
| | | | Fiscal Year Ended June 30, | | Fiscal Year Ended June 30, | |
| | 2017 | | 2016 | | 2015 | | 2020 | | 2019 | | 2018 |
| Current tax expense: | | | | | | Current tax expense: | | | | | |
| Federal | $ | 6,094 |
| | $ | 5,372 |
| | $ | 205 |
| Federal | $ | 8,062 | | | $ | 11,240 | | | $ | 10,111 | |
| State | 1,134 |
| | 902 |
| | 95 |
| State | 1,979 | | | 3,368 | | | 1,758 | |
| Foreign | 788 |
| | 351 |
| | 430 |
| Foreign | 378 | | | 725 | | | 756 | |
| Total Current | 8,016 |
| | 6,625 |
| | 730 |
| |
| Total current | | Total current | 10,419 | | | 15,333 | | | 12,625 | |
| Deferred tax expense: | | | | | | Deferred tax expense: | | | | | |
| Federal | 9,132 |
| | 4,886 |
| | 8,208 |
| Federal | 7,849 | | | 5,336 | | | 51,358 | |
| State | 615 |
| | 458 |
| | (49 | ) | State | 917 | | | 1,609 | | | (5,369) | |
| Foreign | (170 | ) | | (168 | ) | | (226 | ) | Foreign | (109) | | | (182) | | | (196) | |
| Total Deferred | 9,577 |
| | 5,176 |
| | 7,933 |
| |
| Total deferred | | Total deferred | 8,657 | | | 6,763 | | | 45,793 | |
| Income tax expense | $ | 17,593 |
| | $ | 11,801 |
| | $ | 8,663 |
| Income tax expense | $ | 19,076 | | | $ | 22,096 | | | $ | 58,418 | |
The income tax expense differs from the amount computed by applying the federal statutory income tax rate to income from continuing operations before income taxes. The sources and tax effects of the differences are as follows: | | | | Fiscal Year Ended June 30, | | Fiscal Year Ended June 30, | |
| | 2017 | | 2016 | | 2015 | | 2020 | | | 2019 | | 2018 |
| Federal tax provision at statutory rate | 35.0 | % | | 35.0 | % | | 35.0 | % | Federal tax provision at statutory rate | 21.0 | % | | | 21.0 | % | | 28.0 | % |
| Change in federal statutory rate | | Change in federal statutory rate | 0 | | | | 0 | | | 36.2 | |
| State income taxes, net of federal benefit | 3.4 |
| | 3.2 |
| | 0.1 |
| State income taxes, net of federal benefit | 2.9 | | | | 4.4 | | | 3.9 | |
| Permanent differences attributable to partnership investment | 0.4 |
| | (0.4 | ) | | 1.6 |
| Permanent differences attributable to partnership investment | (0.2) | | | | (0.8) | | | (0.1) | |
| Section 199 deductions | (1.4 | ) | | — |
| | — |
| Section 199 deductions | 0 | | | | 0 | | | (1.2) | |
| Non-controlling interest | (1.9 | ) | | (2.5 | ) | | (9.8 | ) | Non-controlling interest | (0.9) | | | | (0.9) | | | (1.0) | |
| Change in valuation allowance | 1.1 |
| | 1.3 |
| | — |
| Change in valuation allowance | 0 | | | | 0 | | | (0.4) | |
| Other, net | (0.4 | ) | | 0.2 |
| | 0.3 |
| Other, net | 0 | | | | 0.4 | | | 0 | |
| Total income tax expense on continuing operations | 36.2 | % | | 36.8 | % | | 27.2 | % | Total income tax expense on continuing operations | 22.8 | % | | | 24.1 | % | | 65.4 | % |
The Company’s effective tax rate includes a rate benefit attributable to the fact that the Company’s subsidiary operated as a limited liability company which was not subject to federal income tax. Accordingly, the portion of the Company’s subsidiary earnings attributable to the non-controlling interest are subject to tax when reported as a component of the non-controlling interests’ taxable income.
The components of the Company's net deferred income tax assets and liabilities at June 30, 20172020 and 20162019 are as follows:
| | | | As of June 30, | | As of June 30, | |
| | 2017 | | 2016 | | 2020 | | 2019 |
| Deferred tax assets: | | | | Deferred tax assets: | | | |
| Litigation accrual | $ | — |
| | $ | 89 |
| |
| | Partnership basis differences | 115,599 |
| | 123,738 |
| Partnership basis differences | $ | 61,650 | | | $ | 69,632 | |
| Fixed assets and intangibles | 8 |
| | 58 |
| |
| | Accrued liabilities and reserves | 348 |
| | 546 |
| Accrued liabilities and reserves | 496 | | | 428 | |
| State tax credits and NOLs | 1,712 |
| | 1,059 |
| State tax credits and NOLs | 5,004 | | | 3,902 | |
| Foreign tax credits | | Foreign tax credits | 580 | | | 761 | |
| Acquisition costs | 10 |
| | — |
| Acquisition costs | 0 | | | 6 | |
| Other | 51 |
| | 99 |
| Other | 275 | | | 337 | |
| Less valuation allowance | (10,324 | ) | | (9,700 | ) | Less valuation allowance | (14,582) | | | (14,252) | |
| Total deferred tax assets | 107,404 |
| | 115,889 |
| Total deferred tax assets | 53,423 | | | 60,814 | |
| Deferred tax liabilities: | | | | Deferred tax liabilities: | |
| | Fixed assets and intangibles | 850 |
| | 941 |
| Fixed assets and intangibles | 467 | | | 545 | |
| Other | 18 |
| | 39 |
| Other | 35 | | | 7 | |
| Total deferred tax liabilities | 868 |
| | 980 |
| Total deferred tax liabilities | 502 | | | 552 | |
| Total net deferred tax assets | $ | 106,536 |
| | $ | 114,909 |
| Total net deferred tax assets | $ | 52,921 | | | $ | 60,262 | |
On an annual basis, the Company performs a comprehensive analysis of all forms of positive and negative evidence to determine whether realizability of deferred tax assets is more likely than not. During each interim period, the Company updates its annual analysis for significant changes in the positive and negative evidence. At June 30, 20172020 and 2016,2019, the Company concluded that $10,324$14,582 and $9,700,$14,252, respectively, of valuation allowance against deferred tax assets was necessary. The additional valuation allowance recorded at June 30, 2017 is due to a portion of the outside basis in the LLC not expected to be realized as a result of certain partnership deductions being limited under Internal Revenue Code Section 704. The Company continues to record the valuation allowance on state net operating losses generated by current and future amortization deductions (with respect to the Section 754 election) that are reported in the Tennessee corporate tax return without offsetting income, which is taxable at the LLC. These net operating losses have a 15 year carryover and will expire, if unused, between 2030 and 2035. This also includes a valuation allowance in the amount of $580 related to foreign tax credit carryforward that is not expected to be utilized in the future.
Unrecognized tax benefits are discussed in the Company's accounting policy for income taxes (Refer to Note 1 on Income Taxes for more information). The Company has filed federal and state income tax returns that remain open to examination for fiscal years 20142017 through 2016,2019, while its subsidiaries, Malibu Boats Holdings, LLC and Malibu Boats Pty Ltd., remain open to examination for fiscal years 20132016 through 2016. 2019. The Company is currently undergoing anclosed the IRS examination of its June 30, 2015 return which began induring the fourth quarter of fiscal 2017.year 2019, resulting in an immaterial adjustment to its tax liability.
A reconciliation of changes in the amount of unrecognized tax benefits for the fiscal years ended June 30, 2017, 2016 and 20152020, 2019, 2018 is as follows: | | | | Fiscal Year Ended June 30, | | Fiscal Year Ended June 30, | |
| | 2017 | | 2016 | | 2015 | | 2020 | | 2019 | | 2018 |
| Balance as of July 1 | $ | 66 |
|
| $ | 66 |
| | $ | — |
| Balance as of July 1 | $ | 1,401 | | | $ | 329 | | | $ | 113 | |
| Additions based on tax positions taken during the current period | 47 |
| | — |
| | 4 |
| Additions based on tax positions taken during the current period | 314 | | | 1,216 | | | 216 | |
| Additions based on tax positions taken during a prior period | — |
| | — |
| | 62 |
| |
| Reductions for settlements with taxing authorities | | Reductions for settlements with taxing authorities | (93) | | | (144) | | | 0 | |
| Reductions due to statute settlements | | Reductions due to statute settlements | (64) | | | 0 | | | 0 | |
| Reductions for tax positions of prior years | | Reductions for tax positions of prior years | (113) | | | 0 | | | 0 | |
| Balance as of June 30 | $ | 113 |
| | $ | 66 |
| | $ | 66 |
| Balance as of June 30 | $ | 1,445 | | | $ | 1,401 | | | $ | 329 | |
In fiscal year 2015,2020, the Company recorded $62 and $4settled $93 related to its state tax filing positions. Also in fiscal year 2020, the Company reduced its uncertain tax positions $92 as a result of a method change filed in connection with uncertain tax positions taken by Malibu Boats Pty Ltd.inventory subject to Internal Revenue Code Sec. 263A, and recorded $203 in prior fiscal years and the fiscalconnection with its current year 2015, respectively, that would be payable by the Company if settled with the relevant tax authority.state filing positions. As of June 30, 2017,2020, it is reasonably possible that none$307 of the total unrecognized tax benefits recorded will reverse within the next 12twelve months. Of the total unrecognized tax benefits recorded on the balance sheet, $113$1,226 would impact the effective tax rate once settled.
As discussed in Note 1 to the Consolidated Financial Statements, our policy is to accrue interest related to potential underpayment of income taxes within the provision for income taxes. At June 30, 2020, we had $231 of accrued interest related to unrecognized tax benefits.
The Company did not provide for U.S. federal, state income taxes or foreign withholding taxes in fiscal year 20172020 on approximately $2,641 of undistributed earningsthe outside basis difference of its non-U.S. subsidiary, as such foreign earnings were intendedare considered to be reinvested indefinitely.permanently reinvested. The estimated income and withholding tax liability associated with the remittance of these earnings is nominal.
11.14. Fair Value Measurements
In determining the fair value of certain assets and liabilities, the Company employs a fair value hierarchy that prioritizes the inputs to valuation techniques used to measure fair value. As defined in ASC Topic 820, Fair Value Measurements and Disclosures, fair value is the amount that would be received to sell an asset or paid to transfer a liability in an orderly transaction between market participants at the measurement date (i.e., the exit price). Financial assets and financial liabilities recorded on the consolidated balance sheets at fair value are categorized based on the reliability of inputs to the valuation techniques as follows:
•Level 1—Financial assets and financial liabilities whose values are based on unadjusted quoted prices in active markets for identical assets.
•Level 2—Financial assets and financial liabilities whose values are based on quoted prices for similar assets or liabilities in active markets; quoted prices for identical or similar assets or liabilities in non-active markets; or valuation models whose inputs are observable, directly or indirectly, for substantially the full term of the asset or liability.
•Level 3—Financial assets and financial liabilities whose values are based on prices or valuation techniques that require inputs that are both unobservable and significant to the overall fair value measurement. These inputs reflect the Company’s estimates of the assumptions that market participants would use in valuing the financial assets and financial liabilities.
The hierarchy gives the highest priority to Level 1 inputs and the lowest priority to Level 3 inputs. In certain cases, the inputs used to measure fair value may fall into different levels of the fair value hierarchy. In such cases, the level in the fair value hierarchy within which the fair value measurement in its entirety falls has been determined based on the lowest level input that is significant to the fair value measurement in its entirety. The Company’s assessment of the significance of a particular input to the fair value measurement in its entirety requires judgment and considers factors specific to the asset or liability.
Assets and liabilities that had recurring fair value measurements as of June 30, 20172020 and 20162019 were as follows:
| | | | | | | | | | | | | | | | | | | | | | | |
| | Fair Value Measurements at Reporting Date Using | | | | | | |
| | Total | | Quoted Prices
in Active
Markets for
Identical Assets
(Level 1) | | Significant
Other
Observable
Inputs
(Level 2) | | Significant
Unobservable
Inputs
(Level 3) |
| As of June 30, 2020: | | | | | | | |
| | | | | | | |
| Interest rate swap not designated as cash flow hedge | $ | 0 | | | $ | 0 | | | $ | 0 | | | $ | 0 | |
| Total assets at fair value | $ | 0 | | | $ | 0 | | | $ | 0 | | | $ | 0 | |
| | | | | | | |
| As of June 30, 2019: | | | | | | | |
| Interest rate swap not designated as cash flow hedge | $ | 68 | | | $ | 0 | | | $ | 68 | | | $ | 0 | |
| | | | | | | |
| | | | | | | |
| Total liabilities at fair value | $ | 68 | | | $ | 0 | | | $ | 68 | | | $ | 0 | |
|
| | | | | | | | | | | | | | | |
| | Fair Value Measurements at Reporting Date Using |
| | Total | | Quoted Prices in Active Markets for Identical Assets (Level 1) | | Significant Other Observable Inputs (Level 2) | | Significant Unobservable Inputs (Level 3) |
| As of June 30, 2017: | | | | | | | |
| Interest rate swap not designated as cash flow hedge | $ | 49 |
| | $ | — |
| | $ | 49 |
| | $ | — |
|
| Total assets at fair value | $ | 49 |
| | $ | — |
| | $ | 49 |
| | $ | — |
|
| | | | | | | | |
| As of June 30, 2016: | | | | | | | |
| Interest rate swap not designated as cash flow hedge | $ | 863 |
| | $ | — |
| | $ | 863 |
| | $ | — |
|
| Total liabilities at fair value | $ | 863 |
| | $ | — |
| | $ | 863 |
| | $ | — |
|
Fair value measurement for the Company's interest rate swap are classified under Level 2 because such measurements are based on significant other observable inputs. There were no transfers of assets or liabilities between Level 1 and Level 2 as of June 30, 20172020 or 2016,2019, respectively.
The Company’s nonfinancial assets and liabilities that have nonrecurring fair value measurements include property, plant and equipment, goodwill and intangibles.
In assessing the need for goodwill impairment, management relies on a number of factors, including operating results, business plans, economic projections, anticipated future cash flows, transactions and marketplace data. Accordingly, these fair value measurements fall in Level 3 of the fair value hierarchy. The Company generally uses projected cash flows, discounted as necessary, to estimate the fair values of property, plant and equipment and intangibles using key inputs such as management’s
projections of cash flows on a held-and-used basis (if applicable), management’s projections of cash flows upon disposition and discount rates. Accordingly, these fair value measurements fall in Level 3 of the fair value hierarchy. These assets and certain liabilities are measured at fair value on a nonrecurring basis as part of the Company’s impairment assessments and as circumstances require.
There were no0 impairments recorded in connection with tangible and intangible long-lived assets for fiscal years ended June 30, 2017, 20162020, 2019 or 2015,2018, respectively.
12.15. Stockholders' Equity
The Company is authorized to issue 150,000,000 shares of capital stock, consisting of 100,000,000 shares of Class A Common Stock, 25,000,000 shares of Class B Common Stock, and 25,000,000 shares of Preferred Stock, par value $0.01 per share.
Offerings
Follow-on Offering
On July 15, 2014,August 14, 2017, the Company completed the follow-onan offering of 5,520,0002,300,000 shares of Class A Common Stock that were issued and sold by the Company at a price to the public of $18.50$24.05 per share of which 4,371,893 shares were issued and sold by the Company and 1,148,107 shares were sold by selling stockholders (the "Follow-On Offering""Offering"). This included 538,252300,000 shares issued and sold by the Company and 181,748 shares sold by selling stockholders pursuant to the over-allotment option granted to the underwriters, which was exercised concurrently with the closing of the Follow-on Offering.
The aggregate gross proceeds from the Follow-on Offering was $102,120.$58,075. Of these proceeds, the Company received $76,836 and the selling stockholders received $20,178,$55,317 after deducting $5,106$2,758 in underwriting discounts and commissions. AllOf the net proceeds received from the Follow-on Offering, $50,000 was used to repay amounts outstanding on its loans under the Credit Agreement (Refer to Note 10). The remaining net proceeds were used to purchase LLC Units directly from the holders of LLC Units.for general working capital purposes.
Tender Offer
On March 13, 2015, Malibu Boats, Inc. commenced an offer to purchase up to $70,000 in value of shares of its Class A Common Stock, including shares of Class A Common Stock issued upon exchange of LLC Units, for cash by means of a “modified Dutch auction” tender offer (the "Tender Offer"). Pursuant to the Tender Offer, holders could tender all or a portion of their shares of Class A Common Stock (1) at a price specified by the tendering stockholder of not less than $21.00 and not more than $23.50 per share of Class A Common Stock, or (2) without specifying a purchase price, in which case their shares of Class A Common Stock would be purchased at the purchase price determined in accordance with the terms of the Tender Offer. Upon completion of the Tender Offer, on April 15, 2015, the Company purchased 3,333,333 shares of Class A Common Stock, including 2,602,923 Class A Common Stock issued upon the exchange of LLC Units, at a purchase price of $21.00 per share for an aggregate purchase price of approximately $70,000, excluding related fees and expenses of approximately $1,523 related to the Tender Offer. Upon the repurchase, 3,333,333 shares were classified as treasury stock and then subsequently retired.
Secondary Offering
On May 27, 2015, the Company completed the secondary offering of 3,996,255 shares of its Class A Common Stock (the "Secondary Offering"), including 2,967,267 shares of Class A Common Stock that were issued upon exchange of LLC Units, at a price to the public of $19.05 per share, after deducting underwriters discounts and commissions, all of which were sold by selling stockholders. In addition, this included 521,250 shares issued and sold by selling stockholders pursuant to the over-allotment option granted to the underwriters, which was exercised concurrently with the closing of the Secondary Offering. The Company did not sell any shares of Common Stock in the public offering and did not receive any proceeds.
Pursuant to the Company’s Certificate of Incorporation, on May 21, 2015 in connection with the exchangesExchange of LLC Units for Class A Common Stock 19
During fiscal year 2018, 11 non-controlling LLC Unit holders exchanged LLC Units for the issuance of Class A Common Stock. In connection with the exchange, 1 share of Class B Common Stock was automatically transferred to the Company and retired. As of June 30, 2018, the Company had a total of 17 shares of its Class B Common Stock issued and outstanding.
During fiscal year 2019, 5 non-controlling LLC Unit holders exchanged LLC Units for the issuance of Class A Common Stock. In connection with the exchange, 2 shares of Class B Common Stock was automatically transferred to the Company and retired. As of June 30, 2019, the Company had a total of 15 shares of its Class B Common Stock issued and outstanding.
During fiscal year 2020, 4 non-controlling LLC Unit holders exchanged LLC Units for the issuance of Class A Common Stock. In connection with the exchange, 0 shares of Class B Common Stock were automatically transferred to the Company and retired. As of June 30, 2015,2020, the Company had a total of 24 shares of its Class B Common Stock issued and outstanding.
Exchange of LLC Units for Class A Common Stock
During fiscal year 2016, a non-controlling LLC Unit holder exchanged LLC Units for the issuance of Class A Common Stock. In connection with the exchange, one share of Class B Common Stock was automatically transferred to the Company and retired. As of June 30, 2016, the Company had a total of 23 shares of its Class B Common Stock issued and outstanding.
During fiscal year 2017, four non-controlling LLC Unit holder exchanged LLC Units for the issuance of Class A Common Stock. In connection with the exchange, one share of Class B Common Stock was automatically transferred to the Company and retired. As of June 30, 2017, the Company had a total of 1915 shares of its Class B Common Stock issued and outstanding.
Stock Repurchase Program
On February 1, 2016,June 18, 2019, the board of directors of the Company authorized a stock repurchase program to allow for the repurchase of up to $15,000$35,000 of the Company’s Class A Common Stock and the LLC's LLC Unitsunits for the period from February 8, 2016July 1, 2019 to February 8, 2017July 1, 2020 (the "Repurchase Program"“Repurchase Program”).
Under the Repurchase Program, the Company couldmay repurchase its Class A Common Stock and the LLC's LLC Units at any time or from time to time, without prior notice, subject to market conditions and other considerations. The Company’s repurchases couldmay be made through 10b5-1 plans, open market purchases, privately negotiated transactions, block purchases or other transactions. The Company fundedintends to fund repurchases under the Repurchase Program from cash on hand. In accordance with the LLC Agreement, in connection with any repurchases by the Company under the Repurchase Program, the LLC must redeem an equal number of LLC Units held by the Company as shares of Class A Common Stock repurchased by the Company at a redemption price equal to the redemption price paid for the Class A Common Stock repurchased by the Company. The Company hadhas no obligation to repurchase any shares under the Repurchase Program and couldmay suspend or discontinue it at any time.
During the fiscal year 2016, the Company purchased 287,346ended June 30, 2020, we repurchased 483,679 shares of Class A Common Stock at an average stock price of $13.82 per share for an aggregate purchase price of approximately $3,981$13.8 million in cash including related fees and expenses. Upon repurchase, these shares were classified as treasury stock and then subsequently retired. In addition, as noted above, 287,346 LLC Units held byDuring the Company were redeemed and canceled by the LLC. During fiscal year 2017, no additionalended June 30, 2019, 0 shares were repurchased under the program.existing Repurchase Program. The program expired on July 1, 2020.
On August 27, 2020, our Board of Directors authorized a new stock repurchase program (the "New Repurchase Program") for the repurchase of up to $50,000 of Class A Common Stock and the LLC Units for the period from September 2, 2020 to July 1, 2021. No shares have been repurchased under the New Repurchase Program.
Class A Common Stock and Class B Common Stock
Voting Rights
Holders of Class A Common Stock and Class B Common Stock will have voting power over Malibu Boats, Inc., the sole managing member of the LLC, at a level that is consistent with their overall equity ownership of the Company's business. Pursuant to the Company's certificate of incorporation and bylaws, each share of Class A Common Stock entitles the holder to one1 vote with respect to each matter presented to the Company's stockholders on which the holders of Class A Common Stock are entitled to vote. Each holder of Class B Common Stock shall be entitled to the number of votes equal to the total number of LLC Units held by such holder multiplied by the exchange rate specified in the Exchange Agreement with respect to each matter presented to the Company's stockholders on which the holders of Class B Common Stock are entitled to vote. Accordingly, the holders of LLC Units collectively have a number of votes that is equal to the aggregate number of LLC Units that they hold. Subject to any rights that may be applicable to any then outstanding preferred stock, the Company's Class A and Class B Common Stock vote as a single class on all matters presented to the Company's stockholders for their vote or approval, except as otherwise provided in the Company's certificate of incorporation or bylaws or required by applicable law. Holders of the Company's Class A and Class B Common Stock do not have cumulative voting rights. Except in respect of matters relating to the election and removal of directors on the Company's board of directors and as otherwise provided in the Company's certificate of incorporation, the Company's bylaws, or as required by law, all matters to be voted on by the Company's stockholders must be approved by a majority of the shares present in person or by proxy at the meeting and entitled to vote on the subject matter.
Equity Consideration
On October 23, 2014,July 6, 2017, in connection with the acquisition of the Australian licensee,Cobalt, the Company issued 170,88939,262 shares of Class A Common Stock to the William Paxson St. Clair, Jr., a former owner of Malibu Boats Pty. Ltd.Cobalt, as equity consideration. Refer to Note 34 for more information on the acquisition.
Dividends
Subject to preferences that may apply to any shares of preferred stock outstanding at the time, the holders of the Company's Class A Common Stock will be entitled to share equally, identically and ratably in any dividends that the board of directors may determine to issue from time to time. Holders of the Company's Class B Common Stock do not have any right to receive dividends.
Liquidation Rights
In the event of any voluntary or involuntary liquidation, dissolution or winding up of our affairs, holders of the Company's Class A Common Stock would be entitled to share ratably in the Company's assets that are legally available for distribution to stockholders after payment of its debts and other liabilities. If the Company has any preferred stock outstanding at such time, holders of the preferred stock may be entitled to distribution and/or liquidation preferences. In either such case, the Company must pay the applicable distribution to the holders of its preferred stock before it may pay distributions to the holders of its
Class A Common Stock. Holders of the Company Class B Common Stock do not have any right to receive a distribution upon a voluntary or involuntary liquidation, dissolution or winding up of the Company's affairs.
Other Rights
Holders of the Company's Class A Common Stock will have no preemptive, conversion or other rights to subscribe for additional shares. The rights, preferences and privileges of the holders of the Company's Class A Common Stock will be subject to, and may be adversely affected by, the rights of the holders of shares of any series of the Company's preferred stock that the Company may designate and issue in the future.
Preferred Stock
Though the Company currently has no plans to issue any shares of preferred stock, its board of directors has the authority, without further action by the Company's stockholders, to designate and issue up to 25,000,000 shares of preferred stock in one or more series. The Company's board of directors may also designate the rights, preferences and privileges of the holders of each such series of preferred stock, any or all of which may be greater than or senior to those granted to the holders of common stock. Though the actual effect of any such issuance on the rights of the holders of common stock will not be known until the
Company's board of directors determines the specific rights of the holders of preferred stock, the potential effects of such an issuance include:
•diluting the voting power of the holders of common stock;
•reducing the likelihood that holders of common stock will receive dividend payments;
•reducing the likelihood that holders of common stock will receive payments in the event of the Company's liquidation, dissolution, or winding up; and
•delaying, deterring or preventing a change-in-control or other corporate takeover.
LLC Units
In connection with the recapitalization we completed in connection with our IPO, the LLC Agreement was amended and restated to, among other things; modify its capital structure by replacing the different classes of interests previously held by the LLC unit holders to a single new class of units called “LLC Units.” As a result of our IPO and the recapitalization we completed in connection with our IPO, the Company holds LLC Units in the LLC and is the sole managing member of the LLC. Holders of LLC Units do not have voting rights under the LLC Agreement.
Further, the LLC and the pre-IPO owners entered into the Exchange Agreement under which (subject to the terms of the Exchange Agreement) they have the right to exchange their LLC Units for shares of the Company's Class A Common Stock on a one-for-one1-for-one basis, subject to customary conversion rate adjustments for stock splits, stock dividends and reclassifications, or at the Company's option, except in the event of a change in control, for a cash payment equal to the market value of the Class A Common Stock. As of June 30, 2017,2020, the Company held 17,937,68720,595,969 LLC Units, representing a 93.4%96.6% economic interest in the LLC, while non-controlling LLC Unit holders held 1,260,627730,652 LLC Units, representing a 6.6%3.4% interest in the LLC. Refer to Note 23 for additional information on non-controlling interest.
As discussed in Note 2,3, net profits and net losses of the LLC will generally be allocated to the LLC’s members (including the Company) pro rata in accordance with the percentages of their respective limited liability company interests. The LLC Agreement provides for cash distributions to the holders of LLC Units if the Company determines that the taxable income of the LLC will give rise to taxable income for its members. In accordance with the LLC Agreement, the Company intends to cause the LLC to make cash distributions to holders of LLC Units for purposes of funding their tax obligations in respect of the income of the LLC that is allocated to them.
13.16. Stock-Based Compensation
Equity Awards Issued Under the Malibu Boats, Inc. Long-Term Incentive Plan
On January 6, 2014, the Company’s board of directors adopted the Malibu Boats, Inc. Incentive Plan. The Incentive Plan, which became effective on January 1, 2014, reserves for issuance up to 1,700,000 shares of Malibu Boats, Inc. Class A Common Stock for the Company’s employees, consultants, members of its board of directors and other independent contractors at the discretion of the compensation committee. Incentive stock awards authorized under the Incentive Plan including unrestricted shares of Class A Common Stock, stock options, SARs, restricted stock, restricted stock units, dividend equivalent
awards and performance awards. As of June 30, 2017,2020, there were 1,125,257 713,346shares available for future issuance under the Incentive Plan.
On May 16, 2015,November 6, 2017, the Company granted 12,05078,900 restricted stock unit awards to key employees under the Incentive Plan with a grant date fair value of $20.67 per unit. On June 27, 2014, the Company granted 46,250 restricted stock unit awards to key employees under the Incentive Plan with a grant date fair value of $20.03 per unit. Under the terms of the agreements, the awards will vest 25% ratably on each anniversary of their grant date. Stock-based compensation expense attributable to these restricted stock units is amortized on a straight-line basis over the requisite service period.
On November 6, 2015, the Company granted 130,564 restricted stock unit and restricted stock awards to certain key employees. The grant date fair value of these awards was $1,994$2,436 based on a stock price of $15.27$30.87 per share on the date of grant. Under the terms of the agreements, approximately 12%72% of the awards vested immediately on the grant date, approximately 38% vest in substantially equal annual installments over a three or four year period, and the remaining 28% of the awards vest in tranches based on the achievement of annual performance targets. Compensation costs associated with performance based awards are recognized over the requisite service period based on probability of achievement.
On November 6, 2017, the Company granted 40,000 options to certain key employees to purchase from the Company shares of Class A Common Stock at a price of $30.87 per share. The term of the options commenced on November 6, 2017 and will expire on November 5, 2023, the day before the sixth anniversary of the grant date. Under the terms of the agreements, approximately 50% of the awards will vest ratably over four years on each anniversary of their grant date and approximately 50% of the awards will vest in tranches based on the achievement of annual or cumulative performance targets. At November 6, 2017, the fair value of the option awards was $405 and is estimated using the Black-Scholes option-pricing model with the following assumptions: risk-free rate of 2.0%, expected volatility of 37.1%, expected term of 4.25 years, and 0 dividends. Stock-based compensation expense attributable to the time based options is amortized on a straight-line basis over the requisite
service period. Compensation costs associated with performance based option awards are recognized over the requisite service period based on probability of achievement.
On August 22, 2018, the Company granted 50,000 options to certain key employees to purchase from the Company shares of Class A Common Stock at a price of $42.13 per share. The term of the options commenced on August 22, 2018 and will expire on August 21, 2024, the day before the sixth anniversary of the grant date. Under the terms of the agreements, the awards will vest ratably over four years on each anniversary of their grant date. At August 22, 2018, the fair value of the option awards was $733 and was estimated using the Black-Scholes option-pricing model with the following assumptions: risk-free rate of 2.7%, expected volatility of 38.4%, expected term of 4.25 years, and 0 dividends. Stock-based compensation expense attributable to the service based options is amortized on a straight-line basis over the requisite service period. Compensation costs associated with performance based option awards are recognized over the requisite service period based on probability of achievement in accordance with ASC Topic 718, Compensation—Stock Compensation.
On November 1, 2018, the Company granted 35,000 restricted stock units and 48,000 restricted stock awards to key employees under the Incentive Plan. The grant date fair value of these awards was $3,474 based on a stock price of $41.85 per share on the date of grant. Under the terms of the agreements, 71% of the awards will vest ratably over four years beginning on November 6, 2019 and approximately 29% of the awards will vest in tranches based on the achievement of annual or cumulative performance targets. Compensation costs associated with performance based awards are recognized over the requisite service period based on probability of achievement in accordance with ASC Topic 718,Compensation—Stock Compensation.Compensation.
On November 4, 2016,January 14, 2019, the Company granted 130,500 restricted stock units and restricted stock awards to certain key employees. The grant date fair value of these awards was $2,039 based on a stock price of $15.62 per share on the date of grant. Under the terms of the agreements, approximately 63% of the awards vest in substantially equal annual installments over a four year period, and the remaining 37% of the awards vest in tranches based on the achievement of annual performance targets. Compensation costs associated with performance based awards are recognized over the requisite service period based on probability of achievement in accordance with ASC Topic 718, Compensation—Stock Compensation.
On June 29, 2017, the Company granted 104,00019,973 options to certain key employees to purchase from the Company shares of Class A Common Stock at a price of $25.85$37.55 per share. The term of the options commencecommenced on June 29, 2017January 14, 2019 and will expire on June 28, 2023,January 13, 2025, the day before the sixth anniversary of the grant date. Under the terms of the agreements, the awards will vest 25% ratably over four years on each anniversary of their grant date. At June 30, 2017,January 14, 2019, the fair value of the option awards was $866$263 and iswas estimated using the Black-Scholes option-pricing model with the following assumptions: risk-free rate of 2.1%2.53%, expected volatility of 36.1%39.0%, expected term of 4.25 years, and no0 dividends. Stock-based compensation expense attributable to thesethe service based options is amortized on a straight-line basis over the requisite service period. Compensation costs associated with performance based option awards are recognized over the requisite service period based on probability of achievement in accordance with ASC Topic 718, Compensation—Stock Compensation.
Risk-free interest rate. The risk-free rate for the expected term of the option is based on the U.S. Treasury yield curve at the date of grant.
Expected term. The Company used the simplified method to estimate the expected term of stock options. The simplified method assumes that employees will exercise share options evenly between the period when the share options are vested and ending on the date when the share options would expire.
Expected volatility. The Company determined expected volatility based on its historical volatility calculated using daily observations of the closing price of its publicalypublicly traded common stock.
Expected dividend. The Company has not estimated any dividend yield as the Company currently does not pay a dividend and does not anticipate paying a dividend over the expected term.
On November 22, 2019, under the Incentive Plan, the Company granted approximately 43,000 restricted service-based stock units and 28,000 restricted service based stock awards to key employees under the Incentive Plan. The grant date fair value of these awards was $2,714 based on a stock price of $38.05 per share on the date of grant. Under the terms of the agreements, approximately 60% of the awards will vest ratably over three years beginning on November 6, 2019 and approximately 40% of the awards will vest ratably over four years beginning on November 6, 2019. Stock-based compensation expense attributable to the service based units and awards is amortized on a straight-line basis over the requisite service period.
On November 22, 2019, under the Incentive Plan, the Company granted to key employees a target amount of approximately 21,000 restricted stock awards with a performance condition. The number of shares that will ultimately be issued, if any, is based on the attainment of a specified amount of earnings during the fiscal year ending June 30, 2022. The maximum number of shares that can be issued if an elevated earnings target is met is approximately 32,000. The grant date fair value of the awards were estimated to be $810, based on a stock price of $38.05. Compensation costs associated with the performance awards are recognized over the requisite service period based on probability of achievement in accordance with ASC Topic 718, Compensation—Stock Compensation.
On November 22, 2019, under the Incentive Plan, the Company granted to key employees a target amount of approximately 21,000 stock awards with a market condition. The number of shares that will ultimately be issued, if any, is
|
| | | | | | | | | | | |
| | | Fiscal Year Ended June 30, 2017 |
| | | Shares | | Price per share | | Weighted Average Exercise Price/Share |
| Total outstanding Options at beginning of year | | — |
| | $ | — |
| | $ | — |
|
| Options granted | | 104,000 |
| | 25.85 |
| | 25.85 |
|
| Options exercised | | — |
| | — |
| | — |
|
| Options canceled | | — |
| | — |
| | — |
|
| Outstanding options at end of year | | 104,000 |
| | 25.85 |
| | 25.85 |
|
| Exercisable at end of year | | — |
| | — |
| | — |
|
| Vested and expected to vest at end of year | | 104,000 |
| | $ | 25.85 |
| | $ | 25.85 |
|
based on a total shareholder return ("TSR") computation that involves comparing the movement in the Company's stock price to movement in a market index from the grant date through November 22, 2022. The maximum number of shares that can be issued if an elevated TSR target is met is approximately 42,000. The grant date fair value of the awards were estimated to be $1,039, which is estimated using a Monte Carlo simulation. The Monte Carlo simulation model utilizes multiple input variables that determine the probability of satisfying the market condition stipulated in the award grant and calculates the fair market value for the stock award. Compensation costs are recognized over the requisite service period based on probability of achievement in accordance with ASC Topic 718, Compensation—Stock Compensation.
AsThe following table presents the number, grant date stock price per share, and weighted-average exercise price per share of the Company’s employee option awards:
| | | | | | | | | | | | | | | | | | | | | | | | | | | | | | | | | | | | | | | | | | | | |
| | Fiscal Year Ended June 30, | | | | | | | | | | | | | | | | |
| | 2020 | | | | | | 2019 | | | | | | 2018 | | | | |
| | Shares | | | | Weighted Average Exercise Price/Share | | Shares | | | | Weighted Average Exercise Price/Share | | Shares | | | | Weighted Average Exercise Price/Share |
| Total outstanding Options at beginning of year | | 185,473 | | | | | $ | 32.51 | | | 144,000 | | | | | $ | 27.24 | | | 104,000 | | | | | $ | 25.85 | |
| Options granted | | 0 | | | | | 0 | | | 69,973 | | | | | 40.82 | | | 40,000 | | | | | 30.87 | |
| Options exercised | | (12,125) | | | | | 31.08 | | | (28,500) | | | | | 26.29 | | | 0 | | | | | 0 | |
| Options canceled | | 0 | | | | | 0 | | | 0 | | | | | 0 | | | 0 | | | | | 0 | |
| Outstanding options at end of year | | 173,348 | | | | | $ | 32.61 | | | 185,473 | | | | | $ | 32.51 | | | 144,000 | | | | | $ | 27.24 | |
| Exercisable at end of year | | 74,869 | | | | | $ | 29.67 | | | 33,500 | | | | | $ | 26.97 | | | 26,000 | | | | | $ | 25.85 | |
| | | | | | | | | | | | | | | | | | |
The Company expects all outstanding options to vest. The weighted average remaining contractual life of options outstanding and options outstanding and exercisable as of June 30, 2017, the weighted-average years non-vested for service period awards and performance target awards2020 was approximately 2.33.56 years and 1.03.31 years, respectively. The total intrinsic value of options exercised during the year ended June 30, 2020 was $200. The total intrinsic value of options outstanding and options outstanding and exercisable at June 30, 2020 was $3,532 and $1,668, respectively. The total intrinsic values are based on the Company’s closing stock price on the last trading day of the applicable year for in-the-money options.
The Company's non-employee directors receive an annual retainer for their services as directors consisting of both a cash retainer and equity awards in the form of Class A Common Stock or restricted stock units. Directors may elect that their cash annual retainer be converted into either fully vested shares of Class A Common Stock or restricted stock units paid on a deferral basis. Equity awards issued to directors are fully vested at the date of grant. Directors receiving restricted stock units as compensation for services have no rights as a stockholder of the Company, no dividend rights (except with respect to dividend equivalent rights), and no voting rights until Class A Common Stock is actually issued to them upon separation from service or change in control as defined in the Incentive Plan. If dividends are paid by the Company to its stockholders, directors would be entitled to receive an equal number of restricted stock units based on their proportional interest. For the fiscal year ended June 30, 2015,2018, the Company issued 3,1014,567 shares of Class A Common Stock and 9,30323,838 restricted stock units with a weighted-average grant date fair value of $18.52$30.52 to its non-employee directors for their services as directors pursuant to the Incentive Plan. For the fiscal year ended June 30, 2016,2019, the Company issued 8,688853 shares of Class A Common Stock and 43,50817,663 restricted stock units with a weighted-average grant date fair value of $14.38$42.29 to its non-employee directors for their services as directors pursuant to the Incentive Plan. For the fiscal year ended June 30, 2017,2020, the Company issued 6,8572,870 shares of Class A Common Stock and 37,72722,206 restricted stock units with a weighted-average grant date fair value of $15.42$32.93 to its non-employee directors for their services as directors pursuant to the Incentive Plan.
The following table presents the number and weighted-average grant date fair value of the Company’s director and employee restricted stock units and restricted stock awards:
| | | | Fiscal Year Ended June 30, | | Fiscal Year Ended June 30, | |
| | 2017 | | 2016 | | 2015 | | 2020 | | | 2019 | | | 2018 | |
| | Number of Restricted Stock Units and Restricted Stock Awards Outstanding | | Weighted Average Grant Date Fair Value | | Number of Restricted Stock Units and Restricted Stock Awards Outstanding | | Weighted Average Grant Date Fair Value | | Number of Restricted Stock Units and Restricted Stock Awards Outstanding | | Weighted Average Grant Date Fair Value | | Number of Restricted Stock Units and Restricted Stock Awards Outstanding | | Weighted Average Grant Date Fair Value | | Number of Restricted Stock Units and Restricted Stock Awards Outstanding | | Weighted Average Grant Date Fair Value | | Number of Restricted Stock Units and Restricted Stock Awards Outstanding | | Weighted Average Grant Date Fair Value |
| Total Non-vested Restricted Stock Units and Restricted Stock Awards at beginning of year | 140,908 |
| | $ | 16.17 |
| | 44,775 |
| | $ | 20.20 |
| | $ | 46,155 |
| | $ | 20.03 |
| Total Non-vested Restricted Stock Units and Restricted Stock Awards at beginning of year | 226,240 | | | $ | 29.64 | | | 227,154 | | | $ | 20.84 | | | 225,854 | | | $ | 15.77 | |
| Granted | 168,227 |
| | 15.55 |
| | 174,072 |
| | 15.05 |
| | 21,353 |
| | 20.44 |
| Granted | 168,048 | | | 37.49 | | | 107,321 | | | 41.63 | | | 102,738 | | | 30.80 | |
| Vested | (81,181 | ) | | 15.95 |
| | (69,751 | ) | | 15.62 |
| | (20,733 | ) | | 15.83 |
| Vested | (112,084) | | | 26.89 | | | (103,811) | | | 22.98 | | | (99,613) | | | 19.57 | |
| Forfeited | (2,100 | ) | | 18.52 |
| | (8,188 | ) | | 20.13 |
| | (2,000 | ) | | 20.03 |
| Forfeited | (4,508) | | | 34.27 | | | (4,424) | | | 25.00 | | | (1,825) | | | 22.58 | |
| Total Non-vested Restricted Stock Units and Restricted Stock Awards at end of year | 225,854 |
| | $ | 15.77 |
| | 140,908 |
| | $ | 16.17 |
| | 44,775 |
| | $ | 20.20 |
| Total Non-vested Restricted Stock Units and Restricted Stock Awards at end of year | 277,696 | | | $ | 35.43 | | | 226,240 | | | $ | 29.64 | | | 227,154 | | | $ | 20.84 | |
As of June 30, 2020, the weighted-average years non-vested for service period awards and performance target awards was approximately 0.8 years and 0.5 year, respectively.
Stock compensation expense attributable to all of the Company's equity awards was $1,396, $1,947$3,042, $2,607 and $1,467$1,973 for fiscal years 2017, 20162020, 2019 and 2015,2018, respectively, including $283, $1,066 and $1,242 of expense related to profit interest awards previously granted prior to the IPO under the former LLC agreement for fiscal years 2017, 2016 and 2015, respectively, and is included in general and administrative expense in the Company's consolidated statement of operations and comprehensive income. The cash flow effects resulting from all equity awards were reflected as noncash operating activities. During fiscal year 2017,2020, the Company withheld approximately 15,58125,469 shares at an aggregate cost of approximately $258,$831, as permitted by the applicable equity award agreements, to satisfy employee tax withholding requirements for employee share-based equity awards that have vested. As of June 30, 20172020 and 2016,2019, unrecognized compensation cost related to nonvested, share-based compensation was $3,601$7,931 and $2,131, respectively, of which $0 and $283 represent the unearned portion attributable to profit interest awards as of June 30, 2017 and 2016,$6,431, respectively.
14.17. Net Earnings Per Share
Basic net income per share of Class A Common Stock is computed by dividing net income attributable to the Company's earnings by the weighted average number of shares of Class A Common Stock outstanding during the period. The weighted average number of shares of Class A Common Stock outstanding used in computing basic net income per share includes fully vested restricted stock units awarded to directors that are entitled to participate in distributions to common shareholders through receipt of additional units of equivalent value to the dividends paid to Class A Common Stock holders.
Diluted net income per share of Class A Common Stock is computed similarly to basic net income per share except the weighted average shares outstanding are increased to include additional shares from the assumed exercise of any common stock equivalents using the treasury method, if dilutive. The Company’s restricted LLC Units and non-qualified stock optionoptions are considered common stock equivalents for this purpose. The number of additional shares of Class A Common Stock related to these common stock equivalents and stock options are calculated using the treasury stock method.
Stock awards with a performance condition that are based on the attainment of a specified amount of earnings are only included in the computation of diluted earnings per share to the extent that the performance condition would be achieved based on the current amount of earnings, and only if the effect would be dilutive.
Stock awards with a market condition that are based on the performance of the Company's stock price in relation to a market index over a specified time period are only included in the computation of diluted earnings per share to the extent that the shares would be issued based on the current market price of the Company's stock in relation to the market index, and only if the effect would be dilutive.
Basic and diluted net income per share of Class A Common Stock has been computed as follows (in thousands, except share and per share amounts):
| | | | Fiscal Year Ended June 30, | | Fiscal Year Ended June 30, | |
| | 2017 | | 2016 | | 2015 | | 2020 | | 2019 | | 2018 |
| Basic: | | | | | | Basic: | | | | | |
| Net income attributable to Malibu Boats, Inc. | $ | 28,358 |
| | $ | 18,042 |
| | $ | 14,661 |
| Net income attributable to Malibu Boats, Inc. | $ | 61,562 | | | $ | 66,066 | | | $ | 27,613 | |
| Shares used in computing basic net income per share: | | | | | | Shares used in computing basic net income per share: | | | | | |
| Weighted-average Class A Common Stock | 17,708,924 |
| | 17,838,625 |
| | 15,668,072 |
| Weighted-average Class A Common Stock | 20,455,895 | | | 20,645,973 | | | 20,012,627 | |
| Weighted-average participating restricted stock units convertible into Class A Common Stock | 137,970 |
| | 95,955 |
| | 64,459 |
| Weighted-average participating restricted stock units convertible into Class A Common Stock | 206,855 | | | 186,472 | | | 166,754 | |
| Basic weighted-average shares outstanding | 17,846,894 |
| | 17,934,580 |
| | 15,732,531 |
| Basic weighted-average shares outstanding | 20,662,750 | | | 20,832,445 | | | 20,179,381 | |
| Basic net income per share | $ | 1.59 |
| | $ | 1.01 |
| | $ | 0.93 |
| Basic net income per share | $ | 2.98 | | | $ | 3.17 | | | $ | 1.37 | |
| | | | | | | | | | | | |
| Diluted: | | | | | | Diluted: | |
| Net income attributable to Malibu Boats, Inc. | $ | 28,358 |
| | $ | 18,042 |
| | $ | 14,661 |
| Net income attributable to Malibu Boats, Inc. | $ | 61,562 | | | $ | 66,066 | | | $ | 27,613 | |
| Shares used in computing diluted net income per share: | | | | | | Shares used in computing diluted net income per share: | |
| Basic weighted-average shares outstanding | 17,846,894 |
| | 17,934,580 |
| | 15,732,531 |
| Basic weighted-average shares outstanding | 20,662,750 | | | 20,832,445 | | | 20,179,381 | |
| Restricted stock units granted to employees | 104,438 |
| | 50,847 |
| | 8,487 |
| Restricted stock units granted to employees | 131,314 | | | 119,476 | | | 101,563 | |
| Weighted-average stock options convertible into Class A Common Stock | | Weighted-average stock options convertible into Class A Common Stock | 15,721 | | | 14,618 | | | 266 | |
| Weighted-average market performance awards convertible into Class A Common Stock | | Weighted-average market performance awards convertible into Class A Common Stock | 42,576 | | | 0 | | | 0 | |
Diluted weighted-average shares outstanding 1 | 17,951,332 |
| | 17,985,427 |
| | 15,741,018 |
| Diluted weighted-average shares outstanding 1 | 20,852,361 | | | 20,966,539 | | | 20,281,210 | |
| Diluted net income per share | $ | 1.58 |
| | $ | 1.00 |
| | $ | 0.93 |
| Diluted net income per share | $ | 2.95 | | | $ | 3.15 | | | $ | 1.36 | |
1 The Company excluded 1,397,447, 1,413,024,826,250, 930,125, and 1,419,0941,205,249 potentially dilutive shares from the calculation of diluted net income per share for the fiscal year ended June 30, 2017, 2016,2020, 2019, and 2015,2018, respectively, as these units would have been antidilutive.
The shares of Class B Common Stock do not share in the earnings or losses of Malibu Boats, Inc. and are therefore not included in the calculation. Accordingly, basic and diluted net income per share of Class B Common Stock has not been presented.
15.18. Commitments and Contingencies
Repurchase Commitments
In connection with its dealers’ wholesale floor-plan financing of boats, the Company has entered into repurchase agreements with various lending institutions. The reserve methodology used to record an estimated expense and loss reserve in each accounting period is based upon an analysis of likely repurchases based on current field inventory and likelihood of repurchase. Subsequent to the inception of the repurchase commitment, the Company evaluates the likelihood of repurchase and adjusts the estimated loss reserve and related consolidated statement of operations account accordingly. ThisWhen a potential loss reserve is recorded it is presented in accrued liabilities in the accompanying consolidated balance sheets.sheet. If the Company were obligated to repurchase a significant number of units under any repurchase agreement, its business, operating results and financial condition could be adversely affected. The total amount financed under the floor financing programs with repurchase obligations was $161,356 and $239,315 as of June 30, 2020 and 2019, respectively.
Repurchases and subsequent sales are recorded as a revenue transaction. The net difference between the repurchase price and the resale price is recorded against the loss reserve and presented in cost of sales in the accompanying consolidated statements of operations and comprehensive income. DuringFor fiscal year ended June 30, 2017 no2020, the Company repurchased 2 units from a lender of one of its former dealers and those units were repurchased. During thesubsequently resold in fiscal year ended June 30, 2016,2020 above their cost and at a minimal margin loss. For fiscal year 2019, the Company agreed to repurchase threerepurchased 8 units from thea lender of two of its former dealers. The total losses on these repurchasesdealers and those units were $30. Other than these repurchase commitments,subsequently resold in fiscal year 2020 above their cost and at minimal margin loss. For fiscal year 2018, the Company hasdid not repurchased another unit from lenders since July 1, 2010.repurchase any units under its repurchase agreements. Accordingly, the Company did not carry a reserve for repurchases as of June 30, 20172020 and 2016,2019, respectively.
The Company has collateralized receivables financing arrangements with a third-party floor plan financing provider for European dealers. Under terms of these arrangements, the Company transfers the right to collect a trade receivable to the financing provider in exchange for cash but agrees to repurchase the receivable if the dealer defaults. Since the transfer of the
Lease Commitments
In connection withreceivable to the financing provider does not meet the conditions for a sale-leaseback transaction as of March 2008,sale under ASC Topic 860, Transfers and Servicing, the Company now leases its manufacturing and office facilities for $156 per monthcontinues to report the transferred trade receivable in other current assets with periodic inflationary adjustments, plusan offsetting balance recorded as a secured obligation in accrued expenses in the paymentCompany's consolidated balance sheet. As of property taxes, normal maintenance, and insurance on the property under an agreement which expires March 2028, with three 10-year options to extend, at the Company’s discretion. Refer to Note 5 for more information.
The Company also has various other leases for operating facilities in both the U.S. and Australia and machinery and equipment under operating leases that expire over the next twelve months. The total rental expense for fiscal years ended June 30, 2017, 20162020 and 2015 was $2,384, $2,394,2019, the Company had financing receivables of $375 and $2,256, respectively.
Future minimum lease payments under noncancelable operating leases as of June 30, 2017, are as follows: |
| | | | |
| | | As of June 30, 2017 |
| Fiscal Year | | |
| 2018 | | $ | 2,263 |
|
| 2019 | | 2,297 |
|
| 2020 | | 2,302 |
|
| 2021 | | 2,303 |
|
| 2022 | | 2,315 |
|
| Thereafter | | 12,577 |
|
| | | $ | 24,057 |
|
Contingencies
Product Liability
The Company is engaged in a business that exposes it to claims for product liability and warranty claims in the event the Company’s products actually or allegedly fail to perform as expected or the use of the Company’s products results, or is alleged to result, in property damage, personal injury or death. Although the Company maintains product and general liability insurance of the types and in the amounts that the Company believes are customary for the industry, the Company is not fully insured against all such potential claims. The Company may have the ability to refer claims to its suppliers and their insurers to pay the costs associated with any claims arising from the suppliers’ products. The Company’s insurance covers such claims that are not adequately covered by a supplier’s insurance and provides for excess secondary coverage above the limits provided by the Company’s suppliers.
The Company may experience legal claims in excess of its insurance coverage or claims that are not covered by insurance, either of which could adversely affect its business, financial condition and results of operations. Adverse determination of material product liability and warranty claims made against the Company could have a material adverse effect on its financial condition and harm its reputation. In addition, if any of the Company products are, or are alleged to be, defective, the Company may be required to participate in a recall of that product if the defect or alleged defect relates to safety. These and other claims that the Company faces could be costly to the Company and require substantial management attention. Refer to Note 79 for discussion of warranty claims. The Company insures against product liability claims and believes there are no material product liability claims as of June 30, 20172020 that would not be covered by our insurance.
Litigation
Certain conditions may exist which could result in a loss, but which will only be resolved when future events occur. The Company, in consultation with its legal counsel, assesses such contingent liabilities, and such assessments inherently involve an exercise of judgment. If the assessment of a contingency indicates that it is probable that a loss has been incurred, the Company accrues for such contingent loss when it can be reasonably estimated. If the assessment indicates that a potentially material loss contingency is not probable but reasonably estimable, or is probable but cannot be estimated, the nature of the contingent liability, together with an estimate of the range of possible loss if determinable and material, is disclosed. If the assessment of a contingency deemed to be both probable and reasonably estimable involves a range of possible losses, the amount within the range that appears at the time to be a better estimate than any other amount within the range would be accrued. When no amount within the range is a better estimate than any other amount, the minimum amount in the range is accrued even though the minimum amount in the range is not necessarily the amount of loss that will be ultimately determined. Estimates of potential legal fees and other directly related costs associated with contingencies are not accrued but rather are expensed as incurred. Except as disclosed below, management does not believe there are any pending claims (asserted or unasserted) at June 30, 20172020 or June 30, 20162019 that will have a material adverse impact on the Company’s financial condition, results of operations or cash flows.
Legal Proceedings
On August 27, 2010, Pacific Coast Marine Windshields Ltd., or "PCMW," filed suit against the Company and certain third parties, including Marine Hardware, Inc., a third-party supplier of windshields to the Company, in the U.S. District Court for the Middle District of Florida seeking monetary and injunctive relief. PCMW was a significant supplier of windshields to the Company through 2008, when the Company sought an alternative vendor of windshields in response to defective product supplied by PCMW. PCMW’s amended complaint alleged, among other things, infringement of a design patent and two utility patents related to marine windshields, copyright infringement and misappropriation of trade secrets. The Company denied any liability arising from the causes of action alleged by PCMW and filed a counter claim alleging PCMW’s infringement of one of the Company's patents, conversion of two of the patents asserted against the Company, unfair competition and breach of contract. In September 2014, the Company entered into a settlement agreement with PCMW pursuant to which the Company agreed to pay $20,000 in cash to the plaintiffs, PCMW and Darren Bach, and the parties released each other from all past and present claims. Further, the plaintiffs, including PCMW, agreed not to sue on now-existing intellectual property rights. The Company recorded a one-time charge of $20,000 in connection with the settlement for the fiscal year ended June 30, 2014 and the Company paid $20,000 on October 6, 2014.
On October 31, 2013,January 12, 2018, the Company filed suit against Nautique Boat Company,Skier’s Choice, Inc., or "Nautique," in the U.S. District Court for the Eastern District of Tennessee alleging infringement of two of the Company's patents and seeking monetary and injunctive relief. This Tennessee lawsuit was a re-filing of a California patent infringement lawsuit against Nautique that was dismissed without prejudice on October 31, 2013. On November 1, 2013, Nautique filed for declaratory judgment in the U.S. District Court for the Middle District of Florida, claiming that it did not infringe the two patents identified in the original complaint in the Tennessee lawsuit. The Tennessee court enjoined Nautique from maintaining the Florida lawsuit which was partially duplicative. Nautique dismissed the Florida lawsuit to comply with the Tennessee court’s ruling. On December 13, 2013, the Company amended the Company's complaint to add another of its patents to the Tennessee lawsuit. All three patents in the case relate to the Company's proprietary wake surfing technology.
On June 27, 2014, Nautique filed a petition with the U.S. Patent and Trademark Office, or “PTO,” requesting institution of an Inter Partes Review, or “IPR,” of the Company’s U.S. Pat. No. 8,539,897, one of the three patents at issue in the Tennessee litigation. On February 6, 2015, the Company and Nautique entered into a Settlement Agreement (the "Nautique Settlement Agreement") to settle the patent infringement lawsuit. Under the terms of the Nautique Settlement Agreement, Nautique made a one-time payment of $2,250 and entered into a license agreement for the payment of future royalties for boats sold by Nautique using the licensed technology. The parties agreed to dismiss all claims in the patent litigation and jointly request the PTO to terminate the IPR.
On February 17, 2015, the parties dismissed the patent litigation with prejudice and on February 25, 2015, the U.S. Patent and Trademark Office terminated the IPR.
On June 29, 2015, the Company filed suit against MasterCraft Boat Company, LLC, or "MasterCraft,"Skier’s Choice," in the U.S. District Court for the Eastern District of Tennessee, seeking monetary and injunctive relief. The Company's complaint alleged MasterCraft'salleges Skier’s Choice’s infringement of athree utility patentpatents - U.S. Patent Nos. 9,260,161, 8,578,873, and 9,199,695 - related to wake surfing technology (U.S. Patent No. 8,578,873). The Court had issued a scheduling order setting deadlines for discovery and other eventstechnology. Skier’s Choice denied liability arising from the causes of action alleged in the litigation, leading up to a trial beginning on August 14, 2017.
Company's complaint and filed counterclaims alleging invalidity of the asserted patents. On February 16, 2016,June 19, 2019, the Company filed a second suitaction against MasterCraftSkier’s Choice in the U.S. District Court for the Eastern District of Tennessee, seeking monetary and injunctive relief. The Company’s complaint alleges MasterCraft’s infringementSkier’s Choice’s surf systems on its Moomba and Supra lines of another utilityboats infringe U.S. Patent No. 10,322,777, a patent related to wake surfing technology (U.S. Patent No. 9,260,161). The Court had issued a scheduling order setting deadlines for discovery and other events in the litigation, leading up to a trial beginning on October 30, 2017.
On May 18, 2016, MasterCraft filed two petitions with the U.S. Patent and Trademark Office, or “PTO,” requesting institution of Inter Partes Review, or “IPR,” of the Company’s U.S. Pat. No. 8,578,873, the patent at issue in the first Tennessee lawsuit. On August 23, 2016, the Company filed its preliminary responses to the IPR petitions. On November 16, 2016, the PTO declined to institute IPR in response to either of the two petitions.
On September 26, 2016, MasterCraft filed a request with the PTO for Ex Parte Reexamination of the Company’s U.S. Pat. No. 9,260,161, the patent at issue in the second Tennessee lawsuit. On November 18, 2016, the PTO granted that request for ex parte reexamination, and on February 16, 2017, the PTO issued a Non-Final Office Action. On April 17, 2017, the Company filed a Response to the Non-Final Office Action.
On May 2, 2017, the Company and MasterCraft entered into a Settlement Agreement (the “MasterCraft Settlement Agreement”) to settle lawsuits filed by the Company in the U.S. District Court for the Eastern District of Tennessee alleging infringement by MasterCraft of two of the Company’s utility patents. Under the terms of the MasterCraft Settlement Agreement, MasterCraft made a one-time payment of $2,500 during the fourth quarter of fiscal year end June 30, 2017, and
entered into a license agreement for the payment of future royalties for boats sold by MasterCraft using the licensed technology. The parties agreed to dismiss all claims in the patent litigation.
On April 22, 2014, Marine Power Holding, LLC ("Marine Power"), a former supplier of engines to the Company, initiated a lawsuit against the Company in the U.S. District Court for the Eastern District of Tennessee seeking monetary damages. On July 10, 2015, the Company filed an Answer and Counterclaim in the lawsuit filed by Marine Power. The CompanySkier’s Choice denied any liability arising from the causes of action alleged by Marine Power. The lawsuit proceeded to trial on August 8, 2016 and on August 18, 2016, a judgment was rendered by the jury against the Company in the litigation with Marine Power resultingCompany's complaint and filed counterclaims alleging invalidity of the asserted patents. On June 27, 2019, Skier’s Choice filed a motion to consolidate these 2 actions, and to continue deadlines in the Company taking a charge of $3,268 during the fiscal year ended June, 30, 2016. The Company subsequently prevailed on post-judgment motions and, on December 15, 2016, the court amended the judgment in the lawsuitearlier case for monetary damages to $1,938. On December 23, 2016, Marine Power filed a notice of appeal contesting the court's decision to reduce the amount of the original judgment. On January 6, 2017, the Company filed a notice of cross appeal, pursuant tonine months, which the Company appealedopposed. On August 22, 2019, the amended final judgmentmotion for consolidation was referred by Judge Thomas Varlan to Magistrate Judge Bruce Guyton, and other rulingsthe 2 cases were stayed pending resolution of that motion. On November 27, 2019, Judge Guyton ordered the court.two cases to be consolidated. On MayJanuary 7, 2020, the consolidated cases were reassigned to Judge Jon McCalla. On January 23, 2020, Judge McCalla issued a Scheduling Order, scheduling trial on the consolidated cases to begin on September 29, 2020.
On August 25, 2020, Judge McCalla issued a claim construction order and set a scheduling conference for August 27, 2017,2020, for purposes of resetting the pretrial calendar and trial dates. The Company intends to vigorously pursue this litigation to enforce its rights in its patented technology and Marine Power entered into a final settlement agreement whereby the Company agreed to pay $2,175 to settle all claims related to the litigation (the "Settlement"). The Settlement was paid in full on May 30, 2017. On June 9, 2017, a joint motion to withdraw appeals was submitted by the parties and their respective appeals were subsequently dismissed. Accordingly, no further losses were accrued asbelieves that Skier’s Choice’s counterclaims are without merit.
19. Related Party Transactions
As of June 30, 2017. On July 6, 2017, Marine Power filed an acknowledgment of satisfaction in the trial court, in which it stipulated that the amended final judgment entered on December 15, 2016 had been compromised and satisfied without any admission, agreement or acknowledgment of liability or fault by any party.
On August 26, 2016, Wizard Lake Marine Inc. and Wizard Lake Marine (B.C.) Inc., collectively “Wizard Lake”, a former dealer of the Company’s, initiated a lawsuit against the Company in the Court of Queen’s Bench of Alberta, Canada seeking monetary damages. The suit alleges breach of contract, wrongful termination, misrepresentation, breach of duty of good faith, and intentional interference. Wizard Lake is asking for damages exceeding $5,000. The Company denies any liability arising from the causes of action alleged by Wizard Lake and is vigorously defending the lawsuit, including commencing a counterclaim against Wizard Lake. The lawsuit is early in the discovery phase.
16. Related Party Transactions
Three2020, there were 2 non-employee members of the Company's board of directors that are also original shareholders of the Company and receive an annual retainer as compensation for services rendered. On November 2, 2018, one non-employee member of the Company's board of directors that is also an original shareholder departed from the board. For the fiscal years ended June 30, 2017, 20162020, 2019 and 2015, $374, $3922018, $310, $347 and $374,$421, respectively, was paid to these directors in both cash and equity for their services. Of the amount paid, $63$51 was a prepayment for services through the 20172020 and 20162019 annual meetings for eachboth of the years ended June 30, 20172020 and 2016, respectively.2019.
17.20. Segment Reporting
The Company has 3 reportable segments, Malibu, Cobalt and Pursuit. The Malibu segment participates in the manufacturing, distribution, marketing and sale of Malibu and Axis performance sports boats throughout the world. The Cobalt and Pursuit segments participate in the manufacturing, distribution, marketing and sale of Cobalt and Pursuit boats, respectively, throughout the world.
The Company revised its segment reporting effective July 1, 2019 to conform to changes in its internal management reporting based on the Company’s boat manufacturing operations. Prior to this change in reporting segments, the Company had 4 reportable segments, Malibu U.S., Malibu Australia, Cobalt and Pursuit. The Company now aggregates Malibu U.S. and Malibu Australia into 1 reportable segment as they have similar economic characteristics and qualitative factors. All segment information in the accompanying consolidated financial statements has been revised to conform to the Company’s current reporting segments for comparison purposes.
The following table presents financial information for the Company’s reportable segments for fiscal years ended June 30, 2017, 2016,2020, 2019, and 2015.2018.
| | | Fiscal Year Ended June 30, 2017 | | | | | | | | |
| Fiscal Year Ended June 30, 2020 | | Fiscal Year Ended June 30, 2020 | |
| | US | | Australia | | Eliminations | | Total | | Malibu | | Cobalt | | Pursuit 1 | | Total |
| Net sales | $ | 267,552 |
| | $ | 22,995 |
| | $ | (8,610 | ) | | $ | 281,937 |
| Net sales | $ | 354,769 | | | $ | 174,768 | | | $ | 123,626 | | | $ | 653,163 | |
| Affiliate (or intersegment) sales | 8,610 |
| | — |
| | (8,610 | ) | | — |
| |
| Net sales to external customers | 258,942 |
| | 22,995 |
| | — |
| | 281,937 |
| |
| Depreciation and amortization | 6,115 |
| | 633 |
| | — |
| | 6,748 |
| Depreciation and amortization | 8,809 | | | 5,258 | | | 4,313 | | | 18,380 | |
| Net income before provision for income taxes | 46,927 |
| | 1,893 |
| | (152 | ) | | 48,668 |
| Net income before provision for income taxes | 55,567 | | | 17,275 | | | 10,890 | | | 83,732 | |
| Capital expenditures | 9,183 |
| | 79 |
| | — |
| | 9,262 |
| Capital expenditures | 10,260 | | | 8,850 | | | 22,181 | | | 41,291 | |
| Long-lived assets | 36,089 |
| | 10,323 |
| | — |
| | 46,412 |
| Long-lived assets | 49,771 | | | 121,508 | | | 114,196 | | | 285,475 | |
| Total assets | $ | 222,252 |
| | $ | 19,099 |
| | $ | (17,688 | ) | | $ | 223,663 |
| Total assets | $ | 194,502 | | | $ | 153,820 | | | $ | 129,024 | | | $ | 477,346 | |
| | | | | | | | | |
| Fiscal Year Ended June 30, 2016 | | | | | | | | |
| Fiscal Year Ended June 30, 2019 | | Fiscal Year Ended June 30, 2019 | |
| | US | | Australia | | Eliminations | | Total | | Malibu | | Cobalt | | Pursuit 1 | | Total |
| Net sales | $ | 239,689 |
| | $ | 20,849 |
| | $ | (7,573 | ) | | $ | 252,965 |
| Net sales | $ | 374,611 | | | $ | 206,598 | | | $ | 102,807 | | | $ | 684,016 | |
| Affiliate (or intersegment) sales | 7,573 |
| | — |
| | (7,573 | ) | | — |
| |
| Net sales to external customers | 232,116 |
| | 20,849 |
| | — |
| | 252,965 |
| |
| Depreciation and amortization | 4,900 |
| | 624 |
| | — |
| | 5,524 |
| Depreciation and amortization | 7,674 | | | 5,252 | | | 3,034 | | | 15,960 | |
| Net income before provision for income taxes | 31,674 |
| | 453 |
| | (31 | ) | | 32,096 |
| Net income before provision for income taxes | 54,160 | | | 28,691 | | | 8,946 | | | 91,797 | |
| Capital expenditures | 6,156 |
| | 20 |
| | — |
| | 6,176 |
| Capital expenditures | 9,153 | | | 4,404 | | | 4,381 | | | 17,938 | |
| Long-lived assets | 31,446 |
| | 10,540 |
| | — |
| | 41,986 |
| Long-lived assets | 49,207 | | | 117,702 | | | 96,312 | | | 263,221 | |
| Total assets | $ | 222,613 |
| | $ | 17,130 |
| | $ | (17,417 | ) | | $ | 222,326 |
| Total assets | $ | 185,154 | | | $ | 151,481 | | | $ | 114,679 | | | $ | 451,314 | |
| | | | | | | | | |
| Fiscal Year Ended June 30, 2015 | | | | | | | | |
| Fiscal Year Ended June 30, 2018 | | Fiscal Year Ended June 30, 2018 | |
| | US | | Australia1 | | Eliminations | | Total | | Malibu | | Cobalt | | Pursuit 1 | | Total |
| Net sales | $ | 219,142 |
| | $ | 14,919 |
| | $ | (5,440 | ) | | $ | 228,621 |
| Net sales | $ | 316,687 | | | $ | 180,315 | | | $ | 0 | | | $ | 497,002 | |
| Affiliate (or intersegment) sales | 5,440 |
| | — |
| | (5,440 | ) | | — |
| |
| Net sales to external customers | 213,702 |
| | 14,919 |
| | — |
| | 228,621 |
| |
| Depreciation and amortization | 4,318 |
| | 572 |
| | — |
| | 4,890 |
| Depreciation and amortization | 7,468 | | | 5,386 | | | 0 | | | 12,854 | |
| Net income before provision for income taxes | 32,142 |
| | 295 |
| | (591 | ) | | 31,846 |
| Net income before provision for income taxes | 69,670 | | | 19,717 | | | 0 | | | 89,387 | |
| Capital expenditures | 5,299 |
| | 67 |
| | — |
| | 5,366 |
| Capital expenditures | 9,279 | | | 1,170 | | | 0 | | | 10,449 | |
| Long-lived assets | 30,125 |
| | 11,481 |
| | — |
| | 41,606 |
| Long-lived assets | 48,784 | | | 118,512 | | | 0 | | | 167,296 | |
| Total assets | $ | 200,260 |
| | $ | 17,982 |
| | $ | (17,928 | ) | | $ | 200,314 |
| Total assets | $ | 208,152 | | | $ | 157,616 | | | 0 | | | $ | 365,768 | |
|
1Represents the results of the Company's LicenseePursuit since itsthe acquisition on October 23, 2014. 15, 2018.
21. Quarterly Financial Reporting (Unaudited)
| | | | | | | | | | | | | | | | | | | | | | | | | | | | | | | | |
| | Quarter Ended | | | | | | | | Fiscal Year Ended
June 30, 2020 |
| | June 30, 2020 | | March 31, 2020 | | December 31, 2019 | | September 30, 2019 | | |
| Net sales | | $ | 118,661 | | | $ | 182,310 | | | $ | 180,112 | | | $ | 172,080 | | | $ | 653,163 | |
| Gross profit | | 23,552 | | | 45,849 | | | 39,868 | | | 40,001 | | | 149,270 | |
| Operating income | | 8,907 | | | 30,133 | | | 23,587 | | | 22,683 | | | 85,310 | |
| Net income | | 6,510 | | | 23,866 | | | 17,598 | | | 16,682 | | | 64,656 | |
| Net income attributable to non-controlling interest | | 307 | | | 1,088 | | | 876 | | | 823 | | | 3,094 | |
| Net income attributable to Malibu Boats, Inc. | | $ | 6,203 | | | $ | 22,778 | | | $ | 16,722 | | | $ | 15,859 | | | $ | 61,562 | |
| Basic net income per share | | $ | 0.30 | | | $ | 1.11 | | | $ | 0.81 | | | $ | 0.76 | | | $ | 2.98 | |
| Diluted net income per share | | $ | 0.29 | | | $ | 1.09 | | | $ | 0.81 | | | $ | 0.76 | | | $ | 2.95 | |
| | | | | | | | | | |
| | Quarter Ended | | | | | | | | Fiscal Year Ended
June 30, 2019 |
| | June 30, 2019 | | March 31, 2019 | | December 31, 2018 | | September 30, 2018 | | |
| Net sales | | $ | 194,822 | | | $ | 199,918 | | | $ | 165,793 | | | $ | 123,483 | | | $ | 684,016 | |
| Gross profit | | 47,732 | | | 49,722 | | | 38,315 | | | 30,501 | | | 166,270 | |
| Operating income | | 29,854 | | | 30,562 | | | 20,944 | | | 16,752 | | | 98,112 | |
| Net income | | 20,485 | | | 22,203 | | | 14,998 | | | 12,015 | | | 69,701 | |
| Net income income attributable to non-controlling interest | | 1,073 | | | 1,104 | | | 741 | | | 717 | | | 3,635 | |
| Net income attributable to Malibu Boats, Inc. | | $ | 19,412 | | | $ | 21,099 | | | $ | 14,257 | | | $ | 11,298 | | | $ | 66,066 | |
| Basic net income per share | | $ | 0.93 | | | $ | 1.01 | | | $ | 0.68 | | | $ | 0.55 | | | $ | 3.17 | |
| Diluted net income per share | | $ | 0.92 | | | $ | 1.01 | | | $ | 0.68 | | | $ | 0.54 | | | $ | 3.15 | |
18. Quarterly Financial Reporting (Unaudited)
|
| | | | | | | | | | | | | | | | | | | | |
| | | Quarter Ended | | Fiscal Year Ended
June 30, 2017 |
| | | June 30, 2017 | | March 31, 2017 | | December 31, 2016 | | September 30, 2017 | |
| Net sales | | $ | 75,106 |
| | $ | 77,149 |
| | $ | 67,661 |
| | $ | 62,021 |
| | $ | 281,937 |
|
| Gross profit | | 20,040 |
| | 21,362 |
| | 17,813 |
| | 15,823 |
| | 75,038 |
|
| Operating income | | 7,965 |
| | 13,026 |
| | 11,661 |
| | 6,786 |
| | 39,438 |
|
| Net income | | 10,266 |
| | 8,846 |
| | 7,737 |
| | 4,226 |
| | 31,075 |
|
| Net income attributable to non-controlling interest | | 602 |
| | 833 |
| | 836 |
| | 446 |
| | 2,717 |
|
| Net income attributable to Malibu Boats, Inc. | | $ | 9,664 |
| | $ | 8,013 |
| | $ | 6,901 |
| | $ | 3,780 |
| | $ | 28,358 |
|
| Basic net income per share | | $ | 0.54 |
| | $ | 0.45 |
| | $ | 0.39 |
| | $ | 0.21 |
| | $ | 1.59 |
|
| Diluted net income per share | | $ | 0.53 |
| | $ | 0.45 |
| | $ | 0.39 |
| | $ | 0.21 |
| | $ | 1.58 |
|
| | | | | | | | | | | |
| | | Quarter Ended | | Fiscal Year Ended
June 30, 2016 |
| | | June 30, 2016 | | March 31, 2016 | | December 31, 2015 | | September 30, 2015 | |
| Net sales | | $ | 66,680 |
| | $ | 68,539 |
| | $ | 60,506 |
| | $ | 57,240 |
| | $ | 252,965 |
|
| Gross profit | | 17,825 |
| | 18,406 |
| | 15,879 |
| | 14,710 |
| | 66,820 |
|
| Operating income | | 7,825 |
| | 11,825 |
| | 8,979 |
| | 7,275 |
| | 35,904 |
|
| Net income | | 4,090 |
| | 6,507 |
| | 5,718 |
| | 3,980 |
| | 20,295 |
|
| Net income income attributable to non-controlling interest | | 486 |
| | 731 |
| | 614 |
| | 422 |
| | 2,253 |
|
| Net income attributable to Malibu Boats, Inc. | | $ | 3,604 |
| | $ | 5,776 |
| | $ | 5,104 |
| | $ | 3,558 |
| | $ | 18,042 |
|
| Basic net income per share | | $ | 0.21 |
| | $ | 0.32 |
| | $ | 0.28 |
| | $ | 0.20 |
| | $ | 1.01 |
|
| Diluted net income per share | | $ | 0.20 |
| | $ | 0.32 |
| | $ | 0.28 |
| | $ | 0.20 |
| | $ | 1.00 |
|
19. Subsequent Events
Cobalt Acquisition
On July 6, 2017, the Company completed its acquisition of Cobalt Boats, LLC. The aggregate purchase price for the transaction was $130,000, consisting of $129,000 funded with cash and borrowings under the Company's New Credit Agreement and $1,000 in equity equal to 39,262 shares of the Company's Class A Common Stock based on a closing stock price of $25.47 per share on June 27, 2017. The aggregate purchase price was subject to certain adjustments, including customary adjustments for the amount of working capital in the business at the closing date and subject to adjustment for any judgment or settlement in connection with a pending litigation matter between Cobalt and Sea Ray Boats, Inc. and Brunswick Corporation. Concurrent with the closing of the Acquisition, William Paxson St. Clair, Jr., a former owner of Cobalt, was appointed as a director to the Company's Board of Directors and as President of Cobalt Boats, LLC.
Delayed Draw Term Loan
On July 6, 2017, the Company borrowed $105,000 under a delayed draw term loan under the New Credit Agreement to fund the payment of the purchase price for the acquisition of Cobalt on the same date. In connection with the delayed draw term loan, the Company incurred and capitalized $1,148 of deferred financing costs.
Offering and Prepayment of Term Loans
On August 14, 2017, the Company completed an offering of 2,300,000 shares of Class A Common Stock that were issued and sold by the Company at a price to the public of $24.05 per share (the "Offering"). This included 300,000 shares issued and sold by the Company pursuant to the option granted to the underwriters, which was exercised concurrently with the closing of the Offering.
The aggregate gross proceeds from the Offering was $58,075. Of these proceeds, the Company received $55,317 after deducting $2,758 in underwriting discounts and commissions. Of the net proceeds received from the Offering, $50,000 was used to repay amounts outstanding on its loans under the New Credit Agreement. The remaining net proceeds were used for general working capital purposes. The Company exercised its option to apply the prepayment to principal installments through December 31, 2021 and a portion of principal installments due on March 31, 2022. Accordingly, no principal payments are required under the New Credit Agreement until March 31, 2022, and as such, all borrowings as of June 30, 2017 are reflected as noncurrent.
Item 9. Changes in and Disagreements with Accountants on Accounting and Financial Disclosure
None.
Item 9A. Controls and Procedures
Evaluation of Disclosure Controls and Procedures
We maintain disclosure controls and procedures (as defined in Rule 13a-15(e) of the Exchange Act) that are designed to ensure that information required to be disclosed by us in the reports that we file or submit under the Exchange Act is recorded, processed, summarized and reported within the time periods specified in the SEC's rules and forms, and that such information is accumulated and communicated to our management, including our chief executive officer and chief financial officer, as appropriate, to allow timely decisions regarding required disclosures. Any controls and procedures, no matter how well designed and operated, can provide only reasonable assurance of achieving the desired control objectives.
As of the end of the period covered by this Form 10-K Annual Report, we carried out an evaluation under the supervision and with the participation of our management, including our chief executive officer and chief financial officer, of the effectiveness of our disclosure controls and procedures. Based upon this evaluation, our chief executive officer and chief financial officer have concluded that our disclosure controls and procedures were effective at a reasonable assurance level as of June 30, 2017.2020.
Management’s Report on Internal Control over Financial Reporting
Our management is responsible for establishing and maintaining adequatePursuant to Section 404 of the Sarbanes-Oxley Act of 2002, the Company included a report of management's assessment of the effectiveness of its internal control over financial reporting as definedpart of this Annual Report on Form 10-K for the fiscal year ended June 30, 2020. Management's report is included in Rule 13a-15(f)the Company's 2020 Financial Statements under the Exchange Act.captions entitled “Report of Management on Internal control overControl Over Financial Reporting” and is incorporated herein by reference.
Report of Independent Registered Public Accounting Firm
KPMG LLP, the independent registered public accounting firm that audited the fiscal year 2020 consolidated financial reporting is a process to provide reasonable assurance regarding the reliability of our financial reporting for external purposesstatements included in accordance with accounting principles generally accepted in the United States. Because of its inherent limitations, internal control over financial reporting may not prevent or detect misstatements. Projections of any evaluation of effectiveness to future periods are subject to the risk that controls may become inadequate because of changes in conditions, or that the degree of compliance with the policies or procedures may deteriorate.
Our management, including our chief executive officer and chief financial officer, assessedthis Annual Report on Form 10-K, has issued an attestation report on the effectiveness of our internal control over financial reporting as of June 30, 2017. In making this assessment, we used the criteria set forth by the Committee of Sponsoring Organizations of the Treadway Commission ("COSO") in Internal Control-Integrated Framework (2013). Based on such assessment our management has concluded that, as of June 30, 2017, our internal control over financial reporting2020, which is effective based on those criteria.
This annual report does not include an attestation report from our registered public accounting firm regarding internal control over financial reporting. Management's report was not subject to attestation by our registered public accounting firm pursuant to rules of the SEC that permit emerging growth companies, which we are, to provide only management's report in this annual report.included herein.
Changes in Internal Control Over Financial Reporting
There have been no changes in our internal control over financial reporting during the fourth quarter ended June 30, 20172020 that have materially affected, or are reasonably likely to materially affect, our internal control over financial reporting.
Item 9B. Other Information
Not Applicable.Stock Repurchase Program
On August 27, 2020, our Board of Directors authorized a stock repurchase program to allow for repurchase of up to $50.0 million of our Class A Common Stock and the LLC's LLC Units for the period from September 2, 2020 to July 1, 2021.
Under the New Repurchase Program, we may repurchase our Class A Common Stock and the LLC's LLC Units at any time or from time to time, without prior notice, subject to market conditions and other considerations. Our repurchases may be made through 10b5-1 plans, open market purchases, privately negotiated transactions, block purchases or other transactions. We intend to fund repurchases under the New Repurchase Program from cash on hand. We have no obligation to repurchase any shares under the New Repurchase Program and may suspend or discontinue it at any time.
PART III.
Item 10. Directors, Executive Officers and Corporate Governance
The Company has adopted a Code of Business Conduct applicable to our employees, directors, and officers and a Code of Ethics. This Code of Ethics is applicable to our principal executive officer, principal financial officer, principal accounting officer and controller, or persons performing similar functions. The codes are available on the Company’s website at www.malibuboats.com. To the extent required by rules adopted by the SEC and NASDAQ,Nasdaq, we intend to promptly disclose future amendments to certain provisions of the codes, or waivers of such provisions granted to executive officers and directors on our website at www.malibuboats.com.
The remaining information required by this Item 10 will be included the Proxy Statement and is incorporated herein by reference.
Item 11. Executive Compensation
The information required by this Item 11 will be included in the Proxy Statement and is incorporated herein by reference.
Item 12. Security Ownership of Certain Beneficial Owners and Management and Related Stockholder Matters
The information required by this Item 12 will be included in the Proxy Statement and is incorporated herein by reference.
Item 13. Certain Relationships and Related Transactions, and Director Independence
The information required by this Item 13 will be included in the Proxy Statement and is incorporated herein by reference.
Item 14. Principal AccountingAccountant Fees and Services
The information required by this Item 14 will be included in the Proxy Statement and is incorporated herein by reference.
PART IV.
Item 15.Exhibits, Financial Statement Schedules
The following documents are filed as part of this Annual Report on Form 10-K:
1. Consolidated Financial Statements
The following financial statements are included in Part II, Item 8 of this Annual Report on Form 10-K:
•Consolidated Statements of Operations and Comprehensive Income for the fiscal years ended June 30, 2017, 2016,2020, 2019, and 2015.
2018.•Consolidated Balance Sheets as of June 30, 20172020 and 2016.
2019.•Consolidated Statements of Stockholders’ Equity for the fiscal years ended June 30, 2017, 2016,2020, 2019, and 2015.
2018.•Consolidated Statements of Cash Flows for the fiscal years ended June 30, 2017, 2016,2020, 2019, and 2015.
2018.•Notes to Consolidated Financial Statements.
•Reports of Independent Registered Public Accounting Firms.Firm.
2. Financial Statement Schedules
Separate financial statement schedules have been omitted because such information is inapplicable or is included in the financial statements or notes described above.
3. Exhibits
The exhibits filed as part of this Annual Report are listed in the exhibit index immediately preceding such exhibits, which exhibit index is incorporated herein by reference.
|
| | | | | | | |
| Exhibit No. | | Description |
| | Certificate of Incorporation of Malibu Boats, Inc. 2 |
| | Bylaws of Malibu Boats, Inc. 2 |
| | Certificate of Formation of Malibu Boats Holdings, LLC 2 |
| | First Amended and Restated Limited Liability Company Agreement of Malibu Boats Holdings, LLC, dated as of February 5, 2014 3 |
| | First Amendment, dated as of February 5, 2014, to First Amended and Restated Limited Liability Company Agreement of Malibu Boats Holdings, LLC 4 |
| | Second Amendment, dated as of June 27, 2014, to First Amended and Restated Limited Liability Company Agreement of Malibu Boats Holdings, LLC 5 |
| | Description of Class A Common Stock 11 |
| | Form of Class A Common Stock Certificate 2 |
| | Form of Class B Common Stock Certificate 2 |
| | Exchange Agreement, dated as of February 5, 2014, by and among Malibu Boats, Inc. and Affiliates of Black Canyon Capital LLC and Horizon Holdings, LLC 3 |
| | Exchange Agreement, dated as of February 5, 2014, by and among Malibu Boats, Inc. and the Members of Malibu Boats Holdings, LLC 3 |
| | Tax Receivable Agreement, dated as of February 5, 2014, by and among Malibu Boats, Inc., Malibu Boats Holdings, LLC and the Other Members of Malibu Boats Holdings, LLC 3 |
| | Second Amended and Restated Credit Agreement, dated June 28, 2017, by and among Malibu Boats, LLC, Malibu Boats Holdings, LLC, the other guarantors party thereto, the lenders party thereto, and SunTrust Bank, as administrative agent, as issuing bank and as swingline lender1
|
| | Second Amended and Restated Security Agreement, dated June 28, 2017, by and among Malibu Boats, LLC, Malibu Boats Holdings, LLC, the other debtors party thereto, and SunTrust Bank, as administrative agent1 |
| | | | | | | | |
| | First Incremental Facility Amendment and First Amendment dated August 21, 2018 to the Second Amended and Restated Credit Agreement, by and among Malibu Boats, LLC, Malibu Boats Holdings, LLC, the other guarantors party thereto, the lenders party thereto, and SunTrust Bank, as administrative agent, as issuing bank and as swingline lender 9 |
| | +Second Incremental Facility Amendment and Second Amendment, dated May 14, 2019, by and among Malibu Boats, LLC, Malibu Boats Holdings, LLC, the other guarantors party thereto, the lenders party thereto, and SunTrust Bank, as administrative agent, swingline lender and issuing bank 10
|
| | Engine Supply Agreement dated November 14, 2016 between Malibu Boats, LLC and General Motors LLC97
|
|
| | |
| | Employment Agreement by and between Malibu Boats, Inc. and Ritchie Anderson, dated February 5, 2014 3 |
| | Employment Agreement by and between Malibu Boats, Inc. and Jack Springer, dated February 5, 2014 3 |
| | Employment Agreement by and between Malibu Boats, Inc. and Wayne Wilson, dated February 5, 2014 3 |
| | Employment Agreement, dated June 28, 2017, between William Paxson St. Clair, Jr. and Cobalt Boats, LLC1
Long-Term Incentive Plan 2
|
| | Long-Term Incentive Plan 2
|
| | Amendment Number One, dated as of June 24, 2014, to the Long Term Incentive Plan 5 |
| | Form of Stock Option Agreement for Long-Term Incentive Plan
8
|
| | Form of Restricted Stock Agreement for Long-Term Incentive Plan
8
|
| | Form of Restricted Stock Unit Award Agreement for Long-Term Incentive Plan (executive)
8
|
| | Form of Restricted Stock Unit Award Agreement for Long-Term Incentive Plan (non-executive)
8
|
| | Form of Indemnification Agreement 76 |
| | Director Compensation Policy5 11 |
| | Form of Time and Performance Based Restricted Stock Award Agreement (executive) 12 |
| | Subsidiaries of Malibu Boats, Inc. |
| | Consent of KPMG LLP, independent registered public accounting firm for Malibu Boats, Inc. |
| | Consent of RSM US LLP, independent registered public accounting firm for Malibu Boats, Inc. |
| | Certificate of the Chief Executive Officer of Malibu Boats, Inc. pursuant to Rule 13a-14 or 15d-14 of the Securities Exchange Act of 1934, as amended, as adopted pursuant to Section 302 of the Sarbanes-Oxley Act of 2002 |
| | Certificate of the Chief Financial Officer of Malibu Boats, Inc. pursuant to Rule 13a-14 or 15d-14 of the Securities Exchange Act of 1934, as amended, as adopted pursuant to Section 302 of the Sarbanes-Oxley Act of 2002 |
| | Certification of the Chief Executive Officer and Chief Financial Officer of Malibu Boats, Inc. pursuant to 18 U.S.C. Section 1350, as adopted pursuant to Section 906 of the Sarbanes-Oxley Act of 2002 |
101.INS101 | | XBRL Instance Document |
101.SCH | | XBRL Taxonomy Extension Schema Document |
101.CAL | | XBRL Taxonomy Calculation Linkbase Document |
101.DEF | | XBRL Definition Linkbase Document |
101.LAB | | XBRL Taxonomy Label Linkbase Document |
101.PRE | | XBRL Taxonomy Presentation Linkbase Document |
| |
* | Management contract or compensatory plan or arrangement. |
| |
+ | Portions of this exhibit have been omitted pursuant to a confidential treatment request. Omitted information has been filed separately withThe following financial statements from the SEC. |
| |
(1) | Filed as an exhibit to the Company's CurrentCompany’s Annual Report on Form 8-K (File No. 001-36290) filed on10-K for the fiscal year ended June 29, 2017. |
| 30, 2020 were formatted in Inline XBRL: (i) Consolidated Statements of Operations and Comprehensive Income, (ii) Consolidated Balance Sheets, (iii) Consolidated Statements of Stockholders’ Equity, (iv) Consolidated Statements of Cash Flows, and (v) the Notes to Consolidated Financial Statements, tagged as blocks of text and including detailed tags. |
(2)104 | Filed as an exhibit to Amendment No. 1 to | The cover page from the Company’s registration statement on Form S-1 (Registration No. 333-192862) filed on January 8, 2014. |
| |
(3) | Filed as an exhibit to the Company’s CurrentAnnual Report on Form 8-K (File No. 001-36290) filed on February 6, 2014.10-K for the fiscal year ended June 30, 2020, formatted in Inline XBRL (Included as Exhibit 101). |
| |
(4) | Filed as an exhibit to the Company's Quarterly Report on Form 10-Q/A (File No. 001-36290) filed on May 13, 2014. |
| |
(5) | Filed as an exhibit to the Company's Current Report on Form 8-K (File No. 001-36290) filed on June 27, 2014. |
| |
(6) | Filed as an exhibit to the Company's Current Report on Form 8-K (File No. 001-36290) filed on October 3, 2014. |
| |
(7) | Filed as an exhibit to the Company’s registration statement on Form S-1 (File No. 333-192862) filed on December 13, 2013. |
| |
(8) | Filed as an exhibit to the Company's Quarterly Report on Form 10-Q (File No. 001-36290) filed on February 4, 2016. |
| |
(9) | * Management contract or compensatory plan or arrangement. + Portions of this exhibit have been omitted pursuant to a confidential treatment request. Omitted information has been filed separately with the SEC. (1) Filed as an exhibit to the Company's Current Report on Form 8-K (File No. 001-36290) filed on June 29, 2017. (2) Filed as an exhibit to Amendment No. 1 to the Company’s registration statement on Form S-1 (Registration No. 333-192862) filed on January 8, 2014. (3) Filed as an exhibit to the Company’s Current Report on Form 8-K (File No. 001-36290) filed on February 6, 2014. (4) Filed as an exhibit to the Company's Quarterly Report on Form 10-Q/A (File No. 001-36290) filed on May 13, 2014. (5) Filed as an exhibit to the Company's Current Report on Form 8-K (File No. 001-36290) filed on June 27, 2014. (6) Filed as an exhibit to the Company’s registration statement on Form S-1 (File No. 333-192862) filed on December 13, 2013. (7) Filed as an exhibit to the Company’s Quarterly Report on Form 10-Q (File No. 001-36290) filed on February 1, 2017. (8) Filed as an exhibit to the Company's Annual Report on Form 10-K (File No. 001-36290) filed on September 8, 2017. |
(9) Filed as an exhibit to the Company's Current Report on Form 8-K (File No. 001-36290) filed on August 22, 2018.
(10) Filed as an exhibit to the Company's Current Report on Form 8-K (File No. 001-36290) filed on May 15, 2019.
(11) Filed as an exhibit to the Company’s Annual Report on Form 10-K (File No. 001-36290) filed on August 29, 2019.
(12) Filed as an exhibit to the Company’s Quarterly Report on Form 10-Q (File No. 001-36290) filed on February 6, 2020.
Item 16.Form 10-K Summary
None.
SIGNATURE
Pursuant to the requirements of the Securities Exchange Act of 1934, the registrant has duly caused this report to be signed on its behalf by the undersigned thereunto duly authorized.
| | | | | |
| MALIBU BOATS, INC. |
| |
| August 31, 2020 | MALIBU BOATS, INC.
|
| |
September 7, 2017 | /s/ Jack D. Springer |
| Jack D. Springer |
| Chief Executive Officer (Principal Executive Officer) |
| |
September 7, 2017August 31, 2020 | /s/ Wayne R. Wilson |
| Wayne R. Wilson |
| Chief Financial Officer (Principal Financial and Accounting Officer) |
Pursuant to the requirements of the Securities Exchange Act of 1934, this report has been signed below by the following persons on behalf of the registrant and in the capacities and on the dates indicated:
| | | | | | | | | | | | | | |
| Signature | | Title | | Date |
| | | | |
Signature | | Title | | Date |
| | | | |
| /s/ Jack D. Springer | | | | September 7, 2017August 31, 2020 |
Jack D. Springer | | Chief Executive Officer and Director (Principal Executive Officer) | | |
/s/ Wayne R. Wilson | | | | September 7, 2017August 31, 2020 |
Wayne R. Wilson | | Chief Financial Officer
(Principal Financial and Accounting Officer)
| | |
/s/ Michael K. Hooks | | | | September 7, 2017August 31, 2020 |
Michael K. Hooks | | Chairman of the Board and Director | | |
/s/ Mark W. Lanigan | | | | September 7, 2017 |
Mark W. Lanigan
| | Director | | |
/s/ Phillip S. Estes | | | | September 7, 2017 |
Phillip S. Estes
| | Director | | |
/s/ James R. Buch | | | | September 7, 2017August 31, 2020 |
James R. Buch | | Director | | |
/s/ Ivar S. Chhina | | | | September 7, 2017August 31, 2020 |
Ivar S. Chhina | | Director | | |
/s/ Michael J. Connolly | | | | September 7, 2017August 31, 2020 |
Michael J. Connolly | | Director | | |
/s/ Mark W. Lanigan | | | | August 31, 2020 |
Mark W. Lanigan | | Director | | |
/s/ Joan M. Lewis | | | | August 31, 2020 |
Joan M. Lewis | | Director | | |
/s/ Peter E. Murphy | | | | September 7, 2017August 31, 2020 |
Peter E. Murphy
| | Director | | |
/s/ William Paxson St. Clair, Jr. | | | | September 7, 2017 |
William Paxson St. Clair, Jr. | | Director | | |
/s/ John E. Stokely | | | | September 7, 2017August 31, 2020 |
John E. Stokely
| | Director | | |