UNITED STATES
SECURITIES AND EXCHANGE COMMISSION
Washington, D.C. 20549
FORM 10-K
ý☒ANNUAL REPORT PURSUANT TO SECTION 13 OR 15(d) OF THE SECURITIES EXCHANGE ACT OF 1934
For the fiscal year ended December 31, 20172019
or
o☐TRANSITION REPORT PURSUANT TO SECTION 13 OR 15(d) OF THE SECURITIES EXCHANGE ACT OF 1934
For the transition period from ____ to ____
Commission File Number: 001-36316
AgroFresh Solutions, Inc.
(Exact Name of Registrant as Specified in Its Charter)
|
| | | | | | | |
Delaware
| | 46-4007249
|
| (State or other jurisdiction of incorporation) | | 46-4007249
(IRS Employer Identification Number) |
One Washington Square
510-530 Walnut Street, Suite 1350
Philadelphia, PA 19106
(Address of principal executive offices)
(267) 317-9139
(Registrant’s telephone number, including area code)
Securities registered pursuant to Section 12(b) of the Act:
|
| | | | | | | | | | | | | |
| Title of each class | | Trading Symbol(s) | | Name of each exchange on which registered |
| Common Stock, par value $0.0001 per share | | AGFS | | The NASDAQ Global Market |
| Warrants to purchase shares of Common Stock | | AGFSW | | The NASDAQ Global Market |
Securities registered pursuant to Section 12(g) of the Act: None
Indicate by check mark if the registrant is a well-known seasoned issuer, as defined in Rule 405 of the Securities Act. o☐ Yes ý☒ No
Indicate by check mark if the registrant is not required to file reports pursuant to Section 13 or Section 15(d) of the Exchange Act o☐ Yes ý☒ No
Indicate by check mark whether the registrant (1) has filed all reports required to be filed by Section 13 or 15(d) of the Securities Exchange Act of 1934 during the preceding 12 months (or for such shorter period that the registrant was required to file such reports), and (2) has been subject to such filing requirements for the past 90 days. ý☒ Yes o☐ No
Indicate by check mark whether the registrant has submitted electronically and posted on its corporate Web site, if any, every Interactive Data File required to be submitted and posted pursuant to Rule 405 of Regulation S-T (Section 232.405 of this chapter) during the preceding 12 months (or for such shorter period that the registrant was required to submit and post such files). ý☒ Yes o☐ No
Indicate by check mark if disclosure of delinquent filers pursuant to Item 405 of Regulation S—K is not contained herein, and will not be contained, to the best of registrant’s knowledge, in definitive proxy or information statements incorporated by reference in Part III of this Form 10—K or any amendment to this Form 10—K. o
Indicate by check mark whether the registrant is a large accelerated filer, an accelerated filer, a non-accelerated filer, or a smaller reporting company, or an emerging growth company. See the definitions of large accelerated filer,” “accelerated filer” andfiler,” “smaller reporting company”
and "emerging growth company" in Rule 12b-2 of the Exchange Act. (Check one): |
| | | | | | | | | | | | | |
Large accelerated filer o☐ | Accelerated filer x☐ | Non-accelerated filer o☒ (Do not check if a
smaller reporting company)
| Smaller reporting company o ☒ | Emerging growth company o ☐ |
If an emerging growth company, indicate by check mark if the registrant has elected not to use the extended transition period for complying with any new or revised financial accounting standards provided pursuant to Section 13(a) of the Exchange Act. o☐
Indicate by check mark whether the registrant is a shell company (as defined by Rule 12b-2 of the Act). o☐ Yes ý☒ No
As of June 30, 2017,2019, the aggregate market value of the common stock held by nonaffiliates of the registrant, based on the $7.81$1.51 closing price of the registrant’s common stock as reported on the NASDAQ Stock Market on that date, was approximately $170$33 million. For purposes of this computation, all officers, directors and 10% beneficial owners of the registrant are deemed to be affiliates. Such determination should not be deemed to be an admission that such officers, directors or 10% beneficial owners are, in fact, affiliates of the registrant.
The number of shares of the registrant’s common stock outstanding as of March 9, 2018February 25, 2020 was 50,903,047.51,195,101.
DOCUMENTS INCORPORATED BY REFERENCE
The information required by Part III of this annual report on Form 10-K, to the extent not set forth in this Form 10-K, is incorporated herein by reference from the registrant’s definitive proxy statement relating to the annual meeting of stockholders to be held in 2018,2020, to be filed with the Securities and Exchange Commission within 120 days after the end of the registrant’s fiscal year ended December 31, 2017.2019.
TABLE OF CONTENTS
CAUTIONARY NOTE REGARDING FORWARD-LOOKING STATEMENTS
Certain of the statements contained in this annual report on Form 10-K constitute “forward-looking statements” for purposes of federal securities laws. Our forward-looking statements include, but are not limited to, statements regarding our or our management’s expectations, hopes, beliefs, intentions or strategies regarding the future. In addition, any statements that refer to projections, forecasts or other characterizations of future events or circumstances, including any underlying assumptions, are forward-looking statements. The words “anticipate,” “believe,” “continue,” “could,” “estimate,” “expect,” “intend,” “may,” “might,” “plan,” “possible,” “potential,” “predict,” “project,” “should,” “would,” “will” and similar expressions may identify forward-looking statements, but the absence of these words does not mean that a statement is not forward-looking. Forward-looking statements in this report may include, for example, statements relating to:
•our future financial performance;
•growth plans and opportunities, including planned product and service offerings;
•changes in the markets in which we compete;
•our ability to increase brand loyalty and awareness;
•our ability to enter into alliances and complete acquisitions of other businesses;
•protection of our intellectual property rights; and
•the outcome of any known and unknown litigation.
The forward-looking statements contained in this report are based on our current expectations and beliefs concerning future developments and their potential effects on us. Future developments affecting us may not be those that we have anticipated. These forward-looking statements involve a number of risks, uncertainties (some of which are beyond our control) or other assumptions that may cause actual results or performance to be materially different from those expressed or implied by these forward-looking statements. These risks and uncertainties include, but are not limited to, those factors described under the heading “Risk Factors” elsewhere in this report. Should one or more of these risks or uncertainties materialize, or should any of our assumptions prove incorrect, actual results may vary in material respects from those projected in these forward-looking statements. We undertake no obligation to update or revise any forward-looking statements, whether as a result of new information, future events or otherwise, except as may be required under applicable securities laws.
PART I
ITEM 1. BUSINESS
Overview
AgroFresh Solutions, Inc. (the “Company”, “AgroFresh”, “we”, “us” or “our)“our”) is a global leader in delivering innovative food preservation and waste reduction solutions forthat extend the shelf life of fresh produce. The Company is empowering the food industry with Smarter FreshnessTM, a range of integrated solutions designed to help growers, packers and retailers improve produce freshness and quality while preventing shrinkage and reducing waste.
AgroFresh’s solutions range from pre-harvest with HarvistaTMmarket leadership is underpinned by our global footprint, extensive applied scientific expertise, customer intimacy, and LandSpringTM to its marqueeSmartFreshTM Quality System, which includes SmartFreshTM, AdvanStoreTMa growing portfolio of value-added products and ActiMistTM, working together to maintain the quality of stored produce. AgroFresh has a controlling interest in Tecnidex Fruit Protection, S.A.U. (“Tecnidex”), a leading provider of post-harvest fungicides, waxes and biocides for the citrus market. Additionally, the company’s initial retail solution, RipeLockTM, optimizes banana ripening for the benefit of retailers and consumers. AgroFresh hasmission-critical advisory services. Our key products registeredare approved for sale in over 4550 countries, supports approximately 3,700 directand support customers and serviceswith over 25,000 storage rooms globally.
In addition, we provide in-depth plant physiology expertise and offer a comprehensive list of solutions spanning from near-harvest to post-harvest, from storage through retail. More importantly, AgroFresh uses proprietary technologyhas been able to regulate the ripening effectsgain a high level of ethylene, the naturally occurring plant hormonetrust from our customers, which is built on nearly 20 years of interaction and support. Our direct market approach, high touch service and science-based model best position us to address our customers’ needs. We believe that triggers ripening in certain fruits and vegetables. Our portfolio of products, that span the supply chain of fresh produce, from orchard to retail shelves, differentiates usthis is a key differentiator compared to other companies that have more narrow product offerings. offer limited service levels.
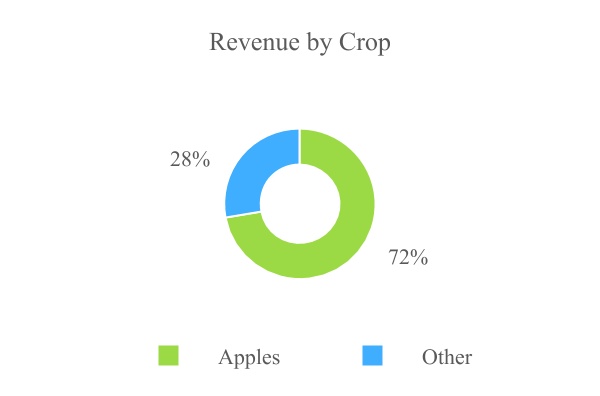
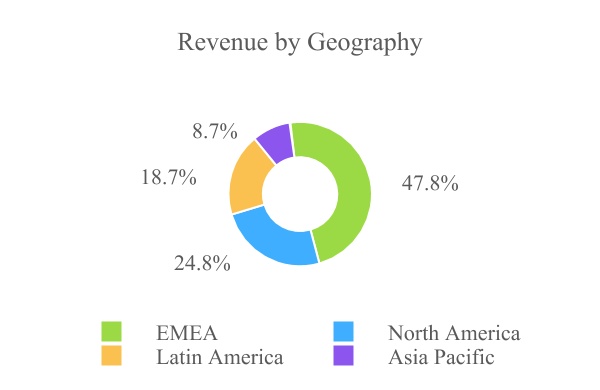
The active ingredient of severalfollowing tables present a breakdown of our products, 1-Methylcyclopropene ("1-MCP")revenue based on solutions, crop and geography for the year ended December 31, 2019.
Note: “EMEA” comprises Europe, the Middle East, and Africa. “Other” include revenue from pears, citrus, kiwifruit, avocados, bananas, and other crops.
AgroFresh’s core business provides solutions to extend the shelf life of fresh produce for both growers and packers. SmartFreshTM, blocks the effects of ethylene. All of AgroFresh’s 1-MCP products are naturally biodegradable and leaves no detectable residue, which has significant consumer appeal.
We believe that SmartFresh our current principal productflagship solution, preserves the texture, firmness, taste and appearance of produce during storage, transportation and retail display. SmartFreshIt allows growers and packers to deliver “just harvested” freshness on a year-round basis and enables retailers to increase customer satisfaction with fresh, high quality produce. An integral part of the SmartFresh sales processvalue proposition is a direct service model providing customers with on-site applications of SmartFresh at their storage facilities together with mission-critical and value-added advisory services. Overall, the SmartFreshTM Quality System offers growers and packers an integrated freshness management solution that is highly effective and easy to deploy.
AgroFresh has two solutions for the pre-harvest market. Our Harvista™ technology is used in pre-harvest management of pome fruit, such as apples and pears. Just as we believe SmartFresh revolutionizedextended its post-harvest apple storage, we believe Harvista can have a similar impact in the orchard. Harvista slows ripening (starch conversion), reduces fruit drop, and holds fruit on the tree longer to promote better color and fruit size, thereby bringing new benefits to the grower and the retailer. It also extends the harvest window to allow growers maximum flexibility in harvest timing while providing peace of mind. LandSpring is a plant-growth regulator ("PGR") for pre-transplant use on seedlings to help them withstand transplanting and other stresses encountered in the field. 2017 was the first year of sales for LandSpring and it received positive reaction from key launch customers.
Our range of solutions for packers and distributors includes innovative storage monitoring systems, StorEdge and AdvanStore, as well as a new delivery system for fungicides, ActiMist. StorEdge and AdvanStore provide customers insights into their storage rooms to help them better manage their storage inventory. Through its novel thermofogging application, ActiMist introduces a better and more efficient way to apply fungicides to stored apples that saves customers money and reduces the complexity of their fungicide protocols. Tecnidex broadens our portfolio of products to post-harvest fungicides, waxes, and biocides, primarily for the citrus market.
RipeLock, a solution designed to improve the quality and consumer appeal of bananas, combines proprietary modified atmosphere packaging and 1-MCP. RipeLock is sold to retailers and enables them to offer consumers bananas that are in better condition and hold the consumer-preferred color longer, reducing shrink and increasing sales. AgroFresh also has a commercial agreementleadership with Food Freshness Technology Holdings Limited ("FFT") that permits us to offer retailers their It’s Fresh!TM ethylene absorbing filters, another novel technology to preserve the freshness of produce at retail.
History
We are a former blank check company that completed our initial public offering on February 19, 2014. On July 31, 2015 (the “Closing Date”), we consummated a business combination (the “Business Combination”) pursuant to a Stock Purchase Agreement, dated April 30, 2015 (the “Purchase Agreement”), with The Dow Chemical Company (“Dow”), providing for the acquisition by us of the AgroFresh business from Dow, resulting in AgroFresh Inc. becoming our wholly-owned, indirect subsidiary. On the Closing Date, we changed our name from Boulevard Acquisition Corp. to AgroFresh Solutions, Inc. Prior to
the closing of the Business Combination, the business that now comprises our business was operated through a combination of wholly-owned subsidiaries and operations of Dow, including through AgroFresh Inc. in the United States.
In December 2017 AgroFresh acquiredof a controlling interest in Tecnidex Fruit Protection, S.A. (“Tecnidex”) which is based in Valencia, Spain, one of the largest citrus producing regions in the world. Tecnidex, a leading provider of post-harvest fungicides, sanitizers, waxes and biocides forcoatings, is primarily focused on the citrus market. Through its portfolio of post-harvest products, technology, consulting, and after-sale services, Tecnidex improves the quality and value of its clients’ fruit and vegetables while respecting the environment.
Tecnidex brought a broad catalog of solutions that enhanced our existing offering, including fungicides that can be added to our innovative ActiMistTM delivery system of foggable fungicides. The expanded offerings further diversified our revenue by expanding our ability to provide more solutions and service the citrus industry. With this acquisition, AgroFresh expanded its industry-leading post-harvest presence into additional crops and increased its penetration of the produce market in southern Europe, Latin America and Africa. We continually seek opportunities to leverage this range of products across new geographies for both existing and new customers.
For over 35 years, Tecnidex has been helping
Complementing our post-harvest solutions, AgroFresh’s HarvistaTM technology is used for near-harvest management of pome fruit (apples and vegetable producers offer clean, safepears), blueberries and high-quality productscherries. Just as SmartFresh revolutionized post-harvest apple storage, we believe Harvista is starting to customershave a similar impact in 18 countries. Through its portfoliothe orchard. In apples, Harvista slows ripening, reduces fruit drop, and holds fruit on the tree longer to promote better color and fruit size. With maximum flexibility in application timing, it extends the harvest window by allowing growers to factor in ever-changing weather conditions and labor availability. We have found that the combination of post-harvest products,Harvista in the orchard and SmartFresh in the storage room results in improved apple quality compared to use of either product individually. When applied to cherries, Harvista offers an increase to yield of a minimum of 10%.
AgroFreshprovides freshness solutions across the supply chain, including retail where much of the ripening process and shrinkage occurs for certain crops. This includes bananas, the largest retail fruit category, and avocados, the fastest growing fruit category. According to data from the Journal of Consumer Affairs and Food and Agriculture Organization of United Nations, it is estimated that 12-16% of banana loss occurs after the fruit reaches the grocery store. SmartFresh technology consulting,can also address this problem and after-sale services, Tecnidex improvesimprove the quality and consumer appeal of bananas. SmartFresh application enables retailers to extend the consumer-preferred yellow life of bananas an additional 2-4 days, reducing shrinkage at the store level. As part of the same diversification efforts, we are also developing and promoting applications of SmartFresh adapted to diverse customer requirements for avocados, broccoli, melons, prunes, tomatoes and mangos.
Our FreshCloud™ platform is an example of how we continue to evolve and increase the value we provide to our customers. The FreshCloudTM platform consists of its clients’produce monitoring and screening solutions with real time information delivered in the “cloud” to customers. FreshCloud capitalizes on our decades-long history of innovation and scientific know-how in the physiology of fruits and vegetables. FreshCloud consists of both enhancements to our existing service offering and customer base and new solutions to reach more crops and steps in the distribution chain. FreshCloud Storage Insights combines proprietary sensor technology and data analytics in the storage room to offer customers real-time access to unique insights into the condition of their stored fruit. FreshCloud Predictive Screening predicts the risk of disorder development during storage by analyzing gene expression at commercial harvest, resulting in more informed storage management decisions. FreshCloud Transit Insights combines sensor technology and proprietary algorithms to provide insights into the condition and quality of fruit during transit. We continue to expand the scope of our FreshCloud offerings, and vegetables while respectingwe are in the environment. Tecnidex is based in Valencia, Spain.process of launching FreshCloud Quality Insights, which aims to integrate quality control and machine learning to drive better decisions through integrated data, as well as digitalization of current solutions such as Harvista.
In December of 2017, AgroFresh invested approximately $10$10.0 million for an approximate 15% ownership stake in and entered into a commercial agreement with FFT, provider of the award-winning It’s Fresh! ethylene removal filters in North America, Europe, the Middle East and Africa (“EMEA”) and Latin America. The proprietary active ingredient of It’s Fresh! has been found to be 100 times more powerful than any other ethylene-absorbing substances, providing a powerful tool to preserve food freshness. We expect It’s Fresh! to complement the RipeLockTM Quality System, our retail solution for extending the freshness of bananas. Through our commercial agreement with FFT, AgroFresh will market It’s Fresh! for high value crops such as berries, stone fruit, avocadoes, tomatoes and cherries, and open up new opportunities to address food waste in retail. FFT’s filters create a protective "Freshasphere"TM around fruit and vegetables to significantly improve their quality, reduce waste and increase sales. Although both companies will continue to operate independently, a key goal of the mutual collaboration is to increase penetration of each company’s respective technology at leading retailers. Where FFT has developed strong retailer relationships, it will serve asrecently shifted its strategic focus away from retailers to growers and packers and is devoting commercial efforts to the launch of a sales agentnew film technology. Due to lower projections while FFT ramps up for AgroFresh’s RipeLock program anda new product launch, AgroFresh will perform the same role for FFT’s It’s Fresh!TM filters with AgroFresh’s retail partners.recognized an impairment charge on its investment in FFT during 2019.
We are subject to extensive national, state and local government regulations. We have completed more than 400 comprehensive international health and environmental tests that have shown the AgroFresh family of products, including SmartFresh and Harvista, to be safe for consumers, workers and the environment. 1-MCP,1-Methylcyclopropene ("1-MCP"), the active ingredient in the AgroFresh products, is metabolized by the natural processes in fruits and leaves no residue. The AgroFresh products have been approved by over 50 authorities including the U.S. Environmental Protection Agency and the European Commission.
Competitive Strengths
We believe that the following strengths differentiate us from our competitors and serve as the foundation for our planned continued growth:
GlobalLeading Agricultural Innovator and Solutions Provider with Proprietary Technical Know-HowKnow-How. AgroFresh has been at the forefront of fresh produce preservation solutions since our inception. Our research and Solutions. We are an agricultural innovatordevelopment team include over 40 scientists, about half with operations in over 45 countries. Our scientists and research staffadvanced degrees, who are leaders in the fieldfields of post-harvestplant physiology. SinceBeginning with our creation of the launchcommercial market for 1-MCP applications for use in the preservation of SmartFresh in 2002,apples, we have developedproduced an extensive and exclusive database onof produce physiology and preferences ofconsumer preferences. Building on our approximately 3,700 customers. Using this extensive proprietary technical expertise, AgroFresh providesknowledge, we have developed an intellectual property portfolio, including over 500 granted and pending patents, that has enabled us to provide comprehensive and innovative solutions to a range of integrated solutions.global customer base. SmartFresh delivers a step-changesubstantial improvement in storage solutions for apples, pears, and pears,other crops, allowing for significantly less waste and greater productivity, as well as a constant supply of high qualityhigh-quality fruit throughout the year. We believeIn the U.S., we estimate that 90% of stored apples are treated with 1-MCP, and our SmartFresh technology continues to enjoy a strong leadership position in this treatment protocol. Extending our record of innovation in the post-harvest market, we entered the near-harvest market with the introduction of Harvista, haswhich extends the potentialideal harvest window for apples and pears, and increases production yields for cherries and blueberries to significantly impact the pre-harvest stage, allowing appleimprove harvest management and pear growers to better manage their harvest, reduce waste and improveenhance fruit quality. Building on this success, we entered the fungicide market with ActiMist and
subsequently enhanced our fungicide portfolio with the acquisition of Tecnidex in 2017. Our recent launch of FreshCloud is the latest milestone in our new product innovation. With StorEdge and AdvanStore,the FreshCloud platform, we expect to be able to provide packers unparalleled informationcustomers real time insights about the condition of their fruit while in cold storage using novel monitoring technologies. The introduction of ActiMist,
Diversified Global Presence Across All Major Growing Regions. We have established a fungicide platform delivered via thermofogging offers a more efficient and quicker application of fungicidesglobal footprint with key products approved in over 50 countries that supports customers with over 25,000 storage rooms simplifying operationsglobally. Our top ten customers represent less than 15% of the Company's total revenue, a sign of the strength and reducing complexity.resilience of our business. The combinationCompany's global commercial platform is unique in the post-harvest industry, positioned across six continents, bringing a full suite of Harvista, SmartFresh, ActiMist, StorEdgeAgroFresh solutions and AdvanStore offers apple and pear growers a unique solutionhigh-touch advisory services to improve the results they are ablecustomers in every key produce-growing region. Our ability to deliver to their customers. LandSpringin-depth technical services and products across every major continent is an additional pre-harvest technology that benefits seedling growers by making the seedlings less sensitive to stresses such as heat, cold and flooding. RipeLock is an innovative fruit quality management system for bananas, offering flexibility and consistency to growers, ripeners and retailers to deliver bananas at a ripeness preferred by consumers.fundamental competitive advantage in our pursuit of capturing growth opportunities. We believe that our storage solutionsglobal footprint provides not only a platform for growth but also greater diversification. Our participation in a wide range of markets protects the business from crop size fluctuations in any particular market. For the year ended December 31, 2019, EMEA, North America, Latin America and portfolioAsia Pacific (including China and India) represented 47.8%, 24.8%, 18.7% and 8.7% of pre- and post-harvest services are well positioned to help address customer needs.sales, respectively. The acquisition of a controlling interest in Tecnidex and the investment in FFT reflectmeaningfully contributed to our ability to expand beyond 1-MCP solutions and develop additional sources of revenue through a variety of crops.global diversification.
Compelling Benefits for Value Chain. Consumer surveys have found that freshness is the most important driver of satisfaction with produce purchased at retail. The ability to store produce longer while preserving just-harvested quality allows growers and packers to extend their marketing window and capitalize on seasonal pricing trends. We believe that SmartFresh revolutionized the apple industry by allowing growers and packers to meet year-round consumer demand for just-harvested quality. This
extension of post-harvest life substantially increases the value of produce that is harvested on a seasonal basis but is sold to consumers throughout the year, particularly during the summer months when apple prices have historically peaked. The cost of SmartFresh translates into less than one cent per pound of apples, and can provide up to a 20-fold increase in value to the grower or packer over the cost of the service. Due to its high effectiveness and low cost relative to the value of the crop treated, we believe that SmartFresh provides compelling benefits across the value chain, from grower to retailer.
UniqueService-Oriented Business Model withCreates Sustainable Competitive StrengthsAdvantages. AgroFresh’s direct service model provides better margins than the industry average, and comprises not only product applications but also “mission critical”mission-critical technical advisory services. We have established a global footprintOur sales and technical support personnel maintain direct interaction with operationsour customers in over 45 countries, allowing us to make over 38,000 monitored applicationsareas of SmartFresh in 2017. Wecontract negotiations and overall customer service. Furthermore, we currently have approximatelyover 40 employees indedicated research and development scientists, about half with advanced degrees, working inacross seven global AgroFresh locations, around the world and at numerous research institutes, and customer sites. This infrastructure investment has allowed us over the past decade, to amass a proprietary database of technical data regardingof plant physiology collected across our 20+ year history. In 2019, we made approximately 36,000 monitored applications of SmartFresh. Our proprietary database gives us unique insights into the causes of produce spoilage for various crops varieties in different regions as well as best practices for the effective use of SmartFreshSmartFresh. As a result, our local sales and technical service teams are best positioned to provide custom advice and solutions, giving our customers “peace of mind” between and during harvest season.
We believe FreshCloud can further bolster our integrated offerings with a wide rangethe addition of apple varieties in variable conditions. Our advisory services utilize this informationdata-backed solutions for the monitoring of produce quality across the supply chain. FreshCloud is designed to assistdeliver timely, predictive insights that will ultimately help our customers in maximizing the profitability of their operations. improve efficiency and enhance produce freshness.
We believe that our direct service model, extensive technical know-how, and brand loyalty will continue todifferentiate us from competitors and sustain our competitive strengths. The credibility
Strong Momentum and trust thisGrowth Opportunities across the Produce Supply Chain. We believe there are significant growth opportunities to expand and diversify our business, model has created positions AgroFresh wellsupported by our track record of new product introductions, market penetration, and mergers and acquisition (“M&A”) execution.
One key initiative is to provideincrease penetration of existing technologies into current and new customers with other solutions such as storage monitoringgeographic markets. While many apple growers and fungicides.
Multiple Drivers of Future Growth.packers in the U.S. have adopted SmartFresh, there is potential for further growth. The market penetration of apples treated with SmartFresh outside the U.S. has been growing internationally but has not yet reachedremains below the levels achieved in the U.S. We have also concentrated on accelerating penetration of SmartFresh into pears outside of the U.S., as well as plums, kiwifruit and persimmons. Based on successful trials with customers, we are increasingalso expanding our salescommercial activities for SmartFresh to increase its use on avocados, bananas, melons, tomatoes, broccoli and marketing efforts in non-U.S. regionsmangos, where we believe SmartFresh can optimize the consumer experience for ripeness, color, taste, and texture. Related to seek to capture these penetration opportunitiesthis effort, we are repositioning RipeLock as our brand for packaging- based freshness technology solutions for fruits and vegetables.
Harvista is another key product where we are actively working to increaseexpand geographic adoption. As of December 31, 2019, Harvista is registered in eight countries and we are currently working to obtain registrations in more than ten additional countries including the European Union (the "EU"). In the past few years, we received regulatory approval to apply Harvista to cherry crops in the U.S., blueberries in Chile, and apples in Australia and our team is working to achieve similar registrations in other markets. Additionally, in 2020 we received approval for use of SmartFreshHarvista on other crops, including pears, kiwifruit, plums,apples in Brazil. The main limitation to accelerated growth of Harvista is the long regulatory approval cycle in important markets like the EU.
We have further augmented our crop solutions portfolio through our acquisition of Tecnidex. The addition of Tecnidex fungicides, sanitizers, waxes and bananas. Harvista extendscoatings has diversified our crop exposure, reduced revenue seasonality, and provided new growth opportunities via cross-pollination of Tecnidex technologies into AgroFresh core fruit categories. As a result of all these initiatives, we have successfully diversified our proportion of sales attributable to apples from nearly 90% in July 2015 down to approximately 72% as of December 31, 2019.
Building on these growth initiatives, we continuously seek opportunities to leverage our research and development (“R&D”) capabilities to commercialize new products for currently unserved markets. At the same time, we are looking at M&A opportunities as another key strategy to enhance our value proposition and drive growth.
Long-Standing Relationships with Highly Diverse Customer Base. We believe our direct service model coupled with our proprietary technology into pre-harvest managementsolutions have helped us develop deep, trusted and long-tenured relationships with a diverse array of applesglobal customers including packers, growers, and pears. Harvista is undergoing an expandedretailers. For more than a decade, we have operated a large team of commercial launchand technical experts located in key geographies around the U.S. We also currently sell Harvista in Turkey, Argentinaworld to provide on-site custom advisory services. This infrastructure helps us maintain intimate and Israel, and plan further launches in South Africa and Chile soon. In addition, we are investing in and launching new solutions that we anticipate will drive continued business growth. LandSpring is another pre-harvest application approved for use on tomato and pepper seedlings and 14 other crops. It is applied to seedlings prior to transplant from the plant house to the field because transplanting is a stress event that causes the plant to produce ethylene. LandSpring blocks the negative effects of ethylene and allows for increased plant vigor including better root establishment, development of greater leaf surface, and less susceptibility to disease which all can lead to better yields. StorEdge and AdvanStore offer atmospheric monitoring that storage operators are not capable of achieving with existing controlled atmosphere (“CA”) technology. This advanced monitoring system is being developedconsistent interaction with our extensive understanding of fruit physiology, fruit respiration, current CA technology, and new proprietary diagnostic tools for measuring fruit volatiles and is designed to provide solutions to customers to help them protect the value of their crops. ActiMist is a platform for delivering fungicides in the storage rooms via thermofogging which enable packhouses to get their storage rooms to desired conditions faster and with less complexity. RipeLock combines 1-MCP with modified atmosphere packaging designed specifically for preserving the quality of bananas during transportation and extending their yellow shelf life for retailers and consumers.
High Customer Touch and Retention. Our personnel interact with our customers face to face throughout the year to addressunderstand all aspects of post-harvestharvest operations, andaddress a variety of customer specificcustomer-specific issues, toand ultimately improve the economics for growers, packers, and retailers across the supply chain. As a result of growersour unique service model and packers.comprehensive solutions, we have cultivated direct customer relationships in more than 50 countries. We believe that this, in turn, has producedhave also started some strategic customer relationships as a high levelway to penetrate new geographies and markets.
High Profit Margins, Strong, and Consistent Cash Flow Generation. Our technical expertise, long-standing customer relationships, and asset-light business model drive attractive, sustainable profit margins. For the year ended December 31, 2019, we generated gross margins and EBITDA margins of customer retention74% and trust in23%, respectively1. In addition, we employ an “asset-light”, outsourced production model. We use a single third-party manufacturer for our key active ingredient, 1-MCP, under a long-term contract with strict confidentiality obligations, to manufacture, and several other suppliers to formulate products and provide packaging services. For the manufacturing of waxes, sanitizers, and equipment servicing the citrus market, we have a combination of a manufacturing plant and several suppliers to formulate products and assemble equipment. As a result, our manufacturing footprint requires minimal capital investment and manufacturing personnel. For the year ended December 31, 2019, capital expenditures were $3.6 million, or 2.1% of net sales. Our attractive margin profile coupled with our asset-light solutions result in free cash flow generation, which will be used to reinvest in the business and repay debt.
ProvenStrong Management Team with Deep Industry Experience. Our management team has extensive food, agricultural and relatedchemical industry experience long-standing customer relationships, and a longproven track record of success in bringing valuable services andinnovative, value-added solutions to market. Commercialcustomers and technical experts are locatedmarkets around the world. The Company’s management team boasts over 125 years of combined relevant industry experience and is led by Jordi Ferre, our chief executive officer, who has over 25 years of experience in key geographies worldwide to provide on-site advisory services, which help customers optimize crop potential. We encourage an independentglobal food operations and entrepreneurial spirit amongmanufacturing.
During the past several years, our management team has effectively launched new products, established new partnerships across the supply chain and employees.completed a successful acquisition of the majority control of Tecnidex. Supported by a deep bench of professionals and a track record of execution, we believe our management team has the vision, expertise, and experience to position us for continued success and to implement our business and growth strategies.
1 EBITDA margin is a non-GAAP measure. See “Management’s Discussion and Analysis of Financial Condition and Results of Operations” in Item 7 of this Annual Report on Form 10-K for more information, and for a reconciliation of EBITDA to net (loss) income.
Industry Overview
Food Preservation and Freshness
According to the FAO,Food and Agriculture Organization of the United Nations, over 1.3 billion metric tons of food, or approximately one third of the total food produced worldwide, is lost to spoilage or waste each year, includingyear. Euromonitor reports that retailers are often judged on their fresh food valued at an estimated $48.3 billion in the U.S. alone. An October 2013 TESCO Consumer Study found that nearly 45% of all fresh fruits and vegetables, including 40% of apples and 20% of bananas, are lost to spoilage. Loss or waste along the food supply chain has a variety of causes, including degradation of fresh produce during storage and transportation.
Food waste is a major economic cost for retailers.selection. A large percentage of food waste at the retail level is based on qualitative factors related to consumer perception of freshness. A consumer survey conductedIn the U.S., the Environmental Protection Agency announced in 2015 the first-ever domestic goal to reduce food loss and waste by Oliver Wyman50 percent by 2030.
Loss or shrinkage along the food supply chain has a variety of causes, including degradation of fresh produce during storage and Ipsos Interactivetransportation.
AgroFresh strives to be the guardian of the world’s fresh produce and stands ready to lead the fresh produce industry into a more sustainable future. In 2019, we completed a detailed sustainability study about the influence of SmartFresh on the apple industry. From 2002 to 2018, we estimate that 259,500 metric tons of apple waste were diverted in the U.S., France and Italy alone. This reduced apple spoilage equates to more than 2.5 million metric tons of water. Improving the apple supply chain in those three countries during the same period took more than 10 million metric tons of carbon dioxide out of the air. This is equivalent to taking approximately two million cars off the road for one year or eliminating one billion smartphone charges. In other countries throughout the world, we estimate that SmartFresh reduced CO2 emissions by approximately 342,000 metric tons during that same period.
the U.S. in 2007 indicated that freshness is the most important driver of customer satisfaction with a store’s produce department.
Pre-HarvestNear-Harvest Treatments
Pre-harvestNear-harvest treatments commonly used to increase the value of crops and reduce pre-harvestharvest losses include the use of
“plant “plant growth regulators” (“PGRs”). during the last stages of crop growth. PGRs influence the rate of growth or development of crops or affect their reaction to stress events such as harsh weather. PGRs interact with the biochemical make-up of the plant and work by mimicking or blocking the production of naturally occurring plant hormones, like ethylene. Blocking the production of ethylene allows a grower to slow down the maturation of fruit to achieve better control over the timing of harvest. PGRs have a range of effectiveness depending on factors such as environmental conditions and the timing of applicationapplication. We consider applications in the orchard as “near-harvest” since they are applied right before the fruit is harvested and have synergistic effect with our post-harvest solutions.
Post-Harvest Treatments
Post-harvest treatments to maximize quality and reduce loss include treatments to manage the effects of ethylene and to prevent microbial contamination. Naturally occurring ethylene triggers the acceleration of ripening in certain crops which results in a reduction of post-harvest life.
One class of post-harvest treatments enhances quality and reduces losses by controlling the environment in which produce is stored. CAControlled Atmosphere ("CA") and Dynamic Controlled Atmosphere (“DCA”) systems are used to keep stored crops within their optimal ranges of temperature and levels of oxygen and carbon dioxide. Specific oxygen and carbon dioxide levels can lower respiration in fresh produce and delay ripening. CA systems have been used for many decades with fruits and vegetables to preserve freshness. DCA, a more recent innovation, seeks to adjust levels of oxygen and carbon dioxide dynamically as the produce in storage breathes and matures. CA and DCA are only effective at preserving freshness while the fruit is kept in cold storage. However, 1-MCP treatments have been found to be complementary to these technologies by helping to better maintain the quality of apples and pears during cold storage and maintaining freshness for up to 90 days after the applesthey are removed from cold storage.
Our Business
We are an agricultural innovator in proprietary advanced technologies that enhance the freshness, quality, and value of fresh produce. We currently offer SmartFresh applications at customer sites predominately through a direct service model utilizing third-party contractors. We also provide advisory services based on our extensive knowledge on the use of 1-MCP collected through tens of thousands of monitored applications done as a part of the service model. Our pricing to customers is based on the service provided, not on the product sold. We operate in over 4550 countries and derive the majority of our revenue working with customers to protect the value of apples, pears and other produce during storage. We also offer Harvista pre-harvest technology in the U.S,U.S., Canada, Argentina, Chile, Turkey, Israel, ChileAustralia and South Africa.Africa, and are expanding into Brazil starting in 2020. LandSpring an additional pre-harvest technology for seedlings, is being marketed primarily in the U.S. RipeLock, an innovative quality management system isand SmartFresh diversification efforts are being marketed mainly in the U.S., EuropeMexico and Australia.Peru. ActiMist a platform of foggable fungicides was launched in the U.S. and is being expanded into other countries subject to regulatory approval. Line extensions and new services are planned for introduction to seek to strengthen our global position in post-harvest storage and to capitalize on adjacent growth opportunities in pre-harvestnear-harvest markets.
Tecnidex’s business,AgroFresh has extended its post-harvest leadership with the acquisition of Tecnidex, a leading provider of fungicides, sanitizers, waxes, and coatings primarily focused on the citrus is mainly concentratedmarket. For over 35 years, Tecnidex has been helping fruit and vegetable producers offer clean, safe and high-quality products to customers in southern Europe18 countries with particular strength in the Mediterranean region. Tecnidex brought a broad catalogue of solutions that enhanced our fungicide offering, ActiMist, an innovative delivery system of foggable fungicides. Our fungicide offerings further diversify our revenue by expanding our ability to provide solutions and North Africa and expands our product offering into other types of fungicides, as well as waxes and coatings.service to the citrus industry.
1-MCP, the active ingredient in SmartFresh, LandSpring Harvista and RipeLock,Harvista, is an ethylene action inhibitor with a proven ability to maintain freshness and extend the shelf life of certain fresh produce. The 1-MCP molecule is structurally similar to ethylene, a naturally occurring plant hormone that occurs in certain fruits and vegetables. Ethylene helps produce grow and ripen, but eventually causes over-ripening and spoilage. 1-MCP works by blocking the ethylene receptors in plant cells, which temporarily delays the ripening process, enabling the produce to better maintain the qualities associated with freshness.
Today, two types of SmartFresh formulations are used to deliver 1-MCP into store rooms, powder and tablets. In a typical SmartFresh powder application, an AgroFresh service provider mixes a pouch of water-soluble powder with water in a SmartFresh generator and activates the generator to release the gaseous form of 1-MCP in the sealed storeroom. When using tablets, a service provider adds the tablets into a prepackaged formulated solution, the tablets dissolve in the solution and the gaseous form of 1-MCP is released in the storeroom. The gas released by either process interacts with the stored fruit, and firmly binds to the fruit’s ethylene receptor sites.
Fruits and vegetables are classified as climacteric or non-climacteric, a term referring to the process of fruit maturation. The climacteric event is a stage of fruit ripening associated with higher ethylene production and changes in the fruit including pigment changes and sugar release. The climacteric event marks the peak of edible ripeness, with fruits having the best taste and texture for consumption. The role of SmartFresh is to delay the onset of the climacteric stage until the product is ready for consumption. Apples, pears, kiwifruit, plums, persimmon, bananas, melons, peaches and tomatoes are examples of climacteric fruit. Our managementThe Company continues to evaluate the commercial value of 1-MCP with a range of other climacteric fruit.
SmartFresh Value Proposition
SmartFresh, our flagship solution, preserves the texture, firmness, taste and appearance of produce during storage, transportation and retail display. It allows growers and packers to deliver “just harvested” freshness on a year-round basis and enables retailers to increase customer satisfaction with fresh, high quality produce. An integral part of the SmartFresh value proposition is a direct service model providing customers with on-site applications of SmartFresh at their storage facilities together with mission-critical and value-added advisory services.
The value of SmartFresh with any crop is determined by both the biological efficacy with that crop and the utility value the application delivers to the customer. The biological efficacy with apples is high; apples are sensitive to ethylene and SmartFresh is effective at delaying ripening. In addition, SmartFresh brings high utility value by helping to keep apples fresh year-round despite their limited harvest window. This has resulted in the widespread adoption of SmartFresh by apple growers and packers throughout the world. The cost of SmartFresh translates into less than one cent per pound of apples, which is small relative to both the value of the crop and the importance of maintaining the quality of that crop during storage. Retail prices of apples in the U.S. typically range from $1.30-$4.50 per pound depending on the variety. The use of SmartFresh gives growers and packers the ability to store apples from one season to the next without losing their just picked quality characteristics.
Beneficial effects of SmartFresh have been proven across numerous apple varieties throughout the world. SmartFresh is also effective with other crops that are highly sensitive to ethylene, including pears, kiwifruit, plums, persimmons, avocados, melons, tomatoes and broccoli, each of which requires a different application method and supply chain logistics beyond storage rooms. We also offer a corresponding solution for flowers, the latter marketed under the EthylBloc brand name through two strategic partners that have a strong position in the global flower market.
AgroFresh’s business historically has been highly seasonal, driven by the timing of apple harvests in the northern and various private label brands.southern hemispheres. The first half of the year is when the southern hemisphere harvest occurs, and the second half of the year is when the northern hemisphere harvest occurs. Since the northern hemisphere harvest of our two core crops of apples and pears is typically larger, a significant portion of our sales and profits are historically generated in the second half of the year. In addition to this seasonality, factors such as weather patterns may impact the timing of the harvest within the two halves of the year. Crop diversification is an important way to achieve balanced revenues across the year, and the ability to service the citrus segment provides an opportunity for the Company to increase revenue in the fourth and first quarters, which are the two strongest quarters for citrus crops. Our acquisition of a controlling interest in Tecnidex and an increased presence in the citrus category has moderately reduced the historic concentration of sales in the second half of the year.
SmartFresh Service Model
We believe that we have developed deep, trusted relationships with our customers by combining our effective SmartFresh product with application expertise and trusted advisory services. Over the past decade we have amassed a valuable proprietary database of technical information on the best practices for the effective use of SmartFresh on a wide range of apple and pear varieties.varieties, since each fruit and fruit variety requires a different treatment protocol. The advisory services component utilizes this information to help maximize the profitability of our customers’ operations.
Seasonality
Our business is highly seasonal, driven by the timing of harvests in the northern and southern hemispheres. The first half of the year is when the southern hemisphere harvest occurs and the second half of the year is when the northern hemisphere harvest occurs. Since the northern hemisphere harvest is typically larger, a significant portion of our sales are historically generated in the second half of the year. In addition to this seasonality, factors such as weather patterns may impact the timing of the harvest within the two halves of the year.
Our Other Products
Harvista
Complementing our post-harvest solutions, Harvista is a pre-harvestused for near-harvest management product that brings ethylene management into orchardsof apples, pears, cherries and fields.blueberries. Our Harvista product line includes several proprietary 1-MCP formulations that are specifically designed to keepslow ripening, reduce fruit drop, and hold fruit on the tree longer which allows moreto promote better color and fruit size, developmentthereby bringing new benefits to the grower. With maximum flexibility in application timing, it extends the harvest window by allowing growers to factor in ever-changing weather conditions and reduceslabor availability, providing peace of mind. We have found that the combination of Harvista in the orchard and SmartFresh in the storage room results in improved fruit stress.
Harvista provides flexibility for fruit harvesters when it is needed the most - within a few days before harvest or when bad weather strikes. Additionally, application prior to, or following, a stress event such as bad weather helps to reduce the incidence of fruit drop or other adverse reactions triggered by these events, which can lower crop yields and cause significant economic loss. We believe the flexibility to apply treatment close to harvest provides growers using Harvista with valuable harvest management benefitsquality metrics compared to competing solutions using older technology that require applications well in advanceuse of harvest.either product individually.
Harvista extends the “ideal harvest window,” the period during which fruit quality is at its peak, by keeping the fruit on the tree longer. For pome fruits, Harvista can extend the length of the harvest windowwindow” for up to an additional 14 days. This added flexibility creates significant benefits both in terms of harvest logistics and crop profitability. Widening the harvest window allows for better scheduling and the optimization of limited resources, such as harvest crews and equipment. The extended harvest window can result in increased average size and weight of fruit. Overall, the value of the crop is enhanced by bigger average sizes,fruit size, better color, and fewer defects.
We offer Harvista for apples, pears, cherries and pearsblueberries through a pre-scheduled application service including aerial and/or ground applications.applications depending on the crop and growing region. Typically, our technical staff designs the protocol in consultation with the customer, and either a third-party service providers makeprovider or the applications. We have also implemented a program to allow customers to make their own applications through AgroFresh-owned sprayers or using kits to modifycustomer makes the customers' own sprayers. This gives orchard operators flexibility to manage the application timing to meet orchard conditions.application.
Harvista is currently available in the U.S., Canada, Turkey, Argentina, Brazil, Israel, Chile, Australia and South Africa, and the Company is currently compiling data for registrations in more than ten more countries, which are expected to be granted on a country by country basis over the next five years. In 2017, we received regulatory approval to apply Harvista to cherries.cherries in the U.S. and blueberries in Chile. Additional registrations and label expansions are expected to be pursued as new formulations and/or crop concepts are validated.
StorEdge & AdvanStoreFreshCloud
Our StorEdgeTo continue to evolve and AdvanStore platforms are usefulincrease the value we provide to our customers, we recently launched our FreshCloud suite of produce monitoring and screening solutions. FreshCloud Storage Insights combines proprietary sensor technology and data analytics in monitoringthe storage room to offer customers real-time access to unique insights into the condition of producetheir stored fruit. FreshCloud Predictive Screening predicts the risk of disorder development during storage. StorEdge provides confirmation, within days that a SmartFresh application was completed successfullystorage by analyzing gene expression at commercial harvest, resulting in more informed storage management decisions. FreshCloud Transit Insights combines sensor technology and provides additional data about storage room conditions the customers can useproprietary algorithms to identify issues. The AdvanStore offering includes on-going monitoring, analytics and feedbackprovide insights as to enable the customer to more optimally manage the condition of the stored commodity and receive early notice of conditions present in the room that may be detrimental to the quality of the produce. Through internal innovation, use of sophisticated analysis and external alliances, the AdvanStore platform reflects our strategy to provide proprietary complete storage solutions to customers by leveraging our extensive knowledge of fruit physiology.during transit.
RipeLock
RipeLock is an innovative fruit quality management system specifically designed for the banana industry. The patented RipeLock system combines a specially-engineered, micro-perforated form of Modified Atmosphere Packaging (“MAP”) and our proprietary 1-MCP formulation. The combination of MAP with 1-MCP provides greater control over the ripening progression of bananas during shipping, distribution, and display. We believe that bananas handled with RipeLock technology retain their bright-yellow color, firm texture, fresh taste, and appealing look for significantly longer than untreated bananas. As a result, RipeLock maximizes the marketable “yellow life” of the fruit, providing economic benefits to brand owners and retailers. Commercial launch of RipeLock began in 2015, and it is now generating revenue among ripeners, food service companies and retailers in the U.S., Europe and Central/Latin America.
LandSpring
LandSpring technology is a PGR for use on seedlings to help them withstand transplanting and other stresses encountered in the field. LandSpring’s active ingredient, 1-MCP, preventsLandSpring suppresses the ethylene signals that would prompt a stress event in the seedling and reduce growth. Among the number of protective benefits, this technology makes seedlings less sensitive to stresses such as heat, cold, UV radiation, drought, flooding and salinity that often occur after planting. When applied before transplanting, LandSpring results in greater plant vigor and a healthier crop that is better able to withstand adverse environmental conditions and give growers the opportunity to increase yield.
Growth Strategy
Our mission is to provide technology, service and support targeted at preserving the quality, freshness and value of produce, through the value chain, worldwide. We have a high touch, asset light, technology driven solutions philosophy. We intend to pursue profitable growth by building on our current capabilities and competencies, expanding into adjacent markets and pursuing related, accretive acquisitions.
Our focus is to:
Strengthen our brand awareness and loyalty through customer relationship programs, intellectual property protection and year-round customer engagement. AgroFresh believes this focus, building on its philosophy of customer intimacy and its sustainable competitive advantages, will allow it to secure and grow its current business.
Further penetrate short term cold storage opportunities in all regions. AgroFresh currently provides its offering to over 80% of U.S. apples stored beyond 30 days. This percentage is much lower in Latin America, Asia Pacific and Europe.
Penetration is typically driven by the pace of registrations, which were earliest in the U.S., and AgroFresh sees these other geographies presenting further opportunities for growth moving forward, as well as shorter term apple storage opportunities in all regions with existing customers.
Extend to other produce, including bananas, pears, and other crops that have the ethylene physiology which responds positively to 1-MCP. One example is RipeLock for bananas. AgroFresh believes it will be able to provide a measurable extension of “yellow life” as well as prevent disorders like split-peel, both of which are highly desired value drivers throughout the supply chain, especially at retail and consumer levels where consistent quality is expected to increase sales.
Expand into other segments such as pre-harvest fruit quality management, fungal and microbial control solutions, diagnostics and storage management solutions. Solutions developed in-house include Harvista, LandSpring, ActiMist and AdvanStore.
Diversify and grow via alliances and accretive acquisitions, building on our numerous core competencies. AgroFresh anticipates proactively pursuing these opportunities. Our acquisition of a controlling interest in Tecnidex is one such example facilitating our expansion into fungicides, biocides, waxes and coatings. In addition, we expect our agreement with FFT to complement RipeLock by bringing a new type of freshness solution to the same retailers we are engaging.
Operations
We operate in more than 45 countries around the world. Currently, we use a single third-party manufacturer (and have a second supplier qualified), under a long-term contract that includes strong confidentiality obligations, to manufacture our key active ingredient, 1-MCP, and several other third parties, primarily to manufacture formulated products and provide product packaging services. We have no owned manufacturing facilities or manufacturing personnel.
We use a high-touch service model for our commercially available products including SmartFresh and Harvista. Sales and sales support personnel maintain direct relationships with customers year-round, which our technical sales and support personnel work directly with customers to provide value-added advisory services regarding the application of SmartFresh and Harvista. The actual application of SmartFresh and Harvista is performed by service providers that are typically third-party contractors. In addition to providing Harvista full service at customer orchards in 2017, we provide retrofit kits to customers to allow them to use their own sprayers to make applications themselves.
We have a dedicated customer service organization responsible for fulfilling customer-related requirements as well as coordinating all services being delivered by our service providers. During the harvest season, temporary third-party resources are added to the customer service organization to support the high volume of transactions and activities.
Marketing and Sales
Our success depends on our ability to attract and develop the talent to effectively implement our strategy. AgroFresh changed its organizational structure and leadership team to support its strategic growth and diversification objectives. The goal of the organizational change is to consolidatehas consolidated the Company’s core business units under a global general managerfour seasoned commercial directors while adding leadership and focus to accelerate new business development activities. Over the past year,In 2018, we have been strengthening and deepening our management organization. We have hired a vice president and global general manager to lead our post-harvest offerings and a director of global retail solutionscrop diversification to lead the RipeLockdiversification of commercial opportunities.opportunities as well as expansion into crops other than pome fruit and citrus. In 2019, we added a business leader to target citrus expansion in California, Peru and Mexico.
The Company’sCompany's core post-harvest business includes SmartFresh, ActiMist, StorEdge and AdvanStore, allsolutions designed to strengthenimprove the company’s leadership inyields of growers and packers. These solutions include SmartFresh, Harvista, ActiMist, FreshCloud Storage Insights, FreshCloud Predictive Screening and a large range of fungicides, waxes and coatings, marketed under the post-harvest space. There is one global general manager with separate regional leads for North America, EMEA, Latin Americabrands Textar and APAC.Teycer, respectively.
The 2017 acquisitionIntegration of Tecnidex continued to progress well in 2019, with all functional departments now aligned with AgroFresh’s global structure, including consolidation of all sales teams. In addition, SAP was managed as a separate business unit and integration is well under wayimplemented across the Tecnidex organization in 2018.April 2019.
The technical sales support group housed within the Research and Development organization, supports the sales team. Technical sales supportteam and runs customer-specific trials for local crop varieties or specialized storage and distribution conditions and conducts follow-up with customers. These individuals workThis team works closely with customers to provide advice on appropriate protocols for SmartFresh, Harvista and Harvistaother product applications depending on crop, variety, region, and climatic conditions. The technical sales support group draws on our extensive knowledge base of 1-MCP applications across all regions and conditions.
Marketing and communications functions areThe marketing function is organized on a global and regional basis. The regionalThis includes global brand management and corporate brand/image stewardship and regionally developed marketing strategies and tactics to drive growth and customer penetration. Marketing personnel are embedded within the Company’s operating regions to provide maximum ability to collaborate with local sales teams manage the core post-harvest business'sand capitalize on business opportunities. Regional marketing needs, while the Global marketing department is responsible for corporate brand stewardship
and communications, as well as serving as a center of excellence to support all product launches, advertising and trade shows. The teams reach out tointeract with customers to keep them up to date on the latest research and news about AgroFresh products. Market research, including product penetration, collecting competitive intelligence and tracking other relevant market and industry information, is managed globally in conjunction with the regional teams.
No single customer accounted for more than 10% of net sales in 2017, 2016,2019, 2018 or 2015.2017.
Competition
TheWe estimate the size of the core post-harvest market forto be approximately $500 million on a global basis. The post-harvest solutions is fragmented with various regional suppliers or products.offered include 1-MCP-based solutions, fungicides and coatings, representing approximately 36%, 20% and 24% of the total market, respectively. The market for the use of 1-MCP is evolving and we expect to continue to facehave faced growing competition as oursince the expiration of the 1-MCP use patent in 2014. We estimate that citrus applications represent approximately 60% of the total core
post-harvest market, which is why we are focused on seeking to grow in this important crop segment. The market for post-harvest solutions is fragmented with various regional suppliers. Including AgroFresh, there are three leading providers with global reach that account for about two thirds of global post-harvest sales. Other regional players, mainly in citrus, account for approximately another 20% of post-harvest sales. Additional key patent expires. We compete with other pre- andplayers in the post-harvest crop preservation providers that have similar product claims and offer potential functional substitutes for our products. Current competitors include: dynamic controlled atmosphere storage companies, including Harvest Watch; Janssen Pharmaceutical and Pace International; and 1-MCP generic sellersindustry include fungicide suppliers such as AgroBest, FitomagSyngenta and several Chinese companies.Janssen PMP who hold post-harvest registrations of fungicides previously approved for pre-harvest applications. In the near-harvest segment, ReTainTM is used pre-harvest for extending the harvest season acrossa competitive technology to Harvista that is offered by Valent in all regions withexcept for the exception of the European Union.EU. We believe that the principal factors of competition in our industry include reputation, product quality, customer service and customer intimacy, product innovation, technical service and value creation. We believe that we compete favorably with competitors on the basis of these and other factors. See the subsection titled “Competitive Strengths” above.
Research and Development
Research and development plays an important role at AgroFresh in supporting customers as well as developing line extensions and new products. ApproximatelyResearch and development is a truly global function with less than half of our research and developmentR&D resources are located in facilities in North America, withand the remainder across theour other regions. Approximately 30% of our research and development resources are third-party contractors. During fruit harvest times (August to November in the Northern Hemisphere and late January to early May in the Southern Hemisphere), we hire additional third-party contract scientists to assist AgroFresh in the execution of experiments involving Harvista, SmartFresh, and AdvanStoreFreshCloud technologies. Most of the regional research and development facilities focus on business aligned research and development initiatives to develop line extensions and create new products. Research and development makes use of core competencies in a number of technical areas including post-harvest physiology, analytical chemistry, regulatory sciences, regulatory affairs, formulation science, formulation process development, organic chemistry and delivery systems. Initiatives focused on next generation solutions utilize expertise in material science, molecular biology, postharvestpost-harvest pathology, diagnostics and sensor technology.
Intellectual Property
We are a technology-based solutions provider and, as such, rely on a combination of important intellectual property strengths, including licenses, patents, trademarks, copyrights and trade secret protection laws to protect our proprietary technology and our intellectual property. We seek to control access to and distribution of our proprietary information. We enter into confidentiality agreements with our employees, consultants, customers, service providers and vendors that generally provide that any confidential or proprietary information developed by us or on our behalf be kept confidential including, but not limited to, information related to our proprietary manufacturing process and SmartFresh service model. In the normal course of business, we provide our intellectual property and/or our products protected by our intellectual property to third parties through licensing or restricted use agreements.
We obtainedToday a majority of our SmartFresh applications use ProTabsTM, an exclusive license from North Carolina State University under the Sisler patent (U.S. 5,518,988) for the use of 1-MCPapplication method patented through 2022, and we continue to delay ripening of fruit and flowers. This patent has expiredinvest in the United States and Europe and continues only in Japan until May of 2020. We also acquired the Daly patent (U.S. 6,017,849) for the encapsulation complex of 1-MCP and alpha-cyclodextrin, usedapplication technologies as the foundational component in SmartFresh and Harvista. Depending on the country, SmartFresh is currently protected by a patent for the encapsulation complex through 2018 or 2019.means to continue to facilitate an even better service to our customers. We have also generated an impressive portfolio of intellectual property with over 30 patents granted in at least one country (pending in other countries) covering 1-MCP and next generation technologies, most of which do not expire until 2025 or beyond. RipeLock and Harvista formulations are patent protected through at least 2027.
Regulation and Compliance
We are subject to extensive national, state and local government regulation, and we have an internalthe Company has a regulatory team that we believe is best in class, which leverages a global network of highly-experienced regulatory consultants. Through this network, we have successfully obtained registrations for SmartFresh, Harvista, RipeLock, and LandSpring in every country where the review process has been completed, and the registration process for Harvista continues in many additional countries. We have completed more than 400
comprehensive international health and environmental tests that have shown the AgroFresh family of products, including SmartFresh and Harvista are safe for consumers, workers, and the environment. 1-MCP, the active ingredient in the AgroFresh products, is metabolized by the natural processes in apples and other fruits and leaves no residue. The products have been approved by over 50 authorities including the U.S. Environmental Protection Agency and the European Commission. We do not anticipate any significant problems in obtaining future required licenses, permits or approvals that are necessary to expand our business. We leverage our regulatory capabilities as we expand the fungicide product lines into new countries.
For a discussion of the various risks we may face from regulation and compliance matters, see “Risk Factors” in Item 1A of this report.
Employees
As of December 31, 2017,2019, we had approximately 284292 full-time employees. None of our employees in North America are members of a union or subject to the terms of a collective bargaining agreement. In certain other countries where we operate (including
(including Brazil, France, Germany, Italy, Netherlands and Spain), employees are members of unions or are represented by works councils. In addition, certain of our activities have been performed historically by seasonal and part-time third-party contingent staff.
Geographic Information
Please see Note 1619 to the audited consolidated and combined financial statements for geographic sales information.
Available Information
Our website is at http://www.agrofresh.com. We make available free of charge, on or through our website, our annual report on Form 10-K, quarterly reports on Form 10-Q, current reports on Form 8-K and amendments to those reports, if any, or other filings filed or furnished pursuant to Section 13(a) or 15(d) of the Securities Exchange Act of 1934, as amended (the "Exchange Act"), as soon as reasonably practicable after electronically filing or furnishing these reports to the Securities and Exchange Commission ("SEC"). Information contained on our website is not a part of this Annual Report on Form 10-K. We have adopted a code of business conduct applicable to our employees including our principal executive, financial and accounting officers, and it is available free of charge, on our website’s investor relations page.
The SEC maintains an Internet site at http://www.sec.gov that contains our annual report on Form 10-K, quarterly reports on Form 10-Q, current reports on Form 8-K and amendments to those reports, if any, or other filings filed or furnished pursuant to Section 13(a) or 15(d) of the Exchange Act, and our proxy and information statements. All reports that we file with the SEC may be read and copied at the SEC’s Public Reference Room at 100 F Street, N.E., Washington, DC, 20549. Information about the operation of the Public Reference Room can be obtained by calling the SEC at 1-800-SEC-0330.
ITEM 1A. RISK FACTORS
Ownership of our securities involves a high degree of risk. Holders of our securities should carefully consider the following risk factors and the other information contained in this report, including our historical financial statements and related notes included herein. Additional risks and uncertainties not presently known to us, which we currently deem immaterial or which are similar to those faced by other companies in our industry or businesses in general, may also impair our business or operations. If any of the following risks or uncertainties actually occur, our business, financial condition and operating results could be adversely affected in a material way. This could cause the trading prices of our securities to decline, perhaps significantly, and you may lose part or all of your investment.
Risks Related to Our Business and Industry
Increased competition in our industry can lead to pricing pressure, reduced margins or the inability of our products and services to achieve market acceptance.
We serve established and knowledgeable customers in the business of growing, storing and handling fresh produce and flowers. Key SmartFresh patents have expired or will expire over the next two years.
Actions by new or existing competitors, including introduction of competing products or services, promotions, combinations with other products or services, or price-cutting may lower our sales or require actions to retain and attract customers which could adversely affect our profitability. Increased competition from existing or new competitors could result in price reductions, increased competition for materials, reduced margins or loss of market share, any of which could materially and adversely affect our business and our operating results and financial condition. For example, during 2017 and 2018, we decreased our pricespricing in the U.S. to defend market share against increased competition, andcompetition. We believe the situation stabilized during the 2019 season. We may be requiredelect to take similar actionsaction in other regions such as Europe in the future.future, depending on competitive pressures.
In addition, if the prices at which our customers sell their products increase or decrease, the demand for our products or services may change. If the demand for our products or services decreases, there could be a significant impact on our business in the applicable location or region resulting inand a material adverse effect on our revenues and results of operations.
Our relationship with our employees could deteriorate, and certain key employees could leave, which could adversely affect our business, financial condition and results of operations.
Our business involves complex operations and demands a management team and workforce that is knowledgeable and expert in many areas necessary for our operations. As a company focused on both research and development and customer service in the highly-specialized horticultural pre- and post-harvest fields, we rely on our ability to attract and retain skilled employees, consultants and contractors, including our specialized research and development and sales and service personnel. As of December 31, 2017,2019, we employed approximately 284292 full-time employees, of which approximately 199148 were members of our research and development and sales and service teams. The departure of a significant number of our highly skilled employees, consultants or contractors or one or more employees who hold key regional management positions could have an adverse impact on our operations, including as a result of customers choosing to follow a regional manager to one of our competitors.
In addition, to execute our growth plan we must attract and retain highly qualified personnel. Competition for these employees exists; new members of management must have significant industry expertise when they join us or engage in significant training which, in many cases, requires significant time before they achieve full productivity. If we fail to attract, train, retain, and motivate our key personnel, our business and growth prospects could be severely harmed.
In addition, certain of our key full-time employees are employed outside the United States. In certain jurisdictions where we operate, labor and employment laws may grant significant job protection to employees, including rights on termination of employment. In addition, in certain countries where we operate (including Brazil, France, Germany, Italy, Netherlands and Spain), our employees are members of unions or are represented by works councils as required by law. We are often required to consult and seek the consent or advice of these unions and/or works councils. These laws, coupled with any requirement to consult with the relevant unions or works councils, could adversely affect our flexibility in managing costs and responding to market changes and could limit our ability to access the skilled employees on which our business depends.
In addition, certain activities of our business have been performed historically by seasonal and part-time third-party contingent staff. Changes in market and other conditions (including changes in applicable law) affecting employees and/or contingent staff could adversely impact the cost to our business of maintaining our employees and third-party staffing.
We are subject to risks relating to portfolio concentration.
Our business is highly dependent on a small number of products, primarily SmartFresh, based on one active ingredient, 1-MCP, applied to a limited number of horticultural products. In 2017,2019, we derived over 85%approximately 76% of our revenue working with customers using SmartFresh to protect the value of apples, pears and other produce during storage. We expect these applications, products and active ingredients to continue to account for a large percentage of our profits in the near term. Our ability to continue to market and sell products containing this active ingredient in existing and new crop segments is important to our future success.
Our net sales and gross profit have historically been generated from one service platform but future growth in net sales and gross profit will likely depend on the development of new product and service platforms, geographic expansion and expansion into new applications. Net sales and gross profit may vary significantly depending on our product, service, customer, application and geographic mix for any given period, which will make it difficult to forecast future operating results.
Our net sales and gross profit vary among our products and services, customer groups and geographic markets. This variation will increase as we attempt to increase sales into new geographies and applications, and as we diversify into other crops and introduce new product and service platforms. Net sales and gross profit, therefore, may differ in future periods from historic or current periods. Overall gross profit margins in any given period are dependent in large part on the product, service, customer and geographic mix reflected in that period’s net sales. Market conditions, competitive pressures, increased material or application costs, regulatory conditions and other factors may result in reductions in revenue or create pressure on the gross profit margins of our business in a given period. Given the nature of our business and expansion plans, the impact of these factors on our business and results of operations will likely vary from period to period and across products, services, applications and geographies. As a result, we may be challenged in our ability to accurately forecast our future operating results.
Acquisitions or investments may not yield the returns expected, which, in turn, could adversely affect our business, financial condition and results of operations.
In December 2017, we completed the acquisition of a controlling interest in Tecnidex Fruit Protection, S.A.U., a
leading provider of post-harvest fungicides, waxes and biocidessanitizers for the citrus market, and we have also made investments in
several technologies that we believe are promising.market. We expect to continue to selectivelymay further pursue strategic acquisitions, as well as investments in technologies. Acquisitions present challenges, including geographical coordination, personnel integration and retention of key management personnel, systems integration, the potential disruption of each company’s respective ongoing businesses,business, possible inconsistencies in standards, controls, procedures, and policies, unanticipated costs of terminating or relocating facilities and operations, unanticipated expenses relating to such integration, contingent obligations, and the reconciliation of corporate cultures. Those operations could divert management’s attention from the business, cause a temporary interruption of or loss of momentum in the business, and adversely affect our results of operations and financial condition. Acquisitions are an important source of new products and active ingredients, technologies, services, customers, geographies and channels to market. The inability to consummate and integrate new acquisitions on advantageous terms could adversely affect our ability to grow and compete effectively.
If Tecnidex FFT or any technologies we have invested in, or any other acquisitions or investments we have completed or may complete do not meet our expectations for any reason, we may not achieve our forecasted results. There can be no assurance that the pre-acquisition analyses and the diligence we conducted in connection with any acquisition or investment will uncover all material issues that may be present in a particular target business or investment, or that factors outside of the target business or investment and outside of our control will not later arise. In such event, we may be required to subsequently realize restructuring, impairment or other charges that could have a significant adverse effect on our business, financial condition and results of operations.
Furthermore, we might not be able to identify additional suitable acquisition or investment opportunities or obtain necessary
financing on acceptable terms and might also spend time and money investigating and negotiating with potential acquisition or
investment targets but not complete the transaction.
Conditions in the global economy may adversely affect our net sales, gross profit and financial condition and may result in delays or reductions in our spending that could have a material adverse effect on our business, financial condition and results of operations.
Although demand for fresh horticultural products is somewhat inelastic in developed economies, the fresh produce and flower industries that we sell to can be affected by importantmaterial changes in supply, market prices, exchange rates and general economic conditions. Delays or reductions in our customers’ purchasing or shifts to lower-cost alternatives that result from tighter economic market conditions would reduce demand for our products and services and could, consequently, have a material
adverse effect on our business, financial condition and results of operations.
We may be adversely affected by the recent coronavirus outbreak.
In December 2019, a novel strain of coronavirus was reported to have surfaced in Wuhan, China. While we have minimal business in China, our operations could be adversely affected to the extent that coronavirus or any other epidemic harms the global economy in general or demand for fresh horticultural products generally. Our operations may experience disruptions in the event of a global pandemic or restriction on travel that results from a global pandemic, which may materially and adversely affect our business, financial condition and results of operations. The extent to which the coronavirus or other health epidemic may impact our results will depend on future developments, which are highly uncertain and cannot be predicted.
Our substantial level of indebtedness could materially and adversely affect our business, financial condition and results of operations.
We have a significant amount of indebtedness. As of December 31, 2019, our total indebtedness was approximately $407 million, including $406 million in outstanding principal under a term loan with a scheduled maturity date of July 31, 2021. This substantial level of debt could have a variety of negative effects, including:
•default and foreclosure on our assets if our operating revenues are insufficient to repay our debt obligations;
•acceleration of our obligations to repay the indebtedness even if we make all principal and interest payments when due if we breach certain covenants that require the maintenance of certain financial ratios or reserves without a waiver or renegotiation of that covenant;
•our immediate payment of all principal and accrued interest, if any, if the debt security is payable on demand;
•our inability to obtain necessary additional financing if the debt security contains covenants restricting our ability to obtain such financing while the debt security is outstanding;
•our inability to pay dividends on our common stock; and
•using a substantial portion of our cash flow to pay principal and interest on our debt, which will reduce the funds available for dividends on our common stock if declared, our ability to pay expenses, make capital expenditures and acquisitions, and fund other general corporate activities.
We may not be able to generate sufficient cash to service all of our indebtedness and may be forced to take other actions to satisfy our obligations under our indebtedness, which may not be successful.
Our ability to make scheduled payments on or refinance our debt obligations depends on our financial condition and operating performance, which are subject to prevailing economic and competitive conditions and to certain financial, business, legislative, regulatory and other factors, some of which are beyond our control. We may be unable to maintain a level of cash flows from operating activities sufficient to permit us to pay the principal, premium, if any, and interest on our indebtedness.
If our cash flows and capital resources are insufficient to fund our debt service obligations, we could face substantial liquidity problems and could be forced to reduce or delay investments and capital expenditures or to dispose of material assets or operations, seek additional debt or equity capital or restructure or refinance our indebtedness. We may not be able to effect any such alternative measures, if necessary, on commercially reasonable terms or at all and, even if successful, those alternative actions may not allow us to meet our scheduled debt service obligations. If we are unable to make payments or otherwise default on our debt obligations, the lenders could foreclose on our assets, which would have a material adverse effect on our business, financial condition and results of operations.
If we are unable to obtain additional debt or equity capital, restructure or refinance our indebtedness, or avail ourselves of alternative actions, our Term Loan ($405.9 million as of December 31, 2019) will become a current liability in the third quarter of 2020, which could raise doubts about our ability to continue as a going concern.
Our expansion depends on further penetration in existing markets and growth into new geographic markets, products, services and applications.
Our growth depends on our ability to achieve further penetration into existing markets and expand into new geographic markets where there may be little or no knowledge of our brands or service offerings. There are significant differences in fresh produce handling practices from geographic region to region. If we cannot generate further penetration in existing markets or create brand awareness and successfully adapt our sales and distribution practices to new markets, this could have an impact on our
ability to generate greater revenue. Expansion into new geographic markets will require us to establish our value proposition for local fresh produce industries and to comply with new regulatory and licensing regimes. Longer registration lead times and a relatively fragmented post-harvest infrastructure in certain jurisdictions could have a material adverse effect on our results of operations and prospects in those markets.
Our growth also depends on our ability to apply current and future technologies to an expanded range of agricultural products. If the adoption of our products and services by growers, packers, and retailers of these agricultural products is slower than anticipated, or if the prices that these customers are willing to pay for our products and services are lower than anticipated, this could negatively impact our ability to increase revenue from current levels.
Failure to manage our growth effectively using our existing controls and systems could harm our business, financial condition and operating results.
Our existing management systems, financial and management controls and information systems may be inadequate to support our planned expansion. Managing any such growth effectively will require us to continue to enhance these systems, procedures and controls and to hire, train and retain management and employees and to engage new material suppliers and service providers. We may not respond quickly enough to the changing demands that our expansion will impose on our management and existing infrastructure, which could harm our business, financial condition and results of operations. Failure to appropriately manage safety, human health, product liability and environmental risks could adversely impact employees, communities, stakeholders, the environment, our reputation and our business, financial condition and results of operations.
We may be unable to respond effectively to technological changes in our industry, which could reduce the demand forourproducts.
Our future business success will depend upon our ability to maintain and enhance our technological capabilities and develop and market products, services and applications that meet changing customer needs and market conditions in a cost-effective and timely manner. Maintaining and enhancing technological capabilities and developing new products may also require significant investments in research and development. We may not be successful in developing new products, services and technology that successfully compete or be able to anticipate changing customer needs and preferences, and our customers may not accept one or more of our new products or services. If we fail to keep pace with evolving technological innovations or fail to modify our products and services in response to customers’ needs or preferences, then our business, financial condition and results of operations could be adversely affected.
We currently rely on a limited number of suppliers to produce certain key components of our products.
We rely on unaffiliated contract manufacturers to produce certain key components of our products. There is limited available manufacturing capacity that meets our quality standards and regulatory requirements, especially for the manufacturing of the active ingredient, 1-MCP. Our 1-MCP needs are currently sourced from a single qualified supplier, although we currently have sufficient safety stock to allow us to withstand a disruption in supply from that supplier. In addition, we have qualified a second supplier to provide our active ingredient in the event of a disruption from our current supplier. However, if we are unable to arrange for sufficient production capacity among our contract manufacturers or our contract manufacturers encounter production, quality, financial, or other difficulties, including labor or geopolitical disturbances, we may encounter difficulty in meeting customer demands as we seek alternative sources of supply, or we may have to make financial accommodations to such contract manufacturermanufacturers or otherwise take steps to avoid or minimize supply disruption. We may be unable to locate an additional or alternate contract manufacturer that meets our quality controls and standards and regulatory requirements in a
timely manner or on commercially reasonable terms. Any such difficulties could have an adverse effect on our business, financial condition and results of operations, which could be material.
In some jurisdictions, we rely on independent distributors to distribute our products.
We rely in some jurisdictions on independent distributors to distribute our products and to assist us with the marketing, sale and servicing of certain of our products. For example, we have entered into long-term distribution relationships for our products in China, Russia, Israel, Greece, South Korea, Japan and Mexico. As a result, delivery of services and products in these jurisdictions relies on the performance of a small number of contractual counterparties, and in most of these countries we are not directly involved in sales and service provider relationships. We cannot be certain that our distributors will focus adequate resources on selling our products and services or be successful in selling them. Some of our distributors also represent or manufacture other, potentially competing, agrochemical products. If we are unable to establish or maintain successful relationships with our distributors, we will need to further develop our own sales and distribution capabilities, which would be expensive, time-consuming and possibly not as successful in achieving market penetration, which could have a material adverse effect on our results of operations, cash flows or financial condition. In addition, the distribution of our products could be disrupted by a number of factors, including labor issues, failure to meet customer standards, bankruptcy or other financial issues affecting our
third-party providers, or other issues affecting any such third party’s ability to meet our distribution requirements. The failure to properly perform by, switch to the competition or loss of, one or more of our distributors could have a material adverse effect on our business, financial condition and results of operations.
Our intellectual property and proprietary rights are integral to our business. Our business and results of operations could be adversely affected if we fail to protect our intellectual property and proprietary rights.
Our success depends to a significant degree upon our ability to protect and preserve our intellectual property rights, including our patent and trademark portfolio and trade secrets related to our proprietary processes, methods, formulations and other technology. Failure to protect our intellectual property rights may result in the loss of valuable technologies or impair our competitive advantage. We rely on confidentiality agreements and patent, trade secret and trademark, as well as judicial enforcement of all of the foregoing to protect such technologies and intellectual property rights. In addition, some of our technologies are not or will not be covered by any patent or patent application. With respect to our pending patent applications, we may not be successful in securing patents for these claims, which could limit our ability to protect inventions that these applications were intended to cover. In addition, the expiration of a patent can result in increased competition with consequent erosion of profit margins.
As key SmartFresh patents have expired or will expire, over the next few years, if we are not able to achieve further differentiation of our products and services through patented mixtures, new formulations, new delivery systems, new application methods or other means of obtaining extended patent protection, our inability to prevent competitors from developing and registering similar products could have an adverse effect on our sales of such product. Our patents also may not provide us with any competitive advantage and may be challenged by third parties. Further, our competitors may attempt to design around our patents.
In some cases, we rely upon unpatented proprietary manufacturing expertise, continuing technological innovation and other trade secrets to develop and maintain our competitive position. While we generally will enter into confidentiality agreements with our employees and third parties to protect our intellectual property, our confidentiality agreements could be breached and may not provide meaningful protection for our trade secrets or proprietary manufacturing expertise. In addition, adequate remedies may not be available in the event of unauthorized use or disclosure of our trade secrets or manufacturing expertise. Violations by others of our confidentiality agreements and the loss of employees who have specialized knowledge and expertise could harm our competitive position and cause our sales and operating results to decline as a result of increased competition.
In addition, we rely on both registered and unregistered trademarks to protect our name and brands. Our failure to adequately maintain the quality of our products and services associated with our trademarks or any loss to the distinctiveness of our trademarks may cause us to lose certain trademark protection, which could result in the loss of goodwill and brand recognition. In addition, successful third-party challenges to the use of any of our trademarks may require us to rebrand our business or certain products or services associated therewith.
We may be unable to prevent third parties from using our intellectual property and other proprietary information without our authorization or from independently developing intellectual property and other proprietary information that is similar to ours, or that has been designed around our patents, particularly in countries other than the United States. The unauthorized use of our intellectual property and other proprietary information by others could reduce or eliminate any competitive advantages we have developed, cause us to lose sales or otherwise harm our business. If it becomes necessary for us to litigate to protect these
rights, any proceedings could be burdensome and costly, and we may not prevail. For example, in August 2016, we filed a lawsuit against MirTech, Inc. (“MirTech”), Decco U.S. Post-Harvest, Inc. (“Decco”) and certain related parties in the United States District Court for the District of Delaware. Our complaint alleges, among other things, that MirTech, a former consultant to us, appropriated our confidential information and technology, in violation of agreements between MirTech and us, and that MirTech and Decco are collaborating to infringe on several of our patents. Our complaint seeks, among other relief, declarations that we are the owner of a number of patents filed by MirTech, injunctive relief to stop the infringement of our patents, and monetary damages. Although the Court ruled in June 2017 that we are the owner of the main patent
(U.S. Patent No. 9,394,216) and related technology at issue in the lawsuit, other aspects of that litigation continue.
If we do not ultimately prevail in that or other litigation, our business could be materially adversely affected.
We may experience claims that our products infringe the intellectual property rights of others, which may cause us to incur unexpected costs or prevent us from selling our products or services.
We continually seek to improve our business processes and develop new products and applications in a crowded patent space that we must continually monitor to avoid infringement. We cannot guarantee that we will not experience claims that our processes and products infringe issued patents (whether present or future) or other intellectual property rights belonging to others.
From time to time, we oppose patent applications that we consider overbroad or otherwise invalid in order to maintain the ability to operate freely in our various business lines without the risk of being sued for patent infringement. If, however, patents are subsequently issued on any such applications by other parties, or if patents belonging to others already exist that cover our products, processes or technologies, we could experience claims for infringement or have to take other remedial or curative actions to continue our manufacturing and sales activities with respect to one or more products. Likewise, our competitors may also already hold or have applied for patents in the United States or abroad that, if enforced or issued, could prevail over our patent rights or otherwise limit our ability to manufacture or sell one or more of our products in the United States or abroad. Any actions asserted against us could include payment of damages for infringement, stopping the use, require that we obtain licenses from these parties or substantially re-engineer our products or processes in order to avoid infringement. We may not be
able to obtain the necessary licenses on acceptable terms, or at all, or be able to re-engineer our products successfully. Further, intellectual property litigation is expensive and time-consuming, regardless of the merits of any claim, and could divert our management’s attention from operating our business.
We license patent rights from third parties. If we are not able to enter into future licenses on commercially reasonable terms, if such third parties do not properly maintain or enforce the patents underlying such existing or future licenses, or if we fail to comply with our obligations under such licenses, our competitive position and business prospects could be adversely affected.
We are a party to license agreements that give us rights to third-party intellectual property that may be necessary or useful for our business, and we may enter into additional licenses in the future. If we are unable to enter into licensing arrangements on favorable terms in the future, our business may be adversely affected. In addition, if the owners of the patents we license do not properly maintain or enforce the patents underlying such licenses, our competitive position and business prospects could be harmed. Without protection for the intellectual property we license, other companies might be able to offer substantially similar or identical products and/or services for sale, which could adversely affect our competitive business position and harm our business prospects.
If we fail to comply with our obligations under license agreements, our counterparties may have the right to terminate these agreements, in which event we may not be able to develop, manufacture, register, or market, or may be forced to cease developing, manufacturing, registering, or marketing, any product or service that is covered by these agreements or may face other penalties under such agreements. Such an occurrence could materially adversely affect the value of the applicable ingredient or formulated products and/or services provided by us and have an adverse effect on our business, financial condition and results of operations.
Seasonality, as well as adverse weather conditions and other natural phenomena, may cause fluctuations in our revenue and operating results.
Historically, our operations have been seasonal, with a greater portion of total net revenue and operating income occurring in the third and fourth calendar quarters. Our customers’ crops are vulnerable to adverse weather conditions and natural disasters such as storms, tsunamis, hail, tornadoes, freezing conditions, extreme heat, drought, and floods, which can reduce acreage planted, lead to modified crop selection by growers and affect the timing and overall yield of harvest, each of which may reduce or otherwise alter demand for our products and services and adversely affect our business and results of operations.
Weather conditions and natural disasters also affect decisions of our distributors, direct customers and end-users about the types and amounts of products and services to purchase and the timing of use of such products and services. Delays by growers in harvesting can result in deferral of orders to a future quarter or decisions to forego orders altogether in a particular growing season, either of which would negatively affect our sales in the affected period. As a result of seasonality, any factors that would negatively affect our third and fourth quarter results in any year could have an adverse impact on our business, financial condition and results of operations for the entire year.
Our products are highly regulated by governmental agencies in the countries where we conduct business. Our failure to obtain regulatory approvals, to comply with registration and regulatory requirements or to maintain regulatory approvals would have an adverse impact on our ability to market and sell our products.
Our pre- and post-harvest products are subject to technical review and approval by government authorities in each country where we wish to sell our products. While there is a general international consensus on the data needed in order to evaluate the safety of agrochemical products before they can be placed on the market (as evidenced, for example, by the standards and guidelines issued by the Organization for Economic Co-operation and Development), each country has its own legislative process and specific requirements in order to determine if identified risks are acceptable and can be managed in the local context and may be subject to frequent changes as new data requirements arise in response to scientific developments.
The regulatory requirements to which we are subject are complex and vary from country to country. To obtain new registrations, it is necessary to have a local registrant, and to understand the country’s regulatory requirements, both at the time an application for registration is submitted and when the registration decision is made, which may be several years later. A significant investment in registration data is required (covering all aspects from manufacturing specifications through storage and transport, use, and, finally, disposal of unwanted product and used containers) to ensure that product performance (e.g., bio efficacy), intrinsic hazards and use patterns are fully characterized. Risk assessments are conducted by government regulatory authorities, who make the final decision on whether the documented risk associated with a product and active ingredient is acceptable prior to granting approval for sale. This process may be prolonged due to requirements for additional data or internal administrative processes. There is a risk that registration of a new product may not be obtained or that a product label may be severely reduced, restricting the use of the product. If these circumstances arise, there is a risk that the substantial investments
made in product development will not lead to the projected sales that justified the investment, and our business, financial condition and results of operations may be adversely affected by failure to obtain new registrations.
Products that are already approved are subject to periodic review by regulatory authorities in many countries. Such reviews frequently require the provision of new data and more complex risk assessments. The outcome of reviews of existing registrations cannot be guaranteed; registrations may be modified or canceled. Since all government regulatory authorities have the right to review existing registrations at any time, the sustainability of the existing portfolio cannot be guaranteed. Existing registrations may be lost at any time, resulting in an immediate impact on sales. Furthermore, prior to expiration, it is necessary to renew registrations. The renewal period and processes vary by country and may require additional studies to support the renewal process. Failure to comply could result in cancellation of the registration, resulting in an impact on sales.
In addition, new laws and regulations may be introduced, or existing laws and regulations may be changed or may become subject to new interpretations, which could result in additional compliance costs, seizures, confiscations, recalls, monetary fines or delays that could affect us or our customers. For example, in accordance with a regulation of the European Parliament and of the Council of the European Union, in May 2014 the EU Commission proposed a List of Candidates for Substitution (“CFS”), which included 1-MCP. In a subsequent press release published on January 27, 2015, the Commission clarified that the list is neither a list of banned substances nor as a ranking of CFS, and that all active substances on the list will still be available on the market and are deemed acceptable, but could be substituted in time if a viable alternative becomes available. We have conducted studies, which have been submitted to the authorities, to support our position that 1-MCP should be removed from the CFS list.
Compliance with the prevailing regulations in countries in which we conduct business is essential. If we fail to comply with government requirements, we could have registrations withdrawn immediately (loss of sales), suffer financial penalties (fines) and suffer reputational damage that could materially and adversely affect our business and our regulatory success in the future.
If the data we supply to registration authorities is used by other companies to obtain their own product registrations, “generic” copies of products in our portfolio could enter the market, and our business position could be adversely affected.
In many countries, toxicity studies, data and other information relied upon by registration authorities in support of a product registration are granted “data protection” for a period of up to 15 years after the date upon which the data was originally submitted. In addition to the period of data compensability, there is in many geographies an exclusive use period of ten years
during which other companies may not legally cite our data in support of registration submissions without our written permission. In some countries, there is also a period of time during which companies may cite another company’s data upon payment of data compensation. In other countries, there is no legislation at all that effectively prevents third parties from citing our proprietary regulatory data. Furthermore, after the exclusive use period and data compensation period have expired, as was the case with respect to our data in Europe in 2016 and in the United States in 2017, any third party would be free to cite our data in support of its registration submissions. The possibility that third parties can use our registration data to obtain their own product registrations can adversely affect our business, financial condition and results of operations by facilitating the entry of “generic” copies of products in our portfolio into the market.
Negative publicity relating to our products could reduce sales.
Our success depends both on our customers’ perception of our products’ effectiveness and on end-consumers’ perception of the safety of our products. We may, from time to time, be faced with negative publicity relating to public health concerns, customer complaints or litigation alleging illness or injury, negative employee, staffing and supplier relationships or other matters, regardless of whether the allegations are valid or whether we are found to be responsible. Given the global nature of the business, the negative impact of adverse publicity relating to one product or in one geographic region may extend far beyond the product or the country involved to affect other parts of our business. The risk of negative publicity is particularly great with respect to the performance of service providers because we are limited in the manner in which we can control them, especially on a real-time basis. The considerable expansion in the use of social media over recent years can further amplify any negative publicity that could be generated by such incidents.
Customer demand for our products and our brand’s value could diminish significantly if we receive negative publicity or if customer confidence in us or our products is otherwise eroded, which would likely result in lower sales and could have a material adverse effect on our business, financial condition and results of operations.
New information or a change in consumer attitudes and preferences regarding diet and health could result in changes in regulations and consumer consumption habits, which could have an adverse effect on our business, financial condition and results of operations.
Public awareness of, and concern about, the use of chemicals in food production has been increasing. Concerns about issues such as chemical residues in foods, agricultural worker safety and environmental impacts of agrochemicals (such as impacts on groundwater or non-target species, such as fish, birds and bees) could result in additional scrutiny of, or adversely affect the market for, our products, even when these products have been approved by governmental authorities. For example, such concerns could result in continued pressure for more stringent regulatory intervention and potential liability relating to health concerns arising from the use of our products in food preparation or the impact our products may have on the environment. These concerns could also influence public and customer perceptions, including purchasing preferences, the viability of our
products, our reputation and the cost to comply with regulations, all of which could have a material adverse impact on our business. Some types of products that we manufacture have been subject to such scrutiny in the past, and some categories of products that we produce are currently under scrutiny and others may be in the future. We may not be able to effectively respond to changes in consumer health perceptions or to modify our product offerings to reflect trends in eating habits, which could have a material adverse effect on our business, financial condition and results of operations.
Use of our current products is not compatible with “organic” labeling standards in all jurisdictions. As such, an increase in consumer preference for organic produce could negatively affect the demand for our products or services. Similarly, a shift in consumer preferences away from fresh produce in favor of frozen or processed food products, or towards “seasonal” or locally grown produce, could negatively affect the demand for our products or services.
We may be required to pay substantial damages for product liability claims or other legal proceedings.
We may become involved in lawsuits concerning crop damage and product inefficacy claims, in addition to intellectual property infringement disputes, claims by employees, former employees or contingent staff, and general commercial disputes. Our insurance may not apply to or fully cover any liabilities we may incur as a result of these lawsuits.
We may face potential product liability claims for or relating to products we have sold and products that we may sell in the future. Since our products are used in the food chain on a global basis, any such product liability claim could subject us to litigation in multiple jurisdictions. Product liability claims, regardless of their merits or their ultimate outcomes, are costly, divert management’s attention, and may adversely affect our reputation and demand for our products and may result in significant damages. We cannot predict with certainty the eventual outcome of pending or future product liability claims. Any of these negative effects resulting from product liability claims could adversely affect our results of operations, cash flows, or
financial condition. These risks exist even with respect to products that have received, or may in the future receive, regulatory approval, registration, and clearance for commercial use. Unexpected quality or efficacy concerns can arise with respect to marketed products, whether or not scientifically justified, leading to product recalls, withdrawals, or declining sales, as well as product liability, personal injury and/or other claims.
Our results of operations are subject to exchange rate and other currency risks. A significant movement in exchange rates could adversely impact our results of operations and cash flows.
We conduct our business in many different currencies, primarily the U.S. dollar and the Euro. Accordingly, currency exchange rates affect our operating results. The effects of exchange rate fluctuations on our future operating results are unpredictable because of the number of currencies in which we conduct business and the potential volatility of exchange rates. We are also subject to the risks of currency controls and devaluations. Currency controls may limit our ability to convert currencies into U.S. dollars or other currencies, as needed, or to pay dividends or make other payments from funds held by subsidiaries in the countries imposing such controls, which could adversely affect our liquidity. Currency devaluations could also negatively affect our operating margins and cash flows. For example, if the U.S. dollar were to strengthen against a local currency, our operating margin would be adversely impacted in the country to the extent significant costs are denominated in U.S. dollars while our revenues are denominated in such local currency. We operate in countries that have experienced hyperinflation in recent years, which amplifies currency risk.
Our substantial international operations subject us to risks, including unfavorable political, regulatory, labor, tax and economic conditions in other countries that could adversely affect our business, financial condition and results of operations.
Currently, we operate, or others operate on our behalf, in more than 4550 countries, in addition to our operations in the United States. We expect sales from international markets to represent an increasing portion of our net sales, and our acquisition of a
controlling interest in Tecnidex increased our operations outside of the United States. Accordingly, our business is subject to risks related to the different legal, political, social and regulatory requirements and economic conditions of many jurisdictions. Risks inherent in our international operations include, in addition to other risks discussed in this section, the following:
•agreements may be difficult to enforce and receivables difficult to collect through a foreign country’s legal system;
•foreign customers may have increased credit risk and different financial conditions, which may necessitate longer payment cycles or result in increased bad debt write-offs or additions to reserves related to our foreign receivables;
•foreign countries may impose additional withholding taxes or otherwise tax our foreign income, impose tariffs or adopt other restrictions on foreign trade or investment, including currency exchange controls;
U.S. export licenses may be difficult to obtain;
•there may be delays and interruptions in transportation and importation of our products;
•general economic conditions in the countries in which we operate, including fluctuations in gross domestic product, interest rates, market demand, labor costs and other factors beyond our control, could have an adverse effect on our net sales in those countries;
•our results of operations could be affected by political or economic instability on a country-specific or global level from various causes, including the possibility of hyperinflationary conditions, natural disasters and terrorist activities and the response to such conditions and events;
•we may experience difficulties in staffing and managing multi-national operations, and face the possibility of labor disputes and unexpected adverse changes in foreign laws or regulatory requirements, including environmental, health and safety laws and laws and regulations affecting export and import duties and quotas;
•governmental policies, including farm subsidies, tariffs, tenders, and commodity support programs, as well as other factors beyond our control, such as the prices of fertilizers, seeds, water, energy and other inputs, and the prices at which crops may ultimately be sold, could negatively influence the number of acres planted, the mix of crops planted and the demand for agrochemicals;
•compliance with a variety of foreign laws and regulations may be difficult; and
•we may be subject to the risks of divergent business expectations resulting from cultural incompatibility.
We generally do not have long-term contracts with our customers or service providers.
Many of our relationships with our customers are based primarily upon one-year agreements or individual sales orders. As such, our customers could cease buying products or services from us at any time, for any reason, with little or no recourse. If multiple customers or a material customer elected not to purchase products or services from us, our business prospects, financial condition and results of operations could be adversely affected.
Our traditional service model relies on short-term and long-term contracts with a large number of service providers who apply our products in most jurisdictions for our customers. Service providers’ investment in the equipment necessary to provide services to customers is also minimal. As a result, service providers with short-term contracts could cease providing services for us or provide services for a competitor upon relatively short notice. If multiple service providers or a material service provider elected not to provide services on our behalf, our business, financial condition and results of operations could be adversely affected.
Increases in costs or reductions in the supplies of raw materials we use in our manufacturing process could materially and adversely affect our results of operations.
Our operations depend upon our or our contract manufacturers' obtaining adequate supplies of raw materials on a timely basis. We typically purchase our major raw materials on a contract or as-needed basis from outside sources. The availability and prices of raw materials may be subject to curtailment or change due to, among other things, the financial stability of our suppliers, suppliers’ allocations to other purchasers, interruptions in production by suppliers, new laws or regulations, changes in exchange rates and worldwide price levels. Additionally, we cannot guarantee that, as our supply contracts expire, we will be able to renew them, or if they are terminated, that we will be able to obtain replacement supply agreements on terms favorable to us. Our results of operations could be adversely affected if the costs of raw materials used in our manufacturing process increase significantly.
Joint development, distribution, manufacturing or venture investments that we enter into could be adversely affected by our lack of sole decision-making authority, our reliance on partners’ operational capabilities, strategic decisions and financial condition, and disputes between us and our collaborating partners.
We have a limited number of joint development and distribution agreements, and may enter into new ones in the future. Investments through joint research, development, registration, manufacturing, distribution, or other joint entities (collectively “collaborations”) may, under certain circumstances, involve risks not present were a third party not involved, including the possibility that collaboration partners might be sold, become bankrupt, fail to fund their share of required investments, fail to meet collaboration milestones, elect to change strategy, make poor business decisions or block or delay necessary decisions. Collaboration partners may develop economic or other business interests or goals which could conflict and become incompatible with our business interests, and may be in a position to take actions opposed to our strategy and objectives. Disputes between us and our collaboration partners may result in arbitration or litigation that would increase our expenses and distract our management team from focusing their time and effort on the business, or subject the projects, investments or facilities owned by the partnership or collaboration to additional risk. In addition, we may in certain circumstances be liable for
the actions of our collaboration partners, which could materially and adversely affect our business, financial condition and results of operations.
We might require additional capital to support business growth, and this capital might not be available.
We intend to continue to make investments to support our business growth and might require additional funds to finance our planned growth, including strategic acquisitions. Accordingly, we might need to engage in equity or debt financings to secure additional funds. If we raise additional funds through issuance of equity securities, our existing stockholders could suffer significant dilution, and any new equity securities that we issue could have rights, preferences and privileges superior to those of holders of our common stock. Any debt financing secured by us in the future could involve restrictive covenants relating to our capital-raising activities and other financial and operational matters, which might make it more difficult for us to obtain additional capital and to pursue business opportunities. Moreover, if we issue new debt securities, the debt holders would have rights senior to common stockholders to make claims on our assets. In addition, we might not be able to obtain additional financing on terms favorable to us, if at all. If we are unable to obtain adequate financing or financing on terms satisfactory to us when required, our ability to continue to support our business growth and to respond to business challenges could be significantly limited.
Our substantial level of indebtedness could materially and adversely affect our business, financial condition and results of operations.
Upon consummation of the Business Combination on July 31, 2015, we incurred debt obligations in the form of a $425 million term loan and a $25 million revolving loan. The incurrence of this debt could have a variety of negative effects, including:
default and foreclosure on our assets if our operating revenues are insufficient to repay our debt obligations;
acceleration of our obligations to repay the indebtedness even if we make all principal and interest payments when due if we breach certain covenants that require the maintenance of certain financial ratios or reserves without a waiver or renegotiation of that covenant;
our immediate payment of all principal and accrued interest, if any, if the debt security is payable on demand;
our inability to obtain necessary additional financing if the debt security contains covenants restricting our ability to obtain such financing while the debt security is outstanding;
our inability to pay dividends on our common stock; and
using a substantial portion of our cash flow to pay principal and interest on our debt, which will reduce the funds available for dividends on our common stock if declared, our ability to pay expenses, make capital expenditures and acquisitions, and fund other general corporate activities.
We are subject to credit risks related to our accounts receivable, and failure to collect our accounts receivable could adversely affect our results of operations and financial condition.
The failure to collect outstanding receivables could have an adverse impact on our business, financial condition and results of operations. If the financial condition of our customers were to deteriorate, resulting in an impairment of their ability to make payments, then we might be required to make additional allowances, which would adversely affect our results of operations in the period in which the determination or allowance was made. Bad debt write offs were less than 0.5% of revenues in each of 2017, 2016,2019, 2018 and 2015.2017.
While we occasionally obtain letters of credit or other security for payment from customers or distributors, enforcing that security is a lengthy and expensive process, and the eventual sale of the security may not ultimately cover the underlying trade receivable balance. Accordingly, we are not protected against accounts receivable default or bankruptcy by these entities. The current economic climate and volatility in the price of the underlying agricultural commodities could increase the likelihood of such defaults and bankruptcies. If a material portion of our customers or distributors were to become insolvent or otherwise were not able to satisfy their obligations to us, we would be materially harmed.
No single customer accounted for more than 10% of our consolidated net sales in 2017, 2016,2019, 2018 or 2015.2017. At December 31, 2017,2019, December 31, 2016,2018 and December 31, 2015,2017, no individual customer accounted for greater than 10% of our consolidated accounts receivable balance.
Failure to comply with the Foreign Corrupt Practices Act, or FCPA, and other similar anti-corruption laws, could subject us to penalties and damage our reputation.
We are subject to the FCPA, which generally prohibits U.S. companies and their intermediaries from making corrupt payments to foreign officials for the purpose of obtaining or keeping business or otherwise obtaining favorable treatment and requires companies to maintain certain policies and procedures, including maintenance of adequate record-keeping and internal accounting practices to accurately reflect transactions. Certain of the jurisdictions in which we conduct business are at a heightened risk for corruption, extortion, bribery, pay-offs, theft and other fraudulent practices. Under the FCPA, U.S. companies may be held liable for actions taken by their strategic or local partners or representatives. Other jurisdictions in which we operate have adopted similar anti-corruption, anti-bribery, and anti-kickback laws to which we are subject. Our employees, distributors, dealers and agents may not always take actions that are consistent with our policies designed to ensure compliance, particularly when they are confronted by pressures from competitors and others to act in a manner that is inconsistent with such policies. If we, or our intermediaries, fail to comply with the requirements of the FCPA, or similar laws of other countries, governmental authorities in the United States or elsewhere, as applicable, could seek to impose civil and/or criminal penalties, which could damage our reputation and have a material adverse effect on our business, financial condition and results of operations.
We rely heavily on information technology, and any material failure, weakness, interruption or breach of security could prevent us from effectively operating our business.
Our operations rely heavily on information systems for management of our supply chain, payment of obligations, collection of cash, credit and debit card transactions and other processes and procedures. Our StorEdge and AdvanStoreFreshCloud product offerings rely particularly heavily on information systems for monitoring, data collection and analysis. Our operations depend upon our ability to protect
our computer equipment andinformation systems, many of which in the caseare located outside of StorEdge and AdvanStore, are not located within our physical control, against damage from physical theft, fire, power loss, telecommunications failure, or other catastrophic events, as well as from internal and external security breaches viruses and other disruptive problems.data loss, including cyber-attacks. The disruption or failure of these systems to operate effectively maintenance problems, upgrading or transitioning to new platforms, or a breach in security of these systems could result in delays in customer service and reduce efficiency in our operations. RemediationBreaches of such problemsour security measures or the accidental loss, inadvertent disclosure, or unapproved dissemination of proprietary information or sensitive or confidential information about us, our employees, former employees, customers or suppliers could result in legal claims or proceedings, damage to or inaccessibility of critical systems, operational disruptions and other significant unplanned capital investments.costs, which could adversely affect our reputation, financial condition and results of operations.
We use hazardous materials in our business and are subject to regulation and potential liability under environmental laws.
Our business is subject to a wide range of stringent laws and regulations that relate to the raw material supply chain, environmental compliance, and disposal of any hazardous wastes.waste, and the manufacture, development, production, marketing and use of our products. As with any chemical manufacturing enterprise, there are inherent hazards associated with chemical manufacturing, and the related storage and transportation of raw materials and the potential thatour products. Exposure to hazardous materials, accidents or noncompliance with laws and regulations by us, the users of our products or our contract manufacturers, could disrupt our operations or expose us to significant losses or liabilities. We cannot predict the adverse impact that new environmental regulations, or new interpretations of existing regulations, might have on the research, development, production, and marketing of our products.
Our suppliers or contract manufacturers may use hazardous materials in connection with producing our products. We may also from time to time send wastes to third parties for disposal.
A failure to comply with the environmental, health and safety laws and regulations to which we are subject, including any permits issued thereunder, may result in environmental remediation costs, loss of permits, fines, penalties or other adverse governmental or private actions, including regulatory or judicial orders enjoining or curtailing operations or requiring corrective measures, installation of pollution control equipment or remedial measures. We could also be held liable for any and all consequences arising out of human exposure to hazardous materials or environmental damage. In the event of a lawsuit or investigation, we could be subject to claims for liability for any injury caused to persons or property by exposure to, or release of such hazardous materials or wastes.wastes related to our products. We may also be subject to claims associated with failure to warn users of our products of risks associated with our products. Further, we may be required to indemnify our suppliers, contract manufacturers, or waste disposal contractors against damages and other liabilities arising out of the production, handling, or storage of our products or raw materials or the disposal of related wastes. Such indemnification obligations could have an adverse effect on our business, financial condition and results of operations.
Environmental laws and regulations are complex, change frequently, have tended to become more stringent and stringently enforced over time and may be subject to new interpretation. We cannot predict the adverse impact that new environmental regulations, or new interpretations of existing regulations, might have on the research, development, production, and marketing of our products.
We may need to recognize impairment charges related to intangible assets and fixed assets.
We have recognized substantial balances of goodwill and identified intangible assets as a result of the Business Combination,business combinations, and we may record additional goodwill and other intangible assets as a result of any acquisitions we may complete in the future. We are required to test goodwill and any other intangible asset with an indefinite life for possible impairment on the same date each year and on an interim basis if there are indicators of a possible impairment. We are also required to evaluate amortizable intangible assets and fixed assets for impairment if there are indicators of a possible impairment. As of December 31, 2016, we had fully impaired our recorded goodwill of $62.4 million, recorded an impairment of $9.5 million on trade names and have recorded an impairment of $1.3 million on certain fixed assets. There is significant judgment required in the analysis of a potential impairment of goodwill, identified intangible assets and fixed assets. If, as a result of a general economic slowdown, deterioration in one or more of the markets in which we operate or impairment in our financial performance and/or future outlook, the estimated fair value of our long-lived assets decreases, we may determine that one or more of our long-lived assets is impaired. An impairment charge would be determined based on the estimated fair value of the assets and any such impairment charge could have a material adverse effect on our financial condition and results of operations.
Our historical financial information may not be indicative of our future results as an independent company.
Our financial information from 2015 and earlier may not reflect what our results of operations, financial position and cash flows would have been had we been an independent company during the periods presented. This is primarily a result of the following factors:
our historical financial information reflects cost allocation for services historically provided by Dow and these allocations are different from the costs we incur for these services as a smaller independent company, including with respect to services provided by Dow under the Transition Services Agreement and other agreements with Dow and its affiliates. In some instances, the costs incurred for these services as a smaller independent company are higher than the share of total Dow expenses assessed to us historically; and
our historical financial information does not reflect the debt and related interest expense that we incurred in connection with the Business Combination.
We are required to pay Dow for certain tax benefits we may claim, and these amounts are expected to be material.
Pursuant to the Tax Receivables Agreement we entered into with Dow upon the consummation of the Business Combination, as
amended in April 2017 (the “Tax Receivables Agreement”), we are required to pay annually to Dow 50% of the amount of tax savings, if any, in U.S. federal, state and local income tax that we actually realize as a result of the increase in tax basis of our assets resulting from a section 338(h)(10) election that we and Dow made in connection with the Business Combination.
We expect that the payments that we may make under the Tax Receivables Agreement could be substantial. It is possible that future transactions or events could increase or decrease the actual tax benefits realized and the corresponding Tax Receivables Agreement payments. There may be a material negative effect on our liquidity if we do not have sufficient funds to make payments under the Tax Receivables Agreement after we have paid taxes.
In certain cases, payments by us under the Tax Receivables Agreement may be accelerated by us or significantly exceed the tax benefits we realize in respect of the tax attributes subject to the Tax Receivables Agreement.
The Tax Receivables Agreement allows us, at any time, to elect an early termination of the Tax Receivables Agreement, in which case we would make an immediate payment equal to the present value of the anticipated future payments to Dow under the Tax Receivables Agreement, after the termination date. Such payment would be based on certain valuation assumptions and deemed events set forth in the Tax Receivables Agreement, including the assumption that we have sufficient taxable income to fully utilize such tax benefits. In addition, in the event of certain acquisition transactions by us or a change of control of us, an alternative calculation mechanism will apply to determine the amount paid to Dow under the Tax Receivables Agreement, which alternative calculation mechanism could result in payments to Dow that are greater than the tax benefits actually realized by us in respect of the tax attributes subject to the Tax Receivables Agreement. Accordingly, payments under the Tax Receivables Agreement may be made years in advance of the actual realization, if any, of the anticipated future tax benefits and may be significantly greater than the benefits we realize in respect of the tax attributes subject to the Tax Receivables Agreement. In these situations, our obligations under the Tax Receivables Agreement could have a substantial negative impact on our liquidity. We may not be able to finance our obligations under the Tax Receivables Agreement and any indebtedness we incur may limit our subsidiaries’ ability to make distributions to us to pay these obligations. In addition, our obligations under the Tax Receivables Agreement could have the effect of delaying, deferring or preventing certain mergers, asset sales, other forms of business combinations or other changes of control that could otherwise be in the best interests of our stockholders.
Risks Related to Our Securities
The Dow andBoulevard Acquisition Sponsor, LLC (the “Sponsor”Chemical Company ("Dow")have has significant influence over us, which could limit your ability to influence the outcome of key transactions, including a change of control.
As of December 31, 2017,2019, Dow and the Sponsor (and its affiliates) owned approximately 36% and 7%, respectively,41% of our outstanding common stock. In addition, each of Dow and the Sponsor currently beneficially owns a significant percentage3,000,000 of our outstanding warrants. Because of the degree of concentration of voting power (and the potential for such power to increase upon the purchase of additional stock or the exercise of warrants), your ability to elect members of our board of directors and influence our business and affairs, including any determinations with respect to mergers or other business combinations, the acquisition or disposition of assets, the incurrence of indebtedness, the issuance of any additional common
stock or other equity securities, the repurchase or redemption of common stock and the payment of dividends, may be diminished.
Our stock price could be extremely volatile, and, as a result, you may not be able to resell your shares at or above the price you paid for them.
In recent years the stock market in general has been highly volatile. As a result, the market price and trading volume of our common stock is likely to be similarly volatile, and investors in our common stock may experience a decrease in the value of their stock, which could be substantial, including decreases unrelated to our results of operations or prospects, and could lose part or all of their investment. The price of our common stock could be subject to wide fluctuations in response to a number of factors, including those described elsewhere in this report and others such as:
•actual or anticipated fluctuations in our quarterly financial results or the quarterly financial results of companies perceived to be similar to us;
•success of competitors;
•our operating results failing to meet the expectation of securities analysts or investors in a particular period;
•changes in financial estimates and recommendations by securities analysts concerning us or the agricultural or specialty chemicals industries in general;
•our ability to market new and enhanced products on a timely basis;
•changes in laws and regulations affecting our business;
•our ability to meet compliance requirements;
•commencement of, or involvement in, litigation involving us;
•changes in our capital structure, such as future issuances of securities or the incurrence of additional debt;
•the volume of shares of our common stock available for public sale;
•any major change in our board of directors or management;
•sales of substantial amounts of common stock by our directors, executive officers or significant stockholders or the perception that such sales could occur; and
•general economic and political conditions such as recessions, interest rates, fuel prices, international currency fluctuations and acts of war or terrorism.
In the past, securities class action litigation has often been initiated against companies following periods of volatility in their stock price. This type of litigation could result in substantial costs and divert our management’s attention and resources, and could also require us to make substantial payments to satisfy judgments or to settle litigation.
Your percentage ownership in us may be diluted by future issuances of capital stock, which could reduce your influence over matters on which stockholders vote.
Our board of directors has the authority, without action or vote of our stockholders, to issue all or any part of our authorized but unissued shares of common stock, including shares issuable upon the exercise of options, or shares of our authorized but unissued preferred stock. Issuances of common stock or voting preferred stock would reduce your influence over matters on which our stockholders vote and, in the case of issuances of preferred stock, would likely result in your interest in us being subject to the prior rights of holders of that preferred stock.
��
There may be sales of a substantial amount of our common stock by our current stockholders, and these sales could cause the price of our common stock to fall.
As of December 31, 2017,2019, there were 50,340,85351,178,146 shares of our common stock outstanding. OfSubstantially all of our issued and outstanding shares that were issued prior to the Business Combination, all are freely transferable, except for any shares held by our “affiliates,” as that term is defined in Rule 144 under the Securities Act. Future sales of our common stock may cause the market price of our securities to drop significantly, even if our business is doing well.
At the closing of the Business Combination, we entered inWe are party to an Investor Rights Agreement, dated July 31, 2015 (the “Investor Rights Agreement”), pursuant to which Dow the Sponsor and the other parties thereto are entitled to demand that we register the resale of their securities subject to certain minimum
requirements. Stockholders who are party to the Investor Rights Agreement also have certain “piggyback” registration rights with respect to registration statements filed subsequent to the Business Combination. The stockholders who are party to the Investor Rights Agreement were subject to a lockup agreement that, subject to certain limited exceptions, precluded them from selling our securities. That lockup period expired on December 31, 2017.we may file.
Upon effectiveness of any registration statement we file pursuant to the Investor Rights Agreement, and following the expiration of the lockup period applicable to the parties to the Investor Rights Agreement, these parties may sell large amounts of our stock in the open market or in privately negotiated transactions, which could have the effect of increasing the volatility in our stock price or putting significant downward pressure on the price of our stock.
Sales of substantial amounts of our common stock in the public market, or the perception that such sales will occur, could adversely affect the market price of our common stock and make it difficult for us to raise funds through securities offerings in the future.
Warrants are exercisable for our common stock, which, if exercised, would increase the number of shares eligible for future resale in the public market and result in dilution to our stockholders.
As of December 31, 2017,2019, outstanding warrants to purchase an aggregate of 15,983,072 shares of our common stock were exercisable in accordance with the terms of the warrant agreement governing those securities. All of these warrants will expire at 5:00 p.m., New York time, on July 31, 2020, or earlier upon redemption or liquidation. The exercise price of these warrants is $11.50 per share. To the extent such warrants are exercised, additional shares of our common stock will be issued, which will result in dilution to the holders of our common stock and increase the number of shares eligible for resale in the public market. Sales of substantial numbers of such shares in the public market or the fact that such warrants may be exercised could adversely affect the market price of our common stock.
If securities or industry analysts do not publish or cease publishing research or reports about us, our business, or our market, or if they change their recommendations regarding our common stock adversely, the price and trading volume of our common stock could decline.
The trading market for our common stock is influenced by the research and reports that industry or securities analysts may publish about us, our business, our market, or our competitors. If securities or industry analysts do not provide coverage of us, our stock price and trading volume would likely be negatively impacted. If any of the analysts who cover or who may cover us change their recommendation regarding our stock adversely, or provide more favorable relative recommendations about our competitors, the price of our common stock would likely decline. If any analyst who covers or who may cover us were to cease coverage of us or fail to regularly publish reports on us, we could lose visibility in the financial markets, which in turn could cause our stock price or trading volume to decline.
Anti-takeover provisions contained in our certificate of incorporation and bylaws could impair a takeover attempt.
Our second amended and restated certificate of incorporation and bylaws contain provisions that could have the effect of delaying or preventing changes in control or changes in our management without the consent of our board of directors. These provisions include:
•no cumulative voting in the election of directors, which limits the ability of minority stockholders to elect director candidates;
•the exclusive right of our board of directors to elect a director to fill a vacancy created by the expansion of the board of directors or the resignation, death, or removal of a director, which prevents stockholders from being able to fill vacancies on our board of directors;
•the ability of our board of directors to determine whether to issue shares of preferred stock and to determine the price and other terms of those shares, including preferences and voting rights, without stockholder approval, which could be used to significantly dilute the ownership of a hostile acquirer;
•a prohibition on stockholder action by written consent, which forces stockholder action to be taken at a special meeting of our stockholders;
•the requirement that an annual meeting of stockholders may be called only by the chairman of the board of directors, the chief executive officer, or the board of directors, which may delay the ability of our stockholders to force consideration of a proposal or to take action, including the removal of directors;
•limiting the liability of, and providing indemnification to, our directors and officers;
•controlling the procedures for the conduct and scheduling of stockholder meetings;
•providing that directors may be removed prior to the expiration of their terms by stockholders only for cause; and
•advance notice procedures that stockholders must comply with in order to nominate candidates to our board of directors or to propose matters to be acted upon at a stockholders’ meeting, which may discourage or deter a potential
acquirer from conducting a solicitation of proxies to elect the acquirer’s own slate of directors or otherwise attempting to obtain control of our board of directors.
These provisions, alone or together, could delay hostile takeovers and changes in control of us or changes in our management. Any provision of our second amended and restated certificate of incorporation or bylaws that has the effect of delaying or deterring a change in control could limit the opportunity for our stockholders to receive a premium for their shares of our common stock, and could also affect the price that some investors are willing to pay for our common stock.
Because we have no current plans to pay cash dividends on our common stock for the foreseeable future, you may not receive any return on investment unless you sell your common stock for a price greater than that which you paid for it.
We may retain future earnings, if any, for future operations, expansion and debt repayment and have no current plans to pay any cash dividends for the foreseeable future. Any decision to declare and pay dividends as a public company in the future will be made at the discretion of our board of directors and will depend on, among other things, our results of operations, financial condition, cash requirements, contractual restrictions and other factors that our board of directors may deem relevant. In addition, our ability to pay dividends may be limited by covenants of any existing and future outstanding indebtedness we or our subsidiaries incur, including our Credit Facility.credit facility. As a result, you may not receive any return on an investment in our common stock unless you sell our common stock for a price greater than that which you paid for it.
The JOBS Act permits “emerging growth companies” like us to take advantage ofWe are a smaller reporting company and we cannot be certain exemptions from various reportingif the reduced disclosure requirements applicable to other publicsmaller reporting companies that are not emerging growth companies.will make our common stock less attractive to investors.
We qualify asWhile we have ceased being an “emerging growth company” as defined in Section 2(a)(19)of December 31, 2019, many of the Securities Act, as modified by the JOBS Act. As such, we are eligibleexemptions available for and intend to take advantage of certain exemptions from various reporting requirements applicable to other public companies that are not emerging growth companies for as long asare also available to smaller reporting companies like us that have less than $250 million of worldwide common equity held by non-affiliates. The disclosures we continuewill be required to provide in our SEC filings will increase, but will still be anless than it would be if we were not considered a smaller reporting company. Specifically, similar to emerging growth company, including (i) the exemptioncompanies, smaller reporting companies are able to provide simplified executive compensation disclosures in their filings; are exempt from the auditorprovisions of Section 404 requiring that independent registered public accounting firms provide an attestation requirements with respect toreport on the effectiveness of internal control over financial reporting under Section 404 of the Sarbanes-Oxley Act, (ii) the exemptions from say-on-pay, say-on-frequencyreporting; and say-on-golden parachute voting requirements and (iii) reducedhave certain other decreased disclosure obligations regarding executive compensationin their SEC filings, including, among other things, only being required to provide two years of audited financial statements in annual reports. Decreased disclosures in our periodic reports and proxy statements. We will remain an emerging growthSEC filings due to our status as a smaller reporting company until the earliest of (i) the last day of the fiscal year in which the market value of our common stock that is held by non-affiliates exceeds $700 million as of June 30 of that fiscal year, (ii) the last day of the fiscal year in which we had total annual gross revenue of $1.17 billion or more during such fiscal year (as indexed for inflation), (iii) the date on which we have issued more than $1 billion in non-convertible debt in the prior three-year period or (iv) the last day of the fiscal year following the fifth anniversary of the date of the first sale of our common stock in our initial public offering.
In addition, Section 107 of the JOBS Act also provides that an emerging growth company can take advantage of the exemption from complying with new or revised accounting standards provided in Section 7(a)(2)(B) of the Securities Act as long as we are an emerging growth company. An emerging growth company can therefore delay the adoption of certain accounting standards until those standards would otherwise apply to private companies. The JOBS Act provides that a company can elect to opt out of the extended transition period and comply with the requirements that apply to non-emerging growth companies but any such an election to opt out is irrevocable. We have elected not to opt out of such extended transition period, which means that when a standard is issued or revised and it has different application dates for public or private companies, we, as an emerging growth company, can adopt the new or revised standard at the time private companies adopt the new or revised standard. This may make comparisonit harder for investors to analyze our results of ouroperations and financial statements with another public company which is neither an emerging growth company nor an emerging growth company which has opted out of using the extended transition period difficult or impossible because of the potential differences in accounting standards used.
prospects. We cannot predict if investors will find our common stock less attractive because we will rely on these exemptions.the exemptions available to smaller reporting companies. If some investors find our common stock less attractive as a result, there may be a less active trading market for our common stock and our stock price may be more volatile.
If we are unable to maintain effective internal control over financial reporting or effective disclosure controls, this could have a material adverse effect on our business and stock price.
As a publicly traded company, we are required to comply with the SEC’s rules implementing Section 302 and 404 of the Sarbanes-Oxley Act, which require management to certify financial and other information in our quarterly and annual reports and provide an annual management report on the effectiveness of controls over financial reporting. Pursuant to the JOBS Act, our independent registered public accounting firm will not be required to attest to the effectiveness of our internal control over
financial reporting until the later of the year following our first annual report required to be filed with the SEC or the datefor so long as we are no longer an emerging growth company, which may be up to five full fiscal years following our initial public offering.remain a smaller reporting company.
In December 2015, we identified a material weaknessA deficiency discovered in our internal control over financial reporting. Although that material
weakness was subsequently remediated,recently implemented SAP accounting system with respect to foreign currency translations caused us to file our management may be unable to conclude in future periods that our disclosure controls and procedures are effective due toquarterly report on Form 10-Q for the effects of various factors, which may, in part, include unremediated material weakness in internal controls over financial reporting.quarter ended June 30, 2018 late. The term “disclosure controls and procedures,” as defined in Rules 13a-15(e) and 15d-15(e) under the Exchange Act means controls and other procedures of a company that are designed to ensure that information required to be disclosed in the reports that it files or submits under the Exchange Act is recorded, processed, summarized and reported, within the time periods specified in the rules and forms of the SEC. Disclosure controls and procedures include, without limitation, controls and procedures designed to ensure that information required to be disclosed by a company in the reports that it files or submits under the Exchange Act is accumulated and communicated to the company’s management, including its principal executive and principal financial officers, as appropriate to allow timely decisions regarding required disclosure.
If we are unable to comply with the requirements of Section 404 in a timely manner or to assert that our internal control over financial reporting is effective, or if our independent registered public accounting firm is unable to express an opinion as to the effectiveness of our internal control over financial reporting onceif and when we no longer qualify as an emerging growthcease to be a smaller reporting company, investors
may lose confidence in the accuracy and completeness of our financial reports and the market price of our common stock could be negatively affected, and we could become subject to investigations by NASDAQ (the exchange on which our securities are listed), the SEC or other regulatory authorities, which could require additional financial and management resources.
ITEM 1B. UNRESOLVED STAFF COMMENTS
Not applicable.
ITEM 2. PROPERTIES
We lease our current headquarter facility in Philadelphia, Pennsylvania, consisting of approximately 15,887 square feet. The lease has a 90 month term commencing in May 2016, with a five-year renewal option and an option for us to terminate the lease after 72 months. We also lease office space in Paris, France, consisting of approximately 7,100 square feet. The lease has a 108 month term commencing in October 2015. We lease a facility in Spring House, Pennsylvania consisting of 14,000 square feet. The lease has a 123 month term commencing in January 2018. We use five primary additional leased locations worldwide to deliver product and technical services: Yakima, and Wenatchee, Washington; Fresno, California; Curico, Chile; Bologna, Italy; and Lerida, Spain. In addition, the Yakima Service Center is our product distribution center to all geographic regions around the world. Tecnidex occupies a building of five units that make up their headquarters in Valencia, Spain. Tecnidex owns two of these units (consisting of approximately 24,480 square feet) and leases the three remaining units (consisting of approximately 37,245 square feet). One of the leased units has a 60 month term that commenced in October 2015 and the other two leased units have a 120 month lease term that commenced in July 2017.
ITEM 3. LEGAL PROCEEDINGS
From time to time we are named as a defendant in legal actions arising from our normal business activities. Although we cannot predict with certainty the ultimate resolution of lawsuits, investigations and claims asserted against us, we do not believe any currently pending legal proceeding to which we are a party will have a material adverse effect on our business, prospects, financial condition, cash flows or results of operations.
As previously reported, inIn August 2016, we filed a lawsuit against MirTech, Inc. (“MirTech”), Decco U.S. Post-Harvest, Inc. (“Decco”) and certain related parties in the United States District Court for the District of Delaware. Our complaint alleges,alleged, among other things, that MirTech, a former consultant to us, appropriated our confidential information and technology, in violation of agreements between MirTech and us, and that MirTech and Decco are collaboratingcollaborated to infringe on several of our patents. Our complaint seeks, among other relief, declarations that we are the owner of a number of patents filed by MirTech, injunctive relief to stop the infringement of our patents, and monetary damages. The claims in this lawsuit were bifurcated and
a bench trial was held in March 2017 on certain of our contract claims., after which the Court ruled in the
Company’s favor and against MirTech. Other matters at issue in the litigation are still pending and scheduled forIn October 2019 there was a jury trial against Decco and its parent company, UPL Ltd.("UPL"), in which the jury awarded AgroFresh $31.1 million in damages, including punitive damage. The Company filed a post-trial motion asking the trial Court Judge to award up to $14.0 million in additional damages, and UPL and Decco filed post-trial motions asking the trial Court Judge to set aside the jury’s award and find in favor of UPL and Decco. The Court has not ruled on any of the post-trial motions to date.
the Fall
PART II
ITEM 4. MINE SAFETY DISCLOSURES
Not applicable.
PART II
ITEM 5. MARKET FOR REGISTRANT’S COMMON EQUITY, RELATED STOCKHOLDER MATTERS, AND ISSUER PURCHASES OF EQUITY SECURITIES
Our common stock and warrants trade on the Nasdaq Global Select Market under the symbols “AGFS” and “AGFSW,” respectively. Each warrant entitles the holder to purchase one share of our common stock at a price of $11.50 per share, and only whole warrants are exercisable. The warrants will expire on July 31, 2020, unless redeemed earlier.
The following table shows, for the periods indicated, the high and low sales prices per share of our common stock and warrants as reported by Nasdaq:
|
| | | | | | | | | | | | | |
| | Common Stock | | Warrants |
| | High | Low | | High | Low |
| Fiscal year ended December 31, 2017 | |
| |
| | |
| |
|
| First Quarter | $ | 4.43 |
| $ | 2.53 |
| | $ | 0.31 |
| $ | 0.24 |
|
| Second Quarter | $ | 7.68 |
| $ | 4.13 |
| | $ | 1.04 |
| $ | 0.95 |
|
| Third Quarter | $ | 9.05 |
| $ | 6.87 |
| | $ | 1.25 |
| $ | 1.18 |
|
| Fourth Quarter | $ | 7.61 |
| $ | 4.94 |
| | $ | 0.63 |
| $ | 0.55 |
|
| Fiscal year ended December 31, 2016 | |
| |
| | |
| |
|
| First Quarter | $ | 6.95 |
| $ | 4.21 |
| | $ | 1.00 |
| $ | 0.23 |
|
| Second Quarter | $ | 6.82 |
| $ | 4.37 |
| | $ | 0.97 |
| $ | 0.40 |
|
| Third Quarter | $ | 6.73 |
| $ | 5.07 |
| | $ | 0.99 |
| $ | 0.36 |
|
| Fourth Quarter | $ | 5.47 |
| $ | 1.96 |
| | $ | 0.78 |
| $ | 0.05 |
|
Holders of Record
On March 9, 2018,February 25, 2020, there were approximately 8584 holders of record of our common stock and 45 holders of record of our warrants. Such numbers do not include beneficial owners holding securities through nominee names.
Dividends
We have not paid any cash dividends on our common stock to date. The payment of cash dividends in the future is within the discretion of our Board of Directors, and will be dependent upon our revenues and earnings, capital requirements and general financial condition. Our Board of Directors does not anticipate declaring any dividends in the foreseeable future. Further, our ability to declare dividends is limited by restrictive covenants contained in our credit facility, which includes an overall cap on the total amount of dividends we can pay, together with the total amount of shares and warrants we can repurchase, of $12.0 million per fiscal year, and imposes certain other conditions on our ability to pay dividends.
Stock Performance Graph
The following graph compares the cumulative total return (assuming reinvestment of dividends) from February 19, 2014 (the date that we consummated our initial public offering) to December 31, 2017 for (i) our common stock, (ii) the S&P SmallCap 600 Index (the “Index”) and (iii) the S&P 600 Materials Group Index (the “Materials Group Index”). The graph assumes the investment of $100 on February 19, 2014 in each of our common stock, the Index and the stocks comprising the Materials Group Index.
|
|
Comparison of Cumulative Total Return
Among AgroFresh Solutions Inc., the S&P SmallCap 600 Index, and the
S&P SmallCap 600 Materials Index
|
Total Return To Shareholders
(Includes reinvestment of dividends)
|
| | | | | | |
| QUARTERLY RETURN PERCENTAGE | Company / Index |
| Quarter Ended: | AgroFresh Solutions Inc. | S&P SmallCap 600 Index | S&P SmallCap 600 Materials Index |
| March 31, 2014 | 0.40 |
| 3.81 |
| 5.06 |
|
| June 30, 2014 | (2.48 | ) | 2.07 |
| 3.95 |
|
| September 30, 2014 | (1.03 | ) | (6.73 | ) | (6.82 | ) |
| December 31, 2014 | (0.62 | ) | 9.85 |
| (0.78 | ) |
| March 31, 2015 | 1.66 |
| 3.96 |
| (3.11 | ) |
| June 30, 2015 | 27.55 |
| 0.19 |
| (4.12 | ) |
| September 30, 2015 | (36.48 | ) | (9.27 | ) | (20.38 | ) |
| December 31, 2015 | (20.28 | ) | 3.72 |
| 0.53 |
|
| March 31, 2016 | 1.11 |
| 2.66 |
| 2.92 |
|
| June 30, 2016 | (17.03 | ) | 3.48 |
| 9.40 |
|
| September 30, 2016 | (0.38 | ) | 7.20 |
| 15.45 |
|
| December 31, 2016 | (49.91 | ) | 11.13 |
| 19.00 |
|
| March 31, 2017 | 64.91 |
| 1.06 |
| (1.96 | ) |
| June 30, 2017 | 64.30 |
| 1.71 |
| 0.32 |
|
| September 30, 2017 | (2.09 | ) | 5.96 |
| 6.23 |
|
| December 31, 2017 | 5.26 |
| 3.96 |
| 5.21 |
|
|
| | | | | | | | | |
| INDEXED RETURNS | Company / Index |
| Quarter Ended: | AgroFresh Solutions Inc. | S&P SmallCap 600 Index | S&P SmallCap 600 Materials Index |
| Base Period - February 19, 2014 | $ | 100 |
| $ | 100 |
| $ | 100 |
|
| March 31, 2014 | 100.40 |
| 103.81 |
| 105.06 |
|
| June 30, 2014 | 97.91 |
| 105.96 |
| 109.20 |
|
| September 30, 2014 | 96.90 |
| 98.83 |
| 101.75 |
|
| December 31, 2014 | 96.30 |
| 108.56 |
| 100.96 |
|
| March 31, 2015 | 97.90 |
| 112.86 |
| 97.83 |
|
| June 30, 2015 | 124.88 |
| 113.08 |
| 93.80 |
|
| September 30, 2015 | 79.32 |
| 102.60 |
| 74.68 |
|
| December 31, 2015 | 63.24 |
| 106.42 |
| 75.07 |
|
| March 31, 2016 | 63.94 |
| 109.25 |
| 77.27 |
|
| June 30, 2016 | 53.05 |
| 113.05 |
| 84.53 |
|
| September 30, 2016 | 52.85 |
| 121.19 |
| 97.59 |
|
| December 31, 2016 | 26.47 |
| 134.68 |
| 116.13 |
|
| March 31, 2017 | 43.66 |
| 136.11 |
| 113.86 |
|
| June 30, 2017 | 71.73 |
| 138.44 |
| 114.21 |
|
| September 30, 2017 | 70.23 |
| 146.70 |
| 121.33 |
|
| December 31, 2017 | 73.93 |
| 152.50 |
| 127.65 |
|
ITEM 6. SELECTED FINANCIAL DATA
As used ina smaller reporting company, we are not required to provide the information required by this section, the terms “Predecessor” and the “AgroFresh Business” refer to the business conducted by Dow through a combination of wholly-owned subsidiaries and operations of Dow, including through AgroFresh Inc. in the United States, prior to the closing of the Business Combination, the term “Successor” refers to AgroFresh Solutions, Inc. (which was named Boulevard Acquisition Corp. prior to the closing of the Business Combination), and the terms “Company”, “AgroFresh”, “we”, “us” and “our” refer to the combined Predecessor and Successor companies, unless the context otherwise requires or it isItem.
otherwise indicated. The application of acquisition accounting for the Business Combination significantly affected certain assets, liabilities, and expenses. As a result, financial information for the twelve months ended December 31, 2017 and December 31, 2016 may not be comparable to the financial information for the seven months ended July 31, 2015 (Predecessor) and the five months ended December 31, 2015 (Successor). Refer to Note 3 to the audited consolidated and combined financial statements contained in this Report for additional information regarding the acquisition accounting for the Business Combination.
The following tables present selected consolidated and combined historical financial data for the Successor and the Predecessor as of the dates and for each of the periods indicated. The selected consolidated historical data for the Successor for the period from inception (August 1, 2015) to December 31, 2015 and the fiscal years ended December 31, 2016 and December 31, 2017 and as of December 31, 2017 and December 31, 2016 has been derived from our audited consolidated financial statements included in this annual report. The selected combined historical data for the Predecessor for the period from January 1, 2015 to July 31, 2015 has been derived from our audited combined financial statements included in this annual report. The selected historical consolidated and combined financial data included below and elsewhere in this annual report are not necessarily indicative of future results and should be read in conjunction with the section entitled “Management’s Discussion and Analysis of Financial Condition and Results of Operations” included in Part II, Item 7 of this annual report and our audited consolidated and combined financial statements and related notes.
Statements of Income (Loss) Data
|
| | | | | | | | | | | | | | | | | | | |
| | Successor | | Predecessor |
| (amounts in thousands, except per share data) | Year Ended December 31,
2017 | Year Ended December 31,
2016 | August 1, 2015
To December 31, 2015 | | January 1, 2015 to July 31, 2015 | Year Ended
December 31,
2014 | Year Ended
December 31,
2013 |
| Net sales | $ | 164,026 |
| $ | 159,669 |
| $ | 111,081 |
| | $ | 52,682 |
| $ | 180,508 |
| $ | 158,789 |
|
| Gross profit | 131,371 |
| 99,692 |
| 19,329 |
| | 42,052 |
| 149,849 |
| 129,359 |
|
| Operating income (loss) | 40,783 |
| (36,854 | ) | (10,056 | ) | | (3,216 | ) | 69,260 |
| 52,602 |
|
| Income (loss) before income taxes | 18,983 |
| (98,540 | ) | (33,669 | ) | | (3,208 | ) | 69,256 |
| 52,597 |
|
| Income tax (benefit) expense | (4,579 | ) | 13,020 |
| (19,232 | ) | | 10,849 |
| 41,399 |
| 25,141 |
|
| Net income (loss) | 23,562 |
| (111,560 | ) | (14,437 | ) | | (14,057 | ) | 27,857 |
| 27,456 |
|
| Less: Net income attributable to noncontrolling interests | (91 | ) | — |
| — |
| | — |
| — |
| — |
|
| Net income (loss) attributable to AgroFresh Solutions, Inc | 23,471 |
| (111,560 | ) | (14,437 | ) | | (14,057 | ) | 27,857 |
| 27,456 |
|
| Net income (loss) per common share: | | | | | | | |
| Basic | 0.47 |
| (2.26 | ) | (0.29 | ) | | |
| | |
| Diluted | 0.47 |
| (2.26 | ) | (0.29 | ) | | |
| | |
Balance Sheet Data
|
| | | | | | | | | | | | | | | | | |
| | Successor | | | Predecessor |
| (amounts in thousands) | December 31,
2017 | December 31,
2016 | December 31,
2015 | | | December 31,
2014 | December 31,
2013 |
| Cash & cash equivalents | $ | 64,533 |
| $ | 77,312 |
| $ | 57,765 |
| | | $ | — |
| $ | — |
|
Working capital (1) | 84,155 |
| 73,631 |
| 113,086 |
| | | 9,996 |
| 18,787 |
|
| Total assets | 983,263 |
| 965,844 |
| 1,082,674 |
| | | 337,506 |
| 358,921 |
|
| Total debt obligations | 410,794 |
| 408,246 |
| 410,536 |
| | | — |
| — |
|
| Total AgroFresh stockholders’ equity | 407,637 |
| 335,145 |
| 443,903 |
| | | 234,351 |
| 265,328 |
|
| Noncontrolling Interest | 8,443 |
| — |
| — |
| | | — |
| — |
|
| Total equity | 416,080 |
| 335,145 |
| 443,903 |
| | | 234,351 |
| 265,328 |
|
———————————————————————————————
| |
(1) | Working capital is defined as current assets less current liabilities. |
ITEM 7. MANAGEMENT’S DISCUSSION AND ANALYSIS OF FINANCIAL CONDITION AND RESULTS OF OPERATIONS
As used in this Management’s Discussion and Analysis of Financial Condition and Results of Operations (“MD&A”), the terms “Predecessor” and the “AgroFresh Business” refer to the business conducted by Dow through a combination of wholly-owned subsidiaries and operations of Dow, including through AgroFresh Inc. in the United States, prior to the closing of the Business Combination, the term “Successor” refers to AgroFresh Solutions, Inc. (which was named Boulevard Acquisition Corp. prior to the closing of the Business Combination), and the terms “Company”, “AgroFresh”, “we”, “us” and “our” refer to the combined Predecessor and Successor companies, unless the context otherwise requires or it is otherwise indicated. The application of acquisition accounting for the Business Combination significantly affected certain assets, liabilities, and expenses. As a result, financial information for the twelve months ended December 31, 2017 and December 31, 2016 may not be comparable to the financial information for the seven months ended July 31, 2015 (Predecessor) and the five months ended December 31, 2015 (Successor). Refer to Note 3 to the audited consolidated and combined financial statements contained in this Report for additional information regarding the acquisition accounting for the Business Combination.
The following discussion and analysis of the Company’s financial condition and results of operations should be read in conjunction with the audited consolidated and combined financial statements and the notes thereto contained elsewhere in this Report.
This Management’s Discussion and Analysis of Financial Condition and Results of Operations (“MD&A&A”) contains the financial measure EBITDA and Adjusted EBITDA, which isare not presented in accordance with accounting principles generally accepted in the United States of America ("GAAP"). ThisThese non-GAAP financial measure ismeasures are being presented because management believes that it providesthey provide readers with additional insight into the Company’s operational performance relative to earlier periods and relative to its competitors. EBITDA is acompetitors and they are key measuremeasures used by the Company to evaluate its performance. The Company does not intend for thisthese non-GAAP financial measuremeasures to be a substitute for any GAAP financial information. Readers of this MD&A should use thisthese non-GAAP financial measuremeasures only in conjunction with the comparable GAAP financial measure.measures. A reconciliation of EBITDA and Adjusted EBITDA to the most comparable GAAP measure is provided in this MD&A.
Business Overview
AgroFresh is a global leader in delivering innovative food preservation and waste reduction solutions for fresh produce. The Company is empowering the food industry with Smarter FreshnessTM, a range of integrated solutions designed to help growers, packers and retailers improve produce freshness and quality while reducing waste. AgroFresh’s solutions range from pre-harvest with HarvistaTM and LandSpringTM to its marquee SmartFreshTM Quality System, which includes SmartFreshTM, AdvanStoreTM and ActiMistTM, working together to maintain the quality of stored produce. AgroFresh has
a controlling interest in Tecnidex, a leading provider of post-harvest fungicides, waxes and biocides for the citrus market. Additionally, the company’s initial retail solution, RipeLockTM, optimizes banana ripening for the benefit of retailers and consumers. AgroFresh has key products registered in over 4550 countries, and supports approximately 3,700 direct customers and serviceswith over 25,000 storage rooms globally. AgroFresh’s solutions range from near-harvest with HarvistaTM and LandSpringTM to its flagship post-harvest SmartFreshTM technology. Additional post-harvest freshness solutions include fungicides that can be applied to meet various customer operational requirements, in either a foggable (ActiMist™) or liquid (ActiSeal™) delivery form. To supplement our near- and post-harvest product solutions, our suite of FreshCloud™ analytical, diagnostic and tracking services provide a range of value-added capabilities that help customers optimize the quality of their produce. Beyond apples, SmartFresh technology can provide ready-to-eat freshness for other fruits and vegetables including avocados, bananas, melons, tomatoes, broccoli and mangos. AgroFresh is also providing customers with packaging-based advisory services and custom packaging solutions including RipeLock, which has been repositioned as our brand for packaging-based freshness technology solutions for fruits and vegetables.
In December 2017, AgroFresh acquired a controlling interest in Tecnidex. With this acquisition, AgroFresh expanded its industry-leading post-harvest presence into additional crops, and increased its penetration of the produce market in southern Europe, Latin America and Africa. For over 35 years, Tecnidex has been helping fruit and vegetable producers offer clean, safe and high-quality products to its regional customers in 18 countries. Through its portfolio of post-harvest products, technology,fungicides, coatings, waxes and sanitizers, and associated consulting and after-sale services, Tecnidex improves the quality and value of its clients’ fruit and vegetables while respecting the environment. Tecnidex is based in Valencia, Spain. Tecnidex further diversifiesdiversified AgroFresh’s revenue by expanding ourthe Company's ability to provide solutions and service to the citrus industry.
Freshness is the most important driver of consumer satisfaction when it comes to produce and, at the same time, food waste is a major issue in the industry. About one third of the total food produced worldwide is lost or wasted each year. Nearly 45 percent45% of all fresh fruits and vegetables, 40 percent40% of apples and 20 percent20% of bananas, are lost to spoilage. AgroFresh plays a key role in the value chain by offering products and services that maintain produce freshness and reduce waste.
AgroFresh’s current principalflagship product, SmartFresh, regulates the post-harvest ripening effects of ethylene, the naturally occurring plant hormone that triggers ripening in certain fruits and vegetables. SmartFresh is naturally biodegradable, leaves no detectable residue, and has been approved for use by many domestic and global regulatory organizations. Harvista extends the Company’s proprietary technology into pre-harvestthe field, including treatment of cherries and blueberries early in the growing season, and near-harvest management of pome fruit such as apples and pears. AdvanStoreFreshCloud Storage InsightsTM is an atmospheric monitoring system under development that leverages the Company’sCompany's extensive understanding of fruit physiology, fruit respiration, current controlled atmosphere technology, and new proprietary diagnostic tools to provide improved and real-time guidance to producers and packers of fresh produce regarding storage conditions so timely corrective measures can be made on a
more timely basis. RipeLockTM combines the technology behind SmartFresh with modified atmosphere packaging designed specifically to preserve quality during transportation and to extend the yellow shelf life of bananas and other potential fruits.taken. LandSpringTM is an innovative 1-MCP technology targeted to transplanted vegetable seedlings. It is currently registered for use on tomato, peppers, and 14 other crops in the US. It reduces transplant shock, resulting in less seedling mortality and faster crop establishment, which leads to a healthier crop and improved yields.
AgroFresh’s business is highly seasonal, driven by the timing of harvests in the northern and southern hemispheres. The first half of the year is when the southern hemisphere harvest occurs, and the second half of the year is when the northern hemisphere harvest occurs. Since the northern hemisphere harvest of our two core crops of apples and pears is typically larger,
a significant portion of our sales and profits are historically generated in the second half of the year. In addition to this seasonality, factors such as weather patterns may impact the timing of the harvest within the two halves of the year.
On July 31, 2015 (the “Closing Date”), we consummated a business combination (the “Business Combination”) pursuant to a Stock Purchase Agreement, dated April 30, 2015 (the “Purchase Agreement”), with Dow, providing for the acquisition by us of the AgroFresh is a former blank check company that completed its initial public offering on February 19, 2014. Uponbusiness from Dow. In connection with the closing of the Business Combination, with Dow on July 31, 2015, the Company changed its name to AgroFresh Solutions, Inc. The Company paid Dow cash consideration of $635 million and issued Dow 17.5 million shares of common stock at a deemed value of $12 per share. The transaction included a liability to Dow to deliver a variable number of warrants between the closing and April 2016, which obligation was terminated pursuant to a letter agreementwe entered into on April 4, 2017. The cash consideration was funded through our initial public offering, a term loan, and a private placement of 4.9 million shares of common stock that yielded $50 million of proceeds. The transaction also had an earn-out feature whereby Dow was entitled to receive a deferred payment of $50 million in March 2018 if AgroFresh achieved a specified average level of Business EBITDA (as defined in the Stock Purchase Agreement related to the Business Combination) over 2016 and 2017. The specified level of Business EBITDA was not achieved and, accordingly, the earn-out feature is no longer payable. In addition, pursuant to a tax receivables agreement entered into in connection with the Business Combination,(the "TRA"), as amended in April 2017, pursuant to which Dow iswas entitled to receive 50% of the tax savings, if any, that the Company realizesrealized as a result of the increase in the tax basis of assets acquired pursuant to the Business Combination.
In The TRA was terminated in December 2019. Also in connection with the closing of the Business Combination, AgroFresh entered into a transition services agreement with Dow. Under the agreement, Dow provided AgroFresh a suite of services for a period of time ranging from six months to five years depending on the service. While most of the Dow-provided services arewere complete as of December 31, 20172018, certain services are expected to continue through 2018. The agreement also provided for a $5 million execution fee that was paid to Dow at the closing of the Business Combination.2020.
Factors Affecting the Company’s Results of Operations
The Company’s results of operations are affected by a number of external factors. Some of the more important factors are briefly discussed below.
Demand for the Company’s Offerings
The Company services customers in over 4550 countries and derives its revenue by assisting growers and packers to optimize the value of their crops primarily through the post-harvest period. Its products and services add value to customers by reducing food spoilage and extending the life of perishable fruits. The U.S. Food and Agriculture Organization of the United Nations has estimated that a growing global population will require a near doubling of food production in developing countries by 2050 to meet the expected demand of a worldwide population of 9 billion people.
This global trend, among others, creates demand for the Company’s solutions. The Company’s offerings are currently protected by patents on, among other things, the encapsulation of the active ingredient, 1-MCP.patent filings in 51 countries.
The global produce market is a function of both the size and the yield of the crop harvested; variations in either will affect total production. Given the nature of the agricultural industry, weather patterns may impact total production and the Company's resulting commercial opportunities. The Company supports a diverse customer base whose end markets vary due to the type of fruit and quality of the product demanded in their respective markets. Such variation across end markets also affects demand for the Company’s services.
Customer Pricing
The Company’s offerings are priced based on the value they provide to the Company’s customers. From time to time, the Company adjusts the pricing of its offeringofferings to address market trends. The Company does not typically price its products in relation to any underlying cost of materials or services; therefore, its margins can fluctuate with changes in these costs. The
Company’s pricing may include rebate arrangements with customers in exchange for mutually beneficial long-term relationships and growth.
Whole Product OfferingIntegrated Service Model
The AgroFresh Whole Product offering is aAgroFresh's direct service model foroffers the Company’s commercially available products, including SmartFresh and Harvista. Sales and sales support personnel maintain direct face-to-face relationships with customers year round. Technical sales and support personnel work directly with customers to provide value-added advisory services regarding the application of SmartFresh. The actual application of SmartFresh is performed by service providers that are typically third-party contractors. The Harvista application service, through both aerial and ground application, is also administered by third-party service providers or made by our customers directly.
The Company is shifting the terms of its contracts with service providers from annual renewal periods to two or three year durations in order to have greater certainty that experienced applicators will be available for the next harvest season. Most of the Company’s service providers are operating under multi-year contracts. Management believes the quality and experience of its service providers deliver clear commercial benefits.
Seasonality
The Company’s operations are subject to seasonal variation due to the timing of the growing seasons around the world. Northern HemisphereFor our core crops of apples and pears, northern hemisphere growers harvest from August through November, and Southern Hemispheresouthern hemisphere growers harvest from late January to early May. As we diversify into other crops, such as citrus, we also anticipate seasonal
variations in this business due to the northern hemisphere citrus harvest, which spans from October to March. Since the majority of the Company’s sales are in Northern Hemispherenorthern hemisphere countries, a proportionately greater share of its revenue is realized during the second half of the year. There are also variations in the seasonal demands from year to year depending on weather patterns and crop size. This seasonality and variations in seasonal demand could impact the ability to compare results between periods.
Foreign Currency Exchange Rates
With a global customer base and geographic footprint, the Company generates revenue and incurs costs in a number of different currencies, with the Euro comprising the most significant non-U.S. currency. Fluctuations in the value of these currencies relative to the U.S. dollar can increase or decrease the Company’s overall revenue and profitability as stated in U.S. dollars, which is the Company’s reporting currency. In certain instances, if sales in a given geography have been adversely impacted on a long-term basis due to foreign currency depreciation, the Company has been able to adjust its pricing so as to mitigate the impact on profitability.
Domestic and Foreign Operations
The Company has both domestic and foreign operations. Fluctuations in foreign exchange rates, regional growth-related spending in research and development (“R&D”)&D and marketing expenses, and changes in local selling prices, among other factors, may impact the profitability of foreign operations in the future.
Critical Accounting Policies and Use of Estimates
Our discussion and analysis of results of operations and financial condition are based upon our financial statements. These financial statements have been prepared in accordance with U.S. GAAP. The preparation of these financial statements requires us to make estimates and judgments that affect the amounts reported in the financial statements. We base our estimates and judgments on historical experiences and assumptions believed to be reasonable under the circumstances and re-evaluate them on an ongoing basis. Actual results could differ from our estimates under different assumptions or conditions. Our significant accounting policies, which may be affected by our estimates and assumptions, are more fully described in Note 2 to the audited consolidated and combined financial statements.
An accounting policy is deemed to be critical if it requires an accounting estimate to be made based on assumptions about matters that are highly uncertain at the time the estimate is made, and if different estimates that reasonably could have been used, or changes in the accounting estimates that are reasonably likely to occur periodically, could materially impact the financial statements. Management believes the following critical accounting policies reflect its most significant estimates and assumptions used in the preparation of the financial statements.
Asset Impairments
Factors that could result in future impairment charges, among others, include changes in worldwide economic conditions, changes in technology, changes in competitive conditions and customer preferences, and fluctuations in foreign currency exchange rates. These risk factors are discussed in Part I, Item 1A, “Risk Factors.”
Goodwill
As discussed in Note 2, “Basis of Presentation and Summary of Significant Accounting Policies,” in the audited consolidated and combined financial statements, the Company tests goodwill and identifiable intangible assets with indefinite lives for impairment at least annually. Intangibles are tested for impairment using a quantitative impairment model. We test goodwill for impairment by either performing a qualitative evaluation or a two-step quantitative test. We consider the Company to be onetwo reporting unitunits for purposes of testing goodwill for impairment.
For the 2016 impairment test, we utilized the quantitative methods to assess impairment and we concluded that goodwill was fully impaired. The inputs utilized in the analysis are classified as Level 3 inputs within the fair value hierarchy as defined in ASC 820, Fair Value.
Measurement. The process of evaluating the potential impairment of goodwill is subjective because it requires the use of estimates and assumptions as to our future cash flows, discount rates commensurate with the risks involved in the assets, future economic and market conditions, as well as other key assumptions. The amounts recorded in the financial statements related to goodwill are based on the best estimates and judgments of the Company’s management, although actual outcomes could differ from our estimates. Our annual test of goodwill indicated that goodwill was fully impaired as of December 31, 2016. In connection with the Tecnidex acquisition in 2017, we recorded approximately $9.4goodwill with a carrying value of $6.3 million of goodwill which is based on the preliminary purchase price allocation as of December 2017.31, 2019. The estimated fair value of the Tecnidex reporting unit as of December 31, 2019 is approximately 9% greater than the carrying value of the reporting unit.A 1% increase in the assumed discount rate or a 5% decrease in projected revenues would cause the impairment test to fail.
Other intangible assets
We conduct our annual indefinite-lived intangible assets impairment assessment as of December 31 of each year unless conditions arise that would require a more frequent evaluation. In assessing the recoverability of indefinite-lived intangible assets, projections regarding estimated discounted future cash flows and other factors are made to determine if impairment has occurred. If we conclude that there has been impairment, we will write down the carrying value of the asset to its fair value. Each year, we evaluate those intangible assets with indefinite lives to determine whether events and circumstances continue to support the indefinite useful lives. When testing indefinite-lived intangible assets for impairment, we have the option to first assess qualitative factors to determine whether the existence of events or circumstances leads to a determination that it is more likely than not (more than 50%) that the fair value of an indefinite-lived intangible asset is less than its carrying amount. Such qualitative factors may include the following:
•Macroeconomic conditions
•Industry and market considerations
•Cost factors
•Overall financial performance; and
•Other relevant entity-specific events
Based on the results of our annual impairment review conducted in December 2016,reviews, management recorded an impairment charge of $9.5$2.6 million on its AgroFresh and SmartFresh trade names.name for the year ended December 31, 2018. The Company recorded an impairment charge of $1.0 million for the year ended December 31, 2019 associated with Verigo software. In determining the fair value of the trade names, at December 31, 2016, the Company applied the relief from royalty methodology, which is based on the assumption that without ownership of the assets, the user of the trade name would have to make a stream of payments to the owner of the trade names in return for the rights to use the trade names. By acquiring the trade name, the user avoids those payments. The annual assessment forCompany has three indefinite-lived trade names which passed the year endedimpairment test as of December 31, 2017 resulted2019 by 34%, 29%, and 8%. A 1% increase in no indicatorsthe discount rate would cause an impairment of impairment.one of the trade names by approximately $0.2 million.
Definite-lived intangible assets, such as technology, customer relationships and software are amortized over their estimated useful lives, generally for periods ranging from 4 to 24 years. TheWe assess the reasonableness of the useful lives of these assets regularly. Our assessment is regularly evaluated.based on a number of factors including competitive environment, product history, underlying product life cycles, operating strategy and the macroeconomic environment of the countries in which the products are sold. The impairment of definite-lived intangible assets is tested annually or more frequently when factors or changes in circumstances indicate that the fair value has declined below its carrying value. If any factors that could result in future impairment charge have occurred, a recoverability test is performed in which the undiscounted cash flows of the asset or asset group are compared to the carrying value. If the cash flows are not sufficient to recover the carrying value, then a fair value estimate is made of the asset or asset group to determine the amount of impairment, if any. Once these assets are fully amortized, they are removed from the balance sheet.
Long-Lived Assets
Long-lived assets, which include property, plant and equipment, and definite-lived intangible assets, are assessed for impairment whenever events or changes in circumstances indicate the carrying amount of the asset may not be recoverable. The impairment testing involves comparing the carrying amount of the asset to the forecasted undiscounted future cash flows generated by that asset. In the eventfourth quarter of 2019, the carrying amountCompany recognized accelerated amortization expense of $34.0 million related to developed RipeLock technology based on the asset exceedsCompany’s change in strategy for the undiscounted future cash flows generated by
that asset and the carrying amount is not considered recoverable, an impairment exists. An impairment loss is measured as the excess of the asset’s carrying amount over its fair value and is recognizedintangibles in the consolidated and combined statements of income (loss) in the period that the impairment occurs. For the year ended December 31, 2017, we concluded there was no impairment of definite-lived intangible assets.income.
Revenue Recognition
In general, revenue is recognized when (1) persuasive evidence of an arrangement exists, (2) delivery has occurred or services have been rendered, (3) the sales price is fixed or determinable, and (4) collectability is reasonably assured. Revenue is presented in our consolidated and combined statements of income (loss), net of estimated rebates and discounts.
The majority of our revenues are generated from the application of our products to fruits and vegetables either before or after harvesting. Revenue is recognized at the time the product is applied to the fruits or vegetables as this represents the point at which our performance obligation to the customer has been completed.
On January 1, 2018, the Company began to account for revenue in accordance with ASU 2014-09, Revenue from Contracts with Customers (Topic 606), which requires revenue recognized to represent the transfer of promised goods or services to customers at an amount that reflects the consideration which is expected to be received in exchange for those goods or services. To determine revenue recognition for the arrangements that the Company determines are within the scope of Topic 606, the Company performs the following 5 steps: (1) identify the contracts with a customer, (2) identify the performance obligations in the contract, (3) determine the transaction price, (4) allocate the transaction price to the performance obligations in the contract and (5) recognize revenue when (or as) the entity satisfies a performance obligation. Revenue is recognizedpresented in our consolidated statements of (loss) income, net of estimated payments that are expectedrebates and discounts.
In periods prior to be paid under customer loyaltythe adoption of Topic 606, revenue was recognized when (1) persuasive evidence of an arrangement existed, (2) delivery had occurred or services had been rendered, (3) the sales price was fixed or determinable, and other rebate programs. We initially record(4) collectability was reasonably assured.
See Note 2 to the estimated liabilityaudited consolidated financial statements for payments under these programs based on our historical experience and management’s assessment of the probability that the payments will be made. Each period, we evaluate the liability to determine whether any adjustments are required.further information.
Accounting for Business Combinations
We account for business combinations under the acquisition method of accounting. This method requires the recording of acquired assets, including separately identifiable intangible assets, and assumed liabilities at their acquisition date fair values. The excess of the purchase price over the fair value of assets acquired and liabilities assumed is recorded as goodwill. Determining the fair value of assets acquired and liabilities assumed requires management’s judgment and often involves the use of significant estimates and assumptions, including assumptions with respect to future cash inflows and outflows, discount rates, royalty rates and asset lives, among other items.
The fair values of intangible assets were estimated using an income approach, either the excess earnings method (customer relationships) or the relief from royalty method (technology and trademarks). Under the excess earnings method, an intangible asset’s fair value is equal to the present value of the incremental after-tax cash flows attributable solely to the intangible asset over its remaining useful life. Under the relief from royalty method, fair value is measured by estimating future revenue associated with the intangible asset over its useful life and applying a royalty rate to the revenue estimate. These intangible assets enable us to secure markets for our products, develop new products to meet evolving business needs and competitively produce our existing products.
The fair values of property, plant, and equipment, other than real properties, were based on the consideration that unless otherwise identified, they will continue to be used “as is” and as part of the ongoing business. The determination of the fair value of assets acquired and liabilities assumed involves assessing factors such as the expected future cash flows associated with individual assets and liabilities and appropriate discount rates at the date of the acquisition.
The fair values of the various contingent consideration components were measured using the following valuation models. The fair value of the tax amortization benefit contingency was measured using an income approach based on the Company’s best estimate of the undiscounted cash payments to be made, tax effected and discounted to present value utilizing an appropriate market discount rate. The fair value of the deferred acquisitionearnout payment was measured using a Black-Scholes optionMonte Carlo pricing model and based on the Company’s best projection of the Company’s average adjusted EBITDA levelrevenues over the two-yearthree-year period from January 1, 20162018 to December 31, 2017. The warrant consideration was measured using directly observable quoted prices for identical assets in an inactive market. The working capital settlement was measured pursuant to the terms of the Purchase Agreement based upon the working capital of the AgroFresh Business as of the Closing Date being greater or less than a target level of working capital determined in accordance with the Purchase Agreement.2020.
See Note 3 to the audited consolidated and combined financial statements for further information.
Stock-Based Compensation
We recognize stock-based compensation expense for all share-based payment awards on a straight-line basis over the requisite service period of the award. Determining the fair value of share-based payment awards requires the input of highly subjective assumptions, including the expected life of the share-based payment awards and stock price volatility. The assumptions used in calculating the fair value of share-based payment awards represent management’s best estimates, but these estimates involve inherent uncertainties and the application of management judgment. As a result, if factors change and we use different
assumptions, our share-based compensation expense could be materially different in the future. See Note 1316 to the audited consolidated and combined financial statements contained in this report for further detail on stock basedstock-based compensation.
Income taxes
The provision for income taxes was determined using the asset and liability approach of accounting for income taxes. Under this approach, deferred taxes represent the future tax consequences expected to occur when the reported amounts of assets and liabilities are recovered or paid. The provision for income taxes represents income taxes paid or payable for the current year plus the change in deferred taxes during the period. Deferred taxes result from differences between the financial and tax basis of our assets and liabilities and are adjusted for changes in tax rates and tax laws when changes are enacted. Valuation allowances are recorded to reduce deferred tax assets when it is more likely than not that a tax benefit will not be realized. Deferred tax assets and liabilities are measured using enacted tax rates applicable in the years in which they are expected to be recovered or settled. The effect on deferred tax assets and liabilities of a change in tax law is recognized in income in the period that includes the enactment date.
Income tax related penalties are included in the provision for income taxes. In evaluating the ability to realize deferred tax assets, the Company relies on taxable income in prior carryback years, the future reversals of existing taxable temporary differences, future taxable income, and tax planning strategies.
The breadth of our operations and the global complexity of tax regulations require assessments of uncertainties and judgments in estimating taxes we will ultimately pay. The final taxes paid are dependent upon many factors, including negotiations with taxing authorities in various jurisdictions, outcomes of tax litigation and resolution of disputes arising from federal, state and
international tax audits in the normal course of business. A liability for unrecognized tax benefits is recorded when management concludes that the likelihood of sustaining such positions upon examination by taxing authorities is less than "more likely than not."
Recently Issued Accounting Standards and Pronouncements
See Note 2 to the accompanying audited consolidated and combined financial statements for a full description of recent accounting pronouncements and our expectations of their impact, if any, on our results of operations and financial condition.
Results of Operations
The following table summarizes the results of operations for both the Successor and Predecessor periods:operations:
| | | | | | | | | | | |
| (in thousands) | Year Ended
December 31, 2019 | Year Ended
December 31, 2018 | Year Ended
December 31, 2017 |
| Net sales | $ | 170,065 | | $ | 178,786 | | $ | 164,026 | |
| Cost of sales (excluding amortization, shown separately below) | 45,049 | | 46,271 | | 32,655 | |
| Gross profit | 125,016 | | 132,515 | | 131,371 | |
| Research and development expenses | 14,112 | | 13,873 | | 13,779 | |
| Selling, general, and administrative expenses | 59,446 | | 65,770 | | 61,847 | |
| Amortization of intangibles | 81,119 | | 45,946 | | 41,910 | |
| Impairment of long lived assets | 11,424 | | 2,600 | | — | |
| | | |
| Change in fair value of contingent consideration | (330) | | (3,018) | | (26,948) | |
| Operating (loss) income | (40,755) | | 7,344 | | 40,783 | |
| Other income | 13 | | 429 | | 611 | |
| (Loss) gain on foreign currency exchange | (4,127) | | (1,722) | | 13,344 | |
| Interest expense, net | (33,784) | | (34,451) | | (35,755) | |
| (Loss) Income before income taxes | (78,653) | | (28,400) | | 18,983 | |
| (Benefit) provision for income taxes | (17,143) | | 1,840 | | (4,579) | |
| Net (loss) income including non-controlling interests | $ | (61,510) | | $ | (30,240) | | $ | 23,562 | |
| Less: Net loss (income) attributable to non-controlling interests | $ | 678 | | $ | 180 | | $ | (91) | |
| Net (loss) income attributable to AgroFresh Solutions, Inc | $ | (60,832) | | $ | (30,060) | | $ | 23,471 | |
|
| | | | | | | | | | | | | | |
| | Successor | | | Predecessor |
| (in thousands) | Year Ended December 31,
2017 | Year Ended December 31,
2016 | August 1, 2015
Through
December 31, 2015 | | | January 1, 2015 Through July 31, 2015 |
| Net sales | $ | 164,026 |
| $ | 159,669 |
| $ | 111,081 |
| | | $ | 52,682 |
|
| Cost of sales (excluding amortization, shown separately below) | 32,655 |
| 59,977 |
| 91,752 |
| | | 10,630 |
|
| Gross profit | 131,371 |
| 99,692 |
| 19,329 |
| | | 42,052 |
|
| Research and development expenses | 13,779 |
| 14,767 |
| 5,256 |
| | | 11,599 |
|
| Selling, general, and administrative expenses | 61,847 |
| 61,892 |
| 31,317 |
| | | 16,774 |
|
| Amortization of intangibles | 41,910 |
| 40,327 |
| 16,504 |
| | | 16,895 |
|
| Impairment of long lived assets | — |
| 10,795 |
| — |
| | | — |
|
| Goodwill impairment | — |
| 62,373 |
| — |
| | | — |
|
| Change in fair value of contingent consideration | (26,948 | ) | (53,608 | ) | (23,692 | ) | | | — |
|
| Operating income (loss) | 40,783 |
| (36,854 | ) | (10,056 | ) | | | (3,216 | ) |
| Other income (expense) | 611 |
| (173 | ) | (24 | ) | | | 8 |
|
| Gain (loss) on foreign currency exchange | 13,344 |
| (3,274 | ) | (387 | ) | | | — |
|
| Interest expense, net | (35,755 | ) | (58,239 | ) | (23,202 | ) | | | — |
|
| Income (Loss) income before income taxes | 18,983 |
| (98,540 | ) | (33,669 | ) | | | (3,208 | ) |
| (Benefit) provision for income taxes | (4,579 | ) | 13,020 |
| (19,232 | ) | | | 10,849 |
|
| Net income (loss) | $ | 23,562 |
| $ | (111,560 | ) | $ | (14,437 | ) | | | $ | (14,057 | ) |
| Less: Net income attributable to noncontrolling interests | $ | (91 | ) | $ | — |
| $ | — |
| | | $ | — |
|
| Net income (loss) attributable to AgroFresh Solutions, Inc | $ | 23,471 |
| $ | (111,560 | ) | $ | (14,437 | ) | | | $ | (14,057 | ) |
Comparison of Results of Operations for the twelve monthsyear ended December 31, 20172019 and the twelve monthsyear ended December 31, 2016.2018.
Net Sales
Net sales were $164.0$170.1 million for the twelve monthsyear ended December 31, 2017,2019, as compared to net sales of $159.7$178.8 million for the twelve monthsyear ended December 31, 2016.2018. The overall increaseimpact of the change in net sales in fiscal year 2017 from fiscal year 2016 was primarily relatedforeign currency exchange rates compared to the addition of Tecnidex and double-digit growth in Harvista.2018 reduced revenue by $3.3 million. Excluding this impact, revenue decreased approximately 3.0%.
Net sales in North America decreased to $53.6 million for 2017, down 4.7% from $56.2 million in 2016. The remaining decrease in net sales is primarilywas due to lowerincreased competition and decreased pear crop size in Europe. Tecnidex sales decreased 4.7% on an absolute basis and decreased 0.1% on a constant currency basis versus the prior year period. Offsetting these decreases was growth in SmartFresh in Latin America, sales of SmartFreshHarvista in North America driven by competitive pressures, somewhat offset by an 18% increase in Harvista sales. Net sales in EMEA increased by $5.5 million to $70.2 million in 2017. Excluding currency impact of $2.9 million, EMEA net sales increased by $2.6 million, primarily due to the addition of Tecnidex along with increased penetration in persimmon and pears. Net sales in Latin America increased 9.6% mainly due to a larger apple crop in Brazil compared to 2016 alongand new revenue associated with growth in Harvista sales in Argentina. Net sales in the Asia Pacific region decreased by $0.9 million driven by declines in China compared to 2016.FreshCloud.
Cost of Sales
Cost of sales was $32.7$45.0 million for the twelve monthsyear ended December 31, 2017,2019, as compared to $60.0$46.3 million for the twelve monthsyear ended December 31, 2016. Included in the 2016 amounts was $30.4 million of amortization of inventory step up.2018. Gross profit margin was 80.1 percent73.5% in 2017 and would have been 81.5 percent2019 versus 74.1% in 2016 if the amortization of inventory step-up had been excluded.2018. The decrease in margin was primarily driven by an unfavorable productrelatively stable and geographic mix.in line with our expectations.
Research and Development Expenses
Research and development expenses were $13.8$14.1 million for the twelve monthsyear ended December 31, 2017,2019, as compared to $14.8$13.9 million for the twelve monthsyear ended December 31, 2016, reflecting more targeted2018. The increase in research activities in 2017.and development expenses is primarily related to $0.5 million of severance costs.
Selling, General and Administrative Expenses
Selling, general and administrative expenses were $61.8$59.4 million for the twelve monthsyear ended December 31, 2017,2019, as compared to $61.9$65.8 million for the twelve monthsyear ended December 31, 2016. Savings achieved2018, a decrease of 9.6%. Included in selling, general and administrative expenses were mostly offset by a number$8.8 million in 2019 and $9.0 million in 2018 of one-time charges, including legal and professional fees associated with the Tecnidex and Food Freshness Technologies transactions, and costs associated with the MirTech litigation. Additionally, there were costs uniquenon-recurring items that include M&A and litigation along with severance. Excluding these items, selling general and administrative expenses decreased approximately 10.7% from 2018 to 2017 associated with our migration off of the Dow transition services agreement and the creation of our own technology infrastructure.2019, driven by ongoing cost optimization initiatives.
Amortization of Intangibles
Amortization of intangibles was $41.9$81.1 million for the twelve monthsyear ended December 31, 2017,2019, as compared to $40.3$45.9 million for the twelve monthsyear ended December 31, 2016.2018. The increase in amortization of intangibles is primarily due to theaccelerated Ripelock amortization of in-process research$34.0 million and development for our LandSpring product line, which started in September 2016.software additions during 2019.
Impairment of Long-lived Assets
During the year ended December 31, 2016, the Company recorded a $9.5 million impairment charge related to a decline in the estimated value of the AgroFresh and SmartFresh trade names and a $1.3 million charge for the write-off of assets resulting from the decision to change the product delivery system for Harvista. There were no indicators of impairment during the 2017 impairment assessment.
Goodwill impairment
As a result of the Tecnidex acquisition $9.4 million was recorded to goodwill. The goodwill will be assessed annually for impairment. During the year ended December 31, 2016,2019, the Company recorded an impairment charge of $62.4$1.0 million asassociated with Verigo software following a resultpartnership agreement with a new technology provider and an impairment of our annual$10.1 million on investments and $0.4 million of other assets. During the year ended December 31, 2018, the Company recorded an impairment test.charge of $2.6 million related to the estimated decline in the fair value of the SmartFresh trade name.
Change in fair value of contingent consideration
The Company recorded a $26.9$0.3 million gain in the twelve monthsyear ended December 31, 20172019 related to the change in the fair value of contingent consideration, as compared to a $53.6$3.0 million gain for the twelve monthsyear ended December 31, 2016.2018. As discussed in Note 3 to the audited consolidated and combined financial statements, pursuant to the Business Combination, the Company entered into various forms of contingent consideration, including the warrant consideration, the deferred payment and the tax amortization benefit contingency. These liabilities are measured at fair value each reporting date and any mark-to-market fluctuations are recognized in earnings. For 2017, the warrant consideration,year ended December 31, 2018, the deferred payment and the tax amortization benefit contingency mark-to-market (gains) lossesgains were $0.5 million, $(2.5)$0.3 million and $(24.9)$2.8 million, respectively. For 2016, the warrant consideration,year ended December 31, 2019, the Company recognized a deferred payment gain of $0.4 million and thea tax amortization benefit contingency loss of $0.1 million. In December 2019, the TRA was terminated, and other incurred mark-to-market (gains) losses were $(4.9)the Company paid to Dow an aggregate of $16 million $(32.5) million, $(17.4) millionin settlement of all past and $1.2 million, respectively.estimated future liabilities that would have been owed under the TRA.
Other Income (Expense)
Other income (expense) was $0.6$0.0 million for the twelve monthsyear ended December 31, 2017,2019, as compared to $(0.2)$0.4 million expenseof income for the twelve monthsyear ended December 31, 2016.2018.
Gain (loss)Loss on foreign currency
GainLoss on foreign currency was $13.3$4.1 million for the twelve monthsyear ended December 31, 20172019 as compared to $(3.3)a loss of $1.7 million loss for the twelve monthsyear ended December 31, 2016.2018. The loss was primarily due to inflation in Argentina during 2019, as compared to 2018, when translation losses were included in equity until July 1, 2018.
Interest Expense, Net
Interest expense, net was $35.8$33.8 million for the twelve monthsyear ended December 31, 2017,2019, as compared to $58.2$34.5 million for the twelve monthsyear ended December 31, 2016.2018. The decrease was primarily driven by lower accretion on the deferred payment toTRA of $0.3 million, increase in the recognition of the gain on hedging activity of $1.1 million and increase of interest income of $0.5 million, which was partially offset by higher interest on our credit facility of $1.5 million.
Dow of $14.3 million, lower accretion on the Tax Receivables Agreement of $7.2 million, and lower amortization of debt discount and other of $1.8 million. Cash interest expense was up $0.9 million in 2017 as compared to 2016.
Income Tax Provision
Our effective tax rate was (24.1)21.8% for the year ended December 31, 2019, as compared to (6.5)% for the twelve monthsyear ended December 31, 2017, as compared to (13.2)% for the twelve months ended December 31, 2016.2018. Our tax rate is affected by recurring items, such as tax rates in foreign jurisdictions and the relative amounts of income we earn in those jurisdictions. It is also affected by discrete items that may occur in any given year. On December 22, 2017 the Tax Cuts and Jobs Act ("TCJA") was enacted in the U.S. The TCJA significantly revised the U.S. federal corporate income tax by, among other things, lowering the corporate income tax rate to 21%, implementing a territorial tax system, and imposing a repatriationlimitation on tax on earningsdeductibility of foreign subsidiaries that are deemed to be repatriated toU.S. interest expense, and the U.S.inclusion of “global intangible low-taxed income” (“GILTI”).
During the twelve monthsyear ended December 31, 2017,2019, certain income was recognized that did not receive a tax cost related to the elimination of intercompany profit in inventory. In addition, there was a tax benefit impact in the amount of $17.3 million (91.1%) for the re-measurement of the Company’s deferred tax assets and liabilities in the U.S. and other foreign jurisdictions as a result of 2017 tax legislation enactments (TCJA), and tax expense impact in the amount of $3.1 million net (16.1%) resulting from a valuation allowance release in the U. S., an increase in the U.S., offset by valuation allowance decreases in South Korea,Japan, Netherlands, and the non-recognition of the tax impact of the intercompany profit in inventory elimination (unbenefitted losses).Turkey.
Comparison of Results of Operations for the twelve monthsyear ended December 31, 2016, January 1, 2015 through July 31, 2015 (Predecessor),2018 and August 1, 2015 throughthe year ended December 31, 2015 (Successor).2017.
Net Sales
Net sales were $159.7$178.8 million for the twelve monthsyear ended December 31, 2016,2018, as compared to net sales of $52.7$164.0 million for the seven months ended July 31, 2015 and $111.1 million for the five monthsyear ended December 31, 2015.2017. The overall decreaseincrease in net sales in fiscal year 20162018 from fiscal year 20152017 was primarily related to lower salesdriven by the addition of SmartFresh,Tecnidex which contributed $20.8 million, partially offset by increased salesSmartFresh declines in the Pacific Northwest region of Harvista.
Net sales in North America decreased to $56.2 million for 2016, down 4.4% from $58.8 million in 2015. The decrease in net sales is primarily due to lower sales of SmartFresh in North America driven by competitive price pressure, somewhat offset by mid single-digit crop growth compared to 2015. This decreasethe United States where the business was partially offsetnegatively impacted by a 44% increase in Harvista sales. Net sales in EMEA decreased by $0.2 millionsmaller than normal apple harvest. As the Company continues to $64.7 million in 2016. Excluding currency impactdiversify, and with the addition of $0.4 million, EMEA net sales increased by $0.2 million, primarily due to increased penetration in apples and pears, partially offset by smaller persimmon and kiwi crops. Net sales in Latin America decreased 2.9%, mainly due to smaller apple crops in Brazil and Argentina compared to 2015, offset by increased penetration in Chile and Mexico, as well as growth in Harvista sales in Argentina. NetTecnidex, SmartFresh sales in the Asia Pacific region decreasedNorthwest represented less than 10% of the Company's overall revenue in 2018.
Additionally, foreign currency negatively impacted revenue in 2018 by $0.5$1.4 million, as a resultmostly driven by the Euro, and ASC-606 deferred revenue negatively impacted sales in 2018 by $1.1 million. Excluding these items along with the impact of smaller crops in Australia and New ZealandTecnidex, organic sales were essentially flat compared to 2015.2017.
Cost of Sales
Cost of sales was $60.0$46.3 million for the twelve monthsyear ended December 31, 2016,2018, as compared to $10.6$32.7 million for the seven months ended July 31, 2015 and $91.8 million for the five monthsyear ended December 31, 2015. Included in these amounts were $30.4 million in 2016 and $73.1 million in the five months ended December 31, 2015 of amortization of inventory step up. If the amortization of inventory step-up is excluded, gross2017. Gross profit margin would have been 81.5 percentwas 74.1% in 20162018 versus 82.1 percent80.1% in 2015.2017. The decrease in margin was primarily driven by lower prices on SmartFreshthe addition of Tecnidex, strategic pricing initiatives in the core business and an unfavorable mix towards lower margin with the increase in Harvista sales.impact of ASC 606 deferred revenue.
Research and Development Expenses
Research and development expenses were $14.8$13.9 million for the twelve monthsyear ended December 31, 2016,2018, as compared to $11.6$13.8 million for the seven months ended July 31, 2015 and $5.3 million for the five monthsyear ended December 31, 2015. Research2017. Tecnidex added $1.2 million of cost. Excluding these costs, research and development expenses decreased due to discontinuation of certain projects.costs were down reflecting our resource allocation strategy that supports initiatives which drive continued diversification beyond apples.
Selling, General and Administrative Expenses
Selling, general and administrative expenses were $61.9$65.8 million for the twelve monthsyear ended December 31, 2016,2018, as compared to $16.8$61.8 million for the seven months ended July 31, 2015 and $31.3 million for the five monthsyear ended December 31, 2015. This2017. The increase was primarily driven by the addition of Tecnidex which
contributed $5.2 million in costs. Excluding Tecnidex, selling general and administrative expenses was primarily driven by incremental recurring expenseswere $60.6 million, down 1% for the year, reflecting the impact of $6.1 million in 2016 to support the Company's standalone infrastructure, severance costs of $3.0 million, non-recurring costs to
establish the Company as a separate public company of $2.0 million, stock-based compensation costs of $1.4 million and litigation costs of $1.3 million.cost optimization initiatives.
Amortization of Intangibles
Amortization of intangibles was $40.3$45.9 million for the twelve monthsyear ended December 31, 2016,2018, as compared to $16.9$41.9 million for the seven months ended July 31, 2015 and $16.5 million for the five monthsyear ended December 31, 2015. Amortization2017. The increase in the Successor periods increased compared to the Predecessor periodsamortization of intangibles is primarily due to the increased valueaddition of intangible assets recognized by the Company resulting from the fair valuationTecnidex amortization of assets and liabilities assumed related to the Business Combination.$1.6 million.
Impairment of Long-lived Assets
During the quarteryear ended December 31, 2016, the Company recorded a $9.5 million impairment charge related to a decline in the estimated value of the AgroFresh and SmartFresh trade names and a $1.3 million charge for the write-off of assets resulting from the decision to change the product delivery system for Harvista.
Goodwill impairment
During the quarter ended December 31, 2016,2018, the Company recorded an impairment charge of $62.4$2.6 million related to the estimated decline in the fair value of the SmartFresh trade name. There were no indicators of impairment during the 2017 impairment assessment.
Goodwill Impairment
As a result of the Tecnidex acquisition $9.4 million was recorded to goodwill for the year ended December 31, 2017. During 2018, a measurement period adjustment was recorded to payments due to the owners of Tecnidex which resulted in $6.7 million of goodwill at December 31, 2018. The goodwill will be assessed annually for impairment. During the years ended December 31, 2018 and 2017, the Company did not record an impairment charge as a result of our annual impairment test, reducing the Company's goodwill balance to zero.test.
Change in fair valueFair Value of contingent considerationContingent Consideration
The Company recorded a $53.6$3.0 million gain in the twelve monthsyear ended December 31, 20162018 related to a change in the fair value of contingent consideration, as compared to $0.0 million for the seven months ended July 31, 2015 and a $23.7$26.9 million gain for the five monthsyear ended December 31, 2015.2017. As discussed in Note 3 to the audited consolidated financial statements, pursuant to the Business Combination, the Company entered into various forms of contingent consideration, including the warrant consideration, the deferred payment, and the tax amortization benefit contingency. These liabilities are measured at fair value each reporting date and any mark-to-market fluctuations are recognized in earnings. For 2016,2018, the warrant consideration, the deferred payment, and the tax amortization benefit contingency mark-to-market (gains) losses were $0.0 million, $(0.3) million, and $(2.8) million, respectively. For 2017, the warrant consideration, the deferred payment, and the tax amortization benefit contingency and other incurred mark-to-market losses (gains) losses were $(4.9)$0.5 million, $(32.5) million, $(17.4)$(2.5) million, and $1.2$(24.9) million, respectively.
Other (Expense) Income
Other (expense) income was expense of $0.2$0.4 million for the twelve monthsyear ended December 31, 2016,2018, as compared to $0.0$0.6 million income for the year ended December 31, 2017.
(Loss) gain on Foreign Currency
Loss on foreign currency was $(1.7) million for the seven monthsyear ended JulyDecember 31, 2015 and $0.02018 as compared to a gain of $13.3 million for the five monthsyear ended December 31, 2015.2017. The loss was due to the strengthening of the U.S. dollar against the euro, Canadian dollar, Australian dollar, Chilean peso and Turkish lira during 2018 as compared to 2017. This was partially offset by the change to highly inflationary accounting in Argentina.
Interest Expense, Net
Interest expense, net was $58.2$34.5 million for the twelve monthsyear ended December 31, 2016,2018, as compared to $23.2$35.8 million for the five monthsyear ended December 31, 2015 and $0.02017. The decrease was primarily driven by lower accretion on the TRA of $5.0 million for the seven months ended July 31, 2015. The interest expense in the Successor periods primarily relates to the Company being a standalone company following the Business Combination. Included in interest expense iswhich was partially offset by higher interest on the Term LoanCredit Facility of $24.6$3.5 million. Cash interest expense was up $15.8 million accretionin 2018 as compared to 2017 due to timing of the Tax Receivables Agreement of $15.9 million, accretion on the deferred payment of $14.3 million, and amortization of debt discount and other of $3.4 million for the twelve months ended December 31, 2016.quarterly interest payments.
Income Tax Provision
Our effective tax rate was (13.2)(6.5)% for the twelve monthsyear ended December 31, 2016,2018, as compared to (338.2)(24.1)% for the seven months ended July 31, 2015 and 57.1% for the five monthsyear ended December 31, 2015.2017. Our tax rate is affected by recurring items, such as tax rates in foreign jurisdictions and the relative amounts of income we earn in those jurisdictions. It is also affected by discrete items that may occur in any given year. In addition to state income taxes,On December 22, 2017 the following items had the most significant impact on the difference between our statutory U.S. federal income tax rate of 35.0%Tax Cuts and our effective tax rate:
During the twelve months ended December 31, 2016, thereJobs Act ("TCJA") was a tax impactenacted in the amount of $1.7 million (1.8%) resulting from non-taxable marked to market gains from private placement warrants issued as purchase price accounting consideration, a tax impact inU.S. The TCJA significantly revised the amount of $28.5 million (28.9%) resulting from the increase of a valuation allowance in the United States and Poland, and a tax impact in the amount of $21.8 million (22.2%) resulting from non-deductible U.S. goodwill impairment. No U.S. taxes were provided for those undistributed foreign earnings that are indefinitely reinvested outside the United States.
federal corporate income tax by, among other things, lowering the corporate income tax rate to 21%, implementing a territorial tax system, imposing a limitation on tax deductibility of U.S. interest expense, and the inclusion of “global intangible low-taxed income” (“GILTI”).
During the year ended December 31, 2018, certain losses occurred that did not receive a tax benefit including the unbenefited losses related to the elimination of intercompany profit in inventory. In addition to these unbenefited losses, there was a valuation allowance increase in the U.S. offset by valuation allowance decreases in Japan, Netherlands, and Turkey.
Non-GAAP Measures
The following table setsets forth the non-GAAP financial measuremeasures of EBITDA and Adjusted EBITDA. The Company believes thisthese non-GAAP financial measure providesmeasures provide meaningful supplemental information as it isthey are used by the Company’s management to evaluate the Company’s performance is(including incentive bonuses and for bank covenant reporting), are more indicative of future operating performance of the Company, and facilitatesfacilitate a better comparison among fiscal periods, as the non-GAAP measure excludes items that are not considered core to the Company’s operations.periods. These non-GAAP results are presented for supplemental informational purposes only and should not be considered a substitute for the financial information presented in accordance with GAAP.
The following is a reconciliation between the non-GAAP financial measuremeasures of EBITDA and Adjusted EBITDA to itstheir most directly comparable GAAP financial measure, net (loss) income:
| | | | | | | | | | | |
| (in thousands) | Year Ended
December 31, 2019 | Year Ended
December 31, 2018 | Year Ended
December 31, 2017 |
| GAAP net (loss) income including non-controlling interests | $ | (61,510) | | $ | (30,240) | | $ | 23,562 | |
| (Benefit) provision for income taxes | (17,143) | | 1,840 | | (4,579) | |
Interest expense (1) | 33,784 | | 34,451 | | 35,755 | |
| Depreciation and amortization | 83,456 | | 47,593 | | 44,356 | |
| Non-GAAP EBITDA | $ | 38,587 | | $ | 53,644 | | $ | 99,094 | |
| Share-based compensation | $ | 2,714 | | $ | 2,897 | | $ | 2,616 | |
Severance related costs (2) | 1,086 | | 1,453 | | 261 | |
Other non-recurring costs (3) | 8,745 | | 7,558 | | 5,486 | |
Loss (gain) on foreign currency exchange (4) | 4,127 | | 1,722 | | (13,344) | |
Contingent consideration adjustments, net (5) | (330) | | (3,018) | | (26,948) | |
Impairment of assets (6) | 11,424 | | 2,600 | | — | |
| Non-GAAP Adjusted EBITDA | $ | 66,353 | | $ | 66,856 | | $ | 67,165 | |
|
| | | | | | | | | | | | | | |
| | Successor | | | Predecessor |
| (in thousands) | Year Ended December 31,
2017 | Year Ended December 31,
2016 | August 1, 2015 Through December 31, 2015 | | | January 1, 2015 Through July 31, 2015 |
| GAAP Net income (loss) | $ | 23,562 |
| $ | (111,560 | ) | $ | (14,437 | ) | | | $ | (14,057 | ) |
| (Benefit) provision for income taxes | (4,579 | ) | 13,020 |
| (19,232 | ) | | | 10,849 |
|
Amortization of inventory step-up(1) | — |
| 30,377 |
| 73,054 |
| | | — |
|
Interest expense(2) | 35,755 |
| 58,239 |
| 23,202 |
| | | — |
|
| Depreciation and amortization | 44,356 |
| 42,850 |
| 19,434 |
| | | 17,379 |
|
| Non-GAAP EBITDA | $ | 99,094 |
| $ | 32,926 |
| $ | 82,021 |
| | | $ | 14,171 |
|
———————————————————————————————
| |
(1) | The amortization of inventory step-up related to the acquisition of AgroFresh was charged to income based on the pace of inventory usage. |
| |
(2) | (1) Interest on the term loan and accretion for debt discounts, debt issuance costs and contingent consideration. |
(2) Severance costs related to ongoing cost optimization initiatives.
(3) Costs related to certain professional and other infrequent or non-recurring fees, including those associated with litigation and M&A related fees.
(4) Loss (gain) on foreign currency exchange relates to net losses and gains resulting from transactions denominated in a currency other than the Company's functional currency, the U.S. dollar.
(5) Non-cash adjustment to the fair value of contingent consideration, including the TRA and contingent payment related to the Tecnidex acquisition.
(6) Impairment of assets related to investments, software and trademarks.
Liquidity and Capital Resources
Cash Flows
| | | | Successor | | | Predecessor | | | | | | | | |
| (in thousands) | Year Ended December 31,
2017 | Year Ended December 31,
2016 | August 1, 2015 Through December 31, 2015 | | | January 1, 2015 Through July 31, 2015 | (in thousands) | Year Ended December 31,
2019 | Year Ended December 31,
2018 | Year Ended December 31,
2017 |
| Net cash provided by (used in) operating activities | $ | 35,389 |
| $ | 30,484 |
| $ | 18,780 |
| | | $ | (5,598 | ) | |
| Net cash provided by operating activities | | Net cash provided by operating activities | $ | 20,059 | | $ | 3,012 | | $ | 35,389 | |
| Net cash used in investing activities | $ | (36,950 | ) | $ | (6,528 | ) | $ | (405,552 | ) | | | $ | (613 | ) | Net cash used in investing activities | $ | (4,426) | | $ | (5,751) | | $ | (36,950) | |
| Net cash (used in) provided by financing activities | $ | (14,015 | ) | $ | (6,069 | ) | $ | 446,706 |
| | | $ | 6,211 |
| |
| Net cash used in financing activities | | Net cash used in financing activities | $ | (22,047) | | $ | (22,228) | | $ | (14,015) | |
Cash provided by (used in) operating activities was $20.1 million for the year ended December 31, 2019, as compared to $3.0 million for the year ended December 31, 2018 and $35.4 million for the twelve monthsyear ended December 31, 2017, as compared to $30.5 million for2017.
For the twelve monthsyear ended December 31, 2016, $18.82019, net income before non-cash items was $20.5 million. Included in this amount is the impairment of intangible assets of $11.4 million, fordepreciation and amortization of $83.5 million, change in the five monthsfair value of contingent consideration (including accretion) of $3.1 million, deferred income taxes of $(21.6) million and other non-cash items of $5.6 million. Additionally, the change in net operating assets was $(0.4) million in 2019.
For the year ended December 31, 2015,2018, net income before non-cash items was $32.0 million. Included in this amount is the impairment of intangible assets of $2.6 million, depreciation and $(5.6)amortization of $47.6 million, forchange in the seven months ended July 31, 2015.fair value of contingent consideration (including accretion) of $0.7 million, deferred income taxes of $1.2 million, cash received on interest rate swap termination of $3.7 million and other non-cash items of $6.5 million. Additionally, the change in net operating assets was $(29.0) million in 2018.
For the twelve monthsyear ended December 31, 2017, net income before non-cash items was $49.4$41.5 million. Included in this amount is depreciation and amortization of $44.4 million, change in the fair value of contingent consideration (including accretion) of $(18.5), million, deferred income taxes of $(12.5) million and other non-cash items of $(12.2)$4.6 million. Additionally, the change in net operating assets was $(6.1) million in 2017.
ForCash used in investing activities was $4.4 million for the twelve monthsyear ended December 31, 2016, net income before non-cash items2019, as compared to $5.8 million for the year ended December 31, 2018 and $37.0 million for the year ended December 31, 2017. Cash used in investing activities in 2019 was $32.0 million. Included in this amount is the impairmentpurchase of goodwill, intangiblefixed assets and other assetsleasehold improvements of $73.2 million, depreciation and amortization of $42.9 million, amortization of inventory step-up of $30.4 million, changes in the fair value of contingent consideration (including accretion) of $23.4 million, deferred income taxes of $13.8$4.2 million and other non-cash itemsinvestments of $6.8$0.3 million. Additionally, the changeCash used in in net operating assets was $(1.6) million in 2016.
Cash (used in) investing activities in 2018 was $(37.0) million for the twelve months ended December 31, 2017, as compared to $(6.5)asset acquisition of Verigo of $1.6 million forand the twelve months ended December 31, 2016, $(405.6) million for the five months ended December 31, 2015,purchase of fixed assets and $(0.6) million for the seven months ended July 31, 2015.leasehold improvements of $4.2 million. Cash used in investing activities in 2017 was for the acquisition of a majority share of Tecnidex, net of cash received, of $(18.2)$18.2 million, minority investments totaling $(11.1)$11.1 million and the purchase of fixed assets and leasehold improvements, net of proceeds from the sale of assets, of $(7.6)$7.6 million.
Cash used in investingfinancing activities was $22.0 million for the year ended December 31, 2019, as compared to $22.2 million for the year ended December 31, 2018 and $14.0 million for the year ended December 31, 2017. Cash used in financing activities in 20162019 was for the purchasesettlement payment of fixed assets and leasehold improvements, netthe TRA of proceeds from the sale of assets, of $(6.0)$16.0 million and a minority investment and distribution agreement totaling $(0.6) million. Cash used in 2015 was primarily driven by $(625.5) million usedthe repayment of debt in the acquisitionamount of $6.3 million, offset by $220.5 million in proceeds from the issuance of stock in 2015, which had been recorded as restricted cash.
of $0.2 million. Cash (used in) provided byused in financing activities in 2018 was $(14.0) million for the twelve months ended December 31, 2017, as compared to $(6.1)payment of Dow liabilities of $10.0 million, for the twelve months ended December 31, 2016, $446.7 million forrepayment of debt in the five months ended December 31, 2015, and $6.2 million for the seven months ended July 31, 2015.amount of $6.1 million. Cash used in financing activities in 2017 was for the repayment of debt $4.0 million and the payment of Dow liabilities and contingent consideration of $(10.0) million along with the repayment of debt in the amount of $(4.0)$10.0 million. Cash used in financing activities in 2016 was for the repayment of debt in the amount of $(4.3) million and the purchase of treasury stock in the amount of $(1.5) million. Cash provided by financing activities in 2015 was primarily driven by $425.0 million of proceeds from the issuance of debt and $50.0 million of proceeds from the private placement shares, partially offset by $(20.9) million of debt issuance and other financing costs.
Liquidity
On July 31, 2015, the Company consummated the Business Combination, pursuant to which the Company issued 17,500,000 shares of common stock at a deemed value of $12.00 per share and paid cash consideration of $635.0 million at the closing. The cash consideration was funded through the Company's initial public offering, the Term Loan (defined below) and the sale of our PIPE shares (defined below).
Term Loan
On July 31, 2015, certain of our subsidiaries entered into a Credit Agreement with Bank of Montreal, as administrative agent (the(as amended, the “Credit Facility”). The Credit Facility consists of a $425 million term loan (the “Term Loan”), with an amortization equal to 1.00% per year, and a $25 million revolving loan facility (the “Revolving Loan”). The Revolving Loan includes a $10 million letter-of-credit sub-facility, issuances against which reduce the available capacity for borrowing. As of December 31, 2017,2019, the Company has issued $0.557 million$32.0 thousand of letters of credit, against which no funds have been drawn. The Term Loan has a scheduled maturity date of July 31, 2021, and the Revolving Loan, as amended on December 23, 2019, has a scheduled maturity date of July 31, 2019.April 1, 2021. The interest rates on borrowings under the facilities are either the alternate base rate plus 3.75% or LIBOR plus 4.75% per annum, with a 1.00% LIBOR floor (with step-downs in respect of borrowings under the Revolving Loan dependent upon the achievement of certain financial ratios). The obligations under the Credit Facility are secured by liens on substantially all of the assets of (a) AgroFresh Inc. and its direct wholly-owned domestic subsidiaries, and (b) AF Solutions Holdings, including the common stock of AgroFresh Inc.
On November 18, 2015, the Credit Facility was amended. An existing provision in the credit agreement permitted the Company, subject to an overall cap
The net proceeds of the Term Loan were used to fund a portion of the purchase price payable to Rohm and Haas Company ("R&H"), a subsidiary of Dow in connection with the Business Combination. Amounts available under the Revolving Loan may also be used for working capital, general corporate purposes, and other uses, all as more fully set forth in the Credit Agreement.
As of December 31, 2017,2019, the Company was in compliance with the senior secured net leverage covenant and the other covenants in the facility, other than covenants that apply only to the Company’s ability to borrow under the Revolving Loan
(excluding (excluding letters of credit). The Company is not currently ableOn January 31, 2019, the Credit Facility was amended to accessdecrease the total availability from $25.0 million to $12.5 million and extend the maturity of the Revolving Loan (other than for letters of credit) as
a result of non-compliance with certain covenantsfrom July 31, 2019 to December 31, 2020. An existing covenant in the facility applicable solelycredit agreement was also amended to allow the Company to have access to the Revolving Loan. Subsequently, on December 23, 2019, the Revolving Loan was further amended to extend the maturity to April 1, 2021 and included favorable revisions to the senior secured net leverage ratio covenant.
As of the Closing Date, the Company incurred approximately $12.9 million in debt issuance costs related to the Term Loan and $1.3 million in costs related to the Revolving Loan. The debt issuance costs associated with the Term Loan were capitalized against the principal balance of the debt, and the Revolving Loan costs were capitalized in Other Assets. All issuance costs will be accreted through interest expense for the duration of each respective debt facility. The accretion in interest expense during the twelve monthsyear ended December 31, 2017,2019, and 20162018 was approximately $2.4 million and $2.3 million, respectively.
PIPE Shares
In connection with the closing of the Business Combination, we issued an aggregate of 4,878,048 shares of our common stock, for an aggregate purchase price of $50.0 million, in a private placement (“PIPE”).
Warrant Repurchase Program
In September 2015, the Company’s Board of Directors approved a Warrant Repurchase Program totaling $2.5 million and for the period from August 1, 2015 through$2.5 million, respectively.
If we are unable to obtain additional debt or equity capital, restructure or refinance our indebtedness, or avail ourselves of alternative actions, our Term Loan ($405.9 million as of December 31, 2015, we purchased 1,201,928 warrants at an average market price2019) will become a current liability in the third quarter of $2.08, completing the authorized repurchase.
Stock Repurchase Program
In November 2015, the Company’s Board of Directors approved a Stock Repurchase Program totaling $10 million of the Company’s publicly-traded shares of common stock. The Repurchase Program was to remain in effect for a period of one year, until November 17, 2016. During the period from August 1, 2015 through December 31, 2015 the Company repurchased 412,334 shares of common stock at an average market price of $5.79. During the twelve months ended December 31, 2016, the Company repurchased 249,047 shares of common stock at an average market price of $5.95.2020.
Off-Balance Sheet Arrangements
As of December 31, 2017,2019, we did not have any off-balance sheet arrangements as defined in Item 303(a)(4)(ii) of Regulation S-K and did not have any commitments or contractual obligations other than as detailed below.obligations. We have not guaranteed any debt or commitments of other entities or entered into any options on non-financial assets.
Contractual Obligations
|
| | | | | | | | | | | | | | | |
| | Payments due by period |
| (in thousands) | Less than 1 year | 1-3 years | 3-5 years | More than 5
years | Total |
Long-term debt-principal repayments (1) | $ | 7,926 |
| $ | 9,572 |
| $ | 401,625 |
| $ | — |
| $ | 419,123 |
|
Long-term debt-interest payments(1) | 31,724 |
| 49,895 |
| 39,125 |
| — |
| 120,744 |
|
Future lease payments(2) | 1,149 |
| 2,258 |
| 2,048 |
| 1,027 |
| 6,482 |
|
Insurance premium financing payable (3) | 639 |
| — |
| — |
| — |
| 639 |
|
| Total | $ | 41,438 |
| $ | 61,725 |
| $ | 442,798 |
| $ | 1,027 |
| $ | 546,988 |
|
———————————————————————————————
(1) Long-Term Debt: On July 31, 2015, in connection with the consummation of the Business Combination, AgroFresh Inc. as the borrower and its parent, AF Solutions Holdings LLC, a wholly-owned subsidiary of the Company, as the guarantor, entered into the Credit Facility. The Credit Facility includes the $425 million Term Loan, with an amortization equal to 1.00% per year. The Term Loan has a scheduled maturity date of July 31, 2021. The interest rates on borrowings under the Term Loan are either the alternate base rate plus 3.75% or LIBOR plus 4.75% per annum, with a 1.00% LIBOR floor.
(2) Future lease payments: The Company has future minimum payments under various non-cancelable operating leases that expire through 2024. These leases generally contain renewal options for periods ranging from three to five years and require the Company to pay all executory costs such as maintenance and insurance.
(3) Insurance premium financing: The Company is party to a one-year commercial premium finance agreement. Total premiums were approximately $1.0 million at an annual percentage rate of 2.9%.
In connection with the Business Combination pursuant to the Purchase Agreement and subsequently modified by the
Amendment Agreement, Dow is entitled to receive future contingent consideration and other payments from the Company in relation to a Tax Receivables Agreement under which the Company is required to pay annually to Dow 50% of the amount of the tax savings, if any, in U.S. Federal, state and local income tax or franchise tax that the Company actually realizes as a result of the increase in tax basis of the AgroFresh Inc. assets resulting from a section 338(h)(10) election that the Company and Dow made in connection with the Business Combination; See Note 3 to the audited consolidated and combined financial statements contained in this Report for further discussion of contingent consideration in connection with the Business Combination. The specified level of Business EBITDA was not achieved and, accordingly, the contingent deferred payment of $50 million is no longer payable. Future payments related to the contingent consideration are not included in the above contractual obligations table as payments are not certain.
ITEM 7A. QUANTITATIVE AND QUALITATIVE DISCLOSURES ABOUT MARKET RISK
Interest Rate Risk
Our exposure to interest rate risk for changes in interest rates relates primarily to our Term Loan and Revolving Loan. The Term Loan and Revolving Loan bear interest at floating rates. For variable rate debt, interest rate changes generally do not affect the fair market value of such debt, but do impact future earnings and cash flows, assuming other factors are held constant.
In December 2017 we entered into an interest rate swap agreement that qualified for and is designated as a cash flow hedge. We currently have a cash flow hedge with an amount equal to approximately 60% of our current outstanding Term Loan covering the next 36 months. Holding debt levels constant, a 100 basis point increase in the effective interest rates would have increased the Company’s interest expense by $1.7 million for the twelve months ended December 31, 2017.
Foreign Currency Risk
A portion of the Company’s operations consists of manufacturing and sales activities in foreign jurisdictions. As a result,smaller reporting company, we are not required to provide the Company’s financial results could be significantly affectedinformation required by factors such as changes in foreign currency exchange rates or weak economic conditions in the foreign markets in which the Company distributes its products or services. The Company’s operating results are exposed to changes in exchange rates between the US dollar and various foreign currencies. As we expand internationally, our results of operations and cash flows will become increasingly subject to changes in foreign currency exchange rates.this Item.
We have not used forward contracts or currency borrowings to hedge our exposure to foreign currency risk. Foreign currency risk can be quantified by estimating the change in results of operations or financial position resulting from a hypothetical 10% adverse change in foreign exchange rates. We believe such a change would generally not have a material impact on our financial position, but could have a material impact on our results of operations. Holding other variables constant (such as interest rates and debt levels), if the U.S. dollar appreciated by 10% against the foreign currencies used by our operations in 2017, revenues would have decreased by approximately $7.0 million and EBITDA would have decreased by approximately $4.0 million for the twelve months ended December 31, 2017.
ITEM 8 - FINANCIAL INFORMATION
INDEX TO CONSOLIDATED FINANCIAL STATEMENTS
REPORT OF INDEPENDENT REGISTERED PUBLIC ACCOUNTING FIRM
To the Board of Directors and Stockholders of
AgroFresh Solutions, Inc.
Philadelphia, Pennsylvania
Opinion on the Financial Statements
We have audited the accompanying consolidated balance sheets of AgroFresh Solutions, Inc. and subsidiaries (the "Company") as of December 31, 20172019 and 2016,2018, the related consolidated and combined statements of (loss) income, (loss), comprehensive (loss) income, (loss), stockholders' equity, and cash flows for each of the three years ended December 31, 2017 and 2016 (Successor),in the five-month period ended December 31, 2015 (Successor), and the seven-month period ended July 31, 2015 (Predecessor),2019, and the related notes and the schedules listed in the Index at Item 15 (collectively referred to as the “consolidated and combined financial statements"). In our opinion, the consolidated and combined financial statements present fairly, in all material respects, the financial position of the Company as of December 31, 20172019, and 2016,2018, and the results of its operations and its cash flows for each of the three years ended December 31, 2017 and 2016 (Successor),in the five-month period ended December 31, 2015 (Successor), and the seven-month period ended July 31, 2015 (Predecessor),2019, in conformity with the accounting principles generally accepted in the United States of America.
Basis for Opinion
These consolidated and combined financial statements are the responsibility of the Company's management. Our responsibility is to express an opinion on the Company's consolidated and combined financial statements based on our audits. We are a public accounting firm registered with the Public Company Accounting Oversight Board (United States) (PCAOB) and are required to be independent with respect to the Company in accordance with the U.S. federal securities laws and the applicable rules and regulations of the Securities and Exchange Commission and the PCAOB.
We conducted our audits in accordance with the standards of the PCAOB. Those standards require that we plan and perform the audit to obtain reasonable assurance about whether the financial statements are free of material misstatement, whether due to error or fraud. The Company is not required to have, nor were we engaged to perform, an audit of its internal control over financial reporting. As part of our audits, we are required to obtain an understanding of internal control over financial reporting but not for the purpose of expressing an opinion on the effectiveness of the Company’s internal control over financial reporting. Accordingly, we express no such opinion.
Our audits included performing procedures to assess the risks of material misstatement of the consolidated and combined financial statements, whether due to error or fraud, and performing procedures that respond to those risks. Such procedures included examining, on a test basis, evidence regarding the amounts and disclosures in the consolidated and combined financial statements. Our audits also included evaluating the accounting principles used and significant estimates made by management, as well as evaluating the overall presentation of the consolidated and combined financial statements. We believe that our audits provide a reasonable basis for our opinion.
Emphasis of a Matter
As discussed in Note 2 and 3 to the financial statements, on July 31, 2015 the Company acquired the AgroFresh Business from The Dow Chemical Company (“Dow”). The Predecessor financial statements reflect the AgroFresh business while it was a business unit of Dow and include allocations of certain expenses from Dow. The Successor financial statements include the impact of acquisition accounting.
/s/ DELOITTE & TOUCHE LLP
Philadelphia, Pennsylvania
March 22, 201813, 2020
We have served as the Company's auditor since 2014.
AgroFresh Solutions, Inc.
CONSOLIDATED BALANCE SHEETS
(In thousands, except share and per share data)
| | | | Successor | | | | | | |
| | December 31, 2017 | December 31, 2016 | | December 31,
2019 | December 31,
2018 |
| ASSETS | |
| |
| ASSETS | |
| Current Assets: | | Current Assets: | |
| Cash and cash equivalents | $ | 64,533 |
| $ | 77,312 |
| Cash and cash equivalents | $ | 29,288 | | $ | 34,852 | |
| Accounts receivable, net of allowance for doubtful accounts of $1,550 and $1,242, respectively | 71,509 |
| 63,675 |
| |
| Accounts receivable, net of allowance for doubtful accounts of $2,232 and $2,336, respectively | | Accounts receivable, net of allowance for doubtful accounts of $2,232 and $2,336, respectively | 68,634 | | 67,942 | |
| Inventories | 24,109 |
| 15,467 |
| Inventories | 22,621 | | 24,807 | |
| Other current assets | 18,684 |
| 14,047 |
| Other current assets | 11,802 | | 15,608 | |
| Total current assets | 178,835 |
| 170,501 |
| |
| | Total Current Assets | | Total Current Assets | 132,345 | | 143,209 | |
| Property and equipment, net | 12,200 |
| 8,048 |
| Property and equipment, net | 13,177 | | 13,289 | |
| Goodwill | 9,402 |
| — |
| Goodwill | 6,323 | | 6,670 | |
| Intangible assets, net | 757,882 |
| 776,584 |
| Intangible assets, net | 631,369 | | 711,967 | |
| Deferred income tax assets | 8,198 |
| 8,459 |
| Deferred income tax assets | 10,317 | | 7,332 | |
| Other assets | 16,746 |
| 2,252 |
| Other assets | 12,161 | | 16,820 | |
| TOTAL ASSETS | $ | 983,263 |
| $ | 965,844 |
| TOTAL ASSETS | $ | 805,692 | | $ | 899,287 | |
| | | |
| LIABILITIES AND STOCKHOLDERS’ EQUITY | | |
| LIABILITIES AND STOCKHOLDERS’ EQUITY | | |
| Current Liabilities: | | Current Liabilities: | |
| Accounts payable | $ | 15,014 |
| $ | 12,133 |
| Accounts payable | $ | 15,105 | | $ | 7,530 | |
| Current portion of long-term debt | 7,926 |
| 15,250 |
| Current portion of long-term debt | 4,675 | | 6,419 | |
| Income taxes payable | 5,931 |
| 3,121 |
| Income taxes payable | 5,648 | | 4,815 | |
| | Accrued expenses and other current liabilities | 65,809 |
| 66,366 |
| Accrued expenses and other current liabilities | 24,350 | | 45,340 | |
| Total current liabilities | 94,680 |
| 96,870 |
| |
| Total Current Liabilities | | Total Current Liabilities | 49,778 | | 64,104 | |
| Long-term debt | 402,868 |
| 392,996 |
| Long-term debt | 398,064 | | 400,309 | |
| Other noncurrent liabilities | 38,505 |
| 140,833 |
| |
| Other non-current liabilities | | Other non-current liabilities | 7,246 | | 32,066 | |
| Deferred income tax liabilities | 31,130 |
| — |
| Deferred income tax liabilities | 16,574 | | 30,232 | |
| Total liabilities | 567,183 |
| 630,699 |
| |
| Total Liabilities | | Total Liabilities | 471,662 | | 526,711 | |
| | | |
| Commitments and Contingencies (Note 17) |
|
|
|
| |
| Stockholders’ equity: | |
| |
| |
| Common stock, par value $0.0001; 400,000,000 shares authorized, 51,002,234 and 50,698,587 shares issued and 50,340,853 and 50,037,206 outstanding at December 31, 2017 and December 31, 2016, respectively | 5 |
| 5 |
| |
| Preferred stock; par value $0.0001, 1 share authorized and outstanding at December 31, 2017 and December 31, 2016 | — |
| — |
| |
| Treasury stock; par value $0.0001, 661,381 shares at December 31, 2017 and December 31, 2016, respectively | (3,885 | ) | (3,885 | ) | |
| Commitments and Contingencies (Note 20) | | Commitments and Contingencies (Note 20) | |
| Stockholders’ Equity: | | Stockholders’ Equity: | |
| Common stock, par value $0.0001; 400,000,000 shares authorized, 51,839,527 and 51,071,573 shares issued and 51,178,146 and 50,410,192 outstanding at December 31, 2019 and December 31, 2018, respectively | | Common stock, par value $0.0001; 400,000,000 shares authorized, 51,839,527 and 51,071,573 shares issued and 51,178,146 and 50,410,192 outstanding at December 31, 2019 and December 31, 2018, respectively | 5 | | 5 | |
| Preferred stock, par value $0.0001; 1 share authorized and outstanding at December 31, 2019 and December 31, 2018, respectively | | Preferred stock, par value $0.0001; 1 share authorized and outstanding at December 31, 2019 and December 31, 2018, respectively | — | | — | |
| Treasury stock, par value $0.0001; 661,381 shares at December 31, 2019 and December 31, 2018, respectively | | Treasury stock, par value $0.0001; 661,381 shares at December 31, 2019 and December 31, 2018, respectively | (3,885) | | (3,885) | |
| Additional paid-in capital | 533,015 |
| 475,598 |
| Additional paid-in capital | 561,006 | | 535,819 | |
| Accumulated deficit | (108,729 | ) | (132,200 | ) | Accumulated deficit | (199,621) | | (138,789) | |
| Accumulated other comprehensive loss | (12,769 | ) | (4,373 | ) | Accumulated other comprehensive loss | (31,060) | | (28,837) | |
| Total AgroFresh stockholders’ equity | 407,637 |
| 335,145 |
| |
| Non-controlling Interest | 8,443 |
| — |
| |
| Total stockholders' equity | 416,080 |
| 335,145 |
| |
| Total AgroFresh Stockholders’ Equity | | Total AgroFresh Stockholders’ Equity | 326,445 | | 364,313 | |
| Non-controlling interest | | Non-controlling interest | 7,585 | | 8,263 | |
| Total Stockholders' Equity | | Total Stockholders' Equity | 334,030 | | 372,576 | |
| TOTAL LIABILITIES AND STOCKHOLDERS' EQUITY | $ | 983,263 |
| $ | 965,844 |
| TOTAL LIABILITIES AND STOCKHOLDERS' EQUITY | $ | 805,692 | | $ | 899,287 | |
See accompanying notes to consolidated and combined financial statements.
AgroFresh Solutions, Inc.
CONSOLIDATED AND COMBINED STATEMENTS OF (LOSS) INCOME (LOSS)
(In thousands, except share and per share data)
| | | | Successor | | | Predecessor | | | | | | | | |
| | Year Ended December 31,
2017 | Year Ended December 31,
2016 | August 1, 2015 Through December 2015 | | | January 1, 2015 Through
July 31, 2015 | | Year Ended December 31,
2019 | Year Ended December 31,
2018 | Year Ended December 31,
2017 |
| Net sales | $ | 164,026 |
| $ | 159,669 |
| $ | 111,081 |
| | | $ | 52,682 |
| Net sales | $ | 170,065 | | $ | 178,786 | | $ | 164,026 | |
| Cost of sales (excluding amortization, shown separately below) | 32,655 |
| 59,977 |
| 91,752 |
| | | 10,630 |
| Cost of sales (excluding amortization, shown separately below) | 45,049 | | 46,271 | | 32,655 | |
| Gross profit | 131,371 |
| 99,692 |
| 19,329 |
| | | 42,052 |
| Gross profit | 125,016 | | 132,515 | | 131,371 | |
| Research and development expenses | 13,779 |
| 14,767 |
| 5,256 |
| | | 11,599 |
| Research and development expenses | 14,112 | | 13,873 | | 13,779 | |
| Selling, general, and administrative expenses | 61,847 |
| 61,892 |
| 31,317 |
| | | 16,774 |
| Selling, general, and administrative expenses | 59,446 | | 65,770 | | 61,847 | |
| Amortization of intangibles | 41,910 |
| 40,327 |
| 16,504 |
| | | 16,895 |
| Amortization of intangibles | 81,119 | | 45,946 | | 41,910 | |
| Impairment of long lived assets | — |
| 10,795 |
| — |
| | | — |
| |
| Goodwill impairment | — |
| 62,373 |
| — |
| | | — |
| |
| Impairment of assets | | Impairment of assets | 11,424 | | 2,600 | | — | |
| | Change in fair value of contingent consideration | (26,948 | ) | (53,608 | ) | (23,692 | ) | | | — |
| Change in fair value of contingent consideration | (330) | | (3,018) | | (26,948) | |
| Operating income (loss) | 40,783 |
| (36,854 | ) | (10,056 | ) | | | (3,216 | ) | |
| Other income (expense) | 611 |
| (173 | ) | (24 | ) | | | 8 |
| |
| Gain (loss) on foreign currency exchange | 13,344 |
| (3,274 | ) | (387 | ) | | | — |
| |
| Operating (loss) income | | Operating (loss) income | (40,755) | | 7,344 | | 40,783 | |
| Other income | | Other income | 13 | | 429 | | 611 | |
| (Loss) gain on foreign currency exchange | | (Loss) gain on foreign currency exchange | (4,127) | | (1,722) | | 13,344 | |
| Interest expense, net | (35,755 | ) | (58,239 | ) | (23,202 | ) | | | — |
| Interest expense, net | (33,784) | | (34,451) | | (35,755) | |
| Income (loss) before income taxes | 18,983 |
| (98,540 | ) | (33,669 | ) | | | (3,208 | ) | |
| (Loss) Income before income taxes | | (Loss) Income before income taxes | (78,653) | | (28,400) | | 18,983 | |
| (Benefit) provision for income taxes | (4,579 | ) | 13,020 |
| (19,232 | ) | | | 10,849 |
| (Benefit) provision for income taxes | (17,143) | | 1,840 | | (4,579) | |
| Net income (loss) including non-controlling interests | 23,562 |
| (111,560 | ) | (14,437 | ) | | | (14,057 | ) | |
| Net income attributable to non-controlling interests | (91 | ) | — |
| — |
| | | — |
| |
| Net income (loss) attributable to AgroFresh Solutions, Inc | $ | 23,471 |
| $ | (111,560 | ) | $ | (14,437 | ) | | | $ | (14,057 | ) | |
| Net (loss) income including non-controlling interests | | Net (loss) income including non-controlling interests | (61,510) | | (30,240) | | 23,562 | |
| Less: Net loss (income) attributable to non-controlling interests | | Less: Net loss (income) attributable to non-controlling interests | 678 | | 180 | | (91) | |
| Net (loss) income attributable to AgroFresh Solutions, Inc | | Net (loss) income attributable to AgroFresh Solutions, Inc | $ | (60,832) | | $ | (30,060) | | $ | 23,471 | |
| | | | | | |
| Income (loss) per common share attributable to AgroFresh stockholders: | | |
| | | | |
| |
| (Loss) income per common share attributable to AgroFresh stockholders: | | (Loss) income per common share attributable to AgroFresh stockholders: | | | |
| Basic | $ | 0.47 |
| $ | (2.26 | ) | $ | (0.29 | ) | | | $ | — |
| Basic | $ | (1.21) | | $ | (0.60) | | $ | 0.47 | |
| Diluted | $ | 0.47 |
| $ | (2.26 | ) | $ | (0.29 | ) | | | $ | — |
| Diluted | $ | (1.21) | | $ | (0.60) | | $ | 0.47 | |
| Weighted average shares outstanding: | | |
| |
| | | |
| Weighted average shares outstanding: | | |
| Basic | 49,808,600 |
| 49,462,205 |
| 49,691,206 |
| | | — |
| Basic | 50,123,565 | | 49,883,739 | | 49,808,600 | |
| Diluted | 50,191,303 |
| 49,462,205 |
| 49,691,206 |
| | | — |
| Diluted | 50,123,565 | | 49,883,739 | | 50,191,303 | |
See accompanying notes to consolidated and combined financial statements.
AgroFresh Solutions, Inc.
CONSOLIDATED AND COMBINED STATEMENTS OF COMPREHENSIVE (LOSS) INCOME (LOSS)
(In thousands)
|
| | | | | | | | | | | | | | |
| | Successor | | | Predecessor |
| Year Ended December 31,
2017 | Year Ended December 31,
2016 | August 1, 2015
Through
December 31, 2015 | | | January 1, 2015 Through July 31, 2015 |
| Net income (loss) | $ | 23,562 |
| $ | (111,560 | ) | $ | (14,437 | ) | | | $ | (14,057 | ) |
| Other comprehensive income (loss): | | | |
| | | |
|
| Foreign currency translation adjustments | (8,038 | ) | 1,263 |
| (5,580 | ) | | | (1,725 | ) |
| Unrealized loss on hedging activity, net of tax $98 | (358 | ) | | | | | |
| Pension and other postretirement benefit plans adjustment, net of tax of $0, $11, $11, and $0, respectively | — |
| (77 | ) | 21 |
| | | — |
|
| Comprehensive income (loss), net of tax | $ | 15,166 |
| $ | (110,374 | ) | $ | (19,996 | ) | | | $ | (15,782 | ) |
| | | | | | | | | | | |
| | Year Ended December 31,
2019 | Year Ended December 31,
2018 | Year Ended December 31,
2017 |
| Net (loss) income | $ | (61,510) | | $ | (30,240) | | $ | 23,562 | |
| Other comprehensive (loss) income: | | | |
| Foreign currency translation adjustments | (1,185) | | (19,340) | | (8,038) | |
| Unrealized gain (loss) on hedging activity, net of tax of $20, $944 and $98, respectively | 74 | | 3,553 | | (358) | |
| Recognition of gain on hedging activity reclassified to net (loss) income, net of tax $(314), $(75) and $0, respectively | (1,112) | | (281) | | — | |
| Comprehensive (loss) income, net of tax | $ | (63,733) | | $ | (46,308) | | $ | 15,166 | |
See accompanying notes to consolidated and combined financial statements.
AgroFresh Solutions, Inc.
CONSOLIDATED AND COMBINED STATEMENTSTATEMENTS OF STOCKHOLDERS’ EQUITY
(In thousands, except share and per share data)
|
| | | | | | | | | | | | | | | | | | | | | | | | | | | | | | | |
| | The AgroFresh Business (Predecessor) |
| | Preferred Stock | | Common Stock | | Treasury Stock | | Net Parent Investment | | Accumulated Deficit | | Accumulated
Other Comprehensive
Income | | Total
Stockholders’
Equity |
| | Shares | Amount | | Shares | Amount | | Amount | | | | |
| Balance at December 31, 2014 | — |
| $ | — |
| | — |
| $ | — |
| | $ | — |
| | $ | 232,293 |
| | $ | — |
| | $ | 2,058 |
| | $ | 234,351 |
|
| Net loss | — |
| — |
| | — |
| — |
| | — |
| | (14,057 | ) | | — |
| | — |
| | (14,057 | ) |
| Other comprehensive loss | — |
| — |
| | — |
| — |
| | — |
| | — |
| | — |
| | (1,725 | ) | | (1,725 | ) |
| Net transfers from parent | — |
| — |
| | — |
| — |
| | — |
| | 6,211 |
| | — |
| | — |
| | 6,211 |
|
| Balance at July 31, 2015 | — |
| $ | — |
| | — |
| $ | — |
| | $ | — |
| | $ | 224,447 |
| | $ | — |
| | $ | 333 |
| | $ | 224,780 |
|
|
| | | | | | | | | | | | | | | | | | | | | | | | | | | | | | | | | | | |
| | AgroFresh Solutions, Inc. (Successor) |
| | Preferred Stock | | Common Stock | | Treasury Stock | | Additional
Paid-in
Capital | | Accumulated Deficit | | Accumulated
Other
Comprehensive
Income (Loss) | | Non-Controlling Interest | | Total
Stockholders’
Equity |
| | Shares | Amount | | Shares | Amount | | Amount | | | | |
| Balance at August 1, 2015 | — |
| $ | — |
| | 6,876,248 |
| $ | 1 |
| | $ | — |
| | $ | 7,080 |
| | $ | (6,203 | ) | | $ | — |
| | $ | — |
| | $ | 878 |
|
| Reclassification of redeemable shares | — |
| — |
| | 20,686,252 |
| 2 |
| | — |
| | 206,860 |
| | — |
| | — |
| | — |
| | 206,862 |
|
| Issuance of PIPE shares | — |
| — |
| | 4,878,048 |
| — |
| | — |
| | 50,000 |
| | — |
| | — |
| | — |
| | 50,000 |
|
| Issuance of common and preferred shares to Dow | 1 |
| — |
| | 17,500,000 |
| 2 |
| | — |
| | 209,998 |
| | — |
| | — |
| | — |
| | 210,000 |
|
| Reclassification of warrants to accrued expenses and other current liabilities | — |
| — |
| | — |
| — |
| | — |
| | (6,160 | ) | | — |
| | — |
| | — |
| | (6,160 | ) |
| Reclassification of warrants from accrued expenses and other current liabilities | — |
| — |
| | — |
| — |
| | — |
| | 6,160 |
| | — |
| | — |
| | — |
| | 6,160 |
|
| Equity-based compensation | — |
| — |
| | — |
| — |
| | — |
| | 1,080 |
| | — |
| | — |
| | — |
| | 1,080 |
|
| Repurchase of warrants | — |
| — |
| | — |
| — |
| | — |
| | (2,524 | ) | | — |
| | — |
| | — |
| | (2,524 | ) |
| Treasury stock purchases | — |
| — |
| | — |
| — |
| | (2,397 | ) | | — |
| | — |
| | |
| | — |
| | (2,397 | ) |
| Other comprehensive loss | — |
| — |
| | — |
| — |
| | — |
| | — |
| | — |
| | (5,559 | ) | | — |
| | (5,559 | ) |
| Net loss | — |
| — |
| | — |
| — |
| | — |
| | — |
| | (14,437 | ) | | — |
| | — |
| | (14,437 | ) |
| Balance at December 31, 2015 | 1 |
| $ | — |
| | 49,940,548 |
| $ | 5 |
| | $ | (2,397 | ) | | $ | 472,494 |
| | $ | (20,640 | ) | | $ | (5,559 | ) | | $ | — |
| | $ | 443,903 |
|
| Stock-based compensation | — |
| — |
| | — |
| — |
| | — |
| | 3,250 |
| | — |
| | — |
| | — |
| | 3,250 |
|
| Transfer of director compensation from liability to equity | — |
| — |
| | — |
| — |
| | — |
| | 185 |
| | — |
| | — |
| | — |
| | 185 |
|
| Issuance of stock, net of forfeitures | — |
| — |
| | 813,073 |
| — |
| | — |
| | — |
| | — |
| | — |
| | — |
| | — |
|
| Shares withheld for taxes | — |
| — |
| | (55,034 | ) | — |
| | — |
| | (331 | ) | | — |
| | — |
| | — |
| | (331 | ) |
| Repurchase of stock for treasury | — |
| — |
| | — |
| — |
| | (1,488 | ) | | — |
| | — |
| | — |
| | — |
| | (1,488 | ) |
| Comprehensive loss | — |
| — |
| | — |
| — |
| | — |
| | — |
| | (111,560 | ) | | 1,186 |
| | — |
| | (110,374 | ) |
| Balance at December 31, 2016 | 1 |
| — |
| | 50,698,587 |
| $ | 5 |
| | (3,885 | ) | | $ | 475,598 |
| | $ | (132,200 | ) | | $ | (4,373 | ) | | $ | — |
| | $ | 335,145 |
|
| Stock-based compensation | — |
| — |
| | — |
| — |
| | — |
| | 1,886 |
| | — |
| | — |
| | — |
| | 1,886 |
|
| Transfer of director compensation from liability to equity | — |
| — |
| | — |
| — |
| | — |
| | 442 |
| | — |
| | — |
| | — |
| | 442 |
|
| Issuance of stock, net of forfeitures | — |
| — |
| | 303,647 |
| — |
| | — |
| | — |
| | — |
| | — |
| | — |
| | — |
|
| Settlement of Dow liabilities | — |
| — |
| | — |
| — |
| | — |
| | 55,089 |
| | — |
| | — |
| | — |
| | 55,089 |
|
| Purchase of Non-Controlling Interest | — |
| — |
| | — |
| — |
| | — |
| | — |
| | — |
| | — |
| | 8,352 |
| | 8,352 |
|
| Comprehensive income | — |
| — |
| | — |
| — |
| | — |
| | — |
| | 23,471 |
| | (8,396 | ) | | 91 |
| | 15,166 |
|
| Balance at December 31, 2017 | 1 |
| $ | — |
| | 51,002,234 |
| $ | 5 |
| | $ | (3,885 | ) | | $ | 533,015 |
| | $ | (108,729 | ) | | $ | (12,769 | ) | | $ | 8,443 |
| | $ | 416,080 |
|
| | | | | | | | | | | | | | | | | | | | | | | | | | | | | | | | |
| | Preferred Stock | | Common Stock | | Treasury Stock | Additional
Paid-in
Capital | Accumulated Deficit | Accumulated Other Comprehensive Loss | Non-Controlling Interest | Total
Stockholders’
Equity |
| | Shares | Amount | Shares | Amount | Amount | | | | | |
| Balance at December 31, 2016 | 1 | | $ | — | | 50,698,587 | | $ | 5 | | $ | (3,885) | | $ | 475,598 | | $ | (132,200) | | $ | (4,373) | | $ | — | | $ | 335,145 | |
| Stock-based compensation | — | | — | | — | | — | | — | | 1,886 | | — | | — | | — | | 1,886 | |
| Transfer of director compensation from liability to equity | — | | — | | — | | — | | — | | 442 | | — | | — | | — | | 442 | |
| Issuance of stock, net of forfeitures | — | | — | | 303,647 | | — | | — | | — | | — | | — | | — | | — | |
| Settlement of Dow liabilities, net of tax | — | | — | | — | | — | | — | | 55,089 | | — | | — | | — | | 55,089 | |
| Purchase of non-controlling interest | — | | — | | — | | — | | — | | — | | — | | — | | 8,352 | | 8,352 | |
| Comprehensive loss | — | | — | | — | | — | | — | | — | | 23,471 | | (8,396) | | 91 | | 15,166 | |
| Balance at December 31, 2017 | 1 | | $ | — | | 51,002,234 | | $ | 5 | | $ | (3,885) | | $ | 533,015 | | $ | (108,729) | | $ | (12,769) | | $ | 8,443 | | $ | 416,080 | |
| Stock-based compensation | — | | — | | — | | — | | — | | 2,804 | | — | | — | | — | | 2,804 | |
| Issuance of stock, net of forfeitures | — | | — | | 69,339 | | — | | — | | — | | — | | — | | — | | — | |
| Comprehensive loss | — | | — | | — | | — | | — | | — | | (30,060) | | (16,068) | | (180) | | (46,308) | |
| Balance at December 31, 2018 | 1 | | $ | — | | 51,071,573 | | $ | 5 | | (3,885) | | $ | 535,819 | | $ | (138,789) | | $ | (28,837) | | $ | 8,263 | | $ | 372,576 | |
| Stock-based compensation | — | | — | | — | | — | | — | | 2,934 | | — | | — | | — | | 2,934 | |
| Issuance of stock, net of forfeitures | — | | — | | 599,281 | | — | | — | | — | | — | | — | | — | | — | |
| Issuance of common stock under employee stock purchase plan | — | | — | | 168,673 | | — | | — | | 241 | | — | | — | | — | | 241 | |
| Settlement of Dow liabilities, net of tax | — | | — | | — | | — | | — | | 22,012 | | — | | — | | — | | 22,012 | |
| Comprehensive loss | — | | — | | — | | — | | — | | — | | (60,832) | | (2,223) | | (678) | | (63,733) | |
| Balance at December 31, 2019 | 1 | | $ | — | | 51,839,527 | | $ | 5 | | $ | (3,885) | | $ | 561,006 | | $ | (199,621) | | $ | (31,060) | | $ | 7,585 | | $ | 334,030 | |
See accompanying notes to consolidated and combined financial statements.
AgroFresh Solutions, Inc.
CONSOLIDATED AND COMBINED STATEMENTSTATEMENTS OF CASH FLOWS
(In thousands)
| | | | Successor | | | Predecessor | | | | | | | | |
| | Year Ended December 31,
2017 | Year Ended December 31,
2016 | August 1, 2015
Through
December 31, 2015 | | | January 1, 2015
Through
July 31, 2015 | | Year Ended December 31,
2019 | Year Ended December 31,
2018 | Year Ended December 31,
2017 |
| Cash flows from operating activities: | | |
| | | |
| Cash flows from operating activities: | | |
| Net income (loss) | $ | 23,562 |
| $ | (111,560 | ) | $ | (14,437 | ) | | | $ | (14,057 | ) | |
| Adjustments to reconcile net income (loss) to net cash provided by (used in) operating activities: | | |
| | | |
| |
| Net (loss) income | | Net (loss) income | (61,510) | | (30,240) | | 23,562 | |
| Adjustments to reconcile net (loss) income to net cash provided by (used in) operating activities: | | Adjustments to reconcile net (loss) income to net cash provided by (used in) operating activities: | | |
| Depreciation and amortization | 44,356 |
| 42,850 |
| 19,434 |
| | | 17,379 |
| Depreciation and amortization | 83,456 | | 47,593 | | 44,356 | |
| Provision for bad debts | 308 |
| 1,052 |
| 190 |
| | | — |
| Provision for bad debts | 63 | | 1,208 | | 308 | |
| Stock based compensation for equity classified awards | 1,886 |
| 3,250 |
| 1,124 |
| | | — |
| Stock based compensation for equity classified awards | 2,934 | | 2,804 | | 1,886 | |
| Pension (income) expense | (153 | ) | 188 |
| 119 |
| | | — |
| |
| Amortization of inventory fair value adjustment | — |
| 30,377 |
| 73,054 |
| | | — |
| |
| Pension expense (income) | | Pension expense (income) | — | | 17 | | (153) | |
| Amortization of deferred financing cost | 2,368 |
| 2,275 |
| 911 |
| | | — |
| Amortization of deferred financing cost | 2,600 | | 2,476 | | 2,368 | |
| Transaction costs | — |
| — |
| (4,487 | ) | | | — |
| |
| Cash received on interest rate swap termination, net of non-cash interest income recognized | | Cash received on interest rate swap termination, net of non-cash interest income recognized | — | | 3,684 | | — | |
| Accretion of contingent consideration | 8,433 |
| 30,197 |
| 11,862 |
| | | — |
| Accretion of contingent consideration | 3,459 | | 3,781 | | 8,433 | |
| Decrease in fair value of contingent consideration | (26,948 | ) | (53,608 | ) | (23,692 | ) | | | — |
| |
| Change in fair value of contingent consideration | | Change in fair value of contingent consideration | (330) | | (3,018) | | (26,948) | |
| Deferred income taxes | (12,515 | ) | 13,792 |
| (19,886 | ) | | | (4,218 | ) | Deferred income taxes | (21,631) | | 1,154 | | (12,515) | |
| Impairment of long-lived assets | — |
| 10,795 |
| — |
| | | — |
| |
| Goodwill impairment | — |
| 62,373 |
| — |
| | | — |
| |
| Impairment of assets | | Impairment of assets | 11,424 | | 2,600 | | — | |
| | Loss (gain) on sales of property | 81 |
| 22 |
| — |
| | | (12 | ) | Loss (gain) on sales of property | 4 | | (52) | | 81 | |
| Other | 98 |
| 32 |
| 2,556 |
| | | — |
| Other | — | | — | | 98 | |
| Changes in operating assets and liabilities: | | | | | Changes in operating assets and liabilities: | |
| Accounts receivable | 5,981 |
| (4,101 | ) | (42,703 | ) | | | 42,585 |
| Accounts receivable | (321) | | (5,362) | | 5,981 | |
| Inventories | (2,496 | ) | (764 | ) | 2,288 |
| | | (5,756 | ) | Inventories | (388) | | (1,581) | | (2,496) | |
| Prepaid expenses and other current assets | (5,176 | ) | (7,788 | ) | (3,830 | ) | | | — |
| Prepaid expenses and other current assets | 2,087 | | (652) | | (5,176) | |
| Accounts payable | (13,889 | ) | 6,357 |
| 13,785 |
| | | (798 | ) | Accounts payable | 6,499 | | (10,955) | | (13,889) | |
| Accrued expenses and other liabilities | 18,432 |
| 2,341 |
| 2,492 |
| | | — |
| Accrued expenses and other liabilities | (9,239) | | (4,175) | | 18,432 | |
| Income taxes payable | 2,844 |
| (376 | ) | — |
| | | (36,070 | ) | Income taxes payable | 1,615 | | (4,053) | | 2,844 | |
| Other assets and liabilities | (11,783 | ) | 2,780 |
| — |
| | | (4,651 | ) | Other assets and liabilities | (663) | | (2,217) | | (11,783) | |
| Net cash provided by (used in) operating activities | 35,389 |
| 30,484 |
| 18,780 |
| | | (5,598 | ) | |
| Net cash provided by operating activities | | Net cash provided by operating activities | 20,059 | | 3,012 | | 35,389 | |
| Cash flows from investing activities: | | |
| | | |
| Cash flows from investing activities: | | |
| Cash paid for property and equipment | (7,725 | ) | (6,004 | ) | (516 | ) | | | (676 | ) | Cash paid for property and equipment | (4,176) | | (4,164) | | (7,725) | |
| Proceeds from sale of property | 99 |
| 76 |
| — |
| | | 63 |
| Proceeds from sale of property | — | | — | | 99 | |
| Acquisition of business, net of cash acquired | (18,192 | ) | — |
| (625,541 | ) | | | — |
| Acquisition of business, net of cash acquired | — | | — | | (18,192) | |
| Restricted cash | — |
| — |
| 220,505 |
| | | — |
| |
| | Other investments | (11,132 | ) | (600 | ) | — |
| | | — |
| Other investments | (250) | | (1,587) | | (11,132) | |
| Net cash used in investing activities | (36,950 | ) | (6,528 | ) | (405,552 | ) | | | (613 | ) | Net cash used in investing activities | (4,426) | | (5,751) | | (36,950) | |
| Cash flows from financing activities: | | | |
| | | |
| Cash flows from financing activities: | | |
| Proceeds from long term debt | — |
| — |
| 425,000 |
| | | — |
| |
| Payment of debt issuance costs | — |
| — |
| (13,120 | ) | | | — |
| |
| Payment of revolving credit facility fees | — |
| — |
| (1,266 | ) | | | — |
| |
| Other financing costs | — |
| — |
| (7,776 | ) | | | — |
| |
| | Payment of Dow liabilities settlement | (10,000 | ) | — |
| — |
| | | — |
| Payment of Dow liabilities settlement | — | | (10,000) | | (10,000) | |
| Repayment of long term debt | | Repayment of long term debt | (6,285) | | (6,096) | | (4,015) | |
| Payments of contingent consideration | | Payments of contingent consideration | — | | (6,132) | | — | |
| Borrowings under revolving credit facility | | Borrowings under revolving credit facility | 4,000 | | 11,000 | | — | |
| Repayments of revolving credit facility | | Repayments of revolving credit facility | (4,000) | | (11,000) | | — | |
| Settlement payment under Tax Receivables Agreement | | Settlement payment under Tax Receivables Agreement | (16,003) | | — | | — | |
| Proceeds from issuance of stock under employee stock purchase plan | | Proceeds from issuance of stock under employee stock purchase plan | 241 | — | | — | |
| | Net cash used in financing activities | | Net cash used in financing activities | $ | (22,047) | | $ | (22,228) | | $ | (14,015) | |
| Effect of exchange rate changes on cash and cash equivalents | | Effect of exchange rate changes on cash and cash equivalents | $ | 1,379 | | $ | (4,714) | | $ | 2,797 | |
| Net decrease in cash and cash equivalents | | Net decrease in cash and cash equivalents | $ | (5,035) | | $ | (29,681) | | $ | (12,779) | |
|
| | | | | | | | | | | | | | |
| Repayment of long term debt | (4,015 | ) | (4,250 | ) | (2,125 | ) | | | — |
|
| Proceeds from private placement | — |
| — |
| 50,000 |
| | | — |
|
| Borrowings under revolving credit facility | — |
| — |
| 500 |
| | | — |
|
| Repayments of revolving credit facility | — |
| — |
| (500 | ) | | | — |
|
| Insurance premium financing | — |
| — |
| 1,294 |
| | | — |
|
| Repayment of notes payable | — |
| — |
| (380 | ) | | | — |
|
| Repurchase of stock for treasury |
|
| (1,488 | ) | (2,397 | ) | | | — |
|
| Payment of withholding taxes related to stock-based compensation to employees |
|
| (331 | ) | — |
| | | — |
|
| Repurchase of warrants | — |
| — |
| (2,524 | ) | | | — |
|
| Cash transfers to/from parent, net | — |
| — |
| — |
| | | 6,211 |
|
| Net cash (used in) provided by financing activities | (14,015 | ) | (6,069 | ) | 446,706 |
| | | 6,211 |
|
| Effect of exchange rate changes on cash and cash equivalents | 2,797 |
| 1,660 |
| (2,253 | ) | | | — |
|
| Net (decrease) increase in cash and cash equivalents | (12,779 | ) | 19,547 |
| 57,681 |
| | | — |
|
| Cash and cash equivalents, beginning of period | 77,312 |
| 57,765 |
| 84 |
| | | — |
|
| Cash and cash equivalents, end of period | $ | 64,533 |
| $ | 77,312 |
| $ | 57,765 |
| | | $ | — |
|
| | | | | | | |
| Supplemental disclosures of cash flow information: | | | |
| | | |
|
| Cash paid for: | | | |
| | | |
|
| Interest | $ | 18,884 |
| $ | 24,560 |
| $ | 10,411 |
| | | $ | — |
|
| Income taxes | $ | 3,257 |
| $ | 3,095 |
| $ | — |
| | | $ | — |
|
| Supplemental schedule of non-cash investing and financing activities: | | | |
| | | |
|
| Accrued purchases of property and equipment | $ | 1,422 |
| $ | 815 |
| $ | — |
| | | $ | — |
|
| Issuance of common stock as consideration for acquisition of business | $ | — |
| $ | — |
| $ | 210,000 |
| | | $ | — |
|
| Acquisition-related contingent consideration | $ | 691 |
| $ | — |
| $ | 190,150 |
| | | $ | — |
|
| Settlement of Dow liabilities not resulting from a cash payment | $ | 55,089 |
| $ | — |
| $ | — |
| | | $ | — |
|
| | | | | | | | | | | |
| Cash and cash equivalents, beginning of period | $ | 34,852 | | $ | 64,533 | | $ | 77,312 | |
| Cash and cash equivalents, end of period | $ | 29,817 | | $ | 34,852 | | $ | 64,533 | |
| | | |
| Supplemental disclosures of cash flow information: | | | |
| Cash paid for: | | | |
| Interest | $ | 30,144 | | $ | 34,712 | | $ | 18,884 | |
| Income taxes | $ | 2,642 | | $ | 6,949 | | $ | 3,257 | |
| | | |
| Supplemental schedule of non-cash investing and financing activities: | | | |
| Accrued purchases of property and equipment | $ | 71 | | $ | 607 | | $ | 1,422 | |
| Acquisition-related contingent consideration | $ | — | | $ | — | | $ | 691 | |
| Settlement of Dow liabilities not resulting from a cash payment | $ | 22,012 | | $ | — | | $ | 55,089 | |
| | | |
| Reconciliation of cash and cash equivalents and restricted cash: | | | |
| Cash and cash equivalents | $ | 29,288 | | $ | 34,852 | | $ | 64,533 | |
| Restricted cash within other current assets | 529 | | — | | — | |
| Total cash and cash equivalents and restricted cash | 29,817 | | 34,852 | | 64,533 | |
See accompanying notes to consolidated and combined financial statements.
AgroFresh Solutions, Inc.
NOTES TO CONSOLIDATED AND COMBINED FINANCIAL STATEMENTS
| |
1. | Description of Business |
1. Description of Business
AgroFresh Solutions, Inc. (the “Company”) is a global leader in delivering innovative food preservation and waste reduction solutions for fresh produce. The Company is empowering the food industry with Smarter FreshnessTM, a range of integrated solutions designed to help growers, packers and retailers improve produce freshness and quality while reducing waste. The Company’s solutions range from pre-harvestnear-harvest with HarvistaTM and LandSpringTM to its marqueeflagship post-harvest SmartFreshTM Quality System, which includes SmartFreshTMSystem. Additional post-harvest freshness solutions include fungicides that can be applied to meet various customer operational requirements in both foggable (ActiMist™), AdvanStoreTMand ActiMistTMliquid (ActiSeal™), working together to maintain the quality of stored produce.delivery options. The Company has a controlling interest in Tecnidex Fruit Protection, S.A.U. (“Tecnidex”), a leading provider of post-harvest fungicides, coatings, waxes and biocidessanitizers for the citrus market. Additionally,Beyond apples, SmartFresh technology can provide ready-to-eat freshness for other fruits and vegetables including avocados, bananas, melons, tomatoes, broccoli and mangos. RipeLock is the Company’s initial retail solution, RipeLockTM, optimizes banana ripeningCompany's newly rebranded line of packaging-based freshness technology solutions for the benefit of retailersfruits and consumers.vegetables, including modified atmosphere packaging. The Company has key products registered in over 4550 countries, and supports approximately 3,700 direct customers and serviceswith over 25,000 storage rooms globally.
The end markets that the Company serves are seasonal and are generally aligned with the seasonal growing patterns of the Company’s customers. For those customers growing, harvesting or storing apples and pears, the Company’s primary target market,core crops, the peak season in the southern hemisphere is the first and second quarters of each year, while the peak season in the northern hemisphere is the third and fourth quarters of each year. Within each half-year period (i.e., January through June for the southern hemisphere, and July through December for the northern hemisphere) the apple growing season has historically occurred during both quarters. A variety of factors, including weather, may affect the timing of the growing, harvesting and storing patterns of the Company’s customers and therefore shift the consumption of the Company’s services and products between the first and second quarters primarily in the southern hemisphere or between the third and fourth quarters primarily in the northern hemisphere.
The Company was originally incorporated as Boulevard Acquisition Corp. (“Boulevard”), a blank check company, in Delaware on October 24, 2013, and was formed for the purpose of effecting a merger, capital stock exchange, asset acquisition, stock purchase, reorganization or similar business combination. On July 31, 2015, the Company completed a Business Combination (refer to Note 3) and changed its name to AgroFresh Solutions, Inc. Prior to consummation of the Business Combination, the Company’s efforts were limited to organizational activities, its initial public offering and related financings, and the search for suitable business acquisition transactions.
| |
2. | 2. Basis of Presentation and Summary of Significant Accounting Policies |
As used in these notes to the consolidated and combined financial statements, the “AgroFresh Business” refers to the business conducted prior to the closing of the Business Combination by The Dow Chemical Company (“Dow”) through a combination of wholly-owned subsidiaries and operations of Dow, including through AgroFresh Inc. in the United States.
As a result of the Business Combination, the Company was identified as the acquirer for accounting purposes, and the AgroFresh Business is the acquiree and accounting Predecessor. The Company’s financial statement presentation reflects the AgroFresh Business as the “Predecessor” for periods through July 31, 2015 (the “Closing Date”). On the Closing Date, Boulevard was re-named AgroFresh Solutions, Inc. and is the “Successor” for periods after the Closing Date, which includes consolidation of the AgroFresh Business subsequent to the Closing Date. The acquisition was accounted for as a business combination using the acquisition method of accounting, and the Successor financial statements reflect a new basis of accounting that is based on the fair value of net assets acquired. See Note 3 for further discussion of the Business Combination. As a result of the application of the acquisition method of accounting as of the effective time of the Business Combination, the financial statements for the Predecessor period and for the Successor period are presented on a different basis and, therefore, are not comparable. The historical financial information of Boulevard prior to the Business Combination has not been reflected in the Predecessor period financial statements as those amounts are not considered to be material.
For the Consolidated Statements of Stockholders’ Equity, the Predecessor results reflect the equity balances and activities of the AgroFresh Business at December 31, 2014 and July 31, 2015 prior to the closing of the Business Combination; and the Successor results reflect the Company’s equity balances at July 31, 2015 following the closing of the Business Combination and the activities of the Company through December 31, 2017 following the closing of the Business Combination. For the fiscal year 2015, the Company’s financial statements reflect the seven months ended July 31, 2015 (Predecessor) and the five months ended December 31, 2015 (Successor).
Section 107 of the JOBS Act provides that an “emerging growth company” can take advantage of the extended transition period provided in Section 7(a)(2)(B) of the Securities Act for complying with new or revised accounting standards. An “emerging
growth company” can therefore delay the adoption of certain accounting standards until those standards would otherwise apply to private companies.
The Company is an emerging growth company, and can adopt the new or revised standard at the time private companies adopt the new or revised standard. The Company has elected not to opt out of such extended transition period which means that when a standard is issued or revised and it has different application dates for public or private companies, the Company, as an emerging growth company, can adopt the new or revised standard at the time private companies adopt the new or revised standard. This may make comparison of the Company’s financial statements with another public company, which is neither an emerging growth company nor an emerging growth company which has opted out of using the extended transition period, difficult or impossible because of the potential differences in accounting standards used.
Principles of Consolidation
The accompanying consolidated and combined financial statements include the accounts of the Company and its wholly owned subsidiaries.entities in which the Company has a controlling voting interest. All intercompany balances and transactions have been eliminated in consolidation.
Use of Estimates
The preparation of the consolidated and combined financial statements in conformity with accounting principles generally accepted in the United States of America (“U.S. GAAP”) requires management to make estimates and assumptions that affect the amounts reported in the consolidated and combined financial statements and accompanying notes. Management believes that such estimates have been based on reasonable and supportable assumptions and the resulting estimates are reasonable for use in the preparation of the consolidated and combined financial statements. Actual results could differ from these estimates. The Company’s significant estimates include the allocation of the purchase price to the fair value of assets acquired and liabilities assumed, impairment of goodwill and identifiable intangible assets, stock-based compensation, contingent liabilities and income tax valuation allowances.
SUMMARY OF SIGNIFICANT ACCOUNTING POLICIES
Adoption of Highly Inflationary Accounting in Argentina
GAAP requires the use of highly inflationary accounting for countries whose cumulative three-year inflation rate exceeds 100%. The Company has been closely monitoring the inflation data and currency volatility in Argentina, where there are multiple data sources for measuring and reporting inflation. In the second quarter of 2018, the Argentine peso rapidly devalued relative to the U.S. dollar, which along with increased inflation, indicated that the three-year cumulative inflation rate in that country exceeded 100% as of June 30, 2018. As a result, the Company elected to adopt highly inflationary accounting as of July 1, 2018 for its subsidiary in Argentina. Under highly inflationary accounting, the functional currency of the Company's subsidiary in Argentina became the U.S. dollar, and its income statement and balance sheet will be measured in U.S. dollars using both current and historical rates of exchange. The effect of changes in exchange rates on Argentine peso-denominated monetary assets and liabilities will be reflected in earnings. As of December 31, 2019, the Company’s subsidiary in Argentina
had a net asset position of $4.4 million. Net sales attributable to Argentina were approximately 4.0% and 3.2% of the Company’s consolidated net sales for the years ended December 31, 2019 and 2018, respectively.
Revenue Recognition
RevenueOn January 1, 2018, the Company began to account for revenue in accordance with Accounting Standards Codification ("ASC") 606, which requires revenue recognized to represent the transfer of promised goods or services to customers at an amount that reflects the consideration which is recognized when there is evidenceexpected to be received in exchange for those goods or services. The Company utilized the modified retrospective method of an arrangement,adoption to all contracts that were not completed as of January 1, 2018. Prior period results were not adjusted and continue to be reported under the price is fixed or determinable, collectionaccounting standards in effect for the prior period. The Company has not made any significant changes to judgments in applying ASC 606 during the year ended December 31, 2019.
Performance Obligations
The Company derives revenue from the customersale of products created with proprietary technology to regulate the ripening of produce and through performing post application technical services for its customers. A performance obligation is probable and either an applicationa promise in a contract to transfer a distinct good or service has been provided or, in certain arrangements, risk and title to product have been transferred to the customer, and usually occursis the unit of account in ASC 606. A contract’s transaction price is allocated to each distinct performance obligation and recognized as revenue when, or as, the performance obligation is satisfied. The majority of the Company’s contracts have multiple performance obligations primarily related to product application occursand post application services, which the Company provides. For contracts with multiple performance obligations, the Company allocates the contract’s transaction price to each performance obligation using the best estimate of the standalone selling price of each distinct good or at the time of shipment, respectively. The Company’s standard terms of delivery are included in its contracts of sale, order confirmation documents and invoices. Sales are recorded net of provisions for customer discounts and rebate programs.
In an effort to maintain a competitive positionservice in the marketplace andcontract. The method used to promote sales and customer loyalty,estimate standalone selling price is the expected cost plus a margin approach, under which the Company maintains variouscalculates the costs of satisfying a performance obligation and factors in an appropriate margin for that distinct good or service.
The transaction price is primarily fixed, as prices are governed by the terms and conditions of the Company's contracts with customers, and payment is typically made under standard terms. The Company has certain transactions that provide for variable consideration through rebate and customer loyalty programs with our customers.programs. Depending on the program, the customer may elect to receive either a credit against theirits account or a cash payment. We recognizeThe Company recognizes an accrued provision for estimated rebates and customer loyalty program payouts at the time services are provided. The primary factors we considerconsidered when estimating the provision for rebates and customer loyalty programs are the average historical experience of aggregate credits issued, the historical relationship of rebates as a percentage of total gross product sales, and the contract terms and conditions of the various rebate programs in effect at the time services are performed. We also monitor aggregate actual rebates grantedThe Company provides standard warranty provisions.
Performance obligations related to product application are typically satisfied at a point in time when the customer obtains control upon application. Performance obligations related to post-application services are satisfied over time and customer loyalty agreements and compare themrevenue is recognized using the output method, as control of the service transfers to the estimated aggregate provision for rebates to assess the reasonablenesscustomer over time during and after storage of the produce. The Company believes that this method provides a faithful depiction of the transfer of value over the term of the performance obligation because the level of effort in providing these services is consistent during the service period. Performance obligations related to Tecnidex sales-type leases are satisfied at the point in time that equipment is installed at the customer site.
Disaggregation of Revenue
The Company disaggregates revenue from contracts with customers into geographic region, product and timing of transfer of goods and services. The Company determined that disaggregating revenue into these categories achieves the disclosure objective of depicting how the nature, amount, timing and uncertainty of revenue and cash flows are affected by economic factors.
Revenues for the year ended December 31, 2019
| | | | | | | | | | | | | | | | | |
| (in thousands) | | | | | |
| Region | North America | EMEA | Latin America | Asia Pacific | Total Revenue |
| Product | | | | | |
| 1-MCP based | $ | 40,012 | | $ | 63,109 | | $ | 28,199 | | $ | 14,513 | | $ | 145,833 | |
| Fungicides, waxes, coatings, sanitizers | 712 | | 16,803 | | 3,172 | | — | | 20,687 | |
| Other* | 1,523 | | 1,374 | | 447 | | 201 | | 3,545 | |
| Total | $ | 42,247 | | $ | 81,286 | | $ | 31,818 | | $ | 14,714 | | $ | 170,065 | |
| | | | | |
| Pattern of Revenue Recognition | | | | | |
| Products transferred at a point in time | $ | 41,122 | | $ | 79,811 | | $ | 31,618 | | $ | 14,535 | | $ | 167,086 | |
| Services transferred over time | 1,125 | | 1,475 | | 200 | | 179 | | 2,979 | |
| Total | $ | 42,247 | | $ | 81,286 | | $ | 31,818 | | $ | 14,714 | | $ | 170,065 | |
Revenues for the year ended December 31, 2018
| | | | | | | | | | | | | | | | | |
| (in thousands) | | | | | |
| Region | North America | EMEA | Latin America | Asia Pacific | Total Revenue |
| Product | | | | | |
| 1-MCP based | $ | 40,597 | | $ | 71,960 | | $ | 26,820 | | $ | 15,082 | | $ | 154,459 | |
| Fungicides, waxes, coatings, sanitizers | 651 | | 20,766 | | — | | — | | 21,417 | |
| Other* | 2,022 | | 530 | | 358 | | — | | 2,910 | |
| Total | $ | 43,270 | | $ | 93,256 | | $ | 27,178 | | $ | 15,082 | | $ | 178,786 | |
| | | | | |
| Pattern of Revenue Recognition | | | | | |
| Products transferred at a point in time | $ | 42,555 | | $ | 92,555 | | $ | 27,101 | | $ | 14,602 | | $ | 176,813 | |
| Services transferred over time | 715 | | 701 | | 77 | | 480 | | 1,973 | |
| Total | $ | 43,270 | | $ | 93,256 | | $ | 27,178 | | $ | 15,082 | | $ | 178,786 | |
*Other includes FreshCloud, technical services and sales-type leases related to Tecnidex.
Contract Assets and Liabilities
ASC 606 requires an entity to present a revenue contract as a contract asset when the entity performs its obligations under the contract by transferring goods or services to a customer before the customer pays consideration or before payment is due. ASC 606 also requires an entity to present a revenue contract as a contract liability in instances when a customer pays consideration, or an entity has a right to an amount of consideration that is unconditional (e.g. receivable), before the entity transfers a good or service to the customer. The following table presents changes in the Company’s contract assets and liabilities during the twelve months ended December 31, 2019:
| | | | | | | | | | | | | | | | | | | | | | | | | | |
| (in thousands) | | Balance at January 1, 2019 | | Additions | | Deductions | | Balance at December 31, 2019 |
| Contract assets: | | | | | | | | |
| Unbilled revenue | | 1,956 | | | 10,029 | | | (10,319) | | | 1,666 | |
| Contract liabilities: | | | | | | | | | | | | |
| Deferred revenue | | 1,280 | | | 3,032 | | | (3,137) | | | 1,175 | |
The following table presents changes in the Company’s contract assets and liabilities during the twelve months ended Balance at December 31, 2018:
| | | | | | | | | | | | | | | | | | | | | | | | | | |
| (in thousands) | | Balance at January 1, 2018 | | Additions | | Deductions | | Balance at December 31, 2018 |
| Contract assets: | | | | | | | | |
| Unbilled revenue | | 739 | | 7,117 | | | (5,900) | | | 1,956 | |
| Contract liabilities: | | | | | | | | |
| Deferred revenue | | 100 | | 4,428 | | | (3,248) | | | 1,280 | |
The Company recognizes contract assets in the form of unbilled revenue in instances where services are performed by the Company but not billed by period end. The Company recognizes contract liabilities in the form of deferred revenue in instances where a customer pays in advance for future services to be performed by the Company. The Company generally receives payments from its customers based on standard terms and conditions. No significant changes or impairment losses occurred to contract balances during the year ended December 31, 2019. Amounts reclassified from unbilled revenue to accounts receivable for the year ended December 31, 2019 were $10.3 million. Amounts reclassified from deferred revenue to revenue were $3.1 million for the year ended December 31, 2019.
Practical Expedients Elected
The Company has elected the following practical expedients in applying ASC 606 across all reportable segments:
Unsatisfied Performance Obligations. Because all of its performance obligations relate to contracts with a duration of less than one year, the Company has elected to apply the optional exemption provided in ASC 606 and, therefore, is not required to disclose the aggregate rebate reserveamount of the transaction price allocated to performance obligations that are unsatisfied or partially unsatisfied at each balance sheet date.the end of the reporting period.
Contract Costs. All incremental customer contract acquisition costs are expensed as they are incurred as the amortization period of the asset that the Company otherwise would have recognized is one year or less in duration.
Significant Financing Component. The Company does not adjust the promised amount of consideration for the effects of a significant financing component as the Company expects, at contract inception, that the period between when the entity transfers a promised good or service to a customer and when the customer pays for that good or service will be one year or less.
Sales Tax Exclusion from the Transaction Price. The Company excludes from the measurement of the transaction price all taxes assessed by a governmental authority that are both imposed on and concurrent with a specific revenue-producing transaction and collected by the Company from the customer.
Shipping and Handling Activities. The Company accounts for shipping and handling activities it performs after a customer obtains control of the good as activities to fulfill the promise to transfer the good, which are recognized in cost of goods sold.
Modified Retrospective Method. The Company adopted ASC 606 on January 1, 2018 utilizing the modified retrospective method, which meant the Company did not retrospectively adjust prior periods. The Company applied the modified retrospective method only to contracts that were not completed at January 1, 2018 and accounted for the aggregate effect of any contract modifications upon adoption. No cumulative adjustment to retained earnings was recorded upon adoption. The following table summarizes the amounts by which the consolidated financial statements are affected in the current reporting period by ASC 606 as compared with the guidance that was in effect before the change.
| | | | | | | | | | | |
| Balance at December 31, 2018 | | | |
| (in thousands) | As reported | ASC 606 Adjustments | Balances without adoption of ASC 606 |
| Consolidated Balance Sheet | | | |
| Liabilities: | | | |
| Accrued expenses and other current liabilities | $ | 45,340 | | $ | (1,093) | | $ | 44,247 | |
| Equity: | | | |
| Accumulated deficit | $ | (138,789) | | $ | 1,093 | | $ | (137,696) | |
| | | | | | | | | | | |
| Year ended December 31, 2018 | | | |
| (in thousands) | As reported | | ASC 606 Adjustments | | Balances without adoption of ASC 606 | |
| Consolidated Statement of Operations | | | | | | |
| Revenue | | | | | | |
| Net sales | 178,786 | | 1,093 | | 179,879 | |
| Net loss attributable to AgroFresh Solutions, Inc. | (30,060) | | 853 | | (29,207) | |
For additional information, these condensed consolidated financial statements should be read in conjunction with the consolidated financial statements and notes included in the Company's Annual Report on Form 10-K for the year ended December 31, 2018.
Cost of Sales
The Company offers SmartFreshCompany's cost of sales consists of cost of materials, cost of equipment, application costs and Harvistacertain supply chain costs. The Company's primary costs of sale are related to applications at customer sites through a direct service model primarily utilizing third-party service providers. Amounts recorded as cost of sales relate to direct costs incurred in connection with the purchase, delivery and application of the product. Such costs are recorded as the related revenue is recognized. Our cost of sales consists primarily of cost of materials, application costs and certain supply chain costs.
Cash and Cash Equivalents
The Company considers short-term, highly liquid investments with original maturities of three months or less when purchased to be cash equivalents.
Accounts Receivable, Net
Accounts receivable, net consists primarily of (i) outstanding amounts invoiced to end-users, re-sellers and third-party contractors and (ii) unbilled revenue in arrangements where the earnings process has been completed but invoices have not been issued as of the reporting date.
The allowance for doubtful accounts is based on historical experience and a review on a specific identification basis of the collectability of outstanding receivables.
Inventories
Inventories, consisting primarily of chemical products and packing, are valued at the lower of cost (under the first-in, first-out method) or net realizable value. Raw materials are valued using the weighted average moving cost method. In connection with the Business Combination, the Company recognized a step-up in fair value of inventory of $103.5 million, which was amortized into cost of sales in the consolidated statements of income (loss) over a period approximating the Company’s estimated inventory turnover cycle and was fully amortized during fiscal year 2016 and the five months ended December 31, 2015. The amount of amortization of the inventory step-up was $30.4 million and $73.1 million for the year ended December 31, 2016, and the five months ended December 31, 2015, respectively.
Property and Equipment
Property and equipment includes leasehold improvements, machinery and equipment, and furniture. Property and equipment acquired in business combinations are initially recorded at their estimated fair value. Property and equipment acquired or constructed in the normal course of business are initially recorded at cost. The Company provides for depreciation and amortization based on the estimated useful lives of assets using the straight-line method.
Estimated useful lives are as follows:
|
| | | | |
| Leasehold improvements | Shorter of useful life or lease term |
| Machinery & Equipment | 1—12 years |
| Furniture | 1—12 years |
Leasehold improvements are amortized on a straight-line basis over the shorter of the estimated useful lives of the assets or the related lease term, which generally includes reasonably assured option periods expected to be exercised by the Company when the Company would suffer an economic penalty if not exercised.
Gains and losses on the disposal of assets are recorded as the difference between the net proceeds received and net carrying values of the assets disposed.
Impairment of Long-Lived Assets
Company management continually evaluates whether events or changes in circumstances might indicate that the remaining estimated useful life of long-lived assets may warrant revision, or that the remaining balance may not be recoverable. When factors indicate that long-lived assets should be evaluated for possible impairment, the Company uses an estimate of the related undiscounted cash flows in measuring whether the long-lived asset should be written down to fair value. Measurement of the amount of impairment would be based on generally accepted valuation methodologies, as deemed appropriate. As of December 31, 2017,2019, Company management believed that, except as noted below, no revision to the remaining useful lives or write-down of the Company’s long-lived assets was required. During 2019, the Company changed its strategy for the use of its RipeLock product. Based on this change, the Company reevaluated the useful life of RipeLock related intangible assets and recorded $34.0 million of amortization based on the change in useful life. For the fiscal year ended December 31, 2016,2018, the Company recorded a $1.3 million impairment of fixed assets related to a change in the Harvista delivery system and a $9.5 million impairment on the SmartFresh and AgroFresh trade names, butmanagement believed that no revision to the remaining useful lives wasor write-down of the Company's long-lived assets were necessary.
Leases
Leases in whichThe Company determines whether a contract contains a lease at contract inception. A contract contains a lease if there is an identified asset and the risk of ownership is retained byCompany has the lessorright to control the asset. Operating lease right-of-use (“ROU”) assets represent the Company's right to use an underlying asset for the lease term, and lease liabilities represent the Company's obligation to make lease payments arising from the lease. Operating lease ROU assets and lease liabilities are classified as operating leases. Leases which substantially transfer to the lessee all of the benefits and risks inherent in ownership are classified as capital leases. Assets, if any, acquired under capital leases are depreciatedrecognized at commencement date based on the same basispresent value of lease payments over the lease term. The Company uses the incremental borrowing rate in determining the present value of lease payments. Leases with a term of 12 months or less at the commencement date are not recognized on the balance sheet and are expensed as property, plant and equipment. Rentalincurred. In the consolidated statements of income, lease expense for operating lease payments and incentives are expensedis recognized on a straight-line basis. The Company conducts a portion of its operations from leased facilities and leases certain equipment through agreements that are all treated as operating leases.basis over the lease term. See Note 12 for additional information.
Selling, General and Administrative Expenses
The Company expenses selling, general and administrative costs as incurred. Selling, general and administrative expense consists primarily of compensation, benefits and other employee-related expenses for personnel in the Company’s administrative, finance, legal, business development, commercial, sales, marketing and human resource functions. Other expenses include professional fees from outside service providers and costs incurred in connection with services provided by Dow under a Transition Services Agreementtransition services agreement entered into upon consummation of the Business Combination.Combination (defined in Note 3 below).
Debt Issuance Costs
The debt issuance costs associated with the Term Loan (defined in Note 1011 below) were capitalized and are presented as a reduction of the principal balance of the debt, and the Revolving Loan costs (defined in Note 1011 below) were capitalized in Other Assets. All issuance costs will be accreted through interest expense for the duration of the respective debt facilities.
Goodwill and Indefinite-lived Intangible Assets
The Company’s goodwill and trade names are not amortized, but tested annually for impairment and more frequently if events and circumstances indicate that the asset might be impaired. The Company conducts annual impairment tests on goodwill and trade names on the last day of each fiscal year or whenever an indicator of impairment exists.
In assessing goodwill impairment, the Company has the option to first assess the qualitative factors to determine whether events or circumstances indicate that it is more likely than not that the fair value of the reporting unit is less than its carrying amount. If
the qualitative factors indicate that it is more likely than not that the fair value of a reporting unit is less than its carrying amount, the Company performs a two-step impairment test of goodwill. In the first step, the Company estimates the fair value of the reporting unit and compares it to the carrying value of the reporting unit. If the carrying value exceeds the estimated fair value of the reporting unit, the second step is performed to measure the amount of the impairment loss, if any. In the second step, the amount of the impairment loss is the excess of the carrying amount of the goodwill over its estimated implied fair value. At December 31, 2016, the Company completed its annual evaluation of goodwill impairment and fully impaired its goodwill balance of $62.4 million. In connection with the Tecnidex acquisition in 2017, the Company recorded approximately $9$9.4 million of goodwill which iswas based on the preliminary purchase price allocation as of December 31, 2017. During the year ended December 31, 2018, there was an adjustment made to consideration payable to holders of Tecnidex which resulted in a measurement period adjustment of $2.8 million to the purchase price allocation.
The Company’s indefinite-lived intangible assets other than goodwill, which primarily relate to trade names, are not amortized, but are tested at least annually for impairment using a quantitative or qualitative impairment analysis, and more frequently if events and circumstances indicate that the asset might be impaired. The quantitative impairment analysis compares the fair value of each indefinite-lived intangible asset, based on discounted future cash flows using a relief-from-royalty methodology with the carrying value of the asset. If the carrying amount of an indefinite-lived intangible asset exceeds its fair value, an impairment loss is recognized equal to the difference between the estimated fair value of the indefinite-lived intangible asset and its carrying amount. During the year ended December 31, 2016,2018, the Company recorded a $9.5$2.6 million impairment charge related to a decline in the estimated value of the AgroFresh and SmartFresh trade names.name. During the year ended December 31, 2019, the Company recorded an impairment charge of $1.0 million associated with the Verigo software following the sale of Verigo assets and a partnership agreement with new technology provider.
Definite-Lived Intangible Assets
Intangible assets subject to amortization primarily consist of acquired technology and customer relationships and are amortized on a straight-line basis over their estimated useful lives.
Stock-Based Compensation
The Company grants various stock-based compensation awards to its officers, employees and Board of Directors with service (time)time-based and/or performanceperformance-based vesting conditions. Awards without cash settlement conditions are equity-classified. The Company measures and recognizes compensation expense over the vesting period based on their estimated grant date fair values.
Phantom stock awards and stock appreciation rights either require or provide the holder of the award with the option to settle in cash. The Company's awards with cash settlement conditions are accounted for as liabilities and the Company measures and recognizes compensation expense over the vesting period based on their estimated fair values as of the most recent reporting date.
Fair values for options and stock appreciation rights are estimated using an option pricing model. Fair values for restricted stock and phantom stock awards are based on the closing price of the Company’s common stock on the grant date and the measurement date.
Compensation expense for the Company’s stock-based compensation awards is generally recognized on a straight-line basis over the vesting period of the award. For awards with performance conditions, compensation expense is recognized only if satisfaction of the performance condition is considered probable of being achieved.
Compensation expense for the Employee Stock Purchase Plan is based on 15% of the closing price on the date of purchase with an adjustment for the fair value of put and call options.
Research and Development
Expenditures for research and development costs, which primarily relate to internal compensation costs and professional service fees, are charged to expense as incurred.
Income Taxes
The Company accounts for income taxes under the asset and liability method, which requires the recognition of deferred tax assets and liabilities for the expected future tax consequences of events that have been included in the financial statements. Under this method, the Company determines deferred tax assets and liabilities on the basis of the differences between the financial statement and tax bases of assets and liabilities by using enacted tax rates in effect for the year in which the
differences are expected to reverse. The effect of a change in tax rates on deferred tax assets and liabilities is recognized in income in the period that includes the enactment date.
The Company recognizes deferred tax assets to the extent that we believe that these assets are more likely than not to be realized. In making such a determination, the Company considers all available positive and negative evidence, including future reversals of existing taxable temporary differences, projected future taxable income, tax-planning strategies, and results of recent operations. If the Company determines that it would be able to realize our deferred tax assets in the future in excess of their net recorded amount, it would make an adjustment to the deferred tax asset valuation allowance, which would reduce the provision for income taxes.
The Company records uncertain tax positions in accordance with ASC 740 on the basis of a two-step process in which (1) we determine whether it is more likely than not that thea tax positionsposition will be sustained on the basis of the technical merits of the position and (2) for those tax positions that meet the more-likely-than-not recognition threshold, we recognize the largest amount of tax benefit that is more than 50% likely to be realized upon ultimate settlement with the related tax authority.
Contingencies
The Company recognizes liabilities for loss contingencies when it is probable that an asset has been impaired or that a liability has been incurred and the amount of impairment or loss can be reasonably estimated. The Company’s ultimate legal and financial liability with respect to such matters cannot be estimated with certainty and requires the use of estimates. When the reasonable estimate is a range, the recorded loss will be the best estimate within the range. The Company records legal settlement costs when those costs are probable and reasonably estimable.
Credit Concentration Risk
Financial instruments, which potentially subject the Company to a concentration of credit risk, consist principally of cash deposits. The Company maintains cash balances at financial institutions with strong credit ratings. Generally, amounts invested with financial institutions are in excess of FDIC insurance limits.
Fair Value of Financial Instruments
The Company measures fair value using the exchange price that would be received for an asset or paid to transfer a liability (an exit price) in the principal or most advantageous market for the asset or liability in an orderly transaction between market participants on the measurement date. The Company uses valuation techniques that maximize the use of observable inputs and minimize the use of unobservable inputs. Based on the underlying inputs, each fair value measurement in its entirety is reported in one of the three tiers in the fair value hierarchy, which prioritizes the inputs used in measuring fair value. These tiers include:
•Level 1, defined as observable inputs such as quoted prices in active markets;
•Level 2, defined as inputs other than quoted prices in active markets that are either directly or indirectly observable; and
•Level 3, defined as unobservable inputs which reflect the Company’s own estimates of assumptions that market participants would use in pricing the asset or liability. Valuation techniques may include the use of third-party pricing services, option pricing models, discounted cash flow models and similar techniques.
Foreign Currency
An entity’s functional currency is the currency of the primary economic environment in which the entity operates; normally, that is the currency of the environment in which an entity primarily generates and expends cash. Assets and liabilities are translated at period-end rates; income statement amounts are translated at average rates during the course of the period. Translation gains and losses of those operations that use local currency as the functional currency, are included in accumulated other comprehensive (loss) income in the consolidated and combined balance sheets.
Foreign currency exchange transaction gain (loss) is the result of remeasuring transactions denominated in a currency other than our primary currency and is reported in the consolidated statement of operations as a separate line within other income (expense).
Warrants
Public Warrants
On February 19, 2014, the Company sold 21,000,000 units at a price of $10.00 per unit (the “Units”) in its initial public offering (the “Public Offering”). Each unit consisted of one1 share of the Company’s common stock and one-half of one warrant (“Warrant”). On March 13, 2014, the Company sold an additional 1,050,000 units pursuant to the partial exercise by the underwriters for the Public Offering of their over-allotment option. Each such additional unit consisted of one1 share of the Company’s common stock and one-half of one warrant. Each whole warrant entitles the holder thereof to purchase one1 share of the Company’s common stock at a price of $11.50 per share. These warrants are classified in Stockholders' Equity.
Private Placement Warrants
Simultaneous with the Public Offering, the Company issued 5,950,000 warrants, and upon the underwriters’ partial exercise of their over-allotment option on March 13, 2014, the Company issued an additional 210,000 warrants (collectively, the “Private Placement Warrants”). On December 17, 2015, the Company amended the Warrant Purchase Agreement (see Note 3) resulting in a reclassification of the Private Placement Warrants into Stockholders' Equity as of December 31, 2015.
Recently Issued Accounting Standards and Pronouncements
In AugustJanuary 2017, the Financial Accounting Standards Board ("FASB") issued Accounting Standards Update ("ASU") 2017-12 Targeted Improvements to Accounting for Hedging Activities, This update makes more financial and nonfinancial hedging strategies eligible for hedge accounting. It also amends the presentation and disclosure requirements and changes how companies assess effectiveness. This update will be effective for the Company for fiscal years beginning after December 15, 2018, and interim periods within those fiscal years. Early adoption is permitted upon its issuance. The Company is currently assessing the impact of the future adoption of this standard on its financial statements.
In May 2017, the FASB issued ASU 2017-09, Compensation-Stock Compensation (Topic 718) Scope of Modification Accounting. ASU 2017-09 addresses the changes to the terms and conditions of share-based awards. The ASU is effective for periods beginning after December 15, 2017 and interim periods therein on a modified retrospective basis. The Company is currently evaluating the impact this guidance will have on its financial statements.
In May 2014, the FASB issued ASU 2014-09, Revenue from Contracts with Customers (“ASU 2014-09”), which has been updated through several revisions and clarifications since its original issuance. The core principle of the new standard is that a company should recognize revenue to depict the transfer of promised goods or services to customers in accordance with the transfer of control over those goods and services. The new standard also requires additional disclosures intended to enable users of financial statements to understand the nature, amount, timing and uncertainty of revenue, and the related cash flows. The standard is effective for interim and annual reporting periods beginning after December 15, 2017. The Company will adopt the new revenue standard in the first quarter of 2018 using the modified retrospective adoption method.
As part of the assessment performed through the date of this filing, the Company has created an implementation working group, which includes internal and third-party resources. The Company implemented the following controls with respect to assessing the
potential impact of adopting the standard:
Developed a detailed project plan with key milestone dates;
Performed education of the new accounting standard;
Outlined the revenue generating activities that fall within the scope of ASU 2014-09 and assessed what impact the standard has on those activities, and;
Monitoring and assessment of the impact of changes to ASU 2014-09 and its interpretations.
The group responsible for implementing the new standard has reviewed arrangements from each revenue stream and the related business strategies. The Company has assessed the various changes in the criteria for revenue recognition required under the new standard, and concluded in summary that post application services will have the most significant impact to our current revenue recognition practices. The Company has determined the following pertaining to the impact of adopting ASU 2014-09:
Performance Obligations and Pattern of Recognition - The Company’s contracts contain various performance obligations including: product application, product supply, and technical services. Currently, revenue is recognized at the time the product is sold or applied to the produce. The adoption of the new standard will not have a material impact on revenue recognition for product application or sales. Upon adoption of the standard, technical services will be considered distinct performance obligations and recognized over time, to align with the transfer of control and benefits related to those performance obligations.
Discounts - Currently, revenue is recognized net of estimated payments that are expected to be paid under rebate programs. The accounting for rebate programs will remain consistent upon adoption of the new standard, which requires that variable consideration be estimated at contract inception.
Contract Costs - The Company will apply the practical expedient of expensing contract costs when incurred if the amortization period of the asset that the Company would have recognized is one year or less. Currently the Company’s accounting policy is to expense contract costs as they are incurred.
Internal Controls Over Financial Reporting - The Company will implement additional controls as they pertain to financial reporting disclosures as well as related business processes.
The remaining implementation matters to be addressed include finalizing the transition specific to the recent acquisition of Tecnidex where contracts include the provision of leased equipment, product supply, technical services and contract costs that may be amortized over a period greater than one year. The Company is also finalizing updates to the Company’s business processes, systems and controls to fully comply with ASU 2014-09. Prospectively, the Company expects the new revenue standard to increase the percentage of revenue recognized over time as related to technical services, which varies by product and region and which could vary in the future depending on the mix of future orders as well as contractual terms negotiated with customers. These projected impacts and accounting models are still under review by the Company.
In March 2017, the FASB issued ASU 2017-07, “Compensation - Retirement Benefits (Topic 715): Improving the Presentation of Net Periodic Pension Cost and Net Periodic Postretirement Benefit Cost.” ASU No. 2017-07 requires employers to separate the service cost component from other components of net periodic benefit costs and to disclose the amounts of net periodic benefit costs that are included in each income statement line item. The amendments of this ASU are effective for fiscal years beginning after December 15, 2017, and interim periods within those fiscal years. The Company does not anticipate that the adoption of this ASU will have a material impact on the consolidated financial statements.
In January 2017, the FASB issued ASU No. 2017-04, "Intangibles - Goodwill and Other,Other", which simplifies the test for goodwill impairment. The guidance is effective for the Company beginning in the first quarter of fiscal year 2020. Early adoption is permitted for interim or annual goodwill impairments tests after January 1, 2017. This standard will impact future financial statements when adopted ifThe Company expects to adopt the Company completes additional business combinations.
In August 2016, the FASB issued ASU 2016-15, "Statement of Cash Flows - Classification of Certain Cash Receipts and Cash Payments." ASU 2016-15 addresses how certain cash receipts and cash payments are presented and classifiednew guidance in the statement
of cash flows. ASU 2016-15 is effective for annual reporting periods, and interim periods therein, beginning after December 15, 2017.2020. The Company is currently in the process of assessingevaluating the impact of adopting this guidance will have on its financial statements.guidance.
In March 2016, the FASB issued ASU 2016-09, Compensation - Stock Compensation: Improvements to Employee Share-Based Payment Accounting. ASU 2016-09 clarifies several aspects of accounting for share-based compensation including the accounting for excess tax benefits and deficiencies, accounting for forfeitures and the classification of excess tax benefits on the cash flow statement. ASU 2016-09 is effective for fiscal years beginning after December 15, 2016 and in interim periods within those fiscal years, with early adoption permitted. The Company adopted this ASU for the year ended December 31, 2017 and it did not have a material impact on the consolidated financial statements.
In February 2016, the FASB issued ASU 2016-02, “Leases”. The main objective of this update is to increase transparency and comparability among organizations by recognizing lease assets and lease liabilities on the balance sheet and disclosing key information about leasing arrangements. This ASU 2016-02 is effective for fiscal years beginning after December 15, 2018, including interim periods within those fiscal years. Effective for the quarter ended March 31, 2019, the Company adopted the guidance for leases and elected to utilize a cumulative effect adjustment to the opening balance of retained earnings for the year of adoption. Accordingly, the Company’s reporting for the comparative periods prior to adoption continue to be presented in the financial statements in accordance with previous lease accounting guidance.
The Company also elected to apply practical expedients applicable to the Company in the updated guidance for transition for leases in effect at adoption, the option to not reassess whether an existing contract is a lease or contains a lease and whether the lease is an operating or finance lease. The adoption of the updated guidance resulted in the Company recognizing a right-of-use asset of $7.3 million as part of other assets and a lease liability of $7.3 million as part of other current liabilities and other long-term liabilities in the consolidated balance sheet as of January 31, 2019. The cumulative effect adjustment to the opening balance of retained earnings was zero. The adoption of the updated guidance did not have a material effect on the Company’s results of operations or liquidity.
In June 2016, the FASB issued ASU 2016-13, “Measurement of Credit Losses on Financial Instruments”, which introduces a new current expense credit loss model to measure impairment on certain types of financial instruments. This update requires an entity to use a forward-looking expected credit loss model for accounts receivables, loans, and other financial instruments. Credit losses relating to available-for-sale debt securities will also be recorded through an allowance for credit losses rather than as a reduction in the amortized cost basis of the securities. In addition, the FASB issued various amendments during 2018 and 2019 to clarify the provisions of ASU 2016-13. The standard will be effective for fiscal years beginning January 1, 2020, including interim periods, with early adoption permitted. Adoption of the standard will be applied using a modified retrospective approach through a cumulative-effect adjustment to retained earnings as of the beginning of the year of adoption, except for certain provisions that are required to be applied prospectively. The Company expects to adopt the new guidance in the first quarter of 2020. The Company is currently evaluating the impact ASU 2016-02 may have on its consolidated financial statements.of adopting this guidance.
In July 2015,August 2018, the FASB issued ASU No. 2015-11, “Simplifying2018-13, Fair Value Measurement (Topic 820): Disclosure Framework - Changes to the Disclosure Requirements for Fair Value Measurement, which is part of Inventory.” The update requires an entitythe FASB disclosure framework project to measure inventory atimprove the lowereffectiveness of cost or net realizable value; subsequent measurement is unchanged for inventory measured using last-in, first-out (LIFO) ordisclosures in the retail inventory method.notes to the financial statements. The amendments in this update arethe new guidance remove, modify and add certain disclosure requirements related to fair value measurements covered in Topic 820, "Fair Value Measurement." The new standard is effective for annualfiscal years, and interim periods within those fiscal years, beginning after December 15, 20162019. Early adoption is permitted for either the entire standard or only the requirements that modify or eliminate the disclosure requirements, with certain requirements applied prospectively, and shouldall other requirements applied retrospectively to all periods
presented. The Company expects to adopt the new guidance in the first quarter of 2020. The Company is currently evaluating the impact of adopting this guidance.
In August 2018, the FASB issued ASU 2018-15, Intangibles - Goodwill and Other - Internal-Use Software (Subtopic 350-40): Customer's Accounting for Implementation Costs Incurred in a Cloud Computing Arrangement That is a Service Contract, which requires a customer in a cloud computing arrangement that is a service contract to follow the internal-use software guidance in Topic 350, Intangibles - Goodwill and Other to determine which implementation costs to capitalize as assets or expense as incurred. The new standard is effective for fiscal years, and interim periods within those fiscal years, beginning after December 15, 2019. Early adoption is permitted and an entity can elect to apply the new guidance on a prospective or retrospective basis. The Company expects to adopt the new guidance in the first quarter of 2020. The Company is currently evaluating the impact of adopting this guidance.
In December 2019, the FASB issued ASU 2019-12, Income Taxes (Topic 740): Simplifying the Accounting for Income Taxes. The amendments simplify the accounting for income taxes by removing certain exceptions to the general principles of Topic 740, "Income Taxes" and also improve consistent application by clarifying and amending existing guidance. The new standard is effective for fiscal years, and interim periods within those fiscal years, beginning after December 15, 2020. Early adoption is permitted, with the amendments to be applied retrospectively.on a retrospective, modified retrospective or prospective basis, depending on the specific amendment. The Company adoptedis currently evaluating the impact of adopting this ASU for the year ended December 31, 2017 and it did not have a material impact on the consolidated financial statements.guidance.
3. Business Combination
On the Closing Date,July 31, 2015 (the "Closing Date"), the Company consummated a business combination (the “Business Combination”) pursuant to the Stock Purchase Agreement, dated April 30, 2015 (the “Purchase Agreement”), by and between the Company and Dow providing for the acquisition by the Company of the AgroFresh Businessbusiness from Dow, resulting in AgroFresh Inc. becoming a wholly-owned, indirect subsidiary of the Company. Pursuant to the Purchase Agreement, the Company paid the following consideration to Rohm and Haas Company (“R&H”), a subsidiary of Dow: (i) 17.5 million shares of common stock (the “Stock Consideration”) and (ii) $635 million in cash (the “Cash Consideration”).cash.
On April 4, 2017, the Company entered into an agreement (the “Amendment Agreement”) with Dow, R&H, Boulevard Acquisition Sponsor, LLC (the “Sponsor”), AgroFresh Inc., Avenue Capital Management II, L.P. (“Avenue”) and, solely as to certain sections of the Amendment Agreement, Joel Citron, Darren Thompson and Robert J. Campbell (collectively, the “Founding Holders”), Marc Lasry and Stephen Trevor. Pursuant to the Amendment Agreement and certain related agreements entered into on the same date (as described below), among other things, the Company and Dow agreed to modify certain obligations of the Company pursuant to (i) the Purchase Agreement, (ii) thea Tax Receivables Agreement dated July 31, 2015 (the “Tax Receivables Agreement”), among the Company, Dow, R&H and AgroFresh Inc., and (iii) entered into in connection with the Warrant Purchase Agreement, dated July 31, 2015 (the “Warrant Purchase Agreement”), among the Company, Dow, R&H and the Sponsor. Mr. Campbell is a memberconsummation of the Company's board of directors, each of Mr. Lasry and Mr. Trevor was a member of the Company’s board of directors at the time the Amendment Agreement was entered into, and each of Dow and the Sponsor is a significant stockholder of the Company.
Amendment Agreement
Pursuant to the Amendment Agreement, the Company agreed to pay Dow the aggregate amount of $20.0 million, of which $10.0 million was paidBusiness Combination, as amended on April 4, 2017 and(as so amended, the remaining $10.0 million was paid on January 31, 2018, in full satisfaction of the Company’s obligations with respect to (i) the working capital adjustment under the Purchase Agreement, (ii) certain transfer and value added tax reimbursement obligations under the Purchase Agreement, and (iii) the amount payable to Dow pursuant to the Tax“Tax Receivables Agreement on account of the 2015 tax year. As of December 31, 2017, these liabilities, inclusive of accrued interest, were approximately $17.0 million, $9.3 million, and $12.0 million, respectively. During the year ended December 31, 2017, the liabilities were reduced by approximately $18.2 million.
First Amendment to Tax Receivables Agreement
The Company, Dow, R&H and AgroFresh Inc. entered into a First Amendment to the Tax Receivables Agreement (the “TRA Amendment”Agreement”). The TRA Amendment reduces, from 85% to 50%, the percentage that the Company iswas required to pay to Dow
pursuant to the Tax Receivables Agreement 50% of the annual tax savings, if any, in U.S. Federal,federal, state and local income tax or franchise tax that the Company actually realizesrealized as a result of the increase in tax basis of the AgroFresh assets resulting from a Section 338(h)(10) election that the Company and Dow made in connection with the transactions contemplated byBusiness Combination. In December 2019, the Purchase Agreement. During the year ended December 31, 2017 the liability to Dow was reduced by approximately $75.3 million as a result of the TRA Amendment.
Stock Buyback Agreement
The Company and Dow entered into a letter agreement (the “Stock Buyback Agreement”), pursuant to which Dow agreed to use its reasonable best efforts to purchase up to 5,070,358 shares of the Company’s common stock in the open market (representing approximately 10% of the total number of shares of the Company’s common stock then outstanding), over a period of up to 18 months.
Termination of Warrant Purchase Agreement
The Company, Dow, R&H and the Sponsor entered into a letter agreement, pursuant to which the Warrant PurchaseTax Receivables Agreement was terminated, effective immediately.
As a result of the Amendment Agreement, the TRA Amendment and the terminationCompany paid to Dow an aggregate of $16 million in settlement of all past and estimated future liabilities that would have been owed under the Warrant Purchase Agreement,Tax Receivables Agreement. Based on this termination, the Company recorded a reduction of liabilities of $95.1 million$27.9 million. This reduction, net of deferred income taxes of $40.0 million. The net impact of $55.1$5.9 million, has been recorded to additional paid-in capital assince the agreements wereTax Receivable Agreement was with a related partiesparty and the transaction has beenis treated as a capital transaction.
Acquisition of Tecnidex
On November 7, 2017, the Company entered into a definitive agreement to acquire a controlling-interest in Tecnidex Fruit Protection, S.A.U. ("Tecnidex"). The transaction was closed on December 1, 2017. Tecnidex, a privately-held international company, is a leading provider of post-harvest fungicides, waxes, coatings, and biocidessanitizers for the citrus market, with clients in 18 countries. For over 35 years, Tecnidex has been helping fruit and vegetable producers offer clean, safe and high-quality products to their regional clients. The acquisition was accounted for as a purchase in accordance with FASB Accounting Standard Codification 805 Business Combination.
At the effective date of the acquisition, the Company agreed to pay holders of Tecnidex $25.0 million in cash for 75% of the outstanding capital stock, of which $20.0 million was paid on December 1, 2017 with2017. In 2018, the balance estimatedpurchase price was finalized as $22.3 million after giving effect to beworking capital, net debt, and other adjustments. The remaining $2.3 million was paid in the second quarter ofduring 2018.
In accordance with the acquisition method of accounting, the Company is allocatingallocated the purchase price to the estimated fair values of the identifiable assets acquired and liabilities assumed, with any excess allocated to goodwill. The allocation of the purchase price accounting is preliminary as the Company is still in the process of valuing the assets acquired and liabilities assumed; therefore the allocation of the acquisition consideration is subject to change.
The preliminary assessment of fair value of the contingent consideration payments on the acquisition date was approximately $0.7 million and was estimated by applying a probability-based income approach utilizing an appropriate discount rate. This estimationestimate was based on significant inputs that are not observable in the market, referred to as Level 3 inputs.
The results of operations for Tecnidex for the period December 1, 2017 through December 31, 2017 were not material to the Company’s results for During the year ended December 31, 2017.2019 and December 31, 2018, there was an adjustment made to the fair value of $0.4 million and $0.3 million, respectively.
| |
4. | Related Party Transactions |
4. Related Party Transactions
The Company is a party to an ongoing agreementstransition services agreement with Dow, a related party, including, but not limited to, operating-related agreements for certain transition services and seconded employees.party. In connection with the Transition Services Agreement,transition services agreement, the Company paid Dow a $5.0 million set-up fee which is beingwas amortized over the period during which the services arewere expected to be provided. In addition, the Company paid Dow $0.6 million on the Business Combination Closing Date to import inventory into Argentina through September 30, 2016.
The Company incurred expenses for such services for the twelve monthsyear ended December 31, 2017,2019, December 31, 2016,2018, and the five months ended December 201531, 2017 as follows:
| | | | | | | | | | | |
| (amounts in thousands) | Year Ended December 31,
2019 | Year Ended December 31,
2018 | Year Ended December 31,
2017 |
| Amortization of prepayment related to set-up of transition services | $ | — | | $ | — | | $ | 827 | |
| Ongoing costs of transition services agreement | 120 | | 335 | | 2,970 | |
| Rent expense | — | | — | | 902 | |
| Other expenses | — | | 1,484 | | 439 | |
| Total incurred expenses | $ | 120 | | $ | 1,819 | | $ | 5,138 | |
|
| | | | | | | | | |
| (amounts in thousands) | Year Ended December 31,
2017 | Year Ended December 31,
2016 | August 1, 2015 Through December 31, 2015 |
| Amortization of prepayment related to set-up of transition services | $ | 827 |
| $ | 1,526 |
| $ | 2,647 |
|
| Ongoing costs of transition services agreement | 2,970 |
| 4,346 |
| 4,531 |
|
| Rent expense | 902 |
| 1,198 |
| 740 |
|
| Amortization of prepayment related to Dow importation services | — |
| 397 |
| 220 |
|
| Other expenses | 439 |
| 894 |
| 593 |
|
| Total incurred expenses | $ | 5,138 |
| $ | 8,361 |
| $ | 8,731 |
|
As of December 31, 20172019 and December 31, 2016,2018, the Company had an outstanding payable to Dow of $1.2$0.1 million and $0.1$0.0 million, respectively.
Refer to Note 3 regarding the contingent consideration owed to Dow as part of the Business Combination.Combination, as well as certain other agreements entered into in connection with the Business Combination, including the termination of the Tax Receivables Agreement in 2019.
In addition, during 2016, the Company made a minority investment in RipeLocker, LLC ("RipeLocker"), a company led by George Lobisser, a director of AgroFresh. In February 2019, the Company made a further minority investment in RipeLocker. On November 29, 2016, the Company entered into a Mutual Services Agreement (the “Services Agreement”) with George Lobisser and RipeLocker, LLC.RipeLocker. Pursuant to the Services Agreement, (i) the Company agreed to provide RipeLocker with technical support, in the form of access to the Company’s research and development personnel for a specified number of hours for purposes of providing advice and input relating to RipeLocker’s products and services, and (ii) Mr. Lobisser agreed to provide consulting services to the Company as may be reasonably requested by the Company from time to time. The Services Agreement provides for Mr. Lobisser to receive a consulting fee of $5,000 per full day for time spent performing consulting services under the Services Agreement (pro-rated for any partial day), plus reimbursement for out-of-pocket expenses, provided that for each hour of technical support provided by the Company to RipeLocker, Mr. Lobisser agreed to provide one-half hour of consulting services for no consideration. In February 2017, the
Company and Mr. Lobisser agreed to substantially curtail any mutual consulting services to be provided under the Services
Agreement, and that any further services would be provided at no charge. AsFor the years ended December 31, 2019 and December 31, 2018, there were 0 amounts paid and as of December 31, 2017,2019 and December 31, 2018, there were no amounts paid and no0 material amounts owed to RipeLocker for consulting services.
5. Inventories
Inventories at December 31, 20172019 and December 31, 2016,2018, consisted of the following:
| | | (in thousands) | December 31, 2017 | December 31, 2016 | (in thousands) | December 31, 2019 | December 31, 2018 |
| Raw material | $ | 2,148 |
| $ | 1,649 |
| Raw material | $ | 3,401 | | $ | 1,286 | |
| Work-in-process | 6,585 |
| 7,963 |
| Work-in-process | 7,278 | | 4,749 | |
| Finished goods | 14,647 |
| 5,132 |
| Finished goods | 10,974 | | 17,535 | |
| Supplies | 729 |
| 723 |
| Supplies | 968 | | 1,237 | |
| Total inventories | $ | 24,109 |
| $ | 15,467 |
| Total inventories | $ | 22,621 | | $ | 24,807 | |
6. Other Current Assets
The Company’s other current assets at December 31, 20172019 and December 31, 20162018 consisted of the following:
|
| | | | | | |
| (in thousands) | December 31, 2017 | December 31, 2016 |
| VAT receivable | $ | 14,088 |
| $ | 9,306 |
|
| Prepaid income tax asset | $ | 2,314 |
| $ | 1,910 |
|
| Other | $ | 2,282 |
| $ | 2,831 |
|
| Total other current assets | $ | 18,684 |
| $ | 14,047 |
|
| | | | | | | | |
| (in thousands) | December 31, 2019 | December 31, 2018 |
| VAT receivable | $ | 4,925 | | $ | 7,854 | |
| Prepaid income tax asset | 3,616 | | 5,090 | |
| Other | 3,261 | | 2,664 | |
| Total other current assets | $ | 11,802 | | $ | 15,608 | |
7. Property and Equipment
Property and equipment at December 31, 20172019 and December 31, 20162018 consisted of the following:
| | | | | | | | | | | | | | | | | |
| (in thousands, except for useful life data) | Useful life (years) | | | December 31, 2019 | December 31, 2018 |
| Buildings and leasehold improvements | 7 | - | 20 | $ | 6,508 | | $ | 4,647 | |
| Machinery & equipment | 1 | - | 12 | 10,954 | | 8,193 | |
| Furniture | 1 | - | 12 | 2,681 | | 2,712 | |
| Construction in progress | | | | 902 | | 1,744 | |
| | | | $ | 21,045 | | $ | 17,296 | |
| Less: accumulated depreciation | | | | (7,868) | | (4,007) | |
| Total property and equipment, net | | | | $ | 13,177 | | $ | 13,289 | |
|
| | | | | | | |
| (in thousands, except for useful life data) | Useful life (years) | December 31, 2017 | December 31, 2016 |
| Leasehold improvements | 7-20 | $ | 2,976 |
| $ | 1,463 |
|
| Machinery & equipment | 1-12 | 7,853 |
| 6,066 |
|
| Furniture | 1-12 | 1,698 |
| 843 |
|
| Construction in progress | | 2,075 |
| 781 |
|
| | | 14,602 |
| 9,153 |
|
| Less: accumulated depreciation | | (2,402 | ) | (1,105 | ) |
| Total property and equipment, net | | $ | 12,200 |
| $ | 8,048 |
|
Depreciation expense for the twelve months ended December 31, 2017 was $1.3 million. Depreciation expense was $0.9 million, $0.3 million, and $0.5 million for the year ended December 31, 2016, the five months ended December 31, 2015,2019 and the seven months ended July 31, 2015,2018 was $2.2 million and $1.6 million, respectively. Depreciation expense is recorded in cost of sales, selling, general and administrative expense and research and development expense in the consolidated combined statements of income (loss). income.
| |
8. | Goodwill and Intangible Assets |
8. Goodwill and Intangible Assets
Changes in the carrying amount of goodwill for the twelve monthsyear ended December 31, 20172019 and December 31, 20162018 are as follows:
|
| | | |
| (in thousands) | Goodwill |
| Balance as of December 31, 2015 | $ | 56,006 |
|
| Measurement period adjustments | 6,367 |
|
| Impairment | (62,373 | ) |
| Balance as of December 31, 2016 | $ | — |
|
| Goodwill as a result of the Business Combination | 9,402 |
|
| Balance as of December 31, 2017 | $ | 9,402 |
|
| | | | | |
| (in thousands) | Amount |
| Balance as of December 31, 2017 | $ | 9,402 | |
| Measurement period adjustment | (2,807) | |
| Foreign currency translation | 75 | |
| Balance as of December 31, 2018 | $ | 6,670 | |
| Foreign currency translation | (347) | |
| Balance as of December 31, 2019 | $ | 6,323 | |
During the Company's annual goodwill impairment testing for the year ended December 31, 2016, it utilized2018, there was an adjustment made to the quantitative methodsconsideration payable to assess impairment and concluded that goodwill was fully impaired.holders of Tecnidex which resulted in a measurement period adjustment of $2.8 million to the purchase price allocation.
The Company’s other intangible assets at December 31, 20172019 and December 31, 20162018 consisted of the following:
| | | | | | | | | | | | | | | | | | | | | | | | | | | | | | |
| | December 31, 2019 | | | | | | December 31, 2018 | | | |
| (in thousands) | Gross Carrying Amount | Accumulated Amortization | | Impairment | Net | | Gross
Carrying
Amount | Accumulated
Amortization | Impairment | Net |
| Other intangible assets: | | | | | | | | | | |
| Developed technology | $ | 758,760 | | $ | (206,998) | | | $ | — | | $ | 551,762 | | | $ | 759,290 | | $ | (134,151) | | $ | — | | $ | 625,139 | |
| In-process research and development | 39,000 | | (7,222) | | | — | | 31,778 | | | 39,000 | | (5,055) | | — | | 33,945 | |
| Trade name | 27,200 | | — | | | — | | 27,200 | | | 28,507 | | — | | (2,600) | | 25,907 | |
| Service provider network | 2,000 | | — | | | — | | 2,000 | | | 2,000 | | — | | — | | 2,000 | |
| Customer relationships | 18,058 | | (2,993) | | | — | | 15,065 | | | 19,872 | | (2,198) | | — | | 17,674 | |
| Software | 9,861 | | (5,347) | | | (992) | | 3,522 | | | 9,405 | | (2,161) | | — | | 7,244 | |
| | | | | | | | | | |
| Other | 100 | | (58) | | | — | | 42 | | | 100 | | (42) | | — | | 58 | |
| Total intangible assets | $ | 854,979 | | $ | (222,618) | | | $ | (992) | | $ | 631,369 | | | $ | 858,174 | | $ | (143,607) | | $ | (2,600) | | $ | 711,967 | |
|
| | | | | | | | | | | | | | | | | | | | | | | | | |
| | December 31, 2017 | | December 31, 2016 |
| (in thousands) | Gross Carrying Amount | Accumulated Amortization | Impairment | Net | | Gross
Carrying
Amount | Accumulated
Amortization | Impairment | Net |
| Other intangible assets: | |
| |
| | |
| | | | | |
| Developed technology | $ | 759,374 |
| $ | (94,886 | ) | $ | — |
| $ | 664,488 |
| | $ | 757,000 |
| $ | (55,623 | ) | $ | — |
| $ | 701,377 |
|
| In-process research and development | 39,000 |
| (2,889 | ) | — |
| 36,111 |
| | 39,000 |
| (722 | ) | — |
| 38,278 |
|
| Trade name | 29,816 |
|
|
|
|
| 29,816 |
| | 35,500 |
| — |
| (9,500 | ) | 26,000 |
|
| Service provider network | 2,000 |
|
|
| — |
| 2,000 |
| | 2,000 |
| — |
| — |
| 2,000 |
|
| Customer relationships | 20,306 |
| (806 | ) | — |
| 19,500 |
| | 8,000 |
| (472 | ) | — |
| 7,528 |
|
| Software | 1,274 |
| (404 | ) | — |
| 870 |
| | 660 |
| (104 | ) | — |
| 556 |
|
| Software not yet placed in service | 5,022 |
|
|
| — |
| 5,022 |
| | 753 |
| — |
| — |
| 753 |
|
| Other | 100 |
| (25 | ) | — |
| 75 |
| | 100 |
| (8 | ) | — |
| 92 |
|
| Total intangible assets | $ | 856,892 |
| $ | (99,010 | ) | $ | — |
| $ | 757,882 |
| | $ | 843,013 |
| $ | (56,929 | ) | $ | (9,500 | ) | $ | 776,584 |
|
During the Company's annual impairment testing conducted for the year ended December 31, 2016,2018, the Company recorded an impairment charge of $9.5$2.6 million on its AgroFresh and SmartFresh trade names. Thename. During the Company's annual impairment testing conducted for the year ended December 31, 20172019, the Company recorded an impairment charge of $1.0 million associated with its Verigo software following a partnership agreement with a new technology provider.
During 2019, the Company accelerated the amortization of Ripelock developed technology based on the Company's remaining expected useful life of the technology. This resulted in no indicatorsan increase to amortization expense of impairment.$34.0 million.
TheAt December 31, 2019, the weighted-average amortization period remaining for the finite-lived intangible assets is 16.9 years. The weighted-average amortization periodperiods remaining for developed technology, customer relationships, in-process R&D, customer relationships, software and other is 17.2, 21.6, 16.8, 3.1,was 15.4, 12.6, 14.7, 1.5, and 4.52.5 years, respectively. At December 31, 2019, the weighted-average amortization periods remaining for these finite-lived intangible assets was 14.2 years.
Amortization expense for intangible assets was $41.9$81.1 million, $40.3 million, $16.5$45.9 million and $16.9$41.9 million for the twelve monthsyears ended December 31, 2019, 2018 and 2017, and 2016, and the five months ending December 31, 2015 and the seven months ended July 31, 2015.respectively.
Estimated annual amortization expense for finite-lived intangible assets excluding amounts in Work in Progress, subsequent to December 31, 20172019 is as follows:
| | | | | |
| (in thousands) | Amount |
| 2020 | $ | 43,423 | |
| 2021 | 41,722 | |
| 2022 | 40,892 | |
| 2023 | 40,795 | |
| 2024 | 40,795 | |
| Thereafter | 394,542 | |
| Total | $ | 602,169 | |
9. Other Assets
|
| | | |
| (in thousands) | Amount |
| 2018 | $ | 43,657 |
|
| 2019 | 43,970 |
|
| 2020 | 43,951 |
|
| 2021 | 43,814 |
|
| 2022 | 43,691 |
|
| Thereafter | 501,960 |
|
| Total | $ | 721,043 |
|
The Company’s other assets at December 31, 2019 and December 31, 2018 consisted of the following:
| | | | | | | | |
| (in thousands) | December 31, 2019 | December 31, 2018 |
| | |
| Right-of-use asset | 6,599 | | — | |
| Long term sales-type lease receivable | 2,501 | | 3,286 | |
| Long term investments | — | | 10,082 | |
| Other long term receivable | 3,061 | | 3,452 | |
| Total other assets | 12,161 | | 16,820 | |
| |
9. | Accrued and Other Current Liabilities |
10. Accrued and Other Current Liabilities
The Company’s accrued and other current liabilities at December 31, 20172019 and December 31, 20162018 consisted of the following:
| | | | | | | | |
| (in thousands) | December 31, 2019 | December 31, 2018 |
| Tax amortization benefit contingency | — | | 11,098 | |
| Additional consideration due seller | — | | 379 | |
| Accrued compensation and benefits | 7,307 | | 10,192 | |
| Accrued rebates payable | 1,377 | | 3,616 | |
| Insurance premium financing payable | 1,000 | | 721 | |
| Severance | 444 | | 971 | |
| Deferred revenue | 1,175 | | 1,280 | |
| Accrued taxes | 3,017 | | 5,316 | |
| Accrued interest | 71 | | — | |
| Lease liability | 1,493 | | — | |
| Other | 8,466 | | 11,767 | |
| Total accrued and other current liabilities | $ | 24,350 | | $ | 45,340 | |
Other current liabilities include primarily professional services, litigation and research and development accruals.
11.Debt
|
| | | | | | |
| (in thousands) | December 31, 2017 | December 31, 2016 |
| Warrant consideration | $ | — |
| $ | 1,080 |
|
| Tax amortization benefit contingency | 11,820 |
| 17,535 |
|
| Working capital settlement | — |
| 17,000 |
|
| Additional consideration due seller | 693 |
| 9,263 |
|
| Dow settlement liability | 10,000 |
| — |
|
| Accrued compensation and benefits | 8,932 |
| 6,352 |
|
| Accrued rebates payable | 5,027 |
| 4,701 |
|
| Insurance premium financing payable | 639 |
| 578 |
|
| Severance | 113 |
| 1,564 |
|
| Deferred revenue | 100 |
| — |
|
| Other Notes Payable | 5,056 |
| — |
|
| Accrued taxes | 7,848 |
| 4,598 |
|
| Accrued Interest | 6,321 |
| — |
|
| Other | 9,260 |
| 3,695 |
|
| Total accrued and other current liabilities | $ | 65,809 |
| $ | 66,366 |
|
The Company’s debt, net of unamortized discounts and deferred financing fees,issuance costs, at December 31, 20172019 and December 31, 20162018 consisted of the following:
| | | (in thousands) | December 31, 2017 | December 31, 2016 | (in thousands) | December 31, 2019 | December 31, 2018 |
| Total Term Loan outstanding | $ | 407,109 |
| $ | 408,246 |
| Total Term Loan outstanding | $ | 405,875 | | $ | 410,125 | |
| Unamortized deferred issuance costs | | Unamortized deferred issuance costs | (3,886) | | (6,168) | |
| Tecnidex loan outstanding | 3,685 |
| — |
| Tecnidex loan outstanding | 750 | | 2,771 | |
| Less: Amounts due within one year | 7,926 |
| 15,250 |
| Less: Amounts due within one year | 4,675 | | 6,419 | |
| Total long-term debt due after one year | $ | 402,868 |
| $ | 392,996 |
| Total long-term debt due after one year | $ | 398,064 | | $ | 400,309 | |
The Company evaluated the amount recorded under the Term Loan (defined below) and determined that the fair value as of December 31, 2017,2019, and 2016,2018, was approximately $408.2$345.0 million, and $380.9$397.1 million, respectively. The fair value of the debt is based on quoted inactive market prices and is therefore classified as Level 2 within the valuation hierarchy.
The Term Loan is presented net of deferred issuance costs, which are amortized using the effective interest method over the term of the Term Loan. Gross deferred issuance costs at the inception of the Term Loan were $12.9 million and as of December 31, 20172019 and December 31, 20162018 there were $8.3$3.9 million and $10.4$6.2 million of unamortized deferred issuance costs, respectively.
Scheduled principal repayments subsequent to December 31, 20172019 are presented in the table below.
| | (in thousands) | | (in thousands) | Amount |
| 2020 | | 2020 | $ | 4,675 | |
| 2021 | | 2021 | 401,950 | |
| | | (in thousands) | Amount | |
| 2018 | $ | 7,926 |
| |
| 2019 | 5,322 |
| |
| 2020 | 4,250 |
| |
| 2021 | 401,625 |
| |
| 2022 | — |
| |
| | Total | $ | 419,123 |
| Total | $ | 406,625 | |
Credit Facility (Successor)
On July 31, 2015, in connection with the consummation of the Business Combination, AgroFresh Inc. as the borrower and its parent, AF Solutions Holdings LLC (“AF Solutions Holdings”), a wholly-owned subsidiary of the Company, as the guarantor, entered into a Credit Agreement with Bank of Montreal, as administrative agent (the(as subsequently amended the “Credit Facility”). The Credit Facility consistsconsisted of a $425$425.0 million term loan (the “Term Loan”), with an amortization equal to 1.00% per year, and a $25 million revolving loan facility (the “Revolving Loan”). On January 31, 2019, the Revolving Loan was amended to reduce the total availability from $25.0 million to $12.5 million, to extend the maturity date from July 31, 2019 to December 31, 2020, and to amend certain financial covenants. On December 23, 2019, the Revolving Loan was further amended to extend the maturity date from December 31, 2020 to April 1, 2021 and to amend one of the financial covenants.
The Revolving Loan includes a $10 million letter-of-credit sub-facility, issuances against which reduce the available capacity for borrowing. As of December 31, 2017,2019, the Company hashad issued $0.56$0.03 million of letters of credit, against which no0 funds have been drawn. The Term Loan has a scheduled maturity date of July 31, 2021, and the Revolving Loan has a scheduled maturity date of July 31, 2019.2021. The interest rates on borrowings under the facilities are either the alternate base rate plus 3.75% or LIBOR plus 4.75% per annum, with a 1.00% LIBOR floor (with step-downs in respect of borrowings under the Revolving Loan dependent upon the achievement of certain financial ratios). The obligations under the Credit Facility are secured by liens on substantially all of the assets of (a) AgroFresh Inc. and its direct wholly-owned domestic subsidiaries, and (b) AF Solutions Holdings, including the common stock of AgroFresh Inc.
The net proceeds of the Term Loan were used to fund a portion of the purchase price payable to Rohm and Haas Company ("R&H"), a subsidiary of Dow in connection with the Business Combination. Amounts available under the Revolving Loan may also be used for working capital, general corporate purposes, and other uses, all as more fully set forth in the Credit Agreement. At December 31, 2017,2019, there was $414.4$405.9 million outstanding under the Term Loan and no0 balance outstanding under the Revolving Loan.
As of the Closing Date of the Business Combination, the Company incurred approximately $12.9 million in debt issuance costs related to the Term Loan and $1.3 million in costs related to the Revolving Loan. The debt issuance costs associated with the Term Loan were capitalized against the principal balance of the debt, and the Revolving Loan costs were capitalized in Other Assets. All issuance costs will be accreted through interest expense for the duration of each respective debt facility. The interest expense related to the amortization of the debt issuance costs during the twelve monthsyear ended December 31, 20172019 and December 31, 20162018 was approximately $2.4$2.5 million and $2.3$2.5 million, respectively.
On November 18, 2015, the Credit Facility was amended. An existing provision in the credit agreement permitted the Company, subject to an overall cap of $12.0 million per fiscal year and certain other conditions, to pay dividends to the Company’s public stockholders and to redeem or repurchase, through July 31, 2016, the Company’s outstanding warrants for an aggregate purchase price of up to $10.0 million. The amendment expanded the scope of this provision to also permit the repurchase of shares of the Company’s outstanding common stock or other equity securities (subject to the same overall cap and other conditions).
Certain restrictive covenants are contained in the Credit Facility, which includes the Revolving Loan, and the Company was in compliance with such covenants as of December 31, 2017,2019, other than certain covenants that apply only to the Company’s ability to borrow under the Revolving
Loan (excluding letters of credit).
The Credit Facility imposesCompany entered into an overall cap on the total amount of dividends the Company can pay, togetherinterest rate swap contract in August 2019 to hedge interest rate risk associated with the total amountTerm Loan. During the year ended December 31, 2019, an unrealized gain of shares and warrants the Company can repurchase, of $12$0.1 million per fiscal year, and imposes certain other conditionswas recognized in connection with this swap. The interest rate swap contract matures on the Company’s ability to pay dividends.December 31, 2020.
Beginning with the year ended December 31, 2016, the Company is required to prepay Term Loan Borrowings and Incremental Term Loan Borrowings in an aggregate amount equal to 50% of the Excess Cash Flow for the fiscal year; provided that such amount of the Excess Cash Flow in any fiscal year shall be reduced by (i) the aggregate amount of prepayments of Term Loans and Incremental Term Loans made, (ii) to the extent accompanied by permanent reductions of Revolving Commitments, the aggregate amount of prepayments of Revolving Loans (other than prepayments financed with the proceeds of Indebtedness), (iii) repaid borrowings of Revolving Loans made on the Effective Date to account for any additional original issue discount or upfront fees that are implemented pursuant to the Fee Letter and (iv) the aggregate amount of cash dividends paid by the Company or Holdings to Holdings or Boulevard Acquisition Corp. ("Boulevard") for the payment of the Seller Earnout; provided further that, prepayments of Term Loan Borrowings and Incremental Term Loan Borrowings shall only be required if 50% of the Excess Cash Flow for such fiscal year exceeds $5,000,000. TheThere are no0 amounts due under this provision for the year ended December 31, 2017.2019.
The Company enters into lease agreements for certain facilities and vehicles that are primarily used in the ordinary course of business. These leases are accounted for as operating leases, whereby lease expense is recognized on a straight-line basis over the term of the lease.
Most leases include an option to extend or renew the lease term. The exercise of the renewal option is at the Company's discretion. The operating lease liability includes lease payments related to options to extend or renew the lease term if the Company is reasonably certain of exercising those options. The Company, in determining the present value of lease payments, uses the Company’s incremental secured borrowing rate commensurate with the term of the underlying lease.
Lease expense is primarily included in general and administrative expenses in the condensed consolidated statements of operations. Additional information regarding the Company's operating leases is as follows:
| | | | | |
11.(in thousands) | Other Noncurrent LiabilitiesYear ended December 31, 2019 |
| Operating Lease Cost | |
| Operating leases | $ | 2,409 | |
Short-term leases (1) | 90 | |
| Total lease expense | $ | 2,499 | |
(1) Leases with an initial term of twelve months or less are not recorded on the balance sheet.
Other information on operating leases:
| | | | | |
| Cash payments included in operating cash flows | 2,312 | |
| Right-of-use assets obtained in exchange for new lease | 401 | |
| Weighted average discount rate | 9.34 | % |
| Weighted average remaining lease term in years | 5.40 years |
The following table presents the contractual maturities of the Company's lease liabilities as of December 31, 2019:
| | | | | |
| (in thousands) | Lease Liability |
| 2020 | $ | 1,939 | |
| 2021 | 1,670 |
| 2022 | 1,509 |
| 2023 | 1,294 |
| 2024 and thereafter | 2,380 |
| Total undiscounted lease payments | $ | 8,792 | |
| Less: present value adjustment | 1,960 | |
| Operating lease liability | $ | 6,832 | |
The following table presents the future minimum lease payments as of December 31, 2018 under noncancellable operating leases:
| | | | | |
| (in thousands) | Future Lease Payments |
| 2019 | 3,413 | |
| 2020 | 2,058 |
| 2021 | 1,790 |
| 2022 | 1,640 |
| 2023 | 1,242 |
| 2024 and thereafter | 2,396 |
| Total undiscounted lease payments | 12,539 |
13.Other Noncurrent Liabilities
The Company’s other noncurrent liabilities at December 31, 20172019 and December 31, 20162018 consisted of the following:
| | | (in thousands) | December 31, 2017 | December 31, 2016 | (in thousands) | December 31, 2019 | December 31, 2018 |
| Tax amortization benefit contingency | $ | 31,562 |
| $ | 132,724 |
| Tax amortization benefit contingency | $ | — | | $ | 29,369 | |
| Deferred payment | — |
| 2,498 |
| |
| Other | 6,943 |
| 5,611 |
| |
| Lease liability | | Lease liability | 5,339 | | — | |
Other (1) | | Other (1) | 1,907 | | 2,697 | |
| Total other noncurrent liabilities | $ | 38,505 |
| $ | 140,833 |
| Total other noncurrent liabilities | $ | 7,246 | | $ | 32,066 | |
(1) Other noncurrent liabilities include long-term rebates and deferred rent in 2018.
14. Severance
The Company expensed $1.1 million and $0.7 million of severance expense for the years ended December 31, 2019 and 2018, respectively. These amounts, which do not include stock compensation expense, were recorded in selling, general and administrative expense in the consolidated statements of (loss) income. As of December 31, 2019, the Company had $0.4 million of severance liability which will be paid out over the next year.
15.Stockholders’ Equity
The authorized common stock of the Company consists of 400,000,000 shares with a par value of $0.0001 per share. Holders of the Company’s common stock are entitled to one1 vote for each share of common stock. As of December 31, 2017,2019, there were 50,340,85351,178,146 shares of common stock outstanding. As of December 31, 20172019, there were warrants to purchase 15,983,072 shares of the Company’s common stock outstanding at a strike price of $11.50. Of the 15,983,072 warrants, 9,823,072 were issued as
part of the units sold in the Company's initial public offering in February 2014 (1,201,928 warrants were subsequently repurchased during 2015) and 6,160,000 warrants were sold in a private placement at the time of such public offering.
On November 18, 2015, the Company announced that its board of directors had authorized a stock repurchase program (the “Repurchase Program”). The Repurchase Program authorized the Company to repurchase in the aggregate up to $10 million of the Company’s publicly-traded shares of common stock. The Repurchase Program was in effect for a period of one year, until November 17, 2016. Under the Repurchase Program, the Company repurchased 661,381 shares of its common stock for $3.9 million, which shares are classified as treasury stock on the Consolidated Balance Sheet.
In connection with and as a condition to the consummation of the Business Combination, the Company issued R&H one1 share of Series A Preferred Stock. R&H, voting as a separate class, is entitled to appoint one1 director to the Company’s board of directors for so long as R&H beneficially holds 10% or more of the aggregate amount of the outstanding shares of common stock and non-voting common stock of the Company. The Series A Preferred Stock has no other rights.
Simultaneously with the Closing, the Company issued 4,878,048 shares of common stock at a price of $10.25 per share in a private placement to raise an aggregate of $50 million of additional equity.Accumulated Other Comprehensive Loss
| | | | | | | | | |
| (in thousands) | December 31, 2019 | December 31, 2018 | |
| Foreign currency translation adjustments | $ | (32,880) | | $ | (31,695) | | |
| Unrealized gain on hedging activity | 1,876 | | 2,914 | | |
| Pension and other postretirement benefit plans | (56) | | (56) | | |
| Total | $ | (31,060) | | $ | (28,837) | | |
16.Stock Compensation
The Company’s stock-based compensation is in accordance with the amended 2015 Incentive Compensation Plan (the “Plan”), pursuant to which the Compensation Committee of the Company is authorized to grant up to 5,150,0007,150,000 shares to officers and employees of the Company, in the form of equity-based awards, including time or performance based options and restricted stock. In addition, the Company may grant cash-settled awards, including stock-appreciation rights (SARs) and phantom stock awards. As of December 31, 2017,2019, there were 3,339,3563,974,757 shares available for grant under the Plan.
In June 2019, the Company's shareholders approved the 2019 Employee Stock Purchase Plan (the "ESPP"), which was effective July 1, 2019. 500,000 shares of common stock are reserved for issuance under the ESPP. As of December 31, 2019, 168,673 shares had been issued under the ESPP.
Total stock-based compensation recorded by the Company for the twelve monthsyear ended December 31, 20172019, 2018, and 2016,2017 for both equity and liability-classified awards was $2.6$2.7 million, $2.9 million, and $3.7$2.6 million respectively.
The following table summarizes the components of stock-based compensation expense in the consolidated statements of (loss) income (loss) for the twelve monthsyear ended December 31, 2017:2019, 2018, and 2017 were as follows:
| | | | | | | | | | | |
| (in thousands) | Year Ended Year Ended
December 31, 2019 | Year Ended Year Ended
December 31, 2018 | Year Ended Year Ended
December 31, 2017 |
| Cost of sales | $ | 142 | | $ | 191 | | $ | 191 | |
| Selling, general, and administrative expenses | 2,384 | | 2,413 | | 2,127 | |
| Research and development expenses | 188 | | 293 | | 299 | |
| Total | $ | 2,714 | | $ | 2,897 | | $ | 2,617 | |
|
| | | |
| (in thousands) | Amount |
| Cost of sales | $ | 191 |
|
| Selling, general, and administrative expenses | $ | 2,127 |
|
| Research and development expenses | 299 |
|
| Total | $ | 2,617 |
|
The following table summarizes the components of stock-based compensation expense in the consolidated statements of income (loss) for the twelve months ended December 31, 2016:
|
| | | |
| (in thousands) | Amount |
| Cost of sales | $ | — |
|
| Selling, general, and administrative expenses | $ | 3,423 |
|
| Research and development expenses | 261 |
|
| Total | $ | 3,684 |
|
Time-Based Stock Options
During the twelve monthsyear ended December 31, 20172019 and December 31, 2016,2018, the Company’s compensation committee approved time-based stock options to be granted to officers and employees of the Company, which vest ratably over three years. A summary of the status of the Company’s time-based stock options (“Options”) for the years ended December 31, 20172019 and 20162018 were as follows:
|
| | | | | | | | | |
| | Number of
Shares Underlying Awards | Weighted-Average
Exercise Price | Weighted-Average
Remaining
Contractual
Term (years) | Aggregate
Intrinsic Value
(In thousands) |
| Outstanding at January 1, 2016 | 1,106,875 |
| $ | 12.00 |
| 9.58 | $ | — |
|
| Granted | 167,598 |
| 5.37 |
| 9.76 | — |
|
| Exercised | — |
| — |
| 0 | — |
|
| Forfeited or expired | (522,500 | ) | 12.00 |
| 0 | — |
|
| Outstanding at December 31, 2016 | 751,973 |
| 10.52 |
| 8.91 | — |
|
| Exercisable at December 31, 2016 | — |
| — |
| 0 | — |
|
| Vested and expected to vest at December 31, 2016 | 751,973 |
| $ | 10.52 |
| 8.91 | $ | — |
|
|
|
|
|
|
|
|
|
| Outstanding at January 1, 2017 | 751,973 |
| $ | 10.52 |
| 8.91 | $ | — |
|
| Granted | 181,800 |
| 4.37 |
|
| — |
|
| Exercised | — |
| — |
| 0 | — |
|
| Forfeited or expired | (6,875 | ) | 9.78 |
| 0 | — |
|
| Outstanding at December 31, 2017 | 926,898 |
| $ | 8.72 |
| 8.18 | $ | — |
|
| Exercisable at December 31, 2017 | 445,449 |
| 3.69 |
| 7.91 | — |
|
| Vested and expected to vest at December 31, 2017 | 926,898 |
| $ | 8.72 |
| 8.18 | $ | — |
|
| | | | | | | | | | | | |
| | Number of Share Underlying Awards | Weighted-Average Exercise Price | Weighted-Average Remaining Contractual Term (years) | |
| Outstanding at January 1, 2018 | 926,898 | | $ | 8.72 | | 8.18 | |
| Granted | 201,535 | | 7.15 | | 9.37 | |
| Exercised | — | | — | | 0 | |
| Forfeited or expired | (146,109) | | 4.66 | | 8.63 | |
| Outstanding at December 31, 2018 | 982,324 | | $ | 9.38 | | 7.18 | |
| Exercisable at December 31, 2018 | 721,869 | | 10.57 | | 6.78 | |
| Vested and expected to vest at December 31, 2018 | 982,324 | | $ | 9.38 | | 7.18 | |
| | | | |
| Outstanding at January 1, 2019 | 982,324 | | $ | 9.38 | | 7.18 | |
| Granted | 324,450 | | 3.34 | | 9.25 | |
| Exercised | — | | — | | 0 | |
| Forfeited or expired | (498,954) | | 10.17 | | 6.27 | |
| Outstanding at December 31, 2019 | 807,820 | | $ | 6.44 | | 7.69 | |
| Exercisable at December 31, 2019 | 403,831 | | 8.66 | | 6.48 | |
| Vested and expected to vest at December 31, 2019 | 807,820 | | $ | 6.44 | | 7.69 | |
The Options granted during the twelve monthsyear ended December 31, 20172019 vest over a three year-year period, one-third on each anniversary of each holder's grant date.
The fair value of each Option was estimated on the date of grant using the Hull-White or Black-Scholes option pricing models with the assumptions described below. For the periods indicated, since the Company has limited historical volatility information available, the expected volatility was based on actual volatility for comparable public companies projected over the expected terms of Options and the actual volatility for the Company since the Business Combination. The Company did not apply a forfeiture rate to the Options as there is not enough historical information available to estimate. The risk-free interest rate was based on the U.S. Treasury yield curve at the time of the grant over the expected term of the Options. The expected life for the Hull-White model was calculated as the average time to achieve the 2.0x strike exercise price in the simulation. The expected life for the Black-Scholes model was estimated using the simplified method.
|
| | |
| | Year Ended December 31,
2017 | Year Ended December 31,
2016 |
| Weighted average grant date fair value | $2.39 | $2.51 |
| Risk-free interest rate | 2.08% | 1.32% |
| Expected life (years) | 6.00 | 6.00 |
| Estimated volatility factor | 57.14% | 48.3% |
| Expected dividends | None | None |
| | | | | | | | |
| Year Ended December 31,
2019 | Year Ended December 31,
2018 |
| Weighted average grant date fair value | $1.72 | | $3.54 | |
| Risk-free interest rate | 2.27% | | 2.56% | |
| Expected life (years) | 6.00 | 6.00 |
| Estimated volatility factor | 52.33% | | 47.52% | |
| Expected dividends | NaN | | NaN | |
As of December 31, 2017,2019, the Company had unrecognized compensation costs for stock options, totaling $1.055$0.6 million that is expected to be recognized over an average period of 2.01.5 years.
Time-Based Stock Appreciation Rights (SARS)
During the year ended December 31, 2017,2019 and December 31, 2018, the Company’s compensation committee approved time-based stock appreciation rights ("SARs") to be granted to officers and employees of the Company outside of the United States, which vest ratably over three years. A summary of the Company’s time-based SARs as of December 31, 20172019 is as follows:
|
| | | | | | | | | |
| | Number of Awards | Weighted-Average Exercise Price | Weighted-Average Remaining Contractual Term (years) | Aggregate Intrinsic Value (In thousands) |
| Outstanding at January 1, 2016 | 165,000 |
| $ | 12.00 |
| 9.71 | $ | — |
|
| Granted | — |
| — |
| 0 | — |
|
| Exercised | — |
| — |
| 0 | — |
|
| Forfeited or expired | (6,875 | ) | 12.00 |
| 0 | — |
|
| Outstanding at December 31, 2016 | 158,125 |
| 12.00 |
| 8.71 | — |
|
| Exercisable at December 31, 2016 | — |
| — |
| 0 | — |
|
| Vested and expected to vest at December 31, 2016 | 158,125 |
| $ | 12.00 |
| 8.71 | $ | — |
|
| | | | | |
| Outstanding at January 1, 2017 | 158,125 |
| $ | 12.00 |
| 8.71 | $ | — |
|
| Granted | 9,350 |
| 2.39 |
| 0 | — |
|
| Exercised | — |
| — |
| 0 | — |
|
| Forfeited or expired | (91,850 | ) | 10.88 |
| 0 | — |
|
| Outstanding at December 31, 2017 | 75,625 |
| $ | 9.83 |
| 7.75 | $ | — |
|
| Exercisable at December 31, 2017 | — |
| — |
| 0 | — |
|
| Vested and expected to vest at December 31, 2017 | 75,625 |
| $ | 9.83 |
| 7.75 | $ | — |
|
| | | | | | | | | | | | |
| | Number of Awards | Weighted-Average Exercise Price | Weighted-Average Remaining Contractual Term (years) | |
| Outstanding at January 1, 2018 | | 75,625 | | $ | 9.83 | | 7.75 | |
| Granted | 30,300 | | 7.35 | | 9.24 | |
| Exercised | — | | — | | 0 | |
| Forfeited or expired | — | | — | | 0 | |
| Outstanding at December 31, 2018 | 105,925 | | 9.12 | | 6.75 | |
| Exercisable at December 31, 2018 | 103,125 | | 8.92 | | 6.68 | |
| Vested and expected to vest at December 31, 2018 | 105,925 | | $ | 9.12 | | 6.75 | |
| | | | |
| Outstanding at January 1, 2019 | 105,925 | | $ | 9.12 | | 6.75 | |
| Granted | 5,450 | | 3.34 | | 9.25 | |
| Exercised | — | | — | | 0 | |
| Forfeited or expired | (27,500) | | 12.00 | | 5.67 | |
| Outstanding at December 31, 2019 | 83,875 | | $ | 8.90 | | 6.00 | |
| Exercisable at December 31, 2019 | 76,558 | | 9.42 | | 5.72 | |
| Vested and expected to vest at December 31, 2019 | 83,875 | | $ | 8.90 | | 6.00 | |
Holders of these SARs are entitled under the terms of the Plan to receive cash payments calculated based on the excess of the Company’s stock price over the target price in their award; consequently, these awards are accounted for as liability-type awards and the Company measures compensation cost based on their estimated fair value at each reporting date and the number of options expected to vest, net of estimated forfeitures, if any.
Upon issuance, the fair value of each SAR award was estimated using the Hull-White option pricing model with the assumptions described below. For the periods indicated, since the Company has limited historical volatility information available, the expected volatility was based on actual volatility for comparable public companies projected over the expected terms of SAR awards. The Company did not apply a forfeiture rate to the SAR awards as there is not enough historical information available to estimate. The risk-free interest rate was based on the U.S. Treasury yield curve at the time of the grant over the expected term of the SAR awards. The expected life was calculated as the average time to achieve the 2.0x strike exercise price in the simulation. Because the SARs are liability classified, they are revalued at each reporting date. The assumptions used to value the SARs as of their issuance dates and as of December 31, 20172019 are presented below:
| | | | | | | | | | | | | | | | | | | | | | | |
| At issuance | | | As of December 31,
2019 | | | As of December 31,
2018 |
| Fair value of awards | $ | 1.86 | | | | $ | 0.17 | | | | $ | 0.29 | |
| Risk-free interest rate | 1.74 | | - | | 2.98 | % | 1.61 | | - | | 1.71% | | 2.47 | % |
| Expected life (years) | 5.83 | - | 6.50 | 2.84 | - | 5.22 | 3.34 |
| Estimated volatility factor | 47.52 | | - | | 48.00 | % | 52.33 | | - | | 54.50% | | 48.22 | % |
| Expected dividends | None | | | | None | | | | NaN | |
|
| | | | | | |
| | As of
December 31,
2017 | As of
December 31,
2016 |
| Fair value of awards | $ | 2.21 |
| $ | 0.32 |
|
| Risk-free interest rate | 2.22 | % | 1.87 | % |
| Expected life (years) | 3.95 |
| 4.73 |
|
| Estimated volatility factor | 54.5 | % | 54.5 | % |
| Expected dividends | None |
| None |
|
As of December 31, 2017,2019, the Company had unrecognized compensation costs for SARs, totaling $29$10.0 thousand that is expected to be recognized over an average period of 1.72.2 years.
Restricted Stock
During the twelve monthsyear ended December 31, 20172019 and December 31, 2016,2018, the Company’s compensation committee approved equity-classified performance-based restricted stock units (RSUs) and time based restricted stock awards to be granted to officers and employees of the Company, which vest ratably over three years. A summary of the Company’s restricted stock awards as of December 31, 20172019 is as follows:
| | | | | | | Number of Shares | Weighted-Average Grant Date Fair Value |
| | Number of Shares | Weighted-Average Grant Date Fair Value | |
| Non-vested RSUs at January 1, 2016 | 596,491 |
| $ | 6.34 |
| |
| Non-vested Restricted Stock & RSUs at January 1, 2018 | | Non-vested Restricted Stock & RSUs at January 1, 2018 | 444,807 | | $ | 5.35 | |
| Granted | 194,570 |
| 5.32 |
| Granted | 554,699 | | 7.06 | |
| Vested | (354,637 | ) | 6.34 |
| Vested | (152,538) | | 5.30 | |
| Forfeited or expired | (139,441 | ) | 6.35 |
| Forfeited or expired | (178,272) | | 5.43 | |
| Non-vested RSUs at December 31, 2016 | 296,983 |
| $ | 5.66 |
| |
| Non-vested Restricted Stock & RSUs at December 31, 2018 | | Non-vested Restricted Stock & RSUs at December 31, 2018 | 668,696 | | $ | 6.76 | |
| | | | |
| Non-vested RSUs at January 1, 2017 | 296,983 |
| $ | 5.66 |
| |
| Non-vested Restricted Stock & RSUs at January 1, 2019 | | Non-vested Restricted Stock & RSUs at January 1, 2019 | 668,696 | | $ | 6.76 | |
| Granted | 513,851 |
| 4.32 |
| Granted | 853,650 | | 3.13 | |
| Vested | (63,744 | ) | 5.46 |
| Vested | (267,249) | | 5.48 | |
| Forfeited or expired | (302,283 | ) | 6.26 |
| Forfeited or expired | (239,275) | | 4.47 | |
| Non-vested RSUs at December 31, 2017 | 444,807 |
| $ | 5.35 |
| |
| Non-vested Restricted Stock and RSUs at December 31, 2019 | | Non-vested Restricted Stock and RSUs at December 31, 2019 | 1,015,822 | | $ | 4.26 | |
As of December 31, 2017, Management has concluded that it is not probable that the performance condition for the RSUs issued in 2015 and 2016 will be met and therefore no compensation is expected to be recognized for those RSUs; however, if it becomes probable that those performance conditions will be met, the Company could recognize up to $1.0 million. Unrecognized compensation expense for the unvestedperformance-based restricted stock and time-based restricted sharesstock is $3.13$2.6 million, which is expected to be recognized over a weighted average period of 2.21.5 years.
Phantom Stock Awards
During the twelve monthsyear ended December 31, 20172019 and December 31, 2016,2018, the Company’s compensation committee approved phantom stock awards to be awarded to officers and employees of the Company located outside of the United States, which vest ratably over three years. These awards will be settled in cash upon vesting and are therefore liability-classified, requiring remeasurement at each balance sheet date. A summary of the Company’s Phantom Stock Awards as of December 31, 20172019 is as follows:
| | | | | | | | |
| | Number of Awards | Weighted-Average Grant Date Fair Value |
| Non-vested phantom stock awards at January 1, 2018 | 78,800 | | $ | 5.91 | |
| Granted | 65,450 | | 7.35 | |
| Vested | (17,519) | | 4.70 | |
| Forfeited or expired | (14,548) | | 7.68 | |
| Non-vested phantom stock awards at December 31, 2018 | 112,183 | | $ | 6.71 | |
| | |
| Non-vested phantom stock awards at January 1, 2019 | 112,183 | | $ | 6.71 | |
| Granted | 136,450 | | 3.09 | |
| Vested | (43,219) | | 5.41 | |
| Forfeited or expired | (22,532) | | 4.51 | |
| Non-vested phantom stock awards at December 31, 2019 | 182,882 | | $ | 4.30 | |
|
| | | | | |
| | Number of Awards | Weighted-Average Grant Date Fair Value |
| Non-vested phantom stock awards at January 1, 2016 | 154,502 |
| $ | 6.34 |
|
| Granted | 10,500 |
| 6.11 |
|
| Vested | (49,655 | ) | 6.34 |
|
| Forfeited or expired | (5,538 | ) | 6.34 |
|
| Non-vested phantom stock awards at December 31, 2016 | 109,809 |
| $ | 6.32 |
|
| | | |
| Non-vested phantom stock awards at January 1, 2017 | 109,809 |
| $ | 6.32 |
|
| Granted | 90,000 |
| 4.35 |
|
| Vested | — |
| — |
|
| Forfeited or expired | (121,009 | ) | 6.34 |
|
| Non-vested phantom stock awards at December 31, 2017 | 78,800 |
| $ | 5.91 |
|
As of December 31, 2017, Management concluded that it is not probable that the performance condition for the phantom shares issued in 2015 and 2016 will be met and therefore no compensation is expected to be recognized for those phantom shares;
however, if it becomes probable that those performance conditions will be met, the Company could recognize up to $0.3 million of additional compensation expense. Unrecognized compensation expense for the unvested time-based phantom shares is $0.4$0.2 million, which is expected to be recognized over a weighted average period of 2.22.0 years.
Director Shares
On January 31, 2014, 20,125 founder shares were transferred to each of Boulevard’s three3 independent directors (“Director Shares”), of Boulevard, adjusted for the effect of stock dividends in February 2014 (for a total of 60,375 founder shares). On March 13, 2014, the underwriters exercised a portion of the over-allotment option from the Public Offering, resulting in a portion of the Director Shares being forfeited. As a result, the Director Shares were adjusted ratably resulting in each director holding 18,375 Director Shares (for a total of 55,125 Director Shares) at December 31, 2017.2019.
The Director Shares were effectively subject to achievement of two2 performance conditions — the Company completing its initial public offering (IPO) and a business combination within 21 months of the IPO. Additionally, 25% (13,781 shares in the
aggregate) are subject to forfeiture if the Company’s stock price does not trade at or above $13 for any 20 trading days ofwithin a 30 day period commencing on the Closing dateDate through July 31, 2020 (5 years).2020.
The grant date fair value of the Director Shares with performance conditions was estimated as of their deemed grant date of January 31, 2014. The aggregate fair value of the Director Shares of $0.4 million was recognized as an expense upon consummation of the Business Combination, at which point the performance conditions had been achieved.
The fair value of the Director Shares was estimated using a Monte Carlo Simulation Model that used the following assumptions:
|
| | | | |
| Risk-free interest rate | 1.96% | |
| Expected life (years) | 6.47 |
| Estimated volatility factor | 31.16% | |
| Expected dividends | NoneNaN | |
As of December 31, 2017,2019, the Company had unrecognized compensation costs for the Director Shares of $2$0 thousand that is expected to be recognized over an average period of 1.0 year.0.0 years.
Board of Director Grants
Certain directors receive shares of restricted stock subject to the terms, provisions and restrictions of the 2015 Incentive Compensation Plan. The shares granted during the five monthsyear ended December 31, 2015 vest over a three year period, one-third on each anniversary of each holder’s grant date, provided the Director is still serving as a director of the Company. The shares granted during the twelve months ended December 31, 20172019, and 2016,2018, vest over a one year period on the one year anniversary of each holder's grant date, provided the Director is still serving as a director of the Company. Upon termination of directorship for any reason, the Director immediately forfeits any unvested shares without payment. A summary of the Company’s time-based restricted stock awarded to the Board of Directors for the twelve monthsyear ended December 31, 20172019 is as follows:
| | | | | | | | |
| | Number of Shares | Weighted-Average Grant Date Fair Value |
| Non-vested time-based restricted stock at January 1, 2018 | 7,262 | | $ | 5.48 | |
| Granted | 85,890 | | 6.75 | |
| Vested | (28,783) | | 5.40 | |
| Forfeited or expired | — | | — | |
| Non-vested time-based restricted stock at December 31, 2018 | 64,369 | | $ | 7.21 | |
| | |
| Non-vested time-based restricted stock at January 1, 2019 | 64,369 | | $ | 7.21 | |
| Granted | 233,362 | | 2.29 | |
| Vested | (90,308) | | 5.80 | |
| Forfeited or expired | — | | — | |
| Non-vested time-based restricted stock at December 31, 2019 | 207,423 | | $ | 2.29 | |
|
| | | | | |
| | Number of Shares | Weighted-Average Grant Date Fair Value |
| Non-vested time-based restricted stocks at January 1, 2016 | 26,387 |
| $ | 6.34 |
|
| Granted | 69,539 |
| 5.08 |
|
| Vested | (76,802 | ) | 5.22 |
|
| Forfeited or expired | (4,600 | ) | 6.34 |
|
| Non-vested time-based restricted stock at December 31, 2016 | 14,524 |
| $ | 6.22 |
|
| | | |
| Non-vested time-based restricted stock at January 1, 2017 | 14,524 |
| $ | 6.22 |
|
| Granted | 96,853 |
| 5.42 |
|
| Vested | (104,115 | ) | 5.40 |
|
| Forfeited or expired |
|
|
|
|
| Non-vested time-based restricted stock at December 31, 2017 | 7,262 |
| $ | 5.48 |
|
As of December 31, 2017,2019, the Company had unrecognized compensation costs for the Director shares of $0.2 million that is expected to be recognized over an average period of 1.50.4 years.
17.Earnings Per Share
Basic incomeearnings (loss) per share is calculated by dividing net (loss) income (loss) by the weighted average number of common shares outstanding for the period. In computing dilutive income (loss) per share, basic income (loss) per share is adjustedThe Company had a loss for the assumed issuanceyear ended December 31, 2019 and December 31, 2018. Therefore, the effect of all potentially dilutive share-basedstock-based awards including stock options, restricted stock, restricted stock units, and warrants.warrants outstanding at December 31, 2019 and December 31, 2018, respectively, have not been included in the computation of diluted loss per share because their inclusion would have been anti-dilutive.
The following is a reconciliation of the weighted-average common shares outstanding used for the computation of basic and diluted net (loss) income (loss) per common share:
| | | | Year Ended December 31,
2017 | Year Ended December 31,
2016 | | Year Ended December 31,
2019 | Year Ended December 31,
2018 | Year Ended December 31,
2017 |
| Basic weighted-average common shares outstanding | 49,808,600 |
| 49,462,205 |
| Basic weighted-average common shares outstanding | 50,123,565 | | 49,883,739 | | 49,808,600 | |
| Effect of dilutive options, performance stock units and restricted stock | 382,703 |
| — |
| Effect of dilutive options, performance stock units and restricted stock | — | | — | | 382,703 | |
| Dilute weighted-average shares outstanding | 50,191,303 |
| 49,462,205 |
| Dilute weighted-average shares outstanding | 50,123,565 | | 49,883,739 | | 50,191,303 | |
Securities that could potentially be dilutive are excluded from the computation of diluted earnings (loss) per share when a loss from continuing operations exists, or when the exercise price exceeds the average closing price of the Company's common stock during the period, or for contingently issued shares, if contingency is not met at the end of the reporting period, because their inclusion would result in an anti-dilutive effect on per share amounts.
The following represents amountsthe number of shares that could potentially dilute basic EPSearnings per share in the future:
|
| | | | |
Stock-based compensation awards(1): | |
|
| Stock options | 577,500848,862 |
|
Warrants:Restricted Stock Units | 585,052 |
|
| Warrants: | | |
| Private placement warrants | 6,160,000 |
|
| Public warrants | 9,823,072 |
|
———————————————————————————————(1) SARs and Phantom Options are payable in cash so will therefore have no impact on number of shares
| |
(1)
| SARs and Phantom Options are payable in cash so will therefore have no impact on number of shares |
Warrants and options are considered anti-dilutive and excluded when the exercise price exceeds the average market value of the Company’s common stock price during the applicable period. Performance share units are considered anti-dilutive if the performance targets upon which the issuance of the shares is contingent have not been achieved and the respective performance period has not been completed as of the end of the current period.
(Loss) income before income taxes consists of the following components:
| | | | Successor | | | Predecessor | |
| (amounts in thousands) | Year Ended December 31,
2017 | Year Ended December 31,
2016 | August 1, 2015
Through
December 31, 2015 | | | January 1, 2015
Through
July 31, 2015 | |
| (in thousands) | | (in thousands) | Year Ended December 31,
2019 | Year Ended December 31,
2018 | Year Ended December 31,
2017 |
| Domestic | $ | (1,118 | ) | $ | (111,056 | ) | $ | (34,139 | ) | | | $ | 29,053 |
| Domestic | $ | (74,979) | | $ | (32,982) | | $ | (1,118) | |
| Foreign | 20,101 |
| 12,516 |
| 470 |
| | | (32,261 | ) | Foreign | (3,674) | | 4,582 | | 20,101 | |
| Total | $ | 18,983 |
| $ | (98,540 | ) | $ | (33,669 | ) | | | $ | (3,208 | ) | Total | $ | (78,653) | | $ | (28,400) | | $ | 18,983 | |
Significant components of income taxes are as follows:
| | | | | | | | | | | |
| (in thousands) | Year Ended December 31,
2019 | Year Ended December 31,
2018 | Year Ended December 31,
2017 |
| Currently payable: | | | |
| Federal | $ | (296) | | $ | (631) | | $ | 1,323 | |
| State and Local | 37 | | $ | 36 | | $ | 32 | |
| Foreign | 4,747 | | $ | 1,281 | | $ | 6,581 | |
| Total currently payable | 4,488 | | $ | 686 | | $ | 7,936 | |
| | | |
| Deferred: | | | |
| Federal | (16,572) | | (2,404) | | (14,801) | |
| State and Local | — | | (66) | | 256 | |
| Foreign | (5,059) | | 3,624 | | 2,030 | |
| Total deferred | (21,631) | | 1,154 | | (12,515) | |
| (Benefit) provision for income taxes | $ | (17,143) | | $ | 1,840 | | $ | (4,579) | |
|
| | | | | | | | | | | | | | |
| | Successor | | | Predecessor |
| (amounts in thousands) | Year Ended December 31,
2017 | Year Ended December 31,
2016 | August 1, 2015 Through December 31, 2015 | | | January 1, 2015
Through
July 31, 2015 |
| Currently payable: | |
|
| |
| | | |
|
| Federal | $ | 1,323 |
| $ | — |
| $ | — |
| | | $ | 14,370 |
|
| State and Local | 32 |
| (1 | ) | 8 |
| | | 305 |
|
| Foreign | 6,581 |
| (771 | ) | 646 |
| | | 392 |
|
| Total currently payable | 7,936 |
| (772 | ) | 654 |
| | | 15,067 |
|
| | | | | | | |
| Deferred: | | | |
| | | |
|
| Federal | (14,801 | ) | 10,073 |
| (18,308 | ) | | | (4,115 | ) |
| State and Local | 256 |
| (482 | ) | (789 | ) | | | (57 | ) |
| Foreign | 2,030 |
| 4,201 |
| (789 | ) | | | (46 | ) |
| Total deferred | (12,515 | ) | 13,792 |
| (19,886 | ) | | | (4,218 | ) |
| Provision (benefit) for income taxes | $ | (4,579 | ) | $ | 13,020 |
| $ | (19,232 | ) | | | $ | 10,849 |
|
A reconciliation of income tax expense at the U.S. Federal statutory income tax rate to actual income tax (benefit) provision is as follows:
| | | | Successor | | | Predecessor | |
| (amounts in thousands) | Year Ended December 31,
2017 | Year Ended December 31,
2016 | August 1, 2015 Through December 31, 2015 | | | January 1, 2015 Through July 31, 2015 | |
| (in thousands) | | (in thousands) | Year Ended December 31,
2019 | Year Ended December 31,
2018 | Year Ended December 31,
2017 |
| Tax at Statutory Rate | $ | 6,654 |
| $ | (34,490 | ) | $ | (11,785 | ) | | | $ | (1,123 | ) | Tax at Statutory Rate | $ | (16,517) | | $ | (5,962) | | $ | 6,654 | |
| State income taxes, net of federal tax benefit | 166 |
| (313 | ) | (508 | ) | | | 141 |
| State income taxes, net of federal tax benefit | 40 | | (54) | | 166 | |
| Effect of Foreign Items | 2,101 |
| (788 | ) | (411 | ) | | | 2,315 |
| Effect of Foreign Items | 1,004 | | 834 | | 2,101 | |
| Goodwill impairment | — |
| 21,831 |
| — |
| | | — |
| Goodwill impairment | — | | — | | — | |
| Valuation Allowance and unbenefited losses | 18,452 |
| 28,466 |
| (2,004 | ) | | | 9,321 |
| Valuation Allowance and unbenefited losses | (3,868) | | 6,018 | | 18,452 |
| U.S. valuation allowance release | (15,388 | ) | — |
| — |
| | | — |
| U.S. valuation allowance release | — | | — | | (15,388) | |
| Deferred Tax Rate Changes | (17,312 | ) | — |
| — |
| | | — |
| Deferred Tax Rate Changes | 281 | | 240 | | (17,312) | |
| Transaction Costs | 470 |
| — |
| — |
| | | — |
| Transaction Costs | 671 | | 531 | | 470 | |
| Tax Incentives | (68 | ) | (82 | ) | (34 | ) | | | — |
| Tax Incentives | (56) | | (91) | | (68) | |
| Disallowed foreign exchange loss | | Disallowed foreign exchange loss | 573 | | — | | — | |
| Warrants | 168 |
| (1,722 | ) | (4,557 | ) | | | — |
| Warrants | — | | — | | 168 | |
| Other | 178 |
| 118 |
| 67 |
| | | 195 |
| Other | 729 | | 324 | | 178 | |
| Provision (benefit) for income taxes | $ | (4,579 | ) | $ | 13,020 |
| $ | (19,232 | ) | | | $ | 10,849 |
| |
| (Benefit) provision for income taxes | | (Benefit) provision for income taxes | $ | (17,143) | | $ | 1,840 | | $ | (4,579) | |
Income tax expense for the twelve monthsyear ended December 31, 2017, twelve months2019, year ended December 31, 2016, five months2018, and year ended December 31, 2015, and seven months ended July 31, 20152017 include certain discrete tax items for changes in valuation allowances, non-deductible U.S. goodwill impairment, foreign effective rate items and other rate modifying items.
On December 22, 2017, the Tax Cuts and Jobs Act (“TCJA”) was enacted in the U.S. The TCJA significantly revisedrepresents sweeping changes in U.S. tax law. Among other changes in tax law, the TCJA permanently reduced the U.S. federal corporate income tax by, among other things, lowering the corporate income tax rate to 21%, implementing beginning in 2018, imposed a territorial tax system, and imposing a repatriation tax on earnings of foreign subsidiaries that are deemed to be repatriated to the U.S.
U.S. GAAP accounting for income taxes requires that the Company records the impacts of any tax law change on deferred income taxes in the quarter that the tax law change is enacted. Due to the complexities involved in accounting for the enactment of TCJA, SEC Staff Accounting Bulletin (“SAB”) 118 allows the Company to provide a provisional estimate of the impacts of the TCJA in its earnings for the fourth quarter and year ending December 31, 2017. Accordingly, based on currently available information, the Company recorded a net benefit of $17.0 million in the Consolidated and Combined Statements of Income (Loss) as a component of “Provision (benefit) for income taxes”. The $17.0 million net benefit consisted of a $17.5 million benefit resulting from the remeasurement of the Company’s net deferred tax liabilities in the U.S. based on the new lower corporate income tax rate and, is in part, offset by a $0.5 million expense relating to the one-time repatriation tax on previously deferred foreign earnings, established a participation exemption system by allowing a 100% dividends received deduction on qualifying dividends paid by foreign subsidiaries, limited deductions for net interest expense, and expanded the U.S. taxation of certain non-U.S. subsidiaries that are owned either wholly or partially byforeign earned income to include “global intangible low-taxed income” (“GILTI”).
The TCJA subjects a U.S. subsidiarycorporation to tax on its GILTI. U.S. GAAP allows companies to make an accounting policy election to either (1) treat taxes due on future GILTI inclusions in U.S. taxable income as a current-period expense when incurred (“period cost method”) or (2) factor such amounts into the measurement of its deferred taxes (“deferred method”). The Company elected to use the period cost method and estimated impacts of the Company.
Although the $17.0GILTI inclusion to be a $0.1 million net benefit represents what thetax expense. The Company believes is a reasonable estimate of the impact of the income tax effects of the TCJA on the Company’s consolidated financial statements as of December 31, 2017, it should be considered provisional. It will require adjustments as additional guidance from the U.S. Department of Treasury is provided and once the Company finalizes certain tax positions when the Company files its 2017 U.S. tax return, the Company will be able to conclude whether any further adjustments are required to its netno provisional deferred tax liability balance in the U.S. of $25.4 million as of December 31, 2017, as well asrelated to the liability associated with the one-time, repatriation tax. Any adjustments to these provisional amounts will be reported as a component of tax expense in the reporting period in which any such adjustments are determined, which will be no later than the fourth quarter of 2018. The Company is still evaluating the potential future impacts of the global intangible low-taxed income (“GILTI”) and base erosion and anti-abuse tax (“BEAT”) provisions of the TCJA, and no provisionalas the Company’s average gross receipts are under $500 million.In addition, the Company is not eligible for a benefit for foreign derived intangible income (“FDII”) due to the Company’s U.S. net operating loss position in tax year 2019.
For the year ended December 31, 2019, the Company recorded a tax expense of $4.3 million for the net increase in valuation allowances related to deferred tax liability has been providedassets that will no longer be able to be realized and other unbenefited losses. The unbenefited losses relate to the limits on the deductibility of interest expense introduced by the TCJA. The Company increased the valuation allowance in the U.S. tax jurisdiction by $5.4 million as the Company currently believes that these minimum tax regimes willdoes not have sufficient evidence to support future taxable income to realize the deferred tax asset related to non-deductible net interest expense limited under the TCJA. There was tax benefit of $1.1 million recorded due to a materialdecrease in foreign valuation allowances in Japan, Netherlands, and Turkey. In addition, the Company recognized a tax benefit of $8.2 million of untaxed income related to the elimination of intercompany profit in inventory.
For the year ended December 31, 2018, the Company recorded a tax expense of $6.0 million for the increase in valuation allowances related to deferred tax assets that will no longer be able to be realized and other unbenefited losses. The unbenefited losses relate to the elimination of intercompany profit in inventory, resulting in tax expense of $1.0 million. The Company increased the valuation allowance in the U.S. tax jurisdiction by $2.8 million as the Company does not have sufficient evidence to support future taxable income to realize the deferred tax asset related to non-deductible net interest expense limited under the TCJA. In addition to the U.S. valuation allowance increase, there was tax expense of $2.2 million recorded due to an increase in foreign valuation allowance in Japan, Netherlands, and Turkey as a result of insufficient sources of future taxable income to support certain deferred tax assets. There was also a reduction of $1.7 million in the valuation allowance recorded due to changes in certain temporary differences and foreign currency translation rates which did not have an impact on future tax liabilities.expense.
For the year ended December 31, 2017, the Company recorded a tax benefit of $17.3 million for the remeasurement of deferred income tax assets and liabilities related to tax legislation enactments like the TCJA in the U.S. and other foreign tax legislation enactments. In addition, the Company recorded an income tax expense of $18.5 million for the increase in net valuation allowances for certain tax attributes and other unbenefited losses. The unbenefittedunbenefited losses related to the elimination of intercompany profit in inventory. In addition the company released the valuation allowance in the U.S. tax jurisdiction of $15.4 million as sufficient deferred income tax liabilities exist such that the deferred tax assets are more likely than not to be realized.
For the year ended December 31, 2016, the Company recorded a tax benefit of $1.7 million for the non-taxable marked to market gains from Private Placement Warrants. In addition, the Company recorded an income tax expense of $28.5 million for the increase in valuation allowances for certain tax attributes, including net operating losses. The increase in valuation allowance occurred in the quarter ended December 31, 2016, following the Company's assessment that it will not be able to realize its deferred tax assets in the U.S. in the time horizon required by U.S. GAAP to carry them as assets. During the quarter ended December 31, 2016, the Company impaired its goodwill asset resulting in a permanent item of $21.8 million, as the impairment is not deductible for tax purposes.
The tax rate for the five months ended December 31, 2015, was unfavorably impacted by the non-taxable marked to market gains from Private Placement Warrants of $4.6 million in the U.S. and by the release of the valuation allowance in the U.S. of $2.0 million.
The tax rate for the seven months ended July 31, 2015 was unfavorably impacted by the increase of valuation allowances of $9.3 million primarily in Canada and South Africa and by losses in multiple foreign jurisdictions with tax rates less than 35% of $2.3 million.
Deferred income taxes reflect the net tax effects of temporary differences between the carrying amounts of assets and liabilities for financial reporting purposes and the amounts for income tax purposes. Significant components of the Company’s deferred tax assets and liabilities at December 31, 20172019 and December 31, 20162018 are as follows:
| | | | | | | | |
| (in thousands) | December 31,
2019 | December 31,
2018 |
| Deferred tax assets: | | |
| Pension and other retiree obligations | 91 | | 32 | |
| Inventory | 438 | | 507 | |
| Other accruals and reserves | 4,580 | | 2,856 | |
| Loss and credit carryforwards | 24,348 | | 14,535 | |
| Interest expense deduction limitation carryforward | 7,767 | | 2,769 | |
| Other | (462) | | — | |
| Valuation allowance | (17,102) | | (16,367) | |
| Deferred tax assets | 19,660 | | 4,332 | |
| | |
| Deferred tax liabilities: | | |
| Intangible assets other than goodwill | (23,953) | | (22,443) | |
| Property, plant and equipment | (1,964) | | (2,582) | |
| Unrealized foreign currency gains | | — | | (2,155) | |
| Other | | — | | (52) | |
| Deferred tax liabilities | (25,917) | | (27,232) | |
| Net deferred tax assets / (liabilities) | $ | (6,257) | | $ | (22,900) | |
|
| | | | | | |
| (amounts in thousands) | December 31,
2017 | December 31,
2016 |
| Deferred tax assets: | |
| |
| Intangible assets other than goodwill | $ | — |
| $ | 5,208 |
|
| Pension and other retiree obligations | 209 |
| 547 |
|
| Inventory | 89 |
| 46 |
|
| Other accruals and reserves | 2,370 |
| 2,546 |
|
| Loss and credit carryforwards | 10,932 |
| 27,682 |
|
| Other | 886 |
| 952 |
|
| Valuation allowance | (13,061 | ) | (27,732 | ) |
| Deferred tax assets | 1,425 |
| 9,249 |
|
| | | |
| Deferred tax liabilities: | |
| |
|
| Intangible assets other than goodwill | (21,753 | ) | — |
|
| Property, plant and equipment | (2,604 | ) | (790 | ) |
| Deferred tax liabilities | (24,357 | ) | (790 | ) |
| Net deferred tax assets / (liabilities) | $ | (22,932 | ) | $ | 8,459 |
|
The Company makes significant judgments regarding the realizability of its deferred tax assets (principally net operating losses). The carrying value of deferred tax assets is based on the Company’s assessment that it is more likely than not that the Company will realize these assets after consideration of all available positive and negative evidence.
Gross operating loss carryforwards amounted to $7.0$5.6 million for foreign jurisdictions, $42.4$102.9 million for U.S. federal, and $6.5$16.6 million for U.S. States at December 31, 2017.2019. These operating loss carryforwards related to the 2015, 20162017, 2018 and current 20172019 tax periods. At December 31, 2017, none2019, NaN of the operating loss carryforwards were subject to expiration in 20172019 through 2019.2022. The operating loss carryforwards expiring in years 20212023 through 20272028 make up $0.9 million of the recorded deferred tax asset. The operating loss carryforwards expiring in years 2030 through 2038 make up $9.2$0.6 million of the recorded deferred tax asset. The remaining deferred tax asset relating to operating loss carryforwards of $1.3$22.6 million have an indefinite expiration. Management assesses the available positive and negative evidence to estimate if sufficient future taxable income will be generated to use the existing deferred tax assets.
As of December 31, 2017,2019, management determined that sufficient negative evidence exists to conclude that it is more-likely-than-not that the certain income tax assets in the U.S., Japan, Netherlands, and KoreaTurkey are not realizable, and therefore, increasedretained the valuation allowance accordingly.
The Company has recorded tax credits in the U.S. for research and development expenditures that were generated in in 2015, 2016,2017, 2018, and 20172019 for a total amount of $0.2$0.3 million. These credits will expire beginning in 2035.
U.S. income and foreign withholding taxes have not been recognized for the difference between the financial reporting and tax basisof the investments in foreign subsidiaries that are indefinitely reinvested outside the U.S. This amount may be recognized upon a sale or liquidation of the subsidiary. There is not a gross temporary difference as of December 31, 2019, since the tax basis of investments in foreign subsidiaries is in excess of the financial reporting basis.
Uncertain Tax Positions
| | | | | | | | | | | |
| (in thousands) | Year Ended December 31,
2019 | Year Ended December 31,
2018 | Year Ended Year Ended
December 31, 2017 |
| Beginning Balance | $ | 1,879 | | $ | 2,884 | | $ | — | |
| Additions of tax positions of the current year | 1,725 | | 393 | | — | |
| Additions to tax positions of the prior years | 88 | | — | | 2,884 | |
| Reductions of tax positions of the prior years | — | | (872) | | — | |
| Reductions related to prior tax positions due to foreign currency | (862) | | (525) | | — | |
| Expiration of statutes of limitations | (160) | | (1) | | — | |
| Ending Balance | $ | 2,670 | | $ | 1,879 | | $ | 2,884 | |
|
| | | | | | | | | | | | | | |
| Successor | | | Predecessor |
(amounts in thousands) | Year Ended December 31,
2017 | Year Ended December 31,
2016 | August 1, 2015
Through
December 31, 2015
| | | January 1, 2015
Through
July 31, 2015
|
Beginning Balance | $ | — |
| $ | — |
| $ | — |
| | | $ | — |
|
Additions of tax positions of the current year | — |
| — |
| — |
| | | — |
|
Additions to tax positions of the prior years | 2,884 |
| — |
| — |
| | | — |
|
Reductions of tax positions of the prior years | — |
| — |
| — |
| | | — |
|
Settlements with taxing authorities | — |
| — |
| — |
| | | — |
|
Expiration of statutes of limitations | — |
| — |
| — |
| | | — |
|
Provision (benefit) for income taxes | 2,884 |
| — |
| — |
| | | — |
|
The Company and its subsidiaries file income tax returns in the U.S. federal jurisdiction and various states and foreign jurisdictions. The Company started its operations on July 31, 2015, and has no history of U.S. federal, state and local, and foreign income tax examinations by tax authorities for any open statutes. As of December 31, 20172019 and 2016,2018, the Company had unrecognized tax benefits, defined as the aggregate tax effect of differences between tax return positions and the benefits recognized in the Company's financial statements, of $2.9$2.7 million and $0.0$1.9 million, respectively. If recognized in the fiscal years ended December 31, 20172019 and 2016, $2.92018, $2.7 million and $0.0$1.9 million, respectively, of these benefits would have reduced income tax expense and the effective tax rate. Of these amounts, approximately $0.2 million and $0.0$0.2 million of the Company's unrecognized tax benefits at December 31, 20172019 and 2016,2018, respectively, are indemnified and the release of the indemnification asset will have an offsetting impact to the effective tax rate of the Company. Of the $2.9$2.7 million and $0.0$1.9 million benefits at December 31, 20172019 and 2016,2018, respectively, approximately $1.1$0.5 million and $0.0$0.9 million have been recorded as a reduction to the related deferred tax asset for the net operating loss in accordance with Accounting Standards Update 2013-11, Presentation of an Unrecognized Tax Benefit When a Net Operating Loss Carryforward, a Similar Tax Loss, or a Tax Credit Carryforward Exists for all periods. The total amount of unrecognized tax benefits is not expected to change within 12 months of the reporting date. The Company's policy is to recognize interest and penalties accrued on any unrecognized tax benefit within the provision for income taxes in the Consolidated and Combined Statements of Income (Loss). Income. The Company recorded an increase of $0.5$0.2 million of interest and penalties as part of "Provision for income taxes" in the Company's Consolidated and Combined Statements of (Loss) Income (Loss) during the period ending December 31, 2017.2019. Cumulative interest and penalties of $0.5$0.7 million and $0.0$0.6 million are recorded as part of "Income taxes payable" for December 31, 20172019 and 2016,2018, respectively.
19.Segment and Geographical Information
| |
16. | Segment and Geographical Information |
Segments
The authoritative guidance for disclosures about segments of an enterprise establishes standards for reporting information about segments. It defines operating segments as components of an enterprise about which separate financial information is available that is evaluated regularly by the chief operating decision-maker in deciding how to allocate resources and in assessing performance. We currently operate and manage our business as a single reportable segment.2 operating segments. Our chief operating decision-makers allocate resources and assess performance of the business at the consolidated level.for each segment. Accordingly, we consider ourselves to be in a singlehave 2 operating and reportable segments (i) AgroFresh core and (ii) Tecnidex. AgroFresh core business is providing produce preservation and waste reduction solutions for growers and packers. Its products include SmartFreshTM, HarvistaTM, and FreshCloud. Tecnidex is a provider of fungicides, sanitizers, waxes, and coatings primarily focused on the citrus market.
Our chief operating decision-makers do not evaluate operating segments using asset or liability information. The following table presents a breakdown of our revenues and gross profit based on reportable segments for the years ended December 31, 2019 and 2018. During 2017 there was 1 reportable segment structure.as Tecnidex was acquired in December 2017.
| | | | | | | | |
| Year Ended December 31, | |
| (in thousands) | 2019 | 2018 |
| AgroFresh Core | | |
| Revenues | 150,268 | | 158,020 | |
| Gross Profit | 117,058 | | 124,297 | |
| Tecnidex | | | | |
| Revenues | 19,797 | | 20,766 | |
| Gross Profit | 7,958 | | 8,218 | |
| Total Revenues | $ | 170,065 | | $ | 178,786 | |
| Total Gross Profit | $ | 125,016 | | $ | 132,515 | |
Geographic Regions
Net sales by geographic region, based on the location of the customer, were as follows:
| | | | Successor | | | Predecessor | | Year Ended Year Ended December 31, | |
| (in thousands) | Year Ended December 31,
2017 | Year Ended December 31,
2016 | August 1, 2015
Through
December 31, 2015 | | | January 1, 2015 Through July 31, 2015 | (in thousands) | 2019 | 2018 | 2017 |
| Net sales: | | |
| |
| | | |
| Net sales: | | | |
North America (1) | $ | 53,556 |
| $ | 56,201 |
| $ | 55,870 |
| | | $ | 2,938 |
| North America (1) | $ | 42,247 | | $ | 43,270 | | $ | 53,556 | |
Latin America (2) | 26,657 |
| 24,315 |
| 729 |
| | | 24,314 |
| Latin America (2) | 31,818 | | 27,178 | | 26,657 | |
EMEA (3) | 70,193 |
| 64,671 |
| 52,534 |
| | | 12,369 |
| EMEA (3) | 81,286 | | 93,256 | | 70,193 | |
Asia Pacific (4) | 13,620 |
| 14,482 |
| 1,948 |
| | | 13,061 |
| Asia Pacific (4) | 14,714 | | 15,082 | | 13,620 | |
| Total Net sales | $ | 164,026 |
| $ | 159,669 |
| $ | 111,081 |
| | | $ | 52,682 |
| Total Net sales | $ | 170,065 | | $ | 178,786 | | $ | 164,026 | |
Sales of SmartFresh™ accounted for approximately 87%76%, 90%80%, and 95%87% of our total worldwide net sales for the years December 31, 2017, 2016,2019, 2018, and 2015,2017, respectively.
———————————————————————————————
| |
(1)(1) North America includes the United States and Canada. (2) Latin America includes Argentina, Brazil, Chile, Columbia, Costa Rica, Dominican Republic, Ecuador, Guatemala, Mexico, Peru, and Uruguay. (3) EMEA includes Europe, the Middle East, and Africa. (4) Asia Pacific includes Australia, China, India, Japan, New Zealand, South Korea, and Philippines. | North America includes the United States and Canada. |
| |
(2)
| Latin America includes Argentina, Brazil, Chile, Guatemala, and Mexico. |
| |
(3)
| EMEA includes Europe, the Middle East, and Africa. |
| |
(4)
| Asia Pacific includes China, South Korea, Japan, Australia, and New Zealand. |
Net property, plant and equipment by geographic region at the end of each period was as follows:
| | | | Successor | | | | | | |
| (in thousands) | December 31,
2017 | December 31,
2016 | (in thousands) | December 31,
2019 | December 31,
2018 |
| Net property, plant and equipment: | |
| | Net property, plant and equipment: | | |
| North America | $ | 7,306 |
| $ | 6,572 |
| North America | $ | 8,857 | | $ | 8,651 | |
| All other | 4,894 |
| 1,476 |
| All other | 4,320 | | 4,638 | |
| Total property, plant and equipment | $ | 12,200 |
| $ | 8,048 |
| Total property, plant and equipment | $ | 13,177 | | $ | 13,289 | |
20.Commitments and Contingencies
| |
17. | Commitments and Contingencies |
The Company is currently involved in various claims and legal actions that arise in the ordinary course of business. The Company has recorded reserves for loss contingencies based on the specific circumstances of each case. Such reserves are recorded when it is probable that a loss has been incurred as of the balance sheet date and can be reasonably estimated. Although the results of litigation and claims can never be predicted with certainty, the Company does not believe that the ultimate resolution of these actions will have any material adverse effect on the Company’s business, financial condition or results of operations.
On October 14, 2019, the Company was awarded a verdict of $31.1 million in damages, related to, among other things, trade secret misappropriation and willful patent infringement, in its litigation against Decco Post-Harvest, Inc. ("Decco") and Decco's
parent company, UPL Limited. The award is subject to post-verdict review by the Court and any appeals that may be taken by the parties in the future.
Purchase Commitments
The Company has various purchasing contracts for contract manufacturing and research and development services which are based on the requirements of the business. Generally, the contracts are at prices not in excess of current market price and do not commit the business to obligations outside the normal customary terms for similar contracts.
Operating Leases
21.Fair Value Measurements
The Company uses various leased facilities and equipment in its operations. The lease terms for these leased assets vary depending on the terms of the applicable lease agreement. Rental expense for all operating leases totaled $3.2 million, $3.3 million, $0.9 million, and $0.8 million for the twelve months ended December 31, 2017, the twelve months ended December 31, 2016, the five months ended December 31, 2015, and the seven months ended July 31, 2015, respectively. At December 31, 2017, the Company had no residual value guarantees related to its operating leases. Future minimum lease payments as of December 31, 2017 under noncancelable operating leases are as follows:
|
| | | |
| (in thousands) | Future Lease Payments |
| 2018 | $ | 1,149 |
|
| 2019 | 1,151 |
|
| 2020 | 1,107 |
|
| 2021 | 1,056 |
|
| 2022 | 992 |
|
| Thereafter | 1,027 |
|
| Total | $ | 6,482 |
|
| |
18. | Fair Value Measurements |
Liabilities Measured at Fair Value on a Recurring Basis
The following table presents the fair value of the Company’s financial instruments that are measured at fair value on a recurring basis as of December 31, 2017:2019:
| | | | | | | | | | | | | | |
| (in thousands) | Level 1 | Level 2 | Level 3 | Total |
Tax amortization benefit contingency (1) | $ | — | | $ | — | | $ | — | | $ | — | |
Contingent consideration (2) | — | | — | | — | | — | |
Interest rate swap (3) | — | | — | | (95) | | (95) | |
Liability-classified stock compensation (4) | — | | — | | 218 | | 218 | |
| Total | $ | — | | $ | — | | $ | 123 | | $ | 123 | |
|
| | | | | | | | | | | | |
| (in thousands) | Level 1 | Level 2 | Level 3 | Total |
Tax amortization benefit contingency(1) | — |
| — |
| 43,382 |
| 43,382 |
|
Contingent consideration(2) | — |
| — |
| 691 |
| 691 |
|
Interest rate contract (3) | — |
| 456 |
| — |
| 456 |
|
Stock appreciation rights(4) | — |
| — |
| 268 |
| 268 |
|
Phantom shares(5) | — |
| — |
| 186 |
| 186 |
|
| Total | $ | — |
| $ | 456 |
| $ | 44,527 |
| $ | 44,983 |
|
The following table presents the fair value of the Company’s financial instruments that are measured at fair value on a recurring basis as of December 31, 2016:2018:
|
| | | | | | | | | | | | |
| (in thousands) | Level 1 | Level 2 | Level 3 | Total |
Warrant consideration(6) | $ | — |
| $ | 1,080 |
| $ | — |
| $ | 1,080 |
|
Tax amortization benefit contingency(1) | — |
| — |
| 150,260 |
| 150,260 |
|
Deferred acquisition payment(7) | — |
| — |
| 2,498 |
| 2,498 |
|
Stock appreciation rights(4) | — |
| — |
| 22 |
| 22 |
|
Phantom shares(5) | — |
| — |
| 4 |
| 4 |
|
| Total | $ | — |
| $ | 1,080 |
| $ | 152,784 |
| $ | 153,864 |
|
| | | | | | | | | | | | | | |
| (in thousands) | Level 1 | Level 2 | Level 3 | Total |
Tax amortization benefit contingency (1) | $ | — | | $ | — | | $ | 40,467 | | $ | 40,467 | |
Contingent consideration (2) | — | | — | | 379 | | 379 | |
Liability-classified stock compensation (4) | — | | — | | 550 | | 550 | |
| Total | $ | — | | $ | — | | $ | 41,396 | | $ | 41,396 | |
———————————————————————————————
1.The fair value of the tax amortization benefit contingency is measured using an income approach based on the Company’s best estimate of the undiscounted cash payments to be made, with the current portion tax effected at 21.5% and the non-current portion tax effected at 21.5% due to the TCJA and discounted to present value utilizing an appropriate market discount rate.
| |
(1) | The fair value of the tax amortization benefit contingency is measured using an income approach based on the Company’s best estimate of the undiscounted cash payments to be made, with the current portion tax effected at 35.3% and the non-current portion tax effected at 21.5% due to the TCJA and discounted to present value utilizing an appropriate market discount rate. Per the April 4, 2017 Amendment Agreement, payments due to Dow under the Tax Receivable Agreement was reduced from 85% to 50% of the applicable tax savings realized by the Company. The valuation technique used did not change during the twelve months ended December 31, 2016 and December 31, 2017. |
| |
(2) | The fair value of the contingent consideration related to the Tecnidex acquisition. |
| |
(3) | The derivative assets and liabilities relate to an interest rate derivative that is measured at fair value using observable market inputs such as interest rates, our own credit risks as well as an evaluation of the counterpart's' credit risks. |
| |
(4) | The fair value of the stock appreciation right was measured using a Black Scholes pricing model during the twelve months ended December 31, 2016 and December 31, 2017. |
| |
(5) | The fair value of phantom shares are based on the fair value of the Company's common stock. The valuation technique used did not change during the twelve months ended December 31, 2016 and December 31, 2017. |
| |
(6)
| This liability relates to warrants to purchase the Company's common stock and future obligations to deliver additional warrants in relation to the Business Combination. The inputs used in the fair value measurement were directly observable quoted prices for identical assets in an inactive market. |
| |
(7)
| The fair value of the deferred acquisition payment is measured using a Black-Scholes option pricing model and based on the Company’s best estimate of the Company’s average Business EBITDA, as defined in the Purchase Agreement, over the two year period from January 1, 2016 to December 31, 2017. The valuation technique used did not change during the twelve months ended December 31, 2016 and December 31, 2017. |
2.The fair value of the contingent consideration related to the Tecnidex acquisition.
3.The derivative assets and liabilities relate to an interest rate derivative that is measured at fair value using observable market inputs such as interest rates, our own credit risks as well as an evaluation of the counterpart's' credit risks.
4.The fair value of the stock appreciation right was measured using a Black-Scholes pricing model during the year ended December 31, 2019 and December 31, 2018. The fair value of phantom shares is based on the fair value of the Company's common stock. The fair value of performance based phantom shares was measured using a Monte Carlo pricing model. The valuation technique used did not change during the year ended December 31, 2019 and December 31, 2018.
There were no0 transfers between Level 1 and Level 2 and no0 transfers out of Level 3 of the fair value hierarchy during the twelve monthsyear ended December 31, 20172019 and December 31, 2016.2018.
At December 31, 2017,2019, the Company evaluated the amount recorded under the Term Loan and determined that the fair value was approximately $408.2$345.0 million. The carrying amounts of cash and cash equivalents, accounts receivable, and accounts payable approximate fair value.
Changes in Financial Instruments Measured at Level 3 Fair Value on a Recurring Basis
The following tables present the changes during the periods presented in our Level 3 financial instruments that are measured at fair value on a recurring basis. These instruments relate to contingent consideration payable to Dow in relation to the Business Combination.
| | | | | | | | | | | | | | | | | |
| (in thousands) | Tax amortization
benefit
contingency | Contingent
consideration
related to
acquisition | Interest rate
contract | Liability-classified stock compensation | Total |
| Balance, December 31, 2018 | 40,467 | | 379 | | — | | 550 | | 41,396 | |
| Accretion | 3,459 | | — | | — | | — | | 3,459 | |
| Payment to Dow | (16,003) | | — | | — | | — | | (16,003) | |
| Dow settlement | (27,994) | | — | | — | | — | | (27,994) | |
| Tecnidex earnout activity | — | | (379) | | — | | — | | (379) | |
| Interest rate contract | — | | — | | (95) | | — | | (95) | |
| Stock compensation activity | — | | — | | — | | (332) | | (332) | |
| Mark-to-market adjustment | 71 | | — | | — | | — | | 71 | |
| Balance, December 31, 2019 | $ | — | | $ | — | | $ | (95) | | $ | 218 | | $ | 123 | |
22.Quarterly Financial Data (Unaudited)
| | | | | | | | | | | | | | |
| (in thousands, except per share data) | First Quarter | Second Quarter | Third Quarter | Fourth Quarter |
| 2019 | | | | |
| Net sales | $ | 38,940 | | $ | 21,183 | | $ | 48,972 | | $ | 60,970 | |
| Cost of sales | $ | 11,335 | | $ | 6,289 | | $ | 13,892 | | $ | 13,533 | |
| Gross profit | $ | 27,605 | | $ | 14,894 | | $ | 35,080 | | $ | 47,437 | |
| (Loss) income before taxes | $ | (13,172) | | $ | (28,651) | | $ | (2,642) | | $ | (34,188) | |
| Net (loss) income | $ | (12,585) | | $ | (22,361) | | $ | 3,011 | | $ | (29,575) | |
| Net (loss) income per common share: | | | | |
| Basic | $ | (0.25) | | $ | (0.45) | | $ | 0.06 | | $ | (0.60) | |
| Diluted | $ | (0.25) | | $ | (0.45) | | $ | 0.06 | | $ | (0.60) | |
|
| | | | | | | | | | | | | | | | | | | | | |
| (in thousands) | Tax amortization benefit contingency | Contingent consideration related to acquisition | Deferred acquisition payment | Interest rate contract (3) | Stock appreciation rights | Phantom shares | Total |
| Balance, December 31, 2016 | $ | 150,260 |
| | $ | 2,498 |
| | $ | 22 |
| $ | 4 |
| $ | 152,784 |
|
| Dow settlement | (86,931 | ) | | — |
| | — |
| — |
| (86,931 | ) |
| Accretion | 8,432 |
| | — |
| | — |
| — |
| 8,432 |
|
| TRA payment to Dow | (3,744 | ) | | | | | | (3,744 | ) |
| Tecnidex acquisition | | 691 |
| | | | | 691 |
|
| Interest rate contract | | | | 456 |
| | | 456 |
|
| Stock compensation expense | — |
| | — |
| | 246 |
| 182 |
| 428 |
|
| Mark-to-market adjustment | (24,924 | ) | | (2,498 | ) | | — |
| — |
| (27,422 | ) |
| Balance, December 31, 2017 | $ | 43,093 |
| $ | 691 |
| $ | — |
| $ | 456 |
| $ | 268 |
| $ | 186 |
| $ | 44,694 |
|
There was $0.3 million of severance expense for the twelve months ended December 31, 2017. For the twelve months ended December 31, 2016, there was $3.2 million of severance expense. This amount, which does not include stock compensation expense, was recorded in selling, general and administrative expense in the condensed consolidated statements of income (loss). As of December 31, 2017, the Company had $0.2 million of severance liability, of which $0.1 million will be paid out over the next year.
| |
20. | Quarterly Financial Data (Unaudited) |
|
| | | | | | | | | | | | |
| (in thousands, except per share data) | First Quarter | Second Quarter | Third Quarter | Fourth Quarter |
| 2017: | | | | |
| Net sales | $ | 32,730 |
| $ | 16,389 |
| $ | 60,772 |
| $ | 54,135 |
|
| Cost of sales | $ | 5,839 |
| $ | 3,906 |
| $ | 11,620 |
| $ | 11,290 |
|
| Gross profit | $ | 26,891 |
| $ | 12,483 |
| $ | 49,152 |
| $ | 42,845 |
|
| (Loss) income before taxes | $ | (10,647 | ) | $ | (14,302 | ) | $ | 13,178 |
| $ | 30,754 |
|
| Net (loss) income | $ | (12,029 | ) | $ | 2,607 |
| $ | 9,546 |
| $ | 23,438 |
|
| Net (loss) income per common share: | | | | |
| Basic | $ | (0.24 | ) | $ | 0.05 |
| $ | 0.19 |
| $ | 0.47 |
|
| Diluted | $ | (0.24 | ) | $ | 0.05 |
| $ | 0.19 |
| $ | 0.47 |
|
| | | (in thousands, except per share data) | First Quarter | Second Quarter | Third Quarter | Fourth Quarter | (in thousands, except per share data) | First Quarter | Second Quarter | Third Quarter | Fourth Quarter |
| 2016: | | |
| 2018 | | 2018 | |
| Net sales | $ | 28,411 |
| $ | 18,385 |
| $ | 61,200 |
| $ | 51,673 |
| Net sales | $ | 38,351 | | $ | 18,420 | | $ | 68,698 | | $ | 53,317 | |
| Cost of sales | $ | 23,820 |
| $ | 15,833 |
| $ | 8,905 |
| $ | 11,791 |
| Cost of sales | $ | 10,846 | | $ | 5,402 | | $ | 16,662 | | $ | 13,361 | |
| Gross profit | $ | 4,591 |
| $ | 2,552 |
| $ | 52,295 |
| $ | 39,882 |
| Gross profit | $ | 27,505 | | $ | 13,018 | | $ | 52,036 | | $ | 39,956 | |
| (Loss) income before taxes | $ | (40,426 | ) | $ | (40,790 | ) | $ | 11,988 |
| $ | (29,595 | ) | (Loss) income before taxes | $ | (9,306) | | $ | (22,777) | | $ | 3,972 | | $ | (289) | |
| Net (loss) income | $ | (25,137 | ) | $ | (25,164 | ) | $ | 7,312 |
| $ | (68,854 | ) | Net (loss) income | $ | (12,876) | | $ | (18,402) | | $ | 2,954 | | $ | (1,916) | |
| Net (loss) income per common share: | | Net (loss) income per common share: | |
| Basic | $ | (0.51 | ) | $ | (0.51 | ) | $ | 0.15 |
| $ | (1.40 | ) | Basic | $ | (0.26) | | $ | (0.37) | | $ | 0.06 | | $ | (0.04) | |
| Diluted | $ | (0.51 | ) | $ | (0.51 | ) | $ | 0.15 |
| $ | (1.40 | ) | Diluted | $ | (0.26) | | $ | (0.37) | | $ | 0.06 | | $ | (0.04) | |
———————————————————————————————
ITEM 9. CHANGES IN AND DISAGREEMENTS WITH ACCOUNTANTS ON ACCOUNTING AND FINANCIAL DISCLOSURE
None.
ITEM 9A. CONTROLS AND PROCEDURES
Disclosure Controls and Procedures
As of December 31, 2017,2019, our management, with the participation of our Chief Executive Officer (“CEO”) and Chief Financial Officer (“CFO”), has conducted an evaluation of our disclosure controls and procedures. Based on that evaluation, our CEO and CFO concluded that our disclosure controls and procedures were effective as of December 31, 2017.2019.
Management’s Report on Internal Controls over Financial Reporting
The Company’s management is responsible for establishing and maintaining adequate internal control over financial reporting, as such term is defined in Rule 13a-15(f) of the Exchange Act. The Company’s internal control over financial reporting is designed to provide reasonable assurance regarding the reliability of financial reporting and the preparation of published financial statements in accordance with generally accepted accounting principles.
Our internal controls over financial reporting include those policies and procedures that:
•pertain to the maintenance of records that, in reasonable detail, accurately and fairly reflect the transactions and dispositions of the assets of the Company;
•provide reasonable assurance that transactions are recorded as necessary to permit preparation of financial statements in accordance with U.S. generally accepted accounting principles, and that our receipts and expenditures are being made only in accordance with authorizations of the Company’s management and directors; and
•provide reasonable assurance regarding prevention or timely detection of unauthorized acquisition, use or disposition of our assets that could have a material effect on the financial statements.
Management assessed the effectiveness of our internal controls over financial reporting as of December 31, 2017.2019. In making this assessment, management used the criteria in Internal Control-Integrated Framework (2013)set forth by the Committee of Sponsoring Organizations of the Treadway Commission (COSO). Based on our assessment using those criteria, management concluded that our internal control over financial reporting as of December 31, 20172019 was effective.
Because of its inherent limitations, internal controls over financial reporting may not prevent or detect misstatements. Projections of any evaluation of effectiveness to future periods are subject to the risk that controls may become inadequate because of changes in conditions, or that the degree of compliance with the policies or procedures may deteriorate.
We have concluded that the financial statements and other financial information included in this Annual Report on Form 10-K fairly present in all material respects our financial condition, results of operations and cash flows as of, and for, the periods presented.
Remediation of Prior Material Weaknesses
As previously reported in our Annual Report on Form 10-K for the year ended December 31, 2015, we identified the following material weakness in our internal control over financial reporting:
In particular, we identified a material weakness in the design and operating effectiveness of our internal control over financial reporting that relate to the accurate and timely reporting of our operating expense accruals. This internal control failure related to ineffective design and operation of controls over our process of identifying and recording liabilities for vendor invoices received subsequent to year-end that related to our 2015 activities, which would have resulted in understated operating expenses and accrued liabilities, if left uncorrected.
A material weakness is a deficiency, or a combination of deficiencies, in internal control, such that there is a reasonable possibility that a material misstatement of annual or interim financial statements will not be prevented or detected on a timely basis.
We believe that the material weakness described above resulted in large part from the completion of the Business Combination on July 31, 2015. Following the completion of the Business Combination, and through 2016 we have been building a standalone financial infrastructure, and this process continued in 2017. Management designed and implemented certain remediation measures to address the material weakness and to improve controls over financial reporting. Among other things, during 2016 we hired permanent full-time finance and accounting personnel, built business and financial processes, developed formal policies and procedures related to expense cut-offs, and conducted training and education of appropriate personnel regarding cost estimates and expense cut-off dates.
We are committed to maintaining a strong control environment. These remediation efforts represent a significant and sustained improvement in our control environment that allowed us to fully remediate the material weakness outlined above as of December 31, 2016.
Changes in Internal Control over Financial Reporting
There were no changes in our internal control over financial reporting identified in connection with the evaluation required by paragraph (d) of Rule 13a-15 or Rule 15d-15 under the Exchange Act that occurred during the Company’s most recently completed fiscal quarter, and there has been no change in our internal control over financial reporting that has materially affected, or is reasonably likely to materially affect, our internal control over financial reporting.
ITEM 9B. OTHER INFORMATION
None.
PART III
ITEM 10. DIRECTORS, EXECUTIVE OFFICERS AND CORPORATE GOVERNANCE
The information required by this Item is incorporated herein by reference to the Company's Definitive Proxy Statement to be filed pursuant to Regulation 14A of the Exchange Act for its 20182020 Annual Meeting of Stockholders, which will be filed no later than 120 days after December 31, 2017.2019.
ITEM 11. EXECUTIVE COMPENSATION
The information required by this Item is incorporated herein by reference to the Company's Definitive Proxy Statement to be filed pursuant to Regulation 14A of the Exchange Act for its 20182020 Annual Meeting of Stockholders, which will be filed no later than 120 days after December 31, 2017.2019.
ITEM 12. SECURITY OWNERSHIP OF CERTAIN BENEFICIAL OWNERS AND MANAGEMENTANDMANAGEMENT AND RELATED STOCKHOLDER MATTERS
The information required by this Item is incorporated herein by reference to the Company's Definitive Proxy Statement to be filed pursuant to Regulation 14A of the Exchange Act for its 20182020 Annual Meeting of Stockholders, which will be filed no later than 120 days after December 31, 2017.2019.
ITEM 13. CERTAIN RELATIONSHIPS AND RELATED TRANSACTIONS, AND DIRECTOR INDEPENDENCE
The information required by this Item is incorporated herein by reference to the Company's Definitive Proxy Statement to be filed pursuant to Regulation 14A of the Exchange Act for its 20182020 Annual Meeting of Stockholders, which will be filed no later than 120 days after December 31, 2017.2019.
ITEM 14. PRINCIPAL ACCOUNTING FEES AND SERVICES
The information required by this Item is incorporated herein by reference to the Company's Definitive Proxy Statement to be filed pursuant to Regulation 14A of the Exchange Act for its 20182020 Annual Meeting of Stockholders, which will be filed no later than 120 days after December 31, 2017.2019.
PART IV
ITEM 15. EXHIBITS, FINANCIAL STATEMENT SCHEDULES
All other schedules are omitted either because they are not applicable, not required, or because the required information is included in the consolidated and combined financial statements or the notes thereto. The following documents are filed as part of this report:
| | | | | | | | |
| | Page |
| (1) | | Page |
(1) | Consolidated Financial Statements | |
| | |
| | |
| | |
| | |
| | |
| | |
| | |
| | |
| (2) | | Financial Statement Schedules | |
| | |
| | |
| | |
| (3) | Exhibits | Exhibits | |
| | |
| | |
SCHEDULE I - CONDENSED FINANCIAL INFORMATION
AgroFresh Solutions, Inc.
Parent Company Information
Condensed Balance Sheets
(In thousands)
| | | | Successor | | | | | | |
| | December 31, 2017 | December 31, 2016 | | December 31,
2019 | December 31,
2018 |
| ASSETS | |
| | ASSETS | | |
| Accounts receivable from subsidiary | $ | 101,504 |
| $ | 4,114 |
| Accounts receivable from subsidiary | $ | 107,420 | | $ | 104,244 | |
| Investment in subsidiaries | 342,810 |
| 333,003 |
| Investment in subsidiaries | 237,349 | | 309,591 | |
| Claims for income tax refunds | (16 | ) | 16 |
| Claims for income tax refunds | 313 | | 196 | |
| Deferred income tax asset | (24 | ) | — |
| Deferred income tax asset | 22,943 | | (24) | |
| TOTAL ASSETS | $ | 444,274 |
| $ | 337,133 |
| TOTAL ASSETS | $ | 368,025 | | $ | 414,007 | |
| | | |
| | | |
| LIABILITIES AND STOCKHOLDERS' EQUITY | | |
| LIABILITIES AND STOCKHOLDERS' EQUITY | | |
| Accounts payable to subsidiaries | $ | 1,909 |
| $ | 1,909 |
| Accounts payable to subsidiaries | $ | 1,909 | | $ | 1,909 | |
| Income taxes payable | 26,285 |
| — |
| |
| Total liabilities | 28,194 |
| 1,909 |
| |
| Other current liabilities | | Other current liabilities | 32,086 | | 39,522 | |
| Total stockholders’ equity | 416,080 |
| 335,224 |
| Total stockholders’ equity | $ | 334,030 | | $ | 372,576 | |
| TOTAL LIABILITIES AND STOCKHOLDERS' EQUITY | $ | 444,274 |
| $ | 337,133 |
| TOTAL LIABILITIES AND STOCKHOLDERS' EQUITY | 368,025 | | 414,007 | |
See accompanying notes to condensed financial statements.
SCHEDULE I - CONDENSED FINANCIAL INFORMATION
AgroFresh Solutions, Inc.
Parent Company Information
Condensed Statements of Operations and Comprehensive (Loss) Income (Loss)
(In thousands)
|
| | | | | | | | | |
| (in thousands) | Year Ended December 31,
2017 | Year Ended December 31,
2016 | August 1, 2015
Through December
31, 2015 |
| Net sales | $ | — |
| $ | — |
| $ | — |
|
| Selling, general and administrative expenses | 27 |
| 27 |
| 2,256 |
|
| Income (loss) in earnings of subsidiaries | 10,005 |
| (93,132 | ) | (30,598 | ) |
| Income (loss) before taxes | 9,978 |
| (93,159 | ) | (32,854 | ) |
| (Benefit) provision for income taxes | (13,584 | ) | 18,401 |
| (18,417 | ) |
| Net income (loss) | $ | 23,562 |
| $ | (111,560 | ) | $ | (14,437 | ) |
| | | | | | | | | | | |
| Year Ended December 31,
2019 | Year Ended December 31,
2018 | Year Ended December 31,
2017 |
| Net sales | $ | — | | $ | — | | $ | — | |
| Selling, general and administrative expenses | — | | — | | 27 | |
| (Loss) Income in earnings of subsidiaries | (72,242) | | (33,219) | | 10,005 | |
| (Loss) Income before taxes | (72,242) | | (33,219) | | 9,978 | |
| (Benefit) provision for income taxes | (10,732) | | (2,979) | | (13,584) | |
| Net (loss) Income | $ | (61,510) | | $ | (30,240) | | $ | 23,562 | |
See accompanying notes to condensed financial statements.
SCHEDULE I - CONDENSED FINANCIAL INFORMATION
AgroFresh Solutions, Inc.
Parent Company Information
Condensed Statements of Cash Flows
(In thousands)
| | | | | | | | Year Ended December 31,
2019 | Year Ended December 31,
2018 | Year Ended December 31,
2017 |
| (in thousands) | Year Ended December 31,
2017 | Year Ended December 31,
2016 | |
| Cash flows from operating activities: | | |
| Cash flows from operating activities: | | | |
| Net cash provided by operating activities | 10,000 |
| 1,818 |
| Net cash provided by operating activities | 16,003 | | 10,000 | | 10,000 | |
| | | |
| Cash flows from investing activities: | | Cash flows from investing activities: | |
| Net cash provided by (used in) investing activities | — |
| — |
| |
| Net cash provided by investing activities | | Net cash provided by investing activities | — | | — | | — | |
| | | |
| Cash flows from financing activities: | | |
| Cash flows from financing activities: | | | |
| Repurchase of stock for treasury | — |
| (1,487 | ) | |
| Payment of withholding taxes on stock-based compensation | — |
| (331 | ) | |
| | Payment of Dow liabilities settlement | (10,000 | ) | — |
| Payment of Dow liabilities settlement | (16,003) | | (10,000) | | (10,000) | |
| Net cash (used in) by financing activities | (10,000 | ) | (1,818 | ) | |
| Net cash used in financing activities | | Net cash used in financing activities | (16,003) | | (10,000) | | (10,000) | |
| | | |
| Net increase (decrease) in cash and equivalents during the period | — |
| — |
| Net increase (decrease) in cash and equivalents during the period | — | | — | | — | |
| Cash and cash equivalents, beginning of period | — |
| — |
| Cash and cash equivalents, beginning of period | — | | — | | — | |
| Cash and cash equivalents, end of period | $ | — |
| $ | — |
| Cash and cash equivalents, end of period | $ | — | | $ | — | | $ | — | |
See accompanying notes to condensed financial statements.statements
SCHEDULE I - CONDENSED FINANCIAL INFORMATION
AgroFresh Solutions, Inc.
Parent Company Information
Notes to Condensed Financial Statements
1. Basis of Presentation
AgroFresh Solutions, Inc. (the “Parent Company”), formerly known as Boulevard Acquisition Corp., was formed to effect the acquisition of the AgroFresh business from Dow, resulting in AgroFresh Inc. becoming a wholly-owned, indirect subsidiary. The Parent Company had no material activities prior to the acquisition of AgroFresh Inc. on July 31, 2015.
The accompanying Condensed Financial Statements include the accounts of the Parent Company and, on an equity basis, its direct and indirect subsidiaries and affiliates. Accordingly, these condensed financial statements have been presented on a “parent-only” basis. Under a parent-only presentation, the Parent Company’s investments in subsidiaries are presented under the equity method of accounting. These parent-only financial statements should be read in conjunction with the consolidated and combined financial statements of AgroFresh Solutions, Inc.
The condensed parent-only financial statementstatements have been prepared in accordance with Rule 12-04, Schedule I of Regulation S-X, as the restricted net assets of the subsidiaries of the Company exceed 25% of the consolidated net assets of the Company.
2. Commitments and Contingencies
As discussed in Note 1011 to the consolidated and combined financial statements, in connection with the consummation of the Business Combination, AgroFresh Inc. as the borrower and its parent, AF Solutions Holdings LLC, a wholly-owned subsidiary of the Parent Company, as the guarantor, entered into the Credit Facility with Bank of Montreal. The Credit Facility consists of a $425.0 million Term Loan and a $25.0 million Revolving Loan. The Revolving Loan includes a $10.0 million letter-of-credit sub-facility, issuances against which reduce the available capacity for borrowing. The obligations under the Credit Facility are secured by liens on substantially all of the assets of (a) AgroFresh Inc. and its direct wholly-owned domestic subsidiaries and (b) AF Solutions Holdings LLC, including the common stock of AgroFresh Inc.
The Term Loan has a scheduled maturity date of July 31, 2021, and the Revolving Loan hashad a scheduled maturity date of July 31, 2019. On January 31, 2019, the Credit Facility was amended to decrease the total availability from $25.0 million to $12.5 million and extend the maturity of the Revolving Loan from July 31, 2019 to December 31, 2020. An existing covenant in the credit agreement was also amended to allow the Company to have access to the Revolving Loan. Subsequently, on December 23, 2019, the Revolving Loan was further amended for the maturity to April 1, 2021 and include favorable revisions to the senior secured net leverage ratio covenant. Maturities of long-term debt for the fivetwo years following December 31, 20172019 are $7.9 million in 2018, $5.3 million in 2019, $4.3$4.7 million in 2020, $401.6and $402.0 million in 2021, and $0.0 million in 2022.2021.
The Credit Facility imposes an overall cap on the total amount of dividends the Parent Company can pay, together with the total amount of shares and warrants the Parent Company can repurchase, of $12.0 million per fiscal year, and imposes certain other conditions on the Parent Company’s ability to pay dividends.
3. Dividends
The ability of the Parent Company’s operating subsidiaries to pay dividends may be restricted due to the terms of the subsidiaries’ financing arrangements (see Note 1011 to the consolidated and combined financial statements).
SCHEDULE II - CONSOLIDATED VALUATION AND QUALIFYING ACCOUNTS
Allowance for Doubtful Accounts
| | | | | | | | | | | | | | |
| (amounts in thousands) | Balance at Beginning of Period | Charged to Expense | Deductions | Balance at End of Period |
| | | | |
| Year Ended December 31, 2019 | 2,336 | 63 | (167) | 2,232 |
| Year Ended December 31, 2018 | 1,550 | 1,208 | (422) | 2,336 |
|
| | | | | | | | | | | | |
| (amounts in thousands) | Balance at Beginning of Period | Charged to Expense | Deductions | Balance at End of Period |
| Successor | |
| |
| |
| |
|
| Year Ended December 31, 2017 | $ | 1,242 |
| $ | 1,395 |
| $ | (1,087 | ) | $ | 1,550 |
|
| Year Ended December 31, 2016 | $ | 190 |
| $ | 1,159 |
| $ | (107 | ) | $ | 1,242 |
|
| August 1, 2015 to December 31, 2015 | $ | — |
| $ | 190 |
| $ | — |
| $ | 190 |
|
| Predecessor | |
| |
| |
| |
|
| January 1, 2015 to July 31, 2015 | $ | 1,678 |
| $ | (602 | ) | $ | — |
| $ | 1,076 |
|
INDEX TO EXHIBITS
| | | Exhibit No. | | Description | Exhibit No. | 10 | Description |
| (1) | Form of Underwriting Agreement. | |
| (18) | Stock Purchase Agreement, dated as of April 30, 2015, by and between Boulevard Acquisition Corp. and The Dow Chemical Company. | | (13) | | Stock Purchase Agreement, dated as of April 30, 2015, by and between Boulevard Acquisition Corp. and The Dow Chemical Company. |
| (2) | Second Amended and Restated Certificate of Incorporation, filed with the Secretary of State of the State of Delaware on July 31, 2015. | | (2) | | Second Amended and Restated Certificate of Incorporation, filed with the Secretary of State of the State of Delaware on July 31, 2015. |
| (2) | Series A Certificate of Designation. | | (2) | | Series A Certificate of Designation. |
| (3) | Amended and Restated Bylaws. | | (3) | | Amended and Restated Bylaws. |
| (4) | Amendment to the Amended and Restated Bylaws of AgroFresh Solutions, Inc., effective as of September 3, 2015. | | (4) | | Amendment to the Amended and Restated Bylaws of AgroFresh Solutions, Inc., effective as of September 3, 2015. |
| (21) | Certificate of Amendment to the Second Amended and Restated Certificate of Incorporation | | (16) | | Certificate of Amendment to the Second Amended and Restated Certificate of Incorporation |
| (2) | Specimen Common Stock Certificate. | | (2) | | Specimen Common Stock Certificate. |
| (2) | Specimen Warrant Certificate. | | (2) | | Specimen Warrant Certificate. |
| (5) | Warrant Agreement, dated as of February 12, 2014, by and between AgroFresh Solutions, Inc. and Continental Stock Transfer & Trust Company. | | (5) | | Warrant Agreement, dated as of February 12, 2014, by and between AgroFresh Solutions, Inc. and Continental Stock Transfer & Trust Company. |
| (5) | Letter Agreement, dated February 12, 2014, among AgroFresh Solutions, Inc., Boulevard Acquisition Sponsor, LLC and Avenue Capital Management II, L.P. | |
| (5) | Letter Agreement, dated February 12, 2014, among AgroFresh Solutions, Inc., Boulevard Acquisition Sponsor, LLC and Robert J. Campbell. | |
| (5) | Letter Agreement, dated February 12, 2014, among AgroFresh Solutions, Inc., Boulevard Acquisition Sponsor, LLC and Joel Citron. | |
| (5) | Letter Agreement, dated February 12, 2014, among AgroFresh Solutions, Inc., Boulevard Acquisition Sponsor, LLC and Darren Thompson. | |
| | | * | | Description of securities. |
| | | (6) | | Form of Indemnification Agreement. |
| (6) | Form of Indemnification Agreement. | | (5) | | Securities Escrow Agreement, dated February 12, 2014, among AgroFresh Solutions, Inc., Boulevard Acquisition Sponsor, LLC, the Initial Holders party thereto and Continental Stock Transfer & Trust Company. |
| (5) | Securities Escrow Agreement, dated February 12, 2014, among AgroFresh Solutions, Inc. , Boulevard Acquisition Sponsor, LLC, the Initial Holders party thereto and Continental Stock Transfer & Trust Company. | | (2) | | Credit Agreement, dated July 31, 2015, by and among AgroFresh Inc., as the borrower and AF Solutions Holdings LLC, acting as guarantor, Bank of Montreal, as administrative agent, BMO Capital Markets Corp., Credit Suisse Securities (USA) LLC, and Sumitomo Mitsui Banking Corporation (“Sumitomo”) as joint lead arrangers and joint bookrunners, BMO Capital Markets Corp. and Credit Suisse, as joint physical bookrunners. Credit Suisse as syndication agent, Sumitomo as documentation agent, and the lenders party thereto. |
| (2) | Credit Agreement, dated July 31, 2015, by and among AgroFresh Inc., as the borrower and AF Solutions Holdings LLC, acting as guarantor, Bank of Montreal, as administrative agent, BMO Capital Markets Corp., Credit Suisse Securities (USA) LLC, and Sumitomo Mitsui Banking Corporation (“Sumitomo”) as joint lead arrangers and joint bookrunners, BMO Capital Markets Corp. and Credit Suisse, as joint physical bookrunners. Credit Suisse as syndication agent, Sumitomo as documentation agent, and the lenders party thereto. | | (7) | | Amendment No. 1 to Credit Agreement, dated as of November 18, 2015. |
| (7) | Amendment No. 1 to Credit Agreement, dated as of November 18, 2015. | | (2) | | Investor Rights Agreement, dated July 31, 2015, by and among AgroFresh Solutions, Inc., The Dow Chemical Company, Rohm and Haas Company, Boulevard Acquisition Sponsor, LLC, Robert J. Campbell, Joel Citron and Darren Thompson. |
| (2) | Investor Rights Agreement, dated July 31, 2015, by and among AgroFresh Solutions, Inc., The Dow Chemical Company, Rohm and Haas Company, Boulevard Acquisition Sponsor, LLC, Robert J. Campbell, Joel Citron and Darren Thompson. | |
| | | (2) | | Tax Receivables Agreement, dated July 31, 2015, by and among AgroFresh Solutions, Inc., AgroFresh Inc., The Dow Chemical Company and Rohm and Haas Company. |
| (2) | Tax Receivables Agreement, dated July 31, 2015, by and among AgroFresh Solutions, Inc., AgroFresh Inc., The Dow Chemical Company and Rohm and Haas Company. | | (9) | | AgroFresh Solutions, Inc. Incentive Compensation Plan. |
| (2) | Transition Services Agreement, dated July 31, 2015, by and between AgroFresh Inc. and The Dow Chemical Company. | | (11) | | Employment Agreement, dated July 14, 2016, between AgroFresh Solutions, Inc. and Jordi Ferre. |
| (2) | Warrant Purchase Agreement, dated July 31, 2015, by and among The Dow Chemical Company, Rohm and Haas Company, AgroFresh Solutions, Inc. and Boulevard Acquisition Sponsor, LLC. | | (12) | | Services Agreement, dated November 29, 2016, among AgroFresh Solutions, Inc., RipeLocker LLC and George Lobisser. |
| (8) | Letter Agreement, dated as of December 17, 2015, among AgroFresh Solutions, Inc., The Dow Chemical Company, Rohm and Haas Company and Boulevard Acquisition Sponsor, LLC regarding Warrant Purchase Agreement. | | (14) | | Form of Stock Option Agreement used in connection with the AgroFresh Solutions, Inc. 2015 Incentive Compensation Plan |
| (9) | AgroFresh Solutions, Inc. Incentive Compensation Plan. | | (14) | | Form of Restricted Stock Agreement used in connection with the AgroFresh Solutions, Inc. 2015 Incentive Compensation Plan |
| (10) | Employment Agreement, dated August 19, 2015, between AgroFresh Solutions, Inc. and Margaret M. (Margo) Loebl. | | (15) | | Agreement dated April 4, 2017, among the registrant, The Dow Chemical Company, Rohm and Haas |
| (10) | Employment Agreement, dated August 25, 2015, between AgroFresh Solutions, Inc. and Thomas Macphee. | | (15) | | First Amendment to Tax Receivables Agreement, dated April 4, 2017, among the registrant, The Dow Chemical Company, Rohm and Haas Company and AgroFresh Inc. |
| (12) | Separation Agreement and Release between AgroFresh Solutions, Inc. and Thomas Macphee. | | (15) | | Letter Agreement, dated April 4, 2017, between the registrant and The Dow Chemical Company. |
| (12) | Separation Agreement and Release between AgroFresh Solutions, Inc. and Stan Howell. | | (15) | | Letter Agreement, dated April 4, 2017, among the registrant, The Dow Chemical Company, Rohm and Haas Company and Boulevard Acquisition Sponsor, LLC. |
| | | (16) | | First Amendment to 2015 Incentive Compensation Plan |
| | | (1) | | Employment Agreement, dated as of September 15, 2015, between AgroFresh Solutions, Inc. and Thomas Ermi. |
| | | (8) | | Offer Letter, dated August 20, 2018 between the Company and Graham Miao. |
| | | (17) | | Amendment No. 2 to Credit Agreement, dated as of January 31, 2019. |
| | | (18) | | Termination Agreement, dated December 20, 2019, among the registrant, The Dow Chemical Company, Rohm and Haas Company and AgroFresh Inc. |
| | | | | | | | |
| (19) | | Amendment No. 3 to Credit Agreement dated as of December 23, 2019. |
| (20) | | Change in Control Executive Severance Agreement, dated August 30, 2019, between the Company and Jordi Ferre. |
| (20) | | Change in Control Executive Severance Agreement, dated August 30, 2019, between the Company and Graham Miao. |
| (20) | | Change in Control Executive Severance Agreement, dated August 30, 2019, between the Company and Thomas Ermi. |
| (20) | | Amended and Restated Employment Agreement, dated August 30, 2019. |
| (21) | | Second Amendment to 2015 Incentive Compensation Plan |
| (22) | | 2019 Employee Stock Purchase Plan |
| (10) | | AgroFresh Solutions, Inc. Code of Business Conduct. |
| * | List of subsidiaries. |
| * | Consent of Deloitte & Touche LLP. |
| * | Power of Attorney (included on the signature page to this report). |
| * | Certification of Chief Executive Officer required by Rule 13a-14(a) or Rule 15d-14(a). |
| * | Certification of the Chief Financial Officer required by Rule 13a-14(a) or Rule 15d-14(a). |
| ** | Certification of Chief Executive Officer and Chief Financial Officer required by Rule 13a-14(b) or Rule 15d-14(b) and 18 U.S.C. 1350. |
| 101.INS | * | XBRL Instance Document |
| 101.SCH | * | XBRL Taxonomy Extension Schema |
| 101.CAL | * | XBRL Taxonomy Calculation Linkbase |
| 101.LAB | * | XBRL Taxonomy Label Document |
| 101.PRE | * | XBRL Presentation Linkbase Document |
| 101.DEF | * | XBRL Definition Linkbase Document |
|
| | |
| (13) | Extension Agreement, dated as of May 9, 2016, among AgroFresh Solutions, Inc., The Dow Chemical Company, Rohm and Haas Company, Boulevard Acquisition Sponsor , LLC, Robert J. Campbell, Joel Citron, Darren Thompson and Continental Stock Transfer & Trust Company. |
| (14) | Employment Agreement, dated July 14, 2016, between AgroFresh Solutions, Inc. and Jordi Ferre. |
| (15) | Employment Agreement, dated as of September 23, 2016, between AgroFresh Solutions, Inc. and Katherine Harper. |
| (16) | Separation Agreement and Release between AgroFresh Solutions, Inc. and Margaret M. Loebl. |
| (17) | Services Agreement, dated November 29, 2016, among AgroFresh Solutions, Inc., RipeLocker LLC and George Lobisser. |
| (19) | Form of Stock Option Agreement used in connection with the AgroFresh Solutions, Inc. 2015 Incentive Compensation Plan. |
| (19) | Form of Restricted Stock Agreement used in connection with the AgroFresh Solutions, Inc. 2015 Incentive Compensation Plan. |
| (20) | Agreement dated April 4, 2017, among the registrant, The Dow Chemical Company, Rohm and Haas |
| (20) | First Amendment to Tax Receivables Agreement, dated April 4, 2017, among the registrant, The Dow Chemical Company, Rohm and Haas Company and AgroFresh Inc. |
| (20) | Letter Agreement, dated April 4, 2017, between the registrant and The Dow Chemical Company. |
| (20) | Letter Agreement, dated April 4, 2017, among the registrant, The Dow Chemical Company, Rohm and Haas Company and Boulevard Acquisition Sponsor, LLC. |
| (21) | First Amendment to 2015 Incentive Compensation Plan |
| * | Employment Agreement, dated as of September 15, 2015, between AgroFresh Solutions, Inc. and Thomas Ermi. |
| (11) | AgroFresh Solutions, Inc. Code of Business Conduct. |
| * | List of subsidiaries. |
| * | Consent of Deloitte & Touche LLP. |
| 24.1 | * | Power of Attorney (included on the signature page to this report). |
| * | Certification of Chief Executive Officer required by Rule 13a-14(a) or Rule 15d-14(a). |
| * | Certification of the Chief Financial Officer required by Rule 13a-14(a) or Rule 15d-14(a). |
| ** | Certification of Chief Executive Officer and Chief Financial Officer required by Rule 13a-14(b) or Rule 15d-14(b) and 18 U.S.C. 1350. |
| 101.INS | * | XBRL Instance Document |
| 101.SCH | * | XBRL Taxonomy Extension Schema |
| 101.CAL | * | XBRL Taxonomy Calculation Linkbase |
| 101.LAB | * | XBRL Taxonomy Label Document |
| 101.PRE | * | XBRL Presentation Linkbase Document |
| 101.DEF | * | XBRL Definition Linkbase Document |
———————————————————————————————
| |
(1) | Incorporated by reference to an exhibit to the Company’s Registration Statement on Form S-1 (File No. 333-193320) filed with the Securities and Exchange Commission on January 13, 2014. |
| |
(2) | Incorporated by reference to an exhibit to the Current Report on Form 8-K of the Company filed with the Securities and Exchange Commission on August 6, 2015. |
| |
(3) | Incorporated by reference to Annex A to the Company’s definitive proxy statement (File No. 001-36197) filed with the Securities and Exchange Commission on July 16, 2015. |
* Filed herewith.
** Furnished herewith.
(1) Incorporated by reference to an exhibit to the Annual Report on Form 10-K of the Company filed with the Securities and Exchange Commission on March 22, 2018.
(2) Incorporated by reference to an exhibit to the Current Report on Form 8-K of the Company filed with the Securities and Exchange Commission on August 6, 2015.
(3) Incorporated by reference to Annex A to the Company’s definitive proxy statement (File No. 001-36197) filed with the Securities and Exchange Commission on July 16, 2015.
(4) Incorporated by reference to an exhibit to the Current Report on Form 8-K of the Company filed with the Securities and Exchange Commission on September 10, 2015.
(5) Incorporated by reference to an exhibit to the Current Report on Form 8-K of the Company filed with the Securities and Exchange Commission on February 19, 2014.
(6) Incorporated by reference to an exhibit to Amendment No. 2 to the Company’s Registration Statement on Form S-1 (File No. 333-193320) filed with the Securities and Exchange Commission on February 11, 2014.
(7) Incorporated by reference to an exhibit to the Current Report on Form 8-K of the Company filed with the Securities and Exchange Commission on November 18, 2015.
(8) Incorporated by reference to an exhibit to the Current Report on Form 8-K of the Company filed with the Securities and Exchange Commission on December 23, 2015.August 30, 2018.
(9) Incorporated by reference to Annex C to the Company’s definitive proxy statement (File No. 001-36197) filed with the Securities and Exchange Commission on July 16, 2015.
| |
(10) | Incorporated by reference to an exhibit to the Current Report on Form 8-K of the Company filed with the Securities and Exchange Commission on August 31, 2015. |
| |
(11) | Incorporated by reference to an exhibit to the Current Report on Form 8-K of the Company filed with the Securities and Exchange Commission on August 19, 2015. |
| |
(12) | Incorporated by reference to an exhibit to the Current Report on Form 8-K of the Company filed with the Securities and Exchange Commission on March 16, 2016. |
| |
(13) | Incorporated by reference to an exhibit to the Current Report on Form 8-K of the Company filed with the Securities and Exchange Commission on May 13, 2016. |
| |
(14) | Incorporated by reference to an exhibit to the Current Report on Form 8-K of the Company filed with the Securities and Exchange Commission on July 19, 2016. |
| |
(15) | Incorporated by reference to an exhibit to the Current Report on Form 8-K of the Company filed with the Securities and Exchange Commission on September 30, 2016. |
| |
(16) | Incorporated by reference to an exhibit to the Current Report on Form 8-K of the Company filed with the Securities and Exchange Commission on October 12, 2016. |
| |
(17) | Incorporated by reference to an exhibit to the Current Report on Form 8-K of the Company filed with the Securities and Exchange Commission on December 5, 2016. |
| |
(18) | (10) Incorporated by reference to an exhibit to the Current Report on Form 8-K of the Company filed with the Securities and Exchange Commission on August 19, 2015. (11) Incorporated by reference to an exhibit to the Current Report on Form 8-K of the Company filed with the Securities and Exchange Commission on July 19, 2016. (12) Incorporated by reference to an exhibit to the Current Report on Form 8-K of the Company filed with the Securities and Exchange Commission on December 5, 2016. (13) Incorporated by reference to an exhibit to the Current Report on Form 8-K of the Company filed with the Securities and Exchange Commission on May 4, 2015. Certain of the exhibits and schedules to this Exhibit have been omitted in accordance with Regulation S-K Item 601(b)(2). The Company agrees to furnish supplementally a copy of all omitted exhibits and schedules to the Securities and Exchange Commission upon its request. |
| |
(19) | Incorporated by reference to an exhibit to the Annual Report on Form 10-K of the Company filed with the Securities and Exchange Commission on March 16, 2017. |
| |
(20) | Incorporated by reference to an exhibit to the Current Report on Form 8-K of the Company filed with the Securities and Exchange Commission on April 6, 2017. |
| |
(21) | Incorporated by reference to an exhibit to the Current Report on Form 8-K of the Company filed with the Securities and Exchange Commission on June 7, 2017. |
omitted in accordance with Regulation S-K Item 601(b)(2). The Company agrees to furnish supplementally a copy of all omitted exhibits and schedules to the Securities and Exchange Commission upon its request.
(14) Incorporated by reference to an exhibit to the Annual Report on Form 10-K of the Company filed with the Securities and Exchange Commission on March 16, 2017.
(15) Incorporated by reference to an exhibit to the Current Report on Form 8-K of the Company filed with the Securities and Exchange Commission on April 6, 2017.
(16) Incorporated by reference to an exhibit to the Current Report on Form 8-K of the Company filed with the Securities and Exchange Commission on June 7, 2017.
(17)Incorporated by reference to an exhibit to the Current Report on Form 8-K of the Company filed with the Securities and Exchange Commission on February 1, 2019.
(18)Incorporated by reference to an exhibit to the Current Report on Form 8-K of the Company filed with the Securities and Exchange Commission on December 20, 2019.
(19)Incorporated by reference to an exhibit to the Current Report on Form 8-K of the Company filed with the Securities and Exchange Commission on December 23, 2019.
(20)Incorporated by reference to an exhibit to the Current Report on Form 8-K of the Company filed with the Securities and Exchange Commission on September 6, 2019
(21)Incorporated by reference to Appendix A to the Company’s Definitive Proxy Statement filed with the Securities and Exchange Commission on April 15, 2019.
(22) Incorporated by reference to Appendix B to the Company’s Definitive Proxy Statement filed with the Securities and Exchange Commission on April 15, 2019.
SIGNATURES
Pursuant to the requirements of the Securities Exchange Act of 1934, the Registrant has duly caused this report to be signed on its behalf by the undersigned, thereunto duly authorized.
| | | | | | | | |
| AgroFresh Solutions, Inc. | |
| Date: | March 13, 2020 |
| | |
| AgroFresh Solutions, Inc. |
| Date: | March 22, 2018 |
| | |
| /s/ Jordi Ferre | |
| By: | Jordi Ferre |
| Title: | Chief Executive Officer |
| | |
| /s/ Katherine HarperGraham Miao | |
| By: | Katherine HarperGraham Miao |
| Title: | Chief Financial Officer |
POWER OF ATTORNEY
KNOW ALL PERSONS BY THESE PRESENTS, that each person whose signature appears below constitutes and appoints Jordi Ferre and Katherine Harper,Graham Miao, jointly and severally, his or her attorney—in—fact, each with the full power of substitution, for such person, in any and all capacities, to sign any and all amendments to this Annual Report on Form 10-K, and to file the same, with all exhibits thereto and other documents in connection therewith, with the Securities and Exchange Commission, granting unto said attorney—in—fact and agent full power and authority to do and perform each and every act and thing requisite and necessary to be done in connection therewith, as fully to all intents and purposes as he or she might do or could do in person hereby ratifying and confirming all that each of said attorneys—in—fact and agents, or his substitute, may do or cause to be done by virtue hereof.
Pursuant to the requirements of the Securities Exchange Act of 1934, this report has been signed below by the following persons on behalf of the registrant and in the capacities and on the date indicated.
| | | | | | | | | | | | | | |
| Signature | | Title | | Date |
| | | | |
| /s/ Jordi Ferre | | Chief Executive Officer and Director | | March 13, 2020 |
| Jordi Ferre | | (Principal Executive Officer) | | |
| | | | |
| /s/ Graham Miao | | Executive Vice President and Chief Financial Officer | | March 13, 2020 |
| Graham Miao | | (Principal Financial and Accounting Officer) | | |
| | | | |
| /s/ Nance K. Dicciani | | Chair of the Board | | March 13, 2020 |
| Nance K. Dicciani | | | | |
| | | | |
| /s/ Robert J. Campbell | | Director | | March 13, 2020 |
| Robert J. Campbell | | | | |
| | | | |
| /s/ Gregory M. Freiwald | | Director | | March 13, 2020 |
| Gregory M. Freiwald | | | | |
| | | | |
| /s/ Torsten Kraef | | Director | | March 13, 2020 |
| Torsten Kraef | | | | |
| | | | |
| /s/ Denise L. Devine | | Director | | March 13, 2020 |
| Denise L. Devine | | | | |
| | | | |
| /s/ Macauley Whiting, Jr. | | Director | | March 13, 2020 |
| Macauley Whiting, Jr. | | | | |
| | | | |
Signature | | Title | | Date |
| | | | |
/s/ Jordi Ferre | | Chief Executive Officer and Director | | March 22, 2018 |
Jordi Ferre | | (Principal Executive Officer) | | |
| | | | |
/s/ Katherine Harper | | Executive Vice President and Chief Financial Officer | | March 22, 2018 |
Katherine Harper | | (Principal Financial and Accounting Officer) | | |
| | | | |
/s/ Nance K. Dicciani | | Chair of the Board | | March 22, 2018 |
Nance K. Dicciani | | | | |
| | | | |
/s/ Robert J. Campbell | | Director | | March 22, 2018 |
Robert J. Campbell | | | | |
| | | | |
/s/ Gregory M. Freiwald | | Director | | March 22, 2018 |
Gregory M. Freiwald | | | | |
| | | | |
/s/ Torsten Kraef | | Director | | March 22, 2018 |
Torsten Kraef | | | | |
| | | | |
/s/ Denise L. Devine | | Director | | March 22, 2018 |
Denise L. Devine | | | | |
| | | | |
/s/ Macauley Whiting, Jr. | | Director | | March 22, 2018 |
Macauley Whiting, Jr. | | | | |
| | | | |
| /s/ George Lobisser | | Director | | March 22, 201813, 2020 |
| George Lobisser | | | | |