| | |
UNITED STATES SECURITIES AND EXCHANGE COMMISSION
Washington, D.C. 20549 |
☒ ANNUAL REPORT PURSUANT TO SECTION 13 OR 15(d) OF THE SECURITIES EXCHANGE ACT OF 1934
For the fiscal year ended December 31, 20202023
OR
☐ TRANSITION REPORT PURSUANT TO SECTION 13 OR 15(d) OF THE SECURITIES EXCHANGE ACT OF 1934
For the transition period from to
Commission File Number: 001-36559
Spark Energy,Via Renewables, Inc.
(Exact name of registrant as specified in its charter)
| | | | | | | | | | | | | | |
| Delaware | | | | 46-5453215 |
(State or other jurisdiction of
incorporation or organization) | | | | (I.R.S. Employer
Identification No.) |
| | | | | | | | | | | | | | |
| | 12140 Wickchester Ln, Suite 100 | | (713) 600-2600 |
| | Houston, Texas 77079 | | |
| | (Address and zip code of principal executive offices) | | (Registrant’s12140 Wickchester Ln, Suite 100Houston, Texas 77079
(Address of principal executive offices) (713) 600-2600 (Registrant's telephone number, including area code) |
Securities registered pursuant to Section 12(b) of the Act:
| | | | | | | | | | |
| Title of each class | | Trading Symbols | | Name of exchange on which registered |
| Class A common stock, par value $0.01 per share | | SPKEVIA | | The NASDAQ Global Select Market |
8.75% Series A Fixed-to-Floating Rate Cumulative Redeemable Perpetual Preferred Stock, par value $0.01 per share | | SPKEPVIASP | | The NASDAQ Global Select Market |
Securities registered pursuant to Section 12(g) of the Act: None
Indicate by check mark if the registrant is a well-known seasoned issuer, as defined in Rule 405 of the Securities Act
Yes ☐ No ☒
Indicate by check mark if the registrant is not required to file reports pursuant to Section 13 or 15(d) of the Act.
Yes ☐ No ☒
Indicate by check mark whether the registrant (1) has filed all reports required to be filed by Section 13 or 15(d) of the Securities Exchange Act of 1934 during the preceding 12 months (or for such shorter period that the registrant was required to file such reports), and (2) has been subject to such filing requirements for the past 90 days.
Yes ☒ No ☐
Indicate by check mark whether the registrant has submitted electronically every Interactive Data File required to be submitted pursuant to Rule 405 of Regulation S-T (§232.405 of this chapter) during the preceding 12 months (or for such shorter period that the registrant was required to submit such files).
Yes ☒ No ☐
Indicate by check mark whether the registrant is a large accelerated filer, an accelerated filer, a non-accelerated filer, a smaller reporting company, or an emerging growth company. See the definitions of “large accelerated filer,” “accelerated filer,” “smaller reporting company,” and "emerging growth company" in Rule 12b-2 of the Exchange Act.
Large accelerated filer ☐ Accelerated filer ☒☐
Non-accelerated filer ☐☒ Smaller reporting company ☐
Emerging Growth Company ☐
If an emerging growth company, indicate by check mark if the registrant has elected not to use the extended transition period for complying with any new or revised financial accounting standards provided pursuant to Section 13(a) of the Exchange Act. o
Indicate by check mark whether the registrant has filed a report on and attestation to its management’s assessment of the effectiveness of its internal control over financial reporting under Section 404(b) of the Sarbanes-Oxley Act (15 U.S.C. 7262(b)) by the registered public accounting firm that prepared or issued its audit report. ☒☐
If securities are registered pursuant to Section 12(b) of the Act, indicate by check mark whether the financial statements
of the registrant included in the filing reflect the correction of an error to previously issued financial statements. o
Indicate by check mark whether any of those error corrections are restatements that required a recovery analysis of incentive-based compensation received by any of the registrant’s executive officers during the relevant recovery period pursuant to §240.10D-1(b). o
Indicate by check mark whether the registrant is a shell company (as defined in Rule 12b-2 of the Act).
Yes ☐ No ☒
The aggregate market value of common stock held by non-affiliates of the registrant on June 30, 2020,2023, the last business day of the registrant's most recently completed second fiscal quarter, based on the closing price on that date of $7.07,$6.96, was approximately $84$17 million. The registrant, solely for the purpose of this required presentation, deemed its Board of Directors and Executive Officers to be affiliates, and deducted their stockholdings in determining the aggregate market value.
There were 14,627,2843,232,701 shares of Class A common stock, 20,800,0004,000,000 shares of Class B common stock and 3,567,543 shares of Series A Preferred Stock outstanding as of March 2, 2021.February 27, 2024.
DOCUMENTS INCORPORATED BY REFERENCE
Portions of the registrant's definitive Proxy Statement in connection with the 2021 Annual Meeting of Stockholders are incorporatedCertain information required by reference into Part III of this Annual Report on Form 10-K.10-K will be disclosed in a Form 10-K/A or in a definitive Proxy Statement for an Annual Meeting of Shareholders (the “Proxy Statement”) no later than 120 days after December 31, 2023.
Table of Contents
| | | | | | | | | | | | | | |
| | | | Page No. |
| | PART I | | |
| Items 1 & 2. | | Business and Properties | | |
| Item 1A. | | Risk Factors | | |
| Item 1B. | | Unresolved Staff Comments | | |
| Item 1C. | | Cybersecurity | | |
| Item 3. | | Legal Proceedings | | |
| Item 4. | | Mine Safety Disclosures | | |
| | PART II | | |
| Item 5. | | Market for Registrant’s Common Equity, Related Stockholder Matters and Issuer Purchases of Equity Securities | | |
| | Stock Performance Graph | | |
| Item 6. | | Reserved | | |
| Item 7. | | Management’s Discussion and Analysis of Financial Condition and Results of Operations | | |
| | Overview | | |
| | Drivers of Our Business | | |
| | Non-GAAP Performance Measures | | |
| | Non-GAAP Performance Measures | | |
| | Consolidated Results of Operations | | |
| | Operating Segment Results | | |
| | Liquidity and Capital Resources | | |
| | Cash Flows | | |
| | Summary of Contractual Obligations | | |
| | Off-Balance Sheet Arrangements | | |
| | Related Party Transactions | | |
| | Critical Accounting Policies and Estimates | | |
| | Contingencies | | |
| Item 7A. | | Quantitative and Qualitative Disclosures About Market Risk | | |
| Item 8. | | Financial Statements and Supplementary Data | | |
| | Index to Consolidated Financial Statements | | |
| Item 9. | | Changes in and Disagreements with Accountants on Accounting and Financial Disclosure | | |
| Item 9A. | | Controls and Procedures | | |
| Item 9B. | | Other Information | | |
| Item 9 C. | | Disclosure Regarding Foreign Jurisdictions that Prevent Inspections | | |
| | PART III | | |
| Item 10. | | Directors, Executive Officers and Corporate Governance | | |
| Item 11. | | Executive Compensation | | |
| Item 12. | | Security Ownership of Certain Beneficial Owners and Management and Related Stockholder Matters | | |
| Item 13. | | Certain Relationships and Related Transactions, and Director Independence | | |
| Item 14. | | Principal Accounting Fees and Services | | |
| | PART IV | | |
| Item 15. | | Exhibits, Financial Statement Schedules | | |
| Item 16. | | Form 10-K Summary | | |
| | SIGNATURES | | |
| | | | |
Cautionary Note Regarding Forward Looking Statements
This Annual Report on Form 10-K (this “Annual Report”) contains forward-looking statements that are subject to a number of risks and uncertainties, many of which are beyond our control. These forward-looking statements within the meaning of Section 27A of the Securities Act of 1933, as amended (the “Securities Act”) and Section 21E of the Securities Exchange Act of 1934, as amended (the “Exchange Act”) can be identified by the use of forward-looking terminology including “may,” “should,” “likely,” “will,” “believe,” “expect,” “anticipate,” “estimate,” “continue,” “plan,” “intend,” “project,” or other similar words. Forward-looking statements appear in a number of places in this Annual Report. All statements, other than statements of historical fact included in this Annual Report are forward-looking statements. The forward-looking statements include statements, regarding the impacts of COVID-19 and the 2021 severe weather event, cash flow generation and liquidity, business strategy, prospects for growth and acquisitions, outcomes of legal proceedings, ability to pay and amount of cash dividends and distributions on our Class A Common Stock and Series A Preferred Stock, future operations, financial position, estimated revenues and losses, projected costs, prospects, plans, objectives, and beliefs of management, are forward-looking statements. Forward-looking statements appear in a numberavailability of places in this Annual Report and may include statements about business strategy and prospects for growth, customer acquisition costs, legal proceedings, ability to pay cash dividends, cash flow generation and liquidity, availability of terms of capital, competition and government regulation and general economic conditions. Although we believe that the expectations reflected in such forward-looking statements are reasonable, we cannot give any assurance that such expectations will prove correct.
The forward-looking statements in this Annual Report are subject to risks and uncertainties. Important factors that could cause actual results to materially differ from those projected in the forward-looking statements include, but are not limited to:
•evolving risks, uncertainties and impacts relating to COVID-19, including the geographic spread, the severityultimate impact of the disease,2021 severe weather event, including future benefits or costs related to ERCOT market Securitization efforts, and any corrective action by the scope and durationState of Texas, ERCOT, the COVID-19 outbreak, actions that may be taken by governmental authorities to containRailroad Commission of Texas, or the COVID-19 outbreak or to treat its impact, and the potential for continuing negative impactsPublic Utility Commission of COVID-19 on economies and financial markets;Texas;
•changes in commodity prices;prices, the margins we achieve, and interest rates;
•the sufficiency of risk management and hedging policies and practices;
•the impact of extreme and unpredictable weather conditions, including hurricanes and other natural disasters;
•federal, state and local regulations, including the industry's ability to address or adapt to potentially restrictive new regulations that may be enacted by public utility commissions;
•our ability to borrow funds and access credit markets;
•restrictions and covenants in our debt agreements and collateral requirements;
•credit risk with respect to suppliers and customers;
•our ability to acquire customers and actual attrition rates;
•changes in costs to acquire customers as well as actual attrition rates;customers;
•accuracy of billing systems;
•our ability to successfully identify, complete, and efficiently integrate acquisitions into our operations;
•significant changes in, or new changes by, the independent system operators (“ISOs”) in the regions we operate;
•competition;
•our ability to successfully obtain the requisite shareholder approval of and to consummate the merger and transactions contemplated by the Merger Agreement (as defined below) and other risks related thereto, including but not limited to, the occurrence of any event, change or other circumstances that could give rise to the termination of the Merger Agreement, the failure to satisfy other conditions to completion of the proposed merger, the failure of the proposed merger to close for any other reason, the outcome of any legal proceedings, regulatory proceedings or enforcement matters that may be instituted against us and others relating to the Merger Agreement or otherwise, the amount of the costs, fees, expenses and charges related to the proposed merger, the effect of the announcement of the proposed merger on our relationships with our contractual counterparties, operating results and business generally, the risk that the pendency of the proposed merger disrupts current plans and operations and the potential difficulties in employee retention as a result of the pendency of the proposed merger, risks related to disruption of management’s attention from our ongoing business operations due to the merger and transactions contemplated by the Merger Agreement; and
•the “risk factors” described in "Item 1A— Risk Factors" of this Annual Report.
You should review the risk factors and other factors noted throughout or incorporated by reference in this Annual Report that could cause our actual results to differ materially from those contained in any forward-looking statement. All forward-looking statements speak only as of the date of this Annual Report. Unless required by law, we disclaim any obligation to publicly update or revise these statements whether as a result of new information, future events or otherwise. It is not possible for us to predict all risks, nor can we assess the impact of all factors on the business or the extent to which any factor, or combination of factors, may cause actual results to differ materially from those contained in any forward-looking statements.
Risk Factor Summary
Our business, financial condition, cash flows, results of operations and ability to pay dividends on our Class A common stock and Series A Preferred Stock could be materially and adversely affected by, and the price of our Class A common stock and Series A Preferred Stock could decline due to a number of factors, whether currently known or unknown, including but not limited to those summarized below. You should carefully consider the risk factors summarized below and described in more detail in Item 1A. — Risk Factors, together with the other information contained in this Annual Report.
Risks Related to Our Business and Our Industry
•We are subject to commodity price risk.
•Our financial results may be adversely impacted by weather conditions and changes in consumer demand.
•Our risk management policies and hedging procedures may not mitigate risk as planned, and we may fail to fully or effectively hedge our commodity supply and price risk.
•ESCOs face risks due to increased and rapidly changing regulations and increasing monetary fines by the state regulatory agencies.
•The retail energy business is subject to a high level of federal, state and local regulations, which are subject to change.
•Liability under the TCPA has increased significantly in recent years, and we face risks if we fail to comply.
•We are, and in the future may become, involved in legal and regulatory proceedings and, as a result, may incur substantial costs.
•Our business is dependent on retaining licenses in the markets in which we operate.
•We may be subject to risks in connection with acquisitions, which could cause us to fail to realize many of the anticipated benefits of such acquisitions.
•We have historically distributed a significant portion of our cash through regular quarterly dividends, and our ability to grow and make acquisitions with cash on hand could be limited.
•We may not be able to manage our growth successfully.
•Our financial results fluctuate on a seasonal, quarterly and annual basis.
•We may have difficulty retaining our existing customers or obtaining a sufficient number of new customers, due to competition and for other reasons.
•Increased collateral requirements in connection with our supply activities may restrict our liquidity.
•We face risks related to health epidemics, pandemics and other outbreaks.
•We are subject to direct credit risk for certain customers who may fail to pay their bills as they become due.
•We depend on the accuracy of data in our information management systems, which subjects us to risks.
•Cyberattacks and data security breaches could adversely affect our business.
•Our success depends on key members of our management, the loss of whom could disrupt our business operations.
•We rely on third party vendors for our customer acquisition verification, billing and transactions platform that exposes us to third party performance risk and other risk.
•A large portion of our current customers are concentrated in a limited number of states, making us vulnerable to customer concentration risks.
•Increases in state renewable portfolio standards or an increase in the cost of renewable energy credit and carbon offsets may adversely impact the price, availability and marketability of our products.
•Our access to marketing channels may be contingent upon the viability of our telemarketing and door-to-door agreements with our vendors.
•Our vendors may expose us to risks.
Risks Related to Our Capital Structure and Capital Stock
•Our indebtedness could adversely affect our ability to raise additional capital to fund our operations or pay dividends. It could also expose us to the risk of increased interest rates and limit our ability to react to changes in the economy or our industry as well as impact our cash available for distribution.
•Our ability to pay dividends depends on many factors, including the performance of our business, cash flows, RCE counts and the margins we receive, as well as restrictions under our Senior Credit Facility.
•We are a holding company. Our sole material asset is our equity interest in Spark HoldCo, LLC ("Spark HoldCo") and we are accordingly dependent upon distributions from Spark HoldCo to pay dividends on the Class A common stock and Series A Preferred Stock.
•The Class A common stock and Series A Preferred Stock are subordinated to our existing and future debt obligations.
•Numerous factors may affect the trading price of the Class A common stock and Series A Preferred Stock.
•There may not be an active trading market for the Class A common stock or Series A Preferred Stock, which may in turn reduce the market value and your ability to transfer or sell your shares of Class A common stock or Series A Preferred Stock.
•Mr. Maxwell holds a substantial majority of the voting power of our common stock.
•Holders of Series A Preferred Stock have extremely limited voting rights.
•We have engaged in transactions with our affiliates in the past and expect to do so in the future. The terms of such transactions and the resolution of any conflicts that may arise may not always be in our or our stockholders’ best interests.
•Our amended and restated certificate of incorporation and amended and restated bylaws, as well as Delaware law, contain provisions that could discourage acquisition bids or merger proposals, which may adversely affect the market price of our Class A common stock.
•Our amended and restated certificate of incorporation designates the Court of Chancery of the State of Delaware as the sole and exclusive forum for certain types of actions and proceedings that may be initiated by our stockholders, which could limit our stockholders’ ability to obtain a favorable judicial forum for disputes with us or our directors, officers, employees or agents.
•Future sales of our Class A common stock and Series A Preferred Stock in the public market could reduce the price of the Class A common stock and Series A Preferred Stock, and may dilute your ownership in us.
•We have issued preferred stock and may continue to do so, and the terms of such preferred stock could adversely affect the voting power or value of our Class A common stock.
•Our amended and restated certificate of incorporation limits the fiduciary duties of one of our directors and certain of our affiliates and restricts the remedies available to our stockholders for actions taken by Mr. Maxwell or certain of our affiliates that might otherwise constitute breaches of fiduciary duty.
•The Series A Preferred Stock represent perpetual equity interests in us, and investors should not expect us to redeem the Series A Preferred Stock on the date the Series A Preferred Stock becomes redeemable by us or on any particular date afterwards.
•The Series A Preferred Stock is not rated.
•The Change of Control Conversion Right may make it more difficult for a party to acquire us or discourage a party from acquiring us.
•Changes in the method of determining the Three-Month CME Term SOFR, or the replacement of Three-Month CME Term SOFR with an alternative reference rate, may adversely affect the floating dividend rate of our Series A Preferred Stock.
•A substantial increase in the Three-Month CME Term SOFR Rate or an alternative rate could negatively impact our ability to pay dividends on the Series A Preferred Stock and Class A common stock.
•We may not have sufficient earnings and profits in order for dividends on the Series A Preferred Stock to be treated as dividends for U.S. federal income tax purposes.
•You may be subject to tax if we make or fail to make certain adjustments to the conversion rate of the Series A Preferred Stock even though you do not receive a corresponding cash distribution.
•We are a “controlled company” under NASDAQ Global Select Market rules, and as such we are entitled to an exemption from certain corporate governance standards of the NASDAQ Global Select Market, and you may not have the same protections afforded to shareholders of companies that are subject to all of the NASDAQ Global Market corporate governance requirements.
PART I.
Items 1 & 2. Business and Properties
General
We are an independent retail energy services company founded in 1999 and are organized as a Delaware corporation that provides residential and commercial customers in competitive markets across the United States with an alternative choice for their natural gas and electricity. We purchase our electricity and natural gas supply from a variety of wholesale providers and bill our customers monthly for the delivery of electricity and natural gas based on their consumption at either a fixed or variable price. Electricity and natural gas are then distributed to our customers by local regulated utility companies through their existing infrastructure.
Our business consists of two operating segments:
•Retail Electricity Segment. In this segment, we purchase electricity supply through physical and financial transactions with market counterparties and ISOs and supply electricity to residential and commercial consumers pursuant to fixed-price and variable-price contracts.
•Retail Natural Gas Segment. In this segment, we purchase natural gas supply through physical and financial transactions with market counterparties and supply natural gas to residential and commercial consumers pursuant to fixed-price and variable-price contracts.
Our Operations
As of December 31, 2020,2023, we operated in 100104 utility service territories across 1920 states and the District of Columbia and had approximately 400,000335,000 residential customer equivalents (“RCEs”). An RCE is an industry standard measure of natural gas or electricity usage with each RCE representing annual consumption of 100 MMBtu of natural gas or 10 MWh of electricity. We serve natural gas customers in fifteensixteen states (Arizona, California, Colorado, Connecticut, Florida, Illinois, Indiana, Maryland, Massachusetts, Michigan, Nevada, New Jersey, New York, Ohio, Pennsylvania and Pennsylvania)Virginia) and electricity customers in twelve states (Connecticut, Delaware, Illinois, Maine, Maryland, Massachusetts, New Hampshire, New Jersey, New York, Ohio, Pennsylvania and Texas) and the District of Columbia using seven brands (Electricity Maine, Electricity N.H., Major Energy, Provider Power Mass, Respond Power, Spark Energy, and Verde Energy).
COVID-19 Impact
The outbreak of the novel coronavirus ("COVID-19") is a rapidly developing situation around the globe that has adversely impacted economic activity and conditions worldwide. In response to the COVID-19 pandemic, we deployed a remote working strategy in March 2020 that enables certain of our employees to work from home, provided timely communication to team members, implemented protocols for team members' safety, and initiated strategies for monitoring and responding to local COVID-19 impacts. Our preparedness efforts, coupled with
quick and decisive plan implementation, resulted in minimal impacts to our workforce. Our employees continue to work remotely, but we plan to return to an on-site work strategy once health and safety conditions permit.
Customer Contracts and Product Offerings
Fixed and variable-price contracts
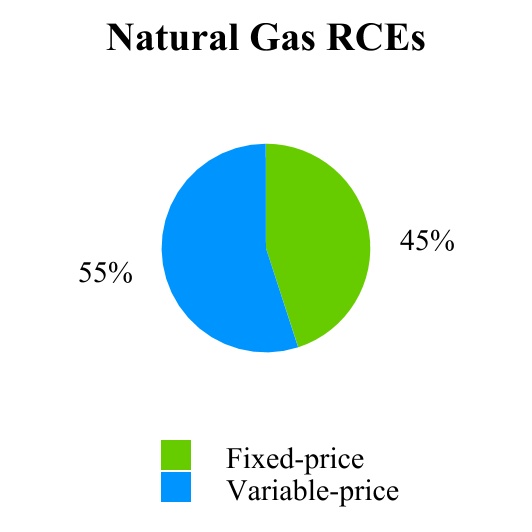
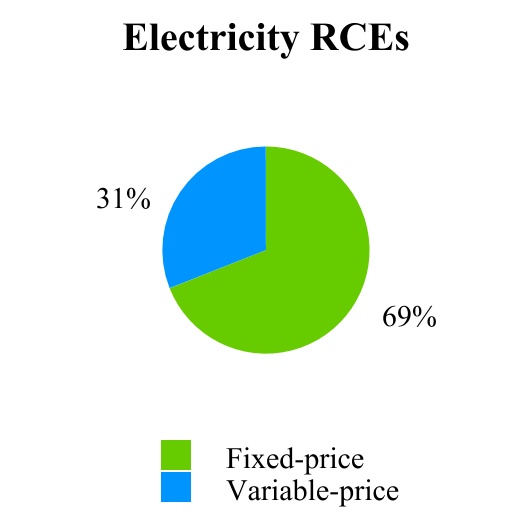
We offer a variety of fixed-price and variable-price service options to our natural gas and electricity customers. Under our fixed-price service options, our customers purchase natural gas and electricity at a fixed price over the life of the customer contract, which provides our customers with protection against increases in natural gas and electricity prices. Our fixed-price contracts typically have a term of one to two years for residential customers and up to threefour years for commercial customers, and most provide for an early termination fee in the event that the
customer terminates service prior to the expiration of the contract term. In a typical market, we offer fixed-price electricity plans for 6, 12 and 24 months and fixed-price natural gas plans from 12 to 24 months, which may or may not provide for a monthly service fee and/or a termination fee, depending on the market and customer type. Our variable-price service options carry a month-to-month term and are priced based on our forecasts of underlying commodity prices and other market and business factors, including the competitive landscape in the market and the regulatory environment, and may also include a monthly service fee depending on the market and customer type. Our variable plans may or may not provide for a termination fee, depending on the market and customer type.
The fixed/variable splits of our RCEs were as follows as of December 31, 2020:2023:
Green products and renewable energy credits
The reduction of carbon emission has become a major focus around the world. We offer renewable and carbon neutral (“green”) products in certainseveral markets. Green energy products are a growing market opportunity and typically provide increased unit margins as a result of improved customer satisfaction and less competition.satisfaction. Renewable electricity products allow customers to choose electricity sourced from wind, solar, hydroelectric and biofuel sources, through the purchase of renewable energy credits (“RECs”). A REC is a market-based instrument that represents the realized renewable attributes of renewable-based power generation. When we procure RECs on behalf of our customers, we are claiming their share of renewable generation that was delivered to the electric grid, directly supporting renewable generators.
Carbon neutral natural gas products give customers the option to reduce or eliminate the carbon footprint associated with their energy usage through the purchase of carbon offset credits. These products typically provide for fixed or variable prices and generally follow the same terms as our other products with the added benefit of carbon reduction and reduced environmental impact.
We currently offerutilize RECs to offset customer volumes related to customers enrolled in renewable electricity in all of our electricity markets and carbon neutral natural gas in several of our gas markets.energy plans. As of December 31, 2020,2023, approximately 36%25% of our customers utilized green products. Also, as a key element of our corporate rebranding and our commitment to sustainability, we began offsetting 100% of customer volume beginning in the second quarter of 2021, by procuring RECs on behalf of our customers.
In addition to the RECs we purchase to satisfy our voluntary requirements under the terms of our green contracts with our customers and to support our corporate sustainability initiatives, we must also purchase a specified number of RECs based on the amount of electricity we sell in a state in a year pursuant to individual state renewable portfolio standards. We forecast the price for the required RECs at the end of each month and incorporate this cost component into our customer pricing models.
Customer Acquisition and Retention
Our customer acquisition strategy consists of customer growth obtained through traditional sales channels complemented by customer portfolio and business acquisitions. We make decisions on how best to deploy capital based on a variety of factors, including cost to acquire customers, availability of opportunities and our view of commodity pricing in particular regions.
We strive to maintain a disciplined approach to recovery of our customer acquisition costs within a 12-month period. We capitalize and amortize our customer acquisition costs over a one to two-year period, which is based on our estimate of the expected average length of a customer relationship. We factor in the recovery of customer
acquisition costs in determining which markets we enter and the pricing of our products in those markets. Accordingly, our results are significantly influenced by our customer acquisition costs.
As a result of the COVID-19 pandemic, certain public utility commissions, regulatory agencies, and other governmental authorities in all of our markets havehad issued orders that impactimpacted the way we have historically acquired customers, such as door to door marketing. Our reduced marketing resulted in significantly reduced customer acquisition costs during 20202021 compared to historical amounts. As long as these orders areexpired in effect and marketing is reduced, we expect to incur reduced customer acquisition costs related to these channels in future periods. However, we may incur increased costs through other manners of marketing, such as online marketing. We also expect2022, our customer acquisition costs with respect to door to door marketing to return to historic levels once door to door marketing restriction orders are lifted.increased during 2022 and 2023. We are unable to predict our future customer acquisition costs at this time. Please see “Item 1A—Risk Factors” in this “Annual Report.”
We are currently focused on growing through organic sales channels; however, we continue to evaluate opportunities to acquire customers through acquisitions and pursue such acquisitions when it makes sense economically or strategically.
Organic Growth
We use organic sales strategies to both maintain and grow our customer base by offering products providing options for term flexibility, price certainty, variable rates and/or green product offerings. We manage growth on a market-by-market basis by developing price curves in each of the markets we serve and create product offerings in which our targeted customer segments find value. The attractiveness of a product from a consumer’s standpoint is based on a variety of factors, including overall pricing, price stability, contract term, sources of generation and environmental impact and whether or not the contract provides for termination and other fees. Product pricing is also based on several other factors, including the cost to acquire customers in the market, the competitive landscape and supply issues that may affect pricing.
Once a product has been created for a particular market, we then develop a marketing campaign. We identify and acquire customers through a variety of sales channels, including our inbound customer care call center, outbound calling, online marketing, opt-in web-based leads, email, direct mail, door-to-door sales, affinity programs, direct sales, brokers and consultants. For residential customers, we have historically used indirect sales brokers, web based solicitation, door-to-door sales, outbound calling, and other methods. For 2020,2023, the largest channels were outbounddirect sales, telemarketing and web-based sales. We typically use brokers or direct marketing to obtain C&I customers, which are typically larger and have greater natural gas and electricity requirements. At December 31, 2020,2023, our customer base was 73%68% residential and 27%32% C&I customers. In our sales practices, we typically employ multiple vendors under short-term contracts and have not entered into any exclusive marketing arrangements with sales vendors. Our marketing team continuously evaluates the effectiveness of each customer acquisition channel and makes adjustments in order to achieve targeted growth and manage customer acquisition costs. We strive to maintain a disciplined approach to recovery of our customer acquisition costs within defined periods.
Acquisitions
We actively monitor acquisition opportunities that may arise in the domestic acquisition market, and seek to acquire both portfolios of customers and broker book acquisitions, as well as retail energy companies utilizing some combination of cash and borrowings under our senior secured borrowing base credit facility ("Senior Credit Facility), the issuance of common or preferred stock, or other financing arrangements. Historically, our customer acquisition strategy has been executed using both third parties and through affiliated relationships. See “—Relationship with our Founder, Majority Shareholder and Majority Shareholder”Chief Executive Officer” for a discussion of affiliate relationships.
The following table provides a summary of our acquisitions over the past five years:
| | | | | | | | | | | | | | |
| Company / Portfolio | Date Completed | RCEs | Segment | Acquisition Source |
|
| | | | |
| | | | |
| | | | |
| | | | |
| Provider Companies (1)
| August 2016 | 121,000 | Electricity | Third Party
| Major Energy Companies (2)
| August 2016 | 220,000 | Natural Gas
Electricity | Affiliate
| Perigee Energy, LLC | April 2017 | 17,000 | Natural Gas
Electricity | Affiliate
| Verde Companies (3)
| July 2017 | 145,000 | Electricity | Third Party
| Customer Portfolio | October 2017 | 44,000 | Electricity | Third Party
| HIKO Energy, LLC | March 2018 | 29,000 | Natural Gas
Electricity | Third Party
| Customer Portfolio | December 2018 | 35,000 | Natural Gas
Electricity | Affiliate
| Customer Portfolio | May 2019 | 60,000 | Natural Gas
Electricity | Third Party |
| Customer Portfolio | May 2021 | 45,000 | Electricity | Third Party |
| Customer Portfolio | July 2021 | 33,000 | Natural Gas | Third Party |
Customer Portfolio (1) | January 2022 | 69,000 | Natural Gas
Electricity | Third Party |
| Customer Portfolio | August 2022 | 18,700 | Natural Gas | Third Party |
(1) Included Electricity Maine, LLC, Electricity N.H., LLC, Provider Power Mass, LLC (collectively, the “Provider Companies”).
(2) Included Major Energy Services, LLC, Major Energy Electric Services, LLC,These RCEs are related to broker contracts we acquired as part of asset purchase agreements and Respond Power, LLC (collectively, the “Major Energy Companies”).
(3) Included Verde Energy USA, Inc.; Verde Energy USA Commodities, LLC; Verde Energy USA Connecticut, LLC; Verde Energy USA DC, LLC; Verde Energy USA Illinois, LLC; Verde Energy USA Maryland, LLC; Verde Energy USA Massachusetts, LLC; Verde Energy USA New Jersey, LLC; Verde Energy USA New York, LLC; Verde Energy USA Ohio, LLC; Verde Energy USA Pennsylvania, LLC; Verde Energy USA Texas Holdings, LLC; Verde Energy USA Trading, LLC; and Verde Energy Solutions, LLC (collectively, the “Verde Companies”).are not included in our Retail RCEs.
Please see Note 4 "Acquisitions" in the notes to our consolidated financial statements for a more detailed description of these acquisitions, including the purchase price, the source of funds and financing arrangements with our Founder and/or National Gas and Electric (“NG&E”). Please see “Item 1A — Risk Factors” in this Annual Report for a discussion of risks related to our acquisition strategy and ability to finance such transactions.
Retaining customers and maximizing customer lifetime value
Following the acquisition of a customer, we devote significant attention to customer retention. We have developed a disciplined renewal communication process, which is designed to effectively reach our customers prior to the end of the contract term, and employ a team dedicated to managing this renewal communications process. Customers are contacted in each utility prior to the expiration of the customer's contract. We may contact the customer through additional channels such as outbound calls or email. We also apply a proprietary evaluation and segmentation process to optimize value to both us and the customer. We analyze historical usage, attrition rates and consumer behaviors to specifically tailor competitive products that aim to maximize the total expected return from energy sales to a specific customer, which we refer to as customer lifetime value.
We actively monitor unit margins from energy sales. We use this information to assess the results of products and to guide business decisions, including whether to engage in pro-active non-renewal of lower margin customers.
Commodity Supply
We hedge and procure our energy requirements from various wholesale energy markets, including both physical and financial markets, through short- and long-term contracts. Our in-house energy supply team is responsible for managing our commodity positions (including energy procurement, capacity, transmission, renewable energy, and resource adequacy requirements) within our risk management policies. We procure our natural gas and electricity requirements at various trading hubs, city-gates and load zones. When we procure commodities at trading hubs, we are responsible for delivery to the applicable local regulated utility for distribution.
In most markets, we hedge our electricity exposure with financial products and then purchase the physical power directly from the ISO for delivery. Alternatively, we may use physical products to hedge our electricity exposure
rather than buying physical electricity in the day-ahead market from the ISO. During the year ended December 31, 2020,2023, we transacted physical and financial settlements of electricity with approximately 11ten suppliers.
We are assessed monthly for ancillary charges such as reserves and capacity in the electricity sector by the ISOs. For example, the ISOs will charge all retail electricity providers for monthly reserves that the ISO determines are necessary to protect the integrity of the grid. Many of the utilities we serve also allocate natural gas transportation and storage assets to us as a part of their competitive choice program. We are required to fill our allocated storage capacity with natural gas, which creates commodity supply and price risk. Sometimes we cannot hedge the volumes associated with these assets because they are too small compared to the much larger bulk transaction volumes required for trades in the wholesale market or it is not economically feasible to do so.
We periodically adjust our portfolio of purchase/sale contracts in the wholesale natural gas market based upon analysis of our forecasted load requirements. Natural gas is then delivered to the local regulated utility city-gate or other specified delivery point where the local regulated utility takes control of the natural gas and delivers it to individual customer locations. Additionally, we hedge our natural gas price exposure with financial products. During the year ended December 31, 2020,2023, we transacted physical and financial settlements of natural gas with approximately 6381 wholesale counterparties.
We also enter into back-to-back wholesale transactions to optimize our credit lines with third-party energy suppliers. With each of our third-party energy suppliers, we have certain contracted credit lines, which allow us to purchase energy supply from these counterparties. If we desire to purchase supply beyond these credit limits, we are required to post collateral in the form of either cash or letters of credit. As we begin to approach the limits of our credit line with one supplier, we may purchase energy supply from another supplier and sell that supply to the original counterparty in order to reduce our net position with that counterparty and open up additional credit to procure supply in the future. Our sales of gas pursuant to these activities also enable us to optimize our credit lines with third-party energy suppliers by decreasing our net buy position with those suppliers.
Asset Optimization
Part of our business includes asset optimization activities in which we identify opportunities in the wholesale natural gas markets in conjunction with our retail procurement and hedging activities. Many of the competitive pipeline choice programs in which we participate require us and other retail energy suppliers to take assignment of and manage natural gas transportation and storage assets upstream of their respective city-gate delivery points. In our allocated storage assets, we are obligated to buy and inject gas in the summer season (April through October) and sell and withdraw gas during the winter season (November through March). These injection and purchase obligations require us to take a seasonal long position in natural gas. Our asset optimization group determines whether market conditions justify hedging these long positions through additional derivative transactions. We also contract with third parties for transportation and storage capacity in the wholesale market and are responsible for reservation and demand charges attributable to both our allocated and third-party contracted transportation and storage assets. Our asset optimization group utilizes these allocated and third-party transportation and storage assets in a variety of ways to either improve profitability or optimize supply-side counterparty credit lines.
We frequently enter into spot market transactions in which we purchase and sell natural gas at the same point or we purchase natural gas at one location and ship it using our pipeline capacity for sale at another location, if we are able to capture a margin. We view these spot market transactions as low risk because we enter into the buy and sell transactions on a back-to-back basis. We also act as an intermediary for market participants who need assistance with short-term procurement requirements. Consumers and suppliers contact us with a need for a certain quantity of natural gas to be bought or sold at a specific location. When this occurs, we are able to use our contacts in the wholesale market to source the requested supply and capture a margin in these transactions.
Our risk policies require that optimization activities be limited to back-to-back purchase and sale transactions, or open positions subject to aggregate net open position limits, which are not held for a period longer than two months. Furthermore, all additional capacity procured outside of a utility allocation of retail assets must be approved by a
risk committee. Hedges of our firm transportation obligations are limited to two years or less and hedging of interruptible capacity is prohibited.
Risk Management
We operate under a set of corporate risk policies and procedures relating to the purchase and sale of electricity and natural gas, general risk management and credit and collections functions. Our in-house energy supply team is responsible for managing our commodity positions (including energy, capacity, transmission, renewable energy, and resource adequacy requirements) within our risk management policies. We attempt to increase the predictability of cash flows by following our hedging strategies.
Our risk committee has control and authority over all of our risk management activities. The risk committee establishes and oversees the execution of our credit risk management policy and our commodity risk policy. The risk management policies are reviewed at least annually by the risk management committee and such committee typically meets quarterly to assure that we have followed these policies. The risk committee also seeks to ensure the application of our risk management policies to new products that we may offer. The risk committee is comprised of our Chief Executive Officer and our Chief Financial Officer, who meet on a regular basis to review the status of the risk management activities and positions. Our risk team reports directly to our Chief Financial Officer and their compensation is unrelated to trading activity. Commodity positions are typically reviewed and updated daily based on information from our customer databases and pricing information sources. The risk policy sets volumetric limits on intra-day and end of day long and short positions in natural gas and electricity. With respect to specific hedges, we have established and approved a formal delegation of authority policy specifying each trader's authorized volumetric limits based on instrument type, lead time (time to trade flow), fixed price volume, index price volume and tenor (trade flow) for individual transactions. The risk team reports to the risk committee any hedging transactions that exceed these delegated transaction limits. The various risks we face in our risk management activities are discussed below.
Commodity Price and Volumetric Risk
Because our contracts require that we deliver full natural gas or electricity requirements to our customers and because our customers’ usage can be impacted by factors such as weather, we may periodically purchase more or less commodity than our aggregate customer volumetric needs. In buying or selling excess volumes, we may be exposed to commodity price volatility. In order to address the potential volumetric variability of our monthly deliveries for fixed-price customers, we implement various hedging strategies to attempt to mitigate our exposure.
Our commodity risk management strategy is designed to hedge substantially all of our forecasted volumes on our fixed-price customer contracts, as well as a portion of the near-term volumes on our variable-price customer contracts. We use both physical and financial products to hedge our fixed-price exposure. The efficacy of our risk management program may be adversely impacted by unanticipated events and costs that we are not able to effectively hedge, including abnormal customer attrition and consumption, certain variable costs associated with electricity grid reliability, pricing differences in the local markets for local delivery of commodities, unanticipated events that impact supply and demand, such as extreme weather, and abrupt changes in the markets for, or availability or cost of, financial instruments that help to hedge commodity price.
Variability in customer demand is primarily impacted by weather. We use utility-provided historical and/or forward projected customer volumes as a basis for our forecasted volumes and mitigate the risk of seasonal volume fluctuation for some customers by purchasing excess fixed-price hedges within our volumetric tolerances. Should seasonal demand exceed our weather-normalized projections, we may experience a negative impact on our financial results.
From time to time, we also take further measures to reduce price risk and optimize our returns by: (i) maximizing the use of natural gas storage in our daily balancing market areas in order to give us the flexibility to offset volumetric variability arising from changes in winter demand; (ii) entering into daily swing contracts in our daily
balancing markets over the winter months to enable us to increase or decrease daily volumes if demand increases or decreases; and (iii) purchasing out-of-the-money call options for contract periods with the highest seasonal volumetric risk to protect against steeply rising prices if our customer demands exceed our forecast. Being geographically diversified in our delivery areas also permits us, from time to time, to employ assets not being used in one area to other areas, thereby mitigating potential increased costs for natural gas that we otherwise may have had to acquire at higher prices to meet increased demand.
We utilize New York Mercantile Exchange (“NYMEX”) settled financial instruments to offset price risk associated with volume commitments under fixed-price contracts. The valuation for these financial instruments is calculated daily based on the NYMEX Exchange published closing price, and they are settled using the NYMEX Exchange’s published settlement price at their maturity.
Basis Risk
We are exposed to basis risk in our operations when the commodities we hedge are sold at different delivery points from the exposure we are seeking to hedge. For example, if we hedge our natural gas commodity price with Chicago basis but physical supply must be delivered to the individual delivery points of specific utility systems around the Chicago metropolitan area, we are exposed to the risk that prices may differ between the Chicago delivery point and the individual utility system delivery points. These differences can be significant from time to time, particularly during extreme, unforecasted cold weather conditions. Similarly, in certain of our electricity markets, customers pay the load zone price for electricity, so if we purchase supply to be delivered at a hub, we may have basis risk between the hub and the load zone electricity prices due to local congestion that is not reflected in the hub price. We attempt to hedge basis risk where possible, but hedging instruments are occasionally not economically feasible or available in the smaller quantities that we require.
Customer Credit Risk
Our credit risk management policies are designed to limit customer credit exposure. Credit risk is managed through participation in purchase of receivables ("POR") programs in utility service territories where such programs are available. In these markets, we monitor the credit ratings of the local regulated utilities and the parent companies of the utilities that purchase our customer accounts receivable. We also periodically review payment history and financial information for the local regulated utilities to ensure that we identify and respond to any deteriorating trends. In non-POR markets, we assess the creditworthiness of new applicants, monitor customer payment activities and administer an active collection program. Using risk models, past credit experience and different levels of exposure in each of the markets, we monitor our receivable aging, bad debt forecasts and actual bad debt expenses and adjust as necessary.
In territories where POR programs have been established, the local regulated utility purchases our receivables, and then becomes responsible for billing and collecting payment from the customer. In return for their assumption of risk, we receive slightly discounted proceeds on the receivables sold. POR programs result in substantially all of our credit risk being linked to the applicable utility and not to our end-use customers in these territories. For the year ended December 31, 2020,2023, approximately 64%55% of our retail revenues were derived from territories in which substantially all of our credit risk was directly linked to local regulated utility companies, all of which had investment grade ratings. During the same period, we paid these local regulated utilities a weighted average discount of approximately 1.2%1.0% of total revenues for customer credit risk. In certain of the POR markets in which we operate, the utilities limit their collections exposure by retaining the ability to transfer a delinquent account back to us for collection when collections are past due for a specified period. If our subsequent collection efforts are unsuccessful, we return the account to the local regulated utility for termination of service to the extent the ability to terminate service has not been limited as a result of COVID-19.regulatory orders. Under these service programs, we are exposed to credit risk related to payment for services rendered during the time between when the customer is transferred to us by the local regulated utility and the time we return the customer to the utility for termination of service, which is generally one to two billing periods. We may also realize a loss on fixed-price customers in this scenario due to the fact that we will have already fully hedged the customer’s expected commodity usage for the life of the contract.
In non-POR markets (and in POR markets where we may choose to direct bill our customers), we manage customer credit risk through formal credit review in the case of commercial customers, and credit score screening, deposits and disconnection for non-payment, in the case of residential customers. Economic conditions (including impacts from COVID-19) may affect our customers’ ability to pay bills in a timely manner, which could increase customer delinquencies and may lead to an increase in bad debtcredit loss expense. We maintain an allowance for doubtful accounts,credit loss, which represents our estimate of potential credit losses associated with accounts receivable from customers within these markets.
We assess the adequacy of the allowance for doubtful accountscredit loss through review of an aging of customer accounts receivable and general economic conditions in the markets that we serve. Our bad debt expense for the year ended December 31, 20202023 was $4.7$3.4 million, or 0.8% of retail revenues. See “Management’s Discussion and Analysis of Financial Condition and Results of Operations—Drivers of Our Business—Customer Credit Risk” for a more detailed discussion of our bad debt expense for the year ended December 31, 2020.2023.
We do not have high concentrations of sales volumes to individual customers. For the year ended December 31, 2020,2023, our largest customer accounted for 2%less than 1% of total retail energy sales.
Counterparty Credit Risk in Wholesale Markets
We do not independently produce natural gas and electricity and depend upon third parties for our supply, which exposes us to wholesale counterparty credit risk in our retail and asset optimization activities. If the counterparties to our supply contracts are unable to perform their obligations, we may suffer losses, including those that occur as a result of being unable to secure replacement supplies of natural gas or electricity on a timely or cost-effective basis or at all. At December 31, 2020,2023, approximately $0.2$2.1 million of our total exposure of $3.1$2.8 million was either with a non-investment grade counterparty or otherwise not secured with collateral or a guarantee.
Operational Risk
As with all companies, we are at risk from cyber-attacks (breaches, unauthorized access, misuse, computer viruses, or other malicious code or other events) that could materially adversely affect our business, or otherwise cause interruptions or malfunctions in our operations. We mitigate these risks through multiple layers of security controls including policy, hardware, and software security solutions. We also have engaged third parties to assist with both external and internal vulnerability scans and continually enhance awareness through employee education and accountability. As of December 31, 2020,During 2023, we haddid not experiencedexperience any material loss related to cyber-attacks or other information security breaches.
Relationship with our Founder, and Majority Shareholder, and Chief Executive Officer
We have historically leveraged our relationship with affiliates of our founder, and majority shareholder and Chief Executive Officer, W. Keith Maxwell III, (our “Founder”), to execute our strategy, including sourcing acquisitions, financing, and operations support. Our FounderMr. Maxwell owns NG&E, which was formed for the purpose of purchasing retail energy companies and retail customer books that may ultimately be resold to us. This relationship has afforded us access to opportunities that may not have otherwise been available to us due to our size and availability of capital.
We may engage in additional transactions with NG&E in the future and expect that any such transactions would be funded by a combination of cash, subordinated debt, or the issuance of Class A or Class B common stock.securities. Actual consideration paid for the assets would depend, among other things, on our capital structure and liquidity at the time of any transaction. Although we believe our Founder would be incentivized to offer us additional acquisition opportunities, he and his affiliates are under no obligation to do so, and we are under no obligation to buy assets from them. Any acquisition activity involving NG&E or any other affiliate of our FounderMr. Maxwell will be subject to negotiation and approval by a special committee of our Board of Directors consisting solely of independent
directors. Please see “Iem“Item 1A — Risk Factors” in this Annual Report for risks related to acquisitions and transactions with our affiliates.
On November 2, 2020,December 29, 2023, we entered into a merger agreement (the “Merger Agreement”) with Retailco, LLC, a Texas limited liability company (“Retailco”), and NuRetailco LLC, a Delaware limited liability company and wholly-owned subsidiary of Retailco (“Merger Sub”), whereby all of our Class A common stock (except for as described below), will be acquired by Retailco for $11.00 per share.
Retailco is an entity owned by TxEx, which is wholly owned by Mr. Maxwell.
The transaction will be effected by a merger of Merger Sub, with and into the Company, with the Company surviving the merger. Under the terms of the Merger Agreement, all of our Class A common stock, except for shares of Class A common stock for which appraisal rights have been properly and validly exercised under Delaware law and certain additional shares, including those held by the Company or any of its subsidiaries (or held in the Company’s treasury), Retailco or Merger Sub or any of their respective subsidiaries, or Mr. Maxwell, and any person or entity controlled by him, will be converted into the right to receive the cash consideration.
The Class A common stock, currently traded under the symbol VIA, will cease to trade on NASDAQ upon consummation of the transaction. We expect that the Series A Preferred Stock, currently traded under the symbol VIASP, will continue to trade on NASDAQ following the transaction. Accordingly, Via Renewables will remain subject to the reporting requirements of the Exchange Act.
The transaction was negotiated on behalf of the Company by a Special Committee of its Board of Directors (the "Board")with the assistance of independent financial and legal advisors. The Special Committee is comprised of entirely disinterested and independent directors. Following the Special Committee’s unanimous recommendation in support of the Company appointed W. Keith Maxwell III, who had served as our interim Chief Executive Officer since Marchmerger, the Company’s Board of 2020, as Chief Executive Officer.Directors (other than Mr. Maxwell) approved the Merger Agreement and recommended that the Company’s stockholders adopt and approve the Merger Agreement and the merger.
The merger is subject to approval by a majority of shareholders of the issued and outstanding shares of the Company’s Class A common stock and Class B common stock. In addition, the merger is subject to a non-waivable requirement of approval by the holders of at least a majority of the issued and outstanding Class A common stock and Class B common stock not owned by Mr. Maxwell and his affiliated entities or the directors, officers or their immediate family members. Mr. Maxwell and affiliated entities have entered into a support agreement to vote their shares in favor of the transaction and against any competing transaction. The Merger Agreement is not subject to a financing condition, but is subject to customary closing conditions. The transaction is expected to close in the second quarter of 2024.
Competition
The markets in which we operate are highly competitive. Our primary competition comes from the incumbent utility and other independent retail energy companies. In the electricity sector, these competitors include larger, well-capitalized energy retailers such as Calpine Energy Solutions, LLC, Constellation Energy Group, Inc.,Corporation, NRG Energy, Inc., and Vistra Energy Corp. We also compete with small local retail energy providers in the electricity sector that are focused exclusively on certain markets. Each market has a different group of local retail energy providers. In the natural gas sector, our national competitors are primarily NRG, Inc. Energy and Constellation Energy Group, Inc.Corporation. Our national competitors generally have diversified energy platforms with multiple marketing approaches and broad geographic coverage similar to us. Competition in each market is based primarily on product offering, price and customer service. The number of competitors in our markets varies. In well-established markets in the Northeast and Texas we have hundreds of competitors, while in other markets the competition is limited to several participants. Markets that offer POR programs are generally more competitive than those markets in which retail energy providers bear customer credit risk.
Our ability to compete depends on our ability to convince customers to switch to our products and services, renew services with customers upon expiration of their contract terms, and our ability to offer products at attractive prices. Many local regulated utilities and their affiliates may possess the advantages of name recognition, longer operating histories, long-standing relationships with their customers and access to financial and other resources, which could pose a competitive challenge to us. As a result of our competitors' advantages, many customers of these local regulated utilities may decide to stay with their longtime energy provider if they have been satisfied with their service in the past. In addition, competitors may choose to offer more attractive short-term pricing to increase their market share.
Seasonality of Our Business
Our overall operating results fluctuate substantially on a seasonal basis depending on: (i) the geographic mix of our customer base; (ii) the relative concentration of our commodity mix; (iii) weather conditions, which directly influence the demand for natural gas and electricity and affect the prices of energy commodities; and (iv) variability in market prices for natural gas and electricity. These factors can have material short-term impacts on monthly and quarterly operating results, which may be misleading when considered outside of the context of our annual operating cycle.
Our accounts payable and accounts receivable are impacted by seasonality due to the timing differences between when we pay our suppliers for accounts payable versus when we collect from our customers on accounts receivable. We typically pay our suppliers for purchases of natural gas on a monthly basis and electricity on a weekly basis. However, it takes approximately two months from the time we deliver the electricity or natural gas to our customers before we collect from our customers on accounts receivable attributable to those product deliveries. This timing difference affects our cash flows, especially during peak cycles in the winter and summer months.
Natural gas accounted for approximately 17%25% of our retail revenues for the year ended December 31, 2020,2023, which exposes us to a high degree of seasonality in our cash flows and income earned throughout the year as a result of the high concentration of heating load in the winter months. We utilize a considerable amount of cash from operations and borrowing capacity to fund working capital, which includes inventory purchases from April through October each year. We sell our natural gas inventory during the months of November through March of each year. We expect that the significant seasonality impacts to our cash flows and income will continue in future periods.
Regulatory Environment
We operate in the highly regulated natural gas and electricity retail sales industry in all of our respective jurisdictions, and must comply with the legislation and regulations in these jurisdictions in order to maintain our licenses to operate. We must also comply with the applicable regulations in order to obtain the necessary licenses in jurisdictions in which we plan to compete. Licensing requirements vary by state, but generally involve regular, standardized reporting in order to maintain a license in good standing with the state commission responsible for regulating retail electricity and gas suppliers. We believe there is potential for changes to state legislation and regulatory measures addressing licensing requirements that may impact our business model in the applicable jurisdictions. In addition, as further discussed below, our marketing activities and customer enrollment procedures are subject to rules and regulations at the state and federal levels, and failure to comply with requirements imposed by federal and state regulatory authorities could impact our licensing in a particular market. See "Risk Factors—We face risks due to increasing regulation of the retail energy industry at the state level."
New York
A Low-Income Order was promulgated by the New York State Public Service Commission ("NYPSC") in December of 2016 (the "Low-Income Order"),Jersey and the New York State Supreme Court, Appellate Division, Third Department ruled in September 2017 that energy service companies ("ESCOs") must proceed with returning existing low-income customers to utility service and stop enrolling new low-income customers. The ESCOs have effectively exhausted their legal remedies to appeal this matter and must now comply with the Low-Income Order. ESCOs may continue serving low income customers if those customers are enrolled in fixed arrangements with guaranteed savings or with value add inclusions (that were entered into prior to the effective date of the Low-Income Order) or if the ESCO receives a waiver from the NYPSC to provide low-income customers with guaranteed savings. The Company and its subsidiaries have been returning low-income customers to the applicable utilities as they have rolled off of their contracts. As of December 31, 2020, remaining low-income customers represent approximately 1.7% of our total RCEs in New York and 0.3% of our RCEs overall.
In December 2017, the NYPSC held an evidentiary hearing to assess the retail energy market in New York. On September 18, 2020, the NYPSC issued an order adopting the changes to the New York retail energy market with product restrictions commencing April 16, 2021 (“2020 Order”). The 2020 Order states that ESCOs can only enroll new residential or small nonresidential customers (mass-market customers) or renew existing mass-market customer contracts for gas and/or electric service if at least one of the following conditions is met: (1) enrollment includes a guaranteed savings over the utility price, as reconciled on an annual basis; (2) enrollment is for a fixed-rate commodity product that is priced at no more than 5% greater than the trailing 12-month average utility supply rate; (3) enrollment is for a renewably sourced electric commodity product that (a) has a renewable mix that is at least 50% greater than the ESCO’s current Renewable Energy Standard (RES) obligation, (b) the ESCO complies with the RES locational and delivery requirements when procuring Renewable Energy Credits (RECs) or entering into bilateral contracts for renewable commodity supply, and (c) there is transparency of information and disclosures provided to the customer with respect to pricing and commodity sourcing. In addition, by September 15, 2021, all New York ESCOs are required to reapply for licenses to serve customers in New York.We timely filed all relicense applications and are waiting to hear back from the NYPSC on such filings.
We are evaluating and proactively managing the potential impact of the NYPSC's 2020 Order and subsequent proceedings on our New York operations while preparing to operate in compliance with any new requirements that may come as a result of any new order promulgated by the NYPSC. Given the uncertainty of the outcome of these matters and the final requirements that may be implemented, we are unable to predict at this time the magnitude of the long-term impact on our operations in New York.
Massachusetts
In October 2018, the Attorney General for the Commonwealth of Massachusetts filed suit against another ESCO and others alleging unfair or deceptive acts or practices in violation of a consumer protections act, breach of the
covenant of good faith and fair dealing, and violation of the Massachusetts Telemarketing Solicitation Act. Contemporaneously with the filing of their complaint, the Commonwealth filed for injunctive relief seeking to attach purchase of receivables program revenues owed to the ESCO as possible damages. There can be no assurance that the Commonwealth will not pursue similar claims against other ESCOs.
Other StatesConnecticut
Certain state commissions have begun efforts to restrict the ability of retail suppliers to “pass through” costs to customers associated with certain changes in law or regulatory requirements. For example, on January 22, 2019, the New Jersey Board of Public Utilities (“NJ BPU”) sent a cease and desist letter to third party suppliers (“TPS”) in New Jersey instructing that a TPS may not charge a customer rate that is higher than the fixed rate applicable during the period for which that rate was fixed. The letter notified TPS that such increases were prohibited and instructed TPS to refund customers amounts charged in excess of the applicable fixed rate. Parties have challenged the NJ BPU’s letter and it is not clear at this time whether refunds will be required. Similarly, the Connecticut Public Utilities Regulatory Authority (“PURA”) opened a docket after receiving complaints regarding increases by suppliers to certain fixed-price supplier contracts due to change in law triggers. PURA will consider whether suppliers’ actions constitute unfair and deceptive trade practices or otherwise violates applicable laws. PURA is expected to issue a declaratory ruling following its review. Depending on the outcome of these efforts in New Jersey and Connecticut,These state actions provide examples where the Company may be required to assume costs that it otherwise would pass on to customers under its change in law provisions and potentially provide refunds to certain customers.
Other Regulations
Our marketing efforts to consumers, including but not limited to telemarketing, door-to-door sales, direct mail and online marketing, are subject to consumer protection regulation including state deceptive trade practices acts, Federal Trade Commission ("FTC") marketing standards, and state utility commission rules governing customer solicitations and enrollments, among others. By way of example, telemarketing activity is subject to federal and state do-not-call regulation and certain enrollment standards promulgated by state regulators. Door-to-door sales are governed by the FTC’s “Cooling-Off Rule" as well as state-specific regulation in many jurisdictions. In markets in which we conduct customer credit checks, these checks are subject to the requirements of the Fair Credit Reporting Act. Violations of the rules and regulations governing our marketing and sales activity could impact our license to operate in a particular market, result in suspension or otherwise limit our ability to conduct marketing activity in certain markets, and potentially lead to private actions against us. Moreover, there is potential for changes to legislation and regulatory measures applicable to our marketing measures that may impact our business models.
We partially rely on lead generators for our telemarketing sales channel.Applicable laws over the years have become more restrictive in our ability to telemarket to potential customers.Most recently, a law was passed by the FCC that lead generators, when obtaining a consumer’s prior express written consent to robocall or robotext the consumer soliciting their business, can only obtain a single seller at a time on the comparison shopping websites that often are the source of lead generation.Specifically, in December 2023, the FCC, adopted rules, pursuant to Federal Communications Commission (FCC 23-107): In the Matter of Targeting and Eliminating Unlawful Text Messages, CG Docket No. 21-402; Rules and Regulations Implementing the Telephone Consumer Protection Act of 1991, CG Docket No. 02-278; Advanced Methods to Target and Eliminate Unlawful Robocalls, CG Docket No. 17-59, Second Report and Order, Second Further Notice of Proposed Rulemaking, and Waiver Order (December 13, 2023) that could impact our ability to obtain, and increase the cost of, sales leads for our telemarketing channel.
Recent interpretations of the Telephone Consumer Protection Act of 1991 (the “TCPA”) by the Federal Communications Commission (“FCC”) have introduced confusion regarding what constitutes an “autodialer” for purposes of determining compliance under the TCPA. Also, additional restrictions have been placed on wireless telephone numbers making compliance with the TCPA more costly. See “Risk Factors—Risks Related to Our Business and Our Industry—Liability under the TCPA has increased significantly in recent years, and we face risks if we fail to comply.”
As compliance with the federal TCPA regulations and state telemarketing regulations becomes increasingly costly and as door-to-door marketing becomes increasingly risky both from a regulatory compliance perspective, and from the risk of such activities drawing class action litigation claims, we and our peers who rely on these sales channels will find it more difficult than in the past to engage in direct marketing efforts. In response to these risks, we are experimenting with new technologies, such as a web-based application to process door-to-door sales enrollments with direct input by the consumer. This application can be accessed using tablets or any smart phone device, which enhances and expands the opportunities to market directly to customers.
Our participation in natural gas and electricity wholesale markets to procure supply for our retail customers and hedge pricing risk is subject to regulation by the Commodity Futures Trading Commission (the "CFTC"), including regulation pursuant to the Dodd-Frank Wall Street Reform and Consumer Protection Act. In order to sell electricity, capacity and ancillary services in the wholesale electricity markets, we are required to have market-based rate
authorization, also known as “MBR Authorization,” from the Federal Energy Regulatory Commission ("FERC"). We are required to make status update filings to FERC to disclose any affiliate relationships and quarterly filings to FERC regarding volumes of wholesale electricity sales in order to maintain our MBR Authorization. We are also required to seek prior approval by FERC to the extent any direct or indirect change in control occurs with respect to entities that hold MBR Authorization.
The transportation and sale for resale of natural gas in interstate commerce are regulated by agencies of the U.S. federal government, primarily FERC under the Natural Gas Act of 1938, the Natural Gas Policy Act of 1978 and regulations issued under those statutes. FERC regulates interstate natural gas transportation rates and service conditions, which affects our ability to procure natural gas supply for our retail customers and hedge pricing risk. Since 1985, FERC has endeavored to make natural gas transportation more accessible to natural gas buyers and sellers on an open and non-discriminatory basis. FERC’s orders do not attempt to directly regulate natural gas retail sales. As a shipper of natural gas on interstate pipelines, we are subject to those interstate pipelines' tariff requirements and FERC regulations and policies applicable to shippers.
Changes in law and to FERC policies and regulations may adversely affect the availability and reliability of firm and/or interruptible transportation service on interstate pipelines, and we cannot predict what future action FERC will take. We do not believe, however, that any regulatory changes will affect us in a way that materially differs from the way they will affect other natural gas marketers and local regulated utilities with which we compete.
In December 2007, FERC issued Order 704, a final rule on the annual natural gas transaction reporting requirements, as amended by subsequent orders on rehearing. Under Order 704, wholesale buyers and sellers of more than 2.2 million MMBtus of physical natural gas in the previous calendar year, including natural gas gatherers and marketers, are required to report, on May 1 of each year, aggregate volumes of natural gas purchased or sold at wholesale in the prior calendar year to the extent such transactions utilize, contribute to, or may contribute to the formation of price indices. It is the responsibility of the reporting entity to determine which individual transactions should be reported based on the guidance of Order 704. Order 704 also requires market participants to indicate whether they report prices to any index publishers, and if so, whether their reporting complies with FERC’s policy statement on price reporting. As a wholesale buyer and seller of natural gas, we are subject to the reporting requirements of Order 704.
Employees
We employed 159 people asAs of December 31, 2020, none of which were subject to any2023, we employed 160 full-time employees. Our employees are not represented by a collective bargaining agreements.unit. We have not experienced any strikes or work stoppages and consider our relations with our employees to be satisfactory.
We also utilizeare dedicated to attracting and retaining talent across a variety of backgrounds, with varying experiences, perspectives and ideas, while having an inclusive culture. As of December 31, 2023, approximately 48% of our workforce was male and 52% female. We encourage and support the servicesdevelopment of independent contractorsour employees wherever possible, and vendorsseek to perform various services.fill positions through promotions and transfers within the organization. Continued learning and career development is advanced through ongoing performance and development conversations with employees and internally developed training programs.
We provide competitive compensation and benefits programs to our employees. These programs include, subject to eligibility policies, a 401(k) Plan, healthcare and insurance benefits, long term incentive awards in the form of restricted stock units to certain employees, health savings and flexible spending accounts, paid time off, family leave and employee assistance programs.
We strive to be a good corporate citizen by being involved with numerous local community and charitable organizations through financial contributions and volunteer events. To encourage volunteerism, we offer paid time off to employees to volunteer in the community during work hours.
Facilities
Our corporate headquarters is located in Houston, Texas.
Available Information
Our website is located at www.sparkenergy.com.www.viarenewables.com. We make available our periodic reports and other information filed with or furnished to the Securities and Exchange Commission (the “SEC”), including our annual reports on Form 10-K, our quarterly reports on Form 10-Q, our current reports on Form 8-K, and all amendments to those reports, free of charge through our website, as soon as reasonably practicable after those reports and other information are electronically filed with or furnished to the SEC. Any materials filed with the SEC may be read and copied at the SEC’s website at www.sec.gov.
Item 1A. Risk Factors
Risk Factor Summary
Our business, financial condition, cash flows, results of operations and ability to pay dividends on our Class A common stock and Series A Preferred Stock could be materially and adversely affected by, and the price of our Class A common stock and Series A Preferred Stock could decline due to a number of factors, whether currently known or unknown, including but not limited to those described below. You should carefully consider these risk factors together with the other information contained in this Annual Report on Form 10-K.
Risks Related to Our Business and Our Industry
•We are subject to commodity price risk.
•We face risks related to health epidemics, pandemics and other outbreaks, including COVID-19.
•Our financial results may be adversely impacted by weather conditions and changes in consumer demand.
•Our risk management policies and hedging procedures may not mitigate risk as planned, and we may fail to fully or effectively hedge our commodity supply and price risk.
•ESCOs face risks due to increased and rapidly changing regulations and increasing monetary fines by the state regulatory agencies.
•The retail energy business is subject to a high level of federal, state and local regulations, which are subject to change.
•Liability under the TCPA has increased significantly in recent years, and we face risks if we fail to comply.
•We are, and in the future may become, involved in legal and regulatory proceedings and, as a result, may incur substantial costs.
•Our business is dependent on retaining licenses in the markets in which we operate.
•We may be subject to risks in connection with acquisitions, which could cause us to fail to realize many of the anticipated benefits of such acquisitions.
•Compliance with New York Public Service Commission Orders may adversely impact customer acquisition and renewal revenue and profitability.
•Pursuant to our cash dividend policy, we distribute a significant portion of our cash through regular quarterly dividends, and our ability to grow and make acquisitions with cash on hand could be limited.
•We may not be able to manage our growth successfully.
•Our financial results fluctuate on a seasonal, quarterly and annual basis.
•We may have difficulty retaining our existing customers or obtaining a sufficient number of new customers, due to competition and for other reasons.
•Increased collateral requirements in connection with our supply activities may restrict our liquidity.
•We are subject to direct credit risk for certain customers who may fail to pay their bills as they become due.
•We depend on the accuracy of data in our information management systems, which subjects us to risks.
•Cyberattacks and data security breaches could adversely affect our business.
•Our success depends on key members of our management, the loss of whom could disrupt our business operations.
•A large portion of our current customers are concentrated in a limited number of states, making us vulnerable to customer concentration risks.
•Increases in state renewable portfolio standards or an increase in the cost of renewable energy credit and carbon offsets may adversely impact the price, availability and marketability of our products.
•Our access to marketing channels may be contingent upon the viability of our telemarketing and door-to-door agreements with our vendors.
•Our vendors may expose us to risks.
Risks Related to Our Capital Structure and Capital Stock
•Our indebtedness could adversely affect our ability to raise additional capital to fund our operations or pay dividends. It could also expose us to the risk of increased interest rates and limit our ability to react to changes in the economy or our industry as well as impact our cash available for distribution.
•We cannot assure you that we will be able to continue paying our targeted quarterly dividend to the holders of our Class A common stock or dividends to the holders of our Series A Preferred Stock in the future.
•We are a holding company. Our sole material asset is our equity interest in Spark HoldCo, LLC ("Spark HoldCo") and we are accordingly dependent upon distributions from Spark HoldCo to pay dividends on the Class A common stock and Series A Preferred Stock.
•The Class A common stock and Series A Preferred Stock are subordinated to our existing and future debt obligations.
•Numerous factors may affect the trading price of the Class A common stock and Series A Preferred Stock.
•There may not be an active trading market for the Class A common stock or Series A Preferred Stock, which may in turn reduce the market value and your ability to transfer or sell your shares of Class A common stock or Series A Preferred Stock.
•Our Founder holds a substantial majority of the voting power of our common stock.
•Holders of Series A Preferred Stock have extremely limited voting rights.
•We have engaged in transactions with our affiliates in the past and expect to do so in the future. The terms of such transactions and the resolution of any conflicts that may arise may not always be in our or our stockholders’ best interests.
•Our amended and restated certificate of incorporation and amended and restated bylaws, as well as Delaware law, contain provisions that could discourage acquisition bids or merger proposals, which may adversely affect the market price of our Class A common stock.
•Our amended and restated certificate of incorporation designates the Court of Chancery of the State of Delaware as the sole and exclusive forum for certain types of actions and proceedings that may be initiated by our stockholders, which could limit our stockholders’ ability to obtain a favorable judicial forum for disputes with us or our directors, officers, employees or agents.
•Future sales of our Class A common stock and Series A Preferred Stock in the public market could reduce the price of the Class A common stock and Series A Preferred Stock, and may dilute your ownership in us.
•We have issued preferred stock and may continue to do so, and the terms of such preferred stock could adversely affect the voting power or value of our Class A common stock.
•Our amended and restated certificate of incorporation limits the fiduciary duties of one of our directors and certain of our affiliates and restricts the remedies available to our stockholders for actions taken by our Founder or certain of our affiliates that might otherwise constitute breaches of fiduciary duty.
•The Series A Preferred Stock represent perpetual equity interests in us, and investors should not expect us to redeem the Series A Preferred Stock on the date the Series A Preferred Stock becomes redeemable by us or on any particular date afterwards.
•The Series A Preferred Stock is not rated.
•We cannot guarantee that our Class A common stock repurchase program will enhance shareholder value and purchases, if any, could increase the volatility of the price of our Class A common stock.
•The Change of Control Conversion Right may make it more difficult for a party to acquire us or discourage a party from acquiring us.
•Changes in the method of determining the London Interbank Offered Rate (“LIBOR”), or the replacement of LIBOR with an alternative reference rate, may adversely affect interest rates under our Senior Credit Facility and the floating dividend rate of our Series A Preferred Stock.
•If we are unable to redeem the Series A Preferred Stock on or after April 15, 2022, a substantial increase in the Three-Month LIBOR Rate or an alternative rate could negatively impact our ability to pay dividends on the Series A Preferred Stock and Class A common stock.
•We may not have sufficient earnings and profits in order for dividends on the Series A Preferred Stock to be treated as dividends for U.S. federal income tax purposes.
•You may be subject to tax if we make or fail to make certain adjustments to the conversion rate of the Series A Preferred Stock even though you do not receive a corresponding cash dividend.
•We are a “controlled company” under NASDAQ Global Select Market rules, and as such we are entitled to an exemption from certain corporate governance standards of the NASDAQ Global Select Market, and you may not have the same protections afforded to shareholders of companies that are subject to all of the NASDAQ Global Market corporate governance requirements.
Risks Related to Our Business and Our Industry
We are subject to commodity price risk.
Our financial results are largely dependent on the prices at which we can acquire the commodities we resell. The prevailing market prices for natural gas and electricity are unpredictable and tend to fluctuate substantially. Changes in market prices for natural gas and electricity may result from many factors that are outside of our control, including:
•weather conditions; including extreme weather conditions, seasonal fluctuations, and the effects of climate change;
•demand for energy commodities and general economic conditions;
•disruption of natural gas or electricity transmission or transportation infrastructure or other constraints or inefficiencies;
•reduction or unavailability of generating capacity, including temporary outages, mothballing, or retirements;
•the level of prices and availability of natural gas and competing energy sources, including the impact of changes in environmental regulations impacting suppliers;
•the creditworthiness or bankruptcy or other financial distress of market participants;
•changes in market liquidity;
•natural disasters, wars, embargoes, acts of terrorism and other catastrophic events;
•significant changes in the pricing methods in the wholesale markets in which we operate;
•changes in regulatory policies concerning how markets are structured, how compensation is provided for service, and the kinds of different services that can or must be offered;
•federal, state, foreign and other governmental regulation and legislation; and
•demand side management, conservation, alternative or renewable energy sources.
WeFor example, in February 2021, the U.S. experienced winter storm Uri, an unprecedented storm bringing extreme cold temperatures to the central U.S., including Texas. As a result of increased power demand for customers across the state of Texas and power generation disruptions during the weather event, power and ancillary costs in the Electric Reliability Counsel of Texas (“ERCOT”) service area experienced extreme volatility and price increases beyond the maximum allowed clearing prices. Less extreme price fluctuations can also occur as a result of routine winter weather fluctuations.
In the event of price fluctuations, we may not be able to pass along changes to the prices we pay to acquire commodities to our customers as such pricing fluctuations can attract consumer class actions as well as state and federal regulatory actions.
See Item 7. Management's Discussion and Analysis of Financial Condition and Results of Operations for additional discussion about the expected impacts of winter storm Uri.
We face risks related to health epidemics, pandemics and other outbreaks, including COVID-19.
The ongoing COVID-19 pandemic is an evolving situation around the globe that continues to adversely impact economic activity and conditions worldwide. In particular, efforts to control the spread of COVID-19 have led to governmental shutdowns, business closures, and disruptions to supply chains and consumer behaviors around the world. We are continuing to monitor developments involving our workforce, customers and suppliers and cannot predict whether COVID-19 will have a future material impact on our business, financial condition or results of operations. However, an extended slowdown of the United States' economic growth, demand for commodities and/or material changes in governmental policy could result in lower economic growth and lower demand for natural gas and electricity in our key markets as well as the ability of various employees, customers, contractors, suppliers and other business partners to fulfill their obligations, which could have a material adverse effect on our business, financial condition or results of operations.
As a result of the COVID-19 pandemic, we experienced a slight increase in residential demand, and a slight decrease in C&I demand, and we may experience changes in customer demand in future periods that we cannot fully anticipate and that may lead us to experience financial gains and/or losses. While we continue to conduct analytics on our customer base to anticipate these changes in demand, we cannot predict how the COVID-19 pandemic will ultimately impact our hedging strategy related to our load forecasts.
Our financial results may be adversely impacted by weather conditions and changes in consumer demand.
Weather conditions directly influence the demand for and availability of natural gas and electricity and affect the prices of energy commodities. Generally, on most utility systems, demand for natural gas peaks in the winter and demand for electricity peaks in the summer. Typically, when winters are warmer or summers are cooler, demand for energy is lower than expected, resulting in less natural gas and electricity consumption than forecasted. When demand is below anticipated levels due to weather patterns, we may be forced to sell excess supply at prices below our acquisition cost, which could result in reduced margins or even losses.
Conversely, when winters are colder or summers are warmer, consumption may outpace the volumes of natural gas and electricity against which we have hedged, and we may be unable to meet increased demand with storage or swing supply. In these circumstances, such as with winter storm Uri, we may experience reduced margins or even losses if we are required to purchase additional supply at higher prices. We may fail to accurately anticipate demand due to fluctuations in weather or to effectively manage our supply in response to a fluctuating commodity price environment.
Further, extreme weather conditions such as hurricanes, droughts, heat waves, winter storms and severe weather associated with climate change could cause these seasonal fluctuations to be more pronounced. Destruction caused by severe weather events, such as hurricanes, tornadoes, severe thunderstorms, snow and ice storms, can result in lost operating revenues.
See Item 7. Management's Discussion and Analysis of Financial Condition and Results of Operations for additional discussion about the expected impacts of winter storm Uri.
Our risk management policies and hedging procedures may not mitigate risk as planned, and we may fail to fully or effectively hedge our commodity supply and price risk.
To provide energy to our customers, we purchase commodities in the wholesale energy markets, which are often highly volatile. Our commodity risk management strategy is designed to hedge substantially all of our forecasted volumes on our fixed-price customer contracts, as well as a portion of the near-term volumes on our variable-price customer contracts. We use both physical and financial products to hedge our exposure. The efficacy of our risk management program may be adversely impacted by unanticipated events and costs that we are not able to effectively hedge, including abnormal customer attrition and consumption, certain variable costs associated with electricity grid reliability, pricing differences in the local markets for local delivery of commodities, unanticipated events that impact supply and demand, such as extreme weather, and abrupt changes in the markets for, or availability or cost of, financial instruments that help to hedge commodity price.
We are exposed to basis risk in our operations when the commodities we hedge are sold at different delivery points from the exposure we are seeking to hedge. For example, if we hedge our natural gas commodity price with Chicago basis but physical supply must be delivered to the individual delivery points of specific utility systems around the Chicago metropolitan area, we are exposed to basis risk between the Chicago basis and the individual utility system delivery points. These differences can be significant from time to time, particularly during extreme, unforecasted cold weather conditions. Similarly, in certain of our electricity markets, customers pay the load zone price for electricity, so if we purchase supply to be delivered at a hub, we may have basis risk between the hub and the load zone electricity prices due to local congestion that is not reflected in the hub price. We attempt to hedge basis risk where possible, but hedging instruments are sometimes not economically feasible or available in the smaller quantities that we require.
Additionally, assumptions that we use in establishing our hedges may reduce the effectiveness of our hedging instruments. Considerations that may affect our hedging policies include, but are not limited to, human error, assumptions about customer attrition, the relationship of prices at different trading or delivery points, assumptions about future weather, and our load forecasting models.
Our derivative instruments are subject to mark-to-market accounting requirements and are recorded on the consolidated balance sheet at fair value with changes in fair value resulting from fluctuations in the underlying
commodity prices immediately recognized in earnings. As a result, the Company’s quarterly and annuals results are subject to significant fluctuations caused by the changes in market price.
In addition, we incur costs monthly for ancillary charges such as reserves and capacity in the electricity sector by ISOs. For example, the ISOs will charge all retail electricity providers for monthly reserves that the ISO determines are necessary to protect the integrity of the grid. We may be unable to fully pass the higher cost of ancillary reserves and reliability services through to our customers, and increases in the cost of these ancillary reserves and reliability services could negatively impact our results of operations.
Many of the natural gas utilities we serve allocate a share of transportation and storage capacity to us as a part of their competitive market operations. We are required to fill our allocated storage capacity with natural gas, which creates commodity supply and price risk. Sometimes we cannot hedge the volumes associated with these assets because they are too small compared to the much larger bulk transaction volumes required for trades in the wholesale market or it is not economically feasible to do so. In some regulatory programs or under some contracts, this capacity may be subject to recall by the utilities, which could have the effect of us being required to access the spot market to cover such a recall.
ESCOs face risks due to increased and rapidly changing regulations and increasing monetary fines by the state regulatory agencies.
The retail energy industry is highly regulated. Regulations may be changed or reinterpreted and new laws and regulations applicable to our business could be implemented in the future. To the extent that the competitive restructuring of retail electricity and natural gas markets is reversed, altered or discontinued, such changes could have a detrimental impact on our business and overall financial condition.
Some states are beginning to increase their regulation of their retail electricity and natural gas markets in an effort to increase consumer disclosures and ensure marketing practices are not misleading to consumers. In addition, the fines against ESCOs that regulators are seeking have increased dramatically in recent years. For example, in 2015late 2022 PURA and the Connecticut Legislature passed legislation providing that licensed electric suppliers inOffice of Consumer Counsel issued to our subsidiary, Verde, a Notice of Violation and Assessment of Penalty proposing civil penalties, restitution payments to certain customers and a multi-year suspension from the Connecticut could no longer offer variable rate products as Connecticut regulators believed that a variable rate product was inappropriate for residential consumers; however, no other state to date has followed Connecticut's legislation.
In December 2017, the New York Public Service Commission (“PSC”) held an evidentiary hearing to assess the retail energy market in New York.On September 18, 2020, the PSC issued an order adopting the changes to the New York retailconnection with violations of Connecticut’s marketing requirements for energy market, with the product restrictions going into effect on April 16, 2021 (“2020 Order”). The 2020 Order states that ESCOs can only enroll new residential or small nonresidential customers (mass-market customers) or renew existing mass-market customer contracts for gas and/or electric service only if at least one of the following conditions is met: (1) enrollment includes a guaranteed savings over the utility price, as reconciled on an annual basis; (2) enrollment is for a fixed-rate commodity product that is priced at no more than 5% greater than the trailing 12-month average utility supply rate; (3) enrollment is for a renewably sourced electric commodity product that (a) has a renewable mix that is at least 50% greater than the ESCO’s current Renewable Energy Standard (RES) obligation, (b) the ESCO complies with the RES locational and delivery requirements when procuring Renewable Energy Credits (RECs) or entering into bilateral contracts for renewable commodity supply, and (c) there is transparency of information and disclosures provided to the customer with respect to pricing and commodity sourcing. In addition, by September 15, 2021, all New York ESCOs are required to reapply for licenses to serve customers in New York.We timely filed all relicense applications and are waiting to hear back from the PSC on such filings.
We are evaluating and proactively managing the potential impact of the NYPSC's 2020 Order and subsequent proceedings on our New York operations while preparing to operate in compliance with any new requirements that may come as a result of any new order promulgated by the NYPSC. Given the uncertainty of the outcome of these matters and the final requirements that may be implemented, we are unable to predict at this time the magnitude of the long-term impact on our operations in New York.
On October 15, 2018, the Attorney General for the Commonwealth of Massachusetts filed suit against another ESCO and others alleging unfair or deceptive acts or practices in violation of a consumer protections act, breach of the covenant of good faith and fair dealing, and violation of the Massachusetts Telemarketing Solicitation Act. Contemporaneously with the filing of their complaint, the Commonwealth filed for injunctive relief seeking to attach purchase of receivables program revenues owed to the ESCO as possible damages. There can be no assurance that the Commonwealth will not pursue similar claims against other ESCOs.
Recently, certain state commissions have begun efforts to restrict the ability of retail suppliers to “pass through” costs to customers associated with certain changes in law or regulatory requirements. For example, on January 22, 2019, the New Jersey Board of Public Utilities ("NJ BPU") sent a cease and desist letter to third party suppliers ("TPS") in New Jersey instructing that a TPS may not charge a customer rate that is higher than the fixed rate applicable during the period for which that rate was fixed. The letter notified TPS that such increases were prohibited and instructed TPS to refund customers amounts charged in excess of the applicable fixed rate. Parties have challenged the NJ BPU’s letter and it is not clear at this time whether refunds will be required. Similarly, the Connecticut Public Utilities Regulatory Authority ("PURA") recently opened a docket after receiving complaints regarding increases by suppliers to certain fixed-price supplier contracts due to change in law triggers. PURA will consider whether suppliers’ actions constitute unfair and deceptive trade practices or otherwise violate applicable laws. PURA is expected to issue a declaratory ruling following its review. Depending on the outcome of these efforts in New Jersey and Connecticut, the Company may be required to assume costs that it otherwise would pass on to customers under its change in law provisions and potentially provide refunds to certain customers.suppliers.
The retail energy business is subject to a high level of federal, state and local regulations, which are subject to change.
Many governmental bodies regulate aspects of our operations, and our failure to comply with these legal requirements can result in substantial penalties. In addition, new laws and regulations, including executive orders, or changes to or new interpretations of existing laws and regulations by courts or regulatory authorities occur regularly, but are difficult to predict. Changes under a new president, administration and Congress in the U.S. are also difficult to predict. Any such variation could negatively impact the retail energy business, including our business, could substantially increase costs to achieve compliance or otherwise could have a material adverse effect on our cash flow, results of operations and financial condition.
For example, many electricity markets have rate caps, and changes to these rate caps by regulators can impact future price exposure. Similarly, regulatory changes can result in new fees or charges that may not have been anticipated when existing retail contracts were drafted, which can create financial exposure. Our ability to manage cost increases that result from regulatory changes will depend, in part, on how the “change in law provisions” of our contracts are interpreted and enforced, among other factors.
Additionally, regulations that do not directly relate to ESCOs could impact us. For example, we have historically used third-party lead generators to identify potential customers for our telemarketing sales channel. In December 2023, the FCC adopted rules that could limit the ability of third-party lead generators to identify large numbers of potential customers. If the number of potential customers is reduced, or if it becomes more difficult or costly to identify potential telemarketing targets, our ability to maintain our RCE count based on our telemarketing sales could be impacted. Please see “Regulatory Environment—Other Regulations.”
Liability under the TCPA has increased significantly in recent years, and we face risks if we fail to comply.
Our outbound telemarketing efforts and use of mobile messaging to communicate with our customers, which has increased in recent years, subjects us to regulation under the TCPA. Over the last several years, companies have been subject to significant liabilities as a result of violations of the TCPA, including penalties, fines and damages under class action lawsuits. Our failure to effectively monitor and comply with our activities that are subject to the TCPA could result in significant penalties and the adverse effects of having to defend and ultimately suffer liability in a class action lawsuit related to such non-compliance.
We are also subject to liability under the TCPA for actions of our third party vendors who are engaging in outbound telemarketing efforts on our behalf. The issue of vicarious liability for the actions of third parties in violation of the TCPA remains unclear and has been the subject of conflicting precedent in the federal appellate courts. There can be no assurance that we may be subject to significant damages as a result of a class action lawsuit for actions of our vendors that we may not be able to control.
We are, and in the future may become, involved in legal and regulatory proceedings and, as a result, may incur substantial costs.
We are subject to lawsuits, claims and regulatory proceedings arising in the ordinary course of our business from time to time, including several purported class action lawsuits involving sales practices, telemarketing and TCPA claims, as well as contract disclosure claims and breach of contract claims. These are in various stages and are subject to substantial uncertainties concerning the outcome.
A negative outcome for any of these matters could result in significant costs, may divert management's attention from other business issues or harm our reputation with customers.
For additional information regarding the nature and status of certain proceedings, see Note 1413 "Commitments and Contingencies" to the audited consolidated financial statements.
Our business is dependent on retaining licenses in the markets in which we operate.
Our business model is dependent on continuing to be licensed in existing markets. We may have a license revoked or not be granted a renewal of a license, or our license could be adversely conditioned or modified (e.g., by increased bond posting obligations). For example, recently, an ESCO was banned by the Public Utilities Commission of Ohio from operating in Ohio for five years in response to allegations of misleading and deceptive marketing practices.
We may be subject to risks in connection with acquisitions, which could cause us to fail to realize many of the anticipated benefits of such acquisitions.
We have grown our business in part through strategic acquisition opportunities from third parties and from affiliates of our majority shareholder and may continue to do so in the future. Achieving the anticipated benefits of these transactions depends in part upon our ability to identify accretive acquisition targets, accurately assess the benefits and risks of the acquisition prior to undertaking it, and the ability to integrate the acquired businesses in an efficient and effective manner. When we identify an acquisition candidate, there is a risk that we may be unable to negotiate terms that are beneficial to us. Additionally, even if we identify an accretive acquisition target, the successful acquisition of that business requires estimating anticipated cash flow and accretive value, evaluating potential regulatory challenges, retaining customers and assuming liabilities. The accuracy of these estimates is inherently uncertain and our assumptions may turn out to be incorrect.
Furthermore, when we make an acquisition, we may not be able to accomplish the integration process smoothly or successfully. The integration process could take longer than anticipated and could result in the loss of valuable employees, the disruption of our business, processes and systems or inconsistencies in standards, controls, procedures, practices, policies, compensation arrangements, distraction of management and significant costs, any of which could adversely affect our ability to achieve the anticipated benefits of the acquisitions. Further, we may have difficulty addressing possible differences in corporate cultures and management philosophies.
In many of our acquisition agreements, we are entitled to indemnification from the counterparty for various matters, including breaches of representations, warranties and covenants, tax matters, and litigation proceedings. We generally obtain security to provide assurances that the counterparty could perform its indemnification obligations, which may be in the form of escrow accounts, payment withholding or other methods. However, to the extent that we do not obtain security, or the security turns out to be inadequate, there is a risk that the counterparty may fail to perform on its indemnification obligations, which could result in the losses being incurred by us.
Our ability to grow at levels experienced historically may be constrained if the market for acquisition candidates is limited and we are unable to make acquisitions of portfolios of customers and retail energy companies on commercially reasonable terms.
Compliance with New York Public Service Commission Orders may adversely impact customer acquisition and renewal revenue and profitability.
As discussed above, the 2020 Order limits the types of services energy retailer marketers may offer new customers or renewals, in terms of pricing for non-renewable commodities and renewable product offerings. Although the Company is working to ensure that its products and services are fully compatible with the 2020 Order, such compliance may adversely impact customer acquisition and renewal revenue and profitability, and organic growth. The Company is evaluating its options and seeking additional clarity to the 2020 Order from the PSC.
Pursuant to our cash dividend policy, we distributeWe have historically distributed a significant portion of our cash through regular quarterly dividends, and our ability to grow and make acquisitions with cash on hand could be limited.
Pursuant to our cash dividend policy, we
We have historically distributed and intend in the future to distribute, a significant portion of our cash through regular quarterly dividends to holders of our Class A common stock and dividends on our Series A Preferred Stock. In the future, we may also distribute a significant amount of cash through dividends. As such, our growth may not be as fast as that of businesses that reinvest their available cash to expand ongoing operations, and we may have to rely upon external financing sources, including the issuance of debt, equity securities, convertible subordinated notes and borrowings under our Senior Credit Facility and Subordinated Facility. These sources may not be available, and our ability to grow and maintain our business may be limited.
Due to the COVID-19 pandemic, we
We may have liquidity needs that would prevent us from continuing our historical practice as it relates to the payment of dividends on our Class A common stock and Series A Preferred Stock. The primary factorsfactor that would lead to a change in the dividend policy would be decreased liquidity due to a decreasing customer book, bad debt associated with the policies adopted by state and regulatory authorities, and increased collateral requirements from suppliers. At this time, we cannot predict the impact the pandemic will have on our ability to continue to pay shareholder dividends.book.
We may not be able to manage our growth successfully.
The growth of our operations will depend upon our ability to expand our customer base in our existing markets and to enter new markets in a timely manner at reasonable costs, organically or through acquisitions. In order for us to recover expenses incurred in entering new markets and obtaining new customers, we must attract and retain customers on economic terms and for extended periods. Customer growth depends on several factors outside of our control, including economic and demographic conditions, such as population changes, job and income growth, housing starts, new business formation and the overall level of economic activity. We may experience difficulty managing our growth and implementing new product offerings, integrating new customers and employees, and complying with applicable market rules and the infrastructure for product delivery.
State regulations may adversely impact customer acquisition and renewal revenue and profitability, and organic growth. For example, New York State limits the types of services energy retailer marketers may offer new customers or renewals, in terms of pricing for non-renewable commodities and renewable product offerings.
Expanding our operations also may require continued development of our operating and financial controls and may place additional stress on our management and operational resources. We may be unable to manage our growth and development successfully.
Our financial results fluctuate on a seasonal, quarterly and annual basis.
Our overall operating results fluctuate substantially on a seasonal, quarterly and annual basis depending on: (1) the geographic mix of our customer base; (2) the relative concentration of our commodity mix; (3) weather conditions, which directly influence the demand for natural gas and electricity and affect the prices of energy commodities; and (4) variability in market prices for natural gas and electricity. These factors can have material short-term impacts on monthly and quarterly operating results, which may be misleading when considered outside of the context of our annual operating cycle. In addition, our accounts payable and accounts receivable are impacted by seasonality due to the timing differences between when we pay our suppliers for accounts payable versus when we collect from our customers on accounts receivable. We typically pay our suppliers for purchases of natural gas on a monthly basis and electricity on a weekly basis. However, it takes approximately two months from the time we deliver the electricity or natural gas to our customers before we collect from our customers on accounts receivable attributable
to those product deliveries. This timing difference could affect our cash flows, especially during peak cycles in the winter and summer months. Furthermore, as a result of the seasonality of our business, we may reserve a portion of our excess cash available for distribution in the first and fourth quarters in order to fund our second and third quarter distributions.
Additionally, we enter into a variety of financial derivative and physical contracts to manage commodity price risk, and we use mark-to-market accounting to account for this hedging activity. Under the mark-to-market accounting method, changes in the fair value of our hedging instruments that are not qualifying or not designated as hedges under accounting rules are recognized immediately in earnings. As a result of this accounting treatment, changes in the forward prices of natural gas and electricity cause volatility in our quarterly and annual earnings, which we are unable to fully anticipate.
We could also incur volatility from quarter to quarter associated with gains and losses on settled hedges relating to natural gas held in inventory if we choose to hedge the summer-winter spread on our retail allocated storage capacity. We typically purchase natural gas inventory and store it from April to October for withdrawal from November through March. Since a portion of the inventory is used to satisfy delivery obligations to our fixed-price customers over the winter months, we hedge the associated price risk using derivative contracts. Any gains or losses associated with settled derivative contracts are reflected in the statement of operations as a component of retail cost of sales and net asset optimization.
We may have difficulty retaining our existing customers or obtaining a sufficient number of new customers, due to competition and for other reasons.
The markets in which we compete are highly competitive, and we may face difficulty retaining our existing customers or obtaining new customers due to competition. We encounter significant competition from local regulated utilities or their retail affiliates and traditional and new retail energy providers. Competitors may offer different products, lower prices, and other incentives, which may attract customers away from our business. Many of these competitors or potential competitors are larger than us, have access to more significant capital resources, have stronger vendor relationships, have more well-established brand names and have larger existing installed customer bases.
Additionally, existing customers may switch to other retail energy service providers during their contract terms in the event of a significant decrease in the retail price of natural gas or electricity in order to obtain more favorable prices. Although we generally have a right to collect a termination fee from each customer on a fixed-price contract who terminates their contract early, we may not be able to collect the termination fees in full or at all. Our variable-price contracts can typically be terminated by our customers at any time without penalty. We may be unable to obtain new customers or maintain our existing customers due to competition or otherwise.
Increased collateral requirements in connection with our supply activities may restrict our liquidity.
Our contractual agreements with certain local regulated utilities and our supplier counterparties require us to maintain restricted cash balances or letters of credit as collateral for credit risk or the performance risk associated with the future delivery of natural gas or electricity. These collateral requirements may increase as we grow our customer base. Collateral requirements will increase based on the volume or cost of the commodity we purchase in any given month and the amount of capacity or service contracted for with the local regulated utility. Significant changes in market prices also can result in fluctuations in the collateral that local regulated utilities or suppliers require.
In addition, due to the COVID-19 pandemic, certain local regulated utilities and our supplier counterparties have contacted us inquiring about our financial condition and the impact the pandemic is having on our operations. These inquiries may lead to additional requests for cash or letters of credit in an effort to mitigate the risk of default in paying our obligations related to the future delivery of natural gas or electricity. As of December 31, 2020, we had not been required to post additional collateral as a result of COVID-19. We have no way to predict what the local regulated utilities or our supplier counterparties may ask for in terms of additional collateral in the future or how long any increased levels of collateral may endure.
The effectiveness of our operations and future growth depend in part on the amount of cash and letters of credit available to enter into or maintain these contracts. The cost of these arrangements may be affected by changes in credit markets, such as interest rate spreads in the cost of financing between different levels of credit ratings. These liquidity requirements may be greater than we anticipate or are able to meet.
We face risks related to health epidemics, pandemics and other outbreaks.
Epidemics, widespread illness or other major health crises, such as COVID-19, may adversely affect the United States' economic growth, demand for natural gas and electricity in our key markets as well as the ability of various employees, customers, contractors, suppliers and other business partners to fulfill their obligations, which could have a material adverse effect on our business, financial condition or results of operations. Actions taken by governmental authorities and third parties to contain and mitigate the risk of spread of any major public health crisis, including COVID-19, may negatively impact our business, including a disruption of or change to our operating plans.
We are subject to direct credit risk for certain customers who may fail to pay their bills as they become due.
We bear direct credit risk related to customers located in markets that have not implemented POR programs as well as indirect credit risk in those POR markets that pass collection efforts along to us after a specified non-payment period. For the year ended December 31, 2020,2023, customers in non-POR markets represented approximately 36%45% of our retail revenues. We generally have the ability to terminate contracts with customers in the event of non-payment, but in most states in which we operate we cannot disconnect their natural gas or electricity service. In POR markets where the local regulated utility has the ability to return non-paying customers to us after specified periods, we may realize a loss for one to two billing periods until we can terminate these customers’ contracts. We may also realize a loss on fixed-price customers in this scenario due to the fact that we will have already fully hedged the customer’s expected commodity usage for the life of the contract and we also remain liable to our suppliers of natural gas and electricity for the cost of our supply commodities. Furthermore, in the Texas market, we are responsible for billing the distribution charges for the local regulated utility and are at risk for these charges, in addition to the cost of the commodity, in the event customers fail to pay their bills. Changing economic factors, such as rising unemployment rates and energy prices also result in a higher risk of customers being unable to pay their bills when due.
In addition, the ongoing COVID-19 pandemic has caused regulatory agencies and other governmental authorities to take, and potentially continue to take, emergency or other actions in light of the pandemic that continue to impact us, including prohibiting the termination of service for non-payment during the current COVID-19 pandemic, requiring deferred payment plans for certain customers unable to pay their bill, and utilities increasing POR fees they charge us in an effort to recoup their bad debts losses. Because of the time lag between the delivery of electricity and natural gas, the issuance of an invoice, and the customer’s payment due date, there may be a substantial lag in time before we are able to determine specific trends in bad debt expense as a result of COVID-19. We are also monitoring other events that may have an impact on our credit risk, such as the expiration of unemployment benefits in December 2020 in many of our service territories. These actions taken by regulatory agencies and governmental authorities may impact our financial results, cash flow and liquidity and the duration of these changes are unknown. At this time, we are unable to predict the impact that this or other related events may have on our collection efforts due to non-payment.
We depend on the accuracy of data in our information management systems, which subjects us to risks.
We depend on the accuracy and timeliness of our information management systems for billing, collections, consumption and other important data. We rely on many internal and external sources for this information, including:
•our marketing, pricing and customer operations functions; and
•various local regulated utilities and ISOs for volume or meter read information, certain billing rates and billing types (e.g., budget billing) and other fees and expenses.
Inaccurate or untimely information, which may be outside of our direct control, could result in:
•inaccurate and/or untimely bills sent to customers;
•incorrect tax remittances;
•reduced effectiveness and efficiency of our operations;
•inability to adequately hedge our portfolio;
•increased overhead costs;
•inaccurate accounting and reporting of customer revenues, gross margin and accounts receivable activity;
•inaccurate measurement of usage rates, throughput and imbalances;
•customer complaints; and
•increased regulatory scrutiny.
We are also subject to disruptions in our information management systems arising out of events beyond our control, such as natural disasters, pandemics, epidemics, failures in hardware or software, power fluctuations, telecommunications and other similar disruptions.
Cyberattacks and data security breaches could adversely affect our business.
Cybersecurity risks have increased in recent years as a result of the proliferation of new technologies and the increased sophistication, magnitude and frequency of cyberattacks and data security breaches. A cyber-attack on our information management systems or those of our vendors could severely disrupt business operations, preventing us from billing and collecting revenues, and could result in significant expenses to investigate and repair security breaches or system damage, lead to litigation, fines, other remedial action, heightened regulatory scrutiny, diminished customer confidence and damage to our reputation. Although we maintain cyber-liability insurance that covers certain damage caused by cyber events, it may not be sufficient to cover us in all circumstances.
Our success depends on key members of our management, the loss of whom could disrupt our business operations.
We depend on the continued employment and performance of key management personnel. A number of our senior executives have substantial experience in consumer and energy markets that have undergone regulatory restructuring and have extensive risk management and hedging expertise. We believe their experience is important to our continued success. We do not maintain key life insurance policies for our executive officers. Our key executives may not continue in their present roles and may not be adequately replaced.
We rely on third party vendors for our customer acquisition verification, billing and transactions platform that exposes us to third party performance risk and other risk.
We have outsourced our back office customer billing and transactions platforms to third party vendors, and we rely heavily on the continued performance of the vendors under our current outsourcing agreement. Our vendors may fail to operate in accordance with the terms of the outsourcing agreement, be subject to cyber-security attacks, or a bankruptcy or other event may prevent them from performing under our outsourcing agreement.
A large portion of our current customers are concentrated in a limited number of states, making us vulnerable to customer concentration risks.
As of December 31, 2020,2023, approximately 60%59% of our RCEs were located in five states. Specifically, 15%21%, 14%11%, 13%11%, 9%8% and 9%7% of our customers on an RCE basis were located in PA, TX, NY, TX, PA, IL,NJ, and MA, respectively. If we are unable to increase our market share across other competitive markets or enter into new competitive markets effectively, we may be subject to continued or greater customer concentration risk. The states that contain a large percentage of our customers could reverse regulatory restructuring or change the regulatory environment in a manner that causes us to be unable to operate economically in that state.
Increases in state renewable portfolio standards or an increase in the cost of renewable energy credit and carbon offsets may adversely impact the price, availability and marketability of our products.
Pursuant to state renewable portfolio standards, we must purchase a specified amount of RECs based on the amount of electricity we sell in a state in a year. In addition, we have contracts with certain customers that require us to purchase RECs or carbon offsets and as part of sustainability efforts have made a corporate commitment to fully offset 100% of customer volume beginning on April 1, 2021 with RECS or carbon offsets. If a state increases its renewable portfolio standards, the demand for RECs within that state will increase and therefore the market price for RECs could increase. We attempt to forecast the price for the required RECs and carbon offsets at the end of each month and incorporate this forecast into our customer pricing models, but the price paid for RECs and carbon offsets may be higher than forecasted. We may be unable to
fully pass the higher cost of RECs through to our customers, and increases in the price of RECs may decrease our results of operations and affect our ability to compete with other energy retailers that have not contracted with customers to purchase RECs or carbon offsets. Further, a price increase for RECs or carbon offsets may require us to decrease the renewable portion of our energy products, which may result in a loss of customers. A further reduction in benefits received by local regulated utilities from production tax credits in respect of renewable energy may adversely impact the availability to us, and marketability by us, of renewable energy under our brands.
Our access to marketing channels may be contingent upon the viability of our telemarketing and door-to-door agreements with our vendors.
Our vendors are essential to our telemarketing and door-to-door sales activities. Our ability to increase revenues in the future will depend significantly on our access to high quality vendors. If we are unable to attract new vendors and retain existing vendors to achieve our marketing targets, our growth may be materially reduced. There can be no assurance that competitive conditions will allow these vendors and their independent contractors to continue to successfully sign up new customers. Further, if our products are not attractive to, or do not generate sufficient revenue for our vendors, we may lose our existing relationships. In addition, the decline in landlines reduces the number of potential customers that may be reached by our telemarketing efforts and, as a result, our telemarketing sales channel may become less viable and we may be required to use more door-to-door marketing. Door-to-door marketing is continually under scrutiny by state regulators and legislators, which may lead to new rules and regulations that impact our ability to use these channels.
Due to the COVID-19 pandemic, certain public utility commissions, regulatory agencies, and other governmental authorities in most of our markets continue to maintain orders prohibiting energy services companies from door-to-door marketing, and in some cases telemarketing, during the pandemic, which has restricted some of the manners we use to market for organic sales. In response, the Company has focused on development of products and channels, partners for web sales, as well as accelerating its telemarketing sales quality programs. In November, 2020, the Company began active door-to-door marketing activities in certain markets where allowed by states’ regulations.
Our vendors may expose us to risks.
We are subject to reputational risks that may arise from the actions of our vendors and their independent contractors that are wholly or partially beyond our control, such as violations of our marketing policies and procedures as well as any failure to comply with applicable laws and regulations. If our vendors engage in marketing practices that are not in compliance with local laws and regulations, we may be in breach of applicable laws and regulations that may result in regulatory proceedings, disadvantageous conditioning of our energy retailer license, or the revocation of our energy retailer license. Unauthorized activities in connection with sales efforts by agents of our vendors, including calling consumers in violation of the TCPA and predatory door-to-door sales tactics and fraudulent misrepresentation could subject us to class action lawsuits against which we will be required to defend. Such defense efforts will be costly and time consuming. In addition, the independent contractors of our vendors may consider us to be their employer and seek compensation.
We rely on third party vendors for our customer billing and transactions platform that exposes us to third party performance risk and cyber-security risk. We have outsourced our back office customer verification, billing and transactions platforms to third party vendors, and we rely heavily on the continued performance of the vendors under our current outsourcing agreement. Our vendors may fail to operate in accordance with the terms of the outsourcing agreement or a bankruptcy or other event may prevent them from performing under our outsourcing agreement.
Risks Related to Our Capital Structure and Capital Stock
Our indebtedness could adversely affect our ability to raise additional capital to fund our operations or pay dividends. It could also expose us to the risk of increased interest rates and limit our ability to react to changes in the economy or our industry as well as impact our cash available for distribution.
We have $100.0$97.0 million of indebtedness outstanding and $31.0$24.3 million in issued letters of credit under our Senior Credit Facility, and zero ofno indebtedness outstanding under our Subordinated Facility as of December 31, 2020.2023. Debt we incur under our Senior Credit Facility, Subordinated Facility or otherwise could have negative consequences, including:
•increasing our vulnerability to general economic and industry conditions;
•requiring cash flow from operations to be dedicated to the payment of principal and interest on our indebtedness, therefore reducing or eliminating our ability to pay dividends to holders of our Class A common stock and Series A Preferred Stock, or to use our cash flow to fund our operations, capital expenditures and future business opportunities;
•limiting our ability to fund future acquisitions or engage in other activities that we view as in our long-term best interest;
•restricting our ability to make certain distributions with respect to our capital stock and the ability of our subsidiaries to make certain distributions to us, in light of restricted payment and other financial covenants, including requirements to maintain certain financial ratios, in our credit facilities and other financing agreements;
•exposing us to the risk of increased costs due to changes in interest rates because certain of our borrowings are at variable rates of interest;
•limiting our ability to obtain additional financing for working capital including collateral postings, capital expenditures, debt service requirements, acquisitions and general corporate or other purposes; and
•limiting our ability to adjust to changing market conditions and placing us at a competitive disadvantage compared to our competitors who have less debt.
If we are unable to satisfy financial covenants in our debt instruments, it could result in an event of default that, if not cured or waived, may entitle the lenders to demand repayment or enforce their security interests. Our Senior Credit Facility will mature in July 31, 2022,June 30, 2025, and we cannot assure that we will be able to negotiate a new credit arrangement on commercially reasonable terms.
In addition, our ability to arrange financing and the costs of such capital, are dependent on numerous factors, including:
•general economic and capital market conditions;
•credit availability from banks and other financial institutions;
•investor confidence;
•our financial performance and the financial performance of our subsidiaries;
•our level of indebtedness and compliance with covenants in debt agreements;
•maintenance of acceptable credit ratings;
•cash flow; and
•provisions of tax and securities laws that may impact raising capital.
We may not be successful in obtaining additional capital for these or other reasons. The failure to obtain additional capital from time to time may have a material adverse effect on its business and operations.
Our ability to pay dividends depends on many factors, including the performance of our business, cash flows, RCE counts and the margins we receive, as well as restrictions under our Senior Credit Facility.
We cannot assure you that we will be able to continue paying our targeted quarterly dividend to the holders of our Class A common stock or dividends to the holders of our Series A Preferred Stock in the future.
The amount of our cash available for distribution principally depends upon the amount of cash we generate from our operations, which fluctuates from quarter to quarter based on, among other things:
•changes in commodity prices, which may be driven by a variety of factors, including, but not limited to, weather conditions, seasonality and demand for energy commodities and general economic conditions;
•the level and timing of customer acquisition costs we incur;
•the level of our operating and general and administrative expenses;
•seasonal variations in revenues generated by our business;
•our debt service requirements and other liabilities;
•fluctuations in our working capital needs;
•our ability to borrow funds and access capital markets;
•restrictions contained in our debt agreements (including our Senior Credit Facility);
•management of customer credit risk;
•abrupt changes in regulatory policies; and
•other business risks affecting our cash flows.
As a result of these and other factors, we cannot guarantee that we will have sufficient cash generated from operations to pay the dividends on our Series A Preferred Stock or to pay a specific level of cash dividends to holders of our Class A common stock.Stock. Further, we could be prevented from paying cash dividends under Delaware law if certain capital requirements are not met.met, and may be further restricted by covenants in our Senior Credit Facility.
The amount of cash available for distribution depends primarily on our cash flow, and is not solely a function of profitability, which is affected by non-cash items. We may incur other expenses or liabilities during a period that could significantly reduce or eliminate our cash available for distribution and, in turn, impair our ability to pay dividends to holders of our Class A common stock and Series A Preferred Stock during the period. Additionally, the dividends paid on Series A Preferred Stock reduce the amount of cash we have available to pay dividends on our Class A common stock.
Each new share of Class A common stock and Series A Preferred Stock issued increases the cash required to continue to pay cash dividends. Any Class A common stock or preferred stock (whether Series A Preferred Stock or a new series of preferred stock) that may in the future be issued to finance acquisitions, upon exercise of stock options or otherwise, would have a similar effect.
Finally, future dividends to holders of our Class A common stock are paid atwithin the discretion of our boardBoard of directors. HoldersDirectors, and will depend upon our operations, our financial condition, capital requirements and investment opportunities, the performance of sharesour business, cash flows, RCE counts and the margins we receive, as well as restrictions under our Senior Credit Facility. The Board of ClassDirectors may be required to reduce or eliminate quarterly cash distributions, including the dividends to the holders of the Series A common stock andPreferred Stock. Even if we are permitted to pay such dividends on the Series A Preferred Stock, do not have a rightour Board of Directors may elect to reduce or eliminate the dividends on such shares unless declaredthe Series A Preferred Stock to maintain cash balances for operations or set aside for payment byother reasons. Any reduction or elimination of cash dividends on our boardSeries A Preferred Stock will likely materially and adversely affect the price of directors. Our board of directors may decrease the level of or entirely discontinue payment of dividends.Series A Preferred Stock.
We are a holding company. Our sole material asset is our equity interest in Spark HoldCo, LLC ("Spark HoldCo") and we are accordingly dependent upon distributions from Spark HoldCo to pay dividends on the Class A common stock and Series A Preferred Stock.
We are a holding company and have no material assets other than our equity interest in Spark HoldCo, and have no independent means of generating revenue. Therefore, we depend on distributions from Spark HoldCo to meet our debt service and other payment obligations, and to pay dividends on our Class A common stock and Series A Preferred Stock. Spark HoldCo or its subsidiaries may be restricted from making distributions to us under applicable law or regulation or under the terms of their financing arrangements, or may otherwise be unable to provide such funds.
The Class A common stock and Series A Preferred Stock are subordinated to our existing and future debt obligations.
The Class A common stock and Series A Preferred Stock are subordinated to all of our existing and future indebtedness (including indebtedness outstanding under the Senior Credit Facility). Therefore, if we become bankrupt, liquidate our assets, reorganize or enter into certain other transactions, assets will be available to pay our obligations with respect to the Series A Preferred Stock only after we have paid all of our existing and future indebtedness in full. The Class A common stock will only receive assets to the extent all existing and future indebtedness and obligations under the Series A Preferred Stock is paid in full. If any of these events were to occur, there may be insufficient assets remaining to make any payments to holders of the Series A Preferred Stock or Class A common stock.
Additionally, none of our subsidiaries have guaranteed or otherwise become obligated with respect to the Class A common stock or Series A Preferred Stock. As a result, the Class A common stock and Series A Preferred Stock effectively rank junior to all existing and future indebtedness and other liabilities of our subsidiaries, including our operating subsidiaries, and any capital stock of our subsidiaries not held by us. Accordingly, our right to receive assets from any of our subsidiaries upon our bankruptcy, liquidation or reorganization, and the right of holders of shares of Class A common stock and Series A Preferred Stock to participate in those assets, is also structurally subordinated to claims of that subsidiary’s creditors, including trade creditors. Even if we were a creditor of any of our subsidiaries, our rights as a creditor would be subordinate to any security interest in the assets of that subsidiary and any indebtedness of that subsidiary senior to that held by us.
Numerous factors may affect the trading price of the Class A common stock and Series A Preferred Stock.
The trading price of the Class A common stock and Series A Preferred Stock may depend on many factors, some of which are beyond our control. Additionally, the market price of our Class A common stock and Series A Preferred Stock may be highly volatile and may fluctuate substantially as a result of a number of factors. The following factors are beyond our control including:and could affect our stock price:
•the pending merger, and if it is completed;
•the impact of our reverse stock split on our common stock;
•the announcement of the elimination, suspension, reduction or reinstatement of dividends on Class A common stock and Series A Preferred Stock;
•the public reaction to our press releases, our other public announcements and our filings with the SEC;
•trading volumes of the Class A common stock and Series A Preferred Stock;
•prevailing interest rates;
•the market for similar securities;
•general economic and financial market conditions;
•our issuance of debt or other preferred equity securities; and
•our financial condition, results of operations and prospects.
These and other factors may cause the market price and demand for our Class A common stock and Series A Preferred Stock to fluctuate substantially, which may adversely affect the trading price of our Class A common stock and Series A Preferred Stock. In the past, when the market price of a stock has been volatile, holders of that stock have often instituted securities class action litigation against the company that issued the stock. If any of our stockholders brought a lawsuit against us, we could incur substantial defense costs. Such a lawsuit could also divert the time and attention of our management from our business. Trading prices and corresponding market value of Class A common stock and Series A Preferred Stock may also impact our ability to satisfy continued listing standards of The Nasdaq Global Select Market, or a particular tier of The Nasdaq exchanges.
One of the factors that will influence the price of the Class A common stock and Series A Preferred Stock will be the distribution yield of the securities (as a percentage of the then market price of the securities) relative to market interest rates. Increases in market interest rates, which have been at low levels relative to historical rates, may lead prospective purchasers of shares of Class A common stock or Series A Preferred Stock to expect a higher distribution yield, and cause them to sell their Class A common stock or Series A Preferred Stock. Accordingly, higher market interest rates could cause the market price of the Class A common stock and Series A Preferred Stock to decrease.
In addition, over the last several years, prices of equity securities in the U.S. trading markets have been experiencing extreme price fluctuations. As a result of these and other factors, investors holding our Class A common stock and Series A Preferred Stock may experience a decrease in the value of their securities, which could be substantial and rapid, and could be unrelated to our financial condition, performance or prospects.
There may not be an active trading market for the Class A common stock or Series A Preferred Stock, which may in turn reduce the market value and your ability to transfer or sell your shares of Class A common stock or Series A Preferred Stock.
There are no assurances that there will be an active trading market for our Class A common stock or Series A Preferred Stock. The liquidity of any market for the Class A common stock and Series A Preferred Stock depends upon the number of stockholders, our results of operations and financial condition, the market for similar securities, the interest of securities dealers in making a market in the Class A common stock and Series A Preferred Stock, and other factors. To the extent that an active trading market is not maintained, the liquidity and trading prices for the Class A common stock and Series A Preferred Stock may be harmed.
Furthermore, because the Series A Preferred Stock does not have any stated maturity and is not subject to any sinking fund or mandatory redemption, stockholders seeking liquidity will be limited to selling their respective shares of Series A Preferred Stock in the secondary market. Active trading markets for the Series A Preferred Stock may not exist at such times, in which case the trading price of your shares of our Series A Preferred Stock could be reduced and your ability to transfer such shares could be limited.
Our FounderMr. Maxwell holds a substantial majority of the voting power of our common stock.
Holders of Class A and Class B common stock vote together as a single class on all matters presented to our stockholders for their vote or approval, except as otherwise required by applicable law or our certificate of incorporation and bylaws. Our Founder controls 65.8%Mr. Maxwell beneficially owns approximately 65.0% of the combined voting power (excluding treasury shares) of the Class A and Class B common stock as of December 31, 20202023 through his direct and indirect ownership in us.
Affiliated owners are entitled to act separately with respect to their investment in us, and they have the ability to elect all of the members of our board of directors, and thereby to control our management and affairs. In addition, affiliates are able to determine the outcome of all matters requiring Class A common stock and Class B common stock shareholder approval, including mergers and other material transactions, and isare able to cause or prevent a change in the composition of our board of directors or a change in control of our company that could deprive our stockholders of an opportunity to receive a premium for their Class A common stock as part of a sale of our company. The existence of a significant shareholder, such as our Founder,Mr. Maxwell, may also have the effect of deterring hostile takeovers, delaying or preventing changes in control or changes in management, or limiting the ability of our other stockholders to approve transactions that they may deem to be in the best interests of our company.
So long as affiliates continue to control a significant amount of our common stock, they will continue to be able to strongly influence all matters requiring shareholder approval, regardless of whether other stockholders believe that a potential transaction is in their own best interests. In any of these matters, the interests of affiliates may differ or conflict with the interests of our other stockholders. Moreover, this concentration of stock ownership may also adversely affect the trading price of our Class A common stock or Series A Preferred Stock to the extent investors perceive a disadvantage in owning stock of a company with a controlling shareholder.
Holders of Series A Preferred Stock have extremely limited voting rights.
Voting rights of holders of shares of Series A Preferred Stock are extremely limited. Our Class A common stock and our Class B common stock are the only classes of our securities carrying full voting rights. Holders of the Series A Preferred Stock generally have no voting rights. As of April 15, 2022, we have the option to redeem our Series A Preferred Stock.
We have engaged in transactions with our affiliates in the past and expect to do so in the future. The terms of such transactions and the resolution of any conflicts that may arise may not always be in our or our stockholders’ best interests.
We have engaged in transactions and expect to continue to engage in transactions with affiliated companies. We have acquired companies and books of customers from our affiliates and may do so in the future. We will continue to enter into back-to-back transactions for purchases of commodities and derivatives on behalf of our affiliate. We will also continue to pay certain expenses on behalf of several of our affiliates for which we will seek reimbursement. We will also continue to share our corporate headquarters with certain affiliates. We cannot assure that our affiliates will reimburse us for the costs we have incurred on their behalf or perform their obligations under any of these contracts.
Our amended and restated certificate of incorporation and amended and restated bylaws, as well as Delaware law, contain provisions that could discourage acquisition bids or merger proposals, which may adversely affect the market price of our Class A common stock.
Our amended and restated certificate of incorporation authorizes our board of directors to issue preferred stock without shareholder approval. On September 20, 2019,August 5, 2022, we filed a registration statement under the Securities Act on Form S-3 allowing us to offer and sell, from time to time, among other securities, shares of preferred stock. The registration statement was declared effective on October 18, 2019.August 16, 2022. The election by our board of directors to issue preferred stock with anti-takeover provisions could make it more difficult for a third party to acquire us.
In addition, some provisions of our amended and restated certificate of incorporation and amended and restated bylaws could make it more difficult for a third party to acquire control of us, even if the change of control would be
beneficial to our stockholders. Among other things, our amended and restated certificate of incorporation and amended and restated bylaws:
•provide for our board of directors to be divided into three classes of directors, with each class as nearly equal in number as possible, serving staggered three year terms. Our staggered board may tend to discourage a third party from making a tender offer or otherwise attempting to obtain control of us, because it generally makes it more difficult for shareholders to replace a majority of the directors;
•provide that the authorized number of directors may be changed only by resolution of the board of directors;
•provide that all vacancies in our board, including newly created directorships, may, except as otherwise required by law or, if applicable, the rights of holders of a series of preferred stock, be filled by the affirmative vote of a majority of directors then in office, even if less than a quorum;
•provide our board of directors the ability to authorize undesignated preferred stock. This ability makes it possible for our board of directors to issue, without shareholder approval, preferred stock with voting or other rights or preferences that could impede the success of any attempt to change control of us. These and other provisions may have the effect of deferring hostile takeovers or delaying changes in control or management of our company;
•provide that at any time after the first date upon which W. KeithMr. Maxwell III no longer beneficially owns more than fifty percent of the outstanding Class A common stock and Class B common stock, any action required or permitted to be taken by the shareholders must be effected at a duly called annual or special meeting of shareholders and may not be effected by any consent in writing in lieu of a meeting of such shareholders, subject to the rights of the holders of any series of preferred stock with respect to such series (prior to such time, such actions may be taken without a meeting by written consent of holders of the outstanding stock having not less than the minimum number of votes that would be necessary to authorize or take such action at a meeting);
•provide that at any time after the first date upon which W. KeithMr. Maxwell III no longer beneficially owns more than fifty percent of the outstanding Class A common stock and Class B common stock, special meetings of our shareholders may only be called by the board of directors, the chief executive officer or the chairman of the board (prior to such time, special meetings may also be called by our Secretary at the request of holders of record of fifty percent of the outstanding Class A common stock and Class B common stock);
•provide that our amended and restated certificate of incorporation and amended and restated bylaws may be amended by the affirmative vote of the holders of at least two-thirds of our outstanding stock entitled to vote thereon;
•provide that our amended and restated bylaws can be amended by the board of directors; and
•establish advance notice procedures with regard to shareholder proposals relating to the nomination of candidates for election as directors or new business to be brought before meetings of our shareholders. These procedures provide that notice of shareholder proposals must be timely given in writing to our corporate secretary prior to the meeting at which the action is to be taken. These requirements may preclude shareholders from bringing matters before the shareholders at an annual or special meeting.
In addition, in our amended and restated certificate of incorporation, we have elected not to be subject to the provisions of Section 203 of the Delaware General Corporation Law (the “DGCL”) regulating corporate takeovers until the date on which W. KeithMr. Maxwell III no longer beneficially owns in the aggregate more than fifteen percent of the outstanding Class A common stock and Class B common stock. On and after such date, we will be subject to the provisions of Section 203 of the DGCL.
Our amended and restated certificate of incorporation designates the Court of Chancery of the State of Delaware as the sole and exclusive forum for certain types of actions and proceedings that may be initiated by our stockholders, which could limit our stockholders’ ability to obtain a favorable judicial forum for disputes with us or our directors, officers, employees or agents.
Our amended and restated certificate of incorporation provides that, unless we consent in writing to the selection of an alternative forum, the Court of Chancery of the State of Delaware will, to the fullest extent permitted by
applicable law, be the sole and exclusive forum for (i) any derivative action or proceeding brought on our behalf, (ii) any action asserting a claim of breach of a fiduciary duty owed by any of our directors, officers, employees or agents to us or our stockholders, (iii) any action asserting a claim against us or any director or officer or other employee of ours arising pursuant to any provision of the DGCL, our amended and restated certificate of incorporation or our bylaws, or (iv) any action asserting a claim against us or any director or officer or other employee of ours that is governed by the internal affairs doctrine, in each such case subject to such Court of Chancery having personal jurisdiction over the indispensable parties named as defendants therein. This exclusive forum provision would not apply to suits brought to enforce any liability or duty created by the Securities Act or the Exchange Act or any other claim for which the federal courts have exclusive jurisdiction. To the extent that any such claims may be based upon federal law claims, Section 27 of the Exchange Act creates exclusive federal jurisdiction over all suits brought to enforce any duty or liability created by the Exchange Act or the rules and regulations thereunder. Furthermore, Section 22 of the Securities Act creates concurrent jurisdiction for federal and state courts over all suits brought to enforce any duty or liability created by the Securities Act or the rules and regulations thereunder.
Any person or entity purchasing or otherwise acquiring any interest in shares of our capital stock will be deemed to have notice of, and consented to, the provisions of our amended and restated certificate of incorporation described in the preceding sentence. This choice of forum provision may limit a stockholder’s ability to bring a claim in a judicial forum that it finds favorable for disputes with us or our directors, officers, employees or agents, which may discourage such lawsuits against us and such persons. Alternatively, if a court were to find these provisions of our amended and restated certificate of incorporation inapplicable to, or unenforceable in respect of, one or more of the specified types of actions or proceedings, we may incur additional costs associated with resolving such matters in other jurisdictions, which could adversely affect our business, financial condition or results of operations.
Future sales of our Class A common stock and Series A Preferred Stock in the public market could reduce the price of the Class A common stock and Series A Preferred Stock, and may dilute your ownership in us.
On September 20, 2019,August 5, 2022, we filed a registration statement under the Securities Act on Form S-3 registering the primary offer and sale, from time to time, of Class A common stock, preferred stock, depositary shares and warrants. The registration statement also registers the Class A common stock held by our affiliates, Retailco and NuDevco (including Class A common stock that may be obtained upon conversion of Class B common stock). All of the shares of Class A common stock held by Retailco and NuDevco and registered on the registration statement may be immediately resold. The registration statement was declared effective on October 18, 2019.August 16, 2022.
We cannot predict the size of future issuances of our Class A common stock or securities convertible into Class A common stock or the effect, if any, that future issuances or sales of shares of our Class A common stock will have on the market price of our Class A common stock. Sales of substantial amounts of our Class A common stock (including shares issued in connection with an acquisition), or the perception that such sales could occur, may adversely affect prevailing market prices of our Class A common stock.
We may also in the future sell additional shares of preferred stock, including shares of Series A Preferred Stock, on terms that may differ from those we have previously issued. Such shares could rank on parity with or, subject to the voting rights referred to above (with respect to issuances of new series of preferred stock), senior to the Series A Preferred Stock as to distribution rights or rights upon liquidation, winding up or dissolution. The subsequent issuance of additional shares of Series A Preferred Stock, or the creation and subsequent issuance of additional classes of preferred stock on parity with the Series A Preferred Stock, could dilute the interests of the holders of Series A Preferred Stock, and could affect our ability to pay distributions on, redeem or pay the liquidation preference on the Series A Preferred Stock. Any issuance of preferred stock that is senior to the Series A Preferred Stock would not only dilute the interests of the holders of Series A Preferred Stock, but also could affect our ability to pay distributions on, redeem or pay the liquidation preference on the Series A Preferred Stock.
Furthermore, subject to compliance with the Securities Act or exemptions therefrom, employees who have received Class A common stock as equity awards may also sell their shares into the public market.
We have issued preferred stock and may continue to do so, and the terms of such preferred stock could adversely affect the voting power or value of our Class A common stock.
Our certificate of incorporation authorizes us to issue, without the approval of our stockholders, one or more classes or series of preferred stock having such designations, preferences, limitations and relative rights, including preferences over our Class A common stock with respect to dividends and distributions, as our board of directors may determine. Through December 31, 2020,2023, we have issued an aggregate of 3,707,2563,567,543 shares of Series A Preferred Stock.
The terms of the preferred stock we offer or sell could adversely impact the voting power or value of our Class A common stock. For example, we might grant holders of preferred stock the right to elect some number of our directors in all events or on the happening of specified events or the right to veto specified transactions. Similarly, the repurchase or redemption rights or liquidation preferences we might assign to holders of preferred stock, such as the Series A Preferred Stock, could affect the residual value of the Class A common stock.
Our amended and restated certificate of incorporation limits the fiduciary duties of one of our directors and certain of our affiliates and restricts the remedies available to our stockholders for actions taken by our FounderMr. Maxwell or certain of our affiliates that might otherwise constitute breaches of fiduciary duty.
Our amended and restated certificate of incorporation contains provisions that we renounce any interest in existing and future investments in other entities by, or the business opportunities of, NuDevco Partners, LLC, NuDevco Partners Holdings, LLC and W. KeithMr. Maxwell, III, or any of their officers, directors, agents, shareholders, members, affiliates and subsidiaries (other than a director or officer who is presented an opportunity solely in his capacity as a director or officer). Because of this provision, these persons and entities have no obligation to offer us those investments or opportunities that are offered to them in any capacity other than solely as an officer or director. If one of these persons or entities pursues a business opportunity instead of presenting the opportunity to us, we will not have any recourse against such person or entity for a breach of fiduciary duty.
The Series A Preferred Stock represent perpetual equity interests in us, and investors should not expect us to redeem the Series A Preferred Stock on the date the Series A Preferred Stock becomes redeemable by us or on any particular date afterwards.
The Series A Preferred Stock represents a perpetual equity interest in us, and the securities have no maturity or mandatory redemption date and are not redeemable at the option of investors under any circumstances. As a result, unlike our indebtedness, the Series A Preferred Stock will not give rise to a claim for payment of a principal amount at a particular date. As a result, holders of the Series A Preferred Stock may be required to bear the financial risks of an investment in the Series A Preferred Stock for an indefinite period of time. In addition, the Series A Preferred Stock will rank junior to all our current and future indebtedness (including indebtedness outstanding under the Senior Credit Facility) and other liabilities. The Series A Preferred Stock will also rank junior to any other preferred stock ranking senior to the Series A Preferred Stock we may issue in the future with respect to assets available to satisfy claims against us.
The Series A Preferred Stock is not rated.
We have not sought to obtain a rating for the Series A Preferred Stock, and the Series A Preferred Stock may never be rated. It is possible, however, that one or more rating agencies might independently determine to assign a rating to the Series A Preferred Stock or that we may elect to obtain a rating of the Series A Preferred Stock in the future. In addition, we may elect to issue other securities for which we may seek to obtain a rating. If any ratings are assigned to the Series A Preferred Stock in the future or if we issue other securities with a rating, such ratings, if they are lower than market expectations or are subsequently lowered or withdrawn, could adversely affect the market for or the market value of the Series A Preferred Stock. Ratings only reflect the views of the issuing rating agency or agencies and such ratings could at any time be revised downward or withdrawn entirely at the discretion of the issuing rating agency. A rating is not a recommendation to purchase, sell or hold any particular security, including the Series A Preferred Stock. Ratings do not reflect market prices or suitability of a security for a
particular investor and any future rating of the Series A Preferred Stock may not reflect all risks related to us and our business, or the structure or market value of the Series A Preferred Stock.
We cannot guarantee that our Class A common stock repurchase program will enhance shareholder value and purchases, if any, could increase the volatility of the price of our Class A common stock.
Our Board of Directors has authorized the Repurchase Program, which permits us to purchase our Class A common stock through August 18, 2021. The Repurchase Program does not obligate us to purchase a specific dollar amount or number of shares of Class A common stock. The specific timing and amount of purchases, if any, will depend upon several factors, including ongoing assessments of capital needs, the market price of the Class A common stock, and other factors, including general market conditions. There can be no assurance that we will make future purchases of Class A common stock or that we will purchase a sufficient number of shares to satisfy market expectations.
Purchases of our Class A common stock could affect the market price and increase volatility of our Class A common stock. We cannot provide any assurance that purchases under the Repurchase Program will be made at the best possible price. Additionally, purchases under our Repurchase Program could diminish our cash reserves or increase borrowings under our Senior Credit Facility or Subordinated Facility, which may impact our ability to finance future growth and to pursue possible future strategic opportunities and acquisitions. Although our Repurchase Program is intended to enhance long-term shareholder value, there is no assurance that it will do so.
We are permitted to and could discontinue our Repurchase Program prior to its expiration or completion. The existence of the Repurchase Program could cause our Class A common stock price to be higher than it would be in the absence of such a program, and any such discontinuation could cause the market price of our Class A common stock to decline.
The Change of Control Conversion Right may make it more difficult for a party to acquire us or discourage a party from acquiring us.
The Change of Control Conversion Right of the Series A Preferred Stock provided in the Certificate of Designation may have the effect of discouraging a third party from making an acquisition proposal for us or of delaying, deferring or preventing certain of our change of control transactions under circumstances that otherwise could provide the holders of our Series A Preferred Stock with the opportunity to realize a premium over the then-current market price of such equity securities or that stockholders may otherwise believe is in their best interests.
Changes in the method of determining the London Interbank Offered Rate (“LIBOR”),Three-Month CME Term SOFR, or the replacement of LIBORThree-Month CME Term SOFR with an alternative reference rate, may adversely affect interest rates under our Senior Credit Facility and the floating dividend rate of our Series A Preferred Stock.
LIBOR is a basic rate
Under the Certificate of interest widely used as a global reference for setting interest rates on loans and payment rates on other financial instruments. Our Senior Credit Facility uses LIBOR asDesignation of the reference rate for Eurodollar denominated borrowings. In addition, on and after April 15, 2022,Series A Preferred Stock, dividends on the Series A Preferred Stock accrue at a floating rate equal to the sum of: (a) Three-Month LIBOR Rate as calculated on each applicable determination date, plus (b) 6.578%. LIBOR was a basic rate of interest widely used as a global reference for setting interest rates on loans and payment rates on other financial instruments, and ceased publication on June 30, 2023.
In 2017,accordance with the United Kingdom’s Financial Conduct Authority, which regulates LIBOR, announced that it intends to phase out LIBORAdjustable Interest Rate (LIBOR) Act (the “LIBOR Act”) and the final regulations promulgated pursuant thereto by the endBoard of 2021. It is unclear ifGovernors of the Federal Reserve System (“Board”), the LIBOR will cease to exist atAct specifies that time, if new methods of calculating LIBOR will be established such that it continues to exist after 2021 or whether different reference rates will develop. It is impossible to predict the effect these developments, any discontinuance, modification or other reforms to LIBOR orreplacement benchmark rate on the establishment of alternative reference rates may have on LIBOR, other benchmark rates or floating rate debt instruments.
Although our Senior Credit Facility and Series A Preferred Stock contain LIBOR alternative provisions and the usefollowing Three-Month LIBOR’s end of alternative reference rates, newpublication on June 30,2023 is Three-Month CME Term SOFR, as administered by CME Group Benchmark Administration, Ltd. (or any successor administrator), plus a tenor spread adjustment of 0.26161%.
New methods of calculating LIBORThree-Month CME Term SOFR or other reforms could cause the interest rates
under our Senior Credit Facility or the dividend rate on our Series A Preferred Stock to be materially different than expected, which could have an adverse effect on our business, financial position, and results of operations, and our ability to pay dividends on the Series A Preferred Stock and Class A common stock.Stock.
If we are unable to redeem the Series
A Preferred Stock on or after April 15, 2022, a substantial increase in the Three-Month LIBORCME Term SOFR Rate or an alternative rate could negatively impact our ability to pay dividends on the Series A Preferred Stock and Class A common stock.Stock.
If we do not repurchase or redeem our Series
A Preferred Stock on or after April 15, 2022, a substantial increase in the Three-Month LIBORCME Term SOFR Rate, (if it then exists), or a substantial increase in the alternative reference rate, could negatively impact our ability to pay dividends on the Series A Preferred Stock. An increase in the dividends payable on our Series A Preferred Stock would negatively impact dividends on our Class A common stock. We cannot assure you that we will have adequate sources of capital to repurchase or redeem the Series A Preferred Stock on or after April 15, 2022. If we are unable to repurchase or redeem the Series A Preferred Stock and our ability to pay dividends on the Series A Preferred Stock, and Class A common stock is negatively impacted, the market value of the Series A Preferred Stock and Class A common stock could be materially adversely impacted.
We may not have sufficient earnings and profits in order for dividends on the Series A Preferred Stock to be treated as dividends for U.S. federal income tax purposes.
The dividends payable by us on the Series A Preferred Stock may exceed our current and accumulated earnings and profits, as calculated for U.S. federal income tax purposes. If this occurs, it will result in the amount of the dividends that exceed such earnings and profits being treated for U.S. federal income tax purposes first as a return of capital to the extent of the beneficial owner’s adjusted tax basis in the Series A Preferred Stock, and the excess, if any, over such adjusted tax basis as gain from the sale or exchange of property, which generally results in capital gain. Such treatment will generally be unfavorable for corporate beneficial owners and may also be unfavorable to certain other beneficial owners.
You may be subject to tax if we make or fail to make certain adjustments to the conversion rate of the Series A Preferred Stock even though you do not receive a corresponding cash dividend.distribution.
The Conversion Rate as defined in the Certificate of Designation for the Series A Preferred Stock is subject to adjustment in certain circumstances. A failure to adjust (or to adjust adequately) the Conversion Rate after an event that increases your proportionate interest in us could be treated as a deemed taxable dividend to you. If you are a non-U.S. holder, any deemed dividend may be subject to U.S. federal withholding tax at a 30% rate, or such lower rate as may be specified by an applicable treaty, which may be set off against subsequent payments on the Series A Preferred Stock. In April 2016, the Internal Revenue Service issued new proposed income tax regulations in regard to the taxability
Table of changes in conversion rights that will apply to the Series A Preferred Stock when published in final form and may be applied to us before final publication in certain instances.Contents
We are a “controlled company” under NASDAQ Global Select Market rules, and as such we are entitled to an exemption from certain corporate governance standards of the NASDAQ Global Select Market, and you may not have the same protections afforded to shareholders of companies that are subject to all of the NASDAQ Global Market corporate governance requirements.
We qualify as a “controlled company” within the meaning of NASDAQ Global Select Market corporate governance standards because an affiliated holder controls more than 50% of our voting power. Under NASDAQ Global Select Market rules, a company of which more than 50% of the voting power is held by an individual, a group or another company is a “controlled company” and may elect not to comply with certain corporate governance requirements.
Although our board of directors has established a nominating and corporate governance committee and a compensation committee of independent directors, it may determine to eliminate these committees at any time. If these committees were eliminated, you may not have the same protections afforded to shareholders of companies that are subject to all of NASDAQ Global Select Market corporate governance requirements.
Item 1B. Unresolved Staff Comments
None.
Item 1C. Cybersecurity
Risk management and strategy
Via Renewables, Inc. recognizes the critical importance of developing, implementing, and maintaining robust cybersecurity measures to safeguard our information systems and protect the confidentiality, integrity, and availability of our data.
Managing Material Risks & Integrated Overall Risk Management
Via Renewables, Inc. has strategically integrated cybersecurity risk management into our broader risk management framework to promote a company-wide culture of cybersecurity risk management. This integration ensures that cybersecurity considerations are an integrated part of our decision-making processes at every level. Our risk management team works closely with our IT department to continuously evaluate and address cybersecurity risks in alignment with our business objectives and operational needs.
Engage Third parties on Risk Management
Recognizing the complexity and evolving nature of cybersecurity threats, Via Renewables, Inc. engages with a range of external experts, including cybersecurity assessors, consultants and auditors in evaluating and testing our risk management systems. These partnerships enable us to leverage specialized knowledge and insights, ensuring our cybersecurity strategies and processes remain at the forefront of industry best practices.
Oversee Third-party Risk
Because we are aware of the risks associated with third-party service providers, Via Renewables, Inc. implements stringent processes to oversee and manage these risks. We conduct thorough security assessments of all third-party providers before engagement and maintain ongoing monitoring to ensure compliance with our cybersecurity standards. This approach is designed to mitigate risks related to data breaches or other security incidents originating from third parties.
Risks from Cybersecurity Threats
We have not encountered cybersecurity challenges that have materially impaired our operations or financial standing.
Governance
The Board of Directors is acutely aware of the critical nature of managing risks associated with cybersecurity threats. The Board has established a robust oversight mechanism to ensure effective governance in managing risks associated by cybersecurity threats because we recognize the significant of these threats to our operations integrity and stakeholder confidence.
Board of Directors Oversight
The Audit Committee is central to the Board’s oversight of cybersecurity risks and bears the primary responsibility for this domain. The Audit Committee is composed of board members with diverse expertise including, risk management, technology, and finance, equipping them to oversee cybersecurity risks effectively.
Management’s Role Managing Risk
The Chief Operating Officer plays a pivotal role in informing the Audit Committee on cybersecurity risks. The Chief Operating Officer provides comprehensive briefings to the Audit Committee on a regulatory basis, with a minimum frequency of once per year. These briefings encompass a broad range of topics including:
•Current cybersecurity landscape and emerging threats;
•Status of ongoing cybersecurity initiatives and strategies;
•Incident reports and learnings from any cybersecurity events; and
•Compliance with regulatory requirements and industry standards.
In addition to our scheduled meetings, the Audit Committee and Chief Operating Officer maintain an ongoing dialogue regarding emerging or potential cybersecurity risks. Together, they receive updates on any significant developments in the cybersecurity domain, ensuring the Board’s oversight is proactive and responsive. The Audit Committee actively participates in strategic decisions related to cybersecurity, offering guidance and approval for major initiatives. This involvement ensures that cybersecurity considerations are integrated into the broader strategic objectives of Via Renewables, Inc. The Audit Committee conducts an annual review of the Company’s cybersecurity program and the effectiveness of its risk management strategies. This review helps in identifying areas for improvement and ensuring the alignment of cybersecurity efforts with the overall risk management framework.
Risk Management Personnel
Primary responsibility for assessing, monitoring and managing our cybersecurity risk rests with the Director of Infrastructure. With over 26 years of experience in the field of cybersecurity, the Director of Infrastructure brings a wealth of expertise to his role. His in-depth knowledge and experience are instrumental in developing and executing our cybersecurity strategies. Our Director of Infrastructure oversees our governance programs, tests our compliance with standards, remediates known risks, and leads our employee training program.
Monitor Cybersecurity Incidents
The Director of Infrastructure is continually informed about the latest developments in cybersecurity, including potential threats and innovative risk management techniques. This ongoing knowledge acquisition is crucial for the effective prevention, detection, mitigation, and remediation of cybersecurity incidents. The Director of Infrastructure implements and oversees processes for the regulatory monitoring of our information systems. This includes the deployment of advanced security measures and regular system audits to identify potential vulnerabilities. In the event of a cybersecurity incident, the Director of Infrastructure is equipped with a well-defined incident response plan. This plan includes immediate actions to mitigate the impact and long-term strategies for remediation and prevention of future incidents.
Reporting to the Board of Directors
The Director of Infrastructure, in his capacity, regularly informs the Chief Financial Officer (CFO) and Chief Operating Officer (COO) of all aspects related to cybersecurity risks and incidents. The CFO and COO regularly inform the Chief Executive Officer (CEO) of such risk and incidents. This ensures that the highest levels of management are kept abreast of the cybersecurity posture and potential risks facing Via Renewables, Inc. Furthermore, significant cybersecurity mattes, and strategic risk management decisions are escalated to the Board of Directors, ensuring that they have comprehensive oversight and can provide guidance on critical cybersecurity issues.
Item 3. Legal Proceedings
We are the subject of lawsuits and claims arising in the ordinary course of business from time to time. Management cannot predict the ultimate outcome of such lawsuits and claims. While the lawsuits and claims are asserted for amounts that may be material, should an unfavorable outcome occur, management does not currently expect that any currently pending matters will have a material adverse effect on our financial position or results of operations except as described in Part II, Item 8 “Financial Statements and Supplementary Data,” Note 1413 "Commitments and Contingencies" to the audited consolidated financial statements, which are incorporated herein by reference.
Item 4. Mine Safety Disclosures.
Not applicable.
PART II
Item 5. Market for Registrant’s Common Equity, Related Stockholder Matters and Issuer Purchases of Equity Securities
Our Class A common stock is traded on the NASDAQ Global Select Market under the symbol “SPKE.“VIA." There is no public market for our Class B common stock. On March 2, 2021,February 27, 2024, we had one holderwe had three holders of record of our Class A common stock and two holders of record of our Class B common stock, excluding the Company, and stockholders for whom shares are held in “nominee” or “street name.” Shareholders of record, excluding Cede & Co. and the Company, held an aggregate of 94 shares.
Dividends
We typically payhave historically paid a cash dividend each quarter to holders of our Class A common stock to the extent we have cash available for distribution and are permitted to do so under the terms of our Senior Credit Facility.Facility, as well as paid dividends to the holders of our Series A Preferred Stock. In April 2023, we announced a suspension of the dividend on the Class A common stock. Our ability to pay dividends depends on certain factors, including the terms of our Senior Credit Facility, the performance of our business, cash flows, RCE counts and the margins we receive. Please see “Item 1A – Risk Factors” in this Annual Report for risks related to our ability to pay dividends.
Recent Sales of Unregistered Equity Securities
We have not sold any unregistered equity securities other than as previously reported.
Issuer Purchases of Equity Securities
We did not repurchase any equity securities between October 1, 20202023 and December 31, 2020.2023.
Stock Performance Graph
The following graph compares the quarterly performance of our Class A common stock to the NASDAQ Composite Index ("NASDAQ Composite") and the Dow Jones U.S. Utilities Index ("IDU"). The chart assumes that the value of the investment in our Class A common stock and each index was $100 at December 31, 20152018 and that all dividends were reinvested. The stock performance shown on the graph below is not indicative of future price performance.
The performance graph above and related information shall not be deemed “soliciting material” or to be “filed” with the SEC, nor shall such information be incorporated by reference into any future filing under the Securities Act or the Exchange Act, except to the extent that we specifically incorporate it by reference.
Item 6. Reserved
ITEM 7. MANAGEMENT’S DISCUSSION AND ANALYSIS OF FINANCIAL CONDITION
AND RESULTS OF OPERATIONS
The following discussion and analysis of our financial condition and results of operations should be read in conjunction with the consolidated financial statements and the related notes thereto included elsewhere in this Annual Report. In this Annual Report, the terms “Spark“Via," "Via Renewables," "Spark Energy,”" “Company,” “we,” “us” and “our” refer collectively to Spark Energy,Via Renewables, Inc. and its subsidiaries.
Overview
We are an independent retail energy services company founded in 1999 that provides residential and commercial customers in competitive markets across the United States with an alternative choice for natural gas and electricity. We purchase our natural gas and electricity supply from a variety of wholesale providers and bill our customers monthly for the delivery of natural gas and electricity based on their consumption at either a fixed or variable price. Natural gas and electricity are then distributed to our customers by local regulated utility companies through their existing infrastructure. As of December 31, 2020,2023, we operated in 100104 utility service territories across 1920 states and the District of Columbia.
Our business consists of two operating segments:
•Retail Electricity Segment. In this segment, we purchase electricity supply through physical and financial transactions with market counterparties and ISOs and supply electricity to residential and commercial consumers pursuant to fixed-price and variable-price contracts. For the years ended December 31, 2020, 20192023, 2022 and 2018,2021, approximately 83%75%, 85%76% and 86%81%, respectively, of our retail revenues were derived from the sale of electricity.
•Retail Natural Gas Segment. In this segment, we purchase natural gas supply through physical and financial transactions with market counterparties and supply natural gas to residential and commercial consumers pursuant to fixed-price and variable-price contracts. For the years ended December 31, 2020, 20192023, 2022 and 2018,2021, approximately 17%25%, 15%24% and 14%19%, respectively, of our retail revenues were derived from the sale of natural gas.
Recent Developments
Extreme Winter Weather EventOn December 29, 2023, we entered into a merger agreement (the “Merger Agreement”) with Retailco, LLC, a Texas limited liability company (“Retailco”), and NuRetailco LLC, a Delaware limited liability company and wholly-owned subsidiary of Retailco (“Merger Sub”), whereby all of our Class A common stock (except for as described below), will be acquired by Retailco for $11.00 per share.
In February 2021, the U.S. experienced winter storm Uri,Retailco is an unprecedented storm bringing extreme cold temperatures to the central U.S., including Texas. As a result of increased power demand for customers across the state of Texas and power generation disruptions during the weather event, power and ancillary costs in the Electric Reliability Council of Texas ("ERCOT") service area reached or exceeded maximum allowed clearing prices. The overall impact of winter storm Urientity owned by TxEx, which is still being assessedwholly owned by management; however, we expect the impact of the weather event will result in a significant loss that will be reflected in our first quarter 2021 results of operations. Uncertainty exists with respect to the financial impact of the weather event due in part to outstanding pricing and volume settlement data from ERCOT; the results of formal disputes regarding pricing and volume settlement data received to date, for which we are exploring all legal options; and any corrective action by the State of Texas, ERCOT, the Railroad Commission of Texas, or the Public Utility Commission of Texas. Possible action may include resettling pricing across the supply chain (i.e. fuel supply, wholesale pricing of generation, or allocating the financial impacts of market-wide load shed ratably across all retail market participants). During the winter storm Uri event, we were required to post a significant amount of collateral with ERCOT. Despite these posting requirements, we consistently maintained, and continue to maintain, sufficient liquidity to conduct our operations in the ordinary course.Mr. Maxwell.
Senior Credit FacilityThe transaction will be effected by a merger of Merger Sub, with and into the Company, with the Company surviving the merger. Under the terms of the Merger Agreement, all of our Class A common stock, except for shares of Class A common stock for which appraisal rights have been properly and validly exercised under Delaware law and certain additional shares, including those held by the Company or any of its subsidiaries (or held in the Company’s treasury), Retailco or Merger Sub or any of their respective subsidiaries, or Mr. Maxwell, and any person or entity controlled by him, will be converted into the right to receive the cash consideration.
The Class A common stock, currently traded under the symbol VIA, will cease to trade on NASDAQ upon consummation of the transaction. We expect that the Series A Preferred Stock, currently traded under the symbol VIASP, will continue to trade on NASDAQ following the transaction. Accordingly, Via Renewables will remain subject to the reporting requirements of the Exchange Act.
On October 30, 2020, a new lender was added to the Senior Credit Facility, bringing total commitments under the Senior Credit Facility to $202.5 million.
On January 19, 2021, we increasedThe transaction was negotiated on behalf of the total commitments under our Senior Credit Facility to $227.5 million.
AppointmentCompany by a Special Committee of Chief Executive Officer
On November 2, 2020, ourits Board of Directors appointed W. Keith Maxwell III, who had served as our interim Chief Executive Officer since Marchwith the assistance of 2020, as Chief Executive Officer.
COVID-19independent financial and legal advisors. The Special Committee is comprised of entirely disinterested and independent directors. Following the Special Committee’s unanimous recommendation in support of the merger, the Company’s Board of Directors (other than Mr. Maxwell) approved the Merger Agreement and recommended that the Company’s stockholders adopt and approve the Merger Agreement and the merger.
The outbreakmerger is subject to approval by a majority of shareholders of the novel coronavirus ("COVID-19") is a rapidly developing situation aroundissued and outstanding shares of the globe that has adversely impacted economic activityCompany’s Class A common stock and conditions worldwide. In response to the COVID-19 pandemic, we deployed a remote working strategy in March 2020 that enables certain of our employees to work from home, provided timely communication to team members, implemented protocols for team members' safety, and initiated strategies for monitoring and responding to local COVID-19 impacts. Our preparedness efforts, coupled with quick and decisive plan implementation, resulted in minimal impacts to our workforce. Our employees continue to work remotely, but we plan to return to an on-site work strategy once health and safety conditions permit.
As described further below under "Drivers of our Business", during the year ended December 31, 2020, compared to the year ended December 31, 2019, we had fewer organic customer acquisitions, which resulted in reduced customer acquisition costs.Class B common stock. In addition, for the year ended December 31, 2020 comparedmerger is subject to year ended December 31, 2019, we experienced lower customer attrition, slight increases in residential demand, and slight decreases in C&I demand. The financial impacta non-waivable requirement of approval by the holders of at least a majority of the decreaseissued and outstanding Class A common stock and Class B common stock not owned by Mr. Maxwell and his affiliated entities or the directors, officers or their immediate family members. Mr. Maxwell and affiliated entities have entered into a support agreement to vote their shares in C&I demand was offset by higher demand from residential customers, which have higher margins. Overall, we believe we have not experienced a material adverse impact to our business, financial condition or results of operations during the year ended December 31, 2020 as a resultfavor of the COVID-19 pandemic. We are continuingtransaction and against any competing transaction. The Merger Agreement is not subject to monitor developments involving our workforce, customers and suppliers anda financing condition, but is subject to customary closing conditions. The transaction is expected to close in the impact on our operations, business, financial condition, liquidity and resultssecond quarter of operations for future periods. Please see “Item 1A—Risk Factors” in this Annual Report.
Drivers of Our Business
The success of our business and our profitability are impacted by a number of drivers, the most significant of which are discussed below.
Customer Growth
Customer growth is a key driver of our operations. Our ability to acquire customers organically or by acquisition is important to our success as we experience ongoing customer attrition. Our customer growth strategy includes growing organically through traditional sales channels complemented by customer portfolio and business acquisitions.
We measure our number of customers using residential customer equivalents ("RCEs"). The following table shows our RCEs by segment as of December 31, 2020, 20192023, 2022 and 2018:2021:
| | | | | | | | | | | | | | |
| RCEs: | | | | | | |
| December 31, | |
| (In thousands) | 2020 | 2019 | | | 2018 | |
| Retail Electricity | 303 | 533 | | | 754 | |
| Retail Natural Gas | 97 | 139 | | | 154 | |
| Total Retail | 400 | 672 | | | 908 | |
Table of Contents
| | | | | | | | | | | | | | |
| RCEs: | | | | | | |
| December 31, | |
| (In thousands) | 2023 | 2022 | | | 2021 | |
| Retail Electricity | 217 | 201 | | | 298 | |
| Retail Natural Gas | 118 | 130 | | | 110 | |
| Total Retail | 335 | 331 | | | 408 | |
The following table details our count of RCEs by geographical location as of December 31, 2020:2023:
| | RCEs by Geographic Location: | RCEs by Geographic Location: | |
| (In thousands) | |
| (In thousands) | |
| (In thousands) | (In thousands) | Electricity | % of Total | Natural Gas | % of Total | Total | % of Total | Electricity | % of Total | Natural Gas | % of Total | Total | % of Total |
| New England | New England | 96 | 32% | 19 | 19% | 115 | 29% | New England | 64 | 29% | 12 | 10% | 76 | 23% |
| Mid-Atlantic | Mid-Atlantic | 115 | 38% | 33 | 34% | 148 | 37% | Mid-Atlantic | 95 | 44% | 51 | 43% | 146 | 44% |
| Midwest | Midwest | 35 | 11% | 28 | 29% | 63 | 16% | Midwest | 20 | 9% | 20 | 17% | 40 | 12% |
| Southwest | Southwest | 57 | 19% | 17 | 18% | 74 | 18% | Southwest | 38 | 18% | 35 | 30% | 73 | 21% |
| Total | Total | 303 | 100% | 97 | 100% | 400 | 100% | Total | 217 | 100% | 118 | 100% | 335 | 100% |
The geographical locations noted above include the following states:
•New England - Connecticut, Maine, Massachusetts and New Hampshire;
•Mid-Atlantic - Delaware, Maryland (including the District of Columbia), New Jersey, New York, Pennsylvania and Pennsylvania;Virginia;
•Midwest - Illinois, Indiana, Michigan and Ohio; and
•Southwest - Arizona, California, Colorado, Florida, Nevada and Texas.
Across our market areas, we have operated under a number of different retail brands. We currently operate under seven retail brands. During 2020 and 2019, we consolidated certain brands and billing systems in an effort to simplify our business operations where practical.
Our organic sales strategies are designed to offer competitive pricing, price certainty, and/or green product offerings to residential and commercial customers. We manage growth on a market-by-market basis by developing price curves in each of the markets we serve and comparing the market prices to the price offered by the local regulated utility. We then determine if there is an opportunity in a particular market based on our ability to create a competitive product on economic terms that provides customer value and satisfies our profitability objectives. We develop marketing campaigns using a combination of sales channels. Our marketing team continuously evaluates the effectiveness of each customer acquisition channel and makes adjustments in order to achieve desired targets.
During the year ended December 31, 2020,2023, we added approximately 46,000140,000 RCEs through our various organic sales channels. This amount was significantly lower than historical periods primarily dueFollowing the COVID-19 pandemic we have continued to limitation offocus on refining our door-to-door marketing as a result of COVID-19 during the majority of 2020 and a reduction in targeted organic customer acquisitions as we focused our efforts to improve our organicexisting sales channels including vendor selection and carefully growing both door to door and telemarketing sales while remaining focused on sales quality. Although we
We expect to acquire less customers organically in future periods than we have historically while marketing restrictions are in place, which may cause our customer bookgrowth to decrease,continue to increase, however, we are unable to predict the ultimate effect of market conditions on our organic sales, financial results, cash flows, and liquidity at this time.
DueIn December 2023, the FCC adopted rules that could limit the ability of third-party lead generators to identify large numbers of potential customers. If the COVID-19 pandemic, certain public utility commissions, regulatory agencies, and other governmental authorities in mostnumber of potential customers is reduced, or if it becomes more difficult or costly to identify potential telemarketing targets, our markets continueability to maintain orders prohibiting energy services companies from door-to-door marketing and in some cases telemarketing during the pandemic, which has restricted some of the manners we have historically used to market for organic sales. In response, we have focusedour RCE count based on development of products and channels, partners for web sales, as well as accelerating itsour telemarketing sales quality programs. In November 2020, we began active door-to-door marketing activities in certain markets where not prohibited by states' COVID-19 restrictions.could be impacted.
We continue to target customer growth and seek to increase our customer growth to more historical levels. However, market conditions and regulatory constraints are making this increasingly difficult, and we are unable to predict future organic sales volumes at this time
We also acquire companies and portfolios of customers through both external and affiliated channels. During the year ended December 31, 2023, we did not add any RCEs through acquisitions or asset purchase agreements. Refer to Note 16 “Customer Acquisitions” for further discussion. Our ability to realize returns from acquisitions that are acceptable to us is dependent on our ability to successfully identify, negotiate, finance and integrate acquisitions. We will continue to evaluate potential acquisitions during 2024.
RCE Activity
The following table shows our RCE activity during the years ended December 31, 2020, 20192023, 2022 and 2018.2021.
| | | (In thousands) | |
| | (In thousands) | |
| | (In thousands) | (In thousands) | Retail Electricity | Retail Natural Gas | Total | % Net Annual Increase (Decrease) | |
| | December 31, 2017 | 868 | 174 | 1,042 | | |
| | December 31, 2020 | |
| | December 31, 2020 | |
| | December 31, 2020 | |
| Additions | |
| Additions | |
| Additions | Additions | 363 | 69 | 432 | | |
| Attrition | Attrition | (477) | (89) | (566) | | |
| December 31, 2018 | 754 | 154 | 908 | (13)% | |
| Attrition | |
| Attrition | |
| December 31, 2021 | |
| December 31, 2021 | |
| December 31, 2021 | |
| Additions | |
| Additions | |
| Additions | Additions | 189 | 58 | 247 | | |
| Attrition | Attrition | (410) | (73) | (483) | | |
| December 31, 2019 | 533 | 139 | 672 | (26)% | |
| Attrition | |
| Attrition | |
| December 31, 2022 | |
| December 31, 2022 | |
| December 31, 2022 | |
| Additions | |
| Additions | |
| Additions | Additions | 38 | 8 | 46 | | |
| Attrition | Attrition | (268) | (50) | (318) | | |
| December 31, 2020 | 303 | 97 | 400 | (40)% | |
| Attrition | |
| Attrition | |
| December 31, 2023 | |
| December 31, 2023 | |
| December 31, 2023 | |
|
In 2018 and 2019, our attrition exceeded customer additions due to our intentional non-renewal
Table of certain larger C&I customer contracts, lower organic sales spending, and fewer acquisitions and slightly higher attrition impacted by our brand consolidation activities. In 2020, our attrition exceeded customer additions primarily due to the non-renewal of certain larger C&I customer contracts and limitations on our ability to sell through door-to-door and telemarketing activities as a result of orders by regulatory agencies and governmental authorities' responses to the COVID-19 pandemic. Average monthly attrition rates during 2020, 2019 and 2018 were as follows:
| | | | | | | | | | | | | | | | | |
|
| Year Ended | Quarter Ended |
| December 31 | December 31 | September 30 | June 30 | March 31 |
| | | | | |
| 2018 | 4.7% | 6.7% | 4.0% | 3.7% | 4.2% |
| 2019 | 5.0% | 7.0% | 4.0% | 3.8% | 5.4% |
| 2020 | 5.0% | 7.7% | 3.0% | 3.5% | 5.7% |
Customer attrition occurs primarily as a result of: (i) customer initiated switches; (ii) residential moves (iii) disconnection resulting from customer payment defaults and (iv) pro-active non-renewal of contracts. Average monthly attrition rates during 2023, 2022 and 2021 were as follows:
| | | | | | | | | | | | | | | | | |
|
| Year Ended | Quarter Ended |
| December 31 | December 31 | September 30 | June 30 | March 31 |
| | | | | |
| 2021 | 3.3% | 3.4% | 2.4% | 3.3% | 4.2% |
| 2022 | 3.8% | 4.2% | 4.0% | 3.1% | 3.7% |
| 2023 | 3.4% | 3.3% | 3.1% | 3.1% | 3.9% |
Customer attrition during the year ended December 31, 20202022 was flat comparedhigher than the year ended December 31, 2021 due to the sharp increase in commodity prices across the industry.
Customer attrition for the year ended December 31, 2023 was lower than the year ended ended December 31, 2022 prior year due to an active strategya decrease in commodity prices across the industry in 2023, compared to shrink our C&I customer book in 2019, resulting in our pro-active non-renewal of some of our lower-margin large commercial contracts.2022.
Customer Acquisition Costs
Managing customer acquisition costs is a key component of our profitability. Customer acquisition costs are those costs related to obtaining customers organically and do not include the cost of acquiring customers through acquisitions, which are recorded as customer relationships. For each of the three years ended December 31, 2020,2023, customer acquisition costs were as follows:
| | Year Ended December 31, |
| Year Ended December 31, | | | Year Ended December 31, |
| (In thousands) | (In thousands) | 2020 | 2019 | 2018 | (In thousands) | 2023 | 2022 | 2021 |
| Customer Acquisition Costs | Customer Acquisition Costs | $ | 1,513 | | $ | 18,685 | | $ | 13,673 | |
We strive to maintain a disciplined approach to recovery of our customer acquisition costs within a 12 month period. We capitalize and amortize our customer acquisition costs over a one to two year period, which is based on our estimate of the expected average length of a customer relationship. We factor in the recovery of customer
acquisition costs in determining whichwhat markets we enter and the pricing of our products in those markets. Accordingly, our results are significantly influenced by our customer acquisition costs. Changes in customer acquisition costs from period to period reflect our focus on growing organically versus growth through acquisitions. We are currently focused on growing through organic sales channels; however, we continue to evaluate opportunities to acquire customers through acquisitions and pursue such acquisitions when it makes sense economically or strategically.
As described above, certain public utility commissions, regulatory agencies, and other governmental authorities in all of our markets havehad issued orders that impactimpacted the way we have historically acquired customers, such as door to door marketing. Our reduced marketing resulted in significantly reduced customer acquisition costs during the twelve months ended December 31, 20202021, compared to historical amounts. As long
Our gradual increase of marketing efforts as these orders arerestrictions were lifted resulted in effectincreased marketing and marketing is reduced, we expect to incur reduced customer acquisition costs in future periods. However, we may incur increased costs through other manners of marketing, such as online marketing. We also expect our customercosts. Customer acquisition costs with respect to door to door marketing returned back to return topre-Covid-19 historic levels once door to door marketing restriction orders are lifted from all markets. We are unable to predict the ultimate impact on our customer acquisition costs at this time. Please see “Item 1A—Risk Factors” in this Annual Report.”2022 and 2023.
Customer Credit Risk
Approximately 64%55% of our revenues are derived from customers in utilities where customer credit risk is borne by the utility in exchange for a discount on amounts billed. Where we have customer credit risk, we record bad debt based on an estimate of uncollectible amounts. Our bad debt expense on non-POR revenues was as follows:
| | | | | | | | | | | |
| Year Ended December 31, |
| 2020 | 2019 | 2018 |
| Total Non-POR Bad Debt as Percent of Revenue | 1.6 | % | 3.3 | % | 2.6 | % |
| | | |
| | | | | | | | | | | |
| Year Ended December 31, |
| 2023 | 2022 | 2021 |
| Total Non-POR Bad Debt as Percent of Revenue | 1.7 | % | 3.0 | % | 0.2 | % |
| | | |
During the year ended December 31, 2020,2023, we experienced lower bad debtcredit loss expense versus 2019 primarily due to an2022. We increased focussales activities in non-POR markets in 2023 and focused on collection efforts, timely billing andwe have experienced a decrease in credit monitoring for new enrollments in non-POR markets. We have also been able to collect on debts that were previously written off, which has further reduced our bad debt expense duringloss expense.
During the year ended December 31, 2020.
The current COVID-19 pandemic has caused regulatory agencies and other governmental authorities2022, we experienced higher credit loss expense versus 2021 primarily due to take, and potentially continue to take, emergency or other actions in light of the pandemic that may impact our customer credit risk, including prohibiting the termination of service for non-payment during the current COVID-19 pandemic, requiring deferred payment plans for certain customers unable to pay their bills, and utilities increasing POR fees they charge us in an effort to recoup their bad debt losses. Although the Company noted no significantincreasing sales activities in non-POR markets and the impact as a result of the COVID-19 pandemic relatedincreased defaults on customer billings, in part due to customer credit risk for the twelve months ended December 31, 2020, because of the time lag between the delivery of electricity andhigher natural gas the issuance of an invoice, and the customer’s payment due date, there may be a substantial lag in time before we are able to determine specific trends in bad debt expense as a result of COVID-19. We are also monitoring other events that may have an impact on our customer credit risk, such as the expiration of unemployment benefits in many of our service territories. Please see “Item 1A—Risk Factors” in this Annual Report.electricity prices.
For the years ended December 31, 2020, 20192023, 2022 and 2018,2021, approximately 64%55%, 67%59% and 66%59%, respectively, of our retail revenues were collected through POR programs where substantially all of our credit risk was with local regulated utility companies. As of December 31, 2020, 20192023, 2022 and 2018,2021, all of these local regulated utility companies had investment grade ratings. During these same periods, we paid these local regulated utilities a weighted average discount of approximately 1.2%1.0%, 0.8%0.9% and 1.0%0.9%, respectively, of total revenues for customer credit risk protection.
Weather Conditions
Weather conditions directly influence the demand for natural gas and electricity and affect the prices of energy commodities. Our hedging strategy is based on forecasted customer energy usage, which can vary substantially as a result of weather patterns deviating from historical norms. We are particularly sensitive to this variability in our residential customer segment where energy usage is highly sensitive to weather conditions that impact heating and cooling demand.
Our risk management policies direct that we hedge substantially all of our forecasted demand, which is typically hedged to long-term normal weather patterns. We also attempt to add additional protection through hedging from time to time to protect us from potential volatility in markets where we have historically experienced higher exposure to extreme weather conditions. Because we attempt to match commodity purchases to anticipated demand, unanticipated changes in weather patterns can have a significant impact on our operating results and cash flows from period to period.
Winter Storm Uri
During the second halffirst quarter of 2020, we2021, the U.S. experienced milder than normal weather across many of our markets as well as a slight decrease in C&I demand aswinter storm Uri, an unprecedented storm bringing extreme cold temperatures to the central U.S., including Texas. As a result of increased power demand for customers across the COVID-19 pandemic, bothstate of which negatively impacted overall customer usage. This was partially offset by slight increasesTexas and power generation disruptions during the weather event, power and ancillary costs in residential demandthe ERCOT service area reached or exceeded maximum allowed clearing prices. As of December 31, 2021, we recorded a net loss of approximately $64.4 million as a direct result of the COVID-19 pandemic. The financial impact of overall demand reductionswinter storm Uri. Although our hedge position was offset by increased margins as a result120% of our strategyforecasted demand in Texas for the month of February, we were still required to shift awaypurchase power at unprecedented prices for an extended period of time during the storm. These price caps imposed by ERCOT for the duration of the storm and beyond have never been experienced in any deregulated market in which we serve. The policies imposed on the electricity markets by ERCOT related to pricing resulted in overall negative impact on our electricity unit margin for 2021. In June 2022, we received $9.6 million from C&I customersERCOT related to a primarily residential customer base,PURA Subchapter N Financing, resulting in an overalla positive impact on our electricity and natural gas unit margin in 2020.
See Item 7. Management's Discussion and Analysis of Financial Condition and Results of Operations - Recent Development for additional discussion about the expected impacts of winter storm Uri.2022.
Asset Optimization
Our asset optimization opportunities primarily arise during the winter heating season when demand for natural gas is typically at its highest. Given the opportunistic nature of these activities and because we account for these activities using the mark to market method of accounting, we experience variability in our earnings from our asset optimization activities from year to year.
Net asset optimization resulted in a loss of $0.7$7.3 million, a gain$2.3 million of $2.8 million and a gain of $4.5$4.2 million for the years ended December 31, 2020, 20192023, 2022 and 2018,2021, respectively.
Non-GAAP Performance Measures
We use the Non-GAAP performance measures of Adjusted EBITDA and Retail Gross Margin to evaluate and measure our operating results. These measures for the three years ended December 31, 20202023 were as follows:
| | | | | | | | | | | | | | | | | |
| | Year Ended December 31, |
| (in thousands) | 2020 | | 2019 | | 2018 |
| Adjusted EBITDA | $ | 106,634 | | | $ | 92,404 | | | $ | 70,716 | |
| Retail Gross Margin | $ | 196,473 | | | $ | 220,740 | | | $ | 185,109 | |
| | | | | | | | | | | | | | | | | |
| | Year Ended December 31, |
| (in thousands) | 2023 | | 2022 | | 2021 |
Adjusted EBITDA (1)(2)(3) | $ | 56,855 | | | $ | 51,793 | | | $ | 80,657 | |
Retail Gross Margin (4)(5) | $ | 136,650 | | | $ | 114,815 | | | $ | 132,534 | |
(1) Adjusted EBITDA for the year ended December 31, 2021 includes a $60.0 million add back related to winter storm Uri and also includes a deduction of $2.2 million non-recurring legal settlement related to an add back in 2019. See discussion below.
(2) Adjusted EBITDA for the year ended December 31, 2022 includes a deduction of $5.2 million related to proceeds received under an ERCOT (winter storm Uri) securitization mechanism in June 2022. See further discussion below.
(3) Adjusted EBITDA for the year ended December 31, 2023 includes a $0.8 million add back related to merger agreement expense.
(4) Retail Gross Margin for the year ended December 31, 2021 includes a $0.5 million reduction related to the winter storm Uri credit settlements received and year ended December 31, 2021 includes a $64.4 million add back related to winter storm Uri. See discussion below.
(5) Retail Gross Margin for year ended December 31, 2022 includes a deduction of $9.6 million related to proceeds received under an ERCOT (winter storm Uri) securitization mechanism in June 2022. See further discussion below.
Adjusted EBITDA. We define “Adjusted EBITDA” as EBITDA less (i) customer acquisition costs incurred in the current period, plus or minus (ii) net (loss) gain on derivative instruments, and (iii) net current period cash settlements on derivative instruments, plus (iv) non-cash compensation expense, and (v) other non-cash and non-recurring operating items. EBITDA is defined as net income (loss) before the provision for income taxes, interest expense and depreciation and amortization. This conforms to the calculation of Adjusted EBITDA in our Senior Credit Facility.
We deduct all current period customer acquisition costs (representing spending for organic customer acquisitions) in the Adjusted EBITDA calculation because such costs reflect a cash outlay in the period in which they are incurred, even though we capitalize and amortize such costs over two years. We do not deduct the cost of customer acquisitions through acquisitions of businesses or portfolios of customers in calculating Adjusted EBITDA.
We deduct our net gains (losses) on derivative instruments, excluding current period cash settlements, from the Adjusted EBITDA calculation in order to remove the non-cash impact of net gains and losses on these instruments. We also deduct non-cash compensation expense that results from the issuance of restricted stock units under our long-term incentive plan due to the non-cash nature of the expense. Finally, we also
We adjust from time to time other non-cash or unusual and/or infrequent charges due to either their non-cash nature or their infrequency. We have historically included the financial impact of weather variability in the calculation of Adjusted EBITDA. We will continue this historical approach, but during the first quarter of 2021 we incurred a net pre-tax financial loss of $64.9 million due to winter storm Uri, as described above. This loss was incurred due to uncharacteristic extended sub-freezing temperatures across Texas combined with the impact of the pricing caps ordered by ERCOT. We believe this event is unusual, infrequent, and non-recurring in nature.
As our Senior Credit Facility is considered a material agreement and Adjusted EBITDA is a key component of our material covenants, we consider our covenant compliance to be material to the understanding of our financial condition and/or liquidity. Our lenders under our Senior Credit Facility are allowing merger related costs to be added back as non-recurring items in the calculation of Adjusted EBITDA for our Debt covenant calculations. We incurred merger related costs of $0.8 million during the fourth quarter of 2023, which are reflected as an add back in the calculation of Adjusted EBITDA for the year ended December 31, 2023. Our lenders under our Senior Credit Facility also allowed $60.0 million of the $64.9 million pre-tax storm loss incurred in the first quarter of 2021 to be added back as a non-recurring item in the calculation of Adjusted EBITDA for our Debt Covenant Calculations. We received a $0.4 million credit from ERCOT for winter storm related losses during the third quarter of 2021, resulting in a net pre-tax storm loss of $64.4 million for the year ended December 31, 2021. In June 2022, we received $9.6 million from ERCOT related to PURA Subchapter N Securitization financing. For consistent presentation of the financial impact of winter storm Uri, $5.2 million of the $9.6 million is reflected as non-recurring items reducing Adjusted EBITDA for the year ended December 31, 2022.
We believe that the presentation of Adjusted EBITDA provides information useful to investors in assessing our liquidity and financial condition and results of operations and that Adjusted EBITDA is also useful to investors as a financial indicator of our ability to incur and service debt, pay dividends and fund capital expenditures. Adjusted EBITDA is a supplemental financial measure that management and external users of our consolidated financial statements, such as industry analysts, investors, commercial banks and rating agencies, use to assess the following:
•our operating performance as compared to other publicly traded companies in the retail energy industry, without regard to financing methods, capital structure or historical cost basis;
•the ability of our assets to generate earnings sufficient to support our proposed cash dividends;
•our ability to fund capital expenditures (including customer acquisition costs) and incur and service debt; and
•our compliance with financial debt covenants. (Refer to Note 109 "Debt" in the Company’s audited consolidated financial statements for discussion of the material terms of our Senior Credit Facility, including the covenant requirements for our Minimum Fixed Charge Coverage Ratio, Maximum Total Leverage Ratio, and Maximum Senior Secured Leverage Ratio.)
The GAAP measures most directly comparable to Adjusted EBITDA are net income (loss) and net cash provided by (used in) operating activities. The following table presents a reconciliation of Adjusted EBITDA to these GAAP measures for each of the periods indicated.
| | | | Year Ended December 31, | | Year Ended December 31, |
| (in thousands) | (in thousands) | 2020 | | 2019 | | 2018 | (in thousands) | 2023 | | 2022 | | 2021 |
| Reconciliation of Adjusted EBITDA to Net Income (Loss): | Reconciliation of Adjusted EBITDA to Net Income (Loss): | | |
| Net income (loss) | |
| Net income (loss) | |
| Net income (loss) | Net income (loss) | $ | 68,218 | | | $ | 14,213 | | | $ | (14,392) | |
| Depreciation and amortization | Depreciation and amortization | 30,767 | | | 40,987 | | | 52,658 | |
| Interest expense | Interest expense | 5,266 | | | 8,621 | | | 9,410 | |
| Income tax expense | Income tax expense | 15,736 | | | 7,257 | | | 2,077 | |
| EBITDA | EBITDA | 119,987 | | | 71,078 | | | 49,753 | |
| Less: | Less: | |
| Net, losses on derivative instruments | (23,386) | | | (67,749) | | | (18,170) | |
| Net, (loss) gain on derivative instruments | |
| Net, (loss) gain on derivative instruments | |
| Net, (loss) gain on derivative instruments | |
| Net, cash settlements on derivative instruments | Net, cash settlements on derivative instruments | 37,729 | | | 42,820 | | | (10,587) | |
| Customer acquisition costs | Customer acquisition costs | 1,513 | | | 18,685 | | | 13,673 | |
| Plus: | Plus: | |
| Non-cash compensation expense | Non-cash compensation expense | 2,503 | | | 5,487 | | | 5,879 | |
| Non-cash compensation expense | |
| Non-cash compensation expense | |
| Non-recurring event - winter storm Uri | |
| Non-recurring legal and regulatory settlements | Non-recurring legal and regulatory settlements | — | | | 14,457 | | | — | |
| Gain on disposal of eRex | — | | | (4,862) | | | — | |
| Merger agreement expense | |
| | Adjusted EBITDA | Adjusted EBITDA | $ | 106,634 | | | $ | 92,404 | | | $ | 70,716 | |
| Adjusted EBITDA | |
| Adjusted EBITDA | |
The following table presents a reconciliation of Adjusted EBITDA to net cash provided by operating activities for each of the periods indicated.
| | | | Year Ended December 31, | | Year Ended December 31, |
| (in thousands) | (in thousands) | 2020 | | 2019 | | 2018 | (in thousands) | 2023 | | 2022 | | 2021 |
| Reconciliation of Adjusted EBITDA to net cash provided by operating activities: | Reconciliation of Adjusted EBITDA to net cash provided by operating activities: | |
| Net cash provided by operating activities | Net cash provided by operating activities | $ | 91,831 | | | $ | 91,735 | | | $ | 59,763 | |
| Net cash provided by operating activities | |
| Net cash provided by operating activities | |
| Amortization of deferred financing costs | Amortization of deferred financing costs | (1,210) | | | (1,275) | | | (1,291) | |
| Bad debt expense | Bad debt expense | (4,692) | | | (13,532) | | | (10,135) | |
| Interest expense | Interest expense | 5,266 | | | 8,621 | | | 9,410 | |
| Income tax expense | Income tax expense | 15,736 | | | 7,257 | | | 2,077 | |
| Non-recurring event - winter storm Uri | |
| Non-recurring legal settlement | |
| Merger agreement expense | |
| | Changes in operating working capital | Changes in operating working capital | |
| | Changes in operating working capital | |
| | Changes in operating working capital | |
| Accounts receivable, prepaids, current assets | |
| Accounts receivable, prepaids, current assets | |
| Accounts receivable, prepaids, current assets | Accounts receivable, prepaids, current assets | (32,820) | | | (33,475) | | | 10,482 | |
| Inventory | Inventory | (1,458) | | | (924) | | | (674) | |
| Accounts payable and accrued liabilities | 36,301 | | | 11,534 | | | (5,093) | |
| Accounts payable, accrued liabilities, current liabilities | |
| Other | Other | (2,320) | | | 22,463 | | | 6,177 | |
| Adjusted EBITDA | Adjusted EBITDA | $ | 106,634 | | | $ | 92,404 | | | $ | 70,716 | |
| Cash Flow Data: | Cash Flow Data: | |
| Cash flows provided by operating activities | Cash flows provided by operating activities | $ | 91,831 | | | $ | 91,735 | | | $ | 59,763 | |
| Cash flows (used in) provided by investing activities | $ | (2,154) | | | $ | 1,398 | | | $ | (18,981) | |
| Cash flows provided by operating activities | |
| Cash flows provided by operating activities | |
| Cash flows used in investing activities | |
| Cash flows used in financing activities | Cash flows used in financing activities | $ | (75,661) | | | $ | (85,103) | | | $ | (20,563) | |
Retail Gross Margin. We define retailRetail Gross Margin as gross margin as operating income (loss) plusprofit less (i) depreciation and amortization expenses and (ii) general and administrative expenses, less (iii) net asset optimization revenues (expenses), (iv)(ii) net gains (losses) on non-trading derivative instruments, and (v)(iii) net current period cash settlements on non-trading derivative instruments.instruments and (iv) gains (losses) from non-recurring events (including non-recurring market volatility). Retail gross marginGross Margin is included as a supplemental disclosure because it is a primary performance measure used by our management to determine the performance of our retail natural gas and electricity segments. As an indicator of our retail energy business’s operating performance, retail gross margin
Retail Gross Margin should not be considered an alternative to, or more meaningful than, operating income (loss),gross profit, its most directly comparable financial measure calculated and presented in accordance with GAAP.
We believe retail gross margin provides information useful to investors as an indicator of our retail energy business's operating performance.
We have historically included the financial impact of weather variability in the calculation of Retail Gross Margin. We will continue this historical approach, but during the first quarter of 2021 we added back the $64.9 million net financial loss incurred related to winter storm Uri, as described above, in the calculation of Retail Gross Margin because the extremity of the Texas storm combined with the impact of unprecedented pricing mechanisms ordered by ERCOT is considered unusual, infrequent, and non-recurring in nature. In June 2022, we received $9.6 million from ERCOT related to PURA Subchapter N Securitization financing. The $9.6 million is reflected as a non-recurring item reducing Retail Gross Margin for the year ended December 31, 2022 for consistent presentation of the financial impacts of winter storm Uri.
The GAAP measure most directly comparable to Retail Gross Margin is operating income (loss).gross profit. The following table presents a reconciliation of Retail Gross Margin to operating income (loss)gross profit for each of the periods indicated.
| | | | | | | | | | | | | | | | | |
| | Year Ended December 31, |
| (in thousands) | 2020 | | 2019 | | 2018 |
| Reconciliation of Retail Gross Margin to Operating Income (Loss): | | | | | |
| Operating income (loss) | $ | 88,797 | | | $ | 23,979 | | | $ | (3,654) | |
| Plus: | | | | | |
| Depreciation and amortization | 30,767 | | | 40,987 | | | 52,658 | |
| General and administrative expense | 90,734 | | | 133,534 | | | 111,431 | |
| Less: | | | | | |
| Net asset optimization (expense) revenue | (657) | | | 2,771 | | | 4,511 | |
| Losses on non-trading derivative instruments | (23,439) | | | (67,955) | | | (19,571) | |
| Cash settlements on non-trading derivative instruments | 37,921 | | | 42,944 | | | (9,614) | |
| Retail Gross Margin | $ | 196,473 | | | $ | 220,740 | | | $ | 185,109 | |
| Retail Gross Margin - Retail Electricity Segment | $ | 143,233 | | | $ | 160,540 | | | $ | 124,668 | |
| Retail Gross Margin - Retail Natural Gas Segment | $ | 53,240 | | | $ | 60,200 | | | $ | 60,441 | |
| | | | | | | | | | | | | | | | | |
| | Year Ended December 31, |
| (in thousands) | 2023 | | 2022 | | 2021 |
| Reconciliation of Retail Gross Margin to Gross Profit: | | | | | |
| Total Revenues | $ | 435,192 | | | $ | 460,493 | | | $ | 393,485 | |
| Less: | | | | | |
| Retail cost of revenues | 310,744 | | | 357,096 | | | 323,219 | |
| Gross Profit | $ | 124,448 | | | $ | 103,397 | | | $ | 70,266 | |
| Less: | | | | | |
| Net asset optimization expense | (7,326) | | | (2,322) | | | (4,243) | |
| Net, (loss) gain on non-trading derivative instruments | (70,304) | | | 17,305 | | | 22,130 | |
| Net, cash settlements on non-trading derivative instruments | 65,428 | | | (35,966) | | | (15,752) | |
| Non-recurring event - winter storm Uri | — | | | 9,565 | | | (64,403) | |
| Retail Gross Margin | $ | 136,650 | | | $ | 114,815 | | | $ | 132,534 | |
Retail Gross Margin - Retail Electricity Segment (1)(2) | $ | 87,566 | | | $ | 82,749 | | | $ | 96,009 | |
| Retail Gross Margin - Retail Natural Gas Segment | $ | 47,489 | | | $ | 32,066 | | | $ | 36,525 | |
| Retail Gross Margin - Other | $ | 1,595 | | | $ | — | | | $ | — | |
(1) Retail Gross Margin for the year ended December 31, 2021 includes a $0.5 million reduction related to the winter storm Uri credit settlements received and includes a $64.4 million add back related to winter storm Uri.
(2) Retail Gross Margin for year ended December 31, 2022 includes a deduction of $9.6 million related to proceeds received under an ERCOT (winter storm Uri) securitization mechanism in June 2022. See further discussion below.
Our non-GAAP financial measures of Adjusted EBITDA and Retail Gross Margin should not be considered as alternatives to net income (loss), net cash provided by operating activities, or operating income (loss).gross profit. Adjusted EBITDA and Retail Gross Margin are not presentations made in accordance with GAAP and have limitations as analytical tools. You should not consider Adjusted EBITDA or Retail Gross Margin in isolation or as a substitute for analysis of our results as reported under GAAP. Because Adjusted EBITDA and Retail Gross Margin exclude some, but not all, items that affect net income (loss), net cash provided by operating activities, and operating income (loss),gross profit, and are defined differently by different companies in our industry, our definition of Adjusted EBITDA and Retail Gross Margin may not be comparable to similarly titled measures of other companies.
Management compensates for the limitations of Adjusted EBITDA and Retail Gross Margin as analytical tools by reviewing the comparable GAAP measures, understanding the differences between the measures and incorporating these data points into management’s decision-making process.
Consolidated Results of Operations
| | (In Thousands) | (In Thousands) | Year Ended December 31, | |
| 2020 | | 2019 | | 2018 | |
| (In Thousands) | |
| (In Thousands) | |
| 2023 | |
| 2023 | |
| 2023 | |
| Revenues: | |
| Revenues: | |
| Revenues: | Revenues: | | |
| Retail revenues | Retail revenues | $ | 555,547 | | | $ | 810,954 | | | $ | 1,001,417 | | |
| Net asset optimization (expense) revenues | (657) | | | 2,771 | | | 4,511 | | |
| Retail revenues | |
| Retail revenues | |
| Net asset optimization expense | |
| Net asset optimization expense | |
| Net asset optimization expense | |
| Other revenue | |
| Other revenue | |
| Other revenue | |
| Total Revenues | |
| Total Revenues | |
| Total Revenues | Total Revenues | 554,890 | | | 813,725 | | | 1,005,928 | | |
| Operating Expenses: | Operating Expenses: | | |
| Operating Expenses: | |
| Operating Expenses: | |
| Retail cost of revenues | |
| Retail cost of revenues | |
| Retail cost of revenues | Retail cost of revenues | 344,592 | | | 615,225 | | | 845,493 | | |
| General and administrative expense | General and administrative expense | 90,734 | | | 133,534 | | | 111,431 | | |
| General and administrative expense | |
| General and administrative expense | |
| Depreciation and amortization | |
| Depreciation and amortization | |
| Depreciation and amortization | Depreciation and amortization | 30,767 | | | 40,987 | | | 52,658 | | |
| Total Operating Expenses | Total Operating Expenses | 466,093 | | | 789,746 | | | 1,009,582 | | |
| Operating income (loss) | 88,797 | | | 23,979 | | | (3,654) | | |
| Total Operating Expenses | |
| Total Operating Expenses | |
| Operating income | |
| Operating income | |
| Operating income | |
| Other (expense)/income: | |
| Other (expense)/income: | |
| Other (expense)/income: | Other (expense)/income: | | |
| Interest expense | Interest expense | (5,266) | | | (8,621) | | | (9,410) | | |
| Interest expense | |
| Interest expense | |
| | Gain on disposal of eRex | — | | | 4,862 | | | — | | |
| | Interest and other income | |
| | Interest and other income | |
| | Interest and other income | Interest and other income | 423 | | | 1,250 | | | 749 | | |
| Total Other (Expenses)/Income | Total Other (Expenses)/Income | (4,843) | | | (2,509) | | | (8,661) | | |
| Total Other (Expenses)/Income | |
| Total Other (Expenses)/Income | |
| Income (loss) before income tax expense | |
| Income (loss) before income tax expense | |
| Income (loss) before income tax expense | Income (loss) before income tax expense | 83,954 | | | 21,470 | | | (12,315) | | |
| Income tax expense | Income tax expense | 15,736 | | | 7,257 | | | 2,077 | | |
| Income tax expense | |
| Income tax expense | |
| Net income (loss) | |
| Net income (loss) | |
| Net income (loss) | Net income (loss) | $ | 68,218 | | | $ | 14,213 | | | $ | (14,392) | | |
| Other Performance Metrics: | Other Performance Metrics: | | |
Adjusted EBITDA (1) | $ | 106,634 | | | $ | 92,404 | | | $ | 70,716 | | |
Retail Gross Margin (1) | $ | 196,473 | | | $ | 220,740 | | | $ | 185,109 | | |
| Other Performance Metrics: | |
| Other Performance Metrics: | |
Adjusted EBITDA (1) (2) (5) | |
Adjusted EBITDA (1) (2) (5) | |
Adjusted EBITDA (1) (2) (5) | |
Retail Gross Margin (1) (3)(4) | |
Retail Gross Margin (1) (3)(4) | |
Retail Gross Margin (1) (3)(4) | |
| Customer Acquisition Costs | |
| Customer Acquisition Costs | |
| Customer Acquisition Costs | Customer Acquisition Costs | $ | 1,513 | | | $ | 18,685 | | | $ | 14 | | |
| RCE Attrition | RCE Attrition | 5.0 | % | | 5.0 | % | | 4.7 | % | |
| RCE Attrition | |
| RCE Attrition | |
| Distributions paid to Class B non-controlling unit holders and dividends paid to Class A common shareholders | Distributions paid to Class B non-controlling unit holders and dividends paid to Class A common shareholders | $ | (40,019) | | | $ | (45,176) | | | $ | (45,261) | | |
| Distributions paid to Class B non-controlling unit holders and dividends paid to Class A common shareholders | |
| Distributions paid to Class B non-controlling unit holders and dividends paid to Class A common shareholders | |
|
(1) Adjusted EBITDA and Retail Gross Margin are Non-GAAPnon-GAAP financial measures. See “" —Non-GAAP Performance Measures”Measures" for a reconciliation of Adjusted EBITDA and Retail Gross Margin to their most directly comparable GAAP financial measures.
(2) Adjusted EBITDA for the year ended December 31, 2021 includes a $60.0 million add back related to winter storm Uri and a deduction of $2.2 million non-recurring legal settlement related to an add back in 2019.
(3) Retail Gross Margin for the year ended December 31, 2021 includes a $0.5 million reduction related to the winter storm Uri credit settlements received and includes a $64.4 million add back related to winter storm Uri.
(4) Retail Gross Margin for the year ended December 31, 2022 includes a deduction of $9.6 million non-recurring credit related to winter storm Uri add back in 2021.
(5) Adjusted EBITDA for the year ended December 31, 2023 includes a $0.8 million add back related to merger agreement expense.
Total Revenues. Total revenues for the year ended December 31, 20202023 were approximately $554.9$435.2 million, a decrease of approximately $258.8$25.3 million, or 32%5%, from approximately $813.7$460.5 million for the year ended December 31, 2019.2022. This decrease was primarily due to a decrease inlower electricity and natural gas volumes sold as a result of a smaller electricity customer book in 2020during 2023 as compared to 2019 and milder weather, partially2022 offset by an increase in electricity unit revenue per MWh. Total revenues for the year ended December 31, 2019 decreased2022 increased approximately $192.2$67.0 million, or 19%17%, from approximately $1,005.9$393.5 million for the year ended December 31, 2018.2021. This decreaseincrease was primarily due to a decrease in electricity and natural gas volumes as a result of a smaller C&I customer book in 2019 as compared to 2018, partially offset by an increase in electricity unit revenue per MWh.
Analysis of the impact of changes in prices and volumes between the years ended December 31, 2020, 20192023, 2022 and 20182021 are as follows:
| | 2020 vs. 2019 | | 2019 vs. 2018 |
| 2023 vs. 2022 | | | 2023 vs. 2022 | | 2022 vs. 2021 |
| Change in electricity volumes sold | Change in electricity volumes sold | $ | (254.0) | | | $ | (221.5) | |
| Change in natural gas volumes sold | Change in natural gas volumes sold | (29.0) | | | (18.4) | |
| Change in electricity unit revenue per MWh | Change in electricity unit revenue per MWh | 26.9 | | | 46.5 | |
| Change in electricity unit revenue per MWh - winter storm Uri | |
| Change in natural gas unit revenue per MMBtu | Change in natural gas unit revenue per MMBtu | 0.7 | | | 2.9 | |
| Change in net asset optimization (expense) revenue | Change in net asset optimization (expense) revenue | (3.4) | | | (1.7) | |
| Change in other revenue | |
| Change in total revenues | Change in total revenues | $ | (258.8) | | | $ | (192.2) | |
Retail Cost of Revenues. Total retail cost of revenues for the year ended December 31, 20202023 was approximately $344.6$310.7 million, a decrease of approximately $270.6$46.4 million, or 44%13%, from approximately $615.2$357.1 million for the year ended December 31, 2019.2022. This decrease was primarily due to a decrease inlower electricity and natural gas volumes sold as a result of a smaller electricity customer book in 2020during 2023 as compared to 2019,2022, offset by a decreaseincrease in electricity and natural gas unit cost, and a changesupply costs due to higher electricity commodity price environment in fair value of our retail derivative portfolio.2023. Total retail cost of revenues for the year ended December 31, 2019 decreased2022 increased approximately $230.3$33.9 million, or 27%10%, from approximately $845.5$323.2 million for the year ended December 31, 2018.2021. This decreaseincrease was primarily due to a decreasean increase in electricity and natural gas volumes as a result of a smaller C&I customer booksupply costs due to higher commodity price environment in 2019, a decrease in electricity and natural gas unit cost,2022, and a change in fairthe value of our retail derivative portfolio.portfolio, offset by electricity supply costs related to winter storm Uri in 2021 that did not re-occur in 2022 and a winter storm Uri credit received from ERCOT in 2022.
Analysis of the impact of changes in prices and volumes between the years ended December 31, 2020, 2019,2023, 2022, and 20182021 are as follows:
| | 2020 vs. 2019 | | 2019 vs. 2018 |
| 2023 vs. 2022 | | | 2023 vs. 2022 | | 2022 vs. 2021 |
| Change in electricity volumes sold | Change in electricity volumes sold | $ | (194.7) | | | $ | (189.5) | |
| Change in natural gas volumes sold | Change in natural gas volumes sold | (14.7) | | | (10.3) | |
| Change in electricity unit cost per MWh | Change in electricity unit cost per MWh | (15.1) | | | (21.4) | |
| Change in electricity unit cost per MWh - winter storm Uri | |
| Change in natural gas unit cost per MMBtu | Change in natural gas unit cost per MMBtu | (6.6) | | | (4.9) | |
| Change in value of retail derivative portfolio | Change in value of retail derivative portfolio | (39.5) | | | (4.2) | |
| Change in other costs | |
| Change in retail cost of revenues | Change in retail cost of revenues | $ | (270.6) | | | $ | (230.3) | |
General and Administrative Expense. General and administrative expense for the year ended December 31, 20202023 was approximately $90.7$68.9 million, a decreasean increase of approximately $42.8$7.0 million, or 32%11%, as compared to $133.5$61.9 million for the year ended December 31, 2019.2022. This decreaseincrease was primarily attributable to legalhigher employee costs and regulatory settlements and increased litigation expense in 2019 that did not reoccur in 2020, a decreasean increase in sales and marketing costs in 2020 due to limitation on our door-to-door marketing as a result of COVID-19 and lower bad debt expense in 2020 due to improved collections efforts.increased sales activity. General and administrative expense for the year ended December 31, 20192022 increased approximately $22.1$17.6 million, or 20%40%, as compared to $111.4$44.3 million for the year ended December 31, 2018.2021. This increase was primarily attributable to non-recurring legalhigher employee costs and regulatory settlements and increased litigationhigher bad debt expense in 2019.2022 and lower employee costs in 2021 due to employee retention credits related to CARES Act that did not re-occur in 2022.
Depreciation and Amortization Expense. Depreciation and amortization expense for the year ended December 31, 20202023 was approximately $30.8$9.1 million, a decrease of approximately $10.2$7.6 million, or 25%46%, from approximately $41.0$16.7 million for the year ended December 31, 2019.2022. This decrease was primarily due to the decreased amortization expense associated with customer relationship intangibles. Depreciation and amortization expense for the year ended December 31, 20192022 decreased approximately $11.7$4.9 million, or 22%23%, from approximately $52.7$21.6 million for the year ended December 31, 2018.2021. This decrease was primarily due to the decreased amortization expense associated with customer relationship intangibles.
Customer Acquisition Cost. Customer acquisition cost for the year ended December 31, 20202023 was approximately $1.5$6.7 million, a decreasean increase of approximately $17.2$0.8 million, or 92%14%, from approximately $18.7$5.9 million for the year
ended December 31, 2019.2022. This increase was primarily due to increased sales activity in 2023 as compared to 2022. Customer acquisition cost for the year ended December 31, 2022 increased approximately $4.5 million, or 315% from approximately $1.4 million for the year ended December 31, 2021, and reflected a return to more historical levels. This decrease was primarily due to limitation on our door-to-door marketing as a result of COVID-19 during the majoritymost of 20202021. The low customer acquisition cost in 2021 was primarily due to a limitation on our ability to use door-to-door marketing as a result of COVID-19 and a reduction in targeted organic customer acquisitions as we focused our efforts to improve our organic sales channels, including vendor selection and sales quality. Customer acquisition cost for the year ended December 31, 2019 increased approximately $5.0 million, or 37% from approximately $13.7 million for the year ended December 31, 2018. This increase was primarily due to an increase in the number of organic sales in 2019 as compared to 2018, as we slowed our organic sales in 2018 to concentrate on acquisitions of companies and portfolios of customers.
Operating Segment Results
| | | | Year Ended December 31, | | Year Ended December 31, |
| | | 2020 | | 2019 | | 2018 | | 2023 | | 2022 | | 2021 |
| | | (in thousands, except volume and per unit operating data) | | (in thousands, except volume and per unit operating data) |
| Retail Electricity Segment | Retail Electricity Segment | |
| Total Revenues | Total Revenues | $ | 461,393 | | | $ | 688,451 | | | $ | 863,451 | |
| Retail Cost of Revenues | 306,012 | | | 552,250 | | | 762,771 | |
| | Less: Net Gains (Losses) on non-trading derivatives, net of cash settlements | 12,148 | | | (24,339) | | | (23,988) | |
Retail Gross Margin (1) —Electricity | $ | 143,233 | | | $ | 160,540 | | | $ | 124,668 | |
| Volumes—Electricity (MWhs) | 4,049,543 | | | 6,416,568 | | | 8,630,653 | |
Retail Gross Margin (2) —Electricity per MWh | $ | 35.37 | | | $ | 25.02 | | | $ | 14.44 | |
| | Retail Natural Gas Segment | |
| Total Revenues | |
| Total Revenues | Total Revenues | $ | 94,154 | | | $ | 122,503 | | | $ | 137,966 | |
| Retail Cost of Revenues | Retail Cost of Revenues | 38,580 | | | 62,975 | | | 82,722 | |
| | Less: Net Gains (Losses) on non-trading derivatives, net of cash settlements | 2,334 | | | (672) | | | (5,197) | |
| Less: Net (Losses) Gains on non-trading derivatives, net of cash settlements | |
| Less: Net (Losses) Gains on non-trading derivatives, net of cash settlements | |
| Less: Net (Losses) Gains on non-trading derivatives, net of cash settlements | |
| Non-recurring event - winter storm Uri | |
Retail Gross Margin (1) —Electricity | |
Volumes—Electricity (MWhs) (3) | |
Retail Gross Margin (2) (4) —Electricity per MWh | |
| | Retail Natural Gas Segment | |
| Retail Natural Gas Segment | |
| Retail Natural Gas Segment | |
| Total Revenues | |
| Total Revenues | |
| Total Revenues | |
| Retail Cost of Revenues | |
| | Less: Net (Losses) Gains on non-trading derivatives, net of cash settlements | |
| Less: Net (Losses) Gains on non-trading derivatives, net of cash settlements | |
| Less: Net (Losses) Gains on non-trading derivatives, net of cash settlements | |
Retail Gross Margin (1) —Gas | Retail Gross Margin (1) —Gas | $ | 53,240 | | | $ | 60,200 | | | $ | 60,441 | |
| Volumes—Gas (MMBtus) | Volumes—Gas (MMBtus) | 11,100,446 | | | 14,543,563 | | | 16,778,393 | |
Retail Gross Margin (2) —Gas per MMBtu | Retail Gross Margin (2) —Gas per MMBtu | $ | 4.80 | | | $ | 4.14 | | | $ | 3.60 | |
(1) Reflects the Retail Gross Margin attributable to our Retail Electricity Segment or Retail Natural Gas Segment, as applicable. Retail Gross Margin is a non-GAAP financial measure. See “—Non-GAAP"Non-GAAP Performance Measures”Measures" for a reconciliation of Retail Gross Margin to most directly comparable financial measures presented in accordance with GAAP.
(2) Reflects the Retail Gross Margin for the Retail Electricity Segment or Retail Natural Gas Segment, as applicable, divided by the total volumes in MWh or MMBtu, respectively.
(3) Excludes volumes (8,402 MWhs) related to winter storm Uri impact for the year ended December 31, 2021.
(4) Retail Gross Margin - Electricity per MWh excludes winter storm Uri impact.
Retail Electricity Segment
Total revenues for the Retail Electricity Segment for the year ended December 31, 20202023 were approximately $461.4$328.5 million, a decrease of approximately $227.1$24.3 million, or 33%7%, from approximately $688.5$352.8 million for the year ended December 31, 2019.2022. This decrease was largely due to lower volumes sold, resulting in a decrease of $254.0 million as a result of a smaller customer book in 2020.$60.6 million. This decrease was partially offset by higher weighted average electricity rates due to our customer mix shifting away from large commercial customers, which resultedprices, resulting in an increase of $26.9$36.3 million. Total revenues for the Retail Electricity Segment for the year ended December 31, 2019 decreased2022 increased approximately $175.0$30.2 million, or 20%9%, from approximately $863.5$322.6 million for the year ended December 31, 2018.2021. This decreaseincrease was largely due to lowerhigher electricity prices, resulting in an increase of $61.4 million. This was partially offset by a decrease in volumes, sold, resultingwhich resulted in a decrease of $221.5$30.5 million, asand a resultdecrease of a smaller commercial book in 2019. This decrease was partially offset by higher weighted average$0.9 million related to electricity rates,revenue due to our customer mix shifting away from large commercial customers, which resultedwinter storm Uri in an increase2021 that did not re-occur in 2022.
Table of $46.5 million.Contents
Retail cost of revenues for the Retail Electricity Segment for the year ended December 31, 20202023 was approximately $306.0$241.0 million, a decrease of approximately $246.3$34.7 million, or 45%13%, from approximately $552.3$275.7 million for the year ended December 31, 2019.2022. This decrease was primarily due to a decrease inlower volumes sold, resulting in a decrease of $194.7 million. This decrease was further impacted by decreased electricity supply costs, which resulted in a decrease in retail cost of revenues of $15.1 million. Additionally, there was$46.4 million and a decrease of $36.5$15.2 million due to a change in the value of our retail derivative portfolio used in hedging.hedging and a credit of $9.6 million related to Winter Storm Uri received in 2022 that did not reoccur in 2023. This was offset by an increase in electricity costs of $17.3 million due to higher commodity price environment in 2023. Retail cost of revenues for the Retail Electricity Segment for the year ended December 31, 20192022 decreased approximately $210.5$9.1 million, or 28%3%, from approximately $762.8$284.8 million for the year ended December 31, 2018.2021. This decrease was primarily due to a decrease in supply costs of $74.8 million related to winter storm Uri in 2021 that did not re-occur in 2022 (which includes a credit of $9.6 million related to winter storm Uri received in 2022 from ERCOT) and electricity volumes sold resulting in a decrease of $189.5$21.4 million. This decrease was further impactedoffset by decreasedan increase in electricity
supply costs, which resulted$65.6 million due to higher commodity price environment in a decrease in retail cost of revenues of $21.4 million. Additionally, there was2022 and by an increase of $0.4$21.5 million due to a change in the value of our retail derivative portfolio used in hedging.
Retail gross margin for the Retail Electricity Segment for the year ended December 31, 20202023 was approximately $143.2$87.6 million, a decreasean increase of approximately $17.4$4.8 million, or 11%6%, as compared to the year ended December 31, 2019,2022, and 2019 increased2022 decreased approximately $35.8$13.3 million or 29%14% as compared to December 31, 20182021 as indicated in the table below (in millions).
| | 2020 vs. 2019 | | 2019 vs. 2018 |
| 2023 vs. 2022 | | | 2023 vs. 2022 | | 2022 vs. 2021 |
| Change in volumes sold | Change in volumes sold | $ | (59.2) | | | $ | (32.0) | |
| Change in gross margin - winter storm Uri | |
| Change in unit margin per MWh | Change in unit margin per MWh | 41.8 | | | 67.8 | |
| Change in retail electricity segment retail gross margin | Change in retail electricity segment retail gross margin | $ | (17.4) | | | $ | 35.8 | |
Electricity unit margin improved in 2023 compared to prior year as a result of higher electricity prices resulting in higher unit margin per MWh sold. Unit margins were positivelynegatively impacted in 2020 and 20192022 compared to prior yearsyear primarily as a result of the higher volumes from our residential customers, which tendelectricity cost due to have higher unit margins than our C&I customers.commodity price environment in 2022.
The volumes of electricity sold decreased from 6,416,5682,433,906 MWh for the year ended December 31, 20192022 to 4,049,5432,008,947 MWh for the year ended December 31, 2020.2023. This decrease was primarily due to a smaller C&I customer book in 2019.during 2023. The volumes of electricity sold decreased from 8,630,6532,677,681 MWh for the year ended December 31, 20182021 to 6,416,5682,433,906 MWh for the year ended December 31, 2019.2022. This decrease was primarily due to a smaller C&I customer book in 2019.2022 as compared to 2021.
Retail Natural Gas Segment
Total revenues for the Retail Natural Gas Segment for the year ended December 31, 20202023 were approximately $94.2$110.9 million, a decreasean increase of approximately $28.3$0.8 million, or 23%1%, from approximately $122.5$110.1 million for the year ended December 31, 2019.2022. This decreaseincrease was primarily attributable to a decrease in volumes of $29.0 million, offset by higher rates, which resulted in an increase in total revenues of $0.7$3.7 million, partially offset by a decrease in volumes of $2.9 million. Total revenues for the Retail Natural Gas Segment for the year ended December 31, 2019 decreased2022 increased by approximately $15.5$35.0 million, or 11%47%, from approximately $138.0$75.1 million for the year ended December 31, 2018.2021. This decreaseincrease was primarily attributable to a decreasean increase in volumes of $18.4$25.6 million, offset byand higher rates, which resulted in an increase in total revenues of $2.9$9.5 million.
Retail cost of revenues for the Retail Natural Gas Segment for the year ended December 31, 20202023 were approximately $38.6$68.2 million, a decrease of approximately $24.4$13.2 million, or 39%16%, from approximately $63.0$81.4 million for the year ended December 31, 2019. This2022. The decrease was primarily due to lower supply costs of $6.6$12.5 million, a decreaselower volumes of $14.7$2.1 million, related to decreased volumes, and a decreaseoffset by an increase of $3.0$1.4 million due to change in the fair value of our retail derivative portfolio used for hedging. Retail cost of revenues for the Retail Natural Gas Segment for the year ended December 31, 2019 decreased2022 increased approximately $19.7$43.0 million, or 24%112%, from approximately $82.7$38.4 million for the year ended December 31, 2018. This decrease2021. The increase was primarily due to decreasedhigher supply costs of $4.9$26.2 million, a decreasehigher volumes of $10.3$13.2 million, related to decreased volumes, and a decreasean increase of $4.5$3.6 million due to change in the fair value of our retail derivative portfolio used for hedging.
Retail gross margin for the Retail Natural Gas Segment for the year ended December 31, 20202023 was approximately $53.2$47.5 million, a decreasean increase of approximately $7.0$15.4 million, or 12%48% from approximately $60.2$32.1 million for the year ended December 31, 2019,2022, and 20192022 decreased approximately $0.2$4.4 million or less than 1%12% from approximately $60.4$36.5 million for the year ended December 31, 20182021 as indicated in the table below (in millions).
| | 2020 vs. 2019 | | 2019 vs. 2018 |
| 2023 vs. 2022 | | | 2023 vs. 2022 | | 2022 vs. 2021 |
| Change in volumes sold | Change in volumes sold | $ | (14.3) | | | $ | (8.1) | |
| Change in unit margin per MMBtu | Change in unit margin per MMBtu | 7.3 | | | 7.9 | |
| Change in retail natural gas segment retail gross margin | Change in retail natural gas segment retail gross margin | $ | (7.0) | | | $ | (0.2) | |
UnitNatural Gas unit margins were positively impactedimproved in 2020 and 20192023 compared to prior yearsyear primarily as a result of the lower natural cost supply costs in 2023. Unit margins were negatively impacted in 2022 compared to prior year primarily as a result of the higher volumes from our residential customers, which tendnatural cost supply costs due to have higher unit margins than our commercial customers.commodity price environment in 2022.
The volumes of natural gas sold decreased from 14,543,56311,558,952 MMBtu for the year ended December 31, 20192022 to 11,100,44611,252,862 MMBtu for the year ended December 31, 2020.2023. This decrease was primarily due to milder-than-normal weathera smaller customer book in 20202023 compared to prior year.2022. The volumes of natural gas sold decreasedincreased from 16,778,3938,611,285 MMBtu for the year ended December 31, 20182021 to 14,543,56311,558,952 MMBtu for the year ended December 31, 2019.2022. This decreaseincrease was primarily due to warmer-than-normal weathera larger customer book in the second and third quarters of 2019.2022 compared to 2021.
Liquidity and Capital Resources
Overview
Our primary sources of liquidity are cash generated from operations and borrowings under our Senior Credit Facility. Our principal liquidity requirements are to meet our financial commitments, finance current operations, fund organic growth and/or acquisitions, service debt and pay dividends. Our liquidity requirements fluctuate with our level of customer acquisition costs, acquisitions, collateral posting requirements on our derivative instruments portfolio, distributions, the effects of the timing between the settlement of payables and receivables, including the effect of bad debts, weather conditions, and our general working capital needs for ongoing operations. Estimating our liquidity requirements is highly dependent on then-current market conditions, forward prices for natural gas and electricity, market volatility and our then existing capital structure and requirements.
We believe that cash generated from operations and our available liquidity sources will be sufficient to sustain current operations and to pay required taxes and quarterly cash distributions, including the quarterlytaxes. Our ability to pay dividends to the holders of the Class A common stock and the Series A Preferred Stock forin the next twelve months. Estimatingfuture will ultimately depend on our liquidity requirements is highly dependent on then-current market conditions, including impacts ofRCE count, margins, profitability and cash flow, and the COVID-19 pandemic, weather events, forward prices for natural gas and electricity, market volatility andcovenants under our then existing capital structure and requirements.Senior Credit Facility.
Liquidity Position
The following table details our available liquidity as of December 31, 2020:2023:
| | | | | |
| December 31, |
| ($ in thousands) | 20202023 |
| Cash and cash equivalents | $ | 71,68442,595 | |
Senior Credit Facility Availability (1) (2) | 71,46748,395 | |
| |
Subordinated Debt Facility Availability (3)(2) | 25,000 | |
| Total Liquidity | $ | 168,151115,990 | |
(1) Reflects amount of Letters of Credit that could be issued based on existing covenants as of December 31, 2020.2023.
(2) On January 19, 2021, we increased the total commitments under our Senior Credit Facility from $202.5 million to $227.5 million, which will positively affect liquidity in future quarters.
(3) The availability of the Subordinated Facility is dependent on our Founder'sMr. Maxwell's willingness and ability to lend. See "—"— Sources of Liquidity and Capital Resources — Amended and Restated Subordinated Debt Facility."
Borrowings and related posting of letters of credit under our Senior Credit Facility are subject to material variations on a seasonal basis due to the timing of commodity purchases to satisfy natural gas inventory requirements and to meet customer demands during periods of peak usage. Additionally, borrowings are subject to borrowing base and covenant restrictions.
During the winter storm Uri event, we were required to post a significant amount of collateral with ERCOT. Despite these posting requirements, we consistently maintained, and continue to maintain, sufficient liquidity to conduct our operations in the ordinary course. As of February 28, 2021, we had $148.6 million of cash, availability under our Senior Credit Facility and Subordinated Debt Facility to meet any of our liquidity needs.
Cash Flows
Our cash flows were as follows for the respective periods (in thousands):
| | | |
| | |
| | |
| | | | Year Ended December 31, | |
| | | 2020 | | 2019 | | 2018 | |
| Net cash provided by operating activities | Net cash provided by operating activities | $ | 91,831 | | | $ | 91,735 | | | $ | 59,763 | | |
| Net cash (used in) provided by investing activities | $ | (2,154) | | | $ | 1,398 | | | $ | (18,981) | | |
| Net cash provided by operating activities | |
| Net cash provided by operating activities | |
| Net cash used in by investing activities | |
| Net cash used in by investing activities | |
| Net cash used in by investing activities | |
| Net cash used in financing activities | Net cash used in financing activities | $ | (75,661) | | | $ | (85,103) | | | $ | (20,563) | | |
| Net cash used in financing activities | |
| Net cash used in financing activities | |
Cash Flows Provided by Operating Activities. Cash flows provided by operating activities for the year ended December 31, 20202023 increased by $0.1$33.1 million compared to the year ended December 31, 2019.2022. The increase was primarily the result of a higher net income in 20202023 coupled with other changes in working capital for the year ended December 31, 2020.capital. Cash flows provided by operating activities for the year ended December 31, 20192022 increased by $32.0$3.5 million compared to the year ended December 31, 2018.2021. The increase was primarily the result of higher net income in 20192022 coupled with a decrease in theother changes in working capital, non-recurring winter storm Uri related costs of $64.4 million for the year ended December 31, 2019.2021, which did not re-occur in 2022, and a $9.6 million credit received in the year ended December 31, 2022 from ERCOT related to winter storm Uri
Cash Flows Used in Investing Activities. Cash flows used in investing activities increaseddecreased by $3.6$5.4 million for the year ended December 31, 2020.2023. The increasedecrease was primarily the result of customer acquisitions during the proceeds received from the sale of the Company's equity method investmentyear ended December 31, 2022 that did not re-occur in 2019, less payment to acquire the Starion customers, with no corresponding proceeds or acquisitions in 2020.2023. Cash flows used in investing activities increased by $20.4$0.4 million for the year ended December 31, 2019.2022. The increase was primarily the result of a reduction in the amount of cash paidincreases related to customer acquisitions for acquisitions during the year ended December 31, 2019 compared to the year ended December 31, 2018, and proceeds received from the sale of the Company's equity method investment in 2019.2022.
Cash Flows Used in Financing Activities. Cash flows used in financing activities decreased by $9.4$8.7 million for the year ended December 31, 2020.2023. The decrease in cash flows used in financing activities was primarily due to an $11.2a decrease in net paydown of our Senior Credit Facility of $32.0 million, paymenta decrease in dividends paid to settleClass A common stockholders of $8.6 million, a decrease in distribution to non-controlling unitholders of $10.2 million, offset by net paydown of sub-debt of $20.0 million for the TRA liability in 2019 and a paymentyear ended December 31, 2023 compared to net borrowing of $2.0sub-debt of $20.0 million related to a Verde Promissory Note made during 2019, both of which did not reoccur in 2020.for the year ended December 31, 2022. Cash flows used in financing activities increased by $64.5$46.7 million for the year ended December 31, 2019.2022. The increase in cash flows used in financing activities was primarily due to an increased net paydown of our Senior Credit Facility and subordinated debt, as well as payments to settle the Company's Tax Receivable Agreement liability. In addition,of $70.0 million, offset by an increase in sub-debt borrowing of $20.0 million for the year ended December 31, 2018, we received proceeds from the issuance2022.
Table of Series A Preferred Stock of approximately $48.5 million, which did not reoccur during 2019.Contents
Sources of Liquidity and Capital Resources
Senior Credit Facility
On June 30, 2022, we entered into the Senior Credit Facility with Woodforest National Bank, as administrative agent, swing bank, swap bank, issuing bank, joint-lead arranger, sole bookrunner and syndication agent, BOKF, NA (d/b/a/ Bank of Texas), as joint-lead arranger and issuing bank, and the other financial institutions party thereto, which replaced our prior credit agreement. The Senior Credit Facility allows us to borrow up to $195.0 million on a revolving basis in the form of working capital loans, loans to fund acquisitions, swingline loans and letters of credit. The Senior Credit Facility expires on June 30, 2025. The Senior Credit Facility revised the Fixed Charge Coverage Ratio and Maximum Senior Secured Leverage Ratio under our prior credit agreement.
As of December 31, 2020,2023, we had total commitments of $202.5$195.0 million under our Senior Credit Facility, of which $131.0$121.3 million was outstanding, including $31.0$24.3 million of outstanding letters of credit, with a maturity date of July 31, 2022.credit.
On July 31, 2020, we entered into the Fourth Amendment, which, among other things, extended the maturity date of the Senior Credit Facility to July 31, 2022, and decreased the maximum borrowing capacity under the Senior Credit Facility to $187.5 million. The Fourth Amendment also revised the Fixed Charge Coverage Ratio, Maximum Total Leverage Ratio and Maximum Senior Secured Leverage Ratio (each as defined in the Senior Credit Facility), eliminated Bridge Loans, and provided for Share Buyback Loans of up to $80.0 million, which permit the Company to repurchase up to an aggregate of 8,000,000 shares of Class A common stock or $80.0 million of Series A Preferred Stock. Under the Senior Credit Facility, we have various limits on advances for Working Capital Loans, Letters of Credit and Share Buyback Loans. For a description of the terms and conditions of our Senior Credit Facility, as amended, including descriptions of the interest rate, commitment fee, covenants and terms of default, please see Note 109 "Debt" in the notes to our condensed consolidated financial statements.
On October 30, 2020, a new lender was added to the Senior Credit Facility, bringing total commitments under the Senior Credit Facility to $202.5 million.
As of December 31, 2020,2023, we were in compliance with the covenants under our Senior Credit Facility. Based upon existing covenants as of December 31, 2020,2023, we had availability to borrow up to $71.5$48.4 million under the Senior Credit Facility.
On January 19, 2021, we increased the total commitmentsMaintaining compliance with our covenants under our Senior Credit Facility may impact our ability to $227.5 million.pay dividends on our Series A Preferred Stock.
Amended and Restated Subordinated Debt Facility
Our SubordinatedIn connection with entering into the Senior Credit Facility, we entered into an amended and restated subordinated promissory note (the “Subordinated Debt FacilityFacility”), which allows us to draw advances in increments of no less than $1.0 million per advance up to $25.0 million. million through January 31, 2026. Borrowings are at the discretion of Retailco. Advances thereunder accrue interest at an annual rate equal to the prime rate as published by the Wall Street Journal plus two percent (2.0%) from the date of the advance.
Although we may use the Subordinated Debt Facility from time to time to enhance short term liquidity, we do not view the Subordinated Debt Facility as a primarymaterial source of liquidity. See Note 10 "Debt" for additional details. As of December 31, 2020,2023, there was zero outstanding borrowings under the Subordinated Debt Facility, and availability to borrow up to $25.0 million under the Subordinated Debt Facility. See Note 9 "Debt" for further information regarding the extension of the Subordinated Debt Facility.
Uses of Liquidity and Capital Resources
Repayment of Current Portion of Senior Credit Facility
Our Senior Credit Facility as amended by the Fourth Amendment, matures in July 2022,June 2025, and thus, no amounts are due currently. However, due to the revolving nature of the facility, excess cash available is generally used to reduce the balance outstanding, which at December 31, 20202023 was $100.0$97.0 million. The current variable interest rate on the facility at December 31, 20202023 was 3.75%8.60%.
Customer Acquisitions
Our customer acquisition strategy consists of customer growth obtained through organic customer additions as well as opportunistic acquisitions. During the years ended December 31, 20202023 and 2019,2022, we spent a total of $1.5$6.7 million and $18.7$5.9 million, respectively, on organic customer acquisitions. As described above, the decrease was primarily due to limitation of our door-to-door marketing as a result of COVID-19 during the majority of 2020 and a reduction in targeted organic customer acquisitions as we focused our efforts to improve our organic sales channels, including vendor selection and sales quality. Our ability to grow our customer base organically or by acquisition is important to our success as we experience ongoing customer attrition each period.
Capital Expenditures
Our capital requirements each year are relatively low and generally consist of minor purchases of equipment or information system upgrades and improvements. Capital expenditures for the year ended December 31, 20202023 included approximately $2.2$1.4 million related to information systems improvements.
Dividends and Distributions
For the year ended December 31, 2020,2023, we paid $2.9 million in dividends to holders of our Class A common stock of $0.725 per share or $10.6 million in the aggregate.stock. In order to pay our stated dividends to holders of our Class A common stock, our subsidiary, Spark HoldCo is required to make corresponding distributions to holders of Class B common stock (our non-controlling interest holders). As a result, during the year ended December 31, 2020,2023, Spark HoldCo made distributions of $15.1$3.6 million to our non-controlling interest holders related to the dividend payments to our Class A shareholders. In April 2023, we announced that our Board of Directors elected to temporarily suspend the quarterly cash dividend on the Class A common stock.
ForDuring the year ended December 31, 2020,2023, we paid $7.9$10.3 million of dividends to holders of our Series A Preferred Stock, and as of December 31, 2020,2023, we had accrued $1.9$2.7 million related to dividends to holders of our Series A
Preferred Stock, which we paid on January 15, 2021.16, 2024. The Series A Preferred Stock will accrue dividends at an annual rate equal to the sum of (a) Three-Month LIBOR (if it then exists), or an alternative reference rate as of the applicable determination date and (b) 6.578%, based on the $25.00 liquidation preference per share of the Series A Preferred Stock. Following the cessation of the publication of U.S. LIBOR on June 30, 2023, we use Three Month CME Term SOFR plus a tenor spread of 0.26161 percent (or 26.161 bps) to calculate the dividend rate on the Series A Preferred Stock pursuant to the rules of the Adjustable Interest Rate (LIBOR) Act. For the year ended December 31, 2020,2023, we declared dividends of $2.1875 per share or $7.9$10.6 million in the aggregate on our Series A Preferred Stock.
On January 21, 2021,17, 2024, our Board of Directors declared a quarterly cash dividend in the amount of $0.18125 per share to holders of our Class A common stock and $0.546875$0.75960 per share for the Series A Preferred Stock. Dividends on Class A common stock will be paid on March 15, 2021 to holders of record on March 1, 2021 andthe Series A Preferred Stock dividends will be paid on April 15, 20212024 to holders of record on April 1, 2021.2024. The Board of Directors may be required to reduce, eliminate or suspend quarterly cash dividends to the holders of the Series A Preferred Stock.
Our ability to payFuture dividends in the future will depend on many factors, including the performance of our business and restrictions under our Senior Credit Facility. If our business does not generate sufficient cash for Spark HoldCo to make distributions to us to fund our Class A common stock and Series A Preferred Stock dividends, we may have to borrow to pay such amounts. Further, even if our business generates cash in excess of our current annual dividend (of $0.725 per share on our Class A common stock), we may reinvest such excess cash flows in our business and not increase the dividends payable to holders of our Class A common stock. Our future dividend policy isare within the discretion of our Board of Directors, and will depend upon the results of our operations, our financial condition, capital requirements and investment opportunities.opportunities, the performance of our business, cash flows, RCE counts and the margins we receive, as well as restrictions under our Senior Credit Facility.
Share Repurchase Program
On August 18, 2020,Even if we are permitted to pay dividends on the Series A Preferred Stock, our Board of Directors authorized a share repurchase program of upmay elect to $20.0 million of Classreduce, eliminate or suspend the dividends on the Series A common stock through August 18, 2021. During the year ended December 31, 2020, we repurchased 45,148 shares of our Class A common stock at a weighted average price of $8.75 per share, for a total cost of $0.4 million.
Collateral Posting Requirements
Our contractual agreements with certain local regulated utilities and our supplier counterparties require usPreferred Stock, in order to maintain restricted cash balances for operations or letters of credit as collateral for credit riskother reasons. A dividend penalty event would occur if dividends on the Series A Preferred Stock are in arrears for six or more quarterly dividend periods, in which case the performance risk associated withdividend rate on the future delivery of natural gas or electricity. Due to the COVID-19 pandemic, certain local regulated utilities and our supplier counterparties have contacted us inquiring about our financial conditionSeries A Preferred Stock would increase by 2.00% per annum, and the impact the pandemic is having on our operations. These inquiries may lead to additional requests for cash or letters of credit in an effort to mitigate the risk of default in paying our obligations related to the future delivery of natural gas or electricity. As of December 31, 2020, we had not been required to post additional collateral as a result of COVID-19.
As discussed above, during the winter storm Uri event, we were required to post a significant amount of collateral with ERCOT. Despite these posting requirements, we consistently maintained, and continue to maintain, sufficient liquidity to conduct our operations in the ordinary course. Asholders of the dateSeries A Preferred Stock would be entitled to elect two members to our Board of this Annual Report, our collateral requirements with ERCOT have been reduced to pre-storm levels.
Summary of Contractual Obligations
The following table discloses aggregate information about our contractual obligations and commercial commitments as of December 31, 20202023 (in millions):
| | Total | 2021 | 2022 | 2023 | 2024 | 2025 | > 5 years |
| Total | | | Total | 2024 | 2025 | 2026 | 2027 | 2028 | > 5 years |
| | Purchase obligations: | Purchase obligations: | |
| Purchase obligations: | |
| Purchase obligations: | |
| | Pipeline transportation agreements | |
| | Pipeline transportation agreements | |
| | Pipeline transportation agreements | Pipeline transportation agreements | $ | 7.7 | | $ | 3.6 | | $ | 0.7 | | $ | 0.6 | | $ | 0.7 | | $ | 0.7 | | $ | 1.4 | |
Other purchase obligations (1) | Other purchase obligations (1) | 6.4 | | 4.8 | | 1.5 | | 0.1 | | — | | — | | — | |
| Total purchase obligations | Total purchase obligations | $ | 14.1 | | $ | 8.4 | | $ | 2.2 | | $ | 0.7 | | $ | 0.7 | | $ | 0.7 | | $ | 1.4 | |
| Senior Credit Facility | Senior Credit Facility | $ | 100.0 | | $ | — | | $ | 100.0 | | $ | — | | $ | — | | $ | — | | $ | — | |
| | Debt | Debt | $ | 100.0 | | $ | — | | $ | 100.0 | | $ | — | | $ | — | | $ | — | | $ | — | |
| | Debt | |
| | Debt | |
(1) The amounts presented here include contracts for billing services and other software agreements to support our operations.
As of December 31, 2020,2023, we had no material "off-balance sheet arrangements."
Related Party Transactions
For a discussion of related party transactions, see Note 1514 "Transactions with Affiliates" in the Company’s audited consolidated financial statements.
Critical Accounting Policies and Estimates
Our significant accounting policies are described in Note 2 "Basis of Presentation and Summary of Significant Accounting Policies" to our audited consolidated financial statements. We prepare our financial statements in conformity with accounting principles generally accepted in the United States of America and pursuant to the rules and regulations of the SEC, which require us to make estimates and assumptions that affect the amounts reported in the financial statements and accompanying footnotes. Actual results could differ from those estimates. We consider the following policies to be the most critical in understanding the judgments that are involved in preparing our financial statements and the uncertainties that could impact our financial condition and results of operations.
Revenue Recognition and Retail Cost of Revenues
Our revenues are derived primarily from the sale of natural gas and electricity to retail customers. We also record revenues from sales of natural gas and electricity to wholesale counterparties, including affiliates. Revenues are recognized when the natural gas or electricity is delivered. Similarly, cost of revenues is recognized when the commodity is delivered.
In each period, natural gas and electricity that has been delivered but not billed by period is estimated. Accrued unbilled revenues are based on estimates of customer usage since the date of the last meter read and are provided by the utility. Volume estimates are based on forecasted volumes and estimated customer usage by class. Unbilled revenues are calculated by multiplying these volume estimates by the applicable rate by customer class. Estimated amounts are adjusted when actual usage is known and billed.
The cost of natural gas and electricity for sale to retail customers is similarly based on estimated supply volumes for the applicable reporting period. In estimating supply volumes, we consider the effects of historical customer volumes, weather factors and usage by customer class. Transmission and distribution delivery fees, where applicable, are estimated using the same method used for sales to retail customers. In addition, other load related costs, such as ISO fees, ancillary services and renewable energy credits are estimated based on historical trends, estimated supply volumes and initial utility data. Volume estimates are then multiplied by the supply rate and recorded as retail cost of revenues in the applicable reporting period. Estimated amounts are adjusted when actual usage is known and billed.
Accounts Receivables and Allowance for Credit Losses
The Company conducts business in many utility service markets where the local regulated utility purchases our receivables, and then becomes responsible for billing the customer and collecting payment from the customer (“POR programs”). These POR programs result in substantially all of the Company’s credit risk being linked to the applicable utility, which generally has an investment-grade rating, and not to the end-use customer. The Company monitors the financial condition of each utility and currently believes its receivables are collectible.
In markets that do not offer POR programs or when the Company chooses to directly bill its customers, certain receivables are billed and collected by the Company. The Company bears the credit risk on these accounts and records an appropriate allowance for credit losses to reflect any losses due to non-payment by customers. The Company’s customers are individually insignificant and geographically dispersed in these markets. The Company writes off customer balances when it believes that amounts are no longer collectible and when it has exhausted all means to collect these receivables.
For trade accounts receivables, the Company accrues an allowance for credit losses by business segment by pooling customer accounts receivables based on similar risk characteristics, such as customer type, geography, aging analysis, payment terms, and related macroeconomic factors. Expected credit loss exposure is evaluated for each of our accounts receivables pools. Expected credits losses are established using a model that considers historical collections experience, current information, and reasonable and supportable forecasts. The Company writes off accounts receivable balances against the allowance for credit losses when the accounts receivable is deemed to be uncollectible.
We assess the adequacy of the allowance for credit losses through review of an aging of customer accounts receivable and general economic conditions in the markets that we serve.
Derivative Instruments
We enter into both physical and financial contracts for the purchase and sale of electricity and natural gas and apply the fair value requirements of ASC Topic 815, Derivatives and Hedging.
Our derivative instruments are subject to mark-to-market accounting requirements and are recorded on the consolidated balance sheet at fair value. Derivative instruments representing unrealized gains are reported as derivative assets while derivative instruments representing unrealized losses are reported as derivative liabilities. We offset amounts in the consolidated balance sheets for derivative instruments executed with the same counterparty where we have a master netting arrangement.
To manage our retail business, we hold derivative instruments that are not for trading purposes and are not designated as hedges for accounting purposes. Changes in the fair value of and amounts realized upon settlement of derivative instruments not held for trading purposes are recognized in retail costs of revenues.
As part of our asset optimization activities, we manage a portfolio of commodity derivative instruments held for trading purposes. Changes in fair value of and amounts realized upon settlements of derivatives instruments held for trading purposes are recognized in earnings in net asset optimization revenues.
We have entered into other energy-related contracts that do not meet the definition of a derivative instrument or for which we made a normal purchase, normal sale election and are therefore not accounted for at fair value.
Goodwill
As noted above, Goodwill represents the excess of cost over fair value of the assets of businesses. The goodwill on our consolidated balance sheet as of December 31, 20202023 is associated with both our Retail Natural Gas and Retail Electricity reporting units. We determine our reporting units by identifying each unit that is engaged in business activities from which it may earn revenues and incur expenses, has operating results regularly reviewed by the segment manager for purposes of resource allocation and performance assessment, and has discrete financial information.
Goodwill is assessed for impairment whenever events or circumstances indicate that impairment of the carrying value of goodwill is likely, but no less often than annually. Our annual assessment, absent a triggering event is as of October 31 of each year. On October 31, 2020,2023, we elected to performperformed a qualitativequantitative assessment of goodwill in accordance with guidance from ASC 350. This guidance permits an entity to first assess qualitative factors to determine whether it is more likely than not that the fair value of a reporting unit is less than its carrying amount as a basis for determining whether it is necessary to perform the quantitative goodwill impairment test. If350, in which we fail the qualitative test or if we elect to by-pass the qualitative assessment, then we must comparecompared our estimate of the fair value of aour reporting unitunits with itstheir carrying value,values, including goodwill. If the carrying value of the reporting unit exceeds its fair value, we would recognize a goodwill impairment loss for the amount by which the reporting unit’s carrying value exceeds its fair value. All of these assessments and calculations, including the determination of whether a triggering event has occurred to undertake an assessment of goodwill involve a high degree of judgment.
We completed our annual assessment of goodwill impairment at October 31, 2020,2023, and the test indicated no impairment.
Deferred tax assets and liabilities
The Company recognizes the amount of taxes payable or refundable for each tax year. In addition, the Company follows the asset and liability method of accounting for income taxes where deferred tax assets and liabilities are recognized for the expected future tax consequences of events that have been recognized in the financial statements or tax returns and operating loss carryforwards. Deferred tax assets and liabilities are measured using enacted tax rates expected to apply to taxable income in those years in which those temporary differences are expected to be recovered or settled. The effect on deferred tax assets and liabilities of a change in the tax rates is recognized in income in the period that includes the enactment date. A valuation allowance is provided for deferred tax assets if it is more likely than not that these items will not be realized.
In assessing the realizability of deferred tax assets, management considers whether it is more likely than not that some portion or all of the deferred tax assets will not be realized. The ultimate realization of deferred tax assets is dependent upon the generation of future taxable income during the periods in which those temporary differences become deductible. Management considers the projected future taxable income and tax planning strategies in making this assessment. All of these determinations involve estimates and assumptions.
Recent Accounting Pronouncements
Refer to Note 2 "Basis of Presentation and Summary of Significant Accounting Policies" for a discussion of recent accounting pronouncements.
Contingencies
In the ordinary course of business, we may become party to lawsuits, administrative proceedings and governmental investigations, including regulatory and other matters. Liabilities for loss contingencies arising from claims, assessments, litigation, fines, penalties and other sources are recorded when it is probable that a liability has been incurred and the amount can be reasonably estimated. For a discussion of the status of current legal and regulatory matters, see Note 1413 "Commitments and Contingencies" in the Company’s audited consolidated financial statements.
ITEM 7A. QUANTITATIVE AND QUALITATIVE DISCLOSURES ABOUT MARKET RISK
Market risks relating to our operations result primarily from changes in commodity prices and interest rates, as well as counterparty credit risk. We employ established risk management policies and procedures to manage, measure, and limit our exposure to these risks.
Commodity Price Risk
We hedge and procure our energy requirements from various wholesale energy markets, including both physical and financial markets and through short and long-term contracts. Our financial results are largely dependent on the margin we are able to realize between the wholesale purchase price of natural gas and electricity plus related costs and the retail sales price we charge our customers for these commodities. We actively manage our commodity price risk by entering into various derivative or non-derivative instruments to hedge the variability in future cash flows from fixed-price forecasted sales and purchases of natural gas and electricity in connection with our retail energy operations. These instruments include forwards, futures, swaps, and option contracts traded on various exchanges, such as NYMEX and Intercontinental Exchange, or ICE, as well as over-the-counter markets. These contracts have varying terms and durations, which range from a few days to several years, depending on the instrument. We also utilize similar derivative contracts in connection with our asset optimization activities to attempt to generate incremental gross margin by effecting transactions in markets where we have a retail presence. Generally, any such instruments that are entered into to support our retail electricity and natural gas business are categorized as having been entered into for non-trading purposes, and instruments entered into for any other purpose are categorized as having been entered into for trading purposes.
Our net (loss)/gain on our non-trading derivative instruments, net of cash settlements, was $14.5$(4.9) million and $(18.7) million for the yearyears ended December 31, 2020.2023 and December 31, 2022, respectively.
We have adopted risk management policies to measure and limit market risk associated with our fixed-price portfolio and our hedging activitieactivities. For additional information regarding our commodity price risk and our risk management policies, see “Item 1A—Risk Factors” of this Annual Report.
s.
We measure the commodity risk of our non-trading energy derivatives using a sensitivity analysis on our net open position. As of December 31, 2020,2023, our Gas Non-Trading Fixed Price Open Position (hedges net of retail load) was a short position of 92,569295,068 MMBtu. An increase of 10% in the market prices (NYMEX) from their December 31, 20202023 levels would have decreased the fair market value of our net non-trading energy portfolio by less than $0.1 million. Likewise, a decrease of 10% in the market prices (NYMEX) from their December 31, 20202023 levels would have increased the fair market value of our non-trading energy derivatives by less than $0.1 million. As of December 31, 2020,2023, our Electricity Non-Trading Fixed Price Open Position (hedges net of retail load) was a short position of 256,801280,418 MWhs. An increase of 10% in the forward market prices from their December 31, 20202023 levels would have decreased the fair market value of our net non-trading energy portfolio by $0.2$1.3 million. Likewise, a decrease of 10% in the forward market prices from their December 31, 20202023 levels would have increased the fair market value of our non-trading energy derivatives by $0.2$1.3 million.
Credit Risk
In many of the utility services territories where we conduct business, Purchase of Receivables ("POR") programs have been established, whereby the local regulated utility purchases our receivables, and becomes responsible for billing the customer and collecting payment from the customer. This service results in substantially all of our credit risk being with the utility and not to our end-use customer in these territories. Approximately 64%55%, 67%59% and 66%59% of our retail revenues were derived from territories in which substantially all of our credit risk was with local regulated utility companies as of December 31, 2020, 20192023, 2022 and 2018,2021, respectively, all of which had investment grade ratings as of such date. During the same period, we paid these local regulated utilities a weighted average discount of approximately 1.2%1.0%, 0.8%0.9% and 1.0%0.9%, respectively, of total revenues for customer credit risk protection. In certain of the POR markets in which we operate, the utilities limit their collections exposure by retaining the ability to transfer a delinquent account back to us for collection when collections are past due for a specified period.
If our collection efforts are unsuccessful, we return the account to the local regulated utility for termination of service. Under these service programs, we are exposed to credit risk related to payment for services rendered during the time between when the customer is transferred to us by the local regulated utility and the time we return the customer to the utility for termination of service, which is generally one to two billing periods. We may also realize a loss on fixed-price customers in this scenario due to the fact that we will have already fully hedged the customer's expected commodity usage for the life of the contract.
In non-POR markets (and in POR markets where we may choose to direct bill our customers), we manage customer credit risk through formal credit review in the case of commercial customers, and credit score screening, deposits and disconnection for non-payment, in the case of residential customers. Economic conditions may affect our customers' ability to pay bills in a timely manner, which could increase customer delinquencies and may lead to an increase in bad debt expense. Our bad debt expense for the year ended December 31, 2020, 20192023, 2022 and 20182021 was approximately 1.6%1.7%, 3.3%3.0% and 2.6%0.2% of non-POR market retail revenues, respectively. See “Management's Discussion and Analysis of Financial Condition and Results of Operations—Drivers of Our Business—Customer Credit Risk” for an analysis of our bad debt expense related to non-POR markets during 2020.2023.
We are exposed to wholesale counterparty credit risk in our retail and asset optimization activities. We manage this risk at a counterparty level and secure our exposure with collateral or guarantees when needed. At December 31, 20202023 and 2019,2022, approximately $0.2$2.1 million and $0.1$1.9 million of our total exposure of $3.1$2.8 million and $3.1$2.8 million, respectively, was either with a non-investment grade counterparty or otherwise not secured with collateral or a guarantee. The credit worthiness of the remaining exposure with other customers was evaluated with no material allowance recorded at December 31, 20202023 and 2019.2022.
Interest Rate Risk
We are exposed to fluctuations in interest rates under our variable-price debt obligations. Senior Credit Facility and our Series A Preferred Stock.
At December 31, 2020,2023, we were co-borrowers under the Senior Credit Facility, under which $100.0$97.0 million of variable rate indebtedness was outstanding. Based on the average amount of our variable rate indebtedness outstanding during the year ended December 31, 2020,2023, a 1% percent increase in interest rates would have resulted in additional annual interest expense of approximately $1.0 million.
On and after April 15, 2022, our Series A Preferred Stock accrue dividends at an annual rate equal to the sum of (a) Three-Month LIBOR (if it then exists), or an alternative reference rate as of the applicable determination date and (b) 6.578%, based on the $25.00 liquidation preference per share of the Series A Preferred Stock. Following the cessation of the publication of U.S. LIBOR on June 30, 2023, we use Three Month CME Term SOFR plus a tenor spread of 0.26161 percent (or 26.161 bps) to calculate the dividend rate on the Series A Preferred Stock pursuant to the rules of the Adjustable Interest Rate (LIBOR) Act. During the year ended December 31, 2023, we paid $10.3 million of dividends to holders of our Series A Preferred Stock, and as of December 31, 2023, based on the Series A Preferred Stock outstanding on December 31, 2023, a 1.0% increase in interest rates would have resulted in additional dividends of $0.9 million for the year.
Item 8. Financial Statements and Supplementary Data
| | | | | | | | |
| | |
| | |
| MANAGEMENT'S REPORT ON INTERNAL CONTROL OVER FINANCIAL REPORTING | | |
| | |
| REPORTS OF INDEPENDENT REGISTERED PUBLIC ACCOUNTING FIRM (PCAOB ID: 248) | | |
| | |
CONSOLIDATED BALANCE SHEETS AS OF DECEMBER 31, 20202023 AND DECEMBER 31, 20192022 | | |
| | |
CONSOLIDATED STATEMENTS OF OPERATIONS AND COMPREHENSIVE INCOME (LOSS) FOR THE YEARS ENDED DECEMBER 31, 2020, 20192023, 2022 AND 20182021 | | |
| | |
CONSOLIDATED STATEMENT OF CHANGES IN EQUITY FOR THE YEARS ENDED DECEMBER 31, 2020, 20192023, 2022 AND 20182021 | | |
| | |
CONSOLIDATED STATEMENTS OF CASH FLOWS FOR THE YEARS ENDED DECEMBER 31, 2020, 20192023, 2022 AND 20182021 | | |
| | |
| NOTES TO THE CONSOLIDATED FINANCIAL STATEMENTS | | |
| | |
MANAGEMENT'S REPORT ON INTERNAL CONTROL OVER FINANCIAL REPORTING
It is the responsibility of the management of Spark Energy,Via Renewables, Inc. to establish and maintain adequate internal control over financial reporting. Internal control over financial reporting is defined in Rule 13a-15(f) or 15d-15(f) promulgated under the Securities Exchange Act, of 1934, as amended, as a process designed by, or under the supervision of, our principal executive and principal financial officers and effected by our board of directors, management, and other personnel, to provide reasonable assurance regarding the reliability of financial reporting and the preparation of financial statements for external purposes in accordance with generally accepted accounting principles and includes those policies and procedures that:
•Pertain to the maintenance of records that in reasonable detail accurately and fairly reflect our transactions and dispositions of the assets;
•Provide reasonable assurance that transactions are recorded as necessary to permit preparation of financial statements in accordance with generally accepted accounting principles, and the receipts and expenditures are being made only in accordance with authorizations of our management and directors; and
•Provide reasonable assurance regarding prevention or timely detection of unauthorized acquisition, use, or disposition of our assets that could have a material effect on our financial statements.
Because of its inherent limitations, internal control over financial reporting may not prevent or detect misstatements. Also, projections of any evaluation of effectiveness to future periods are subject to the risk that controls may become inadequate because of changes in conditions, or that the degree of compliance with the policies or procedures may deteriorate.
Management has assessed the effectiveness of the Company’s internal control over financial reporting as of December 31, 2020,2023, utilizing the criteria in the Committee of Sponsoring Organizations of the Treadway Commission’s Internal Control-Integrated Framework (2013). Based on itsupon this assessment, our management concluded the Company’sthat our internal control over financial reporting was effective as of December 31, 2020.2023
Ernst & Young LLP,
Remediation of Previously Disclosed Material Weakness
As described in Part II, Item 9A “Controls and Procedures” of our 2022 Annual Report, we identified a material weakness in the design and operation of the controls over our calculation of deferred tax assets and liabilities and income tax expense as of December 31, 2022. A material weakness is defined as a deficiency, or a combination of deficiencies, in internal control over financial reporting, such that there is a reasonable possibility that a material misstatement of our annual or interim financial statements will not be prevented or detected on a timely basis.
The Company implemented remediation steps to address the material weakness and improve our internal control over financial reporting. Specifically, we have designed and implemented enhanced tax accounting processes and controls to (a) ensure changes in the Company’s interest in Spark HoldCo, LLC ("Spark HoldCo") are appropriately identified and recorded, and (b) ensure the precision of review of attributes of the Company’s deferred tax assets and liabilities and income tax expense. Additionally, the Company engaged experienced tax advisors to assist with the Company’s calculation of deferred tax assets and liabilities and income tax expense as of December 31, 2023. Testing of both the design and operating effectiveness of the Company’s enhanced controls was completed, and management concluded that the material weakness described above had been fully remediated as of December 31, 2023.
This Annual Report does not contain an attestation report of our independent registered public accounting firm who audited the Company's consolidated financial statements included in this Form 10-K, has issued an attestation report on the Company'srelated to internal control over financial reporting which is included herein.
Report of Independent Registered Public Accounting Firm
REPORT OF INDEPENDENT REGISTERED PUBLIC ACCOUNTING FIRM
To the Shareholders and the
Board of Directors of Spark Energy,and Shareholders
Via Renewables, Inc.
Opinion on the Financial Statementsfinancial statements
We have audited the accompanying consolidated balance sheets of Spark Energy,Via Renewables, Inc. (a Delaware corporation) and subsidiaries (the Company)“Company”) as of December 31, 20202023 and 2019,2022, the related consolidated statements of operations and comprehensive income (loss), changes in equity, and cash flows for each of the threetwo years in the period ended December 31, 2020,2023, and the related notes (collectively referred to as the “consolidated financial“financial statements”). In our opinion, the consolidated financial statements present fairly, in all material respects, the financial position of the Company atas of December 31, 20202023 and 2019,2022, and the results of its operations and its cash flows for each of the threetwo years in the period ended December 31, 2020,2023, in conformity with U.S.accounting principles generally accepted accounting principles.
We also have audited, in accordance with the standardsUnited States of the Public Company Accounting Oversight Board (United States) (PCAOB), the Company's internal control over financial reporting as of December 31, 2020, based on criteria established in Internal Control-Integrated Framework issued by the Committee of Sponsoring Organizations of the Treadway Commission (2013 framework) and our report dated March 4, 2021 expressed an unqualified opinion thereon.America.
Basis for Opinionopinion
These financial statements are the responsibility of the Company'sCompany’s management. Our responsibility is to express an opinion on the Company’s financial statements based on our audits. We are a public accounting firm registered with the PCAOBPublic Company Accounting Oversight Board (United States) (“PCAOB”) and are required to be independent with respect to the Company in accordance with the U.S. federal securities laws and the applicable rules and regulations of the Securities and Exchange Commission and the PCAOB.
We conducted our audits in accordance with the standards of the PCAOB. Those standards require that we plan and perform the audit to obtain reasonable assurance about whether the financial statements are free of material misstatement, whether due to error or fraud. Our audits included performing procedures to assess the risks of material misstatement of the financial statements, whether due to error or fraud, and performing procedures that respond to those risks. Such procedures included examining, on a test basis, evidence regarding the amounts and disclosures in the financial statements. Our audits also included evaluating the accounting principles used and significant estimates made by management, as well as evaluating the overall presentation of the financial statements. We believe that our audits provide a reasonable basis for our opinion.
Critical Audit Matter
The critical audit matter communicated below is a matter arising from the current period audit of the consolidated financial statements that was communicated or required to be communicated to the audit committee and that: (1) relates to accounts or disclosures that are material to the financial statements and (2) involved our especially challenging, subjective, or complex judgments. The communication of the critical audit mattermatters does not alter in any way our opinion on the consolidated financial statements, taken as a whole, and we are not, by communicating the critical audit matter below, providing a separate opinion on the critical audit matter or on the accounts or disclosures to which it relates.
| | | | | | | | |
| | Derivative Instruments
|
Description of the Matter | | As described in Note 7 of the consolidated financial statements, the Company has recognized $0.4 million in gross derivative assets and $12.1 million in gross derivative liabilities. Notional volumes associated with natural gas and electricity derivatives were 2,982,000 MMBtu and 1,845,000 MWh as of December 31, 2020. Auditing the completeness and accuracy of derivatives was complex due to the significant volume of activity associated with the Company’s risk management activities. |
Derivative Instruments
As described in Note 6 of the consolidated financial statements, the Company has recognized $2.2 million in gross derivative assets and $30.6 million in gross derivative liabilities as of December 31, 2023. We identified the completeness and accuracy of derivatives as a critical audit matter.
The principal consideration for our determination that the completeness and accuracy of derivatives is a critical audit matter is due to the significant volume of activity associated with the Company’s risk management activities and derivative portfolio.
| | | | | | | | |
How We Addressed the Matter in Our Audit | | We obtained an understanding, evaluated the design and tested the operating effectiveness of controls over the Company’s process of capturing and accounting for derivative instruments.
To test the completeness and accuracy of the Company’s derivative portfolio, our audit procedures included, among others, independently confirming details of contracts with counterparties and testing a sample of derivative contracts. For example, we confirmed directly with brokers and performed reconciliations between the broker’s statement and the Company’s derivative portfolio records. We also tested information subsequent to the balance sheet date to evaluate completeness of derivatives recorded. For example, we evaluated cash disbursement activity to evaluate completeness of the Company’s derivative portfolio records. |
Our audit procedures related to testing the completeness and accuracy of derivative instruments included the following, among others.
•We tested the design and operating effectiveness of controls over the Company’s process for capturing and accounting for derivative instruments.
•We independently confirmed a sample of derivative contracts directly with counterparties.
•We performed reconciliations between the broker’s statements and the Company’s derivative portfolio records.
•We tested a sample of derivative contracts to verify underlying data agreed to the Company’s records.
•We tested information subsequent to the balance sheet date to evaluate completeness of derivatives recorded. For example, we evaluated cash disbursement and receipt activity to evaluate completeness of the Company’s derivative portfolio records.
/s/ Ernst & Young GRANT THORNTON LLP
We have served as Spark Energy, Inc.’sthe Company's auditor since 2018.2022.
Houston, Texas
March 4, 2021February 29, 2024
Report of Independent Registered Public Accounting Firm
To the StockholdersShareholders and the Board of Directors of Spark Energy,Via Renewables, Inc.
Opinion on Internal Control overthe Financial Reporting
We have audited Spark Energy, Inc.’s internal control over financial reporting as of December 31, 2020, based on criteria established in Internal Control—Integrated Framework issued by the Committee of Sponsoring Organizations of the Treadway Commission (2013 framework) (the COSO criteria). In our opinion, Spark Energy, Inc. (the Company) maintained, in all material respects, effective internal control over financial reporting as of December 31, 2020, based on the COSO criteria.Statements
We also have audited in accordance with the standards of the Public Company Accounting Oversight Board (United States) (PCAOB), the consolidated balance sheets of Spark Energy, Inc. as of December 31, 2020 and 2019, and the relatedaccompanying consolidated statements of operations and comprehensive income (loss), changes in equity and cash flows of Via Renewables, Inc. (the Company) for each of the three years in the periodyear ended December 31, 2020,2021, and the related notes (collectively referred to as the “consolidated financial statements”),. In our opinion, the consolidated financial statements present fairly, in all material respects, the results of the Company’s operations and our report dated March 4,its cash flows for the year ended December 31, 2021, expressed an unqualified opinion thereon.in conformity with U.S. generally accepted accounting principles.
Basis for Opinion
The Company’s management is responsible for maintaining effective internal control over
These financial reporting and for its assessmentstatements are the responsibility of the effectiveness of internal control over financial reporting included in the accompanying Management Report on Internal Control over Financial Reporting.Company's management. Our responsibility is to express an opinion on the Company’s internal control over financial reportingstatements based on our audit.audits. We are a public accounting firm registered with the PCAOBPublic Company Accounting Oversight Board (United States) (PCAOB) and are required to be independent with respect to the Company in accordance with the U.S. federal securities laws and the applicable rules and regulations of the Securities and Exchange Commission and the PCAOB.
We conducted our auditaudits in accordance with the standards of the PCAOB. Those standards require that we plan and perform the audit to obtain reasonable assurance about whether effective internal control overthe financial reporting was maintainedstatements are free of material misstatement, whether due to error or fraud. Our audits included performing procedures to assess the risks of material misstatement of the financial statements, whether due to error or fraud, and performing procedures that respond to those risks. Such procedures included examining, on a test basis, evidence regarding the amounts and disclosures in all material respects.
the financial statements. Our auditaudits also included obtaining an understanding of internal control over financial reporting, assessing the risk that a material weakness exists, testing and evaluating the designaccounting principles used and operating effectivenesssignificant estimates made by management, as well as evaluating the overall presentation of internal control based on the assessed risk, and performing such other procedures as we considered necessary in the circumstances.financial statements. We believe that our audit providesaudits provide a reasonable basis for our opinion.
Definition and Limitations of Internal Control Over Financial Reporting
A company’s internal control over financial reporting is a process designed to provide reasonable assurance regarding the reliability of financial reporting and the preparation of financial statements for external purposes in accordance with generally accepted accounting principles. A company’s internal control over financial reporting includes those policies and procedures that (1) pertain to the maintenance of records that, in reasonable detail, accurately and fairly reflect the transactions and dispositions of the assets of the company; (2) provide reasonable assurance that transactions are recorded as necessary to permit preparation of financial statements in accordance with generally accepted accounting principles, and that receipts and expenditures of the company are being made only in accordance with authorizations of management and directors of the company; and (3) provide reasonable assurance regarding prevention or timely detection of unauthorized acquisition, use, or disposition of the company’s assets that could have a material effect on the financial statements.
Because of its inherent limitations, internal control over financial reporting may not prevent or detect misstatements. Also, projections of any evaluation of effectiveness to future periods are subject to the risk that controls may become inadequate because of changes in conditions, or that the degree of compliance with the policies or procedures may deteriorate.
/s/ Ernst & Young LLP
We served as Via Renewables, Inc.’s auditor from 2018 to 2022.
Houston, Texas
March 3, 2022, except for the effects of the correction of prior year financial information and the reverse stock split as discussed in Notes 2 and 4, 2021respectively, of the 2022 consolidated financial statements, as to which the date is March 29, 2023.
AUDITED CONSOLIDATED FINANCIAL STATEMENTS
SPARK ENERGY,VIA RENEWABLES, INC.
CONSOLIDATED BALANCE SHEETS
(in thousands, except share counts)
| | December 31, 2020 | | December 31, 2019 |
| December 31, 2023 | | | December 31, 2023 | | | December 31, 2022 |
| Assets | Assets | |
| Current assets: | Current assets: | |
| Current assets: | |
| Current assets: | |
| Cash and cash equivalents | |
| Cash and cash equivalents | |
| Cash and cash equivalents | Cash and cash equivalents | $ | 71,684 | | | $ | 56,664 | |
| Restricted cash | Restricted cash | 0 | | | 1,004 | |
| Accounts receivable, net of allowance for doubtful accounts of $3,942 and $4,797 as of December 31, 2020 and 2019, respectively | 70,350 | | | 113,635 | |
| Accounts receivable, net of allowance for credit losses of $4,496 and $4,335 as of December 31, 2023 and 2022, respectively | |
| Accounts receivable—affiliates | Accounts receivable—affiliates | 5,053 | | | 2,032 | |
| Inventory | Inventory | 1,496 | | | 2,954 | |
| Fair value of derivative assets | Fair value of derivative assets | 311 | | | 464 | |
| Customer acquisition costs, net | Customer acquisition costs, net | 5,764 | | | 8,649 | |
| Customer relationships, net | Customer relationships, net | 12,077 | | | 13,607 | |
| | Deposits | |
| Deposits | |
| Deposits | Deposits | 5,655 | | | 6,806 | |
| Renewable energy credit asset | Renewable energy credit asset | 20,666 | | | 24,204 | |
| Other current assets | Other current assets | 11,818 | | | 6,109 | |
| Total current assets | Total current assets | 204,874 | | | 236,128 | |
| Property and equipment, net | Property and equipment, net | 3,354 | | | 3,267 | |
| Fair value of derivative assets | Fair value of derivative assets | 0 | | | 106 | |
| Customer acquisition costs, net | Customer acquisition costs, net | 306 | | | 9,845 | |
| Customer relationships, net | Customer relationships, net | 5,691 | | | 17,767 | |
| Deferred tax assets | Deferred tax assets | 27,960 | | | 29,865 | |
| Goodwill | Goodwill | 120,343 | | | 120,343 | |
| Other assets | Other assets | 4,139 | | | 5,647 | |
| Total Assets | Total Assets | $ | 366,667 | | | $ | 422,968 | |
| Liabilities, Series A Preferred Stock and Stockholders' Equity | Liabilities, Series A Preferred Stock and Stockholders' Equity | |
| Current liabilities: | Current liabilities: | |
| Current liabilities: | |
| Current liabilities: | |
| Accounts payable | |
| Accounts payable | |
| Accounts payable | Accounts payable | $ | 27,322 | | | $ | 48,245 | |
| Accounts payable—affiliates | Accounts payable—affiliates | 826 | | | 1,009 | |
| Accrued liabilities | Accrued liabilities | 34,164 | | | 37,941 | |
| Renewable energy credit liability | Renewable energy credit liability | 19,549 | | | 33,120 | |
| Fair value of derivative liabilities | Fair value of derivative liabilities | 7,505 | | | 19,943 | |
| | Other current liabilities | Other current liabilities | 1,295 | | | 1,697 | |
| | Total current liabilities | 90,661 | | | 141,955 | |
| Long-term liabilities: | |
| Fair value of derivative liabilities | 227 | | | 495 | |
| | Long-term portion of Senior Credit Facility | 100,000 | | | 123,000 | |
| | Other current liabilities | |
| | Other current liabilities | |
| | Total current liabilities | |
| Total current liabilities | |
| Total current liabilities | |
| Long-term liabilities: | |
| Fair value of derivative liabilities | |
| Fair value of derivative liabilities | |
| Fair value of derivative liabilities | |
| | Long-term portion of Senior Credit Facility | |
| Long-term portion of Senior Credit Facility | |
| Long-term portion of Senior Credit Facility | |
| Subordinated debt—affiliate | |
| | Other long-term liabilities | |
| | Other long-term liabilities | |
| | Other long-term liabilities | Other long-term liabilities | 30 | | | 217 | |
| Total liabilities | Total liabilities | 190,918 | | | 265,667 | |
| Commitments and contingencies (Note 14) | 0 | | 0 |
| Series A Preferred Stock, par value $0.01 per share, 20,000,000 shares authorized, 3,707,256 shares issued and 3,567,543 shares outstanding at December 31, 2020 and 3,707,256 shares issued and 3,677,318 outstanding at December 31, 2019 | 87,288 | | | 90,015 | |
| Commitments and contingencies (Note 13) | | Commitments and contingencies (Note 13) | | | | |
| Series A Preferred Stock, par value $0.01 per share, 20,000,000 shares authorized, 3,567,543 shares issued and outstanding at December 31, 2023 and December 31, 2022 | |
| Stockholders' equity: | Stockholders' equity: | |
| Common Stock : | Common Stock : | |
| Class A common stock, par value $0.01 per share, 120,000,000 shares authorized, 14,771,878 shares issued and 14,627,284 shares outstanding at December 31, 2020 and 14,478,999 shares issued and 14,379,533 shares outstanding at December 31, 2019 | 148 | | | 145 | |
| Common Stock : | |
| Common Stock : | |
| | Class B common stock, par value $0.01 per share, 60,000,000 shares authorized, 20,800,000 issued and outstanding at December 31, 2020 and 20,800,000 issued and outstanding at December 31, 2019 | 209 | | 209 | |
| Class A common stock, par value $0.01 per share, 120,000,000 shares authorized, 3,261,620 shares issued and 3,232,701 shares outstanding at December 31, 2023 and 3,200,472 shares issued and 3,171,553 shares outstanding at December 31, 2022 | |
| Class B common stock, par value $0.01 per share, 60,000,000 shares authorized, 4,000,000 issued and outstanding at December 31, 2023 and December 31, 2022 | |
| Additional paid-in capital | Additional paid-in capital | 55,222 | | | 51,842 | |
| Accumulated other comprehensive loss | Accumulated other comprehensive loss | (40) | | | (40) | |
| Retained earnings | Retained earnings | 11,721 | | | 1,074 | |
| Treasury stock, at cost, 144,594 at December 31, 2020 and 99,446 shares at December 31, 2019 | (2,406) | | | (2,011) | |
| Treasury stock, at cost, 28,919 and 28,918 at December 31, 2023 and December 31, 2022 | |
| Total stockholders' equity | Total stockholders' equity | 64,854 | | | 51,219 | |
| Non-controlling interest in Spark HoldCo, LLC | Non-controlling interest in Spark HoldCo, LLC | 23,607 | | | 16,067 | |
| Total equity | Total equity | 88,461 | | | 67,286 | |
| Total Liabilities, Series A Preferred Stock and stockholders' equity | Total Liabilities, Series A Preferred Stock and stockholders' equity | $ | 366,667 | | | $ | 422,968 | |
The accompanying notes are an integral part of the consolidated financial statements.
SPARK ENERGY,VIA RENEWABLES, INC.
CONSOLIDATED STATEMENTS OF OPERATIONS AND COMPREHENSIVE INCOME (LOSS)
(in thousands, except per share data)
| | Year Ended December 31, |
| 2020 | | 2019 | | 2018 |
| Year Ended December 31, | | | Year Ended December 31, |
| 2023 | | | 2023 | | 2022 | | 2021 |
| | Revenues: | Revenues: | |
| Revenues: | |
| Revenues: | |
| Retail revenues | Retail revenues | $ | 555,547 | | | $ | 810,954 | | | $ | 1,001,417 | |
| Net asset optimization (expense) revenues | (657) | | | 2,771 | | | 4,511 | |
| | Retail revenues | |
| Retail revenues | |
| Net asset optimization expense | |
| Other revenue | |
| | Total revenues | Total revenues | 554,890 | | | 813,725 | | | 1,005,928 | |
| Total revenues | |
| Total revenues | |
| Operating expenses: | Operating expenses: | |
| Retail cost of revenues | |
| Retail cost of revenues | |
| Retail cost of revenues | Retail cost of revenues | 344,592 | | | 615,225 | | | 845,493 | |
| General and administrative | General and administrative | 90,734 | | | 133,534 | | | 111,431 | |
| Depreciation and amortization | Depreciation and amortization | 30,767 | | | 40,987 | | | 52,658 | |
| Total operating expenses | Total operating expenses | 466,093 | | | 789,746 | | | 1,009,582 | |
| Operating income (loss) | 88,797 | | | 23,979 | | | (3,654) | |
| Operating income | |
| Other (expense)/income: | Other (expense)/income: | |
| Interest expense | Interest expense | (5,266) | | | (8,621) | | | (9,410) | |
| Interest expense | |
| Interest expense | |
| Interest and other income | Interest and other income | 423 | | | 1,250 | | | 749 | |
| Gain on disposal of eRex | 0 | | | 4,862 | | | 0 | |
| | Total other (expense)/income | |
| Total other (expense)/income | |
| Total other (expense)/income | Total other (expense)/income | (4,843) | | | (2,509) | | | (8,661) | |
| Income (loss) before income tax expense | Income (loss) before income tax expense | 83,954 | | | 21,470 | | | (12,315) | |
| Income tax expense | Income tax expense | 15,736 | | | 7,257 | | | 2,077 | |
| Net income (loss) | Net income (loss) | $ | 68,218 | | | $ | 14,213 | | | $ | (14,392) | |
| Less: Net income (loss) attributable to non-controlling interest | Less: Net income (loss) attributable to non-controlling interest | 38,928 | | | 5,763 | | | (13,206) | |
| Net income (loss) attributable to Spark Energy, Inc. stockholders | $ | 29,290 | | | $ | 8,450 | | | $ | (1,186) | |
| Net income (loss) attributable to Via Renewables, Inc. stockholders | |
| Less: Dividend on Series A preferred stock | Less: Dividend on Series A preferred stock | 7,441 | | | 8,091 | | | 8,109 | |
| Net income (loss) attributable to stockholders of Class A common stock | Net income (loss) attributable to stockholders of Class A common stock | $ | 21,849 | | | $ | 359 | | | $ | (9,295) | |
| Other comprehensive (loss) income, net of tax: | |
| Currency translation (loss) gain | $ | 0 | | | $ | (102) | | | $ | 31 | |
| Other comprehensive (loss) income | 0 | | | (102) | | | 31 | |
| Other comprehensive income (loss), net of tax: | |
| | Comprehensive income (loss) | |
| | Comprehensive income (loss) | |
| | | Comprehensive income (loss) | Comprehensive income (loss) | $ | 68,218 | | | $ | 14,111 | | | $ | (14,361) | |
| | Less: Comprehensive income (loss) attributable to non-controlling interest | Less: Comprehensive income (loss) attributable to non-controlling interest | 38,928 | | | 5,703 | | | (13,188) | |
| Comprehensive income (loss) attributable to Spark Energy, Inc. stockholders | $ | 29,290 | | | $ | 8,408 | | | $ | (1,173) | |
| Less: Comprehensive income (loss) attributable to non-controlling interest | |
| Less: Comprehensive income (loss) attributable to non-controlling interest | |
| Comprehensive income attributable to Via Renewables, Inc. stockholders | |
| | Net income (loss) attributable to Spark Energy, Inc. per share of Class A common stock | |
| Net income (loss) attributable to Via Renewables, Inc. per share of Class A common stock | |
| Net income (loss) attributable to Via Renewables, Inc. per share of Class A common stock | |
| Net income (loss) attributable to Via Renewables, Inc. per share of Class A common stock | |
| Basic | |
| Basic | |
| Basic | Basic | $ | 1.50 | | | $ | 0.03 | | | $ | (0.69) | |
| Diluted | Diluted | $ | 1.48 | | | $ | 0.02 | | | $ | (0.69) | |
| | Weighted average shares of Class A common stock outstanding | Weighted average shares of Class A common stock outstanding | |
| Weighted average shares of Class A common stock outstanding | |
| Weighted average shares of Class A common stock outstanding | |
| Basic | |
| Basic | |
| Basic | Basic | 14,555 | | | 14,286 | | | 13,390 | |
| Diluted | Diluted | 14,715 | | | 14,568 | | | 13,390 | |
The accompanying notes are an integral part of the consolidated financial statements.
SPARK ENERGY,VIA RENEWABLES, INC.
CONSOLIDATED STATEMENT OF CHANGES IN EQUITY
(in thousands)
| | | Issued Shares of Class A Common Stock | |
| | Issued Shares of Class A Common Stock | |
| | Issued Shares of Class A Common Stock | | Issued Shares of Class B Common Stock | Treasury Stock | | Class A Common Stock | Class B Common Stock | Treasury Stock | Accumulated Other Comprehensive Income (Loss) | Additional Paid-In Capital | Retained Earnings (Deficit) | Total Stockholders' Equity | Non-controlling Interest | Total Equity |
| | | | Issued Shares of Class A Common Stock | Issued Shares of Class B Common Stock | Treasury Stock | | Class A Common Stock | Class B Common Stock | Treasury Stock | Accumulated Other Comprehensive Income (Loss) | Additional Paid-In Capital | Retained Earnings (Deficit) | Total Stockholders' Equity | Non-controlling Interest | Total Equity |
| | Balance at 12/31/2017: | | 13,235 | | 21,485 | | (99) | | | $ | 132 | | $ | 216 | | $ | (2,011) | | $ | (11) | | $ | 47,811 | | $ | 11,399 | | $ | 57,536 | | $ | 101,559 | | $ | 159,095 | |
| | Balance at 12/31/2020: | |
| | Balance at 12/31/2020: | |
| | Balance at 12/31/2020: | |
| | Stock based compensation | |
| | Stock based compensation | |
| | Stock based compensation | Stock based compensation | | — | | — | | — | | | — | | — | | — | | — | | 5,703 | | — | | 5,703 | | — | | 5,703 | |
| Restricted stock unit vesting | Restricted stock unit vesting | | 258 | | — | | — | | | 3 | | — | | — | | — | | (1,018) | | — | | (1,015) | | — | | (1,015) | |
| Consolidated net income (loss) | |
| Distributions paid to non-controlling unit holders | |
| Dividends paid to Class A common stockholders ($3.625 per share) | |
| Dividends paid to Preferred Stockholders | |
| Remeasurement of deferred tax assets | |
| Exchange of shares of Class B common stock to shares of Class A common stock | |
| | Consolidated net income | | — | | — | | — | | | — | | — | | — | | — | | — | | (1,186) | | (1,186) | | (13,206) | | (14,392) | |
| Foreign currency translation adjustment for equity method investee | | — | | — | | — | | | — | | — | | — | | 13 | | — | | — | | 13 | | 18 | | 31 | |
| Distributions paid to non-controlling unit holders | | — | | — | | — | | | — | | — | | — | | — | | — | | — | | — | | (35,478) | | (35,478) | |
| Dividends paid to Class A common stockholders ($0.725 per share) | | — | | — | | — | | | — | | — | | — | | — | | (4,932) | | (4,851) | | (9,783) | | — | | (9,783) | |
| Dividends to Preferred Stock | | — | | — | | — | | | — | | — | | — | | — | | (4,055) | | (4,055) | | (8,110) | | — | | (8,110) | |
| Exchange of shares of Class B common stock to shares of Class A common stock | | 685 | | (685) | | — | | | 7 | | (7) | | — | | — | | — | | — | | — | | — | | — | |
| Acquisition of Customers from Affiliate | | — | | — | | — | | | — | | — | | — | | — | | — | | — | | — | | (7,129) | | (7,129) | |
| Remeasurement of deferred tax assets | | — | | — | | — | | | — | | — | | — | | — | | 1,372 | | — | | 1,372 | | — | | 1,372 | |
| Changes in ownership interest | Changes in ownership interest | | — | | — | | — | | | — | | — | | — | | — | | 1,276 | | — | | 1,276 | | (1,276) | | — | |
| Balance at 12/31/2018: | | 14,178 | | 20,800 | | (99) | | | $ | 142 | | $ | 209 | | $ | (2,011) | | $ | 2 | | $ | 46,157 | | $ | 1,307 | | $ | 45,806 | | $ | 44,488 | | $ | 90,294 | |
| Changes in ownership interest | |
| Changes in ownership interest | |
| | Balance at 12/31/2021: | |
| | Balance at 12/31/2021: | |
| | Balance at 12/31/2021: | |
| | Stock based compensation | |
| Stock based compensation | |
| Stock based compensation | Stock based compensation | | — | | — | | — | | | — | | — | | — | | — | | 5,271 | | — | | 5,271 | | — | | 5,271 | |
| Restricted stock unit vesting | Restricted stock unit vesting | | 301 | | — | | — | | | 3 | | — | | — | | — | | (1,107) | | — | | (1,104) | | — | | (1,104) | |
| Consolidated net income | Consolidated net income | | — | | — | | — | | | — | | — | | — | | — | | — | | 8,450 | | 8,450 | | 5,763 | | 14,213 | |
| Foreign currency translation adjustment for equity method investee | | — | | — | | — | | | — | | — | | — | | (42) | | — | | — | | (42) | | (60) | | (102) | |
| Gain on settlement of TRA, net of tax | | — | | — | | — | | | — | | — | | — | | — | | 11,951 | | — | | 11,951 | | — | | 11,951 | |
| Distributions paid to non-controlling unit holders | Distributions paid to non-controlling unit holders | | — | | — | | — | | | — | | — | | — | | — | | — | | — | | — | | (34,794) | | (34,794) | |
| Dividends paid to Class A common stockholders ($0.725 per share) | | — | | — | | — | | | — | | — | | — | | — | | (7,776) | | (2,606) | | (10,382) | | — | | (10,382) | |
| Dividends paid to Class A common stockholders ($3.625 per share) | |
| Dividends paid to Preferred Stockholders | |
| | Changes in ownership interest | |
| | Changes in ownership interest | |
| | Changes in ownership interest | |
| Balance at December 31, 2022 | |
| Stock based compensation | |
| Restricted stock unit vesting | |
| Consolidated net income | |
| | | | | | | | | | | | | | | | | | | | | | | | | | | | | | | | | | | | | | | | |
| Changes in ownership interest | | — | | — | | — | | | — | | — | | — | | — | | (680) | | — | | (680) | | 680 | | 0 | |
| Dividends to Preferred Shareholders | | — | | — | | — | | | — | | — | | — | | — | | (2,029) | | (6,077) | | (8,106) | | — | | (8,106) | |
| Proceeds from disgorgement of stockholder short-swing profits | | — | | — | | — | | | — | | — | | — | | — | | 55 | | — | | 55 | | — | | 55 | |
| Acquisition of Customers from Affiliate | | — | | — | | — | | | — | | — | | — | | — | | — | | — | | — | | (10) | | (10) | |
| Balance at 12/31/2019: | | 14,479 | | 20,800 | | (99) | | | $ | 145 | | $ | 209 | | $ | (2,011) | | $ | (40) | | $ | 51,842 | | $ | 1,074 | | $ | 51,219 | | $ | 16,067 | | $ | 67,286 | |
Impact of adoption of ASC 326 | | — | | — | | — | | | — | | — | | — | | — | | — | | (633) | | (633) | | — | | (633) | |
| Balance at January 1, 2020 | | 14,479 | | 20,800 | | (99) | | | 145 | | 209 | | (2,011) | | (40) | | 51,842 | | 441 | | 50,586 | | 16,067 | | 66,653 | |
| Stock based compensation | | — | | — | | — | | | — | | — | | | — | | 2,357 | | | 2,357 | | — | | 2,357 | |
| Restricted stock unit vesting | | 293 | | — | | — | | | 3 | | — | | — | | — | | (915) | | — | | (912) | | — | | (912) | |
| Consolidated net income | | — | | — | | — | | | — | | — | | — | | — | | — | | 29,290 | | 29,290 | | 38,928 | | 68,218 | |
| Distributions paid to non-controlling unit holders | | — | | — | | — | | | — | | — | | — | | — | | — | | — | | — | | (29,450) | | (29,450) | |
| Dividends paid to Class A common stockholders ($0.725 per share) | | — | | — | | — | | | — | | — | | — | | — | | — | | (10,569) | | (10,569) | | — | | (10,569) | |
| Dividends paid to Preferred Stockholders | | — | | — | | — | | | — | | — | | — | | — | | — | | (7,441) | | (7,441) | | — | | (7,441) | |
| | | | | | | | | | | | | | |
| Treasury Shares | | — | | — | | (45) | | | — | | — | | (395) | | — | | | — | | (395) | | | (395) | |
| Changes in ownership interest | | — | | — | | — | | | — | | — | | — | | — | | 1,938 | | — | | 1,938 | | (1,938) | | 0 | |
| Balance at December 31, 2020 | | 14,772 | | 20,800 | | (144) | | | $ | 148 | | $ | 209 | | $ | (2,406) | | $ | (40) | | $ | 55,222 | | $ | 11,721 | | $ | 64,854 | | $ | 23,607 | | $ | 88,461 | |
| | | | | | | | | | | | | | | | | | | | | | | | | | | | | | | | | | | | | | | | |
| Stock issued - reverse stock split | | 14 | | — | | — | | | — | | — | | — | | — | | — | | — | | — | | — | | — | |
| Distributions paid to non-controlling unit holders | | — | | — | | — | | | — | | — | | — | | — | | — | | — | | — | | (4,308) | | (4,308) | |
| Dividends paid to Class A common stockholders ($0.90625 per share) | | — | | — | | — | | | — | | — | | — | | — | | (2,874) | | — | | (2,874) | | — | | (2,874) | |
| Dividends paid to Preferred Stockholders | | — | | — | | — | | | — | | — | | — | | — | | (2,544) | | (8,076) | | (10,620) | | — | | (10,620) | |
| | | | | | | | | | | | | | |
| | | | | | | | | | | | | | |
| | | | | | | | | | | | | | |
| Changes in ownership interest | | — | | — | | — | | | — | | — | | — | | — | | 469 | | — | | 469 | | (469) | | — | |
| Balance at December 31, 2023 | | 3,262 | | 4,000 | | (29) | | | $ | 32 | | $ | 40 | | $ | (2,406) | | $ | (40) | | $ | 40,002 | | $ | 8,972 | | $ | 46,600 | | $ | (7,881) | | $ | 38,719 | |
The accompanying notes are an integral part of the consolidated financial statements.
SPARK ENERGY,VIA RENEWABLES, INC.
CONSOLIDATED STATEMENTS OF CASH FLOWS
(in thousands)
| | | | | | | | | | | | | | | | | |
| | Year Ended December 31, |
| | 2020 | | 2019 | | 2018 |
| Cash flows from operating activities: | | | | | |
| Net income (loss) | $ | 68,218 | | | $ | 14,213 | | | $ | (14,392) | |
| Adjustments to reconcile net income (loss) to net cash flows provided by operating activities: | | | | | |
| Depreciation and amortization expense | 30,767 | | | 41,002 | | | 51,436 | |
| Deferred income taxes | 1,905 | | | (6,929) | | | (2,328) | |
| | | | | |
| Stock based compensation | 2,503 | | | 5,487 | | | 5,879 | |
| Amortization of deferred financing costs | 1,210 | | | 1,275 | | | 1,291 | |
| Change in fair value of earnout liabilities | 0 | | | (1,328) | | | (1,715) | |
| | | | | |
| Excess tax expense (benefit) related to restricted stock vesting | 0 | | | 50 | | | (101) | |
| Bad debt expense | 4,692 | | | 13,532 | | | 10,135 | |
| Loss on derivatives, net | 23,386 | | | 67,749 | | | 18,170 | |
| Current period cash settlements on derivatives, net | (37,414) | | | (41,919) | | | 11,038 | |
| | | | | |
| | | | | |
| Gain on disposal of eRex | 0 | | | (4,862) | | | 0 | |
| Other | 0 | | | (776) | | | (882) | |
| Changes in assets and liabilities: | | | | | |
| | | | | |
| Decrease in accounts receivable | 37,960 | | | 23,699 | | | 2,692 | |
| (Increase) decrease in accounts receivable—affiliates | (3,020) | | | 526 | | | 859 | |
| Decrease in inventory | 1,458 | | | 924 | | | 674 | |
| Increase in customer acquisition costs | (1,513) | | | (18,685) | | | (13,673) | |
| (Increase) decrease in prepaid and other current assets | (2,120) | | | 9,250 | | | (14,033) | |
| Decrease (increase) in other assets | 288 | | | 55 | | | (335) | |
| (Decrease) increase in accounts payable and accrued liabilities | (37,297) | | | (8,620) | | | 10,301 | |
| Decrease in accounts payable—affiliates | (184) | | | (1,455) | | | (2,158) | |
| Increase (decrease) in other current liabilities | 1,180 | | | (1,459) | | | (3,050) | |
| (Decrease) increase in other non-current liabilities | (188) | | | 6 | | | 41 | |
| Decrease in intangible assets—customer acquisitions | 0 | | | 0 | | | (86) | |
| Net cash provided by operating activities | 91,831 | | | 91,735 | | | 59,763 | |
| Cash flows from investing activities: | | | | | |
| Purchases of property and equipment | (2,154) | | | (1,120) | | | (1,429) | |
| Cash paid for acquisitions | 0 | | | 0 | | | (17,552) | |
| | | | | |
| | | | | |
| | | | | |
| Acquisition of Starion Customers | 0 | | | (5,913) | | | 0 | |
| | | | | |
| | | | | |
| Disposal of eRex investment | 0 | | | 8,431 | | | 0 | |
| | | | | |
| | | | | |
| | | | | |
| Net cash (used in) provided by investing activities | (2,154) | | | 1,398 | | | (18,981) | |
| Cash flows from financing activities: | | | | | |
| Proceeds from (buyback) issuance of Series A Preferred Stock, net of issuance costs paid | (2,282) | | | (743) | | | 48,490 | |
| Payment to affiliates for acquisition of customer book | 0 | | | (10) | | | (7,129) | |
| Borrowings on notes payable | 612,000 | | | 356,000 | | | 417,300 | |
| Payments on notes payable | (635,000) | | | (362,500) | | | (403,050) | |
| Earnout Payments | 0 | | | 0 | | | (1,607) | |
| Net paydown on subordinated debt facility | 0 | | | (10,000) | | | 0 | |
| Payments on the Verde promissory note | 0 | | | (2,036) | | | (13,422) | |
| Payment for acquired customers | (972) | | | 0 | | | 0 | |
| Payment of employee tax related to restricted stock vesting | (1,107) | | | (1,348) | | | (2,895) | |
| | | | | |
| | | | | |
| | | | | |
| | | | | |
| | | | | |
| Proceeds from disgorgement of stockholders short-swing profits | 0 | | | 55 | | | 244 | |
| | | | | |
| Payment of Tax Receivable Agreement Liability | 0 | | | (11,239) | | | (6,219) | |
| Payment of dividends to Class A common stockholders | (10,569) | | | (10,382) | | | (9,783) | |
| Payment of distributions to non-controlling unitholders | (29,450) | | | (34,794) | | | (35,478) | |
| Payment of Preferred Stock dividends | (7,886) | | | (8,106) | | | (7,014) | |
| Purchase of Treasury Stock | (395) | | | 0 | | | 0 | |
| Net cash used in financing activities | (75,661) | | | (85,103) | | | (20,563) | |
| Increase in Cash and cash equivalents and Restricted Cash | 14,016 | | | 8,030 | | | 20,219 | |
| Cash and cash equivalents and Restricted cash—beginning of period | 57,668 | | | 49,638 | | | 29,419 | |
| Cash and cash equivalents and Restricted cash—end of period | $ | 71,684 | | | $ | 57,668 | | | $ | 49,638 | |
| Supplemental Disclosure of Cash Flow Information: | | | | | |
| Non-cash items: | | | | | |
| Property and equipment purchase accrual | $ | 46 | | | $ | 92 | | | $ | (123) | |
| | | | | | | | | | | | | | | | | |
Holdback for Verde Note—Indemnified Matters | $ | 0 | | | $ | 4,900 | | | $ | 0 | |
Write-off of tax benefit related to tax receivable agreement liability—affiliates | $ | 0 | | | $ | 4,384 | | | $ | 0 | |
Gain on settlement of tax receivable agreement liability—affiliates | $ | 0 | | | $ | 16,336 | | | $ | 0 | |
| | | | | |
| | | | | |
| | | | | |
| | | | | |
| Tax benefit from tax receivable agreement | $ | 0 | | | $ | 0 | | | $ | (1,508) | |
| Liability due to tax receivable agreement | $ | 0 | | | $ | 0 | | | $ | 1,642 | |
| | | | | |
| Cash paid during the period for: | | | | | |
| Interest | $ | 3,859 | | | $ | 6,634 | | | $ | 7,883 | |
| Taxes | $ | 23,890 | | | $ | 7,516 | | | $ | 8,561 | |
| | | | | | | | | | | | | | | | | |
| | Year Ended December 31, |
| | 2023 | | 2022 | | 2021 |
| Cash flows from operating activities: | | | | | |
| Net income (loss) | $ | 26,105 | | | $ | 11,203 | | | $ | (5,413) | |
| Adjustments to reconcile net income (loss) to net cash flows provided by operating activities: | | | | | |
| Depreciation and amortization expense | 9,102 | | | 16,703 | | | 21,578 | |
| Deferred income taxes | 5,154 | | | 1,962 | | | 5,507 | |
| | | | | |
| Stock based compensation | 2,295 | | | 3,252 | | | 3,448 | |
| Amortization of deferred financing costs | 825 | | | 1,125 | | | 997 | |
| | | | | |
| | | | | |
| | | | | |
| Bad debt expense | 3,442 | | | 6,865 | | | 445 | |
| Gain (loss) on derivatives, net | 71,493 | | | (17,821) | | | (21,200) | |
| Current period cash settlements on derivatives, net | (66,632) | | | 35,643 | | | 15,692 | |
| | | | | |
| | | | | |
| | | | | |
| Other | 196 | | | 26 | | | — | |
| Changes in assets and liabilities: | | | | | |
| | | | | |
| Decrease (increase) in accounts receivable | 14,777 | | | (21,620) | | | 3,229 | |
| Decrease (increase) in accounts receivable - affiliates | 1,772 | | | (2,636) | | | 1,234 | |
| Decrease (increase) in inventory | 1,281 | | | (2,423) | | | (486) | |
| Increase in customer acquisition costs | (6,736) | | | (5,870) | | | (1,415) | |
| Decrease (increase) in prepaid and other current assets | 610 | | | (10,475) | | | 654 | |
| | | | | |
| Decrease (increase) in other assets | 854 | | | (502) | | | (190) | |
| (Decrease) increase in accounts payable and accrued liabilities | (15,149) | | | 2,707 | | | (10,213) | |
| Increase (decrease) in accounts payable—affiliates | 207 | | | (226) | | | (335) | |
| Decrease in other current liabilities | (264) | | | (1,597) | | | (705) | |
| Decrease in other non-current liabilities | (17) | | | (109) | | | (152) | |
| Decrease in intangible assets—customer acquisitions | — | | | — | | | 27 | |
| Net cash provided by operating activities | 49,315 | | | 16,207 | | | 12,702 | |
| Cash flows from investing activities: | | | | | |
| Purchases of property and equipment | (1,435) | | | (2,153) | | | (2,713) | |
| | | | | |
| | | | | |
| | | | | |
| | | | | |
| Acquisition of Customers | — | | | (4,718) | | | (3,797) | |
| | | | | |
| | | | | |
| | | | | |
| | | | | |
| | | | | |
| | | | | |
| Net cash used in investing activities | (1,435) | | | (6,871) | | | (6,510) | |
| Cash flows from financing activities: | | | | | |
| | | | | |
| | | | | |
| Borrowings on notes payable | 377,000 | | | 289,000 | | | 774,000 | |
| Payments on notes payable | (380,000) | | | (324,000) | | | (739,000) | |
| | | | | |
| Net (paydown) borrowings on subordinated debt facility | (20,000) | | | 20,000 | | | — | |
| | | | | |
| | | | | |
| Restricted stock vesting | (186) | | | (663) | | | (1,329) | |
| | | | | |
| | | | | |
| | | | | |
| | | | | |
| | | | | |
| | | | | |
| | | | | |
| | | | | |
| Payment of dividends to Class A common stockholders | (2,874) | | | (11,461) | | | (10,987) | |
| Payment of distributions to non-controlling unitholders | (4,308) | | | (14,553) | | | (17,436) | |
| Payment of Preferred Stock dividends | (10,268) | | | (7,628) | | | (7,804) | |
| | | | | |
| Net cash used in financing activities | (40,636) | | | (49,305) | | | (2,556) | |
| Increase (decrease) in Cash and cash equivalents and Restricted Cash | 7,244 | | | (39,969) | | | 3,636 | |
| Cash and cash equivalents and Restricted cash—beginning of period | 35,351 | | | 75,320 | | | 71,684 | |
| Cash and cash equivalents and Restricted cash—end of period | $ | 42,595 | | | $ | 35,351 | | | $ | 75,320 | |
| Supplemental Disclosure of Cash Flow Information: | | | | | |
| Non-cash items: | | | | | |
| Property and equipment purchase accrual | $ | (4) | | | $ | (4) | | | $ | (38) | |
| | | | | |
| | | | | |
| | | | | |
| | | | | |
| | | | | |
| | | | | |
| | | | | |
| | | | | |
| | | | | |
| | | | | |
| Cash paid (received) during the period for: | | | | | |
| Interest | $ | 8,636 | | | $ | 5,561 | | | $ | 3,754 | |
| Taxes | $ | 3,425 | | | $ | 865 | | | $ | (1,788) | |
The accompanying notes are an integral part of the consolidated financial statements.
SPARK ENERGY,VIA RENEWABLES, INC.
NOTES TO CONSOLIDATED FINANCIAL STATEMENTS
1. Formation and Organization
Company's Name Change
In August 2021, Spark Energy, Inc. changed its name from Spark Energy, Inc. to Via Renewables, Inc. (the "Company").
Organization
We are an independent retail energy services company that provides residential and commercial customers in competitive markets across the United States with an alternative choice for natural gas and electricity. Spark Energy, Inc. (the "Company")The Company is a holding company whose sole material asset consists of units in Spark HoldCo, LLC (“Spark HoldCo”). The Company is the sole managing member of Spark HoldCo, is responsible for all operational, management and administrative decisions relating to Spark HoldCo’s business and consolidates the financial results of Spark HoldCo and its subsidiaries. Spark HoldCo is the direct and indirect owner of the subsidiaries through which we operate. We conduct our business through several brands across our service areas, including Electricity Maine, Electricity N.H., Major Energy, Provider Power Massachusetts, Respond Power, Spark Energy, and Verde Energy.
Via Energy Solutions (“VES”) is a wholly owned subsidiary of the Company that offers broker services for retail energy customers. Via Wireless is a wholly owned subsidiary of the Company that offers wireless services and equipment to wireless customers.
2. Basis of Presentation and Summary of Significant Accounting Policies
Basis of Presentation
The accompanying consolidated financial statements of the Company have been prepared in accordance with accounting principles generally accepted in the United States (“GAAP”) and pursuant to the rules and regulations of the Securities and Exchange Commission (“SEC”).SEC. Our financial statements are presented on a consolidated basis and include all wholly-owned and controlled subsidiaries. We account for investments over which we have significant influence but not a controlling financial interest using the equity method of accounting. All significant intercompany transactions and balances have been eliminated in the consolidated financial statements.
In the opinion of the Company's management, the accompanying consolidated financial statements reflect all adjustments that are necessary to fairly present the financial position, the results of operations, the changes in equity and the cash flows of the Company for the respective periods. Such adjustments are of a normal recurring nature, unless otherwise disclosed.
Subsequent Events
Subsequent events have been evaluated through the date these financial statements are issued. Any material subsequent events that occurred prior to such date have been properly recognized or disclosed in the consolidated financial statements.
Use of Estimates and Assumptions
The preparation of our consolidated financial statements requires estimates and assumptions that affect the reported amounts of assets and liabilities and disclosure of contingent assets and liabilities at the date of the consolidated financial statements and the reported amounts of revenues and expenses during the period. Actual results could materially differ from those estimates.
Relationship with our Founder, and Majority Shareholder, and Chief Executive Officer
W. KeithMr. Maxwell, III (our "Founder") is the Chief Executive Officer and the owner of a majority of the voting power of our common stock through his ownership of NuDevco Retail, LLC ("NuDevco Retail") and Retailco, LLC ("Retailco"). Retailco is a wholly owned subsidiary of TxEx Energy Investments, LLC ("TxEx"), which is wholly owned by Mr. Maxwell. NuDevco Retail is a wholly owned subsidiary of NuDevco Retail Holdings LLC ("NuDevco Retail Holdings"), which is a wholly owned subsidiary of Electric HoldCo, LLC, which is also a wholly owned subsidiary of TxEx.
On November 2, 2020, the Board of Directors (the "Board") of the Company appointed W. Keith Maxwell III, who had served as our interim Chief Executive Officer since March of 2020, as Chief Executive Officer.
We enter into transactions with and pay certain costs on behalf of affiliates that are commonly controlled by Mr. Maxwell, and these affiliates enter into transactions with and pay certain costs on our behalf. We undertake these transactions in order to reduce risk, reduce administrative expense, create economies of scale, create strategic alliances and supply goods and services among these related parties.
These transactions include, but are not limited to, employee benefits provided through the Company’s benefit plans, insurance plans, leased office space, certain administrative salaries, management due diligence, recurring management consulting, and accounting, tax, legal, or technology services. Amounts billed under these arrangements are based on services provided, departmental usage, or headcount, which are considered reasonable by management. As such, the accompanying consolidated financial statements include costs that have been incurred by the Company and then directly billed or allocated to affiliates, and costs that have been incurred by our affiliates and then directly billed or allocated to us, and are recorded net in general and administrative expense on the consolidated statements of operations with a corresponding accounts receivable—affiliates or accounts payable—affiliates, respectively, recorded in the consolidated balance sheets. Additionally, the Company enters into transactions with certain affiliates for sales or purchases of natural gas and electricity, which are recorded in retail revenues, retail cost of revenues, and net asset optimization revenues in the consolidated statements of operations with a corresponding accounts receivable—affiliate or accounts payable—affiliate in the consolidated balance sheets. The allocations and related estimates and assumptions are described more fully in Note 1514 "Transactions with Affiliates."
On December 29, 2023, we entered into a merger agreement (the “Merger Agreement”) with Retailco, LLC, a Texas limited liability company (“Retailco”), and NuRetailco LLC, a Delaware limited liability company and wholly-owned subsidiary of Retailco (“Merger Sub”), whereby all of our Class A common stock (except for as described below), will be acquired by Retailco for $11.00 per share.
Retailco is an entity owned by TxEx, which is wholly owned by Mr. Maxwell.
The transaction will be effected by a merger of Merger Sub, with and into the Company, with the Company surviving the merger. Under the terms of the Merger Agreement, all of our Class A common stock, except for shares of Class A common stock for which appraisal rights have been properly and validly exercised under Delaware law and certain additional shares, including those held by the Company or any of its subsidiaries (or held in the Company’s treasury), Retailco or Merger Sub or any of their respective subsidiaries, or Mr. Maxwell, and any person or entity controlled by him, will be converted into the right to receive the cash consideration.
The Class A common stock, currently traded under the symbol VIA, will cease to trade on NASDAQ upon consummation of the transaction. We expect that the Series A Preferred Stock, currently traded under the symbol VIASP, will continue to trade on NASDAQ following the transaction. Accordingly, Via Renewables will remain subject to the reporting requirements of the Exchange Act.
The transaction was negotiated on behalf of the Company by a Special Committee of its Board of Directors with the assistance of independent financial and legal advisors. The Special Committee is comprised of entirely disinterested and independent directors. Following the Special Committee’s unanimous recommendation in support of the merger, the Company’s Board of Directors (other than Mr. Maxwell) approved the Merger Agreement and recommended that the Company’s stockholders adopt and approve the Merger Agreement and the merger.
The merger is subject to approval by a majority of shareholders of the issued and outstanding shares of the Company’s Class A common stock and Class B common stock.
In addition, the merger is subject to a non-waivable requirement of approval by the holders of at least a majority of the issued and outstanding Class A common stock and Class B common stock not owned by Mr. Maxwell and his affiliated entities or the directors, officers or their immediate family members. Mr. Maxwell and affiliated entities have entered into a support agreement to vote their shares in favor of the transaction and against any competing transaction. The Merger Agreement is not subject to a financing condition, but is subject to customary closing conditions. The transaction is expected to close in the second quarter of 2024.
Cash and Cash Equivalents
Cash and cash equivalents consist of all unrestricted demand deposits and funds invested in highly liquid instruments with original maturities of three months or less. The Company periodically assesses the financial condition of the institutions where these funds are held and believes that its credit risk is minimal with respect to these institutions.
Restricted Cash
As part of the acquisition of residential customer equivalents (“RCEs") from Starion Energy, Inc., Starion NY Inc. and Starion Energy PA Inc. (collectively "Starion")acquisitions in 2018,May 2021, we funded an escrow account, the balance of which is reflected as restricted cash in our consolidated balance sheet. As we acquire customers and other conditions of the asset purchase agreement are met, we make payments to the sellers from the escrow account. As of December 31, 2020 and December 31, 2019,2022, the balance in the escrow account related to the Starion acquisition was 0 and $1.0 million, respectively. Approximately$1.0 million was$1.7 million. These funds were released to the sellersellers as remaining conditions of the purchase agreement were met in July 2020. Less than $0.1 million was released to the Company in December 2020 pursuant to a final settlement agreement with the seller.first quarter of 2023. See Note 16 "Customer Acquisitions" for further discussion.
Inventory
Inventory primarily consists of natural gas used to fulfill and manage seasonality for fixed and variable-price retail customer load requirements and is valued at the lower of weighted average cost or net realizable value. Purchased natural gas costs are recognized in the consolidated statements of operations, within retail cost of revenues, when the natural gas is sold and delivered out of the storage facility using the weighted average cost of the gas sold.
As of December 31, 2023, the Company also holds approximately $0.5 million of wireless device inventory which is valued at the lower of cost or net realizable value.
Customer Acquisition Costs
The Company capitalizes direct response advertising costs that consist primarily of hourly and commission-based telemarketing costs, door-to-door agent commissions and other direct advertising costs associated with proven customer generation in its balance sheet. These costs are amortized over the estimated life of a customer.one to two years.
As of December 31, 20202023 and 2019,2022, the net customer acquisition costs were $6.1$7.0 million and $18.5$5.2 million,, respectively,of which $5.8$5.2 million and $8.7$3.5 millionwere recorded in current assets, and $0.3$1.8 million and $9.8$1.7 million were recorded in non-current assets. Amortization of customer acquisition costs was $13.9$4.8 million,, $18.5 $2.1 million, and $24.4$6.1 million for the years ended December 31, 2020, 20192023, 2022 and 2018, respectively.2021, respectively, which is recorded in depreciation and amortization in the Consolidated Statements of Operations. Customer acquisition costs do not include customer acquisitions through merger and acquisition activities, which are recorded as customer relationships.
Recoverability of customer acquisition costs is evaluated based on a comparison of the carrying amount of such costs to the future net cash flows expected to be generated by the customers acquired, considering specific assumptions for customer attrition, per unit gross profit, and operating costs. These assumptions are based on forecasts and historical experience. No impairments of customer acquisition costs were recorded for the years ended December 31, 2023, 2022 and 2021.
Customer Relationships
Customer contracts recorded as part of mergers or acquisitions are reflected as customer relationships in our balance sheet. The Company had capitalized customer relationship of $12.1$0.3 million and $13.6$2.5 million, net of amortization, as current assets as of December 31, 20202023 and 2019,2022, respectively, and $5.7$0.1 million and $17.8$0.5 million, net of amortization, as non-current assets as of December 31, 20202023 and 2019,2022, respectively, related to these intangible assets. These intangibles are amortized on a straight-line basis over the estimated average life of the related customer contracts acquired, which ranges from threeeighteen months to sixthree years.
The acquired customer relationships intangibles related to Provider Companies, Major Energy Companies, Perigee Energy LLC, Verde Companies, and HIKO are reflective of the acquired companies’ customer base, and were valued at the respective dates of acquisition using an excess earnings method under the income approach. Using this method, the Company estimated the future cash flows resulting from the existing customer relationships, considering attrition as well as charges for contributory assets, such as net working capital, fixed assets, and assembled workforce. These future cash flows were then discounted using an appropriate risk-adjusted rate of return by retail unit to arrive at the present value of the expected future cash flows. Perigee, and HIKO customerCustomer relationships are amortized to depreciation and amortization based on the expected future net cash flows by year. The acquired customer relationship intangibles related to the Major Energy Companies, the Provider Companies and the Verde Companies wereyear, bifurcated between hedged and unhedged and amortized to depreciation and amortization based on the expected future cash flows by year and expensed to retail cost of revenue based on the expected term of the underlying fixed price contract in each reporting period, respectively.
During the twelve months ended December 31, 2022, the Company changed the estimated average life for Customer Relationships — Other from three years to eighteen months, resulting in approximately $0.9 million of additional amortization recorded in the twelve months ended December 31, 2022. Customer relationship amortization expense was $13.6$2.5 million, $18.3$12.3 million, and $20.3$12.7 million for the years ended December 31, 2020, 20192023, 2022 and 2018, respectively, of which approximately 0, less than $0.1 million, and $(1.2) million was included in retail cost of revenue for those years.2021, respectively.
We review customer relationships for impairment whenever events or changes in business circumstances indicate the carrying value of the intangible assets may not be recoverable. Impairment is indicated when the undiscounted cash flows estimated to be generated by the intangible assets are less than their respective carrying value. If an impairment exists, a loss is recognized for the difference between the fair value and carrying value of the intangible assets. NaNNo impairments of customer relationships were recorded for the years ended December 31, 2020, 20192023, 2022 and 2018.2021.
Non-compete agreements
We capitalize intangible costs associated with non-compete agreements in certain of our acquisitions. Non-compete agreements provide the Company with a certain level of assurance that acquired companies' expected earnings streams will not be disrupted by competition from the companies’ previous owners or members. These non-compete agreements are amortized over their estimated useful life of three years on a straight-line basis. As of December 31, 2020 and 2019, the Company had no capitalized costs related to these non-compete agreements. Amortization expense was 0, $0.3 million and $1.1 million for the years ended December 31, 2020, 2019 and 2018.
Trademarks
We record trademarks as part of our acquisitions which represent the value associated with the recognition and positive reputation of an acquired company to its target markets. This value would otherwise have to be internally developed through significant time and expense or by paying a third party for its use. These intangibles are amortized over the estimated five-year to ten-year life of the trademark on a straight-line basis. The fair values of trademark assets were determined at the date of acquisition using a royalty savings method under the income approach. Under this approach, the Company estimates the present value of expected cash flows resulting from avoiding royalty payments to use a third party trademark. The Company analyzes market royalty rates charged for licensing trademarks and applied an expected royalty rate to a forecast of estimated revenue, which was then discounted using an appropriate risk adjusted rate of return. As of December 31, 20202023 and 2019,2022, we had recorded $4.6$2.4 million and $5.7$2.8 million related to these trademarks in other assets. Amortization expense was $1.1$0.4 million, $1.6$0.7 million, and $1.3$1.1 million for the years ended December 31, 2020, 20192023, 2022 and 2018,2021, respectively.
We review trademarks for impairment whenever events or changes in business circumstances indicate the carrying value of the intangible assets may not be recoverable. Impairment is indicated when the undiscounted cash flows estimated to be generated by the intangible assets are less than their respective carrying value. If an impairment exists, a loss is recognized for the difference between the fair value and carrying value of the intangible assets. NaNNo impairments of trademarks were recorded for the years ended December 31, 2020, 20192023, 2022 and 2018.2021.
Operating Leases
The Company's leases consist ofCompany maintained operating leases related to our offices with lease terms expiring throughthat expired in 2022. The initial term for our property leases is typically three to five years, with renewal options. Rent isoptions with rent recognized on a straight-line basis over the lease term.
For our operating leases, we recorded rent expense of $0.4 million, $0.8zero, less than $0.1 million and $0.8$0.2 million for the years ended December 31, 2020, 20192023, 2022 and 2018,2021, respectively. We recorded sub-lease income of $0.2 million, $0.4zero, less than $0.1 million and 0$0.2 million for the years ended December 31, 2020, 20192023, 2022 and 2018,2021, respectively. As of December 31, 20202023 and 2019,2022, we had recorded a right-of-use asset of $0.1 millionzero and $0.4 million,zero, respectively, in other current assets and other assets.assets. As of December 31, 20202023 and 20192022 we had recorded a lease liability of $0.2 millionzero and $0.6 million,zero, respectively, in other current liabilities and other long-term liabilities.liabilities.
Deferred Financing Costs
Costs incurred in connection with the issuance of long-term debt are capitalized and amortized to interest expense using the straight-line method over the life of the related long-term debt. These costs are included in other assets in our consolidated balance sheets.
Property and Equipment
The Company records property and equipment at historical cost. Depreciation expense is recorded on a straight-line method based on estimated useful lives, which range from 2 to 5 years, along with estimates of the salvage values of the assets. When items of property and equipment are sold or otherwise disposed of, any gain or loss is recorded in the consolidated statements of operations.
The Company capitalizes costs associated with certain of its internal-use software projects. Costs capitalized are those incurred during the application development stage of projects such as software configuration, coding, installation of hardware and testing. Costs incurred during the preliminary or post-implementation stage of the project are expensed in the period incurred, including costs associated with formulation of ideas and alternatives, training and application maintenance. After internal-use software projects are completed, the associated capitalized costs are depreciated over the estimated useful life of the related asset. Interest costs incurred while developing
internal-use software projects are also capitalized. Capitalized interest costs for the years ended December 31, 2020, 20192023, 2022 and 20182021 were not material.
Goodwill
Goodwill represents the excess of cost over fair value of the assets of businesses acquired in accordance with FASB ASC Topic 350 Intangibles-Goodwill and Other ("ASC 350"). The goodwill on our consolidated balance sheet as of December 31, 20202023 is associated with both our Retail Natural Gas and Retail Electricity segments. We determine our segments, which are also considered our reporting unit,units, by identifying each unit that engaged in business activities from which it may earn revenues and incur expenses, had operating results regularly reviewed by the segment manager for purposes of resource allocation and performance assessment, and had discrete financial information.
Goodwill is not amortized, but rather is assessed for impairment whenever events or circumstances indicate that impairment of the carrying value of goodwill is likely, but no less often than annually as of October 31. We compare our estimate of the fair value of the reporting unit with its carrying value, including goodwill. If the carrying value of the reporting unit exceeds its fair value, we would recognize a goodwill impairment loss for the amount by which the reporting unit's carrying value exceeds its fair value. In accordance with our accounting policy, we completed our annual assessment of goodwill impairment as of October 31, 20202023 during the fourth quarter of 2020,2023, using a qualitativequantitative assessment approach, and the test indicated 0no impairment.
Treasury Stock
Treasury stock consists of Company's own stock that has been issued, but subsequently reacquired by the Company. Treasury stock does not reduce the number of shares issued but does reduce the number of shares outstanding. These shares are not eligible to receive cash dividends. We use the cost method to account for treasury shares.
Equity Method Investments
We use the equity method of accounting to account for investments where we have the ability to exercise significant influence, but not control over, the investee. Under the equity method of accounting, investments are stated at initial cost and are adjusted for subsequent additional investments and our share of earnings or losses and distributions. Prior to the sale of our equity investment in November 2019, our equity investment was presented on the consolidated balance sheet under "Other assets", with our share of their income reflected as "Total other income/(expense)" on the consolidated statements of operations. We determined our equity investment earnings using the Hypothetical Liquidation at Book Value (HLBV) method. Under the HLBV method, a calculation was prepared at each balance sheet date to determine the amount the Company would receive if the investee were to liquidate all of its assets, as valued in accordance with U.S. GAAP, and distribute that cash to the investors. The difference between the calculated liquidation distribution amounts at the beginning and the end of the reporting period, after adjusting for capital contributions and distributions, is the Company's share of the earnings or losses from the equity investment for the period. See Note 17 "Equity Method Investment" for further discussion.
Revenues and Cost of Revenues
Our revenues are derived primarily from the sale of natural gas and electricity to customers, including affiliates. Revenues are recognized by the Company based on consideration specified in contracts with customers when performance obligations are satisfied by transferring control over products to a customer. Utilizing these criteria, revenue is recognized when the natural gas or electricity is delivered to the customer. Similarly, cost of revenues is recognized when the commodity is delivered.
Revenues for natural gas and electricity sales are recognized under the accrual method. Natural gas and electricity sales that have been delivered but not billed by period end are estimated. Accrued unbilled revenues are based on estimates of customer usage since the date of the last meter read provided by the utility. Volume estimates are based
on forecasted volumes and estimated customer usage by class. Unbilled revenues are calculated by multiplying these volume estimates by the applicable rate by customer class. Estimated amounts are adjusted when actual usage is known and billed.
Costs for natural gas and electricity sales are similarly recognized under the accrual method. Natural gas and electricity costs that have not been billed to the Company by suppliers but have been incurred by period end are estimated. The Company estimates volumes for natural gas and electricity delivered based on the forecasted revenue volumes, estimated transportation cost volumes and estimation of other costs associated with retail load that varies by commodity utility territory. These costs include items like ISO fees, ancillary services and renewable energy credits. Estimated amounts are adjusted when actual usage is known and billed.
Our asset optimization activities, which primarily include natural gas physical arbitrage and other short term storage and transportation transactions, meet the definition of trading activities and are recorded on a net basis in the consolidated statements of operations in net asset optimization revenues. The Company recorded asset optimization revenues, primarily related to physical sales or purchases of commodities, of $24.8$24.6 million, $62.8$86.7 million and $113.7$57.0 million for the years ended December 31, 2020, 20192023, 2022 and 2018,2021, respectively, and recorded asset optimization costs of revenues of $25.5$31.9 million, $60.0$89.0 million and $109.2$61.2 million for the years ended December 31, 2020, 20192023, 2022 and 2018,2021, respectively, which are presented on a net basis in asset optimization revenues in the Consolidated Statements of Operations.
Other revenue is derived from contracts with customers through the provision of wireless and other services and the sale of wireless equipment. These revenues are recognized under the accrual method, over time as wireless and other services are provided and at the time of delivery of wireless equipment. Costs for wireless and other services and the sale of wireless equipment are similarly recognized on the accrual basis, including costs to procure wireless data and wireless devices.
Natural Gas Imbalances
The consolidated balance sheets include natural gas imbalance receivables and payables, which primarily result when customers consume more or less gas than has been delivered by the Company to local distribution companies (“LDCs”). The settlement of natural gas imbalances varies by LDC, but typically the natural gas imbalances are settled in cash or in kind on a monthly, quarterly, semi-annual or annual basis. The imbalances are valued at their estimated net realizable value. The Company recorded an imbalance receivable of $0.3$0.2 million and $1.6$0.5 million in other current assets on the consolidated balance sheets as of December 31, 20202023 and 2019,2022, respectively.
The Company recorded an imbalance payable of less than $0.1 millionzero and $0.1 millionzero in other current liabilities on the consolidated balance sheets as of December 31, 20202023 and 2019,2022, respectively.
Derivative Instruments
The Company uses derivative instruments such as futures, swaps, forwards and options to manage the commodity price risks of its business operations.
All derivatives are recorded in the consolidated balance sheets at fair value. Derivative instruments representing unrealized gains are reported as derivative assets while derivative instruments representing unrealized losses are reported as derivative liabilities. We offset amounts in the consolidated balance sheets for derivative instruments executed with the same counterparty where we have a master netting arrangement.
As part of our asset optimization activities, we manage a portfolio of commodity derivative instruments held for trading purposes. Changes in fair value of and amounts realized upon settlements of derivatives instruments held for trading purposes are recognized in earnings in net asset optimization revenues.
To manage the retail business, the Company holds derivative instruments that are not for trading purposes and are not designated as hedges for accounting purposes. Changes in the fair value of and amounts realized upon settlement of derivative instruments not held for trading purposes are recognized in retail costs of revenues.
Income Taxes
The Company follows the asset and liability method of accounting for income taxes where deferred tax assets and liabilities are recognized for the expected future tax consequences of events that have been recognized in the
financial statements or tax returns and operating loss carryforwards. Deferred tax assets and liabilities are measured using enacted tax rates expected to apply to taxable income in those years in which those temporary differences are expected to be recovered or settled. The effect on deferred tax assets and liabilities of a change in the tax rates is recognized in income in the period that includes the enactment date. A valuation allowance is provided for deferred tax assets if it is more likely than not that these items will not be realized. Amounts owed or refundable on current year returns is included as a current payable or receivable in the consolidated balance sheet.
In assessing the realizability of deferred tax assets, management considers whether it is more likely than not that some portion or all of the deferred tax assets will not be realized. The ultimate realization of deferred tax assets is dependent upon the generation of future taxable income during the periods in which those temporary differences become deductible. Management considers the projected future taxable income and tax planning strategies in making this assessment.
The Company recognizes interest and penalties related to unrecognized tax benefits within the provision for income taxes on continuing operations in our consolidated statements of operations.
During the year ended December 31, 2023 and 2022 our accrued liabilities included income tax payable of $2.5 million and $0.4 million, respectively. During the year ended December 31, 2023 and 2022 our other current assets included income tax receivable of $2.1 million and $2.5 million, respectively.
Earnings per Share
Basic earnings per share (“EPS”) is computed by dividing net income attributable to stockholders (the numerator) by the weighted-average number of Class A common shares outstanding for the period (the denominator). Class B common shares are not included in the calculation of basic earnings per share because they are not participating securities and have no economic interests. Diluted earnings per share is similarly calculated except that the denominator is increased by potentially dilutive securities. We use the treasury stock method to determine the potential dilutive effect of our outstanding unvested restricted stock units and use the if-converted method to determine the potential dilutive effect of our Class B common stock.
Non-controlling Interest
Net income attributable to non-controlling interest represents the Class B Common stockholders' interest in income and expenses of the Company. The weighted average ownership percentages for the applicable reporting period are used to allocate the income (loss) before income taxes to each economic interest owner.
Commitments and Contingencies
Liabilities for loss contingencies arising from claims, assessments, litigation, fines, penalties and other sources are recorded when it is probable that a liability has been incurred and the amount can be reasonably estimated. Legal costs incurred in connection with loss contingencies are expensed as incurred.
RecentNew Accounting PronouncementsStandards Being Evaluated/Standards Not yet adopted
In June 2016,November 2023, the FASBFinancial Accounting Standards Board (“FASB”) issued ASUAccounting Standards Update (“ASU”) No. 2016-13,2023-07, Financial Instruments - Credit LossesSegment Reporting (Topic 326)280): Measurement of Credit Losses on Financial InstrumentsImprovements to Reportable Segment Disclosures. ("The amendments in the ASU 2016-13").improve reportable segment disclosures by adding and enhancing annual and interim disclosure requirements, clarifying circumstances in which entities can disclose multiple segment measures of profit or loss, providing new segment disclosure requirements for entities with a single reportable segment, and adding other disclosure requirements. ASU 2016-13 requires entities to use a current expected credit loss ("CECL") model, which is a new impairment model based on expected losses rather than incurred losses on financial assets, including trade accounts receivables. The model requires financial assets measured at amortized cost to2023-07 will be presented at the net amount expected to be collected. ASU 2016-13 is effective for annual periods beginning after December 15, 2023 and interim periods within fiscal years beginning after December 15, 2019, including interim2024. We are evaluating the impact of adoption on our consolidated financial statements.
In December 2023, the FASB issued ASU No. 2023-09, Income Taxes (Topic 740): Improvements to Income Tax Disclosures. The ASU requires enhanced income tax disclosures, particularly related to a reporting entity's effective tax rate reconciliation and income taxes paid. For the rate reconciliation, the update requires additional categories of information about federal, state, and foreign taxes and details about significant reconciling items, subject to a quantitative threshold. Income taxes paid must be similarly disaggregated by federal, state, and foreign based on a quantitative threshold. The ASU will be effective for annual periods within those fiscal years.beginning after December 15, 2024. The guidance shall be applied on a prospective basis with the option to apply retrospectively. We adopted ASU 2016-13 and related amendments effective January 1, 2020, andare evaluating the impact of adoption did not have a material impact on our consolidated financial statements.
Standards Being Evaluated/Standards Not Yet Adopted
Below are accounting standards that have been issued, but not yet been adopted by the Company at December 31, 2020. The Company considers the applicability and impact of all ASUs. New ASUs not listed below were assessed and
determined to be either not applicable or are expected to have minimal impact on our consolidated financial statements.
In December 2019, the FASB issued ASU No. 2019-12,
Income Taxes (Topic 740), Simplifying the Accounting for Income Taxes ("ASU 2019-12"). These amendments simplify the accounting for income taxes by removing certain exceptions to the general principles in Topic 740. For public business entities, the amendments in this Update are effective for fiscal years, and interim periods within those fiscal years, beginning after December 15, 2020. We do not expect adoption
Table of the new standard to have a material impact to our consolidated statement of operations.Contents
In March 2020, the FASB issued ASU No. 2020-04, Reference Rate Reform (Topic 848), Facilitation of the Effects of Reference Rate Reform on Financial Reporting ("ASU 2020-04"). The amendments in ASU 2020-04 provide optional expedients and exceptions for applying GAAP to contracts, hedging relationships, and other transactions that reference LIBOR or another reference rate expected to be discontinued because of reference rate reform. In January 2021, the FASB issued ASU 2021-01, Reference Rate Reform (“ASU 2021-01”), which clarifies the scope and application of certain optional expedients and exceptions regarding the original guidance. ASU 2021-01 may be applied prospectively through December 31, 2022. The expedients and exceptions provided by the amendments do not apply to contract modifications made and hedging relationships entered into or evaluated after December 31, 2022, that an entity has elected certain optional expedients for and that are retained through the end of the hedging relationship. We do not expect adoption of the new standard to have a material impact to our consolidated statement of operations.
3. Revenues
Our revenues are derived primarily from the sale of natural gas and electricity to customers, including affiliates. Revenue is measured based upon the quantity of gas or power delivered at prices contained or referenced in the customer's contract, and excludes any sales incentives (e.g. rebates) and amounts collected on behalf of third parties (e.g. sales tax).
Our revenues also include asset optimization activities. Asset optimization activities consist primarily of purchases and sales of gas that meet the definition of trading activities per FASB ASC Topic 815, Derivatives and Hedging.Hedging. They are therefore excluded from the scope of FASB ASC Topic 606,Revenue from Contracts with Customers.Customers.
Other revenue is derived from contracts with customers through the provision of wireless and other services and the sale of wireless equipment.
Revenues for electricity and natural gas sales are recognized under the accrual method when our performance obligation to a customer is satisfied, which is the point in time when the product is delivered and control of the product passes to the customer. Electricity and natural gas products may be sold as fixed-price or variable-price products. The typical length of a contract to provide electricity and/or natural gas is 12 months. Customers are billed and typically pay at least monthly, based on usage. Electricity and natural gas sales that have been delivered but not billed by period end are estimated and recorded as accrued unbilled revenues based on estimates of customer usage since the date of the last meter read provided by the utility. Volume estimates are based on forecasted volumes and estimated residential and commercial customer usage. Unbilled revenues are calculated by multiplying these volume estimates by the applicable rate by customer class (residential or commercial). Estimated amounts are adjusted when actual usage is known and billed.
The following table discloses revenue by primary geographical market, customer type, and customer credit risk profile (in thousands). The table also includes a reconciliation of the disaggregated revenue to revenue by reportable segment (in thousands).
| | Reportable Segments | Reportable Segments | |
| Reportable Segments | |
| Reportable Segments | |
| Years ended December 31, 2023 | |
| Years ended December 31, 2023 | |
| Years ended December 31, 2023 | |
| Retail Electricity (c) | |
| Retail Electricity (c) | |
| Retail Electricity (c) | |
| | Year Ended December 31, 2020 | | Year Ended December 31, 2019 | | Year Ended December 31, 2018 | |
| Primary markets (a) | |
| | Retail Electricity | Retail Natural Gas | Total Reportable Segments | | Retail Electricity | Retail Natural Gas | Total Reportable Segments | | Retail Electricity | Retail Natural Gas | Total Reportable Segments | |
| Primary markets (a) | |
| | Primary markets (a) | Primary markets (a) | | |
| New England | New England | $ | 166,982 | | $ | 14,846 | | $ | 181,828 | | | $ | 284,909 | | $ | 19,289 | | $ | 304,198 | | | $ | 395,682 | | $ | 21,221 | | $ | 416,903 | | |
| New England | |
| New England | |
| Mid-Atlantic | |
| Mid-Atlantic | |
| Mid-Atlantic | Mid-Atlantic | 166,157 | | 32,769 | | 198,926 | | | 242,556 | | 42,469 | | 285,025 | | | 291,046 | | 54,815 | | 345,861 | | |
| Midwest | Midwest | 57,314 | | 26,368 | | 83,682 | | | 79,188 | | 39,200 | | 118,388 | | | 73,167 | | 39,894 | | 113,061 | | |
| Midwest | |
| Midwest | |
| Southwest | Southwest | 70,940 | | 20,171 | | 91,111 | | | 81,798 | | 21,545 | | 103,343 | | | 103,556 | | 22,036 | | 125,592 | | |
| Southwest | |
| Southwest | |
| $ | |
| $ | |
| $ | |
| | $ | 461,393 | | $ | 94,154 | | $ | 555,547 | | | $ | 688,451 | | $ | 122,503 | | $ | 810,954 | | | $ | 863,451 | | $ | 137,966 | | $ | 1,001,417 | | |
| Customer type | |
| | Customer type | |
| | Customer type | Customer type | | |
| Commercial | Commercial | $ | 128,874 | | $ | 31,205 | | $ | 160,079 | | | $ | 249,730 | | $ | 40,466 | | $ | 290,196 | | | $ | 355,607 | | $ | 50,156 | | $ | 405,763 | | |
| Commercial | |
| Commercial | |
| Residential | |
| Residential | |
| Residential | Residential | 341,382 | | 66,305 | | 407,687 | | | 449,900 | | 83,455 | | 533,355 | | | 518,261 | | 93,186 | | 611,447 | | |
| Unbilled revenue (b) | Unbilled revenue (b) | (8,863) | | (3,356) | | (12,219) | | | (11,179) | | (1,418) | | (12,597) | | | (10,417) | | (5,376) | | (15,793) | | |
| Unbilled revenue (b) | |
| Unbilled revenue (b) | |
| $ | |
| $ | |
| $ | |
| | $ | 461,393 | | $ | 94,154 | | $ | 555,547 | | | $ | 688,451 | | $ | 122,503 | | $ | 810,954 | | | $ | 863,451 | | $ | 137,966 | | $ | 1,001,417 | | |
| Customer credit risk | |
| | Customer credit risk | |
| | Customer credit risk | Customer credit risk | | |
| POR | POR | $ | 308,010 | | $ | 47,470 | | $ | 355,480 | | | $ | 479,011 | | $ | 64,416 | | $ | 543,427 | | | $ | 586,901 | | $ | 71,565 | | $ | 658,466 | | |
| POR | |
| POR | |
| Non-POR | Non-POR | 153,383 | | 46,684 | | 200,067 | | | 209,440 | | 58,087 | | 267,527 | | | 276,550 | | 66,401 | | 342,951 | | |
| $ | 461,393 | | $ | 94,154 | | $ | 555,547 | | | $ | 688,451 | | $ | 122,503 | | $ | 810,954 | | | $ | 863,451 | | $ | 137,966 | | $ | 1,001,417 | | |
| Non-POR | |
| Non-POR | |
| $ | |
| $ | |
| $ | |
(a) The primary markets include the following states:
•New England - Connecticut, Maine, Massachusetts and New Hampshire;
•Mid-Atlantic - Delaware, Maryland (including the District of Colombia)Columbia), New Jersey, New York and Pennsylvania;Pennsylvania and Virginia;
•Midwest - Illinois, Indiana, Michigan and Ohio; and
•Southwest - Arizona, California, Colorado, Florida, Nevada and Texas.
(b) Unbilled revenue is recorded in total until it is actualized, at which time it is categorized between commercial and residential customers.
(c) Retail Electricity includes services.
Reconciliation to Consolidated Financial Information
A reconciliation of the reportable segment operating revenues to consolidated revenues is as follows:
| | | | | | | | | | | |
| Year Ended December 31, |
| 2023 | 2022 | 2021 |
| Total Reportable Segments Revenue | $ | 439,360 | | $ | 462,815 | | $ | 397,728 | |
| Net asset optimization expense | (7,326) | | (2,322) | | (4,243) | |
| Other Revenue | 3,158 | | — | | — | |
| Total Revenues | $ | 435,192 | | $ | 460,493 | | $ | 393,485 | |
We record gross receipts taxes on a gross basis in retail revenues and retail cost of revenues. During the year ended December 31, 2020, 20192023, 2022 and 20182021 our retail revenues included gross receipts taxes of $1.0 million, $1.3 million $1.5 million and $1.6$1.1 million respectively. During the year ended December 31, 2020, 20192023, 2022 and 2018,2021, our retail cost of revenues included gross receipts taxes of $5.9$5.2 million, $8.4$5.2 million and $9.9$4.4 million, respectively.
Accounts receivablesReceivables and Allowance for Credit Losses
As discussed in Note 2, “Basis of Presentation and Summary of Significant Accounting Policies”, we adopted the new accounting standards for measuring credit losses effective January 1, 2020.
The Company conducts business in many utility service markets where the local regulated utility purchases our receivables, and then becomes responsible for billing the customer and collecting payment from the customer (“POR programs”). These POR programs result in substantially all of the Company’s credit risk being linked to the
applicable utility, which generally has an investment-grade rating, and not to the end-use customer. The Company monitors the financial condition of each utility and currently believes its receivables are collectible.
In markets that do not offer POR programs or when the Company chooses to directly bill its customers, certain receivables are billed and collected by the Company. The Company bears the credit risk on these accounts and records an appropriate allowance for doubtful accountscredit losses to reflect any losses due to non-payment by customers. The Company’s customers are individually insignificant and geographically dispersed in these markets. The Company writes off customer balances when it believes that amounts are no longer collectible and when it has exhausted all means to collect these receivables.
For trade accounts receivables, the Company accrues an allowance for doubtful accountscredit losses by business segment by pooling customer accounts receivables based on similar risk characteristics, such as customer type, geography, aging analysis, payment terms, and related macroeconomic factors. Expected credit loss exposure is evaluated for each of our accounts receivables pools. Expected credits losses are established using a model that considers historical collections experience, current information, and reasonable and supportable forecasts. The Company writes off accounts receivable balances against the allowance for doubtfulcredit losses accounts when the accounts receivable is deemed to be uncollectible.
We assess the adequacy of the allowance for doubtful accountscredit losses through review of an aging of customer accounts receivable and general economic conditions in the markets that we serve. Bad debt expense of $4.7$3.4 million, $13.5$6.9 million and $10.1$0.4 million was recorded in general and administrative expense in the consolidated statements of operations for the years ended December 31, 2020, 20192023, 2022 and 2018,2021, respectively.
A rollforward of our allowance for credit losses for the year ended December 31, 20202023 is presented in the table below (in thousands):
| | | | | |
| |
| |
| |
| |
| |
| |
| |
| |
| |
| |
| |
| |
| |
Balance at December 31, 20192022 | $ | (4,797)(4,335) | |
| Impact of adoption of ASC 326 | (633) |
| Bad debt provision | (3,234)(3,442) | |
| Write-offs | 5,4643,376 | |
| Recovery of previous write offs | (742)(95) | |
Balance at December 31, 20202023 | $ | (3,942)(4,496) | |
4. Acquisitions
Acquisition of HIKO
In March 2018, we entered into a Membership Interest Purchase Agreement under which we acquired all of the membership interests of HIKO Energy, LLC ("HIKO"), a New York limited liability company, for a total purchase price of $6.0 million in cash, plus working capital. At the time of acquisition, HIKO had a total of approximately 29,000 RCEs located in 42 markets in 7 states. The acquisition was accounted for under the acquisition method. Our preliminary allocation of the purchase price was based upon the estimated fair value of the tangible and
identified intangible assets acquired and liabilities assumed in the acquisition. The allocation of the purchase consideration is as follows (in thousands):
| | | | | | | |
| | | Final Purchase Price Allocation as of December 31, 2018 |
Cash and restricted cash | | | $ | 375 | |
Intangible assets—customer relationships | | | 6,031 | |
Net working capital, net of cash acquired | | | 8,465 | |
Fair value of derivative liabilities | | | (205) | |
Total | | | $ | 14,666 | |
Our consolidated statements of operations for the twelve months ended December 31, 2018 included $15.3 million of revenue and $3.8 million of net income related to the operations of HIKO.
In each of our acquisitions, we evaluate and allocate purchase price based on the following general assumptions.
Customer relationships. Acquired customer relationships were reflective of the acquired companies' customer bases, and were valued using an excess earnings method under the income approach. Using this method, we estimated the future cash flows resulting from the existing customer relationships, considering estimated attrition as well as charges for contributory assets, such as net working capital, intangible assets, fixed assets, and any assembled workforce. These future cash flows were then discounted using an appropriate risk-adjusted rate of return to arrive at the present value of the expected future cash flows.
In acquisitions where we acquired commodity contracts that we could match to fixed-price contracts, customer relationships were bifurcated between unhedged and hedged and are being amortized based on the expected term of the underlying fixed-price contract acquired in each reporting period, respectively.
Customer Acquisitions. We also, from time to time, acquire books of customers from affiliated and non-affiliated parties. These acquisitions do not involve an allocation of the purchase price but rather are recorded as customer relationships.
Acquisition from Related Parties
In March 2018, we entered into an asset purchase agreement with an affiliate pursuant to which we agreed to acquire up to 50,000 RCEs for a cash purchase price of $250 for each RCE, or up to $12.5 million in the aggregate. These customers began transferring after April 1, 2018 and are located in 24 markets in 8 states. For the year ended December 31, 2018, we paid $8.8 million under the terms of the purchase agreement for approximately 35,000 RCEs. No additional customer transfers or consideration will be paid on this transaction. The acquisition was treated as a transfer of assets between entities under common control, and accordingly, the assets were recorded at our affiliate's historical value at the date of transfer, which was $1.7 million. The transaction resulted in $7.1 million recorded in equity as a net distribution to affiliate as of December 31, 2018. Of the $8.8 million paid to our affiliate, $1.7 million was an investing cash outflow, and the remaining $7.1 million was deemed a distribution to our non-controlling interest and classified as financing activity.
Acquisitions of Customer Books
In October 2018, we entered into an asset purchase agreement pursuant to which we agreed to acquire up to 60,000 RCEs from Starion Energy Inc., Starion Energy NY Inc. and Starion Energy PA Inc. (collectively "Starion") for a cash purchase price of up to a maximum of $10.7 million. These customers began transferring in December 2018 and are located in our existing markets. As of December 31, 2019, a total of $8.0 million was paid
under the terms of the purchase agreement for approximately 51,000 RCEs. The customer transfer was completed in 2019.
As part of the acquisition, we funded an escrow account, the balance of which is reflected as restricted cash in our consolidated balance sheet. As of December 31, 2020 and 2019, the balance in the escrow account was 0 and $1.0 million, respectively.
5. Equity
Non-controlling Interest
We hold an economic interest and are the sole managing member in Spark HoldCo, with affiliates of our FounderMr. Maxwell and majority shareholder holding the remaining economic interests in Spark HoldCo. As a result, we consolidate the financial position and results of operations of Spark HoldCo, and reflect the economic interests owned by these affiliates as a non-controlling interest. The Company and affiliates owned the following economic interests in Spark HoldCo at December 31, 20202023 and December 31, 2019,2022, respectively.
| | | | | | | | |
| The Company | Affiliated Owners |
| | |
| | |
| | |
| | |
| | |
| | |
| | |
| | |
| | |
| | |
| | |
| | |
| | |
| | |
| | |
| | |
| | |
| | |
| | |
| December 31, 2020 | 41.53 | % | 58.47 | % |
| December 31, 2019 | 41.04 | % | 58.96 | % |
| | | | | | | | |
| The Company | Affiliated Owners |
| | |
| | |
| | |
| | |
| | |
| | |
| | |
| | |
| | |
| | |
| | |
| | |
| | |
| | |
| | |
| | |
| | |
| | |
| | |
| December 31, 2023 | 44.92 | % | 55.08 | % |
| December 31, 2022 | 44.45 | % | 55.55 | % |
| | |
The following table summarizes the portion of net income (loss) and income tax expense (benefit) attributable to non-controlling interest (in thousands):
| | Year Ended December 31, |
| 2020 | 2019 | 2018 |
| Year Ended December 31, | | | Year Ended December 31, |
| 2023 | | | 2023 | 2022 | 2021 |
| | | | | |
| Net income (loss) allocated to non-controlling interest | Net income (loss) allocated to non-controlling interest | $ | 44,277 | | $ | 7,604 | | $ | (12,140) | |
| Income tax expense allocated to non-controlling interest | 5,349 | | 1,841 | | 1,066 | |
| Net income (loss) allocated to non-controlling interest | |
| Net income (loss) allocated to non-controlling interest | |
| Less: Income tax expense allocated to non-controlling interest | |
| Net income (loss) attributable to non-controlling interest | Net income (loss) attributable to non-controlling interest | $ | 38,928 | | $ | 5,763 | | $ | (13,206) | |
Class A Common Stock and Class B Common Stock
Holders of the Company's Class A common stock and Class B common stock vote together as a single class on all matters presented to our stockholders for their vote or approval, except as otherwise required by applicable law or by our certificate of incorporation.
Reverse Stock Split
On March 20, 2023, the Company’s shareholders approved at a special meeting a proposal by the Company’s Board of Directors to consummate a reverse stock split of the Company’s Class A common stock and Class B common stock at a ratio between 1 for 2 to 1 for 5, with such ratios to be determined by the Chief Executive Officer or the Chief Financial Officer, or to determine not to proceed with the reverse stock split, during a period of time not to exceed the one-year anniversary of the special meeting date (the “Reverse Stock Split”).
On March 20, 2023, the Company filed a Certificate of Amendment to the Company’s Amended and Restated Certificate of Incorporation with the Delaware Secretary of State to effect the Reverse Stock Split at a ratio of 1 to 5 for each issued and outstanding share of Class A common stock and Class B common stock as of March 21, 2023 at 5:30 PM ET. The Class A common stock began trading on a post-split basis on March 22, 2023.
No fractional shares were issued as a result of the Reverse Stock Split and it did not impact the par value of the Class A common stock or Class B common stock. Any fractional shares that would otherwise have resulted from the Reverse Stock Split were rounded up to the next whole number. The number of authorized shares of Class A common stock and Class B common stock were not impacted by the Reverse Stock Split and remained unchanged at 120,000,000 shares of Class A common stock and 60,000,000 shares of Class B common stock.
All shares of Class A common stock and Class B common stock and per share amounts in the accompanying consolidated financial statements and related notes have been retrospectively restated to reflect the effect of the Reverse Stock Split effective March 21, 2023.
Conversion of Class B Common Stock to Class A Common Stock
In July 2021, holders of Class B common stock exchanged 160,000 of their Spark HoldCo units (together with a corresponding number of shares of Class B common stock) for shares of Class A common stock at an exchange ratio of one share of Class A common stock for each Spark HoldCo unit (and corresponding share of Class B common stock) exchanged.
Dividends on Class A Common Stock
Dividends declared for the Company's Class A common stock are reported as a reduction of retained earnings, or a reduction of additional paid in capital to the extent retained earnings are exhausted. During the years ended December 31, 2020, 2019,2023, 2022, and 2018,2021, we paid dividends on our Class A common stock of $10.6$2.9 million, $10.4$11.5 million, and $9.8$11.0 million. This dividend represented an annual rate of $0.725Dividends paid per share on each share of Class A common stock.
On January 21,stock totaled $0.90625 for the year ended December 31, 2023 and $3.625 for the years ended December 31, 2022 and 2021, the Company declared a dividend of $0.18125 per share to holders of record of our Class A common stock on March 1, 2021 and payable on March 15, 2021.respectively.
In order to pay our stated dividends to holders of our Class A common stock, our subsidiary, Spark HoldCo is required to make corresponding distributions to holders of its units, including those holders that own our Class B common stock (our non-controlling interest holder). As a result, during the year ended December 31, 2020,2023, Spark HoldCo made corresponding distributions of $15.1$3.6 million to our non-controlling interest holders.
Share Repurchase Program
On August 18, 2020,In April 2023, we announced that our Board of Directors authorized a share repurchase programelected to temporarily suspend the quarterly cash dividend on the Class A common stock. During the second, third and fourth quarter of up2023, we did not pay dividends to $20.0 millionthe holders of the Company's Class A common stock through August 18, 2021. We are funding the program through available cash balances,and did not make corresponding distributions to our Senior Credit Facility and operating cash flows.
The shares of Class A common stock may be repurchased from time to time in the open market at prevailing market prices or in privately negotiated transactions based on ongoing assessments of capital needs, the market price of the stock, and other factors, including general market conditions. The repurchase program does not obligate us to acquire any particular amount of Class A common stock, may be modified or suspended at any time, and could be terminated prior to completion.
For the year ended December 31, 2020, we repurchased 45,148 shares of our Class A common stock at a weighted average price of $8.75 per share, for a total cost of $0.4 million.non-controlling interest holders.
Preferred Stock
The Company has 20,000,000 shares of authorized preferred stock for which there are 3,707,2563,567,543 shares issued and 3,567,543 shares outstanding at December 31, 20202023 and 3,707,256 shares issued and 3,677,318 outstanding shares at December 31, 2019.2022, respectively. See Note 65 "Preferred Stock" for a further discussion of preferred stock.
Issuance of Class A Common Stock Upon Vesting of Restricted Stock Units
For the years ended December 31, 2020, 2019,2023, 2022, and 2018, 469,811, 473,492,2021, 68,439, 58,033, and 394,243,68,481, respectively of restricted stock units vested, with 292,879, 300,715,46,466, 42,268, and 258,076,43,828, respectively of shares of common stock distributed to the holders of these units. Differences between shares vested and issued were a result of 176,932, 172,777,21,973, 15,765, and 136,16724,653 shares of common stock withheld by the Company to cover taxes owed on the vesting of such units.
Conversion of Class B Common Stock to Class A Common Stock
In 2018, holders of Class B common stock exchanged 685,126 of their Spark HoldCo units (together with a corresponding number of shares of Class B common stock) for shares of Class A common stock at an exchange ratio of one share of Class A common stock for each Spark HoldCo unit (and corresponding share of Class B common stock) exchanged.
Earnings Per Share
Basic earnings per share (“EPS”) is computed by dividing net income attributable to stockholders (the numerator) by the weighted-average number of Class A common shares outstanding for the period (the denominator). Class B common shares are not included in the calculation of basic earnings per share because they are not participating securities and have no economic interests. Diluted earnings per share is similarly calculated except that the denominator is increased by potentially dilutive securities.
The following table presents the computation of basic and diluted income (loss) per share for the years ended December 31, 2020, 2019,2023, 2022, and 20182021 (in thousands, except per share data):
| | Year Ended December 31, |
| 2020 | 2019 | 2018 |
| Net income (loss) attributable to Spark Energy, Inc. stockholders | $ | 29,290 | | $ | 8,450 | | $ | (1,186) | |
| Year Ended December 31, | | | Year Ended December 31, |
| 2023 | | | 2023 | 2022 | 2021 |
| Net income attributable to Via Renewables, Inc. stockholders | |
| Less: Dividend on Series A preferred stock | Less: Dividend on Series A preferred stock | 7,441 | | 8,091 | | 8,109 | |
| Net income (loss) attributable to stockholders of Class A common stock | Net income (loss) attributable to stockholders of Class A common stock | $ | 21,849 | | $ | 359 | | $ | (9,295) | |
| | Basic weighted average Class A common shares outstanding | Basic weighted average Class A common shares outstanding | 14,555 | | 14,286 | | 13,390 | |
| Basic weighted average Class A common shares outstanding | |
| Basic weighted average Class A common shares outstanding | |
| Basic earnings (loss) per share attributable to stockholders | Basic earnings (loss) per share attributable to stockholders | $ | 1.50 | | $ | 0.03 | | $ | (0.69) | |
| | Net income (loss) attributable to stockholders of Class A common stock | |
| Net income (loss) attributable to stockholders of Class A common stock | |
| Net income (loss) attributable to stockholders of Class A common stock | Net income (loss) attributable to stockholders of Class A common stock | $ | 21,849 | | $ | 359 | | $ | (9,295) | |
| | Diluted net income (loss) attributable to stockholders of Class A common stock | Diluted net income (loss) attributable to stockholders of Class A common stock | $ | 21,849 | | $ | 359 | | $ | (9,295) | |
| | Diluted net income (loss) attributable to stockholders of Class A common stock | |
| | Diluted net income (loss) attributable to stockholders of Class A common stock | |
| | Basic weighted average Class A common shares outstanding | |
| Basic weighted average Class A common shares outstanding | |
| Basic weighted average Class A common shares outstanding | Basic weighted average Class A common shares outstanding | 14,555 | | 14,286 | | 13,390 | |
| | Effect of dilutive restricted stock units | 160 | | 282 | | 0 | |
| | Diluted weighted average shares outstanding | |
| | Diluted weighted average shares outstanding | |
| | Diluted weighted average shares outstanding | Diluted weighted average shares outstanding | 14,715 | | 14,568 | | 13,390 | |
| | Diluted earnings (loss) per share attributable to stockholders | Diluted earnings (loss) per share attributable to stockholders | $ | 1.48 | | $ | 0.02 | | $ | (0.69) | |
| Diluted earnings (loss) per share attributable to stockholders | |
| Diluted earnings (loss) per share attributable to stockholders | |
The computation of diluted earnings per share for the year ended December 31, 20202023 excludes 20.84.0 million shares of Class B common stock and 0.2 million restricted stock units because the effect of their conversion was antidilutive. The Company's outstanding shares of Series A Preferred Stock were not included in the calculation of diluted earnings per share because they contain only contingent redemption provisions that have not occurred.
Variable Interest Entity
Spark HoldCo is a variable interest entity due to its lack of rights to participate in significant financial and operating decisions and its inability to dissolve or otherwise remove its management. Spark HoldCo owns all of the outstanding membership interests in each of our operating subsidiaries. We are the sole managing member of Spark HoldCo, manage Spark HoldCo's operating subsidiaries through this managing membership interest, and are considered the primary beneficiary of Spark HoldCo. The assets of Spark HoldCo cannot be used to settle our obligations except through distributions to us, and the liabilities of Spark HoldCo cannot be settled by us except through contributions to Spark HoldCo. The following table includes the carrying amounts and classification of the assets and liabilities of Spark HoldCo that are included in our consolidated balance sheet as of December 31, 20202023 and 20192022 (in thousands):
| | December 31, 2020 | December 31, 2019 |
| December 31, 2023 | | | December 31, 2023 | December 31, 2022 |
| Assets | Assets | |
| Current assets: | Current assets: | |
| Current assets: | |
| Current assets: | |
| Cash and cash equivalents | |
| Cash and cash equivalents | |
| Cash and cash equivalents | Cash and cash equivalents | $ | 71,442 | | $ | 56,598 | |
| Accounts receivable | Accounts receivable | 70,350 | | 113,635 | |
| Other current assets | Other current assets | 55,575 | | 64,476 | |
| Total current assets | Total current assets | 197,367 | | 234,709 | |
| Non-current assets: | Non-current assets: | |
| Goodwill | Goodwill | 120,343 | | 120,343 | |
| Goodwill | |
| Goodwill | |
| Other assets | Other assets | 15,259 | | 37,826 | |
| Total non-current assets | Total non-current assets | 135,602 | | 158,169 | |
| Total Assets | Total Assets | $ | 332,969 | | $ | 392,878 | |
| | Liabilities | Liabilities | |
| Liabilities | |
| Liabilities | |
| Current liabilities: | |
| Current liabilities: | |
| Current liabilities: | Current liabilities: | |
| Accounts Payable and Accrued Liabilities | Accounts Payable and Accrued Liabilities | $ | 61,436 | | $ | 86,097 | |
| Accounts Payable and Accrued Liabilities | |
| Accounts Payable and Accrued Liabilities | |
| | | Other current liabilities | |
| | Other current liabilities | |
| | Other current liabilities | Other current liabilities | 43,676 | | 65,863 | |
| Total current liabilities | Total current liabilities | 105,112 | | 151,960 | |
| Long-term liabilities: | Long-term liabilities: | |
| Long-term portion of Senior Credit Facility | Long-term portion of Senior Credit Facility | 100,000 | | 123,000 | |
| Long-term portion of Senior Credit Facility | |
| Long-term portion of Senior Credit Facility | |
| | Subordinated debt—affiliate | |
| Subordinated debt—affiliate | |
| Subordinated debt—affiliate | |
| | Other long-term liabilities | |
| Other long-term liabilities | |
| Other long-term liabilities | Other long-term liabilities | 256 | | 712 | |
| Total long-term liabilities | Total long-term liabilities | 100,256 | | 123,712 | |
| Total Liabilities | Total Liabilities | $ | 205,368 | | $ | 275,672 | |
6.5. Preferred Stock
In January 2018, we issued 2,000,000 shares of 8.75% Series A Fixed-to-Floating Rate Cumulative Redeemable Perpetual Preferred Stock ("Series A Preferred Stock"), par value $0.01 per share and having a liquidation preference $25.00 per share, plus accumulated and unpaid dividends, at a price to the public of $25.25 per share. The Company received approximately $48.9 million ($24.45 per share) in net proceeds from the offering, after deducting underwriting discounts and commissions and a structuring fee. Offering expenses of $0.5 million were recorded as a reduction to the carrying value of the Series A Preferred Stock.
In May 2019, we commenced a share repurchase program of our Series A Preferred Stock, which allowed us to make purchases of our Series A Preferred Stock under the repurchase program through May 20, 2020. There was no dollar limit on the amount of Series A Preferred Stock that could be repurchased, nor did the repurchase program obligate the Company to make any repurchases.
In November 2019, we amended and extended our repurchase program of our Series A Preferred Stock. The repurchase program allowed us to purchase Series A Preferred Stock through December 31, 2020, at prevailing prices, in open market or negotiated transactions, subject to market conditions, maximum share prices and other considerations. The repurchase program did not obligate us to make any repurchases.
In May 2020, we initiated a tender offer to purchase up to 1,000,000 shares of our Series A Preferred Stock. In June 2020, we accepted for purchase 36,827 shares of the Series A Preferred Stock at a purchase price of $22.00 per share, for an aggregate purchase price of approximately $0.8 million.
During the year ended December 31, 2020, we repurchased 109,775 shares of Series A Preferred Stock at a weighted-average price of $20.79 per share, for a total cost of approximately $2.3 million.
Holders of the Series A Preferred Stock have no voting rights, except in specific circumstances of delisting or in the case the dividends are in arrears as specified in the Series A Preferred Stock Certificate of Designations. The Series A Preferred Stock accrueaccrued dividends at an annual percentage rate of 8.75% through April 14, 2022. The floating rate period for the Series A Preferred Stock began on April 15, 2022. The dividend on the Series A Preferred Stock will accrue at an annual rate equal to the sum of (a) Three-Month LIBOR (if it then exists), or an alternative reference rate as of the applicable determination date and (b) 6.578%, based on the $25.00 liquidation preference per share of the Series A Preferred Stock. The liquidation preference provisions of the Series A Preferred Stock are considered contingent redemption provisions because there are rights granted to the holders of the Series A Preferred Stock that are not solely within our control upon a change in control of the Company. Accordingly, the Series A Preferred Stock is presented between liabilities and the equity sections in the accompanying condensed consolidated balance sheet.sheets. As of April 15, 2022, we have the option to redeem our Series A Preferred Stock.
Following the cessation of the publication of U.S. LIBOR on June 30, 2023, we use Three Month CME Term SOFR plus a tenor spread of 0.26161 percent (or 26.161 bps) to calculate the dividend rate on the Series A Preferred Stock pursuant to the rules of the Adjustable Interest Rate (LIBOR) Act.
During the year ended December 31, 2020,2023, we paid $7.9$10.3 million in dividends to holders of the Series A Preferred Stock. As of December 31, 2020,2023, we had accrued $1.9$2.7 million related to dividends to holders of the Series A Preferred Stock. This dividend was paid on January 15, 2021.16, 2024. During the year ended December 31, 2019,2022, the Company paid $8.1$7.6 million in dividends to holders of the Series A Preferred Stock and had accrued $2.0$2.4 million as of December 31, 2019.2022.
On January 21, 2021,17, 2024, the Company declared a quarterly cash dividend in the amount of $0.546875$0.75960 per share of Series A Preferred Stock. This amount represents an annualized dividend of $2.1875 per share. The dividend will be paid on April 15, 20212024 to holders of record on April 1, 20212024 of the Series A Preferred Stock.
A summary of our preferred equity balance for the years ended December 31, 20202023 and 20192022 is as follows:
| | | | | | | | |
| | (in thousands) |
| | |
| | |
| | |
| | |
| | |
| | |
| | |
| | |
| | |
Balance at December 31, 20182021 | | $ | 90,75887,288 | |
| Repurchase of Series A Preferred Stock | | (727)— | |
| Accumulated dividends on Series A Preferred Stock | | (16)425 | |
Balance at December 31, 20192022 | | $ | 90,01587,713 | |
| Repurchase of Series A Preferred Stock | | (2,667)— | |
| Accumulated dividends on Series A Preferred Stock | | (60)352 | |
Balance at December 31, 20202023 | | $ | 87,28888,065 | |
7.6. Derivative Instruments
We are exposed to the impact of market fluctuations in the price of electricity and natural gas, basis differences in the price of natural gas, storage charges, renewable energy credits ("RECs"), and capacity charges from independent system operators. We use derivative instruments in an effort to manage our cash flow exposure to these risks. These instruments are not designated as hedges for accounting purposes, and accordingly, changes in the market value of these derivative instruments are recorded in the cost of revenues. As part of our strategy to optimize pricing in our natural gas related activities, we also manage a portfolio of commodity derivative instruments held for trading purposes. Our commodity trading activities are subject to limits within our Risk Management Policy. For these derivative instruments, changes in the fair value are recognized currently in earnings in net asset optimization revenues.
Derivative assets and liabilities are presented net in our consolidated balance sheets when the derivative instruments are executed with the same counterparty under a master netting arrangement. Our derivative contracts include transactions that are executed both on an exchange and centrally cleared, as well as over-the-counter, bilateral contracts that are transacted directly with third parties. To the extent we have paid or received collateral related to the derivative assets or liabilities, such amounts would be presented net against the related derivative asset or liability’s fair value. As of December 31, 20202023 and 2019,2022, we had paid $0.1offset $5.2 million and $1.7$2.7 million, respectively, in collateral.collateral to net against the related derivative liability's fair value. The specific types of derivative instruments we may execute to manage the commodity price risk include the following:
•Forward contracts, which commit us to purchase or sell energy commodities in the future;
•Futures contracts, which are exchange-traded standardized commitments to purchase or sell a commodity or financial instrument;
•Swap agreements, which require payments to or from counterparties based upon the differential between two prices for a predetermined notional quantity; and
•Option contracts, which convey to the option holder the right but not the obligation to purchase or sell a commodity.
The Company has entered into other energy-related contracts that do not meet the definition of a derivative instrument or for which we made a normal purchase, normal sale election and are therefore not accounted for at fair value including the following:
•Forward electricity and natural gas purchase contracts for retail customer load;
•Renewable energy credits; and
•Natural gas transportation contracts and storage agreements.
Volumes Underlying Derivative Transactions
The following table summarizes the net notional volumes of our open derivative financial instruments accounted for at fair value by commodity. Positive amounts represent net buys while bracketed amounts are net sell transactions (in thousands):
Non-trading
| | Commodity | Commodity | Notional | | December 31, 2020 | | December 31, 2019 | Commodity | Notional | | December 31, 2023 | | December 31, 2022 |
| Natural Gas | Natural Gas | MMBtu | | 2,880 | | | 6,130 | |
| Natural Gas Basis | MMBtu | | 0 | | | 42 | |
| | Electricity | Electricity | MWh | | 1,845 | | | 6,015 | |
| Electricity | |
| Electricity | |
Trading
| | Commodity | Commodity | Notional | | December 31, 2020 | | December 31, 2019 | Commodity | Notional | | December 31, 2023 | | December 31, 2022 |
| Natural Gas | Natural Gas | MMBtu | | 102 | | | 204 | |
|
Gains (Losses) on Derivative Instruments
Gains (losses) on derivative instruments, net and current period settlements on derivative instruments were as follows for the periods indicated (in thousands):
| | | | | | | | | | | | | | | | | |
| Year Ended December 31, |
| | 2020 | | 2019 | | 2018 |
| | | | | |
| Loss on non-trading derivatives, net | $ | (23,439) | | | $ | (67,955) | | | $ | (19,571) | |
| Gain on trading derivatives, net | 53 | | | 206 | | | 1,401 | |
| Loss on derivatives, net | $ | (23,386) | | | $ | (67,749) | | | $ | (18,170) | |
| | | | | |
Current period settlements on non-trading derivatives (1) (2) | 37,921 | | | 42,944 | | | (9,614) | |
| Current period settlements on trading derivatives | (192) | | | (124) | | | (973) | |
Total current period settlements on derivatives (1) (2) | $ | 37,729 | | | $ | 42,820 | | | $ | (10,587) | |
| | | | | | | | | | | | | | | | | |
| Year Ended December 31, |
| | 2023 | | 2022 | | 2021 |
| | | | | |
| (Loss) gain on non-trading derivatives, net | $ | (70,304) | | | $ | 17,305 | | | $ | 22,130 | |
| (Loss) gain on trading derivatives, net | (1,189) | | | 516 | | | (930) | |
| (Loss) gain on derivatives, net | $ | (71,493) | | | $ | 17,821 | | | $ | 21,200 | |
| | | | | |
Current period settlements on non-trading derivatives (1) | 65,428 | | | (35,966) | | | (15,752) | |
| Current period settlements on trading derivatives | 1,204 | | | 165 | | | 60 | |
Total current period settlements on derivatives (1) | $ | 66,632 | | | $ | (35,801) | | | $ | (15,692) | |
(1) Excludes settlements of 0, less than$0.1$0.2 million and $(0.3) million, respectively,related to acquisition, for the yearsyear ended December 31, 2020, 2019, and 2018 related to non-trading derivative liabilities assumed in various acquisitions.
(2) Excludes settlements of $0.3 million, $(0.9) million, and 0, respectively, for the years ended December 31, 2020, 2019, and 2018 related to power call options.2022.
Gains (losses) on trading derivative instruments are recorded in net asset optimization revenues and gains (losses) on non-trading derivative instruments are recorded in retail cost of revenues on the consolidated statements of operations.
Fair Value of Derivative Instruments
The following tables summarize the fair value and offsetting amounts of our derivative instruments by counterparty and collateral received or paid (in thousands):
| | | | | | | | | | | | | | | | | | | | | | | | | | | | | |
| December 31, 2020 |
| Description | Gross Assets | | Gross
Amounts
Offset | | Net Assets | | Cash
Collateral
Offset | | Net Amount
Presented |
| Non-trading commodity derivatives | $ | 308 | | | $ | (105) | | | $ | 203 | | | $ | 0 | | | $ | 203 | |
| Trading commodity derivatives | 112 | | | (4) | | | 108 | | | 0 | | | 108 | |
| Total Current Derivative Assets | 420 | | | (109) | | | 311 | | | 0 | | | 311 | |
| Non-trading commodity derivatives | 0 | | | 0 | | | 0 | | | 0 | | | 0 | |
| Trading commodity derivatives | 0 | | | 0 | | | 0 | | | 0 | | | 0 | |
| Total Non-current Derivative Assets | 0 | | | 0 | | | 0 | | | 0 | | | 0 | |
| Total Derivative Assets | $ | 420 | | | $ | (109) | | | $ | 311 | | | $ | 0 | | | $ | 311 | |
| | | | | | | | | | | | | | | | | | | | | | | | | | | | | |
| |
| Description | Gross
Liabilities | | Gross
Amounts
Offset | | Net
Liabilities | | Cash
Collateral
Offset | | Net Amount
Presented |
| Non-trading commodity derivatives | $ | (11,139) | | | $ | 3,620 | | | $ | (7,519) | | | $ | 86 | | | $ | (7,433) | |
| Trading commodity derivatives | (74) | | | 2 | | | (72) | | | 0 | | | (72) | |
| Total Current Derivative Liabilities | (11,213) | | | 3,622 | | | (7,591) | | | 86 | | | (7,505) | |
| Non-trading commodity derivatives | (838) | | | 611 | | | (227) | | | 0 | | | (227) | |
| Trading commodity derivatives | 0 | | | 0 | | | 0 | | | 0 | | | 0 | |
| Total Non-current Derivative Liabilities | (838) | | | 611 | | | (227) | | | 0 | | | (227) | |
| Total Derivative Liabilities | $ | (12,051) | | | $ | 4,233 | | | $ | (7,818) | | | $ | 86 | | | $ | (7,732) | |
| | | | | | | | | | | | | | | | | | | | | | | | | | | | | |
| December 31, 2019 |
| Description | Gross Assets | | Gross
Amounts
Offset | | Net Assets | | Cash
Collateral
Offset | | Net Amount
Presented |
| Non-trading commodity derivatives | $ | 570 | | | $ | (275) | | | $ | 295 | | | $ | 0 | | | $ | 295 | |
| Trading commodity derivatives | 170 | | | (1) | | | 169 | | | 0 | | | 169 | |
| Total Current Derivative Assets | 740 | | | (276) | | | 464 | | | 0 | | | 464 | |
| Non-trading commodity derivatives | 333 | | | (227) | | | 106 | | | 0 | | | 106 | |
| Trading commodity derivatives | 0 | | | 0 | | | 0 | | | 0 | | | 0 | |
| Total Non-current Derivative Assets | 333 | | | (227) | | | 106 | | | 0 | | | 106 | |
| Total Derivative Assets | $ | 1,073 | | | $ | (503) | | | $ | 570 | | | $ | 0 | | | $ | 570 | |
| | | | December 31, 2023 |
| Description | Description | Gross
Liabilities | | Gross
Amounts
Offset | | Net
Liabilities | | Cash
Collateral
Offset | | Net Amount
Presented | Description | Gross Assets | | Gross
Amounts
Offset | | Net Assets | | Cash
Collateral
Offset | | Net Amount
Presented |
| Non-trading commodity derivatives | Non-trading commodity derivatives | $ | (34,434) | | | $ | 12,859 | | | $ | (21,575) | | | $ | 1,632 | | | $ | (19,943) | |
| Trading commodity derivatives | Trading commodity derivatives | (194) | | | 194 | | | 0 | | | 0 | | | 0 | |
| Total Current Derivative Liabilities | (34,628) | | | 13,053 | | | (21,575) | | | 1,632 | | | (19,943) | |
| Total Current Derivative Assets | |
| Non-trading commodity derivatives | Non-trading commodity derivatives | (1,951) | | | 1,422 | | | (529) | | | 34 | | | (495) | |
| Trading commodity derivatives | Trading commodity derivatives | 0 | | | 0 | | | 0 | | | 0 | | | 0 | |
| Total Non-current Derivative Liabilities | (1,951) | | | 1,422 | | | (529) | | | 34 | | | (495) | |
| Total Derivative Liabilities | $ | (36,579) | | | $ | 14,475 | | | $ | (22,104) | | | $ | 1,666 | | | $ | (20,438) | |
| Total Non-current Derivative Assets | |
| Total Derivative Assets | |
| | | | | | | | | | | | | | | | | | | | | | | | | | | | | |
| |
| Description | Gross
Liabilities | | Gross
Amounts
Offset | | Net
Liabilities | | Cash
Collateral
Offset | | Net Amount
Presented |
| Non-trading commodity derivatives | $ | (29,730) | | | $ | 6,077 | | | $ | (23,653) | | | $ | 4,679 | | | $ | (18,974) | |
| Trading commodity derivatives | (173) | | | 6 | | | (167) | | | — | | | (167) | |
| Total Current Derivative Liabilities | (29,903) | | | 6,083 | | | (23,820) | | | 4,679 | | | (19,141) | |
| Non-trading commodity derivatives | (672) | | | 115 | | | (557) | | | 503 | | | (54) | |
| Trading commodity derivatives | — | | | — | | | — | | | — | | | — | |
| Total Non-current Derivative Liabilities | (672) | | | 115 | | | (557) | | | 503 | | | (54) | |
| Total Derivative Liabilities | $ | (30,575) | | | $ | 6,198 | | | $ | (24,377) | | | $ | 5,182 | | | $ | (19,195) | |
| | | | | | | | | | | | | | | | | | | | | | | | | | | | | |
| December 31, 2022 |
| Description | Gross Assets | | Gross
Amounts
Offset | | Net Assets | | Cash
Collateral
Offset | | Net Amount
Presented |
| Non-trading commodity derivatives | $ | 709 | | | $ | (154) | | | $ | 555 | | | $ | — | | | $ | 555 | |
| Trading commodity derivatives | 1,267 | | | (190) | | | 1,077 | | | — | | | 1,077 | |
| Total Current Derivative Assets | 1,976 | | | (344) | | | 1,632 | | | — | | | 1,632 | |
| Non-trading commodity derivatives | 1,364 | | | (698) | | | 666 | | | — | | | 666 | |
| Trading commodity derivatives | — | | | — | | | — | | | — | | | — | |
| Total Non-current Derivative Assets | 1,364 | | | (698) | | | 666 | | | — | | | 666 | |
| Total Derivative Assets | $ | 3,340 | | | $ | (1,042) | | | $ | 2,298 | | | $ | — | | | $ | 2,298 | |
| | | | | | | | | | | | | | | | | | | | | | | | | | | | | |
| |
| Description | Gross
Liabilities | | Gross
Amounts
Offset | | Net
Liabilities | | Cash
Collateral
Offset | | Net Amount
Presented |
| Non-trading commodity derivatives | $ | (42,586) | | | $ | 24,969 | | | $ | (17,617) | | | $ | 2,715 | | | $ | (14,902) | |
| Trading commodity derivatives | (1,831) | | | 601 | | | (1,230) | | | — | | | (1,230) | |
| Total Current Derivative Liabilities | (44,417) | | | 25,570 | | | (18,847) | | | 2,715 | | | (16,132) | |
| Non-trading commodity derivatives | (2,907) | | | 192 | | | (2,715) | | | — | | | (2,715) | |
| Trading commodity derivatives | — | | | — | | | — | | | — | | | — | |
| Total Non-current Derivative Liabilities | (2,907) | | | 192 | | | (2,715) | | | — | | | (2,715) | |
| Total Derivative Liabilities | $ | (47,324) | | | $ | 25,762 | | | $ | (21,562) | | | $ | 2,715 | | | $ | (18,847) | |
8.7. Property and Equipment
Property and equipment consist of the following (in thousands):
| | Estimated
useful
lives (years) | | December 31, 2020 | | December 31, 2019 |
| Estimated
useful
lives (years) | | | Estimated
useful
lives (years) | | December 31, 2023 | | December 31, 2022 |
| Information technology | Information technology | 2 – 5 | | $ | 5,821 | | | $ | 22,005 | |
| | Furniture and fixtures | Furniture and fixtures | 2 – 5 | | 957 | | | 1,802 | |
| Furniture and fixtures | |
| Furniture and fixtures | |
| | Total | |
| Total | |
| Total | Total | | 6,778 | | | 23,807 | |
| Accumulated depreciation | Accumulated depreciation | | (3,424) | | | (20,540) | |
| Property and equipment—net | Property and equipment—net | | $ | 3,354 | | | $ | 3,267 | |
Information technology assets include software and consultant time used in the application, development and implementation of various systems including customer billing and resource management systems. As of each of December 31, 20202023 and 2019,2022, information technology includes $0.7$1.5 million and $0.6$0.9 million, respectively, of costs associated with assets not yet placed into service.
Depreciation expense recorded in the consolidated statements of operations was $2.1$1.4 million, $2.3$1.7 million and $3.9$1.8 millionfor the years ended December 31, 2020, 20192023, 2022 and 2018,2021, respectively.
9.8. Intangible Assets
Goodwill, customer relationships and trademarks consist of the following amounts (in thousands):
| | | December 31, 2020 | | December 31, 2019 |
| December 31, 2023 | |
| December 31, 2023 | |
| December 31, 2023 | | | December 31, 2022 |
| Goodwill | Goodwill | $ | 120,343 | | | $ | 120,343 | |
| Customer Relationships— Acquired | Customer Relationships— Acquired | |
| Cost | |
| Cost | |
| Cost | Cost | $ | 58,688 | | | $ | 64,083 | |
| Accumulated amortization | Accumulated amortization | (44,175) | | | (40,231) | |
| Customer Relationships—Acquired | Customer Relationships—Acquired | $ | 14,513 | | | $ | 23,852 | |
Customer Relationships—Other | Customer Relationships—Other | |
| Cost | Cost | $ | 8,988 | | | $ | 17,056 | |
| Cost | |
| Cost | |
| Accumulated amortization | Accumulated amortization | (5,733) | | | (9,534) | |
| Customer Relationships—Other, net | Customer Relationships—Other, net | $ | 3,255 | | | $ | 7,522 | |
Trademarks | Trademarks | |
| Cost | Cost | $ | 7,570 | | | $ | 8,502 | |
| Cost | |
| Cost | |
| Accumulated amortization | Accumulated amortization | (2,972) | | | (2,794) | |
| Trademarks, net | Trademarks, net | $ | 4,598 | | | $ | 5,708 | |
Changes in goodwill, customer relationships (including non-compete agreements) and trademarks consisted of the following (in thousands):
Table of Contents
| | | | | | | | | | | | | | | | | | | | | | | |
| Goodwill | | Customer Relationships— Acquired & Non-Compete Agreements | | Customer Relationships— Other | | Trademarks |
| | | | | | | |
| | | | | | | |
| | | | | | | |
| | | | | | | |
| | | | | | | |
| | | | | | | |
| | | | | | | |
| | | | | | | |
| | | | | | | |
| | | | | | | |
| | | | | | | |
| | | | | | | |
| | | | | | | |
| | | | | | | |
| | | | | | | |
| | | | | | | |
| | | | | | | |
| | | | | | | |
| | | | | | | |
| | | | | | | |
| | | | | | | |
| | | | | | | |
| | | | | | | |
| | | | | | | |
| | | | | | | |
| | | | | | | |
| Balance at December 31, 2020 | $ | 120,343 | | | $ | 14,513 | | | $ | 3,255 | | | $ | 4,598 | |
| Additions | — | | | — | | | 9,100 | | | — | |
| Adjustments | — | | | — | | | (27) | | | — | |
| Amortization | — | | | (9,081) | | | (3,577) | | | (1,066) | |
| Balance at December 31, 2021 | $ | 120,343 | | | $ | 5,432 | | | $ | 8,751 | | | $ | 3,532 | |
| Additions | — | | | — | | | 1,091 | | | — | |
| Adjustments | — | | | 1 | | | — | | | (10) | |
| Amortization | — | | | (5,232) | | | (7,042) | | | (694) | |
| Balance at December 31, 2022 | $ | 120,343 | | | $ | 201 | | | $ | 2,800 | | | $ | 2,828 | |
| Additions | — | | | | | — | | | — | |
| | | | | | | |
| Amortization | — | | | (201) | | | (2,319) | | | (404) | |
| Balance at December 31, 2023 | $ | 120,343 | | | $ | — | | | $ | 481 | | | $ | 2,424 | |
| | | | | | | | | | | | | | | | | | | | | | | |
| Goodwill | | Customer Relationships— Acquired & Non-Compete Agreements | | Customer Relationships— Other | | Trademarks |
| | | | | | | |
| | | | | | | |
| | | | | | | |
| | | | | | | |
| | | | | | | |
| | | | | | | |
| | | | | | | |
| | | | | | | |
| | | | | | | |
| | | | | | | |
| | | | | | | |
| | | | | | | |
| | | | | | | |
| | | | | | | |
| | | | | | | |
| | | | | | | |
| | | | | | | |
| | | | | | | |
| | | | | | | |
| Balance at December 31, 2017 | $ | 120,154 | | | $ | 46,690 | | | $ | 6,802 | | | $ | 8,558 | |
| Additions | — | | | 6,205 | | | 3,818 | | | — | |
Adjustments (1) | 189 | | | (174) | | | — | | | — | |
| Amortization | — | | | (16,527) | | | (3,755) | | | (1,271) | |
| Balance at December 31, 2018 | $ | 120,343 | | | $ | 36,194 | | | $ | 6,865 | | | $ | 7,287 | |
| Additions | — | | | 0 | | | 6,913 | | | — | |
| Amortization | — | | | (12,342) | | | (6,256) | | | (1,579) | |
| Balance at December 31, 2019 | $ | 120,343 | | | $ | 23,852 | | | $ | 7,522 | | | $ | 5,708 | |
| | | | | | | |
| Amortization | — | | | (9,339) | | | (4,267) | | | (1,110) | |
| Balance at December 31, 2020 | $ | 120,343 | | | $ | 14,513 | | | $ | 3,255 | | | $ | 4,598 | |
(1) Related to working capital adjustments on various acquisitions.
The acquired customer relationship intangibles related to Major Energy Companies,During the Provider Companies, and the Verde Companies were bifurcated between hedged and unhedged customer contracts. The unhedged customer contracts are amortized to depreciation and amortization based on the expected future cash flows by year. The hedged customer contracts were evaluated for favorable or unfavorable positions at the time of acquisition and amortized to retail cost of revenue based on the expected term and position of the underlying fixed price contract in each reporting period. For the yearstwelve months ended December 31, 2020, 2019, and 2018, respectively,2022, the Company changed the estimated average life for Customer Relationships — Other from three years to eighteen months, resulting in approximately 0, less than $0.1 million, and $(1.2)$0.9 million of additional amortization recorded in the $9.3 million, $12.3 million, and $16.5 million acquired customer relationship amortization expense is included in retail cost of revenues.twelve months ended December 31, 2022.
Estimated future amortization expense for customer relationships and trademarks at December 31, 20202023 is as follows (in thousands):
| | Year Ending December 31, | Year Ending December 31, | |
| 2021 | $ | 13,142 | |
| 2022 | 6,194 | |
| 2023 | 605 | |
| 2024 | |
| 2024 | |
| 2024 | 2024 | 404 | |
| 2025 | 2025 | 404 | |
| 2026 | |
| 2027 | |
| 2028 | |
| > 5 years | > 5 years | 1,617 | |
| Total | Total | $ | 22,366 | |
10.9. Debt
Debt consists of the following amounts as of December 31, 20202023 and 20192022 (in thousands):
| | | | | | | | | | | |
| December 31, 2020 | | December 31, 2019 |
| | | |
| | | |
| | | |
| | | |
| Long-term debt: | | | |
Senior Credit Facility (1) (2) | $ | 100,000 | | | $ | 123,000 | |
| | | |
| | | |
| | | |
| Total long-term debt | 100,000 | | | 123,000 | |
| Total debt | $ | 100,000 | | | $ | 123,000 | |
| | | | | | | | | | | |
| December 31, 2023 | | December 31, 2022 |
| | | |
| | | |
| | | |
| | | |
| Long-term debt: | | | |
Senior Credit Facility (1) (2) | $ | 97,000 | | | $ | 100,000 | |
| Subordinated Debt | — | | | 20,000 | |
| | | |
| | | |
| Total long-term debt | 97,000 | | | 120,000 | |
| Total debt | $ | 97,000 | | | $ | 120,000 | |
(1) As of December 31, 20202023 and 2019,2022, the weighted average interest rate on the Senior Credit Facility was 3.75%8.60% and 4.71%7.83%, respectively.
(2) As of December 31, 20202023 and 2019,2022, we had $31.0$24.3 million and $37.4$34.4 million in letters of credit issued, respectively.
Capitalized financing costs associated with our Senior Credit Facility were $1.6$1.2 million and $1.3$2.1 million as of December 31, 20202023 and 2019,2022, respectively. Of these amounts, $1.0$0.8 million and $0.9$0.8 million are recorded in other current assets, and $0.6$0.4 million and $0.4$1.3 million are recorded in other non-current assets in the consolidated balance sheets as of December 31, 20202023 and 2019,2022, respectively.
Interest expense consists of the following components for the periods indicated (in thousands):
| | Years Ended December 31, |
| 2020 | | 2019 | | 2018 |
| Years Ended December 31, | | | Years Ended December 31, |
| 2023 | | | 2023 | | 2022 | | 2021 |
Senior Credit Facility | Senior Credit Facility | $ | 2,291 | | | $ | 5,263 | | | $ | 5,300 | |
| | Letters of credit fees and commitment fees | |
| Letters of credit fees and commitment fees | |
| Letters of credit fees and commitment fees | Letters of credit fees and commitment fees | 1,472 | | | 1,656 | | | 1,604 | |
Amortization of deferred financing costs | Amortization of deferred financing costs | 1,210 | | | 1,275 | | | 1,291 | |
| | Other | Other | 293 | | | 197 | | | 26 | |
| Verde promissory note | 0 | | | 230 | | | 1,189 | |
| Other | |
| Other | |
| | Interest expense | Interest expense | $ | 5,266 | | | $ | 8,621 | | | $ | 9,410 | |
| Interest expense | |
| Interest expense | |
Prior Senior Credit Facility
The Company, as guarantor, and Spark HoldCo (the “Borrower” and together with each subsidiary of Spark HoldCo (“Co-Borrowers”)) maintainparty thereto were previously party to a senior secured borrowing baserevolving credit facility, dated May 19, 2017 (as amended, from time to time, “Seniorthe “Prior Senior Credit Facility”) that allows us, which included a senior secured revolving facility up to borrow on a revolving basis and has a maximum borrowing capacity of $202.5 million as of December 31, 2020. Subject to applicable sublimits and terms of the$227.5 million. The Prior Senior Credit Facility borrowings are available forhad a maturity date of October 13, 2023. The outstanding balances under the issuancePrior Senior Credit Facility were paid in full on June 30, 2022 and it was terminated upon execution of lettersthe Company's new Senior Credit Facility.
Senior Credit Facility
On June 30, 2022, the Company and Spark HoldCo, and together with certain subsidiaries of credit (“Letters of Credit”), working capitalthe Company and general purpose revolving credit loans (“Working Capital Loans”Spark Holdco, (the “Co-Borrowers”), and share buyback loans (“Share Buyback Loans” entered into a Credit Agreement (the “Credit Agreement”).
The Senior Credit Facility will mature on July 31, 2022, and all amounts outstanding thereunder will be payable on the maturity date. Borrowings under the SeniorAgreement provides for a senior secured credit facility (the “Senior Credit Facility may be used to pay fees and expenses in connection with the Senior Credit Facility, finance ongoing working capital requirements and general corporate purpose requirements ofFacility”), which allows the Co-Borrowers to provide partial funding for acquisitions, as allowed under terms of the Senior Credit Facility, andborrow up to make open market purchases of our Class A common stock and Series A Preferred Stock.$195.0 million on a revolving basis. The Senior Credit Facility provides for Share Buyback Loansworking capital loans, loans to fund acquisitions, swingline loans and letters of up to $80.0 million, which permit the Company to repurchase up to an aggregate of 8,000,000 shares of Class A common stock or $80.0 million of Series A Preferred Stock.
On January 19, 2021, we increased the total commitments under ourcredit. The Senior Credit Facility to $227.5 million.
Pursuant to the Senior Credit Facility, the interest rate for Working Capital Loansexpires on June 30, 2025, and Letters of Credit under the Senior Credit Facility is generally determined by reference to the Eurodollar rate plus an applicable margin of up to 3.25% per annum (basedall amounts outstanding thereunder are payable on the prevailing utilization) or an alternate base rate plus an applicable margin of up to
2.25% per annum (based on the prevailing utilization). The alternate base rate is equal to the highest of (i) the prime rate (as published in the Wall Street Journal), (ii) the federal funds rate plus 0.50% per annum, or (iii) the reference Eurodollar rate plus 1.00%.expiration date.
Borrowings under the Senior Credit Facility for Share Buyback Loans, are generally determined by referencebear interest at the following rates depending on the classification of the borrowing and provided further that at no time shall the interest rate be less than four percent (4.0%) per annum:
•The Base Rate (a rate per annum equal to the Eurodollargreatest of (a) the prime rate, (b) the Federal Funds Rate plus ½ of 1% and (c) Term Secured Overnight Financing Rate ("SOFR") for a one month tenor plus 1.0%, provided, that the Base Rate shall not at any time be less than 0%), plus an applicable margin of 3.25% to 4.50% per annumdepending on the type of borrowing and the average outstanding amount of loans and letters of credit under the Credit Agreement at the end of the prior fiscal quarter;
•The Term SOFR (a rate equal to the forward looking secured overnight financing rate published by the SOFR administrator on the website of the Federal Reserve Bank of New York or the alternate base rateany successor source with either a comparable tenor (for any calculation with respect to a SOFR loan) or a one month tenor (for any calculation with respect to a Base Rate loan)), plus an applicable margin of 3.50% per annum.3.25% to 4.50% depending on the type of borrowing and the average outstanding amount of loans and letters of credit under the Credit Agreement at the end of the prior fiscal quarter; or
•The Daily Simple SOFR (a rate equal to the forward looking secured overnight financing rate published by the SOFR administrator on the website of the Federal Reserve Bank of New York or any successor source and applied on a daily basis by the Agent in accordance with rate recommendations for daily loans), plus an applicable margin of 3.25% to 4.50% depending on the type of borrowing and the average outstanding amount of loans and letters of credit under the Credit Agreement at the end of the prior fiscal quarter, plus a liquidity premium added by the Agent to each borrowing.
The Co-Borrowers are required to pay a commitmentnon-utilization fee of 0.50% quarterly in arrears on the unused portion of the Senior Credit Facility. In addition, the Co-Borrowers are subject to additional fees including an upfront fee, an annual administrative agency fee, an arrangement fee and letter of credit fees based on a percentage of the face amount of letters of credit payable to any syndicate member that issues a letter of credit.fees.
The Senior Credit FacilityAgreement contains covenants that, among other things, require the maintenance of specified ratios or conditions including:
•Minimum Fixed Charge Coverage Ratio. WeRatio. The Company must maintain a minimum fixed charge coverage ratio of not less than 1.251.10 to 1.00. The Minimum Fixed Charge Coverage Ratio is defined as the ratio of (a) Adjusted EBITDA to (b) the sum of, among other things, consolidated (with respect to the Company and the Co-Borrowers) interest expense, letter of credit fees, commitmentnon-utilization fees, acquisition earn-out payments, (excluding earnoutcertain restricted payments, funded with proceeds from newly issued preferred or common equity), distributions, scheduled amortization payments,taxes, and payments made on or after the closing of the Fourth Amendment to the Senior Credit Facility (other than such payments made from escrow accounts which were funded in connection with a permitted acquisition)July 31, 2020 related to the settlement of civil and regulatory matters if not included in the calculation of Adjusted EBITDA. Our Minimum Fixed Charge Coverage Ratio as of December 31, 2023 was 1.96 to 1.00.
•Maximum Total Leverage Ratio. WeRatio. The Company must maintain a ratio of (x) the sum of total all consolidated
indebtedness (excluding eligible subordinated debt and letter of credit obligations), plus (y) gross amounts reserved for civil and regulatory liabilities identified infilings with the SEC, filings, to Adjusted EBITDA of no more than 2.50 to 1.00. Our Maximum Total Leverage Ratio as of December 31, 2023 was 1.82 to 1.00.
•Maximum Senior Secured Leverage Ratio. WeRatio. The Company must maintain a Senior Secured Leverage Ratio of no more than 1.852.00 to 1.00. The Senior Secured Leverage Ratio is defined as the ratio of (a) all indebtedness of the loan parties on a consolidated basisindebtedness that is secured by a lien on any property of any loan party (including the effective amount of all loans then outstanding under the Senior Credit Facility)Facility but excluding eligible subordinated debt and letter of credit obligations) to (b) Adjusted EBITDA.EBITDA for the most recent twelve month period then ended. Our Maximum Senior Secured Leverage Ratio as of December 31, 2023 was 1.71 to 1.00.
As of December 31, 2023, the Company was in compliance with financial covenants under the Senior Credit Facility. The Company experienced compressed gross profit due to an extreme elevation of commodity costs during 2022, impacting calculated Adjusted EBITDA, a primary component of the financial covenants described above. The Company continues to manage the impact of commodity costs on financial covenant compliance. Maintaining compliance with our covenants under our Senior Credit Facility may impact our ability to pay dividends on our Class A common stock and Series A Preferred Stock.
The Credit Agreement contains various customary affirmative covenants that require, among other things, the Company to maintain insurance, pay its obligations and comply with law. The Credit Agreement also contains customary negative covenants that limit ourthe Company's ability to, among other things, incur certain additional indebtedness, grant certain liens, engage in certain asset dispositions, merge or consolidate, make certain payments, distributions and dividends, investments, acquisitions or loans, materially modify certain agreements, orand enter into transactions with affiliates. The Senior Credit Facility also contains affirmative covenants that are customary for credit facilities of this type. As of December 31, 2020, we were in compliance with our various covenants under the Senior Credit Facility.
The Senior Credit Facility is secured by pledges of the equity of the portion of Spark HoldCo owned by us,the Company, the equity of Spark HoldCo’s subsidiaries, the Co-Borrowers’ present and future subsidiaries, and substantially all of the Co-Borrowers’ and their subsidiaries’ present and future property and assets, including intellectual property assets, accounts receivable, inventory and liquid investments, and control agreements relating to bank accounts.
We are
The Company is entitled to pay cash dividends to the holders of theits Series A Preferred Stock and Class A common stock and will be entitled to repurchase up to an aggregate amount of 10,000,000 shares of our Class A common stock, and up to $92.7 million of Series A Preferred Stock through one or more normal course open market purchases through NASDAQ so long as: (a) no default exists or would result therefrom; (b) the Co-Borrowers are in pro forma compliance with all financial covenants before and after giving effect thereto; and (c) the outstanding amount of all loans and letters of credit doesdo not exceed the borrowing base limits.
The Senior Credit FacilityAgreement contains certain customary representations and warranties and events of default. Events of default include, among other things, payment defaults, breaches of representations and warranties, covenant defaults, cross-defaults and cross-acceleration to certain indebtedness, certain events of bankruptcy, certain events under ERISA, material judgments in excess of $5.0 million, certain events with respect to material contracts, and actual or asserted failure of any guaranty or security document supporting the Senior Credit Facility to be in full force and effect. A default will also occur if at any time W. Keith Maxwell III ceases to, directly or indirectly, beneficially own at least 13,600,000fifty-one percent (51%) of the Company’s outstanding Class A common stock and Class B sharescommon stock on a combined basis, (to be adjusted for any stock split, subdivisions or other stock reclassification or recapitalization), and a controlling percentage of the voting equity interest of the Company, and certain other changes in control. If such an event of default occurs, the lenders under the Senior Credit Facility would be entitled to take various actions, including the acceleration of amounts due under the facility and all actions permitted to be taken by a secured creditor.
Subordinated Debt Facility
The Company maintains an Amended and Restated Subordinated Promissory Note in the principal amount of up to $25.0 million (the “Subordinated Debt Facility”), by and among the Company, Spark HoldCo and Retailco. The Subordinated Debt Facility matures on January 31, 2023.
The Subordinated Debt Facility allows usthe Company to draw advances in increments of no less than $1.0 million per advance up to $25.0 million through January 31, 2026. Borrowings are at the maximum principal amountdiscretion of the Subordinated Debt Facility.Retailco. Advances thereunder accrue interest at 5% per annuman annual rate equal to the prime rate as published by the Wall Street Journal plus two percent (2.0%) from the date of the advance. We have
The Company has the right to capitalize interest payments under the Subordinated Debt Facility. The Subordinated Debt Facility is subordinated in certain respects to our Senior Credit Facility pursuant to a subordination agreement. WeThe Company may pay interest and prepay principal on the Subordinated Debt Facility so long as we areit is in compliance with the covenants under ourthe Senior Credit Facility, areis not in default under the Senior Credit Facility and havehas minimum availability of $5.0 million under the borrowing base under the Senior Credit Facility. Payment of principal and interest under the Subordinated Debt Facility is accelerated upon the occurrence of certain change of control or sale transactions.
As of December 31, 20202023 and 2019,2022, there were 0zero and $20.0 million outstanding borrowings under the Subordinated Debt Facility.
Verde Notes
In connection with the acquisition of the Verde Companies in July 2017, we entered into a promissory note in the aggregate principal amount of $20.0 million (the "Verde Promissory Note"). The Verde Promissory Note required repayment in 18 monthly installments beginning in August 2017, and accrued interest at 5% per annum from the date of issuance. The Verde Promissory Note, including principal and interest, was unsecured, but was guaranteed by us. In January 2018, in connection with the Earnout Termination Agreement (defined below), we issued to the seller of the Verde Companies an amended and restated promissory note (the “Amended and Restated Verde Promissory Note”), which amended and restated the Verde Promissory Note. The Amended and Restated Verde Promissory Note matured in January 2019, and bore interest at a rate of 9% per annum. Principal and interest were payable monthly on the first day of each month, with a portion of each payment going into an escrow account, which serves as security for certain indemnification claims and obligations under the Verde purchase agreement. As of December 31, 2020 and 2019, there was 0 outstanding, respectively, under the Amended and Restated Verde Promissory Note.
In January 2018, we issued a promissory note in the principal amount of $5.9 million in connection with an agreement to terminate the earnout obligations arising in connection with our acquisition of the Verde Companies (the “Verde Earnout Termination Note”). The Verde Earnout Termination Note matured in June 2019 and bore interest at a rate of 9% per annum. Under the terms of the Verde Earnout Termination Note, we were permitted to withhold amounts otherwise due at maturity related to certain indemnifiable matters. A payment of $1.0 million was made to the seller of the Verde Companies in June 2019, and $4.9 million was withheld (the “Verde Holdback”) to be applied to indemnifiable matters. As of December 31, 2020 and 2019, there was 0 outstanding under the Verde Earnout Termination Note.
10. Fair Value Measurements
The Verde Earnout Termination Note, the Verde Promissory Note, and the Amended and Restated Verde Promissory Note are collectively referred to as the "Verde Notes."
11. Fair Value Measurements
Fair value is defined as the price that would be received to sell an asset or paid to transfer a liability (exit price) in an orderly transaction between market participants at the measurement date. Fair values are based on assumptions that market participants would use when pricing an asset or liability, including assumptions about risk and the risks inherent in valuation techniques and the inputs to valuations. This includes the credit standing of counterparties involved and the impact of credit enhancements.
We apply fair value measurements to our commodity derivative instruments based on the following fair value hierarchy, which prioritizes the inputs to the valuation techniques used to measure fair value into three broad levels:
•Level 1—Quoted prices in active markets for identical assets and liabilities. Instruments categorized in Level 1 primarily consist of financial instruments such as exchange-traded derivative instruments.
•Level 2—Inputs other than quoted prices recorded in Level 1 that are either directly or indirectly observable for the asset or liability, including quoted prices for similar assets or liabilities in active markets, quoted prices for identical or similar assets or liabilities in inactive markets, inputs other than quoted prices that are observable for the asset or liability, and inputs that are derived from observable market data by correlation or other means. Instruments categorized in Level 2 primarily include non-exchange traded derivatives such as over-the-counter commodity forwards and swaps and options.
•Level 3—Unobservable inputs for the asset or liability, including situations where there is little, if any, observable market activity for the asset or liability. The Level 3 category includes estimated earnout obligations related to our acquisitions.
As the fair value hierarchy gives the highest priority to quoted prices in active markets (Level 1) and the lowest priority to unobservable data (Level 3), the Company maximizes the use of observable inputs and minimizes the use of unobservable inputs when measuring fair value. These levels can change over time. In some cases, the inputs used to measure fair value might fall in different levels of the fair value hierarchy. In these cases, the lowest level input that is significant to a fair value measurement in its entirety determines the applicable level in the fair value hierarchy.
Assets and Liabilities Measured at Fair Value on a Recurring Basis
The following tables present assets and liabilities measured and recorded at fair value in our consolidated balance sheets on a recurring basis by and their level within the fair value hierarchy (in thousands):
| | Level 1 | | Level 2 | | Level 3 | | Total |
| December 31, 2020 | | | | | | | |
| Level 1 | | | Level 1 | | Level 2 | | Level 3 | | Total |
| December 31, 2023 | | December 31, 2023 | | | |
| Non-trading commodity derivative assets | Non-trading commodity derivative assets | $ | 104 | | | $ | 99 | | | $ | 0 | | | $ | 203 | |
| Trading commodity derivative assets | Trading commodity derivative assets | 0 | | | 108 | | | 0 | | | 108 | |
| Total commodity derivative assets | Total commodity derivative assets | $ | 104 | | | $ | 207 | | | $ | 0 | | | $ | 311 | |
| Non-trading commodity derivative liabilities | Non-trading commodity derivative liabilities | $ | (5) | | | $ | (7,655) | | | $ | 0 | | | $ | (7,660) | |
| Trading commodity derivative liabilities | Trading commodity derivative liabilities | 0 | | | (72) | | | 0 | | | (72) | |
| Total commodity derivative liabilities | Total commodity derivative liabilities | $ | (5) | | | $ | (7,727) | | | $ | 0 | | | $ | (7,732) | |
|
| | | | | | | | | | | | | | | | | | | | | | | |
| Level 1 | | Level 2 | | Level 3 | | Total |
| December 31, 2022 | | | | | | | |
| Non-trading commodity derivative assets | $ | 72 | | | $ | 1,149 | | | $ | — | | | $ | 1,221 | |
| Trading commodity derivative assets | — | | | 1,077 | | | — | | | 1,077 | |
| Total commodity derivative assets | $ | 72 | | | $ | 2,226 | | | $ | — | | | $ | 2,298 | |
| Non-trading commodity derivative liabilities | $ | — | | | $ | (17,617) | | | $ | — | | | $ | (17,617) | |
| Trading commodity derivative liabilities | — | | | (1,230) | | | — | | | (1,230) | |
| Total commodity derivative liabilities | $ | — | | | $ | (18,847) | | | $ | — | | | $ | (18,847) | |
| | | | | | | |
Table of Contents
| | | | | | | | | | | | | | | | | | | | | | | |
| Level 1 | | Level 2 | | Level 3 | | Total |
| December 31, 2019 | | | | | | | |
| Non-trading commodity derivative assets | $ | 0 | | | $ | 401 | | | $ | 0 | | | $ | 401 | |
| Trading commodity derivative assets | 0 | | | 169 | | | 0 | | | 169 | |
| Total commodity derivative assets | $ | 0 | | | $ | 570 | | | $ | 0 | | | $ | 570 | |
| Non-trading commodity derivative liabilities | $ | (1,666) | | | $ | (18,772) | | | $ | 0 | | | $ | (20,438) | |
| Trading commodity derivative liabilities | 0 | | | 0 | | | 0 | | | 0 | |
| Total commodity derivative liabilities | $ | (1,666) | | | $ | (18,772) | | | $ | 0 | | | $ | (20,438) | |
| | | | | | | |
We had no transfers of assets or liabilities between any of the above levels during the years ended December 31, 2020, 20192023, 2022 and 2018.2021.
Our derivative contracts include exchange-traded contracts valued utilizing readily available quoted market prices and non-exchange-traded contractsnon-exchange-traded contracts valued using market price quotations available through brokers or over-the-counter and on-line exchanges. In addition, in determining the fair value of our derivative contracts, we apply a credit risk valuation adjustment to reflect credit risk, which is calculated based on our or the counterparty’s historical credit risks. As of December 31, 20202023 and 2019,2022, the credit risk valuation adjustment was a reduction of derivative liabilities, net of $0.2$0.3 million and $0.2$0.1 million, respectively.
12.11. Stock-Based Compensation
Restricted Stock Units
We maintain a Long-Term Incentive Plan ("LTIP") for employees, consultants and directors of the Company and its affiliates who perform services for the Company. The purpose of the LTIP is to provide a means to attract and retain individuals to serve as directors, employees and consultants who provide services to the Company by affording such individuals a means to acquire and maintain ownership of awards, the value of which is tied to the performance of the Company’s Class A common stock. The LTIP provides for grants of cash payments, stock options, stock appreciation rights, restricted stock or units, bonus stock, dividend equivalents, and other stock-based awards with the total number of shares of stock available for issuance under the LTIP not to exceed 2,750,000 shares.
Restricted stock units granted to our officers, employees, non-employee directors and certain employees of our affiliates who perform services for the Company vest over approximately one year for non-employee directors and ratably over approximately one to four years for officers, employees, and employees of affiliates, with the initial vesting date occurring in May of the subsequent year. Each restricted stock unit is entitled to receive a dividend equivalent when dividends are declared and distributed to shareholders of Class A common stock. These dividend equivalents are retained by the Company, reinvested in additional restricted stock units effective as of the record date of such dividends and vested upon the same schedule as the underlying restricted stock unit.
The Company measures the cost of awards classified as equity awards based on the grant date fair value of the award, and the Company measures the cost of awards classified as liability awards at the fair value of the award at each reporting period. The Company has utilized an estimated 6%10% annual forfeiture rate of restricted stock units in determining the fair value for all awards excluding those issued to executive level recipients and non-employee directors, for which no forfeitures are estimated to occur. The Company has elected to recognize related compensation expense on a straight-line basis over the associated vesting periods.
Although the restricted stock units allow for cash settlement of the awards at the sole discretion of management of the Company, management intends to settle the awards by issuing shares of the Company’s Class A common stock.
Total stock-based compensation expense for the years ended December 31, 2020, 20192023, 2022 and 20182021 was $2.5$2.3 million, $5.5$3.2 million and $5.9$3.4 million. Total income tax benefitexpense/(benefit) related to stock-based compensation recognized in net income (loss) was $0.3$0.2 million, $0.6less than $0.1 million and $0.6less than $(0.1) million for the years ended December 31, 2020, 20192023, 2022 and 2018.
Equity Classified Restricted Stock Units
Restricted stock units issued to employees and officers of the Company are classified as equity awards. The fair value of the equity classified restricted stock units is based on the Company’s Class A common stock price as of the grant date. The Company recognized stock based compensation expense of $2.4$2.3 million, $5.0$3.1 million and $5.3$3.1 million for the years ended December 31, 2020, 20192023, 2022 and 2018,2021, respectively, in general and administrative expense with a corresponding increase to additional paid in capital. The following table summarizes equity classified restricted stock unit activity and unvested restricted stock units for the year ended December 31, 2020:2023:
| | | | | | | | |
| Number of Shares (in thousands) | Weighted Average Grant Date Fair Value |
| | |
| | |
| | |
| | |
| | |
| | |
| | |
| | |
| | |
| | |
| Unvested at December 31, 2019 | 829 | | $9.88 | |
| Granted | 91 | | 6.87 | |
| Dividend reinvestment issuances | 34 | | 8.85 | |
| Vested | (441) | | 6.27 | |
| Forfeited | (208) | | 10.73 | |
| Unvested at December 31, 2020 | 305 | | $9.48 | |
| | | | | | | | |
| Number of Shares (in thousands) | Weighted Average Grant Date Fair Value |
| | |
| | |
| | |
| | |
| | |
| | |
| | |
| | |
| | |
| | |
| Unvested at December 31, 2022 | 114 | | $ | 44.88 | |
| Granted | 81 | | 12.44 | |
| Dividend reinvestment issuances | 4 | | 27.24 | |
| Vested | (60) | | 12.46 | |
| Forfeited | (3) | | 42.82 | |
| Unvested at December 31, 2023 | 136 | | $ | 23.21 | |
For the year ended December 31, 2020, 441,0752023, 59,549 restricted stock units vested, with 284,36537,835 shares of Class A common stock distributed to the holders of these units and 156,71021,714 shares of Class A common stock withheld by the Company to cover taxes owed on the vesting of such units. As of December 31, 2020,2023, there was $1.9$2.3 million of total unrecognized compensation cost related to the Company’s equity classified restricted stock units, which is expected to be recognized over a weighted average period of approximately 2.31.8 years.
Change in Control Restricted Stock Units
In 2018, the Company granted Change in Control Restricted Stock Units ("CIC RSUs") to certain officers that vest upon a "Change in Control", if certain conditions are met. The terms of the CIC RSUs define a "Change in Control" to generally mean:
–the consummation of an agreement to acquire or tender offer for beneficial ownership by any person, of 50% or more of the combined voting power of our outstanding voting securities entitled to vote generally in the election of directors, or by any person of 90% or more of the then total outstanding shares of Class A common stock;
–individuals who constitute the incumbent board cease for any reason to constitute at least a majority of the board;
–consummation of certain reorganizations, mergers or consolidations or a sale or other disposition of all or substantially all of our assets;
–approval by our stockholders of a complete liquidation or dissolution;
–a public offering or series of public offerings by Retailco and its affiliates, as a selling shareholder group, in which their total interest drops below 10 million of our total outstanding voting securities;
–a disposition by Retailco and its affiliates in which their total interest drops below 10 million of our total outstanding voting securities; or
–any other business combination, liquidation event of Retailco and its affiliates or restructuring of us which the Compensation Committee deems in its discretion to achieve the principles of a Change in Control.
The equity classified restricted stock unit table above excludes unvested CIC RSUs as the conditions for Change in Control have not been met. The Company has not recognized stock compensation expense related to the CIC RSUs as the Change in Control conditions have not been met.
Liability Classified Restricted Stock Units
Restricted stock units issued to non-employee directors of the Company and employees of certain of our affiliates are classified as liability awards as the awards are either to a) non-employee directors that allow for the recipient to choose net settlement for the amount of withholding taxes dues upon vesting or b) to employees of certain affiliates of the Company and are therefore not deemed to be employees of the Company. The fair value of the liability classified restricted stock units is based on the Company’s Class A common stock price as of the reported period ending date. The Company recognized stock based compensation expense of less than $0.1 million, $0.5$0.1 million and $0.6$0.3 million for years ended December 31, 2020, 20192023, 2022 and 2018,2021, respectively, in general and administrative expense with a corresponding increase to liabilities. As of December 31, 20202023 and 2019,2022 , the Company’s liabilities related to these restricted stock units recorded in current liabilities was less than $0.1 million and $0.2 million, respectively. The following table summarizes liability classified restricted stock unit activity and unvested restricted stock units for the year ended December 31, 2020:2023:
| | Number of Shares (in thousands) | | | Number of Shares (in thousands) | Weighted Average Reporting Date Fair Value |
| | | Number of Shares (in thousands) | Weighted Average Reporting Date Fair Value |
| | Unvested at December 31, 2022 | |
| | Unvested at December 31, 2019 | 28 | | $9.23 | |
| | Unvested at December 31, 2022 | |
| | Unvested at December 31, 2022 | |
| Granted | Granted | 36 | | 9.57 | |
| Dividend reinvestment issuances | Dividend reinvestment issuances | 2 | | 9.57 | |
| Vested | Vested | (29) | | 6.77 | |
| Forfeited | Forfeited | 0 | | 0 | |
| Unvested at December 31, 2020 | 37 | | $9.57 | |
| Unvested at December 31, 2023 | |
For the year ended December 31, 2020, 28,7362023, 8,890 restricted stock units vested, with 8,5148,631 shares of Class A common stock distributed to the holders of these units and 20,222259 shares of Class A common stock withheld by the Company to cover taxes owed on the vesting of such units. As of December 31, 2020,2023, there was $0.2$0.1 million of total unrecognized compensation cost related to the Company’s liability classified restricted stock units, which is expected to be recognized over a weighted average period of approximately 1.21.6 years.
13.
12. Income Taxes
We and our subsidiaries, CenStar and Verde Energy USA, Inc. ("Verde Corp") are each subject to U.S. federal income tax as corporations. CenStar and Verde Corp file consolidated tax returns in jurisdictions that allow combined reporting. Spark HoldCo and its subsidiaries, with the exception of CenStar and Verde Corp, are treated as flow-through entities for U.S. federal income tax purposes, and, as such, are generally not subject to U.S. federal income tax at the entity level. Rather, the tax liability with respect to their taxable income is passed through to their members or partners. Accordingly, we are subject to U.S. federal income taxation on our allocable share of Spark HoldCo's net U.S. taxable income.
In our financial statements, we report federal and state income taxes for our share of the partnership income attributable to our ownership in Spark HoldCo and for the income taxes attributable to CenStar and Verde Corp. Net income attributable to non-controlling interest includes the provision for income taxes related to CenStar and Verde Corp.
We account for income taxes using the asset and liability method. Deferred tax assets and liabilities are recognized for future tax consequences attributable to differences between the financial statement carrying amounts of existing assets and liabilities and the tax bases of the assets and liabilities. We apply existing tax law and the tax rate that we expect to apply to taxable income in the years in which those differences are expected to be recovered or settled in calculating the deferred tax assets and liabilities. Effects of changes in tax rates on deferred tax assets and liabilities are recognized in income in the period of the tax rate enactment. A valuation allowance is recorded when it is not more likely than not that some or all of the benefit from the deferred tax asset will be realized.
The provision for income taxes for the years ended December 31, 2020, 2019,2023, 2022, and 20182021 included the following components:
| | (in thousands) | (in thousands) | | 2020 | | 2019 | | 2018 | (in thousands) | | 2023 | | 2022 | | 2021 |
| Current: | Current: | | | |
| Federal | |
| Federal | |
| Federal | Federal | | $ | 10,722 | | | $ | 10,511 | | | $ | 3,862 | |
| State | State | | 3,109 | | | 3,675 | | | 1,099 | |
| Total Current | Total Current | | 13,831 | | | 14,186 | | | 4,961 | |
| | | | |
| Deferred: | Deferred: | | |
| Deferred: | |
| Deferred: | |
| Federal | |
| Federal | |
| Federal | Federal | | 1,778 | | | (4,668) | | | (2,792) | |
| State | State | | 127 | | | (2,261) | | | (92) | |
| Total Deferred | Total Deferred | | 1,905 | | | (6,929) | | | (2,884) | |
| Provision for income taxes | Provision for income taxes | | $ | 15,736 | | | $ | 7,257 | | | $ | 2,077 | |
The effective income tax rate was 19%30%, 34%37%, and (17)(3,582)% for the years ended December 31, 2020, 2019,2023, 2022, and 2018,2021, respectively. The following table reconciles the income tax benefit that would result from application of the statutory federal tax rate, 21%, 21%, and 21% for the years ended December 31, 2020, 2019,2023, 2022, and 20182021 respectively, to the amount included in the consolidated statement of operations:
| | (in thousands) | (in thousands) | 2020 | | 2019 | | 2018 | (in thousands) | 2023 | | 2022 | | 2021 |
| Expected provision at federal statutory rate | Expected provision at federal statutory rate | $ | 17,630 | | | $ | 4,509 | | | $ | (2,586) | |
| (Decrease) increase resulting from: | |
| Increase (decrease) resulting from: | |
| Non-controlling interest | Non-controlling interest | (6,464) | | | (1,329) | | | 1,738 | |
| Class A Preferred Stock dividends | 1,304 | | | 1,341 | | | 1,579 | |
| Non-controlling interest | |
| Non-controlling interest | |
| Preferred Stock dividends | |
| | Intra-entity transfer of customer contracts | 0 | | | 0 | | | 473 | |
| | State income taxes, net of federal income tax effect | |
| | State income taxes, net of federal income tax effect | |
| | State income taxes, net of federal income tax effect | State income taxes, net of federal income tax effect | 4,145 | | | 1,382 | | | 428 | |
| Prior year tax adjustments | Prior year tax adjustments | (993) | | | 1,060 | | | (31) | |
| Non-deductible expenses | 195 | | | 256 | | | 256 | |
| Outside Tax basis Adjustment | |
| Penalties | |
| Stock conversion | |
| Rate differential on loss carryback | |
| Other | Other | (81) | | | 38 | | | 220 | |
| Provision for income taxes | Provision for income taxes | $ | 15,736 | | | $ | 7,257 | | | $ | 2,077 | |
Total income tax expense for the years ended December 31, 2020, 20192023, 2022 and 20182021 differed from amounts computed by applying the U.S. federal statutory tax rates to pre-tax income primarily due to state income taxes and the impact of permanent differences between book and taxable income, most notably the income attributable to non-controlling interest, which gets taxed at the non-controlling interest partner level. In addition, in 2021 the Company recognized an effective tax rate benefit from the carry-back of a net operating loss due to higher statutory rate in the carry-back years.
The components of our deferred tax assets as of December 31, 20202023 and 20192022 are as follows:
| | | | | | | | |
| (in thousands) | 2020 | 2019 |
| Deferred Tax Assets: | | |
| Investment in Spark HoldCo | $ | 25,751 | | $ | 28,671 | |
| | |
| | |
| State net operating loss carryforward | 0 | | 140 | |
| Derivative Liabilities | 416 | | 1,669 | |
| Intangibles | 1,393 | | 0 | |
| Other | 531 | | 220 | |
| Total deferred tax assets | 28,091 | | 30,700 | |
| | |
| Deferred Tax Liabilities: | | |
| | |
| Intangibles | 0 | | (808) | |
| Property and equipment | 0 | | (27) | |
| | |
| | |
| Other | (131) | | 0 | |
| Total deferred tax liabilities | (131) | | (835) | |
| | |
| Total deferred tax assets/liabilities | $ | 27,960 | | $ | 29,865 | |
Table of Contents
| | | | | | | | |
| (in thousands) | 2023 | 2022 |
| Deferred Tax Assets: | | |
| Investment in Spark HoldCo | $ | 12,241 | | $ | 16,931 | |
| | |
| | |
| | |
| Derivative Liabilities | 405 | | 333 | |
| Fixed Assets and Intangibles | 2,047 | | 2,919 | |
| Other | 685 | | 552 | |
| Total deferred tax assets | $ | 15,378 | | $ | 20,735 | |
| | |
| Deferred Tax Liabilities: | | |
| | |
| | |
| | |
| | |
| | |
| | |
| Other | (96) | | (298) | |
| Total deferred tax liabilities | $ | (96) | | $ | (298) | |
| | |
| Total deferred tax assets/liabilities | $ | 15,282 | | $ | 20,437 | |
We periodically assess whether it is more likely than not that we will generate sufficient taxable income to realize our deferred income tax assets. In making this determination, we consider all available positive and negative evidence and makes certain assumptions. We consider, among other things, our deferred tax liabilities, the overall business environment, our historical earnings and losses, current industry trends, and our outlook for future years. We believe it is more likely than not that our deferred tax assets will be utilized, and accordingly have not recorded a valuation allowance on these assets.
The tax years 20132017 through 20172022 remain open to examination by the major taxing jurisdictions to which the Company is subject to income tax. An affiliate owned by our Founder would be responsible for any audit adjustments incurred in connection with transactions occurring prior to July 2014 for Spark Energy, Inc. and Spark HoldCo.
Accounting for uncertainty in income taxes prescribes a recognition threshold and measurement methodology for the financial statement recognition and measurement of a tax position taken or expected to be taken in a tax return. As of December 31, 20202023 and 20192022 there was 0no liability, and for the years ended December 31, 2020, 20192023, 2022 and 2018,2021, there was 0no expense recorded for interest and penalties associated with uncertain tax positions or unrecognized tax positions. Additionally, the Company does 0tnot have unrecognized tax benefits as of December 31, 20202023 and 2019.2022.
14.13. Commitments and Contingencies
From time to time, we may be involved in legal, tax, regulatory and other proceedings in the ordinary course of business. Liabilities for loss contingencies arising from claims, assessments, litigation or other sources are recorded when it is probable that a liability has been incurred and the amount can be reasonably estimated.
Legal Proceedings
Below is a summary of our currently pending material legal proceedings. We are subject to lawsuits and claims arising in the ordinary course of our business. The following legal proceedings are in various stages and are subject to substantial uncertainties concerning the outcome of material factual and legal issues. Accordingly, unless otherwise specifically noted, we cannot currently predict the manner and timing of the resolutions of these legal proceedings or estimate a range of possible losses or a minimum loss that could result from an adverse verdict in a potential lawsuit. While the lawsuits and claims are asserted for amounts that may be material should an unfavorable outcome occur, management does not currently expect that any currently pending matters will have a material adverse effect on our financial position or results of operations.
Consumer Lawsuits
Similar to other energy service companies (“ESCOs”) operating in the industry, from time-to-time, the Company is subject to class action lawsuits in various jurisdictions where the Company sells natural gas and electricity.
Variable Rate Cases
In the cases referred to as Variable Rate Cases, such actions involve consumers alleging they paid higher rates than they would have if they stayed with their default utility. The underlying claims of each case are similar; however, because numerous cases have been brought in several different jurisdictions, the varying applicable case law, the varying facts and stages of each case, the Company agreed to mediate in two aggregated mediations to avoid duplicative defense costs in numerous jurisdictions. The Company continues to deny the allegations asserted by Plaintiffs and intends to vigorously defend these matters.
In August 2020, the Company participated in mediation which covered three Spark brand matters: (1) Janet Rolland et al v. Spark Energy, LLC (D.N.J. Apr. 2017); (2) Burger v. Spark Energy Gas, LLC (N.D. Ill. Dec. 2019); and (3)
Local 901 v. Spark Energy, LLC (Sup .Ct. Allen County, Indiana Aug. 2019). The Company is working with the mediator to find a mediated resolution to these cases, but is simultaneously continuing to defend the cases in the respective courts, which includes the case Panzer v. Verde Energy, USA Inc. and Oasis Power, LLC (E.D. Pa Aug. 2019) brought by the same plaintiffs’ counsel participating in mediation. Given the ongoing mediation, discovery and current stage of these matters, we cannot predict the outcome of these cases at this time.
In December of 2020, the Company participated in mediation which covered five Verde brand matters: (1) Marshall v. Verde Energy USA, Inc. (D.N.J. Jan. 2018); (2) Mercado v. Verde Energy USA, Inc. (N.D. Ill. Mar. 2018); (3) Davis v. Verde Energy USA, Inc., et al. (D. Mass. Apr. 2019); (4) LaQua v. Verde Energy USA New York, LLC (E.D.N.Y. Jan. 2020); and (5) Abbate v. Verde Energy USA Ohio, LLC (S.D. Ohio Jun. 2020). The parties continue to work on a mediation resolution and the litigation has been stayed in these matters. Given the ongoing mediation, discovery and current stage of these matters, we cannot predict the outcome of these cases at this time.
On January 14, 2021,Glikin, et al. v. Major Energy Electric Services, LLC, a purported variable rate class action was filed by a Maryland customer in the United States District Court, Southern District of New York,Glikin, et. all v. Major Energy Electric Services, LLC, attempting to represent a class of all Major Energy customers (including customers of companies Major Energy acts as a successor to) in the United States charged a variable rate for electricity or gas by Major Energy during the applicable statute of limitations period up to and including the date of judgment. The Company believes there is no merit tomoved this case to the United States District Court for the District of Maryland (Case No. 1:21-cv-03251-MJM) and plansin December 2023 filed a motion to dismiss the lawsuit. The Company is vigorously defenddefending this matter; however, given the current early stage of this matter, we cannot predict the outcome of this case at this time.
Corporate Matter Lawsuits
Saul Horowitz, as Sellers’ Representative for the former owners of the Major Energy CompaniesFoote v. National Gas & Electric,Electricity N.H., LLC ("NG&E"(“ENH”), a purported Telephone Consumer Protection Act (the “TCPA”) and Spark Energy, Inc., is a lawsuitclass action was filed on October 17, 2017 in the United States District Court for the Southern District of New York assertingHampshire. Plaintiff claims that calls made to her violated the TCPA. Plaintiff purports to assert claims on her own behalf and a putative class of fraudulent inducement against NG&E, breach of contract against NG&E and Spark, and tortious interference with contract against Spark relatedindividuals to whom calls using a membership interest purchase agreement, subsequent dropdown, and associated earnout agreements with the Major Energy Companies' former owners. The relief sought includes unspecified compensatory and punitive damages, prejudgment and post-judgment interest, and attorneys’ fees. This case went to trialprerecorded or artificial voice message regarding ENH’s services were placed during the first two weeksperiod of March 2020September 1, 2019 through September 1, 2023. ENH only operates in New Hampshire and all material has been submittedno other states. The Company denies Plaintiff’s allegations and intends to the Judge for his decision. Given the trial was in Manhattan, New York, which was previously under a shelter-in-place order and is currently re-opening in phases, we are not able to predict when we receive a final decision on this matter. Spark and NG&E deny the allegations asserted by Plaintiffs and have vigorously defended this matter; however, we cannot predict the outcome or consequences of this case at this time. In addition, several smaller, related cases involving the same facts are pending in the United States District Court for the Southern District of New York regarding the Major Energy escrowed indemnification monies and three Major Energy executive compensation agreements. defend against her claims.
In addition to the matters disclosed above, theCorporate Matter Lawsuits
The Company may from time to time be subject to legal proceedings that arise in the ordinary course of business. Although there can be no assurance in this regard, the Company does not expect any of those legal proceedings to have a material adverse effect on the Company’s results of operations, cash flows or financial condition.
Regulatory Matters
Many state regulators have increased scrutiny on retail energy providers, across all industry providers. We are subject to regular regulatory inquiries, license renewal reviews, and preliminary investigations in the ordinary course of our business. Below is a summary of our currently pending material state regulatory matters. The following state regulatory matters are in various stages and are subject to substantial uncertainties concerning the outcome of material factual and legal issues. Accordingly, we cannot currently predict the manner and timing of the resolution of these state regulatory matters or estimate a range of possible losses or a minimum loss that could result from an adverse action. Management does not currently expect that any currently pending state regulatory matters will have a material adverse effect on our financial position or results of operations.
Maine. On February 9, 2023, Maine Commission’s Consumer Assistance and Safety Division (“Advocacy Staff”) filed a Request for Formal Investigation requesting that the Maine Commission open a formal, enforcement investigation to review whether Company’s subsidiary, Electricity Maine, LLC (EME), is in compliance with the Maine Commission’s Rules. During a special deliberative session, the same day, the Maine Commission announced it would proceed with a formal investigation of EME, which was noticed in a Notice of Enforcement Investigation issued February 10, 2023 (Docket No. 2023-00024). The Company met with Advocacy Staff over the course of several months to address concerns. As a result, the Company and the Advocacy Staff have agreed to a settlement in principle pursuant to which customers would receive certain limited refunds on their energy bill. This settlement is pending, and the Maine Commission is required to approve the settlement. The Company is working with the Commission and believes this matter will not have a material impact on the Company.
Illinois. On July 26, 2023, Spark Energy, LLC received a demand letter from a law firm representing the Office of the Illinois Attorney General alleging that Spark Energy, LLC’s marketing and sales practices may have not been in compliance with Illinois law. The letter offered, in the interest of efficiency and minimizing litigation costs, a settlement demand to resolve the matter. The Company is voluntarily working with the firm, however, if settlement is unsuccessful, the Attorney General could commence a lawsuit in Illinois against Spark Energy, LLC.
Connecticut. The Company worked with the Connecticut Public Utilities Regulatory Authority (“PURA”) regarding compliance with requirements implemented in 2016 that customer bills include any changes to existing rates effective for the next billing cycle. PURA approved all of Company’s proposed settlements for all operating brands in Connecticut and refunds have been issued to all Connecticut customers. In addition, PURA is reviewing two of the Company’s brands in Connecticut, Spark and Verde, focusing on marketing, billing and enrollment practices. The Company is cooperating with PURA’s reviews of Spark and Verde.
Illinois. Spark Energy, LLC received a verbal inquiry from the Illinois Commerce Commission (“ICC”) and the Illinois Attorney General (“IAG”) on January 1, 2020 seeking to understand an increase in complaints from Illinois consumers. The Company met with the ICC and the IAG in February 2020 and plan to discuss a compliance plan to ensure its sales are in compliance with Illinois regulations. The parties also discussed possible restitution payments to any customers impacted by sales not in compliance with Illinois regulations.
Maine. In early 2018, Staff of the Maine Public Utilities Commission (“Maine PUC”) issued letters to Electricity Maine seeking information about customer complaints principally associated with historical door-to-door (“D2D”) sales practices. In late July 2018, the Maine PUC issued an Order to Show Cause and Electricity Maine responded in mid-August 2018. The Commission scheduled a procedural conference in early 2019 that resulted in no intervenors other than participation as a party by the Maine Office of Public Advocate. At the conference, the parties agreed on a procedural schedule, including a one-day evidentiary hearing. Following post-hearing discovery, Initial and Reply Briefs were filed on August 30, 2019 and September 10, 2019, respectively. The Maine PUC hearing examiner released its report in April 2020 alleging failures of compliance related to enrollment and marketing practices by Electricity Maine. The Company has been cooperatively working with the Maine Office of Public Advocate and the staff of the Maine PUC. The Company proposed a resolution of this matter which was presented to the Maine PUC for approval. In December 2020, the Maine PUC did not approve the settlement; however, the Company worked cooperatively with the Maine Office of Public Advocate and the staff of the Maine PUC on a revised settlement which was approved by the Maine PUC in February 2021.
New York.
New York Attorney General. Prior to the purchase of Major Energy by the Company, in 2015, Major Energy Services, LLC and Major Energy Electric Services were contacted by the Attorney General, Bureau of Consumer Frauds & Protection for State of New York relating to their marketing practices. Major Energy has exchanged information in response to various requests from the Attorney General and recently agreed to respond to additional questions via remote proceedings in October of 2020. The parties are in settlement negotiations at this time. While investigations of this nature may be resolved in a manner that allows the retail energy supplier to continue operating in New York with stipulations, there can be no assurances that the New York Attorney General will not take more severe action. Prior to the purchase of Major Energy by the Company, in 2015, Major Energy Services, LLC and Major Energy Electric Services were contacted by the Attorney General, Bureau of Consumer Frauds & Protection for State of New York relating to their marketing practices. Major Energy has exchanged information in response to various requests from the Attorney General. The Parties are in settlement negotiations at this time. While investigations of this nature may be resolved in a manner that allows the retail energy supplier to continue operating in New York with stipulations, there can be no assurances that the New York Attorney General will not take more severe action.
Ohio. Verde Energy USA Ohio, LLC (“Verde Ohio”) was the subject of a formal investigation by the Public Utilities Commission of Ohio (“PUCO”) initiated on April 16, 2019. The investigation asserted that Verde Ohio may have violated Ohio’s retail energy supplier regulations. Verde Ohio voluntary suspended door-to-door marketing in Ohio in furtherance of settlement negotiations with the PUCO Staff. On September 6, 2019, Verde Ohio and PUCO Staff executed and filed with PUCO a Joint Stipulation and Recommendation for PUCO’s review and approval, which sets forth agreed settlement terms, which included approximately $1.9 million in refunds to customers and a penalty of $0.7 million. The settlement was approved by PUCO on February 26, 2020, and the Joint Stipulation and Recommendation resolves all of the issues raised in the investigation. The Company has provided all refunds to customers and received final approval of its license recertifications in December 2020.
Pennsylvania. Verde Energy USA, Inc. (“Verde”) is the subject of a formal investigation by the Pennsylvania Public Utility Commission, Bureau of Investigation and Enforcement (“PPUC”) initiated on January 30, 2020. The investigation asserts that Verde may have violated Pennsylvania retail energy supplier regulations. The Company met with the PPUC in February 2020 to discuss the matter and to work with the PPUC cooperatively. Verde reached a settlement, which includes a civil penalty of $1.0 million and a $0.1 million contribution to the PPL hardship fund. On June 30, 2020, Verde and PPUC Bureau of Investigation and Enforcement filed a Joint Petition for Approval of Settlement and Statements in Support of that Joint Petition with the Commission. Verde is currently awaiting final approval of this settlement.
In addition to the matters disclosed above, in the ordinary course of business, the Company may from time to time be subject to regulators initiating informal reviews or issuing subpoenas for information as means to evaluate the Company and its subsidiaries’ compliance with applicable laws, rule,rules, regulations and practices. Although there can be no assurance in this regard, the Company does not expect any of those regulatory reviews to have a material adverse effect on the Company’s results of operations, cash flows or financial condition.
Indirect Tax Audits
We are undergoing various types of indirect tax audits spanning from years 20142020 to 20202023 for which additional liabilities may arise. At the time of filing these consolidated financial statements, these indirect tax audits are at an early stage and subject to substantial uncertainties concerning the outcome of audit findings and corresponding responses.
As of December 31, 20202023 and December 31, 20192022 we had accrued $26.6$6.3 million and $29.2$3.7 million, respectively, related to litigation and regulatory matters and $1.2$0.7 million and $1.8$0.2 million, respectively, related to indirect tax audits. The accrual for litigation and regulatory matters, and indirect tax audit is recorded in accrued liabilities on the balance sheet. The outcome of each of these may result in additional expense.
15.14. Transactions with Affiliates
Transactions with Affiliates
We enter into transactions with and pay certain costs on behalf of affiliates that are commonly controlled in order to reduce risk, reduce administrative expense, create economies of scale, create strategic alliances and supply goods and services to these related parties. We also sell and purchase natural gas and electricity with affiliates. We present receivables and payables with the same affiliate on a net basis in the consolidated balance sheets as all affiliate activity is with parties under common control. Affiliated transactions include certain services to the affiliated companies associated with employee benefits provided through our benefit plans, insurance plans, leased office space, administrative salaries, due diligence work, recurring management consulting, and accounting, tax, legal, or technology services. Amounts billed are based on the services provided, departmental usage, or headcount, which are considered reasonable by management. As such, the accompanying consolidated financial statements include costs that have been incurred by us and then directly billed or allocated to affiliates, as well as costs that have been incurred by our affiliates and then directly billed or allocated to us, and are recorded net in general and administrative expense on the consolidated statements of operations with a corresponding accounts receivable—affiliates or accounts payable—affiliates, respectively, recorded in the consolidated balance sheets. Transactions with affiliates for sales or purchases of natural gas and electricity, are recorded in retail revenues, retail cost of revenues, and net asset optimization revenues in the consolidated statements of operations with a corresponding accounts receivable—affiliate or accounts payable—affiliate recorded in the consolidated balance sheets.
Master Service AgreementThe following tables presents asset and liability balances with Retailco Services, LLCaffiliates (in thousands):
Prior to April 1, 2018, we were a party to a Master Service Agreement with an affiliated company owned by our Founder. The Master Service Agreement provided us with operational support services such as: enrollment and renewal transaction services; customer billing and transaction services; electronic payment processing services; customer service, and information technology infrastructure and application support services. Effective April 1, 2018, we terminated the agreement, and these operational support services were transferred back to us. See "Cost
| | | | | | | | | | | |
| December 31, 2023 | | December 31, 2022 |
| | | |
| | | |
| | | |
| | | |
| | | |
| | | |
| | | |
| | | |
| Assets | | | |
| Accounts Receivable - affiliates | $ | 4,683 | | | $ | 6,455 | |
| Total Assets - affiliates | $ | 4,683 | | | $ | 6,455 | |
| | | | | | | | | | | |
| December 31, 2023 | | December 31, 2022 |
| | | |
| | | |
| | | |
| | | |
| | | |
| | | |
| | | |
| | | |
| Liabilities | | | |
| Accounts Payable - affiliates | $ | 472 | | | $ | 265 | |
Subordinated Debt - affiliates (1) | — | | | 20,000 | |
| Total Liabilities - affiliates | $ | 472 | | | $ | 20,265 | |
Allocations" below for further discussion(1) The Subordinated Debt Facility allows us to draw advances in increments of no less than $1.0 million per advance up to the maximum principal amount of the fees paidSubordinated Debt Facility, subject to Retailco’s discretion. Advances thereunder accrue interest at an annual rate equal to the prime rate as published by the Wall Street Journal plus two percent (2.0%) from the date of the advance. See Note 9 "Debt" for a further description of terms and conditions of the Subordinated Debt Facility.
The following table presents revenues and cost of revenues recorded in net asset optimization revenue associated with affiliates duringfor the periods indicated (in thousands):
| | | | | | | | | | | | | | | | | |
| December 31, 2023 | | December 31, 2022 | | December 31, 2021 |
| | | | | |
| | | | | |
| | | | | |
| | | | | |
| | | | | |
| | | | | |
| | | | | |
| | | | | |
| Revenue NAO - affiliates | $ | 3,262 | | | $ | 4,122 | | | $ | 1,566 | |
| Less: Cost of Revenue NAO - affiliates | 334 | | | 536 | | | 5 | |
| | | | | |
| Net NAO - affiliates | $ | 2,928 | | | $ | 3,586 | | | $ | 1,561 | |
The Company's retail cost of revenue include gains/losses related to derivative instruments transactions with affiliates. For the years ended December 31, 2020, 2019,2023, 2022 and 2018 respectively.2021, respectively, we recognized gain of $0.3 million, zero and zero in retail cost of revenue related to derivative instruments settlements.
Cost Allocations
Where costs incurred on behalf of the affiliate or us cannot be determined by specific identification for direct billing, the costs are allocated to the affiliated entities or us based on estimates of percentage of departmental usage, wages or headcount. The total net amount direct billed and allocated (to)/fromto/(from) affiliates was $(1.5)was $1.5 million, $(0.7)$2.7 million and $10.3$(0.5) million for the years ended December 31, 2020, 20192023, 2022 and 2018,2021, respectively.
Of the amounts directly billed and allocated from affiliates, we recorded general and administrative expense The Company would have incurred incremental costs of $0.2$1.5 million, for the year ended December 31, 2020 related to telemarketing activities performed by an affiliate and $5.9$1.6 million, for the year ended December 31, 2018 related to fees paid under the Master Service Agreement. Additionally, under the Master Service Agreement, we capitalized $0.5$1.3 million of property and equipment for the application, development and implementation of various systems during the year ended December 31, 2018.
Accounts Receivable and Payable—Affiliates
As of December 31, 2020 and 2019, we had current accounts receivable—affiliates of $5.1 million and $2.0 million, respectively, and current accounts payable—affiliates of $0.8 million and $1.0 million, respectively.
Revenues and Cost of Revenues—Affiliates
Revenues recorded in net asset optimization revenues in the consolidated statements of operations for the years ended December 31, 2020, 20192023, 2022 and 2018 related to affiliated sales were $1.0 million, $2.4 million, and $2.4 million,2021, respectively, and cost of revenues recorded in net asset optimization revenues in the consolidated statements of operations for the years ended December 31, 2020, 2019 and 2018 related to affiliated purchases were $0.2 million, $0.1 million and $0.1 million, respectively. These amounts are presented as netoperating on the Consolidated Statements of Operations.
Acquisitions from Related Parties
In March 2018, we entered into an asset purchase agreement with an affiliate to acquire up to 50,000 RCEs for a cash purchase price of $250 for each RCE, or up to $12.5 million in the aggregate. A total of $8.8 million was paid in 2018 under the terms of the purchase agreement for approximately 35,000 RCEs. The acquisition was treated as a transfer of assets between entities under common control, and accordingly, the assets were recorded at their historical value at the date of transfer. The transaction resulted in less than $0.1 million and $7.1 million recorded in equity as a net distribution to affiliate as of December 31, 2019 and 2018, respectively.stand-alone basis.
Distributions to and Contributions from Affiliates
During the years ended December 31, 2020, 20192023, 2022 and 2018,2021, we made distributions to affiliates of our FounderMr. Maxwell of $15.1$3.6 million, $15.1$14.5 million and $15.5$14.8 million, respectively, for payments of quarterly distributions on their respective Spark HoldCo units. During the years ended December 31, 2020, 20192023, 2022 and 2018,2021, we also made distributions to these affiliates for gross-up distributions of $14.4$0.7 million, $19.7$0.1 million, and $16.5$2.6 million, respectively, in connection with distributions made between Spark HoldCo and Spark Energy,Via Renewables, Inc. for payment of income taxes incurred by us.
Proceeds from Disgorgement of Stockholder Short-swing Profits
During the years ended December 31, 2020, 2019 and 2018, we recorded 0, $0.1 million, and zero, respectively, for the disgorgement of stockholder short-swing profits under Section 16(b) under the Exchange Act. The amount was recorded as an increase to additional paid-in capital in our consolidated balance sheet as of December 31, 2020, 2019 and 2018.
Subordinated Debt Facility
In June 2019, weThe Company maintains an Amended and Spark HoldCo entered into aRestated Subordinated Debt Facility with an affiliate owned by our Founder, which allowsPromissory Note in the Company to borrowprincipal amount of up to $25.0 million.million (the “Subordinated Debt Facility”), by and among the Company, Spark HoldCo and Retailco. The Subordinated Debt Facility allows usthe Company to draw advances in increments of no less than $1.0 million per advance up to $25.0 million through January 31, 2026. Borrowings are at the maximum principal amountdiscretion of the Subordinated Debt Facility.Retailco. Advances thereunder accrue interest at 5% per annuman annual rate equal to the prime rate as published by the Wall Street Journal plus two percent (2.0%) from the date of the advance.
As of December 31, 20202023 and 2019,2022, there was 0, respectively, inwere zero and $20.0 million outstanding borrowings under the Subordinated Debt Facility. See Note 109 "Debt" for a further description of terms and conditions of the Subordinated Debt Facility.
Tax Receivable Agreement
Prior to July 11, 2019, we were party to a tax receivable agreement ("TRA") with affiliates. Effective July 11, 2019, the Company entered into a TRA Termination and Release Agreement (the “Release Agreement”), which provided for a full and complete termination of any further payment, reimbursement or performance obligation of the Company, Retailco and NuDevco Retail under the TRA, whether past, accrued or yet to arise. Pursuant to the Release Agreement, the Company made a cash payment of approximately $11.2 million on July 15, 2019 to Retailco and NuDevco Retail. In connection with the termination of the TRA, Spark HoldCo made a distribution of approximately $16.3 million on July 15, 2019 to Retailco and NuDevco Retail under the Spark HoldCo Third Amended and Restated Limited Liability Company Agreement, as amended.
The TRA generally provided for the payment by us to affiliates of 85% of the net cash savings, if any, in U.S. federal, state and local income tax or franchise tax that we realized or would realize (or were deemed to realize in certain circumstances) in future periods as a result of (i) any tax basis increases resulting from the initial purchase by us of Spark HoldCo units from entities owned by our Founder, (ii) any tax basis increases resulting from the exchange of Spark HoldCo units for shares of Class A common stock pursuant to the Exchange Right (or resulting from an exchange of Spark HoldCo units for cash pursuant to the Cash Option) and (iii) any imputed interest deemed to be paid by us as a result of, and additional tax basis arising from, any payments we made under the TRA. We retained the benefit of the remaining 15% of these tax savings.
For the four-quarter periods ending September 30, 2016, 2017, and 2018, we met the threshold coverage ratio required to fund the payments required under the TRA. Our affiliates, however, granted us the right to defer the TRA payment related to the four-quarter period ending September 30, 2016 until May 2018. In April, May, and December of 2018, we paid a total of $6.2 million related to our obligations under the TRA for the 2015, 2016, and 2017 tax years.
16.
15. Segment Reporting
Our determination of reportable business segments considers the strategic operating units under which we make financial decisions, allocate resources and assess performance of our business. Our reportable business segments are retail electricity and retail natural gas. The retail electricity segment consists of electricity sales and transmission to residential and commercial customers. The retail natural gas segment consists of natural gas sales to, and natural gas transportation and distribution for, residential and commercial customers. Corporate and other consists of expenses and assets of the retail electricity and natural gas segments that are managed at a consolidated level such as general and administrative expenses. Asset optimization activities and wireless services are also included in Corporate and other.
For the years ended December 31, 2020, 20192023, 2022 and 2018,2021, we recorded asset optimization revenues of $24.8$24.6 million, $62.8$86.7 million and $113.7$57.0 million and asset optimization cost of revenues of $25.5$31.9 million, $60.0$89.0 million and $109.2$61.2 million, respectively, which are presented on a net basis in asset optimization revenues.
We use retail gross margin to assess the performance of our operating segments. RetailWe define retail gross margin is defined as operating income (loss) plus (i) depreciation and amortization expenses and (ii) general and administrative expenses,gross profit less (i) net asset optimization (expenses) revenues, (expenses), (ii) net (losses) gains (losses) on non-trading derivative
instruments, and (iii) net current period cash settlements on non-trading derivative instruments. instruments, and (iv) gains (losses) from non-recurring events (including non-recurring market volatility).
We deduct net gains (losses) on non-trading derivative instruments, excluding current period cash settlements, from the retail gross margin calculation in order to remove the non-cash impact of net gains and losses on these derivative instruments. We deduct net gains (losses) from non-recurring events (including non-recurring market volatility) to ensure retail gross margin reflects operating performance that is not distorted by non-recurring events or extreme market volatility. Retail gross margin should not be considered an alternative to, or more meaningful than, operating income (loss), as determined in accordance with GAAP.
Below is a reconciliation of retail gross margin to income (loss) before income tax expensegross profit (in thousands):
| | | | | | | | | | | | | | | | | | | | |
| | Years Ended December 31, |
| (in thousands) | | 2020 | | 2019 | | 2018 |
| Reconciliation of Retail Gross Margin to Income (loss) before taxes | | | | | | |
| Income (loss) before income tax expense | | $ | 83,954 | | | $ | 21,470 | | | $ | (12,315) | |
| | | | | | |
| Gain on disposal of eRex | | 0 | | | (4,862) | | | 0 | |
| Total other income/(expense) | | (423) | | | (1,250) | | | (749) | |
| Interest expense | | 5,266 | | | 8,621 | | | 9,410 | |
| Operating income (loss) | | 88,797 | | | 23,979 | | | (3,654) | |
| Depreciation and amortization | | 30,767 | | | 40,987 | | | 52,658 | |
| General and administrative | | 90,734 | | | 133,534 | | | 111,431 | |
| Less: | | | | | | |
| Net asset optimization (expense) revenue | | (657) | | | 2,771 | | | 4,511 | |
| Net, losses on non-trading derivative instruments | | (23,439) | | | (67,955) | | | (19,571) | |
| Net, cash settlements on non-trading derivative instruments | | 37,921 | | | 42,944 | | | (9,614) | |
| Retail Gross Margin | | $ | 196,473 | | | $ | 220,740 | | | $ | 185,109 | |
| | | | | | | | | | | | | | | | | | | | | | | | |
| | Years Ended December 31, | | | | |
| (in thousands) | | 2023 | | 2022 | | 2021 | | | | |
| Reconciliation of Retail Gross Margin to Gross Profit | | | | | | | | | | |
| Total Revenues | | $ | 435,192 | | | $ | 460,493 | | | $ | 393,485 | | | | | |
| | | | | | | | | | |
| Less: | | | | | | | | | | |
| Retail cost of revenues | | 310,744 | | | 357,096 | | | 323,219 | | | | | |
| Gross Profit | | 124,448 | | | 103,397 | | | 70,266 | | | | | |
| Less: | | | | | | | | | | |
| Net asset optimization expense | | (7,326) | | | (2,322) | | | (4,243) | | | | | |
| Net, (loss) gain on non-trading derivative instruments | | (70,304) | | | 17,305 | | | 22,130 | | | | | |
| Net, cash settlements on non-trading derivative instruments | | 65,428 | | | (35,966) | | | (15,752) | | | | | |
| Non-recurring event - winter storm Uri | | — | | | 9,565 | | | (64,403) | | | | | |
| | | | | | | | | | |
| | | | | | | | | | |
| | | | | | | | | | |
| | | | | | | | | | |
| Retail Gross Margin | | $ | 136,650 | | | $ | 114,815 | | | $ | 132,534 | | | | | |
Financial data for business segments are as follows (in thousands):
| Year Ended December 31, 2020 | | Retail
Electricity | | Retail
Natural Gas | | Corporate
and Other | | Eliminations | | Consolidated |
| Year Ended December 31, 2023 | | Year Ended December 31, 2023 |
| Retail
Electricity | | | Retail
Electricity | | Retail
Natural Gas | | Corporate
and Other | | Eliminations | | Consolidated |
| Total Revenues | Total Revenues | $ | 461,393 | | | $ | 94,154 | | | $ | (657) | | | $ | 0 | | | $ | 554,890 | |
| Retail cost of revenues | Retail cost of revenues | 306,012 | | | 38,580 | | | 0 | | | 0 | | | 344,592 | |
| Gross Profit | |
| Less: | Less: | |
| Net asset optimization revenue | 0 | | | 0 | | | (657) | | | 0 | | | (657) | |
| Net, losses on non-trading derivative instruments | (23,242) | | | (197) | | | 0 | | | 0 | | | (23,439) | |
| Net asset optimization expense | |
| Net asset optimization expense | |
| Net asset optimization expense | |
| Net, loss on non-trading derivative instruments | |
| Current period settlements on non-trading derivatives | Current period settlements on non-trading derivatives | 35,390 | | | 2,531 | | | 0 | | | 0 | | | 37,921 | |
| | Retail gross margin | |
| Retail gross margin | |
| Retail gross margin | Retail gross margin | $ | 143,233 | | | $ | 53,240 | | | $ | 0 | | | $ | 0 | | | $ | 196,473 | |
Total Assets | Total Assets | $ | 2,906,139 | | | $ | 941,569 | | | $ | 318,865 | | | $ | (3,799,906) | | | $ | 366,667 | |
| Goodwill | Goodwill | $ | 117,813 | | | $ | 2,530 | | | $ | 0 | | | $ | 0 | | | $ | 120,343 | |
| | | | | | | | | | | | | | | | | | | | | | | | | | | | | |
| Year Ended December 31, 2019 |
| Retail
Electricity | | Retail
Natural Gas | | Corporate
and Other | | Eliminations | | Consolidated |
| Total Revenues | $ | 688,451 | | | $ | 122,503 | | | $ | 2,771 | | | $ | 0 | | | $ | 813,725 | |
| Retail cost of revenues | 552,250 | | | 62,975 | | | 0 | | | 0 | | | 615,225 | |
| Less: | | | | | | | | | |
| Net asset optimization expense | 0 | | | 0 | | | 2,771 | | | 0 | | | 2,771 | |
| Net, losses on non-trading derivative instruments | (66,180) | | | (1,775) | | | 0 | | | 0 | | | (67,955) | |
| Current period settlements on non-trading derivatives | 41,841 | | | 1,103 | | | 0 | | | 0 | | | 42,944 | |
| Retail gross margin | $ | 160,540 | | | $ | 60,200 | | | $ | 0 | | | $ | 0 | | | $ | 220,740 | |
| Total Assets | $ | 2,524,884 | | | $ | 820,601 | | | $ | 341,411 | | | $ | (3,263,928) | | | $ | 422,968 | |
| Goodwill | $ | 117,813 | | | $ | 2,530 | | | $ | 0 | | | $ | 0 | | | $ | 120,343 | |
| Year Ended December 31, 2018 | | Retail
Electricity | | Retail
Natural Gas | | Corporate
and Other | | Eliminations | | Consolidated |
| Year Ended December 31, 2022 | | Year Ended December 31, 2022 |
| Retail
Electricity | | | Retail
Electricity | | Retail
Natural Gas | | Corporate
and Other | | Eliminations | | Consolidated |
| Total Revenues | Total Revenues | $ | 863,451 | | | $ | 137,966 | | | $ | 4,511 | | | $ | 0 | | | $ | 1,005,928 | |
| Retail cost of revenues | Retail cost of revenues | 762,771 | | | 82,722 | | | 0 | | | 0 | | | 845,493 | |
| Gross Profit | |
| Less: | Less: | |
| Net asset optimization expense | Net asset optimization expense | 0 | | | 0 | | | 4,511 | | | 0 | | | 4,511 | |
| Net, Losses on non-trading derivative instruments | (15,200) | | | (4,371) | | | 0 | | | 0 | | | (19,571) | |
| Net asset optimization expense | |
| Net asset optimization expense | |
| Net, gain on non-trading derivative instruments | |
| Current period settlements on non-trading derivatives | Current period settlements on non-trading derivatives | (8,788) | | | (826) | | | 0 | | | 0 | | | (9,614) | |
| Non-recurring event - winter storm Uri | |
| Retail gross margin | Retail gross margin | $ | 124,668 | | | $ | 60,441 | | | $ | 0 | | | $ | 0 | | | $ | 185,109 | |
| Total Assets | Total Assets | $ | 1,857,790 | | | $ | 649,969 | | | $ | 361,697 | | | $ | (2,380,718) | | | $ | 488,738 | |
| Goodwill | Goodwill | $ | 117,813 | | | $ | 2,530 | | | $ | 0 | | | $ | 0 | | | $ | 120,343 | |
|
| | | | | | | | | | | | | | | | | | | | | | | | | | | | | |
| Year Ended December 31, 2021 |
| Retail
Electricity | | Retail
Natural Gas | | Corporate
and Other | | Eliminations | | Consolidated |
| Total Revenues | $ | 322,594 | | | $ | 75,134 | | | $ | (4,243) | | | $ | — | | | $ | 393,485 | |
| Retail cost of revenues | 284,794 | | | 38,425 | | | — | | | — | | | 323,219 | |
| Gross Profit | $ | 37,800 | | | $ | 36,709 | | | $ | (4,243) | | | $ | — | | | $ | 70,266 | |
| Less: | | | | | | | | | |
| Net asset optimization expense | — | | | — | | | (4,243) | | | — | | | (4,243) | |
| Net, Gain on non-trading derivative instruments | 19,070 | | | 3,060 | | | — | | | — | | | 22,130 | |
| Current period settlements on non-trading derivatives | (12,876) | | | (2,876) | | | — | | | — | | | (15,752) | |
| Non-recurring event - winter storm Uri | (64,403) | | | — | | | — | | | — | | | (64,403) | |
| Retail gross margin | 96,009 | | | 36,525 | | | — | | | — | | | 132,534 | |
| Total Assets | $ | 1,527,456 | | | $ | 7,320 | | | $ | 310,039 | | | $ | (1,491,056) | | | $ | 353,759 | |
| Goodwill | $ | 117,813 | | | $ | 2,530 | | | $ | — | | | $ | — | | | $ | 120,343 | |
Significant Customers
For each of the years ended December 31, 2020, 20192023, 2022 and 2018,2021, we did not have any significant customers that individually accounted for more than 10% of our consolidated retail revenue.
Significant Suppliers
For each of the years ended December 31, 2020, 20192023, 2022 and 2018,2021, we had 1, 1,two, three, and 2two significant suppliers that individually accounted for more than 10% of our consolidated retail cost of revenues. For each of the years ended December 31, 2020, 20192023, 2022 and 2018,2021, these suppliers accounted for 11%28%, 10%61% and 28%26% of our consolidated cost of revenue.
17. Equity Method Investment
16. Customer Acquisitions
Investment in eREX Spark Marketing Co., Ltd
Prior to November 2019, we, together with eREX Co., Ltd., a Japanese company, were party to an agreement ("eREX JV Agreement") for a joint venture, eREX Spark Marketing Co., Ltd ("ESM"). As partAcquisition of this agreement, we made contributions of 156.4 million Japanese Yen, or $1.4 million, for a 20% ownership interest in ESM. We were entitled to share in 30% of the dividends distributed by ESM for the first year a qualifying dividend was paid and for the subsequent four years thereafter. After this period, dividends were to be distributed proportionately with the equity ownership of ESM. ESM's board of directors consists of 4 directors, 1 of whom was appointed by us. In November 2019, Spark HoldCo, LLC entered into a share purchase agreement with eREX Co., Ltd. In accordance with the agreement, Spark HoldCo, LLC sold its shares which represented 20% ownership interest in ESM for $8.4 million. The disposal of ESM resulted in a non-recurring gain of $4.9 million for the year ended December 31, 2019. Based on our significant influence, as reflected by the 20% equity ownership and 25% control of the ESM board of directors, we recorded the investment in ESM as an equity method investment.
Our investment in ESM was $3.1 million as of December 31, 2018, reflecting contributions made by us through December 31, 2018 and our proportionate share of earnings as determined under the HLBV method as of December 31, 2018, and recorded in other assets in the consolidated balance sheet. There were no basis differences between our initial contribution and the underlying net assets of ESM. We recorded our proportionate share of ESM's earnings of $0.8 million in our consolidated statement of operations for the year ended December 31, 2019.
18. Subsequent Events
Extreme Winter Weather EventCustomer Books
In FebruaryMay 2021, we entered into a series of asset purchase agreements and agreed to acquire up to approximately 56,900 RCEs for a cash purchase price of up to a maximum of $11.5 million. These customers began transferring in August 2021, and are located in our existing markets. As of December 31, 2022, a total of $7.5 million was paid for approximately 45,000 RCEs ($9.2 million for acquired customer contracts, net of $1.7 million related holdbacks under the U.S. experienced winter storm Uri,terms of the purchase agreement). In addition, approximately $2.3 million was released back to us for a reduction in RCEs to be acquired.
As part of the acquisitions, we funded an unprecedented storm bringing extreme cold temperaturesescrow account, the balance of which is reflected as restricted cash in our consolidated balance sheet. As we acquire customers and as the contractual requirements under the asset purchase agreement are met, we make payments to the central U.S., including Texas.sellers from the escrow account. As a result of increased power demand for customers acrossDecember 31, 2022, the state of Texas and power generation disruptions during the weather event, power and ancillary costsbalance in the Electric Reliability Councilescrow account was $1.7 million. These funds were released to the sellers in the first quarter of Texas ("ERCOT") service area reached or exceeded maximum allowed clearing prices. At2023 as remaining conditions of the asset purchase agreement were met. As of December 31, 2023, the balance in the escrow account was zero.
In July 2021, we entered into an agreement to acquire up to approximately 50,000 RCEs and derivatives related to the customer load under a five-year contingent fee structure based on gas volume billed and collected for the acquired customer contracts. These customers began transferring in the fourth quarter of 2021, and are located in our existing markets. Due to the contingent fee structure, the cost of the RCEs will be recognized when probable and reasonably estimable.
In August 2022, we entered into an agreement to acquire up to approximately 18,700 RCEs and derivatives related to the customer load under a five-year contingent fee structure based on gas volumes billed and collected for the acquired customer contracts. These customers began transferring in the fourth quarter of 2022, and are located in our existing markets. Due to the contingent fee structure, the cost of the RCEs will be recognized when probable and reasonably estimable.
Acquisition of Broker Books
In January 2022, we entered into an asset purchase agreement and agreed to acquire the rights to broker contracts for approximately 1,000 customer meters for a cash price of $0.4 million, which was paid upon execution of the contract.
In January 2022, we entered into an asset purchase agreement to acquire the rights to broker contracts for approximately 900 customer meters for a cash price of $0.6 million, pending certain conditions to close. We paid approximately $0.3 million as a deposit at the time of filing these consolidated financial statements, we expect the impact of winter storm Uri will resultasset purchase agreement was executed. The conditions to close were met in a significant loss that will be reflected in our first quarter 2021 results of operations. However, uncertainty exists with respectJune 2022, at which time approximately $0.3 million was paid to the financial impact of the weather event due in part to outstanding pricing and volume settlement data from ERCOT; the results of formal disputes regarding pricing and volume settlement data received to date, for which we are exploring all legal options; and any corrective action by the State of Texas, ERCOT, the Railroad Commission of Texas, or the Public Utility Commission of Texas. Possible action may include resettling pricing across the supply chain (i.e. fuel supply, wholesale pricing of generation, or allocating the financial impacts of market-wide load shed ratably across all retail market participants). During the winter storm Uri event, we were required to post a significant amount of collateral with ERCOT. Despite these posting requirements, we consistently maintained, and continue to maintain, sufficient liquidity to conduct our operations in the ordinary course.seller.
17. Subsequent Events
Declaration of Dividends
On January 21, 2021,17, 2024, we declared a quarterly dividend of $0.18125 per share to holders of record of our Class A common stock on March 1, 2021, which will be paid on March 15, 2021.
We also declared a quarterly cash dividend in the amount of $0.546875$0.75960 per share to holders of record of the Series A Preferred Stock on January 21, 2021.April 1, 2024. The dividend will be paid on April 15, 2021 to holders of record on April 1, 2021.
Senior Credit Facility Commitment Increase
On January 19, 2021, we increased the total commitments under our Senior Credit Facility to $227.5 million.
Item 9. Changes in and Disagreements with Accountants on Accounting and Financial Disclosure
None.
Item 9A. Controls and Procedures
Evaluation of Disclosure Controls and Procedures
Our management, with the participation of our Chief Executive Officer and our Chief Financial Officer, has evaluated the effectiveness of our disclosure controls and procedures as of the end of the period covered by this Annual Report. The term “disclosure controls and procedures,” as defined in Rules 13a-15(e) and 15d-15(e) under the Exchange Act, means controls and other procedures of a company that are designed to ensure that information required to be disclosed by a company in the reports that it files or submits under the Exchange Act is recorded, processed, summarized and reported, within the time periods specified in the SEC’s rules and forms. Disclosure controls and procedures include, without limitation, controls and procedures designed to ensure that information required to be disclosed by a company in the reports that it files or submits under the Exchange Act is accumulated and communicated to the company’s management, including its principal executive and principal financial officers or persons performing similar functions, as appropriate to allow timely decisions regarding required disclosure. Management recognizes that any controls and procedures, no matter how well designed and operated, can provide only reasonable assurance of achieving their objectives, and management necessarily applies its judgment in evaluating the cost benefit relationship of possible controls and procedures. Based on this evaluation, management concluded that our disclosure controls and procedures were effective as of December 31, 2020 at the reasonable assurance level.2023.
Management's Annual Report on Internal Control Over Financial Reporting
See "Management'sThis Annual Report on Internal Control Over Financial Reporting" under Item 8does not contain an attestation report of this Annual Report.
Attestation Report of the Independent Registered Public Accounting Firm
Ourour independent registered public accounting firm Ernst & Young LLP, has provided an attestation report on the Company’srelated to internal control over financial reporting as of December 31, 2020.because the rules for non-accelerated companies provide an exemption from the attestation requirement
Changes in Internal Control over Financial Reporting
There was no change in our internal control over financial reporting identified in connection with the evaluation required by Rule 13a-15(d) and 15d-15(d) of the Exchange Act that occurred during the three months ended December 31, 20202023 that has materially affected, or is reasonably likely to materially affect, our internal control over financial reporting.
Please see "Management's Report on Internal Control over Financial Reporting" under Item 8 of this Annual Report for a description of remediation measures we intend to take to address the material weakness identified in our internal control over financial reporting.
Item 9B. Other Information
None.
Item 9C. Disclosure Regarding Foreign Jurisdictions that Prevent Inspections
Not Applicable.
PART III.
Item 10. Directors, Executive Officers and Corporate Governance
Information as to Item 10 will be set forthdisclosed in thea Form 10-K/A or Proxy Statement, for the 2021 Annual Meeting of Shareholders (the “Annual Meeting”) and is incorporated herein by reference.which will be filed no later than 120 days after December 31, 2023.
Item 11. Executive Compensation
Information as to Item 11 will be set forthdisclosed in thea Form 10-K/A or Proxy Statement, for the Annual Meeting and is incorporated herein by reference.which will be filed no later than 120 days after December 31, 2023.
Item 12. Security Ownership of Certain Beneficial Owners and Management, and Related Stockholder Matters
Except as provided below, information as to Item 12 will be set forthdisclosed in thea Form 10-K/A or Proxy Statement, for the Annual Meeting and is incorporated herein by reference.which will be filed no later than 120 days after December 31, 2023.
Equity Compensation Plan Information
The following table shows information about our Class A common stock that may be issued under the Spark Energy,Via Renewables, Inc. Amended and Restated Incentive Plan (the “Incentive Plan”) as of December 31, 2020.2023.
| | Plan category | Plan category | (a) Number of securities to be issued upon exercise of outstanding options, warrants and rights (1) | (c) Number of securities remaining available for future issuance under equity compensation plans (excluding securities reflected in column (a)(2)) | Plan category | (a) Number of securities to be issued upon exercise of outstanding options, warrants and rights (1) | (c) Number of securities remaining available for future issuance under equity compensation plans (excluding securities reflected in column (a)(2) |
| Equity compensation plans approved by the security holders | Equity compensation plans approved by the security holders | 409,953 | | 2,088,799 | |
| Equity compensation plans not approved by the security holders | Equity compensation plans not approved by the security holders | — | | — | |
| Total | Total | 409,953 | | 2,088,799 | |
(1) This column reflects the maximum number of shares of Class A common stock that may be issued under outstanding and unvested restricted stock units ("RSUs") at December 31, 2020.2023. No stock options or warrants have been granted under the Incentive Plan.
(2) This column reflects the total number of shares of Class A common stock remaining available for issuance under the LTIP.
The Incentive Plan is the only plan under which our equity securities are authorized for issuance. The Incentive Plan was approved by our shareholder prior to our initial public offering and was approved by our public shareholders in 2019. Please read Note 1211 to our consolidated financial statements, entitled "Stock-Based Compensation" for a description of the Incentive Plan.
Pla
Item 13. Certain Relationships and Related Transactions, and Director Independence
Information as to Item 13 will be set forthdisclosed in thea Form 10-K/A or Proxy Statement, for the Annual Meeting and is incorporated herein by reference.which will be filed no later than 120 days after December 31, 2023
Item 14. Principal Accounting Fees and Services
Information as to Item 14 will be set forthdisclosed in thea Form 10-K/A or Proxy Statement, for the Annual Meeting and is incorporated herein by reference.which will be filed no later than 120 days after December 31, 2023.
PART IV.
Item 15. Exhibits, Financial Statement Schedules
(1) The consolidated financial statements of Spark Energy,Via Renewables, Inc. and its subsidiaries and the report of the independent registered public accounting firm are included in Part II, Item 8 of this Annual Report.
(2) All schedules have been omitted because they are not required under the related instructions, are not applicable or the information is presented in the consolidated financial statements or related notes.
(3) The exhibits listed on the accompanying Exhibit Index are filed as part of, or incorporated by reference into, this Annual Report.
| | | | | | | | | | | | | | | | | | | | |
| INDEX TO EXHIBITS |
| | | | | |
| | | Incorporated by Reference |
| Exhibit | Exhibit Description | Form | Exhibit Number | Filing Date | SEC File No. |
| 2.1# | | 10-Q | | 2.1 | 5/5/2016 | 001-36559 |
| 2.2# | | 10-Q | | 2.2 | 5/5/2016 | 001-36559 |
| 2.3# | | 8-K | | 2.1 | 8/1/2016 | 001-36559 |
| 2.4# | | 10-Q | | 2.4 | 5/8/2017 | 001-36559 |
| 2.5 | | 8-K | | 2.1 | 7/6/2017 | 001-36559 |
| 2.6# | Agreement to Terminate Earnout Payments, effective January 12, 2018, by and among Spark Energy, Inc., CenStar Energy Corp., Woden Holdings, LLC (fka Verde Energy USA Holdings, LLC), Verde Energy USA, Inc., Thomas FitzGerald, and Anthony Mench. | 8-K | | 2.1 | 1/16/2018 | 001-36559 |
| 2.7# | | 10-K | | 2.7 | 3/9/2018 | 001-36559 |
| 2.8# | | 8-K | | 2.1 | 10/25/2018 | 001-36559 |
| 2.9 | | 10-Q | | 2.9 | 8/5/2020 | 001-36559 |
| 3.1 | | 8-K | | 3.1 | 8/4/2014 | 001-36559 |
| 3.2 | | 8-K | | 3.2 | 8/4/2014 | 001-36559 |
| 3.3 | | 8-A | | 5 | 3/14/2017 | 001-36559 |
| 4.1 | | 10-K | | 4.1 | 3/5/2020 | 001-36559 |
| 4.2 | | S-1 | | 4.1 | 6/30/2014 | 333-196375 |
| | | | | | |
| | | | | | |
| 4.3 | | 8-K | | 10.1 | 7/6/2017 | 001-36559 |
| 4.4 | | 8-K | | 10.2 | 1/16/2018 | 001-36559 |
| | | | | | | | | | | | | | | | | | | | |
| INDEX TO EXHIBITS |
| | | | | |
| | | Incorporated by Reference |
| Exhibit | Exhibit Description | Form | Exhibit Number | Filing Date | SEC File No. |
| 2.1# | | 10-Q | | 2.1 | 5/5/2016 | 001-36559 |
| 2.2# | | 10-Q | | 2.2 | 5/5/2016 | 001-36559 |
| 2.3# | | 8-K | | 2.1 | 8/1/2016 | 001-36559 |
| 2.4# | | 10-Q | | 2.4 | 5/8/2017 | 001-36559 |
| 2.5 | | 8-K | | 2.1 | 7/6/2017 | 001-36559 |
| 2.6# | Agreement to Terminate Earnout Payments, effective January 12, 2018, by and among Spark Energy, Inc., CenStar Energy Corp., Woden Holdings, LLC (fka Verde Energy USA Holdings, LLC), Verde Energy USA, Inc., Thomas FitzGerald, and Anthony Menchaca. | 8-K | | 2.1 | 1/16/2018 | 001-36559 |
| 2.7# | | 10-K | | 2.7 | 3/9/2018 | 001-36559 |
| 2.8# | | 8-K | | 2.1 | 10/25/2018 | 001-36559 |
| 2.9 | | 10-Q | | 2.9 | 8/5/2020 | 001-36559 |
| 2.1 | | 8-K | | 2.1 | 1/2/2024 | 001-36559 |
| 3.1* | | | | | | |
| 3.2 | | 8-K | | 3.2 | 8/9/2021 | 001-36559 |
| 3.3 | | 8-A | | 5 | 3/14/2017 | 001-36559 |
| 4.1 | | 10-K | | 4.1 | 3/5/2020 | 001-36559 |
| 4.2 | | S-1 | | 4.1 | 6/30/2014 | 333-196375 |
| | | | | | |
| | | | | | |
| | | | | | |
| | | | | | |
| | | | | | |
| | | | | | | | | | | | | | | | | | | | |
| 4.5 | | 8-K | | 10.1 | 1/16/2018 | 001-36559 |
| 10.1 | Credit Agreement, dated as of May 19, 2017, among Spark Energy, Inc., Spark HoldCo, LLC, Spark Energy, LLC, Spark Energy Gas, LLC, CenStar Energy Corp, CenStar Operating Company, LLC, Oasis Power, LLC, Oasis Power Holdings, LLC, Electricity Maine, LLC, Electricity N.H., LLC, Provider Power Mass, LLC, Major Energy Services LLC, Major Energy Electricity Services LLC, Respond Power LLC and Perigee Energy, LLC as Co-Borrowers, Coöperatieve Rabobank U.A., New York Branch, as Administrative Agent, an Issuing Bank and a Bank, and Coöperatieve Rabobank U.A., New York Branch and BBVA Compass, as Joint Lead Arrangers and Sole Bookrunner, and the Other Financial Institutions Signatory Thereto. | 8-K | | 10.1 | 5/24/2017 | 001-36559 |
| 10.2 | Amendment No. 1 to the Credit Agreement, dated as of November 2, 2017, among Spark HoldCo, LLC, Spark Energy, LLC, Spark Energy Gas, LLC, CenStar Energy Corp, CenStar Operating Company, LLC, Oasis Power, LLC, Oasis Electricity Maine, LLC, Electricity N.H., LLC, Provider Power Mass, LLC, Major Energy Services, LLC, Perigee Energy, LLC, Verde Energy USA, Inc. as Co-Borrowers. | 10-Q | | 10.1 | 11/3/2017 | 001-36559 |
| 10.3 | | 8-K | | 10.1 | 7/20/2018 | 001-36559 |
| 10.4 | Amendment No. 3 to the Credit Agreement, dated as of June 13, 2019, by and among Spark Energy, Inc., the Co-Borrowers, the Issuing Banks party thereto, Coӧperatieve Rabobank U.A., New York Branch, as agent, and the Banks party thereto. | 8-K | | 10.1 | 6/18/2019 | 001-36559 |
| 10.5# | Amendment No. 4 to the Credit Agreement, dated as of July 31, 2020, by and among Spark Energy, Inc., the Co-Borrowers, the Issuing Banks party thereto, Cooperatieve Rabobank U.A., New York Branch, as agent, and the Banks party thereto. | 10-Q | | 10.1 | 8/5/2020 | 001-36559 |
| 10.6 | New Bank Agreement, dated October 30, 2020, by and among Spark Energy, Inc., the Co-Borrowers, the Issuing Banks party thereto, Cooperatieve Rabobank U.A., New York Branch, as agent, the Banks party thereto and Gulf Capital, as new bank. | 10-Q | | 10.2 | 11/4/2020 | 001-36559 |
| 10.7 | | 8-K | | 10.2 | 8/4/2014 | 001-36559 |
| | | | | | |
| 10.8† | | S-8 | | 4.3 | 7/31/2014 | 333-197738 |
| 10.9† | | 10-Q | | 10.3 | 11/10/2016 | 001-36559 |
| 10.10† | | S-1 | | 10.4 | 6/30/2014 | 333-196375 |
| 10.12† | | 10-Q | | 10.2 | 8/5/2020 | 001-36559 |
| 10.13† | | S-1 | | 10.5 | 6/30/2014 | 333-196375 |
| 10.14† | | 10-Q | | 10.5 | 8/3/2018 | 001-36559 |
| | | | | | | | | | | | | | | | | | | | |
| 10.1 | Credit Agreement, dated June 30, 2022, by and among Via Renewables, Inc., Spark HoldCo, LLC, and the other subsidiaries of Via Renewables, Inc. and Spark HoldCo, LLC party thereto, as co-borrowers, Woodforest National Bank, as administrative agent, swing bank, swap bank, issuing bank, joint-lead arranger, sole bookrunner and syndication agent, BOKF, NA (d/b/a/ Bank of Texas), as joint-lead arranger and issuing bank, and the other financial institutions party thereto. | 8-K | | 10.1 | 7/7/2022 | 001-36559 |
| 10.2 | Credit Agreement, dated as of May 19, 2017, among Spark Energy, Inc., Spark HoldCo, LLC, Spark Energy, LLC, Spark Energy Gas, LLC, CenStar Energy Corp, CenStar Operating Company, LLC, Oasis Power, LLC, Oasis Power Holdings, LLC, Electricity Maine, LLC, Electricity N.H., LLC, Provider Power Mass, LLC, Major Energy Services LLC, Major Energy Electric Services LLC, Respond Power LLC and Perigee Energy, LLC as Co-Borrowers, Coöperatieve Rabobank U.A., New York Branch, as Administrative Agent, an Issuing Bank and a Bank, and Coöperatieve Rabobank U.A., New York Branch and BBVA Compass, as Joint Lead Arrangers and Sole Bookrunner, and the Other Financial Institutions Signatory Thereto. | 8-K | | 10.1 | 5/24/2017 | 001-36559 |
| 10.3 | Amendment No. 1 to the Credit Agreement, dated as of November 2, 2017, among Spark HoldCo, LLC, Spark Energy, LLC, Spark Energy Gas, LLC, CenStar Energy Corp, CenStar Operating Company, LLC, Oasis Power, LLC, Electricity Maine, LLC, Electricity N.H., LLC, Provider Power Mass, LLC, Major Energy Services, LLC, Major Energy Electric Services LLC, Respond Power, LLC, Perigee Energy, LLC, Verde Energy USA, Inc., Verde Energy USA, Inc., Verde Energy USA Commodities, LLC, Verde Energy USA Connecticut, LLC, Verde Energy USA DC, LLC, Verde Energy USA Illinois, LLC, Verde Energy USA Maryland, LLC, Verde Energy USA Massachusetts, LLC, Verde Energy USA New Jersey, LLC, Verde Energy USA New York, LLC, Verde Energy USA Ohio, LLC, Verde Energy USA Pennsylvania, LLC, Verde Energy USA Texas Holdings, LLC, Verde Energy USA Trading, LLC, Verde Energy Solutions, LLC, and Verde Energy USA Texas, LLC as Co-Borrowers, Spark Energy, Inc., Coöperatieve Rabobank U.A., New York Branch, as Agent, and the Banks party thereto. | 10-Q | | 10.1 | 11/3/2017 | 001-36559 |
| 10.4 | Amendment No. 2 to the Credit Agreement, dated as of July 17, 2018, by and among Spark Energy, Inc., the Co-Borrowers, Coӧperatieve Rabobank U.A., New York Branch, as agent, the Banks party thereto, and Brown Brothers Harrisman & Co., as existing bank. | 8-K | | 10.1 | 7/20/2018 | 001-36559 |
| 10.5 | Amendment No. 3 to the Credit Agreement, dated as of June 13, 2019, by and among Spark Energy, Inc., the Co-Borrowers, the Issuing Banks party thereto, Coӧperatieve Rabobank U.A., New York Branch, as agent, and the Banks party thereto. | 8-K | | 10.1 | 6/18/2019 | 001-36559 |
| 10.6# | Amendment No. 4 to the Credit Agreement, dated as of July 31, 2020, by and among Spark Energy, Inc., the Co-Borrowers, the Issuing Banks party thereto, Coӧperatieve Rabobank U.A., New York Branch, as agent, and the Banks party thereto. | 10-Q | | 10.1 | 8/5/2020 | 001-36559 |
| 10.7# | Amendment No. 5 to the Credit Agreement, dated as of October 15, 2021, by and among Via Renewables, Inc., the Co-Borrowers, the Issuing Banks party thereto, Coӧperatieve Rabobank U.A., New York Branch, as agent, and the Banks party thereto. | 8-K | | 10.1 | 10/21/2021 | 001-36559 |
| | | | | | | | | | | | | | | | | | | | |
| 10.15† | | 10-Q | | 10.3 | 8/5/2020 | 001-36559 |
| 10.16 | | 10-Q | | 10.1 | 5/8/2017 | 001-36559 |
| 10.17 | | 8-K | | 10.1 | 1/26/2018 | 001-36559 |
| 10.18 | Amendment No. 2 to the Third Amended and Restated Limited Liability Company Agreement of Spark Holdco, LLC, dated as of March 30, 2020, by and between Spark Energy, Inc., Spark HoldCo, LLC, NuDevco Retail, LLC and Retailco, LLC. | 8-K | | 10.1 | 4/3/2020 | 001-36559 |
| 10.19† | | 8-K | | 10.5 | 8/4/2014 | 001-36559 |
| 10.20† | | 8-K | | 10.6 | 8/4/2014 | 001-36559 |
| 10.21† | | 8-K | | 10.9 | 8/4/2014 | 001-36559 |
| 10.22† | | 8-K | | 10.10 | 8/4/2014 | 001-36559 |
| 10.23† | | 8-K | | 10.12 | 8/4/2014 | 001-36559 |
| 10.24† | | 8-K | | 10.2 | 5/27/2016 | 001-36559 |
| 10.25† | | 8-K | | 10.1 | 5/27/2016 | 001-36559 |
| 10.26† | | 8-K | | 10.3 | 6/3/2016 | 001-36559 |
| 10.27 | | 8-K | | 10.4 | 8/4/2014 | 001-36559 |
| 10.28 | Transaction Agreement II, dated as of July 30, 2014, by and among Spark Energy, Inc., Spark HoldCo, LLC, NuDevco Retail LLC, NuDevco Retail Holdings, LLC, Spark Energy Ventures, LLC, NuDevco Partners Holdings, LLC and Associated Energy Services, LP. | 8-K | | 4.1 | 8/4/2014 | 001-36559 |
| 10.29† | | 8-K | | 10.1 | 4/20/2015 | 001-36559 |
| 10.30† | | 8-K | | 10.4 | 4/20/2015 | 001-36559 |
| 10.31† | | 8-K | | 10.1 | 8/4/2015 | 001-36559 |
| 10.32† | | 8-K | | 10.1 | 6/3/2016 | 001-36559 |
| | | | | | | | | | | | | | | | | | | | |
| 10.8 | New Bank Agreement, dated October 30, 2020, by and among Spark Energy, Inc., the Co-Borrowers, the Issuing Banks party thereto, Coӧperatieve Rabobank U.A., New York Branch, as agent, the Banks party thereto and Gulf Capital Bank, as new bank. | 10-Q | | 10.2 | 11/4/2020 | 001-36559 |
| | | | | | |
| | | | | | |
| 10.9 | New Bank Agreement, dated January 19, 2021, by and among Spark Energy, Inc., the Co-Borrowers and Guarantors, the Banks party thereto, Coӧperatieve Rabobank U.A., New York Branch, as agent, and Wells Fargo Bank, NA, as new bank | 10-Q | | 10.2 | 5/6/2021 | 001-36559 |
| 10.10 | | 8-K | | 10.2 | 8/4/2014 | 001-36559 |
| 10.11 | TRA Termination and Release Agreement, dated July 11, 2019, by and among Spark Energy, Inc., Spark HoldCo, LLC, Retailco, LLC, NuDevco Retail, LLC and W. Keith Maxwell III. | 8-K | | 10.1 | 7/17/2019 | 001-36559 |
| 10.12 | | 8-K | | 10.4 | 8/4/2014 | 001-36559 |
| 10.13 | Transaction Agreement II, dated as of July 30, 2014, by and among Spark Energy, Inc., Spark HoldCo, LLC, NuDevco Retail LLC, NuDevco Retail Holdings, LLC, Spark Energy Ventures, LLC, NuDevco Partners Holdings, LLC and Associated Energy Services, LP. | 8-K | | 4.1 | 8/4/2014 | 001-36559 |
| 10.14 | | 10-Q | | 10.1 | 5/8/2017 | 001-36559 |
| 10.15 | | 8-K | | 10.1 | 1/26/2018 | 001-36559 |
| 10.16 | Amendment No. 2 to the Third Amended and Restated Limited Liability Company Agreement of Spark Holdco, LLC, dated as of March 30, 2020, by and between Spark Energy, Inc., Spark HoldCo, LLC, NuDevco Retail, LLC and Retailco, LLC. | 8-K | | 10.1 | 4/3/2020 | 001-36559 |
| 10.17 | | 10-K | | 10.46 | 3/4/2021 | 001-36559 |
| 10.18 | | 8-K | | 10.2 | 10/20/2021 | 001-36559 |
| 10.19 | | 8-K | | 10.2 | 7/7/2022 | 001-36559 |
| 10.20† | | S-8 | | 4.3 | 7/31/2014 | 333-197738 |
| 10.21† | | 10-Q | | 10.3 | 11/10/2016 | 001-36559 |
| 10.22† | | 8-K | | 10.1 | 5/23/2019 | 001-36559 |
| | | | | | | | | | | | | | | | | | | | |
| 10.33† | | 10-Q | | 10.2 | 8/3/2018 | 001-36559 |
| 10.34† | | 10-Q | | 10.3 | 8/3/2018 | 001-36559 |
| 10.35† | | 10-Q | | 10.4 | 8/3/2018 | 001-36559 |
| 10.36† | | 10-Q | | 10.1 | 12/14/2018 | 001-36559 |
| | | | | | |
| 10.37† | | 8-K | | 10.1 | 5/23/2019 | 001-36559 |
| | | | | | |
| 10.38† | | 8-K | | 10.3 | 6/18/2019 | 001-36559 |
| 10.39 | TRA Termination and Release Agreement, dated July 11, 2019, by and among Spark Energy, Inc., Spark HoldCo, LLC, Retailco, LLC, NuDevco Retail, LLC and W. Keith Maxwell III. | 8-K | | 10.1 | 7/17/2019 | 001-36559 |
| 10.40 † | | 8-K | | 10.1 | 8/30/2019 | 001-36559 |
| 10.41 | | 8-K | | 10.1 | 9/27/2019 | 001-36559 |
| 10.42† | | 8-K | | 10.1 | 3/19/2020 | 001-36559 |
| 10.43† | | 8-K | | 10.2 | 3/19/2020 | 001-36559 |
| 10.44† | | 8-K | | 10.1 | 3/25/2020 | 001-36559 |
| 10.45† | | 8-K | | 10.2 | 3/25/2020 | 001-36559 |
| | | | | | |
| | | | | | |
| 10.46* | | | | | | |
| 10.47†* | | | | | | |
| 21.1* | | | | | | |
| 23.1* | | | | | | |
| | | | | | |
| 31.1* | | | | | | |
| | | | | | | | | | | | | | | | | | | | |
| 10.23† | | S-1 | | 10.4 | 6/30/2014 | 333-196375 |
| 10.24† | | 10-Q | | 10.2 | 8/5/2020 | 001-36559 |
| 10.25† | | S-1 | | 10.5 | 6/30/2014 | 333-197738 |
| 10.26† | | 10-Q | | 10.5 | 8/3/2018 | 333-196375 |
| 10.27† | | 10-Q | | 10.3 | 8/5/2020 | 001-36559 |
| 10.28† | | 8-K | | 10.5 | 8/4/2014 | 001-36559 |
| 10.29† | | 8-K | | 10.10 | 8/4/2014 | 001-36559 |
| 10.30† | | 8-K | | 10.12 | 8/4/2014 | 001-36559 |
| | | | | | |
| | | | | | |
| | | | | | |
| 10.31† | | 8-K | | 10.1 | 5/27/2016 | 001-36559 |
| 10.32† | | 8-K | | 10.1 | 8/30/2019 | 001-36559 |
| 10.33† | | 8-K | | 10.2 | 3/19/2020 | 001-36559 |
| 10.34 | | 8-K | | 10.1 | 6/12/2023 | 001-36559 |
| 10.35† | | 8-K | | 10.3 | 6/18/2019 | 001-36559 |
| 10.36† | | 8-K | | 10.1 | 3/19/2020 | 001-36559 |
| 10.37† | | 8-K | | 10.1 | 3/25/2020 | 001-36559 |
| 10.38† | | 10-Q | | 10.5 | 11/4/2021 | 001-36559 |
| 10.39† | | 8-K | | 10.1 | 11/8/2021 | 001-36559 |
| | | | | | |
| 10.40† | | 10-K | | 10.47 | 3/4/2021 | 001-36559 |
| | | | | | |
| 10.41† | | 10-Q | | 10.3 | 11/4/2021 | 001-36559 |
| | | | | | | | | | | | | | | | | | | | |
31.2* | | | | | | |
32** | | | | | | |
101.INS* | XBRL Instance Document. | | | | | |
101.SCH* | XBRL Schema Document. | | | | | |
101.CAL* | XBRL Calculation Document. | | | | | |
101.LAB* | XBRL Labels Linkbase Document. | | | | | |
101.PRE* | XBRL Presentation Linkbase Document. | | | | | |
101.DEF* | XBRL Definition Linkbase Document. | | | | | |
104* | Cover Page Interactive Data File (formatted as Inline XBRL and contained in Exhibit 101.INS) | | | | | |
| | | | | | | | | | | | | | | | | | | | |
| 10.42 | | 10-Q | | 10.1 | 5/4/2023 | 001-36559 |
| 10.43 | | 8-K | | 10.1 | 7/6/2023 | 001-36559 |
| 10.44 | | 8-K | | 10.1 | 4/8/2021 | 001-36559 |
| 10.45 † | | 10-Q | | 10.4 | 11/4/2021 | 001-36559 |
| 16.1 | | 8-K | | 16.1 | 3/31/2022 | 001-36559 |
| | | | | | |
| | | | | | |
| | | | | | |
| | | | | | |
| | | | | | |
| | | | | | |
| | | | | | |
| | | | | | |
| | | | | | |
| 21.1* | | | | | | |
| 23.1* | | | | | | |
| 23.2* | | | | | | |
| | | | | | |
| 31.1* | | | | | | |
| 31.2* | | | | | | |
| 32** | | | | | | |
| 97* | | | | | | |
| 101.INS* | XBRL Instance Document. | | | | | |
| 101.SCH* | XBRL Schema Document. | | | | | |
| 101.CAL* | XBRL Calculation Document. | | | | | |
| 101.LAB* | XBRL Labels Linkbase Document. | | | | | |
| 101.PRE* | XBRL Presentation Linkbase Document. | | | | | |
| 101.DEF* | XBRL Definition Linkbase Document. | | | | | |
| 104* | Cover Page Interactive Data File (formatted as Inline XBRL and contained in Exhibit 101.INS) | | | | | |
* Filed herewith
** Furnished herewith
† Compensatory plan or arrangement
+ Portions of this exhibit have been omitted and filed separately with the SEC pursuant to an order granting confidential treatment.
# The registrant agrees to furnish supplementally a copy of any omitted schedule to the Commission upon request.
Item 16. Form 10-K Summary
None.
SIGNATURES
Pursuant to the requirements of section 13 or 15(d) of the Securities Exchange Act of 1934, as amended, the registrant has duly caused this report to be signed on its behalf by the undersigned, thereunto duly authorized.
| | | | | | | | | | | | | | | | | |
March 4, 2021February 29, 2024 | Spark Energy,Via Renewables, Inc. |
| By: | | /s/ James G. Jones IIMike Barajas |
| | | James G. Jones IIMike Barajas |
| | | Chief Financial Officer (Principal Financial Officer and Principal Accounting Officer) |
| |
Pursuant to the requirements of the Securities Exchange Act of 1934, this report has been signed by the following persons on behalf of the registrant in the capacities indicated on March 4, 2021:February 29, 2024: |
| | |
| | | |
| | | |
| | | |
| | | | | |
| By: | | /s/ W. Keith Maxwell III |
| | | W. Keith Maxwell III |
| | | Chairman of the Board of Directors and Chief Executive Officer (Principal Executive Officer) |
| | | | | |
| | | /s/ James G. Jones IIMike Barajas |
| | | James G. Jones IIMike Barajas |
| | | Chief Financial Officer (Principal Financial Officer and Principal Accounting Officer) |
| | | | | |
| | | /s/ Nick Evans Jr.Stephen Kennedy |
| | | Nick Evans Jr.Stephen Kennedy |
| | | Director |
| | | | | |
| | | /s/ Kenneth M. Hartwick |
| | | Kenneth M. Hartwick |
| | | Director |
| | | | | |
| | | /s/ Amanda Bush |
| | | Amanda Bush |
| | | Director |
| | | | | |
| | | |
| | | |
| | | |