This report contains forward-looking statements that are subject to risks and uncertainties. All statements other than statements of historical fact included in this report are forward-looking. Thoseforward-looking statements. Forward-looking statements reflectdiscuss our current views with respectexpectations and projections relating to our business,financial condition, results of operations, plans, objectives, future events, financial performance and our industry in general. Statements thatbusiness. You can identify forward-looking statements because they do not relate strictly to historical or current facts. These statements may include the words such as “aim,” “anticipate,” “believe,” “estimate,” “expect,” “forecast,” “outlook,” “potential,” “project,” “projection,” “plan,” “intend,” "strive," “plan,” “believe,” “project,” “forecast,” “estimate,“seek,” “may,” “could,” “would,” “will,” “should,” “can,” “can have,” “likely,” the negatives thereof and “anticipate” may be forward-looking. We baseother words and terms of similar meaning in connection with any discussion of the timing or nature of future operating or financial performance or other events. They appear in a number of places throughout this report and include statements regarding our intentions, beliefs or current expectations concerning, among other things, our results of operations, financial condition, liquidity, prospects, growth, strategies and the industry in which we operate. All forward-looking statements on history, experience, expectations, and projections. Forward-looking statements address matters that involveare subject to risks and uncertainties. Weuncertainties that could cause actual results to differ materially from those that we expected.
While we believe that our assumptions are reasonable, we caution you therefore notthat it is very difficult to place undue reliance on forward-looking statements. We make no guarantees regarding outcomes,predict the impact of known factors, and assume no obligationsit is impossible for us to update theanticipate all factors that could affect our actual results. All forward-looking statements herein, except pursuant to law. A non-exhaustive listare expressly qualified in their entirety by these cautionary statements. You should evaluate all forward-looking statements made in this report in the context of the factors that could cause outcomes to differ materially from our expectations includes:
We caution you that the important factors included in this report may not contain all of the factors that are important to you. In addition, we cannot assure you that we will realize the results or developments we expect or anticipate or, even if substantially realized, that they will result in the consequences we anticipate or affect us or our operations in the ways that we expect. The forward-looking statements included in this report are made only as of the date hereof. We undertake no obligation to publicly update or revise any forward-looking statement as a result of new information, future events or otherwise, except as required by law. If we do update one or more forward-looking statements, no inference should be made that we will make additional updates with respect to those or other forward-looking statements. We qualify all of our debt agreements, and (iii) ability to pay or refinance our existing debt or to obtain additional financing;
forward-looking statements by these cautionary statements.
1
Unless otherwise specified in this Annual Report on Form 10-K (“Annual Report”), or the context otherwise requires, terms “El Pollo Loco,” “the Company,” “our company,” “we,” “us,” and “our” mean El Pollo Loco Holdings, Inc. (“Holdings”), together with its subsidiaries.
ITEM 1.BUSINESS
Our Company
El Pollo Loco is Spanish for “The Crazy Chicken.” We opened our first location on Alvarado Street in Los Angeles, California, in 1980, and have grown our restaurant system to 490 restaurants, comprised of 188 company-operated and 302 franchised restaurants as of December 28, 2022. Our restaurants are located in California, Arizona, Nevada, Texas, Utah, Colorado and Louisiana. Our typical restaurant is a free-standing building with drive-thru service that ranges in size from 2,200 to 3,000 square feet with seating for approximately 50-70 people.
El Pollo Loco is a differentiated and growing restaurant concept that specializes in fire-grilling citrus-marinated chicken and operates in the limited service restaurant (“LSR”) segment. We strive to offer food that integrates the qualityculinary traditions of food and dining experience typicalMexico with the healthier lifestyle of fast casual restaurants while providing the speed, convenience, and value typical of traditional quick-service restaurants (“QSRs”), a combination that we call “QSR+”, and to provide a value-oriented fast casual dining experience.Los Angeles. Our distinctive menu features our signature product—product, citrus-marinated fire-grilled chicken—andchicken, as well as a variety of Mexican-inspiredMexican and LA-inspired entrees that we create from our chicken. Every day in every restaurant, we marinate and fire-grill our chicken over open flames, and slice whole tomatoes, avocados, serrano peppers, and cilantro to make our salsas, guacamole, and cilantro dressings from scratch. The design of our kitchens reveals our Mexican-inspired cooking process and allows our customers to watch our Grill Masters and team members fire-grill and hand-cut our signature chicken, as well as team members make burritos, salads, tostadas, bowls, stuffed quesadillas, and chicken entrees.
The Company operates in one operating segment. All significant revenues relate to retail sales of food and beverages through either company or franchised restaurants. Financial information about our operations, including our revenues and net incomeexpenses for fiscal 2017, 20162022, 2021 and 2015,2020, and our total assets as of the end of fiscal 20172022 and 2016,2021, is included in our consolidated financial statements“Audited Consolidated Financial Statements” and accompanying notes, see Item 8, "Financial“Notes to Consolidated Financial Statements” in this Annual Report. See “Item 8. Financial Statements and Supplementary Data."”
Market Trends and Uncertainties
We may face future business disruption and related risks resulting from the ongoing COVID-19 pandemic or from another pandemic, epidemic or infectious disease outbreak, or from broader macroeconomic trends, any of which could have a significant impact on our business. During the year ended December 28, 2022, we incurred $3.3 million in COVID-19 related expenses, comprised of $2.3 million due to overtime primarily related to the first quarter and $1.0 million due to leaves of absence related to the remaining three quarters. During the year ended December 29, 2021 and December 30, 2020, we incurred $3.9 million and $4.9 million, respectively, in COVID-19 related expenses, primarily due to leaves of absence and overtime pay. In addition, while all of our restaurants had dining rooms open as of December 28, 2022, we continue to experience staffing challenges, including higher wage inflation, overtime costs and other labor related costs. Labor costs could also be adversely impacted as a result of California Assembly Bill No. 257, the Fast Food Accountability and Standards Recovery Act (“FAST Act”), which was signed into law in September 2022 and authorizes the creation of a council to set minimum standards for industry workers in California, including minimum wages. The FAST Act, which will take effect if approved by voters in November 2024, could result in increased labor cost at our California restaurants thereby potentially impacting the profitability of our California restaurants. Further, this bill could prompt similar legislation in other states. We also continue to experience inflationary pressures, which resulted in increased commodity prices and impacted our business and results of operations during the year ended December 28, 2022. We expect these pressures to continue during fiscal year 2023.
Due to the fluidity of the COVID-19 pandemic and current macroeconomic environment, we cannot determine the ultimate impact that the COVID-19 pandemic (and its related economic impacts) and the current macroeconomic environment will have on our consolidated financial condition, liquidity, and future results of operations, and therefore
2
any prediction as to the ultimate materiality of the adverse impact on our consolidated financial condition, liquidity, and future results of operations is uncertain.
Our Industry
The restaurant industry is divided into two segments: full service and limited service. Full service is comprised of the casual dining, mid-scale, and fine dining sub-segments. Limited service is comprised of the QSR and fast casual sub-segments. QSRs are traditional fast food restaurants with average check sizes of $3.00 to $8.00. Fast casual is a limited or self-service format with average check sizes of $8.00 to $12.00 that offers food prepared to order within a generally more upscale and developed establishment.
Our Competitive Strengths
We believe that the following strengths differentiate us from our competitors and serve as the foundation for our continued growth:
Differentiated Restaurant Concept with Broad Appeal.
We believe that our food, which combines the culinary traditions of Mexico with the healthier lifestyle of Los Angeles, served in contemporary restaurant environments at reasonable prices, positions us well to satisfy the needs ofMexican-Inspired, Fresh-Made Fire-Grilled Chicken and Entrees.
Our signature product is our chicken, marinated with a proprietary recipe of citrus juice, garlic, and spices, which serves as the foundation of our distinctive menu of flavorful bone-in chicken meals andOur bone-in chicken meals and Mexican-inspired entrees accounted for 46%44% and 54%50% of our company-operated restaurant sales in 2022, respectively, 46% and 48%, respectively, in 2017.2021, and 46% and 47%, respectively, in 2020. Our individual and family-sized chicken meals appeal to customers looking to dine at the restaurant or take out during dinnertime, while our more-portable Mexican-inspired entrees draw traffic from customers at lunchtime or for an afternoon snack, thereby enabling us to generate sales split almost equally between lunch and dinner. We believe that our family-sized chicken meals provide a healthier“better for you” and more convenient alternative for mothers and families looking to solve the “dinnertime dilemma” of providing their families with high-quality meals without investing significant time or money. In 2017,2022 approximately 28% of our company-operated sales were generated from family-sized meals.
Operations Infrastructure that Allows for Real-Time Control, Fast Feedback, and Innovation.
We believe that satisfying our customers’ dining needs is the foundation for our business, and we have3
real-time, restaurant-level information for many aspects of our business. The dashboard provides corporate and field management, as well as restaurant-level operators, with insight into how we are performing both from the customer’s perspectiveperspective. In addition, all company operated restaurants utilize digital “communication boards,” which communicate sales, cost and also through the eyes of experienced third-party auditors.
Developing High Average Unit Volumes (“AUVs”) and Strong Unit Economics One Chicken at a Time.
We seek to position ourselves as a differentiatedExperienced Leadership.
Our Growth Strategy
We believe that we are well-positioned for sales growth because of our QSR+ strategy, signature fire-grilled chicken,strong appeal to our core Hispanic family market, appeal to the broader general market, disciplined business model, and strong unit economics. Through 2019, our system experienced annual comparable restaurant sales growth for eight consecutive years. Our system comparable restaurant sales in fiscal 2020 declined 2.4%, which we believe was largely attributable to the COVID-19 pandemic. In 2022 and 2021, our comparable restaurant sales grew 5.9% and 12.1%, respectively. We plan to continue to expand our business, drive restaurant sales growth maintain strong margins, and enhance our competitive positioningincrease company profits by executing onour Transformation Agenda, which consists of the following four key strategies:
Embed our restaurant base.
An important part of our culture is to provide greater support to the communities in which we operate. In 2004, we created El Pollo Loco Charities, a non-profit charity, to support the communities surrounding our restaurants. El Pollo Loco Charities, together with the Company, have provided over 15,000 meals per year to underprivileged families, through organizations like Food on Foot, Habitat for Humanity, Children’s Institute, and Court Appointed Special Advocates. For example, in 2019 we enhanced our community outreach through several initiatives, including (i) implementing a food donation program with Food Donation Connection and donating 75,000 tacos as part of operations,our “Buy One, Feed Many” initiative, (ii) celebrating Caesar Chavez Day by recruiting 500 company employees, franchisees and customers to refresh a high school located in south Los Angeles and (iii) entering into a relationship with an AUVOrange County-based organization to provide job opportunities for the homeless. In 2020, we provided funds to 13 Latina owned businesses that were heavily impacted by the COVID-19 pandemic. In 2021, we launched a campaign called ValenKIND’s Day, which provided 10,000 meals to community members in our hometown of approximately $1.8 millionLos Angeles who are struggling with hunger and homelessness. For Mother’s Day, we issued $80,000 in grants to help moms in our communities and moms who are restaurant team members pursue their dreams in our “Strong Like A Madre” campaign. During 2022, we launched our first Round Up for Charity campaign benefiting Feeding America. El Pollo Loco Charities committed to match the first 100,000 customer round ups in our effort to reach our goal of raising $400,000 for the charity. In addition, in 2022, we donated 15,000 meals to Food on Foot’s Sunday Program, which serves people experiencing homelessness and food insecurity. Further, during the holidays in 2022, we participated in toy drives for various local charitable organizations including California Highway Patrol’s CHiPs for Kids. Lastly, we also continued a cash-on-cash return2019 commitment to street artists in excessour communities by commissioning three new murals on the exterior walls of 20%, although there is no guarantee that these targets will be met. New restaurant performanceour restaurants in outer markets, which include San Francisco/San Jose, Sacramento, Phoenix, Houstonthe Los Angeles area in celebration of Cesar Chavez Day, Mother’s Day, and Dallas have been mixed, but are currently belowDay of the Dead.
4
Build Awareness and Own our expectations overall.
We engage customers through our 9-moduleseasonal product calendar, which features seasonal favorites fromnew, unique limited time offers and variations of menu items like our “Under 500 Calorie” low calorie menu toShredded Beef Birria, Overstuffed Fire-Grilled Chicken Tostada Salads, and StuffedShredded Beef, and Avocado Quesadillas. Our key points of differentiation are communicated through our advertising campaign, which highlights the brand'sbrand’s authenticity, and our Grill Masters' expertise“better for you” menu options and dedication to high-quality grilled chicken.ingredients. We tailor our message from television and direct mail, which garners broad exposure, to our Loco Rewards loyalty program and social media platform where we engage in one-to-onemore personalized marketing.
We believe that investing in consumer-facing technology is critical to further differentiating our brand and reaching customers for whom convenience and value are key decision factors. Our Loco Rewards loyalty program was launched on June 13, 2017.offers rewards that incentivize customers to visit our restaurants more each month. As of December 27, 2017,28, 2022, there were 512,8423.2 million members in the Loco Rewards loyalty program. The program, whom we target with segmented, dynamic campaigns with special offers one pointtailored to each customer segment with the goals of increasing visit frequency and growing overall spend.
In June 2018, we implemented delivery through DoorDash, a third-party delivery provider. In September 2019, we added Postmates and Uber Eats, and in February 2020 we added GrubHub, as additional marketplace delivery providers. For meals ordered through these market place platforms, restaurants incur a fee based on a percentage of the ticket. As of December 28, 2022, DoorDash maintained exclusivity for every dollardelivery orders placed directly with our restaurants. For orders placed directly from the restaurant, no fee is charged to the restaurant as the full delivery cost is borne by the customer.
In total, during fiscal 2022, delivery orders constituted 7.8% of our total sales mix. As of December 28, 2022, all company-operated and franchise restaurants offered integrated delivery through a third-party service.
We plan to continue investing in our loyalty and delivery programs as well as other technology platforms to continue making it easier for customers spendto access our food.
Deliver Exceptional Service – Profitably. We believe that the key to building sustainable, consistent restaurant operations is through the development of restaurant leader bench, including area managers, general managers, assistant managers and shift leaders. To that end, we have put a $10 reward when they achieve 100 points. Customers earn points primarily by scanningrenewed focus on leadership development, not only to benefit our current restaurant base, but also to ensure we have the leaders necessary for the continued growth of the El Pollo Loco app on Apple iOS or Androidbrand. In addition to leadership development, at the pointteam member level, we have completed the roll-out of purchase, or byan enhanced E-Learning platform across the system.
We also believe that simplifying our restaurant operations will further enhance our ability to attract and retain the best employees and further improve customer service. In 2022, we continued to implement initiatives to make it easier for our employees to operate our restaurants. These included eliminating a number of menu items as well as purchasing pre-chopped serrano peppers and fresh cilantro. Initiatives currently in test include soak tanks for cleaning grill hoods and broilers, and blenders to simplify salsa production. These and other initiatives are intended to enable our restaurant employees to increase their focus on customers and speed of service. We believe that this continued focus, combined with renewed emphasis on providing an exceptional customer experience, will lead to higher sales over the longer term.
Accelerate Development. We believe that execution of our first three strategies will enable us to grow our restaurant base. Our restaurant model is designed to generate strong cash flow, attractive restaurant-level financial results and high returns on invested capital. In 2020, we finalized a new restaurant design that we believe will clearly differentiate and communicate our brand, both on the exterior and interior. In addition, we redesigned the back-of-house to make it easier for employees to operate the restaurant. We believe that our remodels using this new design will result in higher restaurant revenue and a strengthened brand. During fiscal 2022, we completed six company-operated restaurants remodels using the appnew design. In 2022, our franchisees completed 16 remodels using the new design. In 2023, we plan to scan the barcodecontinue our standard practices for remodels, including 10-15 company-operated and 20-30 franchised restaurants.
5
We expect future new unit development to be led by franchisees, with company development being focused on their paper receipt anytime within 24 hours of their purchase. We build segmented dynamic campaigns with the goals of reducing the number of days lapsed since each customer's last visit, increasing visit frequency and increasing overall spend.
Site Selection and Expansion
Restaurant Development
We believe that our restaurant model is designed to generate strong cash flow, attractive restaurant-level financial results, and high returns on invested capital, which we believe provide us with a strong foundation for unit growth over the long-term. In
In fiscal 2018,2023, we intend to open 6four to 8six new company-operated and 6eight to 8twelve new franchised restaurants. There is no guarantee that we will be able to open new company-operated or franchised restaurants, or to increase the overall number of our restaurants. We may be unsuccessful in expanding within existing or into new markets for a variety of reasons as described below in Item 1A, “Risk“Item 1A. Risk Factors,” including competition for customers, sites, franchisees, employees, licenses, and financing.
Site Selection Process
We consider the location of a restaurant to be a critical variable in its long-term success and as such, we devote significant effort to the investigation and evaluation of potential restaurant locations. Our in-house development team has extensive experience building such brands as Taco Bell, Starbucks, Hardee's, Jack-in-the-Box,The Habit Burger Grill, Carl’s Jr., Baskin Robbins, Wendy’s, Denny's, Johnny RocketsDenny’s and Dunkin’ Brands. We use a combination of our in-house development team and outside real estate consultants to locate, evaluate, and negotiate new sites using various criteria, including demographic characteristics, daytime population thresholds, and traffic patterns, along with the potential visibility of, and accessibility to, the restaurant. The process for selecting locations incorporates management’s experience and expertise and includes extensive data collection and analysis. Additionally, we use information and intelligence gathered from managers and other restaurant personnel that live in or near the neighborhoods that we are considering.
Based on our experience and results, we are currently focused on developing freestanding sites with drive-thrus.drive-thrus along with select in-line locations. Our restaurants perform well in a variety of neighborhoods, which gives us greater flexibility and lowers operating risk when selecting new restaurant locations.
We approve new restaurants only after formal review by our real estate site approval committee, which includes most of our senior management, and we monitor restaurants’ on-going performances to inform future site selection decisions.
Restaurant Construction
After identifying a lease site, we commence our restaurant build-out. Our new restaurants are either ground-up prototypes or retail space conversions. We estimate that each ground-up build-out of a restaurant requires an average total cash investment of approximately $1.6 to $1.7 million, net of tenant allowances. We estimate that each conversion requires a total cash investment of approximately $0.8 to $1.1 million. On average, it takes approximately 12 to 1824 months from specific site identification to restaurant opening. Our restaurants are constructed in approximately 10 to 15 weeks. In order to maintain consistency of food and customer service, as well as our colorful, bright, and contemporary restaurant environment, we have set processes and timelines to follow for all restaurant openings.
Restaurant Management and Operations
Service
We are extremely focused on customer service. We aim to provide fast, friendly service on a solid foundation of dedicated, driven team members and managers. Our cashiers are trained on the menu items that we offer and offer customers thoughtful suggestions to enhance the ordering process. Our team members and managers are responsible for our service and dining room environment with a focus on hospitality, teamhospitality. Team members seek to engage in conversation with our customers to ensure satisfaction. In addition, constant monitoring of the dining room occurs to ensure the fresh salsa bar and beverage station areis clean and supplied with products.
6
Operations
We utilize systems that are aimed at measuring our ability to deliver a “best in class” experience for our customers. These systems include customer surveys, mystery shopper scores,social media ratings and speed-of-service performance trends. The operational results from all of these sources are then presented on an operations dashboard that displays the measures in an easy-to-read online format that corporate and restaurant-level management and franchisees can utilize in order to identify strengths and opportunities and to develop specific plans for continuous performance improvement.
We have food safety and quality assurance programs designed to maintain the highest standards for the food and the food preparation procedures that are used by both company-operated and franchised restaurants. We have a quality assurance team and employ third-party auditors that perform our work place and food safety restaurant audits.
Managers and Team Members
Each of our restaurants typically has a general manager an assistant manager, and two to three shift leaders.leaders and some restaurants have an assistant manager. There are between 2015 and 35 team members per restaurant who prepare our food fresh daily and provide customer service. To lead our restaurant management teams, we have area leaders, each of whom is responsible for eight7 to 129 restaurants. Overseeing the area leaders are three directorsRegional Directors of operationsOperations who report up to a senior director of operations. An additional senior director of operations oversees our area leaders in Texas. Our franchiseChief Operating Officer. Franchise operations are supported by three directors of franchise and a Senior Vice President, Franchise, who reported to the Chief Development Officer during 2022 and starting in 2023 will report to a vice president of franchise operations. the Chief Operating Officer. The restaurant development team is supported by four directors who also currently report to the Chief Development Officer.
Training
Our senior vice president of operations leads our company-operated restaurants, managing sales, profitability, customer service targets, and franchise operations support.
Franchise Program
We use a franchising strategy to increase new restaurant growth in certain markets, leveraging the ownership of entrepreneurs with specific local market expertise and requiring a relatively minimal capital commitment by us. As of December 27, 2017, there were28, 2022, we had a total of 265302 franchised restaurants. Franchisees range in size from single-restaurant operators to theour largest franchisee, which owned 6168 restaurants as of December 27, 2017.28, 2022. Our existing franchise base consists of many successful, longstanding, multi-unit restaurant operators. As of December 27, 2017,28, 2022, approximately 75%89% of franchised restaurants were owned and operated by franchisees that had been with us for over 20 years.
We believe that the franchise revenue generated from our franchise base has historically served as an important source of stable and recurring cash flows to us, and we accordingly plan to expand our base of franchised restaurants. In existing markets, we encourage growth from current franchisees. In our expansion markets, we seek highly-qualified and experienced new franchisees for multi-unit development opportunities.
We believe that creating a foundation of initial and on-going support is important for future success, both for our franchisees and for our brand. Therefore, we have structured our corporate staff, programs, and communication systems to ensure that we are delivering high-quality support to our franchisees.
Our franchise training program is a key element in ensuring our franchise owners and their managers are equipped with the knowledge and skills necessary for success. The program introduces new franchise members to El Pollo Loco with hands-on training in the operation and management of our restaurants. This foundational training is conducted by a
7
general training manager who has been certified by our operations group. Training must be successfully completed before a trainee can be assigned to a restaurant as a manager.
Once introductory training has been completed, we offer a path toward constant learning for all crew members by providing instructional materials that span management training, operations, new product introductions, food safety and a number of other essential restaurant functions. Many of these programs are distributed through Pollo Zone as a central hub for all training efforts and features individual learner profiles that will provideprovides our franchise owners with real-time access to the progress of learning in their restaurants.
Marketing and Advertising
We strive to distinguish the El Pollo Loco brand by building a brand equity that we believe not only accentuates our strengths but also deepens the strong emotional connections we have with our customers. We promote our restaurants and products by emphasizing our points of differentiation, fromwhich include our Mexican and LA heritages, our fresh ingredients and scratchmade-from-scratch preparation, toand the cooking of our citrus-marinated chicken on open fire grills in full view in our kitchens.
We use multiple marketing channels, including television, digital,radio and print, to broadly drive brand awareness and purchases of our featured products.digital. We advertise on local broadcast and cable television.
Through our public relations efforts, we engage notable food editors, influencers and bloggers on a range of topics to help promote our products. In addition, we engage in one-on-one conversations using a portfolio of social media platforms, including Facebook, TikTok, Instagram and Twitter. We also use social media as a research and customer service tool, and apply insights gained to future marketing efforts.
Our Loco Rewards loyalty program uses points, rewards, and offers to build engagement and sales by campaigning to customers on a one-to-one basis.with our customers. Customers access the program on elpolloloco.com and the El Pollo Loco iOS Apple and Android app. We build segmented dynamic campaigns with special offers tailored to each customer segment with the goals of reducing the number of days lapsed since each customer’s last visit, increasing visit frequency and increasinggrowing overall spend. To keep customers engaged with the program, unannounced offers, called "Surprise“Surprise and Delights"Delights” are awarded based on that customer’s transaction history. We communicate offers, pointsloyalty updates and other Loco Rewards campaigns to customers via in-app messaging, mobile phone push notifications and email.
Our online ordering program makes it easy for customers to skip the line and order ahead. Available forat every location and accessible from elpolloloco.com or the El Pollo Loco mobile app, any order can be placed and paid for before arriving at the restaurant. For additional convenience, as of December 27, 2017, 66 company and 38 franchise locations offered integrated delivery through third party services such as Uber Rush. The delivery fee, which on average is $7.67, is passed through to the customer.
Purchasing and Distribution
Maintaining a high degree of quality in our restaurants depends in part on our ability to acquire fresh ingredients, and other necessary supplies that meet our specifications, from reliable suppliers. We regularly inspect our vendors to ensure that products purchased conform to our standards and that prices offered are competitive. We have a quality assurance team and third partythird-party accredited auditors that perform comprehensive supplier audits on a frequency schedule based on the potential food safety risk for each product. We contract with McLane Company (our “primary distributor”), a major foodservice distributor, for substantially all of our food and supplies, including the poultry that our restaurants receive from suppliers. Our primary distributor delivers supplies to most of our restaurants three times per week. Our restaurants in Texas, Louisiana and Colorado utilize regional distributors for produce. Our franchisees are required to use our primary distributor or an approved regional distributor, and franchisees must purchase food and supplies from approved suppliers. Poultry is our largest product cost item and represented approximately 40%38% of our total food and paper costs for 2017.2022. Fluctuations in supply and in price can significantly impact our restaurant service and profit performance. We actively manage cost volatility for poultry by negotiating with multiple suppliers and entering into what we believe are the most favorable contract terms given existing market conditions. In the past, we have entered into contracts ranging from two monthsone to threetwo years depending on current and expected market conditions. We currently source poultry from six suppliers, with two accounting for approximately 75%79% of our planned purchases for fiscal 2018. We have fixed prices for 100%2022. More than half of our poultry supplypurchases have a fixed price through the end of 2018.2023.
8
Intellectual Property
We have registered El Pollo Loco ® , Pollo Bowl ® , The Crazy Chicken ® , and certain other names used by our restaurants as trademarks or service marks with the U.S. Patent and Trademark Office, (the “PTO”), and El Pollo Loco ® in approximately 42
Competition
We operate in the restaurant industry, which is highly competitive and fragmented. The number, size, and strength of competitors varies by region. Our competition includes a variety of locally-owned restaurants and national and regional chains that offer dine-in, carry-out, and delivery services. Our competition from the broadest perspective includes restaurants, pizza parlors, convenience food stores, delicatessens, supermarkets, and club stores. There are no significant direct competitors with respect to menus that feature marinated, fire-grilled chicken. However, we indirectly compete with fast casual restaurants, including Chipotle, Panera, Qdoba, Rubio’s, and Taco Cabana, among others, and with chicken-specialty QSRs and Mexican QSRs, such as Chick-fil-A, Church’s Chicken, KFC, Popeyes Louisiana Kitchen, and Taco Bell, among others.
We believe that competition within the fast casualfast-casual restaurant segment is based primarily on ambience, price, taste, quality, and freshness of menu items, as well as on the convenience of drive-thru service. We also believe that QSR competition is based primarily on quality, taste, speed of service, value, brand recognition, restaurant location, and customer service. In addition, we compete with franchisors of other restaurant concepts for prospective franchisees.
Environmental Matters
Our operations are also subject to federal, state, and local laws and regulations relating to environmental protection, including regulation of discharges into the air and water, storage and disposal of liquid and solid waste, and clean-up of contaminated soil and groundwater. Under various federal, state, and local laws, an owner or operator of real property may be liable for the cost of removal or remediation of hazardous or toxic substances on, in, or emanating from that property. Such liability may be imposed without regard to whether the owner or operator knew of, or was responsible for, the presence of such hazardous or toxic substances.
Certain of our properties may be located on sites that we know or suspect have been used by prior owners or operators as retail gasgasoline stations. Such properties previously contained underground storage tanks (“USTs”), for gasoline storage, and while we are not aware of any sites with USTs remaining, it is possible that some of these properties may currently contain abandoned USTs. We are aware of contamination from a release of hazardous materials by a previous owner or operator at two of our owned properties and one of our leased properties. We do not believe that we have contributed to the pre-existing contamination at any of these properties. The appropriate state agencies have been notified, and these issues are being handled without disruption to our business. It is possible that petroleum products and other contaminants may have been released at other properties into the soil or groundwater. Under applicable federal and state environmental laws, we, as the current owner or operator of these sites, may be jointly and severally liable for the costs of investigation and remediation for anycertain contamination. Although we lease most of our properties, and, when we own, we obtain certain assurances from the prior owner or often obtain indemnity agreements from third parties, we cannot assure you that we will notmay nonetheless be liable for environmental conditions relating to our prior, existing,current, or future restaurants or restaurant sites. If we were found liable for the cost of remediation of contamination at, or emanating from, any of our properties, our operating expenses would likely increase and our operating results would likely be adversely affected and, in extraordinary circumstances, our operating results could be materially and adversely affected.
Since 2000, we have obtained “Phase One” environmental reportsEnvironmental Site Assessments (assessing whether current or historical property uses have impacted soil or groundwater beneath the property, posing a threat to the environment and/or human health) for new restaurants. Where warranted, we obtain updated reports, and, if necessary, in rare cases, we obtain “Phase Two” reports.Environmental Site Assessments (evaluating the presence or absence of petroleum products or hazardous substances via soil and/or groundwater sampling). We have not conducted a comprehensive subsurface environmental review of all of our properties or operations. No assurance can be given that we have identified all of the potential environmental liabilities at our properties or that such liabilities will not have a material adverse effect on our financial condition.
9
Regulation and Compliance
We and our franchisees are subject to various federal, state and local laws and regulations that govern our business operations, including those governing:
| ● | employment and wage and hour practices, including, but not limited to, minimum wage rates, overtime, meal and rest periods, prevention of discrimination, harassment, and retaliation, employment of minors, paid and family leave, unemployment tax rates, workers’ compensation rates, suitable seating, and citizen requirements, and other working conditions; |
| ● | privacy and data security, including the collection, maintenance and use of information regarding employees and guests; |
| ● | compliance with the Americans with Disabilities Act and similar laws affording various protections and accommodations to employees and guests with disabilities; |
| ● | environmental practices, including the discharge, storage, handling, release and disposal of hazardous or toxic substances; regulation of discharges into the air, water and soils, storage and disposal of liquid and solid waste, and clean-up of contaminated soil and groundwater, and regulations restricting the use of straws, utensils and the certain packaging materials; |
| ● | compliance with Federal Trade Commission and laws that govern the franchisor-franchisee relationship, including the offer and sale of franchises and certain disclosures to franchisees; |
| ● | the preparation, sale and labeling of food, including regulations of the Food and Drug Administration, which oversees the safety of the entire food system, including inspections and mandatory food recalls, menu labeling and nutritional content; |
| ● | working conditions, health, sanitation, safety and fire standards, building and zoning requirements, public accommodations and safety conditions, environmental matters, and data privacy; |
| ● | building and zoning requirements, including state and local licensing and regulation governing the design and operation of facilities and land use; |
| ● | health and sanitation and public safety; and |
| ● | restaurant operations related to COVID-19. |
We require each of our franchise partners to comply with all federal, state and local laws and regulations. We have processes in place to monitor our own compliance with the numerous, complex, applicable laws and regulations governing our operations.
We are subject to extensivenew, varied and ever-changing rules and regulations regarding the current COVID-19 pandemic, which have materially impacted our earnings and resulted in significant capital expenditures. New federal, state and local government regulations regarding COVID-19 are issued and existing regulations are frequently revised, which materially affected, and continues to affect, our operations. Such regulations govern, for example, employee leave, opening and closing of restaurants and dining rooms, business hours, sanitation practices, guest spacing within dining rooms and other social distancing practices and personal protective equipment.
Other than as described above, the Company’s compliance with federal, state or local laws and regulations, including thoseenvironmental laws, is not expected to materially affect our earnings or competitive position or result in material capital expenditures. However, we cannot predict what laws will be enacted in the future, or how existing or future laws will be administered, interpreted or enforced. We also cannot predict the amount of future expenditures that we may need to make to comply with, or to satisfy claims and lawsuits relating to, among other things, public healththese various laws and safety,regulations. Further, more stringent and varied requirements of local government bodies with respect to zoning, land use and fire codes,environmental factors could delay construction and franchising. Failures to obtain or retain food or other licenses and registrations, or exemptions thereto, would adversely affect the operations ofincrease development costs for new restaurants. AlthoughMoreover, although we have not experienced, and do not anticipate, any significant problems in obtaining required licenses, permits, or approvals, any difficulties, delays, or failures in obtaining such licenses, permits, registrations, exemptions, or approvals could delay or prevent the opening of, or adversely impact the viability of, a restaurant in a particular area.
10
See Item 1A “Risk Factors” and “Environmental Matters” above in this Form 10-K for a discussion of the various regulatoryrisks relating to federal, state, local and compliance risks that we face, see Item 1A, “Risk Factors.”
Management Information Systems
All of our company-operated and franchised restaurants use computerized point-of-sale and back-office systems, which we believe can scale to support our long-term growth plans. Our point-of-sale system provides a touch-screen interface and is integrated with segmented EMVEuropay, Mastercard and Visa tokenized high speed credit and gift card processing hardware. Our point-of-sale system is used to collect daily transaction data, which provides daily sales and product mix information that we actively analyze.
Our in-restaurant back-office computer system is designed to assist in the management of our restaurants and to provide labor and food cost management tools. The system also provides corporate headquarters and restaurant operations management quick access to detailed business data, and reduces the time spent by restaurant managers on administrative needs. The system further provides sales, bank deposit, and variance data to our accounting department on a daily basis. For company-operated restaurants, we use this data to generate weekly consolidated reports regarding sales and other key measures, as well as preliminary weekly profit and loss statements for each location, with final reports following the end of each period.
Human Capital
As of December 27, 2017,28, 2022, we had approximately 5,6374,931 employees, of whom approximately 5,4774,766 were hourly restaurant employees comprised of 4,5363,883 crewmembers, 204191 general managers/acting general managers, 231108 assistant managers, 378542 shift leaders, and 12842 employees in limited-time roles as acting managers or as managers in training. The remaining 160165 employees were corporate and office personnel. None of our employees are part of a collective bargaining agreement, and we believe that our relationships with our employees are satisfactory.
We believe our efforts to maintain solid relationships with our employees are effective and are grounded in our company values. Our primary human capital objective is employee engagement, which is dependent upon hiring, retaining, developing and motivating employees. We strive to build a culture centered around our mission, which is to “Feed the Love that Makes Us All Feel Like Family” and “Heart-Centered Leadership.” We believe this mission is predicated on servant-led leadership, employee recognition and community involvement. We offer our employees both online and on-the-job training. Restaurant management trainees participate in comprehensive, multi-week training programs touching on all aspects of the operations, including restaurant leadership. We provide key restaurant leadership roles with a quarterly cash-based performance bonus awards. Our corporate employees are provided an annual performance bonus award. We also have an equity incentive compensation plan to provide certain management-level or other key employees with stock-based awards. We monitor our progress with metrics such as employee performance measures, turnover rates and restaurant customer surveys.
The health and well-being of our employees and guests have always been and continues to be our top priority. We have maintained enhanced safety measures and continue to monitor cases of COVID-19 to help protect the health and well-being of all of our employees. In 2022, we also continued to provide extended sick leave benefits to employees impacted by COVID-19.
Seasonality
Seasonal factors, including weather and the timing of holidays, cause our revenue to fluctuate from quarter to quarter. Our revenue per restaurant is typically lower in the first and fourth quarters due to reduced January and December transactions and higher in the second and third quarters. As a result of seasonality, our quarterly and annual results of operations and key performance indicators such as company restaurant revenue and comparable restaurant sales may fluctuate.
Available Information
We make available free of charge on our Internet website our annual reports on Form 10-K,Annual Reports, quarterly reports on Form 10-Q, current reports on Form 8-K, and amendments to those reports filed or furnished pursuant to Section 13(a) or 15(d) of the Securities Exchange Act of 1934, as amended (the “Exchange Act”) (15 U.S.C. 78m(a) or 78o(d)), as soon as reasonably practicable after we
11
electronically file such material with, or furnish it to, the Securities and Exchange Commission (“SEC”). Our Internet address is www.elpolloloco.com. The contents of our Internet website are not part of this annual report, and are not incorporated by reference. Our Internet address is provided as an inactive textual reference only.
The SEC also maintains an Internet site that contains reports, proxy and information statements, and other information regarding issuers, including us, that file electronically with the SEC, at http://www.sec.gov.
ITEM 1A.RISK FACTORS
You should carefully consider the following risk factors, as well as other information contained in this report, including our financial statements and the notes related to those statements. The occurrence of any of the following risks could materially and adversely affect our business, prospects, financial condition, results of operations, and cash flow.
COVID-19 has disrupted, and may continue to disrupt, our restaurant operations, including by causing temporary closures of some restaurants, closures of dining rooms, limited capacity restrictions and/or decreased operating hours for some restaurants due to government mandates and/or staffing shortages. Any future pandemic, epidemic or public health emergency may result in similar closures or restrictions that negatively impact our business.
If additional surges of COVID-19 at a significant number of our locations require us to temporarily close those locations for disinfection or result in a large number of our employees becoming ill with COVID-19 or quarantined and being unable to work, our business and results of operations could be further adversely affected, which may also impact our financial condition. Further, any shutdowns, closures or disruptions in the operations of our suppliers caused by COVID-19 outbreaks or federal, state or local mandates to limit the spread of outbreaks of COVID-19 or other diseases could limit the ability of suppliers to supply us and our franchisees with the products needed to operate our business, which would negatively impact our business. COVID-19 or other public health crises may also adversely affect our ability to implement our growth plans, including delays in the opening or construction of new restaurants or the remodel of existing restaurants.
As the duration and severity of the COVID-19 pandemic, including the severity and transmission rates of COVID-19 variants, resurgences of COVID-19 that may continue to occur, and the efficacy of COVID-19 vaccines, continues to be uncertain at this time, it is difficult to forecast any long-term impacts on our future operating results. However, if the COVID-19 pandemic continues for a sustained period of time or if conditions worsen, our sales and operating costs may be materially adversely affected, which could impact our asset values, including goodwill, derivative instruments and long-lived assets, as well as our ability to meet certain covenant provisions in our debt arrangementsin future periods, and have a material adverse effect on our financial results, future operations and liquidity.
Even after the COVID-19 pandemic has subsided, we may continue to experience negative impacts to our financial results due to COVID-19’s impact on the economy in general, globally, nationally and in the locate markets in which we operate, including the availability of credit generally, adverse impacts on our liquidity, and/or decreases in consumer discretionary spending that depress demand for our products. The global effects of the pandemic may also contribute to a prolonged economic downturnslowdown or recession. In addition, even after the COVID-19 pandemic has subsided, the perceived risk of infection or a resurgence or concern of a resurgence of COVID-19 or other diseases may continue to adversely affect traffic to our restaurants and, in turn, may have a material adverse effect on our business, liquidity, financial condition and results of operations. We are also subject to all of the foregoing risks in connection with the outbreak of other diseases, epidemics or pandemics, or similar public threats or fear of such events.
We may be unsuccessful in opening new company-operated or franchised restaurants or in establishing new markets, which could materiallyadversely affect usour growth.
One of the key means to achieving our growth strategy is and will be through opening new restaurants and operating those restaurants on a profitable basis. We opened four new company-operated restaurants in fiscal 2022 and plan to
12
open four to six in fiscal 2023. Our franchisees opened nine new restaurants in fiscal 2022 and plan to open eight to twelve in fiscal 2023.
The ability to open new restaurants is dependent upon a number of factors, many of which are beyond our control, including our and our franchisees’ abilities to: identify available and suitable restaurant sites; compete for restaurant sites; reach acceptable agreements regarding the lease or purchase of locations; obtain or have available the financing required to acquire and operate a restaurant, including construction and opening costs; respond to unforeseen engineering or environmental problems with leased premises; avoid the impact of inclement weather and natural and man-made disasters; hire, train, and retain the skilled management and other employees necessary to meet staffing needs; obtain, in a timely manner and for an acceptable cost, required licenses, permits, and regulatory approvals; respond effectively to any changes in local, state, and federal law and regulations that adversely affect our and our franchisees’ costs or abilities to open new restaurants; and control construction and equipment cost increases for new restaurants.
If we are unable to successfully manage these risks and open new restaurants or sign new franchisees as anticipated, or if restaurant openings are significantly delayed, we could face increased costs and lower than anticipated sales and earnings in future periods.
As part of our longer-term growth strategy, we may enter into geographic markets in which we have little or no prior operating or franchising experience, including through company-operated restaurant growth and franchise development agreements. The challenges of entering new markets include (i) difficulties in hiring and training experienced personnel, (ii) unfamiliarity with local real estate markets and demographics, (iii) consumer unfamiliarity with our brand, and (iv) competitive and economic conditions, consumer tastes, and discretionary spending patterns that are different from and more difficult to predict or satisfy than in our existing markets. Any failure on our part to recognize or respond to these challenges may adversely affect the success of any new restaurants. Expanding our franchise system could require the implementation, expense, and successful management of enhanced business support systems, management information systems, and financial controls, as well as additional staffing, franchise support, and capital expenditures and working capital.
Due to brand recognition and logistical synergies, as part of our growth strategy, we also intend to open new restaurants in areas where we have existing restaurants. The operating results and comparable restaurant sales for our restaurants could be adversely affected due to increasing proximity among our restaurants and due to market saturation.
We may not be able to compete successfully, including with other quick-service and fast casual restaurants.
The food service industry, and particularly its QSR and fast casual segments, is intensely competitive. Competition in our industry is primarily based on price, convenience, quality of service, brand recognition, restaurant location, and type and quality of food, and our market position is based on balancing price and quality. These competitive factors are particularly applicable in markets in which we have expanded relatively rapidly and relatively recently, such as Texas. In addition, the greater Los Angeles area, the primary market in which we compete, consists of what we believe to be the most competitive Mexican-inspired QSR and fast casual market in the future.
We are vulnerable to changes in political and economic conditions and consumer preferences.
The restaurant industry is dependent upon consumer discretionary spending. A prolongedspending, which may be affected by general global economic downturnconditions or an economic recession could impactother business conditions that may affect the public’sdesire or ability of our customers to purchase our products, including recessions or inflationary pressures, which have caused, and desiremay continue to spendcause, increased labor, commodity and utilities costs. In addition, we may be affected by higher consumer debt and interest rates, adverse
13
conditions in the mortgage housing markets, high unemployment levels, increases in gas prices, declines in median income growth, lower consumer confidence, lower consumer discretionary dollars as a result of job losses, home foreclosures, significantly-reduced home values, investment losses, bankruptcies,spending and reduced accessuncertainties due to credit, which could result in lower levels of customer transactionsgeopolitical turmoil and lower average check sizes in our restaurants.potential national or international security concerns, including the conflict between Russia and Ukraine. If the economy experiences anothera significant decline, our business, results of operations, our ability to access the capital markets and our ability to comply with the terms of our secured revolving credit facility could be materially and adversely affected, and we and our franchisees might decelerate the number and timing of new restaurant openings. Deterioration in customer transactions openings and/or a reduction in average check size would negatively impact our revenues and our profitability and could result in further reductions in staff levels, additional impairment charges, and potentialthe number of planned restaurant closures.
Additionally, changes in consumer health perceptions or trends in eating habits may also adversely affect our business if we are unable to effectively adapt our menu offerings. Our success is dependent upon continued customer acceptance of our Mexican-inspired food and customer health perceptions regarding our products. A decrease in American consumers’ interest in Mexican-inspired food or chicken-based food, or changes in customer health perceptions of our food could harm our brand and profitability. We cannot make any assurances regarding our ability to effectively respond to changes in consumer preferences or our ability to develop new products that appeal to consumer preferences.
If we are unable to attract, develop, assimilate, and retain employees, we may not be able to grow or successfully operate our business.
Our success depends in part upon our ability to attract, train, assimilate, and retain a sufficient number of employees, including crewmembers, managers and shift leaders, who understand and appreciate our culture, are able to represent our brand effectively and establish credibility with our customers. If we are unable to hire and retain restaurant employees capable of consistently providing a high level of customer service, understanding of our customers, and knowledge of our offerings, our ability to open new restaurants may be impaired, the performance of our existing and new restaurants could be adversely affected, and our brand image may be negatively impacted. Our growth strategy will require us to attract, train, and assimilate even more restaurant employees. Our ability to do so may be adversely affected by labor shortages due to, among other things, the COVID-19 pandemic and the cost of related overtime pay requirements.
Our business is geographically concentrated in the greater Los Angeles area, and we could be negatively affected by conditions specific to that region.
Our company-operated and franchised restaurants in the greater Los Angeles area generated, in the aggregate, approximately 73%71.2% of our revenue in fiscal 20172022 and approximately 75%70.9% in fiscal 2016.2021. Adverse changes in demographic, unemployment, economic, or regulatory conditions in the greater Los Angeles area or in the State of California, including, but not limited to, enforcement policies for and changes in immigration law, have had and may continue to have material adverse effects on our business.
We believe that an increase in unemployment would have a negative impact on transactions in our restaurants. As a result of our concentration in the greater Los Angeles area, we have been disproportionately affected by the above adverse economic conditions as compared to other national chain restaurants.
14
Our growth strategylong-term success depends in part on openingour ability to effectively identify and secure appropriate sites for new restaurants.
In order to build new restaurants, we must first identify markets where we can enter or expand our footprint, taking into account numerous factors, including the location of our current restaurants, local economic trends, population density, area demographics, cost of construction and real estate and geography. Then we must secure appropriate restaurant sites, which is one of our biggest challenges. There are numerous factors involved in identifying and securing an appropriate restaurant site, including: evaluating size of the site, traffic patterns, local retail, residential and business attractions and infrastructure that will drive high levels of customer traffic and sales; competition in new markets, including competition for restaurant sites; financial conditions affecting developers and potential landlords, such as the effects of macro-economic conditions and the credit market (including the potential for rising interest rates), which could lead to these parties delaying or canceling development projects (or renovations of existing projects), in turn reducing the number of appropriate restaurant sites available; developers and potential landlords obtaining licenses or permits for development projects on a timely basis; proximity of potential restaurant sites to existing restaurants; anticipated commercial, residential and infrastructure development near the potential restaurant site; and availability of acceptable lease terms and arrangements, including construction costs.
In addition, competition for restaurant sites in our target markets can be intense, and development and leasing costs are increasing. Given the numerous factors involved, we may not be able to successfully identify and secure attractive restaurant sites in existing, and new markets and expanding our franchise system. We may be unsuccessful in opening new company-operatedadjacent or franchised restaurants or in establishing new markets, which could adversely affect our growth.
We have incurred, and may continue to incur, significant impairment of certain of our assets, in particular in our new markets.
The recognition of impairment charges may adversely affect our future operations and results. In assessing the carrying value of the assets of 21 restaurants, in Arizona, California and Texas, may not be recoverable. Additionally, we made a strategic decision to close two additional restaurants in Texas. As a result, we recorded a $32.6 million impairment expense. The impairment expense for fiscal 2017 includes an impairment expense of $27.7 million, representing the entire remaining value of capitalized assets of allrecoverability of our company-operated restaurantslong-lived assets, we consider changes in Texas, neteconomic conditions and make assumptions regarding estimated future cash flows and other factors. There is uncertainty in the projected undiscounted future cash flows used in our impairment review analysis, which requires the use of previously recorded depreciation. Factors which led toestimates and assumptions. If actual performance does not achieve the impairment of our Texas restaurants include recent results, which indicates thatprojections, or if the restaurants have not achievedassumptions used change in the sales volumesfuture, we may be required to generate positive cash flows or improve profitabilityrecognize impairment charges in the Texas market, along with the related future cash flow assumptions, including comparable sales rate growthperiods, and restaurant operating costs, over the remaining lease terms and the age of the restaurants in Texas. The restaurants in Texas began opening in late 2014, causing a higher net book value at the time of impairment testing, and increased difficulty projecting results for newer restaurants in newer markets.such charges could be material. Given the difficulty in projecting results for newer restaurants in newer markets, as well as the impact of the COVID-19 pandemic, we are also monitoringmonitor the recoverability of the carrying value of the assets of several other restaurants on an ongoing basis, including those in the Arizona and Northern California markets. For those restaurants, if expected performance improvements are not realized, an impairment charge may be recognized in future periods, and such charge could be material.basis. Asset impairments outside of Texas, or impairments to new units or future capital expenditures could present additional exposure. Closures could also require additional expenditures. Furthermore, franchised unit closings could result in the loss of franchise revenue and have other adverse effects on us.
Changes in food, and supply costs, especially for chicken, labor, construction and utilities could adversely affect our business, financial condition, and results of operations.
Our profitability depends in part on our ability to anticipate and react to changes in the cost of food, supplies, labor, construction and supply costs. Weutilities. In 2022, the costs of commodities, labor, energy and other inputs necessary to operate our restaurants have significantly increased. In addition, we are susceptible to increases in food costs as a result of factors beyond our control, such as general economic conditions, seasonal economic fluctuations, weather conditions, global demand, food shortages, food safety concerns, infectious diseases, fluctuations in the U.S. dollar, cyber-attacks, transportation issues, product recalls, and government regulations, including tariffs and other import restrictions on foreign produce and other goods. At times the costsIn 2021 and continuing into 2022, for example, we experienced inflationary pressures due to supply chain disruptions that adversely impacted and may continue to adversely impact our business and results of many foods for humans and animals, including corn, wheat, corn flour and other flour, rice, and cooking oil, have increased markedly, resulting in upward pricing pressures on almost all of our raw ingredients, including chicken and other meats, and increasing our food costs.operations. Environmental and weather-related issues, such as freezes, drought and climate change, may also lead to increases, temporary or permanent, or spikes in the prices of some ingredients, such as produce and meat. Issues affecting the availability of produce, poultry, or other proteins such as shrimp, including blight, disease, and overfishing, have in the past and may in the future also raise their prices. Any increase in the prices of the ingredients most critical to our menu, suchin particular chicken, as chicken,well as corn, cheese, avocados, beans, rice, and tomatoes, could adversely compress our margins, or cause us to raise our prices, reducing customer demand. Alternatively, in the event of cost increases with respect to one or more of our raw ingredients, we might choose to temporarily suspend serving menu items, such as guacamole or one or more of our salsas, rather than pay the increased cost. Additionally, as a substantial volume of produce and other items are procured from Mexico, and occasionally other countries including Chile and Peru, any new or increased import duties, tariffs or taxes, or other changes in U.S. trade or tax policy could result in higher food and supply costs that would adversely impact our financial results. Any such
15
changes to our menu prices or available menu could negatively impact our restaurant transactions, business, and comparable restaurant sales during the shortage and thereafter.
Our principal food product is chicken. In fiscal 2017, 2016,2022, 2021, and 2015,2020, the cost of chicken included in our product cost was approximately 11.3%11.0%, 12.4%9.9%, and 13.4%10.5%, respectively, of our revenue from company-operated restaurants. Material increases in the cost of chicken could materially and adversely affect our business, operating results, and financial condition. Changes in the cost of chicken can result from a number of factors, including seasonality, increases in the cost of grain, disease, and other factors that affect domestic and international supply of and demand for chicken products. A major driver of the price of corn, which is the primary feed source for chicken, has been the increasing demand for corn by the ethanol industry as an alternative fuel source, as most ethanol plants in the United States primarily use corn to make ethanol. This increased demand on the nation’s corn crop has had and may continue to have an unfavorable impact on chicken prices. Additionally, environmental and animal rights regulations or voluntary programs could increase the cost or supply of chicken and other foods. We often ask our suppliers to use fixed price contracts or other financial risk management strategies to reduce potential price fluctuations in the cost of chicken and other commodities. We have implemented menu price increases in the past to significantly offset increased chicken prices, due to competitive pressures and compressed profit margins. We may not be able to offset all or any portion of increased food and supply costs, or labor, construction and utility costs through higher menu prices in the future. If we implement further menu price increases in the future to protect our margins, average check size and restaurant transactions could be materially and adversely affected, at both company-operated and franchised restaurants.
Social media and negative publicity could have a material adverse impact on our business.
Negative publicity, could reduce sales at some or all of our restaurants.
A variety of additional risks associated with our use of social media include the possibility of improper disclosure of proprietary information, exposure of personally identifiable information of our employees or guests, fraud, or the publication of out-of-date information, any of which may result in material liabilities or reputational damage. Furthermore, any inappropriate use of social media platforms by our franchisees based on, among other things, wage and hour violations, discrimination, harassment, or wrongful termination mayemployees could also create not only legal and financial liability butresult in negative publicity that could damage our reputation, or lead to litigation that increases our costs.
Our ability to continue to expand our digital business, delivery orders and catering is uncertain, and these new business lines are subject to risks.
We rely on third-party providers to fulfill delivery orders, and the ordering and payment platforms used by these third parties, or our mobile app or online ordering system, could be damaged or interrupted by technological failures, user errors, cyber-attacks or other factors, which may adversely affectimpact our sales through these channels and could negatively impact our brand. Additionally, our delivery partners may make errors or fail to make timely deliveries, leading to customer disappointment that may negatively impact our brand. We also incur additional costs associated with using third-party service providers to fulfil these digital orders. Moreover, the third-party restaurant delivery business is intensely competitive, with a number of players competing for market share, online traffic, capital, and delivery drivers and other people resources. The third-party delivery services with which we work may struggle to compete effectively, and if they were to cease or curtail operations or fail to provide timely delivery services in a cost-effective manner, or if they give greater priority on their platforms to our competitors, our delivery business may be negatively impacted. We have also introduced catering offerings on both a pick-up and delivery basis, and customers may choose our competitors’ catering offerings over ours, be disappointed with their experience with our catering, or experience food safety problems if they do not serve our food in a safe manner, which may negatively impact us. Such delivery and catering offerings also increase the risk of illnesses associated with our food because the food is transported and/or served by third parties in conditions we cannot control.
16
We do not have a long history with our catering offering and it is difficult for us to anticipate the level of sales they may generate. In addition, using third party providers to fulfill delivery orders may result in operational challenges, both in fulfilling orders made through these channels and divertin operating our financial and management resources that could otherwise be used to benefit the future performancerestaurants as we balance fulfillment of these orders with service of our operations.traditional in-restaurant guests. Any such operational challenges may negatively impact the customer experience associated with our digital, delivery or catering orders, the guest experience for our traditional in-restaurant business, or both. These types of employee claims could also be asserted against us, on a co-employer theory, by employees offactors may adversely impact our franchisees. A significant increase in the number of these claims, or an increase in the number of successful claims, could materiallysales and adversely affect our business, financial condition, results of operations, and cash flows.
Food-borne illness and other food safety and quality concerns may negatively impact our business and profitability.
Incidents or reports of food- or water-borne illness or other food safety issues, food contamination or tampering, employee hygiene or cleanliness failures, or improper employee conduct at our restaurants could lead to product liability or other claims. Such incidents or reports could negatively affect our brand and reputation as well as our business, revenues, and profits. Similar incidents or reports occurring at quick-service restaurants unrelated to us could likewise create negative publicity, which could negatively impact consumer behavior towards us.
Furthermore, our reliance on third-party food processors makes it difficult to monitor food safety compliance, and may increase the risk that a food-borne illness would affect multiple locations rather than a single restaurant. Some food-borne illness incidents could be caused by third-party food suppliers and transporters outside of our control. New illnesses resistant to our current precautions may develop in the future, or diseases with long incubation periods could arise that could cause claims or allegations on a retroactive basis. One or more instances of food-borne illness in one of our company-operated or franchised restaurants could negatively affect sales at all of our restaurants if highly publicized. This risk would exist even if it were later determined that an illness had been wrongly attributed to one of our restaurants. A number of other restaurant chains have experienced incidents related to food-borne illnesses that have had material adverse impacts on their operations, and we cannot guarantee that we could avoid a similar impact upon the occurrence of a similar incident at one of our restaurants.
Additionally, even if food-bornefood or water-borne illnesses or other food safety issues or incidents were not identified at El Pollo Loco restaurants, our restaurant sales could be adversely affected, both financially and otherwise, if instances of food-borne illnessessimilar incidents or reports at other QSRs or restaurant chains were highly publicized. In addition, our restaurant sales could be adversely affected by publicity regarding other high-profile illnesses such as avian flu that customers may associate with our food products.
Failure to receive timely deliveries of food or other supplies could result in a loss of revenue and materially and adversely impact our operations.
Our and our franchisees’ ability to maintain consistent quality menu items and prices significantly depends upon our ability to acquire fresh food products, including the highest-quality chicken and related items, from reliable sources, in accordance with our specifications and on a timely basis. Shortages or interruptions in the supply of fresh food products, caused by unanticipated demand, problems in production, distribution or distribution,otherwise in the supply chain, including as a result of the COVID-19 pandemic and restrictions implemented to counter its spread, contamination of food products, an outbreak of poultry disease, inclement weather, or other conditions, could materially and adversely affect the availability, quality, and cost of ingredients, which would adversely affect our business, financial condition, results of operations, and cash flows. We have contracts with a limited number of suppliers for the chicken and other food and supplies for our restaurants. Further, increases in fuel prices could result in increased distribution costs. In addition, one company distributes substantially all of the products that we receive from suppliers to company-operated and franchised restaurants. If that distributor or any supplier fails to perform as anticipated or seeks to terminate agreements with us, or if there is any disruption in any of our supply or distribution relationships for any reason, including our ability to replace any lost distributor or supplier, our business, financial condition, results of operations, and cash flows could be materially and adversely affected. If we or our franchisees temporarily close a restaurant or remove popular items from a restaurant’s menu as a result of such a disruption, that restaurant may experience a significant reduction in revenue if our customers change their dining habits as a result.
Our level of indebtedness, and restrictions under our credit facility, could materially and adversely affect our business, financial condition, and results of operations.
Our level of indebtedness could have significant effects on our business, such as:
17
adverse changes in general economic, industry, government regulatory, and competitive conditions in our business by limiting our ability to plan for and react to changing conditions;
In addition, we may not be able to generate sufficient cash flow from our operations to repay our indebtedness when it becomes due and to meet our other cash needs. If we are not able to pay our debts as they become due, we will be required to pursue one or more alternative strategies, such as selling assets, refinancing or restructuring our indebtedness, or selling additional debt or equity securities. We may not be able to refinance our debt or sell additional debt or equity securities or our assets on favorable terms, if at all, and if we have to sell our assets, that sale may negatively affect our ability to generate revenue.
Our secured revolving credit facility contains a number of covenants that, among other things, restrict, subject to certain exceptions, our ability to (i) incur additional indebtedness, (ii) issue preferred stock, (iii) create liens on assets, (iv) engage in mergers or consolidations, (v) sell assets, (vi) make investments, loans, or advances, (vii) make certain acquisitions, (viii) engage in certain transactions with affiliates, (ix) authorize or pay dividends, and (x) change our lines of business or fiscal year. In addition, our secured revolving credit facility requires us (i) to maintain, on a consolidated basis, a minimum consolidated fixed charge coverage ratio and (ii) not to exceed a maximum lease adjusted consolidated leverage ratio. Our ability to borrow under our secured revolving credit facility depends on our compliance with these tests. Events beyond our control, including changes in general economic and business conditions, may affect our ability to meet these tests. We cannot guarantee that we will meet these tests in the future, or that our lenders will waive any failure to meet these tests.
Further, we are a holding company with no material direct operations. Our principal assets are the equity interests that we indirectly hold in our operating subsidiary, El Pollo Loco, Inc. (“EPL”), which owns our operating assets. As a result, we are dependent on loans, dividends, and other payments from EPL, our operating company and indirect wholly owned subsidiary, and from EPL Intermediate, Inc. (“Intermediate”), our direct wholly owned subsidiary, to compete successfully with other quick-servicegenerate the funds necessary to meet our financial obligations and fast casual restaurants. Intense competition in the restaurant industry could make it more difficult to expand our business, and could also have a negative impactpay dividends on our operating results, if customers favor our competitorscommon stock. Our subsidiaries are legally distinct from us and may be prohibited or if we are forcedrestricted from paying dividends or otherwise making funds available to change our pricing and other marketing strategies.
Our marketing programs may not be successful, and our new menu items, advertising campaigns, and restaurant designs and remodels may not generate increased sales or profits.
We incur costs and expend other resources in our marketing efforts on new menu items, advertising campaigns, and restaurant designs and remodels, to raise brand awareness and to attract and retain customers. Our initiatives may not be successful, resulting in expenses incurred without the benefit of higher revenues. Further, if our marketing and advertising strategies are not successful, we may be forced to engage in additional promotional activities to attract and retain customers, including offers for free or discounted food, and any such additional promotional activities could adversely impact our profitability. Additionally, some of our competitors have greater financial resources than we do, enabling them to spend significantly more on marketing, advertising, and other initiatives. Should our competitors increase spending on marketing, advertising, and other initiatives, or our marketing funds decrease for any reason, or should our advertising, promotions, new menu items, and restaurant designs and remodels be less effective than those of our competitors or not resonate with our customers, there could be a material adverse effect on our results of operations and financial condition.
Adverse changes in the economic environment may affect our franchisees, with adverse consequences to us.
Adverse changes in part onthe economic environment, including inflation and increased labor and supply costs, could result in our franchisees and the manner in which they operate their locations to develop and promote our business. As of December 27, 2017, our top 10 franchisees operated over 66% of our franchised restaurants and two franchisees operated over 35% of our franchised restaurants. Due to the continuing challenging economic environment, it is possible that some franchisees could filefiling for bankruptcy or becomebecoming delinquent in their payments to us, which could have significant adverse impacts on our business, due to loss or delay in payments of (i) royalties, (ii) information technology (“IT”) support service fees, (iii) contributions to our advertising funds, and (iv) other fees. Bankruptcies by our franchisees could (i) prevent us from terminating their franchise agreements, so that we could offer their territories to other franchisees, (ii) negatively impact our market share and operating results, as we might have fewer well-performing restaurants, and (iii) adversely impact our ability to attract new franchisees.
18
Franchisees may not have access to the financial or management resources that they need to open the restaurants contemplated by their agreements with us, or be able to find suitable sites on which to develop those restaurants. Franchisees may not be able to negotiate acceptable lease or purchase terms for restaurant sites, obtain necessary permits and government approvals, or meet construction schedules. Any of these problems could slow our growth and reduce our franchise revenue. Additionally, our franchisees typically depend on financing from banks and other financial institutions, which may not always be available to them, in order to construct and open new restaurants. For these reasons, franchisees operating under development agreements may not be able to meet the new restaurant opening dates required under those agreements. Also, we sublease certain restaurants to some existing California franchisees. If any such franchisees cannot meet their financial obligations under their subleases, or otherwise fail to honor or default under the terms of their subleases, especially where state franchise laws may limit our ability to terminate or modify these franchise arrangements, we will be financially obligated under a master lease and could be materially and adversely affected. In the past, franchisees have entered bankruptcy or receivership, which can lead to sale or closure of franchises, cause underperformance or underinvestment in capital expenditures, or lead to nonpayment of us or other creditors, and these circumstances could recur in the future.
We have limited control with respect to the operations of our franchisees, which could have a negative impact on our business.
As of December 28, 2022, approximately 62% of our restaurants were franchised restaurants, therefore, our success relies on the financial success and cooperation of our franchisees, yet we have limited influence over their operations. Franchisees are independent business operators. They are not our employees, and we do not exercise control over the day-to-day operations of their restaurants. We provide training and support to franchisees, and set and monitor operational standards, but the quality of franchised restaurants may be diminished by any number of factors beyond our control. Consequently, franchisees may fail to operate their restaurants in fashions consistent with our standards and requirements, or to hire and train qualified managers and other restaurant personnel. If franchisees do not operate to our expectations, our image and reputation, and the images and reputations of other franchisees, may suffer materially, and system-wide sales could decline significantly.
If our relations with existing or potential franchisees deteriorate, restaurant performance and our development pipeline could suffer.
Our growth depends on maintaining amicable relations with our franchisees. Franchisees, as independent business operators, may from timefranchisees, including their participation in and adherence to time disagree with us and our strategies regarding the business orrestaurant operating guidelines. Because our interpretation ofability to control our respective rights and obligations under the franchise agreement. Disagreementfranchisees is limited, disagreement may lead to inaction by our franchisees with respect to our initiatives, or even disputes with our franchisees, and we expect suchin court, arbitration or otherwise, including disputes related to an actual or alleged violation of contractual, statutory or common law obligations. Such disputes occur from time to time as we continue to offer franchises. Disputes between usfranchises due to our size and our franchisees, whether in
Our self-insurance programs may expose us to significant and unexpected costs and losses.
We currently maintain employee health insurance coverage on a self-insured basis. We do maintain stop loss coverage which sets a limit on our liability for both individual and aggregate claim costs.
We currently record a liability for our estimated cost of claims incurred and unpaid as of each balance sheet date. Our estimated liability is recorded on an undiscounted basis and includes a number of significant assumptions and factors, including historical trends, expected costs per claim, actuarial assumptions, and current economic conditions. Our history of claims activity for all lines of coverage is closely monitored, and liabilities are adjusted as warranted based on changing circumstances. It is possible, however, that our actual liabilities may exceed our estimates of loss. We may also experience an unexpectedly large number of claims that result in costs or liabilities in excess of our projections, and
19
therefore we may be required to record additional expenses. For these and other reasons, our self-insurance reserves could prove to be inadequate, resulting in liabilities in excess of our available insurance and self-insurance. If a successful claim is made against us and is not covered by our insurance or exceeds our policy limits, our business may be negatively and materially impacted.
We are locked into long-term and non-cancelable leases, and may be unable to renew leases at the ends of their terms.
Many of our restaurant leases are non-cancelable and typically have initial terms of up to 20 years andwith up to threefour renewal terms of five years that we may exercise at our option. Even if we close a restaurant, we may remain committed to perform our obligations under the applicable lease, which could include, among other things, payment of the base rent for the balance of the lease term. In addition, in connection with leases for restaurants that we will continue to operate, we may, at the end of the lease term and any renewal period for a restaurant, be unable to renew the lease without substantial additional cost, if at all. As a result, we may close or relocate the restaurant, which could subject us to construction and other costs and risks. Additionally, the revenue and profit, if any, generated at a relocated restaurant might not equal the revenue and profit generated at its prior location.
Risks Related to Information Technology and Data Security
Information technology system failures or breaches of our franchisees are subjectnetwork security could interrupt our operations and adversely affect our business.
From time to extensive government regulations that could resulttime, we experience security events within our networks and systems. These security events have included, and, may in claims leading to increased coststhe future include, those caused by physical or electronic break-ins, computer viruses, malware, worms, attacks by hackers or foreign governments, unauthorized access through the use of compromised credentials and restrict our ability to operatetampering, including through social engineering such as phishing attacks, coordinated denial-of-service attacks, exploitation of design flaws, bugs or sell franchises.
If we are unable to protect our customers’ payment method data or personal information, we could be exposed to data loss, litigation, liability, and reputational damage.
We collect and retain personnel.
We are also subject to regulationfederal and state laws regulating the collection and use of personal information of our employees and customers, including the California Consumer Privacy Act (“CCPA”), which took effect January 1, 2020, and the California Privacy Rights Act (“CPRA”), which was approved in November 2020, and beginning in January 2023 will
20
impose additional data protection obligations on companies doing business in California. In addition, our ability to accept credit/debit cards as payment in our restaurants and online depends on us maintaining our compliance status with standards set by the Federal Trade CommissionPCI Security Standards Council, which require certain levels of system security and subjectprocedures to state laws that governprotect our customers’ credit/debit card information as well as other personal information. Compliance with these standards and regulations may impose significant costs on us. Further, while we have implemented policies and procedures to ensure compliance with the offer, sale, renewal,CCPA, the manner in which the California Attorney General may interpret and terminationenforce the CCPA is uncertain. The potential effects of franchisesthe CCPA and CRPA are far-reaching and may require us to modify our relationships with our franchisees. Failuredata processing practices and policies and incur substantial costs and expenses in an effort to comply with these lawsregulations. There is also the potential for increased regulatory enforcement by the state agencies empowered to enforce these laws. Noncompliance with the CCPA, CRPA and regulations in any jurisdiction or to obtain required approvalsother privacy laws could result in a ban on injunctions, fines and/or temporary suspension of franchise sales, fines,proceedings against us by governmental agencies or the requirement that we make a rescission offerothers. There could also be uncertainty surrounding compliance with privacy laws in other jurisdictions such as state-specific laws which may conflict with existing legislation or future laws and regulations.
Risks Related to Intellectual Property
The failure to enforce and maintain our franchisees, any of which could affecttrademarks and protect our ability to open new restaurants in the future and thusother intellectual property could materially and adversely affect our business, including our ability to establish and maintain brand awareness.
The success of our business strategy depends on our ability to use our existing trademarks and service marks in order to increase brand awareness and further develop our branded products. If our efforts to protect our intellectual property are inadequate, or if any third-party misappropriates or infringes upon our intellectual property, whether in print, on the Internet, or through other media, our brands and branded products could fail to maintain or achieve market acceptance and the value of our brands could be harmed, materially and adversely affecting our business. In addition, the laws of some foreign countries do not protect intellectual property rights to the same extent as do the laws of the United States. Any litigation to enforce our intellectual property rights will likely be costly and may not be successful.
We maintain the recipe for our chicken marinade, as well as certain proprietary standards, specifications, and operating results.procedures, as trade secrets or confidential proprietary information. We may not be able to prevent the unauthorized disclosure or use of our trade secrets or proprietary information, despite the existence of confidentiality agreements and other measures. While we try to ensure that the quality of our brands and branded products is maintained by all of our franchisees, we cannot be certain that these franchisees will not take actions that adversely affect the value of our intellectual property or reputation. If any of our trade secrets or proprietary information were to be disclosed to or independently developed by a competitor, our business, financial condition, and results of operations could be materially and adversely affected.
In addition, we may face claims of infringement that could interfere with our ability to market our restaurants and promote our brand. Any such failurelitigation may be costly and could divert resources from our business. Moreover, if we are unable to successfully defend against such claims, we may be prevented from using our trademarks or service marks in the future and may be liable for damages, which in turn could have a material adverse effect on our business, financial condition and results of operations.
Risks Related to Government Regulation and Litigation
Matters relating to employment and labor law may adversely affect our business.
Various federal, state and local labor laws govern our relationships with our employees and affect operating costs. These laws include employee classifications as exempt or non-exempt, minimum wage requirements, unemployment tax rates, workers’ compensation rates, citizenship requirements, and other wage and benefit requirements for employees classified as non-exempt. Significant additional government regulations and new laws mandating increases in minimum wages or benefits such as health insurance could materially affect our business, financial condition, operating results, and cash flow. In particular, our labor and regulatory compliance costs could be adversely impacted as a result of the FAST Act, which was signed into law in September 2022. The FAST Act, which will take effect if approved by voters in November 2024, authorizes the creation of a council to set minimum standards for workers in the industry, including for wages, working hours, and other health and safety conditions. The implementation of the FAST Act could result in increased labor cost at our California restaurants thereby potentially impacting the profitability of our California restaurants. Further, this bill could prompt similar legislation in other states. In addition, the unionization of our
21
employees and of the employees of our franchisees could materially affect our business, financial condition, operating results, and cash flow.
Employee claims against us or our franchisees based on, among other things, wage and hour violations, discrimination, harassment, or wrongful termination may also create not only legal and financial liability but negative publicity that could adversely affect us and divert our financial and management resources that could otherwise be used to benefit the future performance of our operations. These types of employee claims could also subjectbe asserted against us, to liability toon a co-employer theory, by employees of our franchisees.
We are increasinglyfrom time to time the target of class action lawsuits and other claims proceedings, which could adversely affect our business and results of operations.
Our business is subject to environmental regulations,the risk of litigation by employees, customers, suppliers, stockholders, and others through private actions, class actions, administrative proceedings, regulatory actions, and other litigation, including actions regarding workplace and employment conditions, discrimination, and similar matters, and we are currently a party to wage and hour class action lawsuits. See additional information presented in Note 13 “Commitments and Contingencies—Legal Matters” in the accompanying “Notes to Consolidated Financial Statements” in this Annual Report. Occasionally, our customers file complaints or lawsuits against us alleging that we are responsible for some illnesses or injuries that they suffered at or after a visit to one of our restaurants, including actions seeking damages resulting from food-borne illnesses or accidents in our restaurants. We are also subject to a variety of other claims from third parties arising in the ordinary course of our business, including contract claims. The restaurant industry has also been subject to a growing number of claims that the menus and actions of restaurant chains have led to the obesity of certain of their customers. We may also be subject to lawsuits from our employees, the U.S. Equal Employment Opportunity Commission, or others alleging violations of federal or state laws regarding workplace and employment conditions, discrimination, and similar matters.
Regardless of whether any claims against us are valid and whether we are liable, claims may be expensive to defend against and divert time and money away from operations. In addition, claims may generate negative publicity, which could reduce customer traffic and sales. Insurance may increasenot be available at all or in sufficient amounts to cover any liabilities with respect to these or other matters. A judgment or other liability in excess of our cost of doinginsurance coverage for any claims, or any adverse publicity resulting from claims, could adversely affect our business and affect the manner in whichresults of operations.
If we operate. Environmental regulations could increase the level ofor our taxation and future regulations could impose restrictionsfranchisees face labor shortages or increase theincreased labor costs, associated with food, food packaging, and other supplies, transportation costs, and utility costs. Complying with environmental regulations may cause our results of operations and growth could be adversely affected.
Labor is a primary component in the cost of operating our company-operated and franchised restaurants. Labor shortages and increased labor costs are subject to suffer. We cannot predict what environmental regulationsnumerous internal and external factors, including higher employee-turnover rates, changes in immigration policy including barriers to immigrants entering, working in, or legislation willremaining in the United States, regulatory changes, prevailing wage rates, including increases in federal, state, or local minimum wages or in other employee benefit costs (including costs associated with health insurance coverage or workers’ compensation insurance), and increased competition we face from other companies for qualified employees. During 2022, we continued to experience a competitive and tight labor market. This was attributed to, among other things, increased federal unemployment subsidies, including unemployment benefits offered in response to the ongoing COVID-19 pandemic, costs associated with COVID-19 related overtime pay and other government regulations. A sustained labor shortage could lead to increased costs, such as increased overtime incurred to meet the demands of our customers and increased wage rates to attract and retain employees. Any failure to meet our staffing needs or any material increases in employee turnover rates could adversely affect our business and results of operations, including our ability to grow our restaurant base. See also our risk factor titled “The COVID-19 pandemic and measures intended to prevent its spread has had, and may continue to have, a significant negative impact on our business, sales, results of operations and financial condition, and any future pandemic, epidemic or public health emergency may result in similar adverse effects” above for labor shortage risks we may face in connection with the COVID-19 pandemic.
Federally-mandated, state-mandated, or locally-mandated minimum wages have recently increased in several jurisdictions, including the State of California and Los Angeles County, and may be enactedfurther raised in the future, how existing orincluding as a result of the FAST Act in California. We may be unable to sufficiently increase our menu prices in order
22
to pass future environmental laws willincreased labor costs on to our customers, in which case our margins would be administered or applied, ornegatively affected. Also, reduced margins of franchisees could make it more difficult to sell franchises. In addition, increases in menu prices by us and our franchisees to cover increased labor costs could have the leveleffect of costslowering sales, which would thereby reduce our margins and the royalties that we may incurreceive from franchisees.
We are subject to extensive laws, government regulation, and other legal requirements and our failure to comply with existing or satisfy claimsnew laws and regulations could adversely affect our operational efficiencies, ability to attract and retain talent and results of operations.
Our business is subject to extensive federal, state and local laws and regulations, including those relating to suchthe preparation, sale and labeling of food and beverages, labor and employment practices and working conditions, health, sanitation, safety and fire standards, building and zoning requirements, registration, offer, sale, termination and renewal of franchises, public accommodations and safety conditions, environmental matters, and consumer protection and privacy obligations. See Item 1 “Business—Regulation and Compliance” for further information. We are also subject to laws and regulations.
Compliance with these laws and regulations, and future new laws or changes in these laws or regulations that impose additional requirements, can be costly. Any failure or perceived failure to comply with these laws or regulations could result in, among other things, revocation of required licenses, administrative enforcement actions, fines and civil and criminal liability.
Changes in health, safety, construction, labor, environmental, or other laws or regulations, including changes to or repeal of the PPACA,Patient Protection and Affordable Care Act (“PPACA”), could impose costs upon us, including transition costs. Such transition costs could include uncertainties about how the new laws or regulations might be interpreted, enforced, or litigated by either regulators or private parties. Such changes could also have economic implications for our customers. For example, changes to health insurance law could diminish our customers’ disposable incomes and thus reduce their frequency of eating or ordering out, even from QSR or fast casual restaurants, including us.
Legislation and regulations requiring the display and provisionregarding certain of nutritional information for our menu offerings, new information or attitudes regarding diet and health, or adverse opinions about the health effects of consuming our menu offerings, could affect consumer preferences and negatively impact our results of operations.
Further, certain government authorities have adopted or may adopt laws and regulations regarding trans-fats, sodium, sodas or other ingredients or products used or sold by our restaurants. While only a small number of our ingredients contain trans-fats in trace amounts, these regulations may require us to limit or remove ingredients from our products, which could affect product tastes, customer satisfaction levels, and sales volumes. Transitioning to higher-cost ingredients may also hinder our ability to operate in certain markets and proposed tax increases on certain products, such as sodas, may affect sales volumes of those products. Changes in government regulation and consumer eating habits may impact our business as a result of changes in attitudes regarding diet and health or new information regarding the health effects of consuming our menu offerings. These changes have resulted in, and may continue to result in, the enactment of laws and regulations that impact the ingredients and nutritional content of our menu offerings, or laws and regulations requiringrequire us to disclose the nutritional content of our foodmenu offerings.
We may become subject to liabilities arising from environmental laws that could likely increase our operating expenses and materially and adversely affect our business and results of operations.
We are subject to federal, state, and local laws, regulations, and ordinances that:
| ● | govern activities or operations that may have adverse environmental effects, such as discharges into the air, water and soils, as well as waste handling and disposal practices for solid and hazardous wastes and waste water; and |
23
| ● | impose liability for the costs of remediating, and the damage resulting from, past spills, disposals, or other releases of petroleum products and hazardous materials. |
In particular, under applicable environmental laws, we may be responsible for remediation of environmental conditions and subject to associated liabilities, including liabilities for clean-upcleanup costs, personal injury, or property damage, relating to our restaurants and the land on which our restaurants are located, regardless of whether we lease or own the restaurants or land in question and regardless of whether such environmental conditions were created by us or by a prior owner or tenant. If we are found liable for the costs of remediation of contamination at any of our properties, our operating expenses would likely increase and our results of operations wouldcould be materially and adversely affected. See Item 1, “Business—above under “Item 1. Business—Environmental Matters.”
Risks Related to OwnershipCertain of Our Common Stock
If the ownership of our common stock continues to be highly concentrated, it may prevent you and other minority stockholders from influencing significant corporate decisions and may result in conflicts of interest.
As of December 28, 2022, Trimaran Pollo Partners, L.L.C. (“LLC”), owns approximately 43.3%30.3% of our outstanding common stock. This large position means that LLC and its majority owners—which are predecessors and affiliates of, and certain funds managed by, Trimaran Capital Partners and Freeman Spogli & Co. (collectively, “Trimaran” and “Freeman Spogli,” respectively))—possess significant influence when stockholders vote on matters such as election of directors, mergers, consolidations and acquisitions, the sale of all or substantially all of our assets, decisions affecting our capital structure, amendments to our certificate of incorporation or our by-laws, and our winding up and dissolution. So longIn addition, as LLC maintains at least 40% ownership, (i) any member of December 28, 2022, certain affiliates of Freeman Spogli & Co., FS Equity Partners V, L.P. and FS Affiliates V, L.P. (“Freeman Spogli”), own collectively approximately 15.0% of our outstanding common stock, which they received in August 2022 following a distribution by the board of directors may be removed at any time without cause by affirmative voteLLC of a majorityportion of its shares to Freeman Spogli.
Further, two of our common stock, and (ii) stockholders representing 40% or greater ownership may cause special stockholder meetings to be called. Currently, three of our nineeleven directors, including our chairman, are affiliated with Trimaran orand one of our directors is affiliated with Freeman Spogli.
The interests of Trimaran and Freeman Spogli may conflict with ours or our stockholders’ in the future.
Trimaran and Freeman Spogli engage in a range of investing activities, including investments in restaurants and other consumer-related companies in particular. While our board has determined that director John Roth, a general partner of Freeman Spogli and its CEO, satisfies the criteria for an independent director under NASDAQ rules, inIn the ordinary course of their business activities, Trimaran and Freeman Spogli may engage in activities where their interests conflict with our interests or those of our stockholders. Our amended and restated certificate of incorporation provides that none of LLC or any of its officers, directors, employees, agents, shareholders, members, partners, principals, affiliates and managers (including, inter alia, Trimaran and Freeman Spogli) has a duty to refrain from engaging, directly or indirectly, in the same business activities or similar business activities or lines of business in which we operate. For example, in the third quarter of 2017, Cafe Rio, a high-growth, fast-casual Mexican restaurant company, announced that Freeman Spogli had acquired a majority interest in it. Trimaran and Freeman Spogli also may pursue acquisition opportunities that may be complementary to our business, and, as a result, those acquisition opportunities may not be available to us. In addition, Trimaran and Freeman Spogli may have an interest in pursuing acquisitions, divestitures, and other transactions that, in their judgment, could enhance their investment in us, even though those transactions might involve risks to you, such as debt-financed acquisitions.
24
Risks Related to Ownership of Our Common Stock
Our quarterly operating subsidiariesresults may fluctuate significantly due to provide us with the funds necessary to meet our financial obligations and to pay dividends.
Our quarterly operating results may fluctuate significantly because of our actual operating performance. The stock market in general has from time to time experienced extreme price and volume fluctuations,several factors, including recently. In addition, in the past, following periods of volatility in the overall marketbut not limited to: increases and decreases in sales; profitability of our restaurants; labor availability and costs for personnel; changes in interest rates; macroeconomic conditions, both nationally and locally; negative publicity relating to the marketconsumption of products we serve; changes in consumer preferences and competitive conditions; impairment of long-lived assets and any loss on and exit costs associated with restaurant closures; expansion to new markets; the timing of new restaurant openings and related expense; restaurant operating costs for our newly-opened restaurants; increases in infrastructure costs; and fluctuations in commodity prices.
Seasonal factors, including weather disruptions, and the timing of holidays also cause our revenue to fluctuate from quarter to quarter. Our revenue per restaurant is typically lower in the first and fourth quarters due to reduced January and December transactions and higher in the second and third quarters. As a result of seasonality, our quarterly and annual results of operations and key performance indicators such as company restaurant revenue and comparable restaurant sales may fluctuate. Accordingly, results for any one quarter are not necessarily indicative of results to be expected for any other quarter or for any year and comparable restaurant sales for any particular future period may decrease. In the future, operating results may fall below the expectations of securities analysts and investors. In that event, the price of a company’s securities, securities class action litigation has often been instituted against that company. We are currently defending against such litigation. See Item 3, “Legal Proceedings”. Such litigation could result in substantial costs and a diversion of our management’s attention and resources.
Future offerings of debt or equity securities by us may adversely affect the market price of our common stock.
In the future, we may attempt to obtain financing, or to further increase our capital resources, by issuing additional shares of our common stock or by offering other equity securities, or debt, including senior or subordinated notes, debt securities convertible into equity, or shares of preferred stock. Opening new company-operated restaurants in existing and new markets could require substantial additional capital in excess of cash from operations. We would expect to finance the capital required for new company-operated restaurants through a combination of additional issuances of equity, corporate indebtedness, and cash from operations.
Issuing additional shares of our common stock or other equity securities or securities convertible into equity may dilute the economic and voting rights of our existing stockholders, reduce the market price of our common stock, or both. In a liquidation, holders of any such debt securities or preferred stock, and lenders with respect to other borrowings, could receive distributions of our available assets prior to the holders of our common stock. Debt securities convertible into equity could be subject to adjustments in their conversion ratios under certain circumstances, increasing the number of equity securities issuable upon conversion. Preferred stock, if issued, could have a preference with respect to liquidating distributions, or a preference with respect to dividend payments that could limit our ability to pay dividends to the holders of our common stock. Our decision to issue securities in any future offering will depend on market conditions and other factors beyond our control that may adversely affect the amount, timing, or nature of our future offerings. Thus, holders of our common stock bear the risk that our future offerings may reduce the market price of our common stock and dilute their stockholdings in us.
The market price of our common stock could be negatively affected by sales of substantial amounts of our common stock in the public markets.
The market price of our common stock could decline as a result of sales of a large number of shares of our common stock in the market or the perception that such sales could occur. No lock-up agreements presently are in effect.As of December 28, 2022, LLC, presently ownsFS Equity Partners V, L.P. and FS Affiliates V, L.P. own approximately 43.3%30.3%, 14.8% and 0.2%, respectively, of our outstanding common stock. FS Equity V and FS Affiliates V, which previously indirectly held shares of our common stock through LLC, received shares directly on August 31, 2022, upon LLC’s pro rata distribution in kind of shares of our common stock to FS Equity V and FS Affiliates V. LLC, FS Equity Partners V, L.P. and FS Affiliates V, L.P. could sell stock publicly either if the stock were registered or if the exemption requirements of Rule 144 were satisfied.
Pursuant to our stockholdersstockholders’ agreement, LLC and, in certain instances, Freeman Spogli, may require us to file registration statements under the Securities Act at our expense, covering resales of our common stock held by them or
25
LLC or piggyback on a registration statement in certain circumstances. Pursuant to the stockholders’ agreement, on December 29, 2022, LLC exercised these demand registration rights with respect to the shares of our common stock held by it. On February 15, 2023, we filed a registration statement on Form S-3 with the SEC allowing for the resale of the shares of our common stock held by LLC, which registration statement was declared effective on March 1, 2023. Any such sales by the LLC or Freeman Spogli, or the prospect of any such sales, could materially impact the market price of our common stock.
Further, pursuant to the terms of additionalthe LLC’s limited liability company operating agreement (the “LLC Agreement”), the LLC Agreement can terminate, in which case the LLC will begin the process of dissolving and winding up its affairs, at the earlier of (i) the election of the managing member, or (ii) six years following the completion of our IPO, or July 27, 2020. If the process of winding up the LLC and distribution of shares of our common stock in connection with our incentive plan, acquisitions,begins and all or otherwise will dilute all other stockholdings.
Delaware law, our organizational documents, and our existing and future debt agreements may impede or discourage a takeover, depriving our investors of the opportunity to receive a premium for their shares.
We are a Delaware corporation, and the anti-takeover provisions of Delaware law impose various impediments to the ability of a third partythird-party to acquire control of us, even if a change of control would be beneficial to our existing stockholders. In addition, provisions of our amended and restated certificate of incorporation and by-laws may make it difficult for, or prevent, a third partythird-party from acquiring control of us without the approval of our board of directors. Among other things, these provisions:
In addition, our secured revolving credit facility imposes, and we anticipate that documents governing our future indebtedness may impose, limitations on our ability to enter into change of control transactions. Under our secured revolving credit facility, the occurrence of a change of control transaction can constitute an event of default permitting acceleration of the debt, thereby impeding our ability to enter into change of control transactions.
The foregoing factors, as well as significant common stock ownership by Trimaran and Freeman Spogli, could impede a merger, takeover, or other business combination, or discourage a potential investor from making a tender offer for our common stock, which, under certain circumstances, could reduce the market value of our common stock.
ITEM 1B.UNRESOLVED STAFF COMMENTS
None.
ITEM 2.PROPERTIES
As of December 27, 2017,28, 2022, our restaurant system consisted of 477490 restaurants, comprised of 212188 company-operated restaurants and 265302 franchised restaurants, located in California, Nevada, Arizona, Nevada, Texas, Utah, Louisiana and Utah.Colorado. In addition, we currently license our brand to twofive restaurants in the Philippines. We have not included these twothis licensed restaurants
26
restaurant as part of our unit count as presented in this annual report. The table below sets forth the locations (by state) for all restaurants in operation.
| State | Company- Operated | Franchised | Total | |||||
| California | 163 | 216 | 379 | |||||
| Nevada | 22 | 5 | 27 | |||||
| Arizona | 7 | 20 | 27 | |||||
| Texas | 19 | 20 | 39 | |||||
| Utah | 1 | 4 | 5 | |||||
| Total | 212 | 265 | 477 | |||||
| | | | | | |
|
| Company- |
| |
| |
State |
| Operated |
| Franchised |
| Total |
California |
| 152 |
| 237 |
| 389 |
Nevada |
| 26 |
| 5 |
| 31 |
Arizona |
| — |
| 27 |
| 27 |
Texas |
| 9 |
| 22 |
| 31 |
Utah |
| 1 |
| 8 |
| 9 |
Louisiana |
| — |
| 2 |
| 2 |
Colorado | | — | | 1 | | 1 |
Total |
| 188 |
| 302 |
| 490 |
Our restaurants are either free-standing facilities, typically with drive-thru capability, or in-line. A typical restaurant generally ranges from 2,200 to 3,000 square feet, with seating for approximately 50-70 people. For a majority of our company-operated restaurants, we lease land on which our restaurants are built. Our leases generally have terms of 20 years, with two or threeup to four renewal terms of five years.
Restaurant leases provide for a specified annual rent, and some leases call for additional or contingent rent based on revenue above specified levels. Generally, our leases are “net” leases that require us to pay a pro rata share of taxes, insurance, and maintenance costs. We own 15 properties, of which we currently operatingoperate 12 and licensinglicense three to franchisees. In addition, we operate 200176 company-operated restaurants on leased real estate, an ownedwe own one operating unit with additional parking on leased real estate, and we have another 1539 leased sites that are subleased or assigned to franchisees who operate El Pollo Loco restaurants. We also have sixthree closed units, and two unitsof which are subleased for uses other than El Pollo Loco.
We lease our headquarters, consisting of approximately 29,880 square feet in Costa Mesa, California, for a term expiring in 2023,2024, plus one three-year extension option. Our headquarters is located at 3535 Harbor Boulevard, Suite 100, Costa Mesa, California 92626, and our telephone number is (714) 599-5000. We believe that our current office space is suitable and adequate for its intended purposes and our near-term expansion plans.
ITEM 3.LEGAL PROCEEDINGS
For information regarding our material legal proceedings, see Note 13 “Commitments and Contingencies—Legal Matters” in the Superior Court of the State of California, County of Orange, under the caption
ITEM 4.MINE SAFETY DISCLOSURES
None.
ITEM 5.MARKET FOR REGISTRANT’S COMMON EQUITY, RELATED STOCKHOLDER MATTERS AND ISSUER PURCHASES OF EQUITY SECURITIES
Market Information
Our common stock has been listed on the NASDAQThe Nasdaq Stock Market LLC under the symbol “LOCO” since July 25, 2014.
| Low | High | ||||||
| Fiscal 2016: | |||||||
| First Quarter (December 31, 2015-March 30, 2016) | $ | 10.21 | $ | 15.44 | |||
| Second Quarter (March 31, 2016-June 29, 2016) | $ | 10.50 | $ | 14.98 | |||
| Third Quarter (June 30, 2016-September 28, 2016) | $ | 12.16 | $ | 14.61 | |||
| Fourth Quarter (September 29, 2016-December 28, 2016) | $ | 10.08 | $ | 13.50 | |||
| Fiscal 2017: | |||||||
| First Quarter (December 29, 2016-March 29, 2017) | $ | 10.75 | $ | 13.55 | |||
| Second Quarter (March 30, 2017-June 28, 2017) | $ | 11.50 | $ | 14.85 | |||
| Third Quarter (June 29, 2017-September 27, 2017) | $ | 11.00 | $ | 14.35 | |||
| Fourth Quarter (September 28, 2017-December 27, 2017) | $ | 9.55 | $ | 12.55 | |||
As of February 27, 2018, the closing price per share of our common stock on the NASDAQ was $9.85.
27
Dividends
In fiscal 2022, the same date, there were approximately 20,000 registeredBoard of Directors declared a special cash dividends of $1.50 per share on our common stock. The special dividend was paid on November 9, 2022, to stockholders of record, including holders of restricted stock, at the close of business on October 24, 2022. Our dividend is subject to the discretion and beneficial accounts.
Issuer Purchases of Equity Securities
During the quarterly period ended December 27, 2017, neither28, 2022, we nor any affiliated purchaser made or had made onacquired shares of our or its behalf any purchasescommon stock held by our employees to satisfy tax withholding obligations in connection with the vesting of equity securities, includingpreviously issued restricted stock. The number of shares of common stock acquired and the average price paid per share for exercise price and tax withholdings related to awards under our compensation plans.each month in the fourth quarter ended December 28, 2022 are as shown in the table below.
| | | | | | |
| | Total Number of | | Average Price | | |
| | Shares Purchased | | Paid Per Share | | |
September 29, 2022 to October 26, 2022 |
| 4,590 | | $ | 10.94 |
|
October 27, 2022 to November 23, 2022 |
| 2,637 | | $ | 10.95 |
|
November 24, 2022 to December 28, 2022 |
| — | | $ | — |
|
Total |
| 7,227 | | | |
|
28
Stock Performance Graph
The following graph and table illustrate the total cumulative shareholder return from July 25, 2014, through December 27, 2017, for (i) our common stock, (ii) the NASDAQNasdaq Composite Total Return Index and (iii) the Standard and Poor’s Composite 1500 Restaurants Index (formerly called the S&P Supercomposite Restaurants Index, assumingIndex), for the five years ended December 28, 2022. The graph assumes the investment of $100 at the beginning of the period (at the closing price of our common stock on our first day of trading of $24.03),December 27, 2017) and the reinvestment of dividends, and no transaction costs.
The stock performance graph and table are furnished andshall not be deemed soliciting material or to be filed with the SEC and are notor subject to Regulation 14A or 14C under the Exchange Act or to the liabilities of Section 18 of the Exchange Act, nor shall it be incorporated by reference into any other filing. They are notpast or future filing under the Securities Act of 1933, as amended (the “Securities Act”) or the Exchange Act, except to the extent we specifically request that it be treated as soliciting material or specifically incorporate it by reference into a forecast of future performance.

| Date | LOCO | NASDAQ Composite | S&P Supercomposite Restaurants Index | ||||||||
| July 25, 2014 | $ | 100.00 | $ | 100.00 | $ | 100.00 | |||||
| September 24, 2014 | $ | 148.65 | $ | 102.61 | $ | 99.36 | |||||
| December 31, 2014 | $ | 83.10 | $ | 107.02 | $ | 105.22 | |||||
| April 1, 2015 | $ | 104.91 | $ | 110.61 | $ | 112.22 | |||||
| July 1, 2015 | $ | 85.19 | $ | 113.95 | $ | 119.52 | |||||
| September 30, 2015 | $ | 44.86 | $ | 105.30 | $ | 121.36 | |||||
| December 30, 2015 | $ | 52.77 | $ | 115.81 | $ | 127.95 | |||||
| March 30, 2016 | $ | 55.97 | $ | 111.68 | $ | 133.22 | |||||
| June 29, 2016 | $ | 52.73 | $ | 109.97 | $ | 128.46 | |||||
| September 28, 2016 | $ | 54.35 | $ | 122.74 | $ | 127.33 | |||||
| December 28, 2016 | $ | 52.43 | $ | 125.90 | $ | 136.03 | |||||
| March 29, 2017 | $ | 49.94 | $ | 136.91 | $ | 141.62 | |||||
| June 28, 2017 | $ | 59.09 | $ | 145.13 | $ | 157.36 | |||||
| September 27, 2017 | $ | 49.94 | $ | 150.61 | $ | 150.68 | |||||
| December 27, 2017 | $ | 41.61 | $ | 162.38 | $ | 165.58 | |||||
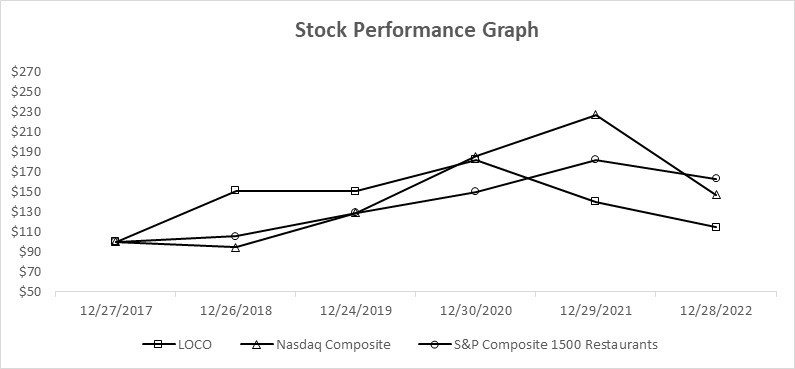
| | | | | | | | | |
|
| | |
| | |
| | |
| | | | | | | | S&P Composite | |
| | | | | Nasdaq | | 1500 | ||
Date |
| LOCO |
| Composite |
| Restaurants | |||
December 27, 2017 | | $ | 100.00 | | $ | 100.00 | | $ | 100.00 |
December 26, 2018 | | $ | 151.00 | | $ | 94.45 | | $ | 105.35 |
December 24, 2019 | | $ | 150.50 | | $ | 129.02 | | $ | 129.03 |
December 30, 2020 | | $ | 182.10 | | $ | 185.46 | | $ | 150.33 |
December 29, 2021 | | $ | 140.10 | | $ | 227.20 | | $ | 181.96 |
December 28, 2022 | | $ | 114.60 | | $ | 147.18 | | $ | 163.07 |
| Fiscal Year | |||||||||||||||||||
| 2017 | 2016 | 2015 | 2014 | 2013 | |||||||||||||||
| Statements of Income Data: | |||||||||||||||||||
| Revenue | |||||||||||||||||||
| Company-operated restaurant revenue | $ | 376,615 | $ | 355,468 | $ | 332,040 | $ | 322,516 | $ | 294,327 | |||||||||
| Franchise revenue | 25,086 | 24,655 | 23,017 | 22,345 | 20,400 | ||||||||||||||
| Total revenue | 401,701 | 380,123 | 355,057 | 344,861 | 314,727 | ||||||||||||||
| Cost of operations | |||||||||||||||||||
| Food and paper costs | 109,898 | 107,218 | 105,917 | 102,611 | 93,589 | ||||||||||||||
| Labor and related expenses | 106,584 | 97,471 | 84,231 | 80,646 | 75,669 | ||||||||||||||
| Occupancy and other operating expenses | 85,631 | 78,263 | 69,977 | 68,538 | 63,150 | ||||||||||||||
| Gain on recovery of insurance proceeds, lost profits | — | (502 | ) | — | — | — | |||||||||||||
| Company restaurant expenses | 302,113 | 282,450 | 260,125 | 251,795 | 232,408 | ||||||||||||||
| General and administrative expenses | 38,523 | 34,661 | 28,997 | 29,519 | 25,506 | ||||||||||||||
| Franchise expenses | 3,335 | 3,823 | 3,456 | 3,704 | 3,841 | ||||||||||||||
| Depreciation and amortization | 18,128 | 16,053 | 13,092 | 11,538 | 10,213 | ||||||||||||||
| Loss on disposal of assets | 799 | 674 | 471 | 646 | 868 | ||||||||||||||
| Expenses related to fire loss | — | 48 | — | — | — | ||||||||||||||
| Gain on recovery of insurance proceeds, property, equipment and expenses | — | (741 | ) | — | — | — | |||||||||||||
| Recovery of securities lawsuits related legal expenses | (1,666 | ) | — | — | — | — | |||||||||||||
| Asset impairment and closed-store reserves | 33,645 | 8,554 | 92 | 1,033 | (101 | ) | |||||||||||||
| Total expenses | 394,877 | 345,522 | 306,233 | 298,235 | 272,735 | ||||||||||||||
| Gain on disposition of restaurants | — | 28 | — | 2,658 | 400 | ||||||||||||||
| Income from operations | 6,824 | 34,629 | 48,824 | 49,284 | 42,392 | ||||||||||||||
| Interest expense, net | 3,278 | 3,155 | 3,707 | 18,062 | 36,334 | ||||||||||||||
| Early extinguishment of debt | — | — | — | 9,718 | 21,530 | ||||||||||||||
| Expenses related to selling shareholders | — | — | 50 | 667 | — | ||||||||||||||
| Income tax receivable agreement (income) expense | (5,570 | ) | 352 | 156 | 41,382 | — | |||||||||||||
| Income (loss) before (provision) benefit for income taxes | 9,116 | 31,122 | 44,911 | (20,545 | ) | (15,472 | ) | ||||||||||||
| (Provision) benefit for income taxes | (497 | ) | (12,783 | ) | (20,857 | ) | 63,008 | (1,401 | ) | ||||||||||
| Net income (loss) | $ | 8,619 | $ | 18,339 | $ | 24,054 | $ | 42,463 | $ | (16,873 | ) | ||||||||
| Per Share Data: | |||||||||||||||||||
| Net income (loss) per share | |||||||||||||||||||
| Basic | $ | 0.22 | $ | 0.48 | $ | 0.63 | $ | 1.32 | $ | (0.59 | ) | ||||||||
| Diluted | $ | 0.22 | $ | 0.47 | $ | 0.62 | $ | 1.24 | $ | (0.59 | ) | ||||||||
| Weighted average shares used in computing net income (loss) per share | |||||||||||||||||||
| Basic | 38,453,347 | 38,357,805 | 37,949,316 | 32,285,484 | 28,712,622 | ||||||||||||||
| Diluted | 39,086,676 | 39,026,950 | 39,039,558 | 34,346,241 | 28,712,622 | ||||||||||||||
| Consolidated Statements of Cash Flows Data: | |||||||||||||||||||
| Net cash provided by operating activities | $ | 53,671 | $ | 49,299 | $ | 57,971 | $ | 26,085 | $ | 19,700 | |||||||||
| Net cash used in investing activities | $ | (36,238 | ) | $ | (35,202 | ) | $ | (30,835 | ) | $ | (21,401 | ) | $ | (13,787 | ) | ||||
| Net cash used in financing activities | $ | (11,051 | ) | $ | (18,030 | ) | $ | (32,534 | ) | $ | (10,200 | ) | $ | (10,385 | ) | ||||
| Fiscal Year | |||||||||||||||||||
| 2017 | 2016 | 2015 | 2014 | 2013 | |||||||||||||||
| Balance Sheet Data—Consolidated (at period end): | |||||||||||||||||||
| Cash and cash equivalents | $ | 8,550 | $ | 2,168 | $ | 6,101 | $ | 11,499 | $ | 17,015 | |||||||||
Net property (1) | $ | 102,794 | $ | 118,470 | $ | 102,421 | $ | 82,090 | $ | 68,641 | |||||||||
| Total assets | $ | 442,711 | $ | 471,305 | $ | 461,028 | $ | 455,306 | $ | 416,942 | |||||||||
Total debt (2) | $ | 93,316 | $ | 104,461 | $ | 123,638 | $ | 165,846 | $ | 289,242 | |||||||||
| Total stockholders’ equity | $ | 274,950 | $ | 265,182 | $ | 244,633 | $ | 210,400 | $ | 48,536 | |||||||||
ITEM 6. [RESERVED]
ITEM 7.MANAGEMENT’S DISCUSSION AND ANALYSIS OF FINANCIAL CONDITION AND RESULTS OF OPERATIONS
The following discussion should be read in conjunction with Item 6, “Selectedour “Audited Consolidated Financial Data,”Statements” and our consolidated financial statements and the notes theretoaccompanying “Notes to Consolidated Financial Statements” included elsewhere in this report.Annual Report. In addition to historical information, this discussion contains forward-looking statements that involve risks, uncertainties, and assumptions that could cause actual results to differ materially from management’s expectations. See “Forward-Looking“Forward-
29
Looking Statements” and Item 1A, “Risk Factors.”“Item 1A. Risk Factors” included elsewhere in this Annual Report. We assume no obligation to update any of these forward-looking statements.
Basis of Presentation
We use a 52- or 53-week fiscal year ending on the last Wednesday of each calendar year. Fiscal 2017, 2016,2022, 2021, and 20152020 ended on December 27, 2017,28, 2022, December 28, 201629, 2021 and December 30, 2015,2020, respectively. In a 52-week fiscal year, each quarter includes 13 weeks of operations. In a 53-week fiscal year, the first, second and third quarters each include 13 weeks of operations, and the fourth quarter includes 14 weeks of operations. Approximately every six or seven years a 53-week fiscal year occurs. Fiscal 2017, 2016,2020 was a 53-week fiscal year. Fiscal 2022 and 20152021 were 52-week fiscal years. 53-week years may cause revenues, expenses, and other results of operations to be higher due to the additional week of operations. Fiscal years are identified in this report according to the calendar years in which they ended. For example, references to fiscal 20172022 refer to the fiscal year ended December 27, 2017.
Overview
El Pollo Loco is a differentiated and growing restaurant concept that specializes in fire-grilling citrus-marinated chicken and operates in the limited service restaurant (“LSR”)LSR segment. We strive to offer food that integrates the qualityculinary traditions of food and dining experience typicalMexico with the healthier lifestyle of fast casual restaurants while providing the speed, convenience, and value typical of traditional quick-service restaurants (“QSRs”), a combination that we call “QSR+” and to provide a value-oriented fast casual dining experience.Los Angeles. Our distinctive menu features our signature product—citrus-marinatedproduct--citrus-marinated fire-grilled chicken—andchicken--and a variety of Mexican-inspiredMexican and LA-inspired entrees that we create from our chicken. We offer our customers healthier alternatives to traditional food on the go, served by our team members in a contemporary restaurant environment. We serve individual and family-sized chicken meals, a variety of Mexican-inspiredMexican and LA-inspired entrees, and sides, and, throughout the year, on a limited-time basis, additional proteins like shrimp and beef. Our entrees include favorites such as our Chicken Avocado Burrito, Under 500 CaloriePollo Fit entrees, Doublechicken tostada salads, and Pollo Bowl, and Stuffed Chicken Avocado Quesadilla.Bowls. Our famous Creamy Cilantro dressings and salsas are prepared fresh daily, allowing our customers to create their favorite flavor profiles to enhance their culinary experience. Our distinctive menu with healthier“better for you” and more affordable alternatives appeals to consumers across a wide variety of socio-economic backgrounds and drives our balanced day-part mix.
Market Trends and Uncertainties
We may face future business disruption and related risks resulting from the ongoing COVID-19 pandemic or from another pandemic, epidemic or infectious disease outbreak, or from broader macroeconomic trends, any of which could have a significant impact on our business. During the year ended December 28, 2022, we incurred a total of $3.3 million in COVID-19 related expenses, comprised of $2.3 million due to overtime primarily related to the first quarter and $1.0 million due to leaves of absence related to the remaining three quarters. During the year ended December 29, 2021 and December 30, 2020, we incurred $3.9 million and $4.9 million, respectively, in COVID-19 related expenses, primarily due to leaves of absence and overtime pay. In addition, while all of our restaurants had dining rooms open as of December 28, 2022, we continue to experience staffing challenges, including higher wage inflation, overtime costs and other labor related costs. Labor costs could also be adversely impacted as a result of the FAST Act, which was signed into law in September 2022 and authorizes the creation of a council to set minimum standards for industry workers in California, including minimum wages. The FAST Act, which will take effect if approved by voters in November 2024, could result in increased labor cost at our California restaurants thereby potentially impacting the profitability of our California restaurants. Further, this bill could prompt similar legislation in other states. We also continue to experience inflationary pressures, which resulted in increased commodity prices and impacted our business and results of operations during the year ended December 28, 2022. We expect these pressures to continue during fiscal year 2023.
Due to the fluidity of the COVID-19 pandemic and current macroeconomic environment, we cannot determine the ultimate impact on our consolidated financial condition, liquidity, and future results of operations, and therefore any prediction as to the ultimate materiality of the adverse impact on our consolidated financial condition, liquidity, and future results of operations is uncertain.
Growth Strategies and Outlook
We plan to continue to expand our business, drive restaurant sales growth, and enhance our competitive positioning, by executing on the following strategies:
30
| ● | build awareness and own our lane; |
| ● | deliver exceptional service – profitably; and |
| ● | accelerate development. |
As of December 27, 2017,28, 2022, we had 477490 locations in fiveseven states. In fiscal 2017,2022, we opened 16four new company-operated restaurants, two in Nevada and 7two in California, and our franchisees opened nine new franchised restaurants, across Arizona,seven in California, Nevada, Utahone in Colorado and Texas.one in Utah. In fiscal 2016, 2021, we opened 18two new company-operated restaurants, one in Nevada and 13one in California, and our franchisees opened two new franchised restaurants, across Arizona, California, Nevada, Utahone in Texas and Texas. one in Louisiana.
In 2018,2023, we intend to open 6four to 8six new company-operated and 6eight to 8twelve new franchised restaurants in Arizona, California, Nevada, Utah and Texas.restaurants. To increase comparable restaurant sales, we plan to increase customer frequency, attract new customers, and improve per-person spend.
Highlights and Trends
Comparable Restaurant Sales
In fiscal 2022, comparable restaurant sales system-wide increased 5.9%. In fiscal 2021, comparable restaurant sales system-wide increased 12.1%. In fiscal 2020, comparable restaurant sales system-wide decreased 2.4%. Comparable restaurant sales growth/decline reflects the change in year-over-year sales for the comparable restaurant base. A restaurant enters our comparable restaurant base the first full week after its 15-month anniversary. System-wide comparable restaurant sales include restaurant sales at all comparable company-operated restaurants and at all comparable franchised restaurants, as reported by franchisees. Comparable restaurant sales at company-operated restaurants increased 3.7% in fiscal 2022, increased 7.6% in fiscal 2021, and decreased 3.0% in fiscal 2020. For company-operated restaurants in 2022, the change in comparable restaurant sales consisted of a 7.3% increase in average check size due to increases in menu prices partially offset by a 3.3% decrease in transactions. In fiscal 2021, the increase in company-operated comparable restaurant sales consisted of a 6.3% increase in average check size and a 1.2% increase in transactions. In fiscal 2020, the decrease in company-operated comparable restaurant sales was primarily the result of a decrease in transactions of 15.8%, partially offset by a 15.3% increase in average check size. In fiscal 2022, comparable restaurant sales at franchised restaurants increased 7.4%. In fiscal 2021, comparable restaurant sales at franchised restaurants increased 15.3%, and in fiscal 2020, comparable restaurant sales at franchised restaurants decreased 2.0%.
31
Restaurant Development
In fiscal 2022, we opened four company-operated restaurants, and our franchisees opened nine new restaurants. From time to time, we and our franchisees close restaurants. In fiscal 2022, we closed two company-operated restaurants. Our franchisees closed one restaurant. Our restaurant counts at the beginning and end of each of the last three years were as follows:
| | | | | | |
|
| Fiscal Year Ended | ||||
|
| 2022 |
| 2021 |
| 2020 |
Company-operated restaurant activity: | |
| |
| |
|
Beginning of period | | 189 | | 196 | | 195 |
Openings | | 4 | | 2 | | 1 |
Restaurant sale to franchisee | | (3) | | (8) | | — |
Closures | | (2) | | (1) | | — |
Restaurants at end of period | | 188 | | 189 | | 196 |
Franchised restaurant activity: | |
| |
| |
|
Beginning of period | | 291 | | 283 | | 287 |
Openings | | 9 | | 2 | | 3 |
Restaurant sale to franchisee | | 3 | | 8 | | — |
Closures | | (1) | | (2) | | (7) |
Restaurants at end of period | | 302 | | 291 | | 283 |
System-wide restaurant activity: | |
| |
| |
|
Beginning of period | | 480 | | 479 | | 482 |
Openings | | 13 | | 4 | | 4 |
Closures | | (3) | | (3) | | (7) |
Restaurants at end of period | | 490 | | 480 | | 479 |
In 2020, we finalized a new restaurant design that we believe will clearly differentiate and communicate our brand, both on the exterior and interior. We believe that our remodels using this new design will result in higher restaurant revenue and a strengthened brand. During the year ended December 28, 2022, we completed six company-operated restaurant remodels and 16 franchise remodels using the new asset design. In fiscal 2023, we plan to continue our standard practices for remodels, which includes completing a total of 10-15 company and 20-30 franchise remodels using the new design. Remodeling is a use of cash and has implications for our net property and depreciation line items on our consolidated balance sheets and statements of income, among others. The cost of our restaurant remodels varies depending on the scope of work required, but on average the investment is $0.3 to $0.4 million per restaurant.
Loco Rewards
Our Loco Rewards loyalty program offers rewards that incentivize customers to visit our restaurants more often each month. Customers earn points for each dollar spent and 50 points can be redeemed for a $5 reward to be used for a future purchase. If a customer does not earn or use points within a one-year period, their account is deactivated and all points expire. Additionally, if a reward is not used within six months, it expires. When a customer is part of the rewards program, the obligation to provide future discounts related to points earned is considered a separate performance obligation, to which a portion of the transaction price is allocated. The performance obligation related to loyalty points is deemed to have been satisfied, and the amount deferred in the balance sheet is recognized as revenue, when the points are transferred to a reward and redeemed, the reward or points have expired, or the likelihood of redemption is remote. A portion of the transaction price is allocated to loyalty points on a pro-rata basis, based on stand-alone selling price, as determined by menu pricing and loyalty point’s terms.
In addition, customers can earn additional points and free entrées for a variety of engagement activities. As points are available for redemption past the quarter earned, a portion of the revenue associated with the earned points will be deferred until redemption or expiration. As of December 28, 2022, the amount of revenue deferred related to the earned points, net of redemptions, is $0.5 million. We had more than 3.2 million members in the Loco Rewards loyalty program as of December 28, 2022.
32
Key Financial Definitions
Revenue
Our revenue is derived from three primary sources: (i)company-operated restaurant revenue, (ii) franchise revenue, which is comprised primarily of franchise royalties and, to a lesser extent, franchise fees and sublease rental income, and (iii) franchise advertising fee revenue. See Note 15 “Revenue from Contracts with Customers”in the accompanying “Notes to Consolidated Financial Statements” in this Annual Report for further details regarding our revenue recognition policy.
Food and Paper Costs
Food and paper costs include the direct costs associated with food, beverage and packaging of our menu items. The components of food and paper costs are variable in nature, change with sales volume, are impacted by menu mix, and are subject to increases or decreases in commodity costs. We expect food and paper costs, particularly those items not subject to purchasing commitments, to increase in the short-term due to current inflationary pressures.
Labor and Related Expenses
Labor and related expenses include wages, payroll taxes, workers’ compensation expense, benefits, and bonuses paid to our restaurant management teams. Like other expense items, we expect labor costs to grow proportionately as our restaurant revenue grows. Factors that influence labor costs include minimum wage and payroll tax legislation, state labor laws (which, in California, may include the FAST Act), overtime, wage inflation, the frequency and severity of workers’ compensation claims, health care costs, and the performance of our restaurants.
Occupancy Costs and Other Operating Expenses
Occupancy costs include rent, common area maintenance (“CAM”), and real estate taxes. Other restaurant operating expenses include the costs of utilities, advertising, credit card processing fees, restaurant supplies, repairs and maintenance, and other restaurant operating costs.
General and Administrative Expenses
General and administrative expenses are comprised of expenses associated with corporate and administrative functions that support the development and operations of our restaurants, including compensation and benefits, travel expenses, stock compensation costs, legal and professional fees, and other related corporate costs. Also included are pre-opening costs, and expenses above the restaurant level, including salaries for field management, such as area and regional managers, and franchise field operational support.
Legal Settlements
Legal settlements include expenses such as judgments or settlements related to legal matters, legal claims and class action lawsuits.
Franchise Expenses
Franchise expenses are primarily comprised of rent expenses incurred on properties leased by us and then sublet to franchisees, and expenses incurred in support of franchisee information technology systems. Additionally, franchise expenses also include all expenses of the advertising fund representing the franchised restaurants portion of advertising expenses.
Depreciation and Amortization
Depreciation and amortization primarily consist of the depreciation of property and equipment, including leasehold improvements and equipment.
33
Loss on Disposal of Assets
Loss on disposal of assets includes the loss on disposal of assets related to retirements and replacement or write-off of leasehold improvements or equipment.
Impairment and Closed-Store Reserves
We review long-lived assets such as property, equipment, and intangibles on a unit-by-unit basis for impairment when events or circumstances indicate the carrying value of the assets may not be recoverable. We determine if there is impairment at the restaurant level by comparing undiscounted future cash flows from the related long-lived assets to their respective carrying values and record an impairment charge when appropriate. In determining future cash flows, significant estimates are made by us with respect to future operating results of each restaurant over its remaining lease term, including sales trends, labor rates, commodity costs and other operating cost assumptions. If assets are determined to be impaired, the impairment charge is measured by calculating the amount by which the assets’ carrying amount exceeds its fair value. This process of assessing fair values requires the use of estimates and assumptions, including our ability to sell or reuse the related assets and market conditions, which are subject to a high degree of judgment. If these assumptions change in the future, we may be required to record impairment charges for these assets and these charges could be material.
When we close a restaurant, we will evaluate the right-of-use (“ROU”) asset for impairment, based on anticipated sublease recoveries. The remaining value of the ROU asset is amortized on a straight-line basis, with the expense recognized in closed-store reserve expense, in addition to property tax and CAM charges for closed restaurants.
(Gain) Loss on Disposition of Restaurants
(Gain) loss on disposal of restaurants includes the (gain) loss on the sale of restaurants to franchisees, or other third parties, and includes the difference between carrying value and sales price of leasehold improvements, equipment and other assets included in the sale.
Interest Expense, Net
Interest expense, net, consists primarily of interest on our outstanding revolving debt. Debt issuance costs are amortized on a straight-line basis over the life of the related debt.
Provision for Income Taxes
Provision for income taxes consists of federal and state tax expense on our income, and changes to our deferred tax asset and deferred tax liability.
34
Results of Operations
Fiscal Year 2022 Compared to Fiscal Year 2021
Our operating results for the fiscal years ended December 28, 2022 and December 29, 2021, in absolute terms and expressed as a percentage of total revenue, with the exception of cost of operations and company restaurant expenses, which are expressed as a percentage of company-operated restaurant revenue, are compared below:
| | | | | | | | | | | | | | | | |
|
| Fiscal Year |
| |||||||||||||
| | 2022 | | 2021 | | | | | |
| ||||||
| | (52-Weeks) | | (52-Weeks) | | Increase / (Decrease) | ||||||||||
|
| ($,000) |
| (%) |
| ($,000) |
| (%) |
| ($,000) |
| (%) |
| |||
Statements of Income Data: |
| |
|
|
|
| |
|
|
|
| |
|
|
| |
Revenue |
| |
|
|
|
| |
|
|
|
| |
|
|
| |
Company-operated restaurant revenue | | $ | 403,218 |
| 85.8 | | $ | 394,733 |
| 86.9 | | $ | 8,485 |
| 2.1 | |
Franchise revenue | |
| 38,225 |
| 8.1 | |
| 33,729 |
| 7.4 | |
| 4,496 |
| 13.3 | |
Franchise advertising fee revenue | |
| 28,516 |
| 6.1 | |
| 25,901 |
| 5.7 | |
| 2,615 |
| 10.1 | |
Total revenue | |
| 469,959 |
| 100.0 | |
| 454,363 |
| 100.0 | |
| 15,596 |
| 3.4 | |
Cost of operations | |
|
|
|
| |
|
|
|
| |
|
|
|
| |
Food and paper costs (1) | |
| 117,774 |
| 29.2 | |
| 104,394 |
| 26.4 | |
| 13,380 |
| 12.8 | |
Labor and related expenses (1) | |
| 130,773 |
| 32.4 | |
| 120,308 |
| 30.5 | |
| 10,465 |
| 8.7 | |
Occupancy and other operating expenses (1) | |
| 101,543 |
| 25.2 | |
| 97,557 |
| 24.7 | |
| 3,986 |
| 4.1 | |
Company restaurant expenses (1) | |
| 350,090 |
| 86.8 | |
| 322,259 |
| 81.6 | |
| 27,831 |
| 8.6 | |
General and administrative expenses | |
| 39,093 |
| 8.3 | |
| 39,852 |
| 8.8 | |
| (759) |
| (1.9) | |
Franchise expenses | |
| 36,169 |
| 7.7 | |
| 32,831 |
| 7.2 | |
| 3,338 |
| 10.2 | |
Depreciation and amortization | |
| 14,418 |
| 3.1 | |
| 15,176 |
| 3.3 | |
| (758) |
| (5.0) | |
Loss on disposal of assets | |
| 165 |
| 0.0 | |
| 289 |
| 0.1 | |
| (124) |
| (42.9) | |
Impairment and closed-store reserves | |
| 752 |
| 0.2 | |
| 1,087 |
| 0.2 | |
| (335) |
| (30.8) | |
(Gain) loss on disposition of restaurants | | | (848) | | (0.2) | | | 1,534 | | 0.3 | | | (2,382) | | (155.3) | |
Total expenses | |
| 439,839 |
| 93.6 | |
| 413,028 |
| 90.9 | |
| 26,811 |
| 6.5 | |
Income from operations | |
| 30,120 |
| 6.4 | |
| 41,335 |
| 9.1 | |
| (11,215) |
| (27.1) | |
Interest expense, net | |
| 1,677 |
| 0.4 | |
| 1,824 |
| 0.4 | |
| (147) |
| (8.1) | |
Income tax receivable agreement (income) expense | |
| (436) |
| (0.1) | |
| 58 |
| 0.0 | |
| (494) |
| (851.7) | |
Income before provision for income taxes | |
| 28,879 |
| 6.1 | |
| 39,453 |
| 8.7 | |
| (10,574) |
| (26.8) | |
Provision for income taxes | |
| 8,078 |
| 1.7 | |
| 10,332 |
| 2.3 | |
| (2,254) |
| (21.8) | |
Net income | | $ | 20,801 |
| 4.4 | | $ | 29,121 |
| 6.4 | | $ | (8,320) |
| (28.6) | |
| (1) | Percentages for line items relating to cost of operations and company restaurant expenses are calculated with company-operated restaurant revenue as the denominator. All other percentages use total revenue. |
Company-Operated Restaurant Revenue
In fiscal 2022, company-operated restaurant revenue increased $8.5 million, or 2.1%. The increase in company-operated restaurant sales was primarily due to an increase in company-operated comparable restaurant revenue of $14.3 million, or 3.7%. The company-operated comparable restaurant sales increase consisted of an approximately 7.3% increase in average check size due to increases in menu prices, partially offset by a 3.3% decrease in transactions. In addition, company-operated restaurant revenue was favorably impacted by $3.5 million of additional sales from the opening of six restaurants during or subsequent to the first quarter of 2021. This company-operated restaurant sales increase was partially offset by a $9.0 million decrease in revenue from the closure of three restaurants during or subsequent to the first quarter of 2021, the eleven company-operated restaurants sold by the Company to existing franchisees during or subsequent to the first quarter of 2021.
Franchise Revenue
In fiscal 2022, franchise revenue increased $4.5 million, or 13.3%. This increase was primarily due to a franchise comparable restaurant sales increase of 7.4%, the opening of eleven restaurants during or subsequent to the first quarter of 2021 and revenue generated from eleven company-operated restaurants sold by the Company to existing franchisees
35
during or subsequent to the first quarter of 2021. This franchise revenue increase was partially offset by the closure of three franchise locations during the same period.
Franchise Advertising Fee Revenue
Franchise advertising fee revenue increased $2.6 million, or 10.1% from the comparable period in the prior year. As advertising fee revenue is a percentage of franchisees’ revenue, the year-to-date fluctuation was due to the increases noted in franchise revenue above.
Food and Paper Costs
Food and paper costs increased $13.4 million, or 12.8%, in fiscal 2022. The increase in food and paper costs resulted primarily from commodity inflation, partially offset by lower transactions. In addition, the increase in food and paper costs resulted from a $1.1 million increase from restaurants opened during the current or prior year. These increases were partially offset by a reduction of $1.5 million for restaurant locations sold to franchisees during the current or prior year. Food and paper costs as a percentage of company-operated restaurant revenue were 29.2% in fiscal 2022, up from 26.4% in fiscal 2021 primarily due to commodity inflation, partially offset by an increase in pricing.
Labor and Related Expenses
Labor and related expenses increased $10.5 million, or 8.7%, in fiscal 2022. The increase was primarily due to a $8.2 million increase primarily related to minimum wage increases in California during fiscal 2022 and other labor wage increases as a result of competitive pressure. Further, the increase for the year-to-date period was due to recognizing a $3.4 million Employee Retention Credit which was recorded as an offset to the corresponding payroll tax expense and was classified as part of the labor and other operating expenses on the consolidated statements of income during the year ended December 29, 2021. In addition, the labor and related expenses were impacted by a $1.3 million increase from restaurants opened during or after the first quarter of the prior year and $1.0 million in higher payroll taxes primarily associated with the labor increases above. The increase in labor and related expenses for the year-to-date period was partially offset by a $2.1 million reduction in labor related to the eleven locations sold to existing franchisees during the current or prior year and a $1.2 million reduction in restaurants closed during the current or prior year. Labor and related expenses as a percentage of company-operated restaurant revenue were 32.4% in fiscal 2022, up from 30.5% in fiscal 2021 primarily due to the cost increases highlighted above, partially offset by the higher menu prices.
Occupancy and Other Operating Expenses
Occupancy and other operating expenses increased $4.0 million, or 4.1%, in fiscal 2022. The increase was primarily due to a $2.4 million increase in utilities costs primarily due to increases in natural gas and electricity costs, a $0.6 million increase in market place delivery fees, a $0.4 million increase in freight fuel costs, a $0.3 million increase in repairs and maintenance and a $0.3 million increase in advertising expense. Occupancy and other operating expenses as a percentage of company-operated restaurant revenue were 25.2% in fiscal 2022, up from 24.7% in fiscal 2021 primarily due to the cost increases highlighted above.
General and Administrative Expenses
General and administrative expenses decreased $0.8 million, or 1.9%, in fiscal 2022. The decrease was due primarily to a $1.1 million decrease in labor related costs, primarily related to a decrease in management bonus expense and a $0.4 million decrease in legal-related expenses. The decrease in general and administrative expenses was partially offset by a $0.6 million increase in other general and administrative expenses.
General and administrative expenses as a percentage of total revenue were 8.3% in fiscal 2022, down from 8.8% in fiscal 2021. This decrease is primarily due to the cost decreases described above and leverage on higher sales.
Franchise Expenses
Franchise expenses increased $3.3 million, or 10.2%, in fiscal 2022. The increase was primarily due to an increase in advertising expenses, primarily resulting from higher franchise revenue, higher franchise services expense and higher
36
rent expense for locations sub-leased to franchisees that have a portion of the rent based on a percentage of revenue generated.
Impairment and Closed-Store Reserves
During fiscal 2022, we recorded a $0.5 million non-cash impairment charge primarily related to the carrying value of the ROU assets of one restaurant in California that closed in 2021 and the long-lived assets of two restaurants in California. During fiscal 2021, we recorded a $0.7 million non-cash impairment charge primarily related to the carrying value of the ROU assets of one restaurant in Texas that closed in 2019, the carrying value of one restaurant in California that closed in 2021 and the long-lived assets of three restaurants in California.
During fiscal 2022, we recognized $0.3 million of closed-store reserve expense related to the amortization of ROU assets, property taxes and CAM payments for our closed locations compared to $0.4 million during fiscal 2021.
Gain and Loss on Disposition of Restaurants
During fiscal 2022, we completed the sale of three company-operated restaurants within the Orange County area to an existing franchisee. We determined that these restaurant dispositions represent multiple element arrangements, and as a result, the cash consideration received was allocated to the separate elements based on their relative standalone selling price. Cash proceeds included upfront consideration for the sale of the restaurants and franchise fees. The cash consideration per restaurant related to franchise fees is consistent with the amounts stated in the related franchise agreements, which are charged for separate standalone arrangements. The Company initially defers and subsequently recognizes the franchise fees over the term of the franchise agreement. This sale resulted in cash proceeds of $1.0 million and a net gain on sale of restaurants of $0.8 million for the fiscal year ended December 28, 2022. These restaurants are included in the total number of franchised El Pollo Loco restaurants.
During fiscal 2021, we completed the sale of eight company-operated restaurants within the Sacramento area to an existing franchisee. We determined that these restaurant dispositions represent multiple element arrangements, and as a result, the cash consideration received was allocated to the separate elements based on their relative standalone selling price. Cash proceeds included upfront consideration for the sale of the restaurants and franchise fees, as well as
future cash consideration for royalties. The cash consideration per restaurant related to franchise fees is consistent with the amounts stated in the related franchise agreements, which are charged for separate standalone arrangements. The Company initially defers and subsequently recognizes the franchise fees over the term of the franchise agreement. Future royalty income is also recognized in revenue as earned. This sale resulted in cash proceeds of $4.6 million and a net loss on sale of restaurants of $1.5 million for the fiscal year ended December 29, 2021. These restaurants are included in the total number of franchised El Pollo Loco restaurants.
Interest Expense, Net
For fiscal 2022, net interest expense, decreased by $0.1 million, primarily related to lower outstanding balances on our 2022 Revolver (as defined below) during part of the year.
Income Tax Receivable Agreement
On July 30, 2014, we entered into the tax receivable agreement (the “TRA”) liability. The TRA calls for us to pay to our pre-IPO stockholders 85% of the savings in cash that we realize in our taxes as a result of utilizing our net operating losses and other tax attributes attributable to preceding periods. In fiscal 2022 and fiscal 2021 we recognized income tax receivable agreement income of $0.4 million and expense of less than $0.1 million, respectively. In fiscal 2022 and 2021, we paid $0.4 million and $1.7 million, respectively, to our pre-IPO stockholders under the TRA.
Provision for Income Taxes
In fiscal 2022, we recorded an income tax expense of $8.1 million, compared to income tax expense of $10.3 million in fiscal 2021, reflecting an estimated effective tax rate of 28.0% and 26.2%, respectively. The difference between the 21.0% statutory rate and the Company’s effective tax rate of 28.0% for the year ended December 28, 2022 is primarily a result of state taxes, the change in valuation allowance against certain state credits, a tax shortfall related to equity compensation and non-deductible executive compensation, partially offset by a Work Opportunity Tax Credit benefit.
37
The difference between the 21.0% statutory rate and the Company’s effective tax rate of 26.2% for the year ended December 29, 2021 is primarily a result of windfall tax benefit related to stock options exercised and state taxes, a Work Opportunity Tax Credit benefit and the change in valuation allowance against certain state credits as a result of future forecasted income apportioned to the state jurisdiction.
Fiscal Year 2021 Compared to Fiscal Year 2020
Year-to-year comparisons of fiscal 2021 and fiscal 2020 that are not included in this Form 10-K can be found in “Management’s Discussion and Analysis of Financial Condition and Results of Operations” in Part II, Item 7 on our Annual Report on Form 10-K for the year ended December 29, 2021, which was filed with the SEC on March 11, 2022.
Key Performance Indicators
To evaluate the performance of our business, we utilize a variety of financial and performance measures. These key measures include company-operated restaurant revenue, system-wide sales, comparable restaurant sales, company-operated average unit volumes (“AUV”), restaurant contribution, restaurant contribution margin, new restaurant openings, EBITDA, and Adjusted EBITDA. In fiscal 2017,2022, our restaurants generated company-operated restaurant revenue of $376.6$403.2 million and system-wide sales of $841.8$1,039.0 million, and system comparable sales increased 1.5%growth of 5.9%, consisting of company-operated restaurant comparable sales growth of 1.0%3.7% and franchised comparable sales growth of 1.8%7.4%. The company-operated comparable sales increase consisted of a 1.9%7.3% increase in average check growth,size due to increases in menu prices and partially offset by a 0.9% transaction decrease.3.3% decrease in transactions. In fiscal 2017,2022, for company-operated restaurants, our annual Average Unit Volume ("AUV")AUV was $1.8$2.1 million, restaurant contribution margin was 19.8%13.2%, and Adjusted EBITDA was $65.3$48.7 million.
Company-Operated Restaurant Revenue
Company-operated restaurant revenue consists of sales of food and beverages in company-operated restaurants net of promotional allowances, employee meals, and other discounts. Company-operated restaurant revenue in any period is directly influenced by the number of operating weeks in such period, the number of open restaurants, and comparable restaurant sales.
Seasonal factors and the timing of holidays cause our revenue to fluctuate from quarter to quarter. Our revenue per restaurant is typically lower in the first and fourth quarters due to reduced January and December transactions and higher in the second and third quarters. As a result of seasonality, our quarterly and annual results of operations and key performance indicators such as company-operated restaurant revenue and comparable restaurant sales may fluctuate.
System-Wide Sales
System-wide sales are neither required by, nor presented in accordance with, accounting principles generally accepted in the United States of America (“GAAP”). System-wide sales are the sum of company-operated restaurant revenue and sales from franchised restaurants. Our total revenue in our consolidated statements of income is limited to company-operated restaurant revenue and franchise revenue from our franchisees. Accordingly, system-wide sales should not be considered in isolation or as a substitute for our results as reported under GAAP. Management believes that the presentation of system-wide sales are an important figure forprovides useful information to investors because they areit is a measure that is widely used in the restaurant industry, including by our management, to evaluate brand scale and market penetration.
38
The following table reconciles system-wide sales to company-operated restaurant revenue and total revenue.
| Fiscal Year | |||||||||||
| (Dollar amounts in thousands) | 2017 | 2016 | 2015 | ||||||||
| Company-operated restaurant revenue | $ | 376,615 | $ | 355,468 | $ | 332,040 | |||||
| Franchise revenue | 25,086 | 24,655 | 23,017 | ||||||||
| Total Revenue | 401,701 | 380,123 | 355,057 | ||||||||
| Franchise revenue | (25,086 | ) | (24,655 | ) | (23,017 | ) | |||||
| Sales from franchised restaurants | 465,149 | 439,973 | 421,344 | ||||||||
| System-wide sales | $ | 841,764 | $ | 795,441 | $ | 753,384 | |||||
| | | | | | | | | |
| | Fiscal Year | |||||||
| | 2022 | | 2021 | | 2020 | |||
(Dollar amounts in thousands) | | (52-Weeks) | | (52-Weeks) |
| (53-Weeks) | |||
Company-operated restaurant revenue | | $ | 403,218 | | $ | 394,733 | | $ | 374,064 |
Franchise revenue | | | 38,225 | | | 33,729 | |
| 29,418 |
Franchise advertising fee revenue | | | 28,516 | | | 25,901 | |
| 22,605 |
Total Revenue | | | 469,959 | | | 454,363 | |
| 426,087 |
Franchise revenue | | | (38,225) | | | (33,729) | |
| (29,418) |
Franchise advertising fee revenue | | | (28,516) | | | (25,901) | | | (22,605) |
Sales from franchised restaurants | | | 635,819 | | | 578,497 | |
| 505,559 |
System-wide sales | | $ | 1,039,037 | | $ | 973,230 | | $ | 879,623 |
Comparable Restaurant Sales
Comparable restaurant sales reflect year-over-year sales changes for comparable company-operated, franchised, and system-wide restaurants. A restaurant enters our comparable restaurant base the first full week after it has operated for fifteen months. Comparable restaurant sales exclude restaurants closed during the applicable period. At December 27, 2017,28, 2022, December 28, 201629, 2021 and December 30, 2015,2020, there were 424, 409,464, 464 and 397465 comparable restaurants, 181, 169,184, 187 and 160190 company-operated and 243, 240280, 276 and 237275 franchised, respectively. Comparable restaurant sales indicate the performance of existing restaurants, since new restaurants are excluded. Comparable restaurant sales growth can be generated by an increase in the number of meals sold and/or by increases in the average check amount,size, resulting from a shift in menu mix and/or higher prices resulting from new products or price increases.
Company-Operated Average Unit Volumes
We measure company-operated AUVs on both a weekly and an annual basis. Weekly AUVs consist of comparable restaurant sales over a seven-day period from Thursday to Wednesday. Annual AUVs are calculated using the following methodology:a step process. First, we divide our total net sales for all company-operated restaurants for the fiscal year by the total number of restaurant operating weeks during the same period. Second, we annualize that average weekly per-restaurant sales figure by multiplying it by 52. An operating week is defined as a restaurant open for business over a seven-day period from Thursday to Wednesday. This measurement allows management to assess changes in consumer spending patterns at our restaurants and the overall performance of our restaurant base.
Restaurant Contribution and Restaurant Contribution Margin
Restaurant contribution and restaurant contribution margin are neither required by, nor presented in accordance with, GAAP. Restaurant contribution is defined as company-operated restaurant revenue less company restaurant expenses which includes food and paper cost, labor and related expenses and occupancy and other operating expenses, where applicable. Restaurant contribution therefore excludes franchise revenue, franchise advertising fee revenue and franchise expenses as well as certain other costs, such as general and administrative expenses, franchise expenses, depreciation and amortization, impairment and closed-store reserve, loss on disposal of assets and other costs that are considered corporate-level expenses and are not considered normal operating costs of our restaurants. Accordingly, restaurant contribution is not indicative of overall Company results and does not accrue directly to the benefit of shareholders because of the exclusion of certain corporate-level expenses. Restaurant contribution margin is defined as restaurant contribution as a percentage of net company-operated restaurant revenue.
Restaurant contribution and restaurant contribution margin are supplemental measures of operating performance of our restaurants, and our calculations thereof may not be comparable to those reported by other companies. Restaurant contribution and restaurant contribution margin have limitations as analytical tools, and you should not consider them in isolation or as substitutes for analysis of our results as reported under GAAP. Management believes that restaurant contribution and restaurant contribution margin are important tools for investors, because they are widely-used metrics within the restaurant industry to evaluate restaurant-level productivity, efficiency, and performance. Management uses restaurant contribution and restaurant contribution margin as key metrics to evaluate the profitability of incremental sales at our restaurants, to evaluate our restaurant performance across periods, and to evaluate our restaurant financial performance compared with
39
our competitors.
A reconciliation of restaurant contribution and restaurant contribution margin to company-operated restaurant revenue is provided below:
| Fiscal Year | |||||||||||
| (Dollar amounts in thousands) | 2017 | 2016 | 2015 | ||||||||
| Company-operated restaurant revenue | $ | 376,615 | $ | 355,468 | $ | 332,040 | |||||
| Company restaurant expenses | 302,113 | 282,450 | 260,125 | ||||||||
| Restaurant contribution | $ | 74,502 | $ | 73,018 | $ | 71,915 | |||||
| Restaurant contribution margin (%) | 19.8 | % | 20.5 | % | 21.7 | % | |||||
| | | | | | | | | | |
|
| Fiscal Year |
| |||||||
(Dollar amounts in thousands) |
| 2022 |
| 2021 |
| 2020 |
| |||
| | | | | | | | | | |
Restaurant contribution: | | | | | | | | | | |
Income from operations | | $ | 30,120 | | $ | 41,335 | | $ | 33,556 | |
Add (less): | |
|
| |
|
| |
|
| |
General and administrative expenses | |
| 39,093 | |
| 39,852 | |
| 35,918 | |
Legal settlements | |
| — | |
| — | |
| 2,566 | |
Franchise expenses | |
| 36,169 | |
| 32,831 | |
| 28,761 | |
Depreciation and amortization | |
| 14,418 | |
| 15,176 | |
| 16,878 | |
Loss on disposal of assets | |
| 165 | |
| 289 | |
| 189 | |
Franchise revenue | |
| (38,225) | |
| (33,729) | |
| (29,418) | |
Franchise advertising fee revenue | |
| (28,516) | |
| (25,901) | |
| (22,605) | |
Recovery of securities lawsuits related legal expenses and other insurance claims | |
| — | |
| — | |
| (123) | |
Impairment and closed-store reserves | |
| 752 | |
| 1,087 | |
| 4,691 | |
(Gain) loss on disposition of restaurants | |
| (848) | |
| 1,534 | |
| — | |
Restaurant contribution | | $ | 53,128 | | $ | 72,474 | | $ | 70,413 | |
| | | | | | | | | | |
Company-operated restaurant revenue: | |
|
| |
|
| |
|
| |
Total revenue | | $ | 469,959 | | $ | 454,363 | | $ | 426,087 | |
Less: | |
|
| |
|
| |
|
| |
Franchise revenue | |
| (38,225) | |
| (33,729) | |
| (29,418) | |
Franchise advertising fee revenue | |
| (28,516) | |
| (25,901) | |
| (22,605) | |
Company-operated restaurant revenue | | $ | 403,218 | | $ | 394,733 | | $ | 374,064 | |
| | | | | | | | | | |
Restaurant contribution margin (%) | |
| 13.2 | % |
| 18.4 | % |
| 18.8 | % |
New Restaurant Openings
The number of restaurant openings reflects the number of new restaurants opened by us and our franchisees during a particular reporting period. Before a new restaurant opens, we and our franchisees incur pre-opening costs, as described below. New restaurants often open with an initial start-up period of higher than normal sales volumes, which subsequently decrease to stabilized levels. New restaurants typically experience normal inefficiencies in the form of higher food and paper, labor, and other direct operating expenses and, as a result, restaurant contribution margins are generally lower during the start-up period of operation. The average start-up period after which our new restaurants’ revenue and expenses normalize is approximately fourteen weeks. When we enter new markets, we may be exposed to start-up times and restaurant contribution margins that are longer and lower than reflected in our average historical experience.
EBITDA and Adjusted EBITDA
EBITDA represents net income (loss) before interest expense, provision (benefit) for income taxes, depreciation, and amortization. Adjusted EBITDA represents net income (loss) before interest expense, provision (benefit) for income taxes, depreciation, amortization, and items that we do not consider representative of our on-going operating performance, as identified in the reconciliation table below.
40
EBITDA and Adjusted EBITDA as presented in this Annual Report are supplemental measures of our performance that are neither required by, nor presented in accordance with, GAAP. EBITDA and Adjusted EBITDA are not measurements of our financial performance under GAAP and should not be considered as alternatives to net income, operating income, or any other performance measures derived in accordance with GAAP, or as alternatives to cash flow from operating activities as a measure of our liquidity. In addition, in evaluating EBITDA and Adjusted EBITDA, you should be aware that in the future we will incur expenses or charges such as those added back to calculate EBITDA and Adjusted EBITDA. Our presentation of EBITDA and Adjusted EBITDA should not be construed as an inference that our future results will be unaffected by unusual or nonrecurring items.
EBITDA and Adjusted EBITDA have limitations as analytical tools, and you should not consider them in isolation, or as substitutes for analysis of our results as reported under GAAP. Some of these limitations are (i) they do not reflect our cash expenditures, or future requirements for capital expenditures or contractual commitments, (ii) they do not reflect changes in, or cash requirements for, our working capital needs, (iii) they do not reflect interest expense, or the cash requirements necessary to service interest or principal payments, on our debt, (iv) although depreciation and amortization are non-cash charges, the assets being depreciated and amortized will often have to be replaced in the future, and EBITDA and Adjusted EBITDA do not reflect any cash requirements for such replacements, (v) they do not adjust for all non-cash income or expense items that are reflected in our statements of cash flows, (vi) they do not reflect the impact of earnings or charges resulting from matters we consider not to be indicative of our on-going operations, and (vii) other companies in our industry may calculate these measures differently than we do, limiting their usefulness as comparative measures.
We compensate for these limitations by providing specific information regarding the GAAP amounts excluded from such non-GAAP financial measures. We further compensate for the limitations in our use of non-GAAP financial measures by presenting comparable GAAP measures more prominently.
Management believes that EBITDA and Adjusted EBITDA facilitate operating performance comparisons from period to period by isolating the effects of some items that vary from period to period without any correlation to core operating performance or that vary widely among similar companies. These potential differences may be caused by variations in capital structures (affecting interest expense), tax positions (such as the impact on periods or companies of changes in effective tax rates or net operating losses) and the age and book depreciation of facilities and equipment (affecting relative depreciation expense). We also present EBITDA and Adjusted EBITDA because (i) we believemanagement believes that these measures are frequently used by securities analysts, investors and other interested parties to evaluate companies in our industry, (ii) we believemanagement believes that investors will find these measures useful in assessing our ability to service or incur indebtedness, and (iii) we use EBITDA and Adjusted EBITDA internally as benchmarks to compare our performance to that of our competitors.
41
The following table sets forth reconciliations of our net income to EBITDA and Adjusted EBITDA to our net income:
| | | | | | | | | |
|
| Fiscal Year | |||||||
(Amounts in thousands) |
| 2022 |
| 2021 |
| 2020 | |||
Net income | | $ | 20,801 | | $ | 29,121 | | $ | 24,474 |
Non-GAAP adjustments: | |
| | |
| | |
| |
Provision for income taxes | |
| 8,078 | |
| 10,332 | |
| 5,651 |
Interest expense, net of interest income | |
| 1,677 | |
| 1,824 | |
| 3,292 |
Depreciation and amortization | |
| 14,418 | |
| 15,176 | |
| 16,878 |
EBITDA | | $ | 44,974 | | $ | 56,453 | | $ | 50,295 |
Stock-based compensation expense (a) | |
| 3,491 | |
| 3,220 | |
| 3,093 |
Loss on disposal of assets (b) | |
| 165 | |
| 289 | |
| 189 |
Recovery of securities lawsuits related legal expense and other insurance claims (c) | | | — | | | — | | | (123) |
Impairment and closed-store reserves (d) | |
| 752 | |
| 1,087 | |
| 4,691 |
(Gain) loss on disposition of restaurants (e) | |
| (848) | |
| 1,534 | |
| — |
Income tax receivable agreement (income) expense (f) | |
| (436) | |
| 58 | |
| 139 |
Securities class action legal expense (g) | |
| 443 | |
| 495 | |
| 604 |
Legal settlements (h) | | | (541) | | | — | | | 2,566 |
Special legal expenses (i) | | | 350 | | | — | | | — |
Pre-opening costs (j) | |
| 326 | |
| 259 | |
| 141 |
Adjusted EBITDA | | $ | 48,676 | | $ | 63,395 | | $ | 61,595 |
| Fiscal Year | |||||||||||
| 2017 | 2016 | 2015 | |||||||||
| Net income | $ | 8,619 | $ | 18,339 | $ | 24,054 | |||||
| Non-GAAP adjustments: | |||||||||||
| Provision for income taxes | 497 | 12,783 | 20,857 | ||||||||
| Interest expense, net | 3,278 | 3,155 | 3,707 | ||||||||
| Depreciation and amortization | 18,128 | 16,053 | 13,092 | ||||||||
| EBITDA | $ | 30,522 | $ | 50,330 | $ | 61,710 | |||||
Stock based compensation expense (a) | 1,056 | 1,063 | 539 | ||||||||
Loss on disposal of assets (b) (c) | 799 | 674 | 471 | ||||||||
Expenses related to fire loss (c) | — | 48 | — | ||||||||
Gain on recovery of insurance proceeds, property, equipment, and expenses(c) | — | (741 | ) | — | |||||||
| Recovery of securities lawsuits related legal expense(d) | (1,666 | ) | — | — | |||||||
Asset impairment and closed-store reserves (e) | 33,645 | 8,554 | 92 | ||||||||
Gain on disposition of restaurants (f) | — | (28 | ) | — | |||||||
Expense related to selling shareholders (g) | — | — | 50 | ||||||||
Income tax receivable agreement (income) expense (h) | (5,570 | ) | 352 | 156 | |||||||
Securities class action legal expense (i) | 4,236 | 2,696 | 993 | ||||||||
Pre-opening costs (j) | 1,981 | 2,624 | 1,456 | ||||||||
| Executive transition costs(k) | 284 | — | — | ||||||||
| Adjusted EBITDA | $ | 65,287 | $ | 65,572 | $ | 65,467 | |||||
| (a) | Includes non-cash, stock-based compensation. |
| (b) | Loss on disposal of assets includes the loss on disposal of assets related to retirements and replacement or write-off of leasehold improvements or equipment. |
| (c) |
| (d) | |
| Includes costs related to impairment of long-lived and ROU assets and closing restaurants. During fiscal |
In fiscal 2021, we recorded non-cash impairment charges of $0.7 million for the year ended December 29, 2021, primarily related to the carrying value of one restaurant in Texas closed in 2019, the ROU assets of one restaurant in California closed in 2021, and the long-lived assets of three restaurants in California. During fiscal 2016,2021, we recognized $0.4 million of closed-store reserve expense, primarily related to the Company determined thatamortization of ROU assets, property taxes and CAM payments for our closed locations.
In fiscal 2020, we recorded impairment charges of $3.5 million for the year ended December 30, 2020, primarily related to the carrying value of the ROU assets of nineone restaurant in Texas and the long-lived assets of four restaurants in Arizona, California and Texas, may not be recoverable. As a result, the Company recorded $8.3California. During fiscal 2020, we recognized $1.2 million of closed-store reserve expense, primarily related to the impairmentamortization of theROU assets, of the nine restaurants.
| (e) | |
| (f) | |
| On July 30, 2014, we entered into the TRA. This agreement calls for us to pay to our pre-IPO stockholders 85% of the savings in cash that we realize in our taxes as a result of utilizing our net operating losses and other tax attributes |
42
| attributable to preceding periods. For the years ended December |
| (g) | |
| Consists of costs related to the defense of securities lawsuits. |
| (h) | Fiscal 2020 consists of an expense of $2.6 million related to resolution of the longstanding lawsuit involving a contract dispute with one of the Company’s franchisees concerning asserted territory rights, as well as amounts incurred related to the payment of the final settlement amounts for consolidated wage and hour class action lawsuits resolved during fiscal 2020. For additional information on legal settlements, see Note 13 “Commitments and Contingencies—Legal Matters” in the accompanying “Notes to Consolidated Financial Statements” in this Annual Report. |
| (i) | Consists of costs related to a special dividend declaration. On October 11, 2022, the Board of Directors declared a special dividend of $1.50 per share on the common stock of the Company. The special dividend was paid on November 9, 2022, to stockholders of record, including holders of restricted stock, at the close of business on October 24, 2022. |
| (j) | Pre-opening costs are a component of general and administrative expenses, and consist of costs directly associated with the opening of new restaurants and incurred prior to opening, including management labor costs, staff labor costs during training, food and supplies used during training, marketing costs, and other related pre-opening costs. These are generally incurred over the three to five months prior to opening. Pre-opening costs also include occupancy costs incurred between the date of possession and the opening date for a restaurant. |
Liquidity and Capital Resources
Our primary sources of liquidity and capital resources have been cash provided from operations, cash and cash equivalents, and the 2022 Revolver (as defined below). Our primary requirements for liquidity and capital are new restaurants, existing restaurant capital investments (remodels and maintenance), legal defense costs, lease obligations, interest payments on our debt, working capital and general corporate needs. Our working capital requirements are not significant, since our customers pay for their purchases in cash or by payment card (credit or debit) at the time of sale. Thus, we are able to sell many of our inventory items before we have to pay our suppliers. Our restaurants do not require significant inventories or receivables. We believe that these sources of liquidity and capital are sufficient to finance our continued operations, including planned capital expenditures, for at least the next 12 months and beyond from the issuance of the consolidated financial statements.
However, depending on the effects of the COVID-19 pandemic (and its related economic impacts) and macroeconomic conditions, our financial performance and liquidity could be further impacted and could impact our ability to meet certain financial covenants required in our 2022 Credit Agreement (as defined in Note 6 “Long-Term Debt”), specifically the lease-adjusted coverage ratio and fixed-charge coverage ratio.
Cash Flows
The following table presents summary cash flow information for the years indicated:
| | | | | | | | | |
|
| Fiscal Year | |||||||
(Amounts in thousands) |
| 2022 |
| 2021 |
| 2020 | |||
Net cash provided by (used in) | | |
| | |
| | |
|
Operating activities | | $ | 38,549 | | $ | 52,099 | | $ | 40,547 |
Investing activities | |
| (18,915) | |
| (12,485) | |
| (6,690) |
Financing activities | |
| (29,187) | |
| (22,787) | |
| (28,708) |
Net (decrease) increase in cash | | $ | (9,553) | | $ | 16,827 | | $ | 5,149 |
Operating Activities
In fiscal 2017, 2016,2022, net cash provided by operating activities decreased by $13.6 million compared to fiscal 2021. This decrease was due primarily to lower profitability and 2015, comparable restaurant sales system-wideunfavorable working capital fluctuations during fiscal 2022.
In fiscal 2021, net cash provided by operating activities increased 1.5%, 0.9%,by $11.6 million compared to fiscal 2020. This increase was due primarily to an increase in profitability after non-cash items and 2.2%, respectively. Comparable restaurant sales growth reflects the change in year-over-year salesfavorable working capital fluctuations for the comparable restaurant base. A restaurant enters our comparable restaurant baseyear ended December 29, 2021.
Investing Activities
In fiscal 2022, net cash used in investing activities increased by $6.4 million compared to fiscal 2021. This increase was due primarily to opening four new company-operated restaurants during fiscal 2022 compared to opening two new company-operated restaurants during fiscal 2021. This was partially offset by cash proceeds of $1.0 million received during fiscal 2022 related to the first full week after its 15-month anniversary. System-wide comparable restaurant sales include restaurant sales at all comparablesale of three restaurants within the Orange County area to an existing franchisee compared to cash proceeds of $4.6 million received during fiscal 2021 related to the sale of eight restaurants within the Sacramento area to an existing franchisee.
In fiscal 2021, net cash used in investing activities increased by $5.8 million compared to fiscal 2020. This increase was due primarily to opening two new company-operated restaurants and at all comparable franchisedremodeling ten restaurants as reportedduring the year ended December 29, 2021 compared to opening one new company-operated restaurant and completing two new remodels during the year ended December 30, 2020. This was partially offset by franchisees. Comparable restaurant sales at company-operatedcash proceeds of $4.6 million received during the year ended December 29, 2021 related to the sale of eight restaurants within the Sacramento area to an existing franchisee.
Financing Activities
In fiscal 2022, net cash used in financing activities increased 1.0%by $6.4 million compared to fiscal 2021. This change was due primarily to a special dividend payout of $56.0 million during fiscal 2022 partially offset by net borrowings on the 2022 Revolver of $26.0 million, compared to net pay downs of $22.8 million in fiscal 2017, 0.6%2021. Additionally, this change was due to a $1.7 million cash inflow related to option exercises during the year ended December 28, 2022, compared to a $0.9 million cash inflow during the year ended December 29, 2021.
In fiscal 2021, net cash used in financing activities decreased by $5.9 million compared to fiscal 2020. This decrease was due primarily to $22.8 million of net pay downs on the 2018 Revolver during fiscal 2021, compared to net pay downs of $34.2 million in fiscal 2016, and 1.0% in fiscal 2015. In fiscal 2017, the increase in company-operated comparable restaurant sales2020. The change was primarily the result of an increase in average check size of 1.9% , partially offset by a decrease of $5.0 million in transactionsproceeds received from the issuance of 0.9%common stock upon exercise of stock options in fiscal 2021 compared to fiscal 2020.
Debt and other Obligations
The Company, as a guarantor, is a party to a credit agreement (the “2022 Credit Agreement”) among EPL, as borrower, Intermediate, as a guarantor, Bank of America, N.A., as administrative agent, swingline lender, and letter of credit issuer, the lenders party thereto, and the other parties thereto, which provides for a $150.0 million five-year senior secured revolving credit facility (the “2022 Revolver”). In fiscal 2016,The 2022 Revolver, which is available pursuant to the increase in company-operated comparable restaurant sales was primarily2022 Credit Agreement, includes a sub limit of $15.0 million for letters of credit and a sub limit of $15.0 million for swingline loans. The 2022 Revolver and 2022 Credit Agreement will mature on July 27, 2027. The obligations under the result2022 Credit Agreement and related loan documents are guaranteed by Holdings and Intermediate. The obligations of an increase in average check size of 0.3%Holdings, EPL and an increase in transactions of 0.3%. In fiscal 2015,Intermediate under the increase in company-operated comparable restaurant sales was driven by an increase in average check size of 2.9% offset2022 Credit Agreement and related loan documents are secured by a decreasefirst priority lien on substantially all of their respective assets.
The special dividend announced by the Company’s Board of Directors on October 11, 2022 was permitted under the terms of 2022 Revolver pursuant to both subclause (iii)(d) and (iii)(e) of the following sentence. Under the 2022 Revolver, Holdings is restricted from making certain payments such as cash dividends, except that it may, inter alia, (i) pay up to $1.0 million per year to repurchase or redeem qualified equity interests of Holdings held by our past or present officers, directors, or employees (or their estates) upon death, disability, or termination of employment, (ii) pay under its TRA, and (iii) so long as no default or event of default has occurred and is continuing, (a) make non-cash repurchases of equity interests in transactionsconnection with the exercise of 1.9%stock options by directors, officers and management,
44
provided that those equity interests represent a portion of the consideration of the exercise price of those stock options, (b) pay up to $0.5 million in any 12 month consecutive period to redeem, repurchase or otherwise acquire equity interests of any subsidiary that is not a wholly-owned subsidiary from any holder of equity interest in such subsidiary, (c) pay up to $2.5 million per year pursuant to stock option plans, employment agreements, or incentive plans, (d) make up to $5.0 million in other restricted payments per year, and (e) make other restricted payments, subject to its compliance, on a pro forma basis, with (x) a lease-adjusted consolidated leverage ratio not to exceed 4.25 times and (y) the financial covenants applicable to the 2022 Revolver.
Borrowings under the 2022 Credit Agreement (other than any swingline loans) bear interest, at the borrower’s option, at rates based upon either the secured overnight financing rate (“SOFR”) or a base rate, plus, for each rate, a margin determined in accordance with a lease-adjusted consolidated leverage ratio-based pricing grid. The base rate is calculated as the highest of (a) the federal funds rate plus 0.50%, (b) the published Bank of America prime rate, or (c) Term SOFR with a term of one-month SOFR plus 1.00%. In fiscal 2017, 2016, and 2015, comparable restaurant sales at franchised restaurants increased 1.8%, 1.1%For Term SOFR loans, the margin is in the range of 1.25% to 2.25%, and 3.1%, respectively.
The 2022 Credit Agreement contains certain financial covenants. We were in compliance with the financial covenants as of December 28, 2022.
At December 28, 2022, $9.8 million of letters of credit and $66.0 million of the revolving line of credit were outstanding. The amount available under the revolving line of credit was $74.2 million at December 28, 2022.
During the year ended December 28, 2022, we have focused on repositioningrefinanced and terminated our brand, improving operational efficiency and brand awareness, strengthening our management team, and refinancing our indebtedness in preparation for future growth. New restaurant development is expected to be a key driver of our long-term growth strategy. In fiscal 2017, we opened 16 company-operated restaurants, and our franchisees opened seven new restaurants. From time to time, we and our franchisees close restaurants. In fiscal 2017,credit agreement (the “2018 Credit Agreement”) among EPL, as borrower, the Company closed five restaurants and our franchisees closed one restaurants. Our restaurant counts atIntermediate, as guarantors, Bank of America, N.A., as administrative agent, swingline lender, and letter of credit issuer, the beginninglenders party thereto, and end of each of the last three years were as follows:
| Fiscal Year | ||||||||
| 2017 | 2016 | 2015 | ||||||
| Company-operated restaurant activity: | ||||||||
| Beginning of period | 201 | 186 | 172 | |||||
| Openings | 16 | 18 | 14 | |||||
| Restaurant sale to franchisee | — | (1 | ) | — | ||||
| Closures | (5 | ) | (2 | ) | — | |||
| Restaurants at end of period | 212 | 201 | 186 | |||||
| Franchised restaurant activity: | ||||||||
| Beginning of period | 259 | 247 | 243 | |||||
| Openings | 7 | 13 | 5 | |||||
| Restaurant sale to franchisee | — | 1 | — | |||||
| Closures | (1 | ) | (2 | ) | (1 | ) | ||
| Restaurants at end of period | 265 | 259 | 247 | |||||
| Total restaurant activity: | ||||||||
| Beginning of period | 460 | 433 | 415 | |||||
| Openings | 23 | 31 | 19 | |||||
| Closures | (6 | ) | (4 | ) | (1 | ) | ||
| Restaurants at end of period | 477 | 460 | 433 | |||||
In connection with our entry into the 2022 Credit Agreement, we had remodeled 120 company-operatedterminated the interest rate swap on July 28, 2022 which was previously used to hedge interest rate risk. Prior to the interest rate swap termination, the swap was a highly effective cash flow hedge. In settlement of this swap, we received approximately $0.6 million and 196 franchised restaurants, or 316 system-wide, over 75%derecognized the corresponding interest rate swap asset. The remaining amount in accumulated other comprehensive (loss) income (“AOCI”) related to the hedging relationship will be reclassified into earnings when the hedged forecasted transaction is reported in earnings.
Material Cash Requirements
Our total capital expenditures for 2022 were $19.9 million. In 2022, we spent approximately $8.1 million on the development and construction of our restaurant system duenew restaurants. The remaining $11.8 million of capital expenditures during 2022 were related to investments in existing restaurants, including new equipment andhardware, technology to optimize efficiencies, remodeling and similar improvements. In 2023, we expect to incur between $27.0 million and $31.0 million in total capital expenditures, of which we expect $11.0 million to $13.0 million will be related to our construction of new restaurants, and $14.0 million to $16.0 million will be related to investments in existing restaurants, including new equipment andhardware, technology to optimize efficiencies, remodeling and similar improvements. Finally, we expect a portion of our incurred capital expenditures in 2023 to be remodeled. This includes 14 company-operatedfor additional corporate initiatives, including investments in
45
technology for support centers to boost innovation, enhancing the customer experience, and 3 franchised restaurants that have been remodeled usingimproving operations. We expect to fund these capital expenditures primarily with operating cash flows.
The following table summarizes our newest Vision restaurant design. The Vision design elevates the brand image with exteriorother current and interior features that embrace the brand’s authentic roots with warm textures, rustic elements and a focus on the signature open kitchen layout established in previous designs. Aslong-term material cash requirements as of December 27, 2017, including new builds and remodels,28, 2022, which we had 44 restaurants openexpect to fund primarily with the Vision design in our system. Remodeling is a use ofoperating cash and has implications for our net property and depreciation line items on our consolidated balance sheets and statements of income, among others. The cost of our restaurant remodels varies depending on the scope of work required, but on average the investment is $0.3 to $0.4 million per restaurant. We believe that our remodeling program will result in higher restaurant revenue and a strengthened brand.flows:
| | | | | | | | | | | | | | | |
|
| Payments Due by Period | |||||||||||||
|
| | |
| | |
| 2024 - |
| 2026 - |
| 2028 and | |||
(Amounts in thousands) | | Total | | 2023 | | 2025 | | 2027 | | thereafter | |||||
Operating leases (1) | | $ | 236,459 | | $ | 27,876 | | $ | 49,616 | | $ | 41,401 | | $ | 117,566 |
Finance leases (1) | |
| 2,146 | |
| 151 | |
| 298 | |
| 218 | |
| 1,479 |
Long-term debt (2) | |
| 76,959 | |
| 3,529 | |
| 6,938 | |
| 66,492 | |
| — |
Income tax receivable agreement (3) | |
| 672 | |
| 263 | |
| 409 | |
| — | |
| — |
Purchasing commitments—chicken(4) | |
| 40,866 | |
| 40,866 | |
| — | |
| — | |
| — |
Total | | $ | 357,102 | | $ | 72,685 | | $ | 57,261 | | $ | 108,111 | | $ | 119,045 |
| (1) | Operating and Finance Leases — Represents future minimum lease payments for our restaurants andthe principal payments during the lease terms, respectively. Refer to Note 5 “Leases”in the accompanying “Notes to Consolidated Financial Statements” in this Annual Report for further details regarding our obligations and the timing of expected payments. |
| (2) | Long-Term Debt — Represents our contractual debt obligations. Includes expected interest expenses, calculated based on applicable interest rates at December 28, 2022. Refer to Note 6 “Long-Term Debt”in the accompanying “Notes to Consolidated Financial Statements” in this Annual Report for further details regarding our obligations and the timing of expected payments. |
| (3) | Income Tax Receivable Agreement — Represents paymentsto our pre-IPO stockholders under the TRA. Refer to Note 9 “Income Taxes”in the accompanying “Notes to Consolidated Financial Statements” in this Annual Report for further details regarding our obligations and the timing of expected payments. |
| (4) | Purchasing Commitments (Chicken) — Reflects contractual purchase commitments for goods related to restaurant operations. Refer to Note 13 “Commitments and Contingencies”in the accompanying “Notes to Consolidated Financial Statements” in this Annual Report for further details regarding our obligations. |
Critical Accounting Policies and Use of Estimates
The preparation of our consolidated financial statements in accordance with GAAP requires us to make estimates and judgments that affect our reported amounts of assets, liabilities, revenue, and expenses, and related disclosure of contingent assets and liabilities. We base our estimates on historical experience and on various other assumptions that we believe to be reasonable under current circumstances in making judgments about the carrying value of assets and liabilities that are not readily available from other sources. We evaluate our estimates on an on-going basis. Actual results may differ from these estimates under different assumptions or conditions.
Accounting policies are an integral part of our financial statements. A thorough understanding of these accounting policies is essential when reviewing our reported results of operations and our financial position. Management believes that the critical accounting policies and estimates discussed below involve the most difficult management judgments, due to the sensitivity of the methods and assumptions used. Our significant accounting policies are described in Note 2 “Summary of Significant Accounting Policies” in the accompanying “Notes to our consolidated financial statements included elsewhereConsolidated Financial Statements” in this report.
Revenue Recognition
We record revenue from company-operated restaurants as food and beverage products are delivered to customers and payment is tendered at the time of sale. We present sales net of sales-related taxes and promotional allowances. In the case of gift card sales, we record revenue when the gift card is redeemed by the customer. We record royalties from
46
franchised restaurant sales based on a percentage of restaurant revenues in the period that the related franchised restaurants’ revenues are earned. FranchiseThe initial franchise services, or exclusivity of the development agreements, are not distinct from the continuing rights or services offered during the term of the franchise agreement and are, therefore, treated as a single performance obligation. As such, initial franchise and development fees received, and area developmentsubsequent renewal fees, are recognized as income when all material servicesover the franchise, or conditions relating to the sale of the
Goodwill and Indefinite-Lived Intangible Assets, Net
Intangible assets consist primarily of goodwill and trademarks.
We do not amortize our goodwill and indefinite-lived intangible assets. We perform an annual impairment test for goodwill during the fourth fiscal quarter of each year, or more frequently if impairment indicators arise. For our annual goodwill impairment assessment at December 27, 2017, we performed a qualitative assessment and concluded that the fair value of the reporting unit to which goodwill was assigned exceeded our book equity. Accordingly, we did not identify any goodwill impairment.
We perform an annual impairment test for indefinite-lived intangible assets during the fourth fiscal quarter of each year, or more frequently if impairment indicators arise. For ourAn impairment test for indefinite-lived intangible assets at December 27, 2017, we performedconsists of either a qualitative assessment and concluded thator a comparison of the fair value of an intangible asset with its carrying amount. The excess of the indefinite-livedcarrying amount of an intangible assets exceeded their carryingasset over its fair value and that there was no impairment.
These assumptions used in our estimates of fair value are generally consistent with past performance and are also consistent with the projections and assumptions that we use in our forward-looking operating plans. These assumptions are subject to change as a result of changing economic and competitive conditions. Changes in these estimates and assumptions could materially affect our determinations of fair value and impairment.
We determined that there were no indicators of potential impairment of our goodwill and indefinite-lived intangible assets during fiscal 2022 and 2021. Accordingly, we did not record any impairment to goodwill or indefinite-lived intangible assets during the year ended December 28, 2022. The ultimate severity and longevity of the COVID-19 pandemic and the extent and duration of any economic downturn is unknown, and therefore, it is possible that impairments could be identified in future periods, and such amounts could be material.
Upon the sale or refranchising of a restaurant, we evaluate whether there is a decrement of goodwill. The amount of goodwill included in the cost basis of the asset sold is determined based on the relative fair value of the portion of the reporting unit disposed of compared to the fair value of the reporting unit retained. The fair value of the portion of the reporting unit disposed of in a refranchising is determined by reference to the discounted value of the future cash flows expected to be generated by the restaurant and retained by the franchisee, which includes a deduction for the anticipated, future royalties the franchisee will pay us associated with the franchise agreement entered into simultaneously with the refranchising transition. The fair value of the reporting unit retained is based on the price a willing buyer would pay for the reporting unit and includes the value of franchise agreements. As such, the fair value of the reporting unit retained can include expected cash flows from future royalties from those restaurants currently being refranchised, future royalties from existing franchise businesses and company restaurant operations. We did not record any decrement to goodwill related to the disposition of restaurants in fiscal 2022, 2021 and 2020.
Long-Lived and ROU Assets
We state the value of our property and equipment, including primarily leasehold improvements and restaurant equipment, furniture, and fixtures, at cost, minus accumulated depreciation and amortization. We calculate depreciation using the straight-line method of accounting over the estimated useful lives of the related assets. We amortize our leasehold improvements using the straight-line method of accounting over the shorter of the lease term (including reasonably assured renewal periods) or the estimated useful lives of the related assets. We expense repairs and maintenance as incurred, but capitalize major improvements and betterments. We make judgments and estimates related to the expected useful lives of those assets that are affected by factors such as changes in economic conditions and changes in operating performance. If we change our assumptions in the future, we may be required to record impairment charges for these assets.
The Company reviews its long-lived and ROU assets for impairment on a restaurant-by-restaurant basis whenever events or changes in circumstances indicate that the carrying value of certain assets may not be recoverable. The Company considers a triggering event to have occurred related to a specific restaurant if the restaurant’s cash flowsAUV for the last twelve months are less than a minimum threshold or if consistent levels of undiscounted cash flows for the remaining
47
lease period are less than the carrying value of the restaurant’s assets. If the Company concludes that the carrying value of certain assets will not be recovered based on expected undiscounted future cash flows, an impairment write-down is recorded to reduce the assets to their estimated fair value. The fair value is measured on a nonrecurring basis using unobservable (Level 3) inputs. There is uncertainty in the projected undiscounted future cash flows used in our impairment review analysis. If actual performance does not achieve the projections, we may recognize impairment charges in future periods, and such charges could be material.
Insurance Reserves
We are responsible for workers’ compensation, general, and health insurance claims up to a specified amount. We maintain a reserve for estimated claims both reported and incurred but not reported, based on historical claims experience and other assumptions. In estimating our insurance accruals, we utilize independent actuarial estimates of expected losses, which are based on statistical analyses of historical data. Our actuarial assumptions are closely monitored and adjusted when warranted by changing circumstances. Should claims occur or medical costs increase in greater amounts than we have expected, accruals may not be sufficient, and we may record additional expenses.
Accounting for Lease Obligations
We lease a substantial number of our restaurant properties. At the inception of each lease, we evaluate the property and the lease to determine whether the lease is an operating lease or a capitalfinance lease. This lease accounting evaluation may require significant judgment in determining the fair value and useful life of the leased property and the appropriate lease term. The lease term used
We subleasemake significant assumptions and judgments related to determination of whether a numbercontract contains a lease and the discount rate used for the lease. In determining if any of restaurant propertiesour contracts contain a lease, we make assumptions and judgments related to our franchisees. As such,ability to direct the use of any assets stated in the contract and the likelihood of renewing any short-term contracts for a period extending past twelve months. We also make significant assumptions and judgments in determining an appropriate discount rate for property leases. These include using a consistent discount rate for a portfolio of leases entered into at varying dates, using the full 20-year term of the lease, excluding any options, and using the total minimum lease payments. We utilize a third-party valuation firm to assist in determining the discount rate, based on the above assumptions. For all other leases, we remain principally liable foruse the underlying leases. If sales trendsdiscount rate implicit in the lease, or economic conditions worsen for our franchisees, their financial health may worsen, our collection rates may decline, and we may be required to assume the responsibility for additional lease payments on what are presently franchised restaurants.
Income Taxes
We use the asset and liability method of accounting for income taxes. Deferred tax assets and liabilities are determined based on temporary differences between the financial carrying amounts and the tax basis of assets and liabilities using enacted tax rates in effect in the years in which the temporary differences are expected to reverse. As of December 27, 2017,28, 2022, we had no federal and less than $0.1 million state net operating loss (“NOL”(“NOL”) carryforwards of $55.8 million and $20.1 million, respectively.carryforwards. These Federal and State NOLs expire beginning in 2030 and 2025, respectively.
A valuation allowance is required when there is significant uncertainty as to whether certain deferred tax assets can be realized. The ability to realize deferred tax assets is dependent upon our ability to generate sufficient taxable income within the carryforward periods provided for in the tax law for each tax jurisdiction. We have considered the following possible sources of taxable income when assessing the realization of our deferred tax assets:
| ● | future reversals of existing taxable temporary differences; |
| ● | future taxable income or loss, exclusive of reversing temporary differences and carryforwards; |
| ● | tax-planning strategies; and |
| ● | taxable income in prior carryback years. |
We will continue to reevaluate the continued need for either a valuation allowance. Relevant factors include:
| ● | current financial performance; |
48
| ● | our ability to meet short-term and long-term financial and taxable income projections; |
| ● | the overall market environment; and |
| ● | the volatility and trends in the industry in which we operate. |
All of the factors that we consider in evaluating treatment of a deferred tax asset valuation allowance involve significant judgment. For example, there are many different interpretations of “cumulative losses in recent years” that can be used. Also, significant judgment is involved in making projections of future financial and taxable income, especially because our financial results are significantly dependent upon industry trends. Any change in our valuation allowance will significantly impact our financial results in the period of that change.
When there are uncertainties related to potential income tax benefits, in order to qualify for recognition, the position we take has to have at least a “more likely than not” chance of being sustained (based on the position’s technical merits) upon challenge by the responsible authorities. The term “more likely than not” means a likelihood of more than 50%. Otherwise, we may not recognize any of the potential tax benefits associated with that position. We recognize a benefit for a tax position that meets the “more likely than not” criterion as the largest amount of tax benefit that is greater than 50% likely to be realized upon its effective resolution. Unrecognized tax benefits involve our judgment regarding the likelihood of a benefit being sustained. The final resolutions of uncertain tax positions could result in adjustments to recorded amounts and affect our results of operations, financial position, and cash flows. However, we anticipate that any such adjustments would not materially impact our financial statements.
On July 30, 2014, we entered into the TRA. The TRA calls for us to pay to our pre-IPO stockholders 85% of the cash savings in cash that we realize in our taxes as a result of utilizing our net operating lossesNOLs and other tax attributes attributable to preceding periods. We are permittedThe TRA charge expense (benefit) is a permanent add-back to makeour taxable income. TRA payments under the 2014 Revolver. In fiscal 2017 a benefit of $5.6 million andresulted in and fiscal 2016, we incurred a charge of $0.4 million of income in fiscal 2022 and less than $0.1 million of expense in fiscal 2021 as a result of the amortization of interest expense related to the amortization of the present value of the TRA obligation, the impact of the Tax Act on the corporate tax rate on future years, and an adjustment to thetotal expected TRA liability, duepayments and changes in estimates for actual tax returns filed and future forecasted taxable income and $0.1 million of expense in fiscal 2020 as a result of changes to future forecasted results and deduction on 2018 legal settlement accrual. In fiscal 2022, 2021 and 2020, we paid $0.4 million, $1.7 million and $5.2 million, respectively, to our pre-IPO stockholders under the expected realization of various pre-IPO tax credits.
In addition, in fiscal 2014, we applied for various tax credits that resulted in $6.7 million of additional deferred tax assets and tax benefits. As of fiscal 2017,2022, the deferred asset balance forrelated to these various tax credits, net of valuation allowance was $5.4$0.5 million. The fiscal 20172022 provision includes a $4.3$6.7 million valuation allowance against our deferred tax asset, resulting from certain tax credits that may not be realizable prior to the time the credits expire. Also,
During fiscal 2020, we received a Notice of Proposed Adjustment for the years ended December 27, 2017 and December 28, 2016, related to our methodology regarding our ordering of NOL. Resolution of this NOPA resulted in fiscal 2017, federal work opportunity tax credits (“WOTC”)a payment of approximately $0.4 million, were generated.
Stock-Based Compensation
We measure and recognize compensation expense for the estimated fair value of equity instruments for employees and non-employee directors based on the grant-date fair value of the award. For awards that are based on a service requirement, the cost is recognized on a straight-line basis over the requisite service period, usually the vesting period. We granted 372,958 options during fiscal 2022. In fiscal 2017, the Company2022, we granted 135,036 stock options and 181,292356,610 restricted stock awards, with an exercise price equal to the fair market value of the common stock on the date of grant. The awards granted in fiscal 2017, 20162022, 2021 and 20152020 had a four-year vesting period for employees and three-year vesting period for directors. For options that were based on performance requirements, costs were recognized over the periods to which the performance criteria related. On November 15, 2016, the board of directors modified the vesting of the remaining performance based stock options to instead vest based solely on time. As of December 27, 2017, there were no remaining performance based stock options outstanding. In order to calculate the grant date fair value for our stock options’ fair values and the associated compensation costs for share-based awards,options, we utilize the Black–Scholes option pricing model.
| Fiscal Year | ||||||||||||||||||||
2017 (52-Weeks) | 2016 (52-Weeks) | Increase / (Decrease) | ||||||||||||||||||
| ($ ,000) | (%) | ($ ,000) | (%) | ($ ,000) | (%) | |||||||||||||||
| Statements of Income Data: | ||||||||||||||||||||
| Revenue | ||||||||||||||||||||
| Company-operated restaurant revenue | $ | 376,615 | 93.8 | $ | 355,468 | 93.5 | $ | 21,147 | 5.9 | |||||||||||
| Franchise revenue | 25,086 | 6.2 | 24,655 | 6.5 | 431 | 1.7 | ||||||||||||||
| Total revenue | 401,701 | 100.0 | 380,123 | 100.0 | 21,578 | 5.7 | ||||||||||||||
| Cost of operations | ||||||||||||||||||||
Food and paper costs (1) | 109,898 | 29.2 | 107,218 | 30.2 | 2,680 | 2.5 | ||||||||||||||
Labor and related expenses (1) | 106,584 | 28.3 | 97,471 | 27.4 | 9,113 | 9.3 | ||||||||||||||
Occupancy and other operating expenses (1) | 85,631 | 22.7 | 78,263 | 22.0 | 7,368 | 9.4 | ||||||||||||||
Gain on recovery of insurance proceeds, lost profits (1) | — | — | (502 | ) | (0.1 | ) | 502 | (100.0 | ) | |||||||||||
Company restaurant expenses (1) | 302,113 | 80.2 | 282,450 | 79.5 | 19,663 | 7.0 | ||||||||||||||
| General and administrative expenses | 38,523 | 9.6 | 34,661 | 9.1 | 3,862 | 11.1 | ||||||||||||||
| Franchise expenses | 3,335 | 0.8 | 3,823 | 1.0 | (488 | ) | (12.8 | ) | ||||||||||||
| Depreciation and amortization | 18,128 | 4.5 | 16,053 | 4.2 | 2,075 | 12.9 | ||||||||||||||
| Loss on disposal of assets | 799 | 0.2 | 674 | 0.2 | 125 | 18.5 | ||||||||||||||
| Expenses related to fire loss | — | — | 48 | 0.0 | (48 | ) | (100.0 | ) | ||||||||||||
| Gain on recovery of insurance proceeds, property, equipment and expenses | — | — | (741 | ) | (0.2 | ) | 741 | (100.0 | ) | |||||||||||
| Recovery of securities lawsuits related legal expenses | (1,666 | ) | (0.4 | ) | — | — | (1,666 | ) | NA | |||||||||||
| Asset impairment and closed-store reserves | 33,645 | 8.4 | 8,554 | 2.3 | 25,091 | 293.3 | ||||||||||||||
| Total expenses | 394,877 | 98.3 | 345,522 | 90.9 | 49,355 | 14.3 | ||||||||||||||
| Gain on disposition of restaurants | — | 0.0 | 28 | 0.0 | (28 | ) | (100.0 | ) | ||||||||||||
| Income from operations | 6,824 | 1.7 | 34,629 | 9.1 | (27,805 | ) | (80.3 | ) | ||||||||||||
| Interest expense, net | 3,278 | 0.8 | 3,155 | 0.8 | 123 | 3.9 | ||||||||||||||
| Income tax receivable agreement (income) expense | (5,570 | ) | (1.4 | ) | 352 | 0.1 | (5,922 | ) | (1,682.4 | ) | ||||||||||
| Income before provision for income taxes | 9,116 | 2.3 | 31,122 | 8.2 | (22,006 | ) | (70.7 | ) | ||||||||||||
| Provision for income taxes | (497 | ) | (0.1 | ) | (12,783 | ) | (3.4 | ) | 12,286 | (96.1 | ) | |||||||||
| Net income | $ | 8,619 | 2.1 | $ | 18,339 | 4.8 | $ | (9,720 | ) | (53.0 | ) | |||||||||
| Fiscal Year | ||||||||||||||||||||
2016 (52-Weeks) | 2015 (52-Weeks) | Increase / (Decrease) | ||||||||||||||||||
| ($ ,000) | (%) | ($ ,000) | (%) | ($ ,000) | (%) | |||||||||||||||
| Statements of Income Data: | ||||||||||||||||||||
| Revenue | ||||||||||||||||||||
| Company-operated restaurant revenue | $ | 355,468 | 93.5 | $ | 332,040 | 93.5 | $ | 23,428 | 7.1 | |||||||||||
| Franchise revenue | 24,655 | 6.5 | 23,017 | 6.5 | 1,638 | 7.1 | ||||||||||||||
| Total revenue | 380,123 | 100.0 | 355,057 | 100.0 | 25,066 | 7.1 | ||||||||||||||
| Cost of operations | ||||||||||||||||||||
Food and paper costs (1) | 107,218 | 30.2 | 105,917 | 31.9 | 1,301 | 1.2 | ||||||||||||||
Labor and related expenses (1) | 97,471 | 27.4 | 84,231 | 25.4 | 13,240 | 15.7 | ||||||||||||||
Occupancy and other operating expenses (1) | 78,263 | 22.0 | 69,977 | 21.1 | 8,286 | 11.8 | ||||||||||||||
Gain on recovery of insurance proceeds, lost profits (1) | (502 | ) | (0.1 | ) | — | — | (502 | ) | N/A | |||||||||||
Company restaurant expenses (1) | 282,450 | 79.5 | 260,125 | 78.3 | 22,325 | 8.6 | ||||||||||||||
| General and administrative expenses | 34,661 | 9.1 | 28,997 | 8.2 | 5,664 | 19.5 | ||||||||||||||
| Franchise expenses | 3,823 | 1.0 | 3,456 | 1.0 | 367 | 10.6 | ||||||||||||||
| Depreciation and amortization | 16,053 | 4.2 | 13,092 | 3.7 | 2,961 | 22.6 | ||||||||||||||
| Loss on disposal of assets | 674 | 0.2 | 471 | 0.1 | 203 | 43.1 | ||||||||||||||
| Expenses related to fire loss | 48 | 0.0 | — | — | 48 | N/A | ||||||||||||||
Gain on recovery of insurance proceeds, property, equipment and expenses | (741 | ) | (0.2 | ) | — | — | (741 | ) | N/A | |||||||||||
| Asset impairment and closed-store reserves | 8,554 | 2.3 | 92 | 0.0 | 8,462 | 9,197.8 | ||||||||||||||
| Total expenses | 345,522 | 90.9 | 306,233 | 86.2 | 39,289 | 12.8 | ||||||||||||||
| Gain on disposition of restaurants | 28 | 0.0 | — | — | 28 | 100.0 | ||||||||||||||
| Income from operations | 34,629 | 9.1 | 48,824 | 13.8 | (14,195 | ) | (29.1 | ) | ||||||||||||
| Interest expense, net | 3,155 | 0.8 | 3,707 | 1.0 | (552 | ) | (14.9 | ) | ||||||||||||
| Expenses related to selling shareholders | — | — | 50 | 0.0 | (50 | ) | (100.0 | ) | ||||||||||||
| Income tax receivable agreement expense | 352 | 0.1 | 156 | 0.0 | 196 | 125.6 | ||||||||||||||
| Income before provision for income taxes | 31,122 | 8.2 | 44,911 | 12.6 | (13,789 | ) | (30.7 | ) | ||||||||||||
| Provision for income taxes | (12,783 | ) | (3.4 | ) | (20,857 | ) | (5.9 | ) | 8,074 | (38.7 | ) | |||||||||
| Net income | $ | 18,339 | 4.8 | $ | 24,054 | 6.8 | $ | (5,715 | ) | (23.8 | ) | |||||||||
operations may be materially different.
49
| Fiscal Year | |||||||||||
| (Amounts in thousands) | 2017 | 2016 | 2015 | ||||||||
| Net cash provided by (used in) | |||||||||||
| Operating activities | $ | 53,671 | $ | 49,299 | $ | 57,971 | |||||
| Investing activities | (36,238 | ) | (35,202 | ) | (30,835 | ) | |||||
| Financing activities | (11,051 | ) | (18,030 | ) | (32,534 | ) | |||||
| Net increase (decrease) in cash and cash equivalents | $ | 6,382 | $ | (3,933 | ) | $ | (5,398 | ) | |||
| Payments Due by Period | |||||||||||||||||||
| (Amounts in thousands) | Total | 2018 | 2019- 2020 | 2021- 2022 | 2023 and thereafter | ||||||||||||||
| Operating leases | $ | 298,149 | $ | 25,270 | $ | 48,921 | $ | 44,376 | $ | 179,582 | |||||||||
| Capital leases | 420 | 172 | 149 | 99 | — | ||||||||||||||
| Long-term debt | 102,196 | 3,054 | 99,142 | — | — | ||||||||||||||
| Income tax receivable agreement | 21,975 | 8,281 | 8,528 | 3,950 | 1,216 | ||||||||||||||
| Purchasing commitments—chicken | 30,835 | 30,835 | — | — | — | ||||||||||||||
| Total | $ | 453,575 | $ | 67,612 | $ | 156,740 | $ | 48,425 | $ | 180,798 | |||||||||
ITEM 7A.QUANTITATIVE AND QUALITATIVE DISCLOSURES ABOUT MARKET RISK
Interest Rate Risk
On July 27, 2022, we refinanced the 2018 Revolver and entered into the 2022 Credit Agreement, which provides for a $150 million five-year senior secured revolving facility. In connection with the refinancing, the 2018 Credit Agreement was terminated. We are exposed to market risk from changes in interest rates on our debt, which bears interest at USD LIBORSOFR plus a margin between 1.75%1.25% and 2.50%2.25%. As of December 27, 2017,28, 2022, we had outstanding borrowings of $93.0$66.0 million and another $7.7under our 2022 Revolver, $9.8 million of letters of credit in support of our insurance programs.programs, and the applicable margin on outstanding borrowings under 2022 Revolver was 1.5%. A 1.0% increase in the effective interest rate applied to theseour 2022 Revolver borrowings would result in a pre-tax interest expense increase of $0.9$0.7 million on an annualized basis.
During the year ended December 28, 2022, we borrowed $26.0 million net of pay downs of $20.0 million on our 2022 Revolver and the outstanding balance as of December 28, 2022 was $66.0 million. Borrowings under the 2022 Credit Agreement (other than any swingline loans) bear interest, at the borrowers’ option, at rates based upon either SOFR or a base rate, risk through normal operating and financing activities and, whenplus, for each rate, a margin determined appropriate, through the use of derivative financial instruments.
In connection with our entry into the past, when2022 Credit Agreement, we have determined it appropriate, we have entered intoterminated the interest rate caps, as discussed above under Item 7, “Management’s Discussion and Analysis of Financial Condition and Results of Operations—Liquidity and Capital Resources—Debt and Other Obligations—Hedging Arrangements.” At this time, due to reduced debt burden and the lowered rates of interest on our debt in recent years, we are not continuingswap previously used to hedge our interest rate exposure.
Inflation
Inflation has an impact on food, paper, construction, utility, labor and benefits, general and administrative, and other costs, all of which can materially impact our operations. We have a substantial number of hourly employees who are paid wage rates at or based on the applicable federal, state, or local minimum wage, and increases in the minimum wage will increase our labor costs. Since January 1, 2017, the State of California (where most of our restaurants are located) has had a minimum wage of $10.50 per hour. We also do substantial business in locales such as the City of Los Angeles and the County of Los Angeles that may have higher minimum wages. For details, see Item 1A, “Risk Factors-Risks Related to Our Business and Industry—If we or our franchisees face labor shortages or increased labor costs, our results of operations and growth could be adversely affected.” In general, we have been able to substantially offset cost increases resulting from inflation by increasing menu prices, managing menu mix, improving productivity, or making other adjustments. We may not be able to offset cost increases in the future.
Commodity Price Risk
We are exposed to market price fluctuation in food product prices. Given the historical volatility of certain of our food product prices, including chicken, other proteins, grains, produce, dairy products, and cooking oil, these fluctuations can materially impact our food and beverage costs. While our purchasing commitments partially mitigate the risk of such fluctuations, there is no assurance that supply and demand factors such as disease or inclement weather will not cause the prices of the commodities used in our restaurant operations to fluctuate. In periods wherewhen the prices of commodities drop, we may pay higher prices under our purchasing commitments. In rapidly-fluctuatingrapidly fluctuating commodities markets, it may prove difficult for us to adjust our menu prices in accordance with input price fluctuations. Therefore, to the extent that we do not pass along cost increases to our customers, our results of operations may be adversely affected. At this time, we do not use financial instruments to hedge our commodity risk. See Item 1A, “Risk Factors—Risks Related to Our Business and Industry—Changes in food and supply costs, especially for chicken, could adversely affect our business, financial condition and results
50
ITEM 8.FINANCIAL STATEMENTS AND SUPPLEMENTARY DATA
EL POLLO LOCO HOLDINGS, INC. AND SUBSIDIARIES
INDEX TO THE CONSOLIDATED FINANCIAL STATEMENTS
Audited Consolidated Financial Statements | |
Report of Independent Registered Public Accounting Firm (BDO USA, LLP; Costa Mesa, California; PCAOB ID #243) | 52 |
Consolidated Balance | 54 |
55 | |
56 | |
57 | |
58 | |
59 |
51
Shareholders and Board of Directors
El Pollo Loco Holdings, Inc.
Costa Mesa, California
Opinion on the Consolidated Financial Statements
We have audited the accompanying consolidated balance sheets of El Pollo Loco Holdings, Inc. (the “Company”) and subsidiaries as of December 27, 201728, 2022 and December 28, 2016,29, 2021, the related consolidated statements of income, changes incomprehensive income, stockholders’ equity, and cash flows for each of the three years in the period ended December 27, 2017,28, 2022, and the related notes (collectively referred to as the "consolidated“consolidated financial statements"statements”). In our opinion, the consolidated financial statements present fairly, in all material respects, the financial position of the Company and subsidiaries at December 27, 201728, 2022 and December 28, 2016,29, 2021, and the results of theirits operations and theirits cash flows for each of the three years in the period ended December 27, 2017,28, 2022, in conformity with accounting principles generally accepted in the United States of America.
We also have audited, in accordance with the standards of the Public Company Accounting Method Related to Deferred Income TaxesOversight Board (United States) (“PCAOB”), the Company's internal control over financial reporting as of December 28, 2022, based on criteria established in Internal Control – Integrated Framework (2013) issued by the Committee of Sponsoring Organizations of the Treadway Commission (“COSO”) and Stock Compensation
Basis for Opinion
These consolidated financial statements are the responsibility of the Company’s management. Our responsibility is to express an opinion on the Company’s consolidated financial statements based on our audits. We are a public accounting firm registered with the Public Company Accounting Oversight Board (United States) (“PCAOB”)PCAOB and are required to be independent with respect to the Company in accordance with the U.S. federal securities laws and the applicable rules and regulations of the Securities and Exchange Commission and the PCAOB.
We conducted our audits in accordance with the standards of the PCAOB. Those standards require that we plan and perform the audit to obtain reasonable assurance about whether the consolidated financial statements are free of material misstatement, whether due to error or fraud. The Company is not required to have, nor were we engaged to perform, an audit of its internal control over financial reporting. As part of our audits we are required to obtain an understanding of internal control over financial reporting but not for the purpose of expressing an opinion on the effectiveness of the Company’s internal control over financial reporting. Accordingly, we express no such opinion.
Our audits included performing procedures to assess the risks of material misstatement of the consolidated financial statements, whether due to error or fraud, and performing procedures that respond to those risks. Such procedures included examining, on a test basis, evidence regarding the amounts and disclosures in the consolidated financial statements. Our audits also included evaluating the accounting principles used and significant estimates made by management, as well as evaluating the overall presentation of the consolidated financial statements. We believe that our audits provide a reasonable basis for our opinion.
Critical Audit Matter
The critical audit matter communicated below is a matter arising from the current period audit of the consolidated financial statements that was communicated or required to be communicated to the audit committee and that: (i) relates to accounts or disclosures that are material to the consolidated financial statements and (ii) involved our especially challenging, subjective, or complex judgments. The communication of the critical audit matter does not alter in any way our opinion on the consolidated financial statements, taken as a whole, and we are not, by communicating the critical audit matter below, providing a separate opinion on the critical audit matter or on the accounts or disclosures to which it relates.
Impairment of Restaurant Property and Equipment
As discussed in Notes 2 and 3 to the consolidated financial statements, the Company reviews its long-lived assets related to restaurants held and used in the business, including property and equipment, for impairment whenever events or changes in circumstances indicate that the carrying value may not be recoverable. The net balance of property and equipment was $78.6 million as of December 28, 2022. For certain restaurants, indicators of impairment of the related property and equipment were present. As such, for these restaurants, management compared the projected undiscounted cash flow to the carrying value to determine whether an impairment loss should be measured.
52
We identified the Company’s evaluation of projected future cash flows to determine the impairment of restaurant property and equipment as a critical audit matter. The future cash flows used in certain of the Company's property and equipment impairment analysis requires management to develop estimates and assumptions about future revenue transaction growth rates, pricing changes, and restaurant operating margins, which are made more uncertain by the impact of the current inflationary pressures on the Company’s business. Auditing these significant assumptions involved especially challenging auditor judgment due to the nature and extent of audit effort required to addresses these matters.
The primary procedures we performed to address this critical audit matter included:
| ● | Evaluating the completeness and accuracy of data used in the projected cash flow models, including recalculating the projected cash flows for selected restaurants with impairment indicators. |
| ● | Evaluating the reasonableness of management’s assumptions over the future revenue transaction growth rates, pricing changes, and restaurant operating margin assumptions for select restaurants by (i) comparing them to historical information for both company-owned and franchised restaurants in the same market, (ii) comparing them to recent trends by restaurant, considering the changes in the Company’s business model and uncertainties related to the impact of the current inflationary pressures, and (iii) comparing them to restaurant industry revenue growth rates based on market data to determine if contradictory evidence existed. |
/s/ BDO USA, LLP
We have served as the Company’s auditor since 2011.
Costa Mesa, California
March 9, 2018
10, 2023
53
(Amounts in thousands, except share data)
| December 27, 2017 | December 28, 2016 | ||||||
| Assets | |||||||
| Current assets: | |||||||
| Cash and cash equivalents | $ | 8,550 | $ | 2,168 | |||
| Restricted cash | — | 125 | |||||
| Accounts and other receivables, net | 7,212 | 6,919 | |||||
| Inventories | 2,289 | 2,112 | |||||
| Prepaid expenses and other current assets | 2,679 | 3,104 | |||||
| Total current assets | 20,730 | 14,428 | |||||
| Property and equipment owned, net | 102,794 | 118,470 | |||||
| Property held under capital lease, net | 40 | 64 | |||||
| Goodwill | 248,674 | 248,674 | |||||
| Trademarks | 61,888 | 61,888 | |||||
| Other intangible assets, net | 377 | 484 | |||||
| Deferred tax assets | 7,167 | 25,905 | |||||
| Other assets | 1,041 | 1,392 | |||||
| Total assets | $ | 442,711 | $ | 471,305 | |||
| Liabilities and Stockholders’ Equity | |||||||
| Current liabilities: | |||||||
| Current portion of obligations under capital leases | $ | 132 | $ | 144 | |||
| Accounts payable | 12,307 | 11,637 | |||||
| Accrued salaries and vacation | 7,339 | 5,754 | |||||
| Accrued insurance | 5,851 | 5,444 | |||||
| Accrued income taxes payable | 35 | 120 | |||||
| Accrued interest | 110 | 198 | |||||
| Current portion of income tax receivable agreement payable | 8,281 | 12,349 | |||||
| Other accrued expenses and current liabilities | 13,270 | 9,672 | |||||
| Total current liabilities | 47,325 | 45,318 | |||||
| Revolver loan | 93,000 | 104,000 | |||||
| Obligations under capital leases, net of current portion | 184 | 317 | |||||
| Deferred taxes | — | 18,488 | |||||
| Other intangible liabilities, net | 786 | 1,012 | |||||
| Income tax receivable agreement payable, net of current portion | 13,694 | 26,306 | |||||
| Other noncurrent liabilities | 12,772 | 10,682 | |||||
| Total liabilities | 167,761 | 206,123 | |||||
| Commitments and contingencies | |||||||
| Stockholders’ Equity | |||||||
Preferred stock, $0.01 par value—100,000,000 shares authorized; none issued or outstanding | — | — | |||||
Common stock, $0.01 par value—200,000,000 shares authorized; 38,661,850 and 38,473,772 shares issued and outstanding | 387 | 385 | |||||
| Additional paid-in capital | 372,990 | 371,843 | |||||
| Accumulated deficit | (98,427 | ) | (107,046 | ) | |||
| Total stockholders’ equity | 274,950 | 265,182 | |||||
| Total liabilities and stockholders’ equity | $ | 442,711 | $ | 471,305 | |||
| | | | | | |
|
| December 28, |
| December 29, | ||
|
| 2022 |
| 2021 | ||
Assets | | |
| | | |
Current assets: | | |
| | |
|
Cash and cash equivalents | | $ | 20,493 | | $ | 30,046 |
Accounts and other receivables, net | |
| 10,084 | |
| 13,407 |
Inventories | |
| 2,442 | |
| 2,318 |
Prepaid expenses and other current assets | |
| 3,662 | |
| 3,732 |
Income tax receivable |
| | 768 | |
| — |
Total current assets | |
| 37,449 | |
| 49,503 |
Property and equipment, net | |
| 78,644 | |
| 75,668 |
Property and equipment held under finance lease, net | |
| 1,532 | |
| 1,635 |
Property and equipment held under operating leases, net ("ROU asset") | |
| 165,584 | |
| 171,981 |
Goodwill | |
| 248,674 | |
| 248,674 |
Trademarks | |
| 61,888 | |
| 61,888 |
Deferred tax assets | |
| 512 | |
| 2,245 |
Other assets | |
| 2,935 | |
| 2,192 |
Total assets | | $ | 597,218 | | $ | 613,786 |
Liabilities and Stockholders’ Equity | |
|
| |
|
|
Current liabilities: | |
|
| |
|
|
Current portion of obligations under finance leases | | $ | 110 | | $ | 143 |
Current portion of obligations under operating leases | |
| 19,995 | |
| 19,959 |
Accounts payable | |
| 12,741 | |
| 10,626 |
Accrued salaries and vacation | |
| 8,873 | |
| 11,539 |
Accrued insurance | |
| 11,120 | |
| 11,193 |
Accrued income taxes payable | |
| — | |
| 889 |
Accrued interest | |
| 291 | |
| 86 |
Current portion of income tax receivable agreement payable | |
| 263 | |
| 437 |
Other accrued expenses and current liabilities | |
| 15,120 | |
| 19,710 |
Total current liabilities | |
| 68,513 | |
| 74,582 |
Revolver loan | |
| 66,000 | |
| 40,000 |
Obligations under finance leases, net of current portion | |
| 1,626 | |
| 1,712 |
Obligations under operating leases, net of current portion | |
| 165,149 | |
| 171,651 |
Deferred taxes | |
| 8,517 | |
| 5,464 |
Income tax receivable agreement payable, net of current portion | |
| 409 | |
| 1,101 |
Other noncurrent liabilities | |
| 5,856 | |
| 8,653 |
Total liabilities | |
| 316,070 | |
| 303,163 |
Commitments and contingencies (Note 13) | |
|
| |
|
|
Stockholders’ equity | |
|
| |
|
|
Preferred stock, $0.01 par value, 100,000,000 shares authorized; none issued or outstanding | |
| — | |
| — |
Common stock, $0.01 par value, 200,000,000 shares authorized; 37,008,061 and 36,601,648 shares issued and outstanding as December 28, 2022 and December 29, 2021, respectively | |
| 370 | |
| 365 |
Additional paid-in-capital | |
| 292,244 | |
| 342,941 |
Accumulated deficit | |
| (11,592) | |
| (32,393) |
Accumulated other comprehensive income (loss) | |
| 126 | |
| (290) |
Total stockholders’ equity | |
| 281,148 | |
| 310,623 |
Total liabilities and stockholders’ equity | | $ | 597,218 | | $ | 613,786 |
See notes to consolidated financial statements.
54
(Amounts in thousands, except share data)
| For the Years Ended | December 27, 2017 | December 28, 2016 | December 30, 2015 | ||||||||
| Revenue | |||||||||||
| Company-operated restaurant revenue | $ | 376,615 | $ | 355,468 | $ | 332,040 | |||||
| Franchise revenue | 25,086 | 24,655 | 23,017 | ||||||||
| Total revenue | 401,701 | 380,123 | 355,057 | ||||||||
| Cost of operations | |||||||||||
| Food and paper costs | 109,898 | 107,218 | 105,917 | ||||||||
| Labor and related expenses | 106,584 | 97,471 | 84,231 | ||||||||
| Occupancy and other operating expenses | 85,631 | 78,263 | 69,977 | ||||||||
| Gain on recovery of insurance proceeds, lost profits | — | (502 | ) | — | |||||||
| Company restaurant expenses | 302,113 | 282,450 | 260,125 | ||||||||
| General and administrative expenses | 38,523 | 34,661 | 28,997 | ||||||||
| Franchise expenses | 3,335 | 3,823 | 3,456 | ||||||||
| Depreciation and amortization | 18,128 | 16,053 | 13,092 | ||||||||
| Loss on disposal of assets | 799 | 674 | 471 | ||||||||
| Expenses related to fire loss | — | 48 | — | ||||||||
Gain on recovery of insurance proceeds, property, equipment and expenses | — | (741 | ) | — | |||||||
| Recovery of securities lawsuits related legal expenses | (1,666 | ) | — | — | |||||||
| Asset impairment and closed-store reserves | 33,645 | 8,554 | 92 | ||||||||
| Total expenses | 394,877 | 345,522 | 306,233 | ||||||||
| Gain on disposition of restaurants | — | 28 | — | ||||||||
| Income from operations | 6,824 | 34,629 | 48,824 | ||||||||
Interest expense—net of interest income of $25, $28, and $49 for the years ended December 27, 2017, December 28, 2016, and December 30, 2015, respectively | 3,278 | 3,155 | 3,707 | ||||||||
| Expenses related to selling shareholders | — | — | 50 | ||||||||
| Income tax receivable agreement (income) expense | (5,570 | ) | 352 | 156 | |||||||
Income before provision for income taxes | 9,116 | 31,122 | 44,911 | ||||||||
| Provision for income taxes | (497 | ) | (12,783 | ) | (20,857 | ) | |||||
| Net income | $ | 8,619 | $ | 18,339 | $ | 24,054 | |||||
| Net income per share: | |||||||||||
| Basic | $ | 0.22 | $ | 0.48 | $ | 0.63 | |||||
| Diluted | $ | 0.22 | $ | 0.47 | $ | 0.62 | |||||
| Weighted average shares used in computing net income per share: | |||||||||||
| Basic | 38,453,347 | 38,357,805 | 37,949,316 | ||||||||
| Diluted | 39,086,676 | 39,026,950 | 39,039,558 | ||||||||
| | | | | | | | | |
| | For the Fiscal Years Ended | |||||||
|
| December 28, 2022 |
| December 29, 2021 |
| December 30, 2020 | |||
| | | | | | | | | |
Revenue |
| |
|
| |
|
| |
|
Company-operated restaurant revenue | | $ | 403,218 | | $ | 394,733 | | $ | 374,064 |
Franchise revenue | |
| 38,225 | |
| 33,729 | |
| 29,418 |
Franchise advertising fee revenue | |
| 28,516 | |
| 25,901 | |
| 22,605 |
Total revenue | |
| 469,959 | |
| 454,363 | |
| 426,087 |
Cost of operations | |
|
| |
|
| |
|
|
Food and paper cost | |
| 117,774 | |
| 104,394 | |
| 98,774 |
Labor and related expenses | |
| 130,773 | |
| 120,308 | |
| 114,455 |
Occupancy and other operating expenses | |
| 101,543 | |
| 97,557 | |
| 92,422 |
Gain on recovery of insurance proceeds, lost profits | | | — | | | — | | | (2,000) |
Company restaurant expenses | |
| 350,090 | |
| 322,259 | |
| 303,651 |
General and administrative expenses | |
| 39,093 | |
| 39,852 | |
| 35,918 |
Legal settlements | |
| — | |
| — | |
| 2,566 |
Franchise expenses | |
| 36,169 | |
| 32,831 | |
| 28,761 |
Depreciation and amortization | |
| 14,418 | |
| 15,176 | |
| 16,878 |
Loss on disposal of assets | |
| 165 | |
| 289 | |
| 189 |
Recovery of securities lawsuits related legal expenses and other insurance claims | |
| — | |
| — | |
| (123) |
(Gain) loss on disposition of restaurants | | | (848) | | | 1,534 | | | — |
Impairment and closed-store reserves | |
| 752 | |
| 1,087 | |
| 4,691 |
Total expenses | |
| 439,839 | |
| 413,028 | |
| 392,531 |
Income from operations | |
| 30,120 | |
| 41,335 | |
| 33,556 |
Interest expense, net | |
| 1,677 | |
| 1,824 | |
| 3,292 |
Income tax receivable agreement (income) expense | |
| (436) | |
| 58 | |
| 139 |
Income before provision for income taxes | |
| 28,879 | |
| 39,453 | |
| 30,125 |
Provision for income taxes | |
| 8,078 | |
| 10,332 | |
| 5,651 |
Net income | | $ | 20,801 | | $ | 29,121 | | $ | 24,474 |
Net income per share | |
|
| |
|
| |
|
|
Basic | | $ | 0.57 | | $ | 0.81 | | $ | 0.70 |
Diluted | | $ | 0.57 | | $ | 0.80 | | $ | 0.68 |
Weighted-average shares used in computing net income per share | |
|
| |
|
| |
|
|
Basic | |
| 36,350,579 | |
| 35,973,892 | |
| 35,193,325 |
Diluted | |
| 36,575,904 | |
| 36,446,756 | |
| 35,796,406 |
See notes to consolidated financial statements.
55
EL POLLO LOCO HOLDINGS, INC.
CONSOLIDATED STATEMENTS OF COMPREHENSIVE INCOME
(Amounts in thousands)
| | | | | | | | | |
| | For the Fiscal Years Ended | |||||||
|
| December 28, |
| December 29, |
| December 30, | |||
| | 2022 | | 2021 | | 2020 | |||
Net income | | $ | 20,801 | | $ | 29,121 | | $ | 24,474 |
Other comprehensive income (loss) | |
|
| |
|
| |
|
|
Changes in derivative instruments | |
|
| |
|
| |
|
|
Unrealized net gains (losses) arising during the period from interest rate swap | |
| 862 | |
| 257 | |
| (1,762) |
Reclassifications of (gains) losses into net income | |
| (296) | |
| 486 | |
| 278 |
Income tax (expense) benefit | |
| (150) | |
| (200) | |
| 398 |
Other comprehensive income (loss), net of taxes | |
| 416 | |
| 543 | |
| (1,086) |
Comprehensive income | | $ | 21,217 | | $ | 29,664 | | $ | 23,388 |
See notes to consolidated financial statements.
56
(Amounts in thousands, except share data)
| Common Stock | Additional Paid-in Capital | Accumulated Deficit | Total Stockholders’ Equity | |||||||||||||||
| Shares | Amount | |||||||||||||||||
| Balance, December 31, 2014 | 37,420,450 | $ | 374 | $ | 359,465 | $ | (149,439 | ) | $ | 210,400 | ||||||||
| Stock based compensation | — | — | 539 | — | 539 | |||||||||||||
| Issuance of common stock upon exercise of stock options | 863,985 | 9 | 4,211 | — | 4,220 | |||||||||||||
| Excess income tax benefit related to share-based compensation plans | — | — | 5,420 | — | 5,420 | |||||||||||||
| Net income | — | — | — | 24,054 | 24,054 | |||||||||||||
| Balance, December 30, 2015 | 38,284,435 | 383 | 369,635 | (125,385 | ) | 244,633 | ||||||||||||
| Stock based compensation | — | — | 1,063 | — | 1,063 | |||||||||||||
| Issuance of common stock related to restricted shares | 41,611 | — | — | — | — | |||||||||||||
| Issuance of common stock upon exercise of stock options | 147,726 | 2 | 976 | — | 978 | |||||||||||||
| Excess income tax benefit related to share-based compensation plans | — | — | 169 | — | 169 | |||||||||||||
| Net income | — | — | — | 18,339 | 18,339 | |||||||||||||
| Balance, December 28, 2016 | 38,473,772 | 385 | 371,843 | (107,046 | ) | 265,182 | ||||||||||||
| Stock based compensation | — | — | 1,056 | — | 1,056 | |||||||||||||
| Issuance of common stock related to restricted shares | 170,417 | 2 | (2 | ) | — | — | ||||||||||||
| Issuance of common stock upon exercise of stock options | 17,661 | 93 | — | 93 | ||||||||||||||
| Net income | — | — | — | 8,619 | 8,619 | |||||||||||||
| Balance, December 27, 2017 | 38,661,850 | $ | 387 | $ | 372,990 | $ | (98,427 | ) | $ | 274,950 | ||||||||
| | | | | | | | | | | | | | | | | |
|
| |
| | |
| | |
| | |
| Accumulated |
|
| | |
|
| |
| | |
| Additional |
| | |
| Other |
| Total | |||
| | Common Stock | | Paid-in | | Accumulated | | Comprehensive | | Stockholders’ | |||||||
|
| Shares |
| Amount |
| Capital |
| Deficit |
| Income (Loss) |
| Equity | |||||
Balance, December 26, 2019 | | 35,126,582 | | $ | 351 | | $ | 330,950 | | $ | (85,988) | | $ | 253 | | $ | 245,566 |
Stock-based compensation | | — | |
| — | |
| 3,093 | |
| — | |
| — | |
| 3,093 |
Issuance of common stock related to restricted shares, net | | 439,061 | |
| 4 | |
| (4) | |
| — | |
| — | |
| — |
Issuance of common stock upon exercise of stock options | | 970,736 | |
| 10 | |
| 5,856 | |
| — | |
| — | |
| 5,866 |
Shares repurchased for employee tax withholdings | | (23,407) | |
| — | |
| (335) | |
| — | |
| — | |
| (335) |
Forfeiture of common stock related to restricted shares | | (89,467) | |
| (1) | |
| 1 | |
| — | |
| — | |
| — |
Other comprehensive income, net of income tax | | — | | | — | | | — | | | — | | | (1,086) | | | (1,086) |
Net income | | — | |
| — | |
| — | |
| 24,474 | |
| — | |
| 24,474 |
Balance, December 30, 2020 | | 36,423,505 | |
| 364 | |
| 339,561 | |
| (61,514) | |
| (833) | |
| 277,578 |
Stock-based compensation | | — | |
| — | |
| 3,220 | |
| — | |
| — | |
| 3,220 |
Issuance of common stock related to restricted shares, net | | 246,780 | |
| 2 | |
| (2) | |
| — | |
| — | |
| — |
Issuance of common stock upon exercise of stock options | | 132,760 | |
| 1 | |
| 865 | |
| — | |
| — | |
| 866 |
Shares repurchased for employee tax withholdings | | (40,384) | |
| — | |
| (705) | |
| — | |
| — | |
| (705) |
Forfeiture of common stock related to restricted shares | | (161,013) | |
| (2) | |
| 2 | |
| — | |
| — | |
| — |
Other comprehensive loss, net of income tax | | — | | | — | | | — | | | — | | | 543 | | | 543 |
Net income | | — | |
| — | |
| — | |
| 29,121 | |
| — | |
| 29,121 |
Balance, December 29, 2021 | | 36,601,648 | |
| 365 | |
| 342,941 | |
| (32,393) | |
| (290) | |
| 310,623 |
Stock-based compensation | | — | |
| — | |
| 3,491 | |
| — | |
| — | |
| 3,491 |
Issuance of common stock related to restricted shares, net | | 356,610 | |
| 4 | |
| (4) | |
| — | |
| — | |
| — |
Issuance of common stock upon exercise of stock options | | 185,798 | |
| 2 | |
| 1,711 | |
| — | |
| — | |
| 1,713 |
Shares repurchased for employee tax withholdings | | (30,128) | |
| — | |
| (322) | |
| — | |
| — | |
| (322) |
Forfeiture of common stock related to restricted shares | | (105,867) | |
| (1) | |
| 1 | |
| — | |
| — | |
| — |
Other comprehensive income, net of income tax | | — | |
| — | |
| — | |
| — | |
| 416 | |
| 416 |
Common stock cash dividends ($1.50 per share) | | — | | | — | | | (55,574) | | | — | | | — | | | (55,574) |
Net income | | — | |
| — | |
| — | |
| 20,801 | |
| — | |
| 20,801 |
Balance, December 28, 2022 | | 37,008,061 | | $ | 370 | | $ | 292,244 | | $ | (11,592) | | $ | 126 | | $ | 281,148 |
See notes to consolidated financial statements.
57
(Amounts in thousands)
| For the Years Ended | December 27, 2017 | December 28, 2016 | December 30, 2015 | ||||||||
| Cash flows from operating activities | |||||||||||
| Net income | $ | 8,619 | $ | 18,339 | $ | 24,054 | |||||
| Adjustments to reconcile changes in net income to net cash provided by operating activities: | |||||||||||
| Depreciation and amortization | 18,128 | 16,053 | 13,092 | ||||||||
| Stock-based compensation expense | 1,056 | 1,063 | 539 | ||||||||
| Fire insurance proceeds for expenses paid and lost profit | — | 611 | — | ||||||||
| Income tax receivable agreement (income) expense | (5,570 | ) | 352 | 156 | |||||||
| Gain on disposition of restaurants | — | (28 | ) | — | |||||||
| Loss on disposal of assets | 799 | 674 | 471 | ||||||||
| Gain on recovery of insurance proceeds, property, equipment and expenses | — | (741 | ) | — | |||||||
| Gain on recovery of insurance proceeds, lost profits | — | (502 | ) | — | |||||||
| Impairment of property and equipment | 32,594 | 8,400 | 181 | ||||||||
| Closed-store reserves | 1,051 | 154 | (89 | ) | |||||||
| Amortization of deferred financing costs | 304 | 304 | 304 | ||||||||
| Amortization of favorable and unfavorable leases, net | (119 | ) | (82 | ) | (156 | ) | |||||
| Excess income tax benefit related to share-based compensation plans | — | (169 | ) | (5,420 | ) | ||||||
| Deferred income taxes, net | 250 | 12,390 | 15,249 | ||||||||
| Changes in operating assets and liabilities: | |||||||||||
| Accounts and other receivables, net | (294 | ) | (844 | ) | (427 | ) | |||||
| Inventories | (177 | ) | (221 | ) | 1 | ||||||
| Prepaid expenses and other current assets | 425 | (448 | ) | 2,452 | |||||||
| Income taxes receivable/payable | (85 | ) | 222 | 5,589 | |||||||
| Other assets | 47 | 107 | 91 | ||||||||
| Accounts payable | 1,088 | (4,579 | ) | 2,317 | |||||||
| Accrued salaries and vacation | 1,585 | (939 | ) | (1,311 | ) | ||||||
| Accrued insurance | 407 | 423 | 1,203 | ||||||||
| Payment related to tax receivable agreement | (11,109 | ) | (3,236 | ) | — | ||||||
| Other accrued expenses and liabilities | 4,547 | 1,996 | (325 | ) | |||||||
| Restricted cash | 125 | — | — | ||||||||
| Net cash provided by operating activities | 53,671 | 49,299 | 57,971 | ||||||||
| Cash flows from investing activities | |||||||||||
| Proceeds from disposition of restaurant | — | 1,465 | — | ||||||||
| Proceeds from fire insurance for property and equipment | — | 743 | — | ||||||||
| Purchase of property and equipment | (36,238 | ) | (37,410 | ) | (30,835 | ) | |||||
| Net cash flows used in investing activities | (36,238 | ) | (35,202 | ) | (30,835 | ) | |||||
| Cash flows from financing activities | |||||||||||
| Proceeds from borrowings on revolver and term loans | 8,000 | — | — | ||||||||
| Payments on revolver loan | (19,000 | ) | (19,000 | ) | (42,000 | ) | |||||
| Proceeds from issuance of common stock upon exercise of stock options, net of expenses | 93 | 978 | 4,254 | ||||||||
| Payment of obligations under capital leases | (144 | ) | (177 | ) | (208 | ) | |||||
| Excess income tax benefit related to share-based compensation plans | — | 169 | 5,420 | ||||||||
| Net cash flows used in financing activities | (11,051 | ) | (18,030 | ) | (32,534 | ) | |||||
| Increase (decrease) in cash and cash equivalents | 6,382 | (3,933 | ) | (5,398 | ) | ||||||
| Cash and cash equivalents, beginning of year | 2,168 | 6,101 | 11,499 | ||||||||
| Cash and cash equivalents, end of year | $ | 8,550 | $ | 2,168 | $ | 6,101 | |||||
| Supplemental cash flow information | |||||||||||
| Cash paid for interest, net of capitalized interest | $ | 3,314 | $ | 3,086 | $ | 3,487 | |||||
| Cash paid during the year for income taxes, net | $ | 336 | $ | 171 | $ | 18 | |||||
| Noncash investing and financing activity | |||||||||||
| Unpaid purchases of property and equipment | $ | 4,741 | $ | 5,158 | $ | 3,201 | |||||
| Cashless stock option exercise | $ | — | $ | — | $ | 34 | |||||
| | | | | | | | | |
| | For the Fiscal Years Ended | |||||||
|
| December 28, |
| December 29, |
| December 30, | |||
|
| 2022 |
| 2021 |
| 2020 | |||
Cash flows from operating activities: | | |
| | |
| | |
|
Net income | | $ | 20,801 | | $ | 29,121 | | $ | 24,474 |
Adjustments to reconcile net income to net cash flows provided by operating activities: | |
|
| |
|
| |
|
|
Depreciation and amortization | |
| 14,418 | |
| 15,176 | |
| 16,878 |
Bad debt expense | | | — | | | — | | | 190 |
Stock-based compensation expense | |
| 3,491 | |
| 3,220 | |
| 3,093 |
Income tax receivable agreement (income) expense | |
| (436) | |
| 58 | |
| 139 |
(Gain) loss on disposition of restaurants | | | (848) | | | 1,534 | | | — |
Loss on disposal of assets | |
| 165 | |
| 289 | |
| 189 |
Impairment of property and equipment | |
| 481 | |
| 711 | |
| 3,498 |
Amortization of deferred financing costs | |
| 340 | |
| 251 | |
| 252 |
Deferred income taxes, net | |
| 4,600 | |
| 957 | |
| 4,008 |
Changes in operating assets and liabilities: | |
|
| |
|
| |
|
|
Accounts and other receivables | |
| 3,323 | |
| (3,444) | |
| (1,155) |
Inventories | |
| (125) | |
| (218) | |
| (92) |
Prepaid expenses and other current assets | |
| 71 | |
| 133 | |
| 1,853 |
Income taxes (receivable) payable | |
| (1,657) | |
| 3,410 | |
| (2,145) |
Other assets | |
| (240) | |
| (1,052) | |
| (13) |
Accounts payable | |
| 3,977 | |
| 2,533 | |
| 666 |
Accrued salaries and vacation | |
| (2,667) | |
| 1,373 | |
| 1,548 |
Accrued insurance | |
| (73) | |
| 777 | |
| 976 |
Payment related to tax receivable agreement | |
| (430) | |
| (1,658) | |
| (5,237) |
Other accrued expenses and liabilities | |
| (6,642) | |
| (1,072) | |
| (8,575) |
Net cash flows provided by operating activities | |
| 38,549 | |
| 52,099 | |
| 40,547 |
Cash flows from investing activities: | |
|
| |
|
| |
|
|
Proceeds from disposition of restaurants | |
| 1,002 | |
| 4,556 | |
| — |
Purchase of property and equipment | |
| (19,917) | |
| (17,041) | |
| (6,690) |
Net cash flows used in investing activities | |
| (18,915) | |
| (12,485) | |
| (6,690) |
Cash flows from financing activities: | |
|
| |
|
| |
|
|
Proceeds from borrowings on revolver and swingline loans | |
| 46,000 | |
| — | |
| 59,500 |
Payments on revolver and swingline loan | | | (20,000) | | | (22,800) | | | (93,700) |
Minimum tax withholdings related to net share settlements | | | (322) | | | (705) | | | (335) |
Proceeds from issuance of common stock upon exercise of stock options, net of expenses | |
| 1,713 | |
| 866 | |
| 5,866 |
Common stock dividends paid | | | (55,574) | | | — | | | — |
Payment of obligations under finance leases | |
| (162) | |
| (148) | |
| (39) |
Deferred financing costs for revolver loan | |
| (842) | |
| — | |
| — |
Net cash flows used in financing activities | |
| (29,187) | |
| (22,787) | |
| (28,708) |
(Decrease) increase in cash and cash equivalents | |
| (9,553) | |
| 16,827 | |
| 5,149 |
Cash and cash equivalents, beginning of period | |
| 30,046 | |
| 13,219 | |
| 8,070 |
Cash and cash equivalents, end of period | | $ | 20,493 | | $ | 30,046 | | $ | 13,219 |
| | | | | | | | | |
| | For the Fiscal Years Ended | |||||||
|
| December 28, |
| December 29, |
| December 30, | |||
| | 2022 |
| 2021 |
| 2020 | |||
Supplemental cash flow information |
| |
|
| |
|
| |
|
Cash paid during the period for interest | | $ | 1,450 | | $ | 1,066 | | $ | 2,956 |
Cash paid during the period for income taxes | | $ | 5,100 | | $ | 5,968 | | $ | 4,225 |
Unpaid purchases of property and equipment | | $ | 1,333 | | $ | 2,454 | | $ | 1,925 |
See notes to consolidated financial statements.
58
EL POLLO LOCO HOLDINGS, INC.
NOTES TO CONSOLIDATED FINANCIAL STATEMENTS
1. DESCRIPTION OF BUSINESS
El Pollo Loco Holdings, Inc. (“Holdings”) is a Delaware corporation headquartered in Costa Mesa, California. Holdings and its direct and indirect subsidiaries are collectively known as “we,” “us” or the “Company.” The Company’s activities are conducted principally through its indirect wholly-owned subsidiary, El Pollo Loco, Inc. (“EPL”), which develops, franchises, licenses and operates quick-service restaurants under the name El Pollo Loco ®. The restaurants, which are located principally in California but also in Arizona, Nevada, Texas, Colorado, Utah and Utah,Louisiana, specialize in flame-grilledfire-grilling citrus-marinated chicken in a wide variety of contemporary Mexican-influencedMexican and LA-inspired entrees, including specialty chicken burritos, chicken quesadillas, chicken tostada salads, chicken tortilla soup, variations on our Pollo Bowl®, Pollo Salads and our Pollo Salads.Fit entrees. At December 27, 2017,28, 2022, the Company operated 212 (141188 (138 in the greater Los Angeles area) and franchised 265 (138302 (141 in the greater Los Angeles area) El Pollo Loco restaurants. In addition, the Company currently licenses twofive restaurants in the Philippines. The Company’s largest stockholder is Trimaran Pollo Partners, L.L.C. (“LLC”), which is controlled by affiliates of Trimaran Capital, L.L.C. LLC acquired Chicken Acquisition Corp. (“CAC”), a predecessor of Holdings, on November 17, 2005 (the “Acquisition”) and has a 43.3% ownership interest as. As of December 27, 2017.28, 2022, LLC, FS Equity Partners V, L.P. and FS Affiliates V, L.P. own approximately 30.3%, 14.8% and 0.2%, respectively, of the Company’s outstanding common stock. FS Equity V and FS Affiliates V, which previously indirectly held shares of the Company’s common stock through LLC, received shares directly on August 31, 2022, upon LLC’s pro rata distribution in kind of shares of the Company’s common stock to FS Equity V and FS Affiliates V. LLC’s only material asset is its investment in Holdings.
On April 22, 2014, CAC, itsthe LLC’s wholly owned subsidiary, Chicken Subsidiary Corp (“CSC”) and CSC’s wholly owned subsidiary, the former El Pollo Loco Holdings, Inc. (“Old Holdings”) entered into the following reorganization transactions: (i) Old Holdings merged with and into CSC with CSC continuing as the surviving corporation; (ii) CSC merged with and into CAC with CAC continuing as the surviving corporation and (iii) CAC renamed itself El Pollo Loco Holdings, Inc.
Holdings has no material assets or operations. Holdings and Holdings’ direct subsidiary, EPL Intermediate, Inc. (“Intermediate”), guarantee EPL’s 20142022 Revolver (see Note 6)6 “Long-Term Debt”) on a full and unconditional basis and Intermediate has no subsidiaries other than EPL. EPL is a separate and distinct legal entity, and has no obligation to make funds available to Intermediate. EPL and Intermediate may pay dividends to Intermediate and to Holdings, respectively.
The Company operates in one operating segment. All significant revenues relate to retail sales of food and beverages to the general public through either company or franchised restaurants.
2. SUMMARY OF SIGNIFICANT ACCOUNTING POLICIES
Liquidity
The Company’s principal liquidity and capital requirements are to servicenew restaurants, existing restaurant capital investments (remodel and maintenance), interest payments on its debt, lease obligations and meetworking capital expenditureand general corporate needs. At December 27, 2017,28, 2022, the Company’s total debt (including capital lease liabilities) was $93.3$66.0 million. The Company’s ability to make payments on its indebtedness and to fund planned capital expenditures depends on available cash and its ability to generate adequate cash flows in the future, which, to a certain extent, is subject to general economic, financial, competitive, legislative, regulatory and other factors that are beyond the Company’s control. Based on current operations, the Company believes that its cash flows from operations, available cash of $8.6$20.5 million at December 27, 2017,28, 2022, and available borrowings under the 20142022 Revolver (which availability was $99.3 million at December 27, 2017)(as defined in Note 6 “Long-Term Debt”) will be adequate to meet the Company’s liquidity needs for the next twelve months from the issuance of the consolidated financial statements.
Basis of Presentation
The Company uses a 52- or 53-week fiscal year ending on the last Wednesday of each calendar year. Fiscal 2017, 2016,2022, 2021, and 20152020 ended on December 27, 2017,28, 2022, December 28, 201629, 2021 and December 30, 2015,2020, respectively. In a 52-week fiscal year, each quarter includes 13 weeks of operations. In a 53-week fiscal year, the first, second and third quarters
59
each include 13 weeks of
Principles of Consolidation
The accompanying consolidated financial statements include the accounts of Holdings and its wholly owned subsidiaries. All intercompany balances and transactions have been eliminated in consolidation. Certain prior year amounts have been reclassified to conform to the current year presentation.
Use of Estimates
The preparation of consolidated financial statements in conformity with accounting principles generally accepted in the United States of America (“GAAP”) requires management to make estimates and assumptions that affect the reported amounts of assets and liabilities and disclosures of contingent assets and liabilities at the date of the consolidated financial statements and revenue and expenses during the period reported. Actual results could materially differ from those estimates. The Company’s significant estimates include estimates for impairment of goodwill, intangible assets and property and equipment, insurance reserves, lease termination liabilities, closed-store reserves,accounting matters, stock-based compensation, income tax receivable agreement (the “TRA”) liability, contingent liabilities and income tax valuation allowances.
COVID-19 and Macroeconomic Conditions
The Company may face future business disruption and related risks resulting from the ongoing COVID-19 pandemic or from another pandemic, epidemic or infectious disease outbreak, or from broader macroeconomic trends, any of which could have a significant impact on our business. During fiscal 2022, the Company incurred $3.3 million in COVID-19 related expenses, comprised of $2.3 million due to overtime primarily related to the first quarter and $1.0 million due to leaves of absence related to the remaining three quarters. During fiscal 2021, the Company incurred $3.9 million in COVID-19 related expenses, primarily due to leaves of absence and overtime pay. During fiscal 2020, the Company incurred $4.9 million in COVID-19 related expenses, primarily due to leaves of absence and overtime pay. While all of the Company’s restaurants had dining rooms open as of December 28, 2022, the Company continues to experience staffing challenges, including higher wage inflation, overtime costs and other labor related costs. Further, the Company continues to experience inflationary pressures, which resulted in increased commodity prices and impacted the Company’s business and results of operations during the year ended December 28, 2022. The Company expects these pressures to continue during fiscal 2023.
Due to the fluidity of the COVID-19 pandemic and the current macroeconomic environment, the Company cannot determine the ultimate impact that the COVID-19 pandemic (and related economic effects) and the current macroeconomic environment will have on the Company’s consolidated financial condition, liquidity, and future results of operations, and therefore any prediction as to the ultimate materiality of the adverse impact on the Company’s consolidated financial condition, liquidity, and future results of operations is uncertain.
Cash
and Cash EquivalentsThe Company considers all highly-liquidliquid instruments with a maturity of three months or less at the date of purchase to be cash equivalents.
Subsequent Events
Subsequent to one commercial bank for Company credit cards. During the fiscal year ended 2017, the cash collateral was returned by the bank, andyear-end, the Company reclassified such amounts to cash and cash equivalents.
60
EL POLLO LOCO HOLDINGS, INC.
NOTES TO CONSOLIDATED FINANCIAL STATEMENTS (continued)
Concentration of Risk
Cash and cash equivalents are maintained at financial institutions and, at times, balances may exceed federally-insured limits. The Company has never experienced any losses related to these balances.
The Company had one supplier for which amounts due at December 27, 201728, 2022 totaled 14%41.7% of the Company’s accounts payable. As of December 28, 2016,29, 2021, the Company had one supplier for which amountsthe amount due totaled 16%26.1% of the Company’s accounts payable. Purchases from the Company’s largest supplier totaled 29%28.5% of the Company’s purchases for fiscal 2017, 33%2022, 27.1% for fiscal 20162021 and 36%26.9% for fiscal 2015. Purchases from the Company’s second largest supplier did not exceed 10% for fiscal 2017, 2016 and 2015. 2020 with no amounts payable at December 28, 2022 or December 29, 2021.
In fiscal 2017, 20162022, 2021 and 2015,2020, Company-operated and franchised restaurants in the greater Los Angeles area generated, in the aggregate, approximately 73%71.2%, 75%70.9%, and 79%71.3%, respectively, of total revenue.
Management believes the loss of the significant supplier or franchisee could have a material adverse effect on the Company’s consolidated results of operations and financial condition.
Accounts
and Other Receivables, NetAccounts and other receivables consist primarily of royalties, advertising and sublease rent and related amounts receivable from franchisees. Such receivables are due on a monthly basis, which may differ from the Company’s fiscal month-end dates. Accounts and other receivables also include credit/debit card receivables. The need for an allowance for doubtful accounts is reviewed on a specific identification basis and takes into consideration past due balances and the financial strength of the obligor. Bad debt expense was immaterial for the years ended December 27, 2017, December 28, 2016, and December 30, 2015.
Inventories
Inventories consist principally of food, beverages and paper supplies and are valued at the lower of average cost or net realizable value.
Property
and Equipment,Property and equipment is statedare recorded at cost and isare depreciated using the straight-line method over the estimated useful lives of the assets. Expenditures for reimbursements and improvements that significantly add to the productivity capacity or extend the useful life are capitalized, while expenditures for maintenance and repairs are expensed as incurred. Leasehold improvements and property held under capitalfinance leases are amortized over the shorter of their estimated useful lives or the remaining lease terms. For leases with renewal periods at the Company’s option, the Company generally uses the original lease term, excluding the option periods, to determine estimated useful lives; if failure to exercise a renewal option imposes an economic penalty on the Company, such that management determines at the inception of the lease that renewal is reasonably assured, the Company may include the renewal option period in the determination of appropriate estimated useful lives.
The estimated useful service lives are as follows:
| | |
Buildings | 20 years | |
Land improvements | 3—30 years | |
Building improvements | 3— | |
Restaurant equipment | 3—10 years | |
Other equipment | 2—10 years | |
Property/equipment held under finance leases | ||
| Shorter of useful life or lease term | |
Leasehold improvements | Shorter of useful life or lease term |
61
The Company capitalizes certain directly attributable internal costs in conjunction with site selection that relate to specific sites for plannedthe acquisition, development and construction of future restaurants. The Company also capitalizes certain directly attributable costs, including interest, in conjunction with constructing new restaurants. These costs are included in property and amortized over the shorter of the life of the related buildings and leasehold improvements or the lease term. Costs related to abandoned sites and other site selection costs that cannot be identified with specific restaurants are charged to general and administrative expenses in the accompanying consolidated statements of income, and were $0.5 million, $0.5 million andless than $0.1 million for each of the years ended December 27, 2017,28, 2022, December 28, 2016,29, 2021 and December 30, 2015, respectively.2020. The Company capitalized internal costs related to site selection and construction activities of $1.9$1.5 million, $1.6$1.4 million and $1.1$1.0 million for the years ended December 27, 2017,28, 2022, December 28, 2016,29, 2021 and December 30, 2015,2020, respectively. Capitalized internal interest costs related to site selection and construction activities were $0.2 million and $0.2 million for the years ended December 27, 2017 and December 28, 2016, respectively, and immaterial for the year ended December 30, 2015.
Impairment
of Long-Lived and ROU AssetsThe Company reviews its long-lived and right-of-use assets (“ROU assets”) for impairment on a restaurant-by-restaurant basis whenever events or changes in circumstances indicate that the carrying value of certain long-lived and ROU assets may not be recoverable. The Company considers a triggering event, related to long-lived assets or ROU assets in a net asset position, to have occurred related to a specific restaurant if the restaurant’s cash flowsAverage Unit Volume (“AUV”) for the last twelve months are less than a minimum threshold or if consistent levels of undiscounted cash flows for the remaining lease period are less than the carrying value of the restaurant’s assets. Additionally, the Company considers a triggering event, related to ROU assets, to have occurred related to a specific lease if the location has been closed or subleased and future estimated sublease income is less than current lease payments. As of December 28, 2022 and December 29, 2021, ROU assets related to closed or subleased restaurant locations totaled $30.7 million and $21.9 million, respectively. If the Company concludes that the carrying value of certain long-lived and ROU assets will not be recovered based on expected undiscounted future cash flows, an impairment write-downloss is recorded to reduce the long-lived or ROU assets to their estimated fair value. The fair value is measured on a nonrecurring basis using unobservable (Level 3) inputs. There is uncertainty in the projected undiscounted future cash flows used in the Company'sCompany’s impairment review analysis, which requires the use of estimates and assumptions. If actual performance does not achieve the projections, or if the assumptions used change in the future, the Company may be required to recognize impairment charges in future periods, and such charges could be material. The Company determined that triggering events occurred for certain stores during the year ended December 28, 2022 that required an impairment review of the Company’s long-lived and ROU assets. Based on the results of this analysis, as well as the strategic decision to close two restaurants in Texas, the Company recorded non-cash impairment charges of $32.6$0.5 million for the year ended December 27, 2017,28, 2022, primarily related to the carrying value of the ROU assets of one restaurant in California that closed in 2021 and the long-lived assets of two restaurants in California.
In fiscal 2021, the Company recorded non-cash impairment charges of $0.7 million primarily related to the carrying value of the ROU assets of 23 restaurantsone restaurant in Arizona, California and Texas. In fiscal 2016 the company recorded a non-cash impairment charge of $8.4 million, primarily related toTexas that closed in 2019, the carrying value of nineone restaurant in Arizona, California that closed in 2021 and Texas.the long-lived assets of three restaurants in California. In in fiscal 20152020, the Company recorded a non-cash impairment charge of $0.2$3.5 million primarily related to the carrying value of the ROU assets of one restaurant in California. The impairment expense for fiscal 2017 includes an impairment expense of $27.7 million, representingTexas and the entire value of capitalizedlong-lived assets of all of the company-operatedfour restaurants in Texas, net of previously recorded depreciation. Factors which led to the impairment of the Texas restaurants include recent results, which indicates that the restaurants have not achieved the sales volumes required to generate positive cash flows or improve profitability in the Texas market, along with the related future cash flow assumptions, including comparable sales rate growth and restaurant operating costs, over the remaining lease terms and the age of the restaurants in Texas. The restaurants in Texas began opening in late 2014, causing a higher net book value at the time of impairment testing, and increased difficulty projecting results for newer restaurants in newer markets.California. Given the difficultyinherent uncertainty in projecting results for newer restaurants in newer markets, we are alsoas well as the impact of the COVID-19 pandemic (and related economic effects), the Company is monitoring the recoverability of the carrying value of the assets of several other restaurants on an ongoing basis, including those in the Arizona and Northern California market.basis. For these restaurants, if expected performance improvements areis not realized, an impairment charge may be recognized in future periods, and such charge could be material.
Closed-Store Reserves
When a restaurant is closed, the Company will evaluate the ROU asset for impairment, based on anticipated sublease recoveries. The remaining value of the ROU asset is amortized on a straight-line basis, with the expense recognized in closed-store reserve expense. Additionally, any property tax and common area maintenance (“CAM”) payments relating to closed restaurants are included within closed-store expense.
During fiscal 2022, the Company recognized $0.3 million of closed-store reserve expense related to the amortization of ROU assets, property taxes and CAM payments for its closed locations.
During fiscal 2021, the Company recognized $0.4 million of closed-store reserve expense related to the amortization of ROU assets, property taxes and CAM payments for its closed locations. During fiscal 2020, the Company recognized
62
$1.2 million of closed-store reserve expense related to the amortization of ROU assets, property taxes and CAM payments for its closed locations.
Goodwill and Indefinite-Lived Intangible Assets
The Company’s indefinite-lived intangible assets consist of trademarks. Goodwill represents the excess of cost over fair value of net identified assets acquired in business combinations accounted for under the purchase method. The Company does not amortize its goodwill and indefinite-lived intangible assets. Goodwill resulted from the Acquisition and from the acquisition of certain franchise locations.
Upon the sale or refranchising of a restaurant, the Company evaluates whether there is a decrement of goodwill. The amount of goodwill included in the cost basis of the asset sold is determined based on the relative fair value of the portion of the reporting unit disposed of compared to the fair value of the reporting unit retained.
The Company performs annual impairment tests for goodwill during the fourth fiscal quarter of each year, or more frequently if impairment indicators arise.
The Company reviews goodwill for impairment utilizing either a qualitative assessment or a two-step process.fair value test by comparing the fair value of a reporting unit with its carrying amount. If the Company decides that it is appropriate to perform a qualitative assessment and concludes that the fair value of a reporting unit more likely than not exceeds its carrying value, no further evaluation is necessary. If the Company performs the two-step process,fair value test, the first step of the goodwill impairment test is used to identify potential impairment by comparingCompany will compare the fair value of a reporting unit with its carrying amount, including goodwill. If the fair value of a reporting unit exceeds its carrying amount, goodwill of the reporting unit is considered not impaired and the second step of the impairment test is unnecessary.impaired. If the carrying amount of a reporting unit exceeds its fair value, the second step is performed to measureCompany will recognize an impairment charge for the amount of impairment by comparingwhich the carrying amount ofexceeds the goodwill to a determination ofreporting unit’s fair value; however, the implied value ofloss recognized cannot exceed the goodwill. If the carryingtotal amount of goodwill is greater than the implied value, an impairment charge is recognized for the difference.
The Company performs annual impairment tests for indefinite-lived intangible assets during the fourth fiscal quarter of each year, or more frequently if impairment indicators arise. An impairment test consists of either a qualitative assessment or a comparison of the fair value of an intangible asset with its carrying amount. The excess of the carrying amount of an intangible asset over its fair value is its impairment loss.
The assumptions used in the estimate of fair value are generally consistent with the past performance of the Company’s reporting segment and are also consistent with the projections and assumptions that are used in current operating plans. These assumptions are subject to change as a result of changing economic and competitive conditions.
The Company determined that there were no indicators of potential impairment of its goodwill and indefinite-lived intangible assets during fiscal 2022. Accordingly, the Company recognized expense relateddid not record any impairment to the impairment of theits goodwill or indefinite-lived intangible assets of 23 restaurants during the year ended December 27, 2017, upon completion of the qualitative assessment, the Company did not identify any indicators of potential impairment for its goodwill or indefinite-lived intangible assets. Furthermore, the Company did not identify any indicators of potential impairment during the years ended December 28, 2016, or December 30, 2015, and thus no impairment was recorded.
Deferred
FinancingDeferred financing feescosts are capitalized and amortized over the period of the loan on a straight-line basis, which approximates the effective interest method. Included in other assets are feesdeferred financing costs (net of accumulated amortization), related to the revolver, of $0.6$0.9 million and $0.9$0.4 million as of December 27, 201728, 2022 and December 28, 2016,29, 2021, respectively. Amortization expense for deferred financing costs was $0.3 million, $0.3 million andapproximately $0.3 million for each of the
63
three years ended December 27, 2017,28, 2022, December 28, 2016,29, 2021, and December 30, 2015, respectively,2020, and is reflected as a component of interest expense in the accompanying consolidated statements of income.
Insurance
ReservesThe Company is responsible for workers’ compensation, general and health insurance claims up to a specified aggregate stop loss amount. The Company maintains a reserve for estimated claims both reported and incurred but not reported, based on historical claims experience and other assumptions. At December 27, 201728, 2022 and December 28, 2016,29, 2021, the Company had accrued $5.9$11.1 million and $5.4$11.2 million, respectively, and such amounts are reflected as accrued insurance in the accompanying consolidated balance sheets. The expense for such reserves for the years ended December 27, 2017,28, 2022, December 28, 201629, 2021 and December 30, 2015,2020, totaled $6.8$8.7 million, $7.2$9.0 million, and $7.9$8.4 million, respectively. These amounts are included in labor and related expenses and general and administrative expenses on the accompanying consolidated statements of income.
Restaurant
Revenues from the operation of company-operated restaurants are recognized as food and beverage products are delivered to customers and payment is tendered at the time of sale. The Company presents sales net of sales-related taxes and promotional allowances. Promotional allowances amounted to approximately $8.9$7.5 million, $7.4$7.7 million and $7.4$7.5 million during the years ended December 27, 2017,28, 2022, December 28, 2016,29, 2021, and December 30, 2015,2020, respectively. Franchise revenue consists
The Company offers a loyalty rewards program, which awards a customer points for dollars spent. Customers earn points for each dollar spent and, as of franchise royalties, initial franchise fees, license fees due from franchisees, IT support servicesAugust 4, 2020, 50 points can be redeemed for a $5 reward to be used for a future purchase. Prior to August 4, 2020, 100 points could be redeemed for a $10 reward. If a customer does not earn or use points within a one-year period, their account is deactivated and rental income for leases and subleases to franchisees. Franchise royalties are based uponall points expire. Additionally, if a percentage of net salesreward is not used within six months, it expires. When a customer is part of the franchisee and are recorded as income as such sales arerewards program, the obligation to provide future discounts related to points earned byis considered a separate performance obligation, to which a portion of the franchisees. Initial franchise and license fees are recognized when all material obligations have been performed and conditionstransaction price is allocated. The performance obligation related to loyalty points is deemed to have been satisfied, typicallyand the amount deferred in the balance sheet is recognized as revenue, when operationsthe points are transferred to a reward and redeemed, the reward or points have expired, or the likelihood of redemption is remote. A portion of the franchised restaurant have commenced. Initial franchise fees recognized during the years ended December 27, 2017,transaction price is allocated to loyalty points, if necessary, on a pro-rata basis, based on stand-alone selling price, as determined by menu pricing and loyalty points terms. As of December 28, 2016,2022 and December 30, 2015, totaled $0.3 million, $0.429, 2021, the revenue allocated to loyalty points that have not been redeemed was $0.5 million and $0.8$0.7 million, respectively. The Company recognizes renewal fees when a renewal agreement with a franchisee becomes effective.
The Company sells gift cards to its customers in the restaurants and through selected third parties. The gift cards sold to customers have no stated expiration dates and are subject to actual and/or potential escheatment rights in several of the jurisdictions in which the Company operates. Furthermore, due to these escheatment rights, the Company does not recognize breakage related to the sale of gift cards due to the immateriality of the amount remaining after escheatment. The Company recognizes income from gift cards when redeemed by the customer. Unredeemed gift card balances are deferred and recorded as other accrued expenses on the accompanying consolidated balance sheets.
Franchise Revenue
Franchise revenue consists of franchise royalties, initial franchise fees, license fees due from franchisees and IT support services. Rental income for subleases to franchisees are outside of the scope of the revenue standard and are within the scope of lease guidance. Under Topic 842, sublease income is recorded on a net basis within the consolidated statements of income. Franchise royalties are based upon a percentage of net sales of the franchisee and are recorded as income as such sales are earned by the franchisees.
For franchise and development agreement fees, the initial franchise services, or exclusivity of the development agreements, are not distinct from the continuing rights or services offered during the term of the franchise agreement and are, therefore, treated as a single performance obligation. As such, initial franchise and development fees received, and
64
subsequent renewal fees, are recognized over the franchise or renewal term, which is typically twenty years. As of December 28, 2022, the Company had executed development agreements that represent commitments to open 72 franchised restaurants at various dates through 2032.
This revenue stream is made up of the following performance obligations:
| ● | Franchise License – inclusive of advertising services, development agreements, training, access to plans and help desk services; |
| ● | Discounted renewal option; and |
| ● | Hardware services. |
The Company satisfies the performance obligation related to the franchise license over the term of the franchise agreement, which is typically 20 years. Payment for the franchise license consists of three components, a fixed-fee related to the franchise/development agreement, a sales-based royalty fee and a sales-based advertising fee. The fixed fee, as determined by the signed development and/or franchise agreement, is due at the time the development agreement is entered into, and/or when the franchise agreement is signed, and does not include a finance component.
The sales-based royalty fee and sales-based advertising fee are considered variable consideration and are recognized as revenue as such sales are earned by the franchisees. Both sales-based fees qualify under the royalty constraint exception, and do not require an estimate of future transaction price. Additionally, the Company is utilizing the practical expedient available under ASC Topic 606, “Revenue from Contracts with Customers” (“Topic 606”) regarding disclosure of the aggregate amount of the transaction price allocated to the performance obligations that are unsatisfied for sales-based royalties.
In certain franchise agreements, the Company offers a discounted renewal to incentivize future renewals after the end of the initial franchise term. As this is considered a separate performance obligation, the Company allocated a portion of the initial franchise fee to this discounted renewal, on a pro-rata basis, assuming a 20 year renewal. This performance obligation is satisfied over the renewal term, which is typically 10 or 20 years, while payment is fixed and due at the time the renewal is signed.
The Company purchases hardware, such as scanners, printers, cash registers and tablets, from third-party vendors, which it then sells to franchisees. As the Company is considered the principal in this relationship, payment received for the hardware is considered revenue, and is received upon transfer of the goods from the Company to the franchisee. As of December 28, 2022, there were no performance obligations, related to hardware services that were unsatisfied or partially satisfied.
Franchise Advertising Fee Revenue
The Company presents advertising contributions received from franchisees as franchise advertising fee revenue and records all expenses of the advertising fund within franchise expenses.
Advertising Costs
Advertising expense is recorded as the obligation to contribute to the advertising fund and is accrued, generally when the associated revenue is recognized. Advertising expense, which is a component of occupancy and other operating expenses, was $16.4 million, $16.1 million and $15.3 million for the years ended December 28, 2022, December 29, 2021 and December 30, 2020, respectively. In addition, there was $28.5 million, $25.9 million and $22.6 million for the years ended December 28, 2022, December 29, 2021 and December 30, 2020, respectively, funded by the franchisees’ advertising fees.
Franchisees pay a monthly fee to the Company that ranges from 4% to 5% of their restaurants’ net sales as reimbursement for advertising, public relations and promotional services the Company provides, which is included
65
within franchise advertising fee revenue. Fees received in advance of provided services are included in other accrued expenses and current liabilities and were $0.8 million and $3.6 million at December 28, 2022 and December 29, 2021, respectively. Company-operated restaurants contribute to the advertising fund on the same basis as franchised restaurants. At December 28, 2022, the Company was obligated to spend $0.8 million more in future periods to comply with this requirement.
Production costs of commercials, programming and other marketing activities are charged to the advertising funds when the advertising is first used for its intended purpose. Total contributions and other marketing expenses are included in general and administrative expenses in the accompanying consolidated statements of income.
Preopening Costs
Preopening costs incurred in connection with the opening of new restaurants are expensed as incurred. Preopening costs, which are included in general and administrative expenses on the accompanying consolidated statements of income, were $0.3 million, $0.3 million and $0.1 million for the years ended December 28, 2022, December 29, 2021, and December 30, 2020, respectively.
Leases
The Company’s operations utilize property, facilities, equipment and vehicles. Buildings and facilities leased from others are primarily for restaurants and support facilities. Restaurants are operated under lease arrangements that generally provide for a fixed base rent and, in some instances, contingent rent based on a percentage of gross operating profit or net revenues more than a defined amount. Initial terms of land and restaurant building leases generally have terms of 20 years, exclusive of options to renew. ROU assets and operating and finance lease liabilities are recognized at the lease commencement date, which is the date the Company takes possession of the property. Operating and finance lease liabilities represent the present value of lease payments not yet paid. ROU assets represent the Company’s right to use an underlying asset and are based upon the operating and finance lease liabilities adjusted for prepayments or accrued lease payments, lease incentives, and impairment of ROU assets. To determine the present value of lease payments not yet paid, the Company estimates incremental borrowing rates corresponding to the lease term including reasonably certain renewal periods.
The Company’s leases generally have escalating rents over the term of the lease, isand are recorded on a straight-line basis over the expected lease term. The lease term beginsAdditionally, tenant incentives used to fund leasehold improvements are recognized when earned and reduce the Company has the rightright-of-use asset related to control the use of the leased property, which is typically before rent payments are due under the terms of the lease. Rent expense is included in occupancy and otherThese are amortized through the operating expenses on the consolidated statements of income. The difference between rent expense and rent paid is recorded as deferred rent, which is included in other noncurrent liabilities in the accompanying consolidated balance sheets. Percentage rent expenses are recorded based on estimated sales or gross margin for respective restaurants over the contingency period.
Operating and finance lease liabilities that are based on an index or rate are calculated using the prevailing index or rate at lease commencement. Subsequent escalations in the index or rate and contingent rental payments are recognized as variable lease expenses. The Company’s lease agreements do not contain any material residual value guarantees or material restrictive covenants.
Leases of equipment primarily consist of restaurant equipment, computer systems and vehicles. The Company subleases facilities to certain franchisees and other non-related parties which are recorded on a straight-line basis.
Gain
on Recovery of Insurance Proceeds,During the year ended December 30, 2020, the Company received business interruption insurance proceeds of the Company’s restaurants incurred damage resulting from a fire. In fiscal 2016, we incurred costs directly$2.0 million, primarily related to restaurant sales losses and expenses related to the fire of less than $0.1 million, disposed of assets of an additional $0.1 millionCOVID-19 pandemic and recognized gains of $0.7 million, related to the reimbursement of property and equipment and expenses incurred and $0.5 million related to the reimbursement of lost profits. The reimbursement of lost profits is included in the accompanying consolidated statements of income, for fiscal 2016, as a reduction of company restaurant expenses. The Company received from the insurance company cash of $1.4 million, net of the insurance deductible, during fiscal 2016. In fiscal 2015, the Company disposed of $0.1 million of assets related to the fire. The restaurant was reopened for business on March 14, 2016.
Recovery of Securities Class Action Legal Expense
During fiscal 2017,2020 the Company received insurance proceeds of $1.7$0.1 million related to the reimbursement of certain legal expenses paid in prior years for the defense of securities lawsuits.a property claim. See Note 13 Commitments“Commitments and Contingencies, Contingencies—Legal Matters.”
66
Gain (Loss) on Disposition of Restaurants
During fiscal 2022, the Company completed the sale of three company-operated restaurants within the Orange County area to an existing franchisee. During fiscal 2021, the Company completed the sale of eight restaurants within the Sacramento area to an existing franchisee. The Company has determined that these restaurant dispositions represent multiple element arrangements, and as a result, the cash consideration received was allocated to the separate elements based on their relative standalone selling price. Cash proceeds included upfront consideration for the sale of the restaurants and franchise fees, as well as future cash consideration for royalties. The cash consideration per restaurant related to franchise fees is consistent with the amounts stated in the related franchise agreements, which are charged for separate standalone arrangements. The Company initially defers and subsequently recognizes the franchise fees over the term of the franchise agreement. Future royalty income is also recognized in revenue as earned. The Orange County sale during 2022 resulted in cash proceeds of $1.0 million and a net gain on sale of restaurants of $0.8 million for the year ended December 28, 2022. The Sacramento sale resulted in cash proceeds of $4.6 million and a net loss on sale of restaurants of $1.5 million for the year ended December 29, 2021. Since the date of their sale, these restaurants are now included in the total number of franchised El Pollo Loco restaurants.
Derivative Financial Instruments
The Company used an interest rate swap, a derivative instrument, to hedge interest rate risk and not for trading purposes. The derivative contract was entered into with a financial institution. In connection with the Company’s entry into the 2022 Credit Agreement (as defined in Note 6 “Long-Term Debt”), it terminated the interest rate swap on July 28, 2022. The Company recorded the derivative instrument on its consolidated balance sheets at fair value. The derivative instrument qualified as a hedging instrument in a qualifying cash flow hedge relationship, and the gain or loss on the derivative instrument was reported as a component of accumulated other comprehensive (loss) income (“AOCI”) and reclassified into earnings in the same period or periods during which the hedged transaction affects earnings. For any derivative instruments not designated as hedging instruments, the gain or loss will be recognized in earnings immediately. If a derivative previously designated as a hedge is terminated, or no longer meets the qualifications for hedge accounting, any balances in AOCI will be reclassified to earnings immediately.
Income Taxes
The provision for income taxes, income taxes payable and deferred income taxes is determined using the asset and liability method. Deferred tax assets and liabilities are determined based on temporary differences between the financial carrying amounts and the tax basisbases of assets and liabilities using enacted tax rates in effect in the years in which the temporary differences are expected to reverse. On a periodic basis, the Company assesses the probability that its net deferred tax assets, if any, will be recovered. If, after evaluating all of the positive and negative evidence, a conclusion is made that it is more likely than not that some portion or all of the net deferred tax assets will not be recovered, a valuation allowance is provided by a chargecharging to tax expense toa reserve for the portion of the deferred tax assets which are not expected to be realized.
The Company reviews its filing positions for all open tax years in all U.S. federal and state jurisdictions where it is required to file.
When there are uncertainties related to potential income tax benefits, in order to qualify for recognition, the position the Company takes has to have at least a “more likely than not” chance of being sustained (based on the position’s technical merits) upon challenge by the respective authorities. The term “more likely than not” means a likelihood of more than 50%. Otherwise, the Company may not recognize any of the potential tax benefit associated with the position. The Company recognizes a benefit for a tax position that meets the “more likely than not” criterion as the largest amount of tax benefit that is greater than 50% likely of being realized upon its effective resolution. Unrecognized tax benefits involve management’s judgment regarding the likelihood of the benefit being sustained. The final resolution of uncertain tax positions could result in adjustments to recorded amounts and may affect our results of operations, financial position and cash flows.
The Company’s policy is to recognize interest or penalties related to income tax matters in income tax expense. The Company had no accrual for interest or penalties at December 27, 201728, 2022 or December 28, 2016,29, 2021. During fiscal 2020, the
67
Company recognized interest of $0.1 million related to the Notice of Proposed Adjustment (“NOPA”), discussed below. During fiscal 2022, fiscal 2021 and did not recognize interest or penalties during the years ended December 27, 2017, December 28, 2016, and December 30, 2015, sincefiscal 2020, there were no material unrecognized tax benefits. Management believes no materialsignificant change to the amount of unrecognized tax benefits will occur within the next twelve months.
On July 30, 2014, the Company entered into an Income Tax Receivable Agreement (the “TRA”). Thea TRA, which calls for the Company to pay to its pre-IPO stockholders 85% of the savings in cash that the Company realizes in its income taxes as a result of utilizing its net operating losses (“NOLs”) and other tax attributes attributable to preceding periods. In fiscal 2015, the Company incurred a charge of approximately $41.4 million relating to the present value of its total expected TRA payments. As of December 27, 2017,28, 2022 and December 29, 2021, the Company had accrued $22.0$0.7 million and $1.5 million, respectively relating to expected TRA payments. In fiscal 20172022, 2021 and 2016, we2020, the Company paid $11.1$0.4 million, $1.7 million and $3.2$5.2 million, respectively, to ourits pre-IPO stockholders under the TRA. In
On March 27, 2020, the Coronavirus Aid, Relief and Economic Security Act (the “CARES Act”) was signed into law as a stimulus package, and contained several tax provisions, including a correction of a previous drafting error related to quality improvement property (“QIP”) and immediate refundability of all remaining alternative minimum tax (“AMT”) credits. The new provisions did not have a material impact on the Company’s consolidated financial statements.
During fiscal 2015 we paid nil2020, the Company received a NOPA for the years ended December 27, 2017 and December 28, 2016, related to our pre-IPO stockholdersthe Company’s methodology regarding its ordering of utilization of AMT NOLs. Resolution of this NOPA resulted in a payment of $0.4 million, and the audit is closed. As a result of the CARES Act, this amount was immediately refundable upon filing of a Form 1139. The Company filed the Form 1139 during the year ended December 30, 2020 and received a refund totaling $0.5 million.
The CARES Act also provides for the deferral of employer Social Security taxes that are otherwise owed for wage payment and the creation of refundable employee retention credits. The total amount deferred as of December 30, 2020 was $4.9 million, of which 50% was due by December 31, 2021 and another 50% was due by December 31, 2022. As of December 28, 2022, the Company made all deferred payroll tax payments and did not have any corresponding balances included in other non-current liabilities on the Company’s consolidated balance sheet.
Additionally, the Company assessed its eligibility for the business relief provision under the TRA.
Fair
Value MeasurementsFair value is the price that would be received to sell an asset or paid to transfer a liability in an orderly transaction between market participants at the measurement date. Financial assets and liabilities carried at fair value are classified and disclosed in one of the following three categories:
| ● | Level 1: Quoted prices for identical instruments in active markets. |
| ● | Level 2: Observable prices for similar instruments in active markets; quoted prices for identical or similar instruments in markets that are not active; and model-derived valuations whose inputs or significant value drivers are observable. |
| ● | Level 3: Unobservable inputs used when little or no market data is available. |
68
During fiscal 2019, the Company had no assets and liabilitiesentered into an interest rate swap (used to hedge interest rate risk), which is required to be measured at fair value on a recurring basis.
The following table presents fair value for the interest rate swap at December 29, 2021 (in thousands):
| | | | | | | | | | | | | |
| | | | | Fair Value Measurements Using | | |||||||
|
| Fair Value |
| Level 1 |
| Level 2 |
| Level 3 |
| ||||
Other non-current liabilities - Interest rate swap | | $ | 396 | | $ | — | | $ | 396 | | $ | — | |
Certain assets and liabilities are measured at fair value on a nonrecurring basis. In other words, the instrumentsthey are not measured at fair value on an ongoing basis but are subject to fair value adjustments only in certain circumstances (for example, when there is evidence of impairment).
The following non-financial instruments were measured at fair value, on a nonrecurring basis, as of and for the year ended December 27, 2017 (in thousands):
| Fair Value Measurements Using | |||||||||||||||||||
| Total | Level 1 | Level 2 | Level 3 | Impairment Losses | |||||||||||||||
| Property and equipment owned, net | $ | — | $ | — | $ | — | $ | — | $ | 32,594 | |||||||||
| Fair Value Measurements Using | |||||||||||||||||||
| Total | Level 1 | Level 2 | Level 3 | Impairment Losses | |||||||||||||||
| Property and equipment owned, net | $ | 1,614 | $ | — | $ | — | $ | 1,614 | $ | 8,400 | |||||||||
| | | | | | | | | | | | | | | |
|
| Total |
| Level 1 |
| Level 2 |
| Level 3 | | Impairment Losses | |||||
Certain property and equipment, net | | $ | — | | $ | — | | $ | — | | $ | — |
| $ | 442 |
Certain ROU assets, net | | $ | 327 | | $ | — | | $ | — | | $ | 327 | | $ | 39 |
The following non-financial instrumentsassets were measured at fair value, on a nonrecurring basis, as of and for the year ended December 29, 2021 reflecting certain property and equipment and ROU assets for which an impairment loss was recognized during the corresponding periods, as discussed above under "Impairment of Long-Lived and ROU Assets" (in thousands):
| | | | | | | | | | | | | | | |
|
| Total |
| Level 1 |
| Level 2 |
| Level 3 |
| Impairment Losses | |||||
Certain property and equipment, net | | $ | — | | $ | — | | $ | — | | $ | — |
| $ | 304 |
Certain ROU assets, net | | $ | 411 | | $ | — | | $ | — | | $ | 411 | | $ | 407 |
The following non-financial assets were measured at fair value, on a nonrecurring basis, as of and for the year ended December 30, 20152020 for which an impairment loss was recognized during the corresponding periods, as discussed above under "Impairment of Long-Lived and ROU Assets" (in thousands):
| Fair Value Measurements Using | |||||||||||||||||||
| Total | Level 1 | Level 2 | Level 3 | Impairment Losses | |||||||||||||||
| Property and equipment owned, net | $ | — | $ | — | $ | — | $ | — | $ | 181 | |||||||||
| | | | | | | | | | | | | | | |
|
| Total |
| Level 1 |
| Level 2 |
| Level 3 |
| Impairment Losses | |||||
Certain property and equipment, net | | $ | — | | $ | — | | $ | — | | $ | — | | $ | 2,955 |
Certain ROU assets, net | | $ | 902 | | $ | — | | $ | — | | $ | 902 | | $ | 543 |
Fair
Value of Financial InstrumentsThe carrying amounts of cash and cash equivalents, restricted cash, accounts receivable, accounts payable and certain accrued expenses approximate fair value due to their short-term maturities. The recorded value of the TRA approximates fair value, based on borrowing rates currently available to the Company for debts with similar terms and remaining maturities (Level 3 measurement).
69
Stock-Based Compensation
Stock-based compensation expense is recognized using a fair-value based method for costs related to all share-based payments including stock options and restricted stock issued under the Company’s employee stock plans. The guidance also requires companies to estimate the fair value of stock option awards is estimated on the date of grant using an option pricing model, which require the input of subjective assumptions. The Company is required to use judgment in estimating the amount of stock-based awards that are expected to be forfeited. If actual forfeitures differ significantly from the original estimate, stock-based compensation expense and the results of operations could be affected. The cost is recognized on a straight-line basis over the period during which an employee is required to provide service, usually the vesting period. For options or restricted shares that are based on a performance requirement, the cost is recognized on an accelerated basis over the period to which the performance criteria relate.
Earnings
per ShareEarnings per share (“EPS”) is calculated using the weighted average number of common shares outstanding during each period. Diluted EPS assumes the conversion, exercise or issuance of all potential common stock equivalents unless the effect is to reduce a loss or increase the income per share. For purposes of this calculation, options and restricted stock awards are considered to be common stock equivalents and are only included in the calculation of diluted earnings per share when their effect is dilutive. The shares used to compute basic and diluted net income per share represent the weighted-average common shares outstanding.
Franchise revenue consists of franchise royalties, initial franchise fees, license fees due from franchisees and IT support services. Rental income for leases and subleases to franchisees are scoped out of the revenue standard and are within the scope of lease guidance. The revenue recognition for franchise royalties are not impacted, and will continue to be recognized when franchisee sales occur. However, revenue recognition for franchise and development fees that are not related to subsequent sales will be impacted. The Company's current accounting policy is to recognize initial franchise fees, development fees, and franchise agreement renewals when all material obligations have been performed and conditions have been satisfied, typically when operations of the franchised restaurant have commenced. In accordance with the new guidance, the initial franchise services, or exclusivity of the development agreements, are not distinct from the continuing rights or services offered during the term of the franchise agreement, and will therefore be treated as a single performance obligation. As such, initial franchise and development fees received, and subsequent renewal fees, will be recognized over the franchise, or renewal, term. Additionally, the Company's current accounting policy is to
On July 11, 2014, EPL and LLC entered into a Franchise Development Option Agreement relating to development of our restaurants in the New York–Newark, NY–NJ–CT–PA Combined Statistical Area (the “Territory”). EPL granted LLC the exclusive option to develop and open 15 restaurants in the Territory over five years (the “Initial Option”), and, provided that the Initial Option is exercised, the exclusive option to develop and open up to an additional 100 restaurants in the Territory over ten years. The Franchise Development Option Agreement terminates (i) ten years after execution, or (ii) if the Initial Option is exercised, five years after that exercise. LLC may only exercise the Initial Option if EPL first determines to begin development of company-operated restaurants in the Territory or support the development of the Territory. We haveThe Company has no current intention to begin development in the Territory and as of December 28, 2022, no stores have been opened in the Territory.
The costs and related accumulated depreciation and amortization of major classes of property are as follows (in thousands):
| December 27, 2017 | December 28, 2016 | ||||||
| Land | $ | 12,323 | $ | 12,323 | |||
| Buildings and improvements | 124,056 | 125,159 | |||||
| Other property and equipment | 64,712 | 65,831 | |||||
| Construction in progress | 8,225 | 11,539 | |||||
| 209,316 | 214,852 | ||||||
| Less: accumulated depreciation and amortization | (106,522 | ) | (96,382 | ) | |||
| $ | 102,794 | $ | 118,470 | ||||
| | | | | | |
|
| December 28, 2022 |
| December 29, 2021 | ||
Land | | $ | 12,323 | | $ | 12,323 |
Buildings and improvements |
| | 153,377 |
| | 144,631 |
Other property and equipment |
| | 83,035 |
| | 78,383 |
Construction in progress |
| | 3,196 |
| | 5,333 |
|
| | 251,931 |
| | 240,670 |
Less: accumulated depreciation and amortization |
| | (173,287) |
| | (165,002) |
| | $ | 78,644 | | $ | 75,668 |
Depreciation and amortization expense was $18.1$14.4 million, $16.1$15.2 million and $13.1$16.9 million for the years ended December 27, 2017,28, 2022, December 28, 2016,29, 2021, and December 30, 2015,2020, respectively. The gross value of assets under capital leases for buildings and improvements was $1.6 million at December 27, 2017 and December 28, 2016. Accumulated depreciation for assets under capital leases was $1.5 million for the years ended December 27, 2017 and December 28, 2016.
Based on the Company’s review of its long-lived assets for impairment, the Company recorded non-cash impairment charges of $32.6$0.4 million, $8.4$0.3 million and $0.2$3.0 million for the years ended December 27, 2017,28, 2022, December 28, 2016,29, 2021, and December 30, 2015,2020, respectively. See “Impairment of Long-Lived and ROU Assets” in Note 2 “Summary of Significant Accounting Policies” for additional information.
70
Domestic trademarks consist of the following (in thousands):
| December 27, 2017 | December 28, 2016 | ||||||
| Beginning balance | $ | 120,700 | $ | 120,700 | |||
| Accumulated impairment charges | (58,812 | ) | (58,812 | ) | |||
| Ending balance | $ | 61,888 | $ | 61,888 | |||
| | | | | | |
| | December 28, | | December 29, | ||
|
| 2022 |
| 2021 | ||
Cost | | $ | 120,700 | | $ | 120,700 |
Accumulated impairment charges |
| | (58,812) |
| | (58,812) |
Trademarks, net | | $ | 61,888 | | $ | 61,888 |
5. LEASES
Nature of the following (in thousands):
| December 27, 2017 | December 28, 2016 | ||||||
| Favorable leasehold interest | $ | 6,038 | $ | 6,038 | |||
| Less: accumulated amortization | (5,661 | ) | (5,554 | ) | |||
| Total favorable leasehold interest, net | $ | 377 | $ | 484 | |||
| Unfavorable leasehold interest liability | $ | (9,156 | ) | $ | (9,156 | ) | |
| Less: accumulated amortization | 8,370 | 8,144 | |||||
| Unfavorable leasehold interest liability, net | $ | (786 | ) | $ | (1,012 | ) | |
| For the Years Ending | Favorable Leasehold Interest | Unfavorable Leasehold Interest | |||||
| December 26, 2018 | $ | 97 | $ | (144 | ) | ||
| December 25, 2019 | 94 | (136 | ) | ||||
| December 30, 2020 | 85 | (123 | ) | ||||
| December 29, 2021 | 64 | (120 | ) | ||||
| December 28, 2022 | 37 | (107 | ) | ||||
| Thereafter | — | (156 | ) | ||||
| Total | $ | 377 | $ | (786 | ) | ||
The Company’s operations utilize property, facilities, equipment and vehicles owned by the Company or leased from others. BuildingsAdditionally, the Company has various contracts with vendors that have been determined to contain an embedded lease in accordance with Topic 842.
As of December 28, 2022, the Company had no leases that it had entered into, but had not yet commenced. The Company does not have control of the property until lease commencement.
Building and facility leases
The majority of the Company’s building and facilities leased from othersleases are primarily for restaurantsclassified as operating leases; however, the Company currently has one facility and support facilities. ten equipment leases that are classified as finance leases.
Restaurants are operated under lease arrangements that generally provide for a fixed base rent and, in some instances, contingent rent based on a percentage of gross operating profit or net revenues in excess of a defined amount. InitialAdditionally, a number of the Company’s leases have payments, which increase at pre-determined dates based on the change in the consumer price index. For all leases, the Company also reimburses the landlord for non-lease components, or items that are not considered components of a contract, such as common area maintenance, property tax and insurance costs. While the Company determined not to separate lease and non-lease components, these payments are based on actual costs, making them variable consideration and excluding them from the calculations of the ROU asset and lease liability.
The initial terms of land and restaurant building leases are generally have terms of 20 years, exclusive of options to renew. LeasesThese leases typically have four 5-year renewal options, which have generally been excluded in the calculation of equipment primarily consistthe ROU asset and lease liability, as they are not considered reasonably certain to be exercised, unless (1) the renewal had already occurred as of restaurant equipment, computer systemsthe time of adoption of Topic 842, or (2) there have been significant leasehold improvements that have a useful life that extend past the original lease term. Furthermore, there are no residual value guarantees and vehicles. no restrictions imposed by the lease.
During the year ended December 28, 2022, the Company reassessed the lease terms on 22 restaurants due to certain triggering events, such as the addition of significant leasehold improvements, the decision to terminate a lease, or the decision to renew. As a result of the reassessment, an additional $13.0 million of ROU assets and lease liabilities for the year ended December 28, 2022 were recognized, and will be amortized over the new lease term.
During the year ended December 29, 2021, the Company reassessed the lease terms on 22 restaurants due to certain triggering events, such as the addition of significant leasehold improvements, the decision to terminate a lease, or the decision to renew. As a result of the reassessment, an additional $17.8 million of ROU assets and lease liabilities for the year ended December 29, 2021 were recognized, and will be amortized over the new lease term.
71
The reassessments had an impact on the original lease classification of one property during the year ended December 28, 2022 which represented $0.7 million of the $13.0 million total additional ROU asset and lease liabilities for fiscal 2022. There were no reassessments that impacted the original lease classification during the year ended December 29, 2021. Additionally, as the Company adopted all practical expedients available under Topic 842, no reallocation between lease and non-lease components was necessary.
The Company also subleases facilities to certain franchisees and other non-related parties which are also considered operating leases. Sublease income also includes contingent rental income based on net revenues. The vast majority of these leases have rights to extend terms via fixed rental increases. However, none of these leases have early termination rights, the right to purchase the premises or any residual value guarantees. The Company does not have any related party leases.
During fiscal 2022, the Company determined that the carrying value of an ROU assets at one restaurant was not recoverable. As a result, the Company recorded on a straight-line basis.
less than $0.1 million non-cash impairment charge for the year ended December 28, 2022 related to one restaurant closed in California. During fiscal 2021, the Company determined that the carrying value of ROU assets at two restaurants were not recoverable. As a result, the Company recorded a $0.4 million non-cash impairment charge for the year ended December 29, 2021 related to one restaurant closed in Texas in 2019 and one restaurant closed in California. During fiscal 2020, the Company determined that the carrying value of ROU assets at one restaurant was not recoverable. As a result, the Company recorded a $0.5 million non-cash impairment charge for the year ended December 30, 2020 related to one restaurant in Texas, which was sold to a franchisee in the prior year.
Equipment
Leases of equipment primarily consist of restaurant equipment, copiers and vehicles. These leases are fixed payments with no variable component. Additionally, no optional renewal periods have been included in the calculation of the ROU Asset, there are no residual value guarantees and no restrictions imposed.
Significant Assumptions and Judgments
In applying the requirements of Topic 842, the Company made significant assumptions and judgments related to determination of whether a contract contains a lease and the discount rate used for the lease.
In determining if any of the Company’s contracts contain a lease the Company made assumptions and judgments related to its ability to direct the use of any assets stated in the contract and the likelihood of renewing any short-term contracts for a period extending past twelve months.
The Company also made significant assumptions and judgments in determining an appropriate discount rate for property leases. These included using a consistent discount rate for a portfolio of leases entered into at varying dates, using the full 20-year term of the lease, excluding any options, and using the total minimum lease payments. For all other leases, the Company uses the discount rate implicit in the lease, or the Company’s incremental borrowing rate.
As the Company has adopted the practical expedient not to separate lease and non-lease components, no significant assumptions or judgments were necessary in allocating consideration between these components, for all classes of underlying assets.
72
EL POLLO LOCO HOLDINGS, INC.
NOTES TO CONSOLIDATED FINANCIAL STATEMENTS (continued)
The following table presents the Company’s total lease cost, disaggregated by underlying asset (in thousands):
| | | | | | | | | | | | | | | | | | | | | | | | | | | |
| | December 28, 2022 | | December 29, 2021 | | December 30, 2020 | |||||||||||||||||||||
| | Property |
| Equipment |
| | | | Property |
| Equipment |
| | | | Property | | Equipment | | | | ||||||
| | Leases | | Leases | | Total | | Leases | | Leases | | Total | | Leases | | Leases | | Total | |||||||||
Finance lease cost: | | |
|
| |
|
| |
| | |
|
| |
|
| |
| | | | | | | | | |
Amortization of right-of-use assets | | $ | 73 | | $ | 2 | | $ | 75 | | $ | 78 | | $ | 2 | | $ | 80 | | $ | 11 | | $ | — | | $ | 11 |
Interest on lease liabilities | | | 42 | | | 3 | |
| 45 | |
| 58 | | | 1 | |
| 59 | | | 27 | | | — | | | 27 |
Operating lease cost | |
| 26,537 | |
| 1,005 | |
| 27,542 | |
| 26,501 | |
| 1,122 | |
| 27,623 | |
| 26,578 | |
| 1,227 | |
| 27,805 |
Short-term lease cost | |
| — | |
| 18 | |
| 18 | |
| — | |
| 21 | |
| 21 | |
| — | |
| 23 | |
| 23 |
Variable lease cost | |
| 597 | |
| 677 | |
| 1,274 | |
| 539 | |
| 354 | |
| 893 | |
| 444 | |
| 191 | |
| 635 |
Sublease income | |
| (4,555) | |
| — | |
| (4,555) | |
| (3,823) | |
| — | |
| (3,823) | |
| (3,251) | |
| — | |
| (3,251) |
Total lease cost | | $ | 22,694 | | $ | 1,705 | | $ | 24,399 | | $ | 23,353 | | $ | 1,500 | | $ | 24,853 | | $ | 23,809 | | $ | 1,441 | | $ | 25,250 |
The following table presents the Company’s total lease cost on the consolidated statement of income (in thousands):
| | | | | | | | | | |
| |
| December 28, 2022 |
| December 29, 2021 | | December 30, 2020 | |||
Lease cost – Occupancy and other operating expenses | | | $ | 23,730 | | $ | 24,020 | | $ | 23,972 |
Lease cost – General & administrative | | |
| 465 | | | 413 | | | 464 |
Lease cost – Depreciation and amortization | | |
| 73 | | | 78 | | | 11 |
Lease cost – Interest expense | | |
| 45 | | | 59 | | | 27 |
Lease cost – Closed-store reserve | | |
| 86 | | | 283 | | | 776 |
Total lease cost | | | $ | 24,399 | | $ | 24,853 | | $ | 25,250 |
73
The Company had the following cash and non-cash activities associated with its leases (in thousands):
| | | | | | | | | | | | | | | | | | | | | | | | | | | |
| | December 28, 2022 | | December 29, 2021 | | December 30, 2020 | |||||||||||||||||||||
|
| Property |
| Equipment |
| | |
| Property |
| Equipment |
| | | | Property | | Equipment | | | | ||||||
| | Leases | | Leases | | Total | | Leases | | Leases | | Total | | Leases | | Leases | | Total | |||||||||
Cash paid for amounts included in the measurement of lease liabilities |
| |
|
| |
|
| |
| | | | | | | | | | | | | | | | | | |
Operating cash flows used for operating leases | | $ | 27,221 | | $ | 953 |
| $ | 28,174 | | $ | 26,414 | | $ | 1,084 | | $ | 27,498 | | $ | 23,683 | | $ | 1,230 | | $ | 24,913 |
Financing cash flows used for finance leases | | $ | 106 | | $ | 56 |
| $ | 162 | | $ | 102 | | $ | 46 | | $ | 148 | | $ | 34 | | $ | 5 | | $ | 39 |
| | | | | | | | | | | | | | | | | | | | | | | | | | | |
Non-cash investing and financing activities: | |
|
| |
|
|
| |
| | | | | | | | | | | | | | | | | | |
Operating lease ROU assets obtained in exchange for lease liabilities: | |
|
| |
|
|
| |
| | | | | | | | | | | | | | | | | | |
Operating lease ROU assets | | $ | 12,978 | | $ | 92 |
| $ | 13,070 | | $ | 17,763 | | $ | — | | $ | 17,763 | | $ | 5,850 | | $ | 13 | | $ | 5,863 |
Finance lease ROU assets obtained in exchange for lease liabilities: | | | | | | | | | | | | | | | | | | | | | | | | | | | |
Finance lease ROU assets | | $ | — | | $ | 28 | | $ | 28 | | $ | — | | $ | 196 | | $ | 196 | | $ | 1,623 | | $ | 54 | | $ | 1,677 |
Derecognition of ROU assets due to terminations, impairment or modifications | | $ | (39) | | $ | (35) |
| $ | (74) | | $ | (4,513) | | $ | (99) | | $ | (4,612) | | $ | (543) | | $ | (26) | | $ | (569) |
| | | | | | | | | | | | | | | | | | | | | | | | | | | |
Other Information | |
|
| |
|
|
| |
| | | | | | | | | | | | | | | | | | |
Weighted-average remaining years in lease term—finance leases | |
| 17.87 | |
| 3.19 | | |
| | | 18.42 | | | 4.02 | | | | | | 18.98 | | | 4.52 | | | |
Weighted-average remaining years in lease term—operating leases | |
| 10.73 | |
| 1.73 | | |
| | | 11.27 | | | 1.44 | | | | | | 11.45 | | | 2.31 | | | |
Weighted-average discount rate—finance leases | |
| 2.57 | % |
| 1.53 | % | |
| | | 2.78 | % | | 1.54 | % | | | | | 2.50 | % | | 1.68 | % | | |
Weighted-average discount rate—operating leases | |
| 4.54 | % |
| 3.80 | % | |
| | | 4.45 | % | | 3.89 | % | | | | | 4.29 | % | | 3.93 | % | | |
Information regarding the Company’s minimum future lease obligations at December 27, 201728, 2022 is as follows (in thousands):
| | | | | | | | | |
| | Finance | | Operating Leases | |||||
|
| Minimum |
| Minimum |
| Minimum | |||
| | Lease | | Lease | | Sublease | |||
For the Years Ending | | Payments | | Payments | | Income | |||
December 27, 2023 | | $ | 151 | | $ | 27,876 | | $ | 4,040 |
December 25, 2024 | |
| 151 | |
| 25,887 | |
| 3,685 |
December 31, 2025 | |
| 147 | |
| 23,729 | |
| 3,207 |
December 30, 2026 | |
| 114 | |
| 21,595 | |
| 2,881 |
December 29, 2027 | |
| 104 | |
| 19,806 | |
| 2,829 |
Thereafter | |
| 1,479 | |
| 117,566 | |
| 20,403 |
Total | | $ | 2,146 | | $ | 236,459 | | $ | 37,045 |
Less: imputed interest (1.53% - 4.54%) | |
| (410) | |
| (51,315) | |
|
|
Present value of lease obligations | |
| 1,736 | |
| 185,144 | |
|
|
Less: current maturities | |
| (110) | |
| (19,995) | |
|
|
Noncurrent portion | | $ | 1,626 | | $ | 165,149 | |
|
|
Short-Term Leases
The Company has multiple short-term leases, which have terms of less than 12 months, and thus were excluded from the recognition requirements of Topic 842. The Company has recognized these lease payments in its consolidated statement
74
| Capital Leases | Operating Leases | ||||||||||||||
| For the Years Ending | Minimum Lease Payments | Minimum Sublease Income | Minimum Lease Payments | Minimum Sublease Income | |||||||||||
| December 26, 2018 | $ | 172 | $ | — | $ | 25,270 | $ | 932 | |||||||
| December 25, 2019 | 95 | — | 25,102 | 728 | |||||||||||
| December 30, 2020 | 54 | — | 23,818 | 455 | |||||||||||
| December 29, 2021 | 54 | — | 22,669 | 466 | |||||||||||
| December 28, 2022 | 45 | — | 21,706 | 466 | |||||||||||
| Thereafter | — | — | 179,582 | 1,158 | |||||||||||
| Total | $ | 420 | $ | — | $ | 298,147 | $ | 4,205 | |||||||
| Less: imputed interest (11.0% to 14.8%) | (104 | ) | |||||||||||||
| Present value of capital lease obligations | 316 | ||||||||||||||
| Less: current maturities | (132 | ) | |||||||||||||
| Noncurrent portion | $ | 184 | |||||||||||||
| For the Years Ended | December 27, 2017 | December 28, 2016 | December 30, 2015 | ||||||||
| Base rent | $ | 24,384 | $ | 22,089 | $ | 19,944 | |||||
| Contingent rent | 259 | 209 | 96 | ||||||||
| Less: sublease income | (2,334 | ) | (2,540 | ) | (2,620 | ) | |||||
| Net rent expense | $ | 22,309 | $ | 19,758 | $ | 17,420 | |||||
of income on a straight-line basis over the lease term and contingent rent are included in occupancy and other operating expenses, while sublease income is included in franchise revenuevariable lease payments in the accompanying consolidated statements of income. Sublease income includes contingent rental income of $0.8 million, $1.0 million, and $1.1 millionperiod in which the obligation for fiscal 2017, 2016, and 2015, respectively.
Lessor
The Company is a lessor for certain property, facilities and equipment owned by the Company and leased to others, principally franchisees, under noncancelablenon-cancelable leases with initial terms ranging from three3 to nine20 years. TheThese lease agreements generally provide for a fixed base rent and, in some instances, contingent rent based on a percentage of gross operating profit or net revenues. Total rental income includedAll leases are considered operating leases.
For the leases in franchise revenue inwhich the accompanying consolidated statements of income for leased property was $0.5Company is the lessor, there are options to extend the lease. However, there are no terms and conditions to terminate the lease, no right to purchase premises and no residual value guarantees. Additionally, there are no related party leases.
For the years ended December 28, 2022, December 29, 2021, and December 30, 2020, the Company received $0.4 million, $0.5$0.4 million and $0.4$0.6 million, for fiscal 2017, 2016, and 2015, respectively.
6. LONG-TERM DEBT
On July 27, 2017, is as follows (in thousands):
| For the Years Ending | |||
| December 26, 2018 | $ | 274 | |
| December 25, 2019 | 184 | ||
| December 30, 2020 | 188 | ||
| December 29, 2021 | 146 | ||
| December 28, 2022 | 132 | ||
| Thereafter | 352 | ||
| Total future minimum rental income | $ | 1,276 | |
The 20142022 Revolver includes a sub limit of $15.0 million for letters of credit and a sub limit of $15.0 million for swingline loans. At DecemberThe 2022 Revolver and 2022 Credit Agreement will mature on July 27, 2017, $7.72027. The obligations under the 2022 Credit Agreement and related loan documents are guaranteed by Holdings and Intermediate. The obligations of Holdings, EPL and Intermediate under the 2022 Credit Agreement and related loan documents are secured by a first priority lien on substantially all of their respective assets.
The 2018 Revolver included a sub limit of $15.0 million offor letters of credit and $93.0a sub limit of $15.0 million for swingline loans. The obligations under the 2018 Credit Agreement and related loan documents were guaranteed by the Company and Intermediate. The obligations of the revolving lineCompany, EPL and Intermediate under the 2018 Credit Agreement and related loan documents were secured by a first priority lien on substantially all of credit were
their respective assets.
The special dividend announced by the Company’s Board of Directors on October 11, 2022 is permitted under the terms of 2022 Revolver pursuant to both subclause (iii)(d) and (iii)(e) of the following sentence. Under the 2022 Revolver, Holdings is restricted from making certain payments such as cash dividends, except that it may, inter alia, (i) pay up to $1.0 million per year to repurchase or redeem qualified equity interests of Holdings held by past or present officers, directors, or employees (or their estates) of the Company upon death, disability, or termination of employment, (ii) pay under its TRA, and (iii) so long as no default or event of default has occurred and is continuing, (a) make non-cash repurchases of equity interests in connection with the exercise of stock options by directors, officers and management, provided that those equity interests represent a portion of the consideration of the exercise price of those stock options, (b) pay up to $0.5 million in any 12 month consecutive period to redeem, repurchase or otherwise acquire equity interests of any subsidiary that is not a wholly-owned subsidiary from any holder of equity interest in such subsidiary, (c) pay up to $2.5 million per year pursuant to stock option plans, employment agreements, or incentive plans, (d) make up to $5.0 million in other restricted payments per year, and (e) make other restricted payments, subject to its compliance, on a pro forma basis, with (x) a lease-adjusted consolidated leverage ratio not to exceed 4.25 times and (y) the financial covenants applicable to the 2022 Revolver.
75
Borrowings under the 2014 Revolver2022 Credit Agreement (other than any swingline loans) bear interest, at the borrower’s option, at rates based upon either LIBORthe secured overnight financing rate (“SOFR”) or a base rate, plus, for each rate, a margin determined in accordance with a lease-adjusted consolidated leverage ratio-based pricing grid. The base rate is calculated as the highest of (a) the federal funds rate plus 0.50%, (b) the prime rate ofpublished Bank of America prime rate, or (c) LIBORTerm SOFR with a term of one-month SOFR plus 1.00%. For LIBORTerm SOFR loans, the margin is in the range of 1.75%1.25% to 2.50%2.25%, and for base rate loans the margin is in thea range of 0.75%0.25% to 1.50%1.25%. The margin was initially set at 2.00% for LIBOR loansBorrowings under the 2022 Revolver may be repaid and at 1.00% for base rate loans untilreborrowed. For borrowings under the delivery of financial statements2022 Revolver and a compliance certificate for2018 Revolver during fiscal 2022, the first quarter of 2016. The interest rate range was 2.4%1.4% to 3.3%6.0%. For borrowings under the 2018 Revolver during fiscal 2017 and 2.0%2021, the interest rate range was 1.3% to 2.4% during fiscal 2016 and1.6%. The interest rate under the 2022 Revolver was 3.3% and 2.4%5.7% at December 27, 201728, 2022 and 1.4% under the 2018 Revolver at December 29, 2021. For the year ended December 28, 2022, the Company had interest expense of $0.9 million under the 2022 Revolver and 2018 Revolver. For the years ended December 29, 2021 and December 28, 2016, respectively.
The 2014 Revolver includes a number of negative and2022 Credit Agreement contains certain financial covenants, including, among others, the following (all subject to certain exceptions): a maximum lease-adjusted consolidated leverage ratio covenant, a minimum consolidated fixed charge coverage ratio, and limitations on indebtedness, liens, investments, asset sales, mergers, consolidations, liquidations, dissolutions, restricted payments, and negative pledges. The 2014 Revolver also includes certain customary affirmative covenants and events of default.covenants. The Company was in compliance with all such covenants at December 28, 2022.
At December 28, 2022, $9.8 million of letters of credit and $66.0 million of borrowings were outstanding under the 2022 Revolver. The amount available under the 2022 Revolver was $74.2 million at December 28, 2022. At December 29, 2021, $10.0 million of letters of credit and $40.0 million of borrowings were outstanding under the 2018 Revolver. The amount available under the 2018 Revolver was $100.0 million at December 29, 2021.
Maturities
On July 27, 2017. See Note 1 for restrictions2022, the Company refinanced and terminated the 2018 Revolver pursuant to the 2022 Credit Agreement. The 2022 Revolver and 2022 Credit Agreement will mature on July 27, 2027. During the year ended December 28, 2022, the Company borrowed $26.0 million net of pay downs of $20.0 million on its 2022 Revolver. During the year ended December 29, 2021, the Company paid down $22.8 million on the payment of dividends under the 20142018 Revolver.
Interest Rate Swap
During the year ended December 25, 2019, the Company entered into a variable-to-fixed interest rate swap agreement with a notional amount of $40.0 million that matures in June 2023. The objective of the interest rate swap was to reduce the Company’s exposure to interest rate risk for a portion of its variable-rate interest payments on its borrowings under the 2018 Revolver. The interest rate swap was designated as a cash flow hedge, as the changes in the future cash flows of the swap were expected to offset changes in expected future interest payments on the related variable-rate debt, in accordance with Accounting Standards Codification (“ASC”) 815 “Derivatives and Hedging.”
In connection with the Company’s entry into the 2022 Credit Agreement, on July 28, 2022, the Company terminated the interest rate swap, which was previously used to hedge interest rate risk. Prior to the interest rate swap termination, the swap was a highly effective cash flow hedge. In settlement of this swap, the Company received approximately $0.6 million and derecognized the corresponding interest rate swap asset. The remaining amount in AOCI related to the hedging relationship will be reclassified into earnings when the hedged forecasted transaction is reported in earnings. As of December 28, 2022, the estimated net gains included in AOCI related to the Company’s cash flow hedge that will be reclassified into earnings in the next 12 months is $0.2 million, based on current Term SOFR interest rates.
The following table shows the financial statement line item and amount of the Company’s cash flow hedge accounting on the consolidated balance sheet (in thousands):
| | | | | | | | | | | | |
| | December 28, 2022 | | December 29, 2021 | ||||||||
|
| Notional |
| Fair value |
| Notional |
| Fair value | ||||
Other liabilities - Interest rate swap | | $ | — | | $ | — | | $ | 40,000 | | $ | 396 |
76
The following table summarizes the effect of the Company’s cash flow hedge accounting on the consolidated statements of income (in thousands):
| | | | | | | | | | |
|
| December 28, 2022 |
| December 29, 2021 | | December 30, 2020 |
| |||
Interest expense on hedged portion of debt | | $ | 439 | | $ | 568 | | $ | 979 | |
Interest (income) expense on interest rate swap |
| | (296) |
| | 486 | | | 278 |
|
Interest (income) expense on debt and derivatives, net | | $ | 143 | | $ | 1,054 | | $ | 1,257 | |
The following table summarizes the effect of the Company’s cash flow hedge accounting on AOCI for the years ended December 28, 2022, December 29, 2021 and December 30, 2020 (in thousands):
| | | | | | | | | | | | | | | | | | |
| | | | | | | (Gain) Loss Reclassified from | | ||||||||||
| | Net Gain (Loss) Recognized in OCI | | AOCI into Interest (Income) Expense | | |||||||||||||
|
| December 28, 2022 |
| December 29, 2021 |
| December 30, 2020 |
| December 28, 2022 |
| December 29, 2021 | December 30, 2020 |
| ||||||
Interest rate swap | | $ | 862 | | $ | 257 | | $ | (1,762) | | $ | (296) | | $ | 486 | $ | 278 | |
See Note 2 “Summary of Significant Accounting Policies” for the fair value of the Company’s derivative asset.
7. OTHER ACCRUED EXPENSES AND CURRENT LIABILITIES
Other accrued expenses and current liabilities consist of the following (in thousands):
| December 27, 2017 | December 28, 2016 | ||||||
| Accrued sales and property taxes | $ | 4,792 | $ | 4,223 | |||
| Gift card liability | 2,319 | 1,870 | |||||
| Other | 6,159 | 3,579 | |||||
| Total other accrued expenses and current liabilities | $ | 13,270 | $ | 9,672 | |||
| | | | | | |
|
| December 28, 2022 |
| December 29, 2021 | ||
Accrued sales and property taxes | | $ | 5,270 | | $ | 4,726 |
Gift card liability | |
| 4,667 | |
| 4,622 |
Loyalty rewards program liability | | | 526 | | | 687 |
Accrued advertising | | | 831 | | | 3,635 |
Accrued legal settlements and professional fees | |
| 1,303 | |
| 771 |
Deferred franchise and development fees | |
| 610 | |
| 637 |
Other | |
| 1,913 | |
| 4,632 |
Total other accrued expenses and current liabilities | | $ | 15,120 | | $ | 19,710 |
Other noncurrent liabilities consist of the following (in thousands):
| | | | | | |
|
| December 28, 2022 |
| December 29, 2021 | ||
Deferred franchise and development fees | | $ | 5,767 | | $ | 5,691 |
Derivative liability | | | — | | | 396 |
Employer social security tax deferral | | | — | | | 2,426 |
Other | |
| 89 | |
| 140 |
Total other noncurrent liabilities | | $ | 5,856 | | $ | 8,653 |
77
| December 27, 2017 | December 28, 2016 | ||||||
| Deferred rent | $ | 9,403 | $ | 8,328 | |||
| Other | 3,369 | 2,354 | |||||
| Total noncurrent liabilities | $ | 12,772 | $ | 10,682 | |||
EL POLLO LOCO HOLDINGS, INC.
NOTES TO CONSOLIDATED FINANCIAL STATEMENTS (continued)
The provision for income taxes is based on the following components (in thousands):
| For the Years Ended | December 27, 2017 | December 28, 2016 | December 30, 2015 | ||||||||
| Current income taxes: | |||||||||||
| Federal | $ | — | $ | — | $ | — | |||||
| State | 250 | 224 | 188 | ||||||||
| Total current | 250 | 224 | 188 | ||||||||
| Deferred income taxes: | |||||||||||
| Federal | 1,495 | 9,660 | 8,871 | ||||||||
| State | 192 | 2,730 | 6,378 | ||||||||
| Total deferred | 1,687 | 12,390 | 15,249 | ||||||||
| Charge in lieu of tax (attributable to stock options) | — | 169 | 5,420 | ||||||||
| Adjustment to deferred taxes for tax rate change | (1,440 | ) | — | — | |||||||
| Tax provision for income taxes | $ | 497 | $ | 12,783 | $ | 20,857 | |||||
| | | | | | | | | |
|
| December 28, |
| December 29, |
| December 30, | |||
For the Years Ended | | 2022 | | 2021 | | 2020 | |||
Current income taxes: |
| |
|
| |
|
| |
|
Federal | | $ | 2,366 | | $ | 7,163 | | $ | 520 |
State | |
| 1,112 | |
| 2,158 | |
| 1,123 |
Total current | |
| 3,478 | |
| 9,321 | |
| 1,643 |
Deferred income taxes: | |
|
| |
|
| |
|
|
Federal | |
| 2,958 | |
| 93 | |
| 3,350 |
State | |
| 1,642 | |
| 918 | |
| 658 |
Total deferred | |
| 4,600 | |
| 1,011 | |
| 4,008 |
Tax provision for income taxes | | $ | 8,078 | | $ | 10,332 | | $ | 5,651 |
The provision for income taxes differs from the amount computed by applying the federal income tax rate of 21.0% for fiscal 2022, 2021 and 2020 as follows:
| For the Years Ended | December 27, 2017 | December 28, 2016 | December 30, 2015 | |||||
| Statutory federal income tax rate of 35% applied to earnings before income taxes and extraordinary items | 35.0 | % | 35.0 | % | 35.0 | % | ||
| TRA expense | (21.4 | ) | 0.4 | 0.1 | ||||
| Revaluation of deferred taxes | (15.8 | ) | — | — | ||||
| Change in valuation allowance | 10.9 | 1.3 | 6.5 | |||||
| WOTC Credit | (2.5 | ) | (0.8 | ) | — | |||
| State tax benefit (net of federal benefit) | 0.6 | 5.0 | 5.1 | |||||
| State tax credits | — | — | (0.6 | ) | ||||
| Other | (1.3 | ) | 0.2 | 0.3 | ||||
| Total | 5.5 | % | 41.1 | % | 46.4 | % | ||
| | | | | | | |
| | December 28, | | December 29, | | December 30, | |
For the Years Ended |
| 2022 |
| 2021 |
| 2020 |
|
Statutory federal income tax rate applied to earnings before income taxes and extraordinary items | | 21.0 | % | 21.0 | % | 21.0 | % |
State income tax expense (net of federal benefit) |
| 7.7 |
| 5.9 |
| 4.3 | |
Change in valuation allowance |
| — |
| 0.1 |
| 0.4 | |
TRA (income) expense |
| (0.3) |
| — |
| — | |
162(m) | | 0.5 | | 0.8 | | 0.2 | |
WOTC Credit |
| (0.9) |
| (0.5) |
| (0.9) | |
Stock option exercises |
| 0.3 |
| (1.4) |
| (6.6) | |
Other |
| (0.3) |
| 0.3 |
| 0.4 | |
Total |
| 28.0 | % | 26.2 | % | 18.8 | % |
As of December 28, 2022, the Company had no federal and less than $0.1 million state NOL carryforwards. These State NOLs expire beginning 2029.The Company also has state enterprise zone credits of approximately$9.2 million, which expire in2023. The utilization of NOL carryforwards and state enterprise zone credits may be subject to limitation under section 382 of the Internal Revenue Code of 1986 (the “Code”) and similar state law provisions.
Deferred income tax assets and liabilities are recorded for differences between the financial statement and tax basis of the assets and liabilities that will result in taxable or deductible amounts in the future based on enacted laws and rates applicable to the periods in which the differences are expected to affect taxable income. Valuation allowances are established when necessary to reduce deferred tax assets to the amount expected to be realized.
The Company has evaluated the available evidence supporting the realization of its gross deferred tax assets. After evaluating all of the positive and negative evidence, including the Company’s continued income from operations, the Company concluded that it is more likely than not that its deferred tax assets except from certain state credits will be realized. In both fiscal 20152021 and 2016,2020, the Company recorded a valuation allowance of approximately $2.9$0.1 million and $0.4 million, respectively, against its deferred tax asset resulting from certain tax credits that may not be realizable prior to the time the credits expire. In fiscal 2017,2022, the Company recorded an additional $1.0$0.5 million to the valuation allowance. As of December 27, 201728, 2022, the total valuation allowance was $4.3$6.7 million.
On July 30, 2014, the Company entered into the TRA. The TRA calls for the Company to pay its pre-IPO stockholders 85% of the cash savings that the Company realizes in its taxes as a result of utilizing its NOLs and other tax attributes attributable to preceding periods. The TRA charge expense (benefit) expense is a permanent add-back to the Company’s taxable income. TRA resulted in approximately $5.6$0.4 million of benefitincome in fiscal 20172022 as a result of the amortization of interest expense related
78
to the total expected TRA payments and changes in estimates for actual tax returns filed and future forecasted taxable income, less than $0.1 million of expense in fiscal 2021 as a reduction in result of the Federal corporate income tax rateamortization of interest expense related to the newly enactedtotal expected TRA payments and changes in estimates for actual tax reforms discussed further below, $0.4returns filed and future forecasted taxable income and $0.1 million of tax expense in fiscal 2016,2020 as a result of changes to future forecasted results and $0.2 million of tax expense in fiscal 2015.deduction on 2018 legal settlement accrual. In fiscal 2017, we2022, 2021 and 2020, the Company paid $11.1$0.4 million, $1.7 million and $5.2 million, respectively, to ourits pre-IPO stockholders under the TRA
As of December 27, 2017,28, 2022 and December 29, 2021, the deferred tax assets related to California Enterprise Zone credits, net of valuation allowances are $5.4 million.
The Company’s deferred tax assets and liabilities as of December 27, 201728, 2022 and December 28, 201629, 2021 are summarized below.
| | | | | | |
|
| December 28, |
| December 29, | ||
| | 2022 | | 2021 | ||
Deferred assets: |
| |
|
| |
|
Capital leases | | $ | 55 | | $ | 60 |
Accrued vacation | |
| 508 | |
| 503 |
Accrued workers’ compensation | |
| 2,201 | |
| 2,616 |
Enterprise zone and other credits | |
| 7,258 | |
| 7,524 |
Net operating losses | |
| 5 | |
| 5 |
Fixed assets | |
| 2,392 | |
| 4,393 |
ROU assets | |
| 50,112 | |
| 51,864 |
Other | |
| 4,397 | |
| 5,694 |
Total deferred tax assets | |
| 66,928 | |
| 72,659 |
Valuation allowance | |
| (6,727) | |
| (6,181) |
Net deferred tax assets | |
| 60,201 | |
| 66,478 |
Deferred liabilities: | |
|
| |
|
|
Goodwill | |
| (6,420) | |
| (6,349) |
Trademark | |
| (16,721) | |
| (16,727) |
Prepaid expense | |
| (595) | |
| (498) |
ROU liabilities | |
| (44,737) | |
| (46,484) |
Other | |
| 267 | |
| 361 |
Deferred tax liabilities | |
| (68,206) | |
| (69,697) |
Net deferred tax liability | | $ | (8,005) | | $ | (3,219) |
The 2017 balances reflect the revaluation for the reduction in the Federal corporate rate to 21%. The 2016 balances are presented at the pre-new tax law rate of 35%.
| December 27, 2017 | December 28, 2016 | ||||||
| Deferred assets: | |||||||
| Capital leases | $ | 90 | $ | 197 | |||
| Accrued vacation | 428 | 658 | |||||
| Accrued legal | — | 308 | |||||
| Deferred rent | 3,516 | 4,351 | |||||
| Accrued workers’ compensation | 1,450 | 1,932 | |||||
| Enterprise zone and other credits | 12,722 | 11,982 | |||||
| Net operating losses | 13,488 | 30,452 | |||||
| Fixed assets | 4,176 | — | |||||
| Other | 2,261 | 2,737 | |||||
| Total deferred tax assets | 38,131 | 52,617 | |||||
| Valuation allowance | (4,306 | ) | (3,311 | ) | |||
| Net deferred tax assets | 33,825 | 49,306 | |||||
| Deferred liabilities: | |||||||
| Goodwill | (6,037 | ) | (8,809 | ) | |||
| Trademark | (17,613 | ) | (26,463 | ) | |||
| Prepaid expense | (380 | ) | (523 | ) | |||
| Fixed asset | — | (1,771 | ) | ||||
| Other | (2,628 | ) | (4,323 | ) | |||
| Deferred tax liabilities | (26,658 | ) | (41,889 | ) | |||
| Net deferred tax asset | $ | 7,167 | $ | 7,417 | |||
| | | | | | |
|
| December 28, |
| December 29, | ||
| | 2022 | | 2021 | ||
Noncurrent: | | | | | | |
Assets - state | | $ | 512 | | $ | 2,245 |
Liabilities - federal | |
| (8,517) | |
| (5,464) |
Net deferred tax liability | | $ | (8,005) | | $ | (3,219) |
As of December 27, 2017, the Company has federal and state NOL carryforwards of approximately $55.8 million and $20.1 million, respectively, which expire beginning in 2030 and 2025, respectively. The Company also has state enterprise zone credits of approximately $10.9 million, which expire in 2023, federal Work Opportunity Credits of approximately $0.8 million, which will expire in 2038 and federal and state alternative minimum tax ("AMT") credits of approximately $0.9 million, which carry forward to 2021. The utilization of NOL carryforwards may be subject to limitation under section 382 of the Internal Revenue Code of 1986 (the “Code”) and similar state law provisions. In fiscal 2014, the Company completed a section 382 analysis and determined that all of the Company's NOL carryforwards and other tax attributes are subject to limitation under section 382. However, that limitation did not impact the Company's 2017 or 2016 year tax liability.
The Company is no longer subject to U.S. examination for years before 20132019 by the federal taxing authority, and for years before 20122018 by state taxing authorities.
79
10. EMPLOYEE BENEFIT PLANS
The Company sponsors a defined contribution employee benefit plan that permits its employees, subject to certain eligibility requirements, to contribute up to 25% of their qualified compensation to the plan. The Company matches 100% of the employees’ contributions of the first 3% of the employees’ annual qualified compensation, and 50% of the employees’ contributions of the next 2% of the employees’ annual qualified compensation. The Company’s matching contribution immediately fully vests. The Company’s contributions to the plan were $0.8 million for the years ended December 27, 2017,28, 2022, December 28, 2016,29, 2021 and December 30, 20152020.
11. STOCK-BASED COMPENSATION
Pursuant to the 2018 Omnibus Equity Incentive Plan the Company grants stock options (“options”), restricted stock units, performance-based stock units and restricted stock. The Company has authorized 5,652,240 shares of common stock for issuance in connection with stock awards. On June 8, 2021, our stockholders approved amending the Equity Incentive Plan, formerly the 2018 Omnibus Equity Incentive Plan, under which the new aggregate share limit was increased to be 2,000,000 shares. As of December 28, 2022, 945,282 shares were $0.7available for grant.
During the years ended December 28, 2022, December 29, 2021 and December 30, 2020, the Company recognized stock-based compensation expense of $3.5 million, $0.6$3.2 million and $0.5$3.1 million, respectively.
Stock Options
At December 27, 2017,28, 2022, options to purchase 2,309,1031,068,179 shares of common stock of the Company were outstanding, including 1,909,440625,436 vested and 399,663442,743 unvested. Unvested options vest over time, or upon our achieving annual financial goals. However, the compensation committee of the board of directors, as administrator of the Company’s 2014 Omnibus Equity Incentive Plan, has the power to accelerate the vesting schedule of stock-based compensation, and, generally, in the event of an employee termination in connection with a change in control of the Company, any unvested portion of an award under the plan shall become fully vested. At December 27, 2017, 1,563,54928, 2022, 180,020 premium options, options granted above the stock price at date of grant, remained outstanding. In fiscal 2017 and 2016,2022, the Company granted 135,036 and 329,673372,958 options, respectively, with an exercise price equal to the fair market value of the common stock on the date of grant. The options granted in fiscal 2017 and 2016,2022 had a four-yearfour year vesting period. NoStock options weregenerally expire ten years from the date of grant. In fiscal 2021, the Company granted 256,172 options, with an exercise price equal to the fair market value of the common stock on the date of grant. The options granted in fiscal 2015. On November 15, 2016, the board of directors approved the modification of the remaining performance based stock options granted in 2014 and 2013 to vest based solely on time. As2021 had a result, a) 17,380 performance based stock options that did not vest in fiscal 2015 based on performance targets not being met, vested as of November 15, 2016; b) 80,799 performance based stock options that would not have vested based on 2016 performance targets vested as of December 28, 2016; and c) 17,378 performance based stock options that would not have vested based on the 2017 performance target vested at the end of fiscal 2017, subject to continued employment of the option holder and the other terms and conditions of the 2014four year vesting period. Stock Option Plan. The Company recorded $0.6 million as compensation expense in fiscal 2016 as a result of this stock option modification. As of December 27, 2017, there were no remaining performance based stock options and 2,309,103 time based stock options outstanding. The options generally expire 10 years from the date of grant.grant. Changes in stock options for the years ended December 27, 201728, 2022 and December 28, 2016,29, 2021, are as follows:
| | | | | | | | | | | |
| | | | | | | Weighted-Average |
| Aggregate | ||
|
| |
| Weighted-Average |
| Contractual Life |
| Intrinsic Value | |||
| | Shares | | Exercise Price |
| Life (Years) |
| (in thousands) | |||
Outstanding - December 30, 2020 |
| 1,030,866 | | $ | 9.82 | | | | | | |
Grants | | 256,172 | | | 17.55 | | | | | | |
Exercised |
| (132,760) | | | 6.52 | | | | | | |
Forfeited, cancelled or expired |
| (176,200) | |
| 14.48 | | | | | | |
Outstanding - December 29, 2021 |
| 978,078 | | $ | 11.45 | | | | | | |
Grants |
| 372,958 | |
| 10.54 | | | | | | |
Exercised |
| (185,798) | | | 9.22 | | | | | | |
Forfeited, cancelled or expired |
| (97,059) | | $ | 12.06 | | | | | | |
Outstanding - December 28, 2022 |
| 1,068,179 | | $ | 9.92 | | | 5.68 | | $ | 1,368 |
Vested and expected to vest at December 28, 2022 |
| 1,060,880 | | $ | 9.92 | | | 5.66 | | $ | 1,362 |
Exercisable at December 28, 2022 |
| 625,436 | | $ | 9.50 | | | 3.37 | | $ | 1,033 |
80
| Shares | Weighted-Average Exercise Price | |||||
| Outstanding - December 30, 2015 | 2,151,214 | $ | 6.25 | |||
| Grants | 347,053 | 12.14 | ||||
| Exercised | (147,726 | ) | 6.62 | |||
| Forfeited, cancelled or expired | (158,813 | ) | 8.20 | |||
| Outstanding - December 28, 2016 | 2,191,728 | 7.26 | ||||
| Grants | 135,036 | 13.73 | ||||
| Exercised | (17,661 | ) | 5.26 | |||
| Forfeited, cancelled or expired | — | — | ||||
| Outstanding - December 27, 2017 | 2,309,103 | $ | 7.65 | |||
| Vested and expected to vest at December 27, 2017 | 2,289,313 | $ | 7.60 | |||
| Exercisable at December 27, 2017 | 1,909,440 | $ | 6.59 | |||
| Range of Exercise Prices | Number Outstanding | Weighted-Average Remaining Contractual Life (in Years) | Weighted- Average Exercise Price | Number Exercisable | Weighted-Average Exercise Price | |||||||||||
| $4.09 | 105,418 | 5.48 | $ | 4.09 | 105,418 | $ | 4.09 | |||||||||
| $5.84 | 1,599,944 | 4.49 | 5.84 | 1,599,944 | $ | 5.84 | ||||||||||
| $9.65 - $13.95 | 464,709 | 8.68 | 12.49 | 82,424 | $ | 11.99 | ||||||||||
| $15.00 | 139,032 | 6.58 | 15.00 | 121,654 | $ | 15.00 | ||||||||||
| $4.09 - $15.00 | 2,309,103 | 5.51 | $ | 7.65 | 1,909,440 | $ | 6.59 | |||||||||
The intrinsic value of options exercised, calculated as the difference between the market value on the date of exercise and the exercise price, was $0.2$0.8 million, $0.9$1.6 million and $14.9$9.9 million for fiscal years 2017, 20162022, 2021 and 2015,2020, respectively.
The Company measures and recognizes compensation expense for the estimated fair value of stock options for employees and non-employee directors and similar awards based on the grant-date fair value of the award. For options that are based on a service requirement, the cost is recognized on a straight-line basis over the requisite service period, usually the vesting period. For options that were based on performance requirements, costs were recognized over periods to which the performance criteria related. The Company has authorized 4,402,240 shares of common stock for issuance in connection with stock options. As of December 27, 2017, 359,642 shares were available for grant. In order to calculate our stock options’ fair values and the associated compensation costs for share-based awards, the Company utilizes the Black–Scholes option pricing model and has developed estimates of various inputs including forfeiture rate, expected term, expected volatility, and risk-free interest rate. The forfeiture rate is based on historical rates and reduces the compensation expense recognized. The expected term for options granted is derived using the “simplified” method, in accordance with SEC guidance. The Company calculates the risk-free interest rate using the implied yield for a U.S. Treasury security with constant maturity and a remaining term equal to the expected term of the Company’s employee stock options. The Company does not anticipate paying any cash dividends for the foreseeable future and therefore uses an expected dividend yield of zero for option valuation purposes. Expected volatility is estimated using four publicly-traded companies in our market category. These are selected based on similarities of market capitalization, size, and other financial and operational characteristics.the Company’s historical data. Volatility is calculated by taking the historical daily closing equity prices of our peer companies,the Company, prior to the grant date, over a period equal to the expected term.
The weighted-average estimated fair value of employee stock options granted in fiscal 20172022 and 2021 was $4.29$4.89 and $8.10 per share, respectively, using the Black–Scholes model with the following weighted-average assumptions used to value the option grants: expected volatility of 28.6%, expected term of 5.75 years, risk-free interest rate of 1.9% to 2.0%, and expected dividend yield of 0%.
| | | | | |
|
| December 28, 2022 |
| December 29, 2021 |
|
Expected volatility | | 43.0 | % | 46.9 | % |
Risk-free interest rate |
| 2.9 | % | 1.1 | % |
Expected term (years) |
| 6.25 |
| 6.25 | |
Expected dividends |
| — |
| — | |
As of December 27, 2017, we28, 2022, the Company had total unrecognized compensation expense of $1.2$2.1 million related to unvested stock options, which the Company expects to recognize over a weighted average period of 2.73.0 years.
The above assumptions generally require significant judgment. If in the future we determinethe Company determines that another method is more reasonable, or if another method for calculating these input assumptions is prescribed by authoritative guidance, and, therefore, should be used to estimate volatility or expected term, the fair value calculated for our stock options could change significantly. Higher volatility and longer expected lives result in an increase to stock-based compensation expense determined at the date of grant. Stock-based compensation expense affects our general and administrative expense.
The Company estimates its forfeiture rate based on an analysis of ourits actual forfeitures and will continue to evaluate the appropriateness of the forfeiture rate based on actual forfeiture experience, analysis of employee turnover behavior, and other factors. Changes in
Restricted Shares
In fiscal 20172022 and 2016, 181,2922021, 356,610 and 29,259222,741 restricted sharesshare awards were granted, respectively, at the fair market value on the date of grant. These grants vest based on continued service over three years for directors and four years for employees. We base
81
Changes in restricted shares for the amount of unearned compensation recorded on the market value of the shares on the date of issuance. In fiscal 2017, 2016,years ended December 28, 2022 and 2015 the Company recognized share-based compensation expense of $0.5 million, $0.2 million, and $0.1 million, respectively. This expense was included in general and administrative expenses in the accompanying consolidated statements of income. December 29, 2021, are as follows:
| | | | | |
|
| |
| Weighted-Average | |
| | Shares | | Fair Value | |
Unvested shares at December 30, 2020 |
| 742,404 | | $ | 11.68 |
Granted |
| 222,741 | | $ | 17.13 |
Released |
| (248,255) | | $ | 11.99 |
Forfeited, cancelled, or expired |
| (221,110) | | $ | 11.80 |
Unvested shares at December 29, 2021 |
| 495,780 | | $ | 13.92 |
Granted |
| 356,610 | | $ | 10.37 |
Released |
| (201,043) | | $ | 13.32 |
Forfeited, cancelled, or expired |
| (105,867) | | $ | 12.91 |
Unvested shares at December 28, 2022 |
| 545,480 | | $ | 12.02 |
As of December 27, 2017,28, 2022, there was total unrecognized compensation expense of $2.3$5.0 million related to unvested restricted shares,share awards, which the Company expects to recognize over a weighted-average period of 3.22.62 years.
| Shares | Weighted-Average Fair Value | |||||
| Unvested shares at December 30, 2015 | 12,352 | $ | 24.58 | |||
| Granted | 29,259 | $ | 13.33 | |||
| Released | (4,859 | ) | $ | 26.10 | ||
| Forfeited, cancelled, or expired | — | $ | — | |||
| Unvested shares at December 28, 2016 | 36,752 | $ | 15.42 | |||
| Granted | 181,292 | $ | 13.69 | |||
| Released | (10,527 | ) | $ | 16.48 | ||
| Forfeited, cancelled, or expired | (10,875 | ) | $ | 16.72 | ||
| Unvested shares at December 27, 2017 | 196,642 | $ | 13.70 | |||
Basic net income per shareEPS is calculated using the weighted-average number of shares of common stock outstanding during the years ended December 27, 2017,28, 2022, December 28, 2016,29, 2021, and December 30, 2015.2020. Diluted net income per shareEPS is calculated using the weighted-average number of shares of common stock outstanding and potentially dilutive during the period, using the treasury stock method.
On October 11, 2022, the Company’s Board of Directors approved a share repurchase program (the “2022 Stock Repurchase Plan”) under which the Company is authorized to repurchase up to $20.0 million of shares of our common stock. The 2022 Stock Repurchase Plan will terminate on March 28, 2024, may be modified, suspended or discontinued at any time, and does not obligate the Company to acquire any particular number of shares.
Under the 2022 Stock Repurchase Plan, the Company is permitted to repurchase its common stock from time to time, in amounts and at prices that the Company deemed appropriate, subject to market conditions and other considerations. The Company’s repurchases will be executed using open market purchases, including pursuant to Rule 10b5-1 trading plans, and/or through privately negotiated transactions.
For the year ended December 28, 2022, the Company did not repurchase any shares of common stock under the 2022 Stock Repurchase Plan.
Below are basic and diluted net income per shareEPS data for the periods indicated, which are in thousands except for per share data.
| | | | | | | | | |
| | For the Years Ended | |||||||
| | December 28, | | December 29, | | December 30, | |||
|
| 2022 |
| 2021 |
| 2020 | |||
Numerator: |
| |
|
| |
|
| |
|
Net income | | $ | 20,801 | | $ | 29,121 | | $ | 24,474 |
Denominator: | |
|
| |
|
| |
|
|
Weighted-average shares outstanding—basic | |
| 36,350,579 | |
| 35,973,892 | |
| 35,193,325 |
Weighted-average shares outstanding—diluted | |
| 36,575,904 | |
| 36,446,756 | |
| 35,796,406 |
Net income per share—basic | | $ | 0.57 | | $ | 0.81 | | $ | 0.70 |
Net income per share—diluted | | $ | 0.57 | | $ | 0.80 | | $ | 0.68 |
Anti-dilutive securities not considered in diluted EPS calculation | |
| 535,574 | |
| 136,397 | |
| 81,041 |
82
| For the Years Ended | December 27, 2017 | December 28, 2016 | December 30, 2015 | ||||||||
| Numerator: | |||||||||||
| Net income | $ | 8,619 | $ | 18,339 | $ | 24,054 | |||||
| Denominator: | |||||||||||
| Weighted-average shares outstanding—Basic | 38,453,347 | 38,357,805 | 37,949,316 | ||||||||
| Weighted-average shares outstanding—Diluted | 39,086,676 | 39,026,950 | 39,039,558 | ||||||||
| Net income per share—Basic | $ | 0.22 | $ | 0.48 | $ | 0.63 | |||||
| Net income per share—Diluted | $ | 0.22 | $ | 0.47 | $ | 0.62 | |||||
Anti-dilutive securities not considered in diluted EPS calculation | 747,985 | 468,705 | 214,411 | ||||||||
| For the Years Ended | December 27, 2017 | December 28, 2016 | December 30, 2015 | |||||
| Weighted-average shares outstanding—Basic | 38,453,347 | 38,357,805 | 37,949,316 | |||||
| Dilutive effect of stock options and restricted shares | 633,329 | 669,145 | 1,090,242 | |||||
| Weighted-average shares outstanding—Diluted | 39,086,676 | 39,026,950 | 39,039,558 | |||||
| | | | | | |
| | For the Years Ended | ||||
|
| December 28, |
| December 29, |
| December 30, |
| | 2022 | | 2021 | | 2020 |
Weighted-average shares outstanding—basic |
| 36,350,579 |
| 35,973,892 |
| 35,193,325 |
Dilutive effect of stock options and restricted shares |
| 225,325 |
| 472,864 |
| 603,081 |
Weighted-average shares outstanding—diluted |
| 36,575,904 |
| 36,446,756 |
| 35,796,406 |
13. COMMITMENTS AND CONTINGENCIES
Legal Matters
On or about November 5, 2015, a purported Holdings shareholder filed a derivative complaint on behalf of Holdings in the Court of Chancery of the State of Delaware against certain Holdings officers, directors and Trimaran Pollo Partners, L.L.C.,LLC, under the caption
On March 17, 2017, the Delaware court granted in part, and denied in part, the motion to stay the
Diep action. The court denied
On May 21, 2021, while the SLC’s motion to dismiss the Diep action was pending, the Company filed a notice of proposed partial settlement of the Diep action with respect to defendants Kay Bogeajis, Laurance Roberts, Stephen J. Sather, Edward J. Valle, Douglas K. Ammerman, and Samuel N. Borgese (collectively, the “Settling Defendants”). Defendant Trimaran Pollo Partners, LLC (“Trimaran”) was not a party to the settlement. The court approved the settlement of $625,000, less Plaintiffs’ fees of $156,250, on September 10, 2021, and dismissed all claims brought, or that could have been brought, against Settling Defendants. In connection with this settlement, the Company received $469,000 in insurance proceeds, which was recorded within general and administrative expenses in the Company’s statement of income for the year ended December 29, 2021.
On July 30, 2021, the court granted the SLC’s motion to dismiss with respect to the claims asserted against remaining defendant Trimaran. On October 4, 2021, Plaintiffs filed a notice of appeal of the court’s granting of the motion to dismiss against defendant Trimaran. Plaintiff filed its opening brief on December 6, 2021. SLC filed its answering brief on December 20, 2021 and the public version of the brief was filed on January 7, 2022. Plaintiffs filed the reply brief on January 4, 2022. The hearing on the appeal took place on March 30, 2022. On June 28, 2022, the court’s granting of the motion to dismiss against Trimaran was affirmed.
Janice P. Handlers-Bryman and Michael D. Bryman v. El Pollo Loco, Inc.
, Los Angeles Superior Court (Case No. MC026045) (the “Lancaster Lawsuit”) was filed on February 9, 2016. Existing El Pollo Loco franchisees, Janice P. Handlers-Bryman and Michael D. Bryman, as individuals and in their capacities as trustees of83