UNITED STATES
SECURITIES AND EXCHANGE COMMISSION
Washington, D.C. 20549
FORM 10-K
|
| | | | |
x☒ | Annual report pursuant to section 13 or 15(d) of the Securities Exchange Act of 1934. For the fiscal year ended April 29, 2016.2022. |
| |
o☐ | Transition report pursuant to Section 13 or 15(d) of the Securities Exchange Act of 1934.
For the transition period from __________ to __________
|
Commission File No. 1-36820
 ®
®MEDTRONIC PUBLIC LIMITED COMPANYMedtronic plc
(Exact name of registrant as specified in its charter)
|
| | | | | | | |
| Ireland | | 98-1183488 |
(JurisdictionState or other jurisdiction of incorporation)incorporation or organization) | | (I.R.S. Employer Identification No.) |
20 On Hatch, Lower Hatch Street
Dublin 2, Ireland
(Address of principal executive office)offices)
+353 1 438-1700
(Registrant's telephone number)number, including area code)
Securities registered pursuant to Section 12(b) of the Act:
|
| | | | | | | |
| Title of each class | Trading Symbol | Name of each exchange on which registered |
| Ordinary shares, par value $0.0001 per share | MDT | New York Stock Exchange Inc. |
| 0.00% Senior Notes due 2022 | MDT/22B | New York Stock Exchange |
| 0.375% Senior Notes due 2023 | MDT/23B | New York Stock Exchange |
| 0.000% Senior Notes due 2023 | MDT/23C | New York Stock Exchange |
| 0.25% Senior Notes due 2025 | MDT/25 | New York Stock Exchange |
| 0.000% Senior Notes due 2025 | MDT/25A | New York Stock Exchange |
| 1.125% Senior Notes due 2027 | MDT/27 | New York Stock Exchange |
| 0.375% Senior Notes due 2028 | MDT/28 | New York Stock Exchange |
| 1.625% Senior Notes due 2031 | MDT/31 | New York Stock Exchange |
| 1.00% Senior Notes due 2031 | MDT/31A | New York Stock Exchange |
| 0.750% Senior Notes due 2032 | MDT/32 | New York Stock Exchange |
| 2.250% Senior Notes due 2039 | MDT/39A | New York Stock Exchange |
| 1.50% Senior Notes due 2039 | MDT/39B | New York Stock Exchange |
| 1.375% Senior Notes due 2040 | MDT/40A | New York Stock Exchange |
| 1.75% Senior Notes due 2049 | MDT/49 | New York Stock Exchange |
| 1.625% Senior Notes due 2050 | MDT/50 | New York Stock Exchange |
Securities registered pursuant to section 12(g) of the Act:
None
Indicate by check mark if the registrant is a well-known seasoned issuer, as defined in Rule 405 of the Securities Act. Yes x ☒ No o☐
Indicate by check mark if the registrant is not required to file reports pursuant to Section 13 or 15(d) of the Exchange Act. Yes o☐ No x☒
Indicate by check mark whether the registrant (1) has filed all reports required to be filed by Section 13 or 15(d) of the Securities Exchange Act of 1934 during the preceding 12 months (or for such shorter period that the registrant was required to file such reports), and (2) has been subject to such filing requirements for the past 90 days. Yes x☒ No o☐
Indicate by check mark whether the registrant has submitted electronically and posted on its corporate Website, if any, every Interactive Data File required to be submitted and posted pursuant to Rule 405 of Regulation S-T (§229.405 of this chapter) during the preceding 12 months (or for such shorter period that the registrant was required to submit and post such files). Yes x☒ No o
Indicate by check mark if disclosure of delinquent filers pursuant to Item 405 of Regulation S-K is not contained herein, and will not be contained, to the best of the registrant’s knowledge, in definitive proxy or information statements incorporated by reference in Part III of this Form 10-K or any amendment to this Form 10-K.o☐
Indicate by check mark whether the registrant is a large accelerated filer, an accelerated filer, a non-accelerated filer, or a smaller reporting company, or an emerging growth company. See definition of “large accelerated filer,” “accelerated filer” andfiler,” “smaller reporting company”company,” and "emerging growth company" in Rule 12b-2 of the Exchange Act.
Large accelerated filer x☒ Accelerated filer o☐ Non-accelerated filer o☐ Smaller reporting companyo☐ Emerging growth company☐
If an emerging growth company, indicate by check mark if the registrant has elected not to use the extended transition period for complying with any new or revised financial accounting standards provided pursuant to Section 13(a) of the Exchange Act. ☐
Indicate by check mark whether the registrant has filed a report on and attestation to its management’s assessment of the effectiveness of its internal control over financial reporting under Section 404(b) of the Sarbanes-Oxley Act (15 U.S.C. 7262(b)) by the registered public accounting firm that prepared or issued its audit report. Yes ☒ No ☐
Indicate by check mark whether the registrant is a shell company (as defined in Rule 12b-2 of the Exchange Act). Yes o☐ No x☒
Aggregate market value of voting and non-voting common equity of Medtronic PLCplc held by non-affiliates of the registrant as of October 30, 2015,29, 2021, based on the closing price of $73.92,$119.86 as reported on the New York Stock Exchange: approximately $104.2$161.2 billion. Number of Ordinary Shares outstanding on June 20, 2016: 1,394,731,8922022: 1,328,709,310
DOCUMENTS INCORPORATED BY REFERENCE
Portions of Registrant’sthe registrant’s Proxy Statement for its 20162022 Annual General Meeting are incorporated by reference into Part III hereto.
CAUTIONARY NOTE REGARDING FORWARD-LOOKING STATEMENTS
Investor Information
This Annual MeetingReport on Form 10-K, and Record Dates
other written reports of Medtronic Public Limited Company,plc, organized under the laws of Ireland (Medtronic plc,(together with its consolidated subsidiaries, Medtronic, the Company, or we, us, or our) will hold its 2016, and oral statements made by or with the approval of one of the Company’s executive officers from time to time, may include “forward-looking” statements. All statements other than statements of historical fact contained in this Annual General Meeting of Shareholders (2016 Annual Meeting) on Friday, December 9, 2016 at 8:00 a.m., local Dublin time at the Conrad Dublin Hotel Earlsfort Terrace Dublin 2, Ireland. The record date for the 2016 Annual Meeting is October 11, 2016 and all shareholders of record at the close of business on that day will be entitled to vote at the 2016 Annual Meeting.
Medtronic Website
Our Annual ReportsReport on Form 10-K, Quarterly Reportsincluding statements regarding our future results of operations and financial position, business strategy and plans, objectives of management for future operations and current expectations or forecasts of future results, are forward-looking statements. These statements involve known and unknown risks, uncertainties, and other important factors that may cause our actual results, performance, or achievements to be materially different from any future results, performance, or achievements expressed or implied by the forward-looking statements. Our forward-looking statements may include statements related to our growth and growth strategies, developments in the markets for our products, therapies and services, financial results, product development launches and effectiveness, research and development strategy, regulatory approvals, competitive strengths, the potential or anticipated direct or indirect impact of COVID-19 ("COVID-19" or the "pandemic") on our business, results of operations and/or financial condition, restructuring and cost-saving initiatives, intellectual property rights, litigation and tax matters, governmental proceedings and investigations, mergers and acquisitions, divestitures, market acceptance of our products, therapies and services, accounting estimates, financing activities, ongoing contractual obligations, working capital adequacy, value of our investments, our effective tax rate, our expected returns to shareholders, and sales efforts. In some cases, such statements may be identified by the use of terminology such as “anticipate,” “believe,” “could,” “estimate,” “expect,” “forecast,” “intend,” “looking ahead,” “may,” “plan,” “possible,” “potential,” “project,” “should,” “will,” and similar words or expressions. Forward-looking statements in this Annual Report include, but are not limited to, statements regarding: our ability to drive long-term shareholder value; development and future launches of products and continued or future acceptance of products, therapies and services in our segments; expected timing for completion of research studies relating to our products; market positioning and performance of our products, including stabilization of certain product markets; divestitures and the potential benefits thereof; the costs and benefits of integrating previous acquisitions; anticipated timing for United States (U.S.) Food and Drug Administration (U.S. FDA) and non-U.S. regulatory approval of new products; increased presence in new markets, including markets outside the U.S.; changes in the market and our market share; acquisitions and investment initiatives, including the timing of regulatory approvals as well as integration of acquired companies into our operations; the resolution of tax matters; the effectiveness of our development activities in reducing patient care costs and hospital stay lengths; our approach towards cost containment; our expectations regarding healthcare costs, including potential changes to reimbursement policies and pricing pressures; our expectations regarding changes to patient standards of care; our ability to identify and maintain successful business partnerships; the elimination of certain positions or costs related to restructuring initiatives; outcomes in our litigation matters and governmental proceedings and investigations; general economic conditions; the adequacy of available working capital and our working capital needs; our payment of dividends and redemption of shares; the continued strength of our balance sheet and liquidity; our accounts receivable exposure; and the potential impact of our compliance with governmental regulations and accounting guidance.
We have based these forward-looking statements largely on our current expectations and projections about future events and financial trends that we believe may affect our business, results of operations, financial condition, and cash flows. These forward-looking statements speak only as of the date of this Annual Report on Form 10-Q, Current Reports10-K and are subject to a number of risks, uncertainties and assumptions described in the “Risk Factors” section and elsewhere in this Annual Report on Form 8-K,10-K. Because forward-looking statements are inherently subject to risks and amendmentsuncertainties, some of which cannot be predicted or quantified, you should not rely on these forward-looking statements as predictions of future events. One must carefully consider forward-looking statements and understand that such forward-looking statements are inherently subject to risks and uncertainties, some of which cannot be predicted or quantified, and involve a variety of risks and uncertainties, known and unknown, including, among others, those reports filed or furnished pursuant to Section 13(a) or 15(d)discussed in the sections entitled “Government Regulation” within “Item 1. Business” and “Item 1A. Risk Factors” in this Annual Report on Form 10-K, as well as those related to:
•competition in the medical device industry;
•delays in regulatory approvals;
•the global COVID-19 pandemic, including new COVID-19 variants that may emerge, as well as potential impacts of the pandemic on healthcare staffing levels;
•reduction or interruption in our supply;
•failure to complete or achieve the intended benefits of acquisitions or divestitures;
•adverse regulatory action;
•laws and governmental regulations;
•litigation results;
•quality problems;
•healthcare policy changes;
•cybersecurity incidents;
•international operations, including the impact of armed conflicts;
•self-insurance;
•commercial insurance;
•changes in applicable tax rates;
•positions taken by taxing authorities;
•decreasing selling prices and pricing pressure;
•liquidity shortfalls;
•fluctuations in currency exchange rates;
•inflation; or
•disruption of our current plans and operations.
Consequently, no forward-looking statement may be guaranteed, and actual results may vary materially from those projected in the forward-looking statements. We intend to take advantage of the Safe Harbor provisions of the Private Securities ExchangeLitigation Reform Act of 1934,1995 regarding our forward-looking statements and are including this sentence for the express purpose of enabling us to use the protections of the safe harbor with respect to all forward-looking statements. While we may elect to update these forward-looking statements at some point in the future, whether as amended (Exchange Act) are available through our website (www.medtronic.com under the "About Medtronic - Investors" caption and “Financial Information - SEC Filings” subcaption) freea result of charge as soon as reasonably practicable afterany new information, future events, or otherwise, we electronically file such material with, or furnish ithave no current intention of doing so except to the Securitiesextent required by applicable law.
PART I
Item 1. Business
Medtronic plc, headquartered in Dublin, Ireland, is the leading global healthcare technology company. Medtronic was founded in 1949 and Exchange Commission (SEC).today serves healthcare systems, physicians, clinicians, and patients in more than 150 countries worldwide. We remain committed to a mission written by our founder in 1960 that directs us “to contribute to human welfare by the application of biomedical engineering in the research, design, manufacture, and sale of products to alleviate pain, restore health, and extend life.”
InformationOur Mission — to alleviate pain, restore health, and extend life — empowers insight-driven care and better outcomes for our world. We remain committed to being recognized as a company of dedication, honesty, integrity, and service. Building on this strong foundation, we are embracing our role as a healthcare technology leader and evolving our business strategy in four key areas:
•Leveraging our pipeline to win market share: The combination of our good end markets, recent product launches and robust pipeline is expected to continue accelerating our growth over both the near-and long-term. We aim to bring inventive and disruptive technology to large healthcare opportunities which enables us to better meet patient needs. Patients around the world deserve access to our life-saving products, and we are driven to use our local presence and scale to increase the adoption of our products and services in markets around the globe.
•Serving more patients by accelerating innovation driven growth and delivering shareholder value: We listen to our patients and customers to better understand the challenges they face. From the patient journey, to creating agile partnerships that produce novel solutions, to making it easier for our customers to deploy our therapies — everything we do is anchored in deep insight, and creates simpler, superior experiences.
•Creating and disrupting markets with our technology: We are confident in our ability to maximize new technology, artificial intelligence (AI), and data and analytics to tailor therapies in real-time, facilitating remote monitoring and care delivery that conveniently manages conditions, and creates new standards of care.
•Empowering our operating units to be more nimble and more competitive: Our operating model, which was effective February 2021, simplified our organization to accelerate decision making, improve commercial execution, and more effectively leverage the scale of our company.
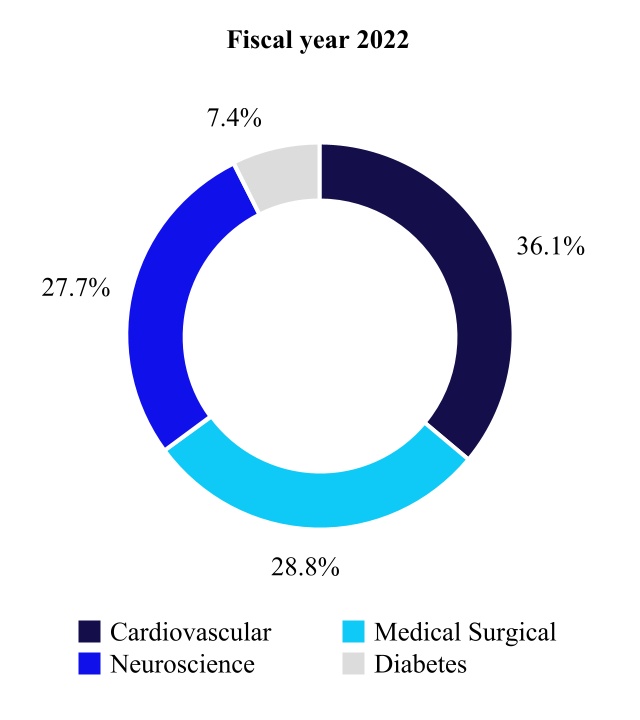
We have four operating and reportable segments that primarily develop, manufacture, distribute, and sell device-based medical therapies and services: the Cardiovascular Portfolio, the Medical Surgical Portfolio, the Neuroscience Portfolio, and the Diabetes Operating Unit. For more information regarding our segments, please see Note 19 to the consolidated financial statements in "Item 8. Financial Statements and Supplementary Data" in this Annual Report on Form 10-K.
CARDIOVASCULAR PORTFOLIO
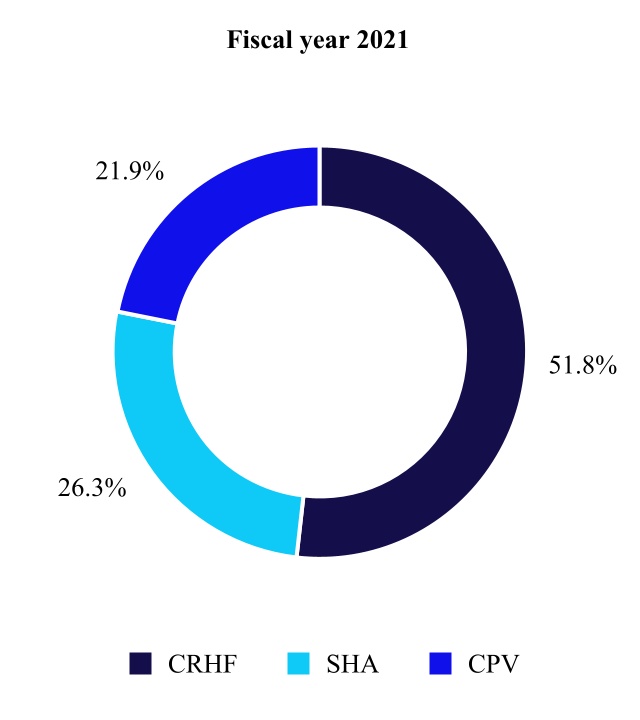
The Cardiovascular Portfolio is made up of the Cardiac Rhythm & Heart Failure, Structural Heart & Aortic, and Coronary & Peripheral Vascular divisions. The primary medical specialists who use our Cardiovascular products include electrophysiologists, implanting cardiologists, heart failure specialists, cardiovascular, cardiothoracic, and vascular surgeons, and interventional cardiologists and radiologists.
Cardiac Rhythm & Heart Failure
Our Cardiac Rhythm & Heart Failure division includes the following Operating Units: Cardiac Rhythm Management; Cardiac Ablation Solutions; and Cardiovascular Diagnostics and Services. Thedivision develops, manufactures, and markets products for the diagnosis, treatment, and management of heart rhythm disorders and heart failure. Our products include implantable devices, leads and delivery systems, products for the treatment of atrial fibrillation (AF), products designed to reduce surgical site infections, information systems for the management of patients with Cardiac Rhythm & Heart Failure devices, and an integrated health solutions business. Principal products and services offered include:
•Implantable cardiac pacemakers including the Azure MRI SureScan, Adapta, Advisa MRI SureScan, and the Micra Transcatheter Pacing System. The Micra Transcatheter Pacing System, which is leadless and does not have a subcutaneous device pocket like a conventional pacemaker, includes the Micra VR device and the Micra AV device. Both of these pacemakers treats patients with atrioventricular block.
•Implantable cardioverter defibrillators (ICDs), including the Visia AF MRI SureScan, Evera MRI SureScan, Primo MRI, and the Cobalt and Crome portfolio of BlueSync-enabled ICDs, as well as defibrillator leads, including the Sprint Quattro Secure lead.
•Implantable cardiac resynchronization therapy devices (CRT-Ds and CRT-Ps) including the Claria/Amplia/Compia family of MRI Quad CRT-D SureScan systems and the Cobalt and Crome portfolio of BlueSync-enabled CRT-Ds, as well as the Percepta/Serena/Solara family of MRI Quad CRT-P SureScan systems.
•Cardiac ablation products including the Arctic Front Advanced Cardiac cryoablation System, designed for pulmonary vein isolation in the treatment of patients with paroxysmal and persistent AF, as well as the DiamondTemp Ablation system, which is the first U.S. FDA-approved, temperature controlled, irrigated radiofrequency ablation system.
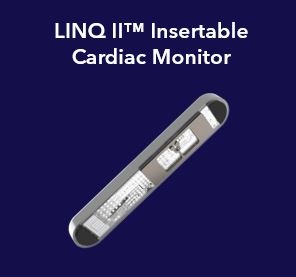
•Insertable cardiac monitoring systems, including the Reveal LINQ and LINQ II. These devices are for patients who experience infrequent symptoms such as dizziness, palpitation, syncope (fainting) and chest pain, which may indicate a cardiac arrhythmia that requires long-term monitoring or ongoing management. The LINQ II device offers improved device longevity, unmatched accuracy and a streamlined workflow with AccuRhythm AI algorithms to reduce clinic workload and data burden.
•TYRX products, including the Cardiac and Neuro Absorbable Antibacterial Envelopes, which are designed to stabilize electronic implantable devices and help prevent infection associated with implantable pacemakers, and defibrillators.
•Remote monitoring services and patient-centered software to enable efficient care coordination and specialized telehealth nurse support as well as services related to hospital operational efficiency.
•Medtronic stopped the distribution and sale of the HVAD System on June 3, 2021. We continue a support program for patients with HVAD devices, and for caregivers and healthcare professionals who participate in their care.
Structural Heart & Aortic
Our Structural Heart & Aortic division includes the following Operating Units: Structural Heart & Aortic and Cardiac Surgery. The division includes therapies to treat heart valve disorders and aortic disease. Our devices include products for the repair and replacement of heart valves, perfusion systems, positioning and stabilization systems for beating heart revascularization surgery, surgical ablation products, and comprehensive line of products and therapies to treat aortic disease, such as aneurysms, dissections, and transections. Principal products offered include:
•CoreValve family of aortic valves, including the Evolut R, Evolut PRO, and Evolut PRO+ systems for transcatheter aortic valve replacement.
•Surgical valve replacement and repair products for damaged or diseased heart valves, including both tissue and mechanical valves; blood-handling products that form a circulatory support system to maintain and monitor blood circulation and coagulation status, oxygen supply, and body temperature during arrested heart surgery; and surgical ablation systems and positioning and stabilization technologies.
•Endovascular stent grafts and accessories, including the Endurant II Stent Graft System for the treatment of abdominal aortic aneurysms, the Valiant Captivia Thoracic Stent Graft System for thoracic endovascular aortic repair procedures, and the Heli-FX EndoAnchor System.
•Transcatheter Pulmonary Valves, including Harmony TPV and Delivery Catheter System and Melody TPV/Ensemble II Delivery System.
Coronary & Peripheral Vascular
Our Coronary & Peripheral Vascular division includes the following Operating Units: Coronary & Renal Denervation and Peripheral Vascular Health. The division is comprised of a comprehensive line of products and therapies to treat coronary artery disease as well as peripheral vascular disease and venous disease. Our products include coronary stents and related delivery systems, including a broad line of balloon angioplasty catheters, guide catheters, guide wires, diagnostic catheters, and accessories, peripheral drug coated balloons, stent and angioplasty systems, carotid embolic protection systems for the treatment of vascular disease outside the heart, and products for superficial and deep venous disease. Principal products offered include:
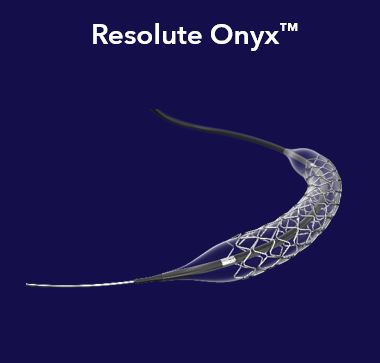
•Percutaneous Coronary Intervention products including our Resolute Onyx drug-eluting stent, Euphora balloons, and Launcher guide catheters.
•Percutaneous angioplasty balloons including the IN.PACT family of drug-coated balloons, vascular stents including the Abre venous stent, directional atherectomy products including the HawkOne directional atherectomy system, and other procedure support tools.
•Products to treat superficial venous diseases in the lower extremities including the ClosureFast radiofrequency ablation system and the VenaSeal Closure System.
MEDICAL SURGICAL PORTFOLIO
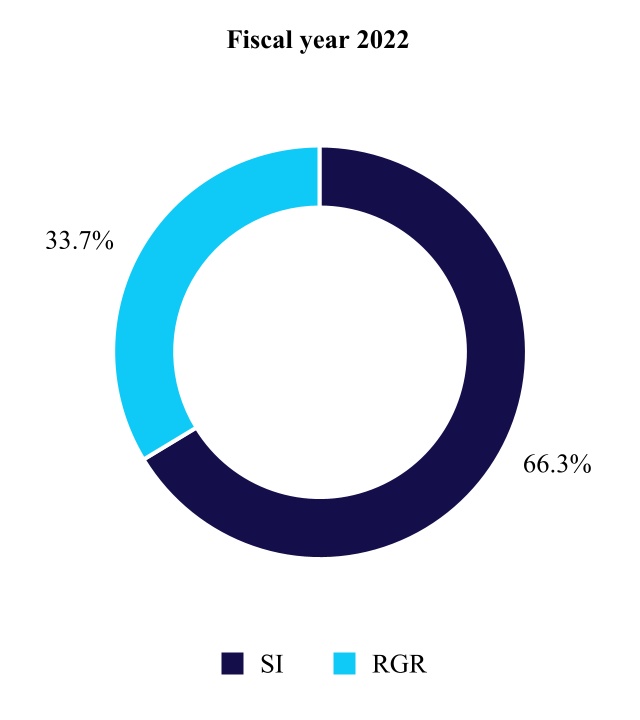
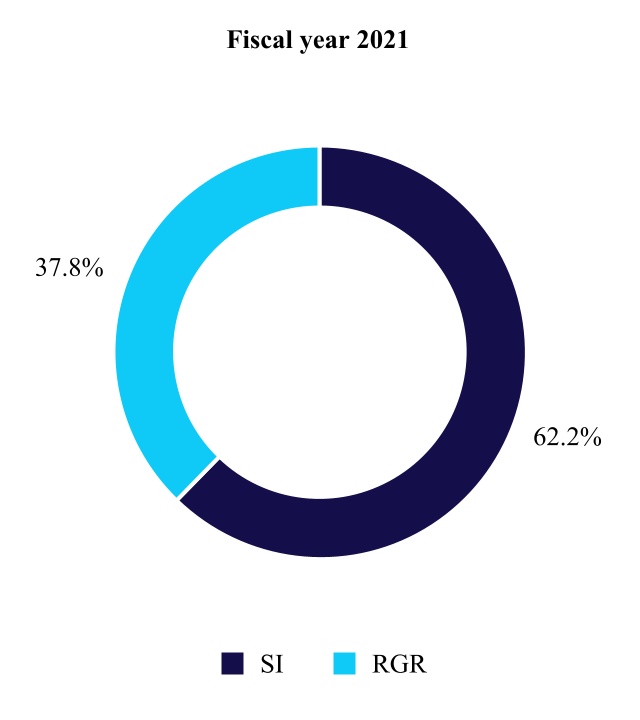
The Medical Surgical Portfolio is made up of the Surgical Innovations and Respiratory, Gastrointestinal, & Renal divisions. Products and therapies of this group are used primarily by healthcare systems, physicians' offices, ambulatory care centers, and other alternate site healthcare providers. While less frequent, some products and therapies are also used in home settings.
Surgical Innovations
Our Surgical Innovations division includes the following Operating Units: Surgical Innovations and Surgical Robotics. The division develops, manufactures, and markets advanced and general surgical products, including surgical stapling devices, vessel sealing instruments, wound closure, electrosurgery products, surgical artificial intelligence (AI) and robotic-assisted surgery products, hernia mechanical devices, mesh implants, gynecology products, lung health and visualization, and therapies to treat diseases and conditions that are typically, but not exclusively, addressed by surgeons. Principal products and services offered include:
•Advanced stapling and energy products, including the Tri-Staple technology platform for endoscopic stapling, including the Endo GIA reloads and reinforced reloads with Tri-Staple Technology and the Endo GIA ultra universal stapler; the Signia Powered Stapling System; the LigaSure Exact Dissector and L-Hook Laparoscopic Sealer/Divider; and the Sonicision curved jaw cordless ultrasonic dissection system.
•Electrosurgical hardware and instruments, including the Valleylab FT10 energy platform, and the Force TriVerse electrosurgical pencils.
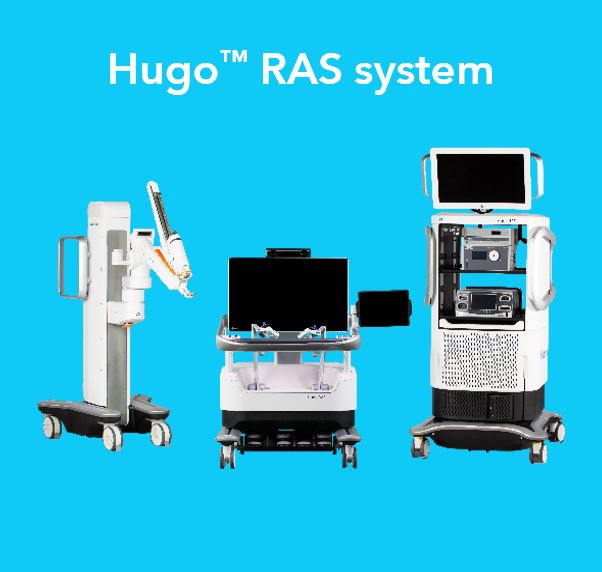
•Robotic and digital surgery technologies including, the Hugo robotic-assisted surgery (RAS) system designed for a broad range of soft-tissue procedures and Touch Surgery Enterprise, the first AI-powered surgical video management solution for the operating room.
•Products designed for the treatment of hernias, including the AbsorbaTack absorbable mesh fixation device for hernia repair, the Symbotex composite mesh for surgical laparoscopic and open ventral hernia repair, and Parietex ProGrip, a self-gripping, biocompatible solution for inguinal hernias.
Respiratory, Gastrointestinal, & Renal
Our Respiratory, Gastrointestinal, & Renal division includes the following Operating Units: Respiratory Interventions, Patient Monitoring, Gastrointestinal, and Renal Care Solutions. The division develops, manufactures, and markets products in the emerging fields of minimally invasive gastrointestinal and hepatologic diagnostics and therapies, patient monitoring, respiratory interventions including airway management and ventilation therapies, and for the treatment of renal disease. Principal products and services offered include:
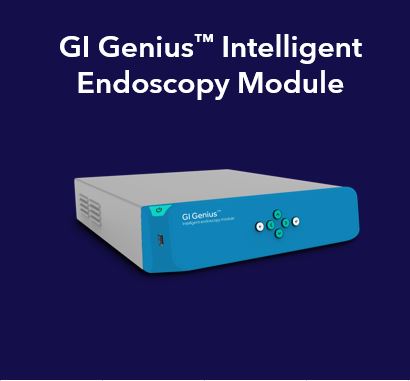
•Gastrointestinal and endoscopy products, including the PillCam capsule endoscopy systems, the Bravo calibration-free reflux testing systems, the EndoFLIP imaging systems, the Emprint ablation system with Thermosphere Technology, the ManoScan Bravo system, the Barrx platform through ablation with the Barrx 360 Express catheter, the GI Genius intelligent endoscopy module, the Cool-tip radiofrequency ablation system, and the HET Bipolar System.
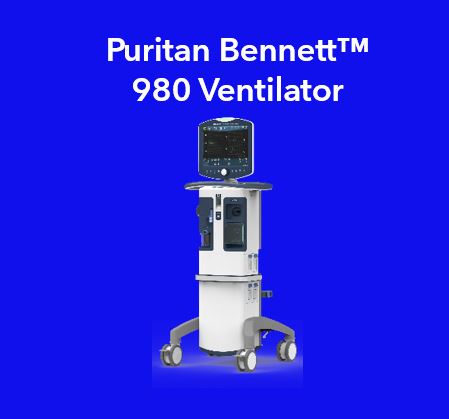
•Airway, ventilation, and inhalation therapies products, including the Puritan Bennett 980 and 840 ventilators, the Newport e360 and HT70 ventilators, the TaperGuard Evac tube, Shiley Endotracheal Tubes, Shiley Tracheostomy Tubes, McGRATH MAC video laryngoscopes, and DAR Filters.
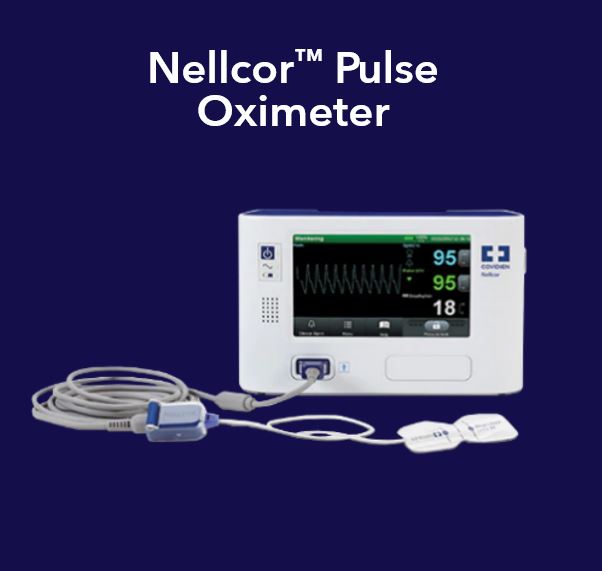
•Products focused on patient monitoring, including Nellcor pulse oximetry monitors and sensors, Microstream capnography monitors, Bispectral Index (BIS) brain monitoring technology, INVOS cerebral/somatic oximetry systems, Vital Sync remote monitoring, and WarmTouch convective warming.
•Products providing solutions for the treatment of renal disease, including Palindrome, Mahurkar and Mahurkar Elite Dialysis Access Catheters for renal therapy, Argyle peritoneal dialysis catheters, Carpediem dialysis machines for pediatric patients,
Amplya dialysis machines for acute patients, and other products designed for use in treatment of both acute and chronic renal failure conditions.
NEUROSCIENCE PORTFOLIO
The Neuroscience Portfolio is made up of the Cranial & Spinal Technologies, Specialty Therapies, and Neuromodulation divisions. The primary medical specialists who use the products of this group include spinal surgeons, neurosurgeons, neurologists, pain management specialists, anesthesiologists, orthopedic surgeons, urologists, urogynecologists, interventional radiologists, and ear, nose, and throat specialists.
Cranial & Spinal Technologies
Our Cranial & Spinal Technologies division and Operating Unit develops, manufactures, and markets an integrated portfolio of devices and therapies for surgical technologies designed to improve the precision and workflow of neuro procedures, and a comprehensive line of medical devices and implants used in the treatment of the spine and musculoskeletal system. The division also provides biologic solutions for the orthopedic and dental markets and offers unique and highly differentiated imaging, navigation, power instruments, nerve monitoring, and robotic guidance systems used in spine and cranial procedures. Principal products and services offered include:
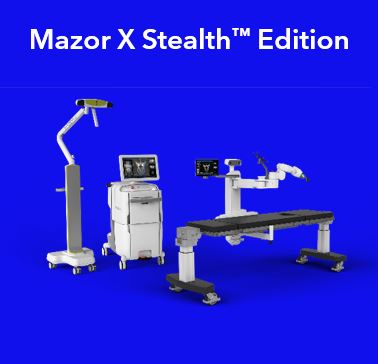
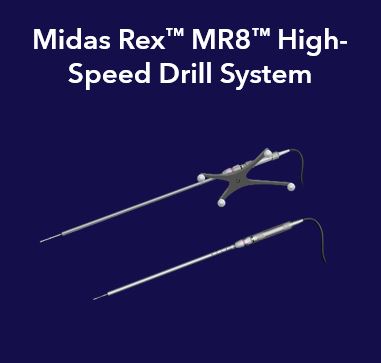
•Neurosurgery products, including platform technologies, implant therapies, and advanced energy products. This includes our StealthStation S8 Navigation System, Stealth Autoguide cranial robotic guidance platform, O-arm Imaging System, Mazor X robotic guidance systems used in robot-assisted spine procedures, and our Midas Rex Surgical Drills, including our MR8 high-speed drill system. This group of products also includes our cerebrospinal fluid (CSF) Management Portfolio, Visualase MRI-guided laser ablation, Aquamantys Sealers, and our PEAK Surgery System used in tissue dissection that consists of the PEAK PlasmaBlade and PULSAR Generator.
•Products to treat a variety of conditions affecting the spine, including degenerative disc disease, spinal deformity, spinal tumors, fractures of the spine, and stenosis. These products include our CD HORIZON SOLERA system, T2 STRATOSPHERE, and CLYDESDALE interbody spacers. These products also include titanium interbody implants and surface technologies, such as our Adaptix interbody system and the Titan Interbody Fusion Device with NanoLOCK technology.
•Products that facilitate less invasive thoracolumbar surgeries, including the CD HORIZON SOLERA VOYAGER Percutaneous Fixation System.
•Products to treat conditions in the cervical region of the spine, including the ZEVO Anterior Cervical Plate System, the INFINITY OCT System, and PRESTIGE LP Cervical Artificial Discs.
•Biologic solutions products, including our INFUSE Bone Graft (InductOs in the European Union (E.U.)), which contains a recombinant human bone morphogenetic protein, rhBMP-2, for certain spinal, trauma, and oral maxillofacial applications.
•Demineralized Bone Matrix products, including MAGNIFUSE, GRAFTON/GRAFTON PLUS, and the MASTERGRAFT family of synthetic bone graft products – Matrix, Putty, and Granules.
Specialty Therapies
Our Specialty Therapies division includes the following Operating Units: Neurovascular; Ear, Nose, and Throat (ENT); and Pelvic Health. The division develops, manufactures, and markets products and therapies to treat diseases of ENT, patients afflicted with acute ischemic and hemorrhagic stroke, and help control the systems of overactive bladder, (non-obstructive) urinary retention, and chronic fecal incontinence. Principal products and services offered include:
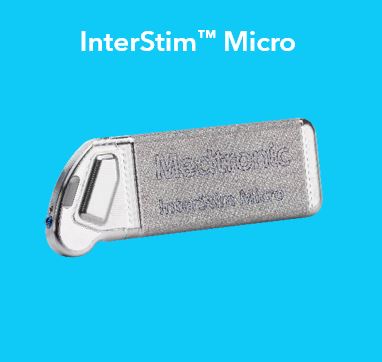
•Pelvic health products, including our InterStim X, InterStim Micro, and InterStim II neurostimulators, and InterStim SureScan MRI leads, to help control the systems of overactive bladder, (non-obstructive) urinary retention, and chronic fecal incontinence. Our NURO System delivers Percutaneous Tibial Neuromodulation therapy to treat overactive bladder and associated symptoms of urinary urgency, urinary frequency, and urge incontinence.
•ENT products, including the Straightshot M5 Microdebrider Handpiece, the IPC system, NIM Nerve Monitoring Systems, FUSION Compact and StealthStation ENT Navigation System, as well as products for hearing restoration and obstructive sleep apnea.
•Neurovascular products to treat diseases of the vasculature in and around the brain. This includes coils, neurovascular stent retrievers, and flow diversion products, as well as access and delivery products to support procedures. Products also include the Pipeline Flex Embolization Devices, endovascular treatments for large or giant wide-necked brain aneurysms, the portfolio of Solitaire revascularization devices for treatment of acute ischemic stroke, the Riptide Aspiration System, the Onyx Liquid Embolic System, and a portfolio of associated access catheters including our React aspiration catheters also for the treatment of acute ischemic stroke.
Neuromodulation
Our Neuromodulation division and Operating Unit develops, manufactures, and markets spinal cord stimulation systems, implantable drug infusion systems for chronic pain, as well as interventional products. Principal products and services offered include:
•Spinal cord stimulation products, including rechargeable and non-rechargeable devices and a large selection of leads used to treat chronic back and/or limb pain and chronic pain resulting from diabetic peripheral neuropathy. This includes the Intellis Spinal Cord Stimulation System, with AdaptiveStim and SureScan MRI Technology, DTM (differential target multiplexed) proprietary waveform, the Evolve workflow algorithm, and Snapshot reporting. Products also include our RestoreSensor (rechargeable) SureScan MRI neurostimulation system with its proprietary AdaptiveStim technology.
•Brain modulation products, including those for the treatment of the disabling symptoms of Parkinson's disease, essential tremor, refractory epilepsy, severe, treatment-resistant obsessive-compulsive disorder (approved under a Humanitarian Device Exemption (HDE) in the U.S.), and chronic, intractable primary dystonia (approved under a HDE in the U.S.). Specifically, this includes our family of Activa Neurostimulators, including Activa SC (single-channel primary cell battery), Activa PC (dual channel primary cell battery), and Activa RC (dual channel rechargeable battery). This also includes our Percept PC Neurostimulator DBS system with BrainSense technology.
•Implantable drug infusion systems, including our SynchroMed II Implantable Infusion System, that deliver small quantities of drug directly into the intrathecal space surrounding the spinal cord.
•Interventional products, including the Kyphon Balloon, the Kyphon V, and Kyphon Assist systems and the OsteoCool RF Tumor ablation system.
•The Accurian nerve ablation system, which conducts radio frequency ablation of nerve tissues.
DIABETES OPERATING UNIT
The Diabetes Operating Unit develops, manufactures, and markets products and services for the management of Type 1 and Type 2 diabetes. The primary medical specialists who use and/or prescribe our Diabetes products are endocrinologists and primary care physicians.
Principal products and services offered include:
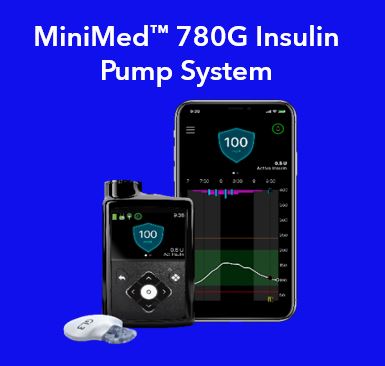
•Insulin pumps and consumables, including the MiniMed 770G system and MiniMed 780G system, which are all powered by SmartGuard technology. The MiniMed 770G system provides smartphone and Bluetooth connectivity, continuously delivers background insulin, monitors sugar levels, and an expanded age indication to ages two and up. The MiniMed 780G enhances the insulin pump systems by including automatic correction boluses and an adjustable glucose target down to 100 mg/dl.
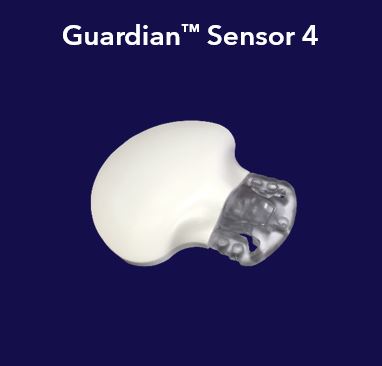
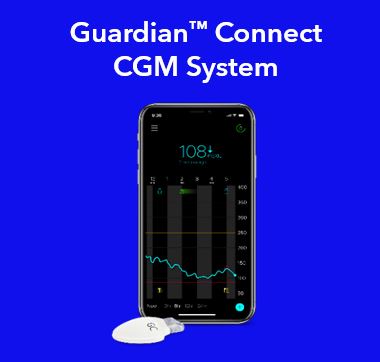
•Continuous glucose monitoring (CGM) systems and sensors, including the Guardian Connect smart CGM system, the Guardian Sensor 3, and the Guardian Sensor 4, are products worn by patients capturing glucose data to reveal patterns and potential problems, such as hyperglycemic and hypoglycemic episodes.
•The InPen smart insulin pen system that combines a reusable Bluetooth-enabled insulin pen with an intuitive mobile app that helps users administer the appropriate insulin dose. The InPen application integrates with our CGM data to provide real-time CGM readings alongside insulin dose information.
•Consumables and supplies, including infusion sets.
HUMAN CAPITAL
Medtronic Workforce Overview
Medtronic’s employees deliver on our Mission every day. We empower insight-driven care, experiences that put people first, and better outcomes for our world. In everything we do, we are engineering the extraordinary. We strive to be the employer of choice for the best and brightest global talent, where employees can grow and develop fulfilling careers. We aspire to create a truly inclusive, diverse, and equitable workplace that fosters innovation and creativity, and where every employee feels a sense of belonging and well-being. Medtronic has 95,000+ full-time employees, of which forty-four percent are based in the U.S. or Puerto Rico.
Inclusion, Diversity & Equity
We believe that improving health for people from all walks of life depends on our ability to unleash the creative power of our diverse global employees. By breaking down barriers to Inclusion, Diversity and Equity (ID&E), we open doors for everyone, driving progress and prosperity around the world. As of the end of fiscal year 2022, 38 percent of our U.S. workforce is ethnically diverse; women comprise 50 percent of our global workforce; and 42 percent of our manager and above employees are women. Additionally, Medtronic employee resource groups (ERGs) are employee-led affinity groups that provide career development and networking opportunities for members and strengthen ties between employees of many different backgrounds, cultures, and interests. In fiscal year 2022, there were 12 ERGs and Diversity Networks across 75 countries with more than 34,000 members.
Pay Equity
For fiscal year 2022, in the United States we have achieved 100% pay equity for gender for the third consecutive year and 100% pay equity for ethnically diverse employees. Globally we have achieved 99% pay equity for gender. We are actively working to close any remaining pay gaps by continuing to expand the annual pay equity analyses for each country we operate in.
Workforce Compensation
Our compensation framework is designed to celebrate the value and contributions of our employees. We are committed to transparent communications on compensation. Our competitive approach to compensation reflects industry benchmarks and local market standards. Our programs include annual and long-term incentives that provide the means to share in the Company’s success. To attract the best leaders, we offer competitive benefits and cash and equity incentives. We reward high-performing employees with an ownership stake in the company through restricted stock, and all employees have the opportunity to purchase stock at a significant discount.
Learning & Development
The skills and dedication of our employees drive our business performance. Our comprehensive professional development programs empower our people to build rewarding careers and help us attract world-class talent. Our suite of professional development programs ensures that our employees, regardless of level, location, language or learning preferences, have access to opportunities to develop and grow. Our investment in employee development has contributed to more than 30 percent of our open roles being filled with internal employees.
In fiscal year 2022, we began our shift away from degree requirements to focus on skills-based certification for certain roles within Medtronic. Additionally, as members of the Multiple Pathways Initiative, we have used a skill – based approach to offering opportunities to expanded pools of external talent that have previously been held back due to lack of access to undergraduate education. Internally, employees can now participate through MAPS (Medtronic Advancement Pathways and Skill-building) in undergraduate courses from top-tier universities to enhance or obtain new skills, at no cost to the employee. Our change in approach has opened up opportunities for employees who have been otherwise restricted from career advancement due to degree requirements.
Employee Engagement and Culture
Through our organizational health survey, we gain valuable insight into the Medtronic employee experience and identify areas where we can improve in four key priority areas: 1) Employee Engagement, 2) Inclusion, 3) Innovation, and 4) Ethics. In our most recent survey ending in the fourth quarter of fiscal year 2022, more than 77 percent of our employees responded. Medtronic carefully reviews and implements actions based on employee feedback in order to partner and create an inclusive, innovative and supportive environment.
To enable our transformation to be the global healthcare technology leader, we introduced a reinvigorated and revived culture. The Medtronic Mindset builds on our core values of integrity, quality, inclusion and collaboration. It urges us to act boldly, compete to win, move with speed and decisiveness, foster belonging, and deliver results… the right way. Our renewed culture helps us meet the needs of our patients and customers, and ensures our Mission endures for many years to come.
Health & Safety
As a large, global employer, it is our responsibility to maintain a safe workplace and support the well-being of our employees. Throughout the COVID-19 pandemic, we have placed a high priority on employee health, providing comprehensive benefits, accommodations and resources to support our workforce through this challenging time. During fiscal year 2022, we offered on-site vaccinations to our employees, enabling a vaccination rate of nearly 90% for our U.S. and Puerto Rico – based workforce. To help limit exposure to the virus, we acted to ensure employees in business-critical functions who cannot work from home were protected, including those in research and development, quality, manufacturing, distribution, and sales. Personal protective equipment, increased sanitation, social distancing guidance, and facility updates (one-way hallways, cafeteria partitions and extra sinks) were provided to protect our employees.
Medtronic has a comprehensive approach to providing robust support for our employees and their families not only during the pandemic, but also in natural disasters, civil unrest and war, bereavement, and other challenging events. Along with other programs, the Medtronic Employee Assistance Program and the Medtronic Employee Emergency Assistance Fund have historically supported employees and their families when faced with difficult times by providing a variety of services such as mental health, safety, and financial resources and support at no cost. These programs have proven invaluable in navigating our employees through unique challenge, including in fiscal year 2022. The Medtronic Employee Emergency Assistance Fund is supported by donations from employees and the Medtronic Foundation, and over the last five years has provided over $6 million in grants to employees experiencing unexpected events creating a financial hardship.
For more information on Human Capital Management at Medtronic, please refer to our 2021 Integrated Performance Report(1) as well as Medtronic’s 2021 Global Inclusion, Diversity and Equity Report(1) available on our company website.
CORPORATE SUSTAINABILITY GOALS
We see possibilities to further increase our positive impact in the world. We have identified three focus areas for our environmental, social, and governance (ESG) efforts to drive measurable impact on issues including: protecting our planet, accelerating access to healthcare technology, and advancing ID&E. In early fiscal year 2022, we set new performance targets across the following areas: Patient Safety & Product Quality; Inclusion, Diversity & Equity; Climate Stewardship; Product Stewardship; and Access & Innovation. More information about our ESG focus areas, including progress we have made to date toward achieving them, is included in our Integrated Performance Report.(1)
(1)The contents of our Integrated Performance Report and our Global Inclusion, Diversity, and Equity Report are referenced for general information only and are not incorporated by reference in the Form 10-K.
OTHER FACTORS IMPACTING OUR OPERATIONS
COVID-19 Pandemic
The global COVID-19 pandemic, together with the preventative and precautionary measures taken by businesses, communities, and governments, has impacted, and may continue to impact significant aspects of our Company and business, including future procedural volumes, supply constraints, healthcare staffing, worker absenteeism with our customers, suppliers, and in our own operations and field teams, and resulting impacts on demand for our products and therapies. See “Item 1A. Risk Factors” in this Annual Report on Form 10-K.
Research and Development
The markets in which we participate are subject to rapid technological advances. Constant improvement of existing products and introduction of new products is necessary to maintain market leadership. Our research and development (R&D) efforts are directed toward maintaining or achieving technological leadership in each of the markets we serve to help ensure that patients using our devices and therapies receive the most advanced and effective treatment possible. We remain committed to developing technological enhancements and new indications for existing products, and less invasive and new technologies for new and emerging markets to address unmet patient needs. That commitment leads to our initiation and participation in hundreds of clinical trials each fiscal year as the demand for clinical and economic evidence remains high. Furthermore, our development activities are intended to help reduce patient care costs and the length of hospital stays in the future. We have not engaged in significant customer or government-sponsored research.
Our R&D activities include improving existing products and therapies, expanding their indications and applications for use, developing new therapies and procedures, and entering into arrangements with third parties to fund the development of certain technologies. We continue to focus on optimizing innovation, improving our R&D productivity, driving growth in emerging markets, generating clinical evidence, and assessing our R&D programs based on their ability to address unmet clinical needs, produce better patient outcomes, and create new standards of care.
Intellectual Property
We rely on a combination of patents, trademarks, tradenames, copyrights, trade secrets, and agreements (non-disclosure and non-competition agreements) to protect our business and proprietary technology. In addition, we have entered into exclusive and non-exclusive licenses relating to corporate governance at Medtronic, includinga wide array of third-party technologies. In the aggregate, these intellectual property assets and licenses are of material importance to our Principlesbusiness; however, we believe that no single intellectual property asset or license is material in relation to any segment of Corporate Governance, Codeour business or to our business as a whole.
We operate in an industry characterized by extensive patent litigation. Patent litigation may result in significant damage awards and injunctions that could prevent the manufacture and sale of Conduct (includingaffected products or result in significant royalty payments in order to continue selling the products. At any given time, we are involved as both a plaintiff and a defendant in a number of patent infringement actions, the outcomes of which may not be known for prolonged periods of time.
Sales and Distribution
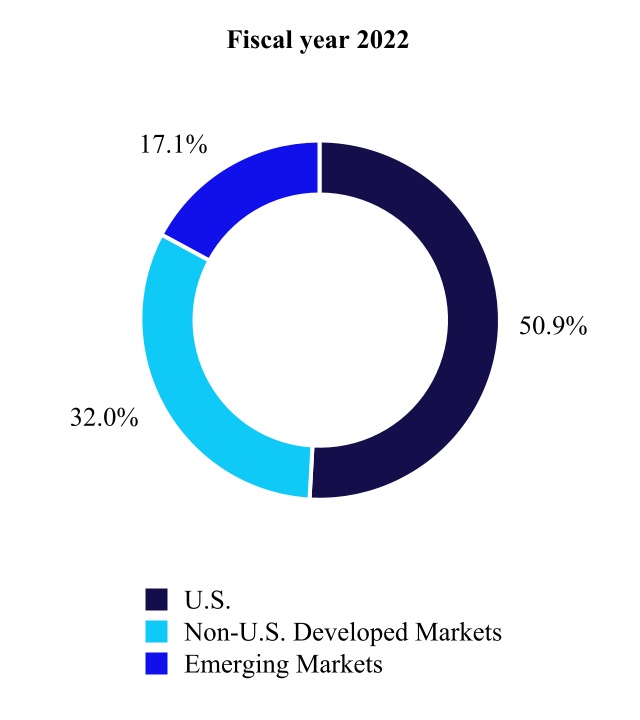
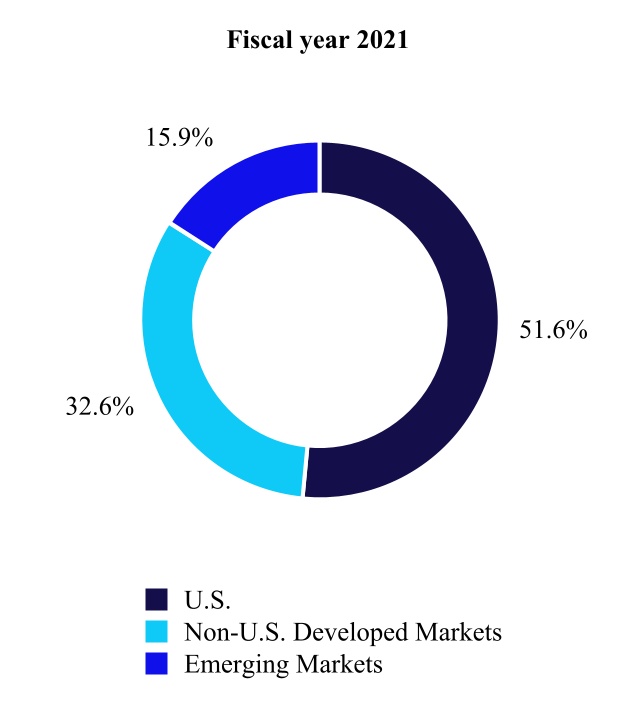
We sell our Codemedical devices and therapies through a combination of Ethics for Senior Financial Officers), Code of Business Conductdirect sales representatives and Ethics for Membersindependent distributors globally. Additionally, a portion of the BoardCompany's revenue is generated from consignment inventory maintained at hospitals. Our medical supply products are used primarily in hospitals, surgical centers, and alternate care facilities, such as home care and long-term care facilities, and are marketed to materials managers, group purchasing organizations (GPOs) and integrated delivery networks (IDNs). We often negotiate with GPOs and IDNs, which enter into supply contracts for the benefit of Directors,their member facilities. Our four largest markets are the U.S., Western Europe, China, and information concerningJapan. Emerging markets are an area of increasing focus and opportunity, as we believe they remain under-penetrated.
Our marketing and sales strategy is focused on rapid, cost-effective delivery of high-quality products to a diverse group of customers worldwide. To achieve this objective, our executive officers, directorsmarketing and Board committees (including committee charters) is available throughsales teams are organized around physician specialties. This focus enables us to develop highly knowledgeable and dedicated sales representatives who are able to foster strong relationships with physicians and other customers and enhance our website at www.medtronic.com under the "About Medtronic - Corporate Governance” caption. Information relatingability to transactions in Medtronic securities by directors and officers is available through our website at www.medtronic.com under the "About Medtronic - Investors" caption and the "Financial Information - SEC Filings" subcaption.
The information listed above may also be obtained upon request from the Medtronic Investor Relations Department, 710 Medtronic Parkway, Minneapolis (Fridley), MN 55432 USA.cross-sell complementary products.
We are not dependent on any single customer for more than 10 percent of our total net sales.
Competition, Industry, and Cost Containment
We compete in both the therapeutic and diagnostic medical markets in more than 150 countries throughout the world. These markets are characterized by rapid change resulting from technological advances and scientific discoveries. Our product lines face a mix of competitors ranging from large manufacturers with multiple business lines to small manufacturers offering a limited selection of products. In addition, we face competition from providers of other medical therapies, such as pharmaceutical companies.
Major shifts in industry market share have occurred in connection with product problems, physician advisories, safety alerts, results of clinical trials to support superiority claims, and publications about our products, reflecting the importance of product quality, product efficacy and quality systems in the medical device industry. In the current environment of managed care, economically motivated customers, consolidation among healthcare providers, increased competition, declining reimbursement rates, and national and provincial tender pricing, competitively priced product offerings are essential to our business. In order to continue to compete effectively, we must continue to create or acquire advanced technology, incorporate this technology into proprietary products, obtain regulatory approvals in a timely manner, maintain high-quality manufacturing processes, and successfully market these products.
Government and private sector initiatives to limit the growth of healthcare costs, including price regulation, competitive pricing, bidding and tender mechanics, coverage and payment policies, comparative effectiveness of therapies, technology assessments and managed-care arrangements, are continuing in many countries where we do business, including the U.S. These initiatives put increased emphasis on the delivery of more cost-effective medical devices and therapies. Government programs, including Medicare and Medicaid, private healthcare insurance and managed-care plans have attempted to control costs by limiting the amount of reimbursement they will pay for particular procedures or treatments, tying reimbursement to outcomes, shifting to population health management, and other mechanisms. Hospitals, which purchase our technology, are also seeking to reduce costs through a variety of mechanisms, including, for example, centralized purchasing, and in some cases, limiting the number of vendors that may participate in the purchasing program. Hospitals are also aligning interests with physicians through employment and other arrangements, such as gainsharing, where a hospital agrees with physicians to share any realized cost savings resulting from changes in practice patterns such as device standardization. This has created an increased level of price sensitivity among customers for our products.
Production and Availability of Raw Materials
We manufacture products at manufacturing facilities located in various countries throughout the world. We purchase many of the components and raw materials used in manufacturing our products from numerous suppliers in various countries. Certain components and raw materials are available only from a sole supplier. We work closely with our suppliers to help ensure continuity of supply while maintaining high quality and reliability. Generally, we have been able to obtain adequate supplies of such raw materials and components.
However, due to the U.S. FDA’s manufacturing requirements, we may not be able to quickly establish additional or replacement sources for certain components or materials if we experience a sudden or unexpected reduction or interruption in supply and are unable to develop alternative sources.
For additional information related to our manufacturing facilities refer to “Item 2. Properties” in this Annual Report on Form 10-K.
Government Regulation
Our operations and products are subject to extensive regulation by numerous government agencies, including the U.S. FDA, European regulatory authorities such as the Medicines and Healthcare Products Regulatory Agency in the United Kingdom Republic of Ireland and the Federal Institute for Drugs and Medical Devices in Germany, the China National Medical Product Administration (NMPA), and other government agencies inside and outside the U.S. To varying degrees, each of these agencies requires us to comply with laws and regulations governing the development, testing, manufacturing, labeling, marketing, distribution and post-marketing surveillance of our products. Our business is also affected by patient and data privacy laws and government payer cost containment initiatives, as well as environmental health and safety laws and regulations.
Product Approval and Monitoring
Many countries where we sell medical devices subject such medical devices and technologies to their own approval and other regulatory requirements regarding performance, safety, and quality of our products. Authorization to commercially distribute a new medical device in the U.S. is generally obtained in one of two primary ways. The first, known as pre-market notification or the 510(k) process, requires us to demonstrate that our medical device is substantially equivalent to a legally marketed medical device. The second, more rigorous process, known as pre-market approval, requires us to independently demonstrate that a medical device is safe and effective for its intended use. This process is generally much more time-consuming and expensive than the 510(k) process.
In the E.U., a single regulatory approval process exists, and conformity with the legal requirements is represented by the CE Mark. To obtain a CE Mark, defined products must meet minimum standards of performance, safety, and quality (i.e., the essential requirements), and then, according to their classification, comply with one or more of a selection of conformity assessment routes. The competent authorities of the E.U. countries separately regulate the clinical research for medical devices and the market surveillance of products once they are placed on the market. A new Medical Device Regulation was published by the E.U. in 2017 which imposes significant additional pre-market and post-market requirements (EU MDR). The regulation provided an implementation period and became effective on May 26, 2021. Medical devices marketed in the E.U. will require certification according to these new requirements, except that devices with valid CE certificates, issued pursuant to the Medical Device Directives before May 2020, can be placed on the market until May 2024.
The global regulatory environment is increasingly stringent and unpredictable. While harmonization of global regulations has been pursued, requirements continue to differ significantly among countries. We expect this global regulatory environment will continue to evolve, which could impact the cost, the time needed to approve, and ultimately, our ability to maintain existing approvals or obtain future approvals for our products. Regulations of the U.S. FDA and other regulatory agencies in and outside the U.S. impose extensive compliance and monitoring obligations on our websitebusiness. These agencies review our design and manufacturing practices, labeling, record keeping, and manufacturers’ required reports of adverse experiences and other information to identify potential problems with marketed medical devices. We are also subject to periodic inspections for compliance with applicable quality system regulations, which govern the methods used in, and the facilities and controls used for, the design, manufacture, packaging, and servicing of finished medical devices intended for human use. In addition, the U.S. FDA and other regulatory bodies, both in and outside the U.S. (including the Federal Trade Commission, the Office of the Inspector General of the Department of Health and Human Services, the U.S. Department of Justice, and various state Attorneys General), monitor the promotion and advertising of our products. Any adverse regulatory action, depending on its magnitude, may limit our ability to effectively market and sell our products, limit our ability to obtain future pre-market approvals or result in a substantial modification to our business practices and operations. For additional information, see "Item 1A. Risk Factors" We are subject to extensive and complex laws and governmental regulations and any adverse regulatory action may materially adversely affect our financial condition and business operations.
Trade Regulations
The movement of products, services, and investment across borders subjects us to extensive trade regulations. A variety of laws and regulations in the countries in which we transact business apply to the sale, shipment and provision of goods, services and technology across borders. These laws and regulations govern, among other things, our import, export and other business activities. We are also subject to the risk that these laws and regulations could change in a way that would expose us to additional costs, penalties or liabilities. Some governments also impose economic sanctions against certain countries, persons or entities. In addition to our need to comply with such regulations in connection with our direct activities, we also sell and provide goods, technology and services to agents, representatives and distributors who may export such items to customers and end-users. If we, or the third parties through which we do business, are not in compliance with applicable import, export control or economic sanctions laws and regulations, we may be subject to civil or criminal enforcement action, and varying degrees of liability. Such actions may disrupt or delay sales of our products or services or result in restrictions on our distribution and sales of products or services that may materially impact our business.
Anti-Boycott Laws
Under U.S. laws and regulations, U.S. companies and their subsidiaries and affiliates outside the U.S. are prohibited from participating or agreeing to participate in unsanctioned foreign boycotts in connection with certain business activities, including the sale, purchase, transfer, shipping or financing of goods or services within the U.S. or between the U.S. and countries outside of the U.S. If we, or certain third parties through which we sell or provide goods or services, violate anti-boycott laws and regulations, we may be subject to civil or criminal enforcement action and varying degrees of liability.
Data Privacy and Security Laws and Regulations
As a business with a significant global footprint, compliance with evolving regulations and standards in data privacy and cybersecurity has resulted, and may continue to result, in increased costs, new compliance challenges, and the threat of increased regulatory enforcement activity. Our business relies on the secure electronic transmission, storage and hosting of sensitive information, including personal information, protected health information, financial information, intellectual property and other sensitive information related to our customers and workforce.
Our global operational footprint comes with the obligation for compliance and adherence to individual data security, confidentiality and breach notification laws at the State Level, Federal Level, and International Level. Examples of those laws include the Health Insurance and Portability Act of 1996 (HIPAA), as amended, and the Health Information Technology for Economic and Clinical Health Act of 2009 (HITECH) in the U.S., the Global Data Protection Regulation (GDPR) within the European Union, and various other country specific requirements around the world.
Because the laws and regulations continue to expand, differ from jurisdiction to jurisdiction, and are subject to evolving (and at times inconsistent) governmental interpretation, compliance with these laws and regulations may require significant additional cost expenditures or changes in products or business that increase competition or reduce revenue. Noncompliance could result in the imposition of fines, penalties, or orders to stop noncompliant activities, or withdrawal of non-compliant products from a market.
Regulations Governing Reimbursement
The delivery of our devices is subject to regulation by the U.S. Department of Health and Human Services (HHS) and comparable state and non-U.S. agencies responsible for reimbursement and regulation of healthcare items and services. U.S. laws and regulations are imposed primarily in connection with federally funded healthcare programs, such as the Medicare and Medicaid programs, as well as the government’s interest in regulating the quality and cost of healthcare. Other governments also impose regulations in connection with their healthcare reimbursement programs and the delivery of healthcare items and services.
U.S. federal healthcare laws apply when we or customers submit claims for items or services that are reimbursed under federally-funded healthcare programs, including laws related to kickbacks, false claims, self-referrals or other healthcare fraud. There are often similar state false claims, anti-kickback, and anti-self-referral and insurance laws that apply to state Medicaid and other healthcare programs and private third-party payers. In addition, as a partmanufacturer of U.S. FDA-approved devices reimbursable by federal healthcare programs, we are subject to the Physician Payments Sunshine Act, which requires us to annually report certain payments and other transfers of value we make to U.S.-licensed physicians or incorporating itU.S. teaching hospitals. Any failure to comply with these laws and regulations could subject us or our officers and employees to criminal and civil financial penalties.
Implementation of legislative or regulatory reforms to reimbursement systems, or adverse decisions relating to our products by reference into,administrators of these systems in coverage or reimbursement, could significantly reduce reimbursement or result in the denial of coverage, which could have an impact on the acceptance of and demand for our Form 10-K.products and the prices that our customers are willing to pay for them.
Environmental Health and Safety Laws
We are also subject to various environmental health and safety laws and regulations both within and outside the U.S. Like other companies in our industry, our manufacturing and other operations involve the use and transportation of substances regulated under environmental health and safety laws including those related to the transportation of hazardous materials.
Available InformationOTHER FACTORS IMPACTING OUR OPERATIONS
COVID-19 Pandemic
The SEC maintains a website that contains reports, proxy and information statements, and other information regarding issuers, including the Company, that file electronicallyglobal COVID-19 pandemic, together with the SEC. The public can obtain any documents that the Company files with the SEC at http://www.sec.gov. The Company files annual reports, quarterly reports, proxy statements,preventative and other documents with the SEC under the Exchange Act. The publicprecautionary measures taken by businesses, communities, and governments, has impacted, and may read and copy any materials that the Company files with the SEC at the SEC’s Public Reference Room at 100 F Street, N.E., Room 1580, Washington, D.C. 20549. The public may obtain information on the operation of the Public Reference Room by calling the SEC at 800-SEC-0330.
Stock Transfer Agent and Registrar
Wells Fargo Shareowner ServicesSM acts as transfer agent and registrar, dividend paying agent, and direct stock purchase plan agent for Medtronic and maintains all shareholder records for the Company. If you are a registered shareholder, you may access your account information online at www.shareowneronline.com. If you have questions regarding the Medtronic stock you own, stock transfers, address or name changes, direct deposit of dividends, lost dividend checks, lost stock certificates, or duplicate mailings, please contact Wells Fargo Shareowner ServicesSM by writing or calling: Wells Fargo Shareowner ServicesSM, 1110 Centre Pointe Curve, Suite 101, Mendota Heights, MN 55120 USA, Telephone: 888-648-8154 or 651-450-4064, Fax: 651-450-4033, www.wellsfargo.com/shareownerservices.
Direct Stock Purchase Plan
Medtronic’s transfer agent, Wells Fargo Bank N.A, administers the direct stock purchase plan, which is called the Shareowner Service Plus PlanSM. Features of this plan include direct stock purchase and reinvestment of dividendscontinue to purchase whole or fractional shares of Medtronic stock. All registered shareholders and potential investors may participate.
To request information on the Shareowner Service Plus PlanSM, or to enroll in the plan, contact Wells Fargo Shareowner ServicesSM at 888-648-8154 or 651-450-4064. You may also enroll via the Internet by visiting www.shareowneronline.com and selecting “Direct Purchase Plan.”
PART I
Item 1. Business
OVERVIEW
Medtronic plc, headquartered in Dublin, Ireland, is among the world's largest medical technology, services and solutions companies - alleviating pain, restoring health, and extending life for millions of people around the world. Medtronic was founded in 1949 and today serves hospitals, physicians, clinicians, and patients in approximately 160 countries worldwide. We remain committed to a mission written by our founder 56 years ago that directs us “to contribute to human welfare by the application of biomedical engineering in the research, design, manufacture, and sale of products to alleviate pain, restore health, and extend life.”
With innovation and market leadership, we have pioneered advances in medical technology in allimpact significant aspects of our businesses. Our commitment to enhanceCompany and business, including future procedural volumes, supply constraints, healthcare staffing, worker absenteeism with our offerings by developingcustomers, suppliers, and acquiring new products, wrap-around programs, and solutions to meet the needs of a broader set of stakeholders is driven by the following primary strategies:
Therapy Innovation: Delivering a strong launch cadence of meaningful therapies and procedures.
Globalization: Addressing the inequity in health care access globally, primarily in emerging markets.
Economic Value: Becoming a leader in value-based health care by offering new services and solutions to improve outcomes and efficiencies, lower costs by reducing hospitalizations, improve remote clinical management, and increase patient engagement.
Our primary customers include hospitals, clinics, third-party health care providers, distributors, and other institutions, including governmental health care programs and group purchasing organizations (GPOs).
On January 26, 2015 (Acquisition Date), Medtronic completed the acquisition of Covidien plc, a public limited company organized under the laws of Ireland (Covidien) in a cash and stock transaction valued at $50.0 billion. In connection with the transaction, Medtronic, Inc., a Minnesota corporation (Medtronic, Inc.), and Covidien were combined under and became subsidiaries of Medtronic plc. Covidien was a global leader in the development, manufacture and sale of healthcare products for use in clinical and home settings and had net sales for its fiscal year ended September 26, 2014 of $10.7 billion. On a pro forma basis, as if the Covidien merger had occurred at the beginning of fiscal year 2014, our combined net sales would have been $28.4 billion for fiscal year 2015 and $27.4 billion for fiscal year 2014; see Note 2 to the consolidated financial statements in “Item 8. Financial Statements and Supplementary Data” in this Annual Report on Form 10-K. The merger with Covidien provides the combined company with increased financial strength and flexibility and is expected to meaningfully accelerate all three strategies discussed above.
We reorganized our reporting structure and aligned our segments and the underlying divisions and businesses in fiscal year 2015 due to the acquisition of Covidien. The majority of Covidien’s operations are included in our new Minimally Invasive Therapies Group. For more informationown operations and field teams, and resulting impacts on demand for our segments, please see Note 17 to the consolidated financial statements inproducts and therapies. See “Item 8. Financial Statements and Supplementary Data”1A. Risk Factors” in this Annual Report on Form 10-K.
Research and Development
The markets in which we participate are subject to rapid technological advances. Constant improvement of existing products and introduction of new products is necessary to maintain market leadership. Our research and development (R&D) efforts are directed toward maintaining or achieving technological leadership in each of the markets we serve to help ensure that patients using our devices and therapies receive the most advanced and effective treatment possible. We currently functionremain committed to developing technological enhancements and new indications for existing products, and less invasive and new technologies for new and emerging markets to address unmet patient needs. That commitment leads to our initiation and participation in four operating segmentshundreds of clinical trials each fiscal year as the demand for clinical and economic evidence remains high. Furthermore, our development activities are intended to help reduce patient care costs and the length of hospital stays in the future. We have not engaged in significant customer or government-sponsored research.
Our R&D activities include improving existing products and therapies, expanding their indications and applications for use, developing new therapies and procedures, and entering into arrangements with third parties to fund the development of certain technologies. We continue to focus on optimizing innovation, improving our R&D productivity, driving growth in emerging markets, generating clinical evidence, and assessing our R&D programs based on their ability to address unmet clinical needs, produce better patient outcomes, and create new standards of care.
Intellectual Property
We rely on a combination of patents, trademarks, tradenames, copyrights, trade secrets, and agreements (non-disclosure and non-competition agreements) to protect our business and proprietary technology. In addition, we have entered into exclusive and non-exclusive licenses relating to a wide array of third-party technologies. In the aggregate, these intellectual property assets and licenses are of material importance to our business; however, we believe that primarilyno single intellectual property asset or license is material in relation to any segment of our business or to our business as a whole.
We operate in an industry characterized by extensive patent litigation. Patent litigation may result in significant damage awards and injunctions that could prevent the manufacture and sale of affected products or result in significant royalty payments in order to continue selling the products. At any given time, we are involved as both a plaintiff and a defendant in a number of patent infringement actions, the outcomes of which may not be known for prolonged periods of time.
Sales and Distribution
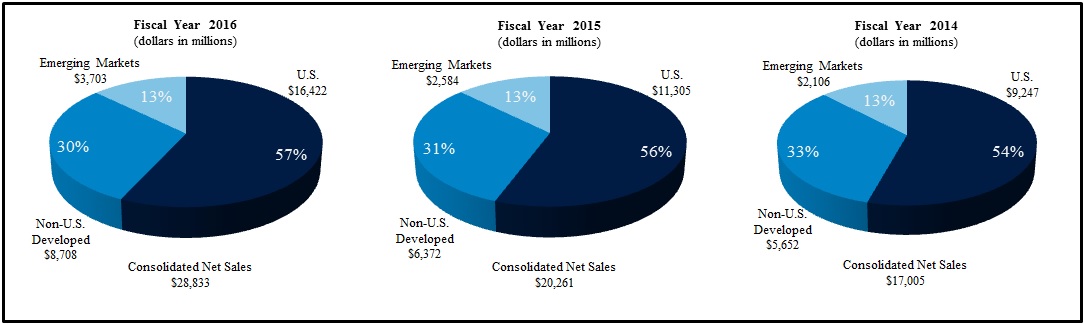
We sell device-basedour medical therapies.devices and therapies through a combination of direct sales representatives and independent distributors globally. Additionally, a portion of the Company's revenue is generated from consignment inventory maintained at hospitals. Our operating segmentsmedical supply products are used primarily in hospitals, surgical centers, and alternate care facilities, such as home care and long-term care facilities, and are marketed to materials managers, group purchasing organizations (GPOs) and integrated delivery networks (IDNs). We often negotiate with eachGPOs and IDNs, which enter into supply contracts for the benefit of their reported net sales for fiscal year 2016, along with their related divisions,member facilities. Our four largest markets are the U.S., Western Europe, China, and Japan. Emerging markets are an area of increasing focus and opportunity, as follows:
Cardiac and Vascular Group (Fiscal year 2016 net sales of $10.2 billion)
Cardiac Rhythm & Heart Failure
Coronary & Structural Heart
Aortic & Peripheral Vascular
Minimally Invasive Therapies Group (Fiscal year 2016 net sales of $9.6 billion)
Surgical Solutions
Patient Monitoring & Recovery
Restorative Therapies Group (Fiscal year 2016 net sales of $7.2 billion)
Spine
Neuromodulation
Surgical Technologies
Neurovascular
Diabetes Group (Fiscal year 2016 net sales of $1.9 billion)
Intensive Insulin Management
Non-Intensive Diabetes Therapies
Diabetes Service & Solutions
CARDIAC AND VASCULAR GROUP
Cardiac Rhythm & Heart Failure Disease Management (CRHF)we believe they remain under-penetrated.
Our CRHF division develops, manufactures,marketing and markets products for the diagnosis, treatment, and management of heart rhythm disorders and heart failure. Our products include implantable devices, leads and delivery systems, products for the treatment of atrial fibrillation (AF), products designed to reduce surgical site infections, information systems for the management of patients with CRHF devices, and an integrated health solutions business.
The following are the principal products and services offered by our CRHF division:
Implantable Cardiac Pacemakers (Pacemakers) Our latest generations of pacemaker systems are the Advisa MRI SureScan models, the Micra Transcatheter Pacing System, and the Ensura MRI SureScan model. The Micra Transcatheter Pacing System, which is leadless and does not have a subcutaneous device pocket like conventional pacemaker, and the Advisa MRI SureScan models have received United States (U.S.) Food and Drug Administration (U.S. FDA) approval and Conformité Européene (CE) Mark approval, while the Ensura MRI SureScan models have received CE Mark approval.
Implantable Cardioverter Defibrillators (ICDs) Our latest generation ICD is the Evera MRI SureScan, the first ICD system with CE Mark, PMDA (Japan), and U.S. FDA, approval for full-body MRI scans for both 1.5T and 3T scanners. The Evera system is paired with the reliable Sprint Quattro Secure lead, the only defibrillator lead with more than 11 years of proven performance with active monitoring.
Implantable Cardiac Resynchronization Therapy Devices (CRT-Ds and CRT-Ps) Our latest generation of CRT-Ds is the Amplia/Compia/Claria family of MRI Quad CRT-D SureScan systems. The U.S. FDA and CE Mark approved Amplia and Compia MRI Quad CRT-D SureScan systems are approved for MRI scans on any part of the body. In addition, the Viva/Brava family with Attain Performa quadripolar features a new algorithm, called AdaptivCRT, which improves heart failure patients' response rate to CRT-D therapy. Viva CRT-P is our latest generation device, with respect to CRT-P.
AF Products Our portfolio of AF products includes the Arctic Front Advance Cardiac Cryoballoon System, which includes the U.S. FDA approved Aortic Front Advance ST Cryoablation Catheter, designed for pulmonary vein isolation in the treatment of patients with drug refractory paroxysmal AF. Additionally, we have a second-generation CE Mark approved Phased RF System, PVAC Gold, which uses duty cycled, phased radio frequency energy for the treatment of symptomatic paroxysmal persistent and long-standing persistent AF.
Diagnostics and Monitoring Devices Our Reveal LINQ is our newest Insertable Cardiac Monitor (ICM) System. The system is used to record the heart’s electrical activity before, during, and after transient symptoms such as syncope (i.e., fainting) and palpitations to assist in diagnosis.
TYRX Products Our TYRX products include the Absorbable Antibacterial Envelope and the TYRX Neuro Absorbable Antibacterial Envelope, which are designed to stabilize electronic implantable devices and help prevent infection associated with implantable pacemakers, defibrillators, and spinal cord neurostimulators.
Services and Solutions Our Care Management Services products and services include remote monitoring and patient-centered software to enable efficient care coordination and specialized telehealth nurse support. Our Cath Lab Managed Services businesssales strategy is focused on developing novel partnershipsrapid, cost-effective delivery of high-quality products to a diverse group of customers worldwide. To achieve this objective, our marketing and sales teams are organized around physician specialties. This focus enables us to develop highly knowledgeable and dedicated sales representatives who are able to foster strong relationships with hospitalsphysicians and other customers and enhance our ability to provide services directly related to hospital operational efficiency.
Coronary & Structural Heart Disease Management (CSH)
Our CSH division includes therapies to treat coronary artery disease (CAD), and heart valve disorders. Our products include coronary stents and related delivery systems, including a broad line of balloon angioplasty catheters, guide catheters, guide wires, diagnostic catheters, and accessories as well as products for the repair and replacement of heart valves, perfusion systems, positioning and stabilization systems for beating heart revascularization surgery, and surgical ablationcross-sell complementary products.
The followingWe are not dependent on any single customer for more than 10 percent of our total net sales.
Competition, Industry, and Cost Containment
We compete in both the principal products offeredtherapeutic and diagnostic medical markets in more than 150 countries throughout the world. These markets are characterized by our CSH division:
Transcatheter Heart Valves (TCVs) Our latest generation TCVs include the CoreValve family of aortic valves. CoreValve, which is the only TCV system shown to be superior to open-heart surgery, has received U.S. FDA approval for extremerapid change resulting from technological advances and high risk
patients. Our next-generation recapturable TCV system, CoreValve Evolut R, has received U.S. FDA approval and CE Mark approval for the 23, 26, and 29 millimeter sizes of the valve.
Percutaneous Coronary Intervention (PCI) Our latest generation PCI stent products include our Resolute Integrity drug-eluting stent systems, which have received U.S. FDA approval, as well as Resolute Onyx drug-eluting stent systems, which have received CE Mark approval.
Heart Surgery We offer a complete line of surgical valve replacement and repair products for damaged or diseased heart valves. Our replacement products include both tissue and mechanical valves. We also offer a complete line of blood-handling products that form a circulatory support system to maintain and monitor blood circulation and coagulation status, oxygen supply, and body temperature during arrested heart surgery. Additionally, we offer surgical ablation systems and positioning and stabilization technologies.
Aortic & Peripheral Vascular Disease Management (APV)
Our APV division is comprised of a comprehensive line of products and therapies to treat aortic disease (such as aneurysms, dissections, and transections) as well as peripheral vascular disease (PVD), and critical limb ischemia (CLI). Our products include endovascular stent graft systems, peripheral drug coated balloon, stent and angioplasty systems, and carotid embolic protection systems for the treatment of vascular disease outside the heart, as well as products for superficial and deep venous disease.
The following are the principal products offered by our APV division:
Endovascular Stent Grafts (Aortic) Our products are designed to treat aortic aneurysms in either the abdomen or thoracic regions of the aorta.scientific discoveries. Our product line includeslines face a rangemix of endovascular stent grafts and accessories including the market-leading Endurant 2S Abdominal Aortic Aneurysm (AAA) Stent Graft System and the Valiant Captivia Thoracic Aortic Aneurysm (TAA) stent graft system and the Aptus endo anchors.
Peripheral Vascular Intervention (PVI) Our primary PVI products include percutaneous angioplasty balloons including the IN.PACT familycompetitors ranging from large manufacturers with multiple business lines to small manufacturers offering a limited selection of drug-coated balloons, which have U.S. FDA and CE Mark approval, as well as peripheral stents such as the Protégé & Complete Self Expanding Vascular Stents, the Visi-Pro & Assurant Cobalt Balloon Expandable stents and directional atherectomy products such as the TurboHawk plaque excision system, and other procedure support products.
EndoVenous (EV) Our EndoVenous product lines are used to treat superficial and deep venous diseases in the lower extremities and include the Closure Fast RF ablation system, the VenaSeal medical adhesive system while also now focusing on embolisms with the Concerto detachable coil system, Micro Vascular Plug (MVP), the PV ONYX liquid embolic system and other procedure support products.
MINIMALLY INVASIVE THERAPIES GROUP
Surgical Solutions
Surgical Solutions develops, manufactures, and markets advanced surgical, general surgical, and hernia products and therapies to treat diseases and conditions that are typically, but not exclusively, addressed by surgeons. In addition, we develop, manufacture, and market several unique products in the emerging fields of minimally invasive gastrointestinal diagnostics, ablation, and interventional lung.
The following are the principal products offered by our Surgical Solutions division:
Surgical Innovations This business includes sales of stapling, vessel sealing, fixation (hernia mechanical devices), mesh, hardware and surgical instruments, as well as wound closure, and electrosurgical products. Key advanced surgical products include: the Tri-Staple technology platform for endoscopic stapling, including the Endo GIA reloads and reinforced reloads with Tri-Staple Technology and the Endo GIA ultra universal stapler; the iDrive and Signia powered stapling systems; the LigaSure vessel sealing system, which features specialty/application specific handpieces powered by proprietary hardware platforms; the Sonicision cordless ultrasonic dissection system; AbsorbaTack absorbable mesh fixation device for hernia repair; Symbotex composite mesh for surgical laparoscopic and open ventral hernia repair; and Parietex ProGrip, a selfgripping, biocompatible solution for inguinal hernias.
Early Technologies Our products include ablation products, and interventional lung and gastrointestinal solutions. This includes the PillCam SB and PillCam COLON, a minimally-invasive, swallowed optical endoscopy technology; superDimesion to evaluate lung lesions; the Cool-tip radiofrequency ablation system; the Evident microwave ablation system; and the HALO ablation catheters for treatment of Barrett’s esophagus.
Patient Monitoring & Recovery (PMR)
Our PMR division develops, manufactures, and markets products and therapies to enable complication-free recovery to enhance patient outcomes.
The following are the principal products offered by our PMR division:
Patient Monitoring Our products include sensors, monitors, and temperature management products. Key patient monitoring products include: Capnostream with Microstream technology capnography monitors, the Nellcor Bedside SpO2 patient monitoring system, the Bispectral Index (BIS) brain monitoring technology, the INVOS Cerebral/Somatic Oximeter, and related modules and sensors.
Airway & Ventilation This business primarily includes sales of airway, ventilator and inhalation therapy products. Key airway & ventilation products include: the Puritan Bennett 840 and 980 ventilators, the Newport e360 and HT70 ventilators, the TaperGuard Evac tube, Mallinckrodt Endotracheal Tubes, Shiley Tracheostomy Tubes, DAR Filters, and resuscitation bags.
Nursing Care This business primarily includes sales of incontinence, wound care, enteral feeding, urology, and suction products. Key nursing care products include Curity and Kerlix gauze and bandages and Kangaroo enteral feeding systems.
Patient Care & Safety (PCS) Our products include medical surgical products, such as operating room supply products, electrodes, and SharpSafety products, which includes needles, syringes, and sharps disposal products. In addition, we manufacture Original Equipment Manufacturer (OEM) products, which are various medical supplies manufactured forface competition from providers of other medical therapies, such as pharmaceutical companies.
Major shifts in industry market share have occurred in connection with product problems, physician advisories, safety alerts, results of clinical trials to support superiority claims, and publications about our products, companies. Underreflecting the importance of product quality, product efficacy and quality systems in the medical device industry. In the current environment of managed care, economically motivated customers, consolidation among healthcare providers, increased competition, declining reimbursement rates, and national and provincial tender pricing, competitively priced product offerings are essential to our Medi-Trace brand,business. In order to continue to compete effectively, we offermust continue to create or acquire advanced technology, incorporate this technology into proprietary products, obtain regulatory approvals in a comprehensive linetimely manner, maintain high-quality manufacturing processes, and successfully market these products.
Government and private sector initiatives to limit the growth of monitoring, diagnostic,healthcare costs, including price regulation, competitive pricing, bidding and defibrillation electrodes.
RESTORATIVE THERAPIES GROUP
Spine
Our Spine division develops, manufactures,tender mechanics, coverage and markets a comprehensive linepayment policies, comparative effectiveness of therapies, technology assessments and managed-care arrangements, are continuing in many countries where we do business, including the U.S. These initiatives put increased emphasis on the delivery of more cost-effective medical devices and implants used intherapies. Government programs, including Medicare and Medicaid, private healthcare insurance and managed-care plans have attempted to control costs by limiting the treatmentamount of the spinereimbursement they will pay for particular procedures or treatments, tying reimbursement to outcomes, shifting to population health management, and musculoskeletal system. Our products and therapies treatother mechanisms. Hospitals, which purchase our technology, are also seeking to reduce costs through a variety of conditions affectingmechanisms, including, for example, centralized purchasing, and in some cases, limiting the spine, including degenerative disc disease, spinal deformity, spinal tumors, fracturesnumber of vendors that may participate in the purchasing program. Hospitals are also aligning interests with physicians through employment and other arrangements, such as gainsharing, where a hospital agrees with physicians to share any realized cost savings resulting from changes in practice patterns such as device standardization. This has created an increased level of price sensitivity among customers for our products.
Production and Availability of Raw Materials
We manufacture products at manufacturing facilities located in various countries throughout the world. We purchase many of the spine,components and stenosis. raw materials used in manufacturing our products from numerous suppliers in various countries. Certain components and raw materials are available only from a sole supplier. We work closely with our suppliers to help ensure continuity of supply while maintaining high quality and reliability. Generally, we have been able to obtain adequate supplies of such raw materials and components.
However, due to the U.S. FDA’s manufacturing requirements, we may not be able to quickly establish additional or replacement sources for certain components or materials if we experience a sudden or unexpected reduction or interruption in supply and are unable to develop alternative sources.
For additional information related to our manufacturing facilities refer to “Item 2. Properties” in this Annual Report on Form 10-K.
Government Regulation
Our Spine divisionoperations and products are subject to extensive regulation by numerous government agencies, including the U.S. FDA, European regulatory authorities such as the Medicines and Healthcare Products Regulatory Agency in the United Kingdom Republic of Ireland and the Federal Institute for Drugs and Medical Devices in Germany, the China National Medical Product Administration (NMPA), and other government agencies inside and outside the U.S. To varying degrees, each of these agencies requires us to comply with laws and regulations governing the development, testing, manufacturing, labeling, marketing, distribution and post-marketing surveillance of our products. Our business is also provides biologic solutionsaffected by patient and data privacy laws and government payer cost containment initiatives, as well as environmental health and safety laws and regulations.
Product Approval and Monitoring
Many countries where we sell medical devices subject such medical devices and technologies to their own approval and other regulatory requirements regarding performance, safety, and quality of our products. Authorization to commercially distribute a new medical device in the U.S. is generally obtained in one of two primary ways. The first, known as pre-market notification or the 510(k) process, requires us to demonstrate that our medical device is substantially equivalent to a legally marketed medical device. The second, more rigorous process, known as pre-market approval, requires us to independently demonstrate that a medical device is safe and effective for its intended use. This process is generally much more time-consuming and expensive than the 510(k) process.
In the E.U., a single regulatory approval process exists, and conformity with the legal requirements is represented by the CE Mark. To obtain a CE Mark, defined products must meet minimum standards of performance, safety, and quality (i.e., the essential requirements), and then, according to their classification, comply with one or more of a selection of conformity assessment routes. The competent authorities of the E.U. countries separately regulate the clinical research for medical devices and the market surveillance of products once they are placed on the market. A new Medical Device Regulation was published by the E.U. in 2017 which imposes significant additional pre-market and post-market requirements (EU MDR). The regulation provided an implementation period and became effective on May 26, 2021. Medical devices marketed in the E.U. will require certification according to these new requirements, except that devices with valid CE certificates, issued pursuant to the Medical Device Directives before May 2020, can be placed on the market until May 2024.
The global regulatory environment is increasingly stringent and unpredictable. While harmonization of global regulations has been pursued, requirements continue to differ significantly among countries. We expect this global regulatory environment will continue to evolve, which could impact the cost, the time needed to approve, and ultimately, our ability to maintain existing approvals or obtain future approvals for our products. Regulations of the U.S. FDA and other regulatory agencies in and outside the U.S. impose extensive compliance and monitoring obligations on our business. These agencies review our design and manufacturing practices, labeling, record keeping, and manufacturers’ required reports of adverse experiences and other information to identify potential problems with marketed medical devices. We are also subject to periodic inspections for compliance with applicable quality system regulations, which govern the methods used in, and the facilities and controls used for, the orthopedicdesign, manufacture, packaging, and dental marketsservicing of finished medical devices intended for human use. In addition, the U.S. FDA and other regulatory bodies, both in concertand outside the U.S. (including the Federal Trade Commission, the Office of the Inspector General of the Department of Health and Human Services, the U.S. Department of Justice, and various state Attorneys General), monitor the promotion and advertising of our products. Any adverse regulatory action, depending on its magnitude, may limit our ability to effectively market and sell our products, limit our ability to obtain future pre-market approvals or result in a substantial modification to our business practices and operations. For additional information, see "Item 1A. Risk Factors" We are subject to extensive and complex laws and governmental regulations and any adverse regulatory action may materially adversely affect our financial condition and business operations.
Trade Regulations
The movement of products, services, and investment across borders subjects us to extensive trade regulations. A variety of laws and regulations in the countries in which we transact business apply to the sale, shipment and provision of goods, services and technology across borders. These laws and regulations govern, among other things, our import, export and other business activities. We are also subject to the risk that these laws and regulations could change in a way that would expose us to additional costs, penalties or liabilities. Some governments also impose economic sanctions against certain countries, persons or entities. In addition to our need to comply with such regulations in connection with our Surgical Technologiesdirect activities, we also sell and provide goods, technology and services to agents, representatives and distributors who may export such items to customers and end-users. If we, or the third parties through which we do business, are not in compliance with applicable import, export control or economic sanctions laws and regulations, we offer uniquemay be subject to civil or criminal enforcement action, and highly differentiated navigation, neuromonitoring,varying degrees of liability. Such actions may disrupt or delay sales of our products or services or result in restrictions on our distribution and power technologies designed for spine procedures.sales of products or services that may materially impact our business.
Anti-Boycott Laws
Under U.S. laws and regulations, U.S. companies and their subsidiaries and affiliates outside the U.S. are prohibited from participating or agreeing to participate in unsanctioned foreign boycotts in connection with certain business activities, including the principal products offered by our Spine division:
Thoracolumbar Products Our products used to treat conditions in this regionsale, purchase, transfer, shipping or financing of goods or services within the U.S. or between the U.S. and countries outside of the spineU.S. If we, or certain third parties through which we sell or provide goods or services, violate anti-boycott laws and regulations, we may be subject to civil or criminal enforcement action and varying degrees of liability.
Data Privacy and Security Laws and Regulations
As a business with a significant global footprint, compliance with evolving regulations and standards in data privacy and cybersecurity has resulted, and may continue to result, in increased costs, new compliance challenges, and the threat of increased regulatory enforcement activity. Our business relies on the secure electronic transmission, storage and hosting of sensitive information, including personal information, protected health information, financial information, intellectual property and other sensitive information related to our customers and workforce.
Our global operational footprint comes with the obligation for compliance and adherence to individual data security, confidentiality and breach notification laws at the State Level, Federal Level, and International Level. Examples of those laws include the CD HORIZON SOLERAHealth Insurance and LEGACY Systems,Portability Act of 1996 (HIPAA), as amended, and the CAPSTONEHealth Information Technology for Economic and CLYDESDALE interbody spacers. In addition, Medtronic offers a numberClinical Health Act of products that facilitate less invasive thoracolumbar surgeries, including2009 (HITECH) in the CD HORIZON VOYAGER, SOLERA SEXTANT and LONGITUDE Percutaneous Fixation Systems.
Cervical Products Products used to treat conditions in this region ofU.S., the spine include the ZEVO and ATLANTIS VISION ELITE Anterior Cervical Plate Systems, the VERTEX SELECT Reconstruction System, and the PRESTIGE and BRYAN Cervical Artificial Discs.
Biologics Products Our Biologics platform products include INFUSE Bone Graft (InductOs inGlobal Data Protection Regulation (GDPR) within the European Union, (E.U.)), which containsand various other country specific requirements around the world.
Because the laws and regulations continue to expand, differ from jurisdiction to jurisdiction, and are subject to evolving (and at times inconsistent) governmental interpretation, compliance with these laws and regulations may require significant additional cost expenditures or changes in products or business that increase competition or reduce revenue. Noncompliance could result in the imposition of fines, penalties, or orders to stop noncompliant activities, or withdrawal of non-compliant products from a recombinant human bone morphogenetic protein, rhBMP-2, for certain spinal, trauma, and oral maxillofacial applications, Demineralized Bone Matrix (DBM) products, including MagniFuse, Grafton/Grafton Plus, and PROGENIX, and the MASTERGRAFT family of synthetic bone graft products - Matrix, Putty, and Granules.market.
Interventional Products Our interventional products include the Xpander II Balloon Kyphoplasty system, the Kyphon-V vertebroplastly system and the Osteocool tumor ablation system.
Neuromodulation
Our Neuromodulation division includes implantable neurostimulation and targeted drug delivery systems for the management of chronic pain, common movement disorders, spasticity, and urologic and gastrointestinal disorders. Neurostimulation uses an implantable medical device, similar to a pacemaker, called a neurostimulator.Regulations Governing Reimbursement
The following are the principal products offereddelivery of our devices is subject to regulation by our Neuromodulation division:
Neurostimulation Systems for Chronic Pain We have a large portfolio of neurostimulation systems, including rechargeable and non-rechargeable devices and a large selection of leads used to treat chronic back and/or limb pain. Our portfolio of products
includes pain neurostimulation systems with SureScan MRI Technology, including the RestoreSensor (rechargeable) SureScan MRI, with its proprietary AdaptiveStim technology.
Implantable Drug Infusion Systems Our SynchroMed II Implantable Infusion System delivers small quantities of drug directly into the intrathecal space surrounding the spinal cord. These devices are used to treat chronic, intractable pain and severe spasticity associated with cerebral palsy, multiple sclerosis, spinal cord and traumatic brain injuries, and stroke.
Deep Brain Stimulation (DBS) Systems DBS is currently approved in many countries around the world for the treatment of the disabling symptoms of essential tremor, Parkinson's disease, refractory epilepsy (outside the U.S.), severe, treatment-resistant obsessive-compulsive disorder (approved under a Humanitarian Device Exemption (HDE) in the U.S.), and chronic, intractable primary dystonia (approved under a HDE in the U.S.). Our family of Activa Neurostimulators for DBS includes Activa SC (single-channel primary cell battery), Activa PC (dual channel primary cell battery), and Activa RC (dual channel rechargeable battery).
Gastroenterology & Urology (Gastro/Uro) Systems Our Sacral neuromodulation uses InterStim, a neurostimulator, to help control the symptoms of overactive bladder, (non-obstructive) urinary retention, and chronic fecal incontinence. Currently, Enterra Therapy is the only gastric electrical stimulation therapy approved in the U.S. (under a HDE), Europe,Department of Health and CanadaHuman Services (HHS) and comparable state and non-U.S. agencies responsible for usereimbursement and regulation of healthcare items and services. U.S. laws and regulations are imposed primarily in connection with federally funded healthcare programs, such as the treatment of intractable nauseaMedicare and vomiting associated with gastroparesis. The system, which contains a small neurostimulator and two leads, stimulates the smooth muscles of the lower stomach.
Surgical Technologies
Our Surgical Technologies division develops, manufactures, and markets products and therapies to treat diseases and conditions of the ear, nose, and throat (ENT) and certain neurological disorders. In addition, the division develops, manufactures, and markets image-guided surgery and intra-operative imaging systems that facilitate surgical planning during precision cranial, spinal, sinus, and orthopedic surgeries. Our Advanced Energy business includes products in the emerging field of advanced energy surgical incision technology,Medicaid programs, as well as the haemostatic sealinggovernment’s interest in regulating the quality and cost of soft tissuehealthcare. Other governments also impose regulations in connection with their healthcare reimbursement programs and bone.the delivery of healthcare items and services.
The followingU.S. federal healthcare laws apply when we or customers submit claims for items or services that are the principal products offered by our Surgical Technologies division:
Neurosurgery Our portfolio of products include both platform technologiesreimbursed under federally-funded healthcare programs, including laws related to kickbacks, false claims, self-referrals or other healthcare fraud. There are often similar state false claims, anti-kickback, and implant therapies. The StealthStation Navigation Systemanti-self-referral and O-arm Imaging System are both platforms used in cranial, spinal, sinus, and orthopedic procedures. The Midas Rex Surgical Drills are used in cranial, spinal, and orthopedic procedures. Visualase MRI-Guided Laser Ablation is used in neurosurgery procedures, and our CSF Management Portfolio is used in treating hydrocephalusinsurance laws that apply to state Medicaid and other conditions impactinghealthcare programs and private third-party payers. In addition, as a manufacturer of U.S. FDA-approved devices reimbursable by federal healthcare programs, we are subject to the intracranial pressure.Physician Payments Sunshine Act, which requires us to annually report certain payments and other transfers of value we make to U.S.-licensed physicians or U.S. teaching hospitals. Any failure to comply with these laws and regulations could subject us or our officers and employees to criminal and civil financial penalties.
ENT The followingImplementation of legislative or regulatory reforms to reimbursement systems, or adverse decisions relating to our products treat ENT diseasesby administrators of these systems in coverage or reimbursement, could significantly reduce reimbursement or result in the denial of coverage, which could have an impact on the acceptance of and conditions: Straightshot M5 Microdebrider Handpiece, the IPC system, NIM Nerve Monitoring Systems, Fusion ENT Navigation System, as well as productsdemand for hearing restoration and Snoring and Obstructive Sleep Apnea.
Advanced Energy Our PEAK Surgery System is a tissue dissection system that consists of the PEAK PlasmaBlade and PULSAR Generator and is cleared for use in a variety of settings, including plastic reconstructive surgery, general surgery, and certain conditions of ENT. Our Aquamantys System uses patented transcollation technology to provide haemostatic sealing of soft tissue and bone and is cleared for use in a variety of surgical procedures, including orthopedic surgery, spine, solid organ resection and thoracic procedures.
Neurovascular
Our Neurovascular division, develops, manufactures, and marketsour products and therapiesthe prices that our customers are willing to treat diseasespay for them.
Environmental Health and Safety Laws
We are also subject to various environmental health and safety laws and regulations both within and outside the U.S. Like other companies in our industry, our manufacturing and other operations involve the use and transportation of substances regulated under environmental health and safety laws including those related to the vasculature in and around the brain. Our products include coils, neurovascular stents, and flow diversion products, as well as access and delivery products to support procedures.
The following are the principal products offered by our Neurovascular division:
The Pipeline and Pipeline Flex Embolization Devices, endovascular treatments for large or giant wide-necked brain aneurysms; the Solitaire FR revascularization device for treatmenttransportation of acute ischemic stroke; and the Apollo Onyx delivery micro catheter, the first detachable tip micro-catheter available in the U.S.hazardous materials.
DIABETES GROUP
Our Diabetes group consists of three divisions (Intensive Insulin Management, Non-Intensive Diabetes Therapies, and Diabetes Service & Solutions) that develop, manufacture, and market advanced, integrated diabetes management solutions that include insulin pump therapy, continuous glucose monitoring (CGM) systems, and therapy management software.
The following are the principal products offered by our Diabetes divisions:
Integrated Diabetes Management Solutions We have an integrated insulin pump and CGM system currently available on the market. In the U.S., we offer the MiniMed 530G System featuring SmartGuard technology, which automatically suspends insulin delivery when glucose levels reach a pre-determined threshold, and newest CGM sensor, Enlite, a sensor that can be worn for 6-days and is more comfortable, more accurate, and smaller than our previous generation sensor. Outside the U.S., we offer our MiniMed 640G System, an integrated system with the Enhanced Enlite CGM sensor that features SmartGuard technology, which automatically suspends insulin delivery when sensor glucose levels are predicted to approach a low limit and then resumes insulin delivery once levels recover.
Professional CGM In addition to our Personal CGM (Enlite), we offer physicians a Professional CGM product called the iPro2/iPro Professional CGM System. Patients wear the iPro2/iPro recorder to capture glucose data that is later uploaded in a physician’s office to reveal glucose patterns and potential problems, including hyperglycemic and hypoglycemic episodes. The data leads to more informed treatment decisions.
Connected Care We continue to innovate and offer new connected care solutions, including the MiniMed Connect, which is the only system providing remote access to pump and sensor data on the user's smartphone.
CareLink Therapy Management Software Our web-based therapy management software solutions, including CareLink Personal software for patients and CareLink Pro software for healthcare professionals, to help patients and their health care providers control their diabetes.
CUSTOMERS AND COMPETITORS
Cardiac and Vascular Group The primary medical specialists who use our Cardiac and Vascular products include electrophysiologists, implanting cardiologists, heart failure specialists, cardiovascular, cardiothorasic, and vascular surgeons and interventional cardiologists and radiologists. Our primary competitors are St. Jude Medical, Inc. (St. Jude), Boston Scientific Corporation (Boston Scientific), Sorin Group (Sorin), Edwards Lifesciences Corporation (Edwards), C.R. Bard Inc. (Bard), and Abbott Laboratories (Abbott).
Minimally Invasive Therapies Group The products and therapies of this group are used primarily by hospitals, physicians' offices, and ambulatory care centers, other alternate site healthcare providers and less frequently in home settings. Our primary competitors are Johnson & Johnson, Boston Scientific, Baxter International Inc., and Bard.
Restorative Therapies Group The primary medical specialists who use the products of this group include spinal surgeons, neurosurgeons, neurologists, pain management specialists, anesthesiologists, orthopedic surgeons, urologists, interventional radiologists, and ear, nose, and throat specialists. Our primary competitors include Johnson & Johnson, Boston Scientific, St. Jude, Stryker Corporation (Stryker), NuVasive, Inc., and Zimmer Holdings, Inc. (Zimmer).
Diabetes Group The primary medical specialists who use and/or prescribe our Diabetes products are endocrinologists, diabetologists, and internists. Our primary competitors are Johnson & Johnson, DexCom, Inc., Tandem Diabetes Care Inc., Insulet Corporation, and F. Hoffmann-La Roche Ltd.
OTHER FACTORS IMPACTING OUR OPERATIONS
COVID-19 Pandemic
The global COVID-19 pandemic, together with the preventative and precautionary measures taken by businesses, communities, and governments, has impacted, and may continue to impact significant aspects of our Company and business, including future procedural volumes, supply constraints, healthcare staffing, worker absenteeism with our customers, suppliers, and in our own operations and field teams, and resulting impacts on demand for our products and therapies. See “Item 1A. Risk Factors” in this Annual Report on Form 10-K.
Research and Development
The markets in which we participate can beare subject to rapid technological advances. Constant improvement of existing products and introduction of new products is necessary to maintain market leadership. Our research and development (R&D) efforts are directed toward maintaining or achieving technological leadership in each of the markets we serve in order to help ensure that patients using our devices and therapies receive the most advanced and effective treatment possible. We remain committed to developing technological enhancements and new indications for existing products, and less invasive and new technologies for new and emerging markets to address unmet patient needs. That commitment leads to our initiation and participation in manyhundreds of clinical trials each fiscal year as the demand for clinical and economic evidence remains high. Furthermore, our development activities are intended to help reduce patient care costs and the length of hospital stays in the future. We have not engaged in significant customer or government-sponsored research.
During fiscal years 2016, 2015, and 2014, we spent $2.2 billion (7.7 percent of net sales), $1.6 billion (8.1 percent of net sales), and $1.5 billion (8.7 percent of net sales) on R&D, respectively. Our R&D activities include improving existing products and
therapies, expanding their indications and applications for use, and developing new therapies and procedures.procedures, and entering into arrangements with third parties to fund the development of certain technologies. We continue to focus on optimizing innovation, improving our R&D productivity, driving growth in emerging markets, generating clinical evidence, generation, and assessing our R&D programs based on their ability to deliver economic value to our customers.address unmet clinical needs, produce better patient outcomes, and create new standards of care.
Acquisitions and Investments
Our strategy to provide a broad range of therapies to restore patients' health and extend lives requires a wide variety of technologies, products, and capabilities. The rapid pace of technological development in the medical industry and the specialized expertise required in different areas of medicine make it difficult for one company alone to develop an all-encompassing portfolio of technological solutions. In addition to internally generated growth through our R&D efforts, historically we have relied, and expect to continue to rely, upon acquisitions, investments, and alliances to provide access to new technologies both in areas served by our existing businesses as well as in new areas and markets.
We expect to make future investments or acquisitions where we believe that we can stimulate the development of, or acquire new technologies and products to further our strategic objectives, and strengthen our existing businesses. Mergers and acquisitions of medical technology companies are inherently risky and no assurance can be given that any of our previous or future acquisitions will be successful or will not materially adversely affect our consolidated results of operations, financial condition, and/or cash flows.
For additional information, see Note 2 to the consolidated financial statements in “Item 8. Financial Statements and Supplementary Data” in this Annual Report on Form 10-K and "Item 1A. Risk Factors - Failure to integrate acquired businesses into our operations successfully could adversely affect our business."
Acquisition of Covidien plc in Fiscal Year 2015
On January 26, 2015, pursuant to a transaction agreement, dated as of June 15, 2014 (the Transaction Agreement), Medtronic, Inc. and Covidien became subsidiaries of the Company. The total cash and stock value of the Covidien acquisition was $50.0 billion. The operating results for Covidien are included in the Minimally Invasive Therapies Group, Cardiac and Vascular Group and Restorative Therapies Group segments.
Based upon the acquisition valuation, the Company acquired $18.3 billion of customer-related intangible assets, $7.1 billion of technology-based intangible assets, $430 million of tradenames, with weighted average estimated useful lives of 18, 16, and 6 years, respectively, $420 million of in-process research and development (IPR&D), and $30.0 billion of goodwill.
Fiscal Year 2016 Acquisitions
Twelve, Inc.
On October 2, 2015, the Company's Coronary & Structural Heart division acquired Twelve, Inc. (Twelve), a privately-held medical device company focused on the development of a transcatheter mitral valve replacement device. Total consideration for the transaction was approximately $472 million, which included an upfront payment of $428 million and the estimated fair value of product development-based contingent consideration of $44 million. Based upon the acquisition valuation, the Company acquired $192 million of IPR&D and $291 million of goodwill.
RF Surgical Systems, Inc.
On August 11, 2015, the Company's Surgical Solutions division acquired RF Surgical Systems, Inc. (RF Surgical), a medical device company focused on the detection and prevention of retained surgical sponges. Total consideration for the transaction was approximately $240 million. Based upon the acquisition valuation, the Company acquired $68 million of technology-based intangible assets, $47 million of customer-related intangible assets, with estimated useful lives of 18 and 16 years, respectively, and $135 million of goodwill.
Medina Medical
On August 31, 2015, the Company's Neurovascular division acquired Medina Medical (Medina), a privately-held medical device company focused on commercializing treatments for vascular abnormalities of the brain, including cerebral aneurysms. Total consideration for the transaction was approximately $219 million, which includes an upfront payment of $155 million and the estimated fair value of revenue-based and product development-based contingent consideration of $64 million. Medtronic had previously invested in Medina and held an 11 percent ownership position. Net of this ownership position, the transaction value was approximately $195 million. Based upon the acquisition valuation, the Company acquired $122 million of IPR&D and $126 million of goodwill.
Patents and LicensesIntellectual Property
We rely on a combination of patents, trademarks, tradenames, copyrights, trade secrets, and non-disclosureagreements (non-disclosure and non-competition agreementsagreements) to establish and protect our business and proprietary technology. We have filed and obtained numerous patents in the U.S. and abroad, and regularly file patent applications worldwide in our continuing effort to establish and protect our proprietary technology. U.S. patents typically have a 20-year term from the application date while patent protection outside the U.S. varies from country to country. In addition, we have entered into exclusive and non-exclusive licenses relating to a wide array of third-party technologies. We have also obtained certain trademarks and tradenames for our products to distinguish our genuine products from our competitors’ products, and we maintain certain details about our processes, products, and strategies as trade secrets. In the aggregate, these intellectual property assets and licenses are of material importance to our business; however, we believe that no single patent, technology, trademark, intellectual property asset or license is material in relation to any segment of our business or to our business as a whole. Our efforts to protect our intellectual property and avoid disputes over proprietary rights have included ongoing review of third-party patents and
We operate in an industry characterized by extensive patent applications. For additional information see “Item 1A. Risk Factors - We are substantially dependent on patent and other proprietary rights and failing to protect such rights or to be successful inlitigation. Patent litigation related to our rights or the rights of others may result in our paymentsignificant damage awards and injunctions that could prevent the manufacture and sale of affected products or result in significant monetary damages and/or royalty payments negatively impact our abilityin order to sell current or future products, or prohibit us from enforcing ourcontinue selling the products. At any given time, we are involved as both a plaintiff and a defendant in a number of patent and other proprietary rights against others.” and Note 15 toinfringement actions, the consolidated financial statements in “Item 8. Financial Statements and Supplementary Data” in this Annual Report on Form 10-K.outcomes of which may not be known for prolonged periods of time.
MarketsSales and Distribution Methods
We sell most of our medical devices and therapies through direct sales representatives in the U.S. and a combination of direct sales representatives and independent distributors in markets outsideglobally. Additionally, a portion of the U.S. For certain portions of our business acquired through the Covidien acquisition, we also sell through distributors in the U.S.Company's revenue is generated from consignment inventory maintained at hospitals. Our medical suppliessupply products are used primarily in hospitals, surgi-centerssurgical centers, and alternate care facilities, such as home care and long-term care facilities, and are marketed to materials managers, GPOsgroup purchasing organizations (GPOs) and integrated delivery networks (IDNs) primarily through third-party distributors, although we also have direct sales representatives.. We often negotiate with GPOs and IDNs, which enter into supply contracts for the benefit of their member facilities. Our threefour largest markets are the U.S., Western Europe, China, and Japan. Emerging markets are an area of increasing focus and opportunity, as we believe they remain under-penetrated.
Our marketing and sales strategy is focused on rapid, cost-effective delivery of high-quality products to a diverse group of customers worldwide - including physicians, hospitals, other medical institutions, and GPOs.worldwide. To achieve this objective, we organize our marketing and sales teams are organized around physician specialties. This focus enables us to develop highly knowledgeable and dedicated sales representatives who are able to foster strong relationships with physicians and other customers and enhance our ability to cross-sell complementary products. We believe that we maintain excellent working relationships with physicians and others in the medical industry that enable us to gain a detailed understanding of therapeutic and diagnostic developments, trends, and emerging opportunities and respond quickly to the changing needs of physicians and patients. We attempt to enhance our presence in the medical community through active participation in medical meetings and by conducting comprehensive training and educational activities. We believe that these activities contribute to physician expertise.
In keeping with the increased emphasis on cost-effectiveness in health care delivery, the current trend among hospitals and other customers is to consolidate into larger purchasing groups to enhance purchasing power. This enhanced purchasing power may lead to pressure on pricing and increased use of preferred vendors. Our customer base continues to evolve to reflect such economic changes across the geographic markets we serve. We are not dependent on any single customer for more than 10 percent of our total net sales.
Competition, Industry, and IndustryCost Containment
We compete in both the therapeutic and diagnostic medical markets in approximately 160 more than 150 countries throughout the world. These markets are characterized by rapid change resulting from technological advances and scientific discoveries. Our product lines face a mixturemix of competitors ranging from large manufacturers with multiple business lines to small manufacturers offering a limited selection of products. In addition, we face competition from providers of other medical therapies, such as pharmaceutical companies.
Major shifts in industry market share have occurred in connection with product problems, physician advisories, safety alerts, results of clinical trials to support superiority claims, and publications about our products, reflecting the importance of product quality, product efficacy and quality systems in the medical device industry. In addition, in the current environment of managed care, economically motivated customers, consolidation among health carehealthcare providers, increased competition, and declining reimbursement rates, we have been increasingly requiredand national and provincial tender pricing, competitively priced product offerings are essential to compete on the basis of price.our business. In order to continue to compete effectively, we must continue to create or acquire advanced technology, incorporate this technology into proprietary products, obtain regulatory approvals in a timely manner, maintain high-quality manufacturing processes, and successfully market these products.
Worldwide Operations
Our global operationsGovernment and private sector initiatives to limit the growth of healthcare costs, including price regulation, competitive pricing, bidding and tender mechanics, coverage and payment policies, comparative effectiveness of therapies, technology assessments and managed-care arrangements, are accompaniedcontinuing in many countries where we do business, including the U.S. These initiatives put increased emphasis on the delivery of more cost-effective medical devices and therapies. Government programs, including Medicare and Medicaid, private healthcare insurance and managed-care plans have attempted to control costs by certain financiallimiting the amount of reimbursement they will pay for particular procedures or treatments, tying reimbursement to outcomes, shifting to population health management, and other risks. Relationships with customersmechanisms. Hospitals, which purchase our technology, are also seeking to reduce costs through a variety of mechanisms, including, for example, centralized purchasing, and effective termsin some cases, limiting the number of sale vary by country; often with longer-term receivables than are typicalvendors that may participate in the U.S. Currency exchange rate fluctuations can affect revenues, netpurchasing program. Hospitals are also aligning interests with physicians through employment and other arrangements, such as gainsharing, where a hospital agrees with physicians to share any realized cost savings resulting from changes in practice patterns such as device standardization. This has created an increased level of expenses, and cash flows from operations outside the U.S. We use operational and economic hedges, as well as currency exchange rate derivative contracts, to manage the impact of currency exchange rate changes on earnings and cash flow. See “Item 7A. Quantitative and Qualitative Disclosures About Market Risk” and Note 8 to the consolidated financial statements in “Item 8. Financial Statements and Supplementary Data” in this Annual Report on Form 10-K. In addition, the repatriation of earnings of certain subsidiaries outside the U.S. may result in substantial U.S. tax cost.price sensitivity among customers for our products.
For financial reporting purposes, net sales and property, plant, and equipment attributable to significant geographic areas are presented in Note 17 to the consolidated financial statements in “Item 8. Financial Statements and Supplementary Data” in this Annual Report on Form 10-K.
Production and Availability of Raw Materials
We manufacture most of our products at 89 manufacturing facilities located in various countries throughout the world. For additional information related to our manufacturing facilities refer to Item 2. in this Annual Report on Form 10-K. We purchase many of the components and raw materials used in manufacturing theseour products from numerous suppliers in various countries. For reasons of quality assurance, sole source availability, or cost effectiveness, certainCertain components and raw materials are available only from a sole supplier. We work closely with our suppliers to help ensure continuity of supply while maintaining high quality and reliability. DueGenerally, we have been able to obtain adequate supplies of such raw materials and components.
However, due to the U.S. FDA’s requirements regarding manufacturing of our products,requirements, we may not be able to quickly establish additional or replacement sources for certain components or materials. Generally,materials if we have been able to obtain adequate supplies of such raw materials and components. However,experience a sudden or unexpected reduction or interruption in supply and an inabilityare unable to develop alternative sources for such supply, could adversely affect our operations. We have reporting and disclosure requirementssources.
For additional information related to the use of certain minerals, known as "conflict minerals" (tantalum, tin, tungsten (or their ores), and gold) which are mined from the Democratic Republic of the Congo and adjoining countries. Pursuantour manufacturing facilities refer to these requirements, we are required to report“Item 2. Properties” in this Annual Report on Form SD the procedures we employ to determine the sourcing of such minerals and metals produced from those minerals. There are costs associated with complying with these disclosure requirements, including for diligence in regards to the sources of any conflict minerals used in our products, in addition to the cost of remediation and other changes to products, processes, or sources of supply as a consequence of such verification activities. In addition, the implementation of these rules could adversely affect the sourcing, supply, and pricing of materials used in our products. As of the date of our conflict minerals report for the 2015 calendar year, we were unable to obtain the necessary information on conflict minerals from all of our suppliers and were unable to determine that all of our products are conflict free. We may continue to face difficulties in gathering this information in the future. We may face reputational challenges if we determine that certain of our products contain minerals not determined to be conflict free or if we are unable to sufficiently verify the origins for all conflict minerals used in our products through the procedures we implement.
Working Capital Practices
Our goal is to carry sufficient levels of inventory to ensure adequate supply of raw materials from suppliers and meet the product delivery needs of our customers. We also provide payment terms to customers in the normal course of business and rights to return product under warranty to meet the operational demands of our customers.
Employees
On April 29, 2016, we employed more than 88,000 full-time employees. Our employees are vital to our success. We believe we have been successful in attracting and retaining qualified personnel in a highly competitive labor market due to our competitive compensation and benefits, and our rewarding work environment.
Seasonality
Worldwide sales, including U.S. sales, do not reflect a significant degree of seasonality; however, the number of medical procedures incorporating Medtronic products is generally lower during summer months, due to summer vacation schedules in the northern hemisphere, particularly in European countries. In addition, pulse oximetry sales can be impacted by flu season.10-K.
Government Regulation
Our operations and Other Considerations
Our products are subject to extensive regulation by numerous government agencies, including the U.S. FDA, European regulatory authorities such as the Medicines and similarHealthcare Products Regulatory Agency in the United Kingdom Republic of Ireland and the Federal Institute for Drugs and Medical Devices in Germany, the China National Medical Product Administration (NMPA), and other government agencies inside and outside the U.S. To varying degrees, each of these agencies requires us to comply with laws and regulations governing the development, testing, manufacturing, labeling, marketing, distribution and distributionpost-marketing surveillance of our products. Our business is also affected by patient and data privacy laws and government payer cost containment initiatives, andas well as environmental health and safety laws and regulations. The primary laws and regulations that affect our business are described below.
The laws applicable to us are subject to change and are subject to evolving interpretations. If a governmental authority were to conclude that we are not in compliance with applicable laws and regulations, Medtronic and its officers and employees could be subject to severe criminal and civil penalties including substantial fines and damages, and exclusion from participation as a supplier of product to beneficiaries covered by Medicare or Medicaid.
Product Approval Processesand Monitoring
Many countries where we sell medical devices subject such medical devices and technologies to their own approval and other regulatory requirements regarding performance, safety, and quality of our products. Authorization to commercially distribute a new medical device or technology in the U.S. is generally receivedobtained in one of two primary ways. The first, known as pre-market notification or the 510(k) process, requires us to demonstrate that our new medical device or technology is substantially equivalent to a legally marketed medical device or technology. In this process, we must submit data that supports our equivalence claim. If human clinical data is required, it must be gathered in compliance with U.S. FDA investigational device exemption regulations. We must receive an order from the U.S. FDA finding substantial equivalence to another legally marketed medical device or technology before we can commercially distribute the new medical device or technology. Modifications to cleared medical devices or technologies can be made without using the 510(k) process if the changes do not significantly affect safety or effectiveness. Minimally Invasive Therapies Group products are generally subject to the pre-market notification process. A very small number of our devices are exempt from pre-market review.
device. The second, more rigorous process, known as pre-market approval, (PMA), requires us to independently demonstrate that the newa medical device is safe and effective. We do this by collecting data regarding design, materials, bench and animal testing, and human clinical dataeffective for the medical device. The U.S. FDA will authorize commercial distribution if it determines there is reasonable assurance that the medical device is safe and effective. This determination is based on the benefit outweighing the risk for the populationits intended to be treated with the device.use. This process is generally much more detailed, time-consuming and expensive than the 510(k) process. A third, seldom used, process for approval exists for humanitarian use devices, intended for patient populations of less than 4,000 patients per year in the U.S. This exemption is similar to the PMA process; however, a full showing of product effectiveness from large clinical trials is not required. The threshold for approving these products is probable benefit and safety.
Many countries outside the U.S. to which we export medical devices also subject such medical devices and technologies to their own regulatory requirements. Frequently, regulatory approval may first be obtained in a country outside of the U.S. prior to application in the U.S. due to differing regulatory requirements; however, other countries, such as China for example, require approval in the country of origin first. Most countries outside of the U.S. require that product approvals be recertified on a regular basis, generally every five years. The recertification process requires that we evaluate any device or technology changes and any new regulations or standards relevant to the device or technology and, where needed, conduct appropriate testing to document continued compliance. Where recertification applications are required, they must be approved in order to continue selling our products in those countries. Because export control and economic sanctions laws and regulations are complex and constantly changing, it is possible that laws and regulations may be enacted, amended, enforced or interpreted in a manner materially impacting our ability to sell or distribute products.
In the E.U., a single regulatory approval process exists, and conformity with the legal requirements is represented by the CE Mark. To obtain a CE Mark, defined products must meet minimum standards of performance, safety, and quality (i.e., the essential requirements), and then, according to their classification, comply with one or more of a selection of conformity assessment routes. A notified body assesses the quality management systems of the manufacturer and the product conformity to the essential and other requirements within the medical device directive. Medtronic is subject to inspection by notified bodies for compliance. The competent authorities of the E.U. countries generally in the form of their ministries or departments of health, overseeseparately regulate the clinical research for medical devices and are responsible forthe market surveillance of products once they are placed on the market. We are required to report device failures and injuries potentially related to product use to these authorities in a timely manner. Various penalties exist for non-compliance with the laws transcribing the medical device directives. We anticipate aA new Medical Device Regulation to bewas published by the European UnionE.U. in 2016,2017 which imposes significant additional pre-market and it is likelypost-market requirements (EU MDR). The regulation provided an implementation period and became effective on May 26, 2021. Medical devices marketed in the E.U. will require certification according to impose additional premarket and postmarket requirements.
To be sold in Japan, most medicalthese new requirements, except that devices must undergo thorough safety examinations and demonstrate medical efficacy before they are granted approval, or “shonin.” The Japanese government, through the Ministry of Health, Labour, and Welfare (MHLW), regulates medical devices under the Pharmaceutical Affairs Law (PAL). Oversight for medical devices is conducted with participation by the Pharmaceutical and Medical Devices Agency (PMDA), a quasi-government organization performing many of the review functions for MHLW. Penalties for a company’s noncompliance with PAL could be severe, including revocation or suspension of a company’s business license and criminal sanctions. MHLW and PMDA also assess the quality management systems of the manufacturer and the product conformityvalid CE certificates, issued pursuant to the requirements ofMedical Device Directives before May 2020, can be placed on the PAL. Medtronic is subject to inspection for compliance by these agencies.market until May 2024.
OurThe global regulatory environment is becoming increasingly stringent and unpredictable, which could increase the time, cost and complexity of obtaining regulatory approvals for our products. Several countries that did not have regulatory requirements for medical devices have established such requirements in recent years and other countries have expanded, or plan to expand, on
existing regulations. Certain regulators are requiring local clinical data in addition to global clinical data.unpredictable. While harmonization of global regulations has been pursued, requirements continue to differ significantly among countries. We expect this global regulatory environment will continue to evolve, which could impact the cost, the time needed to approve, and ultimately, our ability to maintain existing approvals or obtain future approvals for our products, or could increaseproducts. Regulations of the cost and time to obtain such approvals in the future. There can be no assurance that any new medical devices we develop will be approved in a timely or cost-effective manner or approved at all.
Ongoing U.S. FDA Regulations
Both before and after a product is commercially released, we have ongoing responsibilities underother regulatory agencies in and outside the U.S. FDA regulations. The U.S. FDA reviewsimpose extensive compliance and monitoring obligations on our business. These agencies review our design and manufacturing practices, labeling, and record keeping, and manufacturers’ required reports of adverse experiences and other information to identify potential problems with marketed medical devices. We are also subject to periodic inspection by the U.S. FDAinspections for compliance with the U.S. FDA’sapplicable quality system regulations, which govern the methods used in, and the facilities and controls used for, the design, manufacture, packaging, and servicing of all finished medical devices intended for human use. In addition, the U.S. FDA and other U.S. regulatory bodies, both in and outside the U.S. (including the Federal Trade Commission, the Office of the Inspector General of the Department of Health and Human Services, the U. S.U.S. Department of Justice, and various state Attorneys General), monitor the manner in which we promotepromotion and advertiseadvertising of our products. Although surgeons are permittedAny adverse regulatory action, depending on its magnitude, may limit our ability to use their medical judgmenteffectively market and sell our products, limit our ability to employ medical devices for indications other than those clearedobtain future pre-market approvals or approved by the U.S. FDA, the U.S. FDA has prohibited manufacturers from promoting products for such “off-label” uses, and has taken the position that manufacturers can only market their products for cleared or approved uses.
If the U.S. FDA were to conclude that we are notresult in compliance with applicable laws or regulations, or that any of our medical devices are ineffective or pose an unreasonable health risk, the U.S. FDA could require us to notify health professionals and others that the devices present unreasonable risks ofa substantial harm to the public health, order a recall, repair, replacement, or refund of such devices, detain or seize adulterated or misbranded medical devices, or ban such medical devices. The U.S. FDA may also impose operating restrictions, enjoin and/or restrain certain conduct resulting in violations of applicable law pertaining to medical devices, including a hold on approving new devices until issues are resolved to its satisfaction, and assess civil or criminal penalties against our officers, employees, or us. The U.S. FDA may also recommend prosecution to the U. S. Department of Justice. Conduct giving rise to civil or criminal penalties may also form the basis for private civil litigation by third-party payers or other persons allegedly harmed by our conduct.
In April 2015, we entered into a consent decree with the U.S. FDA relatingmodification to our Neuromodulation business’ SynchroMed drug infusion systembusiness practices and the Neuromodulation quality system. The consent decree requires the Companyoperations. For additional information, see "Item 1A. Risk Factors" We are subject to complete certain correctionsextensive and enhancements to the SynchroMed pumpcomplex laws and the Neuromodulation quality system. The consent decree limits the Company's ability to manufacturegovernmental regulations and distribute the SynchroMed drug infusion system, unless specific conditions are met. The agreement does not require the retrieval of any of the Company’s products, but the Company must retain a third-party expert to inspect the Neuromodulation quality systemadverse regulatory action may materially adversely affect our financial condition and to provide a certification that the system complies with the requirements of the consent decree. Once this certification is accepted by the U.S. FDA, and a U.S. FDA inspection is successfully completed, the limitations on manufacturer and distribution of SynchroMed pumps will be lifted. Thereafter, the Company must submit periodic audit reports to the U.S. FDA to ensure ongoing compliance with the consent decree.business operations.
In June 2016, TYRX, Inc. received a Warning Letter from the U.S. FDA following an inspection at the TYRX facility in Monmouth Junction, New Jersey. The Company is taking action to address the Warning Letter and has submitted a response to the U.S. FDA.
Governmental Trade Regulations
The salemovement of products, services, and shipment of our products and servicesinvestment across international borders as well as the purchase of components and products from international sources, subjectsubjects us to extensive governmental trade regulations. A variety of laws and regulations both in the U.S. and in the countries in which we transact business apply to the sale, shipment and provision of goods, services and technology across international borders. Because weThese laws and regulations govern, among other things, our import, export and other business activities. We are subject to extensive regulations in the countries in which we operate, we arealso subject to the risk that these laws and regulations could change in a way that would expose us to additional costs, penalties or liabilities. These laws and regulations govern, among other things, our import and export activities.
The U.S. FDA, in cooperation with U.S. Customs and Border Protection (CBP), administers controls over the import of medical devices into the U.S. The CBP imposes its own regulatory requirements on the import of our products, including inspection and possible sanctions for noncompliance. Medtronic is also subject to foreign trade controls administered by several U.S. government agencies, including the Bureau of Industry and Security within the Commerce Department and the Office of Foreign Assets Control within the Treasury Department. We import raw materials, components and finished products into the countries in which we transact business. We act as the importer of record in many instances, but we also sell and ship goods to third parties who are themselves responsible for complying with applicable trade laws and regulations. In our role as importer of record, we are directly responsible for complying with customs laws and regulations concerning the importation of our raw materials, components and
finished products. If applicable government agencies were to determine that we or such third parties were not in compliance with applicable U.S. FDA or customs laws and regulations when engaging in cross-border transactions involving our products, we may be subject to civil or criminal enforcement action, and varying degrees of liability, depending on the nature of the violation and the extent of our culpability. In addition, such determinations may cause supply chain disruptions and delays in the distribution of our products that impact our business activities.
Many countries, including the U.S., control the export and re-export of goods, technology and services for reasons including public health, national security, regional stability, antiterrorism policies and other reasons. In certain circumstances, approval from governmental authorities may be required before goods, technology or services are exported or re-exported to certain destinations, to certain end-users and for certain end-uses. In addition, international sales of our medical devices that have not received U.S. FDA approval are subject to U.S. FDA export requirements. Some governments may also impose economic sanctions against certain countries, persons or entities. In addition to our need to comply with such regulations in connection with our direct export activities, we also sell and provide goods, technology and services to agents, representatives and distributors who may export such items to customers and end-users. If applicable government agencies were to determine that we, or the third parties through which we export goods, weredo business, are not in compliance with applicable import, export control or economic sanctions laws and regulations, when engaging in transactions involving our products, we may be subject to civil or criminal enforcement action, and varying degrees of liability, dependent upon the nature of the violation and the extent of our culpability. Similarly, such determinationsliability. Such actions may cause disruptiondisrupt or delays in the distribution anddelay sales of our products or services or result in restrictions being placed uponon our international distribution and sales of products whichor services that may materially impact our business activities.business.
Anti-Boycott Laws
Under U.S. laws and regulations, U.S. companies and their controlled-in-fact subsidiaries and affiliates outside the U.SU.S. are prohibited from participating or agreeing to participate in unsanctioned foreign boycotts in connection with certain business activities, including the sale, purchase, transfer, shipping or financing of goods or services within the U.S. or between the U.S. and a foreign country. Currently,countries outside of the U.S. considers the Arab League boycott of Israel to constitute an unsanctioned foreign boycott. We are responsible for ensuring we comply with the requirements of U.S. anti-boycott laws for all transactions in which we are involved. If we, or certain third parties through which we sell or provide goods or services, are determined to have violated U.S.violate anti-boycott laws and regulations, we may be subject to civil or criminal enforcement action and varying degrees of liability, dependent upon the nature of the violation and the extent of our culpability. Penalties for any violations of anti-boycott laws and regulations could include criminal penalties and civil sanctions such as fines, imprisonment, debarment from government contracts, loss of export privileges and the denial of certain tax benefits, including foreign tax credits, and outside U.S subsidiary deferrals.liability.
Data Privacy and Security Laws and Regulations
The collection, maintenance, protection, use,As a business with a significant global footprint, compliance with evolving regulations and standards in data privacy and cybersecurity has resulted, and may continue to result, in increased costs, new compliance challenges, and the threat of increased regulatory enforcement activity. Our business relies on the secure electronic transmission, disclosurestorage and disposalhosting of sensitive information, including personal information, are regulatedprotected health information, financial information, intellectual property and other sensitive information related to our customers and workforce.
Our global operational footprint comes with the obligation for compliance and adherence to individual data security, confidentiality and breach notification laws at the U.S. federalState Level, Federal Level, and state, international and industry levels. U.S. federal and stateInternational Level. Examples of those laws protect the confidentiality of certain patient health information, including patient medical records, and restrict the use and disclosure of patient health information by health care providers. For example, the U.S. FDA has issued guidance advising manufacturers to review their cybersecurity practices and policies to assure that appropriate safeguards are in place to prevent unauthorized access or modification to their medical devices or compromise of the security of the hospital network that may be connected to the device. Moreover, in April 2003, the U.S. Department of Health and Human Services (HHS) published patient privacy rules underinclude the Health Insurance Portability and AccountabilityPortability Act of 1996 (HIPAA), as amended, and the Health Information Technology for Economic and Clinical Health Act of 2009 (HITECH) in April 2005, published security rules for protected health information. The HIPAA privacythe U.S., the Global Data Protection Regulation (GDPR) within the European Union, and security rules governvarious other country specific requirements around the use, disclosure, and security of protected health information by “Covered Entities,” which are health care providers that submit electronic claims, health plans, and health care clearinghouses. In 2009, Congress passedworld.
Because the HITECH Act, which modified certain provisions of the HIPAA privacy and security rules for Covered Entities and their Business Associates (which is anyone that performs a service on behalf of a Covered Entity involving the use or disclosure of protected health information and is not a member of the Covered Entity’s workforce). These included directing HHS to publish more specific security standards, and increasing breach notification requirements, as well as tightening certain aspects of the privacy rules. HHS published the final versions of these new rules in January 2013, and Covered Entities and Business Associates were expected to be in compliance by September 2013. In addition, the HITECH Act provided that Business Associates will now be subject to the same security requirements as Covered Entities, and that with regard to both the security and privacy rule, Business Associates will be subject to direct enforcement by HHS, including civil and criminal liability, just as Covered Entities are. In the past, HIPAA has generally affected us indirectly, but these modifications increase the potential for enforcement action against us as a Business Associate. Medtronic is generally not a Covered Entity, except for our Diabetes business, Medtronic Monitoring, Inc. and our health insurance plans. Medtronic only operates as a Business Associate to Covered Entities in a limited number of instances. In those cases, the patient data that we receive and analyze may include protected health information.
A number of states have also adopted laws and regulations continue to expand, differ from jurisdiction to jurisdiction, and are subject to evolving (and at times inconsistent) governmental interpretation, compliance with these laws and regulations may require significant additional cost expenditures or changes in products or business that may affect our privacy and security practices, such as state laws that govern the use, disclosure and protection of social security numbersincrease competition or that are designed to protect credit card account data.
State and local authorities increasingly focus on the importance of protecting individuals from identity theft, with a significant number of states enacting laws requiring businesses to notify individuals of security breaches involving personal information. State consumer protection laws may also apply to privacy and security practices related to personally identifiable information, including information related to consumers and care providers.
We are also impacted by the privacy requirements of countries outside the United States. Privacy standards in Europe and Asia are becoming increasingly strict. Enforcement action and financial penalties related to privacyreduce revenue. Noncompliance could result in the E.U. are growing, and new laws and restrictions are being passed. In Aprilimposition of 2016, the European Council and the Parliament adopted the new General Data Protection Regulation, which sets demanding requirements for the managementfines, penalties, or orders to stop noncompliant activities, or withdrawal of individually identifiable data in the E.U.
The management of cross border transfers of information among and outside of E.U. member countries is becoming more complex, which may complicate our clinical research activities, as well as product offerings that involve transmission or use of clinical data. China and Russia have passed so-called “data localization” laws, which require multi-national companies that store certain individually identifiable data on their citizens to maintain that data on servers located in their country. Restrictions on transfer or processing of that data may apply as well. The restrictions may complicate our operations in those countries, adding complexity and additional management and oversight needs, and the Chinese and Russian governments are still clarifying how they will apply and enforce these laws.
Cost Containment Initiatives
Government and private sector initiatives to limit the growth of health care costs, including price regulation, competitive pricing, bidding and tender mechanics, coverage and payment policies, comparative effectiveness of therapies, technology assessments, and managed-care arrangements, are continuing in many countries where we do business, including the U.S. These changes are causing the marketplace to put increased emphasis on the delivery of more cost-effective medical devices and therapies. Government programs, including Medicare and Medicaid, private health care insurance, and managed-care plans have attempted to control costs by limiting the amount of reimbursement they will pay for particular procedures or treatments, tying reimbursement to outcomes, shifting to population health management, and other mechanisms designed to constrain utilization and contain costs. Hospitals, which purchase implants, are also seeking to reduce costs throughnon-compliant products from a variety of mechanisms, including, for example, creating centralized purchasing functions that set pricing and in some cases limiting the number of vendors that can participate in the purchasing program. Hospitals are also aligning interests with physicians through employment and other arrangements, such as gainsharing, where a hospital agrees with physicians to share any realized cost savings resulting from the physicians’ collective change in practice patterns such as standardization of devices where medically appropriate. This has created an increasing level of price sensitivity among customers for our products.
Some third-party payers must also approve coverage and set reimbursement levels for new or innovative devices or therapies before they will reimburse health care providers who use the medical devices or therapies. Even though a new medical device may have been cleared for commercial distribution, we may find limited demand for the device until coverage and sufficient reimbursement levels have been obtained from governmental and private third-party payers. In addition, some private third-party payers require that certain procedures or that the use of certain products be authorized in advance as a condition of reimbursement. International examples of cost containment initiatives and health care reforms in markets significant to Medtronic's business include Japan, where the government reviews reimbursement rate benchmarks every two years, which may significantly reduce reimbursement for procedures using our medical devices or deny coverage for those procedures. As a result of our manufacturing efficiencies, cost controls and other cost-savings initiatives, we believe we are well-positioned to respond to changes resulting from the worldwide trend toward cost-containment; however, uncertainty remains as to the nature of any future legislation, new or changed coverage and reimbursement government or private payer policies or decisions, or other reforms, making it difficult for us to predict the potential impact of cost-containment trends on future operating results.market.
Regulations Governing Reimbursement
The delivery of our devices is subject to regulation by HHSthe U.S. Department of Health and Human Services (HHS) and comparable state and non-U.S. agencies responsible for reimbursement and regulation of health carehealthcare items and services. U.S. laws and regulations are imposed primarily in connection with federally funded healthcare programs, such as the Medicare and Medicaid programs, as well as the government’s interest in regulating the quality and cost of health care.healthcare. Other governments also impose regulations in connection with their health carehealthcare reimbursement programs and the delivery of health carehealthcare items and services.
U.S. federal health carehealthcare laws apply when we or customers submit claims for items or services that are reimbursed under Medicare, Medicaid,federally-funded healthcare programs, including laws related to kickbacks, false claims, self-referrals or other federally-funded health care programs. The principal U.S. federal laws include: (1) the Anti-kickback Statute, which prohibits offers to pay or receive remuneration of any kind for the purpose of purchasing, ordering, recommending making referrals to items or services reimbursable by a federal health care program; (2) the False Claims Act which prohibits the submission of false or otherwise improper claims for payment to a federally-funded health care program, including claims resulting from a violation of the Anti-kickback Statute; (3) the Stark law, which prohibits physicians from referring Medicare or Medicaid patients
to a provider that bills these programs for the provision of certain designated health services if the physician (or a member of the physician’s immediate family) has a financial relationship with that provider; and (4) health care fraud statutes that prohibit false statements and improper claims to any third-party payer.healthcare fraud. There are often similar state false claims, anti-kickback, and anti-self-referral and insurance laws that apply to state-fundedstate Medicaid and other health carehealthcare programs and private third-party payers. Insurance companies can also bring a private cause of action for treble damages against a manufacturer for a pattern of causing false claims to be filed under the federal Racketeer Influenced and Corrupt Organizations Act, or RICO. In addition, as a manufacturer theof U.S. FDA-approved devices reimbursable by federal healthcare programs, we are subject to the Physician Payments Sunshine Act, which requires us to annually report certain payments and other transfers of value we make to U.S.-licensed physicians or U.S. teaching hospitals. Further, the U.S. Foreign Corrupt Practices Act (FCPA) can be used to prosecute companies in the U.S. for arrangements with physicians, or other parties outside the U.S. if the physician or party is a government official of another country and the arrangement violates the law of that country.
The laws and regulations of health care goods and services that are applicable to us, including those described above, are subject to evolving interpretations and enforcement discretion. If a governmental authority were to conclude that we are not in compliance with applicable laws and regulations, we and our officers and employees could be subject to severe criminal and civil financial penalties, including, for example, exclusion from participation as a supplier of product to beneficiaries covered by Medicare. Any failure to comply with these laws and regulations relatingcould subject us or our officers and employees to criminal and civil financial penalties.
Implementation of legislative or regulatory reforms to reimbursement and health care goods and services could adversely affect our reputation, business, financial condition and cash flows.
Our profitability and operations are subject to risks relating to changes in legislative, regulatory and reimbursement policies and decisions as well as changes to private payer reimbursement coverage and payment decisions and policies. Implementation of further legislative or administrative reforms to the reimbursement system in the U.S. and abroad,systems, or adverse decisions relating to our products by administrators of these systems in coverage or reimbursement, could significantly reduce reimbursement or result in the denial of coverage, which could have an impact on the acceptance of and demand for our products and the prices that our customers are willing to pay for them.
Environmental Health and Safety Laws
We are also subject to various environmental health and safety laws and regulations both within and outside the U.S. Similar toLike other companies in our industry, our manufacturing and other operations involve the use and transportation of substances regulated under environmental health and safety laws including those related to the transportation of hazardous materials. To
Available Information
We maintain a website at www.medtronic.com. Our Annual Reports on Form 10-K, Quarterly Reports on Form 10-Q, Current Reports on Form 8-K, and amendments to those reports filed or furnished pursuant to Section 13(a) or 15(d) of the bestSecurities Exchange Act of 1934, as amended (Exchange Act) are made available under the “Our Company – Investors” caption and “Financials – SEC Filings” subcaption of our knowledge at this time,website as soon as reasonably practicable after we do not expect that complianceelectronically file them with, environmental protection laws will have a material impact on our consolidated results of operations, financial position, and/or cash flows.furnish them to, the Securities and Exchange Commission (SEC).
Litigation Risks
Patent Litigation We operate in an industry characterized by extensive patent litigation. Patent litigation can result in significant damage awards and injunctions that could prevent the manufacture and sale of affected products or result in significant royalty payments in order to continue selling the products. At any given time, we are involved as both a plaintiff and a defendant in a number of patent infringement actions, the outcomes of which may not be known for prolonged periods of time. While it is not possible to predict the outcome of patent litigation incidentsInformation relating to our business, we believecorporate governance, including our Principles of Corporate Governance, Code of Conduct (including our Code of Ethics for Senior Financial Officers and any related amendments or waivers), Code of Business Conduct and Ethics for Members of the outcomes associated with this type
Board of Directors, and information concerning our consolidated results of operations, financial position, or cash flows. For additional information, see “Item 1A. Risk Factors - We are substantially dependent on patentexecutive officers, directors and other proprietary rights and failingBoard committees (including committee charters) is available through our website at www.medtronic.com under the “Our Company – Governance” caption. Information relating to protect such rights or to be successfultransactions in litigation related to our rights or the rights of others may result in our payment of significant monetary damages and/or royalty payments, negatively impact our ability to sell current or future products, or prohibit us from enforcing our patent and other proprietary rights against others.” and Note 15 to the consolidated financial statements in “Item 8. Financial Statements and Supplementary Data” in this Annual Report on Form 10-K.
Product Liability and Other Claims We operate in an industry susceptible to significant product liability claims. These claims may be broughtMedtronic securities by individuals seeking relief on their own behalf or purporting to represent a class. We are also susceptible to other litigation, including private securities litigation, shareholder derivative suits and contract litigation. These claims may be asserted against us in the future based on events we are not aware of at the present time. While it is not possible to predict the outcome of product liability litigation, we believe the outcomes associated with this type of litigation could have a material adverse impact on our consolidated results of operations, financial position, or cash flows. For additional information, see “Item 1A. Risk Factors - Quality problems with, and product liability claims in connection with, our processes, goods, and services, could lead to recalls or safety alerts, harm our reputation and have a material adverse effect on our business, results of operations, financial condition and our cash flows.” and Note 15 to the consolidated financial statements in “Item 8. Financial Statements and Supplementary Data” in this Annual Report on Form 10-K.
Insurance
We have elected to self-insure most of our insurable risks across the Company, and we made this decision based on costs and availability factors in the insurance marketplace. We continue to maintain a directors' and officers' liability insurance policy providing coverage for the directors and officers ofis available through our website at www.medtronic.com under the Company.“Our Company – Investors” caption and the “Financials – SEC Filings” subcaption.
Our website and the information contained on or connected to our website are not incorporated by reference into this Form 10-K.
The SEC maintains a website that contains reports, proxy and information statements, and other information regarding issuers, including the Company, that file electronically with the SEC. The public may obtain any documents that we file with the SEC at http://www.sec.gov. We continue to monitorfile annual reports, quarterly reports, proxy statements, and other documents with the insurance marketplace to evaluate the value to us of obtaining insurance coverage for other categories of losses in the future. Based on historical loss trends, we believe that our self-insurance program accruals and our existing insurance coverage will be adequate to cover future losses. Historical trends, however, may not be indicative of future losses. The absence of third-party insurance coverage for other categories of losses increases our exposure to unanticipated claims and these losses could have a material adverse impact on our consolidated earnings, financial condition and/or cash flows.
Section 13(r) ofSEC under the Exchange ActAct.
Under Section 13(r) of the Exchange Act, the Company is required to include certain disclosures in its periodic reports if the Company or any of its affiliates knowingly engaged in certain specified activities during the period covered by the report. As a global medical device company, Medtronic conducts business throughout the world, including supplying life enhancing medical products for patient use in Iran in accordance with authorizations issued by the U.S. Department of the Treasury’s Office of Foreign Assets Control (OFAC) and other U.S. and non-U.S. governmental entities, and consistent with the Company’s corporate policies. As part of its ongoing global trade compliance program, the Company identified that certain authorized shipments during the period covered by this report, which were arranged and effectuated by third-party logistics providers, were sent to Iran on aircraft owned or operated by Iran Air. This air carrier was designated under Executive Order 13382 during the relevant time period. Iran Air’s designation under Executive Order 13382 was terminated on January 16, 2016. While Medtronic paid associated freight expenses to the third-party logistics company, there were no gross revenues or net profits accrued by Medtronic as a result of Iran Air being used by the third-party logistics providers. Medtronic is taking corrective actions with regard to its third party logistics providers to confirm that air carriers designated under the Executive Orders are not used to ship Medtronic medical products in the future, and will implement additional controls as necessary. The Company has also notified OFAC regarding this matter.
Executive Officers of Medtronic
Set forth below are the names and ages of current Section 16(b) executive officers of Medtronic, as well as information regarding their positions with Medtronic, their periods of service in these capacities, and their business experiences. There are no family relationships among any of the officers named, nor is there any arrangement or understanding pursuant to which any person was selected as an officer.
Omar Ishrak, age 60, has been Chairman and Chief Executive Officer of the Company since January 2015 and of Medtronic, Inc. since June 2011. Prior to that, Mr. Ishrak served as President and Chief Executive Officer of GE Healthcare Systems, a division of GE Healthcare, from 2009 to 2011. Prior to that, Mr. Ishrak was President and Chief Executive Officer of GE Healthcare Clinical Systems from 2005 to 2008 and President and Chief Executive Officer of GE Healthcare Ultrasound and BMD from 1995 to 2004.
Michael J. Coyle, age 54, has been Executive Vice President and Group President, Cardiac and Vascular Group of the Company since January 2015 and of Medtronic, Inc. since December 2009. Prior to that, he served as President of the Cardiac Rhythm Management division at St. Jude from 2001 to 2007, and prior positions included serving St. Jude as President of the company’s Daig Catheter division and numerous leadership positions at Eli Lilly & Company.
Gary L. Ellis, age 59, has served as Executive Vice President of Global Operations and Information Technology since June 2016. Mr. Ellis previously served as Executive Vice President and Chief Financial Officer of the Company beginning in January 2015 and of Medtronic, Inc. beginning in April 2014. Prior to that, he was Senior Vice President and Chief Financial Officer from May 2005 to April 2014; Vice President, Corporate Controller and Treasurer from October 1999 to May 2005, and Vice President and Corporate Controller from August 1994 to October 1999. Mr. Ellis joined Medtronic in 1989 as Assistant Corporate Controller and was promoted to Vice President of Finance for Medtronic Europe in 1992, until being named as Corporate Controller in 1994. Mr. Ellis is a member of the board of directors of The Toro Company and past chairman of the American Heart Association.
Hooman C. Hakami, age 46, has been Executive Vice President and Group President, Diabetes Group of the Company since January 2015 and of Medtronic, Inc. since June 2014. Prior to that, he was President and Chief Executive Officer of Detection and Guidance Solutions at GE Healthcare from April 2012 to May 2014. Prior to that, he served as President and Chief Executive Officer of Interventional Systems from July 2009 to April 2012; Global Business Transformation leader for GE Healthcare from December 2008 to July 2009; and Vice President and General Manager, Global Ultrasound Services from June 2004 to December 2008. Mr. Hakami started his career with GE and has held the following financial roles: Chief Financial Officer for the Global Ultrasound division from 2001 to 2004; Chief Financial Officer for Clinical and Multi-vendor Services from 1999 to 2001; as well as various finance roles at GE Capital from 1994 to 1999; GE's Aerospace Division from 1992 to 1994 and GE Power Systems from 1991 to 1992.
Bryan C. Hanson, age 49, has been Executive Vice President and Group President, Minimally Invasive Therapies Group of the Company since February 2015. Prior to that, he was Senior Vice President and Group President, Covidien since October 2014; Senior Vice President and Group President, Medical Devices and United States of Covidien from October 2013 to September 2014; Senior Vice President and Group President of Covidien for the Surgical Solutions business from July 2011 to October 2013; and President of Covidien’s Energy-based Devices business from July 2006 to June 2011. Mr. Hanson held several other positions of increasing responsibility in sales, marketing and general management with Covidien from October 1992 to July 2006.
Bradley E. Lerman, age 59, has been Senior Vice President, General Counsel and Corporate Secretary of the Company since January 2015 and of Medtronic, Inc. since May 2014. Prior to that, he was Executive Vice President, General Counsel, and Corporate Secretary at Federal National Mortgage Association (Fannie Mae) from October 2012 to May 2014; Senior Vice President and Chief Litigation Counsel at Pfizer, Inc. from January 2009 to September 2012; Partner at Winston & Strawn from August 1998 to January 2009; partner at Kirkland & Ellis from March 1996 to July 1998; Associate Independent Counsel from October 1994 to March 1996; and Assistant U.S. Attorney in the Northern District of Illinois from February 1986 to September 1994.
Geoffrey S. Martha, age 46, has been Executive Vice President and President, Restorative Therapies Group since June 2015. Mr. Martha previously served as Senior Vice President of Strategy and Business Development of the Company beginning in January 2015 and of Medtronic, Inc. beginning in August 2011. Prior to that, he served as Managing Director of Business Development at GE Healthcare from April 2007 to July 2011; General Manager for GE Capital Technology Finance Services from November 2003 to March 2007; Senior Vice President, Business Development for GE Capital Vendor Financial Services from February 2002 to October 2003; General Manager for GE Capital Colonial Pacific Leasing from February 2001 to January 2002; and Vice President, Business Development for Potomac Federal, the GE Capital federal financing investment bank from May 1998 to January 2001.
Karen L. Parkhill, age 50, joined the Company as Executive Vice President and Chief Financial Officer in June 2016. From 2011 to 2016, Ms. Parkhill served as Vice Chairman and Chief Financial Officer of Comerica Incorporated. Ms. Parkhill was a member of Comerica’s Management Executive Committee and the Comerica Bank Board of Directors. Prior to joining Comerica, Ms. Parkhill worked for J.P. Morgan Chase & Co. in various capacities from 1992 to 2011, including serving as Chief Financial Officer of the Commercial Banking business from 2007 to 2011. Ms. Parkhill is also a current member of the Board of Directors for the Methodist Health System in Dallas.
Carol A. Surface, age 50, has been Senior Vice President and Chief Human Resources Officer of the Company since January 2015 and of Medtronic, Inc. since September 2013. Prior to that, she was the Executive Vice President and Chief Human Resources Officer at Best Buy Co., Inc. from March 2010 to September 2013, and held a series of HR leadership roles at PepsiCo Inc., from May 2000 to March 2010.
Robert ten Hoedt, age 55, has been Executive Vice President and President, EMEA of the Company since January 2015 and of Medtronic, Inc. since May 2014. Prior to that, he was Senior Vice President and President, EMEA and Canada from 2009 to 2014; Vice President CardioVascular Europe and Central Asia from 2006 to 2009; Vice President and General Manager, Vitatron from 1999 to 2006; Gastro-Uro leader from 1994 to 1999; and Marketing Manager, Neurological from 1991 to 1994.
Item 1A. Risk Factors
Investing in usour securities involves a variety of risks and uncertainties, known and unknown, including, among others, those discussed below. Each of the following risks should be carefully considered. Basedconsidered, together with all the other information included in this Annual Report on Form 10-K, including our consolidated financial statements and the information currently known to us, we believerelated notes and in our other filings with the following information identifies the most significant risk factors affecting our Company. However, the risks and uncertainties described below are not the only ones related to our businesses and are not necessarily listed in the order of their importance. AdditionalSEC. Furthermore, additional risks and uncertainty not presently known to us or that we currently believe to be immaterial may also adversely affect our business. Our business, results of operations, financial condition, and cash flow and prospects could be materially and adversely affected by any of these risks or uncertainties.
Business and Operational Risks Relating to the Company
We operate in a highly competitive industry and we may be unable to compete effectively.
We compete in both the therapeutic and diagnostic medical markets in approximately 160more than 150 countries throughout the world. These markets are characterized by rapid change resulting from technological advances and scientific discoveries. In the product lines in which we compete, we face a mixturerange of competitors ranging from large manufacturerscompanies with multiple business lines to small, specialized manufacturers that offer a limited selection of niche products. Development by other companies of new or improved products, processes, technologies, or the introduction of reprocessed products or generic versions when our proprietary products lose their patent protection may make our productsexisting or proposedplanned products less competitive. In addition, we face competition from providers of alternative medical therapies, such as pharmaceutical companies.
We believe our ability to compete depends upon many factors both within and beyond our control, including:
Competitive factors include:
product reliability,
•product performance and reliability,
•product technology and innovation,
•product quality and safety,
•breadth of product lines,
•product support services,
•customer support,
•cost-effectiveness and price, and
•reimbursement approval from health carehealthcare insurance providers.providers, and
We also face competition for marketing, distribution, and collaborative development agreements, for establishing relationships•changes to the regulatory environment.
Competition may increase as additional companies enter our markets or modify their existing products to compete directly with academic and research institutions, and for licenses to intellectual property.ours. In addition, academic institutions, governmental agencies and other public and private research organizations also may conduct research, seek patientpatent protection and establish collaborative arrangements for discovery, research, clinical development and marketing of products similar to ours. These companies and institutions compete with us in recruiting and retaining qualified scientific and management personnel, as well as in acquiring necessary product technologies.
Major shifts From time to time we have lost, and may in industrythe future lose, market share have occurred in connection with product problems, physician advisories, safety alerts and publications about our products; reflectingproducts, which highlights the importance of product quality, product efficacy and quality systems into our industry.business. In the current environment of managed care, consolidation among health carehealthcare providers, increased competition, and declining reimbursement rates, and national and provincial tender pricing, as recently experienced in China, competitively priced product offerings are essential to our success. Further, our continued growth and success depend on our ability to develop, acquire and market new and differentiated products, technologies and intellectual property, and as a result we have been increasingly requiredalso face competition for marketing, distribution, and collaborative development agreements, establishing relationships with academic and research institutions and licenses to compete on the basis of price.intellectual property. In order to continue to compete effectively, we must continue to create, invest in or acquire advanced technology, incorporate this technology into our proprietary products, obtain regulatory approvals in a timely manner, and manufacture and successfully market our products. Given these factors, we cannot guarantee that we will be able to compete effectively or continue our level of successsuccess.
The ongoing global COVID-19 pandemic has had, and may continue to have, an adverse effect on certain aspects of our business, results of operations, financial condition and cash flows. The nature and extent of future impacts are highly uncertain and unpredictable.
Our global operations and interactions with healthcare systems, providers and patients around the world expose us to risks associated with public health crises, including epidemics and pandemics such as COVID-19. In particular, the continuing preventative and precautionary measures that we and other businesses, communities, and governments have taken to mitigate the spread of the disease has led to restrictions on, disruptions in, and other related impacts on business and personal activities, including reduced customer demand for certain of our products and has resulted in many of our employees working remotely. We expect medical procedure rates to continue to vary by therapy and country, and could be impacted by regional COVID-19 case volumes, healthcare system staffing shortages, patient’s willingness to schedule deferrable procedures, travel restrictions, transportation limitations, quarantine restrictions, vaccine and booster immunization rates, and new COVID-19 variants. While COVID-19 case volumes appear to be decreasing in the U.S and certain other countries as a result of higher vaccination rates, the global COVID-19 outlook remains uncertain as new variants emerge.
Together with the preventative and precautionary measures being taken, as well as the corresponding need to adapt to new and improved methods of conducting business, such as increased remote monitoring, COVID-19 is having, and may continue to have, an adverse impact on certain aspects of our Company and business, including the demand for and supply of certain of our products, operations, supply chains and distribution systems, impacts or delays to product development milestones, clinical trials, or regulatory clearances and approval timing, and our ability to generate cash flow, and may have an adverse impact on our ability to access capital. Some of our products are more sensitive to reductions in deferrable and emergent medical procedures, and, as hospital systems prioritize treatment of COVID-19 patients and otherwise comply with government guidelines, certain medical procedures have been and may continue to be suspended or postponed. It is not possible to predict the timing of deferrable medical procedures and, to the extent individuals and hospital systems de-prioritize, delay or cancel these procedures, or if unemployment or loss of insurance coverage adversely impacts an individual’s ability to pay for our products and services, our business, results of operations, financial condition, and cash flows could continue to be negatively affected. Further, the COVID-19 pandemic has strained hospital systems around the world, resulting in adverse financial impacts to those systems that could result in reduced future expenditures for certain capital equipment and other products and services we provide, as well as potential disruption of product launches of our recently approved products.
A number of our global suppliers, vendors, and distributors have been adversely affected by the COVID-19 pandemic, including employee absenteeism. These impacts could impair our ability to move our products through distribution channels to end customers, and any such delay or shortage in the supply of components or materials may result in our industry.inability to satisfy consumer demand for certain of our products in a timely manner or at all, which could harm our reputation, future sales and profitability.
COVID-19 has impacted and may further impact the global economy and capital markets, including by negatively impacting demand for a number of our products, access to capital markets (including the commercial paper market), foreign currency exchange rates, and interest rates, each of which may adversely impact our business and liquidity. We could experience loss of sales and profits due to delayed payments or insolvency of healthcare professionals, hospitals and other customers, suppliers and vendors facing liquidity issues. As a result, we may be compelled to take additional measures to preserve our cash flow.
COVID-19 could adversely impact our ability to retain key employees and the continued service and availability of skilled personnel necessary to run our complex productions and operations, including our executive officers and other key members of our management team.
While the impact of COVID-19 has had, and may continue to have, an adverse effect on our business, results of operations, financial condition and cash flows, the nature and extent of such impact is highly uncertain and unpredictable, as we cannot predict with confidence the duration of the pandemic.
Reduction or interruption in supply and an inability to develop alternative sources for supply or other manufacturing difficulties may adversely affect our manufacturing operations and related product sales.
The manufacture of our products requires the timely delivery of a sufficient amount of quality components and materials and is highly exacting and complex, due in part to strict regulatory requirements. We manufacture mostthe majority of our products and procure important third-party services, such as sterilization services, at numerous manufacturing facilities located throughout the world.worldwide. We purchase many of the components, and raw materials used in manufacturingand services needed to manufacture these products from numerous suppliers in various countries. We seek to maintain continuity of supply by use of multiple options for sourcing where possible. We have generally been able to obtain adequate supplies of such raw materials, components and components. However,services, although global shortages of certain components such as semiconductors and resins have recently caused, and may in the future cause, disruptions to our product manufacturing supply chain. In addition, for reasons of quality assurance, cost effectiveness, or availability, we procure certain components, and raw materials and services needed to manufacture our products are obtained from a sole supplier. WeAlthough we work closely with our suppliers to try to ensure continuity of supply while maintaining high quality and reliability. However, we cannot guarantee thatreliability, the supply of these efforts willcomponents, raw materials and services may be successful.interrupted or insufficient. In addition, due to the stringent regulations and requirements of regulatory agencies, including the U.S. FDA, regarding the manufacture of our products, we may not be able to quickly establish additional or replacement sourcessources. Additionally, many regulatory agencies are imposing regulatory requirements on safe use of
chemicals and their potential impact on health and the environment which also may impact supply constraints. Furthermore, the prices of commodities and other materials used in our products, which are often volatile and outside of our control, could adversely impact our supply. We use resins, other petroleum-based materials and pulp as raw materials in some of our products, and the prices of oil and gas also significantly affect our costs for certain components or materials.freight and utilities. A reduction or interruption in supply, and an inability to develop alternative sources for such supply, could adversely affect our ability to manufacture our products in a timely or cost-effective manner and to make our related productcould result in lost sales.
Other problemsdisruptions in the manufacturing process or product sales and fulfillment systems for any reason, including equipment malfunction, failure to follow specific protocols and procedures, supplier facility shut-downs, defective raw materials, natural disasters such as hurricanes, tornadoes, earthquakes, or wildfires, property damage or facility closures from riots or public protests, and other environmental factors and the impact of epidemics or pandemics, such as the COVID-19 pandemic, and actions by businesses, communities and governments in response, could lead to launch delays, product shortage, unanticipated costs, lost revenues and damage to our reputation. AFor example, in the past we have experienced a global information technology systems interruption that affected our customer ordering, distribution, and manufacturing processes, and we have been adversely impacted by, and may continue to be adversely impacted by, the global COVID-19 pandemic and the responses of governments and of our partners, including suppliers, manufacturers, distributors and other businesses. Furthermore, any failure to identify and address manufacturing problems prior to the release of products to our customers may alsocould result in quality or safety issues.
In addition, many of our products require sterilization before sale and several of our key products are manufactured or sterilized at a single manufacturingparticular facility, with limited alternate facilities. If an event occurs that results in damage to or closure of one or more of such facilities, such as the Illinois Environmental Protection Agency's decision to close a supplier's sterilization facility in February 2019, we may be unable to manufacture or sterilize the relevant products atto the previous levelsrequired quality specifications or at all. Because of the time required to approve and license a manufacturing or sterilization facility, a third-party manufacturer may not be available on a timely basis to replace production capacity in the event manufacturing or sterilization capacity is lost.
Moreover, pursuant to the conflict minerals requirements promulgated by the SEC as a part of Dodd-Frank, we are required to report on the source of any conflict minerals used in our products, as well as the process we use to determine the source of such materials. We will continue to incur expenses as we work with our suppliers to evaluate the source of any conflict minerals in our products, and compliance with these requirements could adversely affect the sourcing, supply, and pricing of our raw materials.
Our industry is experiencing greater scrutiny and regulation by governmental authorities, which may lead to greater regulation in the future.
Our medical devices and technologies and our business activities are subject to a complex regime of regulations and an aggressive enforcement environment, including by the U.S. FDA, U. S. Department of Justice, Health and Human Services-Office of the
Inspector General, and numerous other federal, state, and non-U.S. governmental authorities. These authorities and members of Congress have been increasing their scrutiny of our industry. In addition, certain state governments and the federal government have enacted legislation aimed at increasing transparency of our interactions with health care providers. As a result, we are required by law to disclose payments and other transfers of value to health care providers licensed by certain states and to all U.S. physicians and U.S. teaching hospitals at the federal level. Any failure to comply with these legal and regulatory requirements could impact our business. In addition, we may continue to devote substantial additional time and financial resources to further develop and implement policies, systems, and processes to comply with enhanced legal and regulatory requirements, which may also impact our business. We anticipate that governmental authorities will continue to scrutinize our industry closely, and that additional regulation may increase compliance and legal costs, exposure to litigation, and other adverse effects to our operations.
We are subject to costly and complex laws and governmental regulations and any adverse regulatory action may materially adversely affect our financial condition and business operations.
Our medical devices are subject to regulation by numerous government agencies, including the U.S. FDA and comparable agencies outside the U.S. To varying degrees, each of these agencies requires us to comply with laws and regulations governing the development, testing, manufacturing, labeling, marketing, and distribution of our products. We cannot guarantee that we will be able to obtain or maintain marketing clearance for our new products or enhancements or modifications to existing products, and the failure to maintain approvals or obtain approval or clearance could have a material adverse effect on our business, results of operations, financial conditions and cash flows. Even if we are able to obtain such approval or clearance, it may:
take a significant amount of time,
require the expenditure of substantial resources,
involve stringent clinical and pre-clinical testing, as well as increased post-market surveillance,
involve modifications, repairs, or replacements of our products, and
result in limitations on the proposed uses of our products.
Both before and after a product is commercially released, we have ongoing responsibilities under U.S. FDA regulations. Many of our facilities and procedures and those of our suppliers are also subject to periodic inspections by the U.S. FDA to determine compliance with the U.S. FDA’s requirements, including primarily the quality system regulations and medical device reporting regulations. The results of these inspections can include inspectional observations on U.S. FDA’s Form-483, warning letters, or other forms of enforcement. Since 2009, the U.S. FDA has significantly increased its oversight of companies subject to its regulations, including medical device companies, by hiring new investigators and stepping up inspections of manufacturing facilities. The U.S. FDA has recently also significantly increased the number of warning letters issued to companies. If the U.S. FDA were to conclude that we are not in compliance with applicable laws or regulations, or that any of our medical devices are ineffective or pose an unreasonable health risk, the U.S. FDA could ban such medical devices, detain or seize adulterated or misbranded medical devices, order a recall, repair, replacement, or refund of such devices, refuse to grant pending pre-market approval applications or require certificates of non-U.S governments for exports, and/or require us to notify health professionals and others that the devices present unreasonable risks of substantial harm to the public health. The U.S. FDA may also assess civil or criminal penalties against us, our officers or employees and impose operating restrictions on a company-wide basis, or enjoin and/or restrain certain conduct resulting in violations of applicable law. The U.S. FDA may also recommend prosecution to the U. S. Department of Justice. Any adverse regulatory action, depending on its magnitude, may restrict us from effectively marketing and selling our products and limit our ability to obtain future pre-market clearances or approvals, and could result in a substantial modification to our business practices and operations.
In addition, the U.S. FDA has taken the position that device manufacturers are prohibited from promoting their products other than for the uses and indications set forth in the approved product labeling. A number of enforcement actions have been taken against manufacturers that promote products for “off-label” uses, including actions alleging that federal health care program reimbursement of products promoted for “off-label” uses constitute false and fraudulent claims to the government. The failure to comply with “off-label” promotion restrictions can result in significant civil or criminal exposure, administrative obligations and costs, and/or other potential penalties from, and/or agreements with, the federal government.
Pursuant to Dodd-Frank, the SEC promulgated final rules regarding disclosure of the use of certain minerals, known as "conflict minerals" (tantalum, tin, tungsten (or their ores), and gold) which are mined from the Democratic Republic of the Congo and adjoining countries. Under the rules, we are now required to disclose the procedures we employ to determine the sourcing of such minerals and metals produced from those minerals. There are costs associated with complying with these disclosure requirements, including for diligence in regards to the sources of any conflict minerals used in our products, in addition to the cost of remediation and other changes to products, processes, or sources of supply as a consequence of such verification activities. In addition, the implementation of these rules could adversely affect the sourcing, supply, and pricing of materials used in our products. As of the date of our conflict minerals report for the 2015 calendar year, we were unable to obtain the necessary information on conflict minerals from all of our suppliers and were unable to determine that all of our products are conflict free. In addition, we may continue to face difficulties in gathering this information in the future. We may face reputational challenges if we determine that
certain of our products contain minerals not determined to be conflict free or if we are unable to sufficiently verify the origins for all conflict minerals used in our products through the procedures we implement.
Governmental regulations outside the U.S have become increasingly stringent and more common, and we may become subject to more rigorous regulation by governmental authorities in the future. In the European Union, for example, we anticipate a new Medical Device Regulation to be published in 2016, and it is likely to impose additional premarket and postmarket requirements. Penalties for a company’s non-compliance with governmental regulation could be severe, including fines, revocation or suspension of a company’s business license, mandatory price reductions and criminal sanctions. Any governmental law or regulation imposed in the future may have a material adverse effect on us.
We are subject to environmental laws and regulations and the risk of environmental liabilities, violations and litigation.
We are subject to numerous U.S. federal, state, local and non-U.S. environmental, health and safety laws and regulations concerning, among other things, the generation, storage, use and transportation of hazardous materials, emissions or discharges of substances into the environment, investigation and remediation of hazardous substances or materials at various sites, chemical constituents in medical equipment and end-of-life disposal and take-back programs, and the health and safety of our employees. Our operations involve the use of substances regulated under such laws and regulations, primarily those used in manufacturing and sterilization processes. If we violate these environmental laws and regulations, we could be fined, criminally charged or otherwise sanctioned by regulators. Furthermore, environmental laws outside of the U.S. are becoming more stringent, resulting in increased costs and compliance burdens.
In addition, certain environmental laws assess liability on current or previous owners or operators of real property for the costs of investigation, removal or remediation of hazardous substances or materials at their properties or at properties which they have disposed of hazardous substances. Liability for investigative, removal and remedial costs under certain U.S. federal and state laws are retroactive, strict and joint and several. In addition to cleanup actions brought by governmental authorities, private parties could bring personal injury or other claims due to the presence of, or exposure to, hazardous substances. The ultimate cost of site cleanup and timing of future cash outflows is difficult to predict, given the uncertainties regarding the extent of the required cleanup, the interpretation of applicable laws and regulations, and alternative cleanup methods.
We may in the future be subject to additional environmental claims for personal injury or cleanup based on our past, present or future business activities (including the past activities of companies we have acquired). The costs of complying with current or future environmental protection and health and safety laws and regulations, or liabilities arising from past or future releases of, or exposures to, hazardous substances, may exceed our estimates, or have a material adverse effect on our business, consolidated earnings, financial condition, and/or cash flow.
Our failure to comply with laws and regulations relating to reimbursement of health care goods and services may subject us to penalties and adversely impact our reputation, business, financial condition and cash flows.
Our devices, products and therapies are purchased principally by hospitals or physicians that typically bill various third-party payers, such as governmental programs (e.g., Medicare, Medicaid and comparable non-U.S. programs), private insurance plans and managed care plans, for the healthcare services provided to their patients. The ability of our customers to obtain appropriate reimbursement for products and services from third-party payers is critical because it affects which products customers purchase and the prices they are willing to pay. As a result, our devices, products and therapies are subject to regulation regarding quality and cost by HHS, including the Centers for Medicare & Medicaid Services (CMS) as well as comparable state and non-U.S. agencies responsible for reimbursement and regulation of health care goods and services. The principal U.S. federal laws implicated include those that prohibit (i) the filing of false or improper claims for federal payment, known as the false claims laws, (ii) unlawful inducements for the referral of business reimbursable under federally-funded health care programs, known as the anti-kickback laws, and (iii) health care service providers from seeking reimbursement for providing certain services to a patient who was referred by a physician who has certain types of direct or indirect financial relationships with the service provider, known as the Stark law. Many states have similar laws that apply to reimbursement by state Medicaid and other funded programs as well as in some cases to all payers. Insurance companies can also bring a private cause of action for treble damages against a manufacturer for causing a false claim to be filed under the federal Racketeer Influenced and Corrupt Organizations Act, RICO. In addition, as a manufacturer of U.S. FDA-approved devices reimbursable by federal healthcare programs, we are subject to the Physician Payments Sunshine Act, which requires us to annually report certain payments and other transfers of value we make to U.S.-licensed physicians or U.S. teaching hospitals.
Our profitability and international operations are subject to risks relating to changes in government and private medical reimbursement programs and policies, and changes in legal regulatory requirements in the U.S. and around the world. Implementation of further legislative or administrative reforms to the reimbursement system in the U.S. and abroad, or adverse decisions relating to our products by administrators of these systems in coverage or reimbursement, could significantly reduce
reimbursement or result in the denial of coverage, which could have an impact on the acceptance of and demand for our products and the prices that our customers are willing to pay for them.
The laws and regulations of health care goods and services that are applicable to us, including those described above, are subject to evolving interpretations. If a governmental authority were to conclude that we are not in compliance with applicable laws and regulations, we and our officers and employees could be subject to severe criminal and civil penalties, including, for example, exclusion from participation as a supplier of product to beneficiaries covered by CMS. Any failure to comply with laws and regulations relating to reimbursement and health care goods and services could adversely affect our reputation, business, financial condition and cash flows.
We are substantially dependent on patent and other proprietary rights and failing to protect such rights or to be successful in litigation related to our rights or the rights of others may result in our payment of significant monetary damages and/or royalty payments, negatively impact our ability to sell current or future products, or prohibit us from enforcing our patent and other proprietary rights against others.
We are substantially dependent on patent and other proprietary rights and rely on a combination of patents, trade secrets, and non-disclosure and non-competition agreements to protect our proprietary intellectual property. We also operate in an industry characterized by extensive patent litigation. Patent litigation against us can result in significant damage awards and injunctions that could prevent our manufacture and sale of affected products or require us to pay significant royalties in order to continue to manufacture or sell affected products. At any given time, we are generally involved as both a plaintiff and a defendant in a number of patent infringement actions, the outcomes of which may not be known for prolonged periods of time. While it is not possible to predict the outcome of patent litigation, we believe the results associated with any such litigation could result in our payment of significant monetary damages and/or royalty payments, negatively impact our ability to sell current or future products, or prohibit us from enforcing our patent and proprietary rights against others, which would generally have a material adverse impact on our consolidated earnings, financial condition, and/or cash flows.
While we intend to defend against any threats to our intellectual property, our patents, trade secrets, or other agreements may not adequately protect our intellectual property. Further, pending patent applications owned by us may not result in patents being issued to us, patents issued to or licensed by us in the past or in the future may be challenged or circumvented by competitors and such patents may be found invalid, unenforceable or insufficiently broad to protect our technology or to provide us with any competitive advantage. Third parties could obtain patents that may require us to negotiate licenses to conduct our business, and the required licenses may not be available on reasonable terms or at all. We also rely on non-disclosure and non-competition agreements with certain employees, consultants, and other parties to protect, in part, trade secrets and other proprietary rights. We cannot be certain that these agreements will not be breached, that we will have adequate remedies for any breach, that others will not independently develop substantially equivalent proprietary information, or that third parties will not otherwise gain access to our trade secrets or proprietary knowledge.
In addition, the laws of certain countries in which we market some of our products do not protect our intellectual property rights to the same extent as the laws of the U.S., which could make it easier for competitors to capture market position in such countries by utilizing technologies that are similar to those developed or licensed by us. Competitors also may harm our sales by designing products that mirror the capabilities of our products or technology without infringing our intellectual property rights. If we are unable to protect our intellectual property in these countries, it could have a material adverse effect on our business, financial condition or results of operations.
Quality problems with, and product liability claims in connection with, our processes, goods, and services, could lead to recalls or safety alerts, harm our reputation and have a material adverse effect on our business, results of operations, financial condition and our cash flows.
Quality is extremely important to us and our customers due to the serious and costly consequences of product failure and our business exposes us to potential product liability risks that are inherent in the design, manufacture, and marketing of medical devices. In addition, many of our products are often used in intensive care settings with seriously ill patients and some of the medical devices we manufacture and sell are designed to be implanted in the human body for long periods of time or indefinitely. Component failures, manufacturing defects, design flaws, off-label use, or inadequate disclosure of product-related risks or product-related information with respect to our products could result in an unsafe condition or injury to, or death of, a patient. These problems could lead to recall of, or issuance of a safety alert relating to, our products, and could result in product liability claims and lawsuits, including class actions, which could ultimately result, in certain cases, in the removal from the body of such products and claims regarding costs associated therewith. Due to the strong name recognition of the Medtronic and Covidien brands, a material adverse event involving one of our products could result in reduced market acceptance and demand for all products within that brand, and could harm our reputation and ability to market products in the future.
Strong product quality is critical to the success of our goods and services. If we fail to meet these standards and our products are the subject of recalls or safety alerts, our reputation could be damaged, we could lose customers, and our revenue and results of operations could decline. Our success also depends generally on our ability to manufacture to exact tolerances precision-engineered components, subassemblies, and finished devices from multiple materials. If our components fail to meet these standards or fail to adapt to evolving standards, our reputation, competitive advantage and market share could be harmed. In certain situations, we may undertake a voluntary recall of products or temporarily shut down production lines based on performance relative to our own internal safety and quality monitoring and testing data.
Further, we have elected to self-insure with respect to product liability risks and any product liability claim brought against us, with or without merit, could be costly to defend. See "Our insurance program may not be adequate to cover future losses." Any of the foregoing problems, including product liability claims or product recalls in the future, regardless of their ultimate outcome, could harm our reputation and have a material adverse effect on our business, results of operations, financial condition, and cash flows.
Health care policy changes, including U.S. health care reform legislation, signed in 2010, may have a material adverse effect on us.
In response to perceived increases in health care costs in recent years, there have been and continue to be proposals by the federal government, state governments, regulators, and third-party payers to control these costs and, more generally, to reform the U.S. health care system. Certain of these proposals could limit the prices we are able to charge for our products or the amounts of reimbursement available for our products and could limit the acceptance and availability of our products. The adoption of some or all of these proposals could have a material adverse effect on our financial condition and results of operations.
The Patient Protection and Affordable Care Act and the Health Care and Education Affordability Reconciliation Act of 2010 provide for a number of healthcare policy changes that are or will be applicable to us. However, certain provisions of the law are not yet effective and there are many programs and requirements for which the details have not yet been fully established or consequences not fully understood, and it is unclear what the full impacts will be from the law. The legislation provides for significant new taxes on medical device makers in the form of a 2.3 percent excise tax on all U.S. medical device sales that commenced in January 2013. Although the excise tax has been suspended by Congress until the end of 2017, its status is unclear for 2018 and subsequent years. Under the legislation, the total cost to the medical device industry is expected to be approximately $20 billion over 10 years. The law also focuses on a number of Medicare provisions aimed at improving quality and decreasing costs. It is uncertain at this point what negative unintended consequences these provisions will have on patient access to new technologies. The Medicare provisions include value-based payment programs, increased funding of comparative effectiveness research, reduced hospital payments for avoidable readmissions and hospital acquired conditions, and pilot programs to evaluate alternative payment methodologies that promote care coordination (such as bundled physician and hospital payments). Additionally, the law includes a reduction in the annual rate of inflation for Medicare payments to hospitals that began in 2011 and the establishment of an independent payment advisory board to recommend ways of reducing the rate of growth in Medicare spending. We cannot predict what health care programs and regulations will be ultimately implemented at the federal or state level, or the effect of any future legislation or regulation. However, any changes that lower reimbursement for our products or reduce medical procedure volumes could adversely affect our business and results of operations.
Our insurance program may not be adequate to cover future losses.
We have elected to self-insure most of our insurable risks across the company, and we made this decision based on cost and availability factors in the insurance marketplace. We manage and maintain a portion of our self-insured program through a wholly-owned captive insurance company. We continue to maintain a directors and officers liability insurance policy with a third party insurer that provides coverage for the directors and officers of the company. We continue to monitor the insurance marketplace to evaluate the value of obtaining insurance coverage for other categories of losses in the future. Although we believe, based on historical loss trends, that our self-insurance program accruals and our existing insurance coverage will be adequate to cover future losses, historical trends may not be indicative of future losses. The absence of third-party insurance coverage for other categories of losses increases our exposure to unanticipated claims and these losses could have a material adverse impact on our consolidated earnings, financial condition and/or cash flows.
If we experience decreasing prices for our goods and services and we are unable to reduce our expenses, our results of operations will suffer.
We may experience decreasing prices for our goods and services due to pricing pressure experienced by our customers from managed care organizations and other third-party payers, increased market power of our customers as the medical device industry consolidates, and increased competition among medical engineering and manufacturing services providers. If the prices for our goods and services decrease and we are unable to reduce our expenses, our results of operations will be adversely affected.
We may experience higher costs to produce our products as a result of changes in prices for oil, gas and other commodities.
We use resins, other petroleum-based materials and pulp as raw materials in some of our products. Prices of oil and gas also significantly affect our costs for freight and utilities. Oil, gas and pulp prices are volatile and may increase, resulting in higher costs to produce and distribute our products. New laws or regulations adopted in response to climate change could also increase energy costs and the costs of certain raw materials and components. Due to the highly competitive nature of the healthcare industry and the cost-containment efforts of our customers and third-party payers, we may be unable to pass along cost increases through higher prices. If we are unable to fully recover these costs through price increases or offset these increases through cost reductions, we could experience lower margins and profitability and our business, results of operations, financial condition and cash flows could be materially and adversely affected.
Economic and political instability around the world could adversely affect our revenues, financial condition or results of operations.
There can be no assurance that economic and political instability around the world will not adversely affect our revenues, financial condition or results of operations. Our customers and vendors may experience financial difficulties or be unable to borrow money to fund their operations which may adversely impact their ability to purchase our products or to pay for our products on a timely basis, if at all. As with our customers and vendors, these economic conditions make it more difficult for us to accurately forecast and plan our future business activities. In addition, a significant amount of our trade receivables are with national health care systems in many countries. Repayment of these receivables is dependent upon the political and financial stability of those countries. In light of these global economic fluctuations, we continue to monitor the creditworthiness of customers located outside the U.S. Failure to receive payment of all or a significant portion of these receivables could adversely affect our results of operations.
We are subject to a variety of market and financial risks due to our international operations that could adversely affect those operations or our profitability and operating results.
Although our stock is traded on the New York Stock Exchange, we are a global company. Operations in countries outside of the U.S., which account for approximately 43 percent of our net sales for the fiscal year ended April 29, 2016, are accompanied by certain financial and other risks that would not be faced by a company operating purely within the U.S. We intend to continue to pursue growth opportunities in sales outside the U.S., especially in emerging markets, which could expose us to greater risks associated with international sales and operations. Our profitability and international operations are, and will continue to be, subject to a number of risks and potential costs, including:
fluctuations in currency exchange rates,
healthcare reform legislation,
multiple non-U.S. regulatory requirements that are subject to change and that could restrict our ability to manufacture and sell our products,
local product preferences and product requirements,
longer-term receivables than are typical in the U.S.,
trade protection measures and import or export licensing requirements,
less intellectual property protection in some countries outside the U.S. than exists in the U.S.,
different labor regulations and workforce instability,
political instability,
the potential payment of U.S. income taxes on earnings of certain controlled foreign subsidiaries subject to U.S. taxation upon repatriation,
the expiration and non-renewal of foreign tax rulings and/or grants,
potentially negative consequences from changes in or interpretations of tax laws, and
economic instability and inflation, recession or interest rate fluctuations.
There are recent legislative proposals to tax profits of U.S. affiliates which are earned abroad. While it is impossible for us to predict whether these and other proposals will be implemented, or how they will ultimately impact us, they may materially impact our results of operations if, for example, our profits earned abroad are subject to U.S. income tax, or we are otherwise disallowed deductions as a result of these profits.
On June 23, 2016, the United Kingdom (U.K.) held a referendum in which voters approved an exit from the E.U., commonly referred to as “Brexit”. As a result of the referendum, it is expected that the British government will begin negotiating the terms of the U.K.’s future relationship with the E.U. Although it is unknown what those terms will be, it is possible that there will be greater restrictions on imports and exports between the U.K. and E.U. countries and increased regulatory complexities. These changes may adversely affect our operations and financial results.
Finally, changes in currency exchange rates may reduce the reported value of our revenues outside the U.S, net of expenses, and cash flows. We cannot predict changes in currency exchange rates, the impact of exchange rate changes, nor the degree to which we will be able to manage the impact of currency exchange rate changes.
The failure to comply with U.S. Foreign Corrupt Practices Act and similar anti-bribery laws in non-U.S. jurisdiction could materially adversely affect our business and result in civil and/or criminal sanctions.
The U.S. Foreign Corrupt Practices Act (FCPA) and similar anti-bribery laws in non-U.S. jurisdictions generally prohibit companies and their intermediaries from making improper payments to non-U.S. government officials for the purpose of obtaining or retaining business. Because of the predominance of government-sponsored healthcare systems around the world, many of our customer relationships outside of the U.S. are with governmental entities and are therefore potentially subject to such laws.
Global enforcement of anti-corruption laws has increased substantially in recent years, with more frequent voluntary self-disclosures by companies, aggressive investigations and enforcement proceedings by U.S. and non-U.S. governmental agencies, and assessment of significant fines and penalties against companies and individuals. Our international operations create the risk of unauthorized payments or offers of payments by one of our employees, consultants, sales agents, or distributors, because these parties are not always subject to our control. It is our policy to implement safeguards to educate our employees and agents on these legal requirements and prohibit improper practices. However, our existing safeguards and any future improvements may not always be effective, and our employees, consultants, sales agents, or distributors may engage in conduct for which we might be held responsible. In addition, the government may seek to hold us liable for successor liability FCPA violations committed by any companies in which we invest or that we acquire. Any alleged or actual violations of these regulations may subject us to government scrutiny, severe criminal or civil sanctions and other liabilities, including exclusion from government contracting, and could disrupt our business, and result in a material adverse effect on our reputation, results of operations, financial condition, and cash flows.
Laws and regulations governing the export of our products could adversely impact our business.
The U.S. Department of the Treasury’s Office of Foreign Assets Control (OFAC), and the Bureau of Industry and Security at the U.S. Department of Commerce (BIS), administer certain laws and regulations that restrict U.S. persons and, in some instances, non-U.S. persons, in conducting activities, transacting business with or making investments in certain countries, governments, entities and individuals subject to U.S. economic sanctions. Due to our international operations, we are subject to such laws and regulations, which are complex, restrict our business dealings with certain countries and individuals, and are constantly changing. Further restrictions may be enacted, amended, enforced or interpreted in a manner that materially impacts our operations.
From time to time, certain of our subsidiaries have limited business dealings in countries subject to comprehensive sanctions, including Iran, Sudan, Syria, Cuba and those in the region of Crimea. Certain of our subsidiaries sell medical devices and surgical tools, and may provide related services, to distributors and other purchasing bodies in such countries. These business dealings represent an insignificant amount of our consolidated revenues and income, but expose us to a heightened risk of violating applicable sanctions regulations. Violations of these regulations are punishable by civil penalties, including fines, denial of export privileges, injunctions, asset seizures, debarment from government contracts and revocations or restrictions of licenses, as well as criminal fines and imprisonment. We have established policies and procedures designed to assist with our compliance with such laws and regulations. However, there can be no assurance that our policies and procedures will effectively prevent us from violating these regulations in every transaction in which we may engage, and such a violation could adversely affect our reputation, business, financial condition, results of operations and cash flows.
Consolidation in the health care industry could have an adverse effect on our revenues and results of operations.
In response to a variety of actions by legislators, regulators, and third party payers to reduce the perceived rise in healthcare costs, many health care industry companies, including health care systems, are consolidating to create new companies with greater market power. As the health care industry consolidates, competition to provide goods and services to industry participants will become more intense. These industry participants may try to use their market power to negotiate price concessions or reductions for medical devices that incorporate components produced by us. If we are forced to reduce our prices because of consolidation in the health care industry, our revenues would decrease and our consolidated earnings, financial condition, and/or cash flows would suffer.
Our business is indirectly subject to health care industry cost-containment measures that could result in reduced sales of medical devices and medical devices containing our components.
Most of our customers, and the health care providers to whom our customers supply medical devices, rely on third-party payers, including government programs and private health insurance plans, to reimburse some or all of the cost of the procedures in which medical devices that incorporate components we manufacture or assemble are used. The continuing efforts of governmental authorities, insurance companies, and other payers of health care costs to contain or reduce these costs could lead to patients being unable to obtain approval for payment from these third-party payers. If third-party payer payment approval cannot be obtained by patients, sales of finished medical devices that include our components may decline significantly and our customers may reduce
or eliminate purchases of our components. The cost-containment measures that health care providers are instituting, both in the U.S. and internationally, could harm our ability to operate profitably. For example, managed care organizations have successfully negotiated volume discounts for pharmaceuticals.
In an effort to reduce costs, many existing and potential customers for our products within the U.S. have become members of group purchase organizations (GPOs) and integrated delivery networks (IDNs). GPOs and IDNs negotiate pricing arrangement with healthcare product manufacturers and distributors and offer the negotiated prices to affiliated hospitals and other members. GPOs and IDNs typically award contracts on a category-by-category basis through a competitive bidding process. Bids are generally solicited from multiple manufacturers with the intention of driving down pricing. Due to the highly competitive nature of the GPO and IDN contracting processes, we may not be able to obtain or maintain contract positions with major GPOs and IDNs across our product portfolio. Furthermore, the increasing leverage of organized buying groups may reduce market prices for our products, thereby reducing our profitability.
While having a contract with a GPO and IDN for a given product category can facilitate sales to members of that GPO or IDN, such contract positions can offer no assurance that sales volumes of those products will be maintained. GPOs and IDNs increasingly are awarding contracts to multiple suppliers for the same product category. Even when we are the sole contracted supplier of a GPO or IDN for a certain product category, members of the GPO or IDN generally are free to purchase from other suppliers. Furthermore, GPO and IDN contracts typically are terminable without cause upon 60 to 90 days’ notice. Accordingly, although we have multiple contracts with many major GPOs and IDNs, the members of such groups may choose to purchase from our competitors due to the price or quality offered by such competitors, which could result in a decline in our sales and profitability.
Our research and development efforts rely upon investments and investment collaborations, and we cannot guarantee that any previous or future investments or investment collaborations will be successful.
Our strategyMission is to provide a broad range of therapies to restore patients to fuller, healthier lives, which requires a wide variety of technologies, products and capabilities. The rapid pace of technological development in the medical industry and the specialized expertise required in different areas of medicine make it difficult for one company alone to develop a broad portfolio of technological solutions. In addition to internally generated growth through our research and development efforts, historically we have relied, and expect to continue to rely, upon investments and investment collaborations to provide us access to new technologies both in areas served by our existing businesses as well as in new areas.
We expect to make future investments where we believe that we can stimulate the development or acquisition of new technologies and products to further our strategic objectives and strengthen our existing businesses. Investments and investment collaborations in and with medical technology companies are inherently risky, and we cannot guarantee that any of our previous or future investments or investment collaborations will be successful or will not materially adversely affect our consolidated earnings,business, results of operations, financial condition and/orand cash flows.
The continuing development of many of our products depends upon us maintaining strong relationships with health carehealthcare professionals.
If we fail to maintain our working relationships with health carehealthcare professionals, many of our products may not be developed and marketed in line with the needs and expectations of the professionals who use and support our products, which could cause a decline in our earnings and profitability. The research, development, marketing and sales of many of our new and improved products is dependent upondepends on our maintaining working relationships with health carehealthcare professionals. We rely on these professionals to provide us with considerable knowledge and experience regarding the development, marketing and sale of our products. Physicians assist us as researchers, marketing and product consultants, inventors and public speakers. In addition, as a result of the COVID-19 pandemic, our access to these professionals has been limited at times, and travel restrictions, shutdowns and similar measures have impacted our ability to maintain these relationships, thereby affecting our ability to develop, market and sell new and improved products. If we are unable to maintain our strong relationships with these professionals, and continue to receive their advice and input, the development and marketing of our products could suffer, which could have a material adverse effect on our consolidated earnings,business, results of operations, financial condition, and/orand cash flows.
We are increasingly dependent on sophisticated information technology systems to operate our business and many of our products and services include integrated software and information technology. If we fail to properly maintain the integrity of our systems and data, if our products and services do not operate as intended, or we experience a cyber-attack or other breach of these systems or products, our business could be materially affected.have debt obligations that create risk.
We are increasingly dependent on sophisticated information technology for our products and infrastructure. We rely on information technology systemsrequired to process, transmit and store electronic information in our day-to-day operations, and routinely process, store and transmit large amounts of data in our operations, including sensitive personal information as well as proprietary or confidential information. In addition, manyuse a portion of our products and services incorporate software and information technology that allows patients and physiciansoperating cash flow to be connectedpay interest or to collect data regarding a patient and the therapy he or she is receiving.
The size and complexityprincipal on our outstanding indebtedness instead of our information technology systems makes them vulnerable to increasingly sophisticated cyber-attacks, breakdown, destruction, loss or compromise of data, obsolescence or incompatibility among systems, orfor other significant disruptioncorporate purposes, including power outages and telecommunications failures. Unauthorized persons may attempt to hack into our products or systems to obtain personal data relating to patients or employees, our confidential or proprietary information or confidential information we hold on behalf of third parties. If third parties successfully hack into or interfere with our implanted or connected products or services, they may create issues with product functionality that could pose a risk of loss of data, a risk to patient safety, and a risk of product recall or field activity. We have programs in place to detect, contain and respond to data security incidents, and we make ongoing improvements to our information-sharing products in order to minimize vulnerabilities, in accordance with industry and regulatory standards. However, because the techniques used to obtain unauthorized access or sabotage systems change frequently and may be difficult to detect, we may not be able to anticipate and prevent these intrusions or mitigate them when and if they occur.
We also rely on third party vendors to supply and/or support certain aspects of our information technology systems. Third party systems may contain defects in design or manufacture or other problems that could unexpectedly compromise information security of our own systems, and we are dependent on these third parties to deploy appropriate security programs to protect their systems.
In addition, we continue to grow in part through new business acquisitions. With this growth we will continue to consolidate and integrate the number of systems we operate, and to upgrade and expand our information system capabilities for stable and secure business operations.
If we are unable to maintain reliable information technology systems and prevent data breaches, we may suffer regulatory consequences in addition to business consequences. Our worldwide operations mean that we are subject to data protection and cyber security laws and regulations in many jurisdictions, and that some of the data we process, store and transmit may be transmitted across countries. In the U.S., HIPAA privacy and security rules require certain of our operations to protect the confidentiality of patient medical records and other health information, and the Federal Trade Commission has begun to assert authority over protection of privacy and the use of cyber security in information systems, particularly in the area of online communications and mobile healthcare applications, in which we have a growing presence. In Europe, the General Data Protection Regulation requires us to manage individually identifiable information in the E.U. and, in the event of violations, may impose fines of up to four percent of our global revenue. China and Russia have also passed laws that require individually identifiable data on their citizens to be maintained on local servers and that may restrict transfer or processing of that data. We believe that we meet the expectations of applicable regulations and that the ongoing costs and impacts of ensuring compliance with such rules are not material to our business. However, there is no guarantee that we will avoid enforcement actions by governmental bodies. Enforcement actions can be costly and interrupt regular operationsfunding future expansion of our business. In addition, there has been a developing trend of civil lawsuits and class actions relating to breaches of consumer data held by large companies. While Medtronic has not been named in any such suits, if a substantial breach or loss of data from our records were to occur, we could become a target of such litigation.
Our information systems require an ongoing commitment of significant resources to maintain, protect, and enhance existing systems and develop new systems to keep pace with continuing changes in information processing technology, evolving legal and regulatory standards, the increasing need to protect patient and customer information, and the information technology needs associated with our changing products and services. There can be no assurance that our process of consolidating the number of systems we operate, upgrading and expanding our information systems capabilities, continuing to build security into the design of our products, protecting and enhancing our systems and developing new systems to keep pace with continuing changes in information processing technology will be successful or thatWe may also incur additional systems issues will not ariseindebtedness in the future. Any significant breakdown, intrusion, interruption, corruption,future to supplement our existing liquidity and cash generated from operations to satisfy our needs for working capital and capital expenditures, to pursue growth initiatives, and to make returns of capital to shareholders. At the time we incur such additional indebtedness, or destruction of these systems, as well as any data breaches, could have a material adverse effect on our business. If we fail to maintainrefinance or protect our information systems and data integrity effectively, we could expose patients or employees to financial or medical identity theft, suffer a loss of product functionality, loserestructure existing customers, have difficulty attracting new customers, have difficulty preventing, detecting, and controlling fraud, be exposed to the loss or misuse of confidential information, have disputes with customers, physicians, and other health care professionals, suffer regulatory sanctions or penalties under federal laws, state laws, or the laws of other jurisdictions, experience increases in operating expenses, incur expenses or lose revenues as a result of a data privacy breach, or suffer other adverse consequences including legal action and damage to our reputation.
Negative conditions in global credit markets may impair our ability to issue debt securities, including our commercial paper program and the liquidity and/or market value of investments in marketable debt securities such as our other fixed income securities, which may cause us losses and liquidity issues.
We have investments in marketable debt securities that are classified and accounted for as available-for-sale. Our debt securities include government and agency securities, corporate debt securities, certificates of deposit, debt funds, and mortgage-backed and other asset-backed securities. Market conditions over the past several years have included periods of significant economic uncertainty and at times general market distress. During these periods, we may experience reduced liquidity across the fixed-income investment market, including the securities in which we invest. In the event we need to sell these securities, we may not
be able to do so in a timely manner or for a value that is equal to the underlying principal. In addition,indebtedness, we may be requiredunable to adjust the carrying valueobtain capital market financing with similar terms and currency denomination, or at
all, which could materially adversely impact our results of operations and financial condition.
Negative market conditions may also impair our ability to access the capital markets through the issuance of commercial paper or debt securities, or may impact our ability to sell such securities at a reasonable price and may negatively impact our ability to borrow from financial institutions.
Our products are continually the subject of clinical trials conducted by us, our competitors, or other third parties, the results of which may be unfavorable, or perceived as unfavorable, and could have a material adverse effect on our business financial condition, and results of operations.
As a part At any time, the value of the regulatory process of obtaining marketing clearance for new productsour debt outstanding will fluctuate based on several factors including foreign currency exchange rate and new indications for existing products, we conduct and participate in numerous clinical trials with a variety of study designs, patient populations, and trial endpoints. Unfavorable or inconsistent clinical data from existing or future clinical trials conducted by us, by our competitors, or by third parties, or the market’s or U.S. FDA’s perception of this clinical data, may adversely impact our ability to obtain product approvals, our position in, and share of, the markets in which we participate, and our business, financial condition, and results of operations.interest rate movements.
Failure to integrate acquired businesses into our operations successfully, as well as liabilities or claims relating to such acquired businesses, could adversely affect our business.
As part of our strategy to develop and identify new products and technologies, we have made several significant acquisitions in recent years, including the 2015 acquisition of Covidien, and may make additional acquisitions in the future. Our integration of the operations of acquired businesses requires significant efforts, including the coordination of information technologies, research and development, sales and marketing, operations, manufacturing, and finance. These efforts result in additional expenses and involve significant amounts of management’s time that cannot then be dedicated to other projects. Our failure to manage and coordinate the growth of the combined companyacquired companies successfully could also have an adverse impact on our business. Further, acquired businesses may have liabilities, or be subject to claims, litigation or investigations that we did not anticipate or which exceed our estimates at the time of the acquisition. In addition, we cannot be certain that the businesses we acquire will become profitable or remain so. Factors that will affect the success of our acquisitions include:
•the presence or absence of adequate internal controls and/or significant fraud in the financial systems of acquired companies,
•our ability or inability to integrate information technology systems of acquired companies in a secure and reliable manner,
•liabilities, claims, litigation, investigations, or other adverse developments arising out of investigations by governmental entities ofrelating to acquired businesses or the business practices of acquired companies, including investigations by governmental entities, potential FCPA or product liability imposed by FCPA,claims or other unanticipated liabilities,
•any decrease in customer loyalty and product orders caused by dissatisfaction with the combined companies’ product lines and sales and marketing practices, including price increases,
•our ability to retain key employees, and
•the ability of the combined company to achieve synergies among its constituentacquired companies, such as increasing sales of the combinedintegrated company’s products, achieving cost savings, and effectively combining technologies to develop new products.
We also could experience negative effects on our business, results of operations, financial condition, and cash flows and financial condition from acquisition-related charges, amortization of intangible assets and asset impairment charges. These effects, individually or in the aggregate, could cause a deterioration of our credit rating
Legal and result in increased borrowing costs and interest expense.
The expansion of our services and solutions business may not yield the revenue we expect and will expose us to new risks.
We are increasingly focusing on our services and solutions businesses and the creation of comprehensive value-based healthcare offerings, in which payment is based on measurable patient outcomes over a specific time horizon. These offerings include care management services, cath lab and operating room managed services, and solutions for chronic disease management. We intend to expand our services and solutions model across all of our business groups and across geographic regions. However, we remain in the relatively early stages of developing and implementing this business model. As a result, we will need to invest significant expense and management resources into developing our expertise and executing our strategies, and our efforts may not be profitable.
In addition, the expansion of our services and solutions business model will expose us to, or increase our exposure to, a variety of regulations in the various countries we provide services and solutions, including regulations related to government payments, fraud and abuse, patient privacy, and the corporate practice of medicine. Compliance with these regulations may prove to be more costly than we anticipate, and we may not successfully comply with such regulations. These regulatory costs may slow our expansion into these business areas and may have a negative effect on our results of operations, cash flows, and financial condition.
The medical device industry is the subject of numerous governmental investigations into marketing and other business practices. These investigations could result in the commencement of civil and/or criminal proceedings, substantial fines, penalties, and/or administrative remedies, divert the attention of our management, and have an adverse effect on our financial condition and results of operations.Regulatory Risks
We are subject to extensive and complex laws and governmental regulations and any adverse regulatory action may materially adversely affect our financial condition and business operations.
Our medical devices and technologies, as well as our business activities, are subject to a complex set of regulations and rigorous regulationenforcement, including by the U.S. FDA, U.S. Department of Justice, Health and Human Services-Office of the Inspector General, and numerous other federal, state, and non-U.S. governmental authorities. These authorities have been increasing their scrutinyTo varying degrees, each of these agencies requires us to comply with laws and regulations governing the development, testing, manufacturing, labeling, marketing and distribution of our industry.products. As a part of the regulatory process of obtaining marketing clearance for new products and new indications for existing products, we conduct and participate in numerous clinical trials with a variety of study designs, patient populations, and trial endpoints. Unfavorable clinical data from existing or future clinical trials may adversely impact our ability to obtain product approvals, our position in, and share of, the markets in which we participate, and our business, results of operations, financial condition, and cash flows. We cannot guarantee that we will be able to obtain or maintain marketing clearance for our new products or enhancements or modifications to existing products, and the failure to maintain approvals or obtain approval or clearance could have a material adverse effect on our business, results of operations, financial condition and cash flows. Even if we are able to obtain approval or clearance, it may:
•take a significant amount of time,
•require the expenditure of substantial resources,
•involve stringent clinical and pre-clinical testing, as well as increased post-market surveillance,
•involve modifications, repairs or replacements of our products, and
•limit the proposed uses of our products.
Both before and after a product is commercially released, we have ongoing responsibilities under the U.S. FDA and other applicable non-U.S. government agency regulations. For instance, many of our facilities and procedures and those of our suppliers are also subject to periodic inspections by the U.S. FDA to determine compliance with applicable regulations. The results of these inspections can include inspectional observations on the U.S. FDA’s Form-483, warning letters, or other forms of enforcement. If the U.S. FDA were to conclude that we are not in compliance with applicable laws or regulations, or that any of our medical products are ineffective or pose an unreasonable health risk, the U.S. FDA could ban such medical products, detain or seize adulterated or misbranded medical products, order
a recall, repair, replacement, or refund of such products, refuse to grant pending pre-market approval applications or require certificates of non-U.S governments for exports, and/or require us to notify health professionals and others that the devices present unreasonable risks of substantial harm to the public health. The U.S. FDA and other non-U.S. government agencies may also assess civil or criminal penalties against us, our officers or employees and impose operating restrictions on a company-wide basis. The U.S. FDA may also recommend prosecution to the U.S. Department of Justice. Any adverse regulatory action, depending on its magnitude, may restrict us from effectively marketing and selling our products and limit our ability to obtain future pre-market clearances or approvals, and could result in a substantial modification to our business practices and operations. Furthermore, we occasionally receive subpoenas or other requests for information from state and federal governmental agencies, including, among others, the U.S. Department of Justice and the Office of Inspector General of HHS. Thesewhile these investigations typically relate primarily to financial arrangements with health carehealthcare providers, regulatory compliance and product promotional practices.
We cooperate with these investigations and respond to such requests. However, when an investigation begins,practices, we cannot predict when it will be resolved, the timing, outcome or impact of the investigation, or its impact on us. Anany such investigations. Any adverse outcome in one or more of these investigations could include the commencement of civil and/or criminal proceedings, substantial fines, penalties, and/or administrative remedies, including exclusion from government reimbursement programs and/or entry into Corporate Integrity Agreements (CIAs) with governmental agencies and amendments to existing CIAs.agencies. In addition, resolution of any of these matters could involve the imposition of additional, and costly compliance obligations. Finally, if these investigations continue over a long period of time, they could divert the attention of management from the day-to-day operations of our business and impose significant administrative burdens, including cost, on us. These potential consequences, as well as any adverse outcome from thesegovernment investigations, or other investigations initiated by a government at any time, could have a material adverse effect on our business, results of operations, financial condition, and cash flows.
In addition, the U.S. FDA has taken the position that device manufacturers are prohibited from promoting their products other than for the uses and indications set forth in the approved product labeling, and any failure to comply could subject us to significant civil or criminal exposure, administrative obligations and costs, and/or other potential penalties from, and/or agreements with, the federal government.
Governmental regulations in the U.S. and outside the U.S. are constantly changing and may become increasingly stringent. In the European Union, for example, the Medical Device Regulation which became effective in May 2021 includes significant additional pre-market and post-market requirements. Penalties for regulatory non-compliance could be severe, including fines and revocation or suspension of a company’s business license, mandatory price reductions and criminal sanctions. The development and implementation of future laws and regulations may have a material adverse effect on us.
Our failure to comply with laws and regulations relating to reimbursement of healthcare goods and services may subject us to penalties and adversely impact our reputation, business, results of operations.operations, financial condition and cash flows.
Our substantial leveragedevices, products and debt service obligationstherapies are purchased principally by hospitals or physicians that typically bill various third-party payers, such as governmental healthcare programs (e.g., Medicare, Medicaid and comparable non-U.S. programs), private insurance plans and managed care plans, for the healthcare services provided to their patients. The ability of our customers to obtain appropriate reimbursement for products and services from third-party payers is critical because it affects which products customers purchase and the prices they are willing to pay. As a result, our devices, products and therapies are subject to regulation regarding quality and cost by HHS, including the Centers for Medicare & Medicaid Services (CMS), as well as comparable state and non-U.S. agencies responsible for reimbursement and regulation of health are goods and services, including laws and regulations related to kickbacks, false claims, self-referrals and healthcare fraud. Many states have similar laws that apply to reimbursement by state Medicaid and other funded programs as well as in some cases to all payers. In certain circumstances, insurance companies attempt to bring a private cause of action against a manufacturer for causing false claims. In addition, as a manufacturer of U.S. FDA-approved devices reimbursable by federal healthcare programs, we are subject to the Physician Payments Sunshine Act, which requires us to annually report certain payments and other transfers of value we make to U.S.-licensed physicians or U.S. teaching hospitals. Any failure to comply with these laws and regulations could adversely affectsubject us or our business.officers and employees to criminal and civil financial penalties.
AsWe are also subject to risks relating to changes in government and private medical reimbursement programs and policies, and changes in legal regulatory requirements in the U.S. and around the world. Implementation of April 29, 2016,further legislative or administrative reforms to these reimbursement systems, or adverse decisions relating to coverage of or reimbursement for our total consolidated external debt was approximately $31.2 billion. products by administrators of these systems, could have an impact on the acceptance of and demand for our products and the prices that our customers are willing to pay for them.
We are substantially dependent on patent and other proprietary rights and failing to protect such rights or to be successful in litigation related to our rights or the rights of others may result in our payment of significant monetary damages and/or royalty payments, negatively impacting our ability to sell current or future products.
We are substantially dependent on patent and other proprietary rights and rely on a combination of patents, trademarks, tradenames, copyrights, trade secrets, and agreements (such as employee, non-disclosure and non-competition agreements) to protect our business and proprietary intellectual property. We also incur additional indebtednessoperate in an industry characterized by extensive patent litigation. Patent litigation can result in significant damage awards and injunctions that could prevent our manufacture and sale of affected products or require us to pay significant royalties in order to continue to manufacture or sell affected products. At any given time, we are generally involved as both a plaintiff and a defendant in a number of patent infringement actions, the outcomes of which may not be known for prolonged periods of time. While it is not possible to predict the outcome of patent litigation, it is possible that the results of such litigation could require us to pay significant monetary damages and/or royalty payments, negatively impact our ability to sell current or future products, or that enforcement actions to protect our patent and proprietary rights against others could be unsuccessful, any of which could have a material adverse impact on our
business, results of operations, financial condition, and cash flows. In addition, any public announcements related to litigation or administrative proceedings initiated or threatened against us could cause our stock price to decline.
While we intend to defend against any threats to our intellectual property, our patents, trademarks, tradenames, copyrights, trade secrets or agreements (such as employee, non-disclosure and non-competition agreements) may not adequately protect our intellectual property. Further, pending patent applications may not result in patents being issued to us, patents issued to or licensed by us may be challenged or circumvented by competitors and such patents may be found invalid, unenforceable or too limited in scope to protect our technology or provide us with any competitive advantage. In addition, our patents will expire over time, our ability to protect novel business models is uncertain, and infringement may go undetected. Third parties could obtain patents that may require us to negotiate licenses to conduct our business, and such licenses may not be available on reasonable terms or at all. In addition, license agreements could be terminated. We also rely on non-disclosure and non-competition agreements with certain employees, consultants and other parties to protect, in part, trade secrets and other proprietary rights. We cannot be certain that these agreements will not be breached, that we will have adequate remedies for any breach, that others will not independently develop substantially equivalent proprietary information, or that third parties will not otherwise gain access to our trade secrets or proprietary knowledge.
In addition, the laws of certain countries in which we market or manufacture some of our products do not protect our intellectual property rights to the same extent as the laws of the U.S., which could make it easier for competitors to capture market position. Competitors also may harm our sales by designing products that substantially mirror the capabilities of our products or technology without infringing our intellectual property rights. If we are unable to protect our intellectual property in these countries, it could have a material adverse effect on our business, results of operations, financial condition, and cash flows.
Quality problems could lead to recalls or safety alerts, product liability claims, reputational harm, adverse verdicts or costly settlements, and could have a material adverse effect on our business, results of operations, financial condition and cash flows.
Quality is extremely important to us and our customers due to the impact on patients, and the serious and potentially costly consequences of adverse product performance. Our business exposes us to potential product liability risks that are inherent in the design, manufacture, and marketing of medical devices. In addition, many of our products are often used in intensive care settings with seriously ill patients and some of the medical devices we manufacture and sell are designed to be implanted in the human body for long periods of time or indefinitely. Component failures, manufacturing nonconformances, design defects, off-label use, or inadequate disclosure of product-related risks or product-related information with respect to our products, if they were to occur, could result in an unsafe condition or injury to, or death of, a patient. These problems could lead to recall of, or issuance of a safety alert relating to, our products, and could result in product liability claims and lawsuits, including class actions, which could ultimately result, in certain cases, in the removal from the body of such products and claims regarding costs associated therewith. Due to the strong name recognition of the Medtronic brand, a material adverse event involving one of our products could result in diminished market acceptance and demand for all products within that brand, and could harm our reputation and ability to market products in the future. Our substantial indebtednessFurther, we may be exposed to additional potential product liability risks related to products designed, manufactured and/or marketed in response to the COVID-19 pandemic, and unpredictable or accelerated changes in demand for certain of our products in connection with COVID-19 and its related impacts could have adverse consequences, including:impact development and production of products and services and could increase the risk of regulatory enforcement actions, product defects or related claims, as well as adversely impact our customer relationships and reputation.
making it more difficult for usStrong product quality is critical to satisfythe success of our financial obligations;
increasing our vulnerability to adverse economic, regulatorygoods and industry conditions, and placing us at a disadvantage compared to our competitors that are less leveraged;
limiting our ability to competeservices. If we fall short of these standards and our flexibility in planning for,products are the subject of recalls or reacting to, changes insafety alerts, our businessreputation could be damaged, we could lose customers and the industry in which we operate;
limiting our ability to borrow additional funds for working capital, capital expenditures, acquisitionsrevenue and general corporate or other purposes; and
exposing us to greater interest rate risk.
results of operations could decline. Our debt service obligations will require us to use a portion of our operating cash flow to pay interest and principal on indebtedness instead of for other corporate purposes, including funding future expansion of our business, acquisitions, and ongoing capital expenditures, which could impede our growth. Our ability to make payments on, and to refinance, our indebtedness, and to fund capital expenditures willsuccess also can depend on our ability to generatemanufacture to exact specification precision-engineered components, subassemblies and finished devices from multiple materials. If our components fail to meet these standards or fail to adapt to evolving standards, our reputation, competitive advantage and market share could be harmed. In certain situations, we may undertake a voluntary recall of products or temporarily shut down production lines based on performance relative to our own internal safety and quality monitoring and testing data.
Any of the foregoing problems, including future product liability claims or recalls, regardless of their ultimate outcome, could harm our reputation and have a material adverse effect on our business, results of operations, financial condition and cash flows.
Healthcare policy changes may have a material adverse effect on us.
In response to perceived increases in healthcare costs in recent years, there have been and continue to be actions and proposals by several governments, regulators and third-party payers globally, including the U.S. federal and state governments, to control these costs and, more generally, to reform healthcare systems. Certain of these actions and proposals, among other things, limit the prices we are able to charge for our products or the amounts of reimbursement available for our products and could limit the acceptance and availability of our products. These actions and proposals could have a material adverse effect on our business, results of operations, financial condition and cash flows.
We rely on the proper function, security and availability of our information technology systems and data, as well as those of third parties throughout our global supply chain, to operate our business, and a breach, cyber-attack or other disruption to these systems or data could materially and adversely affect our business, results of operations, financial condition, cash flows, reputation or competitive position.
We are increasingly dependent on sophisticated information technology systems to operate our business. That technology includes systems that could be used to process, transmit and store sensitive data. Additionally, many of our products and services include integrated software and information technology that collects data regarding patients or connects to other internal systems. One of the most prevalent attacks on large organizations has been ransomware which can have a devastating impact on an organization’s operations. We have invested in ransomware readiness in the pursuit of both prevention and rapid response to a ransomware event. Like all organizations, we routinely experience attempted interference with the integrity of, and interruptions in, our technology systems via events such as cyber-attacks, malicious intrusions, or other breakdowns. The consequences could mean data breaches, interference with the integrity of our products and data, compromise of intellectual property or other proprietary information, or other significant disruptions. Furthermore, we rely on third-party vendors to supply and/or support certain aspects of our information technology systems and resulting products. As we have seen with recent “Supply Chain Attacks,” these third-party systems could also become vulnerable to cyber-attack, malicious intrusions, breakdowns, interference, or other significant disruptions, and may contain defects in design or manufacture or other problems that could result in system disruption or compromise the information security of our own systems. The Russia-Ukraine conflict may increase cybersecurity risks on a global basis. Lastly, we continue to grow in part through new business acquisitions and, as a result, may face risks associated with defects and vulnerabilities in their systems, or difficulties or other breakdowns or disruptions in connection with the integration of the acquisitions into our information technology systems.
Our worldwide operations mean that we are subject to laws and regulations, including data protection and cybersecurity laws and regulations, in many jurisdictions. The variety of U.S. and international privacy and cybersecurity laws and regulations impacting our operations are described in “Item 1. Business" – Other Factors Impacting Our Operations – Data Privacy and Security Laws and Regulations. Any data security breaches, cyber-attacks, malicious intrusions or significant disruptions could result in actions by regulatory bodies and/or civil litigation, any of which could materially and adversely affect our business, results of operations, financial condition, cash flows, reputation, or competitive position.
In addition, our information technology systems require an ongoing commitment of significant resources to maintain, protect, and enhance existing systems and develop new systems. This enables us to keep pace with continuing changes in information processing technology, evolving legal and regulatory standards, the increasing need to protect patient and customer information, changes in the techniques used to obtain unauthorized access to data and information systems, and the information technology needs associated with our changing products and services. There can be no assurance that our extensive efforts (including, but not limited to, consolidating, protecting, upgrading, and expanding our systems and capabilities, continuing to build security into the design of our products, and developing new systems to keep pace with continuing changes in information processing technology) will be successful or that additional systems issues will not arise in the future.
If our information technology systems, products or services or sensitive data are compromised, there are many consequences that could result. Consequences include, but are not limited to patients or employees being exposed to financial or medical identity theft or suffer a loss of product functionality, losing existing customers or have difficulty attracting new customers, experiencing difficulty preventing, detecting, and controlling fraud, being exposed to the loss or misuse of confidential information, having disputes with customers, physicians, and other healthcare professionals, suffering regulatory sanctions or penalties under federal laws, state laws, or the laws of other jurisdictions, experiencing increases in operating expenses or an impairment in our ability to conduct our operations, incurring expenses or losing revenues as a result of a data privacy breach, product failure, information technology outages or disruptions, or suffering other adverse consequences including lawsuits or other legal action and damage to our reputation.
The failure to comply with anti-corruption laws could materially adversely affect our business and result in civil and/or criminal sanctions.
The U.S. Foreign Corrupt Practices Act (FCPA), the Irish Criminal Justice (Corruption Offences) Act 2018, and similar anti-corruption laws in other jurisdictions generally prohibit companies and their intermediaries from making improper payments to government officials for the purpose of obtaining or retaining business. Because of the predominance of government-administered healthcare systems in many jurisdictions around the world, many of our customer relationships outside of the U.S. are with governmental entities and are therefore potentially subject to such laws. We also participate in public-private partnerships and other commercial and policy arrangements with governments around the globe.
Global enforcement of anti-corruption laws has increased in recent years, including investigations and enforcement proceedings leading to assessment of significant fines and penalties against companies and individuals. Our international operations create a risk of unauthorized payments or offers of payments by one of our employees, consultants, sales agents, or distributors. We maintain policies and programs to implement safeguards to educate our employees and agents on these legal requirements, and to prevent and prohibit improper practices. However, existing safeguards and any future improvements may not always be effective, and our employees, consultants, sales agents or
distributors may engage in conduct for which we could be held responsible. In addition, regulators could seek to hold us liable for conduct committed by companies in which we invest or that we acquire. Any alleged or actual violations of these regulations may subject us to government scrutiny, criminal or civil sanctions and other liabilities, including exclusion from government contracting, and could disrupt our business, adversely affect our reputation and result in a material adverse effect on our business, results of operations, financial condition and cash flows.
Laws and regulations governing international business operations could adversely impact our business.
The U.S. Department of the Treasury’s Office of Foreign Assets Control (OFAC) and the U.S. Commerce Department’s Bureau of Industry and Security (BIS) administer certain laws and regulations that restrict U.S. persons and, in some instances, non-U.S. persons, in conducting activities, transacting business with, or making investments in, certain countries, governments, entities and individuals subject to U.S. economic sanctions or export restrictions. Our international operations subject us to these laws and regulations, which are complex, restrict our business dealings with certain countries, governments, entities, and individuals, and are constantly changing. Further restrictions may be enacted, amended, enforced or interpreted in a manner that materially impacts our operations.
From time to time, certain of our subsidiaries have limited business dealings in countries subject to comprehensive sanctions, including Iran, Syria, Cuba and the region of Crimea. Certain of our subsidiaries sell medical devices, and may provide related services, to distributors and other purchasing bodies in such countries. These business dealings represent an insignificant amount of our consolidated revenues and income, but expose us to a heightened risk of violating applicable sanctions regulations. Violations of these regulations are punishable by civil penalties, including fines, denial of export privileges, injunctions, asset seizures, debarment from government contracts and revocations or restrictions of licenses, as well as criminal fines and imprisonment. We have established policies and procedures designed to assist with our compliance with such laws and regulations. However, there can be no assurance that our policies and procedures will prevent us from violating these regulations in every transaction in which we may engage, and such a violation could adversely affect our reputation, business, results of operations, financial condition, and cash flows.
Climate change, or legal, regulatory or market measures to address climate change may materially adversely affect our financial condition and business operations.
Climate change resulting from increased concentrations of carbon dioxide and other greenhouse gases in the atmosphere presents risks to our current and future operations from natural disasters and extreme weather conditions, such as hurricanes, tornadoes, earthquakes, wildfires or flooding. Such extreme weather conditions and other conditions caused by or related to climate change could increase our operational costs, pose physical risks to our facilities and adversely impact our supply chain, including: manufacturing and distribution networks, the availability and cost of raw materials and components, energy supply, transportation, or other inputs necessary for the operation of our business. The impacts of climate change on global water resources may result in water scarcity, which could impact our ability to access sufficient quantities of water in certain locations and result in increased costs. Concerns over climate change could have an impact on customer demand for our products and result in new legal or regulatory requirements designed to mitigate the effects of climate change on the environment. Although it is difficult to predict and adequately prepare to meet the challenges to our business posed by climate change, if new laws or regulations are more stringent than current legal or regulatory requirements, we may experience increased compliance burdens and costs to meet the regulatory obligations as well as adverse impacts on raw material sourcing, manufacturing operations and the distribution of our products.
We are subject to environmental laws and regulations and the risk of environmental liabilities, violations and litigation.
We are subject to environmental, health, and safety laws, and regulations concerning, among other things, the generation, handling, transportation, and disposal of hazardous substances or wastes, the remediation of hazardous substances or materials at various sites, and emissions or discharges into the land, air or water. We are further subject to numerous, laws and regulations concerning, among other things, chemical constituents in medical products and end-of-life disposal and take-back programs for medical devices. Our operations and those of certain third-party suppliers involve the use of substances subject to these laws and regulations, primarily those used in manufacturing and sterilization processes. If we or our suppliers violate these environmental laws and regulations, facilities could be shut down and violators could be fined, or otherwise sanctioned. New laws and regulations, violations of these laws or regulations, stricter enforcement of existing requirements, or the discovery of previously unknown contamination could require us to incur costs or could become the basis for new or increased liabilities that could be material.
Our insurance program may not be adequate to cover future losses.
We have elected to self-insure most of our insurable risks across the Company, and we made this decision based on cost and availability factors in the insurance marketplace. We manage and maintain a portion of our self-insured program through a wholly-owned captive insurance company. We continue to maintain a directors and officers liability insurance policy with third-party insurers that provides coverage for the directors and officers of the Company. We continue to monitor the insurance marketplace to evaluate the value of obtaining insurance coverage for other categories of losses in the future. This is subjectAlthough we believe, based on historical loss trends, that our self-insurance program accruals and our existing insurance coverage will be adequate to general economic,cover future losses, historical trends may not be indicative of
future losses. The absence of third-party insurance coverage for other categories of losses increases our exposure to unanticipated claims and these losses could have a material adverse impact on our business, results of operations, financial competitive, legislative, regulatorycondition and other factors, many of which are beyond our control.cash flows.
Changes in tax laws or exposure to additional income tax liabilities could have a material impact on our business, results of operations, financial condition and results of operations.cash flows.
We are subject to income taxes, as well as non-income based taxes, in boththe U.S., Ireland, and various other jurisdictions in which we operate. The tax laws in the U.S., Ireland and other countries in which we and our affiliates do business could change on a prospective or retroactive basis, and any such changes could materially adversely affect our business and our effective tax rate. For example, on December 22, 2017, the U.S. enacted comprehensive tax legislation, commonly referred to as the Tax Cuts and Jobs Act (the "Tax Act"), which resulted in a significant charge to tax expense during our fiscal year 2018 associated with U.S. taxation of accumulated foreign earnings as well as the requirement to revalue U.S. deferred tax assets and liabilities resulting from the reduction in the U.S. corporate tax rate. In addition, the Biden Administration has provided a framework for proposed U.S. tax law changes, which if enacted could have a material impact on our business, results of operations, financial condition, and cash flows.
In October 2021, the Organization for Economic Cooperation and Development (OECD) secured agreement from 136 countries to push forward with proposals to fundamentally rewrite International Tax rules which if enacted by these countries, will likely impact the amount of tax multinationals such as Medtronic pay in the future. During 2022 and 2023 more details on these proposals will be released and various consultations will take place. The OECD has set a timeline for the implementation of these proposals in 2023 but may end up being deferred to a later date.
The aggressive nature of the timeline set by the OECD may mean that all implications for business may not have been fully worked through or fully understood before rules are finalized. We continue to monitor the implications potentially resulting from this guidance. This action together with other legislative changes in many countries on the mandatory sharing of company information (financial and operational) with taxing authorities on a local and global basis under various information sharing initiatives, could lead to disagreements between jurisdictions outsideassociated with the U.S. proper allocation of profits between such jurisdictions.
We are subject to ongoing tax audits in the various jurisdictions.jurisdictions in which we operate. Tax authorities may disagree with certain positions we have taken and assess additional taxes. We regularly assess the likely outcomes of these audits in order to determine the appropriateness of our tax provision. However, there can be no assurance that we will accurately predict the outcomes of these audits, and the actual outcomes of these audits could have a material impact on our consolidated earnings and financial condition. Additionally, changes in tax laws or tax rulings could materially impact our effective tax rate. For example, legislation in 2010 imposed a 2.3 percent excise tax on medical device manufacturers for U.S. sales of medical devices beginning in January 2013. Proposals for fundamental U.S. corporate tax reform, if enacted, could have a material impact on our financial condition and results of operations.
Medtronic, Inc. tax court proceeding outcome could have an adverse impact on our financial condition.
In March 2009, the IRS issued its audit report for Medtronic Inc.'s fiscal years 2005 and 2006. Medtronic, Inc. reached agreements with the IRS on some, but not all matters related to these fiscal years. On December 23, 2010, the IRS issued a statutory notice of deficiency with respect to the remaining issues. Medtronic, Inc. filed a petition with the U.S. Tax Court on March 21, 2011 objecting to the deficiency. During October and November 2012, Medtronic, Inc. reached a resolution with the IRS on various matters, including the deductibility of a settlement payment. Medtronic, Inc. and the IRS agreed to hold one issue, the calculation of amounts eligible for the one-time repatriation holiday, because such issue was being addressed by other taxpayers in litigation with the IRS. The remaining unresolved issue relates to the allocation of income between Medtronic, Inc. and its wholly-owned subsidiary operating in Puerto Rico, which is one of the Company's key manufacturing sites. The Tax Court proceeding with respect to this issue began on February 3, 2015 and ended on March 12, 2015. The U.S. Tax Court issued its opinion on June 9, 2016. The U.S. Tax Court generally rejected the IRS’s position, but also made certain modifications to the Medtronic, Inc. tax returns as filed. Final resolution of this matter is not expected until the end of calendar 2016 or later if the tax court opinion is appealed.
Examination and audits by tax authorities could result in additional tax payments, which could have a material adverse effect on our and Covidien’s business, results of operations, financial condition, and cash flow.flows.
The Company has providedWe have recorded reserves for potential payments of tax to various tax authorities related to uncertain tax positions. However, the calculation of such tax liabilities involves the application of complex tax laws, regulations and treaties (where applicable) in many jurisdictions. Therefore, any dispute with a tax authority may result in a payment that is significantly different from current estimates. If payment of these amounts ultimately proves to be less than the recorded amounts, the reversal of the liabilities generally would result in tax benefits being recognized in the period when we determine the liabilities are no longer necessary. If the Company’sour estimate of tax liabilities proves to be less than the amount for which it is ultimately liable, we would incur additional charges, to expense and such charges could have a material adverse effect on our business, results of operations, financial condition, and cash flows.
If the distribution of Mallinckrodt ordinary shares to Covidien shareholders in 2013, or certain internal transactions undertaken in anticipation of the 2013 separation, are determined to be taxable for U.S. federal incomeThe Medtronic, Inc. tax purposes, we could incur significant U.S. federal income tax liabilities.
Covidien received an IRS ruling substantially to the effect that, for U.S. federal income tax purposes, (i) certain transactions effected in connection with its 2013 separation of Mallinckrodt qualify as transactions under Sections 355 and/or 368(a) of the Code, and (ii) the distribution qualifies as a transaction under Sections 355 and 368(a)(1)(D) of the Code. In addition to obtaining the IRS ruling, Covidien received a tax opinion from Skadden, Arps, Slate, Meagher & Flom LLP, in form and substance acceptable to Covidien, which relied on the effectiveness of the IRS ruling, substantially to the effect that, for U.S. federal income tax purposes, the distribution and certain transactions entered into in connection with the distribution qualify as transactions under Sections 355 and/or 368(a) of the Code.
The private letter rulings and the opinions relied on certain facts and assumptions, and certain representations and undertakings in the case of the 2013 separation, from Covidien and Mallinckrodt, regarding the past and future conduct of their respective businesses and other matters. Notwithstanding the private letter rulings and the tax opinions, the IRS could determine on audit that the 2013 distribution or the related internal transactions should be treated as taxable transactions if it determines that any of the respective facts, assumptions, representations or undertakings is not correct or has been violated, or that the distributions should be taxable for other reasons, including as a result of significant changes in stock or asset ownership after the distributions, or if the IRS were to disagree with the conclusions of the tax opinions that are not covered by the IRS rulings.
We could incur significant U.S. federal income tax liabilities or tax indemnification obligations, whether under applicable law or the tax matters agreement that was entered into with Mallinckrodt, if it is ultimately determined that certain related transactions undertaken in anticipation of the 2013 distribution are taxable.
Our tax position may be adversely affected by changes in tax law relating to multinational corporations.
Recent legislative proposals have aimed to expand the scope of U.S. corporate tax residence, limit the ability of foreign-owned corporations to deduct interest expense, tax the accumulated unrepatriated earnings of foreign subsidiaries of U.S. corporations, impose a minimum tax on the future offshore earnings of U.S. multinational groups, and to make other changes in the taxation of multinational corporations.
Additionally, the U.S. Congress, government agencies in non-U.S. jurisdictions where we and our affiliates do business, and the Organisation for Economic Co-operation and Development have recently focused on issues related to the taxation of multinational corporations. One example is in the area of “base erosion and profit shifting,” where profits are claimed to be earned for tax purposes in low-tax jurisdictions, or payments are made between affiliates from a jurisdiction with high tax rates to a jurisdiction with lower tax rates. The Organisation for Economic Co-operation and Development has released several components of its
comprehensive plan to create an agreed set of international rules for fighting base erosion and profit shifting. As a result, the tax laws in the U.S., Ireland and other countries in which we and our affiliates do business could change on a prospective or retroactive basis, and any such changes could materially adversely affect our business.
Moreover, tax authorities may carefully scrutinize companies that result from a cross-border business combination (such as us), which may lead such authorities to assert that we owe additional taxes, whichcourt proceeding outcome could have a material adverse effectimpact on our financial condition.
In March 2009, the IRS issued its audit report for Medtronic Inc. for fiscal years 2005 and 2006. Medtronic, Inc. reached agreements with the IRS on some, but not all matters related to these fiscal years. The remaining unresolved issue for fiscal years 2005 and 2006 relates to the allocation of income between Medtronic, Inc. and its wholly-owned subsidiary operating in Puerto Rico, which is one of our key manufacturing sites. An adverse outcome in this matter could materially and adversely affect our business, results of operations, financial condition, and cash flows. See Note 18 to the consolidated financial statements in "Item 8. Financial Statements and Supplementary Data" in this Annual Report on Form 10-K.
Future potential changes to the U.S. tax laws could result in us being treated as a U.S. corporation for U.S. federal tax purposes, and the IRS may not agree with the conclusion that we should be treated as a foreign corporation for U.S federal income tax purposes.
Because Medtronic plc is organized under the laws of Ireland, we would generally be classified as a foreign corporation under the general rule that a corporation is considered tax resident in the jurisdiction of its organization or incorporation for U.S. federal income tax purposes. Even so, the IRS may assert that we should be treated as a U.S. corporation (and, therefore, a U.S. tax resident) for U.S. federal income tax purposes pursuant to Section 7874 of the U.S. Internal Revenue Code of 1986, as amended (the Code). In addition, a retroactive change to U.S. tax laws in this area could change this classification. If we were to be treated as a U.S. corporation for federal tax purposes, we could be subject to substantially greater U.S. tax liability than currently contemplated as a non-U.S. corporation.
Legislative or other governmental action relating to the denial of U.S. federal or state governmental contracts to U.S. companies that redomicile abroad could adversely affect our business.
Various U.S. federal and state legislative proposals that would deny governmental contracts to U.S. companies that move their corporate location abroad may affect us. We are unable to predict the likelihood that, or final form in which, any such proposed legislation might become law, the nature of the regulations that may be promulgated under any future legislative enactments, or the effect such enactments and increased regulatory scrutiny may have on our business.
Risks Relating to Our Jurisdiction of Incorporation
We are incorporated in Ireland, and Irish law differs from the laws in effect in the U.S. and may afford less protection to holders of our securities.
Our shareholders may have more difficulty protecting their interests than would shareholders of a corporation incorporated in a jurisdiction of the United States. It may not be possible to enforce court judgments obtained in the U.S. against us in Ireland based on the civil liability provisions of the U.S. federal or state securities laws. In addition, there is some uncertainty as to whether the courts of Ireland would recognize or enforce judgments of U.S. courts obtained against us or our directors or officers based on the civil liabilities provisions of the U.S. federal or state securities laws or hear actions against us or those persons based on those laws. We have been advised that the U.S. currently does not have a treaty with Ireland providing for the reciprocal recognition and enforcement of judgments in civil and commercial matters. Therefore, a final judgment for the payment of money rendered by any U.S. federal or state court based on civil liability, whether or not based solely on U.S. federal or state securities laws, would not automatically be enforceable in Ireland.
As an Irish company, we are governed by the Irish Companies Acts,Act 2014, which differdiffers in some material respects from laws generally applicable to U.S. corporations and shareholders, including, among others, differences relating to interested director and officer transactions and shareholder lawsuits. Likewise, the duties of directors and officers of an Irish company generally are owed to the company only. Shareholders of Irish companies generally do not have a personal right of action against directors or officers of the company and may exercise such rights of action on behalf of the company only in limited circumstances. Accordingly, holders of our securities may have more difficulty protecting their interests than would holders of securities of a corporation incorporated in a jurisdiction of the U.S.
As an Irish public limited company, certain capital structure decisions require shareholder approval, which may limit Medtronic’s flexibility to manage its capital structure.
Under Irish law, our authorized share capital can be increased by an ordinary resolution of our shareholders and the directors may issue new ordinary or preferred shares, without shareholder approval, once authorized to do so by our articles of association or by an ordinary resolution of our shareholders. Additionally, subject to specified exceptions, Irish law grants statutory preemption rights to existing shareholders where shares are being issued for cash consideration but allows shareholders to disapply such statutory preemption rights either in our articles of association or by way of special resolution. Such disapplication can either be generally applicable or be in respect of a particular allotment of shares. Accordingly, at our 2021 Annual General Meeting, our Shareholders authorized our Board of Directors to issue up to 33% of our issued ordinary shares and further authorized our Board of Directors to issue up to 10% of such shares for cash without first offering them to our existing shareholders (provided that with respect to 5% of such shares, such allotment is to be used for the purposes of a specified capital investment). Both of these authorizations will expire on June 9, 2023, unless renewed by shareholders for a further period. We anticipate seeking new authorizations at our 2022 Annual General Meeting and in subsequent years. We cannot provide any assurance that these authorizations will always be approved, which could limit our ability to issue equity and thereby adversely affect the holders of our securities.
A transfer of our shares, other than ones effected by means of the transfer of book-entry interests in the Depository Trust Company, may be subject to Irish stamp duty.
Transfers of our shares effected by means of the transfer of book entry interests in the Depository Trust Company (DTC) will not be subject to Irish stamp duty. However, if you holda shareholder holds our shares directly rather than beneficially through DTC, any transfer of your shares could be subject to Irish stamp duty (currently at the rate of 1% of the higher of the price paid or the market value of the shares acquired). Payment of Irish stamp duty is generally a legal obligation of the transferee. The potential for stamp duty could adversely affect the price of your shares.
In certain limited circumstances, dividends we pay may be subject to Irish dividend withholding tax and dividends received by Irish residents and certain other shareholders may be subject to Irish income tax.
In certain limited circumstances, dividend withholding tax (currently at a rate of 20%25%) may arise in respect of dividends paid on our shares. A number of exemptions from dividend withholding tax exist such that shareholders resident in the U.S. and other specified countries that have a tax treaty with Ireland may be entitled to exemptions from dividend withholding tax.
Shareholders resident in the U.S. that hold their shares through DTC will not be subject to dividend withholding tax, provided the addresses of the beneficial owners of such shares in the records of the brokers holding such shares are recorded as being in the U.S. (and such brokers
have further transmitted the relevant information to a qualifying intermediary appointed by us). However, other shareholders may be subject to dividend withholding tax, which could adversely affect the price of their shares.
Shareholders entitled to an exemption from Irish dividend withholding tax on dividends received from us will not be subject to Irish income tax in respect of those dividends unless they have some connection with Ireland other than their shareholding in our Company (for example, they are resident in Ireland). Shareholders who are not resident nor ordinarily resident in Ireland, but who receive dividends subject to Irish dividend withholding tax, will generally have no further liability to Irish income tax on those dividends.
Our shares received by means of a gift or inheritance could be subject to Irish capital acquisitions tax.
Irish capital acquisitions tax (CAT) could apply to a gift or inheritance of our shares irrespective of the place of residence, ordinary residence or domicile of the parties. This is because our shares will be regarded as property situated in Ireland. The person who receives the gift or inheritance has primary liability for CAT. Gifts and inheritances passing between spouses are exempt from CAT. Children currently have a tax-free threshold which Irish Revenue typically updates annuallyof €335,000 in respect of taxable gifts or inheritances received from their parents.
Risks Relating to the Covidien Acquisition (the Transaction)
We may not realize all of the anticipated benefits of the Transactions or those benefits may take longer to realize than expected. We may also encounter significant unexpected difficulties in integrating Medtronic, Inc. and Covidien.
Our ability to realize the anticipated benefits of the Transaction will depend, to a large extent, on our ability to integrate the Medtronic, Inc. and Covidien businesses. The combination of two independent businesses is a complex, costly and time-consuming process. As a result, we will be required to devote significant management attention and resources to integrating the business practices and operations of Medtronic, Inc. and Covidien. The integration process may disrupt the businesses and, if implemented ineffectively or if impacted by unforeseen negative economic or market conditions or other factors, we may not realize the full anticipated benefits of the transaction. Our failure to meet the challenges involved in integrating the two businesses to realize the anticipated benefits of the transaction could cause an interruption or a loss of momentum in, our activities and could adversely affect our results of operations.
In addition, the overall integration of the businesses may result in material unanticipated problems, expenses, liabilities, competitive responses, loss of customer relationships, and diversion of management’s attention. The difficulties of combining the operations of the companies include, among others:
the diversion of management’s attention to integration matters;
difficulties in achieving anticipated cost savings, synergies, business opportunities and growth prospects from combining the businesses;
difficulties in the integration of operations and systems;
difficulties in the assimilation of employees;
difficulties in managing the expanded operations of a significantly larger and more complex company;
challenges in keeping existing customers and obtaining new customers; and
challenges in attracting and retaining key personnel.
Many of these factors will be outside of our control and any one of them could result in increased costs, decreases in Irish Revenue typically updates the amount of expected revenuesthis tax-free threshold on an annual basis.
Economic and diversion of management’s time and energy, which could materially impact our business, financial condition and results of operations. In addition, even if the operations of the businesses of Medtronic, Inc. and Covidien are integrated successfully, we may not realize the full benefits of the Transaction, including the synergies, cost savings or sales or growth opportunities that we expect. These benefits may not be achieved within the anticipated time frame, or at all. Furthermore, additional unanticipated costs may be incurredIndustry Risks
Changes in the integration of the businesses of Medtronic, Inc. and Covidien. All of these factors could negatively impact our earnings per share, decrease or delay the expected accretive effect of the transaction, and negatively impact the priceprices of our ordinary shares. As a result, we cannot assure you that the combination of the Medtronic, Inc.goods and Covidien businesses will result in the realization of the full benefits anticipated from the transaction.
Future potential changes to the U.S. tax laws could result in us being treated as a U.S. corporation for U.S. federal tax purposes, and the IRSservices and/or inflationary costs may not agree with the conclusion that we should be treated as a foreign corporation for U.S federal income tax purposes.
Because we are an Irish incorporated entity, we would generally be classified as a foreign corporation under the general rule that a corporation is considered tax resident in the jurisdiction of its organization or incorporation for U.S. federal income tax purposes. Even so, the IRS may assert that we should be treated as a U.S. corporation (and, therefore, a U.S. tax resident) for U.S. federal income tax purposes pursuant to Section 7874 of the U.S. Internal Revenue Code of 1986, as amended (the Code).
Under Section 7874 of the Code, if Medtronic Inc.’s shareholders immediately prior to the Transaction hold 80% or more of the vote or value of our shares by reason of holding stock in Medtronic, Inc. immediately after the Transaction (the ownership test), and our expanded affiliated group after the Transaction does not have substantial business activities in Ireland relative to its worldwide activities (the substantial business activities test), we would be treated as a U.S. corporation for U.S. federal income tax purposes. Based on the rules for determining share ownership under Section 7874 of the Code, Medtronic, Inc.’s shareholders received approximately 70% of our ordinary shares (by both vote and value) by reason of holding stock in Medtronic, Inc. Therefore, under current law, we should not be treated as a U.S. corporation for U.S. federal income tax purposes. However, there is limited guidance regarding the application of Section 7874, including the application of the ownership test.
In addition, changes to Section 7874 or the U.S. Treasury regulations promulgated thereunder could affect our status as a foreign corporation for U.S. federal tax purposes. Any such changes could have prospective or retroactive application.
Since Section 7874 was enacted, there have been various legislative proposals to broaden its scope. Such proposals could, among other things, treat a foreign acquiring corporation as a U.S. corporation under Section 7874 if the former shareholders of the U.S. corporation own more than 50% of the shares of the foreign acquiring corporation after the transaction, or if the foreign corporation’s affiliated group has substantial business activities in the U.S. and the foreign corporation is primarily managed and controlled in
the U.S. Accordingly, if enacted in their present form and retroactively effective to apply to the Transactions, such proposals could cause us to be treated as a U.S. corporation for U.S. federal tax purposes.
If we were to be treated as a U.S. corporation for federal tax purposes, based on our existing expected cash flows, we could be subject to substantially greater U.S. tax liability than currently contemplated as a non-U.S. corporation.
Specifically, if we were to be treated as a U.S. corporation for federal tax purposes, we would be subject to U.S. corporate income tax on our worldwide income, and the income of our foreign subsidiaries would be subject to U.S. tax when repatriated or when deemed recognized under the U.S. tax rules for controlled foreign corporations (CFC's). Additionally, Covidien's foreign corporations, which are not currently CFC's, would become CFC's making them potentially subject to current or future U.S. taxation, which could have a material adverse effect on our business, results of operations, financial condition and cash flows.
We have experienced, and may continue to experience, decreasing prices for certain of our goods and services due to pricing pressure from managed care organizations and other third-party payers on our customers, increased market power of our customers as the medical device industry consolidates and increased competition among medical engineering and manufacturing services providers. We have also recently experienced, and may continue to experience, rising costs due to inflation. If the prices for our goods and services change or inflation continues to rise, we may be unable to sufficiently reduce our expenses or offset rising costs through increased prices to customers. As a result, our business, results of operations, financial condition and cash flows may be adversely affected.
We are subject to a variety of risks associated with global operations that could adversely affect our profitability and operating results.
We develop, manufacture, distribute and sell our products globally. We intend to continue to expand our operations and to pursue growth opportunities outside the U.S., especially in emerging markets. Operations in different countries including emerging markets could expose us to additional and greater risks and potential costs, including:
•fluctuations in currency exchange rates,
•healthcare reform legislation,
•the need to comply with different regulatory regimes worldwide that are subject to change and that could restrict our ability to manufacture and sell our products,
•local product preferences and product requirements,
•longer-term receivables than are typical in the U.S.,
•trade protection measures, tariffs and other border taxes, and import or export licensing requirements,
•less intellectual property protection in some countries outside the U.S. than exists in the U.S.,
•different labor regulations and workforce instability,
•political and economic instability, including as a result of wars and insurrections,
•the expiration and non-renewal of foreign tax rulings and/or grants,
•potentially negative consequences from changes in or interpretations of tax laws, and
•economic instability and inflation, recession or interest rate fluctuations.
The ongoing global economic competition and trade tensions between the U.S. and China present risk to Medtronic. Although we have been able to mitigate some of the impact on Medtronic from increased duties imposed by both sides (through petitioning both governments for tariff exclusions and other mitigations), the risk remains of additional tariffs and other kinds of restrictions. Tariff exclusions awarded to Medtronic by the U.S. Government require periodic renewal, and policies for granting exclusions could shift. The U.S. and China could impose other types of restrictions such as limitations on government procurement or technology export restrictions, which could affect Medtronic’s access to the markets. China comprises approximately eight percent of our total revenues.
The Russia-Ukraine conflict and resulting sanctions and export restrictions are creating barriers to doing business in Russia and adversely impacting global supply chains. While we have no manufacturing, distribution or direct material suppliers in the region, we are closely monitoring the potential raw material/sub-tier supplier impact in both Russia and Ukraine. Materials like palladium and neon, which are both dependent on Russia supply, are part of broader semiconductor shortages in industry. Additional sanctions, export restrictions, and
potential countermeasures within Russia may lead to greater uncertainty and geopolitical shifts in Asia that could cause additional adverse impacts on global supply chains and our business, results of operations, financial condition and cash flows.
More generally, several governments including the U.S. have raised the possibility of policies to induce “re-shoring” of supply chains, less reliance on imported supplies, and greater national production. Examples include potential “Buy America” requirements in the U.S. If such steps triggered retaliation in other markets restricting access to foreign products in purchases by their government-owned healthcare systems, the result could be a significant impact on Medtronic.
Other significant changes or disruptions to international trade arrangements, such as termination or modifications of other existing trade agreements, may adversely affect our business, results of operations, financial condition and cash flows. In addition, a significant amount of our trade receivables are with national healthcare systems in many countries. Repayment of these receivables is dependent upon the political and financial stability of those countries. In light of these global economic fluctuations, we continue to monitor the creditworthiness of customers. Failure to receive payment of all or a significant portion of these receivables could adversely affect our business, results of operations, financial condition and cash flows.
The U.S. Treasury DepartmentCOVID-19 pandemic, and the IRSresponses of business and governments to the pandemic, have at times resulted in reduced availability of air transport, port closures, increased border controls or closures, increased transportation costs and increased security threats to our supply chain, and countries may promulgate rules that wouldcontinue to close borders, impose prolonged quarantines, and further restrict travel and other activities. Our business could be adversely affect our tax position.impacted if we are unable to successfully manage these and other risks of global operations.
The U.S. Treasury Department has announced that it is examining possibleFinally, changes in currency exchange rates may impact the regulatory rules affectingreported value of our revenues, expenses, and cash flows. We cannot predict changes in currency exchange rates, the impact of exchange rate changes, nor the degree to which we will be able to manage the impact of currency exchange rate changes.
Consolidation in the healthcare industry could have an adverse effect on our revenues and results of operations.
Many healthcare industry companies, that move their tax domicile outsideincluding healthcare systems, distributors, manufacturers, providers, and insurers, are consolidating or have formed strategic alliances. As the U.S. In the event the U.S. Treasury Departmenthealthcare industry consolidates, competition to provide goods and the IRS wereservices to change the applicable regulatory rules,industry participants will become more intense. Further, this consolidation creates larger enterprises with greater negotiating power, which they can use to negotiate price concessions. If we could face potentially substantial tax costsmust reduce our prices because of industry consolidation, or if we lose customers as a result of consolidation, our business, results of operations, financial condition, and cash flows could be adversely affected.
Healthcare industry cost-containment measures could result in reduced sales of our medical devices and medical device components.
Most of our customers, and the Transactions. Wehealthcare providers to whom our customers supply medical devices, rely on third-party payers, including government programs and private health insurance plans, to reimburse some or all of the cost of the procedures in which medical devices that incorporate components we manufacture or assemble are used. The continuing efforts of governmental authorities, insurance companies and other payers of healthcare costs to contain or reduce these costs could lead to patients being unable to assess the potential impactobtain approval for payment from these third-party payers. If third-party payer payment approval cannot be obtained by patients, sales of any such possible changes, if adopted, until theyfinished medical devices that include our components may decline significantly and our customers may reduce or eliminate purchases of our components. The cost-containment measures that healthcare providers are announced.
On September 22, 2014,instituting, both in the U.S. Treasury Department and the IRS issued new guidance announcing their intention to issue regulations interpreting multiple sectionsoutside of the Code, including Section 7874, to address inversion transactions and transactions that Treasury and the IRS characterize as “post-inversion tax avoidance transactions” (the IRS Notice). When issued, such regulations would apply to transactions completed on or after September 22, 2014. The regulations described in the IRS Notice would expand the set of circumstances under which Section 7874 applies to cause the foreign acquirer of a U.S. corporation to be treated as a U.S. corporation for U.S. federal income tax purposes. Such regulations would also impose additional U.S. taxes on certain transactions involving the acquired U.S. corporation’s CFC’s.
The regulations interpreting Section 7874 of the Code announced in the IRS Notice are not expected to cause us to be treated as a U.S. corporation for U.S. federal tax purposes. However, if ultimately upheld by a reviewing court, the regulations announced in the IRS Notice would be expected to limit, could harm our ability to engage in various intercompany transactions involving non-U.S. subsidiaries.operate profitably. For example, managed care organizations have successfully negotiated volume discounts for pharmaceuticals, and GPOs and IDNs have also concentrated purchasing decisions for some customers, which has led to downward pricing pressure for medical device companies, including us.
In addition, in the IRS Notice, the U.S. Treasury Department and the IRS announced their intention to issue additional guidance in the future intended to restrict our ability to undertake certain transactions which could reduce our U.S. tax liability. According to the IRS Notice, such guidance may include, among other things, limitations on our ability to deduct interest on certain intercompany debt for U.S federal income tax purposes. We are unable to predict the likelihood that any such guidance will be issued, the nature of regulations that may be promulgated thereunder or the effect such guidance may have on our business.
The Transaction may not allow us to maintain competitive global cash management and a competitive effective corporate tax rate.
While we believe that being incorporated in Ireland should help us maintain a competitive worldwide effective corporate tax rate and provide flexible global cash management, we cannot give any assurance as to what our effective tax rate nor global cash accessibility will be, however, because of, among other things, uncertainty regarding the tax policies of the jurisdictions where we will operate. Additionally, the tax laws of Ireland and other jurisdictions could change in the future, and such changes could cause a material change in our effective tax rate or global cash accessibility.
Legislative or other governmental action relating to the denial of U.S. federal or state governmental contracts to U.S. companies that redomicile abroad could adversely affect our business.
Various U.S. federal and state legislative proposals that would deny governmental contracts to U.S. companies that move their corporate location abroad may affect us. We are unable to predict the likelihood that, or final form in which, any such proposed legislation might become law, the nature of the regulations that may be promulgated under any future legislative enactments, or the effect such enactments and increased regulatory scrutiny may have on our business.
Item 1B. Unresolved Staff Comments
None.
Item 2. Properties
OurMedtronic's principal executive office is located in Ireland and is leased by us. Ourthe Company, while its main operational offices are owned by us and located in the Minneapolis, Minnesota metropolitan area.area and are owned by the Company.
OurThe Company's total manufacturing and research space is approximately 149.6 million square feet. Approximately 7237 percent of the manufacturing or research facilities are owned by usMedtronic and the remaining balance is leased. The following is a summary of ourthe Company's largest manufacturing or research facilities by location:
|
| | | | | | | |
| Location Country or State | | Square Feet (in thousands) |
ChinaConnecticut | | 1,1821,138 |
|
South CarolinaPuerto Rico | | 1,146811 |
|
ConnecticutMexico | | 1,098762 |
|
MinnesotaChina | | 1,024735 |
|
MexicoMinnesota | | 959623 |
|
Puerto RicoItaly | | 831485 |
|
| Ireland | | 640446 |
|
FloridaDominican Republic | | 550304 |
|
MassachusettsArizona | | 504294 |
|
CaliforniaSwitzerland | | 502283 |
|
IllinoisFrance | | 459268 |
|
ItalyColorado | | 454259 |
|
TexasFlorida | | 431255 |
|
SwitzerlandCalifornia | | 347210 |
|
Arizona | | 294 |
|
Indiana | | 291 |
|
Colorado | | 287 |
|
Nebraska | | 281 |
|
Georgia | | 236 |
|
Japan | | 220 |
|
Dominican Republic | | 217 |
|
Canada | | 206 |
|
WeMedtronic also maintainmaintains sales and administrative offices in the U.S. at 12five locations in 10five states and outside the U.S. at 202129 locations in 6762 countries. MostA majority of these locations are leased. We areThe Company is using substantially all of ourits currently available productive space to develop, manufacture, and market ourits products. OurThe Company's facilities are in good operating condition,well-maintained, suitable for their respective uses, and adequate for current needs.
Item 3. Legal Proceedings
In accordance with Item 103 of Regulation S-K, we have adopted a $1 million disclosure threshold for proceedings under environmental laws to which a governmental authority is a party, as we believe matters under this threshold are not material to the Company. A discussion of the Company’s legal proceedings is containedand other loss contingencies are described in Note 1518 to the consolidated financial statements in “Item 8. Financial Statements and Supplementary Data” in this Annual Report on Form 10-K.
Item 4. Mine Safety Disclosures
Not applicable.
PART II
Item 5. Market for Medtronic’s Common Equity, Related Shareholder Matters, and Issuer Purchases of Equity Securities
The Company’s ordinary shares are listed on the New York Stock Exchange under the symbol “MDT.”
In January 2015, the Company's Board of Directors authorized, subject to the ongoing existence of sufficient distributable reserves, the adoption of the existing Medtronic, Inc. share redemption program. As of April 29, 2016, the Company had used all of the 80 million shares authorized under the January 2015 share redemption program. In June 2015, the Company's Board of Directors authorized, subject to the ongoing existence of sufficient distributable reserves, the redemption of an additional 80 million of the Company's ordinary shares. As of April 29, 2016, the Company had used 8 million of the 80 million shares authorized under the June 2015 share redemption program. As authorized by the Board of Directors, our share redemption program expires when the total number of authorized shares have been redeemed.
The following table provides information about the shares redeemedrepurchased by the Company during the fourth quarter of fiscal year 2016:2022: | | | | | | | | | | | | | | | | | | | | | | | | | | |
| Fiscal Period | | Total Number of
Shares Purchased | | Average Price
Paid per Share | | Total Number of Shares
Purchased as a Part of
Publicly Announced
Program | | Maximum Approximate Dollar Value of Shares that may yet be Purchased Under the Program |
| 1/29/2022-2/25/2022 | | 1,130,750 | | | $ | 103.16 | | | 1,130,750 | | | $ | 4,234,214,099 | |
| 2/26/2022-4/1/2022 | | 6,141,716 | | | 107.85 | | | 6,141,716 | | | 3,571,839,180 | |
| 4/2/2022-4/29/2022 | | 5,627,112 | | | 110.47 | | | 5,627,112 | | | 2,950,215,113 | |
| Total | | 12,899,578 | | | $ | 108.58 | | | 12,899,578 | | | $ | 2,950,215,113 | |
|
| | | | | | | | | | | | | |
| Fiscal Period | | Total Number of Shares Purchased | | Average Price Paid per Share | | Total Number of Shares Purchased as a Part of Publicly Announced Program | | Maximum Number of Shares that May Yet Be Purchased Under the Program |
| 1/30/2016-2/26/2016 | | 2,700,350 |
| | $ | 74.08 |
| | 2,700,350 |
| | 77,939,900 |
|
| 2/27/2016-4/1/2016 | | 3,710,152 |
| | 75.47 |
| | 3,710,152 |
| | 74,229,748 |
|
| 4/2/2016-4/29/2016 | | 2,351,007 |
| | 76.56 |
| | 2,351,007 |
| | 71,878,741 |
|
| Total | | 8,761,509 |
| | $ | 75.34 |
| | 8,761,509 |
| | 71,878,741 |
|
On June 20, 2016,2022, there were approximately 40,10022,372 shareholders of record of the Company’s ordinary shares. Ordinary cash dividends declared and paid totaled 38.0 cents$0.63 per share for each quarter of fiscal year 20162022 and 30.5 cents$0.58 per share for each quarter of fiscal year 2015. The following prices are2021. On May 26, 2022, the high and low market sales quotations per share of the Company’s ordinary sharesCompany announced an increase in Medtronic's cash dividends for the quarters indicated:
|
| | | | | | | | | | | | | | | | |
| Fiscal | | 1st Quarter | | 2nd Quarter | | 3rd Quarter | | 4th Quarter |
| 2016 High | | $ | 79.08 |
| | $ | 78.91 |
| | $ | 78.92 |
| | $ | 80.74 |
|
| 2016 Low | | 72.20 |
| | 55.54 |
| | 72.28 |
| | 71.03 |
|
| 2015 High | | 65.50 |
| | 67.11 |
| | 77.39 |
| | 79.50 |
|
| 2015 Low | | 57.81 |
| | 59.83 |
| | 65.51 |
| | 70.91 |
|
first quarter of fiscal year 2023, raising the amount to $0.68 per share.
Stock Performance Graph
The following graph compares the cumulative total shareholder return on Medtronic’s ordinary shares with the cumulative total shareholder return on the Standard & Poor’s (S&P) 500 Index and the S&P 500 Health Care Equipment Index for the last five fiscal years. The graph assumes that $100 was invested at market close on April 29, 201124, 2017 in Medtronic’s ordinary shares, the S&P 500 Index, and the S&P 500 Health Care Equipment Index and that all dividends were reinvested.

|
| | | | | | | | | | | | | | | | | | | | | | | | |
| Company/Index | | April 2011 | | April 2012 | | April 2013 | | April 2014 | | April 2015 | | April 2016 |
| Medtronic, Inc. / Medtronic plc | | $ | 100.00 |
| | $ | 92.68 |
| | $ | 116.80 |
| | $ | 149.62 |
| | $ | 203.06 |
| | $ | 211.37 |
|
| S&P 500 Index | | 100.00 |
| | 105.16 |
| | 121.27 |
| | 145.85 |
| | 169.15 |
| | 168.63 |
|
| S&P 500 Health Care Equipment Index | | 100.00 |
| | 97.46 |
| | 113.00 |
| | 134.57 |
| | 177.23 |
| | 187.79 |
|
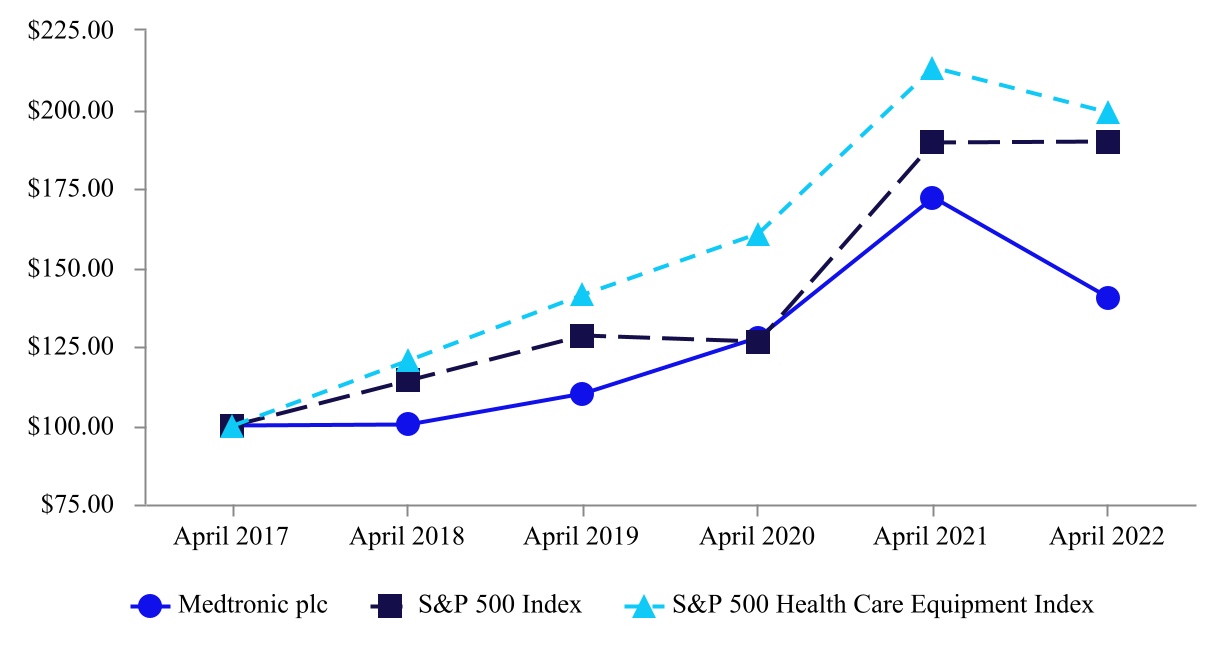
| | | | | | | | | | | | | | | | | | | | | | | | | | | | | | | | | | | | | | |
| Company/Index | | April 2017 | | April 2018 | | April 2019 | | April 2020 | | April 2021 | | April 2022 |
| Medtronic plc | | $ | 100.00 | | | $ | 100.06 | | | $ | 109.91 | | | $ | 127.67 | | | $ | 172.10 | | | $ | 140.27 | |
| S&P 500 Index | | 100.00 | | | 114.20 | | | 128.28 | | | 126.28 | | | 189.28 | | | 189.68 | |
| S&P 500 Health Care Equipment Index | | 100.00 | | | 120.35 | | | 141.25 | | | 160.75 | | | 213.16 | | | 198.87 | |
For information on ourthe Company's equity compensation plans, see "Item 12. Security Ownership of Certain Beneficial Owners and Management and Related Shareholder Matters" in this Annual Report on Form 10-K.
Irish Restrictions on Import and Export of Capital
Except as indicated below, there are no restrictions on non-residents of Ireland dealing in Irish domestic securities, which includes ordinary shares of Irish companies. Except as indicated below, dividends and redemption proceeds also continue to be freely transferable to non-resident holders of such securities. The Financial Transfers Act, 1992 provides that the Irish Minister for Finance can make provision for the restriction of financial transfers between Ireland and other countries. For the purposes of this Act, “financial transfers” include all transfers which would be movements of capital or payments within the meaning of the treaties governing the European CommunitiesE.U. if they had been made between Member States of the Communities.E.U. This Act has been used by the Minister for Finance to implement European Council Directives, whichand underlying E.U. regulations provide for the restriction of financial transfers to certain countries, organizations, and people including the Al-Qaeda network and the Taliban, Afghanistan, Belarus, Burma (Myanmar), Democratic People’s Republic of Korea, Democratic Republic of Congo, Egypt, Eritrea, Iran, Iraq, Ivory Coast, Lebanon, Liberia, Libya, Republic of Guinea, Russia, Somalia, Sudan, Syria, Tunisia, certain persons and Syria.groups in Ukraine and Zimbabwe.
Any transfer of, or payment in respect of, a share or interest in a share involving the government of any country that is currently the subject of United Nations or E.U. sanctions, any person or body controlled by any of the foregoing, or by any person acting on behalf of the foregoing, may be subject to restrictions pursuant to such sanctions as implemented into Irish law.
Irish Taxes Applicable to U.S. Holders
Dividends paid by Medtronic will generally be subject to Irish dividend withholding tax (currently at the standarda rate of income tax (currently 2025 percent) unless an exemption applies.
Dividends paid to U.S. residents will not be subject to Irish dividend withholding tax provided that:
•in the case of a beneficial ownerof Medtronic shares held in the Depository Trust Company (DTC), the address of the beneficial owner in the records of his or her broker is in the United States and this information is provided by the broker to the Company’s qualifying intermediary; or
•in the case of a record owner, the record owner has provided to the Company’s transfer agent a valid U.SU.S. Certification of Residence (Form 6166) or valid Irish Non-Resident Form V2.
Irish income tax may also arise with respect to dividends paid on Medtronic’s ordinary shares. A U.S. resident who meets one of the exemptions from dividend withholding tax described above and who does not hold Medtronic shares through a branch or agency in Ireland through which a trade is carried on generally will not have any Irish income tax liability on a dividend paid by Medtronic. In addition, if a U.S. shareholder is subject to the dividend withholding tax, the withholding payment discharges any Irish income tax liability, provided the shareholder furnishes to the Irish Revenue authorities a statement of the dividend withholding tax imposed.
While the U.S./Ireland Double Tax Treaty contains provisions regarding withholding, due to the wide scope of the exemptions from dividend withholding tax available under Irish domestic law, it would generally be unnecessary for a U.S. resident shareholder to rely on the treaty provisions.
Item 6. Selected Financial DataReserved
|
| | | | | | | | | | | | | | | | | | | |
| (in millions, except per share data and additional information) | Fiscal Year |
| Operating Results for the Fiscal Year: | 2016 | | 2015 (1) | | 2014 | | 2013 | | 2012 |
| Net sales | $ | 28,833 |
| | $ | 20,261 |
| | $ | 17,005 |
| | $ | 16,590 |
| �� | $ | 16,184 |
|
| Cost of products sold | 9,142 |
| | 6,309 |
| | 4,333 |
| | 4,126 |
| | 3,889 |
|
| Research and development expense | 2,224 |
| | 1,640 |
| | 1,477 |
| | 1,557 |
| | 1,490 |
|
| Selling, general, and administrative expense | 9,469 |
| | 6,904 |
| | 5,847 |
| | 5,698 |
| | 5,623 |
|
| Special charges (gains), net | 70 |
| | (38 | ) | | 40 |
| | — |
| | — |
|
| Restructuring charges, net | 290 |
| | 237 |
| | 78 |
| | 172 |
| | 87 |
|
| Certain litigation charges, net | 26 |
| | 42 |
| | 770 |
| | 245 |
| | 90 |
|
| Acquisition-related items | 283 |
| | 550 |
| | 117 |
| | (49 | ) | | 12 |
|
| Amortization of intangible assets | 1,931 |
| | 733 |
| | 349 |
| | 331 |
| | 335 |
|
| Other expense, net | 107 |
| | 118 |
| | 181 |
| | 108 |
| | 364 |
|
| Operating profit | 5,291 |
| | 3,766 |
| | 3,813 |
| | 4,402 |
| | 4,294 |
|
| Operating profit margin percentage | 18.4 | % | | 18.6 | % | | 22.4 | % | | 26.5 | % | | 26.5 | % |
| Interest expense, net | 955 |
| | 280 |
| | 108 |
| | 151 |
| | 149 |
|
| Income from continuing operations before income taxes | 4,336 |
| | 3,486 |
| | 3,705 |
| | 4,251 |
| | 4,145 |
|
| Provision for income taxes | 798 |
| | 811 |
| | 640 |
| | 784 |
| | 730 |
|
| Income from continuing operations | 3,538 |
| | 2,675 |
| | 3,065 |
| | 3,467 |
| | 3,415 |
|
| Income from discontinued operations, net of tax | — |
| | — |
| | — |
| | — |
| | 202 |
|
| Net income | $ | 3,538 |
| | $ | 2,675 |
| | $ | 3,065 |
| | $ | 3,467 |
| | $ | 3,617 |
|
| Per Ordinary Share: | |
| | |
| | |
| | |
| | |
|
| Basic - Income from continuing operations | $ | 2.51 |
| | $ | 2.44 |
| | $ | 3.06 |
| | $ | 3.40 |
| | $ | 3.24 |
|
| Basic - Net income | 2.51 |
| | 2.44 |
| | 3.06 |
| | 3.40 |
| | 3.43 |
|
| Diluted - Income from continuing operations | 2.48 |
| | 2.41 |
| | 3.02 |
| | 3.37 |
| | 3.22 |
|
| Diluted - Net income | 2.48 |
| | 2.41 |
| | 3.02 |
| | 3.37 |
| | 3.41 |
|
| Cash dividends declared per ordinary share | 1.52 |
| | 1.22 |
| | 1.12 |
| | 1.04 |
| | 0.97 |
|
| Financial Position at Fiscal Year-end: | |
| | |
| | |
| | |
| | |
|
| Working capital | $ | 16,435 |
| | $ | 21,671 |
| | $ | 15,651 |
| | $ | 13,902 |
| | $ | 10,409 |
|
| Current ratio | 3.3:1.0 | | 3.4:1.0 | | 3.8:1.0 | | 4.5:1.0 | | 2.8:1.0 |
| Total assets | $ | 99,782 |
| | $ | 106,685 |
| | $ | 37,943 |
| | $ | 34,900 |
| | $ | 32,818 |
|
| Long-term debt | 30,247 |
| | 33,752 |
| | 10,315 |
| | 9,741 |
| | 7,359 |
|
| Shareholders’ equity | 52,063 |
| | 53,230 |
| | 19,443 |
| | 18,671 |
| | 17,113 |
|
Additional Information:(2) | |
| | |
| | |
| | |
| | |
|
| Full-time employees at year-end | 88,063 |
| | 85,573 |
| | 43,305 |
| | 42,466 |
| | 40,601 |
|
| Full-time equivalent employees at year-end | 98,017 |
| | 92,500 |
| | 49,247 |
| | 46,659 |
| | 44,944 |
|
(1) Covidien was acquired on January 26, 2015. For further information, see the section entitled "Understanding our Financial Information"
(2) Employee counts include continuing operations only.
Item 7. Management’s Discussion and Analysis of Financial Condition and Results of Operations
Understanding Our Financial InformationUNDERSTANDING OUR FINANCIAL INFORMATION
The following discussion and analysis provides information management believes to be relevant to understanding the financial condition and results of operations of the CompanyCompany. The discussion focuses on our financial results for the fiscal year ended April 29, 2022 (fiscal year 2022) and its subsidiaries.the fiscal year ended April 30, 2021 (fiscal year 2021). A discussion on our results of operations for fiscal year 2021 as compared to the year ended April 24, 2020 (fiscal year 2020) is included in Part II, Item 7. "Management's Discussion and Analysis of Financial Condition and Results of Operations" of our Annual Report on Form 10-K for the year ended April 30, 2021, filed with the SEC on June 25, 2021, and is incorporated by reference into this Form 10-K. You should read this discussion and analysis along with our consolidated financial statements and related notes thereto as ofat April 29, 20162022 and April 24, 201530, 2021 and for each of the three fiscal years ended April 29, 2016, April 24, 2015,2022, 2021, and April 25, 2014.
On January 26, 2015, pursuant to the Transaction Agreement, the Company acquired Covidien and Medtronic, Inc. (collectively, the Transactions). Following the consummation of the Transactions, Medtronic, Inc. and Covidien became subsidiaries of the Company. In connection with the Transactions, the Company became the successor registrant to Medtronic, Inc. and re-registered as a public limited company organized under the laws of Ireland. For the fiscal year ended April 24, 2015, the results of operations of Covidien2020, which are reflected in Medtronic’s results of operations for only the fourth quarter due to the timing of the Transactions, which will affect comparability throughout this Annual Report on Form 10-K.
For further information regarding the Acquisition, see the section entitled "Acquisition and Investments - Acquisition of Covidien plc in Fiscal Year 2015" contained inpresented within "Item 1. Business" and Note 2 to the consolidated financial statements in “Item 8. Financial Statements and Supplementary Data”Data" in this Annual Report on Form 10-K.
Organization of Financial Information
Management’s discussion Amounts reported in millions within this annual report are computed based on the amounts in thousands, and analysis provides material historical and prospective disclosures designed to enable investors and other users to assess our financial condition and results of operations.
Statements that are forward-looking and not historical in nature are subject to risks and uncertainties. See "Item 1A. Risk Factors" in this Annual Report on Form 10-K and "Cautionary Factors That May Affect Future Results" in this management's discussion and analysis for more information.
The consolidated financial statements are presented within Item 8 of this Annual Report on Form 10-K and includetherefore, the consolidated statements of income, consolidated statements of comprehensive income, consolidated balance sheets, consolidated statements of shareholders’ equity, consolidated statements of cash flows, and the related notes, which are an integral partsum of the consolidated financial statements.components may not equal the total amount reported in millions due to rounding. Additionally, certain columns and rows within tables may not sum due to rounding.
Financial Trends
Throughout this management’s discussionManagement’s Discussion and analysis,Analysis, we present certain financial measures that management uses to evaluatefacilitate management's review of the operational performance of the Company and as a basis for strategic planning; however, such financial measures are not presented in our financial statements prepared in accordance with accounting principles generally accepted accounting principles in the United States (U.S.) (U.S. GAAP). These financial measures are considered non-GAAP"non-GAAP financial measures.
Management uses non-GAAPmeasures" and are intended to supplement, and should not be considered as superior to, financial measures to facilitate management’s review of the operational performance of the Company and as a basis for strategic planning. Management believespresented in accordance with U.S. GAAP. We believe that non-GAAP financial measures provide information useful information to investors regardingin understanding the Company's underlying businessoperational performance and trends and may facilitate comparisons with the performance of other companies in the Company’s ongoing operations and are useful for period over period comparisons of such operations. The non-GAAP financial measures reflect an additional way of viewing aspects ofmedical technologies industry.
As presented in the Company’s operations. Investors should not consider results reflecting non-GAAP financial measures in isolation from, or as a substitute for, financial information prepared in accordance with U.S. GAAP and are cautioned that Medtronic may calculate results reflecting non-GAAP financial measures in a manner that is different from other companies.
The GAAP to Non-GAAP Reconciliation presentsReconciliations section below, our non-GAAP financial measures that exclude the impact of certain charges or gainsbenefits that contribute to or reduce earnings and that may affect financial trends but whichand include certain charges or benefits that result from transactions or events that management believeswe believe may or may not recur with similar materiality or impact to our operations in future periods (Non-GAAP Adjustments).
In the event there is a Non-GAAP Adjustment recognized in our operating results, the tax cost or benefit attributable to that item is separately calculated and recorded.reported. Because the effective rate can be significantly impacted by thesethe Non-GAAP Adjustments that take place induring the period, we often refer to our tax rate using both the effective rate and the non-GAAP nominal tax rate (Non-GAAP Nominal Tax Rate). The Non-GAAP Nominal Tax Rate is calculated as the provision for income taxes,tax provision, adjusted for the impact of Non-GAAP Adjustments, as a percentage of income from operations before income taxes, excluding Non-GAAP Adjustments.
Free cash flow is a non-GAAP financial measure calculated by subtracting property, plant, and equipment additions from operating cash flows.
Refer to the “GAAP to Non-GAAP Reconciliation,Reconciliations," "Income Taxes," and "Summary of"Free Cash Flows"Flow" sections for reconciliations of the non-GAAP financial measures to their most directly comparable financial measures prepared in accordance with U.S. GAAP.
EXECUTIVE LEVEL OVERVIEW
The global healthcare system is continuing to respond to the unprecedented challenge posed by the COVID-19 pandemic ("COVID-19" or the "pandemic"). Most of our resultsbusinesses were affected by a decline in global procedural volumes during fiscal year 2021, particularly in the first and second quarters. During fiscal year 2022, the pandemic, to a lesser extent, continued to affect most of operationsour businesses, including the most recent COVID-19 lockdown in China which began in late March. In addition to the pandemic, our business faced the impacts of healthcare system staffing shortages on procedural volumes and significant supply chain disruptions in certain businesses particularly in the fourth quarter of fiscal year 2022. We cannot predict with confidence the duration and severity of the pandemic and its impact on global procedure volumes. We expect medical procedure rates may continue to vary by therapy and country and to be impacted by regional COVID-19 case volumes, vaccine and booster immunization rates, and new COVID-19 variants. Additionally, we cannot predict the impact healthcare system staffing shortages will have on procedural volumes, and the impact supply chain disruptions will have on the business.
The following is a summary of revenue, diluted earnings per share, and cash flow for fiscal years 2022 and 2021:
GAAP to Non-GAAP Reconciliations
Starting with the quarter ended April 29, 2022, the Company will no longer adjust non-GAAP financial measures for certain license payments for, or acquisitions of, technology not approved by regulators due to recent industry guidance from the U.S. Securities and Exchange Commission. Historical non-GAAP financial measures presented in this Annual Report on Form 10-K have been recast for comparability.
The tables below present reconciliations of our Non-GAAP financial measures to the most directly comparable financial measures prepared in accordance with U.S. GAAP for fiscal years 2022 and 2021.
| | | | | | | | | | | | | | | | | | | | | | | | | | | | | |
| | Fiscal year ended April 29, 2022 |
| (in millions, except per share data) | Income Before Income Taxes | | Income Tax Provision (Benefit) | | Net Income Attributable to Medtronic | | Diluted EPS | | Effective Tax Rate |
| GAAP | $ | 5,517 | | | $ | 456 | | | $ | 5,039 | | | $ | 3.73 | | | 8.3 | % |
| Non-GAAP Adjustments: | | | | | | | | | |
Restructuring and associated costs (1) | 335 | | | 54 | | | 281 | | | 0.21 | | | 16.1 | |
Acquisition-related items (2) | (43) | | | 5 | | | (48) | | | (0.04) | | | (11.6) | |
| Certain litigation charges | 95 | | | 17 | | | 78 | | | 0.06 | | | 17.9 | |
(Gain)/loss on minority investments (3) | (12) | | | — | | | (9) | | | (0.01) | | | — | |
Medical device regulations (4) | 102 | | | 16 | | | 86 | | | 0.06 | | | 15.7 | |
| Amortization of intangible assets | 1,733 | | | 266 | | | 1,467 | | | 1.09 | | | 15.3 | |
MCS impairment / costs (5) | 881 | | | 220 | | | 661 | | | 0.49 | | | 25.0 | |
Certain tax adjustments, net (6) | — | | | 50 | | | (50) | | | (0.04) | | | — | |
| Non-GAAP | $ | 8,609 | | | $ | 1,084 | | | $ | 7,505 | | | $ | 5.55 | | | 12.6 | % |
| | | | | | | | | | | | | | | | | | | | | | | | | | | | | |
| | Fiscal year ended April 30, 2021 |
| (in millions, except per share data) | Income Before Income Taxes | | Income Tax (Benefit) Provision | | Net Income Attributable to Medtronic | | Diluted EPS | | Effective Tax Rate |
| GAAP | $ | 3,895 | | | $ | 265 | | | $ | 3,606 | | | $ | 2.66 | | | 6.8 | % |
| Non-GAAP Adjustments: | | | | | | | | | |
Restructuring and associated costs (1) | 617 | | | 128 | | | 489 | | | 0.36 | | | 20.7 | |
Acquisition-related items (2) | (15) | | | (20) | | | 4 | | | — | | | 126.7 | |
| Certain litigation charges | 118 | | | 23 | | | 95 | | | 0.07 | | | 19.5 | |
(Gain)/loss on minority investments (3) | (61) | | | — | | | (57) | | | (0.04) | | | — | |
Impairment charges (7) | 76 | | | 7 | | | 68 | | | 0.05 | | | 10.5 | |
Medical device regulations (4) | 83 | | | 15 | | | 68 | | | 0.05 | | | 18.1 | |
Debt tender premium and other charges (8) | 308 | | | 60 | | | 248 | | | 0.18 | | | 19.5 | |
| Amortization of intangible assets | 1,783 | | | 283 | | | 1,500 | | | 1.11 | | | 15.9 | |
Certain tax adjustments, net (9) | — | | | 41 | | | (41) | | | (0.03) | | | — | |
| Non-GAAP | $ | 6,804 | | | $ | 802 | | | $ | 5,980 | | | $ | 4.42 | | | 11.8 | % |
(1)Associated costs include costs incurred as a direct result of the restructuring program, such as salaries for employees supporting the program and consulting expenses.
(2)The charges primarily include business combination costs, changes in fair value of contingent consideration, specifically for the fiscal year ended April 30, 2021, changes in amounts accrued for certain contingent liabilities for a past acquisition.
(3)We exclude unrealized and realized gains and losses on our minority investments as we do not believe that these components of income or expense have a direct correlation to our ongoing or future business operations.
(4)The charges represent estimated incremental costs of complying with the new European Union medical device regulations for previously registered products and primarily include charges for contractors supporting the project and other direct third-party expenses, which are expected to be substantially complete by the end of fiscal year 2023.
(5)The charges relate to the adjustedCompany’s June 2021 decision to stop the distribution and sale of the Medtronic HVAD System within the Mechanical Circulatory Support Operating Unit (MCS). The charges included $515 million of non-cash impairments, primarily related to $409 million of intangible asset impairments, as well as $366 million for commitments and obligations in connection with the decision, including patient support obligations, restructuring, and other associated costs. Medtronic is committed to serving the needs of the approximately 3,500 patients currently implanted with the HVAD System.
(6)The net benefit primarily relates to the deferred tax impact associated with a step up in tax basis for Swiss Cantonal purposes and a change in tax rates on deferred taxes associated with intellectual property, which are partially offset by the amortization on previously established deferred tax assets from intercompany intellectual property transactions and a charge related to a change in the Company's permanent reinvestment assertion on certain historical earnings.
(7)The charges relate to the abandonment of certain intangible assets in our Neuroscience segment.
(8)The charges relate to the early redemption of approximately $6.0 billion of debt.
(9)The net benefit primarily relates to the finalization of an audit at the IRS Appellate level for fiscal years 2012 through 2014 and the capitalization of certain research and development costs for U.S. income tax purposes, which are partially offset by the impact of an intercompany sale of assets, and a tax basis adjustment and amortization of previously established deferred tax assets from intercompany intellectual property transactions.
Free Cash Flow
Free cash flow, a non-GAAP measurementsfinancial measure, is calculated by subtracting additions to property, plant, and equipment from net cash provided by operating activities. Management uses this non-GAAP financial measure, in addition to U.S. GAAP financial measures, to evaluate our operating results. Free cash flow should be considered supplemental to, and not a substitute for, our reported financial results prepared in accordance with U.S. GAAP. Reconciliations between net cash provided by management.operating activities (the most comparable U.S. GAAP measure) and free cash flow are as follows:
Our | | | | | | | | | | | |
| Fiscal Year |
| (in millions) | 2022 | | 2021 |
| Net cash provided by operating activities | $ | 7,346 | | | $ | 6,240 | |
| Additions to property, plant, and equipment | (1,368) | | | (1,355) | |
| Free cash flow | $ | 5,978 | | | $ | 4,885 | |
Refer to the Summary of Cash Flows section for drivers of the change in cash provided by operating activities.
NET SALES
Segment and Division
The charts below illustrate the percent of net sales by segment for fiscal year-end isyears 2022 and 2021:
The table below includes net sales by segment and division for fiscal years 2022 and 2021: | | | | | | | | | | | | | | | | | |
| | Net Sales by Fiscal Year | | Percent Change |
| (in millions) | 2022 | | 2021 | |
| Cardiac Rhythm & Heart Failure | $ | 5,908 | | | $ | 5,584 | | | 6 | % |
| Structural Heart & Aortic | 3,055 | | | 2,834 | | | 8 | |
| Coronary & Peripheral Vascular | 2,460 | | | 2,354 | | | 5 | |
| Cardiovascular | 11,423 | | | 10,772 | | | 6 | |
| Surgical Innovations | 6,060 | | | 5,438 | | | 11 | |
| Respiratory, Gastrointestinal, & Renal | 3,081 | | | 3,298 | | | (7) | |
| Medical Surgical | 9,141 | | | 8,737 | | | 5 | |
| Cranial & Spinal Technologies | 4,456 | | | 4,288 | | | 4 | |
| Specialty Therapies | 2,592 | | | 2,307 | | | 12 | |
| Neuromodulation | 1,735 | | | 1,601 | | | 8 | |
| Neuroscience | 8,784 | | | 8,195 | | | 7 | |
| Diabetes | 2,338 | | | 2,413 | | | (3) | |
| Total | $ | 31,686 | | | $ | 30,117 | | | 5 | % |
Segment and Market Geography
The charts below illustrate the last Fridaypercent of net sales by market geography for fiscal years 2022 and 2021:
The table below includes net sales by market geography for each of our segments for fiscal years 2022 and 2021:
| | | | | | | | | | | | | | | | | | | | | | | | | | | | | | | | | | | | | | | | | | | | | | | | | | | | | |
| U.S.(1) | | Non-U.S. Developed Markets(2) | | Emerging Markets(3) |
| (in millions) | Fiscal Year 2022 | | Fiscal Year 2021 | | % Change | | Fiscal Year 2022 | | Fiscal Year 2021 | | % Change | | Fiscal Year 2022 | | Fiscal Year 2021 | | % Change |
| Cardiovascular | $ | 5,545 | | | $ | 5,248 | | | 6 | % | | $ | 3,866 | | | $ | 3,752 | | | 3 | % | | $ | 2,012 | | | $ | 1,773 | | | 13 | % |
| Medical Surgical | 3,862 | | | 3,650 | | | 6 | | | 3,373 | | | 3,320 | | | 2 | | | 1,905 | | | 1,766 | | | 8 | |
| Neuroscience | 5,753 | | | 5,456 | | | 5 | | | 1,801 | | | 1,724 | | | 4 | | | 1,229 | | | 1,015 | | | 21 | |
| Diabetes | 974 | | | 1,171 | | | (17) | | | 1,085 | | | 1,019 | | | 6 | | | 279 | | | 222 | | | 26 | |
| Total | $ | 16,135 | | | $ | 15,526 | | | 4 | % | | $ | 10,126 | | | $ | 9,815 | | | 3 | % | | $ | 5,426 | | | $ | 4,777 | | | 14 | % |
(1)U.S. includes the United States and U.S. territories.
(2)Non-U.S. developed markets include Japan, Australia, New Zealand, Korea, Canada, and the countries of Western Europe.
(3)Emerging markets include the countries of the Middle East, Africa, Latin America, Eastern Europe, and the countries of Asia that are not included in April, and therefore, the total weeksnon-U.S. developed markets, as defined above.
The increase in anet sales for fiscal year can fluctuate between 52 and 53 weeks. Fiscal year 20162022 was a 53-week year, withprimarily due to the additional week occurringrecovery of global procedure volumes from the downturn experienced in the first quarter. Fiscal years 2015 and 2014 were 52-week years.second quarters of fiscal year 2021 as a result of the COVID-19 pandemic. The net sales increase was partially offset by supply chain challenges, particularly in the fourth quarter of fiscal year 2022, as well as the impact of COVID-19 experienced in fiscal year 2022, particularly in the U.S. and China. For fiscal year 2022, currency had an unfavorable impact of $107 million on non-U.S. developed markets and a favorable impact of $33 million on emerging markets.
Executive Level OverviewLooking ahead, a number of macro-economic and geopolitical factors could negatively impact our business, including without limitation:
Medtronic is among•The uncertain and uneven impact of COVID-19 on future procedural volumes, supply constraints including certain electronic components and semiconductors, healthcare staffing, worker absenteeism with our customers, suppliers, and in our own operations and field teams, and resulting impacts on demand for our products and therapies;
•The potential impact that sanctions and other measures being imposed in response to the world's largest medical technology, services,Russia-Ukraine conflict could have on revenue and solutions companies - alleviating pain, restoring health,supply chain. The financial impact of the conflict in the fourth quarter of fiscal year 2022, including on accounts receivable and extending life for millions of people around the world. We employ more than 88,000 full-time employees worldwide, serving physicians, hospitals,inventory reserves, was not material and patients in approximately 160 countries. Our primary products include those for cardiac rhythm disorders, cardiovascular disease, advanced and general surgical care, respiratory and monitoring solutions, neurological disorders, spinal conditions and musculoskeletal trauma, urological and digestive disorders, and ear, nose, and throat and diabetes conditions.
Net income for the fiscal year ended April 29, 2016 was $3.5 billion, $2.48 per diluted share, as compared to net income of $2.7 billion, $2.41 per diluted share, for2022, the fiscal year ended April 24, 2015, representing an increase of 32 percent and 3 percent, respectively.
The table below illustrates net sales by operating segment for fiscal years 2016 and 2015:
|
| | | | | | | | | | | |
| | | Net Sales | | |
| | | Fiscal Year | | |
| (dollars in millions; NM - Not Meaningful) | | 2016 | | 2015 | | % Change |
| Cardiac and Vascular Group | | $ | 10,196 |
| | $ | 9,361 |
| | 9 | % |
Minimally Invasive Therapies Group (1) | | 9,563 |
| | 2,387 |
| | 301 |
|
| Restorative Therapies Group | | 7,210 |
| | 6,751 |
| | 7 |
|
| Diabetes Group | | 1,864 |
| | 1,762 |
| | 6 |
|
| Total Net Sales | | $ | 28,833 |
| | $ | 20,261 |
| | 42 | % |
| |
(1) | The Minimally Invasive Therapies Group was a new group in the fourth quarter of fiscal year 2015 that contains the majority of Covidien's former operations. Revenue growth is compared to a full year of operations in fiscal year 2016. |
Our performance for the fiscal year ended April 29, 2016 was favorably impacted by an additional selling week during the first quarter of fiscal year 2016 due to our 52/53 week fiscal year calendar. Currency translation had an unfavorable impact of $1.4 billion on net sales compared to the prior fiscal year. The Cardiac and Vascular Group’s performance was primarily a result of the addition of the Covidien Peripheral business into the Aortic & Peripheral Vascular division and strong net sales across all three divisions: Cardiac Rhythm & Heart Failure, Coronary & Structural Heart, and Aortic & Peripheral Vascular. The Surgical Solutions and Patient Monitoring & Recovery divisions, within the Minimally Invasive Therapies Group, contributed $5.3 billion and $4.3 billion of revenue, respectively. The Restorative Therapies Group’s performance was a result of solid growth in Surgical Technologies, and was favorably impacted by the addition of the Covidien Neurovascular division, partially offset by declines in Spine and Neuromodulation. The Diabetes Group's performance was primarily due to growth in international markets, driven by the next-generation MiniMed 640G System with the Enhanced Enlite Sensor. See our discussion in the “Net Sales” section of this management’s discussion and analysis for more information on the results of our operating segments.
Acquisition of Covidien In fiscal year 2015, we acquired Covidien to continue in our mission to create a medical technology and services company with a comprehensive product portfolio and a broad global reach that is better able to improve healthcare outcomes. Covidien meaningfully accelerates our core strategies of therapy innovation, globalization and economic value. The transaction was accounted for as a business combination using the acquisition method of accounting, which requires, among other things, that assets acquired and liabilities assumed be recognized at their fair values at the Acquisition Date.
For further information regarding the Acquisition, see the section entitled “Acquisition and Investments - Acquisition of Covidien” contained in “Item 1. Business,” and Note 2 to the consolidated financial statements in “Item 8. Financial Statements and Supplementary Data” in this Annual Report on Form 10-K. The full text of the Transaction Agreement was filed as Exhibit 2.1 to our Amendment No. 5 to the Registration Statement on Form S-4 filed with the SEC on November 20, 2014.
GAAP to Non-GAAP Reconciliation The following is a reconciliation of our net sales, operating profit, income from operations before income taxes, net income, provision for income taxes, and effective tax rate prepared in accordance with U.S. GAAP to those results after giving effect to adjustments relating to charges or gains that management believes may or may not recur with similar materiality or impact on net income in future periods. We have provided these non-GAAP financial measures, because we believe they provide meaningful information regarding our results on a consistent and comparable basis for the periods presented. Management uses these non-GAAP financial measures to facilitate management's review of the operational performance of the Company and as a basis for strategic planning. Management believes that the resulting non-GAAP financial measures provide useful information to investors regarding the underlying business trends and performancein these countries represented less than 1% of the Company's ongoing operationsconsolidated revenues and are useful for period over period comparisons of such operations. These non-GAAP financial measures reflect an additional way of viewing aspects ofassets. Although the Company's operations. Investors should not consider results reflecting non-GAAP financial measures in isolation from, or as a substitute for, financial information prepared in accordance with U.S. GAAP and are cautioned that Medtronic may calculate results reflecting non-GAAP financial measures in a manner that is different from other companies.
Refer to the "Cost and Expenses," "Income Taxes," and "Liquidity and Capital Resources" sectionsimplications of this Management's Discussion and Analysis for more information on the Non-GAAP Adjustments.
|
| | | | | | | | | | | | | | | | | | | | | | | |
| | Fiscal year ended April 29, 2016 | |
| (in millions) | Net Sales | | Operating Profit | | Income from Operations Before Income Taxes | | Net Income | | Provision for Income Taxes (1) | | Effective Tax Rate | |
| GAAP | $ | 28,833 |
| | $ | 5,291 |
| | $ | 4,336 |
| | $ | 3,538 |
| | $ | 798 |
| | 18.4 | % | |
| Non-GAAP Adjustments: | | | | | | | | | | | | |
| Impact of inventory step-up | — |
| | 226 |
| | 226 |
| | 165 |
| | 61 |
| | 27.0 |
| |
| Special charges | — |
| | 70 |
| | 70 |
| | 44 |
| | 26 |
| | 37.1 |
| |
| Restructuring charges, net | — |
| | 299 |
| | 299 |
| | 221 |
| | 78 |
| | 26.1 |
| |
| Certain litigation charges, net | — |
| | 26 |
| | 26 |
| | 17 |
| | 9 |
| | 34.6 |
| |
| Acquisition-related items | — |
| | 283 |
| | 283 |
| | 212 |
| | 71 |
| | 25.1 |
| |
| Amortization of intangible assets | — |
| | 1,931 |
| | 1,931 |
| | 1,467 |
| | 464 |
| | 24.0 |
| |
| Loss on previously held forward starting interest rate swaps | — |
| | — |
| | 45 |
| | 29 |
| | 16 |
| | 35.6 |
| |
| Debt tender premium | — |
| | — |
| | 183 |
| | 118 |
| | 65 |
| | 35.5 |
| |
| Certain tax adjustments | — |
| | — |
| | — |
| | 417 |
| | (417 | ) | | — |
| |
| Non-GAAP | $ | 28,833 |
| | $ | 8,126 |
| | $ | 7,399 |
| | $ | 6,228 |
| | $ | 1,171 |
| | 15.8 | % | |
| |
(1) | The tax effect of each Non-GAAP Adjustment is based on the jurisdictions in which the expense (income) is incurred and the tax laws in effect for each such jurisdiction. |
|
| | | | | | | | | | | | | | | | | | | | | | | |
| | Fiscal year ended April 24, 2015 | |
| (in millions) | Net Sales | | Operating Profit | | Income from Operations Before Income Taxes | | Net Income | | Provision for Income Taxes (1) | | Effective Tax Rate | |
| GAAP | $ | 20,261 |
| | $ | 3,766 |
| | $ | 3,486 |
| | $ | 2,675 |
| | $ | 811 |
| | 23.3 | % | |
| Non-GAAP Adjustments: | | | | | | | | | | | | |
| Impact of inventory step-up | — |
| | 623 |
| | 623 |
| | 455 |
| | 168 |
| | 27.0 |
| |
| Impact of product technology upgrade commitment | — |
| | 74 |
| | 74 |
| | 61 |
| | 13 |
| | 17.6 |
| |
| Special (gains) charges, net | — |
| | (38 | ) | | (38 | ) | | (23 | ) | | (15 | ) | | 39.5 |
| |
| Restructuring charges, net | — |
| | 252 |
| | 252 |
| | 180 |
| | 72 |
| | 28.6 |
| |
| Certain litigation charges, net | — |
| | 42 |
| | 42 |
| | 27 |
| | 15 |
| | 35.7 |
| |
| Acquisition-related items | — |
| | 550 |
| | 550 |
| | 433 |
| | 117 |
| | 21.3 |
| |
| Amortization of intangible assets | — |
| | 733 |
| | 733 |
| | 538 |
| | 195 |
| | 26.6 |
| |
| Impact of acquisition on interest expense | — |
| | — |
| | 77 |
| | 49 |
| | 28 |
| | 36.4 |
| |
| Certain tax adjustments | — |
| | — |
| | — |
| | 349 |
| | (349 | ) | | — |
| |
| Non-GAAP | $ | 20,261 |
| | $ | 6,002 |
| | $ | 5,799 |
| | $ | 4,744 |
| | $ | 1,055 |
| | 18.2 | % | |
| |
(1) | The tax effect of each Non-GAAP Adjustment is based on the jurisdictions in which the expense (income) is incurred and the tax laws in effect for each such jurisdiction. |
|
| | | | | | | | | | | | | | | | | | | | | | | |
| | Fiscal year ended April 25, 2014 | |
| (in millions) | Net Sales | | Operating Profit | | Income from Operations Before Income Taxes | | Net Income | | Provision for Income Taxes (1) | | Effective Tax Rate | |
| GAAP | $ | 17,005 |
| | $ | 3,813 |
| | $ | 3,705 |
| | $ | 3,065 |
| | $ | 640 |
| | 17.3 | % | |
| Non-GAAP Adjustments: | | | | | | | | | | | | |
| Special charges | — |
| | 40 |
| | 40 |
| | 26 |
| | 14 |
| | 35.0 |
| |
| Restructuring charges, net | — |
| | 88 |
| | 88 |
| | 60 |
| | 28 |
| | 31.8 |
| |
| Certain litigation charges, net | — |
| | 770 |
| | 770 |
| | 701 |
| | 69 |
| | 9.0 |
| |
| Acquisition-related items | — |
| | 117 |
| | 117 |
| | 79 |
| | 38 |
| | 32.5 |
| |
| Amortization of intangible assets | — |
| | 349 |
| | 349 |
| | 230 |
| | 119 |
| | 34.1 |
| |
| Certain tax adjustments | — |
| | — |
| | — |
| | (63 | ) | | 63 |
| | — |
| |
| Non-GAAP | $ | 17,005 |
| | $ | 5,177 |
| | $ | 5,069 |
| | $ | 4,098 |
| | $ | 971 |
| | 19.2 | % | |
| |
(1) | The tax effect of each Non-GAAP Adjustment is based on the jurisdictions in which the expense (income) is incurred and the tax laws in effect for each such jurisdiction. |
Critical Accounting Estimates
The preparation of the consolidated financial statements, in conformity with U.S. GAAP, requires management to use judgment in making estimates and assumptions that affect the reported amounts of assets, liabilities, revenues, and expenses. These estimates reflect managements' best judgment about economic and market conditions and their potential effects on the valuation and/or carrying value of assets and liabilities based upon relevant information available. We base our estimates on historical experience and on various assumptions thatconflict are believed to be reasonable under the circumstances, the results of which form the basis for making judgments about the carrying values of assets and liabilities that are not readily apparent from other sources. See also Note 1 to the consolidated financial statements in “Item 8. Financial Statements and Supplementary Data” in this Annual Report on Form 10-K, which discusses our significant accounting policies.
Our critical accounting estimates include the following:
Revenue Recognition Based upon the lag time between the original sale to distributors at list price and the related distributor rebate earned at time of sale to the end customer and the judgments involved in estimating such rebates, we consider certain Minimally Invasive Therapies Group price adjustment rebates to be a critical accounting estimate. We adjust reserves to reflect differences between estimated and actual experience, and record such adjustment as a reduction of sales in the period of adjustment. Adjustments to recorded reserves have not been significant. Price adjustment rebates charged against gross sales for the fiscal year ended April 29, 2016 and the fourth quarter of fiscal year 2015 were $2.9 billion and $679 million, respectively.
Litigation Contingencies We are involved in a number of legal actions involving product liability, intellectual property disputes, shareholder derivative actions, securities class actions, other class actions, income tax matters, and environmental matters. The outcomes of these legal actions are not within our complete control and may not be known for prolonged periods of time. In some actions, the claimants seek damages, as well as other relief (including injunctions barring the sale of products that are the subject of the lawsuit), that could require significant expenditures or result in lost revenues. Estimates of probable losses resulting from litigation, governmental proceedings, and income tax matters involving the Company are inherently difficult to predict particularly whenat this time, the matters are in early procedural stages, with incomplete scientific facts or legal discovery; involve unsubstantiated or indeterminate claims for damages; potentially involve penalties, fines, or punitive damages; or could result in a change in business practice. Our significant legal proceedings are discussed in Note 15 to the consolidated financial statements in “Item 8. Financial Statements and Supplementary Data” in this Annual Report on Form 10-K. While it is not possible to predict the outcome for most of the matters discussed in Note 15 to the consolidated financial statements, we believe it is possible that costs associated with these matters could have a material adverse impact on our consolidated earnings, financial position, and/or cash flows.
Income Tax Reserves We establish reserves when, despite our belief that our tax return positions are fully supportable, we believe that certain positions are likely to be challenged and that weongoing conflict may or may not prevail. These reserves are established and adjusted in accordance with the principles of U.S. GAAP. Under U.S. GAAP, if we determine that a tax position is more likely than not of being sustained upon audit, based solelyincrease pressure on the technical merits ofglobal economy and supply chains, resulting in increased future volatility risk for our business operations and performance.
•Competitive product launches and pricing pressure, geographic macro-economic risks including general price inflation, rising interest rates, reimbursement challenges, impacts from changes in the position, we recognize the benefit. We measure the benefit by determining the amount that is greater than 50 percent likely of being realized upon settlement. We presume that all tax positions will be examined by a taxing authority with full knowledge of all relevant information. The calculationmix of our tax liabilities involves dealing with uncertaintiesproduct offerings, delays in the application of complex tax regulations in a multitude of jurisdictions across our global operations. We regularly monitor our tax positions and tax liabilities. We reevaluate the technical merits of our tax positions and recognize an uncertain tax benefit, or derecognize a previously recorded tax benefit, when (i) there is a completion of a tax audit, (ii) effective settlement of an issue (iii) there is a change in applicable tax law including a tax case or legislative guidance, or (iv) there is an expiration of the statute of limitations. Significant judgment is required in accounting for tax reserves. Although we believe that we have adequately provided for liabilities resulting from tax assessments by taxing authorities, positions taken by these tax authorities could have a material impact on our effective tax rate, consolidated earnings, financial position and/or cash flows.
Valuation of Intangible Assets and Goodwill When we acquire a business, the assets acquired and liabilities assumed are recorded at their respective fair values as of the acquisition date. Goodwill is the excess of the purchase price consideration over the estimated fair value of net assets of acquired businesses. Intangible assets include patents, trademarks, tradenames, customer relationships, purchased technology, and IPR&D. Determining the fair value of intangible assets acquired as part of a business combination requires us to make significant estimates. These estimates include the amount and timing of projected future cash flows of each project or technology, the discount rate used to discount those cash flows to present value, the assessment of the asset’s lifeproduct registration approvals, replacement cycle and the consideration of legal, technical, regulatory, economic, and competitive risks.
The test for goodwill impairment requires us to make several estimates about fair value, most of which are based on projected future cash flows. Our estimates associated with the goodwill impairment test are considered critical due to the amount of goodwill recorded on our consolidated balance sheets and the judgment required in determining fair value, including projected future cash flows. The Company assesses the impairment of goodwill annually in the third quarter at the reporting unit level and whenever an event occurs or circumstances change that would indicate that the carrying amount may be impaired. Goodwill was $41.5 billion and $40.5 billion as of April 29, 2016 and April 24, 2015, respectively.
We test definite-lived intangible assets for impairment when an event occurs or circumstances change that would indicate the carrying amount of the assets or asset group may be impaired. Our tests are based on future cash flows that require significant judgment with respect to future revenue and expense growth rates, appropriate discount rate, asset groupings, and other assumptions and estimates. We use estimates that are consistent with our business plans and a market participant view of the assets being evaluated. Actual results may differ from our estimates due to a number of factors including, among others, changes in competitive conditions, timing of regulatory approval, results of clinical trials, changes in worldwide economic conditions,challenges, and fluctuations in currency exchange rates. These risk factors are discussedrates; and
•National and provincial tender pricing for certain products, particularly in “Item 1A. Risk Factors” in this Annual Report on Form 10-K. Definite-lived intangible assets, net of accumulated amortization, were $26.2 billion and $27.4 billion as of April 29, 2016 and April 24, 2015, respectively.China.
The Company assesses the impairment of indefinite-lived intangibles annually in the third quarter and whenever an event occurs or circumstances change that would indicate that the carrying amount may be impaired. Our impairment tests of indefinite-lived intangibles require the Company to make several estimates about fair value, most of which are based on projected future cash flows. Indefinite-lived intangible assets, were $721 million and $720 million as of April 29, 2016 and April 24, 2015, respectively.Cardiovascular
The results of our annual impairment test are discussed in Note 6 to the consolidated financial statements in “Item 8. Financial Statements and Supplementary Data” in this Annual Report on Form 10-K.
Contingent Consideration Contingent consideration is recorded at the acquisition date at estimated fair value and is remeasured each reporting period with the change in fair value recognized as income or expense within acquisition-related items in our consolidated statements of income. Changes to the fair value of contingent consideration can result from changes in the timing and amount of revenue estimates, in the timing or probability of achieving the milestones which trigger payment, or in discount rates. The fair value of contingent consideration was $377 million and $264 million as of April 29, 2016 and April 24, 2015, respectively.
Net Sales
In the fourth quarter of fiscal year 2015, we amended the way in which we evaluate performance and allocate resources with the acquisition of Covidien. As a result, we began to operate under four reportable segments and four operating segments, the Cardiac and Vascular Group (composed of Cardiac Rhythm & Heart Failure, Coronary & Structural Heart and Aortic & Peripheral Vascular businesses), the Minimally Invasive Therapies Group (composed of Surgical Solutions and Patient Monitoring & Recovery), the Restorative Therapies Group (composed of the Spine, Neuromodulation, Surgical Technologies, and Neurovascular businesses), and the Diabetes Group. See Note 17 to the consolidated financial statements in “Item 8. Financial Statements and Supplementary Data” in this Annual Report on Form 10-K for additional discussion related to our segment reporting.
The table below illustrates net sales by operating segment and division for fiscal years 2016, 2015, and 2014:
|
| | | | | | | | | | | | | | | | | | | | | |
| | Net Sales | | | | Net Sales | | |
| | Fiscal Year | | | | Fiscal Year | | |
| (dollars in millions; NC - Not Calculable) | 2016 | | 2015 | | % Change | | 2015 | | 2014 | | % Change |
| Cardiac Rhythm & Heart Failure | $ | 5,465 |
| | $ | 5,245 |
| | 4 | % | | $ | 5,245 |
| | $ | 4,996 |
| | 5 | % |
| Coronary & Structural Heart | 3,093 |
| | 3,038 |
| | 2 |
| | 3,038 |
| | 2,956 |
| | 3 |
|
Aortic & Peripheral Vascular (1) | 1,638 |
| | 1,078 |
| | 52 |
| | 1,078 |
| | 895 |
| | 20 |
|
| Total Cardiac and Vascular Group | 10,196 |
| | 9,361 |
| | 9 |
| | 9,361 |
| | 8,847 |
| | 6 |
|
Surgical Solutions (1) | 5,265 |
| | 1,293 |
| | 307 |
| | 1,293 |
| | — |
| | NC |
|
Patient Monitoring & Recovery (1) | 4,298 |
| | 1,094 |
| | 293 |
| | 1,094 |
| | — |
| | NC |
|
Total Minimally Invasive Therapies Group (1) | 9,563 |
| | 2,387 |
| | 301 |
| | 2,387 |
| | — |
| | NC |
|
| Spine | 2,924 |
| | 2,971 |
| | (2 | ) | | 2,971 |
| | 3,041 |
| | (2 | ) |
| Neuromodulation | 1,926 |
| | 1,977 |
| | (3 | ) | | 1,977 |
| | 1,898 |
| | 4 |
|
| Surgical Technologies | 1,773 |
| | 1,671 |
| | 6 |
| | 1,671 |
| | 1,562 |
| | 7 |
|
Neurovascular (1) | 587 |
| | 132 |
| | 345 |
| | 132 |
| | — |
| | NC |
|
| Total Restorative Therapies Group | 7,210 |
| | 6,751 |
| | 7 |
| | 6,751 |
| | 6,501 |
| | 4 |
|
| Diabetes Group | 1,864 |
| | 1,762 |
| | 6 |
| | 1,762 |
| | 1,657 |
| | 6 |
|
| Total | $ | 28,833 |
| | $ | 20,261 |
| | 42 | % | | $ | 20,261 |
| | $ | 17,005 |
| | 19 | % |
| |
(1) | Growth rates are impacted by the acquisition of Covidien in the fourth quarter of fiscal year 2015. Revenue growth is compared to a full year of operations in fiscal year 2016. |
Cardiac and Vascular Group The Cardiac and Vascular Group’sCardiovascular products with specific focus on comprehensive disease management, include pacemakers, insertable and external cardiac monitors, cardiac resynchronization therapy devices, (CRT-D), implantable cardioverter defibrillators (ICD), leads and delivery systems, ablation products, electrophysiology catheters, products for the treatment of atrial fibrillation, information systems for the management of patients with Cardiac Rhythm & Heart Failure devices, products designed to reduce surgical site infections, coronary and peripheral stents balloon,and related delivery systems, balloons and related delivery systems, endovascular stent graft systems, heart valve replacement technologies, cardiac tissue ablation systems, and open heart and coronary bypass grafting surgical products. The Cardiac and Vascular GroupCardiovascular also includes Care Management Services (formerly known as Cardiocom) and Cath Lab Managed Services (CLMS) within the Cardiac Rhythm & Heart Failure division. The Cardiac and
Vascular Group'sCardiovascular net sales for fiscal year 20162022 were $10.2$11.4 billion, an increase of 96 percent as compared to the prior fiscal year.year 2021. Currency translation had an unfavorable impact on net sales of $572 million as a result of the change in exchange rates from the prior year. The Cardiac and Vascular Group’s performance was favorably impacted by an additional selling week during the first quarter of fiscal year 2016. The Cardiac and Vascular Group’s performance for fiscal year 2016 also benefited2022 of $32 million. The net sales increase was primarily due to the recovery of global procedure volumes from the additiondeclines experienced in fiscal year 2021 along with growth from recent product launches, partially offset by global supply chain disruptions and declines in China due to recent COVID-19 lockdowns.
The charts below illustrate the percent of the Covidien Peripheral business into the Aortic & Peripheral Vascular division and strongCardiovascular net sales across all three divisions. See the more detailed discussion of each division's performance below.by division for fiscal years 2022 and 2021:
Cardiac Rhythm & Heart Failure (CRHF) net sales increased 6 percent in fiscal year 2022 as compared to fiscal year 2021. The increase was led by Cardiac Rhythm Management with growth in TYRX antibacterial envelopes, CRT-Ds, and cardiac pacing therapies due to Micra and transvenous pacemakers. Cardiac Ablation Solutions also led growth with strong sales of Arctic Front cryoablation systems. The net sales growth was partially offset by a decline of Medtronic HVAD System net sales as a result of our June 2021 decision to stop the
distribution and sale of the system. The net sales for the Medtronic HVAD system for fiscal year 2016 were $5.5 billion, an increase of 42021 was $141 million.
Structural Heart & Aortic (SHA) net sales increased 8 percent in fiscal year 2022 as compared to the prior fiscal year.year 2021. The increase was led by growth in Cardiac Rhythm & Heart Failuretranscatheter aortic valve replacement (TAVR) net sales was driven by strong growth in AF Solutions, with the continued global acceptanceas a result of our Arctic Front Advance Cardiac CryoAblation Catheter (Arctic Front) system. Additionally, net sales were driven by the continued adoption of the Reveal LINQ insertable cardiac monitor,CoreValve Evolut. Cardiac Surgery also contributed to the net increase in sales as a result of broad growth across the business, particularly from strong sales of Extra-Corporeal Life Support (ECLS) devices. These increases were partially offset by declines within Aortic caused by field corrective actions (FCA) and COVID-19 challenges. The most notable field corrective actions were for the launch of the Evera MRI SureScan ICDValiant Navion Thoracic Stent Graft System FCA issued in the U.S. during the secondfourth quarter of fiscal year 2016, with continued strong adoption through2021 and the fourthEndurant II/IIs Stent Graft Systems FCA issued in the third quarter of fiscal year 2016. Net2022.
Coronary & Peripheral Vascular (CPV) net sales increased 5 percent in fiscal year 2022 as compared to fiscal year 2021. The increase was led by growth in Peripheral Vascular Health driven by strong performance of the recently launched Abre venous self-expanding stent system for Deep Venous disease, as well as our superficial venous product portfolio, including the VenaSeal and ClosureFast systems. The increase was partially offset by declines in Coronary as well as Atherectomy products due to impacts of COVID-19 on procedural volumes.
In addition to the macro-economic and geopolitical factors described in the Executive Level Overview, looking ahead, we expect Cardiovascular could be affected by the following:
•Continued growth of our Micra transcatheter pacing system. The Micra AV launched in Japan in November 2021 and received approval in China in May 2022. Micra AV expands the Micra target population from 15 percent to 45 percent of pacemaker patients.
•Continued acceptance and growth from the Azure XT and S SureScan pacing systems. Azure pacemakers feature Medtronic-exclusive BlueSync technology, which enables automatic, secure wireless remote monitoring with increased device longevity.
•Growth of the Cobalt and Crome portfolio of ICDs and CRT-Ds.
•Continued acceptance and expansion of the Claria MRI CRT-D system with AdaptivCRT and compatibility with TriageHF technology.
•Continued acceptance and expansion of the LINQ II cardiac monitor. Supply for the Cardiac Rhythm & Heart Failure division were also affected by continued pricing pressures.
Coronary & Structural Heart net sales forLINQ II cardiac monitor is improving as we continue to ramp our wafer scale manufacturing. During the third quarter of fiscal year 2016 were $3.1 billion, an increase2022, we launched two AccuRhythm AI algorithms on the LINQ II platform to significantly reduce false positive alerts for Atrial Fibrillation and Pause while retaining sensitivity for true positive detection, and reduce clinic workload and burden.
•Growth of 2 percent compared to the prior fiscal year. Nets sales were driven byCRT-P quadripolar pacing system.
•Continued growth, adoption, and utilization of the TYRX Envelope for implantable devices.
•Continued acceptance and market expansion of Arctic Front cryoablation for treatment of atrial fibrillation. In June 2021, the Arctic Front cryoablation system received a first line therapy designation from the U.S. FDA for the treatment of atrial fibrillation.
•Continued acceptance and growth of the self-expanding CoreValve Evolut R recapturabletranscatheter aortic valve replacement platform into intermediate risk indication globally and for the treatment of patients determined to be at low risk with surgery.
•Continued expansion and training of field support to increase coverage in the U.S. centers performing TAVR procedures.
•Continued acceptance and growth from Evolut PRO, which provides industry-leading hemodynamics, reliable delivery, enhanced durability versus SAVR procedures at 5 years, and advanced sealing with an excellent safety profile. In August 2021, the U.S. FDA approved the Evolut FX TAVR, a system enhancement designed to improve the overall procedural experience through enhancements in deliverability, implant visibility and deployment stability. During the third quarter of fiscal year 2022, Evolut PRO received NMPA approval within China.
•Continued acceptance and growth from the VenaSeal Closure System in the U.S. The VenaSeal Closure System is a unique non-thermal solution to address superficial venous disease that provides improved patient comfort, reduces the recovery time, and eliminates the risk of thermal nerve injury.
•Continued acceptance and growth of the Abre venous self-expanding stent system in the U.S., which was launched late as well as pressure from competitors re-entering the market. Abre is designed for the unique challenges of venous disease. It offers easy deployment, to let physicians focus on their patient, and delivers demonstrated endurance, to give patients freedom of movement.
•Our voluntary recall of the Valiant Navion Thoracic Stent Graft System and our ability to ramp production of our previous generation product, the Valiant Captivia Thoracic Stent Graft System. We are currently ramping production of the Valiant Captivia Thoracic Stent Graft System and plan to reach full production capacity in the first quarter of fiscal year 2016,2023.
•Our June 2021 decision to stop the distribution and a strong CoreValve launch in Japan in the fourth quarter of fiscal year 2016. In addition, net sales of Coronary & Structural Heart division were driven by drug-eluting stents, including the Resolute Onyx drug-eluting stent in Europe and the Resolute Integrity drug-eluting stent in the U.S., and the recent launchessale of the NC EuphoraMedtronic HVAD System.
•Our ability to successfully develop, obtain regulatory approval of and SC Euphora balloon dilatation catheters. Net sales were partially offset by continued pricing pressures incommercialize the products within our Coronary business.
Aortic & Peripheral Vascular net sales for fiscal year 2016 were $1.6 billion, an increase of 52 percent comparedpipeline, which include, but are not limited to, the prior fiscal year. The Aortic & Peripheral Vascular division net sales performance benefited from the addition of the Covidien Peripheral business. The increase in Aortic & Peripheral Vascular net sales was driven by strong growth of the IN.PACT Admiral drug-coated balloon in the U.S. and globally, continued strength in Valiant Captiva TAA stent graft sales, continued solid adoption of our Aptus Heli-FX endoanchor, and continued adoption of the Endurant IIs Abdominal Aortic Aneurysm (AAA) 3-piece system in the U.S. Net sales for the Aortic & Peripheral Vascular division were affected by increased competition in international markets and reimbursement cuts in Japan.
The Cardiac and Vascular Group's net sales for fiscal year 2015 were $9.4 billion, an increase of 6 percent compared to the prior fiscal year. The Cardiac and Vascular Group’s performance was primarilySymplicity Spyral Multi-Electrode Renal Denervation Catheter, Pulse Field Ablation, a result of strong net sales in Cardiac Rhythm & Heart Failure and Aortic & Peripheral Vascular and solid growth in Coronary & Structural Heart.
Cardiac Rhythm & Heart Failure net sales for fiscal year 2015 were $5.2 billion, an increase of 5 percent compared to the prior fiscal year. The increase in Cardiac Rhythm & Heart Failure net sales was driven by the ongoing acceptance of the Reveal LINQ insertable cardiac monitor and the launches of the Viva XT CRT-D with Attain Performa quadripolar CRT-D lead system in the U.S. in September 2014 and Evera MRI SureScan ICD in Japan in November 2014. Net sales of the Cardiac Rhythm & Heart failure division were also driven by the continued global acceptance of the Arctic Front Advance Cardiac CryoAblation Catheter (Arctic Front) system, net sales from Cardiocom and our CLMS business, which includes the August 2014 acquisition of NGC Medical S.p.A. (NGC).
Coronary & Structural Heart net sales for fiscal year 2015 were $3.0 billion, an increase of 3 percent compared to the prior fiscal year. The increase in Coronary & Structural Heart net sales was driven by ongoing success of the CoreValve transcatheter aortic heart valve in the U.S., the launch of the CoreValve Evolute R recapturable system in international markets, and the international launch of the Resolute Onyx drug-eluting stent in November 2014. Net sales were partially offset by continued pricing pressures in the U.S., Western Europe, Japan, and India in our Coronary business.
Aortic & Peripheral Vascular net sales for fiscal year 2015 were $1.1 billion, an increase of 20 percent compared to the prior fiscal year. The Aortic & Peripheral Vascular division includes a portion of the Covidien Peripheral business, which contributed strong performance during the fourth quarter of fiscal year 2015 on the strength of its chronic venous insufficiency products. The increase in Aortic & Peripheral Vascular net sales was driven by IN.PACT Admiral drug-coated balloons in the U.S. and international markets. Aortic & Peripheral Vascular net sales were also driven by strong sales of our Valiant Captivia Thoracic Stent Graft System, and growth from the Endurant 2S Abdominal Aortic Aneurysm (AAA) Stent Graft System in the U.S. and Western Europe. Net sales for the Aortic & Peripheral Vascular division were impacted by increased competitive and pricing pressures in the U.S., Western Europe, and Japan.
Looking ahead, we expect our Cardiac and Vascular Group could be affected by the following:
Increasing competition, fluctuations in currency exchange rates, and continued pricing pressures.
Continued acceptance and future growth of the Amplia/Compia/Claria family of MRI Quad CRT-D SureScan systems. The Amplia and Compia MRI Quad CRT-D SureScan systems received U.S. FDA approval in February
2016 and launched in March 2016. The Amplia/Compia/Claria family of MRI Quad CRT-D SureScan systems received CE Mark approval in February 2016. The systems are approved for MRI scans on any part of the body without positioning restrictions.
Continued acceptance and future growth from the Viva/Brava family of CRT-D devices and the Attain Performa portfolio of quadripolar leads. The Viva/Brava family of CRT-D devices utilizes a new algorithm, called AdaptivCRT, which improves patients’ response rates to CRT-D therapy by preserving the patients’ normal heart rhythms and continually adapts to individual patient needs. Paired with Viva/Brava Quad CRT-D, Attain Performa leads provide additional options for physicians to optimize patient therapy. In the second quarter of fiscal year 2015, we received U.S. FDA approval of our Attain Performa quadripolar lead, Viva Quad XT CRT-D, and Viva Quad S CRT-D.
Continued acceptance and future growth from the Evera family of ICDs. The Evera family of ICDs has increased battery longevity, advanced shock reduction technology, and a contoured shape with thin, smooth edges that better fits inside the body. Our Evera MRI SureScan ICD received CE Mark approval late in the fourth quarter of fiscal year 2014 and launched in Japan in November 2014. We received U.S. FDA approval of our Evera MRI SureScan ICD in the second quarter of fiscal year 2016.
Continued acceptance and future growth from the Advisa DR MRI SureScan pacing system for use in full-body MRI scans. The Advisa DR MRI SureScan is our second-generation MRI pacing system and is the first system to combine advanced pacing technology with proven MRI access. We received U.S. FDA approval of the Advisa SR MRI SureScan single-chamber pacemaker in the first quarter of fiscal year 2016.
Continued future growth from the Arctic Front system, including the second generation Arctic Front Advance Cardiac Cryoballoon. The Arctic Front system is a cryoballoon indicated for the treatment of drug refractory paroxysmal atrial fibrillation. The cryoballoon treatment involves a minimally invasive procedure that efficiently creates circumferential lesions around the pulmonary vein, which studies have indicated is thenovel energy source of erratic electrical signals that cause irregular heartbeat. We received U.S. FDA approval in the first quarter of fiscal year 2016 for the Aortic Front Advance ST Cryoablation Catheter.
Continued future growth from Reveal LINQ, our next-generation insertable cardiac monitor launched in international and U.S. markets in the third and fourth quarters of fiscal year 2014, respectively.
Acceptance and future growth of our Micra transcatheter pacing system, which received CE Mark approval in April 2015 and U.S. FDA approval in April 2016. Micra is a miniaturized single chamber pacemaker system that is delivered through the femoral veinnon-thermal, Aurora Extravascular ICD and is implanted in the right ventricle of the heart. The system does not use a leadtranscatheter mitral and does not have a subcutaneous device pocket underneath the skin as with conventional pacemaker systems.tricuspid therapy products led by our Intrepid system.
Continued acceptance and future growth from Care Management Service's remote telemonitoring solutions business for the management of chronic diseases such as heart failure, diabetes, and hypertension. Care Management Services has a readmission reduction program focused on minimizing heart failure readmission penalties for U.S. hospitals.
Continued acceptance of our CLMS business. CLMS provides a unique service offering, whereby we enter into long-term contracts with hospitals, both within Europe and in certain other regions around the world, to upgrade and more effectively manage their cath lab and hybrid operating rooms. At the end of fiscal year 2016, we had 88 long-term CLMS agreements.Medical Surgical
Continued acceptance of CoreValve Evolut R, our next-generation recapturable system with differentiated 14-French equivalent delivery system. We have CE Mark approval for the 23 millimeter size of the valve and received CE Mark approval for the 26 and 29 millimeter sizes early in the fourth quarter of fiscal year 2015. We received U.S. FDA approval of the 23, 26, and 29 millimeter sizes in the first quarter of fiscal year 2016.
Acceptance of our CoreValve transcatheter heart valve technologies for the replacement of the aortic valve in Japan. We received Japanese regulatory approval in March 2015 and launched in Japan late in the third quarter of fiscal year 2016 following reimbursement approval. We received U.S. FDA approval for valve-in-valve implantation in March 2015.
Acceptance of the Resolute Onyx drug-eluting coronary stent, which received CE Mark approval in November 2014. Resolute Onyx builds on the Resolute Integrity drug-eluting coronary stent with thinner struts to improve deliverability and is the first stent to feature our CoreWire technology, allowing greater visibility during the
procedure. We added new sizes and indications for Resolute Onyx in Europe in the third quarter of fiscal year 2016.
The global stent market continues to experience pricing pressure resulting from government austerity programs and reimbursement cuts in Europe and Japan.
Continued worldwide growth of our Euphora Non-Compliant and Semi-Compliant Balloon Dilatation Catheter and our family of coronary guide catheters.
Acceptance of the IN.PACT Admiral drug-coated balloon for the treatment of peripheral artery disease in the upper leg. The IN.PACT Admiral drug-coated balloon was launched in the U.S. early in the fourth quarter of fiscal year 2015, and received CE Mark approval in January 2016 for arteriovenous access to help maintain hemodialysis access in patients with end-stage renal disease.
Integration of Aptus Endosystems, Inc. (Aptus), acquired in June 2015, into the Aortic & Peripheral division. Aptus is a medical device company focused on developing advanced technology for endovascular aneurysm repair and thoracic endovascular aneurysm repair.
Continued and future acceptance of the Endurant family of AAA stent graft products. We received CE Mark and U.S. FDA approval of the Endurant IIs stent graft late in the second quarter of fiscal year 2015. Continued worldwide growth of the Valiant Captivia Thoracic Stent Graft System.
Acceptance of our VenaSeal closure system, which was launched in the U.S. in November 2015. The VenaSeal closure system is a minimally invasive procedure that uses a proprietary medical adhesive to close superficial veins of the lower extremities in patients with symptomatic venous reflux.
Minimally Invasive Therapies Group MinimallyInvasive Therapies Group’s goals are to diagnose and intervene earlier, improve treatments, and help patients recover faster. Our technologies andMedical Surgical’s products span the entire continuum of care. The group lookspatient care from diagnosis to enhance patient outcomes through minimally invasive solutionsrecovery, with a focus on diseases of the gastrointestinal tract, lungs, pelvic region, kidneys, obesity, and preventable complications. The Surgical Solutions division's products include those for advanced and general surgical care (stapling,products, surgical stapling devices, vessel sealing and other surgical instruments), sutures,instruments, wound closure, electrosurgery products, hernia mechanical devices, mesh implants, and solutions for gastrointestinal (GI), advanced ablation, and interventional lung. The Patient Monitoring & Recovery division's products includelung, ventilators, capnography and other airway products, renal care products, and sensors and monitors compressionfor pulse oximetry, capnography, level of consciousness and dialysis products, enteral feeding, wound care, and medical surgical products (including operating room supply products, electrodes, needles, syringes, and sharps disposals). The Minimally Invasive Therapies Group’scerebral oximetry. Medical Surgical’s net sales for fiscal year 20162022 were $9.6 billion.$9.1 billion, an increase of 5 percent as compared to fiscal year 2021. Currency translation had an unfavorable impact on net sales of $493$44 million as a result of the change in exchange rates from the prior year. The Minimally Invasive Therapies Group was favorably impacted by an additional selling week during the first quarter of fiscal year 2016. The Minimally Invasive Therapies Group contains the majority of Covidien's former operations. See the more detailed discussion of each business’s performance below.
Net sales contributions in Surgical Solutions for fiscal year 2016 were $5.3 billion.2022. The net sales performanceincrease was primarily due to the recovery of global procedure volumes from the declines experienced in fiscal year 2021 partially offset by global supply chain disruptions and declines in China due to recent COVID-19 lockdowns.
The charts below illustrate the percent of Medical Surgical Solutions was mainly attributable to staplingnet sales by division for fiscal years 2022 and energy. Stapling products results benefited from continued worldwide market adoption of the Endo GIA Reinforced Reload and energy products benefited from continued strong adoption of the LigaSure Maryland Jaw and Valleylab FT10 Energy Platform. Further, Early Technologies product performance was driven by gastrointestinal solutions products, more specifically, our gastrointestinal diagnostic product line.2021:
Patient Monitoring & Recovery
Surgical Innovations (SI) net sales for fiscal year 2016 were $4.3 billion.2022 increased 11 percent as compared to fiscal year 2021. Net sales contributionsgrowth was led by Advanced Surgical instruments, driven by the continued adoption of the Company's LigaSure, Sonicision, and Tri-Staple technologies, and Hernia and Wound Management. The increase was partially offset by declines in the fourth quarter of fiscal year 2022 resulting from global supply chain challenges, including resins, semiconductors, and packaging trays, which impacted energy and stapling products.
Respiratory, Gastrointestinal, & Renal (RGR) net sales for fiscal year 2022 decreased 7 percent as compared to fiscal year 2021. RGR net sales declines were largely due to declines in ventilator demands when compared fiscal year 2021 as demand returned to pre-pandemic levels in the fourth quarter of fiscal year 2022. These declines were partially offset by growth in Patient Monitoring, & Recovery were driven mainlyled by U.S. sales within Respiratorythe Nellcor pulse oximetry sensors and Patient Monitoring, Patient Care and Safety, and Nursing Care. Respiratory and Patient Monitoring performance was attributable tothe Bispectral Index (BIS) sensors, airway products, and acute ventilator sales. Patient Care and Safety net sales results were primarily due to sales of compression and SharpSafety product lines, and sales within our electrode and dialysis products. The Nursing Care results were largelyGastrointestinal, driven by sales of incontinence, enteral feedingthe esophageal product portfolio, as well as growth in Renal Care Solutions.
In addition to the macro-economic and wound care products.
Lookinggeopolitical factors described in the Executive Level Overview, looking ahead we expect Minimally Invasive Therapies GroupMedical Surgical could be impactedaffected by the following:
•Continued acceptance and future growth of Open-to-Minimally Invasive Surgery (MIS)Open-to-MIS techniques and tools supported by our efforts to transition open surgery to MIS.MIS (minimally invasive surgery). The Open to MISOpen-to-MIS initiative focuses on establishingfurthering our presence in and working to optimize
open surgery globally, while capturing the market opportunity that exists in transitioning open procedures to MIS, whether through traditional MIS, or advanced technologies, likeincluding robotics. To achieve this transition, we are focused on product training, surgical skill training
•Continued acceptance and continued therapy innovationfuture growth of powered stapling and energy platform.
•Our ability to advance MIS.
Changesexecute ongoing strategies in procedural volumes,order to address the competitive pressure reimbursement challenges, reprocessed products, impacts from changesof reprocessing of our vessel sealing disposables and growth of surgical soft tissue robotics procedures in the mix of our product offerings, fluctuations in currency exchange rates and pricing pressure, particularly in developed markets.U.S.
•Our ability to create markets and drive productproducts and procedures into emerging markets. We have high quality and cost-effective surgical products designed for customers in emerging markets such as the ReliaMax reusable stapler, which is reposable (part reusable, part disposable), and the ValleyLab LS10 single channel vessel sealing generator, which is compatible with our line of LigaSure instruments and designed for simplified use and affordability.
Continued acceptance and future growth within the end stage renal disease market. The population of patients treated for end stage renal disease globally is expected to double over the next decade. We will grow our therapy innovation with scalable and affordable dialysis delivery and investing in vascular creation and maintenance technologies. Our ability to successfully integrate Bellco into Medtronic. Bellco is a pioneer in hemodialysis treatment solutions that we acquired in February 2016.
Continued growth due to cross-selling initiatives of Minimally Invasive Therapies Group within other businesses with Medtronic.
•Continued elevation of the standard of care for respiratory compromise, a progressive condition impacting a patient’s ability to breathe effectively. The Capnostream35 is expected to launcheffectively, which leverages our market leading MicroStream capnography technology.
•Continued acceptance and growth in patient monitoring, airway, and ventilation management. Key products in this area include the Puritan Bennett 980 ventilator, Microstream Capnography, Nellcor pulse oximetry system with OxiMax technology, Shiley tracheostomy and endotracheal tubes, McGRATH MAC video laryngoscopes, SonarMed Airway Monitoring System for the NICU, and the Nellcor Oxysoft pulse oximetry system for neonatal and adult critical care patients, which received U.S. FDA clearance during the fourth quarter of fiscal year 2017.2022.
Creation•Continued and future acceptance of less invasive standards of care in diseasesGastrointestinal and conditionsHepatology products, including the areas of GI Diagnostic and Therapeutic product lines. Recently launched products include the gastrointestinal tractPillCam COLON capsule endoscopy, the Barrx platform through ablation with the Barrx 360 Express catheter, Endoflip imaging systems, Bravo Calibration-free reflux testing, and lung to enable earlier diagnosisthe Emprint ablation system with Thermosphere Technology, which maintains predictable spherical ablation zones throughout procedures reducing procedure time and intervention.cost.
•Continued and future acceptance of advancedInterventional Lung Solutions. Products include our Illumisite navigation platform, combined with our portfolio of biopsy tools including the Arcpoint pulmonary needle, and general surgical care products from both physiciansto access lesions outside the airway, the CrossCountry transbronchial access tool. This comprehensive portfolio gives the power to display position and patientsaccess lung nodules in the periphery of open andthe lungs, in a minimally invasive proceduresapproach to accessing difficult-to-reach areas of the lung, which may aid in Surgical Solutions, including stapling, vessel sealing, and other surgical instruments.the diagnosis of lung cancer.
•Expanding the use of less invasive treatments and furthering our commitment to improving options for women with abnormal uterine bleeding withbleeding. Our expanded and strengthened surgical offerings are expected to complement our global gynecology business.
•Continued future growth internationally for the Hugo robotic assisted surgery (RAS) system for urologic, bariatric, gynecologic, and general surgery procedures as well as for our easy-to-access Touch Surgery Enterprise surgical video system. The Hugo RAS system, which received CE Mark in October 2021 as well as secured additional regulatory approvals in the third and fourth quarters of fiscal year 2017 acquisition2022, is designed to help reduce unwanted variability, improve patient outcomes, and by extension, lower per procedure cost.
•The pending contribution of our Renal Care Solutions business as a highly profitable and fast-growing gynecology business. The addition will expand and strengthen the Minimally Invasive Therapies Group’s offerings and complement the existing global gynecology business.
Ability to develop a surgical robotic platform that reduces the variability of surgical procedures and improves the repeatability and reliability of procedures
Continued acceptance of other recently launched products including the Endo GIA Reinforced Reload, the LigaSure Maryland jaw laparoscopic sealer and divider, and three additional sizesresult of the May 25, 2022 definitive agreement with DaVita Inc. Refer to the “Subsequent Events” section of this Management’s Discussion and Analysis for additional information on the divestiture.
•Our ability to successfully develop, obtain regulatory approval of and commercialize the products within our pipeline, which include, but are not limited to, our Hugo RAS system in the U.S., our NextGen McGrath MAC video laryngoscopes, Signia power stapling devices, and our Ligasure and Sonicision Cordless Ultrasonic Dissection Device and the GastriSail Gastric Positioning System.vessel sealing devices.
Future acceptance of the Signia Stapling System, expected to launch in fiscal year 2017. The single-hand use increases patient focus and consistent staple lines reduce leaks and tissue trauma.
Future acceptance of the HD multi-pass system, expected to launch in fiscal year 2018. The HD multi-pass system reduces infrastructure by requiring less water, has less start-up costs, and offers high quality ultrapure dialysate treatment.Neuroscience
Continued acceptance and growth in respiratory care, ventilation and airway management, patient monitoring, and homecare. Key products in this area include the Puritan Bennett 980 ventilator, Microstream Capnography bedside capnography monitor, portable monitor with Nellcor pulse oximetry system with OxiMax technology and the Nellcor Respiratory Compromise monitor with vital signs of SpO2, pulse rate, End-Tidal CO2, and Respiratory Rate.
Continued and future acceptance of Early Technologies, including the areas of GI solutions, advanced ablation, and interventional lung solutions. Recently launchedNeuroscience's products include the PillCam COLON capsule endoscopy, Emprint ablation system with Thermosphere Technology which maintains predictable spherical ablation zones throughout procedures reducing procedure time and cost, and the GenCut core biopsy system and the superDimension Triple Needle Cytology Brush, lung tissue biopsy tools for use with the superDimension navigation system. The superDimension system enables a minimally invasive approach to accessing difficult-to-reach areas of the lung, which can aid in the diagnosis of lung cancer.
Ability to generate product innovation and adoption of less invasive surgical techniques to help patients recover faster and at less overall cost to the healthcare system. Opportunities exist to provide advanced solutions that minimize complications and increase efficiency. Our goal is to create localized solutions to improve surgical approaches and increase access to care, address economic and clinical challenges, and advance minimally invasive surgery by minimizing complications, thereby reducing surgical variability and increasing efficiency.
Continued and future acceptance of the Valleylab FT10 energy platform, which we launched in fiscal year 2016. The faster sealing of the Valleylab FT10 decreases procedure times and auto-adjusting energy accommodates different tissue types.
Restorative Therapies Group The Restorative Therapies Group includes products for various areas of the spine,spinal implants, bone graft substitutes, biologic products, trauma,image-guided surgery and intra-operative imaging systems, robotic guidance systems used in the robot-assisted spine procedures, and systems that incorporate advanced energy surgical instruments. Neuroscience's products also focus on the treatment of overactive bladder, urinary retention, fecal incontinence, as well as products to treat ear, nose, and throat (ENT), and therapies to treat the diseases of the vasculature in and around the brain, including coils, neurovascular stents and flow diversion products. Neuroscience also manufactures products related to implantable neurostimulation therapies and drug delivery systems for the treatment of chronic pain, movement disorders, obsessive-compulsive disorder (OCD), overactive bladder, urinary retention, fecal incontinence and gastroparesis, products to treat conditions of the ear, nose, and throat, and systems that incorporate advanced energy surgical instruments. Additionally, this group manufactures and sells image-guided surgery and intra-operative imaging systems. With the addition of the Neurovascular division through the January 2015 Covidien acquisition, the group manufactures and markets products and therapies to treat diseases of the vasculature in and around the brain and includes sales of coils, neurovascular stents and flow diversion products. The Restorative Therapies Group’sepilepsy. Neuroscience’s net sales for fiscal year 20162022 were $7.2 billion, an increase of 7 percent over the prior fiscal year. Currency translation had an unfavorable impact on net sales of approximately $244 million as a result of the change in exchange rates from the prior year. The Restorative Therapies Group's performance was favorably impacted by an additional selling week during the first quarter of fiscal year 2016. The Restorative Therapies Group’s performance for fiscal year 2016 was favorably impacted by the addition of the Neurovascular division, growth in Surgical Technologies, and by an additional selling week during the first quarter of fiscal 2016, partially offset by declines in Neuromodulation and Spine. See the more detailed discussion of each business's performance below.
Spine net sales for fiscal year 2016 were $2.9 billion, a decrease of 2 percent over the prior fiscal year. The decrease in Spine net sales was driven by declines in Core Spine and Interventional, partially offset by growth in BMP (composed of INFUSE bone graft (InductOs in the E.U.)) in the U.S. The U.S. Core Spine market grew in the low-single digits, with modest procedural growth offset by continued pricing pressures. During fiscal year 2016, new product introductions across several procedures, resulted in a sequential improvement in the Core Spine growth rate. We are seeing incremental revenue from our differentiated OLIF procedures, as well as from the recent Solera, Voyager, Elevate, and PTC Interbody launches for TLIF and MIDLF procedures. In Core Spine, we are also realizing some early benefits from our Speed to Scale initiative, which accelerates innovation and enables rapid deployment of these products and procedures to the market. The Interventional Spine net sales decline was driven by continued pricing pressures. In BMP, strong growth in the U.S. was offset by declines in international BMP due to the InductOs stop shipment in Europe which we expect to continue until the back half of fiscal year 2017.
Neuromodulation net sales for fiscal year 2016 were $1.9 billion, a decrease of 3 percent over the prior fiscal year. The decrease in net sales was primarily due to challenges in Drug Pumps and Pain Stimulation, partially offset by growth in Gastro/Uro, with relatively flat results in DBS. In Drug Pumps, the business was negatively affected by challenges related to its April 2015 U.S. FDA consent decree, as well as the January divestiture of its intrathecal baclofen drug. In Pain Stimulation and DBS, declines were driven by increased competition in the market, however, drivers such as the expanded early onset DBS indication in the U.S. that we received earlier this fiscal year and new strategies that focus our pain products on the growing opioid epidemic could improve future results. In Gastro/Uro, implant growth of our InterStim Therapy for overactive bladder, urinary retention, and bowel incontinence continued in the U.S. during fiscal year 2016.
Surgical Technologies net sales for fiscal year 2016 were $1.8 billion, an increase of 6 percent over the prior fiscal year. The increase in net sales was driven by continued worldwide net sales growth across the portfolio of Advanced Energy, ENT, and Neurosurgery. Performance was driven by strong growth of power systems, Aquamantys Transcollation, and PEAK PlasmaBlade technologies, as well as solid growth of Midas Rex products, monitoring, and O-arm imaging systems.
Neurovascular net sales for fiscal year 2016 were $587 million. The division contributed revenue from the strength of its coils, stents, flow diversion, and access product lines. Our Solitaire FR mechanical thrombectomy device delivered strong results, solidifying our leadership position in the rapidly expanding ischemic stroke market. Our Flow Diversion products for the treatment of intracranial aneurysms, Pipeline Flex in the U.S. and Japan and Pipeline Shield in Europe, continue to lead the market.
Spine net sales for fiscal year 2015 were $3.0 billion, a decrease of 2 percent over the prior fiscal year. The decrease in Spine's net sales for fiscal year 2015 was driven by declines in Core Spine and Interventional, partially offset by growth in BMP. Both the global and U.S. Core Spine markets grew in the low-single digits, with modest procedural growth offset by continued pricing pressures. During fiscal year 2015, the Core Spine business continued to focus on differentiating itself over the long-term through portfolio updates, procedural innovation, and continued development and deployment of the its Surgical Synergy program that
integrates imaging, navigation, and powered surgical instruments. Fiscal year 2015 included several new product launches, including our Prestige LP cervical disc and Pure Titanium Coated (PTC) interbodies spacers, which partially offset declines in Core Spine. Interventional Spine net sales decline was driven by a decline in European sales, where the business faced pricing pressures in Germany and unfavorable currency translation. Underlying demand for BMP stabilized and returned to slight growth in the latter half of fiscal year 2015.
Neuromodulation net sales for fiscal year 2015 were $2.0 billion, an increase of 4 percent over the prior fiscal year. The increase in net sales was primarily due to strong growth in Gastro/Uro and growth in DBS and Pain Stimulation. Our global focus on our neurologist referral programs, and the strength of the EARLYSTIM data in international markets, continues to drive solid growth of DBS systems. Implant growth of our InterStim Therapy for overactive bladder, urinary retention, and bowel incontinence continued in the U.S. throughout fiscal year 2015. The increase in net sales for fiscal year 2015 was also due to global growth of our RestoreSensor SureScan MRI system. While the U.S. pain stimulation market has weakened as a result of reimbursement changes, net sales of our SureScan MRI system for the fiscal year demonstrate our continued strength in the market.
Surgical Technologies net sales for fiscal year 2015 were $1.7$8.8 billion, an increase of 7 percent over the prior fiscal year. The increase in net sales was driven by continued worldwide net sales growth across the portfolio of Advanced Energy, ENT, and Neurosurgery, partially offset by unfavorable currency translation. Performance was driven by strong growth of power systems, Aquamantys Transcollation, and PEAK PlasmaBlade technologies, as well as solid growth of Midas Rex products, monitoring, and O-arm imaging systems. Additionally, net sales growth was positively impacted by launch of our NuVent sinus balloons in the second quarter ofcompared to fiscal year 2015 and the acquisition of Visualase during the first quarter of fiscal year 2015, adding2021. Currency had a MRI-guided laser ablation technology to our broad suite of neuroscience solutions for neurosurgery. The increase in revenue from Visualase and our NuVent sinus balloons was partially offset by our divestiture of the MicroFrance product line during the third quarter of fiscal year 2015.
Neurovascularfavorable impact on net sales for fiscal year 2015 were $1322022 of $3 million. The division, formerly partnet sales increase was primarily due to the recovery of Covidien, contributed revenueglobal procedure volumes from the declines experienced in fiscal year 2021, partially offset by global supply chain disruptions and declines in China due to COVID-19 lockdowns and reduced sales in advance of potential national volume-based pricing (VBP) tenders.
The graphs below illustrate the percent of Neuroscience net sales by division for fiscal years 2022 and 2021:
Cranial & Spinal Technologies (CST) net sales for fiscal year 2022 increased 4 percent as compared to fiscal year 2021. Net sales growth was primarily driven by Neurosurgery with strong sales of the Midas Rex powered surgical instruments and StealthStation Navigation and O-arm Imaging System. Growth in CST also occurred in Spine and Biologics due to the recovery of global procedural volumes in the U.S., Japan, and Western Europe compared to the prior fiscal year. This growth was partially offset by recent reduced sales in China in advance of potential national VBP tender in Spine.
Specialty Therapies (Specialty) net sales for fiscal year 2022 increased 12 percent as compared to fiscal year 2021. Net sales growth was primarily driven by strength in Pelvic Health, ENT, and Neurovascular. Pelvic Health's growth was led by sales of its coils, stents,the recently launched InterStim Micro neurostimulator and SureScan MRI leads. ENT growth was driven by the sales of StealthStation ENT Navigation System despite continued supply constraints in disposables, which are recovering. Neurovascular's growth was led by sales of flow diversion, hemorrhagic stroke, and access product lines. The New England Journal of Medicine published several positive clinical trials on our Solitaire FR revascularization device, resultingliquid embolic products.
Neuromodulation (NM) net sales for fiscal year 2022 increased 8 percent as compared to fiscal year 2021. Sales growth occurred in continued customer adoptionboth Pain Therapies and Brain Modulation and reflected a recovery in procedural volumes. Net sales growth was driven by strong performance of the product. Additionally, net sales were positively impacted byPercept PC deep brain stimulation (DBS) device with BrainSense technology in Brain Modulation.
In addition to the U.S. launch ofmacro-economic and geopolitical factors described in the Pipeline Flex embolization device, which was launched during the third quarter of fiscal year 2015.
LookingExecutive Level Overview, looking ahead we expect our Restorative Therapies GroupNeuroscience could be affected by the following:
Changes in procedural volumes, competitive•Continued growth from Enabling Technologies, including StealthStation Navigation and pricing pressure, reimbursement challenges, impacts from changes in the mix of our product offerings, the timing of product registration approvals,O-arm Imaging Systems, Midas Rex Powered Surgical Instruments, and fluctuations in currency exchange rates.
Continued commercial integration in the Restorative Therapies groupENT Navigation and marketPower Systems, as well as acceptance of the Stealth Autoguide cranial robotic guidance platform.
•Continued sales of Mazor robotic units and associated market adoption of robot-assisted spine procedures, including the Mazor X Stealth, our newintegrated robotics and navigation platform.
•Continued growth from spine titanium interbody implants.
•Continued adoption of our integrated solutions through the Surgical Synergy program,strategy, which integrates our spinal implants with enabling technologies such as imaging, navigation, power instruments, nerve monitoring, and Surgical Technologies' imagingMazor robotics, as well as AI-driven surgical planning, personalized spinal implants, and navigation equipment.robot-assisted surgery due to Medicrea technologies, acquired in fiscal year 2021.
•Market acceptance and continued global adoption of innovative new spine products and procedural solutions within our CST division such as our CD Horizon Solera Voyager system, our ELEVATE expandable interbody cage,Infinity OCT System and our OLIF25 and OLIF51 procedure solutions, bothPrestige LP cervical disc system.
Continued pricing and competitive pressures on premium balloon kyphoplasty (BKP) within Interventional Spine. Though we remain focused on communicating the clinical and economic benefits for premium BKP, we expect pressure in several markets to continue. We believe opportunities for growth exist•Growth in the broader vertebral compression fracture (VCF) and adjacent markets andas we continue to pursue the development of other therapies to treat more patients with VCF, including the recent U.S. launchescontinued success of both the Kyphon V vertebroplasty system and the Osteocool tumorRF Spinal Tumor ablation system.
Acceptance of Kanghui's broad portfolio of trauma, spine, and large-joint reconstruction products focused on the growing global value segment.
•Continued acceptance and growth of our ENT and Pelvic Health therapies within our Specialty Therapies division, including our InterStim therapy with InterStim II, InterStim Micro and InterStim X neurostimulators for the treatment of the symptoms of overactive bladder, urinary retention, and bowel incontinence, and capital equipment sales of the Stealth Station ENT surgical navigation system and intraoperative NIM nerve monitoring system.
•Continued acceptance and growth of the Solitaire FR revascularization device for treatment of acute ischemic stroke and the Pipeline Embolization Devices, endovascular treatments for large or giant wide-necked brain aneurysms.
•Continued acceptance of our React Catheter and Riptide aspiration system, along with our next-generation Solitaire revascularization device.
•Market acceptance and continued global adoption rates of stimulatorsour Intellis spinal cord stimulator, DTM proprietary waveform, Evolve workflow algorithm, and leads approvedSnapshot reporting to treat chronic pain in major markets around the world.
•Continued acceptance and growth of our Percept PC DBS device with BrainSense technology, including its treatment of Parkinson's Disease, epilepsy, and other movement disorders.
•Market acceptance and growth from SCS therapy for treating Diabetic Peripheral Neuropathy (DPN) on Intellis rechargeable neurostimulator and Vanta recharge-free neurostimulator which received U.S. FDA approval in January 2022.
•Ongoing obligations under the U.S. FDA consent decree entered in April 2015 relating to the SynchroMed drug infusion system and the Neuromodulation quality system. We continueThe U.S. FDA lifted its distribution requirements on our implantable drug pump in October 2017 and its warning letter in November 2017.
•Our ability to make progress againstsuccessfully develop, obtain regulatory approval of and commercialize the products within our U.S FDA consent decree commitments.pipeline, which include, but are not limited to, our closed-loop Percept PC and RC devices with adaptive DBS (aDBS), our hemorrhagic stroke intravascular device, and our next-generation spine enabling technologies.
Continued and future acceptance of our current indications for Medtronic DBS Therapy for the treatment of movement disorders, epilepsy (approved in Europe), and OCD. The DBS Therapy portfolio includes Activa
Diabetes
PC, our small and advanced primary cell battery, and Activa RC, a rechargeable DBS device. We anticipate continued competitive pressures in Europe and expect competition to enter the U.S. market in the coming year.
Continued acceptance of InterStim Therapy for the treatment of the symptoms of overactive bladder, urinary retention, and bowel incontinence.
Continued acceptance and growth of our Surgical Technologies therapies, including Advanced Energy products and strategies to focus on its four core markets of orthopedic, spine, breast surgery, and CRDM replacements, Neurosurgery StealthStation S7 and O-Arm Imaging Systems, Midas and ENT power systems, and intraoperative nerve monitoring during surgical procedures utilizing the NIM-Response 3.0 during head and neck surgical procedures. Additionally, continued growth in nerve monitoring utilizing the NIM Eclipse system during spinal surgical procedures.
Acceptance of the recently launched NuVent sinus balloon, with built-in surgical EM navigation, used for chronic sinusitis to restore sinus drainage in a minimally invasive way.
Continued acceptance and growth of Neurovascular therapies, including the Solitare FR revascularization device for treatment of acute ischemic stroke and the Pipeline Embolization Devices, endovascular treatments for large or giant wide-necked brain aneurysms.
Future acceptance of the Medina mesh coil implant launched in European Union in May 2016. Medina Medical was acquired in August 2015 and focuses on the commercialization of treatments for vascular abnormalities of the brain, including cerebral aneurysms.
Efficiencies gained from fiscal year 2017 reorganization to provide a stronger focus on the diseases and conditions that we serve to further innovate, integrate platforms and leverage breadth of product portfolio across Restorative Therapies Group. Beginning in the first quarter of fiscal year 2017, the new reporting structure includes Spine, Brain Therapies (consists of Modulation, Neurovascular, and Neurosurgery), Pain Therapies (consists of Stimulation, Pump, and Interventional), and Specialty Therapies (consists of Pelvic Health, Advanced Energy, and ENT).
Diabetes Group The Diabetes Group is composed of the Intensive Insulin Management (IIM), Non-Intensive Diabetes Therapies (NDT) and Diabetes Service & Solutions (DSS) divisions. The Diabetes GroupDiabetes' products include insulin pumps, continuous glucose monitoring (CGM) systems, insulin pump consumables, and therapy management software. The Diabetes Group’s netsmart insulin pen systems. Diabetes' sales for fiscal year 20162022 were $1.9$2.3 billion, an increasea decrease of 63 percent over the prioras compared to fiscal year and were favorably affected by an additional selling week during the first quarter of fiscal year 2016. Net sales in the U.S. increased 6 percent compared to the prior fiscal year, driven by the MiniMed 530G System with Enlite sensor in the IIM division.2021. Currency translation had an unfavorable impact on net sales for fiscal year 2022 of $101 million$2 million. Diabetes' net sales decline for fiscal year 2022 was primarily attributable to declines in the U.S. partially offset by growth in the MiniMed 780G insulin pump system and integrated CGM in the international markets.
In addition to the macro-economic and geopolitical factors described in the Executive Level Overview, looking ahead we expect Diabetes could be affected by the following:
•Patient demand for the MiniMed 770G insulin pump system, which launched in the U.S. in November 2020 and in Japan in January 2022. The system is powered by SmartGuard technology and features the added benefits of smartphone connectivity and an expanded age indication to children as young as age two.
•Continued growth internationally for the MiniMed 780G insulin pump system. The MiniMed 780G system was approved in the E.U. in June 2020 and has launched in over 40 countries on four continents outside the U.S. The global adoption of sensor-augmented insulin pump systems has resulted in strong sensor attachment rates.
•Continued acceptance and growth of the Guardian Connect CGM system which displays glucose information directly to a smartphone to help ensure patients have access to their glucose levels seamlessly and discretely. The Guardian Connect CGM system is available on both Apple iOS and Android devices.
•Strengthening our position in the diabetes market as a result of the change in exchange rates fromSeptember 2020 acquisition of Companion Medical. Companion Medical offered a U.S. FDA cleared InPen smart pen system that combines the prior year. The Diabetes Group's performance in international markets was favorably affected by our next-generation MiniMed 640G Systemfreedom of a reusable Bluetooth pen with the Enhanced Enlite sensor.
The Diabetes Group’s net sales for fiscal year 2015 were $1.8 billion,intelligence of an increase of 6 percent overintuitive mobile application that helps users administer the prior fiscal year. The increase in net sales was primarily driven by 9 percent growth inappropriate insulin dose. During the U.S., driven by the ongoing launch of the MiniMed 530G System with Enlite Sensor. Approval was obtained late in the secondthird quarter of fiscal year 2014. Net sales2021, we integrated our CGM data into the InPen application, which allows users to have their Medtronic CGM readings in the international markets increased 2 percent compared to the prior fiscal year. Performancereal-time alongside insulin dose information, all in international markets was favorably affected by the launch of our next-generation MiniMed 640G System with the Enhanced Enliteone view.
•Continued pump and CGM sensorcompetition in Australia and Europe, partially offset by unfavorable currency translation.an expanding global market.
Looking ahead, we expect our Diabetes Group could be impacted by the following:
Increasing competition, potential risk of pricing pressures, reduction in reimbursement rates, and fluctuations in currency exchange rates.
•Changes in medical reimbursement policies and programs. Continued acceptance and improved reimbursementprograms, along with additional payor coverage on insulin pumps.
Continued acceptance from both physicians and patients•Resolution of insulin-pump and CGM therapy.
Continued acceptance and future growth offindings contained in a December 2021 U.S. FDA warning letter relating to the MiniMed 530G System, available in the U.S., which includes the600 series insulin pump and Enlite sensor. This isa remote controller device for MiniMed 508 and Paradigm pumps. We are currently working with the first systemU.S. FDA to resolve the findings. The existence of the warning letter may limit our ability to launch certain new Diabetes products in the U.S. that assists in protecting againstprior to resolution of the riskfindings.
•Our ability to successfully develop, obtain regulatory approval of hypoglycemia by automatically suspendingand commercialize the products within our pipeline, which include, but are not limited to, our MiniMed 780G insulin delivery when glucose falls below a specified threshold.
Continued acceptance and future growth from our next-generation pump systems, the MiniMed 640G with SmartGuard predictive low-glucose management, which has launched in Europe, Australia, and select Latin
America countries, and the MiniMed 620G, the first integrated system customized for the Japanese market. The Company continues to make progress in bringing the MiniMed 640G to the U.S., and plans to submit the premarket approvalGuardian 4 sensor, which have been submitted to the U.S. FDA in the third quarter of fiscal year 2017. In addition, the Company is on track to file its premarket approval to the U.S. FDA for the first hybrid closed loop system by the end of June 2016.FDA.
Acceptance of MiniMed Connect, which allows users to view their insulin pump and CGM data on a smartphone and provides remote monitoring and text message notifications. The Company received U.S. FDA approval during the first quarter of fiscal 2016.
Selection by UnitedHealthcare as the preferred in-network provider of insulin pumps, giving their members access to our advanced diabetes technology and comprehensive support services.
Operations by Market Geography
The graph below illustrates net sales by market geography for fiscal years 2016, 2015, and 2014:
The table below illustrates net sales by market geography for each of our operating segments for fiscal years 2016 and 2015:
|
| | | | | | | | | | | | | | | | | | | | | | | |
| | Fiscal Year 2016 | | Fiscal Year 2015 |
| (in millions) | U.S. | | Non-U.S. Developed Markets | | Emerging Markets | | U.S. | | Non-U.S. Developed Markets | | Emerging Markets |
| Cardiac and Vascular Group | $ | 5,347 |
| | $ | 3,283 |
| | $ | 1,566 |
| | $ | 4,435 |
| | $ | 3,412 |
| | $ | 1,514 |
|
| Minimally Invasive Therapies Group | 5,014 |
| | 3,299 |
| | 1,250 |
| | 1,230 |
| | 856 |
| | 301 |
|
| Restorative Therapies Group | 4,921 |
| | 1,542 |
| | 747 |
| | 4,569 |
| | 1,556 |
| | 626 |
|
| Diabetes Group | 1,140 |
| | 584 |
| | 140 |
| | 1,071 |
| | 548 |
| | 143 |
|
| Total | $ | 16,422 |
| | $ | 8,708 |
| | $ | 3,703 |
| | $ | 11,305 |
| | $ | 6,372 |
| | $ | 2,584 |
|
For fiscal year 2016, net sales for the U.S. increased 45 percent, developed markets outside the U.S. increased 37 percent, and emerging markets increased 43 percent compared to the prior fiscal year. Currency translation had an unfavorable impact of $1.4 billion on net sales for fiscal year 2016. Net sales growth in the U.S. was led by strong growth in the Cardiac and Vascular Group and solid growth in the Restorative Therapies Group and Diabetes. The growth in all markets was primarily driven by the addition of Minimally Invasive Therapies Group net sales totaling $9.6 billion for fiscal year 2016 and was also favorably impacted by an additional selling week during the first quarter of fiscal year 2016.
For fiscal year 2015, net sales for the U.S increased 22 percent, non-U.S. developed markets increased 13 percent, and emerging markets increased 23 percent over the prior fiscal year. Currency translation had an unfavorable impact of $666 million on net sales for fiscal year 2015. Net sales growth in non-U.S. developed markets was driven by the addition of the Minimally Invasive Therapies Group in the fourth quarter, as a result of the Covidien acquisition, offset by unfavorable currency translation. Emerging markets growth was led by strong growth in the Restorative Therapies Group and Diabetes, solid growth in the Cardiac and Vascular Group, and the addition of the Minimally Invasive Therapies Group in the fourth quarter as a result of the Covidien acquisition, partially offset by unfavorable currency translation.
Net sales outside the U.S. are accompanied by certain financial risks, such as changes in currency exchange rates and collection of receivables, which typically have longer payment terms. We monitor the creditworthiness of our customers to which we grant credit terms in the normal course of business. However, a significant amount of our outstanding accounts receivable are with international customers. We continue to monitor the economic conditions in many countries outside the U.S. and the average length of time it takes to collect on our outstanding accounts receivable in these countries. Although we do not currently foresee a significant credit risk associated with a material portion of these receivables, repayment is dependent upon the financial stability of the economies of those countries.
Costs and ExpensesCOSTS AND EXPENSES
The following is a summary of major costscost of products sold, research and development, and selling, general, and administrative expenses as a percent of net sales:
|
| | | | | | | | |
| | Fiscal Year |
| | 2016 | | 2015 | | 2014 |
| Cost of products sold | 31.7 | % | | 31.1 | % | | 25.5 | % |
| Research and development expense | 7.7 |
| | 8.1 |
| | 8.7 |
|
| Selling, general, and administrative expense | 32.8 |
| | 34.1 |
| | 34.4 |
|
Cost of Products Sold We continue to focus on reducing our costs of production through channel optimization, supply chainsupplier management, manufacturing improvements, and review ofoptimizing our manufacturing network. Beginning inCost of products sold for fiscal year 2015, our product mix has substantially changed with the acquisition of Covidien in2022 was $10.1 billion as compared to $10.5 billion for fiscal year 2015.2021. The Patient Monitoring & Recovery division within Minimally Invasive Therapies Group, which accounts for approximately 45 percent of Minimally Invasive Therapies Group's net sales, generally realizes a lower average margin due to the type products sold within the division. Therefore,decrease in cost of products sold as a percentage of net sales has increased in fiscal years 2016 and 2015. Cost of products sold was $9.1 billion, $6.3 billion, and $4.3 billion in fiscal years 2016, 2015, and 2014, respectively.
We have recognized amortizationlargely due to the conditions of the adjustment relatedpandemic during fiscal year 2021, which resulted in recognizing a portion of our fixed overhead costs as period expenses, increases in our reserves in our excess and obsolete inventory, as well as negative impact from mix, as products in higher demand had lower gross margins. The decrease was also attributable to charges from field correction actions in the prior year. Fiscal year 2022 included $58 million of inventory fair value fromwrite-downs associated with our June 2021 decision to stop the Covidien acquisition todistribution and sale of Medtronic's HVAD System (MCS charges). Looking forward, our cost of products sold totaling $226 millionlikely will be further negatively impacted by inflation and $623 million in fiscal years 2016higher labor and 2015, respectively. Additionally, in fiscal year 2015, cost of products sold included a $74 million charge related to a CRHF global comprehensive program for home based monitors due to industry conversion from analog to digital technology. Restructuring charges included in cost of products sold totaled $9 million, $15 million, and $10 million in fiscal years 2016, 2015, and 2014, respectively, for inventory write-offs of discontinued product lines. These charges affect the comparability of our operating results between periods, therefore, we consider this a Non-GAAP Adjustment, refer to the "Executive Level Overview" section of this Management's Discussion and Analysis for further analysis related to these charges.direct material costs.
Research and Development Expense We remain committed to acceleratingdeliver the development of meaningful innovationsbest possible experiences for every patient, physician, and caregiver we serve; to create technologies that expand what’s possible across the entire human body to transform lives; to turn data and insights into real action to serve real patient needs, dramatically improving care; and to expand healthcare access and deliver better patientpositive outcomes at appropriate costs, lead to enhanced quality of life, and can be validated by clinical and economic evidence. We are also focused on expanding access to quality healthcare. During fiscal year 2016, we continued to invest in new technologies to supportthat go far beyond our mission with several new acquisitions, as well as, continued product growth within our business units.
products. Research and development expense for fiscal year 2016, 2015,2022 was $2.7 billion as compared to $2.5 billion for fiscal year 2021. Fiscal year 2022 included $101 million of acquisitions of, and 2014license payments for, technology not approved by regulators, primarily in our Diabetes segment.
Selling, General, and Administrative Expense Our goal is to continue to leverage selling, general, and administrative expense initiatives. Selling, general, and administrative expense primarily consists of salaries and wages, other administrative costs, such as professional fees and marketing expenses, and certain acquisition and restructuring expenses. Selling, general, and administrative expense for fiscal year 2022 was $2.2$10.3 billion $1.6as compared to $10.1 billion for fiscal year 2021. The decrease in selling, general, and $1.5 billion, respectively. Research and developmentadministrative expense remained fairly flat as a percentage of net sales over the three-year period.
Selling, General, and Administrative Our goal is to continue selling, general, and administrative expense leverage initiatives and to continue to realize cost synergies expected from the acquisition of Covidien. During fiscal year 2016, we realized a 1.3 percentage point decrease in our selling, general, and administrative expense percentage towas primarily driven by net sales growth as a result of these initiatives.the recovery of procedural volumes partially offset by increases in employee travel as compared to the corresponding period in the prior year when travel was limited.
Selling, general, and administrative expense was $9.5 billion, $6.9 billion, and $5.8 billion during fiscal years 2016, 2015, and 2014, respectively.
The following is a summary of other costs and expenses:expenses (income):
| | | | | | | | | | | |
| Fiscal Year |
| (in millions) | 2022 | | 2021 |
| Amortization of intangible assets | $ | 1,733 | | | $ | 1,783 | |
| Restructuring charges, net | 60 | | | 293 | |
| Certain litigation charges | 95 | | | 118 | |
| Other operating expense, net | 862 | | | 315 | |
| Other non-operating income, net | (318) | | | (336) | |
| Interest expense | 553 | | | 925 | |
|
| | | | | | | | | | | |
| | Fiscal Year |
| (in millions) | 2016 | | 2015 | | 2014 |
| Special charges (gains), net | $ | 70 |
| | $ | (38 | ) | | $ | 40 |
|
| Restructuring charges, net | 290 |
| | 237 |
| | 78 |
|
| Certain litigation charges, net | 26 |
| | 42 |
| | 770 |
|
| Acquisition-related items | 283 |
| | 550 |
| | 117 |
|
| Amortization of intangible assets | 1,931 |
| | 733 |
| | 349 |
|
| Other expense, net | 107 |
| | 118 |
| | 181 |
|
| Interest expense, net | 955 |
| | 280 |
| | 108 |
|
Special Charges (Gains), Net During fiscal year 2016, we recognized special chargesAmortization of $70 million in connection withIntangible Assets Amortization of intangible assets includes the impairment of a debt investment.
During fiscal year 2015, we recognized special gains of $138 million, which consisted of a $41 million gain on the sale of a product line in the Surgical Technologies division, and a $97 million gain on the sale of an equity method investment.
During fiscal year 2015 and 2014, consistent with our commitment to improving the health of people and communities throughout the world, we made charitable contributions of $100 million and $40 million, respectively, to the Medtronic Foundation, which is a related party non-profit organization.
Special charges (gains), net will affect the comparabilityamortization expense of our operating results between periods,definite-lived intangible assets, consisting of purchased patents, trademarks, tradenames, customer relationships, purchased technology, and we consider this a Non-GAAP Adjustment, refer to the "Executive Level Overview" section of this Management's Discussion and Analysis for further analysis related to these charges.other intangible assets.
Restructuring Charges, Net We incur restructuring charges in connection with our cost-reduction and productivity initiatives or with acquisitions when we implement plans to restructure and integrate
Enterprise Excellence
In the acquired operations. Amounts recognized as restructuring charges result from a series of judgments and estimates about future events and uncertainties and rely heavily on assumptions upon implementation of the initiative programs. Restructuring programs will affect the comparability of our operating results between periods, and we consider this a Non-GAAP Adjustment. Refer to the "Executive Level Overview" section of this Management's Discussion and Analysis.
We began our restructuring program related to the acquisition of Covidien, the cost synergies initiative, in the fourththird quarter of fiscal year 2015. We anticipate approximately $850 million2018, we announced a multi-year global Enterprise Excellence Program designed to drive long-term business growth and sustainable efficiency. Further program details are described in cost synergies to be achieved as a resultNote 4 of the Covidien acquisition through fiscal year 2018, including administrative office optimization, manufacturing and supply chain infrastructure, and certain general and administrative savings. Restructuring charges are expected to be incurred in future fiscal years as cost synergy initiatives are finalized. Restructuring charges are expected to be primarily related to employee termination costs and costs related to manufacturing and facility closures.
Currently, we haveseveral initiative programs in various states of progress with total restructuring liabilities of $257 million and $233 million at April 29, 2016 and April 24, 2015, respectively. During fiscal year 2016, we incurred $332 million in restructuring charges, $9 million of which was related to inventory write-offs of discontinued product lines recognized within cost of products sold in the consolidated statements of income. These charges were partially offset by a $33 million reversal of excess restructuring reserves.
For additional information, see Note 3 to the consolidated financial statements in “Item 8. Financial Statements and Supplementary Data” in this Annual Report on Form 10-K.
Certain Litigation Charges, Net We classify material litigation chargesSince inception, the Company has incurred pre-tax exit and gains recognized as certain litigation charges, net. Certain litigation charges, netdisposal costs and other costs, across all segments, of $1.6 billion in connection with the Enterprise Excellence program. In total, the Company estimates it will affect the comparabilityrecognize approximately $1.8 billion of our operating results between periods,exit and we consider this a Non-GAAP Adjustment, referdisposal costs and other costs related to the "Executive Level Overview" sectionEnterprise Excellence program by the end of this Management's Discussion and Analysis. Duringfiscal year 2023.
For fiscal years 20162022 and 2015, we recorded certain litigation2021, the Company recognized net charges net of $26$259 million and $42$349 million, respectively, which primarily relate to additional accountingincluding $31 million and $52 million, respectively within restructuring charges, for probable and reasonably estimable INFUSE product liability litigation,net in the consolidated statements of income which were recordedprimarily comprised of employee termination benefits. For fiscal years 2022 and 2021, charges also included costs incurred as a direct result of additional filedthe restructuring program, such as salaries for employees supporting the program and unfiled claims,consulting, including $116 million and other litigation matters. See$128 million, respectively, recognized within cost of products sold, and $112 million and $169 million, respectively, recognized within selling, general, and administrative expense in the consolidated statements of income.
Simplification
In the first quarter of fiscal year 2021, we initiated our Simplification restructuring program designed to make the Company a more nimble and competitive organization. Further program details are described in Note 15 to4 of the consolidated financial statements in “Item 8. Financial Statements and Supplementary Data” in this Annual Report on Form 10-K for additional information.10-K.
During fiscal year 2014, we recorded certain litigation charges, netSince inception, the Company has incurred pre-tax exit and disposal costs and other costs, across all segments, of $770$349 million which primarily included the global patent settlement agreement with Edwards Lifesciences Corporation of $589 million, and accounting charges for probable and reasonably estimable INFUSE product liability litigation of $140 million.
Acquisition-Related Items During fiscal year 2016, we recorded charges from acquisition-related items of $283 million, primarily related to costs incurred in connection with the Covidien acquisition. The charges incurred in connection withSimplification program. In total, the Covidien acquisition include $219Company estimates it will recognize approximately $450 million of professional servicesexit and integrationdisposal costs and $58 millionother costs related to the Simplification program by the end of accelerated or incremental stock compensation expense.
During fiscal year 2015, we recorded2023.
For fiscal years 2022 and 2021, the Company recognized net charges from acquisition-related items of $550$82 million and $268 million, respectively, including $35 million and $241 million, respectively, within restructuring charges, net in the consolidated statements of income which were primarily related tocomprised of employee termination benefits. For fiscal years 2022 and 2021, charges also included costs incurred as a direct result of the restructuring program, such as salaries for employees supporting the program and consulting, including $45 million and $27 million, respectively, recognized within selling, general, and administrative expensein connection with the Covidien acquisition.consolidated statements of income. The net charges incurred in connection with the Covidien acquisition include $275 million of professional services and integration costs, $189 million of accelerated or incremental stock compensation expense, and $69for fiscal year 2021 included $97 million of incremental officerdefined benefit pension and director excise tax.post-retirement related expenses for employees that accepted voluntary early retirement packages.
During fiscal year 2014, we recorded net
Certain Litigation Charges We classify specified certain litigation charges from acquisition-related items of $117 million, primarily including IPR&D and long-lived asset impairment charges of $236 milliongains related to the Ardian, Inc. acquisition recordedsignificant legal matters as certain litigation charges in the third quarterconsolidated statements of fiscal year 2014. The impairment charges were partially offset by incomeincome. For additional information, refer to Note 18 of $138 million related to the change in fair value of contingent consideration associated with acquisitions subsequent to April 29, 2009.
Acquisition-related items will affect the comparability of our operating results between periods, and we consider this a Non-GAAP Adjustment. Refer to the "Executive Level Overview" section of this Management's Discussion and Analysis. See Note 2 to the consolidated financial statements in “Item 8. Financial Statements and Supplementary Data” in this Annual Report on Form 10-K for further discussion on IPR&D charges.10-K.
Amortization of Intangible Assets Amortization of intangible assets includes the amortization expense of our definite-lived intangible assets consisting of purchased patents, trademarks, tradenames, purchased technology, and other intangible assets. Amortization of intangible assets will affect the comparability of our operating results between periods, therefore we consider this a Non-GAAP Adjustment, refer to the "Executive Level Overview" section of this Management's Discussion and Analysis for further details related to this expense.
In fiscal year 2016, amortization expense was $1.9 billion as compared to $733 million in fiscal year 2015. The $1.2 billion increase in amortization expense in fiscal year 2016 was primarily due to realizing a full year impact of amortization of intangibles acquired with Covidien in the fourth quarter of fiscal year 2015.
In fiscal year 2015, amortization expense was $733 million, an increase of $384 million from $349 million in fiscal year 2014. The increase was primarily due to the fourth quarter fiscal year 2015 acquisition of Covidien, which added $379 million in amortization expense and fiscal year 2014 acquisitions of TYRX, Corventis, Inc. and Visualase, Inc., partially offset by reduced ongoing amortization expense from certain intangible assets that became fully amortized.
Other Operating Expense, Net Other operating expense, net primarily includes royalty income and expense, realized equity security gains and losses, realized currency transactionremeasurement and derivative gains and losses, impairment charges on equity securities, the Puerto Rico excise tax,taxes, changes in the fair value of contingent consideration, changes in amounts accrued for certain contingent liabilities for a past acquisition, MCS charges, impairment charges, and the U.S. medical device excise tax. In fiscal year 2016,income from funded research and development arrangements.
The increase in other operating expense, net was $107primarily driven by MCS charges recorded in fiscal year 2022. The charges of $823 million a decreaseprimarily included $409 million of $11intangible asset impairments and $366 million from $118for commitments and obligations, including
customer support obligations, restructuring, and other associated costs. The increase was partially offset by changes in fair value of contingent consideration, which resulted in $103 million of income for fiscal year 2022 as compared to $36 million of expense in fiscal year 2021. The net currency impact of remeasurement expense and our hedging programs also partially offset the priorincrease with $70 million of income in fiscal year. The largest contributoryear 2022 and $47 million of expense in fiscal year 2021. Finally, contributing to the change was a $132 million gain related to amounts accrued for certain contingent liabilities for a past acquisition and $76 million of impairment charges related to the abandonment of certain intangible assets, both in fiscal year 2021. Additional information regarding the MCS charges is described in Note 4 of the consolidated financial statements in "Item 8. Financial Statements and Supplementary Data" in this Annual Report on Form 10-K.
Other Non-Operating Income, Net Other non-operating income, net includes the non-service component of net periodic pension and postretirement benefit cost, investment gains and losses, and interest income. The decrease in other expense,non-operating income, net wasfor fiscal year 2022 is driven by our equity method and minority investments portfolio offset by an increase in income from the non-service component of net realized currency gains, whichperiodic pension and postretirement benefit cost. Gains on equity method and minority investments were partially offset by increased royalty expense within Minimally Invasive Therapies Group,$30 million and a write-off of a minority investment in the current year. Total net realized currency gains recorded in other expense, net were $314$61 million in fiscal year 2016 compared to gains of $196 million in the prior fiscal year. Looking ahead, we expect other expense, net will be impacted as a result of the suspension of the U.S. medical device excise tax for two years beginning January 1, 2016 and ending December 31, 2017.
In fiscal year 2015, other expense, net was $118 million, a decrease of $63 million from $181 million in the prior fiscal year. The decrease was primarily due to an increase in net realized currency gains partially offset by increased royalties in our Structural Heart business and increased U.S. medical device excise tax, which for fiscal year 2015 was $1352022 and 2021, respectively, and income related to the non-service component of net periodic pension and postretirement benefits were $107 million compared to $112and $86 million, in the prior fiscal year. Total net realized currency gains recorded in other expense, net were $196 million in fiscal year 2016 compared to gains of $43 million in the prior fiscal year.respectively.
Interest Expense Net Interest expense net includes interest earned on our cash, cash equivalents and investments, interest incurred on our outstanding borrowings, amortization of debt issuance costs and debt premiums or discounts, the net realized and unrealized gainamortization of gains or losslosses on trading securities, ineffectiveness onterminated or de-designated interest rate derivative instruments, and the net realized gain or loss on the sale or impairment of available-for-sale debt securities. In fiscal year 2016, interest expense, net was $955 million, as compared to $280 million in fiscal year 2015. The increase in interest expense, net for fiscal year 2016 was largely driven by an increase in total short-term and long-term borrowings, primarily resulting from the Covidien acquisition, and a $183 million charge recorded
charges recognized in connection with the cash tender offer and early redemption of certain outstanding debt securities, as discussed within the “Liquidity and Capital Resources" section of this management’s discussion and analysis. In addition, during the second quarter of fiscal year 2016 we incurred a $45 million loss on interest rate swaps, which were previously entered into in advance of a planned debt issuance that is no longer expected after the internal reorganization of the ownership of certain legacy Covidien businesses completed in the second quarter of fiscal year 2016.senior notes. The Company treats this interest expense charge, as well as the $183 million charge associated with the cash tender offer and redemption as Non-GAAP Adjustments. The increasedecrease in interest expense net duringfor fiscal year 2016 was partially offset by increased interest income earned on higher investment balances, as compared to fiscal year 2015. Based on current expected rates, we expect interest expense, net to increase in future quarters as our investment balances decline resulting from the deployment of capital, including incremental share repurchases and net debt reduction.
In fiscal year 2015, interest expense, net was $280 million, as compared to $108 million in fiscal year 2014. For fiscal year 2015, the increase in interest expense, net2022 was primarily due to the impact$308 million charge incurred as a result of the incremental interest expense resulting from the issuanceearly redemption of $17.0approximately $6.0 billion of debt to fund the Covidien acquisition and the $3.0 billion term loan funded in January 2015. The $17.0 billion debt resulted in $77 million of incremental interest expense in the third quarter ofduring fiscal year 2015 prior2021.
INCOME TAXES | | | | | | | | | | | | | |
| | Fiscal Year |
| (in millions) | 2022 | | 2021 | | |
| Income tax provision (benefit) | $ | 456 | | | $ | 265 | | | |
| Income before income taxes | 5,517 | | | 3,895 | | | |
| Effective tax rate | 8.3 | % | | 6.8 | % | | |
| | | | | |
| Non-GAAP income tax provision | $ | 1,084 | | | $ | 802 | | | |
| Non-GAAP income before income taxes | 8,609 | | | 6,804 | | | |
| Non-GAAP Nominal Tax Rate | 12.6 | % | | 11.8 | % | | |
| | | | | |
| Difference between the effective tax rate and Non-GAAP Nominal Tax Rate | 4.3 | % | | 5.0 | % | | |
Many of the countries we operate in have statutory tax rates lower than our U.S. statutory rate, thereby resulting in an overall effective tax rate less than the U.S. statutory rate of 21.0 percent. A significant portion of our earnings are generated from operations in Puerto Rico, Switzerland, and Ireland. The statutory tax rates for these jurisdictions range from12.5 percent to 37.5 percent. Our earnings in Puerto Rico are subject to certain tax incentive grants which provide for tax rates lower than the country’s statutory tax rates. Unless our tax incentive grants are extended, they will expire between fiscal years2023 and 2034. The tax incentive grants, which expired during fiscal year 2022, did not have a material impact on our financial results. See Note 13 to the close of the Covidien transaction. The Company treatedconsolidated financial statements in "Item 8. Financial Statements and Supplementary Data" in this interest expense item as a Non-GAAP Adjustment.Annual Report on Form 10-K for additional information.
See our discussion in the “Liquidity and Capital Resources” section of this management’s discussion and analysis for more information regarding our investment portfolio.
Income Taxes
|
| | | | | | | | | | | |
| | Fiscal Year |
| (in millions) | 2016 | | 2015 | | 2014 |
| Provision for income taxes | $ | 798 |
| | $ | 811 |
| | $ | 640 |
|
| Income from operations before taxes | $ | 4,336 |
| | $ | 3,486 |
| | $ | 3,705 |
|
| Effective tax rate | 18.4 | % | | 23.3 | % | | 17.3 | % |
| | | | | | |
| Non-GAAP provision for income taxes | $ | 1,171 |
| | $ | 1,055 |
| | $ | 971 |
|
| Non-GAAP income from operations before taxes | $ | 7,399 |
| | $ | 5,799 |
| | $ | 5,069 |
|
| Non-GAAP Nominal Tax Rate | 15.8 | % | | 18.2 | % | | 19.2 | % |
| | | | | | |
| Difference between the effective tax rate and Non-GAAP Nominal Tax Rate | (2.6 | )% | | (5.1 | )% | | 1.9 | % |
Our effective tax rate for fiscal year 20162022 was 18.48.3 percent, as compared to 23.36.8 percent in the prior fiscal year. The decrease in our effective tax rate was due to the net tax impact of inventory step-up, debt tender premium, acquisition-related items, certain tax adjustments, amortization of intangible assets, the impact from the acquisition of Covidien, operational tax benefits described below, and year-over-year changes in operational results by jurisdiction.
year 2021. Our Non-GAAP Nominal Tax Rate for fiscal year 20162022 was 15.812.6 percent, as compared to 18.211.8 percent in fiscal year 2021. The increase in both the prior fiscal year. The decrease in oureffective tax rate and the Non-GAAP Nominal Tax Rate for fiscal year 2016 as compared to the prior fiscal year was primarily due to the impact of the Covidien acquisition, operational tax benefits, and year-over-year changes in operational results by jurisdiction.
During fiscal year 2016,2022, we recorded $97recognized$89 million inof operational tax benefits. The retroactive renewal and extension of the U.S. federal research and development tax credit resulted in a $16 million operational tax benefit for fiscal year 2016. In addition, we recordedbenefits included a $40$46 million benefit from the reversal of a valuation allowanceexcess tax benefits associated with foreign net operating losses,stock-based compensation, and a $41$43 million net benefit associated with the resolution of certain income tax audits, finalization of certain tax returns, and changes to uncertain tax position reserves.reserves, and changes to certain deferred income tax balances.
Our effective tax rate forDuring fiscal year 2015 was 23.3 percent compared to 17.3 percent from the prior fiscal year. The increase in our effective tax rate was due to the net tax impact2021, we recognized$51 million of special charges (gains), net, restructuring charges, net, certain litigation charges, net, acquisition-related items, certain tax adjustments, the impact from the acquisition of Covidien, the operational tax benefits, described below.
Our Non-GAAP Nominal Tax Rate for fiscal year 2015 was 18.2 percent compared to 19.2 percent in the prior fiscal year. The decrease in our Non-GAAP Nominal Tax Rate for fiscal year 2015 as compared to the prior fiscal year was primarily due to the impact of the Covidien acquisition, operationalwhich included a $46 million benefit from excess tax benefits described below, and year-over-year changes in operational results by jurisdiction.
During fiscal year 2015, we recorded $33 million in operational tax benefits. The retroactive renewal and extension of the U.S. federal research and development tax credit resulted in a $12 million operational tax benefit for fiscal year 2015. In addition, we recorded a $9 million benefit associated with foreign dividend distributions, and a $12 million net benefit associated with the resolution of certain income tax audits, finalization of certain tax returns, and changes to uncertain tax position reserves.stock-based compensation.
An increase in our Non-GAAP Nominal Tax Rate of 1one percent would result in an additional income tax provision for the fiscal years ended April 29, 20162022 and April 24, 20152021 of approximately $74$86 million and $58$68 million, respectively.
Certain Tax Adjustments
During fiscal year 2016 we recorded2022, the net benefit from certain tax adjustments of $417 million. A $442$50 million, certain tax adjustment charge was recorded, which primarily related to the U.S. recognized in income tax expense resulting from our completion of an internal reorganization of the ownership of certain legacy Covidien businesses that reduced the cash and investments held by our U.S.-controlled non-U.S. subsidiaries (the Internal Reorganization). As a result of the Internal Reorganization, approximately $9.7 billion of cash, cash equivalents and investments in marketable debt and equity securities previously held by U.S.-controlled non-U.S. subsidiaries became available for general corporate purposes. This charge was partially offset by a $25 million tax benefit associated with the disposition of a wholly owned U.S. subsidiary. The $417 million net certain tax adjustment was recorded in the provision for income taxes(benefit) in the consolidated statement of income, included the following:
•A benefit of $82 million associated with a step up in tax basis for Swiss Cantonal purposes.
•A benefit of $82 million related to a change in tax rates on intangible assets.
•A cost of $47 million associated with the amortization of the previously established deferred tax assets from intercompany intellectual property transactions.
•A cost of $41 million associated with a change in the Company’s permanent reinvestment assertion on certain historical earnings.
•A net cost of $26 million primarily associated with an intercompany sale of assets.
During fiscal year 2016.
In fiscal year 2015, we recorded2021, the net benefit from certain tax adjustments of $349$41 million, of which $329 million related to the resolution of the Kyphon Inc. (Kyphon) acquisition-related issues with the U.S. Internal Revenue Service (IRS). In addition, the certainrecognized in income tax adjustments include $20 million related to a taxable gain associated with the Covidien acquisition. The $349 million certain tax adjustment was recorded in the provision for income taxes(benefit) in the consolidated statement of income, for fiscal year 2015.included the following:
In fiscal year 2014, we recorded a $63•A net benefit of $106 million certain tax benefit associated with the resolution of an audit at the IRS Appellate level for fiscal years 2012, 2013, and 2014. The issues resolved relate to the utilization of certain issuesnet operating losses and the allocation of income between Medtronic, Inc. and its wholly owned subsidiary operating in Puerto Rico for businesses that are not the fourth quartersubject of the U.S. Tax Court Case for fiscal year 2014years 2005 and 2006.
•A net cost of $73 million related to a tax basis adjustment of previously established deferred tax assets from intercompany intellectual property transactions. The cumulative amount of deferred tax benefit previously recognized from intercompany intellectual property transactions and recorded as Certain Tax Adjustments is $1.5 billion. The corresponding deferred tax assets will be amortized over a period of approximately 20 years.
•A cost of $50 million associated with the IRS relatingamortization of the previously established deferred tax assets from intercompany intellectual property transactions.
•A net cost of $25 million associated with an internal restructuring and intercompany sale of assets.
•A benefit of $83 million related to their reviewthe capitalization of our fiscal year 2009 through 2011 domesticcertain research and development costs for U.S. income tax returns. The $63 million certainpurposes and the establishment of a deferred tax benefit was recorded inasset at the provision for income taxes in the consolidated statement of income for fiscal year 2014.U.S. federal statutory tax rate.
Certain tax adjustments will affect the comparability of our operating results between periods, therefore,periods. Therefore, we consider these Non-GAAP Adjustments. Refer to the "Executive Level Overview" section of this Management's Discussion and Analysis for further analysis related todiscussion of these adjustments.
Liquidity and Capital Resources
|
| | | | | | | |
| | Fiscal Year |
| (in millions) | 2016 | | 2015 |
| Working capital | $ | 16,435 |
| | $ | 21,671 |
|
Current ratio(1) | 3.3:1.0 |
| | 3.4:1.0 |
|
| Cash, cash equivalents, and current investments | $ | 12,634 |
| | $ | 19,480 |
|
| Short-term borrowings and long-term debt | 31,240 |
| | 36,186 |
|
Net cash position(2) | $ | (18,606 | ) | | $ | (16,706 | ) |
| Total shareholder's equity | $ | 52,063 |
| | $ | 53,230 |
|
Debt-to-total capital ratio(3) | 38 | % | | 40 | % |
| |
(1) | The ratio of current assets to current liabilities. |
| |
(2) | The sum of cash, cash equivalents, and current investments less short-term borrowings and long-term debt and excludes non-current investments that are not considered readily available to fund current operations. |
| |
(3) | The ratio of total debt (short-term borrowings and long-term debt) to total capitalization (total debt and total shareholder's equity). |
LIQUIDITY AND CAPITAL RESOURCES
We are currently in a strong financial position, and we believe our balance sheet and liquidity as of April 29, 2022 provide us with flexibility, in the future. Approximately $5 billion ofand our cash, cash equivalents, and current investments, held by certain U.S.-controlled non-U.S. subsidiaries may not represent available liquidity for general corporate purposes. However, we believealong with our other existing cash, cash equivalents and investments, as well as our $3.5 billion revolving credit facility and related commercial paper program (no commercial paper outstanding as of April 29, 2016),programs will satisfy our foreseeable working capital requirements for at least the next 12 months. We regularly review our capital needs and consider various investing and financing alternatives to support our requirements. operating needs.
Our net cash position in fiscal year 2016 decreased by $1.9 billion as compared to fiscal year 2015. See the “Summary of Cash Flows” section of this management’s discussionliquidity and analysis for further information.
In April 2016, the Company completed a cash tender offer and redemption of $2.7 billion of senior notes for $3.0 billion of total consideration. We recognized a loss on debt extinguishment of $163 million, which included cash premiums and accelerated amortization of deferred financing costs and debt discounts and premiums. The loss on debt extinguishment was recorded in the interest expense in the consolidated statement of income. In addition to the loss on debt extinguishment, we recognized $20 million of interest expense due to the acceleration of net losses on forward starting interest rate derivatives, which had been terminated at the time of original debt issuances, relating to the portion of debt extinguished in the tender offer.
|
| | | | |
| | Rating for Fiscal Year Ended(1)
|
| | April 29, 2016 | | April 24, 2015 |
Standard & Poor's (S&P) Ratings Services | | | | |
Long-term debt | | A | | A |
Short-term debt | | A-1 | | A-1 |
| | | | |
Moody's Investors Service (Moody's) | | | | |
Long-term debt | | A3 | | A3 |
Short-term debt | | P-2 | | P-2 |
(1) Agency ratingscapital structure are subject to change, and there can be no assurance that a ratings agency will continue to provide ratings and/or
maintain its current ratings. A security rating is not a recommendation to buy, sell or hold securities, and may be subject to revision or
withdrawal at any time by the rating agency, and each rating should be evaluated independently of any other rating.
Standard & Poor's (S&P) Ratings Services' and Moody's Investors Service long-term debt rating and short-term debt rating at April 29, 2016 were unchanged as compared to the ratings at April 24, 2015. We do not expect the Moody's and S&P Ratings Services' ratings to have a significant impact on our liquidity or future flexibility to access additional liquidity given our balance sheet, our $3.5 billion revolving credit facility and related commercial paper program, discussed above andregularly within the “Debtcontext of our annual operating and Capital” section of this management's discussion and analysis.
strategic planning processes. We have future contractual obligations and other minimum commercial commitments that are entered into inconsider the normal course of business. We believe our off-balance sheet arrangements do not have a material current or anticipated future effect on our consolidated earnings, financial position, and/or cash flows.
Notes 1 and 15 to the consolidated financial statements in “Item 8. Financial Statements and Supplementary Data” in this Annual Report on Form 10-K provide information regarding amounts we have accrued related to significant legal proceedings. In accordance with U.S. GAAP, we record a liability in our consolidated financial statements for these actions when a loss is known or considered probable and the amount can be reasonably estimated. Actual settlements may be different than estimated and could have a material impact on our consolidated earnings, financial position, and/or cash flows.
We provide for tax liabilities in our financial statements with respect to amounts that we expect to repatriate from subsidiaries (to the extent the repatriation would be subject to tax); however, no tax liabilities are recorded for amounts that we consider to be permanently reinvested. Our current plans do not foresee a need to repatriate funds that are designated as permanently reinvested in orderliquidity necessary to fund our operations, or meet currently anticipated liquidity andwhich includes working capital investment needs. However, we evaluate our legal entity structure supporting our business operations, and to the extent such evaluation results in a change to our overall business structure, we may be required to accrue for additional tax obligations.
We haveneeds, investments in marketable debt securities that are classifiedresearch and accounted for as available-for-sale. Our debt securities include U.S. governmentdevelopment, property, plant, and agency securities, corporate debt securities, mortgage-backed securities, other asset-backed securities, debt funds, and auction rate securities. Some of our investments may experience reduced liquidity due to changes in market conditions and investor demand. Our auction rate security holdings continue to experience reduced liquidity due to low investor demand. Although our auction rate securities are currently illiquidequipment, and other securities could become illiquid, we believe we could liquidate a substantial amount of our portfolio without incurring a material impairment loss.
For the fiscal year ended April 29, 2016, the total other-than-temporary impairment losses on available-for-saleoperating costs. We also consider capital allocation alternatives that balance returning value to shareholders through dividends and share repurchases, satisfying maturing debt, securities were not significant. Based on our assessment of the credit quality of the underlying collateral and credit support available to each of the remaining securities in which we are invested, we believe we have recorded all necessary other-than-temporary impairments as we do not have the intent to sell, nor is it more likely than not that we will be required to sell, before recovery of the amortized cost. However, as of April 29, 2016, we have $327 million of gross unrealized losses on our aggregate short-termacquiring businesses and long-term available-for-sale debt securities of $9.7 billion; if market conditions deteriorate, some of these holdings may experience other-than-temporary impairment in the future which could have a material impact on our financial results. Management is required to use estimates and assumptions in its valuation of our investments, which requires a high degree of judgment, and therefore, actualtechnology.
results could differ materially from those estimates. See Note 5 to the consolidated financial statements in “Item 8. Financial Statements and Supplementary Data” in this Annual Report on Form 10-K for additional information regarding fair value measurements.
Summary of Cash Flows
The following is a summary of cash provided by (used in) operating, investing, and financing activities, the effect of exchange rate changes on cash and cash equivalents, and the net change in cash and cash equivalents: | | | | | | | | | | | |
| | Fiscal Year |
| (in millions) | 2022 | | 2021 |
| Cash provided by (used in): | | | |
| Operating activities | $ | 7,346 | | | $ | 6,240 | |
| Investing activities | (1,659) | | | (2,866) | |
| Financing activities | (5,336) | | | (4,136) | |
| Effect of exchange rate changes on cash and cash equivalents | (231) | | | 215 | |
| Net change in cash and cash equivalents | $ | 121 | | | $ | (547) | |
|
| | | | | | | | | | | |
| | Fiscal Year |
| (in millions) | 2016 | | 2015 | | 2014 |
| Cash provided by (used in): | |
| | |
| | |
|
| Operating activities | $ | 5,218 |
| | $ | 4,902 |
| | $ | 4,959 |
|
| Investing activities | 2,245 |
| | (17,058 | ) | | (3,594 | ) |
| Financing activities | (9,543 | ) | | 15,949 |
| | (918 | ) |
| Effect of exchange rate changes on cash and cash equivalents | 113 |
| | (353 | ) | | 37 |
|
| Net change in cash and cash equivalents | $ | (1,967 | ) | | $ | 3,440 |
| | $ | 484 |
|
Operating Activities Our The $1.1 billion increase in net cash provided by operating activities was $5.2 billion for the fiscal year ended April 29, 2016 compared to $4.9 billion provided in the prior year. The $316 million increase was primarily driven by an increase in net income before depreciation and amortization, loss on debt extinguishment, and acquisition-related items of $2.1 billion andcash collected from customers along with a decrease in certain litigation payments of $469 million,cash paid for income taxes. The increase in net cash provided was partially offset by an increase in cash paid for incomes taxesto employees. The increase in cash collected from customers was primarily related to COVID-19 driving decreased sales in the fourth quarter of fiscal year 2020 and interestfirst quarter of $747 million and $688 million, respectively.fiscal year 2021. The increasedecrease in cash paid for income taxes was primarily due to increased estimated federal tax payments and tax payments associated with IRS audit settlements in fiscal year 2021. Cash paid to employees increased due to higher annual incentive plan payouts compared to the prior fiscal year.
Investing Activities The $1.2 billion decrease in net cash used was primarily attributable to a result of the settlement payments made for the resolution of the Kyphon acquisition-related matters, internal reorganization of the ownership of certain legacy Covidien businesses, and the impacts from the full year of Covidien results. The increasedecrease in cash paid for interestacquisitions of $903 million, as well as a decrease of net purchases of investments of $273 million as compared to fiscal year 2021.
Financing Activities The $1.2 billion increase in net cash used was primarilylargely the result of a full yearthe increase of interest payments on the Senior Notes and Term Loan issued in fiscal year 2015 primarily to fund the $16 billion cash consideration portionshare repurchases of the Covidien acquisition, as well as the interest payments on the outstanding debt assumed as part of the Covidien acquisition. Net cash provided by operating activities was further offset by the impact of a full year of operations post-Covidien acquisition.
Our net cash provided by operating activities was $4.9 billion for the fiscal year ended April 24, 2015 compared to $5.0 billion provided in the fiscal year ended April 25, 2014.$1.9 billion. The slight year-over-year decrease is primarily the result of certain Covidien acquisition impacts, including acquisition-related items, accrued liabilities, and deferred income taxes, offset by the $750 million settlement payment made to Edwards in May 2014.
Investing Activities Our net cash provided by investing activities was $2.2 billion for the fiscal year ended April 29, 2016 compared to $17.1 billion used in the prior year. The $19.3 billion increase was primarily attributable to higher levels of cash used in the prior year for acquisitions, primarily related to the Covidien acquisition, as well as an increase in net proceeds from purchases and sales and maturities of marketable securities in the current fiscal year.
Our net cash used in investing activities was$17.1 billion for the fiscal year ended April 24, 2015 compared to $3.6 billion used in the fiscal year ended April 25, 2014. The $13.5 billion increase was primarily attributable to higher levels of cash used in fiscal year ended April 24, 2015 for acquisitions, primarily related to the Covidien acquisition, partially offset by a decrease in net purchases and sales and maturitiesshort-term borrowings of marketable securities.
Financing ActivitiesOur net cash used in financing activities was $9.5 billion for the$311 million. For fiscal year ended April 29, 2016 compared to $15.92021, financing cash flows were impacted by the Mizuho Bank term loan under which we borrowed ¥300 billion provided in the prior year. The $25.5 billion decrease primarily resulted from a net decrease in debt issued, primarily related to the Covidien acquisition, higher paymentsfirst quarter of maturing and extinguished long-term debt, an increase in cash paid for dividends to shareholders, and an increase in repurchases of ordinary shares.
Our net cash provided by financing activities was $15.9 billion for the fiscal year ended April 24, 2015 compared to $918 million used2021, which was subsequently repaid in the fourth quarter of fiscal year ended April 25, 2014. The $16.92021. Fiscal year 2021 financing cash flows were also impacted by the issuance of $7.2 billion increase primarily resulted from a net increase in issuances of long-term debt, primarily related to the Covidien acquisition, net of payments on long-term debt and short-term borrowings, partiallyEuro-denominated senior notes offset by a decreasethe early redemption of $6.0 billion of senior notes for $6.3 billion of total consideration, and repayment of an additional $911 million of Euro-denominated senior notes. For more information on the Mizuho Bank term loan, and issuances and redemptions of senior notes, refer to Note 6 of the consolidated financial statements in net issuance“Item 8. Financial Statements and repurchases of ordinary shares.Supplementary Data” in this Annual Report on Form 10-K.
Free Cash Flow
Free cash flow, a non-GAAP financial measure, is calculated by subtracting property, plant, and equipment additions from operating cash flows. Management uses this non-GAAP financial measure, in addition to U.S. GAAP financial measures to evaluate our operating results. Free cash flow should be considered supplemental to, and not a substitute for, our reported financial results prepared in accordance with U.S. GAAP. Reconciliations between net cash provided by operating activities (the most comparable U.S. GAAP measure) and free cash flow are as follows:
|
| | | | | | | | | | | |
| | Fiscal Year |
| (in millions) | 2016 | | 2015 | | 2014 |
| Net cash provided by operating activities | $ | 5,218 |
| | $ | 4,902 |
| | $ | 4,959 |
|
| Net cash provided by (used in) investing activities | 2,245 |
| | (17,058 | ) | | (3,594 | ) |
| Net cash (used in) provided by financing activities | (9,543 | ) | | 15,949 |
| | (918 | ) |
| | | | | | |
| Net cash provided by operating activities | 5,218 |
| | 4,902 |
| | 4,959 |
|
| Additions to property, plant, and equipment | (1,046 | ) | | (571 | ) | | (396 | ) |
| Free cash flow | $ | 4,172 |
| | $ | 4,331 |
| | $ | 4,563 |
|
| Dividends to shareholders | $ | 2,139 |
| | $ | 1,337 |
| | $ | 1,116 |
|
| Repurchase of ordinary shares | 2,830 |
| | 1,920 |
| | 2,553 |
|
| Issuances of ordinary shares | (491 | ) | | (649 | ) | | (1,307 | ) |
| Return to shareholders | $ | 4,478 |
| | $ | 2,608 |
| | $ | 2,362 |
|
| Return of operating cash flow percentage | 86 | % | | 53 | % | | 48 | % |
| Return of free cash flow percentage | 107 | % | | 60 | % | | 52 | % |
Debt and Capital
Our capital structure consists of equity and interest-bearing debt. Interest-bearingWe primarily utilize unsecured senior debt obligations to meet our financing needs and, to a lesser extent, bank borrowings. From time to time, we may repurchase our outstanding debt obligations in the open market or through privately negotiated transactions.
Total debt at April 29, 2022 was $24.1 billion, as compared to $26.4 billion at April 30, 2021. The decrease in total debt was driven by fluctuations in exchange rates as it pertains to our Euro-denominated senior notes.
Subsequent to fiscal year 2022, on May 2, 2022, we entered into a percentageterm loan agreement (Fiscal 2023 Loan Agreement) with Mizuho Bank, Ltd. for an aggregate principal amount of up to ¥300 billion with a term of 364 days. In May and June 2022, Medtronic Luxco borrowed an aggregate of ¥297 billion, or approximately $2.3 billion, of the term loan, under the Fiscal 2023 Loan Agreement. The Company used the net proceeds of the borrowings to fund the early redemption of $1.9 billion of Medtronic Inc. Senior Notes for $1.9 billion of total interest-bearingconsideration, and $368 million of Medtronic Luxco Senior Notes for $376 million of total consideration. The Company will recognize a total loss on debt extinguishment of $53 million in the quarter ended July 29, 2022, which primarily includes cash premiums and equity was 38 percentaccelerated amortization of deferred financing costs and debt discounts and premiums. The loss will be recognized in interest expense in the consolidated statements of income.
We repurchase our ordinary shares on occasion as of April 29, 2016 and 40 percent as of April 24, 2015.
As part of our focus on returning value to our shareholders, shares are repurchased from time to time.shareholders. In January 2015,March 2019, the Company's Board of Directors authorized subject to the ongoing existencerepurchase of sufficient distributable reserves, the adoption$6.0 billion of the existing Medtronic, Inc. share redemption program.Company's ordinary shares. There is no specific time period associated with these repurchase authorizations. During fiscal years 20162022 and 2015,2021, we repurchased a total of 3822 million and 304 million shares, respectively, under these programs at an average price of $74.92$113.11 and $64.53,$126.80, respectively. In June 2015, the Company's Board of Directors authorized, subject to the ongoing existence of sufficient distributable reserves, the redemption of an additional 80 million of the Company's ordinary shares. As ofAt April 29, 2016,2022, we havehad approximately 72 million shares$3.0 billion remaining under the share repurchase program authorized by our Board of Directors.
For more information on credit arrangements, see Note 6 of the consolidated financial statements in “Item 8. Financial Statements and Supplementary Data” in this Annual Report on Form 10-K.
Liquidity
Our liquidity sources at April 29, 2022 included $3.7 billion of cash and cash equivalents and $6.9 billion of current Board authorization.
We use a combination of bank borrowings andinvestments. Additionally, we maintain commercial paper issuancesprograms and a Credit Facility.
Our investments primarily include available-for-sale debt securities, including U.S. and non-U.S. government and agency securities, corporate debt securities, mortgage-backed securities, certificates of deposit, and other asset-backed securities. See Note 5 to fund ourthe consolidated financial statements in "Item 8. Financial Statements and Supplementary Data" in this Annual Report on Form 10-K for additional information regarding fair value measurements.
We maintain multicurrency commercial paper programs for short-term financing, needs. Short-term debt, including the current portion of our long-term debt and capital lease obligations, as of April 29, 2016, was $993 million compared to $2.4 billion as of April 24, 2015.
We maintain a commercial paper program for short term financing, which allowsallow us to issue unsecured commercial paper notes on a private placement basis up to a maximum aggregate amount outstanding at any time of $3.5 billion. No amounts were outstanding under this program as of At both April 29, 20162022 and April 24, 2015, respectively.
During fiscal years 2016 and 2015, the weighted average original maturity of the30, 2021, we had no commercial paper outstanding was approximately 49 and 52 days, respectively, and the weighted average interest rate was 0.57 percent and 0.13 percent, respectively.outstanding. The issuance of commercial paper reduces the amount of credit available under our existing line of credit, as explained below.
We also have a $3.5 billion five-year syndicated line of credit facility ($3.5 Billion Revolving Credit(Credit Facility), which expires in January 2020.December 2026. At each anniversary date of the Credit Facility, we can request a one-year extension of the maturity date. The $3.5 Billion Revolving Credit Facility provides backup funding for the commercial paper programprograms and may also be used for general corporate purposes. The $3.5 Billion Revolving Credit Facility provides us with the ability to increase itsour borrowing capacity by an additional $500 million$1.0 billion at any time during the term of the agreement. At each anniversary date of the $3.5 Billion Revolving Credit Facility, but not more than twice prior to the maturity date, the Company could also request a one-year extension of the maturity date. As of April 29, 20162022 and April 24, 2015,30, 2021, no amounts were outstanding onunder the committed line of credit.Credit Facility.
Interest rates on advances onof our $3.5 Billion Revolving Credit Facility are determined by a pricing matrix based on our long-term debt ratings assigned by S&PStandard & Poor's Ratings Services and Moody’s. For additional information on our credit ratings status by S&P
Ratings Services(S&P) and Moody's refer to "Liquidity and Capital Resources" section of this Management's Discussion and Analysis.Investors Service (Moody’s). Facility fees are payable on the credit facilityCredit Facility and are determined in the same manner as the interest rates. The agreements also contain customary covenants, all of which we remainWe are in compliance with as of April 29, 2016.
We utilize Senior Notes that are unsecured, senior obligations that rank equally with all other secured and unsubordinated indebtedness to meet our long-term financing needs. We use the net proceeds from the sale of the Senior Notes primarily for working capital and general corporate purposes and in the case of Senior Notes issued on December 10, 2014, to finance the Covidien acquisition andcovenants related expenses. Long-term debt as of April 29, 2016 was $30.2 billion compared to $33.8 billion as of April 24, 2015. The decrease is primarily due to the cash tender offer and redemption of $2.7 billion of senior notes for $3.0 billion of total consideration in April 2016, as discussed within the “Liquidity and Capital Resources" section of this Management’s Discussion and Analysis. Credit Facility.
The indentures under which the Senior Notes have been issued contain customary covenants, all of which we remain in compliance with as of April 29, 2016.
On December 10, 2014, we issued seven tranches of the 2015 Senior Notes with an aggregate face value of $17.0 billion. In addition, on January 26, 2015, we also borrowed $3.0 billion for a term of three years under a term loan agreement. We used these combined proceeds to fund the $16.0 billion cash consideration portion of the Covidien acquisition, to pay certain transaction and financing expenses, and for working capital and general corporate purposes.
For additional information regarding our debt agreements, refer to Note 7 of the consolidated financial statements in “Item 8. Financial Statements and Supplementary Data” in this Annual Report on Form 10-K.
Off-Balance Sheet Arrangements and Long-Term Contractual Obligations
Presented belowfollowing table is a summary of our S&P and Moody's long-term debt ratings and short-term debt ratings:
| | | | | | | | | | | | | | |
| | Agency Rating (1) |
| | April 29, 2022 | | April 30, 2021 |
| Standard & Poor's Ratings Services | | | | |
| Long-term debt | | A | | A |
| Short-term debt | | A-1 | | A-1 |
| Moody's Investors Service | | | | |
| Long-term debt | | A3 | | A3 |
| Short-term debt | | P-2 | | P-2 |
(1) Agency ratings are subject to change, and there may be no assurance that an agency will continue to provide ratings and/or maintain its current ratings. A security rating is not a recommendation to buy, sell or hold securities, and may be subject to revision or withdrawal at any time by the rating agency, and each rating should be evaluated independently of any other rating.
S&P and Moody's long-term debt ratings and short-term debt ratings at April 29, 2022 were unchanged as compared to the ratings at April 30, 2021. We do not expect the S&P and Moody's ratings to have a significant impact on our liquidity or future flexibility to access additional liquidity given our balance sheet, Credit Facility, and related commercial paper programs.
Contractual Obligations and Cash Requirements
We have future contractual obligations and other minimum commercial commitments asthat are entered into in the normal course of business, some of which are recorded in our consolidated balance sheet. We believe our off-balance sheet arrangements do not have a material current or anticipated future effect on our consolidated earnings, financial position, and/or cash flows.
Presented below is a summary of our off-balance sheet contractual obligations and other minimum commercial commitments at April 29, 2016.2022, as well as long-term contractual obligations reflected in the balance sheet at April 29, 2022.
| | | | | | | | | | | | | | | | | | | | | | | | | | | | | | | | | | | | | | | | | | | | |
| | | Maturity by Fiscal Year |
| (in millions) | | Total | | 2023 | | 2024 | | 2025 | | 2026 | | 2027 | | Thereafter |
| Contractual obligations related to off-balance sheet arrangements: | | | | | | | | | | | | | | |
Commitments to fund minority investments, milestone payments, and royalty obligations(1) | | $ | 233 | | | $ | 95 | | | $ | 54 | | | $ | 30 | | | $ | 18 | | | $ | 18 | | | $ | 19 | |
Interest payments(2) | | 6,902 | | | 466 | | | 460 | | | 460 | | | 394 | | | 391 | | | 4,732 | |
Other(3) | | 995 | | | 445 | | | 235 | | | 121 | | | 66 | | | 34 | | | 94 | |
| | | | | | | | | | | | | | |
Contractual obligations reflected in the balance sheet(4): | | | | | | | | | | | | | | |
Debt obligations(5) | | $ | 24,275 | | | $ | 3,744 | | | $ | 6 | | | $ | 1,895 | | | $ | 2,133 | | | $ | 1,969 | | | $ | 14,528 | |
| Operating leases | | 976 | | | 213 | | | 164 | | | 130 | | | 103 | | | 82 | | | 284 | |
Contingent consideration(6) | | 119 | | | 35 | | | 49 | | | 33 | | | 1 | | | — | | | — | |
Tax obligations(7) | | 1,496 | | | 176 | | | 330 | | | 440 | | | 550 | | | — | | | — | |
| | | | | | | | | | | | | | |
| | | | | | | | | | | | | | |
(1)Includes commitments related to the funding of minority investments, estimated milestone payments, and royalty obligations. While it is not certain if and/or when payments will be made, the maturity dates included in the table reflect our best estimates.
(2)Includes the contractual interest payments on our outstanding debt and excludes the impacts of debt premium and discount amortization. See Notes 7 and 13Note 6 to the consolidated financial statements in “Item 8. Financial Statements and Supplementary Data” in this Annual Report on Form 10-K for additional information regarding long-termon our debt agreements.
(3)Includes inventory purchase commitments, research and leasedevelopment, and other arrangements that are legally binding and specify minimum purchase quantities or spending amounts. These purchase commitments do not exceed our projected requirements and are in the normal course of business. Excludes open purchase orders with a remaining term of less than one year.
(4)Excludes defined benefit plan obligations, respectively. Additionally,guarantee obligations, uncertain tax positions, non-current tax liabilities, and litigation settlements for which we cannot make a reliable estimate of the period of cash settlement. For further information, see Note 11Notes 13, 15, and 18 to the consolidated financial statements in “Item 8. Financial Statements and Supplementary Data” in this Annual Report on Form 10-K.
(5)Includes the current and non-current portion of our Senior Notes and bank borrowings. Excludes debt premium and discount, unamortized gains from terminated interest rate swap agreements, and commercial paper. See Notes 6 and 7 to the consolidated financial statements in “Item 8. Financial Statements and Supplementary Data” in this Annual Report on Form 10-K for additional information regarding accrued incomeon our debt agreements and interest rate swap agreements, respectively.
(6)Includes the fair value of our current and non-current portions of contingent consideration. While it is not certain if and/or when payments will be made, the maturity dates included in this table reflect our best estimates.
(7)Represents the tax obligations which areassociated with the transition tax that resulted from U.S. Tax Reform. The transition tax will be paid over an eight-year period and will not reflected in the table below.
|
| | | | | | | | | | | | | | | | | | | | | | | | | | | | |
| | | Maturity by Fiscal Year |
| (in millions) | | Total | | 2017 | | 2018 | | 2019 | | 2020 | | 2021 | | Thereafter |
| Contractual obligations related to off-balance sheet arrangements: | | |
| | |
| | |
| | |
| | |
| | |
| | |
|
Operating leases(1) | | $ | 544 |
| | $ | 180 |
| | $ | 130 |
| | $ | 90 |
| | $ | 56 |
| | $ | 33 |
| | $ | 55 |
|
Commitments to fund minority investments/contingent acquisition consideration(2) | | 520 |
| | 89 |
| | 72 |
| | 155 |
| | 48 |
| | 41 |
| | 115 |
|
Interest payments(3) | | 13,925 |
| | 1,058 |
| | 1,014 |
| | 911 |
| | 882 |
| | 760 |
| | 9,300 |
|
Other(4) | | 603 |
| | 351 |
| | 115 |
| | 35 |
| | 27 |
| | 25 |
| | 50 |
|
| Contractual obligations related to off-balance sheet arrangements subtotal | | $ | 15,592 |
| | $ | 1,678 |
| | $ | 1,331 |
| | $ | 1,191 |
| | $ | 1,013 |
| | $ | 859 |
| | $ | 9,520 |
|
| Contractual obligations reflected in the balance sheet: | | |
| | |
| | |
| | |
| | |
| | |
| | |
|
Long-term debt, including current portion(5) | | $ | 30,805 |
| | $ | 887 |
| | $ | 6,188 |
| | $ | 408 |
| | $ | 3,774 |
| | $ | 1,102 |
| | $ | 18,446 |
|
| Capital leases | | 132 |
| | 106 |
| | 4 |
| | 3 |
| | 2 |
| | 2 |
| | 15 |
|
| Contractual obligations reflected in the balance sheet subtotal | | $ | 30,937 |
| | $ | 887 |
| | $ | 6,188 |
| | $ | 408 |
| | $ | 3,774 |
| | $ | 1,102 |
| | $ | 18,446 |
|
| Total contractual obligations | | $ | 46,529 |
| | $ | 2,565 |
| | $ | 7,519 |
| | $ | 1,599 |
| | $ | 4,787 |
| | $ | 1,961 |
| | $ | 27,966 |
|
| |
(1) | Certain leases require us to pay real estate taxes, insurance, maintenance, and other operating expenses associated with the leased premises. These future costs are not included in the schedule above. |
| |
(2) | Certain commitments related to the funding of cost or equity method investments and/or previous acquisitions are contingent upon the achievement of certain product-related milestones and various other favorable operational conditions, and estimated royalty obligations. While it is not certain if and/or when these payments will be made, the maturity dates included in this table reflect our best estimates. Contingent consideration includes only the maximum potential amount of undiscounted future contingent consideration associated with all completed business combinations or purchases of intellectual property prior to April 24, 2009. See Note 2 to the consolidated financial statements in “Item 8. Financial Statements and Supplementary Data” in this Annual Report on Form 10-K for additional information regarding our debt agreements. |
| |
(3) | Interest payments in the table above reflect the contractual interest payments on our outstanding debt, and exclude the impact of the debt discount amortization and impact of interest rate swap agreements. See Note 7 to the consolidated financial statements in “Item 8. Financial Statements and Supplementary Data” in this Annual Report on Form 10-K for additional information regarding our debt agreements. |
| |
(4) | We have included inventory purchase commitments which are legally binding and specify minimum purchase quantities. These purchase commitments do not exceed our projected requirements and are in the normal course of business. These commitments do not include open purchase orders. These obligations also include certain research and development arrangements. |
| |
(5) | Long-term debt in the table above includes the $3.0 billion Term Loan Credit Agreement, $3.1 billion of CIFSA Senior Notes, $16.9 billion of 2015 Senior Notes, $1.5 billion of 2014 Senior Notes, $1.9 billion of 2013 Senior Notes, $1.1 billion of 2012 Senior Notes, $500 million of 2011 Senior Notes, $1.3 billion of 2010 Senior Notes, and $700 million of 2009 Senior Notes. The table above excludes the debt premium and discount, the fair value impact of outstanding interest rate swap agreements, and the unamortized gains from terminated interest rate swap agreements. See Notes 7 and 8 to the consolidated financial statements in “Item 8. Financial Statements and Supplementary Data” in this Annual Report on Form 10-K for additional information regarding the interest rate swap agreements. |
Milestone Payments We acquire assets still in development, enter into research and development arrangements, and sponsor certain clinical trials that often require milestone and/or royalty payments to a third-party, contingent upon the occurrence of certain future events. Milestone payments may be required upon the successful achievement of an important point in the development life cycle of a product or upon certain pre-designated levels of achievement in clinical trials. In addition, if required by the arrangement, we may have to make royalty payments based on a percentage of sales related to the product under development or in the event that regulatory approval for marketing is obtained. In situations where we have no ability to influence the achievement of the milestone or otherwise avoid the payment, we have included those milestone or minimum royalty payments in the preceding table. However, the majority of these arrangements give us the discretion to unilaterally make the decision to stop development of a product or cease progress of a clinical trial, which would allow us to avoid making the contingent payments. Although we are unlikely to cease development if a device successfully achieves clinical testing objectives, these payments are not included in the table of contractual obligations because of the contingent nature of these payments and our ability to avoid them if we decided to pursue a different path of development or testing.accrue interest. See Note 213 to the consolidated financial statements in “Item 8. Financial Statements and Supplementary Data” in this Annual Report on Form 10-K for additional information regarding contingent consideration.further information.
Indemnification provisions In the normal course of business, we periodically enter into agreements that require us to indemnify customers or suppliers for specific risks, such as claims for injury or property damage arising outas a result of our products or the negligence of our personnel or claims alleging that our products infringe third-party patents or other intellectual property. Our maximum exposure under these indemnification provisions cannotis unable to be estimated, and we have not accrued any liabilities within our consolidated financial statements or included any indemnification provisions in our commitments table.the table above. Historically, we have not experienced significant losses on these types of indemnification obligations.agreements.
Note 18 to the consolidated financial statements in "Item 8. Financial Statements and Supplementary Data" in this Annual Report on Form 10-K provides information regarding amounts we have accrued related to legal matters. In accordance with U.S. GAAP, we record a liability in our consolidated financial statements for these matters when a loss is known or considered probable and the amount can be reasonably estimated. Actual settlements may be different than estimated and could have a material effect on our consolidated earnings, financial position, and/or cash flows.
InformationWe record tax liabilities in our consolidated financial statements for amounts that we expect to repatriate from subsidiaries (to the extent the repatriation would be subject to tax); however, no tax liabilities are recorded for amounts we consider to be permanently reinvested. We expect to have access to the majority of our cash flows in the future. In addition, we continue to evaluate our legal entity structure supporting our business operations, and to the extent such evaluation results in a change to our overall business structure, we may be required to accrue for additional tax obligations.
Beyond the contractual obligations and other minimum commercial commitments outlined above, we have recurring cash requirements arising from the normal operation of our business that include capital expenditures, research and developments costs, and other operational costs.
We believe our balance sheet and liquidity provide us with flexibility, and our cash, cash equivalents, current investments, Credit Facility and related commercial paper programs as well as our ability to generate operating cash flows will satisfy our current and future contractual obligations and cash requirements. We regularly review our capital needs and consider various investing and financing alternatives to support our requirements.
ACQUISITIONS
Affera, Inc. Pending Acquisition
On January 10, 2022, Medtronic and Affera, Inc. (Affera) entered into a definitive agreement in which Medtronic will acquire Affera for $925 million, including up to $250 million of contingent consideration related to certain technical and regulatory milestones. The acquisition is pending clearance of anti-trust filings and other closing conditions.
Intersect ENT Acquisition
Subsequent to fiscal year 2022, on May 13, 2022, the Company acquired Intersect ENT. Total consideration for the transaction was approximately $1.2 billion to acquire all outstanding shares of Intersect ENT for $28.25 per share.
Additional information regarding acquisitions is included in Note 23 of the consolidated financial statements in "Item 8. Financial Statements and Supplementary Data" within this Annual Report on Form 10-K.
SUBSEQUENT EVENTS
On May 25, 2022, the Company and DaVita Inc. (“DaVita”) entered into a definitive agreement with the intent to form a new, independent kidney care-focused medical device company (“NewCo”) with equal equity ownership. The transaction is expected to close in calendar year 2023, subject to customary regulatory approvals and closing conditions. We are contributing our entire Renal Care Solutions business (“RCS”) to NewCo. RCS is part of the Respiratory, Gastrointestinal, and Renal division in our Medical Surgical portfolio, and had revenue of $325 million in fiscal year 2022. We expect to record a non-cash pre-tax impairment of long-lived assets of $60 million to $90 million in the quarter ending July 29, 2022 related to goodwill.
CRITICAL ACCOUNTING ESTIMATES
We have used various accounting policies to prepare the consolidated financial statements in accordance with U.S. GAAP. Our significant accounting policies are disclosed in Note 1 to the consolidated financial statements in “Item"Item 8. Financial Statements and Supplementary Data”Data" in this Annual Report on Form 10-K.
The preparation of the consolidated financial statements, in conformity with U.S. GAAP, requires us to use judgment in making estimates and assumptions that affect the reported amounts of assets, liabilities, revenues, and expenses. These estimates reflect our best judgment about economic and market conditions and the potential effects on the valuation and/or carrying value of assets and liabilities based upon relevant information available. We periodically acquire certain tangiblebase our estimates on historical experience and on various assumptions that are believed to be reasonable under the circumstances, the results of which form the basis for making judgments about the carrying values of assets and liabilities that are not readily apparent from other sources.
Our critical accounting estimates include the following:
Litigation Contingencies We are involved in a number of legal actions involving product liability, intellectual property and commercial disputes, shareholder related matters, environmental proceedings, tax disputes, and governmental proceedings and investigations. The outcomes of these legal actions are not completely within our control and may not be known for prolonged periods of time. In some actions, the enforcement agencies or intangible assetsprivate claimants seek damages, as well as other civil or criminal remedies (including injunctions barring the sale of products that are the subject of the proceeding), that could require significant expenditures or result in lost revenues or limit our ability to conduct business in the applicable jurisdictions. Estimating probable losses from enterprises that do not otherwise qualifyour litigation and governmental proceedings is inherently difficult, particularly when the matters are in early procedural stages, with incomplete scientific facts or legal discovery; involve unsubstantiated or indeterminate claims for accounting asdamages; potentially involve penalties, fines, or punitive damages; or could result in a change in business combination. These transactions are reflectedpractice. The Company records a liability in the consolidated financial statements for loss contingencies when a loss is known or
considered probable, and the amount may be reasonably estimated. If the reasonable estimate of a known or probable loss is a range, and no amount within the range is a better estimate than any other, the minimum amount of the range is accrued. If a loss is reasonably possible but not known or probable, and may be reasonably estimated, the estimated loss or range of loss is disclosed. Our significant legal proceedings are discussed in Note 18 to the consolidated financial statements in "Item 8. Financial Statements and Supplementary Data" in this Annual Report on Form 10-K.
Income Tax Reserves We establish reserves when, despite our belief that our tax return positions are fully supportable, we believe that certain positions are likely to be challenged and that we may or may not prevail. Under U.S. GAAP, if we determine that a tax position is more likely than not of being sustained upon audit, based solely on the technical merits of the position, we recognize the benefit. We measure the benefit by determining the amount that is greater than 50 percent likely of being realized upon settlement. We presume that all tax positions will be examined by a taxing authority with full knowledge of all relevant information. The calculation of our tax liabilities involves dealing with uncertainties in the application of complex tax regulations in a multitude of jurisdictions across our global operations. We regularly monitor our tax positions and tax liabilities. We reevaluate the technical merits of our tax positions and recognize an uncertain tax benefit, or derecognize a previously recorded tax benefit, when there is (i) a completion of a tax audit, (ii) effective settlement of an issue, (iii) a change in applicable tax law including a tax case or legislative guidance, or (iv) the expiration of the applicable statute of limitations. Significant judgment is required in accounting for tax reserves. Although we believe that we have adequately provided for liabilities resulting from tax assessments by taxing authorities, positions taken by these tax authorities could have a material impact on our effective tax rate, consolidated earnings, financial position and/or cash flows.
Valuation of Intangible Assets and Goodwill When we acquire a business, the assets acquired and liabilities assumed are recorded at their respective fair values at the acquisition date. Goodwill is the excess of the purchase price over the estimated fair value of net assets of acquired businesses. Intangible assets primarily include patents, trademarks, tradenames, customer relationships, purchased technology, and in-process research and development. Determining the fair value of intangible assets acquired as part of a business combination requires us to make significant estimates. These estimates include the amount and timing of projected future cash flows of each project or technology, the discount rate used to discount those cash flows to present value, and the assessment of the asset’s life cycle. The estimates could be impacted by legal, technical, regulatory, economic, and competitive risks.
The test for impairment of goodwill requires us to make several estimates related to projected future cash flows to determine the fair value of the goodwill reporting units. Our estimates associated with the goodwill impairment test are considered critical due to the amount of goodwill recorded on our consolidated balance sheets and the judgment required in determining fair value. We assess the impairment of goodwill at the reporting unit level annually as of the first day of the third quarter and whenever an event occurs or circumstances change that would indicate that the carrying amount may be impaired.
We also test definite-lived intangible assets for impairment when an event occurs or circumstances change that would indicate the carrying amount of the assets or asset group may be impaired. We assess the impairment of indefinite-lived intangible assets annually in the third quarter and whenever an event occurs or circumstances change that would indicate that the carrying amount may be impaired.
Our tests for goodwill and intangible assets are based on future cash flows that require significant judgment with respect to future revenue and expense growth rates, appropriate discount rates, asset groupings, and other assumptions and estimates. We use estimates that are consistent with the highest and best use of the assets based on a componentmarket participant's view of investing activities under other investing activities, net.the assets being evaluated. Actual results may differ from our estimates due to a number of factors including, among others, changes in competitive conditions, timing of regulatory approval, results of clinical trials, changes in worldwide economic conditions, and fluctuations in currency exchange rates.
New Accounting Pronouncements
NEW ACCOUNTING PRONOUNCEMENTS
Information regarding new accounting pronouncements is included in Note 1 to the consolidated financial statements in “Item 8. Financial Statements and Supplementary Data” in this Annual Report on Form 10-K.
Cautionary Factors That May Affect Future Results
This Annual Report,SUPPLEMENTAL GUARANTOR FINANCIAL INFORMATION
Medtronic plc and other written reportsMedtronic Global Holdings S.C.A. (Medtronic Luxco), a wholly-owned subsidiary guarantor, each have provided full and oral statements made by or with the approval of oneunconditional guarantees of the Company’s executive officers from timeobligations of Medtronic, Inc., a wholly-owned subsidiary issuer, under the Senior Notes (Medtronic Senior Notes) and full and unconditional guarantees of the obligations of Covidien International Finance S.A. (CIFSA), a wholly-owned subsidiary issuer, under the Senior Notes (CIFSA Senior Notes). The guarantees of the CIFSA Senior Notes are in addition to time, may include “forward-looking” statements. Forward-looking statements broadly include our current expectations or forecaststhe guarantees of future results. Our forward-looking statements generally relate to our growththe CIFSA Senior Notes by Covidien Ltd. and growth strategies, developments inCovidien Group Holdings Ltd., both of which are wholly-owned subsidiary guarantors of the marketsCIFSA Senior Notes. Medtronic plc and Medtronic, Inc. each have provided a full and unconditional guarantee of the obligations of Medtronic Luxco under the Senior Notes (Medtronic Luxco Senior Notes). The following is a summary of these guarantees:
Guarantees of Medtronic Senior Notes
•Parent Company Guarantor - Medtronic plc
•Subsidiary Issuer - Medtronic, Inc.
•Subsidiary Guarantor - Medtronic Luxco
Guarantees of Medtronic Luxco Senior Notes
•Parent Company Guarantor - Medtronic plc
•Subsidiary Issuer - Medtronic Luxco
•Subsidiary Guarantor - Medtronic, Inc.
Guarantees of CIFSA Senior Notes
•Parent Company Guarantor - Medtronic plc
•Subsidiary Issuer - CIFSA
•Subsidiary Guarantors - Medtronic Luxco, Covidien Ltd., and Covidien Group Holdings Ltd. (CIFSA Subsidiary Guarantors)
The following tables present summarized financial information for our products,the fiscal year ended April 29, 2022 for the obligor groups of Medtronic and Medtronic Luxco Senior Notes, and CIFSA Senior Notes. The obligor group consists of the parent company guarantor, subsidiary issuer, and subsidiary guarantors for the applicable senior notes. The summarized financial results, product development launches and effectiveness, research and development strategy, regulatory approvals, competitive strengths, restructuring and cost-saving initiatives, intellectual property rights, litigation and tax matters, government investigations, mergers and acquisitions, divestitures, market acceptance of our products, accounting estimates, financing activities, ongoing contractual obligations, working capital adequacy, value of our investments, our effective tax rate, our expected returns to shareholders, and sales efforts. Such statements can be identified by the use of terminology such as “anticipate,” “believe,” “could,” “estimate,” “expect,” “forecast,” “intend,” “looking ahead,” “may,” “plan,” “possible,” “potential,” “project,” “should,” “will,” and similar words or expressions. Forward-looking statements in this Annual Report include, but are not limited to, statements regarding our ability to drive long-term shareholder value, development and future launches of products and continued or future acceptance of products in our operating segments; expected timing for completion of research studies relating to our products; market positioning and performance of our products, including stabilization of certain product markets; unanticipated issues that may affect U.S. FDA and non-U.S. regulatory approval of new products; increased presence in new markets, including markets outside the U.S.; changes in the market and our market share; acquisitions and investment initiatives, as well as integration of acquired companies into our operations; the resolution of tax matters; the effectiveness of our development activities in reducing patient care costs and hospital stay lengths; our approach towards cost containment; our expectations regarding health care costs; theinformation is presented after elimination of certain positions(i) intercompany transactions and balances among the guarantors and issuers and (ii) equity in earnings from and investments in any subsidiary that is a non-guarantor or costs related to restructuring initiatives; outcomes in our litigation matters and government investigations; general economic conditions;issuer.
The summarized results of operations information for the adequacy of available working capital and our working capital needs; our payment of dividends and redemption of shares; the continued strength of ourfiscal year ended April 29, 2022 was as follows:
| | | | | | | | | | | |
| (in millions) | Medtronic & Medtronic Luxco Senior Notes (1) | | CIFSA Senior Notes (2) |
| Net sales | $ | 2,063 | | | $ | — | |
| Operating profit | 469 | | | (5) | |
| Loss before income taxes | (518) | | | (974) | |
| Net loss attributable to Medtronic | (529) | | | (1,005) | |
The summarized balance sheet information for the fiscal year ended April 29, 2022 was as follows:
| | | | | | | | | | | |
| (in millions) | Medtronic & Medtronic Luxco Senior Notes (1) | | CIFSA Senior Notes (2) |
Total current assets(3) | $ | 20,767 | | | $ | 6,881 | |
Total noncurrent assets(4) | 12,099 | | | 8,293 | |
Total current liabilities(5) | 32,647 | | | 24,302 | |
Total noncurrent liabilities(6) | 50,542 | | | 60,292 | |
| Noncontrolling interests | 171 | | | 171 | |
(1)The Medtronic Senior Notes and liquidity; our accounts receivable exposure; and the potential impact of our compliance with governmental regulations and accounting guidance. One must carefully consider forward-looking statements and understand that such statements
may be affected by inaccurate assumptions and may involve a variety of risks and uncertainties, known and unknown, including, among others, those discussed in the sections entitled “Government Regulation and Other Considerations” within “Item 1. Business” and “Item 1A. Risk Factors” in this Annual Report on Form 10-K, as well as those related to competition in the medical device industry, reduction or interruption in our supply, quality problems, liquidity shortfalls, decreasing prices and pricing pressure, fluctuations in currency exchange rates, changes in applicable tax rates, positions taken by taxing authorities, adverse regulatory action, litigation results, self-insurance, commercial insurance, health care policy changes, international operations, failure to achieve the intended benefitsMedtronic Luxco Senior Notes obligor group consists of the Covidienfollowing entities: Medtronic plc, Medtronic Luxco, and other acquisitions or disruption of our current plans and operations.Medtronic, Inc. Refer to the guarantee summary above for further details.
Consequently, no forward-looking statement can be guaranteed and actual results may vary materially. We intend to take advantage(2)The CIFSA Senior Notes obligor group consists of the Safe Harbor provisionsfollowing entities: Medtronic plc, Medtronic Luxco, CIFSA, and CIFSA Subsidiary Guarantors. Please refer to the guarantee summary above for further details.
(3)Includes receivables due from non-guarantor subsidiaries of the Private Securities Litigation Reform Act$20.2 billion and $6.9 billion for Medtronic & Medtronic Luxco Senior Notes, and CIFSA Senior Notes, respectively.
(4)Includes loans receivable due from non-guarantor subsidiaries of 1995 regarding our forward-looking statements,$6.5 billion and are including this sentence$8.3 billion for the express purpose of enabling us to use the protections of the safe harbor with respect to all forward-looking statements.Medtronic & Medtronic Luxco Senior Notes, and CIFSA Senior Notes, respectively.
We undertake no obligation to update any statement we make, but investors are advised to consult all other disclosures by us in our filings with the Securities and Exchange Commission, especially on Forms 10-K, 10-Q, and 8-K, in which we discuss in more detail various important factors that could cause actual results to differ from expected or historical results. In addition, actual results may differ materially from those anticipated(5)Includes payables due to a numbernon-guarantor subsidiaries of factors, including, among others, those discussed in the section entitled “Item 1A. Risk Factors” in this Annual Report on Form 10-K. It is not possible$26.4 billion and $20.2 billion for Medtronic & Medtronic Luxco Senior Notes, and CIFSA Senior Notes, respectively.
(6)Includes loans payable due to foresee or identify all such factors. As such, investors should not consider any listnon-guarantor subsidiaries of such factors to be an exhaustive statement$29.0 billion and $46.4 billion for Medtronic & Medtronic Luxco Senior Notes, and CIFSA Senior Notes, respectively.
Item 7A. Quantitative and Qualitative Disclosures About Market Risk
Currency Exchange Rate RiskCURRENCY EXCHANGE RATE RISK
Due to the global nature of our operations, we are exposed to currency exchange rate changes. In a period where the U.S. dollar is strengthening/weakening as compared to other currencies, our revenues and expenses denominatedchanges, which may cause fluctuations in other currencies are translated into U.S. dollars at a lower/higher value than they would be in an otherwise constant currency exchange rate environment.
We use operational and economic hedges, as well as currency exchange rate derivative instruments, to manage the impact of currency exchange rate fluctuations on earnings and cash flows. In order to minimize earnings and cash flow volatility resulting from currency exchange rate fluctuations, we enter into derivative instruments, principally forward currency exchange rate contracts. These contracts are designed to hedge anticipated currency transactions and changes in the value of specific assets and liabilities. At inception of the contract, the derivative instrument is designated as either a freestanding derivative or a cash flow hedge. The primary currencies of the derivative instruments are the Euro and Japanese Yen. Fluctuations in the currency exchange rates of currency exposures that are unhedged, such as in certain emerging markets, may result in future earnings and cash flow volatility. We do not enter into currency exchange rate derivative instruments for speculative purposes.
The gross notional amount of all currency exchange rate derivative instruments outstanding at April 29, 20162022 and April 24, 201530, 2021 was $10.8$13.8 billion and $9.8$14.7 billion, respectively. At April 29, 2016,2022, these contracts were in ana net unrealized lossgain position of $11$586 million. Additional information regarding our currency exchange rate derivative instruments is included in Note 7 to the consolidated financial statements in “Item 8. Financial Statements and Supplementary Data” in this Annual Report on Form 10-K.
A sensitivity analysis of changes in the fair value of all currency exchange rate derivative contracts at April 29, 20162022 and April 30, 2021 indicates that, if the U.S. dollar uniformly strengthened/weakened by 10 percent against all currencies, it would have the following impact on the fair value of these contracts would increase/decrease by approximately $725 million. contracts:
| | | | | | | | | | | | | | |
| | Increase (decrease) |
| (in millions) | | April 29, 2022 | | April 30, 2021 |
| 10% appreciation in the U.S. dollar | | $ | 903 | | | $ | 995 | |
| 10% depreciation in the U.S. dollar | | (903) | | | (995) | |
Any gains and losses on the fair value of derivative contracts would generally be offset by gains and losses on the underlying transactions. These offsetting gains and losses are not reflected in the above analysis.
Interest Rate RiskINTEREST RATE RISK
We are subject to interest rate risk on our short-term investments and our borrowings. We manage interest rate risk in the aggregate, while focusing on our immediate and intermediate liquidity needs. Our debt portfolio as ofat April 29, 2016,2022 was comprised of debt predominatelypredominantly denominated in U.S. dollars and Euros, of which approximately 90%substantially all is fixed rate debt and approximately 10% is floating-rate debt. We are also exposed to interest rate changes affecting our investments in interest rate sensitive instruments, which include our marketable debt securities, fixed-to-floating interest rate swap agreements, and forward starting interest rate swap agreements.securities.
A sensitivity analysis of the impact on our investments in interest rate sensitiverate-sensitive financial instruments of a hypothetical 10 basis point change in interest rates, as compared to interest rates as ofat April 29, 2016, indicates that2022 and April 30, 2021, would have the following impact on the fair value of these instruments would correspondingly change by $85 million.instruments:
| | | | | | | | | | | | | | |
| | Increase (decrease) |
| (in millions) | | April 29, 2022 | | April 30, 2021 |
| 10 basis point increase in interest rates | | $ | 53 | | | $ | 21 | |
| 10 basis point decrease in interest rates | | (53) | | | (21) | |
For a discussion of current market conditions and the impact on our financial condition and results of operations, please see the “Liquidity and Capital Resources”“Liquidity” section of “Itemthe Management's Discussion and Analysis in "Item 7. Management'sManagement’s Discussion and Analysis of Financial Condition and Results of Operations”Operations" in this Annual Report on Form 10-K. For additional discussion of market risk, see Notes 5 and 87 to the consolidated financial statements in “Item 8. Financial Statements and Supplementary Data” in this Annual Report on Form 10-K.
Item 8. Financial Statements and Supplementary Data
Report of Independent Registered Public Accounting Firm
To theShareholders and Board of Directors of Medtronic plc:plc
Opinions on the Financial Statements and Internal Control over Financial Reporting
In our opinion,We have audited the accompanying consolidated balance sheets of Medtronic plc and its subsidiaries (the “Company”) as of April 29, 2022 and April 30, 2021, and the related consolidated statements of income, of comprehensive income, shareholders’of equity and cash flows present fairly, in all material respects, the financial position of Medtronic plc and its subsidiaries (the Company) at April 29, 2016 and April 24, 2015, and the results of their operations and their cash flows for each of the three years in the period ended April 29, 20162022, including the related notes and schedule of valuation and qualifying accounts for each of the three years in the period ended April 29, 2022 appearing under Item 15(a)(1) (collectively referred to as the “consolidated financial statements”). We also have audited the Company's internal control over financial reporting as of April 29, 2022, based on criteria established in Internal Control - Integrated Framework (2013) issued by the Committee of Sponsoring Organizations of the Treadway Commission (COSO).
In our opinion, the consolidated financial statements referred to above present fairly, in all material respects, the financial position of the Company as of April 29, 2022 and April 30, 2021, and the results of its operations and its cash flows for each of the three years in the period ended April 29, 2022 in conformity with accounting principles generally accepted in the United States of America. In addition, in our opinion, the financial statement schedule listed in the index appearing under Item 15(a)(1)presents fairly, in all material respects, the information set forth therein when read in conjunction with the related consolidated financial statements. Also in our opinion, the Company maintained, in all material respects, effective internal control over financial reporting as of April 29, 2016,2022, based on criteria established in Internal Control - Integrated Framework(2013) issued by the Committee of Sponsoring Organizations ofCOSO.
Change in Accounting Principle
As discussed in Note 1 to the Treadway Commission (COSO). consolidated financial statements, the Company changed the manner in which it accounts for leases in fiscal year 2020.
Basis for Opinions
The Company's management is responsible for these consolidated financial statements, and financial statement schedule, for maintaining effective internal control over financial reporting, and for its assessment of the effectiveness of internal control over financial reporting, included in the accompanying Management'sManagement’s Annual Report on Internal Control overOver Financial Reporting.Reporting appearing under Item 9A. Our responsibility is to express opinions on thesethe Company’s consolidated financial statements on the financial statement schedule, and on the Company's internal control over financial reporting based on our integratedaudits. We are a public accounting firm registered with the Public Company Accounting Oversight Board (United States) (PCAOB) and are required to be independent with respect to the Company in accordance with the U.S. federal securities laws and the applicable rules and regulations of the Securities and Exchange Commission and the PCAOB.
We conducted our audits in accordance with the standards of the Public Company Accounting Oversight Board (United States).PCAOB. Those standards require that we plan and perform the audits to obtain reasonable assurance about whether the consolidated financial statements are free of material misstatement, whether due to error or fraud, and whether effective internal control over financial reporting was maintained in all material respects.
Our audits of the consolidated financial statements included performing procedures to assess the risks of material misstatement of the consolidated financial statements, whether due to error or fraud, and performing procedures that respond to those risks. Such procedures included examining, on a test basis, evidence supportingregarding the amounts and disclosures in the consolidated financial statements, assessingstatements. Our audits also included evaluating the accounting principles used and significant estimates made by management, andas well as evaluating the overall presentation of the consolidated financial statement presentation.statements. Our audit of internal control over financial reporting included obtaining an understanding of internal control over financial reporting, assessing the risk that a material weakness exists, and testing and evaluating the design and operating effectiveness of internal control based on the assessed risk. Our audits also included performing such other procedures as we considered necessary in the circumstances. We believe that our audits provide a reasonable basis for our opinions.
Definition and Limitations of Internal Control over Financial Reporting
A company’s internal control over financial reporting is a process designed to provide reasonable assurance regarding the reliability of financial reporting and the preparation of financial statements for external purposes in accordance with generally accepted accounting principles. A company’s internal control over financial reporting includes those policies and procedures that (i) pertain to the maintenance of records that, in reasonable detail, accurately and fairly reflect the transactions and dispositions of the assets of the company; (ii) provide reasonable assurance that transactions are recorded as necessary to permit preparation of financial statements in accordance with generally accepted accounting principles, and that receipts and expenditures of the company are being made only in accordance with authorizations of management and directors of the
company; and (iii) provide reasonable assurance regarding prevention or timely detection of unauthorized acquisition, use, or disposition of the company’s assets that could have a material effect on the financial statements.
Because of its inherent limitations, internal control over financial reporting may not prevent or detect misstatements. Also, projections of any evaluation of effectiveness to future periods are subject to the risk that controls may become inadequate because of changes in conditions, or that the degree of compliance with the policies or procedures may deteriorate.
Critical Audit Matters
The critical audit matter communicated below is a matter arising from the current period audit of the consolidated financial statements that was communicated or required to be communicated to the audit committee and that (i) relates to accounts or disclosures that are material to the consolidated financial statements and (ii) involved our especially challenging, subjective, or complex judgments. The communication of critical audit matters does not alter in any way our opinion on the consolidated financial statements, taken as a whole, and we are not, by communicating the critical audit matter below, providing a separate opinion on the critical audit matter or on the accounts or disclosures to which it relates.
Income Tax Reserve for the Uncertain Tax Position Related to Puerto Rico Manufacturing
As described in Notes 13 and 18 to the consolidated financial statements, management records reserves for uncertain tax positions related to unresolved matters with the Internal Revenue Service (IRS) and other taxing authorities. A remaining unresolved issue with the IRS, relates to the allocation of income between Medtronic, Inc. and its wholly-owned subsidiary operating in Puerto Rico, which is one of the Company's manufacturing sites. These reserves are subject to a high degree of estimation and management judgment. Total reserves relating to uncertain tax positions as of April 29, 2022 were $1.661 billion, of which the Puerto Rico manufacturing reserve makes up a significant portion.
The principal considerations for our determination that performing procedures relating to the income tax reserve for the uncertain tax position related to Puerto Rico manufacturing is a critical audit matter are the significant judgment by management when determining the reserve, including a high degree of estimation uncertainty relative to the unresolved issue with the IRS involving one of the Company’s manufacturing sites. This in turn led to a high degree of auditor judgment, effort, and subjectivity in performing procedures and evaluating audit evidence to support management’s accurate measurement of the income tax reserve for the uncertain tax position related to Puerto Rico manufacturing, as the nature of the evidence is often highly subjective.
Addressing the matter involved performing procedures and evaluating audit evidence in connection with forming our overall opinion on the consolidated financial statements. These procedures included testing the effectiveness of controls relating to the recognition of the income tax reserves for uncertain tax positions, as well as controls over measurement of the reserves. These procedures also included, among others (i) testing management’s process for determining the reserve for the uncertain tax position, (ii) evaluating the status and results of the related U. S. Tax Court case, and (iii) evaluating the consistency of the reserve calculation with the relevant documents related to the tax court case.
|
| |
| /s/ PricewaterhouseCoopers LLP |
|
| Minneapolis, Minnesota |
June 28, 201623, 2022 |
We have served as the Company’s auditor since 1963.
Medtronic plc
Consolidated Statements of Income
|
| | | | | | | | | | | | |
| | | Fiscal Year |
| (in millions, except per share data) | | 2016 | | 2015 | | 2014 |
| Net sales | | $ | 28,833 |
| | $ | 20,261 |
| | $ | 17,005 |
|
| | | | | | | |
| Costs and expenses: | | | | | | |
| Cost of products sold | | 9,142 |
| | 6,309 |
| | 4,333 |
|
| Research and development expense | | 2,224 |
| | 1,640 |
| | 1,477 |
|
| Selling, general, and administrative expense | | 9,469 |
| | 6,904 |
| | 5,847 |
|
| Special charges (gains), net | | 70 |
| | (38 | ) | | 40 |
|
| Restructuring charges, net | | 290 |
| | 237 |
| | 78 |
|
| Certain litigation charges, net | | 26 |
| | 42 |
| | 770 |
|
| Acquisition-related items | | 283 |
| | 550 |
| | 117 |
|
| Amortization of intangible assets | | 1,931 |
| | 733 |
| | 349 |
|
| Other expense, net | | 107 |
| | 118 |
| | 181 |
|
| Operating profit | | 5,291 |
| | 3,766 |
| | 3,813 |
|
| | | | | | | |
| Interest income | | (431 | ) | | (386 | ) | | (271 | ) |
| Interest expense | | 1,386 |
| | 666 |
| | 379 |
|
| Interest expense, net | | 955 |
| | 280 |
| | 108 |
|
| Income from operations before income taxes | | 4,336 |
| | 3,486 |
| | 3,705 |
|
| Provision for income taxes | | 798 |
| | 811 |
| | 640 |
|
| Net income | | $ | 3,538 |
| | $ | 2,675 |
| | $ | 3,065 |
|
| Basic earnings per share | | $ | 2.51 |
| | $ | 2.44 |
| | $ | 3.06 |
|
| Diluted earnings per share | | $ | 2.48 |
| | $ | 2.41 |
| | $ | 3.02 |
|
| Basic weighted average shares outstanding | | 1,409.6 |
| | 1,095.5 |
| | 1,002.1 |
|
| Diluted weighted average shares outstanding | | 1,425.9 |
| | 1,109.0 |
| | 1,013.6 |
|
| Cash dividends declared per ordinary share | | $ | 1.52 |
| | $ | 1.22 |
| | $ | 1.12 |
|
| | | | | | | | | | | | | | | | | |
| | Fiscal Year |
| (in millions, except per share data) | 2022 | | 2021 | | 2020 |
| Net sales | $ | 31,686 | | | $ | 30,117 | | | $ | 28,913 | |
| Costs and expenses: | | | | | |
| Cost of products sold, excluding amortization of intangible assets | 10,145 | | | 10,483 | | | 9,424 | |
| Research and development expense | 2,746 | | | 2,493 | | | 2,331 | |
| Selling, general, and administrative expense | 10,292 | | | 10,148 | | | 10,109 | |
| Amortization of intangible assets | 1,733 | | | 1,783 | | | 1,756 | |
| Restructuring charges, net | 60 | | | 293 | | | 118 | |
| Certain litigation charges | 95 | | | 118 | | | 313 | |
| Other operating expense, net | 862 | | | 315 | | | 71 | |
| Operating profit | 5,752 | | | 4,484 | | | 4,791 | |
| Other non-operating income, net | (318) | | | (336) | | | (356) | |
| Interest expense | 553 | | | 925 | | | 1,092 | |
| Income before income taxes | 5,517 | | | 3,895 | | | 4,055 | |
| Income tax provision (benefit) | 456 | | | 265 | | | (751) | |
| Net income | 5,062 | | | 3,630 | | | 4,806 | |
| Net income attributable to noncontrolling interests | (22) | | | (24) | | | (17) | |
| Net income attributable to Medtronic | $ | 5,039 | | | $ | 3,606 | | | $ | 4,789 | |
| Basic earnings per share | $ | 3.75 | | | $ | 2.68 | | | $ | 3.57 | |
| Diluted earnings per share | $ | 3.73 | | | $ | 2.66 | | | $ | 3.54 | |
| Basic weighted average shares outstanding | 1,342.4 | | | 1,344.9 | | | 1,340.7 | |
| Diluted weighted average shares outstanding | 1,351.4 | | | 1,354.0 | | | 1,351.1 | |
The accompanying notes are an integral part of these consolidated financial statements.
Medtronic plc
Consolidated Statements of Comprehensive Income
|
| | | | | | | | | | | | |
| | | Fiscal Year |
| (in millions) | | 2016 | | 2015 | | 2014 |
| Net income | | $ | 3,538 |
| | $ | 2,675 |
| | $ | 3,065 |
|
| | | | | | | |
| Other comprehensive loss, net of tax: | | |
| | |
| | |
|
| Unrealized (loss) gain on available-for-sale securities, net of tax (benefit) expense of $(102), $11, and $(58), respectively | | (121 | ) | | 20 |
| | (103 | ) |
| Translation adjustment | | (197 | ) | | (495 | ) | | 13 |
|
| Net change in retirement obligations, net of tax (benefit) expense of $(46), $(173), and $72, respectively | | (66 | ) | | (366 | ) | | 87 |
|
| Unrealized (loss) gain on derivatives, net of tax (benefit) expense of $(172), $146, and $(60), respectively | | (300 | ) | | 254 |
| | (102 | ) |
| Other comprehensive loss, net of tax | | (684 | ) | | (587 | ) | | (105 | ) |
| Comprehensive income | | $ | 2,854 |
| | $ | 2,088 |
| | $ | 2,960 |
|
| | | | | | | | | | | | | | | | | |
| | Fiscal Year |
| (in millions) | 2022 | | 2021 | | 2020 |
| Net income | $ | 5,062 | | | $ | 3,630 | | | $ | 4,806 | |
| | | | | |
| Other comprehensive income (loss), net of tax: | | | | | |
| Unrealized (loss) gain on investment securities | (301) | | | 92 | | | 45 | |
| Translation adjustment | (2,086) | | | 1,699 | | | (829) | |
| Net investment hedge | 2,299 | | | (1,694) | | | 405 | |
| Net change in retirement obligations | 574 | | | 505 | | | (544) | |
| Unrealized (loss) gain on cash flow hedges | 727 | | | (519) | | | 72 | |
| Other comprehensive income (loss) | 1,213 | | | 83 | | | (851) | |
| Comprehensive income including noncontrolling interests | 6,274 | | | 3,713 | | | 3,955 | |
| Comprehensive income attributable to noncontrolling interests | (16) | | | (32) | | | (15) | |
| Comprehensive income attributable to Medtronic | $ | 6,258 | | | $ | 3,681 | | | $ | 3,940 | |
The accompanying notes are an integral part of these consolidated financial statements.
Medtronic plc
Consolidated Balance Sheets
|
| | | | | | | | |
| (in millions, except per share data) | | April 29,
2016 | | April 24,
2015 |
| ASSETS | | | | |
| Current assets: | | | | |
| Cash and cash equivalents | | $ | 2,876 |
| | $ | 4,843 |
|
| Investments | | 9,758 |
| | 14,637 |
|
| Accounts receivable, less allowances of $161 and $144, respectively | | 5,562 |
| | 5,112 |
|
| Inventories | | 3,473 |
| | 3,463 |
|
| Tax assets | | 697 |
| | 1,335 |
|
| Prepaid expenses and other current assets | | 1,234 |
| | 1,454 |
|
| Total current assets | | 23,600 |
| | 30,844 |
|
| Property, plant, and equipment, net | | 4,841 |
| | 4,699 |
|
| Goodwill | | 41,500 |
| | 40,530 |
|
| Other intangible assets, net | | 26,899 |
| | 28,101 |
|
| Long-term tax assets | | 1,383 |
| | 774 |
|
| Other assets | | 1,559 |
| | 1,737 |
|
| Total assets | | $ | 99,782 |
| | $ | 106,685 |
|
| LIABILITIES AND SHAREHOLDERS’ EQUITY | | | | |
| Current liabilities: | | | | |
| Short-term borrowings | | $ | 993 |
| | $ | 2,434 |
|
| Accounts payable | | 1,709 |
| | 1,610 |
|
| Accrued compensation | | 1,712 |
| | 1,611 |
|
| Accrued income taxes | | 566 |
| | 935 |
|
| Deferred tax liabilities | | — |
| | 119 |
|
| Other accrued expenses | | 2,185 |
| | 2,464 |
|
| Total current liabilities | | 7,165 |
| | 9,173 |
|
| Long-term debt | | 30,247 |
| | 33,752 |
|
| Long-term accrued compensation and retirement benefits | | 1,759 |
| | 1,535 |
|
| Long-term accrued income taxes | | 2,903 |
| | 2,476 |
|
| Long-term deferred tax liabilities | | 3,729 |
| | 4,700 |
|
| Other long-term liabilities | | 1,916 |
| | 1,819 |
|
| Total liabilities | | 47,719 |
| | 53,455 |
|
| Commitments and contingencies (Notes 2, 13, and 15) | |
| |
|
| Shareholders’ equity: | | | | |
| Ordinary shares— par value $0.0001, 2.6 billion shares authorized, 1,399,018,022 and 1,421,648,005 shares issued and outstanding, respectively | | — |
| | — |
|
| Retained earnings | | 53,931 |
| | 54,414 |
|
| Accumulated other comprehensive (loss) income | | (1,868 | ) | | (1,184 | ) |
| Total shareholders’ equity | | 52,063 |
| | 53,230 |
|
| Total liabilities and shareholders’ equity | | $ | 99,782 |
| | $ | 106,685 |
|
| | | | | | | | | | | | | | |
| (in millions) | | April 29, 2022 | | April 30, 2021 |
| ASSETS | | | | |
| Current assets: | | | | |
| Cash and cash equivalents | | $ | 3,714 | | | $ | 3,593 | |
| Investments | | 6,859 | | | 7,224 | |
| Accounts receivable, less allowances and credit losses of $230 and $241, respectively | | 5,551 | | | 5,462 | |
| Inventories, net | | 4,616 | | | 4,313 | |
| Other current assets | | 2,318 | | | 1,955 | |
| Total current assets | | 23,059 | | | 22,548 | |
| Property, plant, and equipment, net | | 5,413 | | | 5,221 | |
| Goodwill | | 40,502 | | | 41,961 | |
| Other intangible assets, net | | 15,595 | | | 17,740 | |
| Tax assets | | 3,403 | | | 3,169 | |
| Other assets | | 3,008 | | | 2,443 | |
| Total assets | | $ | 90,981 | | | $ | 93,083 | |
| LIABILITIES AND EQUITY | | | | |
| Current liabilities: | | | | |
| Current debt obligations | | $ | 3,742 | | | $ | 11 | |
| Accounts payable | | 2,276 | | | 2,106 | |
| Accrued compensation | | 2,121 | | | 2,482 | |
| Accrued income taxes | | 704 | | | 435 | |
| Other accrued expenses | | 3,551 | | | 3,475 | |
| Total current liabilities | | 12,394 | | | 8,509 | |
| Long-term debt | | 20,372 | | | 26,378 | |
| Accrued compensation and retirement benefits | | 1,113 | | | 1,557 | |
| Accrued income taxes | | 2,087 | | | 2,251 | |
| Deferred tax liabilities | | 884 | | | 1,028 | |
| Other liabilities | | 1,410 | | | 1,756 | |
| Total liabilities | | 38,260 | | | 41,481 | |
| Commitments and contingencies (Notes 3, 16, and 18) | | 0 | | 0 |
| Shareholders’ equity: | | | | |
| Ordinary shares— par value $0.0001, 2.6 billion shares authorized, 1,330,743,395 and 1,345,400,671 shares issued and outstanding, respectively | | — | | | — | |
| Additional paid-in capital | | 24,566 | | | 26,319 | |
| Retained earnings | | 30,250 | | | 28,594 | |
| Accumulated other comprehensive loss | | (2,265) | | | (3,485) | |
| Total shareholders’ equity | | 52,551 | | | 51,428 | |
| Noncontrolling interests | | 171 | | | 174 | |
| Total equity | | 52,722 | | | 51,602 | |
| Total liabilities and equity | | $ | 90,981 | | | $ | 93,083 | |
The accompanying notes are an integral part of these consolidated financial statements.
Medtronic plc
Consolidated Statements of Shareholders’ Equity | | | | | | | | | | | | | | | | | | | | | | | | | | | | | | | | | | | | | | | | | | | | | | | | | | |
| | Ordinary Shares | | Additional Paid-in Capital | | Retained
Earnings | | Accumulated
Other
Comprehensive
Loss | | Total
Shareholders’
Equity | | Noncontrolling Interests | | Total Equity |
| (in millions, except per share data) | | Number | | Par Value | | | | | | |
| April 26, 2019 | | 1,341 | | | $ | — | | | $ | 26,532 | | | $ | 26,270 | | | $ | (2,711) | | | $ | 50,091 | | | $ | 121 | | | $ | 50,212 | |
| Net income | | — | | | — | | | — | | | 4,789 | | | — | | | 4,789 | | | 17 | | | 4,806 | |
| Other comprehensive loss | | — | | | — | | | — | | | — | | | (849) | | | (849) | | | (2) | | | (851) | |
| Dividends to shareholders ($2.16 per ordinary share) | | — | | | — | | | — | | | (2,894) | | | — | | | (2,894) | | | — | | | (2,894) | |
| Issuance of shares under stock purchase and award plans | | 12 | | | — | | | 564 | | | — | | | — | | | 564 | | | — | | | 564 | |
| Repurchase of ordinary shares | | (12) | | | — | | | (1,228) | | | — | | | — | | | (1,228) | | | — | | | (1,228) | |
| Stock-based compensation | | — | | | — | | | 297 | | | — | | | — | | | 297 | | | — | | | 297 | |
| Changes to noncontrolling ownership interests | | — | | | — | | | — | | | — | | | — | | | — | | | (1) | | | (1) | |
Cumulative effect of change in accounting principle(1) | | — | | | — | | | — | | | (33) | | | — | | | (33) | | | — | | | (33) | |
| April 24, 2020 | | 1,341 | | | $ | — | | | $ | 26,165 | | | $ | 28,132 | | | $ | (3,560) | | | $ | 50,737 | | | $ | 135 | | | $ | 50,872 | |
| Net income | | — | | | — | | | — | | | 3,606 | | | — | | | 3,606 | | | 24 | | | 3,630 | |
| Other comprehensive income | | — | | | — | | | — | | | — | | | 75 | | | 75 | | | 8 | | | 83 | |
| Dividends to shareholders ($2.32 per ordinary share) | | — | | | — | | | — | | | (3,120) | | | — | | | (3,120) | | | — | | | (3,120) | |
| Issuance of shares under stock purchase and award plans | | 8 | | | — | | | 382 | | | — | | | — | | | 382 | | | — | | | 382 | |
| Repurchase of ordinary shares | | (4) | | | — | | | (559) | | | — | | | — | | | (559) | | | — | | | (559) | |
| Stock-based compensation | | — | | | — | | | 344 | | | — | | | — | | | 344 | | | — | | | 344 | |
| Changes to noncontrolling ownership interests | | — | | | — | | | (13) | | | — | | | — | | | (13) | | | 7 | | | (6) | |
Cumulative effect of change in accounting principle(1) | | — | | | — | | | — | | | (24) | | | — | | | (24) | | | — | | | (24) | |
| April 30, 2021 | | 1,345 | | | $ | — | | | $ | 26,319 | | | $ | 28,594 | | | $ | (3,485) | | | $ | 51,428 | | | $ | 174 | | | $ | 51,602 | |
| Net income | | — | | | — | | | — | | | 5,039 | | | — | | | 5,039 | | | 22 | | | 5,062 | |
| Other comprehensive income | | — | | | — | | | — | | | — | | | 1,219 | | | 1,219 | | | (6) | | | 1,213 | |
| Dividends to shareholders ($2.52 per ordinary share) | | — | | | — | | | — | | | (3,383) | | | — | | | (3,383) | | | — | | | (3,383) | |
| Issuance of shares under stock purchase and award plans | | 7 | | | — | | | 329 | | | — | | | — | | | 329 | | | — | | | 329 | |
| Repurchase of ordinary shares | | (21) | | | — | | | (2,442) | | | — | | | — | | | (2,442) | | | — | | | (2,442) | |
| Stock-based compensation | | — | | | — | | | 359 | | | — | | | — | | | 359 | | | — | | | 359 | |
| Changes to noncontrolling ownership interests | | — | | | — | | | 1 | | | — | | | — | | | 1 | | | (19) | | | (18) | |
| April 29, 2022 | | 1,331 | | | $ | — | | | $ | 24,566 | | | $ | 30,250 | | | $ | (2,265) | | | $ | 52,551 | | | $ | 171 | | | $ | 52,722 | |
|
| | | | | | | | | | | | | | | | | | | |
| | | Ordinary Shares | | Retained Earnings | | Accumulated Other Comprehensive Loss | | Total Shareholders’ Equity |
| (in millions) | | Number | | Par Value | | | |
| Balance as of April 26, 2013 | | 1,016 |
| | $ | 102 |
| | $ | 19,061 |
| | $ | (492 | ) | | $ | 18,671 |
|
| Net income | | — |
| | — |
| | 3,065 |
| | — |
| | 3,065 |
|
| Other comprehensive loss | | — |
| | — |
| | — |
| | (105 | ) | | (105 | ) |
| Dividends to shareholders | | — |
| | — |
| | (1,116 | ) | | — |
| | (1,116 | ) |
| Issuance of shares under stock purchase and award plans | | 31 |
| | 3 |
| | 1,304 |
| | — |
| | 1,307 |
|
| Repurchase of ordinary shares | | (48 | ) | | (5 | ) | | (2,548 | ) | | — |
| | (2,553 | ) |
| Tax benefit from exercise of stock-based awards | | — |
| | — |
| | 29 |
| | — |
| | 29 |
|
| Stock-based compensation | | — |
| | — |
| | 145 |
| | — |
| | 145 |
|
| Balance as of April 25, 2014 | | 999 |
| | $ | 100 |
| | $ | 19,940 |
| | $ | (597 | ) | | $ | 19,443 |
|
| Net income | | — |
| | — |
| | 2,675 |
| | — |
| | 2,675 |
|
| Other comprehensive loss | | — |
| | — |
| | — |
| | (587 | ) | | (587 | ) |
| Ordinary shares issued in connection with the Covidien plc acquisition, net of taxes | | 436 |
| | — |
| | 33,787 |
| | — |
| | 33,787 |
|
| Result of contribution of Medtronic, Inc. to Medtronic plc | | — |
| | (99 | ) | | 99 |
| | — |
| | — |
|
| Dividends to shareholders | | — |
| | — |
| | (1,337 | ) | | — |
| | (1,337 | ) |
| Issuance of shares under stock purchase and award plans | | 17 |
| | 2 |
| | 647 |
| | — |
| | 649 |
|
| Repurchase of ordinary shares | | (30 | ) | | (3 | ) | | (1,917 | ) | | — |
| | (1,920 | ) |
| Tax benefit from exercise of stock-based awards | | — |
| | — |
| | 81 |
| | — |
| | 81 |
|
| Stock-based compensation | |
|
| | — |
| | 439 |
| | — |
| | 439 |
|
| Balance as of April 24, 2015 | | 1,422 |
| | $ | — |
| | $ | 54,414 |
| | $ | (1,184 | ) | | $ | 53,230 |
|
| Net income | | — |
| | — |
| | 3,538 |
| | — |
| | 3,538 |
|
| Other comprehensive loss | | — |
| | — |
| | — |
| | (684 | ) | | (684 | ) |
| Dividends to shareholders | | — |
| | — |
| | (2,139 | ) | | — |
| | (2,139 | ) |
| Issuance of shares under stock purchase and award plans | | 15 |
| | — |
| | 491 |
| | — |
| | 491 |
|
| Repurchase of ordinary shares | | (38 | ) | | — |
| | (2,830 | ) | | — |
| | (2,830 | ) |
| Tax benefit from exercise of stock-based awards | | — |
| | — |
| | 82 |
| | — |
| | 82 |
|
| Stock-based compensation | | — |
| | — |
| | 375 |
| | — |
| | 375 |
|
| Balance as of April 29, 2016 | | 1,399 |
| | $ | — |
| | $ | 53,931 |
| | $ | (1,868 | ) | | $ | 52,063 |
|
The accompanying notes are an integral part of these consolidated financial statements.
Medtronic plc
Consolidated Statements of Cash Flows
|
| | | | | | | | | | | | |
| | | Fiscal Year |
| (in millions) | | 2016 | | 2015 | | 2014 |
| Operating Activities: | | | | | | |
| Net income | | $ | 3,538 |
| | $ | 2,675 |
| | $ | 3,065 |
|
| Adjustments to reconcile net income to net cash provided by operating activities: | | | | | | |
| Depreciation and amortization | | 2,820 |
| | 1,306 |
| | 850 |
|
| Amortization of debt discount and issuance costs | | 29 |
| | 76 |
| | 8 |
|
| Acquisition-related items | | 218 |
| | 634 |
| | 110 |
|
| Provision for doubtful accounts | | 49 |
| | 35 |
| | 43 |
|
| Deferred income taxes | | (460 | ) | | (926 | ) | | (207 | ) |
| Stock-based compensation | | 375 |
| | 439 |
| | 145 |
|
| Loss on debt extinguishment | | 163 |
| | — |
| | — |
|
| Other, net | | (111 | ) | | (134 | ) | | (28 | ) |
| Change in operating assets and liabilities, net of acquisitions: | | | | | | |
| Accounts receivable, net | | (435 | ) | | (413 | ) | | (70 | ) |
| Inventories | | (186 | ) | | (282 | ) | | (39 | ) |
| Accounts payable and accrued liabilities | | (65 | ) | | 1,616 |
| | (117 | ) |
| Other operating assets and liabilities | | (403 | ) | | 643 |
| | 444 |
|
| Certain litigation charges, net | | 26 |
| | 42 |
| | 770 |
|
| Certain litigation payments | | (340 | ) | | (809 | ) | | (15 | ) |
| Net cash provided by operating activities | | 5,218 |
| | 4,902 |
| | 4,959 |
|
| Investing Activities: | | | | | | |
| Acquisitions, net of cash acquired | | (1,213 | ) | | (14,884 | ) | | (385 | ) |
| Additions to property, plant, and equipment | | (1,046 | ) | | (571 | ) | | (396 | ) |
| Purchases of marketable securities | | (5,406 | ) | | (7,582 | ) | | (10,895 | ) |
| Sales and maturities of marketable securities | | 9,924 |
| | 5,890 |
| | 8,111 |
|
| Other investing activities, net | | (14 | ) | | 89 |
| | (29 | ) |
| Net cash provided by (used in) investing activities | | 2,245 |
| | (17,058 | ) | | (3,594 | ) |
| Financing Activities: | | | | | | |
| Acquisition-related contingent consideration | | (22 | ) | | (85 | ) | | (1 | ) |
| Change in short-term borrowings, net | | 7 |
| | (1 | ) | | 127 |
|
| Repayment of short-term borrowings (maturities greater than 90 days) | | (139 | ) | | (150 | ) | | (1,301 | ) |
| Proceeds from short-term borrowings (maturities greater than 90 days) | | 139 |
| | 150 |
| | 1,176 |
|
| Issuance of long-term debt | | — |
| | 19,942 |
| | 1,994 |
|
| Payments on long-term debt | | (5,132 | ) | | (1,268 | ) | | (565 | ) |
| Dividends to shareholders | | (2,139 | ) | | (1,337 | ) | | (1,116 | ) |
| Issuance of ordinary shares | | 491 |
| | 649 |
| | 1,307 |
|
| Repurchase of ordinary shares | | (2,830 | ) | | (1,920 | ) | | (2,553 | ) |
| Other financing activities | | 82 |
| | (31 | ) | | 14 |
|
| Net cash (used in) provided by financing activities | | (9,543 | ) | | 15,949 |
| | (918 | ) |
| Effect of exchange rate changes on cash and cash equivalents | | 113 |
| | (353 | ) | | 37 |
|
| Net change in cash and cash equivalents | | (1,967 | ) | | 3,440 |
| | 484 |
|
| Cash and cash equivalents at beginning of period | | 4,843 |
| | 1,403 |
| | 919 |
|
| Cash and cash equivalents at end of period | | $ | 2,876 |
| | $ | 4,843 |
| | $ | 1,403 |
|
| Supplemental Cash Flow Information | | | | | | |
| Cash paid for: | | | | | | |
| Income taxes | | $ | 1,379 |
| | $ | 632 |
| | $ | 521 |
|
| Interest | | 1,266 |
| | 578 |
| | 394 |
|
| | | | | | | | | | | | | | | | | |
| | Fiscal Year |
| (in millions) | 2022 | | 2021 | | 2020 |
| Operating Activities: | | | | | |
| Net income | $ | 5,062 | | | $ | 3,630 | | | $ | 4,806 | |
| Adjustments to reconcile net income to net cash provided by operating activities: | | | | | |
| Depreciation and amortization | 2,707 | | | 2,702 | | | 2,663 | |
| Provision for credit losses | 58 | | | 128 | | | 99 | |
| Deferred income taxes | (604) | | | (422) | | | (1,315) | |
| Stock-based compensation | 359 | | | 344 | | | 297 | |
| Loss on debt extinguishment | — | | | 308 | | | 406 | |
| | | | | |
| Asset impairment charges | 515 | | | — | | | — | |
| | | | | |
| Other, net | 138 | | | 251 | | | 217 | |
| Change in operating assets and liabilities, net of acquisitions and divestitures: | | | | | |
| Accounts receivable, net | (477) | | | (761) | | | 1,291 | |
| Inventories, net | (560) | | | 78 | | | (577) | |
| Accounts payable and accrued liabilities | 213 | | | 531 | | | (44) | |
| Other operating assets and liabilities | (65) | | | (549) | | | (609) | |
| Net cash provided by operating activities | 7,346 | | | 6,240 | | | 7,234 | |
| Investing Activities: | | | | | |
| Acquisitions, net of cash acquired | (91) | | | (994) | | | (488) | |
| | | | | |
| Additions to property, plant, and equipment | (1,368) | | | (1,355) | | | (1,213) | |
| Purchases of investments | (9,882) | | | (11,808) | | | (11,039) | |
| Sales and maturities of investments | 9,692 | | | 11,345 | | | 9,574 | |
| Other investing activities, net | (10) | | | (54) | | | (37) | |
| Net cash used in investing activities | (1,659) | | | (2,866) | | | (3,203) | |
| Financing Activities: | | | | | |
| Change in current debt obligations, net | — | | | (311) | | | (17) | |
| Proceeds from short-term borrowings (maturities greater than 90 days) | — | | | 2,789 | | | — | |
| Repayments from short-term borrowings (maturities greater than 90 days) | — | | | (2,853) | | | — | |
| Issuance of long-term debt | — | | | 7,172 | | | 5,568 | |
| Payments on long-term debt | (1) | | | (7,367) | | | (6,110) | |
| Dividends to shareholders | (3,383) | | | (3,120) | | | (2,894) | |
| Issuance of ordinary shares | 429 | | | 474 | | | 662 | |
| Repurchase of ordinary shares | (2,544) | | | (652) | | | (1,326) | |
| Other financing activities | 163 | | | (268) | | | (81) | |
| Net cash used in financing activities | (5,336) | | | (4,136) | | | (4,198) | |
| Effect of exchange rate changes on cash and cash equivalents | (231) | | | 215 | | | (86) | |
| Net change in cash and cash equivalents | 121 | | | (547) | | | (253) | |
| Cash and cash equivalents at beginning of period | 3,593 | | | 4,140 | | | 4,393 | |
| Cash and cash equivalents at end of period | $ | 3,714 | | | $ | 3,593 | | | $ | 4,140 | |
| Supplemental Cash Flow Information | | | | | |
| Cash paid for: | | | | | |
| Income taxes | $ | 996 | | | $ | 1,250 | | | $ | 878 | |
| Interest | 540 | | | 582 | | | 643 | |
The accompanying notes are an integral part of these consolidated financial statements.
Medtronic plc
Notes to Consolidated Financial Statements (Continued)
1. Summary of Significant Accounting Policies
Nature of Operations Medtronic plc (Medtronic or the Company) is the leading global leader in medicalhealthcare technology –company– alleviating pain, restoring health, and extending life for millions of people around the world. The Company provides innovative products and therapies to serve hospitals,healthcare systems, physicians, clinicians, and patients. Medtronic was founded in 1949 and is headquartered in Dublin, Ireland. Medtronic plc is the successor registrant to Medtronic, Inc.
Principles of Consolidation The consolidated financial statements include the accounts of Medtronic plc, its wholly-owned subsidiaries, entities for which the Company has a controlling financial interest, and its consolidated subsidiaries. All significant intercompanyvariable interest entities for which the Company is the primary beneficiary. Intercompany transactions and accountsbalances have been eliminated.fully eliminated in consolidation. Certain reclassifications have been made to prior year financial statements to conform to classifications used in the current year. Amounts reported in millions within this annual report are computed based on the amounts in thousands, and therefore, the sum of the components may not equal the total amount reported in millions due to rounding. Additionally, certain columns and rows within tables may not sum due to rounding.
Use of Estimates The preparation of the consolidated financial statements in conformity with accounting principles generally accepted accounting principles in the United States (U.S.) (U.S. GAAP) requires management to make estimates and assumptions that affect the amounts reported amount of assets and liabilities, contingencies, and revenues and expenses in the consolidated financial statements and accompanying notes, sales discounts, rebates, allowances and incentives, warranty obligations,notes. Estimates are used when accounting for items such as income tax reserves, depreciation, amortization, employee benefits,taxes, contingencies, and intangible asset, and liability valuations. Actual results may or may not differ from those estimates.
COVID-19 has had, and may continue to have, an adverse effect on our business, results of operations, financial condition, and cash flows, and its future impacts remain uncertain and unpredictable. The Company has considered the disruptions caused by COVID-19 and has assessed the potential impact on certain accounting estimates including, but not limited to, the allowance for doubtful accounts, inventory reserves, return reserves, the valuation of goodwill, intangible assets, other long-lived assets, investments and contingent consideration, as of April 29, 2022 and through the date of this report. There was not a material impact to accounting estimates associated with the Company’s consolidated financial statements as of and for each of the three fiscal years ended April 29, 2022, April 30, 2021, and April 24, 2020.
Fiscal Year-End The Company utilizes a 52/53-week fiscal year, ending the last Friday in April. The Company’sApril, for the presentation of its consolidated financial statements and related notes thereto at April 29, 2022 and April 30, 2021 and for each of the three fiscal years 2016ended April 29, 2022 (fiscal year 2022), 2015April 30, 2021 (fiscal year 2021), and 2014 ended on April 29, 2016, April 24, 2015, and April 25, 2014, respectively.2020 (fiscal year 2020). Fiscal year 20162021 was a 53-week year, with the additionalextra week occurringhaving occurred in the first fiscal month of the first quarter. Fiscal years 2015 and 2014 were 52-week years.
Cash Equivalents The Company considers highly liquid investments with maturities of three months or less from the date of purchase to be cash equivalents. These investments are carried at cost, which approximates fair value.
Investments InvestmentsThe Company invests in marketable debt and equity securities, investments that do not have readily determinable fair values, and certaininvestments accounted for under the equity method.
Marketable debt securities are classified and accounted for as available-for-sale. Debt securities include corporate debt securities, government and agency securities, certificates of deposit, mortgage-backed securities, other asset-backed securities, debt funds, and auction rate securities. These investments are recorded at fair value in the consolidated balance sheets. The change in fair value for available-for-sale securities is recorded, net of taxes, as a component of accumulated other comprehensive (loss) incomeloss on the consolidated balance sheets. ManagementThe Company determines the appropriate classification of its investments in marketable debt and equity securities at the time of purchase and reevaluates such determinations at each balance sheet date. The classification of marketable debt securities as current or long-term is based on the nature of the securities and theirthe availability for use in current operations consistent with how the Company managesCompany's management of its capital structure and liquidity.
Investments in securities that are classified and accounted for as trading securities primarily include exchange-traded funds and are recorded at fair value on the consolidated balance sheets. The Company seeks to offset changes in liabilities related to equity and other market risks of certain deferred compensation arrangements. The change in fair value for trading securities is recorded as a component of interest expense, net on the consolidated statements of income.
Certain of the Company’s investments in marketable equity securities and other securities are long-term, strategic investments in companies that are in variedvarious stages of development. These investmentsdevelopment and are included in other assets on the consolidated balance sheets. The Company accounts for these investments under the cost or theMarketable equity method of accounting, as appropriate. Certain of these investmentssecurities are publicly traded companies and are therefore accounted for as available for sale. The valuation of equity and other securities accounted for under the cost method considers all available financial information related to the investee, including valuations based on recent third-party equity investmentsrecorded at fair value in the investee. If an unrealized loss for any investmentconsolidated balance sheets. The change in fair value of marketable equity securities is considered to be other-than-temporary, the loss is recognized within other non-operating income, net in the consolidated statements of income in theincome. At each reporting period, the determinationCompany makes a qualitative assessment considering impairment indicators to evaluate whether the investment is made.impaired. Equity securities accounted for under the equity method are initially recorded at the amount of the Company’s investment and are adjusted each period for the Company’s share of the investee’s income or loss and dividends paid. Equity securitiesSecurities accounted for under both the cost and equity methodsmethod are reviewed quarterly for changes in circumstance or the occurrence of events that suggest other than temporary impairment has occurred.
Accounts Receivable and Allowance for Doubtful Accounts and Credit Losses The Company grants credit to customers in the Company’s investment may not be recoverable. See Note 5normal course of business and maintains an allowance for discussiondoubtful accounts for potential credit losses. When evaluating allowances for doubtful accounts, the Company considers various factors, including historical experience and customer-specific information. Uncollectible accounts are written-off against the allowance when it is deemed that a customer account is uncollectible.
Medtronic plc
Notes to Consolidated Financial Statements (Continued)
Inventories Inventories are stated at the lower of cost or market,net realizable value, with cost determined on a first-in, first-out basis. The Company reduces the carrying value of inventories for those items that are potentially excess, obsolete, or slow-moving based on changes in customer demand, technology developments, or other economic factors. Inventory balances are as follows:
Medtronic plc
Notes to Consolidated Financial Statements (Continued)
|
| | | | | | | |
| (in millions) | April 29,
2016 | | April 24,
2015 |
| Finished goods | $ | 2,242 |
| | $ | 2,268 |
|
| Work in-process | 499 |
| | 509 |
|
| Raw materials | 732 |
| | 686 |
|
| Total | $ | 3,473 |
| | $ | 3,463 |
|
Property, Plant, and Equipment Property, plant, and equipment is stated at cost.cost and depreciated over the useful lives of the assets using the straight-line method. Additions and improvements that extend the lives of the assets are capitalized, while expenditures for repairs and maintenance are expensed as incurred. The Company assesses property, plant, and equipment for impairment whenever events or changes in circumstances indicate that the carrying amount of property, plant, and equipment assetsasset groupings may not be recoverable. DepreciationThe cost of interest that is providedincurred in connection with significant ongoing construction projects is capitalized using the straight-line method over the estimated useful lives of the various assets. Depreciation expense of $889 million, $573 million, and $501 million was recognizeda weighted average interest rate. These costs are included in fiscal years 2016, 2015, and 2014, respectively.
Property,property, plant, and equipment balances and corresponding livesamortized over the useful life of the related asset. Upon retirement or disposal of property, plant, and equipment, the costs and related amounts of accumulated depreciation or amortization are as follows:eliminated from the asset and accumulated depreciation accounts. The difference, if any, between the net asset value and the proceeds, is recognized in earnings.
|
| | | | | | | | | | |
| (in millions) | April 29,
2016 | | April 24,
2015 | | Lives
(in years) |
| Land and land improvements | $ | 215 |
| | $ | 217 |
| | Up to 20 |
|
| Buildings and leasehold improvements | 2,394 |
| | 2,314 |
| | Up to 40 |
|
| Equipment | 6,328 |
| | 5,649 |
| | Generally 3-7, up to 15 |
|
| Construction in progress | 777 |
| | 683 |
| | — |
|
| Subtotal | 9,714 |
| | 8,863 |
| | |
|
| Less: Accumulated depreciation | (4,873 | ) | | (4,164 | ) | | |
|
| Property, plant, and equipment, net | $ | 4,841 |
| | $ | 4,699 |
| | |
|
Goodwill and Intangible Assets Goodwill is the excess of the purchase price over the estimated fair value of net assets of acquired businesses. In accordance with U.S. GAAP, goodwill is not amortized. The Company assesses thegoodwill for impairment of goodwill annually in the third quarter of the fiscal year and whenever an event occurs or circumstances change that would indicate the carrying amount may be impaired. Impairment testing for goodwill is doneperformed at a reporting unit level. The test for impairment of goodwill requires the Company to make several estimates related to projected future cash flows to determine the fair value of the goodwill reporting units. The Company calculates the excess of each reporting unit's fair value over its carrying amount, including goodwill, utilizing a discounted cash flow analysis. Internal operational budgets and long-range strategic plans are used as a basis for the cash flow analysis. The Company also utilizes assumptions for working capital, capital expenditures, and terminal growth rates. The discount rate applied to the cash flow analysis is based on the weighted average cost of capital (“WACC”) for each reporting unit. An impairment loss is recognized when the carrying amount of the reporting unit’s net assets exceeds the estimated fair value of the reporting unit. The estimated fair value is determined using a discounted future cash flow analysis.
Intangible assets include patents, trademarks, tradenames, customer relationships, purchased technology, and in-process research and development (IPR&D). Intangible assets with a definite life are amortized on a straight-line basis with estimated useful lives typically ranging from three to 20 years.years. Amortization is recognized within amortization of intangible assets in the consolidated statements of income. Intangible assets with a definite life are tested for impairment whenever events or changes in circumstances indicate that the carrying amount of an intangible asset (asset group) may not be recoverable. When events or changes in circumstances indicate that the carrying amount of an intangible asset may not be recoverable, the Company calculates the excess of an intangible asset's carrying value over its undiscounted future cash flows. If the carrying value is not recoverable, an impairment is recognized based on the amount by which the carrying value exceeds the fair value. The fair value of an intangible asset (asset group) is estimated by utilizing a discounted cash flow analysis.
Acquired IPR&D represents the fair value assigned to those research and development projects that were acquired in a business combination for which the related products have not received regulatory approval and have no alternative future use. IPR&D is capitalized at its fair value as an indefinite-lived intangible asset, and any development costs incurred after the acquisition are expensed as incurred. The fair value of IPR&D is determined by estimating the future cash flows of each project and discounting the net cash flows back to their present values. Upon achieving regulatory approval or commercial viability for the related product, the indefinite-lived intangible asset is accounted for as a definite-lived asset and is amortized on a straight-line basis over the estimated useful life. If the project is not completed or is terminated or abandoned, the Company may have an impairment related to the IPR&D, which is charged to expense. Indefinite-lived intangible assets are tested for impairment annually in the third quarter of the fiscal year and whenever events or changes in circumstances indicate that the carrying amount may be impaired. Impairment is calculated as the excess of the asset’s carrying value over its fair value. Fair value is generally determined using a discounted future cash flow analysis.
IPR&D represents the fair value of those research and development (R&D) projects for which the related products have not received regulatory approval and havewith no alternative future use. IPR&Duse acquired inoutside of a business combination is initially capitalized at its fair value as an indefinite-lived intangible asset. Determining the fair value of IPR&D requires the Company to make significant estimates. The fair value of IPR&D is determined by estimating the future cash flows of each R&D project or technology and discounting the net cash flows back to their present values. The discount rate used is determined at the time of measurement in accordance with accepted valuation methodologies. IPR&D has an indefinite life and is not amortized until regulatory approval is received and the product is launched, at which time the IPR&D becomes an amortizable asset.expensed immediately.
At the time of acquisition, the Company expects that all acquired IPR&D will reach technological feasibility, but there can be no assurance that the commercial viability of these products will actually be achieved. The natureContingent Consideration Certain of the efforts to developCompany’s business combinations involve potential payment of future consideration that is contingent upon the achievement of certain product development milestones and/or contingent on the acquired technologies into commercially viable products consists principally of planning, designing, and conducting clinical trials necessary to obtain regulatory approvals. The risks associated with achieving commercialization include, but are not limited to, delays or failure to obtain regulatory approvals to conduct clinical trials, delays or failure to obtain required market clearances, or delays or issues with patent issuance, validity, and litigation. If commercial viability were not achieved, the Company would likely look to
Medtronic plc
Notes to Consolidated Financial Statements (Continued)
other alternatives to provide these therapies. If the related R&D project is not completed in a timely manner or the R&D project is terminated or abandoned, the Company may have an impairment related to the IPR&D, calculated as the excess of the asset’s carrying value over its fair value.
Contingent Consideration business reaching certain performance milestones. The Company recognizesrecords contingent consideration at fair value at the date of acquisition based on the consideration expected to be transferred, estimated as the probability-weighted future cash flows, discounted back to present value. The fair value of contingent consideration is measured using projected payment dates, discount rates, probabilities of payment, and projected revenues (for revenue-based considerations). Projected revenues are based on the Company’s most recent internal operational budgets and long-range strategic plans. The discount rate used is determined at the time of measurement in accordance with accepted valuation methodologies. TheChanges in projected revenues, probabilities of payment, discount rates, and projected payment dates may result in adjustments to the fair value of the contingentmeasurements. Contingent consideration is remeasured each reporting period withusing Level 3 inputs, and the change in fair value, including accretion for the passage of time, is recognized as income or expense within acquisition-related itemsother operating expense, net in the consolidated statements of income. Contingent consideration payments made soon after the acquisition date are classified as investing activities in the
Derivatives U.S. GAAP requires companies
Medtronic plc
Notes to recognize all derivatives as assets and liabilities onConsolidated Financial Statements (Continued)
consolidated statements of cash flows. Contingent consideration payments not made soon after the balance sheet andacquisition date that are related to measure the instruments atacquisition date fair value through earnings unlessare reported as financing activities in the derivative qualifies for hedge accounting. If the derivative qualifies for hedge accounting, depending on the natureconsolidated statements of cash flows, and amounts paid in excess of the hedge and hedge effectiveness, changes in theoriginal acquisition date fair value of the derivative will either be recognized immediately in earnings or recorded in other comprehensive income (loss) until the hedged item is recognized in earnings upon settlement/termination. The changes in the fair value of the derivative are intended to offset the change in fair value of the hedged asset, liability, or probable commitment. The Company evaluates hedge effectiveness at inception and on an ongoing basis. If a derivative is no longer expected to be highly effective, hedge accounting is discontinued. Hedge ineffectiveness, if any, is recorded in earnings. Cash flows from derivative contracts are reported as operating activities in the consolidated statements of cash flows.
Self-Insurance The Company self-insures the majority of its insurable risks, including medical and dental costs, disability coverage, physical loss to property, business interruptions, workers’ compensation, comprehensive general, and product liability. Insurance coverage is obtained for risks required to be insured by law or contract. The Company uses operationalclaims data and economic hedges,historical experience, as well as currency exchange rate derivative contracts and interest rate derivative instruments,applicable, to manageestimate liabilities associated with the impact of currency exchange and interest rate changes on earnings and cash flows. In addition,exposures that the Company uses cross currency interest rate swaps to manage currency risk related to certain debt. In order to minimize earnings and cash flow volatility resulting from currency exchange rate changes, the Company enters into derivative instruments, principally forward currency exchange rate contracts. These contracts are designed to hedge anticipated transactions in another currency and changes in the value of specific assets and liabilities. At inception of the contract, the derivative is designated as either a freestanding derivative or a cash flow hedge. The primary currencies of the derivative instruments are the Euro and the Japanese Yen. has self-insured.
Retirement Benefit Plan Assumptions The Company does not enter into currency exchange ratesponsors various retirement benefit plans, including defined benefit pension plans, post-retirement medical plans, defined contribution savings plans, and termination indemnity plans, covering substantially all U.S. employees and many employees outside the U.S. See Note 15 for assumptions used in determining pension and post-retirement benefit costs and liabilities.
Derivatives The Company recognizes all derivative contracts for speculative purposes. All derivativefinancial instruments that qualify for hedge accounting are recordedin its consolidated financial statements at fair value in accordance with authoritative guidance on derivatives and hedging, and presents assets and liabilities associated with derivative financial instruments on a gross basis in the consolidated balance sheets, as a component of prepaid expenses and other current assets, other assets, other accrued expenses, or other long-term liabilities depending upon the gain or loss position of the contract and contract maturity date.
Forward contracts designated as cash flow hedges are designed to hedge the variability of cash flows associated with forecasted transactions denominated in another currency that will take place in the future.financial statements. For derivative instruments that are designated and qualify as hedging instruments, the hedging instrument must be designated as a fair value hedge or a cash flow hedge, based upon the effective portion of the gain or lossexposure being hedged. See Note 7 for more information on the derivative instrument is reported as a component of accumulated other comprehensive (loss) income. The effective portion of the gain or loss on the derivative instrument is reclassified into earnings and is included in other expense, net or cost of products sold in the consolidated statements of income, depending on the underlying transaction that is being hedged, in the same period or periods during which the hedged transaction affects earnings.
The Company uses freestanding derivative contracts to offset its exposure to the change in value of specific non-U.S. dollar currency denominated assets and liabilities and to offset variability of cash flows associated with forecasted transactions denominated other currencies. These derivatives are not designated as hedges, and therefore, changes in the value of these contracts are recognized in earnings, thereby offsetting the current earnings effect of the related change in value of non-U.S dollar denominated assets and liabilities.
The Company uses forward starting interest rateCompany's derivative instruments designated as cash flow hedges to manage the exposure to interest rate volatility with regard to future issuances of fixed-rate debt. The effective portion of the gains or losses on the forward starting interest rate derivative instruments that are designated and qualify as cash flow hedges are reported as a component of accumulated other comprehensive (loss) income. Beginning in the period in which the planned debt issuance occurs and the related derivative instruments are terminated, the effective portion of the gains or losses are then reclassified into interest expense, net over the term of the related debt. Any portion of the gains or losses that are determined to be ineffective are immediately recognized in interest expense, net.hedging programs.
The Company uses interest rate derivative instruments designated as fair value hedges to manage the exposure to interest rate movements and to reduce borrowing costs by converting fixed-rate debt into floating-rate debt. Under these agreements, the Company agrees to exchange, at specified intervals, the difference between fixed and floating interest amounts calculated by reference to agreed-upon notional principal amounts. Changes in the fair value of the derivative instrument are recorded in interest
Medtronic plc
Notes to Consolidated Financial Statements (Continued)
expense, net, and are offset by changes in the fair value of the underlying debt instrument. The gains (losses) from terminated interest rate swap agreements are recorded in long-term debt, increasing (decreasing) the outstanding balances of the debt, and amortized as a reduction of (addition to) interest expense, net over the remaining life of the related debt. The cash flows from the termination of the interest rate swap agreements are reported as operating activities in the consolidated statements of cash flows.
In addition, the Company has collateral credit agreements with its primary derivative counterparties. Under these agreements, either party is required to post eligible collateral when the market value of transactions covered by the agreement exceeds specific thresholds, thus limiting credit exposure for both parties.
Fair Value Measurements The Company follows the authoritative guidance on fair value measurements and disclosures with respect to assets and liabilities that are measured at fair value on both a recurring and nonrecurring basis. Under this guidance, fairFair value is defined as the exit price, or the amount that would be received to sell an asset or paid to transfer a liability in an orderly transaction between market participants as of the measurement date. The authoritative guidance also establishes a hierarchy for inputs used in measuring fair value that maximizes the use of observable inputs and minimizes the use of unobservable inputs by requiring that the most observable inputs be used when available. Observable inputs are inputs market participants would use in valuing the asset or liability, based on market data obtained from sources independent of the Company. Unobservable inputs are inputs that reflect the Company’s assumptions about the factors market participants would use in valuing the asset or liability developed based upon the best information available in the circumstances. The categorization of financial assets and financial liabilities within the valuation hierarchy is based upon the lowest level of input that is significant to the fair value measurement. The hierarchy is broken down into three levels defined as follows:
•Level 1 - Inputs are quoted prices in active markets for identical assets or liabilities.
•Level 2 - Inputs include quoted prices for similar assets or liabilities in active markets, quoted prices for identical or similar assets or liabilities in markets that are not active, and inputs (other than quoted prices) that are observable for the asset or liability, either directly or indirectly.
•Level 3 - Inputs are unobservable for the asset or liability.
Financial assets that are classified as Level 1 securities include highly liquid government bonds within U.S. government and agency securities and marketable equity securities and exchange-traded funds for which quoted market prices are available. In addition, the Company classifies currency forward contracts as Level 1 since they are valued using quoted market prices in active markets which have identical assets or liabilities.
The valuation for most fixed maturity securities are classified as Level 2. Financial assets that are classified as Level 2 include corporate debt securities, government and agency securities, certificates of deposit, other asset-backed securities, certificate of deposits, debt funds, and certain mortgage-backed securities whose value is determined using inputs that are observable in the market or canmay be derived principally from, or corroborated by, observable market data such as pricing for similar securities, recently executed transactions, cash flow models with yield curves, and benchmark securities. In addition, interest ratetotal return swaps are included in Level 2 as the Company uses inputs other than quoted prices that are observable for the asset. The Level 2 derivative instruments are primarily valued using standard calculations and models that use readily observable market data as their basis.
Financial assets are considered Level 3 when their fair values are determined using pricing models, discounted cash flow methodologies, or similar techniques, and at least one significant model assumption or input is unobservable. Financial assets that are classified as Level 3 financial assets also include certain investment securities for which there is limited market activity such that the determination of fair value requires significant judgment or estimation. Level 3 investment securities include certain corporate debt securities,estimation, and auction rate securities, and certain mortgage-backed securities. With the exception of auction rate securities, these securities wereare valued using third-party pricing sources that incorporate transaction details such as contractual terms, maturity, timing, and amount of expected future cash flows, as well as assumptions about liquidity and credit valuation adjustments by market participants. The fair value of auction rate securities is estimated by the Company using a discounted cash flow model, which incorporates significant unobservable inputs. The significant unobservable inputs used in the fair value measurement of the Company’s auction rate securities are years to principal recovery and the illiquidity premium that is incorporated into the discount rate. Significant increases (decreases) in any
Warranty Obligation The Company offers a warranty on various products. The Company estimates the costs that may be incurred under its warranties and records a liability in the amount of such costs at the time the product is sold. The amount of the reserve recorded is equal to the net costs to repair or otherwise satisfy the obligation. The Company includes the warranty obligation in other accrued expenses and other long-term liabilities on the consolidated balance sheets.
Medtronic plc
Notes to Consolidated Financial Statements (Continued)
Changesilliquidity premium that is incorporated into the discount rate. For goodwill, other intangible assets, and IPR&D, inputs used in the Company’s product warranty obligations during the years ended April 29, 2016 and April 24, 2015 consistedfair value analysis fall within Level 3 of the following:fair value hierarchy due to the use of significant unobservable inputs to determine fair value.
|
| | | | |
| (in millions) | | Warranty Obligation |
| Balance as of April 25, 2014 | | $ | 32 |
|
| Fair value of warranty obligation acquired from Covidien | | 23 |
|
| Technology upgrade commitment | | 74 |
|
| Warranty claims provision | | 30 |
|
| Settlements made | | (24 | ) |
| Balance as of April 24, 2015 | | $ | 135 |
|
| Warranty claims provision | | 64 |
|
| Settlements made | | (91 | ) |
| Balance as of April 29, 2016 | | $ | 108 |
|
Self-Insurance ItCertain investments for which the fair value is measured using the Company’s policy to self-insure the vast majority ofnet asset value per share (or its insurable risks including medical and dental costs, disability coverage, physical loss to property, business interruptions, workers’ compensation, comprehensive general, and product liability. Insurance coverage is obtained for those risks required to be insured by law or contract. The Company uses claims data and historical experience, as applicable, to estimate liabilities associated with the exposures that the Company has self-insured. Based on historical loss trends, the Company believes that its self-insurance program accruals and its existing insurance coverage will be adequate to cover future losses. Historical trends, however, may not be indicative of future losses. These losses could have a material adverse impact on the Company’s consolidated financial statements.
Retirement Benefit Plan Assumptions The Company sponsors various retirement benefit plans, including defined benefit pension plans (pension benefits), post-retirement medical plans (post-retirement benefits), defined contribution savings plans, and termination indemnity plans, covering substantially all U.S. employees and many employees outside the U.S. Pension benefit costs include assumptions for the discount rate, retirement age, compensation rate increases, and the expected return on plan assets. Post-retirement benefit costs include assumptions for the discount rate, retirement age, expected return on plan assets, and health care cost trend rate assumptions.
The Company changed the methodology used to estimate the service and interest cost components of net periodic pension cost and net periodic postretirement benefit cost for the Company’s pension and other post-retirement benefits, effective April 30, 2016. Previously, the Company estimated such cost components utilizing a single weighted-average discount rate derivedequivalent) practical expedient are excluded from the market-observed yield curves of high-qualityfair value hierarchy. Financial assets for which the fair value is measured using the net asset value per share practical expedient include certain debt funds, equity and fixed income securities used to measure the pension benefit obligationcommingled trusts, and accumulated post-retirement benefit obligation. The new methodology utilizes a full yield curve approach in the estimation of these cost components by applying the specific spot rates along the yield curve to their underlying projected cash flows and provides a more precise measurement of service and interest costs by improving the correlation between projected cash flows and their corresponding spot rates. The change does not affect the measurement of the Company’s pension obligation or accumulated post-retirement benefit obligation. The Company has accounted for this change prospectively as a change in accounting estimate.registered investment companies.
Revenue Recognition The Company sells its products through direct sales representatives and independent distributors. Additionally, a portion of the Company's revenue is generated from consignment inventory maintained at hospitals. The Company recognizes revenue when titlecontrol is transferred to the goodscustomer. For products sold through direct sales representatives and risk of loss transfers to customers, which may beindependent distributors, control is transferred upon shipment or upon delivery, to the customer site, based on the contract terms and legal requirements. For consignment inventory, control is transferred when the product is used or legal requirements in non-U.S. jurisdictions, provided thereimplanted. Payment terms vary depending on the country of sale, type of customer, and type of product.
If a contract contains more than one performance obligation, the transaction price is allocated to each performance obligation based on relative standalone selling price. Shipping and handling is treated as a fulfillment activity rather than a promised service, and therefore, is not considered a performance obligation. Taxes assessed by a governmental authority that are no material remaining performance obligations required ofboth imposed on, and concurrent with, a specific revenue producing transaction and collected by the Company from customers (for example, sales, use, value added, and some excise taxes) are not included in revenue. For contracts that have an original duration of one year or any matters requiring customer acceptance. In cases whereless, the Company utilizes distributors or ships product directlyuses the practical expedient applicable to such contracts and does not adjust the end user, it generally recognizes revenue upon shipment provided all revenue recognition criteria have been met. A portion of the Company’s revenue is generated from inventory maintained at hospitals or with field representatives. For these products, revenue is recognized attransaction price for the time the product has been used or implanted.value of money.
The Company records estimatedamount of revenue recognized reflects sales rebates and returns, discounts, and rebates as a reduction of sales in the same period revenue is recognized. Rebateswhich are estimated based on sales terms, historical experience, and trend analysis. In estimating rebates, the Company considers the lag time between the point of sale and the payment of the rebate claim, contractual commitments, includingthe stated rebate rates, and other relevant information. The Company adjustsrecords adjustments to rebates and returns reserves to reflect differences between estimated and actual experience, andas increases or decreases of revenue.
The Company records such adjustment as a reduction of sales in the period of adjustment.
In certain circumstances,deferred revenue liability if a customer pays consideration before the Company enters into arrangements intransfers a good or service to the customer. Deferred revenue primarily represents remote monitoring services and equipment maintenance, for which it provides multiple deliverablesconsideration is received at the same time as consideration for the device or equipment. Revenue related to its customers. Arrangements with multiple deliverables are divided into separate units of accounting. Total revenueremote monitoring services and equipment maintenance is first allocated amongrecognized over the service period as time elapses.
Medtronic plc
Notes to Consolidated Financial Statements (Continued)
deliverables based upon their relative fair values. Revenue is then recognized for each deliverable in accordance with the principles described above. Fair values are determined based on the prices at which the individual deliverables are regularly sold to other third parties.
Shipping and Handling Shipping and handling costs incurred to physically move product from the Company's premises to the customer's premises are recognized in selling, general, and administrative expense in the consolidated statements of income and were $316$354 million, $284$308 million, and $194$347 million in fiscal years 2016, 2015,2022, 2021, and 2014, respectively,2020, respectively. Other shipping and handling costs incurred to store, move, and prepare products for shipment are includedrecognized in selling, general, and administrative expensecost of products sold in the consolidated statements of income.
Research and Development Research and development costs are expensed when incurred. Research and development costs include costs of all basic research activities as well as other research, engineering, and technical effort requiredactivities to develop a new product or service or make significant improvement to an existing product or manufacturing process. Research and development costs also include pre-approval regulatory and clinical trial expenses.
Costs Associated with Exit Activities The Company accrues employee termination costs associated with ongoing benefit arrangements, including benefits provided as part of the Company’s U.S. severance policy or provided in accordance with non-U.S. statutory requirements, if the obligation is attributed to prior services rendered, the rights to the benefits have vested, the payment is probable, and the amount can be reasonably estimated. Other costs associated with exit activities may include distributor cancellation fees, costs related to leased facilities to be abandoned or subleased, and asset impairments.
ContingenciesThe Company records a liability in the consolidated financial statements for loss contingencies when a loss is known or considered probable, and the amount canmay be reasonably estimated. If the reasonable estimate of a known or probable loss is a range, and no amount within the range is a better estimate than any other, the minimum amount of the range is accrued. If a loss is reasonably possible but not known or probable, and canmay be reasonably estimated, the estimated loss or range of loss is disclosed. In accordance with U.S. GAAP, income tax liabilities are not accounted for under the loss contingency rules, but rather specific accounting guidance. Insurance recoveries related to potential claims are recognized up to the amount of the recorded liability when coverage is confirmed and the estimated recoveries are probable of payment. These recoveries are not netted against the related liabilities for financial statement presentation.
Tax Guarantees As a result of the recent acquisition of Covidien, theIncome Taxes The Company has guarantee commitments and indemnifications with Tyco International plc (Tyco International) and TE Connectivity Ltd. (TE Connectivity) which relate to certain contingent tax liabilities as part of a tax sharing agreement. These commitments and indemnifications were recorded at their respective fair values as of the Acquisition Date. Each reporting period, the Company evaluates the potential lossdeferred taxes that it believes is probable. This guarantee currently has not been amortized into income because there has been no predictable pattern of performance. As a result, the liability generally will be reduced upon the Company’s release from its obligations or as payments are made. As of April 29, 2016, liabilities related to guarantee commitments associated with Tyco International's and TE Connectivity's tax obligations totaled $284 million and are included in other accrued expenses and on the Company’s consolidated balance sheet.
The Company also has current and non-current receivables due from Tyco International and TE Connectivityarise as a result of the different treatment of transactions for U.S. GAAP and income tax sharing agreement. Asaccounting, known as temporary differences. The Company records the tax effect of April 29, 2016, receivables from Tyco Internationalthese temporary differences as deferred tax assets and TE Connectivity totaled $261 million and are includeddeferred tax liabilities. Deferred tax assets generally represent items that may be used as a tax deduction or credit in prepaid expenses and other currenta tax return in future years for which the Company has already recognized the tax benefit in the consolidated statements of income. The Company establishes valuation allowances for deferred tax assets when the amount of expected future taxable income is not likely to support the use of the deduction or credit. Deferred tax liabilities generally represent tax expense for which payment has been deferred or expense has already been taken as a deduction on the Company’s tax return but has not yet been recognized as an expense in the consolidated balance sheet.statements of income. See Notes 15 and 18Footnote 13 for additional backgroundmore information on the Company's uncertain tax sharing agreement.positions and tax policies.
Other Operating Expense, Net Other operating expense, net primarily includes royalty income and expense, realized equity security gains and losses, realized currency transactionremeasurement and derivative gains and losses, impairment charges on equity securities, Puerto Rico excise tax,taxes, changes in fair value of contingent consideration, changes in amounts accrued for certain contingent liabilities for a past acquisition, charges related to the June 2021 decision to stop the distribution and U.S. medical device excise tax.sale of Medtronic's HVAD System within the Mechanical Circulatory Support Operating Unit (MCS) (MCS charges), impairment charges, and income from funded research and development arrangements.
Medtronic plc
Notes to Consolidated Financial Statements (Continued)
Other Non-Operating Income, Net Other non-operating income, net includes the non-service component of net periodic pension and post-retirement benefit cost, investment gains and losses, and interest income.
Currency Translation Assets and liabilities of non-U.S. dollar functional currency entities are translated to U.S. dollars at period-end exchange rates, and the resulting gains and lossescurrency impacts arising from the translation of those netthe assets and liabilities are recorded as a cumulative translation adjustment, a component of accumulated other comprehensive (loss) incomeloss, on the consolidated balance sheets. Elements of the consolidated statements of income are translated at the average monthly currency exchange rates in effect during the period and currencyperiod. Currency transaction gains and losses are included in other operating expense, net in the consolidated statements of income.
Earnings Per Share Earnings per share is calculated usingStock-Based Compensation The Company measures stock-based compensation expense at the two-class method, as the Company's A Preferred Shares are considered participating securities. Accordingly, earnings are allocated to both ordinary shares and participating securities in determining earnings per ordinary share. Due to the limited number of A Preferred Shares outstanding, this allocation had no effect on ordinary earnings per share; therefore, it is not presented below. Basic earnings per share is computedgrant date based on the weighted average numberfair value of ordinary shares outstanding. Diluted earnings per sharethe award and recognizes the compensation expense over the requisite service period, which is computedgenerally the vesting period. The amount of stock-based compensation expense recognized during a period is based on the weighted average number of ordinary shares outstanding, increased by the number of additional shares that would have been outstanding had the potentially dilutive ordinary shares been issued, and reduced by the number of shares the Company could have repurchased from the proceeds
Medtronic plc
Notes to Consolidated Financial Statements (Continued)
from issuanceportion of the potentially dilutive shares. Potentially dilutive ordinary shares include stock optionsawards that are expected to vest. The Company estimates pre-vesting forfeitures at the time of grant and other stock-based awards granted under stock-based compensation plans and shares committed to be purchased underrevises the employee stock purchase plan.estimates in subsequent periods.
The table below sets forth the computation of basic and diluted earnings per share:
|
| | | | | | | | | | | |
| | Fiscal Year |
| (in millions, except per share data) | 2016 | | 2015 | | 2014 |
| Numerator: | |
| | |
| | |
|
| Net income attributable to ordinary shareholders | $ | 3,538 |
| | $ | 2,675 |
| | $ | 3,065 |
|
| Denominator: | |
| | |
| | |
|
| Basic – weighted average shares outstanding | 1,409.6 |
| | 1,095.5 |
| | 1,002.1 |
|
| Effect of dilutive securities: | |
| | |
| | |
|
| Employee stock options | 12.2 |
| | 9.1 |
| | 7.1 |
|
| Employee restricted stock units | 4.0 |
| | 4.3 |
| | 4.3 |
|
| Other | 0.1 |
| | 0.1 |
| | 0.1 |
|
| Diluted – weighted average shares outstanding | 1,425.9 |
| | 1,109.0 |
| | 1,013.6 |
|
| | | | | | |
| Basic earnings per share | $ | 2.51 |
| | $ | 2.44 |
| | $ | 3.06 |
|
| Diluted earnings per share | $ | 2.48 |
| | $ | 2.41 |
| | $ | 3.02 |
|
The calculation of weighted average diluted shares outstanding excludes options to purchase approximately 4 million, 2 million, and 5 million ordinary shares in fiscal years 2016, 2015, and 2014, respectively, because their effect would be anti-dilutive on the Company’s earnings per share. Additionally, the calculation of weighted average diluted shares outstanding excludes approximately 20 million and 5 million shares for fiscal years 2016 and 2015 respectively, and does not exclude any shares for fiscal year 2014, because the performance criteria had not yet been met. The calculation of weighted average diluted shares outstanding excludes approximately 1 million restricted stock units for each fiscal year 2016, 2015 and 2014, because the performance criteria had not yet been met.
NewRecently Adopted Accounting Standards
Recently AdoptedCurrent Expected Credit Losses
In April 2014,June 2016, the Financial Accounting Standards Board (FASB) issued amended guidance for reporting discontinued operations. The amended guidance changeschanging the criteria for determining when the results of operations aremethodology to be reported as discontinued operationsused to measure credit losses for certain financial instruments and expandsfinancial assets, including trade receivables. The new methodology requires the related disclosure requirements. The guidance defines a discontinued operation as a component or grouprecognition of componentsan allowance that is disposedreflects the current estimate of or classified as held for sale, which is a strategic shift that has, or will have, a major effect oncredit losses expected to be incurred over the life of the financial position and results of operations.asset. The Company prospectively adopted this accounting guidance using the modified retrospective method in the first quarter of fiscal year 2016. Its2021. The adoption of this guidance did not have a material impact onto the Company'sCompany’s consolidated financial statements.
In September 2015, the FASB issued accounting guidance which eliminates the requirement for an acquirer in a business combination to restate prior period financial statements for measurement period adjustments. An acquirer in a business combination is required to report provisional amounts when measurements are incomplete at the end of the reporting period covering the business combination. Prior to the issuance of the new guidance, an acquirer was required to adjust such provisional amounts by restating prior period financial statements. Under the new guidance, the acquirer will recognize the measurement-period adjustment in the period the adjustment is determined. The Company prospectively adopted this accounting guidance in the third quarter of fiscal year 2016. Its adoption did not have a material impact on the Company's consolidated financial statements.
In November 2015, the FASB issued accounting guidance that requires all deferred tax assets and liabilities, along with any related valuation allowance, to be classified as noncurrent on the Consolidated Balance Sheets. Current guidance requires the deferred taxes for each jurisdiction to be presented as a net current asset or liability and net noncurrent asset or liability. As a result of the new guidance, each jurisdiction will now only have one net noncurrent deferred tax asset or liability. The new guidance does not change the existing requirement that only permits offsetting deferred tax assets and liabilities within a single jurisdiction. Entities have the option to apply the new guidance prospectively or retrospectively. This accounting guidance is effective for financial statements issued for annual periods beginning after December 15, 2016, with early adoption permitted. The Company prospectively
Medtronic plc
Notes to Consolidated Financial Statements (Continued)
adopted this accounting guidance in the third quarter of fiscal year 2016. Prior periods have not been retrospectively adjusted for adoption of this statement.
In March 2016, the FASB issued accounting guidance which eliminates the requirement to apply the equity method of accounting retrospectively when a reporting entity obtains significant influence over a previously held investment. Instead, the equity method of accounting should be applied prospectively from the date significant influence is obtained. Investors should add the cost of acquiring the additional interest in the investee (if any) to the current basis of their previously held interest. For available-for-sale securities that become eligible for the equity method of accounting, any unrealized gain or loss recorded within accumulated other comprehensive income (AOCI) should be recognized in earnings at the date the investment initially qualifies for the use of the equity method. The Company prospectively adopted this accounting guidance in the fourth quarter of fiscal year 2016. Its adoption did not have a material impact on the Company's consolidated financial statements.
Not Yet Adopted
In May 2014, the FASB issued amended revenue recognition guidance to clarify the principles for recognizing revenue from contracts with customers. The guidance requires an entity to recognize revenue in an amount that reflects the consideration to which an entity expects to be entitled in exchange for the transfer of goods or services. The guidance also requires expanded disclosures relating to the nature, amount, timing, and uncertainty of revenue and cash flows arising from contracts with customers. Additionally, qualitative and quantitative disclosures are required about customer contracts, significant judgments and changes in judgments, and assets recognized from the costs to obtain or fulfill a contract. This accounting guidance is effective for the Company beginning in the first quarter of fiscal year 2019 using one of two prescribed retrospective methods. Early adoption is permitted. The Company is evaluating the impact of the amended revenue recognition guidance on the Company's consolidated financial statements.
Leases
In February 2016, the FASB issued guidance which requires lessees to recognize right-of-use assets and lease liabilities on the balance sheet. This guidance also requires additional qualitative and quantitative lease related disclosures in the notes to the consolidated financial statements. The Company adopted this guidance is to be applied using athe modified retrospective approach at the beginning of the earliest comparative period in the financial statements and is effective for the Company beginningmethod in the first quarter of fiscal year 2020. Early
During the implementation, the Company elected the package of practical expedients available under the transition guidance that allowed an entity not to reassess whether any expired or existing contracts are or contain leases, the classification for any expired or existing leases or any initial direct costs for existing leases. Further, the Company made accounting policy elections to not apply the recognition requirements to short-term leases and to account for lease and nonlease components as a single lease component.
The adoption is permitted. of this guidance resulted in the recognition of right-of-use assets and lease liabilities in an amount of approximately $1.0 billion, an immaterial cumulative-effect adjustment to retained earnings as of April 27, 2019, and expansion of lease related disclosures.The Company is evaluating theadoption of this guidance did not have a material impact of the lease guidance on the Company's consolidated financial statements.statements of income or consolidated statements of cash flows.
In March 2016,2. Revenue
The Company's revenues are principally derived from device-based medical therapies and services related to cardiac rhythm disorders, cardiovascular disease, renal disease, neurological disorders and diseases, spinal conditions and musculoskeletal trauma, chronic pain, urological and digestive disorders, ear, nose, and throat conditions, and diabetes conditions as well as advanced and general surgical care products, respiratory and monitoring solutions, and neurological surgery technologies. The Company's primary customers include healthcare systems, clinics, third-party healthcare providers, distributors, and other institutions, including governmental healthcare programs and group purchasing organizations.
Medtronic plc
Notes to Consolidated Financial Statements (Continued)
The table below illustrates net sales by segment and division for fiscal years 2022, 2021, and 2020:
| | | | | | | | | | | | | | | | | |
| | Net Sales by Fiscal Year |
| (in millions) | 2022 | | 2021 | | 2020 |
| Cardiac Rhythm & Heart Failure | $ | 5,908 | | | $ | 5,584 | | | $ | 5,141 | |
| Structural Heart & Aortic | 3,055 | | | 2,834 | | | 2,842 | |
| Coronary & Peripheral Vascular | 2,460 | | | 2,354 | | | 2,486 | |
| Cardiovascular | 11,423 | | | 10,772 | | | 10,468 | |
| Surgical Innovations | 6,060 | | | 5,438 | | | 5,513 | |
| Respiratory, Gastrointestinal, & Renal | 3,081 | | | 3,298 | | | 2,839 | |
| Medical Surgical | 9,141 | | | 8,737 | | | 8,352 | |
| Cranial & Spinal Technologies | 4,456 | | | 4,288 | | | 4,082 | |
| Specialty Therapies | 2,592 | | | 2,307 | | | 2,147 | |
| Neuromodulation | 1,735 | | | 1,601 | | | 1,497 | |
| Neuroscience | 8,784 | | | 8,195 | | | 7,725 | |
| Diabetes | 2,338 | | | 2,413 | | | 2,368 | |
| Total | $ | 31,686 | | | $ | 30,117 | | | $ | 28,913 | |
The table below includes net sales by market geography and segment for fiscal years 2022, 2021, and 2020:
| | | | | | | | | | | | | | | | | | | | | | | | | | | | | | | | | | | | | | | | | | | | | | | | | | | | | |
| U.S.(1) | | Non-U.S. Developed Markets(2) | | Emerging Markets(3) |
| (in millions) | Fiscal Year 2022 | | Fiscal Year 2021 | | Fiscal Year 2020 | | Fiscal Year 2022 | | Fiscal Year 2021 | | Fiscal Year 2020 | | Fiscal Year 2022 | | Fiscal Year 2021 | | Fiscal Year 2020 |
| Cardiovascular | $ | 5,545 | | | $ | 5,248 | | | $ | 5,062 | | | $ | 3,866 | | | $ | 3,752 | | | $ | 3,519 | | | $ | 2,012 | | | $ | 1,773 | | | $ | 1,887 | |
| Medical Surgical | 3,862 | | | 3,650 | | | 3,532 | | | 3,373 | | | 3,320 | | | 3,169 | | | 1,905 | | | 1,766 | | | 1,651 | |
| Neuroscience | 5,753 | | | 5,456 | | | 5,122 | | | 1,801 | | | 1,724 | | | 1,659 | | | 1,229 | | | 1,015 | | | 945 | |
| Diabetes | 974 | | | 1,171 | | | 1,204 | | | 1,085 | | | 1,019 | | | 940 | | | 279 | | | 222 | | | 224 | |
| Total | $ | 16,135 | | | $ | 15,526 | | | $ | 14,919 | | | $ | 10,126 | | | $ | 9,815 | | | $ | 9,287 | | | $ | 5,426 | | | $ | 4,777 | | | $ | 4,707 | |
(1)U.S. includes the FASB issued guidanceUnited States and U.S. territories.
(2)Non-U.S. developed markets include Japan, Australia, New Zealand, Korea, Canada, and the countries of Western Europe.
(3)Emerging markets include the countries of the Middle East, Africa, Latin America, Eastern Europe, and the countries of Asia that are not included in the non-U.S. developed markets, as defined above.
At April 29, 2022, $981 million of rebates were classified as other accrued expenses, and$548 million of rebates were classified as a reduction of accounts receivable in the consolidated balance sheet. At April 30, 2021, $906 million of rebates were classified as other accrued expenses, and $485 million of rebates were classified as a reduction of accounts receivable in the consolidated balance sheet. During fiscal year 2022, adjustments to simplifyrebate and return reserves recognized in revenue that were included in the accounting for share based payment transactions by requiring all excess tax benefitsrebate and deficienciesreturn reserves at the beginning of the period were not material.
Deferred Revenue and Remaining Performance Obligations
Deferred revenue at April 29, 2022 and April 30, 2021 was $399 million and $368 million, respectively. At April 29, 2022 and April 30, 2021, $305 million and $276 million was included in other accrued expenses, respectively, and $94 million and $93 million was included in other liabilities, respectively. During the fiscal year ended April 29, 2022, the Company recognized $243 million of revenue that was included in deferred revenue as of April 30, 2021.
Remaining performance obligations include goods and services that have not yet been delivered or provided under existing, noncancellable contracts with minimum purchase commitments. At April 29, 2022, the estimated revenue expected to be recognized in income tax expensefuture periods related to unsatisfied performance obligations for executed contracts with an original duration of one year or benefit in earnings. An entity can make an entity-wide accounting policy election to either estimate the expected forfeiture awards or account for forfeitures as they occur. This accounting guidance is effective for the Company beginning in the first quarter of fiscal year 2018. Early adoption is permitted for any entity in any interim or annual period.more was approximately $925 million. The Company is currently assessing the impact of the guidanceexpects to recognize revenue on the Company's consolidated financial statements.majority of these remaining performance obligations over the next three years.
2.
Medtronic plc
Notes to Consolidated Financial Statements (Continued)
3. Acquisitions and Acquisition-Related Items
The Company had various acquisitions and other acquisition-related activity during fiscal years 2016, 2015,2022 and 2014. Certain acquisitions2021 that were accounted for as business combinations as noted below. In accordance with authoritative guidance on business combination accounting, thecombinations. The assets and liabilities of the companiesbusinesses acquired were recorded as ofand consolidated on the acquisition date at their respective fair values, and consolidated. With the exceptionvalues. Goodwill resulting from business combinations is largely attributable to future yet to be defined technologies, new customer relationships, existing workforce of the Covidienacquired businesses, and synergies expected to arise after the Company's acquisition and unless otherwise disclosed, theof these businesses. The pro forma impact of these acquisitions during fiscal years 2022 and 2021 was not significant, either individually or in the aggregate, to the consolidated results of the Company for the fiscal years ended April 29, 2016, April 24, 2015, or April 25, 2014.Company. The results of operations related to each companyof acquired businesses have been included in the Company’s consolidated statements of income since the date each companybusiness was acquired. Purchase price allocation adjustments for fiscal years 2022 and 2021 business combinations were not significant.
Acquisition of Covidien public limited company in Fiscal Year 20152022
On January 26, 2015 (Acquisition Date), pursuantThe acquisition date fair value of net assets acquired during fiscal year 2022 was $125 million, consisting of $154 million of assets acquired and $29 million of liabilities assumed. Based upon preliminary valuations, assets acquired were primarily comprised of $50 million of technology-based intangible assets with estimated useful lives ranging from 15 to 16 years, and $80 million of goodwill. The goodwill is not deductible for tax purposes. The Company recognized $31 million of contingent consideration liabilities in connection with business combinations during fiscal year 2022, which are comprised of revenue and regulatory milestone-based payments.
Fiscal Year 2021
The acquisition date fair value of net assets acquired during fiscal year 2021 was $1.2 billion, consisting of $1.4 billion of assets acquired and $161 million of liabilities assumed. Based upon final valuations, assets acquired were primarily comprised of $417 million of technology-based intangible assets and $13 million of customer-related intangible assets with estimated useful lives ranging from 8 to 15 years, and $816 million of goodwill. The goodwill is not deductible for tax purposes. The Company recognized $253 million of contingent consideration liabilities in connection with business combinations during fiscal year 2021, which are comprised of revenue and regulatory milestone-based payments. Additionally, the Company recognized a gain of $132 million related to a change in amounts accrued for certain contingent liabilities from a past acquisition. The benefit was recognized in other operating expense, net in the consolidated statements of income as the purchase accounting was finalized in fiscal year 2020.
Subsequent Acquisitions
Subsequent to fiscal year 2022, on May 13, 2022, the Company's Neuroscience segment acquired Intersect ENT, a global ear, nose, and throat (ENT) medical technology leader. The acquisition expands Medtronic's portfolio of products used during ENT procedures and, combined with the Company's navigation, powered instruments, and existing tissue health products, will offer a broader suite of solutions to assist surgeons treating patients who suffer from chronic rhinosinusitis (CRS). Total consideration for the transaction, agreement, dated as of June 15, 2014 (the Transaction Agreement),in which the Company acquired Covidien plc (Covidien), and Covidien and Medtronic, Inc. became subsidiaries of Medtronic (collectively, the Transactions). In connection with the consummation of the Transactions, Medtronic re-registered as a public limited company organized under the laws of Ireland.
On January 26, 2015, (a) each Covidien ordinary share was converted into the right to receive $35.19 in cash and 0.956 of a newly issued Medtronic plc share (the Arrangement Consideration) in exchange for each Covidien share held by such shareholders, and (b) each share of Medtronic, Inc. common stock was converted into the right to receive one Medtronic plc ordinary share. Based on the number ofall outstanding shares of Medtronic, Inc. and Covidien as of January 23, 2015 (the last business day prior to the
Medtronic plc
Notes to Consolidated Financial Statements (Continued)
close of the transaction), former Medtronic, Inc. and Covidien shareholders heldIntersect ENT for $28.25 per share, was approximately 69 percent and 31 percent, respectively, of the Company's ordinary shares after giving effect to the acquisition.
Covidien is a global leader in the development, manufacture, and sale of healthcare products for use in clinical and home settings.$1.2 billion. The operating results for Covidien are included in the Minimally Invasive Therapies Group, Cardiac and Vascular Group and Restorative Therapies Group segments.
Fair Value of Consideration Transferred
Total consideration was $50.0 billion, consisting of $16.0 billion cash and $34.0 billion of non-cash consideration. Total consideration is comprised of the equity value of the shares that were outstanding as of January 23, 2015 and the portion of Covidien's share awards and share options earned as of January 23, 2015 ($559 million). Share awards and share options not earned ($496 million) as of January 23, 2015transaction will be expensed over the remaining future vesting period, including $189 million and $70 million recognized in acquisition-related items and restructuring charges, net, respectively, for the fiscal year ended April 24, 2015. Share award and share options of $58 million and $18 million were recognized in acquisition-related items and restructuring charges, net, respectively, for the fiscal year ended April 29, 2016.
The following table summarizes the total fair value of consideration transferred:
|
| | | | |
| (in millions, except per share data) | | |
| Cash consideration paid to Covidien shareholders ($35.19 per share) | | $ | 15,994 |
|
| Cash consideration paid for vested Covidien share awards ($35.19 per share) | | 33 |
|
| Total cash consideration | | $ | 16,027 |
|
| | | |
| Covidien shares outstanding as of January 23, 2015 | | 455 |
|
| Exchange ratio per share | | 0.956 |
|
Total Medtronic shares issued to Covidien shareholders(1) | | 435 |
|
| Medtronic per share value as of January 23, 2015 | | $ | 76.95 |
|
| Fair value of Medtronic shares issued to Covidien shareholders | | $ | 33,435 |
|
Fair value of shares issued to Covidien share award holders(1) | | 70 |
|
| Fair value of share options and awards issued to Covidien share option and award holders | | 456 |
|
| Total fair value of consideration transferred | | $ | 49,988 |
|
(1) 1 million ordinary shares were issued, net, to Covidien share award holders.
Fair Value of Assets Acquired and Liabilities Assumed
The Company accounted for the acquisition of Covidien as a business combination using the acquisition method of accounting. TheThis requires, among other things, that assets acquired and liabilities assumed were recordedbe recognized at their respective fair values as of the Acquisition Date. The fair valueacquisition date.
Due to the limited amount of time since the acquisition date and the significant limitations on access to Intersect ENT information prior to the acquisition date the preliminary acquisition valuation for the business combination is incomplete at this time. As a result, the Company is unable to provide the amounts recognized as of the acquisition date for the major classes of assets acquired and liabilities assumed, was finalized duringincluding the thirdinformation required for valuation of intangible assets and goodwill. We will include such disclosures in our Form 10-Q for the quarter ending July 29, 2022.
Acquired In-Process Research & Development (IPR&D)
IPR&D with no alternative future use acquired outside of a business combination is expensed immediately. During fiscal year 2016. During the measurement period, which ended January 26, 2016, adjustments were made to finalize Covidien's preliminary fair value estimates related primarily to other current assets, intangible assets, goodwill, certain property value, contingent liabilities and the related deferred tax impacts. Based upon the acquisition valuation,2022, the Company acquired $18.3 billion of customer-related intangible assets, $7.1 billion of technology-based intangible assets, $430 million of tradenames, with weighted average estimated useful lives of 18, 16, and 6 years, respectively, $420$101 million of IPR&D and $30.0 billion of goodwill.
Medtronic plc
Notes to Consolidated Financial Statements (Continued)
The fair values of the assets acquired and liabilities assumed are as follows:
|
| | | |
| (estimated in millions) | |
| Accounts receivable | $ | 1,349 |
|
| Inventories | 2,219 |
|
| Other current assets | 3,181 |
|
| Property, plant, and equipment | 2,293 |
|
| Goodwill | 29,979 |
|
| Intangible assets | 26,210 |
|
| Other assets | 761 |
|
| Total assets acquired | 65,992 |
|
| | |
| Short-term borrowings | 1,011 |
|
| Other current liabilities | 2,434 |
|
| Long-term debt | 4,623 |
|
| Long-term deferred tax liabilities | 4,745 |
|
| Other long-term liabilities | 3,191 |
|
| Total liabilities assumed | 16,004 |
|
| Net assets acquired | $ | 49,988 |
|
Goodwill has been allocated to the Minimally Invasive Therapies Group, Cardiac and Vascular Group, Restorative Therapies Group, and Diabetes Group. Goodwill is calculated as the excess of the consideration transferred over the net assets recognized and represents the expected revenue and cost synergies of the combined company, which are further described above. Goodwill recognized as a result of the acquisition is not deductible for tax purposes. See Note 6 for additional information about goodwill and other intangible assets.
Contingent liabilities assumed as part of the Acquisition total $2.7 billion and are included in accrued income taxes, other accrued expenses, long-term accrued income taxes, and other long-term liabilities. These contingent liabilities include $1.5 billion related to income taxes (including uncertain tax positions and guarantee commitments), and $1.2 billion related to legal claims (including product liability and environmental matters). Contingent liabilities are recorded at their estimated fair values, aside from those pertaining to uncertainty in income taxes which are an exception to the fair value basis of accounting. Legal matters and certain environmental matters that are legal in nature are recorded at their respective probable and estimable amounts. See Note 15 for additional background on contingent liabilities.
Actual and Pro Forma Impact
The Company's consolidated financial statements for the fiscal year ended April 24, 2015 include Covidien's results of operations from the Acquisition Date through April 24, 2015. Net sales and operating loss attributable to Covidien during this period and included in Medtronic's consolidated financial statements for the fiscal year ended April 24, 2015 total $2.7 billion and $423 million, respectively. The $423 million operating loss includes $623 million of amortization from the step-up in fair value of inventory acquired, $379 million of intangible asset amortization, $218 million of acquisition-related charges, and $142 million of restructuring charges, net, all of which relate to the Covidien acquisition.
The following unaudited pro forma information gives effect to Medtronic's acquisition of Covidien as if the acquisition had occurred on April 27, 2013, the first day of fiscal year 2014, and had been included in the Company's consolidated statements of income for fiscal years 2015 and 2014.
|
| | | | | | | |
| (in millions) | 2015 | | 2014 |
| Pro forma net sales | $ | 28,369 |
| | $ | 27,380 |
|
| Pro forma net income | $ | 3,944 |
| | $ | 3,280 |
|
Medtronic plc
Notes to Consolidated Financial Statements (Continued)
The historical consolidated financial information of the Company and Covidien has been adjusted in the pro forma information to give effect to pro forma events that are (1) directly attributable to the transaction, (2) factually supportable, and (3) expected to have a continuing impact on the combined results. In order to reflect the occurrence of the acquisition on April 27, 2013 as required, the unaudited pro forma results include adjustments to reflect, among other things, the amortization of the inventory step-up, the incremental intangible asset amortization to be incurred based on the values of each identifiable intangible asset, and interest expense from debt financing obtained to fund the cash consideration transferred. Pro forma adjustments were tax-effected at the Company's statutory rate. These pro forma amounts are not necessarily indicative of the results that would have been obtained if the acquisition had occurred as of the beginning of the period presented or that may occur in the future, and does not reflect future synergies, integration costs, or other such costs or savings.
Fiscal Year 2016
The fair values of the assets acquired and liabilities assumed from acquisitions during fiscal year 2016 are as follows: |
| | | | | | | | | | | | | | | | | | | |
| (in millions) | Twelve, Inc. | | RF Surgical Systems, Inc. | | Medina Medical | | All Other | | Total |
| Other current assets | $ | 60 |
| | $ | 40 |
| | $ | 11 |
| | $ | 134 |
| | $ | 245 |
|
| Property, plant, and equipment | — |
| | 2 |
| | — |
| | 39 |
| | 41 |
|
| IPR&D | 192 |
| | — |
| | 122 |
| | 143 |
| | 457 |
|
| Other intangible assets | — |
| | 115 |
| | — |
| | 199 |
| | 314 |
|
| Goodwill | 291 |
| | 135 |
| | 126 |
| | 304 |
| | 856 |
|
| Other assets | — |
| | 2 |
| | — |
| | 15 |
| | 17 |
|
| Total assets acquired | 543 |
| | 294 |
| | 259 |
| | 834 |
| | 1,930 |
|
| | | | | | | | | | |
| Current liabilities | 37 |
| | 27 |
| | 6 |
| | 91 |
| | 161 |
|
| Long-term deferred tax liabilities, net | 34 |
| | 27 |
| | 34 |
| | 53 |
| | 148 |
|
| Other liabilities | — |
| | — |
| | — |
| | 50 |
| | 50 |
|
| Total liabilities assumed | 71 |
| | 54 |
| | 40 |
| | 194 |
| | 359 |
|
| Net assets acquired | $ | 472 |
| | $ | 240 |
| | $ | 219 |
| | $ | 640 |
| | $ | 1,571 |
|
Twelve, Inc.
On October 2, 2015, the Company's Coronary & Structural Heart division acquired Twelve, Inc. (Twelve), a privately-held medical device company focused on the development of a transcatheter mitral valve replacement device. Total consideration for the transaction was approximately $472 million, which included an upfront payment of $428 million and the estimated fair value of product development-based contingent consideration of $44 million. Based upon the acquisition valuation, the Company acquired $192 million of IPR&D and $291 million of goodwill. The acquired goodwill is not deductible for tax purposes.
RF Surgical Systems, Inc.
On August 11, 2015, the Company's Surgical Solutions division acquired RF Surgical Systems, Inc. (RF Surgical), a medical device company focused on the detection and prevention of retained surgical sponges. Total consideration for the transaction was approximately $240 million. Based upon the acquisition valuation, the Company acquired $68 million of technology-based intangible assets, $47 million of customer-related intangible assets, with estimated useful lives of 18 and 16 years, respectively, and $135 million of goodwill. The acquired goodwill is not deductible for tax purposes.
Medina Medical
On August 31, 2015, the Company's Neurovascular division acquired Medina Medical (Medina), a privately-held medical device company focused on commercializing treatments for vascular abnormalities of the brain, including cerebral aneurysms. Total consideration for the transaction was approximately $219 million, which includes an upfront payment of $155 million and the estimated fair value of revenue-based and product development-based contingent consideration of $64 million. Medtronic had previously invested in Medina and held an 11 percent ownership position. Net of this ownership position, the transaction value was approximately $195 million. Based upon the acquisition valuation, the Company acquired $122 million of IPR&D and $126 million of goodwill. The acquired goodwill is not deductible for tax purposes.
The Company accounted for the acquisitions of Twelve, RF Surgical, and Medina and all other acquisitions as business combinations using the acquisition method of accounting.
Medtronic plc
Notes to Consolidated Financial Statements (Continued)
Fiscal Year 2015
The fair values of the assets acquired and liabilities assumed from acquisitions during fiscal year 2015, other than the Covidien acquisition, are as follows: |
| | | | | | | | | | | | | | | |
| (in millions) | NGC Medical S.p.A. | | Sapiens Steering Brain Stimulation | | All Other | | Total |
| Other current assets | $ | 55 |
| | $ | 3 |
| | $ | 12 |
| | $ | 70 |
|
| Property, plant, and equipment | 15 |
| | 1 |
| | 2 |
| | 18 |
|
| IPR&D | — |
| | 30 |
| | 39 |
| | 69 |
|
| Other intangible assets | 159 |
| | — |
| | 157 |
| | 316 |
|
| Goodwill | 197 |
| | 170 |
| | 108 |
| | 475 |
|
| Other assets | 3 |
| | 3 |
| | 49 |
| | 55 |
|
| Total assets acquired | 429 |
| | 207 |
| | 367 |
| | 1,003 |
|
| | | | | | | | |
| Current liabilities | 34 |
| | 4 |
| | 6 |
| | 44 |
|
| Long-term deferred tax liabilities, net | 51 |
| | — |
| | 66 |
| | 117 |
|
| Other liabilities | 4 |
| | — |
| | — |
| | 4 |
|
| Total liabilities assumed | 89 |
| | 4 |
| | 72 |
| | 165 |
|
| Net assets acquired | $ | 340 |
| | $ | 203 |
| | $ | 295 |
| | $ | 838 |
|
NGC Medical S.p.A
On August 26, 2014, the Company acquired NGC Medical S.p.A. (NGC), a privately-held Italian company that offers a broad suite of hospital managed services. Total consideration for this transaction was approximately $340 million. Medtronic had previously invested in NGC and held a 30 percent ownership position in that company. Net of this ownership position, the transaction value was approximately $238 million. Based upon the acquisition valuation, the Company acquired $159 million of customer-related intangible assets and tradenames with an estimated useful life of 20 years at the time of acquisition and $197 million of goodwill. The acquired goodwill is not deductible for tax purposes. During fiscal year 2015, the Company recorded adjustments to goodwill, other intangible assets, net, and long-term deferred tax liabilities.
Sapiens Steering Brain Stimulation
On August 25, 2014, the Company acquired Sapiens Steering Brain Stimulation (Sapiens), a privately-held developer of deep brain stimulation technologies. Total consideration for the transaction was approximately $203 million. Based upon the acquisition valuation, the Company acquired $30 million of IPR&D and $170 million of goodwill. The acquired goodwill is not deductible for tax purposes.
The Company accounted for the acquisitions of NGC and Sapiens as business combinations using the acquisition method of accounting.
Medtronic plc
Notes to Consolidated Financial Statements (Continued)
Fiscal Year 2014
The fair values of the assets acquired and liabilities assumed during fiscal year 2014 are as follows:
|
| | | | | | | | | | | |
| (in millions) | TYRX, Inc. | | All Other | | Total |
| Current assets | $ | 6 |
| | $ | 14 |
| | $ | 20 |
|
| Property, plant, and equipment | 1 |
| | 7 |
| | 8 |
|
| Intangible assets | 94 |
| | 61 |
| | 155 |
|
| Goodwill | 132 |
| | 123 |
| | 255 |
|
| Total assets acquired | 233 |
| | 205 |
| | 438 |
|
| | | | | | |
| Current liabilities | 4 |
| | 12 |
| | 16 |
|
| Long-term deferred tax liabilities, net | 7 |
| | — |
| | 7 |
|
| Total liabilities assumed | 11 |
| | 12 |
| | 23 |
|
| Net assets acquired | $ | 222 |
| | $ | 193 |
| | $ | 415 |
|
TYRX, Inc.
On December 30, 2013, the Company acquired TYRX, Inc. (TYRX), a privately-held developer of antibiotic drug and implanted medical device combinations. TYRX's products include those designed to reduce surgical site infections associated with implantable pacemakers, defibrillators, and spinal cord neurostimulators. Under the terms of the agreement, the transaction included an initial up-front payment of $159 million, representing a purchase price amount that was net of acquired cash, including the assumption and settlement of existing TYRX debt and direct acquisition costs. Total consideration for the transaction was approximately $222 million, which included estimated fair values for product development-based and revenue-based contingent consideration of $25 million and $35 million, respectively. The product development-based contingent consideration includes a future potential payment of $40 million upon achieving certain milestones, and the revenue-based contingent consideration payments equal TYRX's actual annual revenue growth for the company's fiscal years 2015 and 2016. Based upon the acquisition valuation, the Company acquired $94 million of technology-based intangible assets with an estimated useful life of 14 years and $132 million of goodwill. The acquired goodwill is not deductible for tax purposes.
The Company accounted for the acquisition of TYRX as a business combination using the acquisition method of accounting.
Acquisition-Related Items
During fiscal year 2016, the Company recorded charges from acquisition-related items of $283 million, primarily related to costs incurred in connection with the Covidien acquisition. The charges incurredasset acquisitions of technology not approved by regulators, which was recognized in connection with the Covidien acquisition include $219 million of professional servicesresearch and integration costs and $58 million of accelerated or incremental stock compensation expense.
During fiscal year 2015, the Company recorded charges from acquisition-related items of $550 million, primarily related to costs incurred in connection with the Covidien acquisition. The charges incurred in connection with the Covidien acquisition include $275 million of professional services and integration costs, $189 million of accelerated or incremental stock compensationdevelopment expense and $69 million of incremental officer and director excise tax. These amounts are included within acquisition-related itemsin the consolidated statements of income.
During fiscal year 2014, the Company recorded net charges from acquisition-related items of $117 million, primarily including2021, IPR&D and long-livedacquired in connection with asset impairment charges of $236 million related to the Ardian, Inc. (Ardian) acquisition recorded in the third quarter of fiscal year 2014. The impairment charges were partially offset by income of $138 million related to the change in fair value of contingent consideration associated with acquisitions subsequent to April 29, 2009. These amounts are included within acquisition-related items in the consolidated statements of income.was not significant.
Contingent Consideration
Certain of the Company’s business combinations and purchases of intellectual property involve the potential for the payment of future consideration that is contingent consideration upon the achievement of certain product development milestones and/or various other favorable
Medtronic plc
Notes to Consolidated Financial Statements (Continued)
operating conditions. Payment of the additional consideration is generally contingent on the acquired companybusiness reaching certain performance milestones, including attaining specified revenue levels or achieving product development targets. For business combinations subsequent to April 24, 2009, amilestones. A liability is recorded for the estimated fair value of the contingent consideration on the acquisition date. The fair value of the contingent consideration is remeasured at each reporting period, withand the change in fair value is recognized as income orwithin other operating expense, within acquisition-related itemsnet in the consolidated statements of income. The Company measures the liability on a recurring basis using Level 3 inputs.
Medtronic plc
Notes to Consolidated Financial Statements (Continued)
The fair value of contingent consideration is measured using projected payment dates, discount rates, probabilities of payment,at April 29, 2022 and projected revenues (for revenue-based considerations). Projected contingent payment amounts are discounted back to the current period using a discounted cash flow model. Projected revenues are basedApril 30, 2021 was $119 million and $270 million, respectively. At April 29, 2022, $35 million was recorded in other accrued expenses, and $84 million was recorded in other liabilities on the Company’s most recent internal operational budgets and long-range strategic plans. Increases (decreases) in projected revenues, probabilities of payment, discount rates, or projected payment dates may result in higher (lower) fair value measurements. Fluctuations in any of the inputs may result in a significantly lower (higher) fair value measurement.
The recurring Level 3 fair value measurements of contingent consideration include the following significant unobservable inputs:
|
| | | | | | | | | |
| ($ in millions) | Fair Value at April 29, 2016 | | Valuation Technique | | Unobservable Input | | Range |
| | | | | | Discount rate | | 11% - 27% |
| Revenue-based payments | $ | 195 |
| | Discounted cash flow | | Probability of payment | | 30% - 100% |
| | |
| | | | Projected fiscal year of payment | | 2017 - 2025 |
| | | | | | Discount rate | | 0.3% - 5.5% |
| Product development-based payments | $ | 182 |
| | Discounted cash flow | | Probability of payment | | 75% - 100% |
| | |
| | | | Projected fiscal year of payment | | 2017 - 2025 |
consolidated balance sheets. At April 29, 2016, the estimated maximum potential amount of undiscounted future contingent consideration that the Company is expected to make associated with all completed business combinations or purchases of intellectual property prior to April 24, 2009 was approximately $175 million. The Company estimates the milestones or other conditions associated with the contingent consideration will be reached in fiscal year 2017 and thereafter.
The fair value of contingent consideration associated with acquisitions subsequent to April 24, 2009, as of April 29, 2016 and April 24, 2015, was $377 million and $264 million, respectively. As of April 29, 2016, $31130, 2021, $78 million was reflected in other long-term liabilitiesaccrued expenses, and $66$192 million was reflected in other accrued expenses inliabilities on the consolidated balance sheets. As of April 24, 2015, $242 million was reflected in other long-term liabilities and $22 million was reflected in other accrued expenses in the consolidated balance sheets. The portion of the contingent consideration related to the acquisition date fair value is reported as financing activities in the consolidated statements of cash flows. Amounts paid in excess of the original acquisition date fair value are reported as operating activities in the consolidated statements of cash flows.
The following table provides a reconciliation of the beginning and ending balances of contingent consideration:
| | | | | | | | | | | |
| | Fiscal Year |
| (in millions) | 2022 | | 2021 |
| Beginning Balance | $ | 270 | | | $ | 280 | |
| Purchase price contingent consideration | 31 | | | 253 | |
| Purchase price allocation adjustments | 7 | | | — | |
| Payments | (86) | | | (299) | |
| Change in fair value | (103) | | | 36 | |
| Ending Balance | $ | 119 | | | $ | 270 | |
The recurring Level 3 fair value measurements of contingent consideration for which a liability is recorded include the following significant unobservable inputs:
| | | | | | | | | | | | | | | | | | | | | | | | | | | | |
| (in millions) | | Fair Value at April 29, 2022 | | | | Unobservable Input | | Range | | Weighted Average (1) |
| | | | | | Discount rate | | 11.2% - 27.2% | | 14.6% |
| Revenue and other performance-based payments | | $ | 104 | | | | | Probability of payment | | 100% | | 100% |
| | | | | | | Projected fiscal year of payment | | 2023 - 2027 | | 2025 |
| | | | | | Discount rate | | 5.5% | | 5.5% |
| Product development and other milestone-based payments | | $ | 15 | | | | | Probability of payment | | 100% | | 100% |
| | | | | | | Projected fiscal year of payment | | 2023 - 2024 | | 2024 |
(1) Unobservable inputs were weighted by the relative fair value of the contingent consideration liability. For projected fiscal year of payment, the amount represents the median of the inputs and is not a weighted average.
|
| | | | | | | |
| | Fiscal Year |
| (in millions) | 2016 | | 2015 |
| Beginning Balance | $ | 264 |
| | $ | 68 |
|
| Acquired contingent consideration | — |
| | 236 |
|
| Purchase price contingent consideration | 149 |
| | 40 |
|
| Contingent consideration payments | (22 | ) | | (85 | ) |
| Change in fair value of contingent consideration | (14 | ) | | 5 |
|
| Ending Balance | $ | 377 |
| | $ | 264 |
|
3.4. Restructuring Charges Net
Cost Synergies InitiativeEnterprise Excellence
The cost synergies initiative, initially referred to asIn the third quarter of fiscal year 2015 initiative,2018, the Company announced its Enterprise Excellence restructuring program, which was the beginning ofdesigned to leverage the Company's restructuring program primarilyglobal size and scale, as well as enhance the customer and employee experience, with a focus on three objectives: global operations, functional optimization, and commercial optimization.
Since inception, the Company has incurred pre-tax exit and disposal costs and other costs, across all segments, of $1.6 billion in connection with the Enterprise Excellence program. In total, the Company estimates it will recognize approximately $1.8 billion of exit and disposal costs and other costs related to the acquisitionprogram by the end of Covidien. This initiative is expected to contributefiscal year 2023. The remaining charges are costs associated with the restructuring program, such as salaries and benefits for employees supporting the program, including program management and transition teams, and strategic and operational consulting services related to the approximately $850 million in cost synergies expected to be achieved as a resultthree objectives of the Covidien acquisition throughprogram. These charges are recognized within restructuring charges, net, cost of products sold, and selling, general, and administrative expense in the consolidated statements of income.
For fiscal years 2022, 2021 and 2020, the Company recognized net charges of $259 million, $349 million, and $441 million, respectively, of which $116 million, $128 million, and $155 million, respectively, were recognized within cost of products sold, and $112 million, $169 million, and $168 million, respectively, were recognized within selling, general, and administrative expense in the consolidated statements of income.
Simplification
In the first quarter of fiscal year 2018, including2021, the Company initiated the Simplification restructuring program, designed to make the Company a more nimble and competitive organization focused on accelerating innovation, enhancing the customer experience, driving revenue growth, and winning market share, while also more efficiently and effectively leveraging the enterprise scale.
Medtronic plc
Notes to Consolidated Financial Statements (Continued)
administrative office optimization, manufacturingSince inception, the Company has incurred pre-tax exit and supply chain infrastructure, certaindisposal costs and other costs, across all segments, of $349 million in connection with the program. In total, the Company estimates it will recognize approximately $450 million of exit and disposal costs and other costs related to the Simplification program cancellations,by the end of fiscal year 2023. The remaining charges are costs associated with the restructuring program, such as salaries for employees supporting the program and certainconsulting expenses. These charges are recognized within restructuring charges, net, cost of products sold, and selling, general, and administrative savings. Restructuring charges are expected to be incurredexpense in futurethe consolidated statements of income.
For fiscal years 2022 and 2021, the Company recognized net charges of $82 million and $268 million, respectively, of which $45 million and $27 million were recognized within selling, general, and administrative expense in the consolidated statements of income. The net charges for fiscal year 2021 included $97 million of incremental defined benefit pension and post-retirement related expenses for employees that accepted voluntary early retirement packages and are not included in the table below, as cost synergy strategiesthey are finalized. Restructuring accruals resulting from restructuring chargesassociated with costs that are scheduled to be substantially complete within one year fromaccounted for under the period in which the restructuring charge was initially incurred.pension and post-retirement rules. See Note 15 for further discussion on these charges.
A summary ofThe following table summarizes the activity related to the cost synergies initiative is presented below:restructuring programs noted above for fiscal years 2022, 2021, and 2020: |
| | | | | | | | | | | | | | | |
| (in millions) | Employee Termination Costs | | Asset Write-downs | | Other Costs | | Total |
| Balance as of April 25, 2014 | $ | — |
| | $ | — |
| | $ | — |
| | $ | — |
|
| Restructuring charges | 213 |
| | 28 |
| | 7 |
| | 248 |
|
| Payments/write-downs | (77 | ) | | (28 | ) | | — |
| | (105 | ) |
| Balance as of April 24, 2015 | $ | 136 |
| | $ | — |
| | $ | 7 |
| | $ | 143 |
|
| Restructuring charges | 248 |
| | 23 |
| | 61 |
| | 332 |
|
| Payments/write-downs | (153 | ) | | (23 | ) | | (31 | ) | | (207 | ) |
Reversal of excess accrual
| (18 | ) | | $ | — |
| | $ | — |
| | (18 | ) |
| Balance as of April 29, 2016 | $ | 213 |
| | $ | — |
| | $ | 37 |
| | $ | 250 |
|
| | | | | | | | | | | | | | | | | | | | | | | | | | | | | |
| (in millions) | Employee Termination Benefits | | Associated Costs(1) | | Asset
Write-downs | | Other
Costs | | Total |
| April 26, 2019 | $ | 101 | | | $ | 9 | | | $ | — | | | $ | 12 | | | $ | 122 | |
| Charges | 129 | | | 300 | | | 24 | | | 9 | | | 462 | |
| Cash payments | (128) | | | (290) | | | — | | | (9) | | | (427) | |
| Settled non-cash | — | | | — | | | (24) | | | — | | | (24) | |
Accrual adjustments(2) | (13) | | | — | | | — | | | (8) | | | (21) | |
| April 24, 2020 | 89 | | | 19 | | | — | | | 4 | | | 112 | |
| Charges | 213 | | | 322 | | | — | | | 4 | | | 539 | |
| Cash payments | (162) | | | (319) | | | — | | | (5) | | | (486) | |
| | | | | | | | | |
Accrual adjustments(2) | (17) | | | — | | | — | | | (2) | | | (19) | |
| April 30, 2021 | 123 | | | 22 | | | — | | | 1 | | | 146 | |
| Charges | 80 | | | 274 | | | — | | | — | | | 354 | |
| Cash payments | (109) | | | (269) | | — | | | — | | | (378) | |
| | | | | | | | | |
Accrual adjustments(2) | (13) | | | — | | | — | | | — | | | (13) | |
| April 29, 2022 | $ | 81 | | | $ | 27 | | | $ | — | | | $ | 1 | | | $ | 110 | |
As(1)Associated costs include costs incurred as a direct result of the restructuring program, such as salaries for employees supporting the program and consulting expenses.
(2)Accrual adjustments relate to certain employees identified for termination finding other positions within the Company or contract terminations being settled for less than originally estimated.
Mechanical Circulatory Support (MCS)
On June 3, 2021, the Company announced the decision to stop the distribution and revisionssale of the Medtronic HVAD System in light of a growing body of observational clinical comparisons indicating a lower frequency of neurological adverse events and mortality with another circulatory support device available to severance provisions,patients compared to the HVAD system. In connection with this decision, the Company recorded an $18charges of $726 million reversal of excess restructuring reserves(MCS charges) within the Cardiovascular segment during the first quarter of fiscal year ended April 29, 2016.
As part of the cost synergies initiative for the fiscal year ended April 29, 2016, the Company2022, including $58 million recognized $23 million of asset write-downs, which included $9 million related to inventory write-offs of discontinued product lines recognized within costin costs of products sold and $668 million recognized within other operating expense, net in the consolidated statementsstatement of income. In addition,income. The charges included $515 million of non-cash impairments and write-downs primarily related to $409 million of intangible asset impairments and $58 million of inventory write-downs. The Company also recorded charges of $211 million for commitments and obligations associated with the decision, which included charges for patient support obligations, restructuring, and other associated costs. During the fourth quarter of fiscal year ended2022, the Company recorded additional charges of $155 million within other operating expense, net primarily related to incremental commitments and obligations associated with the exit of the business. As of April 29, 2016, asset write-downs included $14 million related to property, plant, and equipment impairments.
In the fiscal year ended April 24, 2015, the Company recognized $28 million of asset write-downs, which included $15 million related to inventory write-offs of discontinued product lines and production-related asset impairments recognized within cost of products sold2022, accruals were recorded in the consolidated statementsbalance sheet for these obligations, with $82 million reflected in other accrued expenses and $152 million recorded in other liabilities. Medtronic remains committed to serving the needs of income. In addition, for the fiscal year ended April 24, 2015, asset write-downs included $13 million related to property, plant, and equipment impairments.
Covidien Initiative
Covidien's pre-acquisition restructuring program is designed to improve Covidien's cost structure. The program consists of reducing corporate expenses, expanding shared services, consolidating manufacturing locations, and optimizing distribution centers. The Covidien restructuring initiative is scheduled to be substantially complete by the end of fiscal year 2018. At the Acquisition Date, the Company reserved $103 million in connectionapproximately 3,500 patients currently implanted with the Covidien initiative, which consistedHVAD system.
Medtronic plc
Notes to Consolidated Financial Statements (Continued)
A summary of the activity related to the Covidien initiative is presented below: |
| | | | | | | | | | | |
| | Covidien Initiative |
| (in millions) | Employee Termination Costs | | Other Costs | | Total |
| Balance as of January 26, 2015 (Acquisition Date) | $ | 76 |
| | $ | 27 |
| | $ | 103 |
|
| Restructuring charges | — |
| | — |
| | — |
|
| Payments/write-downs | (10 | ) | | (10 | ) | | (20 | ) |
| Reversal of excess accrual | (5 | ) | | — |
| | (5 | ) |
| Balance as of April 24, 2015 | $ | 61 |
| | $ | 17 |
| | $ | 78 |
|
| Restructuring charges | — |
| | — |
| | — |
|
| Payments/write-downs | (49 | ) | | (12 | ) | | (61 | ) |
| Reversal of excess accrual | (10 | ) | | — |
| | (10 | ) |
| Balance as of April 29, 2016 | $ | 2 |
| | $ | 5 |
| | $ | 7 |
|
In the fiscal year ended April 29, 2016 and April 24, 2015, the Company recorded reversals of excess restructuring reserves related to the Covidien initiative of $10 million and $5 million, respectively. The reversals were primarily a result of certain employees identified for termination finding other positions within the Company and early lease termination negotiations in fiscal year 2015.
4. Special Charges (Gains), Net and Certain Litigation Charges, Net
Special Charges (Gains), Net
During fiscal year 2016, the Company recognized a special charge of $70 million in connection with the impairment of a debt investment.
During fiscal year 2015, the Company recognized a $138 million gain, which consisted of a $41 million gain on the sale of a product line in the Surgical Technologies division and a $97 million gain on the sale of an equity method investment.
During 2015 and 2014, continuing with the Company's commitment to improving the health of people and communities throughout the world, the Company made charitable contributions of $100 million and $40 million, respectively, to the Medtronic Foundation, a related party non-profit organization.
Certain Litigation Charges, Net
The Company classifies material litigation charges and gains recognized as certain litigation charges, net. During fiscal years 2016 and 2015, the Company recorded certain litigation charges, net of $26 million and $42 million, respectively, which primarily relate to additional accounting charges for probable and reasonably estimable INFUSE product liability litigation, which were recorded as a result of additional filed and unfiled claims, and other litigation matters. Refer to Note 15 for additional information.
During fiscal year 2014, the Company recorded certain litigation charges, net of $770 million, which primarily include the global patent settlement agreement with Edwards Lifesciences Corporation of $589 million, accounting charges for probable and reasonably estimable INFUSE product liability litigation of $140 million, and other litigation matters.
5. Financial Instruments
Debt Securities
The Company holds investments consisting primarily ofin marketable debt and equity securities. The authoritative guidance is principally applied to financial assets and liabilities such as marketable equity securities and debt and equity securities that are classified and accounted for as trading and available-for-sale and are measuredremeasured on a recurring basis. Further, we also hold cost or equity method investments which are measured at fair value on a nonrecurring basis.
Medtronic plc
Notes to Consolidated Financial Statements (Continued)
The following table summarizestables summarize the Company's investments in available-for-sale debt securities by significant investment categoriescategory and the related consolidated balance sheet classification at April 29, 2016:2022 and April 30, 2021:
| | | | | | | | | | | | | | | | | | | | | | | | | | | | | | | | | | | |
| April 29, 2022 |
| Valuation | | Balance Sheet Classification |
| (in millions) | Cost | | Unrealized
Gains | | Unrealized
Losses | | Fair Value | | Investments | | Other Assets |
| Level 1: | | | | | | | | | | | |
| U.S. government and agency securities | $ | 533 | | | $ | 1 | | | $ | (15) | | | $ | 518 | | | $ | 518 | | | $ | — | |
| Level 2: | | | | | | | | | | | |
| Corporate debt securities | 4,457 | | | 4 | | | (140) | | | 4,321 | | | 4,321 | | | — | |
| U.S. government and agency securities | 910 | | | — | | | (41) | | | 869 | | | 869 | | | — | |
| Mortgage-backed securities | 592 | | | — | | | (35) | | | 558 | | | 558 | | | — | |
| Non-U.S. government and agency securities | 17 | | | — | | | — | | | 17 | | | 17 | | | — | |
| Certificates of deposit | 20 | | | — | | | — | | | 20 | | | 20 | | | 0 |
| Other asset-backed securities | 567 | | | — | | | (11) | | | 556 | | | 556 | | | — | |
| Total Level 2 | 6,563 | | | 4 | | | (227) | | | 6,341 | | | 6,341 | | | — | |
| Level 3: | | | | | | | | | | | |
| Auction rate securities | 36 | | | — | | | (3) | | | 33 | | | — | | | 33 | |
| Total available-for-sale debt securities | $ | 7,131 | | | $ | 5 | | | $ | (245) | | | $ | 6,893 | | | $ | 6,859 | | | $ | 33 | |
| | | | | | | | | | | | | | | | | | | | | | | | | | | | | | | | | | | |
| April 30, 2021 |
| Valuation | | Balance Sheet Classification |
| (in millions) | Cost | | Unrealized
Gains | | Unrealized
Losses | | Fair Value | | Investments | | Other Assets |
| Level 1: | | | | | | | | | | | |
| U.S. government and agency securities | $ | 505 | | | $ | 26 | | | $ | (3) | | | $ | 528 | | | $ | 528 | | | $ | — | |
| Level 2: | | | | | | | | | | | |
| Corporate debt securities | 4,557 | | | 103 | | | (13) | | | 4,647 | | | 4,647 | | | — | |
| U.S. government and agency securities | 810 | | | — | | | (7) | | | 804 | | | 804 | | | — | |
| Mortgage-backed securities | 645 | | | 21 | | | (16) | | | 650 | | | 650 | | | — | |
| Non-U.S. government and agency securities | 31 | | | 1 | | | — | | | 33 | | | 33 | | | — | |
| Certificates of deposit | 19 | | | — | | | — | | | 19 | | | 19 | | | — | |
| Other asset-backed securities | 534 | | | 4 | | | (1) | | | 537 | | | 537 | | | — | |
| Debt funds | 7 | | | — | | | — | | | 7 | | | 7 | | | — | |
| Total Level 2 | 6,603 | | | 129 | | | (36) | | | 6,696 | | | 6,696 | | | — | |
| Level 3: | | | | | | | | | | | |
| Auction rate securities | 36 | | | — | | | (3) | | | 33 | | | — | | | 33 | |
| Total available-for-sale debt securities | $ | 7,144 | | | $ | 155 | | | $ | (42) | | | $ | 7,257 | | | $ | 7,224 | | | $ | 33 | |
The amortized cost of debt securities excludes accrued interest, which is reported in other current assets in the consolidated balance sheets.
|
| | | | | | | | | | | | | | | | | | | | | | | |
| | Valuation | | Balance Sheet Classification |
| (in millions) | Cost | | Unrealized Gains | | Unrealized Losses | | Fair Value | | Investments | | Other Assets |
| Available-for-sale securities | |
| | |
| | |
| | |
| | | | |
| Level 1: | | | | | | | | | | | |
| U.S. government and agency securities | $ | 792 |
| | $ | 14 |
| | $ | (1 | ) | | $ | 805 |
| | $ | 805 |
| | $ | — |
|
| Marketable equity securities | 75 |
| | 21 |
| | (11 | ) | | 85 |
| |
| | 85 |
|
| Total Level 1 | 867 |
| | 35 |
| | (12 | ) | | 890 |
| | 805 |
| | 85 |
|
| Level 2: | | | | | | | | | | | |
| Corporate debt securities | 3,935 |
| | 85 |
| | (24 | ) | | 3,996 |
| | 3,996 |
| | — |
|
| U.S. government and agency securities | 902 |
| | 2 |
| | — |
| | 904 |
| | 904 |
| | — |
|
| Mortgage-backed securities | 1,016 |
| | 17 |
| | (18 | ) | | 1,015 |
| | 1,015 |
| | — |
|
| Other asset-backed securities | 192 |
| | 3 |
| | — |
| | 195 |
| | 195 |
| | — |
|
| Debt funds | 3,040 |
| | 5 |
| | (281 | ) | | 2,764 |
| | 2,764 |
| | — |
|
| Total Level 2 | 9,085 |
| | 112 |
| | (323 | ) | | 8,874 |
| | 8,874 |
| | — |
|
| Level 3: | | | | | | | | | | | |
| Corporate debt securities | 1 |
| | — |
| | — |
| | 1 |
| | — |
| | 1 |
|
| Auction rate securities | 47 |
| | — |
| | (3 | ) | | 44 |
| | — |
| | 44 |
|
| Total Level 3 | 48 |
| | — |
| | (3 | ) | | 45 |
| | — |
| | 45 |
|
| Total available-for-sale securities | 10,000 |
| | 147 |
| | (338 | ) | | 9,809 |
| | 9,679 |
| | 130 |
|
| Trading securities: | |
| | |
| | |
| | |
| | | | |
| Level 1: | | | | | | | | | | | |
| Exchange-traded funds | 65 |
| | 15 |
| | (1 | ) | | 79 |
| | 79 |
| | — |
|
| Total Level 1: | 65 |
| | 15 |
| | (1 | ) | | 79 |
| | 79 |
| | — |
|
| Total trading securities | 65 |
| | 15 |
| | (1 | ) | | 79 |
| | 79 |
| | — |
|
| Cost method, equity method, and other investments: | | | | | | | | | | | |
| Level 3: | | | | | | | | | | | |
| Cost method, equity method, and other investments | 506 |
| | — |
| | — |
| | N/A |
| | — |
| | 506 |
|
| Total Level 3: | 506 |
| | — |
| | — |
| | N/A |
| | — |
| | 506 |
|
| Total cost method, equity method, and other investments | 506 |
| | — |
| | — |
| | N/A |
| | — |
| | 506 |
|
| Total investments | $ | 10,571 |
| | $ | 162 |
| | $ | (339 | ) |
| $ | 9,888 |
| | $ | 9,758 |
| | $ | 636 |
|
Medtronic plc
Notes to Consolidated Financial Statements (Continued)
The following table summarizes the Company's investments by significant investment categories and the related consolidated balance sheet classification at April 24, 2015:
|
| | | | | | | | | | | | | | | | | | | | | | | |
| | Valuation | | Balance Sheet Classification |
| (in millions) | Cost | | Unrealized Gains | | Unrealized Losses | | Fair Value | | Investments | | Other Assets |
| Available-for-sale securities: | |
| | |
| | |
| | |
| | | | |
| Level 1: | | | | | | | | | | | |
| U.S. government and agency securities | $ | 1,525 |
| | $ | 17 |
| | $ | (1 | ) | | $ | 1,541 |
| | $ | 1,541 |
| | $ | — |
|
| Marketable equity securities | 64 |
| | 35 |
| | (19 | ) | | 80 |
| | — |
| | 80 |
|
| Total Level 1 | 1,589 |
| | 52 |
| | (20 | ) | | 1,621 |
| | 1,541 |
| | 80 |
|
| Level 2: | | | | | | | | | | | |
| Corporate debt securities | 6,282 |
| | 105 |
| | (10 | ) | | 6,377 |
| | 6,377 |
| | — |
|
| U.S. government and agency securities | 1,597 |
| | 4 |
| | (3 | ) | | 1,598 |
| | 1,598 |
| | — |
|
| Mortgage-backed securities | 1,462 |
| | 22 |
| | (6 | ) | | 1,478 |
| | 1,478 |
| | — |
|
| Non-U.S. government and agency securities | 85 |
| | — |
| | — |
| | 85 |
| | 85 |
| | — |
|
| Certificates of deposit | 44 |
| | — |
| | — |
| | 44 |
| | 44 |
| | — |
|
| Other asset-backed securities | 504 |
| | 3 |
| | — |
| | 507 |
| | 507 |
| | — |
|
| Debt funds | 3,061 |
| | 19 |
| | (150 | ) | | 2,930 |
| | 2,930 |
| | — |
|
| Total Level 2 | 13,035 |
| | 153 |
| | (169 | ) | | 13,019 |
| | 13,019 |
| | — |
|
| Level 3: | | | | | | | | | | | |
| Corporate debt securities | 1 |
| | — |
| | — |
| | 1 |
| | — |
| | 1 |
|
| Auction rate securities | 109 |
| | — |
| | (4 | ) | | 105 |
| | — |
| | 105 |
|
| Total Level 3 | 110 |
| | — |
| | (4 | ) | | 106 |
| | — |
| | 106 |
|
| Total available-for-sale securities | 14,734 |
| | 205 |
| | (193 | ) | | 14,746 |
| | 14,560 |
| | 186 |
|
| Trading securities: | |
| | |
| | |
| | |
| | | | |
| Level 1: | | | | | | | | | | | |
| Exchange-traded funds | 58 |
| | 19 |
| | — |
| | 77 |
| | 77 |
| | — |
|
| Total Level 1 | 58 |
| | 19 |
| | — |
| | 77 |
| | 77 |
| | — |
|
| Total trading securities | 58 |
| | 19 |
| | — |
| | 77 |
| | 77 |
| | — |
|
| Cost method, equity method, and other investments: | | | | | | | | | | | |
| Level 3: | | | | | | | | | | | |
| Cost method, equity method, and other investments | 520 |
| | — |
| | — |
| | N/A |
| | — |
| | 520 |
|
| Total Level 3 | 520 |
| | — |
| | — |
| | N/A |
| | — |
| | 520 |
|
| Total cost method, equity method, and other investments | 520 |
| | — |
| | — |
| | N/A |
| | — |
| | 520 |
|
| Total investments | $ | 15,312 |
| | $ | 224 |
| | $ | (193 | ) | | $ | 14,823 |
| | $ | 14,637 |
| | $ | 706 |
|
Medtronic plc
Notes to Consolidated Financial Statements (Continued)
Marketable Debt and Equity Securities:
The following tables showpresent the gross unrealized losses and fair values of the Company’s available-for-sale debt securities that have been in a continuous unrealized loss position deemed to be temporary, aggregated by investment category as ofat April 29, 20162022 and April 24, 2015:30, 2021: | | | | April 29, 2016 | | April 29, 2022 |
| | Less than 12 months | | More than 12 months | | Less than 12 months | | More than 12 months |
| (in millions) | Fair Value | | Unrealized
Losses | | Fair Value | | Unrealized
Losses | (in millions) | Fair Value | | Unrealized
Losses | | Fair Value | | Unrealized
Losses |
| U.S. government and agency securities | | U.S. government and agency securities | $ | — | | | $ | — | | | $ | 945 | | | $ | (56) | |
| Corporate debt securities | $ | 756 |
| | $ | (18 | ) | | $ | 136 |
| | $ | (6 | ) | Corporate debt securities | 222 | | | (1) | | | 2,993 | | | (139) | |
| Mortgage-backed securities | | Mortgage-backed securities | — | | | — | | | 507 | | | (35) | |
| Other asset-backed securities | | Other asset-backed securities | — | | | — | | | 526 | | | (11) | |
| Auction rate securities | — |
| | — |
| | 44 |
| | (3 | ) | Auction rate securities | — | | | — | | | 33 | | | (3) | |
| Mortgage-backed securities | 196 |
| | (5 | ) | | 92 |
| | (5 | ) | |
| U.S. government and agency securities | 308 |
| | (4 | ) | | 67 |
| | (5 | ) | |
| Debt funds | 670 |
| | (26 | ) | | 1,601 |
| | (256 | ) | |
| Marketable equity securities | 45 |
| | (11 | ) | | — |
| | — |
| |
| Total | $ | 1,975 |
| | $ | (64 | ) | | $ | 1,940 |
| | $ | (275 | ) | Total | $ | 222 | | | $ | (1) | | | $ | 5,004 | | | $ | (244) | |
| | | | | | | | | | | | | | | | | | | | | | | |
| | April 30, 2021 |
| | Less than 12 months | | More than 12 months |
| (in millions) | Fair Value | | Unrealized
Losses | | Fair Value | | Unrealized
Losses |
| U.S. government and agency securities | $ | 946 | | | $ | (10) | | | $ | — | | | $ | — | |
| Corporate debt securities | — | | | — | | | 3,209 | | | (13) | |
| Mortgage-backed securities | — | | | — | | | 650 | | | (16) | |
| Other asset-backed securities | — | | | — | | | 531 | | | (1) | |
| Auction rate securities | — | | | — | | | 33 | | | (3) | |
| Total | $ | 946 | | | $ | (10) | | | $ | 4,423 | | | $ | (32) | |
|
| | | | | | | | | | | | | | | |
| | April 24, 2015 |
| | Less than 12 months | | More than 12 months |
| (in millions) | Fair Value | | Unrealized Losses | | Fair Value | | Unrealized Losses |
| Corporate debt securities | $ | 944 |
| | $ | (9 | ) | | $ | 34 |
| | $ | (1 | ) |
| Auction rate securities | — |
| | — |
| | 105 |
| | (4 | ) |
| Mortgage-backed securities | 346 |
| | (3 | ) | | 206 |
| | (3 | ) |
| U.S. government and agency securities | 356 |
| | (1 | ) | | 267 |
| | (3 | ) |
| Debt funds | 1,291 |
| | (109 | ) | | 559 |
| | (41 | ) |
| Marketable equity securities | 4 |
| | (19 | ) | | — |
| | — |
|
| Total | $ | 2,941 |
| | $ | (141 | ) | | $ | 1,171 |
| | $ | (52 | ) |
The following table represents the range of the unobservable inputs utilized in the fair value measurement of the auction rate securities classified as Level 3 as of April 29, 2016:
|
| | | |
| Valuation Technique | Unobservable Input | Range (Weighted Average) |
Auction rate securities | Discounted cash flow | Years to principal recovery | 2 yrs. - 12 yrs. (3 yrs.) |
Illiquidity premium | 6% |
The Company reviews the fair value hierarchy classification on a quarterly basis. Changes in the ability to observe valuation inputs may result in a reclassification of levels for certain securities within the fair value hierarchy. The Company’s policy is to recognize transfers into and out of levels within the fair value hierarchy at the end of the fiscal quarter in which the actual event or change in circumstances that caused the transfer occurs. There were no transfers between Level 1, Level 2,into or out of Level 3 during the twelve monthsfiscal years ended April 29, 2016.2022 and April 30, 2021. When a determination is made to classify an asset or liability within Level 3, the determination is based upon the significance of the unobservable inputs to the overall fair value measurement.
Medtronic plc
Notes to Consolidated Financial Statements (Continued)
The following tables provide a reconciliation of the beginning and ending balances of items measured at fair value on a recurring basis that used significant unobservable inputs (Level 3):
|
| | | | | | | | | | | |
| (in millions) | Total Level 3
Investments | | Corporate debt
securities | | Auction rate
securities |
| Balance as of April 24, 2015 | $ | 106 |
| | $ | 1 |
| | $ | 105 |
|
| Total unrealized gains/(losses) included in other comprehensive income | (3 | ) | | — |
| | (3 | ) |
| Settlements | (58 | ) | | — |
| | (58 | ) |
| Balance as of April 29, 2016 | $ | 45 |
| | $ | 1 |
| | $ | 44 |
|
| | | | | | |
| (in millions) | Total Level 3
Investments | | Corporate debt
securities | | Auction rate
securities |
| Balance as of April 25, 2014 | $ | 106 |
| | $ | 9 |
| | $ | 97 |
|
| Total realized losses and other-than-temporary impairment losses included in earnings | (5 | ) | | (5 | ) | | — |
|
| Total unrealized gains/(losses) included in other comprehensive income | 10 |
| | 2 |
| | 8 |
|
| Settlements | (5 | ) | | (5 | ) | | — |
|
| Balance as of April 24, 2015 | $ | 106 |
| | $ | 1 |
| | $ | 105 |
|
Activity related to the Company’s investmentavailable-for-sale debt securities portfolio is as follows: | | | | Fiscal Year | |
| | 2016 | | 2015 | | 2014 | | | | | | | | | | | | | | | |
| (in millions) | Debt(1) | | Equity(2) | | Debt(1) | | Equity(2)(3) | | Debt(1) | | Equity(2)(3) | (in millions) | April 29, 2022 | | April 30, 2021 | | April 24, 2020 |
| Proceeds from sales | $ | 9,881 |
| | $ | 42 |
| | $ | 5,640 |
| | $ | 250 |
| | $ | 7,991 |
| | $ | 120 |
| |
| Proceeds from sales and maturities | | Proceeds from sales and maturities | $ | 9,611 | | | $ | 10,420 | | | $ | 9,559 | |
| Gross realized gains | 36 |
| | 38 |
| | 33 |
| | 164 |
| | 15 |
| | 69 |
| Gross realized gains | 15 | | | 15 | | | 25 | |
| Gross realized losses | (53 | ) | | — |
| | (19 | ) | | — |
| | (12 | ) | | — |
| Gross realized losses | (18) | | | (14) | | | (22) | |
| Impairment losses recognized | — |
| | (114 | ) | | — |
| | (29 | ) | | (1 | ) | | (9 | ) | |
| |
(1) | Includes available-for-sale debt securities. |
| |
(2) | Includes marketable equity securities, cost method, equity method, exchange-traded funds, and other investments. |
| |
(3) | As a result of certain acquisitions that occurred during the fiscal year ended April 29, 2016, the Company recognized a non-cash realized gain of $9 million on its previously-held minority investment included in other expense, net on the consolidated statement of income.
|
| |
(4) | As a result of certain acquisitions that occurred during the fiscal year ended April 24, 2015, the Company recognized a non-cash realized gain of $41 million on its previously-held minority investments included in other expense, net on the consolidated statement of income. Also, a realized gain on an equity method investment totaling $97 million is included in special (gains) charges, net on the consolidated statement of income.
|
Credit losses representDuring the difference between the present value of cash flows expected to be collected on certain mortgage-backed securities and auction rate securities and the amortized cost of these securities. Based on the Company’s assessment of the credit quality of the underlying collateral and credit support available to each of the remaining securities in which invested,fiscal year ended April 30, 2021, the Company believes it has recorded all necessary other-than-temporary impairmentshad proceeds from maturities of investments classified as the Company does not have the intentheld to sell, nor is it more likely than not that the Company will be required to sell, before recoverymaturity of the amortized cost.
As of April 29, 2016 and April 24, 2015, the credit loss portion of other-than temporary impairments on debt securities were not significant. The total reductions for available-for-sale debt securities sold during the fiscal years ended April 29, 2016 and April 24, 2015 were not significant.
Medtronic plc
Notes to Consolidated Financial Statements (Continued)
$911 million.
The April 29, 20162022 balance of available-for-sale debt securities excluding debt funds which have no single maturity date, by contractual maturity is shown in the following table. Within the table, maturities of mortgage-backed securities have been allocated based upon timing of estimated cash flows assuming no change in the current interest rate environment. Actual maturities may differ from contractual maturities because the issuers of the securities may have the right to prepay obligations without prepayment penalties.
| | | | | |
| (in millions) | April 29, 2022 |
| Due in one year or less | $ | 1,501 | |
| Due after one year through five years | 3,465 | |
| Due after five years through ten years | 1,271 | |
| Due after ten years | 656 | |
| Total debt securities | $ | 6,893 | |
|
| | | |
| (in millions) | April 29, 2016 |
| Due in one year or less | $ | 899 |
|
| Due after one year through five years | 3,181 |
|
| Due after five years through ten years | 2,792 |
|
| Due after ten years | 88 |
|
| Total debt securities | $ | 6,960 |
|
The Company holds investments in marketable equity securities, which are classified as other assets in the consolidated balance sheets. The aggregate carrying amount of these investments was $85 million and $80 million as of April 29, 2016 and April 24, 2015, respectively. During the fiscal years ended April 29, 2016 and April 24, 2015, the Company determined that the fair value of certain marketable equity securities were below their carrying values and that the carrying values of these investments were not expected to be recoverable within a reasonable period of time. As a result, the Company recognized $20 million and $7 million in impairment charges for fiscal years 2016 and 2015 respectively, which were recognized within other expense, net in the consolidated statements of income. There were no marketable equity securities impairment charges recognized for the fiscal year ended April 25, 2014.
Cost method, equity method, and other investments
The Company holds investments in equity and other securities that are accounted for using the cost or equity method, which are classified as other assets in the consolidated balance sheets. As of April 29, 2016 and April 24, 2015, the aggregate carrying amount of equity and other securities without a quoted market price and accounted for using the cost or equity method was $506 million and $520 million, respectively. These cost or equity method investments are measured at fair value on a nonrecurring basis. The total carrying value of these investments is reviewed quarterly for changes in circumstance or the occurrence of events that suggest the Company’s investment may not be recoverable. The value of cost or equity method investments is not adjusted if there are no identified events or changes in circumstances that may have a material adverse effect on the fair value of the investment.
During the fiscal year ended April 29, 2016, the Company determined that the fair values of certain cost method investments were below their carrying values and that the carrying values of these investments were not expected to be recoverable within a reasonable period of time. As a result, the Company recognized $23 million in impairment charges during the fiscal year ended April 29, 2016, which was recorded in other expense, net and $70 million in impairment charges which was recorded in special charges (gains), net in the consolidated statements of income. During the fiscal year ended April 24, 2015, and April 25, 2014 the Company determined that the fair values of certain cost method investments were below their carrying values and that the carrying values of these investments were not expected to be recoverable within a reasonable period of time. As a result, the Company recognized $7 million and $10 million in impairment charges during fiscal years 2015 and 2014 respectively, which were recorded in other expense, net in the consolidated statements of income. These investments fall within Level 3 of the fair value hierarchy, due to the use of significant unobservable inputs to determine fair value, as the investments are privately-held entities without quoted market prices. To determine the fair value of these investments, the Company used all pertinent financial information available related to the entities, including financial statements and market participant valuations from recent and proposed equity offerings.
Medtronic plc
Notes to Consolidated Financial Statements (Continued)
6. GoodwillEquity Securities, Equity Method Investments, and Other Intangible Assets, Net
Goodwill
The changes in the carrying amount of goodwill for fiscal years 2016 and 2015 are as follows:
|
| | | | | | | | | | | | | | | | | | | |
| (in millions) | Cardiac and Vascular Group | | Minimally Invasive Therapies Group | | Restorative Therapies Group | | Diabetes Group | | Total |
| Balance as of April 25, 2014 | $ | 2,881 |
| | $ | — |
| | $ | 6,368 |
| | $ | 1,344 |
| | $ | 10,593 |
|
| Goodwill as a result of Covidien acquisition | 2,795 |
| | 23,399 |
| | 2,892 |
| | 500 |
| | 29,586 |
|
| Goodwill as a result of other acquisitions | 245 |
| | — |
| | 218 |
| | 9 |
| | 472 |
|
| Other adjustments, net | — |
| | — |
| | (9 | ) | | — |
| | (9 | ) |
| Currency adjustment, net | (66 | ) | | — |
| | (45 | ) | | (1 | ) | | (112 | ) |
| Balance as of April 24, 2015 | $ | 5,855 |
| | $ | 23,399 |
| | $ | 9,424 |
| | $ | 1,852 |
| | $ | 40,530 |
|
| Goodwill as a result of acquisitions | 393 |
| | 264 |
| | 199 |
| | — |
| | 856 |
|
| Measurement period adjustments related to Covidien | 21 |
| | 346 |
| | 26 |
| | — |
| | 393 |
|
| Other adjustments, net | — |
| | (34 | ) | | 3 |
| | — |
| | (31 | ) |
| Currency adjustment, net | (26 | ) | | (191 | ) | | (32 | ) | | 1 |
| | (248 | ) |
| Balance as of April 29, 2016 | $ | 6,243 |
| | $ | 23,784 |
| | $ | 9,620 |
| | $ | 1,853 |
| | $ | 41,500 |
|
The Company assesses goodwillholds investments in equity securities with readily determinable fair values, equity investments without readily determinable fair values, investments accounted for impairment annuallyunder the equity method, and other investments. Equity securities with readily determinable fair values are included in the third quarter and whenever an event occurs or circumstances change that would indicate that the carrying amount may be impaired. Impairment testing for goodwill is performed at the reporting unit level. The Company included the Minimally Invasive Therapies Group as an additional reporting unit in its annual impairment testing performed in the third quarterLevel 1 of fiscal year 2016. No other changes were made to reporting units during fiscal year 2016. The test for impairment of goodwill requires the Company to make several estimates about fair value, most of which are based on projected future cash flows. The Company calculated the excess of each reporting unit's fair value over its carrying amount, including goodwill, utilizing a discounted cash flow analysis. As a result of the analysis performed, the fair value of each reporting unit's goodwill was deemed to be greater than the carrying value. The Company did not record any goodwill impairments during fiscal years 2016, 2015, or 2014.
Intangible Assets Carrying Value
The gross carrying amounthierarchy, as they are measured using quoted market prices. Equity method investments and accumulated amortization of intangible assets at the end of fiscal years 2016 and 2015 are as follows:
|
| | | | | | | | | | | | | | | |
| | Fiscal Year 2016 | | Fiscal Year 2015 |
| (in millions) | Gross Carrying Amount | | Accumulated Amortization | | Gross Carrying Amount | | Accumulated Amortization |
| Definite-lived | | | | | | | |
| Customer-related | $ | 18,596 |
| | $ | (1,331 | ) | | $ | 18,492 |
| | $ | (273 | ) |
| Purchased technology and patents | 11,397 |
| | (2,976 | ) | | 11,118 |
| | (2,268 | ) |
| Trademarks and tradenames | 854 |
| | (403 | ) | | 640 |
| | (363 | ) |
| Other | 72 |
| | (31 | ) | | 79 |
| | (44 | ) |
| Total | $ | 30,919 |
| | $ | (4,741 | ) | | $ | 30,329 |
| | $ | (2,948 | ) |
| Indefinite-lived | | | | | | | |
| IPR&D | $ | 721 |
| | | | $ | 470 |
| | |
| Tradenames | — |
| | | | 250 |
| | |
| Total | $ | 721 |
| | | | $ | 720 |
| | |
The Company assesses indefinite-lived assets for impairment annually in the third quarter and whenever an event occurs or circumstances change that would indicate that the carrying amount may be impaired. Similar to the goodwill impairment test, the
Medtronic plc
Notes to Consolidated Financial Statements (Continued)
indefinite-lived assets impairment test requires the Company to make several estimates about fair value, most of which are based on projected future cash flows. The Company calculates the excess of indefinite-lived assetinvestments without readily determinable fair values over their carrying values utilizing a discounted future cash flow analysis. The Company did not record any significant indefinite-lived asset impairments during fiscal year 2016. As a result of the analysis performed during fiscal year 2015, the fair value of certain IPR&D indefinite-lived assets were deemed to be less than their carrying value, resulting in an impairment loss of $5 million, which was recorded in acquisition-related items in the consolidated statements of income. During fiscal year 2014, the fair value of IPR&D indefinite-lived assets were deemed to be less than the carrying value, resulting in a pre-tax impairment loss of $207 million primarily related to the Ardian acquisition and was recorded in acquisition-related items in the consolidated statements of income. See discussion below for additional information on impairments recorded on the Ardian long-lived asset group. Due to the nature of IPR&D projects, the Company may experience future delays or failures to obtain regulatory approvals to conduct clinical trials, failures of such clinical trials, delays or failures to obtain required market clearances or other failures to achieve a commercially viable product, and as a result, may record impairment losses in the future.
The Company assesses definite-lived intangible assets for impairment whenever events or changes in circumstances indicate that the carrying amount of an intangible asset (asset group) may not be recoverable. When events or changes in circumstances indicate that the carrying amount of an intangible asset may not be recoverable, the Company calculates the excess of an intangible asset's carrying value over its undiscounted future cash flows. If the carrying value is not recoverable, an impairment loss is recorded based on the amount by which the carrying value exceeds the fair value. The inputs used in the fair value analysis fallare included within Level 3 of the fair value hierarchy due to the use of significant unobservable inputs to determine fair value. The Company did not record any intangible asset impairments during fiscal year 2016 and 2015. During fiscal year 2014, the Company determined that a change in events and circumstances indicated that the carrying amount of certain definite-lived intangible assets, representing less than five percent of the total aggregate carrying amount of intangible assets, may not be fully recoverable. During fiscal year 2014, the carrying amount of Ardian definite-lived intangible assets was less than the undiscounted future cash flows, therefore, the Company assessedTo determine the fair value of these investments, the Company uses all pertinent financial information available related to the investees, including financial statements, market participant valuations from recent and proposed equity offerings, and other third-party data.
The following table summarizes the Company's equity and other investments atApril 29, 2022 and April 30, 2021, which are classified as other assets in the consolidated balance sheets:
| | | | | | | | | | | | | | |
| (in millions) | | April 29, 2022 | | April 30, 2021 |
| Investments with readily determinable fair value (marketable equity securities) | | $ | 64 | | | $ | 74 | |
| Investments without readily determinable fair values | | 732 | | | 537 | |
| Equity method and other investments | | 85 | | | 76 | |
| Total equity and other investments | | $ | 881 | | | $ | 687 | |
The table below includes activity related to the Company’s portfolio of equity and recorded an impairment of $41 million that was includedother investments. Gains and losses on equity and other investments are recognized in acquisition-related itemsother non-operating income, net in the consolidated statements of income.
Intangible Asset Amortization | | | | | | | | | | | | | | | | | | | | |
| (in millions) | | April 29, 2022 | | April 30, 2021 | | April 24, 2020 |
| Proceeds from sales | | $ | 81 | | | $ | 13 | | | $ | 15 | |
| Gross gains | | 99 | | | 68 | | | 17 | |
| Gross losses | | (52) | | | (3) | | | (30) | |
| Impairment losses recognized | | (17) | | | (4) | | | (4) | |
Amortization expense for fiscal years 2016, 2015, and 2014 was $1.9 billion, $733 million, and $349 million, respectively.
Estimated aggregate amortization expense byDuring the fiscal year basedended April 29, 2022, there were $8 million of net unrealized gains on equity securities and other investments still held at April 29, 2022. During the current carrying valuefiscal year ended April 30, 2021, there were $63 million of definite-lived intangible assets, excluding any possible future amortization associated with acquired IPR&D, which has not met technological feasibility, is as follows:net unrealized gains on equity securities and other investments still held at April 30, 2021.
|
| | | |
(in millions) Fiscal Year | Amortization Expense |
| 2017 | $ | 1,931 |
|
| 2018 | 1,899 |
|
| 2019 | 1,805 |
|
| 2020 | 1,757 |
|
| 2021 | 1,739 |
|
Medtronic plc
Notes to Consolidated Financial Statements (Continued)
7.6. Financing Arrangements
Short-termCurrent debt obligations consisted of the following: | | | | | | | | | | | |
| (in millions) | April 29, 2022 | | April 30, 2021 |
| Bank borrowings | $ | 12 | | | $ | 2 | |
0.000 percent three-year 2019 senior notes | 798 | | | — | |
0.375 percent four-year 2019 senior notes | 1,596 | | | — | |
0.000 percent two-year 2020 senior notes | 1,330 | | | — | |
| Finance lease obligations | 6 | | | 9 | |
| | | |
| Current debt obligations | $ | 3,742 | | | $ | 11 | |
|
| | | | | | | | |
| (in millions) | | April 29, 2016 | | April 24, 2015 |
| Capital lease obligations | | $ | 106 |
| | $ | 16 |
|
| Bank borrowings | | 387 |
| | 303 |
|
| Floating rate three-year 2014 senior notes | | 250 |
| | — |
|
| 0.875 percent three-year 2014 senior notes | | 250 |
| | — |
|
| 2.625 percent five-year 2011 senior notes | | — |
| | 500 |
|
| 4.750 percent ten-year 2005 senior notes | | — |
| | 600 |
|
| 1.350 percent 2012 CIFSA senior notes | | — |
| | 600 |
|
| 2.800 percent 2010 CIFSA senior notes | | — |
| | 400 |
|
| Interest rate swaps | | — |
| | 10 |
|
| Debt premium | | — |
| | 5 |
|
| Total Short-Term Borrowings | | $ | 993 |
| | $ | 2,434 |
|
Commercial Paper On January 26, 2015, Medtronic Global Holdings S.C.A. (Medtronic Luxco), an entity organized under the laws of Luxembourg, (Medtronic Luxco), entered into various agreements pursuant to which Medtronic Luxco may issue United States Dollar-denominated unsecured commercial paper notes (the 2015 Commercial PaperCP Program) on a private placement basis, upand on January 31, 2020 Medtronic Luxco entered into various agreements pursuant to which Medtronic Luxco may issue Euro-denominated unsecured commercial paper notes (the 2020 CP Program) on a maximumprivate placement basis. The Maximum aggregate amount outstanding at any time under the 2015 CP Program and the 2020 CP Program together may not exceed the equivalent of $3.5 billion. The Company and Medtronic, Inc. have guaranteed the obligations of Medtronic Luxco under the 2015 Commercial PaperCP Program and the 2020 CP Program. No amounts were
There was no commercial paper outstanding as ofat April 29, 20162022 and April 24,2015.
30, 2021, or during fiscal year 2021. During fiscal years 2016 and 2015,year 2022, the weighted average original maturity of the commercial paper outstanding was approximately 49 and 52fifteen days respectively, and the weighted average interest
Medtronic plc
Notes to Consolidated Financial Statements (Continued)
rate was 0.57 percent and 0.13 percent, respectively.0.70 percent. The issuance of commercial paper reduces the amount of credit available under the Company's existing line of credit.credit facility, defined below.
Bank Borrowings Outstanding bank borrowings as of April 29, 2016 were short-term advances to certain non-U.S. subsidiaries under credit agreements with various banks. Bank borrowings consist primarily of borrowings at interest rates considered favorable by management ranging from 0.18% to 0.19% and the borrowing is a natural hedge of currency and exchange rate risk.
Line of Credit The Company has a $3.5 billion Five Year Revolving Credit Facility ($3.5 billion Five Year Revolving Credit On December 12, 2021, Medtronic Luxco, as borrower, entered into an amendment to its amended and restated credit agreement (Credit Facility), by and among Medtronic, Medtronic, Inc., Medtronic Luxco, the lenders from time to time party thereto, and Bank of America, N.A., as administrative agent and issuing bank, which expires in January 2020. extending the maturity date of the Credit Facility to December 2026 and removing the cap on the number of extension options available.
The Credit Facility provides for a $3.5 billion Five Year Revolvingfive-year unsecured revolving credit facility (Credit Facility). At each anniversary date of the Credit Facility we can request a one-year extension of the maturity date. The Credit Facility provides the Company with the ability to increase its borrowing capacity by an additional $500 million$1.0 billion at any time during the term of the agreement. At each anniversary date of the $3.5 billion Five Year Revolving Credit Facility, but not more than twice prior to the maturity date, the Company could also request a one-year extension of the maturity date. The Company Medtronic Luxco, and Medtronic, Inc. have guaranteed the obligations of the borrowers under the Credit Facility, and Medtronic Luxco will also guarantee the obligations under the Amended and Restated Revolvingof any designated borrower. The Credit Agreement. As ofFacility includes a multi-currency borrowing feature for certain specified foreign currencies. At April 29, 20162022 and April 24, 2015,30, 2021, no amounts were outstanding onunder the committed line of credit.Credit Facility.
Interest rates on advances on the Credit Facility are determined by a pricing matrix based on the Company’s long-term debt ratings, assigned by Standard & Poor’s Ratings Services and Moody’s Investors Service. Facility fees are payable on the Credit Facility and are determined in the same manner as the interest rates. The agreement also contains customary covenants, all of which the Company remainsis in compliance with asall covenants related to the Credit Facility.
Medtronic plc
Notes to Consolidated Financial Statements (Continued)
Long-termThe Company's long-term debt obligations consisted of the following:
| | | | | | | | | | | | | | | | | | | | | | | | | | | | | |
| | | | April 29, 2022 | | April 30, 2021 |
| (in millions, except interest rates) | Maturity by Fiscal Year | | Amount | | Effective Interest Rate | | Amount | | Effective Interest Rate |
0.000 percent three-year 2019 senior notes | 2023 | | $ | — | | | — | % | | $ | 907 | | | 0.08 | % |
0.375 percent four-year 2019 senior notes | 2023 | | — | | | — | | | 1,813 | | | 0.55 | |
0.000 percent two-year 2020 senior notes | 2023 | | — | | | — | | | 1,511 | | | 0.12 | |
3.500 percent ten-year 2015 senior notes | 2025 | | 1,890 | | | 3.74 | | | 1,890 | | | 3.74 | |
0.250 percent six-year 2019 senior notes | 2026 | | 1,064 | | | 0.45 | | | 1,209 | | | 0.43 | |
0.000 percent five-year 2020 senior notes | 2026 | | 1,064 | | | 0.25 | | | 1,209 | | | 0.22 | |
1.125 percent eight-year 2019 senior notes | 2027 | | 1,596 | | | 1.26 | | | 1,813 | | | 1.24 | |
3.350 percent ten-year 2017 senior notes | 2027 | | 368 | | | 3.53 | | | 368 | | | 3.53 | |
0.375 percent eight-year 2020 senior notes | 2029 | | 1,064 | | | 0.52 | | | 1,209 | | | 0.51 | |
1.625 percent twelve-year 2019 senior notes | 2031 | | 1,064 | | | 1.75 | | | 1,209 | | | 1.74 | |
1.000 percent twelve-year 2019 senior notes | 2032 | | 1,064 | | | 1.06 | | | 1,209 | | | 1.05 | |
0.750 percent twelve-year 2020 senior notes | 2033 | | 1,064 | | | 0.81 | | | 1,209 | | | 0.81 | |
4.375 percent twenty-year 2015 senior notes | 2035 | | 1,932 | | | 4.47 | | | 1,932 | | | 4.47 | |
6.550 percent thirty-year 2007 CIFSA senior notes | 2038 | | 253 | | | 4.67 | | | 253 | | | 4.67 | |
2.250 percent twenty-year 2019 senior notes | 2039 | | 1,064 | | | 2.35 | | | 1,209 | | | 2.34 | |
6.500 percent thirty-year 2009 senior notes | 2039 | | 158 | | | 6.56 | | | 158 | | | 6.56 | |
1.500 percent twenty-year 2019 senior notes | 2040 | | 1,064 | | | 1.59 | | | 1,209 | | | 1.58 | |
5.550 percent thirty-year 2010 senior notes | 2040 | | 224 | | | 5.58 | | | 224 | | | 5.58 | |
1.375 percent twenty-year 2020 senior notes | 2041 | | 1,064 | | | 1.47 | | | 1,209 | | | 1.46 | |
4.500 percent thirty-year 2012 senior notes | 2042 | | 105 | | | 4.54 | | | 105 | | | 4.54 | |
4.000 percent thirty-year 2013 senior notes | 2043 | | 305 | | | 4.09 | | | 305 | | | 4.09 | |
4.625 percent thirty-year 2014 senior notes | 2044 | | 127 | | | 4.67 | | | 127 | | | 4.67 | |
4.625 percent thirty-year 2015 senior notes | 2045 | | 1,813 | | | 4.69 | | | 1,813 | | | 4.69 | |
1.750 percent thirty-year 2019 senior notes | 2050 | | 1,064 | | | 1.88 | | | 1,209 | | | 1.87 | |
1.625 percent thirty-year 2020 senior notes | 2051 | | 1,064 | | | 1.76 | | | 1,209 | | | 1.75 | |
| | | | | | | | | |
| Finance lease obligations | 2023-2035 | | 56 | | | 9.15 | | | 62 | | | 9.29 | |
| Debt discount, net | 2023-2051 | | (52) | | | — | | | (75) | | | — | |
| Deferred financing costs | 2023-2051 | | (109) | | | — | | | (125) | | | — | |
| Long-term debt | | | $ | 20,372 | | | | | $ | 26,378 | | | |
|
| | | | | | | | | | | | | | | |
| | | | April 29, 2016 | | April 24, 2015 |
| (in millions, except interest rates) | Maturity by Fiscal Year | | Payable | | Effective Interest Rate | | Payable | | Effective Interest Rate |
| Floating rate three-year 2014 senior notes | 2017 | | $ | — |
| | — | % | | $ | 250 |
| | 0.32 | % |
| 0.875 percent three-year 2014 senior notes | 2017 | | — |
| | — |
| | 250 |
| | 0.91 |
|
| 6.000 percent ten-year 2008 CIFSA senior notes | 2018 | | 1,150 |
| | 1.41 |
| | 1,150 |
| | 1.41 |
|
| 1.375 percent five-year 2013 senior notes | 2018 | | 1,000 |
| | 1.41 |
| | 1,000 |
| | 1.41 |
|
| 1.500 percent three-year 2015 senior notes | 2018 | | 1,000 |
| | 1.59 |
| | 1,000 |
| | 1.59 |
|
| 5.600 percent ten-year 2009 senior notes | 2019 | | 400 |
| | 5.61 |
| | 400 |
| | 5.61 |
|
| 4.450 percent ten-year 2010 senior notes | 2020 | | 766 |
| | 4.47 |
| | 1,250 |
| | 4.47 |
|
| 2.500 percent five-year 2015 senior notes | 2020 | | 2,500 |
| | 2.52 |
| | 2,500 |
| | 2.52 |
|
| Floating rate five-year 2015 senior notes | 2020 | | 500 |
| | 1.04 |
| | 500 |
| | 1.04 |
|
| 4.200 percent ten-year 2010 CIFSA senior notes | 2021 | | 600 |
| | 2.22 |
| | 600 |
| | 2.22 |
|
| 4.125 percent ten-year 2011 senior notes | 2021 | | 500 |
| | 4.19 |
| | 500 |
| | 4.19 |
|
| 3.125 percent ten-year 2012 senior notes | 2022 | | 675 |
| | 3.16 |
| | 675 |
| | 3.16 |
|
| 3.200 percent ten-year 2012 CIFSA senior notes | 2023 | | 650 |
| | 2.66 |
| | 650 |
| | 2.66 |
|
| 3.150 percent seven-year 2015 senior notes | 2022 | | 2,500 |
| | 3.18 |
| | 2,500 |
| | 3.18 |
|
| 2.750 percent ten-year 2013 senior notes | 2023 | | 530 |
| | 2.78 |
| | 1,250 |
| | 2.78 |
|
| 2.950 percent ten-year 2013 CIFSA senior notes | 2024 | | 310 |
| | 2.67 |
| | 750 |
| | 2.67 |
|
| 3.625 percent ten-year 2014 senior notes | 2024 | | 850 |
| | 3.65 |
| | 850 |
| | 3.65 |
|
| 3.500 percent ten-year 2015 senior notes | 2025 | | 4,000 |
| | 3.61 |
| | 4,000 |
| | 3.61 |
|
| 4.375 percent twenty-year 2015 senior notes | 2035 | | 2,382 |
| | 4.44 |
| | 2,500 |
| | 4.44 |
|
| 6.550 percent thirty-year 2007 CIFSA senior notes | 2038 | | 374 |
| | 3.75 |
| | 850 |
| | 3.75 |
|
| 6.500 percent thirty-year 2009 senior notes | 2039 | | 300 |
| | 6.52 |
| | 300 |
| | 6.52 |
|
| 5.550 percent thirty-year 2010 senior notes | 2040 | | 500 |
| | 5.56 |
| | 500 |
| | 5.56 |
|
| 4.500 percent thirty-year 2012 senior notes | 2042 | | 400 |
| | 4.51 |
| | 400 |
| | 4.51 |
|
| 4.000 percent thirty-year 2013 senior notes | 2043 | | 325 |
| | 4.12 |
| | 750 |
| | 4.12 |
|
| 4.625 percent thirty-year 2014 senior notes | 2044 | | 650 |
| | 4.67 |
| | 650 |
| | 4.67 |
|
| 4.625 percent thirty-year 2015 senior notes | 2045 | | 4,000 |
| | 4.64 |
| | 4,000 |
| | 4.64 |
|
| Three-year term loan | 2018 | | 3,000 |
| | 1.12 |
| | 3,000 |
| | 1.12 |
|
| Interest rate swaps | 2021-2022 | | 89 |
| | — |
| | 79 |
| | — |
|
| Deferred gains from interest rate swap terminations, net | — | | — |
| | — |
| | 3 |
| | — |
|
| Capital lease obligations | 2018-2026 | | 26 |
| | 4.66 |
| | 129 |
| | 3.52 |
|
| Bank borrowings | 2018-2021 | | 56 |
| | 6.46 |
| | 17 |
| | — |
|
| Debt premium (discount) | 2018-2045 | | 214 |
| | — |
| | 499 |
| | — |
|
| Total Long-Term Debt | | | $ | 30,247 |
| | |
| | $ | 33,752 |
| | |
|
Senior Notes The Company has outstanding unsecured senior obligations, including those indicateddescribed as senior notes in the long-term debt tabletables above (collectively, the Senior Notes). The Senior Notes rank equally with all other unsecured and unsubordinated indebtedness of the Company. The indentures under which the Senior Notes were issued contain customary covenants, all of which the Company remainsis in compliance with asall covenants related to the Seniors Notes.
In June 2019, Medtronic Luxco issued 6 tranches of April 29, 2016.Euro-denominated Senior Notes with an aggregate principal of €5.0 billion, with maturities ranging from fiscal year 2021 to fiscal year 2050, resulting in cash proceeds of approximately $5.6 billion, net of discounts and issuance costs. The Company used the net proceeds from the sale of the Senior Notes primarily for working capital and general corporate uses, which includes the repayment of other indebtedness of the Company, andoffering to fund the acquisition of Covidien in fiscal year 2015.
Medtronic plc
Notes to Consolidated Financial Statements (Continued)
In April 2016, the Company completed a cash tender offer and early redemption of $2.7$5.2 billion of senior notesMedtronic Inc., CIFSA, and Medtronic Luxco Senior Notes for $3.0$5.6 billion of total consideration. WeThe Company recognized a loss on debt extinguishment of $163$413 million in fiscal year 2020, which primarily included cash premiums and accelerated amortization of deferred financing costs and debt discounts and premiums. The loss on debt extinguishment was recordedrecognized in the interest expensein the consolidated statement of income.
In addition to the loss on debt extinguishment, we recognized $20 million of interest expense due to the acceleration of net losses on forward starting interest rate derivatives, which had been terminated at the time of original debt issuances, relating to the portion of debt extinguished in the tender offer.
On January 26, 2015,September 2020, Medtronic and Medtronic Luxco each provided a full and unconditional guarantee of the Senior Note obligations of Medtronic, Inc. and of Covidien International Finance S.A., a Luxembourg company (“CIFSA”).
On December 10, 2014, the CompanyGlobal Holdings S.C.A. (Medtronic Luxco) issued sevenan additional 6 tranches of Euro-denominated Senior Notes (collectively the 2015 Senior Notes) with an aggregate face valueprincipal of $17.0€6.3 billion, with maturities ranging from fiscal year 2023 to fiscal year 2051, resulting in cash proceeds of approximately $16.8$7.2 billion, net of discounts and issuance costs. The first tranche consisted of $1.0 billion of 1.500 percent Senior Notes due 2018. The second tranche consisted of $2.5 billion of 2.500 percent Senior Notes due 2020. The third tranche consisted of $500 million of floating rate Senior Notes due 2020 (the 2020 floating rate notes). The 2020 floating rate notes bear interest at the three-month London InterBank Offered Rate (LIBOR) plus 80 basis points. The fourth tranche consisted of $2.5 billion of 3.150 percent Senior Notes due 2022. The fifth tranche consisted of $4.0 billion of 3.500 percent Senior Notes due 2025. The sixth tranche consisted of $2.5 billion of 4.375 percent Senior Notes due 2035. The seventh tranche consisted of $4.0 billion of 4.625 percent Senior Notes due 2045. Interest on the 2020 floating rate notes is payable quarterly and interest on each series of the fixed rate notes is payable semi-annually. The Company used the combinednet proceeds fromof the 2015 Senior Notes and the $3.0 billion borrowed for a term of three years under the Term Loan Credit Agreement (as defined below)offering to fund the approximately $16 billion cash consideration portion
As of January 26, 2015, Covidien had $5.0 billion aggregate principal amount issued and outstanding consisting of $750 million aggregate principal amount of 2.950 percent senior notes due 2023, $600 million aggregate principal amount of 1.350 percent senior notes due 2015, $650 million aggregate principal amount of 3.200 percent senior notes due 2022, $400 million aggregate principal amount of 2.800 percent senior notes due 2015, $600 million aggregate principal amount of 4.200 percent senior notes due 2020, $1.2 billion aggregate principal amount of 6.000 percent senior notes due 2018 and $850 million aggregate principal amount of 6.550 percent senior notes due 2037 (collectively, the “CIFSA Senior Notes”). The Company recorded a fair value adjustment as required upon acquisition and subsequently recorded a premium totaling $607 million related to CIFSA Senior Notes.
As of April 29, 2016 and April 24, 2015, the Company had interest rate swap agreements designated as fair value hedges of certain underlying fixed-rate obligations including the Company’s $500 million 4.125 percent 2011 Senior Notes, and $675 million 3.125 percent 2012 Senior Notes. As of April 24, 2015, the Company also had an interest rate swap agreement designated as a fair value hedge underlying the fixed rate obligation related to the Company's $600 million 4.750 percent 2005 Senior Notes and the $500 million 2.625 percent 2011 Senior Notes, which were due during fiscal year 2016. For additional information regarding the interest rate swap agreements, refer to Note 8.
Term Loan On January 26, 2015, Medtronic, Inc. borrowed $3.0 billion for a term of three years under that certain Senior Unsecured Term Loan Credit Agreement (the “Term Loan Credit Agreement”), among Medtronic, Inc., Medtronic, Medtronic Luxco, the lenders from time to time party thereto and Bank of America, N.A., as administrative agent, to finance, in part, the cash component of the Arrangement Consideration and certain transaction expenses. Medtronic and Medtronic Luxco have guaranteed the obligations of Medtronic, Inc. under the Term Loan Credit Agreement.
Medtronic plc
Notes to Consolidated Financial Statements (Continued)
early redemption of $4.3 billion of Medtronic Inc. and CIFSA Senior Notes and €1.5 billion of Medtronic Luxco Senior Notes for $6.3 billion of total consideration in October 2020. Additionally, the Company used the proceeds to repay its €750 million floating rate senior notes at maturity in March 2021. The Company recognized a loss on debt extinguishment of $308 million in fiscal year 2021, which primarily included cash premiums and accelerated amortization of deferred financing costs and debt discounts and premiums. The loss was recognized in interest expense in the consolidated statement of income.
The Euro-denominated debt issued in June 2019 and September 2020 is designated as a net investment hedge of certain of the Company's European operations. Refer to Note 7 for additional information regarding the net investment hedge.
Term Loan Agreements On May 12, 2020, Medtronic Luxco entered into a term loan agreement (Fiscal 2021 Loan Agreement) by and among Medtronic Luxco, Medtronic plc, Medtronic, Inc., and Mizuho Bank, Ltd. as administrative agent and as lender. The Fiscal 2021 Loan Agreement provided an unsecured term loan in an aggregate principal amount of up to ¥300 billion, with a term of six months and the option to extend for an additional six months at Medtronic Luxco’s option. On May 13, 2020, Medtronic Luxco borrowed the entire amount of the term loan under the Fiscal 2021 Loan Agreement. The Japanese Yen-denominated debt was designated as a net investment hedge for certain of the Company's Japanese operations. Borrowings under the Fiscal 2021 Loan Agreement carried interest at the TIBOR Rate (as defined in the Fiscal 2021 Loan Agreement) plus a margin of 0.50% per annum. Medtronic plc and Medtronic, Inc. guaranteed the obligations of Medtronic Luxco under the Fiscal 2021 Loan Agreement. On November 12, 2020, the Company exercised its option to extend the term loan for an additional six months. During the fourth quarter of fiscal year 2021, the Company de-designated the Yen-denominated debt as a net investment hedge and repaid the term loan in full, including interest.
Subsequent to fiscal year 2022, on May 2, 2022, Medtronic Luxco entered into a term loan agreement (Fiscal 2023 Loan Agreement) by and among Medtronic Luxco, Medtronic plc, Medtronic, Inc., and Mizuho Bank, Ltd. as administrative agent and as lender. The Fiscal 2023 Loan Agreement provides an unsecured term loan in an aggregate principal amount of up to ¥300 billion with a term of 364 days. Borrowings under the Fiscal 2023 Loan Agreement bear interest at the TIBOR Rate (as defined in the Fiscal 2023 Loan Agreement) plus a margin of 0.40% per annum. Medtronic plc and Medtronic, Inc. have guaranteed the obligations of Medtronic Luxco under the Fiscal 2023 Loan Agreement. In May and June 2022, Medtronic Luxco borrowed an aggregate of ¥297 billion, or approximately $2.3 billion, of the term loan, under the Fiscal 2023 Loan Agreement. The Company used the net proceeds of the borrowings to fund the early redemption of $1.9 billion of Medtronic Inc.'s 3.500% Senior Notes due 2025 for $1.9 billion of total consideration, and $368 million of Medtronic Luxco's 3.350% Senior Notes due 2027 for $376 million of total consideration. The Company will recognize a total loss on debt extinguishment of $53 million in the quarter ended July 29, 2022, which primarily includes cash premiums and accelerated amortization of deferred financing costs and debt discounts and premiums. The loss will be recognized in interest expense in the consolidated statements of income.
Contractual maturities of debt for the next five fiscal years and thereafter, excluding thedeferred financing costs and debt premium and discount, and the fair value of outstanding interest rate swap agreementsnet, are as follows:
|
| | | |
(in millions) Fiscal Year | |
| 2017 | $ | 993 |
|
| 2018 | 6,176 |
|
| 2019 | 411 |
|
| 2020 | 3,777 |
|
| 2021 | 1,104 |
|
| Thereafter | 18,476 |
|
| Total debt | 30,937 |
|
| Less: Current portion of debt | 993 |
|
| Long-term portion of debt | $ | 29,944 |
|
| | | | | |
| (in millions) | |
| 2023 | $ | 3,744 | |
| 2024 | 6 | |
| 2025 | 1,895 | |
| 2026 | 2,133 | |
| 2027 | 1,969 | |
| Thereafter | 14,528 | |
| Total | $ | 24,275 | |
| |
| |
Financial Instruments Not Measured at Fair Value
TheAt April 29, 2022, the estimated fair value of the Company’s long-term debt, including the short-term portion, as of April 29, 2016Senior Notes was $29.8$22.9 billion compared to a principal value of $27.4$24.2 billion. As ofAt April 24, 201530, 2021 the estimated fair value was $34.6$28.6 billion compared to a principal value of $32.1$26.5 billion. FairThe fair value was estimated using quoted market prices for the publicly registered senior notes,Senior Notes, which are classified as Level 2 within the fair value hierarchy. The fair values and principal values consider the terms of the related debt and exclude the impacts of debt discounts and derivative/hedging activity.
8.7. Derivatives and Currency Exchange Risk Management
The Company uses operational and economic hedges, as well asincluding currency exchange rate derivative contracts and interest rate derivative instruments, to manage the impact of currency exchange and interest rate changes on earnings and cash flows. In addition, the Company uses cross currency interest rate swaps to manage currency risk related to certain debt. In order to minimize earnings and cash flow volatility resulting from currency exchange rate changes, the Company enters into derivative instruments, principally forward currency exchange rate
Medtronic plc
Notes to Consolidated Financial Statements (Continued)
contracts. These contracts are designed to hedge anticipated foreign currency transactions and changes in the value of specific assets and liabilities. At inception of the contract, the derivative is designated as either a freestanding derivative or a cash flow hedge. The primary currenciesCurrencies of theour derivative instruments areinclude the Euro, Japanese Yen, Chinese Yuan, and Japanese Yen.others. The Company does not enter into currency exchange rate derivative contracts for speculative purposes. The gross notional amount of all currency exchange rate derivative instruments outstanding was $13.8 billion and $14.7 billion at April 29, 20162022 and April 24, 2015 was $10.8 billion30, 2021, respectively.
The Company also uses derivative and $9.8 billion, respectively. The aggregatenon-derivative instruments to manage the impact of currency exchange rate gains (losses) were $314 million, $131 million, and $(1) million,changes on net investments in fiscal years 2016, 2015, and 2014, respectively.
foreign currency-denominated operations. The information that follows explains the various types of derivatives and financial instruments used by the Company, how and whyreasons the Company uses such instruments, howand the impact such instruments are accounted for, and how such instruments impacthave on the Company’s consolidated balance sheets statements of income, and statements of cash flows.income.
Freestanding Derivative Contracts
Freestanding derivative contracts are primarily used to offset the Company’s exposure to the change in value of specific foreign currency denominatedforeign-currency-denominated assets and liabilities, and to offset variability of cash flows associated with forecasted transactions denominated in a foreign currency.currencies. The gross notional amount of thesethe Company's freestanding currency exchange rate contracts not designated as hedging instruments, outstanding at April 29, 20162022 and April 24, 201530, 2021 was $5.0$4.9 billion and $4.7$5.7 billion, respectively.
Medtronic plc
Notes to Consolidated Financial Statements (Continued)
The Company's freestanding currency exchange rate contracts are not designated as hedges, and therefore, changes in the value of these contracts are recognized in earnings, thereby offsetting the current earnings effect of the related change in value of foreign-currency-denominated assets, liabilities, and cash flows.
The Company also uses total return swaps to hedge the liability of a non-qualified, deferred compensation plan. The gross notional amount and location of the gainsCompany's total return swaps outstanding at April 29, 2022 and April 30, 2021 was $226 million and $243 million, respectively. The Company's total return swaps are not designated as hedges, and therefore, changes in the value of these instruments are recognized in earnings. The cash flows related to the Company's freestanding derivative contracts are reported as operating or financing activities, depending on the nature of the underlying hedged item, in the consolidated statements of income related to derivative instruments, not designated as hedging instruments, for fiscal years 2016, 2015, and 2014 are as follows:cash flows.
|
| | | | | | | | | | | | | | |
| (in millions) | | | | Fiscal Year |
| Derivatives Not Designated as Hedging Instruments | | Location | | 2016 | | 2015 | | 2014 |
| Currency exchange rate contracts | | Other expense | | $ | 33 |
| | $ | 210 |
| | $ | 15 |
|
Cash Flow Hedges
Currency Exchange Rate Risk
Forward contracts designated as cash flow hedges are designed to hedge the variability of cash flows associated with forecasted transactions denominated in a foreign currency that will take place in the future. No gains or losses relating to ineffectiveness of cash flow hedges were recognized in earnings during fiscal years 2016, 2015, or 2014. No components of the hedge contracts were excluded in the measurement of hedge ineffectiveness and no hedges were derecognized or discontinued during fiscal years 2016, 2015, or 2014. The gross notional amount of these contracts, designated as cash flow hedges, outstanding at April 29, 20162022 and April 24, 201530, 2021 was $5.7$8.8 billion and $5.1$9.0 billion, respectively, and will mature within the subsequent two-yearthree-year period.
For derivative instruments that are designated and qualify as a cash flow hedge, the gain or loss on the derivative instrument is reported as a component of accumulated other comprehensive loss. The amountgain or loss on the derivative instrument is reclassified into earnings and is included in other operating expense, net or cost of gains (losses) and location of the gains (losses) products sold in the consolidated statements of income and other comprehensive income (OCI)in the same period or periods during which the hedged transaction affects earnings. Amounts excluded from the measurement of hedge effectiveness are recognized in earnings in the current period. The cash flows related to foreign currency exchange rate contract derivative instruments designated as cash flow hedges forall of the fiscal years ended April 29, 2016, April 24, 2015, and April 25, 2014 are as follows:
|
| | | | | | | | | | |
| April 29, 2016 | | |
| | | | |
|
| | | Gross Gains Recognized in OCI on Effective Portion of Derivative | | Effective Portion of Gains (Losses) on Derivative Reclassified from AOCI into Income |
| (in millions) | | |
| Derivatives in Cash Flow Hedging Relationships | | Amount | | Location | | Amount |
Currency exchange rate contracts | | $ | (165 | ) | | Other expense, net | | $ | 405 |
|
| | | |
| | Cost of products sold | | (37 | ) |
| Total | | $ | (165 | ) | | | | $ | 368 |
|
|
| | | | | | | | | | |
| April 24, 2015 | | |
| | | | |
|
| | | Gross Losses Recognized in OCI on Effective Portion of Derivative | | Effective Portion of Gains (Losses) on Derivative Reclassified from AOCI into Income |
| (in millions) | | |
| Derivatives in Cash Flow Hedging Relationships | | Amount | | Location | | Amount |
Currency exchange rate contracts | | $ | 707 |
| | Other expense, net | | $ | 221 |
|
| | | |
| | Cost of products sold | | (65 | ) |
| Total | | $ | 707 |
| | | | $ | 156 |
|
|
| | | | | | | | | | |
| April 25, 2014 | | |
| | | | |
|
| | | Gross Gains Recognized in OCI on Effective Portion of Derivative | | Effective Portion of Gains (Losses) on Derivative Reclassified from AOCI into Income |
| (in millions) | | |
| Derivatives in Cash Flow Hedging Relationships | | Amount | | Location | | Amount |
Currency exchange rate contracts | | $ | (152 | ) | | Other expense, net | | $ | 94 |
|
| | | | | Cost of products sold | | (43 | ) |
| Total | | $ | (152 | ) | | | | $ | 51 |
|
Medtronic plc
Notes to Consolidated Financial Statements (Continued)
Forecasted Debt Issuance Interest Rate Risk
Forward starting interest rateCompany's derivative instruments designated as cash flow hedges are designed to managereported as operating activities in the exposure to interest rate volatility with regard to future issuancesconsolidated statements of fixed-rate debt. No gains or losses relating to ineffectiveness of forward starting interest rate derivative instruments were recognized in earnings during fiscal years 2016, 2015, or 2014.cash flows. No components of the hedge contracts were excluded in the measurement of hedge ineffectiveness. In connection with the closing of the 2015 Senior Notes, the Company entered intoeffectiveness, and no forward starting interest rate derivatives with a notional amount of $5.9 billion, these swapscontracts designated as cash flow hedges were terminated upon the issuance of the 2015 Senior Notes. Upon termination, there was no material ineffectiveness on the contracts which were in a net liability position, resulting in cash payment of $79 million. Duringderecognized or discontinued during fiscal year 2016, the Company terminated forward starting interest rate derivatives with a consolidated notional amount of $500 million, which were previously entered into in advance of a planned debt issuance that is no longer expected. Upon termination, these swaps were in a net liability position, resulting in a cash payment of $45 million. As of years 2022, 2021, or 2020.
At April 29, 2016,2022 and April 30, 2021, the Company had $300$474 million of fixed pay, forward starting interest rate swaps with a weighted average fixed rate of 3.10 percent in anticipation of planned debt issuances.
For the fiscal years ended April 29, 2016after-tax unrealized gains and April 24, 2015, the Company reclassified $12$253 million and $11 million, respectively, of the effective portion of the net losses on forward starting interest rate derivative instruments from accumulated other comprehensive (loss) income to interest expense, net. In addition, we reclassified $20 million from accumulated other comprehensive (loss) income to interest expense, net due to the acceleration of net losses on forward starting interest derivatives, which had been terminated at the time of the original debt issuances, relating to the portion of debt extinguished in the tender offer.
Theafter-tax unrealized losses, on outstanding forward starting interest rate swap derivative instruments as of April 29, 2016 and April 24, 2015 were $48 million and $71 million, respectively.
As of April 29, 2016 and April 24, 2015, the Company had $(90) million and $210 million, respectively, in after-tax net unrealized (losses) gains associated with cash flow hedging instruments recorded in accumulated other comprehensive (loss) incomeloss. The Company expects that $17$368 million of after-tax net unrealized gains as of at April 29, 20162022 will be reclassified intorecognized in the consolidated statements of earningsincome over the next 12 months.
Fair ValueNet Investment Hedges
Interest rate derivative instrumentsThe Company has designated Euro-denominated debt as fair value hedges are designeda net investment hedge of certain of its European operations to manage the exposure to interestcurrency and exchange rate movements and to reduce borrowing costs by converting fixed-rate debt into floating-rate debt. Under these agreements, the Company agrees to exchange, at specified intervals, the difference between fixed and floating interest amounts calculated by reference to an agreed-upon notional principal amount.
As offor foreign currency-denominated net investments in foreign operations. At April 29, 2016 and April 24, 2015,2022, the Company had interest rate swaps in gross notional amounts€16.0 billion, or $17.0 billion, of $1.2 billion and $2.0 billion, respectively, designated as fair value hedges of underlying fixed rate obligations. As of April 29, 2016 and April 24, 2015, the Company had interest rate swap agreements designated as fair value hedges of underlying fixed rate obligations including the Company’s $500 million 4.125 percent 2011 Senior Notes due 2021, and the $675 million 3.125 percent 2012 Senior Notes due 2022. As of April 24, 2015, the Company also had an interest rate swap agreementoutstanding Euro-denominated debt designated as a fairhedge of its net investment in certain of its European operations, which will mature in fiscal year 2023 through fiscal year 2051.
In February 2021, the Company de-designated ¥300 billion of outstanding Yen-denominated debt previously designated as a net investment hedge and concurrently entered into freestanding forward derivative contracts with a total notional value hedge underlyingof ¥300 billion, or approximately $2.9 billion. These forward contracts were not designated as hedges. The Company used the fixed rate obligationproceeds from these forward derivative contracts to repay the ¥300 billion of Yen-denominated debt in conjunction with the maturity of these forward contracts in March and April of 2021.
For instruments that are designated and qualify as net investment hedges, the gains or losses are reported as a component of accumulated other comprehensive loss. The gains or losses are reclassified into earnings upon a liquidation event or deconsolidation of the foreign
Medtronic plc
Notes to Consolidated Financial Statements (Continued)
subsidiary. Amounts excluded from the assessment of effectiveness are recognized in other operating expense, net. The cash flows related to the Company's $600 million 4.750 percent 2005 Senior Notes due 2016 andderivative instruments designated as net investment hedges are reported as investing activities in the $500 million 2.625 percent 2011 Senior Notes due 2016.consolidated statements of cash flows.
As ofAt April 29, 20162022 and April 24, 2015,30, 2021, the market value of outstanding interest rate swap agreements was anCompany had $841 million in after-tax unrealized gain of $89 milliongains and $18 million, respectively, and the market value$1.5 billion in after-tax unrealized losses associated with net investment hedges recorded in accumulated other comprehensive loss, respectively. The Company does not expect any of the hedged items was anafter-tax unrealized loss of $89 million and $18 million, respectively, which was recordedgains at April 29, 2022 to be recognized inother assets, prepaid expenses and other current assets, and other long-term liabilities with the offsets recorded in long-term debt and short-term borrowings on the consolidated balance sheets. No significant hedge ineffectiveness was recorded as a resultstatements of these fair value hedges for fiscal year 2016, 2015, and 2014.income over the next 12 months.
During fiscal years 2016, 2015, and 2014, the Company did not have any ineffective fair value hedging instruments. In addition, theThe Company did not recognize any gains or losses during fiscal years 2016, 2015,2022, 2021, or 20142020 on firm commitmentsinstruments that no longer qualify as fair valuenet investment hedges.
Gains and Losses on Hedging Instruments and Derivatives not Designated as Hedging Instruments
The amount of the gains and losses on our hedging instruments and the classification of those gains and losses within our consolidated financial statements for fiscal years 2022, 2021, and 2020 were as follows:
| | | | | | | | | | | | | | | | | | | | | | | | | | | | | | | | | | | | | | | | | |
| (Gain) Loss Recognized in Accumulated Other Comprehensive Income | | (Gain) Loss Reclassified into Income | | |
| | | |
| Fiscal Year | | Fiscal Year | | Location of (Gain) Loss in Income Statement |
| (in millions) | 2022 | | 2021 | | 2020 | | 2022 | | 2021 | | 2020 | |
| Cash flow hedges | | | | | | | | | | | | | |
| Currency exchange rate contracts | $ | (953) | | | $ | 519 | | | $ | (397) | | | $ | (144) | | | $ | (17) | | | $ | (335) | | | Other operating expense, net |
| Currency exchange rate contracts | 18 | | | 108 | | | — | | | 61 | | | 15 | | | — | | | Cost of products sold |
| Net investment hedges | (2,299) | | | 1,694 | | | (405) | | | — | | | — | | | (9) | | | Other operating expense, net |
| Total | $ | (3,234) | | | $ | 2,321 | | | $ | (802) | | | $ | (83) | | | $ | (2) | | | $ | (344) | | | |
| | | | | | | | | | | | | |
The amount of the gains and losses on our derivative instruments not designated as hedging instruments and the classification of those gains and losses within our consolidated financial statements for fiscal years 2022, 2021, and 2020 were as follows:
| | | | | | | | | | | | | | | | | | | | | | | |
| (Gain) Loss Recognized in Income | | |
| Fiscal Year | | Location of (Gain) Loss in Income Statement |
| (in millions) | 2022 | | 2021 | | 2020 | |
| Derivatives not designated as hedging instruments | | | | | | | |
| Currency exchange rate contracts | $ | (54) | | | $ | 247 | | | $ | (133) | | | Other operating expense, net |
| Total return swaps | 1 | | | (81) | | | 7 | | | Other operating expense, net |
| Total | $ | (53) | | | $ | 166 | | | $ | (126) | | | |
Medtronic plc
Notes to Consolidated Financial Statements (Continued)
Balance Sheet Presentation
The following tables summarize the locationbalance sheet classification and fair value amounts of derivative instruments reportedincluded in the consolidated balance sheets as of at April 29, 20162022 and April 24, 2015.30, 2021. The fair value amounts are presented on a gross basis, and are segregated between derivatives that are designated and qualify as hedging instruments and those that are not designated and do not qualify as hedging instruments, and are further segregated by type of contract within those two categories.
|
| | | | | | | | | | | |
| April 29, 2016 | | | | | | | |
| | Asset Derivatives | | Liability Derivatives |
| (in millions) | Balance Sheet Location | | Fair Value | | Balance Sheet Location | | Fair Value |
| Derivatives designated as hedging instruments | | | |
| | | | |
|
| Interest rate contracts | Prepaid expenses and other current assets | | $ | — |
| | Other accrued expenses | | $ | — |
|
| Currency exchange rate contracts | Prepaid expenses and other current assets | | 123 |
| | Other accrued expenses | | 89 |
|
| Interest rate contracts | Other assets | | 89 |
| | Other long-term liabilities | | 48 |
|
| Currency exchange rate contracts | Other assets | | 9 |
| | Other long-term liabilities | | 54 |
|
| Total derivatives designated as hedging instruments | | | $ | 221 |
| | | | $ | 191 |
|
| Derivatives not designated as hedging instruments | | | |
| | | | |
|
| Commodity derivatives | Prepaid expenses and other current assets | | $ | — |
| | Other accrued expenses | | $ | 1 |
|
| Currency exchange rate contracts | Prepaid expenses and other current assets | | 13 |
| | Other accrued expenses | | 23 |
|
| Cross currency interest rate contracts | Other assets | | 14 |
| | Other long-term liabilities | | 4 |
|
| Total derivatives not designated as hedging instruments | | | $ | 27 |
| | | | $ | 28 |
|
| Total derivatives | | | $ | 248 |
| | | | $ | 219 |
|
| | | | | | | | |
| April 24, 2015 | | | |
| | | | |
|
| | Asset Derivatives | | Liability Derivatives |
| (in millions) | Balance Sheet Location | | Fair Value | | Balance Sheet Location | | Fair Value |
| Derivatives designated as hedging instruments | | | |
| | | | |
|
| Interest rate contracts | Prepaid expenses and other current assets | | $ | 10 |
| | Other accrued expenses | | $ | — |
|
| Currency exchange rate contracts | Prepaid expenses and other current assets | | 382 |
| | Other accrued expenses | | 12 |
|
| Interest rate contracts | Other assets | | 79 |
| | Other long-term liabilities | | 71 |
|
| Currency exchange rate contracts | Other assets | | 143 |
| | Other long-term liabilities | | 3 |
|
| Total derivatives designated as hedging instruments | | | $ | 614 |
| | | | $ | 86 |
|
| Derivatives not designated as hedging instruments | | | |
| | | | |
|
| Currency exchange rate contracts | Prepaid expenses and other current assets | | $ | 119 |
| | Other accrued expenses | | $ | 30 |
|
| Total derivatives not designated as hedging instruments | | | $ | 119 |
| | | | $ | 30 |
|
| Total derivatives | | | $ | 733 |
| | | | $ | 116 |
|
Medtronic plc
Notes to Consolidated Financial Statements (Continued)
| | | | | | | | | | | | | | | | | | | | | | | | | | | | | | | | | | | |
| | Fair Value - Assets | | Fair Value - Liabilities |
| (in millions) | April 29, 2022 | | April 30, 2021 | | Balance Sheet Classification | | April 29, 2022 | | April 30, 2021 | | Balance Sheet Classification |
| Derivatives designated as hedging instruments | | | | | | | | | | | |
| Currency exchange rate contracts | $ | 481 | | | $ | 49 | | | Other current assets | | $ | 43 | | | $ | 190 | | | Other accrued expenses |
| | | | | | | | | | | |
| Currency exchange rate contracts | 168 | | | 22 | | | Other assets | | 16 | | | 94 | | | Other liabilities |
| Total derivatives designated as hedging instruments | 649 | | | 70 | | | | | 60 | | | 285 | | | |
| Derivatives not designated as hedging instruments | | | | | | | | | | | |
| Currency exchange rate contracts | 46 | | | 14 | | | Other current assets | | 49 | | | 11 | | | Other accrued expenses |
| Total return swaps | — | | | 18 | | | Other current assets | | 20 | | | — | | | Other accrued expenses |
| | | | | | | | | | | |
| | | | | | | | | | | |
| Total derivatives not designated as hedging instruments | 46 | | | 32 | | | | | 69 | | | 11 | | | |
| Total derivatives | $ | 695 | | | $ | 102 | | | | | $ | 129 | | | $ | 296 | | | |
| | | | | | | | | | | |
The following table provides information by level for the derivative assets and liabilities that are measured at fair value on a recurring basis as of April 29, 2016 and April 24, 2015:basis:
|
| | | | | | | | | | | | | | | | | | | | | | | | |
| | April 29, 2016 | | April 24, 2015 | |
| (in millions) | Level 1 | | Level 2 | | Level 3 | | Level 1 | | Level 2 | | Level 3 | |
| Derivative Assets | $ | 145 |
| | $ | 103 |
| | $ | — |
| | $ | 644 |
| | $ | 89 |
| | $ | — |
| |
| Derivative Liabilities | 166 |
| | 53 |
| | — |
| | 45 |
| | 71 |
| | — |
| |
| | | | | | | | | | | | | | | | | | | | | | | | | | |
| April 29, 2022 | | April 30, 2021 | | | |
| (in millions) | Level 1 | | Level 2 | | Level 1 | | Level 2 | | | |
| Derivative assets | $ | 695 | | | $ | 109 | | | $ | 85 | | | $ | 18 | | | | |
| Derivative liabilities | — | | | 20 | | | 296 | | | — | | | | |
The Company has elected to present the fair value of derivative assets and liabilities within the consolidated balance sheets on a gross basis, even when derivative transactions are subject to master netting arrangements and may otherwise qualify for net presentation. The cash flows related to collateral posted and received are reported gross as investing and financing activities, respectively, in the consolidated statements of cash flows.
Medtronic plc
Notes to Consolidated Financial Statements (Continued)
The following table providestables provide information as if the Company had elected to offset the asset and liability balances of derivative instruments, netted in accordance with various criteria as stipulated by the terms of the master netting arrangements with each of the counterparties. Derivatives not subject to master netting arrangements are not eligible for net presentation.
| | | | | | | | | | | | | | | | | | | | | | | | | | |
| | April 29, 2022 |
| | | | Gross Amount Not Offset on the Balance Sheet | | |
| (in millions) | | Gross Amount of Recognized Assets (Liabilities) | | Financial Instruments | | Cash Collateral (Received) Posted | | Net Amount |
| Derivative assets: | | | | | | | | |
| Currency exchange rate contracts | | $ | 695 | | | $ | (109) | | | $ | (254) | | | $ | 332 | |
| | | | | | | | |
| | | | | | | | |
| | | | | | | | |
| | | | | | | | |
| Derivative liabilities: | | | | | | | | |
| Currency exchange rate contracts | | (109) | | | 109 | | | — | | | — | |
| | | | | | | | |
| | | | | | | | |
| Total return swaps | | (20) | | | — | | | — | | | (20) | |
| | (129) | | | 109 | | | — | | | (20) | |
| Total | | $ | 566 | | | $ | — | | | $ | (254) | | | $ | 312 | |
|
| | | | | | | | | | | | | | | | |
| April 29, 2016 | | | | Gross Amount Not Offset on the Balance Sheet | | |
| (in millions) | | Gross Amount of Recognized Assets (Liabilities) | | Financial Instruments | | Cash Collateral (Received) or Posted | | Net Amount |
| Derivative Assets | | | | | | | | |
| Currency exchange rate contracts | | $ | 145 |
| | $ | (98 | ) | | $ | (1 | ) | | $ | 46 |
|
| Interest rate contracts | | 89 |
| | (20 | ) | | — |
| | 69 |
|
| Cross Currency interest rate contracts | | 14 |
| | — |
| | — |
| | 14 |
|
| | | $ | 248 |
| | $ | (118 | ) | | $ | (1 | ) | | $ | 129 |
|
| | | | | | | | | |
| Derivative Liabilities | | | | | | | | |
| Currency exchange rate contracts | | $ | (166 | ) | | $ | 85 |
| | 26 |
| | $ | (55 | ) |
| Interest rate contracts | | (48 | ) | | 34 |
| | — |
| | (14 | ) |
| Cross currency interest rate contracts | | (4 | ) | | — |
| | — |
| | (4 | ) |
| Commodity contracts | | (1 | ) | | — |
| | — |
| | (1 | ) |
| | | $ | (219 | ) | | $ | 119 |
| | $ | 26 |
| | $ | (74 | ) |
| Total | | $ | 29 |
| | $ | 1 |
| | $ | 25 |
| | $ | 55 |
|
|
| | | | | | | | | | | | | | | | |
| April 24, 2015 | | | | Gross Amount Not Offset on the Balance Sheet | | |
| (in millions) | | Gross Amount of Recognized Assets (Liabilities) | | Financial Instruments | | Cash Collateral (Received) or Posted | | Net Amount |
| Derivative Assets | | | | | | | | |
| Currency exchange rate contracts | | $ | 644 |
| | $ | (61 | ) | | $ | (325 | ) | | $ | 258 |
|
| Interest rate contracts | | 89 |
| | (10 | ) | | (13 | ) | | 66 |
|
| | | $ | 733 |
| | $ | (71 | ) | | $ | (338 | ) | | $ | 324 |
|
| | | | | | | | | |
| Derivative Liabilities | | | | | | | | |
| Currency exchange rate contracts | | $ | (45 | ) | | $ | 31 |
| | $ | — |
| | $ | (14 | ) |
| Interest rate contracts | | (71 | ) | | 40 |
| | 8 |
| | (23 | ) |
| | | $ | (116 | ) | | $ | 71 |
| | $ | 8 |
| | $ | (37 | ) |
| Total | | $ | 617 |
| | $ | — |
| | $ | (330 | ) | | $ | 287 |
|
Medtronic plc
Notes to Consolidated Financial Statements (Continued)
| | | | | | | | | | | | | | | | | | | | | | | | | | |
| | April 30, 2021 |
| | | | Gross Amount Not Offset on the Balance Sheet | | |
| (in millions) | | Gross Amount of Recognized Assets (Liabilities) | | Financial Instruments | | Cash Collateral (Received) Posted | | Net Amount |
| Derivative assets: | | | | | | | | |
| Currency exchange rate contracts | | $ | 85 | | | $ | (83) | | | $ | — | | | $ | 1 | |
| | | | | | | | |
| | | | | | | | |
| Total return swaps | | 18 | | | — | | | — | | | 18 | |
| | 102 | | | (83) | | | — | | | 19 | |
| Derivative liabilities: | | | | | | | | |
| Currency exchange rate contracts | | (296) | | | 83 | | | 46 | | | (167) | |
| | | | | | | | |
| | | | | | | | |
| | | | | | | | |
| Total | | $ | (194) | | | $ | — | | | $ | 46 | | | $ | (148) | |
Concentrations of Credit Risk
Financial instruments, which potentially subject the Company to significant concentrations of credit risk, consist principally of interest-bearing investments, forward exchange derivative contracts, and trade accounts receivable. Global concentrations of credit risk with respect to trade accounts receivable are limited due to the large number of customers and their dispersion across many geographic areas. The Company monitors the creditworthiness of its customers to which it grants credit terms in the normal course of business.
The Company maintains cash and cash equivalents, investments, and certain other financial instruments (including currency exchange rate and interest rate derivative contracts) with various major financial institutions. The Company performs periodic evaluations of the relative credit standings of these financial institutions and limits the amount of credit exposure with any one institution. In addition, the Company has collateral credit agreements with its primary derivatives counterparties. Under these agreements, either party is required to post eligible collateral when the market value of transactions covered by the agreement exceeds specific thresholds, thus limiting credit exposure for both parties. As of April 29, 2016,2022, the Company received net cash collateral of $254 million from its counterparties. As of April 30, 2021, the Company posted net cash collateral of $25$46 million to its counterparties. As of April 24, 2015, the Company received net cashCash collateral of $330 million from its counterparties. The collateral received wasposted is recorded as a reduction in cash and cash equivalents, with the offset recorded as an increase in other accrued expenses oncurrent assets in the consolidated balance sheets. TheCash collateral posted wasreceived is recorded as an increase in Prepaid expensescash and other current assets,cash equivalents with the offset recorded as a decrease in cash and cash equivalents onother accrued expenses in the consolidated balance sheets.
Medtronic plc
Notes to Consolidated Financial Statements (Continued)
8. Inventories
Inventory balances, net of reserves, were as follows:
| | | | | | | | | | | |
| (in millions) | April 29, 2022 | | April 30, 2021 |
| Finished goods | $ | 3,070 | | | $ | 2,906 | |
| Work-in-process | 682 | | | 611 | |
| Raw materials | 864 | | | 796 | |
| Total | $ | 4,616 | | | $ | 4,313 | |
9. Goodwill and Other Intangible Assets
Goodwill
The following table presents the changes in the carrying amount of goodwill by segment:
| | | | | | | | | | | | | | | | | | | | | | | | | | | | | |
| (in millions) | Cardiovascular | | Medical Surgical | | Neuroscience | | Diabetes | | Total |
| April 24, 2020 | $ | 6,831 | | | $ | 20,176 | | | $ | 10,920 | | | $ | 1,914 | | | $ | 39,841 | |
| Goodwill as a result of acquisitions | 248 | | | 12 | | | 210 | | | 346 | | | 816 | |
| Purchase accounting adjustments | (2) | | | (5) | | | 3 | | | (4) | | | (8) | |
| Currency translation and other | 132 | | | 1,012 | | | 167 | | | 1 | | | 1,312 | |
| April 30, 2021 | 7,209 | | | 21,195 | | | 11,300 | | | 2,257 | | | 41,961 | |
| Goodwill as a result of acquisitions | 55 | | | — | | | 26 | | | — | | | 80 | |
| Purchase accounting adjustments | 21 | | | 3 | | | 3 | | | (2) | | | 25 | |
| Currency translation and other | (125) | | | (1,241) | | | (196) | | | (1) | | | (1,563) | |
| April 29, 2022 | $ | 7,160 | | | $ | 19,957 | | | $ | 11,132 | | | $ | 2,254 | | | $ | 40,502 | |
The Company did not recognize any goodwill impairments during fiscal years 2022, 2021, or 2020.
Intangible Assets
The following table presents the gross carrying amount and accumulated amortization of intangible assets:
| | | | | | | | | | | | | | | | | | | | | | | |
| April 29, 2022 | | April 30, 2021 |
| (in millions) | Gross Carrying Amount | | Accumulated Amortization | | Gross Carrying Amount | | Accumulated Amortization |
| Definite-lived: | | | | | | | |
| Customer-related | $ | 16,953 | | | $ | (7,005) | | | $ | 17,036 | | | $ | (6,058) | |
| Purchased technology and patents | 10,802 | | | (5,667) | | | 11,286 | | | (5,156) | |
| Trademarks and tradenames | 473 | | | (266) | | | 475 | | | (251) | |
| Other | 80 | | | (69) | | | 82 | | | (68) | |
| Total | $ | 28,308 | | | $ | (13,006) | | | $ | 28,879 | | | $ | (11,533) | |
| Indefinite-lived: | | | | | | | |
| IPR&D | $ | 293 | | | $ | — | | | $ | 394 | | | $ | — | |
| | | | | | | |
| | | | | | | |
During fiscal year 2022, the Company recognized $409 million of definite-lived intangible asset impairment charges in connection with respectMCS within the Cardiovascular Portfolio. The intangible asset impairment charge primarily related to trade accounts receivable are limited duepurchased technology and patents. Refer to Note 4 Restructuring Charges for additional information on what led to the large numberimpairment. During fiscal year 2021, the Company recognized $30 million of customersdefinite-lived intangible asset charges in connection with the abandonment of certain intangible assets within the Neuroscience segment. During fiscal year 2020, the Company recognized $37 million of definite-lived intangible asset charges, including $33 million and their dispersion across many geographic areas. The Company monitors the creditworthiness of its customers to which it grants credit terms$4 million recognized in connection with business exits in the normal courseNeuroscience and Cardiovascular segments, respectively. Definite-lived intangible asset charges are recognized in other operating expense, net in the consolidated statements of business. However, aincome.
Medtronic plc
Notes to Consolidated Financial Statements (Continued)
Indefinite-lived intangible asset impairment charges were not significant amount of trade receivables are with hospitals that are dependent upon governmental health care systems in many countries. The current economic conditions in many countries outside the U.S. may continue to increase the average length of time it takesfor fiscal year 2022. During fiscal year 2021, the Company recognized $45 million of indefinite-lived intangible asset impairment charges related to collect on its outstanding trade receivablesthe abandonment of certain IPR&D projects in these countries as certain payment patterns have been impacted. Althoughthe Neuroscience segment. During fiscal year 2020, the Company does not currently foreseerecognized $35 million of indefinite-lived intangible asset impairment charges, including $25 million relating to a significant credit riskpartial impairment of an IPR&D project within the Neuroscience segment and $10 million in connection with the discontinuation of an IPR&D project within the Cardiovascular segment. Indefinite-lived intangible asset impairment charges are recognized in other operating expense, net in the consolidated statements of income. Due to the nature of IPR&D projects, the Company may experience future delays or failures to obtain regulatory approvals to conduct clinical trials, failures of such clinical trials, delays or failures to obtain required market clearances, other failures to achieve a commercially viable product, or the discontinuation of certain projects, and as a result, may recognize impairment losses in the future.
Amortization Expense
Intangible asset amortization expense was $1.7 billion for fiscal year 2022 and $1.8 billion for fiscal years 2021 and 2020. Estimated aggregate amortization expense by fiscal year based on the current carrying value and remaining estimated useful lives of definite-lived intangible assets at April 29, 2022, excluding any possible future amortization associated with the outstanding accounts receivable, repaymentacquired IPR&D which has not met technological feasibility, is dependent upon the financial stabilityas follows:
| | | | | |
| (in millions) | Amortization
Expense |
| 2023 | $ | 1,659 | |
| 2024 | 1,624 | |
| 2025 | 1,602 | |
| 2026 | 1,588 | |
| 2027 | 1,564 | |
10. Property, Plant, and Equipment
Property, plant, and equipment balances and corresponding estimated useful lives were as follows:
| | | | | | | | | | | | | | | | | |
| (in millions) | April 29, 2022 | | April 30, 2021 | | Estimated Useful Lives
(in years) |
| Equipment | $ | 6,489 | | | $ | 6,308 | | | Generally 2-7, up to 15 |
| Computer software | 2,617 | | | 2,346 | | | Up to 5 |
| Land and land improvements | 170 | | | 178 | | | Up to 20 |
| Buildings and leasehold improvements | 2,351 | | | 2,370 | | | Up to 40 |
| Construction in progress | 1,737 | | | 1,498 | | | — | |
| Property, plant, and equipment | 13,365 | | | 12,700 | | | |
| Less: Accumulated depreciation | (7,952) | | | (7,479) | | | |
| Property, plant, and equipment, net | $ | 5,413 | | | $ | 5,221 | | | |
Depreciation expense of the economies of these countries.$974 million, $919 million, and $907 million was recognized in fiscal years 2022, 2021, and 2020, respectively.
9.11. Shareholders’ Equity
Share Capital
Medtronic plc is authorized to issue 2.6 billion Ordinary Shares, $0.0001 par value; 40 thousand Euro Deferred Shares, €1.00 par value; 128127.5 million Preferred Shares, $0.20 par value; and 500 thousand A Preferred Shares, $1.00 par value.
Euro Deferred Shares
During the Transactions,The authorized share capital of the Company issuedincludes 40 thousand Euro Deferred Shares, at theirwith a par value of €1.00 per share. The holders of the Euro Deferred Shares are not entitled to receive any dividend or distribution and are not entitled to receive notice of, nor attend, speak or vote at any general meeting of the Company. On a return of assets, whether on liquidation or otherwise, the Euro Deferred Shares are entitled to only the repayment of the amounts paid up on such shares, after repayment of the capital paid up on the ordinary shares. Euro Deferred shareholders are not entitled to any further participation in the assets or profits of the Company. On March 23, 2016, theAt April 29, 2022, no Euro Deferred Shares were transferred back toissued or outstanding.
Preferred Shares The authorized share capital of the Company andincludes 127.5 million of Preferred Shares, with a par value of $0.20 per share. At April 29, 2022, no Preferred Shares were subsequently canceled.issued or outstanding.
A Preferred Shares
The Company issued 624 A Preferred Shares The authorized share capital of the Company includes 500 thousand A Preferred Shares, with a par value of $1.00 each to threeper share. During the third quarter of its advisors in connection withfiscal year 2022 the Transactions, for a total ofCompany redeemed the previously outstanding 1,872 A Preferred Shares outstanding with an aggregate consideration of $75 thousand. The holders offor $0.075 million. At April 29, 2022, 0 A Preferred Shares are entitledwere outstanding.
Medtronic plc
Notes to payment of dividends prior to any other class of shares in the Company equal to twice the dividend to be paid per Company ordinary share. On a return of assets, whether on liquidation or otherwise, the A Preferred Shares are entitled to repayment of the capital paid up thereon in priority to any repayment of capital to the holders of any other shares and the holders of the A Preferred Shares shall not be entitled to any further participation in the assets or profits of the Company. The holders of the A Preferred Shares are not entitled to receive notice of, nor to attend, speak, or vote at any general meeting of the Company.Consolidated Financial Statements (Continued)
Dividends
Dividends The timing, declaration, and payment of future dividends to holders of ourthe Company's ordinary and A Preferred shares falls within the discretion of the Company's Board of Directors and depends upon many factors, including the statutory requirements of Irish law, the Company's earnings and financial condition, the capital requirements of ourthe Company's businesses, industry practice and any other factors the Board of Directors deems relevant.
Medtronic plc
Notes to Consolidated Financial Statements (Continued)
Ordinary Share Repurchase Program
Shares are repurchased from time to timeon occasion to support the Company’s stock-based compensation programs and to return capital to shareholders. During fiscal years 20162022 and 2015,2021, the Company repurchased approximately 3822 million and 304 million shares, respectively, at an average price of $74.92$113.11 and $64.53,$126.80, respectively.
In June 2015,March 2019, the Company's Board of Directors authorized subject to the ongoing existence of sufficient distributable reserves, the redemption of 80 million$6.0 billion for repurchase of the Company's ordinary shares. As ofThere is no specific time-period associated with these repurchase authorizations. At April 29, 2016,2022, the Company had used 8 million$3.0 billion of the 80 million shares$6.0 billion authorized under the repurchase program, leaving 72 million sharesapproximately $3.0 billion available for future repurchases. The Company accounts for repurchases of ordinary shares using the par value method and shares repurchased are canceled.cancelled.
10.12. Stock Purchase and Award Plans
The Company measures stock-based compensation expense at the grant date based on the fair value of the award and recognizes the compensation expense over the requisite service period, which is generally the vesting period.
The Medtronic, Inc. 2013 Stock Award and Incentive Plan was originally approved by the Company's shareholders in August 2013. In January 2015, the Company's Board of Directors approved an amendment to and assumption of the existing Medtronic, Inc. 2013 Stock Award and Incentive Plan, which created the new Medtronic plc 2013 Stock Award and Incentive Plan (2013 Plan). In fiscal year 2016,2022, the Company granted stock awards under the Medtronic plc 2013 Plan (2013 Plan) and the 2021 Medtronic plc Long Term Incentive Plan (2021 Plan). The 2021 Plan was approved by the Company's shareholders on December 9, 2021, and provides for a maximum of 115 million ordinary shares to be issued, in addition to the 14 million ordinary shares previously approved for issuance under the 2013 Plan. The 20132021 Plan provides for the grant of non-qualified and incentive stock options, stock appreciation rights, restricted stock, restricted stock units, performance awards, and other stock and cash-based awards. As of At April 29, 2016,2022, there were approximately 27127 million shares available for future grants under the 20132021 Plan.
ShareStock-Based Compensation Expense The following table presents the components and classification of stock-based compensation expense recognized for stock options, restricted stock, performance share units, and employee stock purchase plan (ESPP) in fiscal years 2022, 2021, and 2020:
| | | | | | | | | | | | | | | | | |
| | Fiscal Year |
| (in millions) | 2022 | | 2021 | | 2020 |
| Stock options | $ | 70 | | | $ | 72 | | | $ | 61 | |
| Restricted stock | 184 | | | 185 | | | 205 | |
| Performance share units | 66 | | | 49 | | | — | |
| Employee stock purchase plan | 39 | | | 38 | | | 31 | |
| Total stock-based compensation expense | $ | 359 | | | $ | 344 | | | $ | 297 | |
| | | | | |
| Cost of products sold | $ | 36 | | | $ | 35 | | | $ | 28 | |
| Research and development expense | 40 | | | 38 | | | 36 | |
| Selling, general, and administrative expense | 283 | | | 272 | | | 233 | |
| Total stock-based compensation expense | 359 | | | 344 | | | 297 | |
| Income tax benefits | (62) | | | (59) | | | (51) | |
| Total stock-based compensation expense, net of tax | $ | 297 | | | $ | 285 | | | $ | 246 | |
Stock Options Options are granted at the exercise price, which is equal to the closing price of the Company’s ordinary shareshares on the grant date. The majority of the Company’s options are non-qualified options with a 10-year10-year life and a 4-year4-year ratable vesting term. In fiscal year 2016, the Company granted share options under the 2013 Plan.
Restricted Stock Awards Restricted stock and restricted stock units (collectively referred to as restricted stock awards) are granted to officers and key employees. The Company grants restricted stock awards that typically cliff vest after four years. The expense recognized for restricted stock awards is equal to the grant date fair value, which is equal to the closing stock price on the date of grant. Restricted stock awards are expensed over the vesting period and are subject to forfeiture if employment terminates prior to the lapse of the restrictions. The Company also grants shares of performance-based restricted stock awards that typically cliff vest after three years only if the Company has also achieved certain performance objectives. Performance awards are expensed over the performance period based on the probability of achieving the performance objectives.
Shares of restricted stock are considered issued and outstanding shares of the Company at the grant date and have the same dividend and voting rights as other ordinary shares. Restricted stock units are not considered issued or outstanding ordinary shares of the Company. Dividend equivalent units are accumulated on restricted stock units during the vesting period. In fiscal year 2016, the Company granted restricted stock units under the 2013 Plan. As of April 29, 2016, all restricted stock awards outstanding were restricted stock units.
Employees Stock Purchase Plan The Medtronic plc Amended and Restated 2014 Employees Stock Purchase Plan (ESPP) allows participating employees to purchase the Company's ordinary shares at a discount through payroll deductions. The expense recognized for shares purchased under the Company’s ESPP is equal to the 15 percent discount the employee receives at the end of the calendar quarter purchase period.
Employees can contribute between 2 percent and 10 percent of their wages or the statutory limit under the U.S. Internal Revenue Code toward the purchase of newly issued ordinary shares of the Company at 85 percent of its market value at the end of the calendar quarter purchase period. Employees purchased 2 million shares at an average price of $61.66 per share in the fiscal year ended April 29, 2016. As of April 29, 2016, plan participants have had approximately $12 million withheld to purchase the Company's ordinary shares at 85 percent of its market value on July 1, 2016, the last trading day before the end of the calendar quarter purchase period. At April 29, 2016, approximately 20 million ordinary shares were available for future purchase under the ESPP.
Stock Option Valuation Assumptions The Company uses the Black-Scholes option pricing model (Black-Scholes model) to determine the fair value of stock options as ofat the grant date. The fair value of stock options under the Black-Scholes model requires management to make assumptions regarding projected employee stock option exercise behaviors, risk-free interest rates, volatility of the Company’s stock price, and expected dividends.
Medtronic plc
Notes to Consolidated Financial Statements (Continued)
The following table provides the weighted average fair value of options granted to employees and the related assumptions used in the Black-Scholes model:
|
| | | | | | | | | | | |
| | Fiscal Year |
| | 2016 | | 2015 | | 2014 |
| Weighted average fair value of options granted | $ | 13.72 |
| | $ | 25.39 |
| | $ | 12.00 |
|
| Assumptions used: | |
| | |
| | |
|
Expected life (years)(1) | 5.94 |
| | 4.24 |
| | 6.40 |
|
Risk-free interest rate(2) | 1.79 | % | | 0.99 | % | | 1.88 | % |
Volatility(3) | 21.00 | % | | 21.29 | % | | 25.20 | % |
Dividend yield(4) | 1.96 | % | | 1.66 | % | | 2.02 | % |
| |
(1) | Expected life: The Company analyzes historical employee stock option exercise and termination data to estimate the expected life assumption. The Company calculates the expected life assumption using the midpoint scenario, which combines historical exercise data with hypothetical exercise data, as the Company believes this data currently represents the best estimate of the expected life of a new employee option. The Company also stratifies its employee population into two groups based upon distinctive exercise behavior patterns.
|
| |
(2) | Risk-free interest rate: The rate is based on the grant date yield of a zero-coupon U.S. Treasury bond whose maturity period equals the expected term of the option.
|
| |
(3) | Volatility: Expected volatility is based on a blend of historical volatility and an implied volatility of the Company’s ordinary shares. Implied volatility is based on market traded options of the Company’s ordinary shares.
|
| |
(4) | Dividend yield: The dividend yield rate is calculated by dividing the Company’s annual dividend, based on the most recent quarterly dividend rate, by the closing stock price on the grant date.
|
Stock-Based Compensation Expense Under the fair value recognition provisions of U.S. GAAP for accounting for stock-based compensation, the Company measures stock-based compensation expense at the grant date based on the fair value of the award and recognizes the compensation expense over the requisite service period, which is generally the vesting period.
The amount of stock-based compensation expense recognized during a period is based on the portion of the awards that are ultimately expected to vest. The Company estimates pre-vesting forfeitures at the time of grant by analyzing historical data and revises those estimates in subsequent periods if actual forfeitures differ from those estimates. Ultimately, the total expense recognized over the vesting period will equal the fair value of awards that actually vest.
Pursuant to the Transaction Agreement, outstanding stock option awards held by Covidien employees upon transaction close were converted into options to acquire the Company's ordinary shares in a manner designed to preserve the intrinsic value of such awards. In addition, unvested restricted stock units granted on or after June 15, 2014 which were held by Covidien employees upon close of the Covidien acquisition were converted into restricted stock units of the Company in a manner designed to preserve the intrinsic value of such awards. The modifications made to the restricted stock units granted on or after June 15, 2014 and all outstanding share options pursuant to the Transaction Agreement that converted such awards constituted modifications under the authoritative guidance for accounting for stock compensation. This guidance requires the Company to revalue the award upon the transaction close and allocate the revised fair value between consideration paid and continuing expense based on the ratio of service performed through the transaction date over the total service period of the award. The revised fair value allocated to post-combination services resulted in incremental expense which is recognized over the remaining service period of the award. The Company recognized $58 million of incremental expense related to these modifications during fiscal year 2016 and is included in acquisition-related items. Except for the conversion of share options and restricted stock units discussed herein, the material terms of these awards remained unchanged.
Medtronic plc
Notes to Consolidated Financial Statements (Continued)
| | | | | | | | | | | | | | | | | |
| | Fiscal Year |
| | 2022 | | 2021 | | 2020 |
| Weighted average fair value of options granted | $ | 22.83 | | | $ | 16.15 | | | $ | 15.49 | |
| Assumptions used: | | | | | |
| Expected life (years) | 6.0 | | 6.0 | | 6.1 |
| Risk-free interest rate | 0.90 | % | | 0.33 | % | | 1.88 | % |
| Volatility | 23.04 | % | | 24.17 | % | | 17.97 | % |
| Dividend yield | 1.95 | % | | 2.36 | % | | 2.09 | % |
The following table presents the components and classification of stock-based compensation expense for stock options, restricted stock awards, and ESPP shares recognized for fiscal years 2016, 2015, and 2014:
|
| | | | | | | | | | | |
| | Fiscal Year |
| (in millions) | 2016 | | 2015 | | 2014 |
| Stock options | $ | 206 |
| | $ | 140 |
| | $ | 34 |
|
| Restricted stock awards | 148 |
| | 284 |
| | 98 |
|
| Employees stock purchase plan | 21 |
| | 15 |
| | 13 |
|
| Total stock-based compensation expense | $ | 375 |
| | $ | 439 |
| | $ | 145 |
|
| | | | | | |
| Cost of products sold | $ | 50 |
| | $ | 23 |
| | $ | 14 |
|
| Research and development expense | 37 |
| | 29 |
| | 27 |
|
| Selling, general, and administrative expense | 212 |
| | 128 |
| | 104 |
|
| Restructuring charges | 18 |
| | 70 |
| | — |
|
| Acquisition-related items | 58 |
| | 189 |
| | — |
|
| Total stock-based compensation expense | 375 |
| | 439 |
| | 145 |
|
| Income tax benefits | (108 | ) | | (138 | ) | | (40 | ) |
| Total stock-based compensation expense, net of tax | $ | 267 |
| | $ | 301 |
| | $ | 105 |
|
Stock Options The following table summarizes all stock option activity including activity from options assumed or issued as a result of acquisitions, during fiscal year 2016:2022:
|
| | | | | | | | | | | | |
| | Options (in thousands) | | Wtd. Avg. Exercise Price | | Wtd. Avg. Remaining Contractual Term (in years) | | Aggregate Intrinsic Value (in millions) |
| Outstanding at April 24, 2015 | 62,021 |
| | $ | 53.27 |
| | | | |
| Granted | 5,785 |
| | 77.76 |
| | | | |
| Exercised | (11,103 | ) | | 41.99 |
| | | | |
| Expired/Forfeited | (3,733 | ) | | 70.62 |
| | | | |
| Outstanding at April 29, 2016 | 52,970 |
| | 57.09 |
| | 6.47 | | $ | 1,168 |
|
| Vested and expected to vest at April 29, 2016 | 25,542 |
| | 69.91 |
| | 8.48 | | 236 |
|
| Exercisable at April 29, 2016 | 23,383 |
| | 40.14 |
| | 3.90 | | 912 |
|
| | | | | | | | | | | | | | | | | | | | | | | |
| | Options
(in thousands) | | Wtd. Avg.
Exercise
Price | | Wtd. Avg. Remaining Contractual Term (in years) | | Aggregate Intrinsic Value (in millions) |
| Outstanding at April 30, 2021 | 27,972 | | | $ | 84.38 | | | | | |
| Granted | 4,153 | | | 129.03 | | | | | |
| Exercised | (3,222) | | | 70.52 | | | | | |
| Expired/Forfeited | (641) | | | 107.42 | | | | | |
| Outstanding at April 29, 2022 | 28,263 | | | 92.00 | | | 5.5 | | $ | 450 | |
| Expected to vest at April 29, 2022 | 8,818 | | | 110.27 | | | 8.4 | | 35 | |
| Exercisable at April 29, 2022 | 18,804 | | | 82.62 | | | 4.0 | | 414 | |
The following table summarizes the total cash received from the issuance of new shares upon stock option award exercises, the total intrinsic value of options exercised, and the related tax benefit during fiscal years 2016, 2015,2022, 2021, and 2014:2020:
| | | | Fiscal Year | | Fiscal Year |
| (in millions) | 2016 | | 2015 | | 2014 | (in millions) | 2022 | | 2021 | | 2020 |
| Cash proceeds from options exercised | $ | 452 |
| | $ | 609 |
| | $ | 1,273 |
| Cash proceeds from options exercised | $ | 209 | | | $ | 277 | | | $ | 484 | |
| Intrinsic value of options exercised | 374 |
| | 329 |
| | 249 |
| Intrinsic value of options exercised | 174 | | | 205 | | | 349 | |
| Tax benefit related to options exercised | 131 |
| | 106 |
| | 78 |
| Tax benefit related to options exercised | 40 | | | 47 | | | 75 | |
Unrecognized compensation expense related to outstanding stock options as ofat April 29, 20162022 was $303 million and is expected to be recognized over a weighted average period of 2.1 years.
Medtronic plc
Notes to Consolidated Financial Statements (Continued)
Restricted Stock Awards The following table summarizes restricted stock award activity, including activity from restricted stock awards assumed or issued as a result of acquisitions, during fiscal year 2016:
|
| | | | | | |
| | Awards (in thousands) | | Wtd. Avg. Grant Price |
| Nonvested at April 24, 2015 | 10,022 |
| | $ | 53.88 |
|
| Granted | 2,565 |
| | 77.68 |
|
| Vested | (3,148 | ) | | 42.96 |
|
| Forfeited | (619 | ) | | 59.16 |
|
| Nonvested at April 29, 2016 | 8,820 |
| | $ | 64.33 |
|
The following table summarizes the weighted-average grant date fair value of restricted stock awards granted, total fair value of restricted stock awards vested and related tax benefit during fiscal years 2016, 2015, and 2014:
|
| | | | | | | | | | | |
| | Fiscal Year |
| (in millions, except per share data) | 2016 | | 2015 | | 2014 |
| Weighted-average grant-date fair value per restricted stock award | $ | 77.68 |
| | $ | 69.30 |
| | $ | 55.62 |
|
| Fair value of restricted stock awards vested | 276 |
| | 174 |
| | 142 |
|
| Tax benefit related to restricted stock awards vested | 76 |
| | 50 |
| | 40 |
|
Unrecognized compensation expense related to restricted stock awards as of April 29, 2016 was $278$90 million and is expected to be recognized over a weighted average period of 2.5 years.
Restricted Stock Restricted stock units are expensed over the vesting period and are subject to forfeiture if employment terminates prior to the lapse of the restrictions. The expense recognized for restricted stock units is equal to the grant date fair value, which is equal to the closing stock price on the date of grant. Restricted stock units either have a 4-year ratable vesting term or cliff vest after three years. The Company also grants shares of performance-based restricted stock units that typically cliff vest after three years only if the Company has also achieved certain performance objectives. Performance awards are expensed over the performance period based on the probability of achieving the performance objectives. Restricted stock units are not considered issued or outstanding ordinary shares of the Company. Dividend equivalent units are accumulated on restricted stock units during the vesting period.
Medtronic plc
Notes to Consolidated Financial Statements (Continued)
The following table summarizes restricted stock activity during fiscal year 2022:
| | | | | | | | | | | |
| | Units
(in thousands) | | Wtd. Avg.
Grant
Price |
| Nonvested at April 30, 2021 | 5,980 | | | $ | 97.66 | |
| Granted | 1,935 | | | 127.47 | |
| Vested | (2,089) | | | 93.05 | |
| Forfeited | (456) | | | 107.53 | |
| Nonvested at April 29, 2022 | 5,370 | | | 108.92 | |
The following table summarizes the weighted-average grant date fair value of restricted stock granted, total fair value of restricted stock vested and related tax benefit during fiscal years 2022, 2021, and 2020:
| | | | | | | | | | | | | | | | | |
| Fiscal Year |
| (in millions, except per share data) | 2022 | | 2021 | | 2020 |
| Weighted-average grant-date fair value per restricted stock | $ | 127.47 | | | $ | 99.48 | | | $ | 103.52 | |
| Fair value of restricted stock vested | 194 | | | 280 | | | 242 | |
| Tax benefit related to restricted stock vested | 52 | | | 65 | | | 62 | |
Unrecognized compensation expense related to restricted stock as of April 29, 2022 was $316 million and is expected to be recognized over a weighted average period of 2.5 years.
Performance Share Units Beginning in fiscal year 2021, the Company granted performance share units to officers and key employees. Performance share units typically cliff vest after three years. The awards include three metrics: relative total shareholder return (rTSR), revenue growth, and return on investor capital (ROIC). rTSR is considered a market condition metric, and the expense is determined at the grant date and will not be adjusted even if the market condition is not met. Revenue growth and ROIC are considered performance metrics, and the expense is recorded over the performance period, which will be reassessed each reporting period based on the probability of achieving the various performance conditions. The number of shares earned at the end of the three-year period will vary, based on only actual performance, from 0% to 200% of the target number of performance share units granted. Performance share units are subject to forfeiture if employment terminates prior to the lapse of the restrictions. Performance share units are not considered issued or outstanding ordinary shares of the Company. Dividend equivalent units are accumulated on performance share units for each component of the award during the vesting period.
The Company calculates the fair value of the performance share units for each component individually. The fair value of the rTSR metric will be determined using the Monte Carlo valuation model. The fair value of the revenue growth and ROIC metrics are equal to the closing stock price on the grant date.
The following table summarizes performance share unit activity during fiscal year 2022:
| | | | | | | | | | | |
| | Units
(in thousands) | | Wtd. Avg.
Grant
Price |
| Nonvested at April 30, 2021 | 828 | | | $ | 129.05 | |
| Granted | 831 | | | 149.16 | |
| | | |
| Forfeited | (78) | | | 138.31 | |
| Nonvested at April 29, 2022 | 1,581 | | | 138.95 | |
Medtronic plc
Notes to Consolidated Financial Statements (Continued)
The following table summarizes the weighted-average grant date fair value of performance share units granted, total fair value of performance share units vested and related tax benefit during fiscal year 2022 and 2021:
| | | | | | | | | | | | | |
| Fiscal Year |
| (in millions, except per share data) | 2022 | | 2021 | | |
| Weighted-average grant-date fair value per performance share units | $ | 149.16 | | | $ | 129.04 | | | |
| Fair value of performance share units vested | — | | | — | | | |
| Tax benefit related to performance share units vested | — | | | — | | | |
Unrecognized compensation expense related to performance share units as of April 29, 2022 was $84 million and is expected to be recognized over a weighted average period of 1.9 years.
Employees Stock Purchase Plan The Medtronic plc Amended and Restated 2014 Employees Stock Purchase Plan allows participating employees to purchase the Company's ordinary shares at a discount through payroll deductions. The expense recognized for shares purchased under the Company’s ESPP is equal to the 15 percent discount the employee receives. Employees purchased 2 million shares at an average price of $98.75 per share in fiscal year 2022. At April 29, 2022, approximately 7 million ordinary shares were available for future purchase under the ESPP.
13. Income Taxes
The income tax provision for income taxes(benefit) is based on income before income taxes reported for financial statement purposes. The components of income from continuing operations before income taxes, based on tax jurisdiction, are as follows:
| | | | | | | | | | | | | | | | | |
| | Fiscal Year |
| (in millions) | 2022 | | 2021 | | 2020 |
| U.S. | $ | 436 | | | $ | (358) | | | $ | 466 | |
| International | 5,081 | | | 4,253 | | | 3,589 | |
| Income before income taxes | $ | 5,517 | | | $ | 3,895 | | | $ | 4,055 | |
|
| | | | | | | | | | | |
| | Fiscal Year |
| (in millions) | 2016 | | 2015 | | 2014 |
| U.S. | $ | 333 |
| | $ | 639 |
| | $ | 1,690 |
|
| International | 4,003 |
| | 2,847 |
| | 2,015 |
|
| Income from continuing operations before income taxes | $ | 4,336 |
| | $ | 3,486 |
| | $ | 3,705 |
|
The income tax provision for income taxes from continuing operations(benefit) consists of the following: | | | | | | | | | | | | | | | | | |
| | Fiscal Year |
| (in millions) | 2022 | | 2021 | | 2020 |
| Current tax expense: | | | | | |
| U.S. | $ | 467 | | | $ | 287 | | | $ | 151 | |
| International | 599 | | | 439 | | | 375 | |
| Total current tax expense | 1,066 | | | 726 | | | 526 | |
| Deferred tax (benefit) expense: | | | | | |
| U.S. | (402) | | | (625) | | | (138) | |
| International | (209) | | | 165 | | | (1,139) | |
| Net deferred tax benefit | (611) | | | (461) | | | (1,277) | |
| Income tax provision (benefit) | $ | 456 | | | $ | 265 | | | $ | (751) | |
|
| | | | | | | | | | | |
| | Fiscal Year |
| (in millions) | 2016 | | 2015 | | 2014 |
| Current tax expense: | |
| | |
| | |
|
| U.S. | $ | 440 |
| | $ | 1,128 |
| | $ | 532 |
|
| International | 835 |
| | 502 |
| | 248 |
|
| Total current tax expense | 1,275 |
| | 1,630 |
| | 780 |
|
| Deferred tax (benefit) expense: | |
| | |
| | |
|
| U.S. | (67 | ) | | (705 | ) | | (175 | ) |
| International | (410 | ) | | (114 | ) | | 35 |
|
| Net deferred tax benefit | (477 | ) | | (819 | ) | | (140 | ) |
| Total provision for income taxes | $ | 798 |
| | $ | 811 |
| | $ | 640 |
|
Medtronic plc
Notes to Consolidated Financial Statements (Continued)
Deferred taxes arise because of the different treatment of transactions for financial statement accounting and income tax accounting, known as temporary differences. The Company records the tax effect of these temporary differences as deferred tax assets and deferred tax liabilities. Deferred tax assets generally represent items that can be used as a tax deduction or credit in a tax return in future years for which the Company has already recorded the tax benefit in the consolidated statements of income. The Company establishes valuation allowances for deferred tax assets when the amount of expected future taxable income is not likely to support the use of the deduction or credit. Deferred tax liabilities generally represent tax expense recognized in the consolidated financial statements for which payment has been deferred or expense has already been taken as a deduction on the Company’s tax return but has not yet been recognized as an expense in the consolidated statements of income. Tax assets (liabilities), shown before jurisdictional netting of deferred tax assets (liabilities), are comprised of the following:
| | | | | | | | | | | |
| (in millions) | April 29, 2022 | | April 30, 2021(1) |
| Deferred tax assets: | | | |
| Intangible assets | $ | 2,334 | | | $ | 1,536 | |
| Net operating loss, capital loss, and credit carryforwards | 5,982 | | | 6,114 | |
| Capitalization of research and development | 597 | | | 408 | |
| Other accrued liabilities | 483 | | | 442 | |
| Accrued compensation | 332 | | | 411 | |
| Pension and post-retirement benefits | 66 | | | 234 | |
| Stock-based compensation | 146 | | | 132 | |
| Inventory | 146 | | | 164 | |
| Lease obligations | 92 | | | 106 | |
| Federal and state benefit on uncertain tax positions | 60 | | | 55 | |
| Interest limitation | 386 | | | 352 | |
| | | |
| Other | 374 | | | 336 | |
| Gross deferred tax assets | 10,998 | | | 10,290 | |
| Valuation allowance | (6,583) | | | (5,822) | |
| Total deferred tax assets | 4,415 | | 4,468 |
| Deferred tax liabilities: | | | |
| Intangible assets | (1,488) | | | (1,856) | |
| Realized loss on derivative financial instruments | (66) | | | (75) | |
| Right of use leases | (89) | | | (102) | |
| Unrealized gain on available-for-sale securities and derivative financial instruments | — | | | (16) | |
| Accumulated depreciation | (121) | | | (151) | |
| Outside basis difference of subsidiaries | (129) | | | (101) | |
| Other | (70) | | | (81) | |
| Total deferred tax liabilities | (1,963) | | | (2,382) | |
| Prepaid income taxes | 474 | | | 458 | |
| Income tax receivables | 358 | | | 353 | |
| Tax assets, net | $ | 3,284 | | | $ | 2,897 | |
| Reported as (after valuation allowance and jurisdictional netting): | | | |
| Other current assets | $ | 765 | | | $ | 756 | |
| Tax assets | 3,403 | | | 3,169 | |
| Deferred tax liabilities | (884) | | | (1,028) | |
| Tax assets, net | $ | 3,284 | | | $ | 2,897 | |
|
| | | | | | | |
| (in millions) | April 29, 2016 | | April 24, 2015 |
| Deferred tax assets: | |
| | |
|
| Net operating loss, capital loss, and credit carryforwards | $ | 7,568 |
| | $ | 5,912 |
|
| Other accrued liabilities | 619 |
| | 585 |
|
| Accrued compensation | 358 |
| | 330 |
|
| Pension and post-retirement benefits | 530 |
| | 449 |
|
| Stock-based compensation | 316 |
| | 418 |
|
| Other | 341 |
| | 303 |
|
| Inventory | 225 |
| | 171 |
|
| Federal and state benefit on uncertain tax positions | 308 |
| | 296 |
|
| Unrealized loss on available-for-sale securities and derivative financial instruments | 107 |
| | — |
|
| Gross deferred tax assets | 10,372 |
| | 8,464 |
|
| Valuation allowance | (7,032 | ) | | (5,607 | ) |
| Total deferred tax assets | 3,340 |
| | 2,857 |
|
| Deferred tax liabilities: | |
| | |
|
| Intangible assets | (5,173 | ) | | (5,393 | ) |
| Basis impairment | (230 | ) | | (204 | ) |
| Realized loss on derivative financial instruments | (112 | ) | | (112 | ) |
| Other | (179 | ) | | (96 | ) |
| Accumulated depreciation | (189 | ) | | (217 | ) |
| Unrealized gain on available-for-sale securities and derivative financial instruments | — |
| | (160 | ) |
| Total deferred tax liabilities | (5,883 | ) | | (6,182 | ) |
| Prepaid income taxes | 365 |
| | 427 |
|
| Income tax receivables | 529 |
| | 188 |
|
| Tax liabilities, net | $ | (1,649 | ) | | $ | (2,710 | ) |
| Reported as (after valuation allowance and jurisdictional netting): | |
| | |
|
| Tax assets | $ | 697 |
| | $ | 1,335 |
|
| Long-term tax assets | 1,383 |
| | 774 |
|
| Deferred tax liabilities | — |
| | (119 | ) |
| Long-term deferred tax liabilities | (3,729 | ) | | (4,700 | ) |
| Tax liabilities, net | $ | (1,649 | ) | | $ | (2,710 | ) |
No deferred taxes have been provided on the approximately $79.3 billion and $74.2 billion of undistributed earnings of the Company’s subsidiaries at April 29, 2022 and April 30, 2021, respectively, since these earnings have been, and under current plans will continue to be, permanently reinvested in these subsidiaries. Due to the number of legal entities and jurisdictions involved, the complexity of the legal entity structure of the Company, and the complexity of the tax laws in the relevant jurisdictions, the Company believes it is not practicable to estimate, within any reasonable range, the amount of additional taxes which may be payable upon distribution of these undistributed earnings.
At April 29, 2016,2022, the Company had approximately $26.6$25.4 billion of net operating loss carryforwards in certain non-U.S. jurisdictions, of which$22.420.0 billion have no expiration, and the remaining $4.2$5.4 billion will expire in futureduring fiscal years 2023 through 2036.2042. Included in these net operating loss carryforwards are $18.0$18.6 billion of net operating losses related to a subsidiary of the Company, substantially all of which
Medtronic plc
Notes to Consolidated Financial Statements (Continued)
were recorded in fiscal year 2008 as a result of the receipt of a favorable tax ruling from certain non-U.S. taxing authorities. The Company has recorded a full valuation allowance against these net operating losses, as management does not believe that it is more likely than not that these net operating losses will be utilized. Certain of the remaining non-USnon-U.S. net
Medtronic plc
Notes to Consolidated Financial Statements (Continued)
operating loss carryforwards of $8.6$6.8 billion have a valuation allowance recorded against the carryforwards, as management does not believe that it is more likely than not that these net operating losses will be utilized.
At April 29, 2016,2022, the Company had $847$222 million of U.S. federal net operating loss carryforwards, of which $47 million have no expiration. The remaining loss carryforwards will expire during fiscal 2018years 2023 through 2036. For U.S. state purposes, the Company had $755 million$1.4 billion of net operating loss carryforwards at April 29, 2016,2022, $72 million of which have no expiration. The remaining U.S. state loss carryforwards will expire during fiscal 2017years 2023 through 2036.2042.
At April 29, 2016,2022, the Company also had $202$254 million of tax credits available to reduce future income taxes payable, of which$98120 million have no expiration, and theexpiration. The remaining credits begin towill expire during fiscal 2017.years 2023 through 2042.
The Company has established valuation allowances of $7.0$6.6 billion and $5.6$5.8 billion at April 29, 20162022 and April 24, 2015,30, 2021, respectively, primarily related to the uncertainty of the utilization of certain deferred tax assets which are primarily comprised of tax loss and credit carryforwards in various jurisdictions. The increase in the valuation allowance during fiscal year 2022 is primarily related to the step up in tax basis for Swiss Cantonal purposes, the generation of certain net operating losses and the effects of currency fluctuations. These valuation allowances would result in a reduction to the provision for income taxestax provision in the consolidated statements of income if they are ultimately not required.
At April 29, 2016, the Company had certain potential non-U.S. tax attributes that had not been recorded in the consolidated financial statements, including$12.4 billion of non-U.S. special deductions with an indefinite carryforward period. The Company has treated these amounts as special deductions for financial statement purposes since utilization is contingent upon the annual performance of certain economic factors. The Company intends to recognize the applicable portion of the special deduction annually at an estimated tax rate of between1% and3% when and if these economic factors are met.
The Company’s effective income tax rate from continuing operations varied from the U.S. federal statutory tax rate as follows:
| | | | | | | | | | | | | | | | | |
| | Fiscal Year |
| | 2022 | | 2021 | | 2020 |
| U.S. federal statutory tax rate | 21.0 | % | | 21.0 | % | | 21.0 | % |
| Increase (decrease) in tax rate resulting from: | | | | | |
| U.S. state taxes, net of federal tax benefit | 0.2 | | | (1.1) | | | 0.5 | |
| Research and development credit | (1.3) | | | (2.3) | | | (2.1) | |
| Puerto Rico excise tax | (1.1) | | | (2.0) | | | (1.5) | |
| International | (11.2) | | | (12.6) | | | (10.0) | |
| Stock based compensation | (0.8) | | | (0.8) | | | (1.5) | |
| Interest on uncertain tax positions | 0.5 | | | 0.9 | | | 1.3 | |
| Base erosion anti-abuse tax | 0.9 | | | 0.5 | | | 2.6 | |
| Foreign derived intangible income benefit | (1.0) | | | (1.9) | | | (1.2) | |
| Certain tax adjustments | (0.9) | | | (1.0) | | | (30.8) | |
| Legal entity restructuring | — | | | 1.8 | | | — | |
| U.S. tax on foreign earnings | 2.2 | | | 3.4 | | | 2.8 | |
| Other, net | (0.2) | | | 0.9 | | | 0.4 | |
| Effective tax rate | 8.3 | % | | 6.8 | % | | (18.5) | % |
|
| | | | | | | | |
| | Fiscal Year |
| | 2016 | | 2015 | | 2014 |
| U.S. federal statutory tax rate | 35.0 | % | | 35.0 | % | | 35.0 | % |
| Increase (decrease) in tax rate resulting from: | |
| | |
| | |
|
| U.S. state taxes, net of federal tax benefit | 0.9 |
| | 0.8 |
| | 0.6 |
|
| Research and development credit | (1.2 | ) | | (0.7 | ) | | (0.5 | ) |
| Domestic production activities | (0.3 | ) | | (0.4 | ) | | (0.4 | ) |
| International | (23.4 | ) | | (24.3 | ) | | (17.7 | ) |
| Puerto Rico Excise Tax | (1.6 | ) | | (1.7 | ) | | (1.6 | ) |
Impact of adjustments(1) | 11.4 |
| | 13.3 |
| | 5.6 |
|
| Reversal of excess tax accruals | — |
| | — |
| | (1.9 | ) |
| Valuation allowance release | (0.9 | ) | | — |
| | — |
|
| Other, net | (1.5 | ) | | 1.3 |
| | (1.8 | ) |
| Effective tax rate | 18.4 | % | | 23.3 | % | | 17.3 | % |
| |
(1) | Adjustments include the impact of inventory step-up, impact of product technology upgrade commitment, special charges (gains), net, restructuring charges, net, certain litigation charges, net, acquisition-related items, amortization of intangible assets, and certain tax adjustments. |
During fiscal year 20162022, the Company recordednet benefit from certain tax adjustments of $417 million. A $442$50 million, certain tax adjustment charge was recorded, which primarily related to the U.S. recognized in income tax expense resulting from our completion of an internal reorganization of the ownership of certain legacy Covidien businesses that reduced the cash and investments held by our U.S.-controlled non-U.S. subsidiaries (the Internal Reorganization). As a result of the Internal Reorganization, approximately $9.7 billion of cash, cash equivalents and investments in marketable debt and equity securities previously held by U.S.-controlled non-U.S. subsidiaries became available for general corporate purposes. This charge was partially offset by a $25 million tax benefit associated with the disposition of a wholly owned U.S. subsidiary. The $417 million net certain tax adjustment was recorded in the provision for income taxes(benefit) in the consolidated statement of income, included the following:
•A benefit of$82 million associated with a step up in tax basis for fiscal year 2016.Swiss Cantonal purposes.
During fiscal year 2015,•A benefit of$82 million related to a settlement was reached with the IRS for the Kyphon acquisition-related matters. As a result, the Company recorded a $329change in tax rates on intangible assets.
•A cost of$47 million certain tax adjustment associated with the settlement. In addition,amortization of the certainpreviously established deferred tax adjustments includes a $20assets from intercompany intellectual property transactions.
•A cost of $41 million charge related to a taxable gain associated with the Covidien acquisition. The $349 million net tax cost was recordeda change in the provision for income taxes in the consolidated statementCompany’s permanent reinvestment assertion on certain historical earnings.
•A net cost of income for fiscal year 2015.$26 million primarily associated with an intercompany sale of assets.
Medtronic plc
Notes to Consolidated Financial Statements (Continued)
InDuring fiscal year 2014,2021, the Company recorded a $71net benefit from certain tax adjustments of $41 million, net tax benefit associated with the reversal of excess tax accruals. This net tax benefit included $63 million related to the settlement of certain issues reached with the IRS involving the review of the Company’s fiscal years 2009 through 2011 domestic recognized in income tax returns and the remaining amount related to the resolution of various state and foreign audit proceedings covering multiple years and issues. The $71 million net tax benefit was recorded in the provision for income taxes(benefit) in the consolidated statement of income, included the following:
•A net benefit of$106 million associated with the resolution of an audit at the IRS Appellate level for fiscal yearyears 2012, 2013, and 2014.
No deferred taxes have been provided for any portion of the approximately $29.0 billion and $27.8 billion of undistributed earnings of the Company’s subsidiaries as of April 29, 2016 and April 24, 2015, respectively, since these earnings have been, and under current plans will continue to be, permanently reinvested in these subsidiaries. The Company has not provided U.S. income taxes on approximately $20.5 billion of undistributed earnings, net, from non-U.S. subsidiaries as of April 25, 2014. Due to the number of legal entities and jurisdictions involved and the complexity of the legal entity structure of the Company, the complexity of the tax laws in the relevant jurisdictions, including, but not limited to the rules pertainingissues resolved relate to the utilization of foreigncertain net operating losses and the allocation of income between Medtronic, Inc. and its wholly owned subsidiary operating in Puerto Rico for businesses that are not the subject of the U.S. Tax Court Case for fiscal years 2005 and 2006.
•A net cost of$73 million related to a tax creditsbasis adjustment of previously established deferred tax assets from intercompany intellectual property transactions. The cumulative amount of deferred tax benefit previously recognized from intercompany intellectual property transactions and recorded as Certain Tax Adjustments is $1.5 billion. The corresponding deferred tax assets will be amortized over a period of approximately 20 years.
•A cost of$50 million associated with the amortization of the previously established deferred tax assets from intercompany intellectual property transactions.
•A net cost of $25 million associated with an internal restructuring and intercompany sale of assets.
•A benefit of$83 million related to the capitalization of certain research and development costs for U.S. income tax purposes and the establishment of a deferred tax asset at the U.S. federal statutory tax rate.
During fiscal year 2020, the net benefit from certain tax adjustments of $1.2 billion, recognized in income tax provision (benefit) in the United Statesconsolidated statement of income, included the following:
•A net benefit of$63 million related to the finalization of certain state tax impacts from U.S. Tax Reform, and the issuance of certain final U.S. Treasury Regulations associated with U.S. Tax Reform. The primary impact of projections of income for future years to any calculations,these regulations resulted in the Company believes it is not practicablere-establishing its permanently reinvested assertion on certain foreign earnings and reversing the previously accrued tax liability. This benefit was partially offset by additional tax associated with a previously executed internal reorganization of certain foreign subsidiaries.
•A benefit of $252 million related to estimate, within any reasonable range,tax legislative changes in Switzerland, which abolished certain preferential tax regimes the amountCompany benefited from and replaced them with a new set of additional taxes which mayinternationally accepted measures. The legislation provided for higher effective tax rates but allowed for a transitional period whereby an amortizable asset was created for Swiss federal income tax purposes that will be payable upon distributionamortized and deducted over a 10-year period.
•A benefit of these earnings.$658 million related to the release of a valuation allowance previously recorded against certain net operating losses. Luxembourg enacted tax legislation during the year requiring the Company to reassess the realizability of certain net operating losses. The Company evaluated both the positive and negative evidence and released valuation allowance equal to the expected benefit from the utilization of certain net operating losses in connection with a planned intercompany sale of intellectual property.
•A benefit of $269 million associated with the intercompany sale of intellectual property and the establishment of a deferred tax asset.
Currently, the Company’s operations in Puerto Rico, Switzerland, Singapore, Dominican Republic, Costa Rica, and IsraelChina have various tax holidays and tax incentive grants. The tax reductions as compared to the local statutory rate favorably impacted earnings by $248 million, $301 million, and $231 million in fiscal years 2022, 2021, and 2020, respectively, and diluted earnings per diluted share by $0.33$0.18, $0.22, and $0.17, in fiscal year 2016, $0.37 in fiscal year 2015,years 2022, 2021, and $0.42 in fiscal year 2014. Unless these2020, respectively. The tax holidays are conditional upon the Company meeting certain thresholds required under statutory law. The tax incentive grants, areunless extended, they will expire between fiscal years 20172023 and 2029.2034. The Company’s historical practice has been to renew, extend, or obtain new tax incentive grants upon expiration of existing tax incentive grants. If the Company is not able to renew, extend, or obtain new tax incentive grants, the expiration of existing tax incentive grants could have a material impact on the Company’s financial results in future periods. The tax incentive grants which expired during fiscal year 2022 did not have a material impact on the Company's consolidated financial statements.
Medtronic plc
Notes to Consolidated Financial Statements (Continued)
The Company had $2.7$1.7 billion, $2.9$1.7 billion, and $1.2$1.9 billion of gross unrecognized tax benefits as ofat April 29, 2016,2022, April 30, 2021, and April 24, 2015, and April 25, 2014,2020, respectively. A reconciliation of the beginning and ending amount of unrecognized tax benefits for fiscal years 2016, 2015,2022, 2021, and 20142020 is as follows:
| | | | Fiscal Year | | Fiscal Year |
| (in millions) | 2016 | | 2015 | | 2014 | (in millions) | 2022 | | 2021 | | 2020 |
| Gross unrecognized tax benefits at beginning of fiscal year | $ | 2,860 |
| | $ | 1,172 |
| | $ | 1,068 |
| Gross unrecognized tax benefits at beginning of fiscal year | $ | 1,668 | | | $ | 1,862 | | | $ | 1,836 | |
| Gross increases: | |
| | |
| | |
| Gross increases: | | | | | |
| Prior year tax positions | 36 |
| | 331 |
| | 64 |
| Prior year tax positions | 1 | | | 88 | | | 12 | |
| Current year tax positions | 202 |
| | 231 |
| | 166 |
| Current year tax positions | 40 | | | 62 | | | 55 | |
| Acquisitions | — |
| | 1,199 |
| | — |
| |
| Gross decreases: | |
| | |
| | |
| Gross decreases: | | | | | |
| Prior year tax positions | (116 | ) | | (40 | ) | | (58 | ) | Prior year tax positions | (29) | | | (106) | | | (9) | |
| Settlements | (275 | ) | | (33 | ) | | (66 | ) | Settlements | (8) | | | (216) | | | (5) | |
| Statute of limitation lapses | (4 | ) | | — |
| | (2 | ) | Statute of limitation lapses | (11) | | | (21) | | | (27) | |
| Gross unrecognized tax benefits at end of fiscal year | $ | 2,703 |
| | $ | 2,860 |
| | $ | 1,172 |
| Gross unrecognized tax benefits at end of fiscal year | 1,661 | | | 1,668 | | | 1,862 | |
| Cash advance paid in connection with proposed settlements | (384 | ) | | (378 | ) | | — |
| |
| Cash advance paid to taxing authorities | | Cash advance paid to taxing authorities | (859) | | | (859) | | | (859) | |
| Gross unrecognized tax benefits at end of fiscal year, net of cash advance | $ | 2,319 |
| | $ | 2,482 |
| | $ | 1,172 |
| Gross unrecognized tax benefits at end of fiscal year, net of cash advance | $ | 802 | | | $ | 809 | | | $ | 1,003 | |
If all of the Company’s unrecognized tax benefits as ofat April 29, 2016,2022, April 30, 2021, and April 24, 2015, and April 25, 20142020 were recognized, $2.1$1.6 billion, $2.2$1.6 billion, and $1.1$1.8 billion would impact the Company’s effective tax rate, respectively. Although the Company believes that it has adequately provided for liabilities resulting from tax assessments by taxing authorities, positions taken by these tax authorities could have a material impact on the Company’s effective tax rate in future periods. The Company has recorded $7 million of gross unrecognized tax benefits, net of cash advance, of $787 million as a current liability, and $2.7 billion as a long-termnoncurrent liability. The Company estimates that within the next 12 months it is reasonably possible that its uncertain tax positions excluding interest, could decrease by as much as $500$15 million, net as a result of the resolution of tax matters with the U.S. Tax Court, Appeals Division of the IRS, other settlements with taxing authorities as well as statute of limitation lapses.
The Company recognizes interest and penalties related to income tax matters in the provision for income taxestax provision(benefit) in the consolidated statements of income and records the liability in the current or long-term noncurrent accrued income taxes in the consolidated balance sheets, as appropriate. The Company had $609$117 million, $656$99 million, and $141$225 million of accrued gross interest and penalties as of
Medtronic plc
Notes to Consolidated Financial Statements (Continued)
at April 29, 2016,2022, April 30, 2021, and April 24, 2015, and April 25, 2014,2020, respectively. During the fiscal years ended April 29, 2016, April 24, 2015,2022, 2021, and April 25, 2014,2020, the Company recognized gross interest expense of approximately $80$17 million, $142income of $44 million, and $36expense of $53 million, respectively, in the income tax provision for income taxes(benefit) in the consolidated statements of income.
The Company’sCompany reserves for uncertain tax positions relaterelated to unresolved matters with the IRS and other taxing authorities. These reserves are subject to a high degree of estimation and management judgment. Resolution of these significant unresolved matters, or positions taken by the IRS or other tax authorities during future tax audits, could have a material impact on the Company’s financial results in future periods. The Company continues to believe that its reserves for uncertain tax positions are appropriate and that it has meritorious defenses for its tax filings and will vigorously defend them during the audit process, appellate process, and through litigation in courts, as necessary.
Medtronic plc
Notes to Consolidated Financial Statements (Continued)
The major tax jurisdictions where the Company conducts business which remain subject to examination are as follows:
|
| | | | | | | |
| Jurisdiction | | Earliest Year Open |
| United States - federal and state | | 19962005 |
BrazilAustralia | | 20112018 |
CanadaBrazil | | 20052017 |
ChinaCanada | | 20092013 |
Costa RicaChina | | 20122015 |
Dominican RepublicCosta Rica | | 20112018 |
FranceDominican Republic | | 20112019 |
GermanyFrance | | 20092019 |
IndiaGermany | | 20012014 |
IrelandIndia | | 20112002 |
IsraelIreland | | 20102012 |
ItalyIsrael | | 20052010 |
JapanItaly | | 20102005 |
LuxembourgJapan | | 20092018 |
MexicoKorea | | 20052017 |
Puerto RicoLuxembourg | | 20092017 |
SingaporeMexico | | 20112017 |
SwitzerlandPuerto Rico | | 20032011 |
| Singapore | | 2016 |
| Switzerland | | 2010 |
| United Kingdom | | 20092017 |
See Note 1518 for additional information regarding the status of current tax audits and proceedings.
12.
Medtronic plc
Notes to Consolidated Financial Statements (Continued)
14. Earnings Per Share
Basic earnings per share is computed based on the weighted average number of ordinary shares outstanding. Diluted earnings per share is computed based on the weighted number of ordinary shares outstanding, increased by the number of additional shares that would have been outstanding had the potentially dilutive ordinary shares been issued, and reduced by the number of shares the Company could have repurchased with the proceeds from issuance of the potentially dilutive shares. Potentially dilutive ordinary shares include stock-based awards granted under stock-based compensation plans and shares committed to be purchased under the employee stock purchase plan.
The table below sets forth the computation of basic and diluted earnings per share:
| | | | | | | | | | | | | | | | | |
| | Fiscal Year |
| (in millions, except per share data) | 2022 | | 2021 | | 2020 |
| Numerator: | | | | | |
| Net income attributable to ordinary shareholders | $ | 5,039 | | | $ | 3,606 | | | $ | 4,789 | |
| Denominator: | | | | | |
| Basic – weighted average shares outstanding | 1,342.4 | | | 1,344.9 | | | 1,340.7 | |
| Effect of dilutive securities: | | | | | |
| Employee stock options | 6.6 | | | 6.6 | | | 7.2 | |
| Employee restricted stock units | 1.6 | | | 2.1 | | | 2.8 | |
| Other | 0.8 | | | 0.5 | | | 0.4 | |
| Diluted – weighted average shares outstanding | 1,351.4 | | | 1,354.0 | | | 1,351.1 | |
| | | | | |
| Basic earnings per share | $ | 3.75 | | | $ | 2.68 | | | $ | 3.57 | |
| Diluted earnings per share | $ | 3.73 | | | $ | 2.66 | | | $ | 3.54 | |
The calculation of weighted average diluted shares outstanding excludes options to purchase approximately 5 million ordinary shares in fiscal year 2022 and 4 million ordinary shares in fiscal years 2021 and 2020 because their effect would have been anti-dilutive on the Company’s earnings per share.
15. Retirement Benefit Plans
The Company sponsors various retirement benefit plans, including defined benefit pension plans, (pension benefits), post-retirement medical plans, (post-retirement benefits), defined contribution savings plans, and termination indemnity plans, covering substantially all U.S. employees and many employees outside the U.S. The net expense related to these plans was $584$459 million, $433$668 million,, and $419$467 million in fiscal years 2016, 2015,2022, 2021, and 2014,2020, respectively.
In the U.S., the Company maintains a qualified pension planplans designed to provide guaranteed minimum retirement benefits to all eligible U.S. employees.participants. Pension coverage for non-U.S. employees is provided, to the extent deemed appropriate, through separate plans. In addition, U.S. and Puerto Rico employees are also eligible to receive specified Company paid health care and life insurance benefits through the Company’s post-retirement benefits. In addition to the benefits provided under the qualified pension plan, retirement benefits associated with wages in excess of the IRS allowable limits are provided to certain employees under a non-qualified plan. U.S. and Puerto Rico employees are also eligible to receive a medical benefit component, in addition to normal retirement benefits, through the Company’s post-retirement benefits.
As of At April 29, 20162022 and April 24, 2015,30, 2021, the net underfundedfunded status of the Company’s benefit plans was $1.4 billion$74 million overfunded and $1.3 billion,$705 million underfunded, respectively.
During fiscal year 2021, as part of the Simplification restructuring program, the Company offered certain eligible U.S. employees voluntary early retirement packages, resulting in incremental expense of $97 million recognized. Of this amount, $73 million related to U.S. pension benefits, $11 million related to defined contribution plans, $11 million related to U.S. post-retirement benefits, and $2 million related to cash payments and administrative fees. See Note 4 for additional information on the Simplification restructuring program.
As of April 24, 2020, the Company announced the freezing of U.S. pension benefits beginning in 2027. Employees will continue to earn benefits as required by the plan until April 30, 2027, after which date benefits will no longer be earned and employees will earn benefits under a new defined contribution structure. The Company recognized curtailment benefits of $94 million in fiscal year 2020 as a result of this change.
Medtronic plc
Notes to Consolidated Financial Statements (Continued)
Defined Benefit Pension Plans The change in benefit obligation and funded status of the Company’s U.S. and Non-U.S. pension benefits are as follows:
| | | | | | | | | | | | | | | | | | | | | | | |
| | U.S. Pension Benefits | | Non-U.S. Pension Benefits |
| | Fiscal Year | | Fiscal Year |
| (in millions) | 2022 | | 2021 | | 2022 | | 2021 |
| Accumulated benefit obligation at end of year: | $ | 3,396 | | | $ | 3,786 | | | $ | 1,638 | | | $ | 2,035 | |
| Change in projected benefit obligation: | | | | | | | |
| Projected benefit obligation at beginning of year | $ | 3,979 | | | $ | 3,723 | | | $ | 2,294 | | | $ | 2,024 | |
| Service cost | 98 | | | 106 | | | 64 | | | 70 | |
| Interest cost | 102 | | | 109 | | | 26 | | | 28 | |
| Employee contributions | — | | | — | | | 12 | | | 12 | |
| Plan curtailments and settlements | — | | | — | | | (11) | | | (4) | |
Actuarial (gain) loss(1) | (513) | | | 99 | | | (394) | | | 6 | |
| Benefits paid | (141) | | | (129) | | | (48) | | | (41) | |
| Special termination benefits | — | | | 73 | | | — | | | — | |
| Currency exchange rate changes and other | — | | | — | | | (203) | | | 200 | |
| Projected benefit obligation at end of year | $ | 3,526 | | | $ | 3,979 | | | $ | 1,740 | | | $ | 2,294 | |
| Change in plan assets: | | | | | | | |
| Fair value of plan assets at beginning of year | $ | 3,660 | | | $ | 2,982 | | | $ | 1,900 | | | $ | 1,404 | |
| Actual return on plan assets | 15 | | | 715 | | | (12) | | | 232 | |
| Employer contributions | 24 | | | 95 | | | 70 | | | 149 | |
| Employee contributions | — | | | — | | | 12 | | | 12 | |
| Plan settlements | — | | | — | | | (1) | | | (4) | |
| Benefits paid | (141) | | | (129) | | | (48) | | | (41) | |
| Currency exchange rate changes and other | — | | | — | | | (188) | | | 149 | |
| Fair value of plan assets at end of year | $ | 3,559 | | | $ | 3,660 | | | $ | 1,732 | | | $ | 1,900 | |
| Funded status at end of year: | | | | | | | |
| Fair value of plan assets | $ | 3,559 | | | $ | 3,660 | | | $ | 1,732 | | | $ | 1,900 | |
| Benefit obligations | 3,526 | | | 3,979 | | | 1,740 | | | 2,294 | |
| Over (under) funded status of the plans | 33 | | | (319) | | | (8) | | | (394) | |
| Recognized asset (liability) | $ | 33 | | | $ | (319) | | | $ | (8) | | | $ | (394) | |
Amounts recognized on the consolidated
balance sheets consist of: |
| Non-current assets | $ | 313 | | | $ | 110 | | | $ | 240 | | | $ | 48 | |
| Current liabilities | (21) | | | (20) | | | (6) | | | (6) | |
| Non-current liabilities | (259) | | | (408) | | | (242) | | | (436) | |
| Recognized asset (liability) | $ | 33 | | | $ | (319) | | | $ | (8) | | | $ | (394) | |
Amounts recognized in accumulated other
comprehensive loss: |
| Prior service cost (credit) | $ | — | | | $ | — | | | $ | (4) | | | $ | (6) | |
| Net actuarial loss | 854 | | | 1,220 | | | 161 | | | 530 | |
| Ending balance | $ | 854 | | | $ | 1,220 | | | $ | 157 | | | $ | 524 | |
(1)Actuarial gains and losses result from changes in actuarial assumptions (such as changes in the discount rate and revised mortality rates). The actuarial gain in fiscal year 2022 was primarily related to increases in discount rates. The actuarial loss in fiscal year 2021 was primarily related to decreases in discount rates.
|
| | | | | | | | | | | | | | | |
| | U.S. Pension Benefits | | Non-U.S. Pension Benefits |
| | Fiscal Year | | Fiscal Year |
| (in millions) | 2016 | | 2015 | | 2016 | | 2015 |
| Accumulated benefit obligation at end of year: | $ | 2,757 |
| | $ | 2,699 |
| | $ | 1,367 |
| | $ | 1,462 |
|
| Change in projected benefit obligation: | |
| | |
| | |
| | |
|
| Projected benefit obligation at beginning of year | $ | 2,956 |
| | $ | 2,203 |
| | $ | 1,647 |
| | $ | 1,031 |
|
| Service cost | 120 |
| | 104 |
| | 81 |
| | 60 |
|
| Interest cost | 122 |
| | 105 |
| | 31 |
| | 33 |
|
| Benefit obligations assumed in Covidien acquisition | — |
| | 214 |
| | — |
| | 472 |
|
| Employee contributions | — |
| | — |
| | 16 |
| | 16 |
|
| Plan curtailments and settlements | (28 | ) | | — |
| | (133 | ) | | (35 | ) |
| Actuarial (gain) loss | (42 | ) | | 391 |
| | (103 | ) | | 354 |
|
| Benefits paid | (80 | ) | | (61 | ) | | (49 | ) | | (34 | ) |
| Currency exchange rate changes and other | — |
| | — |
| | 45 |
| | (250 | ) |
| Projected benefit obligation at end of year | $ | 3,048 |
| | $ | 2,956 |
| | $ | 1,535 |
| | $ | 1,647 |
|
| Change in plan assets: | |
| | |
| | |
| | |
|
| Fair value of plan assets at beginning of year | $ | 2,204 |
| | $ | 1,917 |
| | $ | 1,189 |
| | $ | 889 |
|
| Actual return on plan assets | (70 | ) | | 69 |
| | (44 | ) | | 162 |
|
| Plan assets acquired in Covidien acquisition | — |
| | 188 |
| | — |
| | 262 |
|
| Employer contributions | 112 |
| | 91 |
| | 93 |
| | 80 |
|
| Employee contributions | — |
| | — |
| | 16 |
| | 16 |
|
| Plan settlements | (28 | ) | | — |
| | (118 | ) | | (1 | ) |
| Benefits paid | (80 | ) | | (61 | ) | | (49 | ) | | (34 | ) |
| Currency exchange rate changes | — |
| | — |
| | 26 |
| | (185 | ) |
| Fair value of plan assets at end of year | $ | 2,138 |
| | $ | 2,204 |
| | $ | 1,113 |
| | $ | 1,189 |
|
| Funded status at end of year: | |
| | |
| | |
| | |
|
| Fair value of plan assets | $ | 2,138 |
| | $ | 2,204 |
| | $ | 1,113 |
| | $ | 1,189 |
|
| Benefit obligations | 3,048 |
| | 2,956 |
| | 1,535 |
| | 1,647 |
|
| Underfunded status of the plans | $ | (910 | ) | | $ | (752 | ) | | $ | (422 | ) | | $ | (458 | ) |
| Recognized liability | $ | (910 | ) | | $ | (752 | ) | | $ | (422 | ) | | $ | (458 | ) |
Amounts recognized on the consolidated balance sheets consist of: |
| Non-current assets | $ | — |
| | $ | 21 |
| | $ | 20 |
| | $ | 2 |
|
| Current liabilities | (12 | ) | | (11 | ) | | (8 | ) | | (48 | ) |
| Non-current liabilities | (898 | ) | | (762 | ) | | (434 | ) | | (412 | ) |
| Recognized liability | $ | (910 | ) | | $ | (752 | ) | | $ | (422 | ) | | $ | (458 | ) |
Amounts recognized in accumulated other comprehensive (loss) income: |
| Prior service cost (benefit) | $ | 4 |
| | $ | 4 |
| | $ | (14 | ) | | $ | (2 | ) |
| Net actuarial loss | 1,361 |
| | 1,253 |
| | 359 |
| | 372 |
|
| Ending balance | $ | 1,365 |
| | $ | 1,257 |
| | $ | 345 |
| | $ | 370 |
|
Medtronic plc
Notes to Consolidated Financial Statements (Continued)
In certain countries outside the U.S., fully funding pension plans is not a common practice, as funding provides no income tax benefit. Consequently, certain pension plans were partially funded as ofat April 29, 20162022 and April 24, 2015.30, 2021. U.S. and non-U.S. pension plans with accumulated benefit obligations in excess of plan assets consist of the following:
| | | | | | | | | | | |
| | Fiscal Year |
| (in millions) | 2022 | | 2021 |
| Accumulated benefit obligation | $ | 830 | | | $ | 5,089 | |
| Projected benefit obligation | 880 | | | 5,198 | |
| Plan assets at fair value | 356 | | | 4,561 | |
|
| | | | | | | |
| | Fiscal Year |
| (in millions) | 2016 | | 2015 |
| Accumulated benefit obligation | $ | 3,922 |
| | $ | 3,678 |
|
| Projected benefit obligation | 4,333 |
| | 4,032 |
|
| Plan assets at fair value | 2,981 |
| | 2,823 |
|
PlansU.S. and non-U.S. pension plans with projected benefit obligations in excess of plan assets consist of the following: | | | | | | | | | | | |
| | Fiscal Year |
| (in millions) | 2022 | | 2021 |
| Projected benefit obligation | $ | 907 | | | $ | 5,921 | |
| Plan assets at fair value | 379 | | | 5,159 | |
|
| | | | | | | |
| | Fiscal Year |
| (in millions) | 2016 | | 2015 |
| Projected benefit obligation | $ | 4,362 |
| | $ | 4,319 |
|
| Plan assets at fair value | 3,009 |
| | 3,086 |
|
The net periodic benefit cost of the plans includeincludes the following components: | | | | | | | | | | | | | | | | | | | | | | | | | | | | | | | | | | | |
| | U.S. Pension Benefits | | Non-U.S. Pension Benefits |
| | Fiscal Year | | Fiscal Year |
| (in millions) | 2022 | | 2021 | | 2020 | | 2022 | | 2021 | | 2020 |
| Service cost | $ | 98 | | | $ | 106 | | | $ | 106 | | | $ | 64 | | | $ | 70 | | | $ | 59 | |
| Interest cost | 102 | | | 109 | | | 126 | | | 26 | | | 28 | | | 28 | |
| Expected return on plan assets | (226) | | | (242) | | | (225) | | | (64) | | | (59) | | | (58) | |
| Amortization of prior service cost | — | | | 1 | | | 1 | | | (1) | | | (1) | | | (1) | |
| Amortization of net actuarial loss | 64 | | | 69 | | | 56 | | | 22 | | | 25 | | | 14 | |
| Settlement and curtailment (gain) loss | — | | | — | | | — | | | (10) | | | 1 | | | — | |
| Special termination benefits | — | | | 73 | | | — | | | — | | | — | | | — | |
| Net periodic benefit cost | $ | 39 | | | $ | 116 | | | $ | 64 | | | $ | 37 | | | $ | 64 | | | $ | 42 | |
|
| | | | | | | | | | | | | | | | | | | | | | | |
| | U.S. Pension Benefits | | Non-U.S. Pension Benefits |
| | Fiscal Year | | Fiscal Year |
| (in millions) | 2016 | | 2015 | | 2014 | | 2016 | | 2015 | | 2014 |
| Service cost | $ | 120 |
| | $ | 104 |
| | $ | 107 |
| | $ | 81 |
| | $ | 60 |
| | $ | 54 |
|
| Interest cost | 122 |
| | 105 |
| | 97 |
| | 31 |
| | 33 |
| | 29 |
|
| Expected return on plan assets | (180 | ) | | (160 | ) | | (141 | ) | | (48 | ) | | (41 | ) | | (35 | ) |
| Amortization of prior service cost | — |
| | — |
| | 1 |
| | — |
| | — |
| | 1 |
|
| Amortization of net actuarial loss | 98 |
| | 65 |
| | 85 |
| | 20 |
| | 12 |
| | 11 |
|
| Settlement gain | $ | (1 | ) | | $ | — |
| | $ | — |
| | $ | (10 | ) | | $ | — |
| | $ | — |
|
| Net periodic benefit cost | $ | 159 |
| | $ | 114 |
| | $ | 149 |
| | $ | 74 |
| | $ | 64 |
| | $ | 60 |
|
The other changes in plan assets and projected benefit obligations recognized inaccumulated other comprehensive (loss) incomefor fiscal year 20162022 are as follows:
| | | | | | | | | | | |
| (in millions) | U.S. Pension
Benefits | | Non-U.S.
Pension
Benefits |
| Net actuarial gain | $ | (303) | | | $ | (317) | |
| Amortization of prior service credit | — | | | 1 | |
| Amortization and settlement recognition of actuarial loss | (64) | | | (22) | |
| Effect of exchange rates | — | | | (29) | |
| Total recognized in other comprehensive income | (367) | | | (367) | |
| Total recognized in net periodic benefit cost and other comprehensive income | $ | (328) | | | $ | (331) | |
|
| | | | | | | |
| (in millions) | U.S. Pension Benefits | | Non-U.S. Pension Benefits |
| Net actuarial loss (gain) | 205 |
| | (11 | ) |
| Amortization of net actuarial loss | (98 | ) | | (12 | ) |
| Prior service cost | $ | — |
| | $ | (12 | ) |
| Effect of exchange rates | 1 |
| | 10 |
|
| Total loss (gain) recognized in accumulated other comprehensive (loss) income | $ | 108 |
| | $ | (25 | ) |
| Total loss recognized in net periodic benefit cost and accumulated other comprehensive (loss) income | $ | 267 |
| | $ | 49 |
|
The estimated net actuarial loss that will be amortized from accumulated other comprehensive (loss) income into net periodic benefit cost, before tax, in fiscal year 2017 for U.S. and non-U.S. pension benefits is expected to be $89 million and $17 million, respectively.
Medtronic plc
Notes to Consolidated Financial Statements (Continued)
The actuarial assumptions are as follows:
| | | | U.S. Pension Benefits | | Non-U.S. Pension Benefits | | U.S. Pension Benefits | | Non-U.S. Pension Benefits |
| | Fiscal Year | | Fiscal Year | | Fiscal Year | | Fiscal Year |
| | 2016 | | 2015 | | 2014 | | 2016 | | 2015 | | 2014 | | 2022 | | 2021 | | 2020 | | 2022 | | 2021 | | 2020 |
| Critical assumptions – projected benefit obligation: | |
| | |
| | |
| | |
| | |
| | |
| Critical assumptions – projected benefit obligation: | | | | | | | | | | | |
| Discount rate | 3.60% - 4.30% |
| | 4.20 | % | | 4.75 | % | | 0.25% - 10.20% |
| | 1.88 | % | | 3.32 | % | Discount rate | 4.23% - 4.48% | | 2.80% - 3.50% | | 3.10% - 3.70% | | 0.60% - 25.40% | | 0.30% - 13.30% | | 0.30% - 13.30% |
| Rate of compensation increase | 3.90 | % | | 3.90 | % | | 3.90 | % | | 2.83 | % | | 2.92 | % | | 2.80 | % | Rate of compensation increase | 4.83 | % | | 4.83 | % | | 3.90 | % | | 2.70 | % | | 2.90 | % | | 2.91 | % |
| Critical assumptions – net periodic benefit cost: | |
| | |
| | |
| | |
| | |
| | |
| Critical assumptions – net periodic benefit cost: | | | | | | | | | | | |
| Discount rate | 4.20% - 4.80% |
| | 4.75 | % | | 4.55 | % | | 0.80% - 9.00% |
| | 3.32 | % | | 3.52 | % | |
Discount rate – benefit obligation | | Discount rate – benefit obligation | 2.80% - 3.46% | | 3.10% - 3.70% | | 3.90% - 4.30% | | 0.25% - 12.80% | | 0.30% - 13.90% | | 0.40% - 13.90% |
Discount rate – service cost | | Discount rate – service cost | 2.50% - 3.51% | | 2.60% - 3.90% | | 3.70% - 4.00% | | 0.24% - 12.80% | | 0.30% - 13.90% | | 0.40% - 13.90% |
Discount rate – interest cost | | Discount rate – interest cost | 2.08% - 2.87% | | 2.80% - 3.20% | | 3.50% - 4.30% | | 0.08% - 12.80% | | 0.30% - 13.90% | | 0.40% - 13.90% |
| Expected return on plan assets | 8.20 | % | | 8.25 | % | | 8.25 | % | | 4.35 | % | | 4.77 | % | | 4.76 | % | Expected return on plan assets | 5.60% - 7.40% | | 7.50 | % | | 7.90 | % | | 3.67 | % | | 3.78 | % | | 4.19 | % |
| Rate of compensation increase | 3.90 | % | | 3.90 | % | | 3.90 | % | | 2.92 | % | | 2.80 | % | | 2.78 | % | Rate of compensation increase | 3.90% - 4.83% | | 3.90 | % | | 3.90 | % | | 2.90 | % | | 2.91 | % | | 2.87 | % |
The Company changed theutilizes a full yield curve approach methodology used to estimate the service and interest cost components of net periodic pension cost and net periodic postretirementpost-retirement benefit cost for the Company’s pension and other postretirement benefit plans, effective April 30, 2016. Previously, the Company estimated such cost components utilizing a single weighted-average discount rate derived from the market-observed yield curves of high-quality fixed income securities used to measure the pension benefit obligation and accumulated postretirement benefit obligation.post-retirement benefits. The new methodology utilizes a full yield curve approach in the estimation of these cost components by applying theapplies specific spot rates along the yield curve to their underlying projected cash flows and provides a more precise measurementin estimation of service and interest costs by improving the correlation between projected cash flows and their corresponding spot rates.cost components. The current yield curves represent high quality, long-term fixed income instruments. The change does not affect the measurement of the Company’s pension obligation or accumulated postretirement benefit obligation. The Company has accounted for this change prospectively as a change in accounting estimate.
The expected long-term rate of return on plan assets assumptions are determined using a building block approach, considering historical averages and real returns of each asset class. In certain countries, where historical returns are not meaningful, consideration is given to local market expectations of long-term returns.
Retirement Benefit Plan Investment Strategy The Company has an accountsponsors trusts that holdshold the assets for both the U.S. pension planplans and other U.S. post-retirement benefits,benefit plans, primarily retiree medical benefits. For investment purposes, the Medtronic U.S. pension and other U.S. post-retirement benefit plans are managed in an identical way, as their objectives are similar.employ similar investment strategies with different asset allocation targets.
The Company has a Qualified Plan Committee (the Plan Committee) that sets investment guidelines for U.S. pension planplans and other U.S. post-retirement benefitsbenefit plans with the assistance of an external consultant.consultants. These guidelines are established based on market conditions, risk tolerance, funding requirements, and expected benefit payments. The Plan Committee also oversees the investment allocation process, selects the investment managers, and monitors asset performance. As pension liabilities are long-term in nature, the Company employs a long-term total return approach to maximize the long-term rate of return on plan assets for a prudent level of risk. An annual analysis on the risk versus the return of the investment portfolio is conducted to justify the expected long-term rate of return assumption.
The investment portfolio containsportfolios contain a diversified portfolioallocation of investment categories, including equities, fixed income securities, hedge funds, and private equity. Securities are also diversified in terms of domestic and international, securities, short- and long-term, securities, growth and value styles, large cap and small cap stocks, and active and passive management, and derivative-based styles.management.
Outside the U.S., pension plan assets are typically managed by decentralized fiduciary committees. There is significant variation in policy asset allocation from country to country. Local regulations, local funding rules, and local financial and tax considerations are part of the funding and investment allocation process in each country. The weighted average target asset allocations at April 29, 2022 for the plans are 41% equity securities, 33% debt securities, and 26% other.
The Planplans did not hold any investments in the Company’s ordinary shares as ofat April 29, 20162022 or April 24, 2015.30, 2021.
Medtronic plc
Notes to Consolidated Financial Statements (Continued)
The Company’s pension planU.S. plans target asset allocations at April 29, 20162022, compared to the U.S. plans actual asset allocations at April 29, 2022 and April 24, 2015,30, 2021 by asset category, are as follows:
| | | | | | | | | | | | | | | | | |
| U.S. Plans | Target Allocation | | Actual Allocation |
| | April 29, 2022 | | April 29, 2022 | | April 30, 2021 |
| Asset Category: | | | | | |
| Equity securities | 34 | % | | 36 | % | | 39 | % |
| Debt securities | 51 | | | 45 | | | 32 | |
| Other | 15 | | | 19 | | | 29 | |
| Total | 100 | % | | 100 | % | | 100 | % |
|
| | | | | |
| U.S. Plans | | | |
| | Target Allocation |
| | April 29, 2016 | | April 24, 2015 |
| Asset Category | |
| | |
|
| Equity securities | 49 | % | | 49 | % |
| Debt securities | 23 |
| | 23 |
|
| Other | 28 |
| | 28 |
|
| Total | 100 | % | | 100 | % |
| | | | |
| Non-U.S. Plans | |
| | |
|
| | Target Allocation |
| | April 29, 2016 | | April 24, 2015 |
| Asset Category | |
| | |
|
| Equity securities | 34 | % | | 35 | % |
| Debt securities | 27 |
| | 29 |
|
| Other | 39 |
| | 36 |
|
| Total | 100 | % | | 100 | % |
Retirement Benefit Plan Asset Fair Values The following is a description of the valuation methodologies used for retirement benefit plan assets measured at fair value.value:
Short-term investments: Valued at the closing price reported in the active markets in which the individual security is traded.
U.S. government securities: Certain U.S. governmentMutual funds: Comprised of investments in equity and fixed income securities held in pooled investment vehicles. The valuations of mutual funds are based on the respective net asset values which are determined by the fund daily at market close. The net asset values are calculated based on the valuation of the underlying assets which are determined using observable inputs. The net asset values are publicly reported.
Equity commingled trusts: Comprised of investments in equity securities held in pooled investment vehicles. The valuations of equity commingled trusts are based on the respective net asset values which are determined by the fund daily at market close. The net asset values are calculated based on the valuation of the underlying assets which are determined using observable inputs. The net asset values are not publicly reported, and funds are valued at the closing price reported in the active markets in which the individual security is traded. Other U.S. government securities are valued based on inputs other than quoted prices that are observable.
Corporate debt securities: Valued based on inputs other than quoted prices that are observable.
Common stock: Valued at the closing price reported in the active markets in which the individual security is traded.
Equity mutual funds/Commingled trusts: Valued based on the year-end net asset valuesvalue practical expedient.
Fixed income commingled trusts: Comprised of theinvestments in fixed income securities held in pooled investment vehicles. The net asset valuesvaluations of the investment vehicles are based on the fair values of the underlying investments of the commingled trusts valued at the closing price reported in the active markets in which the individual security is traded. Certain equity commingled trusts contain underlying investments that are characterized as Level 1 or Level 2 and provide a daily net asset value. The Company classifies these investments as Level 2. Certain equity commingled trusts contain a material amount underlying investments that are characterized as Level 3 and do not have a daily reported net asset value. The Company classifies these investments as Level 3.
Fixed income/Commingled trusts: Valued based on the year-end net asset values of the investment vehicles. The net asset values of the investment vehicles are based on the fair values of the underlying investments of the commingled trusts valued based on inputs other than quoted prices that are observable. The Company evaluates fixed income commingled trusts to characterize the underlying investments as Level 1, 2, or 3. Certain fixed income commingled trusts contain underlying investments that are characterized as Level 1 or Level 2 and the Company classifies these investments as Level 2. Certain fixed income commingled trusts could contain a material amount underlying investments that are characterized as Level 3 and the Company would classify these investments as Level 3. As of April 29, 2016, no fixed income commingled trusts are classified as Level 3.based on the respective net asset values which are determined by the fund daily at market close. The net asset values are calculated based on the valuation of the underlying assets which are determined using observable inputs. The net asset values are not publicly reported, and funds are valued at the net asset value practical expedient.
Partnership units: Valued based on the year-end net asset values of the underlying partnerships. The net asset values of the partnerships are based on the fair values of the underlying investments of the partnerships. Quoted market prices are used to value the underlying investments of the partnerships, where the partnerships consist of the investment pools which invest primarily in common stocks. Partnership units include partnerships, private equity investments, and real asset investments. Partnerships primarily include long/short equity and absolute return strategies. These investments canmay be redeemed monthly with notice periods ranging from 45 to 95 days. As ofAt April 29, 2016,2022, there is one absolute return strategy fund totaling $1 million that isare no funds in the process of liquidation. The Company expects to receive the proceeds over the next five years. Private equity investments consist of common
Medtronic plc
Notes to Consolidated Financial Statements (Continued)
stock and debt instruments of private companies. For private equity funds, the sum of the unfunded commitments as ofat April 29, 20162022 is $119$204 million, and the estimated liquidation period of these funds is expected to be one to 15 years. Real asset investments consist of commodities, derivatives, Real Estate Investment Trusts, and illiquid real estate holdings. These investments have redemption and liquidation periods ranging from 30 days to 10 years. Other valuationAt April 29, 2022, there are no real estate investments in the process of liquidation. Valuation procedures are utilized to arrive at fair value if a quoted market price is not available for a partnership investment.
Registered investment companies: Valued at net asset values which are not publicly reported. The net asset values are calculated based on the valuation of the underlying assets. The underlying assets are valued at the quoted market prices of shares held by the plan at year-end in the active market on which the individual securities are traded.
Insurance contracts: Comprised of investments in collective (group) insurance contracts, consisting of individual insurance policies. The policyholder is the employer, and each member is the owner/beneficiary of their individual insurance policy. These policies are a part of the insurance company’s general portfolio and participate in the insurer’s profit-sharing policy on an excess yield basis.
The methods described above may produce fair values that may not be indicative of net realizable value or reflective of future fair values. Furthermore, while the Company believes its valuation methodologies are appropriate and consistent with other market participants, the use of different methodologies or assumptions to determine fair value of certain financial instruments could result in a different fair value measurement at the reporting date.
There were no transfers between Level 1, Level 2, or Level 3 during fiscal years 2016, 2015, or 2014.
Medtronic plc
Notes to Consolidated Financial Statements (Continued)
The following tables provide information by level for the retirement benefit plan assets that are measured at fair value, as defined by U.S. GAAP. See Note 1Certain investments for discussion ofwhich the fair value measurement termsis measured using the net asset value per share (or its equivalent) practical expedient are not presented within the fair value hierarchy. The fair value amounts presented for these investments are intended to permit reconciliation to the total fair value of Levels 1, 2,plan assets at April 29, 2022 and 3.April 30, 2021.
U.S. Pension Benefits
| | | | | | | | | | | | | | | | | | | | | | | | | | | | | |
| | Fair Value at | | | | |
| | Fair Value Measurements
Using Inputs Considered as | | Investments Measured at Net Asset Value |
| (in millions) | April 29, 2022 | Level 1 | | Level 2 | | Level 3 | |
| Short-term investments | $ | 73 | | | $ | 73 | | | $ | — | | | $ | — | | | $ | — | |
| Mutual funds | 125 | | | 125 | | | — | | | — | | | — | |
| Equity commingled trusts | 1,281 | | | — | | | — | | | — | | | 1,281 | |
| Fixed income commingled trusts | 1,069 | | | — | | | — | | | — | | | 1,069 | |
| Partnership units | 1,011 | | | — | | | — | | | 1,011 | | | — | |
| $ | 3,559 | | | $ | 197 | | | $ | — | | | $ | 1,011 | | | $ | 2,350 | |
|
| | | | | | | | | | | | | | | |
| | Fair Value as of | | |
| | Fair Value Measurements Using Inputs Considered as |
| (in millions) | April 29, 2016 | Level 1 | | Level 2 | | Level 3 |
| Short-term investments | $ | 127 |
| | $ | 127 |
| | $ | — |
| | $ | — |
|
| U.S. government securities | 146 |
| | 137 |
| | 9 |
| | — |
|
| Corporate debt securities | 216 |
| | — |
| | 216 |
| | — |
|
| Equity mutual funds/commingled trusts | 956 |
| | — |
| | 763 |
| | 193 |
|
| Fixed income mutual funds | 231 |
| | — |
| | 231 |
| | — |
|
| Partnership units | 462 |
| | — |
| | — |
| | 462 |
|
| | $ | 2,138 |
| | $ | 264 |
| | $ | 1,219 |
| | $ | 655 |
|
| | | | | | | | | | | | | | | | | | | | | | | | | | | | | |
| | Fair Value at | | Fair Value Measurements
Using Inputs Considered as | | Investments Measured at Net Asset Value |
| (in millions) | April 30, 2021 | Level 1 | | Level 2 | | Level 3 | |
| Short-term investments | $ | 232 | | | $ | 232 | | | $ | — | | | $ | — | | | $ | — | |
| Mutual funds | 99 | | | 99 | | | — | | | — | | | — | |
| Equity commingled trusts | 1,420 | | | — | | | — | | | — | | | 1,420 | |
| Fixed income commingled trusts | 1,050 | | | — | | | — | | | — | | | 1,050 | |
| Partnership units | 860 | | | — | | | — | | | 860 | | | — | |
| $ | 3,660 | | | $ | 331 | | | $ | — | | | $ | 860 | | | $ | 2,470 | |
|
| | | | | | | | | | | | | | | |
| | Fair Value as of | | Fair Value Measurements Using Inputs Considered as |
| (in millions) | April 24, 2015 | Level 1 | | Level 2 | | Level 3 |
| Short-term investments | $ | 247 |
| | $ | 247 |
| | $ | — |
| | $ | — |
|
| U.S. government securities | 155 |
| | 109 |
| | 46 |
| | — |
|
| Corporate debt securities | 5 |
| | — |
| | 4 |
| | 1 |
|
| Equity commingled trusts | 951 |
| | — |
| | 751 |
| | 200 |
|
| Fixed income commingled trusts | 374 |
| | — |
| | 374 |
| | — |
|
| Partnership units | 472 |
| | — |
| | — |
| | 472 |
|
| | $ | 2,204 |
| | $ | 356 |
| | $ | 1,175 |
| | $ | 673 |
|
Medtronic plc
Notes to Consolidated Financial Statements (Continued)
The following tables provide a reconciliation of the beginning and ending balances of U.S. pension benefit assets measured at fair value that used significant unobservable inputs (Level 3):
| | | | | |
| (in millions) | Partnership Units |
| April 24, 2020 | $ | 625 | |
| Total realized gains, net | 8 | |
| Total unrealized gains, net | 89 | |
| Purchases and sales, net | 139 | |
| April 30, 2021 | 860 | |
| Total realized gains, net | 28 | |
| Total unrealized gains, net | 72 | |
| Purchases and sales, net | 51 | |
| April 29, 2022 | $ | 1,011 | |
|
| | | | | | | | | | | | | | | |
| (in millions) | Total Level 3 Investments | | Corporate Debt Securities | | Commingled Trusts | | Partnership Units |
| Balance as of April 24, 2015 | $ | 673 |
| | $ | 1 |
| | $ | 200 |
| | $ | 472 |
|
| Total realized gains included in income | 10 |
| | — |
| | — |
| | 10 |
|
| Total unrealized losses included in accumulated other comprehensive (loss) income | (151 | ) | | (1 | ) | | (7 | ) | | (143 | ) |
| Purchases and sales, net | 123 |
| | — |
| | — |
| | 123 |
|
| Balance as of April 29, 2016 | $ | 655 |
| | $ | — |
| | $ | 193 |
| | $ | 462 |
|
|
| | | | | | | | | | | | | | | |
| (in millions) | Total Level 3 Investments | | Corporate Debt Securities | | Commingled Trusts | | Partnership Units |
| Balance as of April 25, 2014 | $ | 959 |
| | $ | 1 |
| | $ | 285 |
| | $ | 673 |
|
| Total realized gains included in income | 162 |
| | — |
| | 65 |
| | 97 |
|
| Total unrealized gains included in accumulated other comprehensive (loss) income | (130 | ) | | — |
| | (31 | ) | | (99 | ) |
| Purchases and sales, net | (318 | ) | | — |
| | (119 | ) | | (199 | ) |
| Balance as of April 24, 2015 | $ | 673 |
| | $ | 1 |
| | $ | 200 |
| | $ | 472 |
|
Non-U.S. Pension Benefits
|
| | | | | | | | | | | | | | | |
| | Fair Value as of | | Fair Value Measurements Using Inputs Considered as |
| (in millions) | April 29, 2016 | Level 1 | | Level 2 | | Level 3 |
| Registered investment companies | $ | 1,037 |
| | $ | — |
| | $ | 1,037 |
| | $ | — |
|
| Insurance contracts | 76 |
| | — |
| | — |
| | 76 |
|
| | $ | 1,113 |
| | $ | — |
| | $ | 1,037 |
| | $ | 76 |
|
| | | | | | | | |
| | Fair Value as of | | Fair Value Measurements Using Inputs Considered as |
| (in millions) | April 24, 2015 | Level 1 | | Level 2 | | Level 3 |
| Registered investment companies | $ | 1,113 |
| | $ | — |
| | $ | 1,113 |
| | $ | — |
|
| Insurance contracts | 60 |
| | — |
| | — |
| | 60 |
|
| Partnership units | 16 |
| | — |
| | — |
| | 16 |
|
| | $ | 1,189 |
| | $ | — |
| | $ | 1,113 |
| | $ | 76 |
|
The following tables provide a reconciliation of the beginning and ending balances of non-U.S. pension benefit assets measured at fair value that used significant unobservable inputs (Level 3):
|
| | | | | | | | | | | |
| (in millions) | Total Level 3 Investments | | Insurance Contracts | | Partnership Units |
| Balance as of April 24, 2015 | $ | 76 |
| | $ | 60 |
| | $ | 16 |
|
| Total unrealized gains included in accumulated other comprehensive (loss) income | — |
| | — |
| | — |
|
| Purchases and sales, net | (2 | ) | | 14 |
| | (16 | ) |
| Currency exchange rate changes | 2 |
| | 2 |
| | — |
|
| Balance as of April 29, 2016 | $ | 76 |
| | $ | 76 |
| | $ | — |
|
Medtronic plc
Notes to Consolidated Financial Statements (Continued)
|
| | | | | | | | | | | |
| (in millions) | Total Level 3 Investments | | Insurance Contracts | | Partnership Units |
| Balance as of April 25, 2014 | $ | 21 |
| | $ | 11 |
| | $ | 10 |
|
| Total unrealized gains included in accumulated other comprehensive (loss) income | 1 |
| | (1 | ) | | 2 |
|
| Purchases and sales, net | 63 |
| | 56 |
| | 7 |
|
| Currency exchange rate changes | (9 | ) | | (6 | ) | | (3 | ) |
| Balance as of April 24, 2015 | $ | 76 |
| | $ | 60 |
| | $ | 16 |
|
| | | | | | | | | | | | | | | | | | | | | | | | | | | | | |
| | Fair Value at | | Fair Value Measurements
Using Inputs Considered as | | Investments Measured at Net Asset Value |
| (in millions) | April 29, 2022 | Level 1 | | Level 2 | | Level 3 | |
| Registered investment companies | $ | 1,689 | | | $ | — | | | $ | — | | | $ | — | | | $ | 1,689 | |
| Insurance contracts | 43 | | | — | | | — | | | 43 | | | — | |
| $ | 1,732 | | | $ | — | | | $ | — | | | $ | 43 | | | $ | 1,689 | |
| | | | | | | | | | | | | | | | | | | | | | | | | | | | | |
| | Fair Value at | | Fair Value Measurements
Using Inputs Considered as | | Investments Measured at Net Asset Value |
| (in millions) | April 30, 2021 | Level 1 | | Level 2 | | Level 3 | |
| Registered investment companies | $ | 1,850 | | | $ | — | | | $ | — | | | $ | — | | | $ | 1,850 | |
| Insurance contracts | 49 | | | — | | | — | | | 49 | | | — | |
| $ | 1,900 | | | $ | — | | | $ | — | | | $ | 49 | | | $ | 1,850 | |
Non-U.S. pension benefit assets that are valued using significant unobservable inputs (Level 3) was $43 million and $49 million as of April 29, 2022 and April 30, 2021, respectively. The decrease in the fair value of the assets was due to insurance contracts being sold.
There were no transfers into or out of Level 3 for both the U.S. and non-U.S. pension plans during the fiscal years ended April 29, 2022 and April 30, 2021.
Retirement Benefit Plan Funding It is the Company’s policy to fund retirement costs within the limits of allowable tax deductions. During fiscal year 2016,2022, the Company made discretionary contributions of approximately $112$24 million to the U.S. pension plan. Internationally, the Company contributed approximately $93$70 million for pension benefits during fiscal year 2016.2022. The Company anticipates that it will make contributions of $73$21 million and $52 million to its U.S. pension benefitsbenefit plans and non-U.S. pension benefit plans, respectively, in fiscal 2017.year 2023. Based on the guidelines under the U.S. Employee Retirement Income Security Act of 1974 and the various guidelines which govern the plans outside the U.S., the majority of anticipated fiscal year 20152023 contributions will be discretionary. The Company believes that along with pension assets, the returns on invested pension assets, and Company contributions the Company will be able to meet its pension and other post-retirement obligations in the future.
Retiree benefit payments, which reflect expected future service, are anticipated to be paid as follows:
| | | | | | | | | | | |
| (in millions) | Gross Payments |
| Fiscal Year | U.S. Pension Benefits | | Non-U.S. Pension Benefits |
| 2023 | $ | 150 | | | $ | 61 | |
| 2024 | 160 | | | 55 | |
| 2025 | 172 | | | 59 | |
| 2026 | 182 | | | 59 | |
| 2027 | 193 | | | 65 | |
| 2028 – 2032 | 1,110 | | | 367 | |
| Total | $ | 1,966 | | | $ | 666 | |
|
| | | | | | | |
| (in millions) | U.S. Pension Benefits | | Non-U.S. Pension Benefits |
| Fiscal Year | Gross Payments | | Gross Payments |
| 2017 | $ | 87 |
| | $ | 39 |
|
| 2018 | 96 |
| | 40 |
|
| 2019 | 105 |
| | 39 |
|
| 2020 | 116 |
| | 40 |
|
| 2021 | 126 |
| | 43 |
|
| 2022 – 2026 | 810 |
| | 265 |
|
| Total | $ | 1,340 |
| | $ | 466 |
|
Post-retirement Benefit Plans The net periodic benefit cost associated with the Company’s post-retirement benefit plans was $12income of $20 million, $14$6 million, and $15 million in fiscal years 2016, 2015,2022, 2021, and 2014,2020, respectively. The Company’s projected benefit obligation for all post-retirement benefit plans was $369$276 million and $352$337 million at April 29, 20162022 and April 24, 2015,30, 2021, respectively. The Company’s fair value of plan assets for all post-retirement benefit plans was $269$325 million and $288$345 million at April 29, 20162022 and April 24, 2015,30, 2021, respectively. The activity during fiscal 2016post-retirement benefit plan assets at both April 29, 2022 and 2015 related to bothApril 30, 2021 primarily comprised of equity and fixed commingled trusts, consistent with the changeU.S. retirement benefit plan assets outlined in projected benefit obligations and the fair value of plan assets was not material.leveling tables above.
Defined Contribution Savings Plans The Company has defined contribution savings plans that cover substantially all U.S. employees and certain non-U.S. employees. The general purpose of these plans is to provide additional financial security during retirement by providing employees with an incentive to make regular savings. Company contributions to the plans are based on employee contributions
Medtronic plc
Notes to Consolidated Financial Statements (Continued)
and Company performance and since fiscal year 2006, the entire match has been made in cash.performance. Expense recognized under these plans was $269$403 million, $188$495 million, and $145$376 million in fiscal years 2016, 2015,2022, 2021, and 2014,2020, respectively.
Effective May 1, 2005, the Company froze participation in the original defined benefit pension plan in the U.S. and implemented two2 new plans includingplans: an additional defined benefit pension plan, the Personal Pension Account (PPA), and a new defined contribution pension plan, respectively: the Personal Pension Account (PPA) and the Personal Investment Account (PIA). Employees in the U.S. hired on or after May 1, 2005 havebut before January 1, 2016 had the option to participate in either the PPA or the PIA. Participants in the PPA receive an annual allocation of their salary and bonus on which they will receive an annual guaranteed rate of return, which is based on the ten-yearten-year Treasury bond rate. Participants in the PIA also receive an annual allocation of their salary and bonus; however, they are allowed to determine how to invest their funds among identified fund alternatives. The cost associated with the PPA is included in U.S. Pension Benefits in the tables presented earlier. The defined contribution cost associated with the PIA was approximately $58$48 million, $53$50 million,, and $50$52 million in fiscal years 2016, 2015,2022, 2021, and 2014,2020, respectively.
Medtronic plc
Notes to Consolidated Financial Statements (Continued)
Effective January 1, 2016, the Company froze participation in the existing defined benefit (PPA) and contribution (PIA) pension plans in the U.S. and implemented a new form of benefit under the existing defined contribution plan for legacy Covidien employees and employees in the U.S. hired on or after January 1, 2016.2016 or rehired after July 1, 2020. Participants in the Medtronic Core Contribution (MCC) also receive an annual allocation of their salary and bonus and are allowed to determine how to invest their funds among identified fund alternatives. The cost associated with the MCC is included in U.S. Pension Benefits in the tables presented earlier. The defined contribution cost associated with the MCC was approximately $12$83 million, $73 million, and $66 million and in fiscal year 2016.years 2022, 2021, and 2020, respectively.
13.16. Leases
The Company leases office, manufacturing, and research facilities and warehouses, as well as transportation, data processing, and other equipment under capital and operating leases. A substantial number of these leases contain options that allowequipment. The Company determines whether a contract is a lease or contains a lease at inception date. Upon commencement, the Company recognizes a right-of-use asset and lease liability. Right-of-use assets represent the Company's right to renewuse the underlying asset for the lease term. Lease liabilities are the Company's obligation to make the lease payments arising from a lease.As the Company’s leasestypically do not provide an implicit rate, the Company’s lease liabilities are measured on a discounted basis using the Company's incremental borrowing rate. Lease terms used in the recognition of right-of-use assets and lease liabilities include only options to extend the lease that are reasonably certain to be exercised. Additionally, lease terms underlying the right-of-use assets and lease liabilities consider terminations that are reasonably certain to be executed.
The Company's lease agreements include leases that have both lease and associated nonlease components. The Company has elected to account for lease components and the associated nonlease components as a single lease component. The consolidated balance sheets do not include recognized assets or liabilities for leases that, at the fair rental valuecommencement date, have a term of twelve months or less and do not include an option to purchase the underlying asset that is reasonably certain to be exercised. The Company recognizes such leases in the consolidated statements of income on a straight-line basis over the date of renewal.lease term. Additionally, the Company recognizes variable lease payments not included in its lease liabilities in the period in which the obligation for those payments is incurred. Variable lease payments for fiscal year 2022, 2021, and 2020 were not material.
Future minimum payments under capitalizedThe Company's lease agreements include leases accounted for as operating leases and non-cancelable operatingthose accounted for as finance leases. The right-of-use assets, lease liabilities, lease costs, cash flows, and lease maturities associated with the Company's finance leases were not material to the consolidated financial statements at April 29, 2016 are:
|
| | | | | | | |
(in millions) Fiscal Year | Capitalized Leases | | Operating Leases |
| 2017 | $ | 109 |
| | $ | 180 |
|
| 2018 | 5 |
| | 130 |
|
| 2019 | 4 |
| | 90 |
|
| 2020 | 4 |
| | 56 |
|
| 2021 | 3 |
| | 33 |
|
| Thereafter | 16 |
| | 55 |
|
| Total minimum lease payments | $ | 141 |
| | $ | 544 |
|
| Less amounts representing interest | (9 | ) | | N/A |
|
| Present value of net minimum lease payments | $ | 132 |
| | N/A |
|
Rent expense2022 or April 30, 2021 or for all operating leases was $269 million, $195 million, and $150 million in fiscal years 2016, 2015, and 2014, respectively. The increase in fiscal year 2016 rent expense is primarily related to2022, 2021 and 2020. Finance lease right-of-use assets are included in property, plant, and equipment, net, and finance lease liabilities are included in current debt obligations and long-term debt on the Covidien acquisition.consolidated balance sheets.
Medtronic plc
Notes to Consolidated Financial Statements (Continued)
The following table summarizes the balance sheet classification of the Company's operating leases and amounts of the right-of-use assets and lease liabilities at April 29, 2022 and April 30, 2021:
14. | | | | | | | | | | | | | | | | | |
| (in millions) | Balance Sheet Classification | | April 29, 2022 | | April 30, 2021 |
| Right-of-use assets | Other assets | | $ | 854 | | | $ | 998 | |
| Current liability | Other accrued expenses | | 167 | | | 186 | |
| Non-current liability | Other liabilities | | 703 | | | 829 | |
The following table summarizes the weighted-average remaining lease term and weighted-average discount rate for the Company's operating leases at April 29, 2022, April 30, 2021, and April 24, 2020:
| | | | | | | | | | | | | | | | | | | | |
| | April 29, 2022 | | April 30, 2021 | | April 24, 2020 |
| Weighted-average remaining lease term | | 7.3 Years | | 7.5 years | | 7.2 years |
| Weighted-average discount rate | | 2.0% | | 2.3% | | 3.0% |
The following table summarizes the components of total operating lease cost for fiscal year 2022, 2021, and 2020:
| | | | | | | | | | | | | | | | | | | | |
| | Fiscal Year |
| (in millions) | | 2022 | | 2021 | | 2020 |
| Operating lease cost | | $ | 195 | | | $ | 216 | | | $ | 223 | |
| Short-term lease cost | | 65 | | | 35 | | | 46 | |
| Total operating lease cost | | $ | 260 | | | $ | 251 | | | $ | 269 | |
The following table summarizes the cash paid for amounts included in the measurement of operating lease liabilities and right-of-use assets obtained in exchange for operating lease liabilities for fiscal year 2022, 2021, and 2020:
| | | | | | | | | | | | | | | | | | | | |
| | Fiscal Year |
| (in millions) | | 2022 | | 2021 | | 2020 |
| Cash paid for amounts included in the measurement of operating lease liabilities | | $ | 174 | | | $ | 216 | | | $ | 221 | |
| Right-of-use assets obtained in exchange for operating lease liabilities | | 78 | | | 230 | | | 174 | |
Medtronic plc
Notes to Consolidated Financial Statements (Continued)
The following table summarizes the maturities of the Company's operating leases at April 29, 2022:
| | | | | | | | |
(in millions)
Fiscal Year | | Operating Leases |
| 2023 | | $ | 213 | |
| 2024 | | 164 | |
| 2025 | | 130 | |
| 2026 | | 103 | |
| 2027 | | 82 | |
| Thereafter | | 284 | |
| Total expected lease payments | | 976 | |
| Less: Imputed interest | | (105) | |
| Total lease liability | | $ | 871 | |
The Company makes certain products available to customers under lease arrangements, including arrangements whereby equipment is placed with customers who then purchase consumable products to accompany the use of the equipment. Income arising from arrangements where the Company is the lessor is recognized within net sales in the consolidated statements of income and the Company's net investments in sales-type leases are included in other current assets and other assets in the consolidated balance sheets. Lessor income and the related assets and lease maturities were not material to the consolidated financial statements at or for the fiscal year ended April 29, 2022 and April 30, 2021.
Medtronic plc
Notes to Consolidated Financial Statements (Continued)
17. Accumulated Other Comprehensive (Loss) IncomeLoss
ChangesThe following table provides changes in accumulatedAOCI, net of tax and by component: | | | | | | | | | | | | | | | | | | | | | | | | | | | | | | | | | | | |
| (in millions) | Unrealized (Loss) Gain on Investment Securities | | Cumulative Translation Adjustments | | Net Investment Hedges | | Net Change in Retirement Obligations | | Unrealized (Loss) Gain on Cash Flow Hedges | | Total Accumulated Other Comprehensive (Loss) Income |
| April 26, 2019 | $ | (45) | | | $ | (1,383) | | | $ | (169) | | | $ | (1,308) | | | $ | 194 | | | $ | (2,711) | |
| Other comprehensive income (loss) before reclassifications | 43 | | | (827) | | | 405 | | | (596) | | | 309 | | | (666) | |
| Reclassifications | 2 | | | — | | | — | | | 52 | | | (237) | | | (183) | |
| Other comprehensive income (loss) | 45 | | | (827) | | | 405 | | | (544) | | | 72 | | | (849) | |
| | | | | | | | | | | |
| April 24, 2020 | — | | | (2,210) | | | 236 | | | (1,852) | | | 266 | | | (3,560) | |
| Other comprehensive income (loss) before reclassifications | 92 | | | 1,691 | | | (1,694) | | | 432 | | | (541) | | | (20) | |
| Reclassifications | — | | | — | | | — | | | 73 | | | 22 | | | 95 | |
| Other comprehensive income (loss) | 92 | | | 1,691 | | | (1,694) | | | 505 | | | (519) | | | 75 | |
| | | | | | | | | | | |
| April 30, 2021 | 92 | | | (519) | | | (1,458) | | | (1,347) | | | (253) | | | (3,485) | |
| Other comprehensive income (loss) before reclassifications | (304) | | | (2,080) | | | 2,299 | | | 514 | | | 781 | | | 1,210 | |
| Reclassifications | 3 | | | — | | | — | | | 60 | | | (54) | | | 9 | |
| Other comprehensive income (loss) | (301) | | | (2,080) | | | 2,299 | | | 574 | | | 727 | | | 1,219 | |
| | | | | | | | | | | |
| April 29, 2022 | $ | (209) | | | $ | (2,599) | | | $ | 841 | | | $ | (773) | | | $ | 474 | | | $ | (2,265) | |
The income tax on gains and losses on investment securities in other comprehensive (loss) income before reclassifications during fiscal years 2022, 2021, and 2020 was a benefit of $51 million, an expense of $31 million and a benefit of $13 million, respectively. During fiscal years 2022, 2021, and 2020, realized gains and losses on investment securities reclassified from AOCI were reduced by componentincome taxes of $1 million, $2 million and $3 million, respectively. When realized, gains and losses on investment securities reclassified from AOCI are as follows:recognized within other non-operating income, net. Refer to Note 5 for additional information.
During fiscal years 2022, 2021, and 2020, the income tax on cumulative translation adjustment was a benefit of $8 million, an expense of $7 million, and a benefit of $9 million, respectively.
During fiscal years 2022, 2021, and 2020, there were no tax impacts on net investment hedges. Refer to Note 7 for additional information.
The net change in retirement obligations in other comprehensive income includes amortization of net actuarial losses included in net periodic benefit cost. The income tax on the net change in retirement obligations in other comprehensive income before reclassifications during fiscal years 2022, 2021, and 2020 resulted in an expense of $134 million and $115 million, and a benefit of $159 million, respectively. During fiscal years 2022, 2021, and 2020, the gains and losses on defined benefit and pension items reclassified from AOCI were reduced by income taxes of $20 million, $16 million, and $12 million, respectively. When realized, net gains and losses on defined benefit and pension items reclassified from AOCI are recognized within other non-operating income, net. Refer to Note 15 for additional information.
The income tax on unrealized gains and losses on cash flow hedges in other comprehensive income before reclassifications during fiscal years 2022, 2021, and 2020 was an expense of $152 million, a benefit of $87 million, and an expense of $88 million, respectively. Amounts reclassified from AOCI related to cash flow hedges included income taxes of $26 million, $14 million, and $80 million for fiscal years 2022, 2021, and 2020, respectively. When realized, gains and losses on currency exchange rate contracts reclassified from AOCI are recognized within other operating expense, net or cost of products sold. Refer to Note 7 for additional information.
|
| | | | | | | | | | | | | | | | | | | |
| (in millions) | Unrealized Gain (Loss) on Available-for-Sale Securities | | Cumulative Translation Adjustments(1) | | Net Change in Retirement Obligations | | Unrealized Gain (Loss) on Derivatives | | Total Accumulated Other Comprehensive (Loss) Income |
| Balance as of April 25, 2014, net of tax | $ | (6 | ) | | $ | 218 |
| | $ | (765 | ) | | $ | (44 | ) | | $ | (597 | ) |
| Other comprehensive income (loss) before reclassifications, before tax | 169 |
| | (495 | ) | | (617 | ) | | 545 |
| | (398 | ) |
| Tax (expense) benefit | (60 | ) | | — |
| | 198 |
| | (199 | ) | | (61 | ) |
| Other comprehensive income (loss) before reclassifications, net of tax | 109 |
| | (495 | ) | | (419 | ) | | 346 |
| | (459 | ) |
| Reclassifications, before tax | (138 | ) | | — |
| | 78 |
| | (145 | ) | | (205 | ) |
| Tax benefit (expense) | 49 |
| | — |
| | (25 | ) | | 53 |
| | 77 |
|
| Reclassifications, net of tax | (89 | ) | (2) | — |
| | 53 |
| (3) | (92 | ) | (4) | (128 | ) |
| Other comprehensive income (loss), net of tax | 20 |
| | (495 | ) | | (366 | ) | | 254 |
| | (587 | ) |
| Balance as of April 24, 2015, net of tax | 14 |
| | (277 | ) | | (1,131 | ) | | 210 |
| | (1,184 | ) |
| Other comprehensive loss before reclassifications, before tax | (201 | ) | | (197 | ) | | (226 | ) | | (145 | ) | | (769 | ) |
| Tax benefit | 94 |
| | — |
| | 85 |
| | 51 |
| | 230 |
|
| Other comprehensive loss before reclassifications, net of tax | (107 | ) | | (197 | ) | | (141 | ) | | (94 | ) | | (539 | ) |
| Reclassifications, before tax | (22 | ) | | — |
| | 114 |
| | (327 | ) | | (235 | ) |
| Tax benefit (expense) | 8 |
| | — |
| | (39 | ) | | 121 |
| | 90 |
|
| Reclassifications, net of tax | (14 | ) | (2) | — |
| | 75 |
| (3) | (206 | ) | (4) | (145 | ) |
| Other comprehensive loss, net of tax | (121 | ) | | (197 | ) | | (66 | ) | | (300 | ) | | (684 | ) |
| Balance as of April 29, 2016, net of tax | $ | (107 | ) | | $ | (474 | ) | | $ | (1,197 | ) | | $ | (90 | ) | | $ | (1,868 | ) |
| |
(1) | Taxes are not provided on cumulative translation adjustments as substantially all translation adjustments relate to earnings that are intended to be indefinitely reinvested outside the U.S. |
| |
(2) | Represents net realized losses on sales of available-for-sale securities that were reclassified from AOCI to other expense, net (see Note 5).
|
| |
(3) | Includes net amortization of prior service costs and actuarial losses included in net periodic benefit cost (see Note 12). |
| |
(4) | Relates to cash flow hedges that were reclassified from AOCI to other expense, net or cost of products sold and forward starting interest rate derivative instruments that were reclassified from AOCI to interest expense, net (see Note 8).
|
15.18. Commitments and Contingencies
Legal Matters
The Company and its affiliates are involved in a number of legal actions from time to time involving product liability, employment, intellectual property and commercial disputes, shareholder related matters, environmental proceedings, income tax disputes, and governmental proceedings and investigations, in the United States and around the world, and other matters, including those described below. With respect to governmental proceedings and investigations, like other companies in our industry, the Company is subject to extensive regulation by national, state, and local governmental agencies in the United
Medtronic plc
Notes to Consolidated Financial Statements (Continued)
States and in other jurisdictions in which the Company and its affiliates operate. As a result, interaction with governmental agencies is ongoing. The Company’s standard practice is to cooperate with regulators and investigators in responding to inquiries. The outcomes of these legal actions are not within the Company’s complete control and may not be known for prolonged periods of time. In some actions, the enforcement agencies or private claimants seek damages, as well as other reliefcivil or criminal remedies (including injunctions barring the sale of products that are the subject of the proceeding), that could require significant expenditures, or result in lost revenues. revenues, or limit the Company's ability to conduct business in the applicable jurisdictions.
The Company records a liability in the consolidated financial statements on an undiscounted basis for loss contingencies related to legal actions when a loss is known or considered probable and the amount canmay be reasonably estimated. If the reasonable estimate of a known or probable loss is a range, and no amount within the range is a better estimate than any other, the minimum amount of the range is accrued. If a loss is reasonably possible but not known or probable, and canmay be reasonably estimated, the estimated loss or range of loss is disclosed. When determining the estimated loss or range of loss, significant judgment is required. Estimates of probable losses resulting from litigation and governmental proceedings involving the Company are inherently difficult to predict, particularly
Medtronic plc
Notes to Consolidated Financial Statements (Continued)
when the matters are in early procedural stages with incomplete scientific facts or legal discovery, involve unsubstantiated or indeterminate claims for damages, potentially involve penalties, fines or punitive damages, or could result in a change in business practice. AsThe Company classifies certain specified litigation charges and gains related to significant legal matters as certain litigation charges in the consolidated statements of income. During fiscal years 2022, 2021, and 2020, the Company recognized $95 million, $118 million, and $313 million, respectively, of additional certain litigation charges. At April 29, 20162022 and April 24, 2015,30, 2021, total accrued certain litigation charges were approximately $1.0$0.3 billion and $879 million,$0.4 billion, respectively. The ultimate cost to the Company with respect to accrued certain litigation charges could be materially different than the amount of the current estimates and accruals and could have a material adverse impact on the Company’s consolidated earnings, financial position, and/or cash flows. The Company includes accrued certain litigation charges in other accrued expenses and other long-term liabilities on the consolidated balance sheets.
In addition to litigation contingencies, the Company also has certain guarantee obligations that may potentially result in future costs. While it is not possible to predict the outcome for most of the legal matters discussed below, the Company believes it is possible that the costs associated with themthese matters could have a material adverse impact on the Company’s consolidated earnings, financial position, and/or cash flows.
Product Liability Matters
Sprint Fidelis
In 2007, a putative class action was filed in the Ontario Superior Court of Justice in Canada seeking damages for personal injuries allegedly related to the Company's Sprint Fidelis family of defibrillation leads. On October 20, 2009, the court certified a class proceeding but denied class certification on plaintiffs' claim for punitive damages. Pretrial proceedings are underway. The Company has not recorded an expense related to damages in connection with this matter because any potential loss is not currently probable or reasonably estimable under U.S. GAAP. Additionally, the Company cannot reasonably estimate the range of loss, if any, that may result from this matter.
INFUSE Litigation
The Company estimates law firms representing approximately 6,000 claimants have asserted or intend to assert personal injury claims against Medtronic in the U.S. state and federal courts involving the INFUSE bone graft product. As of June 1, 2016, the Company has reached agreements to settle approximately 3,900 of these claims. The Company recorded an additional expense of $26 million in the second quarter of fiscal year 2016 related to probable and reasonably estimable damages in connection with this matter. The Company's accrued expenses for this matter are included within accrued certain litigation charges in other accrued expenses and other long-term liabilities on the consolidated balance sheets as discussed above.
Other INFUSE Litigation
On June 5, 2014, Humana, Inc. filed a lawsuit for unspecified monetary damages in the U.S. District Court for the Western District of Tennessee, alleging that Medtronic, Inc. violated federal racketeering (RICO) law and various state laws, by conspiring with physicians to promote unapproved uses of INFUSE. In September of 2015 the Court granted Medtronic’s motion to dismiss the primary allegations, including the RICO claims, in Humana’s complaint. In April of 2016 the Court denied Humana’s motion to file an amended complaint. The Company has not recorded an expense related to damages in connection with this matter because any potential loss is not currently probable or reasonably estimable under U.S. GAAP. Additionally, the Company cannot reasonably estimate the range of loss, if any, that may result from this matter.
Pelvic Mesh Litigation
The Company through the acquisition of Covidien, is currently involved in litigation in various state and federal courts against manufacturers of pelvic mesh products alleging personal injuries resulting from the implantation of those products. TwoNaN subsidiaries of Covidien supplied pelvic mesh products to one1 of the manufacturers, C.R. Bard (Bard), named in the litigation. The litigation includes a federal multi-district litigation in the U.S. District Court for the Northern District of West Virginia and cases in various state courts and jurisdictions outside the U.S. Generally, complaints allege design and manufacturing claims, failure to warn, breach of warranty, fraud, violations of state consumer protection laws and loss of consortium claims. In July 2015, the Company andfiscal year 2016, Bard agreed that Bard would paypaid the Company $121 million towards the settlement of 11,000 of these claims. The $121 million settlementIn May 2017, the agreement with Bard was recorded asamended to extend the terms to apply to up to an opening balance sheet adjustment related to the Covidien acquisition in the first quarter of fiscal year 2016.additional 5,000 claims. That agreement does not resolve the dispute between the Company and Bard with respect to claims that do not settle, if any. As part of the agreement, the Company and Bard agreed to dismiss without prejudice their pending litigation with respect to Bard’s obligation to defend and indemnify the Company. The Company estimates law firms representing approximately 15,80016,200 claimants have asserted or may assert claims involving products manufactured by Covidien’s subsidiaries. As of June 1, 2016,2022, the Company hashad reached agreements to settle approximately 6,20015,900 of these claims. The Company's accrued expenses for this matter
Medtronic plc
Notes to Consolidated Financial Statements (Continued)
are included within accrued certain litigation charges in other accrued expenses and other long-term liabilities on the consolidated balance sheets as discussed above.
PatentHernia Mesh Litigation
Ethicon
Starting in fiscal year 2020, plaintiffs began filing lawsuits against certain subsidiaries of the Company in U.S. state and federal courts alleging personal injury from hernia mesh products sold by those subsidiaries. The majority of the pending cases are in Massachusetts state court, where they have been consolidated before a single judge. As of June 6, 2022, subsidiaries of the Company have been named as defendants in lawsuits filed on behalf of approximately 5,900 individual plaintiffs, and certain plaintiffs’ law firms have advised the Company that they may file additional cases in the future. On December 14, 2011, Ethicon filed an action against CovidienJune 6, 2022, the Judicial Panel on Multidistrict Litigation transferred 83 actions involving the Company’s hernia mesh to a federal Multidistrict Litigation in the U.S. District Court for the Southern District of Ohio, alleging patent infringement and seeking monetary damages and injunctive relief. On January 22, 2014, the district court entered summary judgment in Covidien's favor, and the majority of this ruling was affirmed by the Federal Circuit on August 7, 2015. Following appeal, the case was remanded backMassachusetts for pretrial proceedings. The pending lawsuits relate almost entirely to the District Court with respecthernia mesh products that have not been subject to one patent. On January 21, 2016, Covidien filed a second action in the U.S. District Court for the Southern District of Ohio, seeking a declaration of non-infringement with respect to a second set of patents held by Ethicon. The court consolidated this second action with the remaining patent issues from the firstrecalls, withdrawals, or other adverse regulatory action. In addition to claims of non-infringement, the Company asserts affirmative defenses of invalidity for each of the patents-in-suit. The case is currently in the early stages of fact discovery. The Company has not recorded an expense related to damages in connection with this matter because any potential loss is not currently probable or reasonably estimable under U.S. GAAP. Additionally, the Company cannot reasonably estimate the range of loss, if any, that may result from this matter.
Shareholder Related Matters
INFUSE
On March 12, 2012, Charlotte Kokocinski (Kokocinski) filed a shareholder derivative action against both Medtronic, Inc. and certain of its current and former officers and directors in the U.S. District Court for the District of Minnesota, setting forth certain allegations, including a claim that defendants violated various purported duties in connection with the INFUSE bone graft product and otherwise. On March 25, 2013, the Court dismissed the case without prejudice, and Kokocinski subsequently filed an amended complaint. On March 30, 2015, the Court granted defendants’ motion to dismiss the amended complaint, dismissing the case with prejudice. Kokocinski sought reconsideration of that decision, and, on September 30, 2015, the Court denied Kokocinski’s request for reconsideration. Kokocinski has appealed the Court’s decision to the U.S. Court of Appeals for the Eighth Circuit.
West Virginia Pipe Trades and Phil Pace, on June 27, 2013 and July 3, 2013, respectively, filed putative class action complaints against Medtronic, Inc. and certain of its officers in the U.S. District Court for the District of Minnesota, alleging that the defendants made false and misleading public statements regarding the INFUSE Bone Graft product during the period of December 8, 2010 through August 3, 2011. The matters were consolidated in September, 2013, and in the consolidated complaint plaintiffs alleged a class period of September 28, 2010 through August 3, 2011. On September 30, 2015, the Court granted defendants’ motion for summary judgment in the consolidated matters. Plaintiffs have appealed the dismissal to the U.S. Court of Appeals for the Eighth Circuit.
Shareholder Related Matters Resulting from the Covidien Acquisition
On July 2, 2014, Lewis Merenstein filed a putative shareholder class action in Hennepin County, Minnesota, District Court seeking to enjoin the then-potential acquisition of Covidien. The lawsuit named Medtronic, Inc., Covidien, and each member of the Medtronic, Inc. Board of Directors at the time as defendants, and alleged that the directors breached their fiduciary duties to shareholders with regard to the then-potential acquisition. On August 21, 2014, Kenneth Steiner filed a putative shareholder class action in Hennepin County, Minnesota, District Court, also seeking an injunction to prevent the potential Covidien acquisition. In September 2014, the Merenstein and Steiner matters were consolidated and in December 2014, the plaintiffs filed a preliminary injunction motion seeking to enjoin the Covidien transaction. On December 30, 2014, a hearing was held on plaintiffs’ motion for preliminary injunction and on defendants’ motion to dismiss. On January 2, 2015, the District Court denied the plaintiffs’ motion for preliminary injunction and on January 5, 2015 issued its opinion. On March 20, 2015, the District Court issued its order and opinion granting Medtronic’s motion to dismiss the case. In May of 2015, the plaintiffs filed an appeal, and, in January of 2016, the Minnesota State Court of Appeals affirmed in part, reversed in part, and remanded the case to the District Court for further proceedings. In February of 2016, the Company petitioned the Minnesota Supreme Court to review the decision of the Minnesota State Court of Appeals, and on April 19, 2016 the Minnesota Supreme Court granted the Company’s petition on the issue of whether most of the original claims are properly characterized as direct or derivative under Minnesota law. A decision from the Minnesota Supreme Court is expected in calendar year 2017.
The Company has not recorded an expense related to damages in connection with the shareholder relatedthese matters because any potential loss is not currently probable orand reasonably estimable under U.S. GAAP.estimable. Additionally, the Company cannotis unable to reasonably estimate the range of loss, if any, that may result from these matters.
Medtronic plc
Notes to Consolidated Financial Statements (Continued)
Environmental Proceedings
The Company through the acquisition of Covidien, is involved in various stages of investigation and cleanup related to environmental remediation matters at a number of sites. These projects relate to a variety of activities, including removal of solvents, metals and other hazardous substances from soil and
Medtronic plc
Notes to Consolidated Financial Statements (Continued)
groundwater. The ultimate cost of site cleanup and timing of future cash flows is difficult to predict given uncertainties regarding the extent of the required cleanup, the interpretation of applicable laws and regulations, and alternative cleanup methods.
The Company is a successor to a company which owned and operated a chemical manufacturing facility in Orrington, Maine from 1967 until 1982, and is responsible for the costs of completing an environmental site investigation as required by the Maine Department of Environmental Protection (MDEP). MDEP served a compliance order on Mallinckrodt LLC and U.S. Surgical Corporation, subsidiaries of Covidien, in December 2008. The compliance order2008, which included a directive to remove a significant volume of soils at the site. On December 19, 2008, Covidien filed an appeal withAfter a hearing on the compliance order before the Maine Board of Environmental Protection (Maine Board) to challenge the terms of the compliance order. A hearing before the Maine Board began on January 25, 2010 and concluded on February 4, 2010. On August 19, 2010,order, the Maine Board modified the MDEP order and issued a final order requiring removal of two2 landfills, capping of the remaining three3 landfills, installation of a groundwater extraction system and long-term monitoring of the site and the three3 remaining landfills.
On April 3, 2014, the Maine Supreme Judicial Court affirmed the Maine Board’s compliance order. The Company has proceeded with implementation of the investigation and remediation at the site in accordance with the MDEP order as modified by the Maine Board order.
TheSince the early 2000s, the Company hasor its predecessors have also been involved in a lawsuit filed in the U.S. District Court for the District of Maine by the Natural Resources Defense Council and the Maine People’s Alliance. Plaintiffs sought an injunction requiring Covidienthe Company's predecessor to conduct extensive studies of mercury contamination of the Penobscot River and Bay and options for remediating such contamination, and to perform appropriate remedial activities, if necessary.
On July 29, 2002, followingFollowing a trial in March 2002, trial, the District Court entered an opinion and order whichcourt held that conditions in the Penobscot River and Bay may pose an imminent and substantial endangerment and that Covidienthe Company’s predecessor was liable for the cost of performing a study of the riverRiver and bay. The District Court subsequently appointed an independent study panel to overseeBay. Following a second trial in June 2014, the study andcourt ordered Covidien to pay costs associated with the study. A report issued by the study panel contains recommendations for a variety of potential remedial options which could be implemented individually or in a variety of combinations, and included preliminary cost estimates for a variety of potential remedial options, which the report describes as “very rough estimates of cost,” ranging from $25 million to $235 million. The report indicates that these costs are subject to uncertainties, and that before any remedial option is implemented, further engineering studies and engineering design work are necessary to determine the feasibility of the proposed remedial options. In June of 2014, a trial was held to determine if remediation was necessary and feasible, and on September 2, 2015, the District Court issued an order concluding that further engineering study and engineering design work is appropriatewas needed to determine the nature and extent of remediation in the Penobscot River and Bay. In January of 2016, the CourtThe court also appointed an engineering firm to conduct such studies and issue a report on potential remediation alternatives. In connection with these proceedings, reports have been produced including a variety of cost estimates for a variety of potential remedial options. In March 2021, the next phaseparties notified the court that they had agreed on a settlement in principle of all issues in this matter. Finalization of the study. The study is targeted for completion late 2017.proposed settlement remains subject to court approval.
The Company's accrued expenses for environmental proceedings are included within accrued certain litigation charges in other accrued expenses and other long-term liabilities on the consolidated balance sheets as discussed above.
Government Matters
Medtronic has received subpoenas or document requests from the Attorneys General in Massachusetts, California, Oregon, Illinois, and Washington seeking information regarding sales, marketing, clinical, and other information relating to the INFUSE bone graft product. The Company has not recorded an expense related to damages in connection with these matters, because any potential loss is not currently probable or reasonably estimable under U.S. GAAP. Additionally, the Company cannot reasonably estimate the range of loss, if any, that may result from these matters.
On May 2, 2011, the U.S. Attorney’s Office for the District of Massachusetts issued a subpoena to ev3, a subsidiary of the Company, requesting production of documents relating to sales and marketing and other issues in connection with several neurovascular products. The matters under investigation relate to activities prior to Covidien's acquisition of ev3 in 2010. ev3 complied as required with the subpoena and cooperated with the investigation. In the third quarter of fiscal year 2016, the Company accrued expenses in connection with this matter, which are included within accrued certain litigation charges in other accrued expenses and other long-term liabilities on the consolidated balance sheets as discussed above.
Medtronic plc
Notes to Consolidated Financial Statements (Continued)
On September 2, 2014, the U.S. Department of Health and Human Services, Office of Inspector General and the U.S. Attorney’s Office for the Northern District of California, issued a subpoena requesting production of documents relating to sales and marketing practices associated with certain of ev3’s peripheral vascular products. The Company has not recorded an expense related to damages in connection with this matter, because any potential loss is not currently probable or reasonably estimable under U.S. GAAP. Additionally, the Company cannot reasonably estimate the range of loss, if any, that may result from this matter.
Income Taxes
In March 2009, the U.S. Internal Revenue Service (IRS)IRS issued its audit report on Medtronic, Inc. for fiscal years 2005 and 2006. Medtronic, Inc. reached agreement with the IRS on some, but not all matters related to these fiscal years. On December 23, 2010, the IRS issued a statutory notice of deficiency with respect to the remaining issues. Medtronic, Inc. filed a petition with the U.S. Tax Court on March 21, 2011 objecting to the deficiency. During October and November 2012, Medtronic, Inc. reached resolution with the IRS on various matters, including the deductibility of a settlement payment. Medtronic, Inc. and the IRS agreed to hold one issue, the calculation of amounts eligible for the one-time repatriation holiday, because such specific issue was being addressed by other taxpayers in litigation with the IRS. The remaining unresolved issue for fiscal years 2005 and 2006 relates to the allocation of income between Medtronic, Inc. and its wholly-owned subsidiary operating in Puerto Rico, which is one of the Company's key manufacturing sites. The U.S. Tax Court proceedingreviewed this dispute, and in June 2016, issued an opinion with respect to this issue began on February 3, 2015the allocation of income between the parties for fiscal years 2005 and ended on2006. The Tax Court generally rejected the IRS’s position, but also made certain modifications to the Medtronic, Inc. tax returns as filed. In April 2017, the IRS filed a Notice of Appeal to the U.S. Court of Appeals for the Eighth Circuit regarding the Tax Court opinion. Oral argument for the Appeal occurred in March 12, 2015.2018. The U.S. Tax Court of Appeals issued its opinion on June 9, 2016. Please see Note 18in August 2018 and remanded the case back to the Tax Court for additional information regarding this subsequent event.factual findings. The Tax Court trial relating to the issues remanded by the Court of Appeals concluded during June 2021. The parties are awaiting the Tax Court decision, which will remain subject to appeal by either party upon its issuance.
In October 2011, theThe IRS has issued its audit reportreports on Medtronic, Inc. for fiscal years 2007 and 2008. Medtronic, Inc. reached agreement with the IRS on some but not all matters related to these fiscal years. During the first quarter of fiscal year 2016, the Company finalized its agreement with the IRS on the proposed adjustments associated with the tax effects of the Company's acquisition of Kyphon Inc. (Kyphon). The settlement was consistent with the certain tax adjustment recorded during the fourth quarter of fiscal year 2015. The significant issues that remain unresolved for these tax years relate to the allocation of income betweenthrough 2016. Medtronic, Inc. and its wholly-owned subsidiary operating in Puerto Rico.
In April 2014, the IRS issued its audit report on Medtronic, Inc. for fiscal years 2009, 2010, and 2011. Medtronic, Inc.have reached agreement with the IRS on some but not all matters related to these fiscal years. The significant issues that remain unresolved relate toexcept for the allocation of income between Medtronic, Inc. and its wholly-owned subsidiary operating in Puerto Rico for the businesses that are the subject of the U.S. Tax Court matter for fiscal years 2005 and proposed adjustments associated with the tax effects of its acquisition structures for Ardian, CoreValve, Inc., and Ablation Frontiers, Inc. The Company disagrees with the IRS and will attempt to resolve these matters at the IRS Appellate level, however, it will proceed through litigation, if necessary. The IRS continues to audit 2006.
Medtronic, Inc.'s’s fiscal years 2017, 2018, and 2019 U.S. federal income tax returns forare currently being audited by the fiscal years 2012 through 2014.IRS.
Covidien andLP (a wholly owned subsidiary of Medtronic plc) has either reached agreement with the IRS have concluded and reached agreementor the statute of limitations has lapsed on its audit of Covidien’s U.S. federal income tax returns through fiscal year 2018.
Although it is not possible to predict the outcome for most of the 2008 and 2009 tax years. The IRS continues to audit Covidien’s U.S. federal income tax returns formatters discussed above, the years 2010 through 2012. Open periods for examination also include certain periods during which Covidien was a subsidiary of Tyco International plc (Tyco International). The resolution ofCompany believes it is possible that charges associated with these matters is subjectcould have a material adverse impact on the Company’s consolidated earnings, financial position, and/or cash flows.
Refer to the conditions set forth in the Tyco tax sharing agreement (Tax Sharing Agreement). Tyco International has the right to administer, control and settle all U.S.Note 13 for additional discussion of income tax audits for periods prior to the 2007 separation.taxes.
The IRS has concluded its field examination
Table of certain of Tyco International’s U.S. federal income tax returns for the years 1997 through 2000 and proposed tax adjustments, several of which also affect Covidien’s income tax returns for certain years after 2000. Tyco International has appealed certain of the tax adjustments proposed by the IRS and has resolved all but one of the matters associated with the proposed tax adjustments. The IRS has asserted that substantially all of Tyco International’s intercompany debt originating during the years 1997 through 2000 should not be treated as debt for U.S. federal income tax purposes, and has disallowed interest deductions related to the intercompany debt and certain tax attribute adjustments recognized on Tyco International’s U.S. income tax returns. The Company disagrees with the IRS’s proposed adjustments and, on July 22, 2013, Tyco International filed a petition with the U.S. Tax Court contesting the IRS assessment. On January 15, 2016, Tyco International, as the audit managing party under the Tax Sharing Agreement, entered into Stipulations of Settled Issues with the IRS intended to resolve all disputes related to the intercompany debt issues for the tax sharing participants for the 1997 - 2000 audit cycle, currently before the U.S. Tax Court. The Stipulations of Settled Issues are contingent upon the IRS Appeals Division applying the same settlement to all intercompany debt issues on appeal for subsequent audit cycles (2001 - 2007) and the approval of the U.S. Congress Joint Committee on Taxation, if required. If finalized, the tentative resolution would cover all aspects of the controversy before the U.S. Tax Court and the Appeals Division of the IRS. During the fourth quarter of fiscal 2016, the Company paid $10 million to the IRS related to the settlement. In addition, the Company paid $183 million to TE Connectivity Ltd. and received $2 million from Tyco International plc, representing its estimated share of the total amount payable to or receivable from the other Tax SharingContents
Medtronic plc
Notes to Consolidated Financial Statements (Continued)
Participants in connection with this matter. The resolutions with the U.S. Tax Court and IRS Appeals were finalized during May 2016. Please see Note 18 regarding this subsequent event for additional information.
See Note 11 for additional discussion of income taxes.
Guarantees
As a result of the acquisition of Covidien, the Company has guarantee commitments and indemnifications with Tyco International, TE Connectivity, and Mallinckrodt plc (Mallinckrodt) which relate to certain contingent tax liabilities.
On June 29, 2007, Covidien entered into the Tax Sharing Agreement, under which Covidien shares responsibility for certain of its, Tyco International’s and TE Connectivity’s income tax liabilities for periods prior to Covidien’s 2007 separation from Tyco International (2007 separation). Covidien, Tyco International and TE Connectivity share 42 percent, 27 percent, and 31 percent, respectively, of U.S. income tax liabilities that arise from adjustments made by tax authorities to Covidien's, Tyco International’s and TE Connectivity’s U.S. income tax returns, certain income tax liabilities arising from adjustments made by tax authorities to intercompany transactions or similar adjustments, and certain taxes attributable to internal transactions undertaken in anticipation of the 2007 separation. If Tyco International and TE Connectivity default on their obligations to Covidien under the Tax Sharing Agreement, the Company would be liable for the entire amount of these liabilities. All costs and expenses associated with the management of these tax liabilities are being shared equally among the parties.
In connection with the 2007 separation, all tax liabilities associated with Covidien business became Covidien’s tax liabilities. Following Covidien’s spin-off of its Pharmaceuticals business to Covidien shareholders through a distribution of all the outstanding ordinary shares of Mallinkrodt (2013 separation), Mallinckrodt became the primary obligor to the taxing authorities for the tax liabilities attributable to its subsidiaries, a significant portion of which relate to periods prior to the 2007 separation. However, Covidien remains the sole party subject to the Tax Sharing Agreement. Accordingly, Mallinckrodt does not share in Covidien’s liability to Tyco International and TE Connectivity, nor in the receivable that Covidien has from Tyco International and TE Connectivity.
If any party to the Tax Sharing Agreement were to default in its obligation to another party to pay its share of the distribution taxes that arise as a result of no party’s fault, each non-defaulting party would be required to pay, equally with any other non-defaulting party, the amounts in default. In addition, if another party to the Tax Sharing Agreement that is responsible for all or a portion of an income tax liability were to default in its payment of such liability to a taxing authority, the Company could be legally liable under applicable tax law for such liabilities and be required to make additional tax payments. Accordingly, under certain circumstances, the Company may be obligated to pay amounts in excess of the Company’s agreed upon share of Covidien's, Tyco International’s and TE Connectivity’s tax liabilities.
The Company has used available information to develop its best estimates for certain assets and liabilities related to periods prior to the 2007 separation, including amounts subject to or impacted by the provisions of the Tax Sharing Agreement. The actual amounts that the Company may be required to ultimately accrue or pay under the Tax Sharing Agreement, however, could vary depending upon the outcome of the unresolved tax matters. Final determination of the balances will be made in subsequent periods, primarily related to certain pre-2007 separation tax liabilities and tax years open for examination. These balances will also be impacted by the filing of final or amended income tax returns in certain jurisdictions where those returns include a combination of Tyco International, Covidien and/or TE Connectivity legal entities for periods prior to the 2007 separation. The resolutions with the U.S. Tax Court and IRS Appeals were finalized during May 2016. Please see Note 18 regarding this subsequent event for additional information.
In conjunction with the 2013 separation, Mallinckrodt assumed the tax liabilities that are attributable to its subsidiaries, and Covidien indemnified Mallinckrodt to the extent that such tax liabilities arising from periods prior to 2013 exceed $200 million, net of certain tax benefits realized. In addition, in connection with the 2013 separation, Covidien entered into certain other guarantee commitments and indemnifications with Mallinckrodt.
Except as described above in this note or for certain income tax related matters, the Company has not recorded an expense related to losses in connection with these matters because any potential loss is not currently probable or reasonably estimable under U.S. GAAP. Additionally, the Company cannot reasonably estimate the range of loss, if any, that may result from these matters.
In the normal course of business, the Company and/or its affiliates periodically enter into agreements that require one or more of themthe Company and/or its affiliates to indemnify customers or suppliers for specific risks, such as claims for injury or property damage arising outas a result of the Company or its affiliates’ products, or the negligence of any of theirthe Company's personnel, or claims alleging that any of theirthe Company's products infringe on third-party patents or other intellectual property. The Company also offers warranties on various products. The Company’s maximum exposure under these indemnification provisions cannotguarantees is unable to be
Medtronic plc
Notes to Consolidated Financial Statements (Continued)
estimated, and the Company has not accrued any liabilities within the consolidated financial statements. estimated. Historically, the Company has not experienced significant losses on these types of indemnifications.
16. Quarterly Financial Data (unaudited)
|
| | | | | | | | | | | | | | | | | | | | | |
| (in millions, except per share data) | | | First Quarter | | Second Quarter | | Third Quarter | | Fourth Quarter | | Fiscal Year |
| Net Sales | | | |
| | |
| | |
| | |
| | |
|
| | 2016 | | $ | 7,274 |
| | $ | 7,058 |
| | $ | 6,934 |
| | $ | 7,567 |
| | $ | 28,833 |
|
| | 2015 | | 4,273 |
| | 4,366 |
| | 4,318 |
| | 7,304 |
| | 20,261 |
|
| Gross Profit | | | |
| | |
| | |
| | |
| | |
|
| | 2016 | | $ | 4,818 |
| | $ | 4,876 |
| | $ | 4,793 |
| | $ | 5,204 |
| | $ | 19,691 |
|
| | 2015 | | 3,168 |
| | 3,224 |
| | 3,190 |
| | 4,370 |
| | 13,952 |
|
| Net Income (Loss) | | | | | | | | | | | |
| | 2016 | | $ | 820 |
| | $ | 520 |
| | $ | 1,095 |
| | $ | 1,104 |
| | $ | 3,538 |
|
| | 2015 | | 871 |
| | 828 |
| | 977 |
| | (1 | ) | | 2,675 |
|
| Basic Earnings per Share | | | |
| | |
| | |
| | |
| | |
|
| | 2016 | | $ | 0.58 |
| | $ | 0.37 |
| | $ | 0.78 |
| | $ | 0.79 |
| | 2.51 |
|
| | 2015 | | 0.88 |
| | 0.84 |
| | 0.99 |
| | — |
| | 2.44 |
|
| Diluted Earnings per Share | | | |
| | |
| | |
| | |
| | |
|
| | 2016 | | $ | 0.57 |
| | $ | 0.36 |
| | $ | 0.77 |
| | $ | 0.78 |
| | 2.48 |
|
| | 2015 | | 0.87 |
| | 0.83 |
| | 0.98 |
| | — |
| | 2.41 |
|
The data inCompany believes the scheduleultimate resolution of the above has been intentionally roundedguarantees is not expected to have a material effect on the nearest million, and therefore, the quarterly amounts may not sum to the fiscal year-to-date amounts.Company’s consolidated earnings, financial position, and/or cash flows.
17.19. Segment and Geographic Information
The Company’s management evaluates performance and allocates resources based on profit and loss from operations before income taxes and interest expense, net, not including the impact of inventory step-up, the impact of product technology upgrade commitment, special (gains) charges, net, restructuring charges, net, certain litigation charges, net, acquisition-related items, and certain tax adjustments. The accounting policies ofThere were no changes to the reportable segments areduring the same as those described in the summary of significant accounting policies in Note 1.
In the fourth quarter of fiscal year 2015, the Company amended the way in which management evaluates performanceended April 29, 2022. The Company's 4 principal operating and allocates resources due to the Covidien acquisition. As a result, the Company began to operate under four reportable segments are as follows: Cardiovascular Portfolio, Neuroscience Portfolio, Medical Surgical Portfolio, and four operating segments. This change had no impact on the Company’s consolidated results for prior periods presented.Diabetes Operating Unit.
The Company’s CardiacCompany's management has chosen to organize the entity based upon therapy solutions provided by each segment. The 4 principal segments are strategic businesses that are managed separately, as each one develops and Vascular Group consists of three divisions: Cardiac Rhythm & Heart Failure, Coronary & Structural Heart,manufactures products and Aortic & Peripheral Vascular. provides services oriented toward targeted therapy solutions.
The primary products sold by this operatingand services from which the Cardiovascular Portfolio segment derives its revenues include products for the diagnosis, treatment, and management of cardiac rhythm disorders and cardiovascular disease, as well as services to diagnose, treat, and manage heart and vascular-related disorders and diseases. The products produced by this operating segment require highly-skilled, technical manufacturing processes and are distributed through direct sales representatives in the U.S. and through direct sales representatives and indirect distributors outside of the U.S. Further, the primary customers of this operating segment are surgeons and specialists and the regulatory approval process for the Cardiac and Vascular Group is similar across all components. The Company’s Minimally Invasive Therapies Group consists of two divisions: Surgical Solutions and Patient Monitoring & Recovery.
The primary products sold by this operatingand services from which the Medical Surgical Portfolio segment derives its revenues include those focused on diseases of the respiratory system, gastrointestinal tract, renal system, lungs, pelvic region, kidneys, obesity, and other preventable complications.
The primary products and services from which enhance patient outcomes through minimally invasive solutions. These productsthe Neuroscience Portfolio segment derives its revenues include those for advancedfocused on neurostimulation therapies and general surgical care and patient monitoring, nursing and patient care, and airway and ventilation. Further, the regulatory approval processdrug delivery systems for the Minimally Invasive Therapies Group is similar across all components. The Company’s Restorative Therapies Group consiststreatment of four divisions: Spine, Neuromodulation, Surgical Technologies,chronic pain, as well as various areas of the spine and Neurovascular. brain, along with pelvic health and conditions of the ear, nose, and throat.
The primary customers of this operatingproducts from which the Diabetes Operating Unit segment derives its revenues include spinal surgeons, neurosurgeons,those focused on diabetes management, including insulin pumps, continuous glucose monitoring systems, smart insulin pens, and pain specialists. The products sold by this operating segmentinsulin pump consumables.
Segment disclosures are distributed through directon a performance basis, consistent with internal management reporting. Net sales representatives in the U.S. and through direct sales representatives and indirect distributors outside of the U.S. Further,Company's segments include end-customer revenues from the regulatory approval processsale of products the segment develops, manufactures, and distributes. Refer to Note 2 for discussion on net sales by segment. There are certain corporate and centralized expenses that are not allocated to the Restorative Therapies Group is similarsegments. The Company's management evaluates the performance of the segments and allocates resources based on net sales and segment operating profit. Segment operating profit represents income before income taxes, excluding interest expense, amortization of intangible assets, centralized distribution costs, non-operating income or expense items, certain corporate charges, and other items not allocated to the segments.
Medtronic plc
Notes to Consolidated Financial Statements (Continued)
across all components. The primary products sold by the Company’s Diabetes Group include those for diabetes management and the approval process for the Diabetes is similar across all divisions.
Net salesaccounting policies of the Company’s reportable segments include end-customer revenues fromare the salesame as those described in Note 1. Certain depreciable assets may be recorded by one segment, while the depreciation expense is allocated to another segment. The allocation of productsdepreciation expense is based on the proportion of the assets used by each reportable segment developssegment.
Segment Operating Profit
| | | | | | | | | | | | | | | | | |
| | Fiscal Year |
| (in millions) | 2022 | | 2021 | | 2020 |
| Cardiovascular | $ | 4,512 | | | $ | 3,850 | | | $ | 3,719 | |
| Medical Surgical | 3,572 | | | 3,021 | | | 3,044 | |
| Neuroscience | 3,765 | | | 3,162 | | | 2,915 | |
| Diabetes | 583 | | | 598 | | | 546 | |
| Segment operating profit | 12,432 | | | 10,632 | | | 10,224 | |
| Interest expense | (553) | | | (925) | | | (1,092) | |
| Other non-operating income, net | 318 | | | 336 | | | 356 | |
| Amortization of intangible assets | (1,733) | | | (1,783) | | | (1,756) | |
| Corporate | (1,724) | | | (1,577) | | | (1,239) | |
| Centralized distribution costs | (1,752) | | | (1,877) | | | (1,420) | |
| Restructuring and associated costs | (335) | | | (617) | | | (441) | |
| Acquisition-related items | 43 | | | 15 | | | (66) | |
| Certain litigation charges | (95) | | | (118) | | | (313) | |
| Impairment charges | — | | | (76) | | | — | |
| MCS impairment / costs | (881) | | | — | | | — | |
| IPR&D charges | (101) | | | (31) | | | (25) | |
| Exit of businesses | — | | | — | | | (52) | |
| Debt tender premium and other charges | — | | | — | | | 7 | |
| Medical device regulations | (102) | | | (83) | | | (48) | |
| Contribution to Medtronic Foundation | — | | | — | | | (80) | |
| Income before income taxes | $ | 5,517 | | | $ | 3,895 | | | $ | 4,055 | |
Total Assets and manufactures or distributes. Net sales and income before income taxes by reportable segment are as follows:Depreciation Expense | | | | | | | | | | | | | | | | | | | | | | | | | | | | | |
| Total Assets | | Depreciation Expense |
| (in millions) | April 29, 2022 | | April 30, 2021 | | 2022 | | 2021 | | 2020 |
| Cardiovascular | $ | 14,490 | | | $ | 15,027 | | | $ | 214 | | | $ | 212 | | | $ | 210 | |
| Medical Surgical | 36,940 | | | 39,319 | | | 200 | | | 195 | | | 194 | |
| Neuroscience | 16,917 | | | 17,151 | | | 265 | | | 236 | | | 233 | |
| Diabetes | 3,797 | | | 3,671 | | | 67 | | | 53 | | | 38 | |
| Segments | 72,144 | | | 75,168 | | | 746 | | | 696 | | | 675 | |
| Corporate | 18,837 | | | 17,915 | | | 228 | | | 223 | | | 232 | |
| Total | $ | 90,981 | | | $ | 93,083 | | | $ | 974 | | | $ | 919 | | | $ | 907 | |
|
| | | | | | | | | | | |
| | Fiscal Year |
| (in millions) | 2016 | | 2015 | | 2014 |
| Cardiac and Vascular Group | $ | 10,196 |
| | $ | 9,361 |
| | $ | 8,847 |
|
| Minimally Invasive Therapies Group | 9,563 |
| | 2,387 |
| | — |
|
| Restorative Therapies Group | 7,210 |
| | 6,751 |
| | 6,501 |
|
| Diabetes Group | 1,864 |
| | 1,762 |
| | 1,657 |
|
| Total Net Sales | $ | 28,833 |
| | $ | 20,261 |
| | $ | 17,005 |
|
|
| | | | | | | | | | | |
| | Fiscal Year |
| (in millions) | 2016 | | 2015 | | 2014 |
| Cardiac and Vascular Group | $ | 3,182 |
| | $ | 3,140 |
| | $ | 2,982 |
|
| Minimally Invasive Therapies Group | 1,394 |
| | 342 |
| | — |
|
| Restorative Therapies Group | 1,976 |
| | 1,828 |
| | 1,821 |
|
| Diabetes Group | 543 |
| | 540 |
| | 457 |
|
| Total Reportable Segments’ Income Before Income Taxes | 7,095 |
| | 5,850 |
| | 5,260 |
|
| Impact of inventory step-up | (226 | ) | | (623 | ) | | — |
|
| Impact of product technology upgrade commitment | — |
| | (74 | ) | | — |
|
| Special (gains) charges, net | (70 | ) | | 38 |
| | (40 | ) |
Restructuring charges, net (1) | (299 | ) | | (252 | ) | | (88 | ) |
| Certain litigation charges, net | (26 | ) | | (42 | ) | | (770 | ) |
| Acquisition-related items | (283 | ) | | (550 | ) | | (117 | ) |
| Interest expense, net | (955 | ) | | (280 | ) | | (108 | ) |
| Corporate | (900 | ) | | (581 | ) | | (432 | ) |
| Total Income From Operations Before Income Taxes | $ | 4,336 |
| | $ | 3,486 |
| | $ | 3,705 |
|
| |
(1) | Restructuring charges, net within this table include the impact of amounts recorded within cost of products sold in the consolidated statements of income. |
Medtronic plc
Notes to Consolidated Financial Statements (Continued)
The following table presents the Company’s assets by reportable segment:
|
| | | | | | | |
| (in millions) | April 29,
2016 | | April 24,
2015 |
| Cardiac and Vascular Group | $ | 13,563 |
| | $ | 13,642 |
|
| Minimally Invasive Therapies Group | 52,227 |
| | 51,228 |
|
| Restorative Therapies Group | 14,564 |
| | 15,249 |
|
| Diabetes Group | 2,592 |
| | 2,597 |
|
| Total Assets of Reportable Segments | 82,946 |
| | 82,716 |
|
| Corporate | 16,836 |
| | 23,969 |
|
| Total Assets | $ | 99,782 |
| | $ | 106,685 |
|
Geographic Information
Net sales are attributed to the country based on the location of the customer taking possession of the products or in which the services are rendered. Geographic property, plant, and equipment are attributed to the country based on the physical location of the assets.
The following table presents net sales to external customersfor fiscal years 2022, 2021, and 2020, and property, plant, and equipment, net by geographic region:at April 29, 2022 and April 30, 2021 for the Company's country of domicile, countries with significant concentrations, and all other countries:
| | | | | | | | | | | | | | | | | | | | | | | | | | | | | |
| Net sales | | Property, plant, and equipment, net |
| (in millions) | 2022 | | 2021 | | 2020 | | April 29, 2022 | | April 30, 2021 |
| Ireland | $ | 101 | | | $ | 100 | | | $ | 85 | | | $ | 177 | | | $ | 170 | |
| | | | | | | | | |
| United States | 16,135 | | | 15,526 | | | 14,919 | | | 3,821 | | | 3,688 | |
| Rest of world | 15,450 | | | 14,491 | | | 13,909 | | | 1,415 | | | 1,363 | |
| Total other countries, excluding Ireland | 31,585 | | | 30,017 | | | 28,828 | | | 5,236 | | | 5,051 | |
| Total | $ | 31,686 | | | $ | 30,117 | | | $ | 28,913 | | | $ | 5,413 | | | $ | 5,221 | |
|
| | | | | | | | | | | | | | | | | | | |
| (in millions) | Americas (1) | | EMEA (2) | | Asia Pacific | | Greater China | | Consolidated |
| Fiscal Year 2016 | |
| | |
| | |
| | |
| | |
|
| Net sales to external customers | $ | 17,578 |
| | $ | 6,700 |
| | $ | 3,060 |
| | $ | 1,495 |
| | $ | 28,833 |
|
| Property, plant, and equipment, net | $ | 3,728 |
| | $ | 708 |
| | $ | 220 |
| | $ | 185 |
| | $ | 4,841 |
|
| Fiscal Year 2015 | |
| | |
| | |
| | |
| | |
|
| Net sales to external customers | $ | 12,125 |
| | $ | 5,064 |
| | $ | 2,059 |
| | $ | 1,013 |
| | $ | 20,261 |
|
| Property, plant, and equipment, net | $ | 3,626 |
| | $ | 725 |
| | $ | 165 |
| | $ | 183 |
| | $ | 4,699 |
|
| Fiscal Year 2014 | |
| | |
| | |
| | |
| | |
|
| Net sales to external customers | $ | 9,922 |
| | $ | 4,483 |
| | $ | 1,776 |
| | $ | 824 |
| | $ | 17,005 |
|
| Property, plant, and equipment, net | $ | 1,833 |
| | $ | 393 |
| | $ | 74 |
| | $ | 92 |
| | $ | 2,392 |
|
| |
(1) | The U.S., which is included in the Americas, had net sales to external customers of $16.4 billion, $11.3 billion, and $9.2 billion in fiscal years 2016, 2015, and 2014, respectively. Property, plant, and equipment, net includes $3.3 billion, $3.0 billion, and $1.7 billion in the U.S. in fiscal years 2016, 2015, and 2014 respectively. |
| |
(2) | EMEA consists of the following regions: Europe, Middle East, and Africa. Sales to Ireland were insignificant during all periods presented. Property, plant, and equipment, net includes $169 million, $151 million, and $72 million in Ireland in fiscal years 2016, 2015, and 2014, respectively. |
No single customer represented over 10 percent of the Company’s consolidated net sales in fiscal years 2016, 2015,2022, 2021, or 2014.2020.
18.20. Subsequent Events
Tyco International, as audit managing party under the Tax Sharing Agreement, entered into Stipulations of Settled Issues with the IRS intended to resolve all Federal tax disputes related to the previously disclosed intercompany debt issues for the Tax Sharing Participants for the 1997-2000 audit cycle before the U.S. Tax Court. The Stipulations of Settled Issues were contingent upon the IRS Appeals Division applying the same settlement terms to all intercompany debt issues on appeal for subsequent audit cycles (2001-2007). On May 17, 2016 the IRS Office of Appeals issued fully executed Forms 870-AD that effectively settled the matters on appeal on the same terms as those set forth in the Stipulations of Settled Issues, and on May 31, 2016 the U.S. Tax Court entered decisions consistent with the Stipulations of Settled Issues. As a result, all aspects of this controversy that were before the U.S. Tax Court and Appeals Division of the IRS have been finally resolved for audit cycles from 1997-2007. The Company estimates the adjustments to the income tax reserve and guarantee contingencies will result in the recognition of a benefit of approximately $425 million in the Company’s first quarter of fiscal 2017 results.
On May 18, 2016,25, 2022, the Company signedand DaVita Inc. (“DaVita”) entered into a definitive agreement with the intent to acquire Smith & Nephew's gynecology business for approximately $350 million.form a new, independent kidney care-focused medical device company (“NewCo”) with equal equity ownership. The addition of Smith & Nephew's gynecology business will expand and strengthen Medtronic's minimally invasive surgical offerings and will further complement its existing global gynecology business. The acquisitiontransaction is expected to close in fiscalcalendar year 2017.
2023, subject to customary regulatory approvals and closing conditions. Medtronic plc
Notesis contributing its entire Renal Care Solutions business (“RCS”) to Consolidated Financial Statements (Continued)
On June 9, 2016, the U.S. Tax court issued its opinion with respect to the allocation of income between Medtronic, Inc. and its wholly-owned subsidiary operating in Puerto Rico for fiscal years 2005 and 2006. The U.S. Tax Court generally rejected the IRS’s position, but also made certain modifications to the Medtronic, Inc. tax returns as filed. We do not expect the resultsNewCo. RCS is part of the opinion to have a material impact onRespiratory, Gastrointestinal, and Renal division in the financial statements. An AppealCompany’s Medical Surgical portfolio, and had revenue of the U.S. Tax Court Opinion must be filed within 90 days of the final decision by the Tax Court. The final decision will not occur until all issues related to the fiscal years are resolved. As one item remains open, the calculation of amounts eligible for the one-time repatriation holiday, a final decision is not expected until later this fiscal year, and, therefore, an estimate of the financial statement impact cannot yet be made.
On June 27, 2016, the Company announced entry into a definitive agreement to acquire HeartWare International, Inc. for approximately $1.1 billion. The addition of HeartWare International, Inc.'s portfolio of heart failure products will expand and strengthen Medtronic's heart failure product offerings and will further complement its existing global cardiac rhythm and heart failure business. The acquisition is expected to close$325 million in fiscal year 2017.2022.
103
19. Guarantor Financial Information
On January 26, 2015, Medtronic plc ("Parent Company Guarantor") and Medtronic Luxco, a subsidiary guarantor, each provided a full and unconditional guarantee of the obligations of Medtronic, Inc. under the Medtronic 2015 Senior Notes. In addition, Medtronic plc and Medtronic Luxco each provided a full and unconditional guarantee of the obligations of CIFSA, assumed as part of the Covidien acquisition, under the CIFSA Senior Notes. These guarantees of the CIFSA Senior Notes were in addition to the guarantees of the CIFSA Senior Notes by acquired Covidien holding companies Covidien Ltd. (f/k/a Covidien plc) and Covidien Group Holdings Ltd. (f/k/a Covidien Ltd.), both of which remain guarantors of the CIFSA Senior Notes. A summary of the guarantees is as follows:
Guarantees of Medtronic Senior Notes
Parent Company Guarantor - Medtronic plc
Subsidiary Issuer - Medtronic, Inc.
Subsidiary Guarantor - Medtronic Luxco
Since Medtronic plc and Medtronic Luxco did not exist in prior years, the Parent Company Guarantor column and Subsidiary Guarantor Column in the consolidating financial information for the guarantees of the Medtronic 2015 Senior Notes appear as zeros for fiscal year 2014. Accordingly, the fiscal year 2014 consolidating financial information is of the predecessor registrant, Medtronic, Inc.
Guarantees of CIFSA Senior Notes
Parent Company Guarantor - Medtronic plc
Subsidiary Issuer - CIFSA
Subsidiary Guarantors - Medtronic Luxco, Covidien Ltd., and Covidien Group Holdings Ltd.
The following presents the Company’s Consolidating Statements of Comprehensive Income and Condensed Consolidating Statements of Cash Flows as of and for the fiscal years ended April 29, 2016, April 24, 2015, and April 25, 2014, and Condensed Consolidating Balance Sheets as of April 29, 2016 and April 24, 2015. The guarantees provided by the Parent Company Guarantor and Subsidiary Guarantors are joint and several. Condensed consolidating financial information for Medtronic plc, Medtronic Luxco, Medtronic, Inc. and CIFSA, on a stand-alone basis, is presented using the equity method of accounting for subsidiaries.
There were no Medtronic plc or Medtronic Luxco guarantees in effect in periods prior to fiscal year 2015, and the CIFSA Senior Notes were assumed as part of the Covidien acquisition. Therefore, no consolidating financial information for the fiscal year ended April 25, 2014 is presented related to the guarantees of the CIFSA Senior Notes.
During fiscal year 2016, the Company undertook certain steps to reorganize ownership of various subsidiaries. The transactions were entirely among subsidiaries under the common control of Medtronic. This reorganization has been reflected as of the beginning of the earliest period presented.
The Company made revisions to its Condensed Consolidating Balance Sheet of the guarantees of the CIFSA Senior Notes as previously presented in Note 19 in the Company’s Annual Report on Form 10-K for the year ended April 24, 2015. A $14.7 billion revision increased investment in subsidiaries and shareholders' equity in the Subsidiary Issuer (CIFSA) column of the Condensed Consolidating Balance Sheet due to an incorrect presentation primarily related to the investment balance upon acquisition and an
Medtronic plc
Notes to Consolidated Financial Statements (Continued)
intercompany dividend. The Company also made revisions to the Condensed Consolidating Statement
Medtronic plc
Notes to Consolidated Financial Statements (Continued)
Consolidating Statement of Comprehensive Income
Fiscal Year Ended April 29, 2016
Medtronic Senior Notes
|
| | | | | | | | | | | | | | | | | | | | | | | |
| (in millions) | Parent Company Guarantor (Medtronic plc) | | Subsidiary Issuer (Medtronic, Inc.) | | Subsidiary Guarantors | | Subsidiary Non-guarantors | | Consolidating Adjustments | | Total |
| Net sales | $ | — |
| | $ | 1,411 |
| | $ | — |
| | $ | 28,832 |
| | $ | (1,410 | ) | | $ | 28,833 |
|
| | | | | | | | | | | | |
| Costs and expenses: | | | | | | | | | | | |
| Cost of products sold | — |
| | 991 |
| | — |
| | 9,561 |
| | (1,410 | ) | | 9,142 |
|
| Research and development expense | — |
| | 627 |
| | — |
| | 1,597 |
| | — |
| | 2,224 |
|
| Selling, general, and administrative expense | 10 |
| | 991 |
| | — |
| | 8,468 |
| | — |
| | 9,469 |
|
| Special (gains) charges, net | — |
| | 70 |
| | — |
| | — |
| | — |
| | 70 |
|
| Restructuring charges, net | — |
| | 17 |
| | — |
| | 273 |
| | — |
| | 290 |
|
| Certain litigation charges, net | — |
| | — |
| | — |
| | 26 |
| | — |
| | 26 |
|
| Acquisition-related items | — |
| | 135 |
| | — |
| | 148 |
| | — |
| | 283 |
|
| Amortization of intangible assets | — |
| | 12 |
| | — |
| | 1,919 |
| | — |
| | 1,931 |
|
| Other (income) expense, net | 112 |
| | (2,329 | ) | | — |
| | 2,324 |
| | — |
| | 107 |
|
| Operating profit (loss) | (122 | ) | | 897 |
| | — |
| | 4,516 |
| | — |
| | 5,291 |
|
| | | | | | | | | | | | |
| Interest income | — |
| | (237 | ) | | (706 | ) | | (448 | ) | | 960 |
| | (431 | ) |
| Interest expense | 25 |
| | 1,906 |
| | 10 |
| | 405 |
| | (960 | ) | | 1,386 |
|
| Interest expense (income), net | 25 |
| | 1,669 |
| | (696 | ) | | (43 | ) | | — |
| | 955 |
|
| Equity in net (income) loss of subsidiaries | (3,676 | ) | | 4,224 |
| | (2,980 | ) | | — |
| | 2,432 |
| | — |
|
| Income (loss) from operations before income taxes | 3,529 |
| | (4,996 | ) | | 3,676 |
| | 4,559 |
| | (2,432 | ) | | 4,336 |
|
| Provision (benefit) for income taxes | (9 | ) | | (96 | ) | | — |
| | 903 |
| | — |
| | 798 |
|
| Net income (loss) | 3,538 |
| | (4,900 | ) | | 3,676 |
| | 3,656 |
| | (2,432 | ) | | 3,538 |
|
| Other comprehensive income (loss), net of tax | (684 | ) | | (493 | ) | | (684 | ) | | (673 | ) | | 1,850 |
| | (684 | ) |
| Total comprehensive income (loss) | $ | 2,854 |
| | $ | (5,393 | ) | | $ | 2,992 |
| | $ | 2,983 |
| | $ | (582 | ) | | $ | 2,854 |
|
Medtronic plc
Notes to Consolidated Financial Statements (Continued)
Consolidating Statement of Comprehensive Income
Fiscal Year Ended April 24, 2015
Medtronic Senior Notes
|
| | | | | | | | | | | | | | | | | | | | | | | |
| (in millions) | Parent Company Guarantor (Medtronic plc) | | Subsidiary Issuer (Medtronic, Inc.) | | Subsidiary Guarantors | | Subsidiary Non-guarantors | | Consolidating Adjustments | | Total |
| Net sales | $ | — |
| | $ | 1,261 |
| | $ | — |
| | $ | 20,261 |
| | $ | (1,261 | ) | | $ | 20,261 |
|
| | | | | | | | | | | | |
| Costs and expenses: | | | | | | | | | | | |
| Cost of products sold | — |
| | 895 |
| | — |
| | 6,659 |
| | (1,245 | ) | | 6,309 |
|
| Research and development expense | — |
| | 552 |
| | — |
| | 1,088 |
| | — |
| | 1,640 |
|
| Selling, general, and administrative expense | 1 |
| | 857 |
| | — |
| | 6,046 |
| | — |
| | 6,904 |
|
| Special (gains) charges | — |
| | 100 |
| | — |
| | (138 | ) | | — |
| | (38 | ) |
| Restructuring charges, net | — |
| | 7 |
| | — |
| | 230 |
| | — |
| | 237 |
|
| Certain litigation charges, net | — |
| | — |
| | — |
| | 42 |
| | — |
| | 42 |
|
| Acquisition-related items | — |
| | 312 |
| | — |
| | 238 |
| | — |
| | 550 |
|
| Amortization of intangible assets | — |
| | 11 |
| | — |
| | 722 |
| | — |
| | 733 |
|
| Other (income) expense, net | 103 |
| | (1,618 | ) | | — |
| | 1,633 |
| | — |
| | 118 |
|
| Operating profit (loss) | (104 | ) | | 145 |
| | — |
| | 3,741 |
| | (16 | ) | | 3,766 |
|
| |
|
| |
|
| |
|
| |
|
| |
|
| |
|
|
| Interest income | — |
| | (56 | ) | | (170 | ) | | (387 | ) | | 227 |
| | (386 | ) |
| Interest expense | — |
| | 762 |
| | — |
| | 131 |
| | (227 | ) | | 666 |
|
| Interest expense (income), net | — |
| | 706 |
| | (170 | ) | | (256 | ) | | — |
| | 280 |
|
| Equity in net (income) loss of subsidiaries | (2,790 | ) | | (5,830 | ) | | (2,620 | ) | | — |
| | 11,240 |
| | — |
|
| Income (loss) from operations before income taxes | 2,686 |
| | 5,269 |
| | 2,790 |
| | 3,997 |
| | (11,256 | ) | | 3,486 |
|
| Provision (benefit) for income taxes | 11 |
| | (44 | ) | | — |
| | 844 |
| | — |
| | 811 |
|
| Net income | 2,675 |
| | 5,313 |
| | 2,790 |
| | 3,153 |
| | (11,256 | ) | | 2,675 |
|
| Other comprehensive income (loss), net of tax | (587 | ) | | (540 | ) | | (587 | ) | | (232 | ) | | 1,359 |
| | (587 | ) |
| Total comprehensive income (loss) | $ | 2,088 |
| | $ | 4,773 |
| | $ | 2,203 |
| | $ | 2,921 |
| | $ | (9,897 | ) | | $ | 2,088 |
|
Medtronic plc
Notes to Consolidated Financial Statements (Continued)
Consolidating Statement of Comprehensive Income
Fiscal Year Ended April 25, 2014
Medtronic Senior Notes
|
| | | | | | | | | | | | | | | | | | | | | | | |
| (in millions) | Parent Company Guarantor (Medtronic plc) | | Subsidiary Issuer (Medtronic, Inc.) | | Subsidiary Guarantors | | Subsidiary Non-guarantors | | Consolidating Adjustments | | Total |
| Net sales | $ | — |
| | $ | 1,155 |
| | $ | — |
| | $ | 17,005 |
| | $ | (1,155 | ) | | $ | 17,005 |
|
| | | | | | | | | | | | |
| Costs and expenses: | | | | | | | | | | | |
| Cost of products sold | — |
| | 787 |
| | — |
| | 4,674 |
| | (1,128 | ) | | 4,333 |
|
| Research and development expense | — |
| | 540 |
| | — |
| | 937 |
| | — |
| | 1,477 |
|
| Selling, general, and administrative expense | — |
| | 821 |
| | — |
| | 5,026 |
| | — |
| | 5,847 |
|
| Special (gains) charges | — |
| | 40 |
| | — |
| | — |
| | — |
| | 40 |
|
| Restructuring charges, net | — |
| | 71 |
| | — |
| | 7 |
| | — |
| | 78 |
|
| Certain litigation charges, net | — |
| | (24 | ) | | — |
| | 794 |
| | — |
| | 770 |
|
| Acquisition-related items | — |
| | — |
| | — |
| | 117 |
| | — |
| | 117 |
|
| Amortization of intangible assets | — |
| | 12 |
| | — |
| | 337 |
| | — |
| | 349 |
|
| Other (income) expense, net | — |
| | (1,623 | ) | | — |
| | 1,804 |
| | — |
| | 181 |
|
| Operating profit (loss) | — |
| | 531 |
| | — |
| | 3,309 |
| | (27 | ) | | 3,813 |
|
| | | | | | | | | | | | |
| Interest income | — |
| | (5 | ) | | — |
| | (267 | ) | | 1 |
| | (271 | ) |
| Interest expense | — |
| | 317 |
| | — |
| | 63 |
| | (1 | ) | | 379 |
|
| Interest expense (income), net | — |
| | 312 |
| | — |
| | (204 | ) | | — |
| | 108 |
|
| Equity in net (income) loss of subsidiaries | — |
| | (3,077 | ) | | — |
| | — |
| | 3,077 |
| | — |
|
| Income (loss) from operations before income taxes | — |
| | 3,296 |
| | — |
| | 3,513 |
| | (3,104 | ) | | 3,705 |
|
| Provision (benefit) for income taxes | — |
| | 231 |
| | — |
| | 409 |
| | — |
| | 640 |
|
| Net income (loss) | — |
| | 3,065 |
| | — |
| | 3,104 |
| | (3,104 | ) | | 3,065 |
|
| Other comprehensive income (loss), net of tax | — |
| | (105 | ) | | — |
| | (286 | ) | | 286 |
| | (105 | ) |
| Total comprehensive income (loss) | $ | — |
| | $ | 2,960 |
| | $ | — |
| | $ | 2,818 |
| | $ | (2,818 | ) | | $ | 2,960 |
|
Medtronic plc
Notes to Consolidated Financial Statements (Continued)
Condensed Consolidating Balance Sheet
April 29, 2016
Medtronic Senior Notes
|
| | | | | | | | | | | | | | | | | | | | | | | |
| (in millions) | Parent Company Guarantor (Medtronic plc) | | Subsidiary Issuer (Medtronic, Inc.) | | Subsidiary Guarantors | | Subsidiary Non-guarantors | | Consolidating Adjustments | | Total |
| ASSETS | | | | | | | | | | | |
| Current assets: | | | | | | | | | | | |
| Cash and cash equivalents | $ | — |
| | $ | 55 |
| | $ | — |
| | $ | 2,821 |
| | $ | — |
| | $ | 2,876 |
|
| Investments | — |
| | — |
| | — |
| | 9,758 |
| | — |
| | 9,758 |
|
| Accounts receivable, net | — |
| | — |
| | — |
| | 5,562 |
| | — |
| | 5,562 |
|
| Inventories | — |
| | 162 |
| | — |
| | 3,511 |
| | (200 | ) | | 3,473 |
|
| Intercompany receivable | 389 |
| | 161,868 |
| | — |
| | 162,278 |
| | (324,535 | ) | | — |
|
| Tax assets | — |
| | 122 |
| | — |
| | 575 |
| | — |
| | 697 |
|
| Prepaid expenses and other current assets | 24 |
| | 149 |
| | — |
| | 1,061 |
| | — |
| | 1,234 |
|
| Total current assets | 413 |
| | 162,356 |
| | — |
| | 185,566 |
| | (324,735 | ) | | 23,600 |
|
| Property, plant and equipment, net | — |
| | 1,139 |
| | — |
| | 3,702 |
| | — |
| | 4,841 |
|
| Goodwill | — |
| | — |
| | — |
| | 41,500 |
| | — |
| | 41,500 |
|
| Other intangible assets, net | — |
| | 31 |
| | — |
| | 26,868 |
| | — |
| | 26,899 |
|
| Long-term tax assets | — |
| | 690 |
| | — |
| | 693 |
| | — |
| | 1,383 |
|
| Investment in subsidiaries | 73,108 |
| | 63,806 |
| | 70,198 |
| | — |
| | (207,112 | ) | | — |
|
| Intercompany loans receivable | 3,000 |
| | 8,884 |
| | 10,203 |
| | 18,140 |
| | (40,227 | ) | | — |
|
| Other assets | — |
| | 644 |
| | — |
| | 915 |
| | — |
| | 1,559 |
|
| Total assets | $ | 76,521 |
| | $ | 237,550 |
| | $ | 80,401 |
| | $ | 277,384 |
| | $ | (572,074 | ) | | $ | 99,782 |
|
| LIABILITIES AND SHAREHOLDERS’ EQUITY | | | | | | | | | | | |
| Current liabilities: | | | | | | | | | | | |
| Short-term borrowings | $ | — |
| | $ | 500 |
| | $ | — |
| | $ | 493 |
| | $ | — |
| | $ | 993 |
|
| Accounts payable | — |
| | 288 |
| | — |
| | 1,421 |
| | — |
| | 1,709 |
|
| Intercompany payable | 20,486 |
| | 151,687 |
| | — |
| | 152,362 |
| | (324,535 | ) | | — |
|
| Accrued compensation | 32 |
| | 616 |
| | — |
| | 1,064 |
| | — |
| | 1,712 |
|
| Accrued income taxes | 11 |
| | — |
| | — |
| | 555 |
| | — |
| | 566 |
|
| Deferred tax liabilities | — |
| | — |
| | — |
| | — |
| | — |
| | — |
|
| Other accrued expenses | 1 |
| | 243 |
| | — |
| | 1,941 |
| | — |
| | 2,185 |
|
| Total current liabilities | 20,530 |
| | 153,334 |
| | — |
| | 157,836 |
| | (324,535 | ) | | 7,165 |
|
| Long-term debt | — |
| | 26,784 |
| | — |
| | 3,463 |
| | — |
| | 30,247 |
|
| Long-term accrued compensation and retirement benefits | — |
| | 1,258 |
| | — |
| | 501 |
| | — |
| | 1,759 |
|
| Long-term accrued income taxes | 10 |
| | 1,422 |
| | — |
| | 1,471 |
| | — |
| | 2,903 |
|
| Long-term intercompany loans payable | 3,918 |
| | 10,128 |
| | 14,297 |
| | 11,884 |
| | (40,227 | ) | | — |
|
| Long-term deferred tax liabilities | — |
| | — |
| | — |
| | 3,729 |
| | — |
| | 3,729 |
|
| Other long-term liabilities | — |
| | 202 |
| | — |
| | 1,714 |
| | — |
| | 1,916 |
|
| Total liabilities | 24,458 |
| | 193,128 |
| | 14,297 |
| | 180,598 |
| | (364,762 | ) | | 47,719 |
|
| Shareholders’ equity | 52,063 |
| | 44,422 |
| | 66,104 |
| | 96,786 |
| | (207,312 | ) | | 52,063 |
|
| Total liabilities and shareholders’ equity | $ | 76,521 |
| | $ | 237,550 |
| | $ | 80,401 |
| | $ | 277,384 |
| | $ | (572,074 | ) | | $ | 99,782 |
|
Medtronic plc
Notes to Consolidated Financial Statements (Continued)
Condensed Consolidating Balance Sheet
April 24, 2015
Medtronic Senior Notes
|
| | | | | | | | | | | | | | | | | | | | | | | |
| (in millions) | Parent Company Guarantor (Medtronic plc) | | Subsidiary Issuer (Medtronic, Inc.) | | Subsidiary Guarantors | | Subsidiary Non-guarantors | | Consolidating Adjustments | | Total |
| ASSETS | | | | | | | | | | | |
| Current assets: | | | | | | | | | | | |
| Cash and cash equivalents | $ | 263 |
| | $ | 1,071 |
| | $ | 170 |
| | $ | 3,339 |
| | $ | — |
| | $ | 4,843 |
|
| Investments | — |
| | — |
| | — |
| | 14,637 |
| | — |
| | 14,637 |
|
| Accounts receivable, net | — |
| | — |
| | — |
| | 5,112 |
| | — |
| | 5,112 |
|
| Inventories | — |
| | 165 |
| | — |
| | 3,497 |
| | (199 | ) | | 3,463 |
|
| Intercompany receivable | 259 |
| | 146,942 |
| | — |
| | 144,638 |
| | (291,839 | ) | | — |
|
| Tax assets | — |
| | 295 |
| | — |
| | 1,040 |
| | — |
| | 1,335 |
|
| Prepaid expenses and other current assets | 4 |
| | 128 |
| | — |
| | 1,322 |
| | — |
| | 1,454 |
|
| Total current assets | 526 |
| | 148,601 |
| | 170 |
| | 173,585 |
| | (292,038 | ) | | 30,844 |
|
| Property, plant and equipment, net | — |
| | 976 |
| | — |
| | 3,723 |
| | — |
| | 4,699 |
|
| Goodwill | — |
| | — |
| | — |
| | 40,530 |
| | — |
| | 40,530 |
|
| Other intangible assets, net | — |
| | 39 |
| | — |
| | 28,062 |
| | — |
| | 28,101 |
|
| Long-term tax assets | — |
| | 294 |
| | — |
| | 480 |
| | — |
| | 774 |
|
| Investment in subsidiaries | 70,233 |
| | 68,710 |
| | 63,063 |
| | — |
| | (202,006 | ) | | — |
|
| Intercompany loans receivable | 3,000 |
| | 6,516 |
| | 10,000 |
| | 10,218 |
| | (29,734 | ) | | — |
|
| Other assets | — |
| | 678 |
| | — |
| | 1,059 |
| | — |
| | 1,737 |
|
| Total assets | $ | 73,759 |
| | $ | 225,814 |
| | $ | 73,233 |
| | $ | 257,657 |
| | $ | (523,778 | ) | | $ | 106,685 |
|
| LIABILITIES AND SHAREHOLDERS’ EQUITY | | | | | | | | | | | |
| Current liabilities: | | | | | | | | | | | |
| Short-term borrowings | $ | — |
| | $ | 1,110 |
| | $ | — |
| | $ | 1,324 |
| | $ | — |
| | $ | 2,434 |
|
| Accounts payable | — |
| | 261 |
| | — |
| | 1,349 |
| | — |
| | 1,610 |
|
| Intercompany payable | 20,506 |
| | 135,660 |
| | — |
| | 135,673 |
| | (291,839 | ) | | — |
|
| Accrued compensation | 1 |
| | 490 |
| | — |
| | 1,120 |
| | — |
| | 1,611 |
|
| Accrued income taxes | 19 |
| | — |
| | — |
| | 916 |
| | — |
| | 935 |
|
| Deferred tax liabilities | 3 |
| | — |
| | — |
| | 116 |
| | — |
| | 119 |
|
| Other accrued expenses | — |
| | 628 |
| | — |
| | 1,836 |
| | — |
| | 2,464 |
|
| Total current liabilities | 20,529 |
| | 138,149 |
| | — |
| | 142,334 |
| | (291,839 | ) | | 9,173 |
|
| Long-term debt | — |
| | 29,004 |
| | — |
| | 4,748 |
| | — |
| | 33,752 |
|
| Long-term accrued compensation and retirement benefits | — |
| | 965 |
| | — |
| | 570 |
| | — |
| | 1,535 |
|
| Long-term accrued income taxes | — |
| | 1,048 |
| | — |
| | 1,428 |
| | — |
| | 2,476 |
|
| Long-term intercompany loans payable | — |
| | 10,218 |
| | 10,000 |
| | 9,516 |
| | (29,734 | ) | | — |
|
| Long-term deferred tax liabilities | — |
| | — |
| | — |
| | 4,700 |
| | — |
| | 4,700 |
|
| Other long-term liabilities | — |
| | 207 |
| | — |
| | 1,612 |
| | — |
| | 1,819 |
|
| Total liabilities | 20,529 |
| | 179,591 |
| | 10,000 |
| | 164,908 |
| | (321,573 | ) | | 53,455 |
|
| Shareholders’ equity | 53,230 |
| | 46,223 |
| | 63,233 |
| | 92,749 |
| | (202,205 | ) | | 53,230 |
|
| Total liabilities and shareholders’ equity | $ | 73,759 |
| | $ | 225,814 |
| | $ | 73,233 |
| | $ | 257,657 |
| | $ | (523,778 | ) | | $ | 106,685 |
|
Medtronic plc
Notes to Consolidated Financial Statements (Continued)
Condensed Consolidating Statement of Cash Flows
Fiscal Year Ended April 29, 2016
Medtronic Senior Notes
|
| | | | | | | | | | | | | | | | | | | | | | | |
| (in millions) | Parent Company Guarantor (Medtronic plc) | | Subsidiary Issuer (Medtronic, Inc.) | | Subsidiary Guarantors | | Subsidiary Non-guarantors | | Consolidating Adjustments | | Total |
| Operating Activities: | | | | | | | | | | | |
| Net cash provided by (used in) operating activities | $ | 297 |
| | $ | 402 |
| | $ | 696 |
| | $ | 4,635 |
| | $ | (812 | ) | | $ | 5,218 |
|
| Investing Activities: | | | | | | | | | | | |
| Acquisitions, net of cash acquired | — |
| | (526 | ) | | — |
| | (687 | ) | | — |
| | (1,213 | ) |
| Additions to property, plant, and equipment | — |
| | (334 | ) | | — |
| | (712 | ) | | — |
| | (1,046 | ) |
| Purchases of marketable securities | — |
| | — |
| | — |
| | (5,406 | ) | | — |
| | (5,406 | ) |
| Sales and maturities of marketable securities | — |
| | — |
| | — |
| | 9,924 |
| | — |
| | 9,924 |
|
| Net (increase) decrease in intercompany loans receivable | — |
| | (2,368 | ) | | (203 | ) | | (7,921 | ) | | 10,492 |
| | — |
|
| Capital contributions paid | — |
| | (11 | ) | | (4,959 | ) | | (4,900 | ) | | 9,870 |
| | — |
|
| Other investing activities, net | — |
| | — |
| | — |
| | (14 | ) | | — |
| | (14 | ) |
| Net cash provided by (used in) investing activities | — |
| | (3,239 | ) | | (5,162 | ) | | (9,716 | ) | | 20,362 |
| | 2,245 |
|
| Financing Activities: | | | | | | | | | | | |
| Acquisition-related contingent consideration | — |
| | — |
| | — |
| | (22 | ) | | — |
| | (22 | ) |
| Change in short-term borrowings, net | — |
| | — |
| | — |
| | 7 |
| | — |
| | 7 |
|
| Repayment of short-term borrowings (maturities greater than 90 days) | — |
| | — |
| | (139 | ) | | — |
| | — |
| | (139 | ) |
| Proceeds from short-term borrowings (maturities greater than 90 days) | — |
| | — |
| | 139 |
| | — |
| | — |
| | 139 |
|
| Issuance of long-term debt | — |
| | — |
| | — |
| | — |
| | — |
| | — |
|
| Payments on long-term debt | — |
| | (2,988 | ) | | — |
| | (2,144 | ) | | — |
| | (5,132 | ) |
| Dividends to shareholders | (2,139 | ) | | — |
| | — |
| | — |
| | — |
| | (2,139 | ) |
| Issuance of ordinary shares | 491 |
| | — |
| | — |
| | — |
| | — |
| | 491 |
|
| Repurchase of ordinary shares | (2,830 | ) | | — |
| | — |
| | — |
| | — |
| | (2,830 | ) |
| Net intercompany loan borrowings (repayments) | 3,918 |
| | (91 | ) | | 4,296 |
| | 2,369 |
| | (10,492 | ) | | — |
|
| Intercompany dividend paid | — |
| | — |
| | — |
| | (812 | ) | | 812 |
| | — |
|
| Capital contributions received | — |
| | 4,900 |
| | — |
| | 4,970 |
| | (9,870 | ) | | — |
|
| Other financing activities | — |
| | — |
| | — |
| | 82 |
| | — |
| | 82 |
|
| Net cash provided by (used in) financing activities | (560 | ) | | 1,821 |
| | 4,296 |
| | 4,450 |
| | (19,550 | ) | | (9,543 | ) |
| Effect of exchange rate changes on cash and cash equivalents | — |
| | — |
| | — |
| | 113 |
| | — |
| | 113 |
|
| Net change in cash and cash equivalents | (263 | ) | | (1,016 | ) | | (170 | ) | | (518 | ) | | — |
| | (1,967 | ) |
| Cash and cash equivalents at beginning of period | 263 |
| | 1,071 |
| | 170 |
| | 3,339 |
| | — |
| | 4,843 |
|
| Cash and cash equivalents at end of period | $ | — |
| | $ | 55 |
| | $ | — |
| | $ | 2,821 |
| | $ | — |
| | $ | 2,876 |
|
Medtronic plc
Notes to Consolidated Financial Statements (Continued)
Condensed Consolidating Statement of Cash Flows
Fiscal Year Ended April 24, 2015
Medtronic Senior Notes
|
| | | | | | | | | | | | | | | | | | | | | | | |
| (in millions) | Parent Company Guarantor (Medtronic plc) | | Subsidiary Issuer (Medtronic, Inc.) | | Subsidiary Guarantors | | Subsidiary Non-guarantors | | Consolidating Adjustments | | Total |
| Operating Activities: | | | | | | | | | | | |
| Net cash provided by (used in) operating activities | $ | 26 |
| | $ | 1,479 |
| | $ | 170 |
| | $ | 3,640 |
| | $ | (413 | ) | | $ | 4,902 |
|
| Investing Activities: | | | | | | | | | | | |
| Acquisitions, net of cash acquired | (9,700 | ) | | (65 | ) | | — |
| | (5,119 | ) | | — |
| | (14,884 | ) |
| Additions to property, plant, and equipment | — |
| | (187 | ) | | — |
| | (384 | ) | | — |
| | (571 | ) |
| Purchases of marketable securities | — |
| | — |
| | — |
| | (7,582 | ) | | — |
| | (7,582 | ) |
| Sales and maturities of marketable securities | — |
| | — |
| | — |
| | 5,890 |
| | — |
| | 5,890 |
|
| Net (increase) decrease in intercompany loans receivable | — |
| | (16,996 | ) | | — |
| | 53 |
| | 16,943 |
| | — |
|
| Other investing activities, net | — |
| | — |
| | — |
| | 89 |
| | — |
| | 89 |
|
| Net cash provided by (used in) investing activities | (9,700 | ) | | (17,248 | ) | | — |
| | (7,053 | ) | | 16,943 |
| | (17,058 | ) |
| Financing Activities: | | | | | | | | | | | |
| Acquisition-related contingent consideration | — |
| | — |
| | — |
| | (85 | ) | | — |
| | (85 | ) |
| Change in short-term borrowings, net | — |
| | — |
| | — |
| | (1 | ) | | — |
| | (1 | ) |
| Repayment of short-term borrowings (maturities greater than 90 days) | — |
| | (150 | ) | | — |
| | — |
| | — |
| | (150 | ) |
| Proceeds from short-term borrowings (maturities greater than 90 days) | — |
| | 150 |
| | — |
| | — |
| | — |
| | 150 |
|
| Issuance of long-term debt | — |
| | 19,942 |
| | — |
| | — |
| | — |
| | 19,942 |
|
| Payments on long-term debt | — |
| | (1,268 | ) | | — |
| | — |
| | — |
| | (1,268 | ) |
| Dividends to shareholders | (435 | ) | | (902 | ) | | — |
| | — |
| | — |
| | (1,337 | ) |
| Issuance of ordinary shares | 172 |
| | 477 |
| | — |
| | — |
| | — |
| | 649 |
|
| Repurchase of ordinary shares | (300 | ) | | (1,620 | ) | | — |
| | — |
| | — |
| | (1,920 | ) |
| Net intercompany loan borrowings (repayments) | 10,500 |
| | (53 | ) | | — |
| | 6,496 |
| | (16,943 | ) | | — |
|
| Intercompany dividends paid | — |
| | — |
| | — |
| | (413 | ) | | 413 |
| | — |
|
| Other financing activities | — |
| | — |
| | — |
| | (31 | ) | | — |
| | (31 | ) |
| Net cash provided by (used in) financing activities | 9,937 |
| | 16,576 |
| | — |
| | 5,966 |
| | (16,530 | ) | | 15,949 |
|
| Effect of exchange rate changes on cash and cash equivalents | — |
| | — |
| | — |
| | (353 | ) | | — |
| | (353 | ) |
| Net change in cash and cash equivalents | 263 |
| | 807 |
| | 170 |
| | 2,200 |
| | — |
| | 3,440 |
|
| Cash and cash equivalents at beginning of period | — |
| | 264 |
| | — |
| | 1,139 |
| | — |
| | 1,403 |
|
| Cash and cash equivalents at end of period | $ | 263 |
| | $ | 1,071 |
| | $ | 170 |
| | $ | 3,339 |
| | $ | — |
| | $ | 4,843 |
|
Medtronic plc
Notes to Consolidated Financial Statements (Continued)
Condensed Consolidating Statement of Cash Flows
Fiscal Year Ended April 25, 2014
Medtronic Senior Notes
|
| | | | | | | | | | | | | | | | | | | | | | | |
| (in millions) | Parent Company Guarantor (Medtronic plc) | | Subsidiary Issuer (Medtronic, Inc.) | | Subsidiary Guarantors | | Subsidiary Non-guarantors | | Consolidating Adjustments | | Total |
| Operating Activities: | | | | | | | | | | | |
| Net cash provided by (used in) operating activities | $ | — |
| | $ | 1,384 |
| | $ | — |
| | $ | 3,949 |
| | $ | (374 | ) | | $ | 4,959 |
|
| Investing Activities: | | | | | | | | | | | |
| Acquisitions, net of cash acquired | — |
| | — |
| | — |
| | (385 | ) | | — |
| | (385 | ) |
| Additions to property, plant, and equipment | — |
| | (154 | ) | | — |
| | (242 | ) | | — |
| | (396 | ) |
| Purchases of marketable securities | — |
| | — |
| | — |
| | (10,895 | ) | | — |
| | (10,895 | ) |
| Sales and maturities of marketable securities | — |
| | — |
| | — |
| | 8,111 |
| | — |
| | 8,111 |
|
| Net (increase) decrease in intercompany loans receivable | — |
| | 1 |
| | — |
| | (12 | ) | | 11 |
| | — |
|
| Other investing activities, net | — |
| | — |
| | — |
| | (29 | ) | | — |
| | (29 | ) |
| Net cash provided by (used in) investing activities | — |
| | (153 | ) | | — |
| | (3,452 | ) | | 11 |
| | (3,594 | ) |
| Financing Activities: | | | | | | | | | | | |
| Acquisition-related contingent consideration | — |
| | — |
| | — |
| | (1 | ) | | — |
| | (1 | ) |
| Change in short-term borrowings, net | — |
| | — |
| | — |
| | 127 |
| | — |
| | 127 |
|
| Repayment of short-term borrowings (maturities greater than 90 days) | — |
| | (1,301 | ) | | — |
| | — |
| | — |
| | (1,301 | ) |
| Proceeds from short-term borrowings (maturities greater than 90 days) | — |
| | 1,045 |
| | — |
| | 131 |
| | — |
| | 1,176 |
|
| Issuance of long-term debt | — |
| | 1,994 |
| | — |
| | — |
| | — |
| | 1,994 |
|
| Payments on long-term debt | — |
| | (565 | ) | | — |
| | — |
| | — |
| | (565 | ) |
| Dividends to shareholders | — |
| | (1,116 | ) | | — |
| | — |
| | — |
| | (1,116 | ) |
| Issuance of ordinary shares | — |
| | 1,307 |
| | — |
| | — |
| | — |
| | 1,307 |
|
| Repurchase of ordinary shares | — |
| | (2,553 | ) | | — |
| | — |
| | — |
| | (2,553 | ) |
| Net intercompany loan borrowings (repayments) | — |
| | 12 |
| | — |
| | (1 | ) | | (11 | ) | | — |
|
| Intercompany dividends paid | — |
| | — |
| | — |
| | (374 | ) | | 374 |
| | — |
|
| Other financing activities | — |
| | 14 |
| | — |
| | — |
| | — |
| | 14 |
|
| Net cash provided by (used in) financing activities | — |
| | (1,163 | ) | | — |
| | (118 | ) | | 363 |
| | (918 | ) |
| Effect of exchange rate changes on cash and cash equivalents | — |
| | — |
| | — |
| | 37 |
| | — |
| | 37 |
|
| Net change in cash and cash equivalents | — |
| | 68 |
| | — |
| | 416 |
| | — |
| | 484 |
|
| Cash and cash equivalents at beginning of period | — |
| | 196 |
| | — |
| | 723 |
| | — |
| | 919 |
|
| Cash and cash equivalents at end of period | $ | — |
| | $ | 264 |
| | $ | — |
| | $ | 1,139 |
| | $ | — |
| | $ | 1,403 |
|
Medtronic plc
Notes to Consolidated Financial Statements (Continued)
Consolidating Statement of Comprehensive Income
Fiscal Year Ended April 29, 2016
CIFSA Senior Notes
|
| | | | | | | | | | | | | | | | | | | | | | | |
| (in millions) | Parent Company Guarantor (Medtronic plc) | | Subsidiary Issuer (CIFSA) | | Subsidiary Guarantors | | Subsidiary Non-guarantors | | Consolidating Adjustments | | Total |
| Net sales | $ | — |
| | $ | — |
| | $ | — |
| | $ | 28,833 |
| | $ | — |
| | $ | 28,833 |
|
| | | | | | | | | | | | |
| Costs and expenses: | | | | | | | | | | | |
| Cost of products sold | — |
| | — |
| | — |
| | 9,142 |
| | — |
| | 9,142 |
|
| Research and development expense | — |
| | — |
| | — |
| | 2,224 |
| | — |
| | 2,224 |
|
| Selling, general, and administrative expense | 10 |
| | 1 |
| | 3 |
| | 9,455 |
| | — |
| | 9,469 |
|
| Special (gains) charges, net | — |
| | — |
| | — |
| | 70 |
| | — |
| | 70 |
|
| Restructuring charges, net | — |
| | — |
| | — |
| | 290 |
| | — |
| | 290 |
|
| Certain litigation charges, net | — |
| | — |
| | — |
| | 26 |
| | — |
| | 26 |
|
| Acquisition-related items | — |
| | — |
| | — |
| | 283 |
| | — |
| | 283 |
|
| Amortization of intangible assets | — |
| | — |
| | — |
| | 1,931 |
| | — |
| | 1,931 |
|
| Other (income) expense, net | 112 |
| | 1 |
| | (18 | ) | | 12 |
| | — |
| | 107 |
|
| Operating profit (loss) | (122 | ) | | (2 | ) | | 15 |
| | 5,400 |
| | — |
| | 5,291 |
|
| | | | | | | | | | | | |
| Interest income | — |
| | (434 | ) | | (710 | ) | | (451 | ) | | 1,164 |
| | (431 | ) |
| Interest expense | 25 |
| | 138 |
| | 10 |
| | 2,377 |
| | (1,164 | ) | | 1,386 |
|
| Interest (income) expense, net | 25 |
| | (296 | ) | | (700 | ) | | 1,926 |
| | — |
| | 955 |
|
| Equity in net (income) loss of subsidiaries | (3,676 | ) | | (8,563 | ) | | (2,961 | ) | | — |
| | 15,200 |
| | — |
|
| Income (loss) from operations before income taxes | 3,529 |
| | 8,857 |
| | 3,676 |
| | 3,474 |
| | (15,200 | ) | | 4,336 |
|
| Provision (benefit) for income taxes | (9 | ) | | — |
| | — |
| | 807 |
| | — |
| | 798 |
|
| Net income (loss) | 3,538 |
| | 8,857 |
| | 3,676 |
| | 2,667 |
| | (15,200 | ) | | 3,538 |
|
| Other comprehensive income (loss), net of tax | (684 | ) | | (102 | ) | | (684 | ) | | (684 | ) | | 1,470 |
| | (684 | ) |
| Total comprehensive income (loss) | $ | 2,854 |
| | $ | 8,755 |
| | $ | 2,992 |
| | $ | 1,983 |
| | $ | (13,730 | ) | | $ | 2,854 |
|
Medtronic plc
Notes to Consolidated Financial Statements (Continued)
Consolidating Statement of Comprehensive Income
Fiscal Year Ended April 24, 2015
CIFSA Senior Notes
|
| | | | | | | | | | | | | | | | | | | | | | | |
| (in millions) | Parent Company Guarantor (Medtronic plc) | | Subsidiary Issuer (CIFSA) | | Subsidiary Guarantors | | Subsidiary Non-guarantors | | Consolidating Adjustments | | Total |
| Net sales | $ | — |
| | $ | — |
| | $ | — |
| | $ | 20,261 |
| | $ | — |
| | $ | 20,261 |
|
| | | | | | | | | | | | |
| Costs and expenses: | | | | | | | | | | | |
| Cost of products sold | — |
| | — |
| | — |
| | 6,309 |
| | — |
| | 6,309 |
|
| Research and development expense | — |
| | — |
| | — |
| | 1,640 |
| | — |
| | 1,640 |
|
| Selling, general, and administrative expense | 1 |
| | — |
| | 21 |
| | 6,882 |
| | — |
| | 6,904 |
|
| Special (gains) charges, net | — |
| | — |
| | — |
| | (38 | ) | | — |
| | (38 | ) |
| Restructuring charges, net | — |
| | — |
| | — |
| | 237 |
| | — |
| | 237 |
|
| Certain litigation charges, net | — |
| | — |
| | — |
| | 42 |
| | — |
| | 42 |
|
| Acquisition-related items | — |
| | — |
| | — |
| | 550 |
| | — |
| | 550 |
|
| Amortization of intangible assets | — |
| | — |
| | — |
| | 733 |
| | — |
| | 733 |
|
| Other (income) expense, net | 103 |
| | — |
| | 26 |
| | (11 | ) | | — |
| | 118 |
|
| Operating profit (loss) | (104 | ) | | — |
| | (47 | ) | | 3,917 |
| | — |
| | 3,766 |
|
| | | | | | | | | | | | |
| Interest income | — |
| | (149 | ) | | (170 | ) | | (386 | ) | | 319 |
| | (386 | ) |
| Interest expense | — |
| | 29 |
| | — |
| | 956 |
| | (319 | ) | | 666 |
|
| Interest (income) expense, net | — |
| | (120 | ) | | (170 | ) | | 570 |
| | — |
| | 280 |
|
| Equity in net (income) loss of subsidiaries | (2,790 | ) | | 1,412 |
| | (2,667 | ) | | — |
| | 4,045 |
| | — |
|
| Income (loss) from operations before income taxes | 2,686 |
| | (1,292 | ) | | 2,790 |
| | 3,347 |
| | (4,045 | ) | | 3,486 |
|
| Provision (benefit) for income taxes | 11 |
| | — |
| | — |
| | 800 |
| | — |
| | 811 |
|
| Net income (loss) | 2,675 |
| | (1,292 | ) | | 2,790 |
| | 2,547 |
| | (4,045 | ) | | 2,675 |
|
| Other comprehensive income (loss), net of tax | (587 | ) | | 200 |
| | (587 | ) | | (587 | ) | | 974 |
| | (587 | ) |
| Total comprehensive income (loss) | $ | 2,088 |
| | $ | (1,092 | ) | | $ | 2,203 |
| | $ | 1,960 |
| | $ | (3,071 | ) | | $ | 2,088 |
|
Medtronic plc
Notes to Consolidated Financial Statements (Continued)
Condensed Consolidating Balance Sheet
April 29, 2016
CIFSA Senior Notes
|
| | | | | | | | | | | | | | | | | | | | | | | |
| (in millions) | Parent Company Guarantor (Medtronic plc) | | Subsidiary Issuer (CIFSA) | | Subsidiary Guarantors | | Subsidiary Non-guarantors | | Consolidating Adjustments | | Total |
| ASSETS | | | | | | | | | | | |
| Current assets: | | | | | | | | | | | |
| Cash and cash equivalents | $ | — |
| | $ | 208 |
| | $ | — |
| | $ | 2,668 |
| | $ | — |
| | $ | 2,876 |
|
| Investments | — |
| | — |
| | — |
| | 9,758 |
| | — |
| | 9,758 |
|
| Accounts receivable, net | — |
| | — |
| | — |
| | 5,562 |
| | — |
| | 5,562 |
|
| Inventories | — |
| | — |
| | — |
| | 3,473 |
| | — |
| | 3,473 |
|
| Intercompany receivable | 389 |
| | — |
| | 61 |
| | 20,469 |
| | (20,919 | ) | | — |
|
| Tax assets | — |
| | — |
| | — |
| | 697 |
| | — |
| | 697 |
|
| Prepaid expenses and other current assets | 24 |
| | — |
| | — |
| | 1,210 |
| | — |
| | 1,234 |
|
| Total current assets | 413 |
| | 208 |
| | 61 |
| | 43,837 |
| | (20,919 | ) | | 23,600 |
|
| Property, plant and equipment, net | — |
| | — |
| | 1 |
| | 4,840 |
| | — |
| | 4,841 |
|
| Goodwill | — |
| | — |
| | — |
| | 41,500 |
| | — |
| | 41,500 |
|
| Other intangible assets, net | — |
| | — |
| | — |
| | 26,899 |
| | — |
| | 26,899 |
|
| Long-term tax assets | — |
| | — |
| | — |
| | 1,383 |
| | — |
| | 1,383 |
|
| Investment in subsidiaries | 73,108 |
| | 41,582 |
| | 68,875 |
| | — |
| | (183,565 | ) | | — |
|
| Intercompany loans receivable | 3,000 |
| | 8,253 |
| | 11,465 |
| | 27,724 |
| | (50,442 | ) | | — |
|
| Other assets | — |
| | — |
| | — |
| | 1,559 |
| | — |
| | 1,559 |
|
| Total assets | $ | 76,521 |
| | $ | 50,043 |
| | $ | 80,402 |
| | $ | 147,742 |
| | $ | (254,926 | ) | | $ | 99,782 |
|
| LIABILITIES AND SHAREHOLDERS’ EQUITY | | | | | | | | | | | |
| Current liabilities: | | | | | | | | | | | |
| Short-term borrowings | $ | — |
| | $ | — |
| | $ | — |
| | $ | 993 |
| | $ | — |
| | $ | 993 |
|
| Accounts payable | — |
| | — |
| | — |
| | 1,709 |
| | — |
| | 1,709 |
|
| Intercompany payable | 20,486 |
| | — |
| | — |
| | 433 |
| | (20,919 | ) | | — |
|
| Accrued compensation | 32 |
| | — |
| | — |
| | 1,680 |
| | — |
| | 1,712 |
|
| Accrued income taxes | 11 |
| | — |
| | — |
| | 555 |
| | — |
| | 566 |
|
| Deferred tax liabilities | — |
| | — |
| | — |
| | — |
| | — |
| | — |
|
| Other accrued expenses | 1 |
| | 24 |
| | — |
| | 2,160 |
| | — |
| | 2,185 |
|
| Total current liabilities | 20,530 |
| | 24 |
| | — |
| | 7,530 |
| | (20,919 | ) | | 7,165 |
|
| Long-term debt | — |
| | 3,382 |
| | — |
| | 26,865 |
| | — |
| | 30,247 |
|
| Long-term accrued compensation and retirement benefits | — |
| | — |
| | — |
| | 1,759 |
| | — |
| | 1,759 |
|
| Long-term accrued income taxes | 10 |
| | — |
| | — |
| | 2,893 |
| | — |
| | 2,903 |
|
| Long-term intercompany loans payable | 3,918 |
| | 14,689 |
| | 14,298 |
| | 17,537 |
| | (50,442 | ) | | — |
|
| Long-term deferred tax liabilities | — |
| | — |
| | — |
| | 3,729 |
| | — |
| | 3,729 |
|
| Other long-term liabilities | — |
| | — |
| | — |
| | 1,916 |
| | — |
| | 1,916 |
|
| Total liabilities | 24,458 |
| | 18,095 |
| | 14,298 |
| | 62,229 |
| | (71,361 | ) | | 47,719 |
|
| Shareholders’ equity | 52,063 |
| | 31,948 |
| | 66,104 |
| | 85,513 |
| | (183,565 | ) | | 52,063 |
|
| Total liabilities and shareholders’ equity | $ | 76,521 |
| | $ | 50,043 |
| | $ | 80,402 |
| | $ | 147,742 |
| | $ | (254,926 | ) | | $ | 99,782 |
|
Medtronic plc
Notes to Consolidated Financial Statements (Continued)
Condensed Consolidating Balance Sheet
April 24, 2015
CIFSA Senior Notes
|
| | | | | | | | | | | | | | | | | | | | | | | |
| (in millions) | Parent Company Guarantor (Medtronic plc) | | Subsidiary Issuer (CIFSA) | | Subsidiary Guarantors | | Subsidiary Non-guarantors | | Consolidating Adjustments | | Total |
| ASSETS | | | | | | | | | | | |
| Current assets: | | | | | | | | | | | |
| Cash and cash equivalents | $ | 263 |
| | $ | 728 |
| | $ | 170 |
| | $ | 3,682 |
| | $ | — |
| | $ | 4,843 |
|
| Investments | — |
| | — |
| | — |
| | 14,637 |
| | — |
| | 14,637 |
|
| Accounts receivable, net | — |
| | — |
| | — |
| | 5,112 |
| | — |
| | 5,112 |
|
| Inventories | — |
| | — |
| | — |
| | 3,463 |
| | — |
| | 3,463 |
|
| Intercompany receivable | 259 |
| | — |
| | 269 |
| | 20,506 |
| | (21,034 | ) | | — |
|
| Tax assets | — |
| | — |
| | — |
| | 1,335 |
| | — |
| | 1,335 |
|
| Prepaid expenses and other current assets | 4 |
| | — |
| | 6 |
| | 1,444 |
| | — |
| | 1,454 |
|
| Total current assets | 526 |
| | 728 |
| | 445 |
| | 50,179 |
| | (21,034 | ) | | 30,844 |
|
| Property, plant and equipment, net | — |
| | — |
| | 1 |
| | 4,698 |
| | — |
| | 4,699 |
|
| Goodwill | — |
| | — |
| | — |
| | 40,530 |
| | — |
| | 40,530 |
|
| Other intangible assets, net | — |
| | — |
| | — |
| | 28,101 |
| | — |
| | 28,101 |
|
| Long-term tax assets | — |
| | — |
| | — |
| | 774 |
| | — |
| | 774 |
|
| Investment in subsidiaries | 70,233 |
| | 28,663 |
| | 61,768 |
| | — |
| | (160,664 | ) | | — |
|
| Intercompany loans receivable | 3,000 |
| | 7,401 |
| | 11,303 |
| | 17,082 |
| | (38,786 | ) | | — |
|
| Other assets | — |
| | — |
| | — |
| | 1,737 |
| | — |
| | 1,737 |
|
| Total assets | $ | 73,759 |
| | $ | 36,792 |
| | $ | 73,517 |
| | $ | 143,101 |
| | $ | (220,484 | ) | | $ | 106,685 |
|
| LIABILITIES AND SHAREHOLDERS’ EQUITY | | | | | | | | | | | |
| Current liabilities: | | | | | | | | | | | |
| Short-term borrowings | $ | — |
| | $ | 1,002 |
| | $ | — |
| | $ | 1,432 |
| | $ | — |
| | $ | 2,434 |
|
| Accounts payable | — |
| | — |
| | 2 |
| | 1,608 |
| | — |
| | 1,610 |
|
| Intercompany payable | 20,506 |
| | — |
| | 279 |
| | 249 |
| | (21,034 | ) | | — |
|
| Accrued compensation | 1 |
| | — |
| | — |
| | 1,610 |
| | — |
| | 1,611 |
|
| Accrued income taxes | 19 |
| | — |
| | — |
| | 916 |
| | — |
| | 935 |
|
| Deferred tax liabilities | 3 |
| | — |
| | — |
| | 116 |
| | — |
| | 119 |
|
| Other accrued expenses | — |
| | 40 |
| | 1 |
| | 2,423 |
| | — |
| | 2,464 |
|
| Total current liabilities | 20,529 |
| | 1,042 |
| | 282 |
| | 8,354 |
| | (21,034 | ) | | 9,173 |
|
| Long-term debt | — |
| | 4,581 |
| | — |
| | 29,171 |
| | — |
| | 33,752 |
|
| Long-term accrued compensation and retirement benefits | — |
| | — |
| | — |
| | 1,535 |
| | — |
| | 1,535 |
|
| Long-term accrued income taxes | — |
| | — |
| | — |
| | 2,476 |
| | — |
| | 2,476 |
|
| Long-term intercompany loans payable | — |
| | 8,385 |
| | 10,002 |
| | 20,399 |
| | (38,786 | ) | | — |
|
| Long-term deferred tax liabilities | — |
| | — |
| | — |
| | 4,700 |
| | — |
| | 4,700 |
|
| Other long-term liabilities | — |
| | — |
| | — |
| | 1,819 |
| | — |
| | 1,819 |
|
| Total liabilities | 20,529 |
| | 14,008 |
| | 10,284 |
| | 68,454 |
| | (59,820 | ) | | 53,455 |
|
| Shareholders’ equity | 53,230 |
| | 22,784 |
| | 63,233 |
| | 74,647 |
| | (160,664 | ) | | 53,230 |
|
| Total liabilities and shareholders’ equity | $ | 73,759 |
| | $ | 36,792 |
| | $ | 73,517 |
| | $ | 143,101 |
| | $ | (220,484 | ) | | $ | 106,685 |
|
Medtronic plc
Notes to Consolidated Financial Statements (Continued)
Condensed Consolidating Statement of Cash Flows
Fiscal Year Ended April 29, 2016
CIFSA Senior Notes
|
| | | | | | | | | | | | | | | | | | | | | | | |
| (in millions) | Parent Company Guarantor (Medtronic plc) | | Subsidiary Issuer (CIFSA) | | Subsidiary Guarantors | | Subsidiary Non-guarantors | | Consolidating Adjustments | | Total |
| Operating Activities: | | | | | | | | | | | |
| Net cash provided by (used in) operating activities | $ | 297 |
| | $ | 4,208 |
| | $ | 604 |
| | $ | 4,114 |
| | $ | (4,005 | ) | | $ | 5,218 |
|
| Investing Activities: | | | | | | | | | | | |
| Acquisitions, net of cash acquired | — |
| | — |
| | — |
| | (1,266 | ) | | 53 |
| | (1,213 | ) |
| Additions to property, plant, and equipment | — |
| | — |
| | — |
| | (1,046 | ) | | — |
| | (1,046 | ) |
| Purchases of marketable securities | — |
| | — |
| | — |
| | (5,406 | ) | | — |
| | (5,406 | ) |
| Sales and maturities of marketable securities | — |
| | — |
| | — |
| | 9,924 |
| | — |
| | 9,924 |
|
| Net (increase) decrease in intercompany loans receivable | — |
| | (8,193 | ) | | (164 | ) | | (3,302 | ) | | 11,659 |
| | — |
|
| Sales of subsidiaries | — |
| | — |
| | 53 |
| | — |
| | (53 | ) | | — |
|
| Capital contributions paid | — |
| | (720 | ) | | (4,959 | ) | | — |
| | 5,679 |
| | — |
|
| Other investing activities, net | — |
| | — |
| | — |
| | (14 | ) | | — |
| | (14 | ) |
| Net cash provided by (used in) investing activities | — |
| | (8,913 | ) | | (5,070 | ) | | (1,110 | ) | | 17,338 |
| | 2,245 |
|
| Financing Activities: | | | | | | | | | | | |
| Acquisition-related contingent consideration | — |
| | — |
| | — |
| | (22 | ) | | — |
| | (22 | ) |
| Change in short-term borrowings, net | — |
| | — |
| | — |
| | 7 |
| | — |
| | 7 |
|
| Repayment of short-term borrowings (maturities greater than 90 days) | — |
| | — |
| | (139 | ) | | — |
| | — |
| | (139 | ) |
| Proceeds from short-term borrowings (maturities greater than 90 days) | — |
| | — |
| | 139 |
| | — |
| | — |
| | 139 |
|
| Issuance of long-term debt | — |
| | — |
| | — |
| | — |
| | — |
| | — |
|
| Payments on long-term debt | — |
| | (2,121 | ) | | — |
| | (3,011 | ) | | — |
| | (5,132 | ) |
| Dividends to shareholders | (2,139 | ) | | — |
| | — |
| | — |
| | — |
| | (2,139 | ) |
| Issuance of ordinary shares | 491 |
| | — |
| | — |
| | — |
| | — |
| | 491 |
|
| Repurchase of ordinary shares | (2,830 | ) | | — |
| | — |
| | — |
| | — |
| | (2,830 | ) |
| Net intercompany loan borrowings (repayments) | 3,918 |
| | 6,306 |
| | 4,296 |
| | (2,861 | ) | | (11,659 | ) | | — |
|
| Intercompany dividend paid | — |
| | — |
| | — |
| | (4,005 | ) | | 4,005 |
| | — |
|
| Capital Contributions received | — |
| | — |
| | — |
| | 5,679 |
| | (5,679 | ) | | — |
|
| Other financing activities | — |
| | — |
| | — |
| | 82 |
| | — |
| | 82 |
|
| Net cash provided by (used in) financing activities | (560 | ) | | 4,185 |
| | 4,296 |
| | (4,131 | ) | | (13,333 | ) | | (9,543 | ) |
| Effect of exchange rate changes on cash and cash equivalents | — |
| | — |
| | — |
| | 113 |
| | — |
| | 113 |
|
| Net change in cash and cash equivalents | (263 | ) | | (520 | ) | | (170 | ) | | (1,014 | ) | | — |
| | (1,967 | ) |
| Cash and cash equivalents at beginning of period | 263 |
| | 728 |
| | 170 |
| | 3,682 |
| | — |
| | 4,843 |
|
| Cash and cash equivalents at end of period | $ | — |
| | $ | 208 |
| | $ | — |
| | $ | 2,668 |
| | $ | — |
| | $ | 2,876 |
|
Medtronic plc
Notes to Consolidated Financial Statements (Continued)
Condensed Consolidating Statement of Cash Flows
Fiscal Year Ended April 24, 2015
CIFSA Senior Notes
|
| | | | | | | | | | | | | | | | | | | | | | | |
| (in millions) | Parent Company Guarantor (Medtronic plc) | | Subsidiary Issuer (CIFSA) | | Subsidiary Guarantors | | Subsidiary Non-guarantors | | Consolidating Adjustments | | Total |
| Operating Activities: | | | | | | | | | | | |
| Net cash provided by (used in) operating activities | $ | 26 |
| | $ | 1,238 |
| | $ | 142 |
| | $ | 4,596 |
| | $ | (1,100 | ) | | $ | 4,902 |
|
| Investing Activities: | | | | | | | | | | | |
| Acquisitions, net of cash acquired | (9,700 | ) | | 440 |
| | — |
| | (5,624 | ) | | — |
| | (14,884 | ) |
| Additions to property, plant, and equipment | — |
| | — |
| | (1 | ) | | (570 | ) | | — |
| | (571 | ) |
| Purchases of marketable securities | — |
| | — |
| | — |
| | (7,582 | ) | | — |
| | (7,582 | ) |
| Sales and maturities of marketable securities | — |
| | — |
| | — |
| | 5,890 |
| | — |
| | 5,890 |
|
| Net (increase) decrease in intercompany loans receivable | — |
| | (59 | ) | | 29 |
| | (10,626 | ) | | 10,656 |
| | — |
|
| Capital contributions paid | — |
| | (937 | ) | | — |
| | — |
| | 937 |
| | — |
|
| Other investing activities, net | — |
| | — |
| | — |
| | 89 |
| | — |
| | 89 |
|
| Net cash provided by (used in) investing activities | (9,700 | ) | | (556 | ) | | 28 |
| | (18,423 | ) | | 11,593 |
| | (17,058 | ) |
| Financing Activities: | | | | | | | | | | | |
| Acquisition-related contingent consideration | — |
| | — |
| | — |
| | (85 | ) | | — |
| | (85 | ) |
| Change in short-term borrowings, net | — |
| | — |
| | — |
| | (1 | ) | | — |
| | (1 | ) |
| Repayment of short-term borrowings (maturities greater than 90 days) | — |
| | — |
| | (150 | ) | | — |
| | — |
| | (150 | ) |
| Proceeds from short-term borrowings (maturities greater than 90 days) | — |
| | — |
| | 150 |
| | — |
| | — |
| | 150 |
|
| Issuance of long-term debt | — |
| | — |
| | — |
| | 19,942 |
| | — |
| | 19,942 |
|
| Payments on long-term debt | — |
| | (51 | ) | | — |
| | (1,217 | ) | | — |
| | (1,268 | ) |
| Dividends to shareholders | (435 | ) | | — |
| | — |
| | (902 | ) | | — |
| | (1,337 | ) |
| Issuance of ordinary shares | 172 |
| | — |
| | — |
| | 477 |
| | — |
| | 649 |
|
| Repurchase of ordinary shares | (300 | ) | | — |
| | — |
| | (1,620 | ) | | — |
| | (1,920 | ) |
| Net intercompany loan borrowings (repayments) | 10,500 |
| | 97 |
| | — |
| | 59 |
| | (10,656 | ) | | — |
|
| Intercompany dividend paid | — |
| | — |
| | — |
| | (1,100 | ) | | 1,100 |
| | — |
|
| Capital contributions received | — |
| | — |
| | — |
| | 937 |
| | (937 | ) | | — |
|
| Other financing activities | — |
| | — |
| | — |
| | (31 | ) | | — |
| | (31 | ) |
| Net cash provided by (used in) financing activities | 9,937 |
| | 46 |
| | — |
| | 16,459 |
| | (10,493 | ) | | 15,949 |
|
| Effect of exchange rate changes on cash and cash equivalents | — |
| | — |
| | — |
| | (353 | ) | | — |
| | (353 | ) |
| Net change in cash and cash equivalents | 263 |
| | 728 |
| | 170 |
| | 2,279 |
| | — |
| | 3,440 |
|
| Cash and cash equivalents at beginning of period | — |
| | — |
| | — |
| | 1,403 |
| | — |
| | 1,403 |
|
| Cash and cash equivalents at end of period | $ | 263 |
| | $ | 728 |
| | $ | 170 |
| | $ | 3,682 |
| | $ | — |
| | $ | 4,843 |
|
Item 9. Changes in and Disagreements with Accountants on Accounting and Financial Disclosure
Not applicable.
Item 9A. Controls and Procedures
Disclosure Controls and Procedures
Our management, with the participation of our Chief Executive Officer and Chief Financial Officer, has evaluated the effectiveness of the design and operation of our disclosure controls and procedures (as defined in Rule 13a-15(e) under the Securities Exchange Act of 1934, as amended (the Exchange Act)) and changes in the Company’s internal control over financial reporting (as defined in Rule 13a-15(f) under the Exchange Act) as of the end of the period covered by this report. Based upon that evaluation, the Chief Executive Officer and Chief Financial Officer have concluded that, as of the end of the period covered by this annual report, our disclosure controls and procedures (as defined in Rule 13a-15(e) of the Exchange Act) are effective.
Management’s Annual Report on Internal Control Over Financial Reporting
Management is responsible for establishing and maintaining adequate internal control over financial reporting for the Company (as defined in Exchange Act Rule 13a-15(f)). Management conducted an evaluation of the effectiveness of internal control over financial reporting based on the framework in Internal Control – Integrated Framework (2013) issued by the Committee of Sponsoring Organizations of the Treadway Commission (COSO). Based on this evaluation, management concluded that the Company’s internal control over financial reporting was effective as of April 29, 2016. Our2022. The effectiveness of the Company's internal control over financial reporting as of April 29, 2016,2022 has been audited by PricewaterhouseCoopers LLP, an independent registered public accounting firm, who has also audited our consolidated financial statements, as stated in their report in the section entitled “Report of Independent Registered Public Accounting Firm,” which expresses an unqualified opinion on the effectiveness of the Company’s internal control over financial reporting as of April 29, 2016, which is included in “Item 8. Financial Statements and Supplementary Data” in this Annual Report on Form 10-K.
Changes in Internal Control overOver Financial Reporting
There have beenDuring the quarter ended April 29, 2022, there were no changes in the Company'sour internal control over financial reporting during(as defined in Rules 13a-15(f) under the Company's most recently completed fiscal quarterExchange Act) that have materially affected, or are reasonably likely to materially affect, the Company's internal control over financial reporting. The Company has not experienced any material impacts to its internal controls over financial reporting despite the COVID-19 pandemic.
Item 9B. Other Information
None.As reported in our Quarterly Reports on Form 10-Q for the first three quarters of fiscal year 2022, Medtronic has engaged in certain activities that it is required to disclose pursuant to Section 13(r)(1)(D)(ii) of the Securities Exchange Act of 1934, as amended. In particular, during the first three quarters of fiscal year 2022, Medtronic engaged in certain regulatory activities involving Russia’s Federal Security Service (“FSB”) related to its medical devices that were expressly authorized by the U.S. Government under applicable economic sanctions regulations.
During the first three quarters of fiscal year 2022, in the normal course of business and consistent with the OFAC authorizations as in effect at the time, Medtronic Russia filed a total of nine notifications with the FSB, as required under local Russian law for the import of medical devices that make use of encryption functionality. These activities did not directly result in any revenues or profits for Medtronic. Medtronic did not engage in these activities during the fourth quarter of fiscal year 2022. To the extent that notifications with the FSB remain permissible under U.S. law, Medtronic may decide to continue engaging in such activities for the limited purposes of complying with local law requirements in Russia.
PART III
Part III of this Annual Report on Form 10-K incorporates information by reference from our 2016the Company's 2022 definitive proxy statement, which will be filed no later than 120 days after April 29, 2016.2022.
Item 10. Directors, Executive Officers, and Corporate Governance
The sections entitled “Proposal 1 — Election of Directors — Directors and Nominees,” “Governance of Medtronic“Corporate Governance — Committees of the Board and Meetings,” and “Share Ownership Information — Delinquent Section 16(a) Beneficial Ownership Reporting Compliance”Report” in ourthe Company's Proxy Statement for our 20162022 Annual General Meeting of Shareholders, which will be filed no later than 120 days after April 29, 2016,2022, are incorporated herein by reference. See also “Executive
Set forth below are the names and ages of our Executive Officers of Medtronic” herein.
We have adopted a written CodeMedtronic, as well as information regarding their positions with Medtronic, their periods of Ethics that applies to our Chief Executive Officer, Chief Financial Officer, Corporate Treasurer, Corporate Controller,service in these capacities, and other senior financial officers performing similar functions whotheir business experiences. There are identified from time to time by the Chief Executive Officer. We have also adopted a written Code of Business Conduct and Ethics for Membersno family relationships among any of the Boardofficers named, nor is there any arrangement or understanding pursuant to which any person was selected as an officer.
The following table shows the name, age, and position as of Directors. The CodeApril 29, 2022 of Ethics for Senior Financial Officers, which is parteach of our broader Code of Conduct applicable to all employees, and the Code of Business Conduct and Ethics for MembersExecutive Officers:
| | | | | | | | | | | | | | |
| Name | | Age | | Position with the Company |
| Geoffrey S. Martha | | 52 | | Chairman and Chief Executive Officer |
| Ivan K. Fong | | 60 | | Executive Vice President, General Counsel and Corporate Secretary of the Company |
| Karen L. Parkhill | | 56 | | Executive Vice President and Chief Financial Officer |
| Carol A. Surface | | 56 | | Executive Vice President and Chief Human Resources Officer |
| Robert ten Hoedt | | 61 | | Executive Vice President and President, EMEA Region, President, APAC Region |
| Robert J. White | | 59 | | Executive Vice President and President, Medical Surgical Portfolio |
| John Liddicoat, M.D. | | 58 | | Executive Vice President and President, Americas Region |
| Sean Salmon | | 57 | | Executive Vice President and President, Diabetes Operating Unit, President, Cardiovascular Portfolio |
| Brett Wall | | 57 | | Executive Vice President and President, Neuroscience Portfolio |
Geoffrey S. Martha, age 52, is Chairman of the Board of Directors are postedand Chief Executive Officer of Medtronic. Geoff assumed the role of CEO on our website, www.medtronic.com underApril 27, 2020 and became Chairman of the "About Medtronic" menu, underBoard on December 11, 2020. Prior to his role as Chairman and CEO, he served as President of Medtronic from November 2019 through April 2020 and joined the “Investors” caption,Board of Directors in November 2019. Previously, Mr. Martha served as Executive Vice President and underPresident, Restorative Therapies Group, a role he held since August 2015. Mr. Martha previously served as Senior Vice President of Strategy and Business Development of the “Corporate Governance” subcaption. Any amendmentsCompany beginning in January 2015 and of Medtronic, Inc. beginning in August 2011. Prior to or waiversthat, he served as Managing Director of Business Development at GE Healthcare from April 2007 to July 2011; General Manager for executive officers or directorsGE Capital Technology Finance Services from November 2003 to March 2007; Senior Vice President, Business Development for GE Capital Vendor Financial Services from February 2002 to October 2003; General Manager for GE Capital Colonial Pacific Leasing from February 2001 to January 2002; and Vice President, Business Development for Potomac Federal, the GE Capital federal financing investment bank from May 1998 to January 2001.
Ivan K. Fong, age 60, has been Executive Vice President, General Counsel and Corporate Secretary of these ethics codes will be disclosedthe Company since February 2022. Prior to that, he held several leadership positions at 3M Company from 2012 to 2022, including Executive Vice President, Chief Legal and Policy Officer and Secretary. Prior to joining 3M Company, Mr. Fong served as General Counsel of the U.S. Department of Homeland Security from 2009 to 2012. Prior to his role with the U.S. Government, he was Chief Legal Officer and Secretary for Cardinal Health, Inc from 2005 to 2009. Mr. Fong currently serves on our website promptly following the dateBoard of such amendment or waiver.Cboe Global Markets.
Karen L. Parkhill, age 56, joined the Company as Executive Vice President and Chief Financial Officer in June 2016. From 2011 to 2016, Ms. Parkhill served as Vice Chairman and Chief Financial Officer of Comerica Incorporated. Ms. Parkhill was a member of Comerica’s Management Executive Committee and the Comerica Bank Board of Directors. Prior to joining Comerica, Ms. Parkhill worked for J.P. Morgan Chase & Co. in various capacities from 1992 to 2011, including serving as Chief Financial Officer of the Commercial Banking business from 2007 to 2011. Ms. Parkhill is also a current member of the Board of Directors for American Express.
Carol A. Surface, age 56, has been Executive Vice President and Chief Human Resources Officer of the Company since January 2015 and of Medtronic, Inc. since September 2013. Prior to that, she was the Executive Vice President and Chief Human Resources Officer at Best Buy Co., Inc. from March 2010 to September 2013, and held a series of HR leadership roles at PepsiCo Inc., from May 2000 to March 2010.
Robert ten Hoedt, age 61, has been Executive Vice President and President, EMEA Region of the Company since January 2015 and of Medtronic, Inc. since May 2014, as well as President, APAC Region starting March 2022. Prior to that, he was Senior Vice President and President, EMEA and Canada from 2009 to 2014; Vice President CardioVascular Europe and Central Asia from 2006 to 2009; Vice President and General Manager, Vitatron from 1999 to 2006; Gastro-Uro leader from 1994 to 1999; and Marketing Manager, Neurological from 1991 to 1994.
Robert J. White, age 59, is Executive Vice President and President, Medical Surgical Portfolio. Since 2017, Mr. White has served as Executive Vice President and Group President of the Minimally Invasive Therapies Group of Medtronic. Prior to that, he was Senior Vice President and President, Asia Pacific from January 2015 to December 2017. He had served as President, Emerging Markets, President, Respiratory and Monitoring Solutions and Vice President and General Manager of Patient Monitoring at Covidien. He also held various leadership positions at GE Healthcare and IBM. Mr. White is also a current member of the Board of Directors of Smith & Nephew plc.
John Liddicoat, M.D., age 58, was named Executive Vice President and President, Americas Region in September 2018. Dr. Liddicoat joined Medtronic in 2006 as Vice President of Atrial Fibrillation Technologies. In December of 2006, Dr. Liddicoat was named Vice President and General Manager of the Structural Heart Disease Business. Beginning in August 2014, Dr. Liddicoat served as Senior Vice President and President, Cardiac Rhythm and Heart Failure.
Sean Salmon, age 57, has been Executive Vice President and Group President, Diabetes Group of the company since October 2019, and also assumed the role of Executive Vice President and President, Cardiovascular Portfolio in January 2021. Mr. Salmon previously served as Senior Vice President and President of Coronary and Structural Heart Business within the Cardiac and Vascular Group of the Company beginning in July 2014. Mr. Salmon is a seasoned leader who has been with Medtronic since 2004 and spent the past 16 years in increasingly senior levels of management. Prior to joining Medtronic, Mr. Salmon worked at CR Bard and Johnson & Johnson.
Brett Wall, age 57, is Executive Vice President and President of Medtronic’s Neuroscience Portfolio. Mr. Wall previously served as Senior Vice President and President of the Brain Therapies division of Medtronic within the Restorative Therapies Group from March 2016 to November 2019. Prior to that, Mr. Wall served as SVP and President of Medtronic’s Neurovascular business. Prior to joining Medtronic, he served as Covidien’s SVP and President of Neurovascular as well as Senior Vice President and President of the International Vascular Therapies business for Covidien. Mr. Wall also served as Senior Vice President and President, International at ev3, Inc. From 2000 to 2008, Brett held various marketing and sales positions with ev3, Inc. and Micro Therapeutics, Inc. Mr. Wall has also worked at Boston Scientific as Director of Marketing, Cardiovascular, Asia Pacifica and Marketing Manager, Japan, from September 1995 to September 2000.
Item 11. Executive Compensation
The sections entitled “Governance of Medtronic“Corporate Governance — Director Compensation,” “Governance“Corporate Governance — Committees of Medtronic — Compensation Committee — Compensation Committee Interlocksthe Board and Insider Participation,Meetings,” “Compensation Discussion and Analysis, (CD&A),” and “Executive Compensation” in ourMedtronic's Proxy Statement for our 2016the Company's 2022 Annual General Meeting of Shareholders, which will be filed no later than 120 days after April 29, 2016,2022, are incorporated herein by reference. The section entitled “Compensation Committee Report” in ourMedtronic's Proxy Statement for our 2016the Company's 2022 Annual General Meeting of Shareholders, which will be filed no later than 120 days after April 29, 2016,2022, is furnished herein by reference.
Item 12. Security Ownership of Certain Beneficial Owners and Management and Related Shareholder Matters
The sections entitled “Share Ownership Information – Significant Shareholders,” “Share Ownership Information – Beneficial Ownership of Management,” and “Executive Compensation — Equity Compensation Plan Information” in ourMedtronic's Proxy Statement for our 2016the Company's 2022 Annual General Meeting of Shareholders, which will be filed no later than 120 days after April 29, 2016,2022, are incorporated herein by reference.
Item 13. Certain Relationships and Related Transactions, and Director Independence
The sections entitled “Proposal 1 — Election of Directors“Corporate Governance — Director Independence” and “Proposal 1“Corporate Governance — Election of Directors — Related Party Transactions and Other Matters” in ourMedtronic's Proxy Statement for our 2016the Company's 2022 Annual General Meeting of Shareholders, which will be filed no later than 120 days after April 29, 2016,2022, are incorporated herein by reference.
Item 14. Principal Accounting Fees and Services
The sections entitled “Governance“Corporate Governance — Committees of Medtronic — Audit Committee — Audit Committee Pre-Approval Policies”the Board and Meetings” and “Audit and Non-Audit Fees” in ourMedtronic's Proxy Statement for our 2016the Company's 2022 Annual General Meeting of Shareholders, which will be filed no later than 120 days after April 29, 2016,2022, are incorporated herein by reference.
PART IV
Item 15. Exhibits and Financial Statement Schedules
| | | | | |
| (a) | 1. Financial Statement Schedules |
| |
(a) | 1. Financial Statement Schedules |
| |
| Schedule II. Valuation and Qualifying Accounts — years ended April 29, 2016,2022, April 30, 2021, and April 24, 2015, and April 25, 2014.2020. |
| |
MEDTRONIC PLC AND SUBSIDIARIES
SCHEDULE II – VALUATION AND QUALIFYING ACCOUNTS
(in millions) | | | | | | | | | | | | | | | | | | | | | | | | | | | | | |
| | | Additions | | Deductions | | |
| Balance at
Beginning of
Fiscal Year | | Charges to Income | | Charges to Other Accounts | | Other Changes (Debit) Credit | | Balance
at End of
Fiscal Year |
| Allowance for doubtful accounts: | | | | | | | | | |
| Fiscal year ended April 29, 2022 | $ | 241 | | | $ | 58 | | | $ | — | | | $ | (69) | | (a) | $ | 230 | |
| Fiscal year ended April 30, 2021 | 208 | | | 128 | | | — | | | (95) | | (a) | 241 | |
| Fiscal year ended April 24, 2020 | 190 | | | 99 | | | — | | | (81) | | (a) | 208 | |
| | | | | | | | | |
| Inventory reserve: | | | | | | | | | |
| Fiscal year ended April 29, 2022 | $ | 629 | | | $ | 156 | | | $ | — | | | $ | (157) | | (b) | $ | 628 | |
| Fiscal year ended April 30, 2021 | 544 | | | 483 | | | — | | | (398) | | (b) | 629 | |
| Fiscal year ended April 24, 2020 | 521 | | | 282 | | | — | | | (259) | | (b) | 544 | |
| | | | | | | | | |
| Deferred tax valuation allowance: | | | | | | | | | |
| Fiscal year ended April 29, 2022 | $ | 5,822 | | | $ | 884 | | | $ | (19) | | (e) | $ | (103) | | (d) | $ | 6,583 | |
| | | | | | | | | |
| Fiscal year ended April 30, 2021 | 5,482 | | | 342 | | | 170 | | (e) | (172) | | (d) | 5,822 | |
| | | | | | | | | | |
| Fiscal year ended April 24, 2020 | 6,300 | | | 119 | | | (6) | | (c) | (744) | | (d) | 5,482 | |
| | | | | | | (187) | | (e) | |
| | | | | |
| (a) Primarily consists of uncollectible accounts written off, less recoveries. |
| (b) Primarily reflects utilization of the inventory reserve. |
| (c) Reflects the impact from acquisitions and amounts recognized in accumulated other comprehensive income/loss. |
| (d) Primarily reflects carryover attribute utilization and expiration. |
| (e) Primarily reflects the effects of currency fluctuations. |
| | | | | | | | | | | | | | | | | |
| All other schedules are omitted because they are not applicable or the required information is shown in the financial statements or notes thereto. |
| |
| 2. Exhibits |
| | |
| | | |
| Exhibit No. | | Description |
| 2.12. Exhibits |
| | Transaction Agreement, dated as of June 15, 2014, among Medtronic, Inc., Covidien plc, Medtronic plc (formerly known as Kalani I Limited), Makani II Limited, Aviation Acquisition Co., Inc., and Aviation Merger Sub, LLC (incorporated by reference to Exhibit 2.1 to Medtronic plc’s Amendment No. 5 to the Registration Statement on Form S-4, filed on November 20, 2014, File No. 333-197406). | | | | | | | | | |
| Exhibit No. | | Description |
| 2.23.1 | | Appendix III to the Rule 2.5 Announcement (Conditions Appendix) (incorporated by reference to Exhibit 2.2 to Medtronic, Inc.’s Current Report on Form 8-K, filed on June 16, 2014, File No. 001-07707). |
| | | |
| 2.3 | | Expenses Reimbursement Agreement, dated as of June 15, 2014, by and between Covidien plc and Medtronic, Inc. (incorporated by reference to Exhibit 2.3 to Medtronic, Inc.’s Current Report on Form 8-K, filed on June 16, 2014, File No. 001-07707). |
| | | |
| 2.4 | | Separation and Distribution Agreement, dated as of June 29, 2007, by and among Tyco International Ltd., Covidien Ltd. and Tyco Electronics Ltd. (incorporated by reference to Exhibit 2.1 to Covidien plc’s Current Report on Form 8-K, filed on July 5, 2007, File No. 001-33259). |
| | | |
| 2.5 | | Separation and Distribution Agreement, dated as of June 28, 2013, between Covidien plc and Mallinckrodt plc (incorporated by reference to Exhibit 2.1 to Covidien plc’s Current Report on Form 8-K filed on July 1, 2013, File No. 001-33259). |
| | | |
| 3.1 | | |
| | | |
| 3.2 | | |
| | | |
| 4.1 | | Form of Indenture between Medtronic, Inc. and Wells Fargo Bank, National Association (incorporated by reference to Exhibit 4.1 to Medtronic, Inc.’s Amendment No. 2 to the Registration Statement on Form S-4,S-3, filed on January 10, 2005,February 6, 2017, File No. 333-121239)333-215895). |
| | | |
| 4.24.1 | | Indenture, dated as of September 15, 2005, between Medtronic, Inc. and Wells Fargo Bank, N. A. (including the Forms of Notes thereof) (incorporated by reference to Exhibit 4.1 to Medtronic, Inc.’s Registration Statement on Form S-4, filed December 6, 2005, File No. 333-130163). |
| | | |
| 4.3 | | First Supplemental Indenture, dated as of January 26, 2015, by and among Medtronic plc, Medtronic, Inc., Medtronic Global Holdings S.C.A. and Wells Fargo Bank, National Association (incorporated by reference to Exhibit 4.1 to Medtronic plc’s Current Report on Form 8-K12B, filed on January 27, 2015, File No. 001-36820). |
| | | |
| 4.4 | | |
| | | |
|
| | | |
| 4.74.4 | | |
| | | |
| 4.84.5 | | |
| | | |
| 4.94.6 | | |
| | | |
| 4.104.7 | | |
| | | |
| 4.114.8 | | Seventh Supplemental Indenture, dated as of January 26, 2015, by and among Medtronic plc, Medtronic, Inc., Medtronic Global Holdings S.C.A. and Wells Fargo Bank, National Association (incorporated by reference to Exhibit 4.2 to Medtronic plc’s Current Report on Form 8-K12B, filed on January 27, 2015, File No. 001-36820). |
| | | |
| 4.124.9 | | |
| | | |
| 4.134.10 | | First Supplemental Indenture, dated December 10, 2014, between Medtronic, Inc. and Wells Fargo Bank, National Association (including Form of Floating Rate Senior Notes due 2020, Form of 1.500% Senior Notes due 2018, Form of 2.500% Senior Notes due 2020, Form of 3.150% Senior Notes due 2022, Form of 3.500% Senior Notes due 2025, Form of 4.375% Senior Notes due 2035 and Form of 4.625% Senior Notes due 2045) (incorporated by reference to Exhibit 4.2 of Medtronic, Inc.’s Current Report on Form 8-K filed with the Commission on December 10, 2014, File No. 001-07707). |
| | | |
| 4.144.11 | | |
| | | |
| 4.154.12 | | |
| | | |
| 4.164.13 | | |
| | | |
| 4.174.14 | | First Supplemental Indenture, dated as of October 22, 2007, by and among Covidien International Finance S.A., Covidien Ltd. 1and Deutsche Bank Trust Company Americas (incorporated by reference to Exhibit 4.1(b) to the Covidien plc’s Current Report on Form 8-K filed on October 22, 2007, File No. 001-33259). |
| | | |
| 4.18 | | Second Supplemental Indenture, dated as of October 22, 2007, by and among Covidien International Finance S.A., Covidien Ltd. and Deutsche Bank Trust Company Americas (incorporated by reference to Exhibit 4.1(c) to the Covidien plc’s Current Report on Form 8-K filed on October 22, 2007, File No. 001-33259). |
| | | |
| 4.19 | | Third Supplemental Indenture, dated as of October 22, 2007, by and among Covidien International Finance S.A., Covidien Ltd. and Deutsche Bank Trust Company Americas (incorporated by reference to Exhibit 4.1(d) to Covidien plc’s Current Report on Form 8-K filed on October 22, 2007, File No. 001-33259). |
| | | |
| 4.20 | | |
| | | |
| | | | | | | | | | | |
| 4.224.16 | | |
| | | |
| 4.234.17 | | |
| | | |
| 4.244.18 | | |
| | | |
| 4.254.19 | | Ninth Supplemental Indenture, dated as of January 26, 2015, by and among Medtronic plc, Medtronic Global Holdings S.C.A., Covidien public limited company, Covidien International Finance S.A., Covidien Ltd. and Deutsche Bank Trust Company Americas (incorporated by reference to Exhibit 4.5 to Medtronic plc’s Current Report on Form 8-K12B, filed on January 27, 2015, File No. 001-36820). |
| | | |
| 4.264.20 | | Registration Rights Agreement,Senior Indenture, dated December 10, 2014,as of March 28, 2017, by and among Medtronic plc, Medtronic Global Holdings S.C.A., Medtronic, Inc., and Merrill Lynch, Pierce, Fenner & Smith Incorporated, DeutscheWells Fargo Bank, Securities Inc. and J.P. Morgan Securities LLC, as representatives of the several initial purchasersN.A. (incorporated by reference to Exhibit 4.10 to Medtronic, Inc.’s Current Report on Form 8-K filed with the Commission on December 10, 2014, File No. 001-07707) |
| | | |
| 4.27 | | Joinder Agreement to the Registration Rights Agreement, dated as of January 26, 2015, by and among Medtronic plc and Medtronic Global Holdings S.C.A. (incorporated by reference to Exhibit 4.64.1 to Medtronic plc’s Current Report on Form 8-K12B,8-K, filed on January 27, 2015,March 28, 2017, File No. 001-36820).
|
| | | |
| 10.14.21 | | Senior Unsecured Term LoanFirst Supplemental Indenture, dated as of March 28, 2017, by and among Medtronic plc, Medtronic Global Holdings S.C.A., Medtronic, Inc., and Wells Fargo Bank, N.A. (incorporated by reference to Exhibit 4.2 to Medtronic plc’s Current Report on Form 8-K, filed on March 28, 2017, File No. 001-36820).
|
| | | |
| 4.22 | | Second Supplemental Indenture, dated as of March 7, 2019, by and among Medtronic plc, Medtronic Global Holdings S.C.A., Medtronic, Inc., Wells Fargo Bank, N.A., and Elavon Financial Services DAC, UK Branch (incorporated by reference to Exhibit 4.1 to Medtronic plc’s Current Report on Form 8-K, filed on March 7, 2019, File No. 001-36820). |
| | | |
| 4.23 | | Third Supplemental Indenture, dated as of July 2, 2019, among Medtronic Global Holdings S.C.A., Medtronic, Inc. and Medtronic plc, Wells Fargo Bank, N.A., as trustee, and Elavon Financial Services DAC (incorporated by reference to Exhibit 4.1 to Medtronic plc' Current Report on Form 8-K, filed July 2, 2019, File No. 001-36820). |
| | | |
| 4.24 | | Fourth Supplemental Indenture, dated as of September 29, 2020, among Medtronic Global Holdings S.C.A., Medtronic, Inc. and Medtronic plc, Wells Fargo Bank, N.A., as trustee, and Elavon Financial Services DAC, as paying agent (including the forms of the 2023 Notes, the 2025 Notes, the 2028 Notes, the 2032 Notes, the 2040 Notes and the 2050 Notes) (incorporated by reference to Exhibit 4.1 to Medtronic plc' Current Report on Form 8-K, filed September 29, 2020, File No. 001-36820). |
| | | |
| #4.25 | | |
| | | |
| 10.1 | | Amended and Restated Credit Agreement, dated as of November 7, 2014,December 12, 2018, by and among Medtronic Global Holdings, SCA, certain subsidiaries named therein, Medtronic, Inc., Medtronic Holdings Limited, Medtronic Global Holdings SCA,PLC, the lenders from time to time party thereto, and Bank of America, N.A., as administrative agentAdministration Agent (incorporated by reference to Exhibit 10.210.1 to Medtronic Inc.’splc’s Current Report on Form 8-K, filed on November 10, 2014,December 13, 2018, File No. 001-07707)001-36820). |
| | | |
| 10.2 | | Amendment No. 1 and RestatementExtension Agreement to the Amended and Restated Credit Agreement, dated as of November 7, 2014, by andDecember 12, 2019, among Medtronic, Inc., Medtronic plc (formerly known as Medtronic Holdings Limited), Medtronic Global Holdings S.C.A., Medtronic, Inc., Medtronic PLC, the lenders from time to timeLenders party thereto and Bank of America, N.A., as administrative agent and issuing bank (incorporated by reference to Exhibit 10.3 to Medtronic, Inc.’s Current Report on Form 8-K, filed on November 10, 2014, File No. 001-07707). |
| | | |
| 10.3 | | Senior Unsecured Bridge Credit Agreement, dated as of November 7, 2014, by and among Medtronic, Inc., Medtronic Holdings Limited, Medtronic Global Holdings SCA, the lenders from time to time party thereto, and Bank of America, N.A., as administrative agent (incorporated by reference to Exhibit 10.1 to Medtronic, Inc.’s Current Report on Form 8-K, filed on November 10, 2014, File No. 001-07707). |
| | | |
| 10.4 | | Senior Unsecured Bridge Credit Agreement, dated as of June 15, 2014, by and among Medtronic, Inc., Kalani I Limited, the lenders from time to time party thereto, and Bank of America, N.A., as administrative agent (incorporated by reference to Exhibit 10.1 to Medtronic, Inc.’s Current Report on Form 8-K, filed on June 18, 2014, File No. 001-07707). |
| | | |
| 10.5 | | Senior Unsecured Cash Bridge Credit Agreement, dated as of June 15, 2014, by and among Makani II Limited, Kalani I Limited, the lenders from time to time party thereto, and Bank of America, N.A., as administrative agent (incorporated by reference to Exhibit 10.2 to Medtronic, Inc.’s Current Report on Form 8-K, filed on June 18, 2014, File No. 001-07707). |
| | | |
| 10.6 | | Amendment dated September 30, 2015, to Senior Unsecured Term Loan Credit Agreement, dated as of November 7, 2014, by and among Medtronic, Inc., Medtronic Holdings Limited, Medtronic Global Holdings, SCA, the lenders from time to time party thereto, and Bank of America, N.A., as administrative agent.Administrative Agent (incorporated by reference to Exhibit 10.1 to Medtronic plc’s Current Report on Form 10-Q, for the quarter ended October 30, 2015, filed on December 9, 2015,February 28, 2020, File No. 001-36820).
|
|
| | | |
| 10.3 | | |
| 10.7 | | Amendment dated September 30, 2015, to Amended and Restated Revolving Credit Agreement, dated as of November 7, 2014, by and among Medtronic, Inc., Medtronic Holdings Limited, Medtronic Global Holdings, SCA, the lenders from time to time party thereto, and Bank of America, N.A., as administrative agent and issuing bank (incorporated by reference to Exhibit 10.2 to Medtronic plc’s Form 10-Q for the quarter ended October 30, 2015,
filed on December 9, 2015, File No. 001-36820).
|
| | | |
| 10.8 | | Amended and Restated Five-Year Senior CreditTerm Loan Agreement, dated as of May 23, 2014,12, 2020, among Covidien International Finance S.A.Medtronic Global Holdings S.C.A., Covidien plc,Medtronic, Inc., Medtronic PLC, the lendersLenders party thereto and Citibank, N.A.Mizuho Bank, LTD., as administrative agentAdministrative Agent (incorporated by reference to Exhibit 10.1 to CovidienMedtronic plc’s Current Report on Form 8-K, filed on May 28, 2014,12, 2020, File No. 001-33259)001-36820). |
| | | |
| | | | | | | | | | | |
| 10.910.4 | | Tax Sharing Agreement, dated as of June 29, 2007, by and among Tyco International Ltd., Covidien Ltd. and Tyco Electronics Ltd. (incorporated by reference to Exhibit 10.1 to Covidien plc’s Current Report on Form 8-K, filed on July 5, 2007, File No. 001-33259). |
| | | |
| 10.10 | | Tax Matters Agreement, dated as of June 28, 2013, between Covidien plc and Mallinckrodt plc (incorporated by reference to Exhibit 10.1 to Covidien plc’s Current Report on Form 8-K filed on July 1, 2013, File No. 001-33259). |
| | | |
| 10.11 | | Employee Matters Agreement, dated as of June 28, 2013, between Covidien plc and Mallinckrodt plc (incorporated by reference to Exhibit 10.2 to Covidien plc’s Current Report on Form 8-K filed on July 1, 2013, File No. 001-33259). |
| | | |
| 10.12 | | Transition Services Agreement, dated as of June 28, 2013, between Covidien plc and Mallinckrodt plc (incorporated by reference to Exhibit 10.3 to Covidien plc’s Current Report on Form 8-K filed on July 1, 2013, File No. 001-33259). |
| | | |
| 10.13 | | |
| | | |
| 10.1410.5 | | |
| | | |
| *10.1510.6 | | Letter Agreement by and between Medtronic, Inc. and Omar Ishrak dated May 11, 2011 (incorporated by reference to Exhibit 10.1 to Medtronic, Inc.’s Current Report on Form 8-K, filed on May 11, 2011, File No. 001-07707). |
| | | |
| *10.16 | |
|
| | | |
| *10.1710.7 | | Amendment to Letter Agreement dated May 11, 2011 by and between Medtronic, Inc. and Omar Ishrak (incorporated by reference to Exhibit 10.1 to Medtronic, Inc.’s Quarterly Report on Form 10-Q for the quarter ended July 29, 2011, filed September 7, 2011, File No. 001-07707). |
| | | |
| *10.18 | | Amendment dated February 12, 2015 to the Letter Agreement by and between Medtronic, Inc. and Omar Ishrak dated May 11, 2011 (incorporated by reference to Exhibit 10.24 to Medtronic plc’s Quarterly Report on Form 10-Q for the quarter ended January 23, 2015, filed on February 27, 2015, File No. 001-36820). |
| | | |
| *10.19 | | Letter Agreement by and between Medtronic, Inc. and Michael J. Coyle dated November 19, 2009 (incorporated by reference to Exhibit 10.55 to Medtronic, Inc.’s Annual Report on Form 10-K for the year ended April 27, 2012, filed on June 26, 2012, File No. 001-07707). |
| | | |
| *10.20 | | |
| | | |
| *10.2110.8 | | Letter Agreement by and between Medtronic, Inc. and Hooman Hakami dated April 29, 2014 (incorporated by reference to Exhibit 10.5 of Medtronic, Inc.’s Quarterly Report on Form 10-Q for the quarter ended July 25, 2014, filed on August 29, 2014, File No. 001-07707) |
| | | |
| *10.22 | | |
| | | |
| *10.23 | | Letter Agreement by and between Medtronic plc and Bryan C. Hanson dated February 12, 2015 (incorporated by reference to Exhibit 10.30 to Medtronic plc’s Quarterly Report on Form 10-Q for the quarter ended January 23, 2015, filed on February 27, 2015, File No. 001-36820). |
| | | |
|
| | | |
| *10.2410.9 | |
|
| | | |
| *10.2510.10 | | |
| | | |
| *10.11 | | |
| | | |
| *10.2610.12 | | 1994 Stock Award Plan (amended and restated as of January 1, 2008) (incorporated by reference to Exhibit 10.1 of Medtronic, Inc.’s Quarterly Report on Form 10-Q for the quarter ended January 28, 2008, filed on March 4, 2008, File No. 001-07707). |
| | | |
| *10.27 | | Amendment to the 1994 Stock Award Plan (incorporated by reference to Exhibit 10.7 to Medtronic plc’s Current Report on Form 8-K, filed on January 27, 2015, File No. 001-36820). |
| | | |
| *10.28 | | 1998 Outside Director Stock Compensation Plan (as amended and restated effective as of January 1, 2008) (incorporated by reference to Exhibit 10.3 to Medtronic, Inc.’s CurrentQuarterly Report on Form 8-K,10-Q for the quarter ended January 25, 2008, filed on, February 27, 2014,filed on March 4, 2008, File No. 001-07707). |
| | | |
| *10.2910.13 | | |
| | | |
| *10.3010.14 | | Form of Initial Option Agreement under the 1998 Outside Director Stock Compensation Plan (incorporated by reference to Exhibit 10.17 to Medtronic, Inc.’s Annual Report on Form 10-K for the year ended April 29, 2005, filed June 29, 2005, File No. 001-07707). |
| | | |
| *10.31 | | Form of Annual Option Agreement under the 1998 Outside Director Stock Compensation Plan (incorporated by reference to Exhibit 10.18 to Medtronic, Inc.’s Annual Report on Form 10-K for the year ended April 29, 2005, filed June 29, 2005, File No. 001-07707). |
| | | |
| *10.32 | | Form of Replacement Option Agreement under the 1998 Outside Director Stock Compensation Plan (incorporated by reference to Exhibit 10.19 to Medtronic, Inc.’s Annual Report on Form 10-K for the year ended April 29, 2005, filed June 29, 2005, File No. 001-07707). |
| | | |
| *10.33 | | Kyphon Inc. 2002 Stock Plan (amended and restated July 26, 2007, as further amended on October 18, 2007) (incorporated by reference to Exhibit 10.6 to Medtronic, Inc.’s Quarterly Report on Form 10-Q for the quarter ended January 25, 2008, filed on March 4, 2008, File No. 001-07707). |
| | | |
| *10.34 | | Addendum: Kyphon Inc. 2002 Stock Plan (dated December 13, 2007) (incorporated by reference to Exhibit 10.7 to Medtronic, Inc.’s Quarterly Report on Form 10-Q for the quarter ended January 25, 2008, filed on March 4, 2008, File No. 001-07707). |
| | | |
| *10.35 | | Amendment to the Kyphon Inc. 2002 Stock Plan (incorporated by reference to Exhibit 10.1 to Medtronic plc’s Current Report on Form 8-K, filed on January 27, 2015, File No. 001-36820). |
| | | |
| *10.36 | | |
| | | |
| *10.3710.15 | | |
| | | |
| *10.3810.16 | | |
| | | |
| *10.3910.17 | | |
| | | |
| *10.4010.18 | | |
| | | |
| *10.4110.19 | | |
| | | |
| | | | | | | | | | | |
| *10.4410.22 | | |
| | | |
| *10.4510.23 | | |
| | | |
| *10.4610.24 | | |
| | | |
| *10.4710.25 | | |
| | | |
| *10.4810.26 | | |
| | | |
| *10.4910.27 | | |
| | | |
| *10.5010.28 | | |
| | | |
| *10.5110.29 | | |
| | | |
| *10.5210.30 | | |
| | | |
| *10.5310.31 | | |
| | | |
| *10.5410.32 | | |
| | | |
| *10.5510.33 | | |
| | | |
| *10.5610.34 | | |
| | | |
| *10.5710.35 | | |
| | | |
| *10.5810.36 | | |
| | | |
| *10.5910.37 | | |
| | | |
| | | | | | | | | | | |
| *10.6210.40 | | |
| | | |
| *10.6310.41 | | |
| | | |
| *10.6410.42 | | |
| | | |
| *10.6510.43 | | Medtronic Incentive Plan (amended and restated effective January 1, 2008) (incorporated by reference to Exhibit 10.2 to Medtronic, Inc.’s Quarterly Report on Form 10-Q for the quarter ended January 28, 2008, filed on March 4, 2008, File No. 001-07707). |
| | | |
| *10.66 | | Amended and Restated 2013 Stock Award and Incentive Plan (incorporated by reference to Exhibit 10.9 to Medtronic plc’s Current Report on Form 8-K, filed on January 27, 2015, File No. 001-36820). |
| | | |
| *10.67 | | |
| | | |
| *10.6810.44 | | |
| | | |
| *10.45 | | |
| | | |
| *10.46 | | |
| | | |
| *10.47 | | |
| | | |
| *10.48 | | |
| | | |
| *10.49 | | |
| | | |
| *10.50 | | |
| | | |
| *10.6910.51 | | |
| | | |
| *10.52 | | |
| | | |
| *10.7010.53 | | |
| | | |
| *10.7110.54 | | |
| | | |
| *10.7210.55 | | |
| | | |
| *10.7310.56 | | |
| | | |
| | | | | | | | | | | |
| *10.7410.57 | | |
| | | |
| *10.7510.58 | | |
| | | |
| *10.7610.59 | | |
| | | |
|
| | | |
| *10.7710.60 | | |
| | | |
| *10.7810.61 | | |
| | | |
| *10.7910.62 | | |
| | | |
| *10.8010.63 | | |
| | | |
| *10.8110.64 | | |
| | | |
| *10.65 | | |
| | | |
| *10.66 | | |
| | | |
| *10.8210.67 | | |
| | | |
| *10.8310.68 | | |
| | | |
| *10.8410.69 | | |
| | | |
| *10.70 | | |
| | | |
| *10.8510.71 | | |
| | | |
| *10.8610.72 | | |
| | | |
| | | | | | | | | | | |
| *10.8710.73 | | Covidien Savings Related Share |
| | | |
| *10.88 | | Covidien Stock and Incentive Plan (incorporated by reference to Exhibit 10.5 to Covidien plc’s Current Report on Form 8-K filed on March 26, 2013, File No. 001-33259). |
| | | |
| *10.89 | | Covidien Separation and Distribution Agreement Equity Awards under the Separation and Distribution Agreement, dates as of June 29, 2007, by and among Tyco International Ltd., Covidien Ltd., and Tyco Electronics Ltd. (incorporated by reference to Exhibit 2.1 to Covidien plc’s Current Report on Form 8-K filed on July 5, 2007, File No. 001-33259). |
| | | |
| *10.90 | | Covidien Severance Plan for U.S. Officers and Executives, asDeferral Program (as amended and restated generally effective January 1, 2017) (incorporated by reference to Exhibit 10.1 to Covidien plc’s Current Report on Form 8-K filed on September 23, 2014, File No. 001-33259). |
| | | |
| *10.91 | | Covidien Change in Control Severance Plan for Certain U.S. Officers and Executives (incorporated by reference to Exhibit 10.1 to Covidien plc’s Current Report on Form 8-K filed on March 26, 2013, File No. 001-33259). |
| | | |
| *10.92 | | Covidien Supplemental Savings and Retirement Plan, as amended and restated (incorporated by reference to Exhibit 10.1 to CovidienMedtronic plc’s Quarterly Report on Form 10-Q for the quarter ended December 25, 2009,October 28, 2016, filed on January 26, 2010,December 5, 2016, File No. 001-33259)001-36820). |
| | | |
| *10.9310.74 | | Form of Non-Competition, Non-Solicitation |
| | | |
|
| | | |
| *10.9410.75 | | FY09 Grant U.S. Option Terms and Conditions (incorporated by reference to Exhibit 10.3 to Covidien plc’s Current Report on Form 8-K filed on September 23, 2014, File No. 001-33259). |
| | | |
| *10.95 | | FY09 Grant U.S. Restricted Stock Unit Terms and Conditions (incorporated by reference to Exhibit 10.2 to Covidien plc’s Current Report on Form 8-K filed on |
| | | |
| *10.96 | | Deed Poll of Assumption relating to Covidien Ltd. Employee Equity Plans, dated June 4, 2009 (incorporated by reference to Exhibit 10.3 to Covidien plc’s Current Report on Form 8-K12G3 filed on June 5, 2009, File No. 001-33259). |
| | | |
| *10.97 | | Director Grant Restricted Stock Unit Terms and Conditions (incorporated by reference to Exhibit 10.2 to Covidien plc’s Current Report on Form 8-K filed on March 23, 2009, File No. 001-33259). |
| | | |
| *10.98 | | Founders’ Grant Standard Option Terms and Conditions6, 2020) (incorporated by reference to Exhibit 10.4 to Covidien plc’s Current Report on Form 8-K filed on September 23, 2014, File No. 001-33259). |
| | | |
| *10.99 | | Founders’ Grant Standard Option Terms and Conditions for Directors (incorporated by reference to Exhibit 10.13 to Covidien plc’s Current Report on Form 8-K filed on July 5, 2007, File No. 001-33259). |
| | | |
| *10.100 | | Form of Deed of Indemnification by and between Covidien plc and Covidien plc’s Directors and Secretary (incorporated by reference to Exhibit 10.4 to Covidien plc’s Form 10-Q for the quarter ended June 28, 2013, filed on August 5, 2013, File No. 001-33259). |
| | | |
| *10.101 | | Form of Terms and Conditions of Option Award (incorporated by reference to Exhibit 10.2 to Covidien plc’s Current Report on Form 8-K filed on September 23, 2014, File No. 001-33259). |
| | | |
| *10.102 | | Form of Terms and Conditions of Restricted Unit Award (incorporated by reference to Exhibit 10.3 to CovidienMedtronic plc’s Quarterly Report on Form 10-Q for the quarter ended December 25, 2009,October 30, 2020, filed on January 26, 2010,December 3, 2020, File No. 001-33259)001-36820). |
| | | |
| *10.10310.76 | | FormAmendment No. 3 and Extension Agreement to the Amended and Restated Credit Agreement, dated as of TermsDecember 13, 2021, by and Conditionsamong Medtronic Global Holdings S.C.A., certain subsidiaries of Performance Unit AwardMedtronic plc from time to time party thereto, Medtronic, Inc., Medtronic plc, the lenders from time to time party thereto and Bank of America N.A., as administrative agent. (incorporated by reference to Exhibit 10.410.01 to CovidienMedtronic plc’s Current Report on Form 8-K, filed on December 14, 2021, File No. 001-36820). |
| | | |
| *10.77 | | Medtronic Capital Accumulation Plan Deferral Program (as restated generally effective January 1, 2017) (Conformed through the Amendment generally effective as of January 1, 2022) (incorporated by reference to Exhibit 10.1 to Medtronic plc’s Quarterly Report on Form 10-Q for the quarter ended December 25, 2009,January 28, 2022, filed on January 26, 2010,March 3, 2022, File No. 001-33259)001-36820). |
| | | |
| *10.10410.78 | | Amended Terms and Conditions of |
| | | |
| *10.79 | | |
| | | |
| *10.10510.80 | | Amended Terms and Conditions of Performance Unit Awards FY13-FY15 |
| | | |
| *10.10610.81 | | Form |
| | | |
| 12.1*10.82 | | Computation |
| | | |
| 21#21 | | |
| | | |
| 23#22 | | |
| | | |
| #23 | | |
| | | |
| 24#24 | | |
| | | |
| 31.1#31.1 | | |
| | | |
| 31.2#31.2 | | |
| | | |
| 32.1#32.1 | | |
| | | |
| 32.2#32.2 | | |
| | | |
| 101 | | The following materials from Medtronic plc’s Annual Report on Form 10-K for the year ended April 29, 2016, formatted in Extensible Business Reporting Language (XBRL): (i) consolidated statements of income, (ii) consolidated statements of comprehensive income, (iii) consolidated balance sheets, (iv) consolidated statements of cash flows, (v) consolidated statements of shareholders’ equity, and (vi) the notes to the consolidated financial statements. |
|
| | | |
| #101.SCH | | XBRL Taxonomy Extension Schema Document |
| | | |
| #101.CAL | | XBRL Taxonomy Extension Calculation Linkbase Document |
| | | |
| #101.DEF | | XBRL Taxonomy Extension Definition Linkbase Document |
| | | |
| #101.LAB | | XBRL Taxonomy Extension Label Linkbase Document |
| | | |
| #101.PRE | | XBRL Taxonomy Extension Presentation Linkbase Document |
| | | |
| #104 | | Cover Page Interactive Data File (formatted as Inline XBRL and contained in Exhibit 101) |
| | | | | | | | |
| *Exhibits that are management contracts or compensatory plans or arrangements. |
| #Filed herewith |
|
MEDTRONIC PLC AND SUBSIDIARIES
SCHEDULE II – VALUATION AND QUALIFYING ACCOUNTSItem 16. Form 10-K Summary
(in millions)Registrants may voluntarily include a summary of information required by Form 10-K under this Item 16. The Company has not elected to include such summary information.
|
| | | | | | | | | | | | | | | | | | |
| | | | Additions | | Deductions | | |
| | Balance at Beginning of Fiscal Year | | Charges to Income | Charges to Other Accounts | | Other Changes (Debit) Credit | | Balance at End of Fiscal Year |
| Allowance for doubtful accounts: | |
| | |
| | | |
| | |
|
| Year ended 4/29/16 | $ | 144 |
| | $ | 49 |
| $ | — |
| | $ | (28 | ) | (b) | $ | 161 |
|
| | |
| | |
| | | $ | (4 | ) | (c) | |
|
| Year ended 4/24/15 | $ | 115 |
| | $ | 35 |
| $ | 34 |
| (a) | $ | (36 | ) | (b) | $ | 144 |
|
| | |
| | |
| | | $ | (4 | ) | (c) | |
|
| Year ended 4/25/14 | $ | 98 |
| | $ | 43 |
| $ | — |
| | $ | (30 | ) | (b) | $ | 115 |
|
| | |
| | |
| | | $ | 4 |
| (c) | |
|
| | | | | | | | | |
| Deferred tax valuation allowance: | | | | | | | | |
| Year ended 4/29/16 | $ | 5,607 |
| | $ | 1,194 |
| $ | 4 |
| (a) | $ | (88 | ) | (d) | $ | 7,032 |
|
| | | | | | | $ | 315 |
| (c) | |
| Year ended 4/24/15 | $ | 397 |
| | $ | 40 |
| $ | 5,660 |
| (a) | $ | (56 | ) | (d) | $ | 5,607 |
|
| | | | | | | $ | (434 | ) | (c) | |
| Year ended 4/25/14 | $ | 313 |
| | $ | 104 |
| $ | 5 |
| | $ | (29 | ) | (d) | $ | 397 |
|
| | | | | | | $ | 4 |
| (c) | |
|
| |
(a) Reflects the impact from acquisitions |
(b) Uncollectible accounts written off, less recoveries. |
(c) Reflects primarily the effects of currency fluctuations. |
(d) Decrease in deferred tax valuation allowance due to carryover attribute utilization and expiration. |
SIGNATURES
Pursuant to the requirements of Section 13 or 15(d) of the Securities Exchange Act of 1934, the registrant has duly caused this report to be signed on its behalf by the undersigned, thereunto duly authorized.
|
| | | | | | | |
| MEDTRONIC PUBLIC LIMITED COMPANYMedtronic plc |
| | |
Dated: June 28, 201623, 2022 | By: | /s/ Omar Ishrak Geoffrey S. Martha |
| | Omar IshrakGeoffrey S. Martha |
| | Chairman and |
| | Chief Executive Officer |
Pursuant to the requirements of the Securities Exchange Act of 1934, the report has been signed below by the following persons on behalf of the registrant and in the capacities and on the dates indicated.
| | | | | | | | |
| Medtronic plc |
| | |
| Dated: June 23, 2022 | By: | /s/ Geoffrey S. Martha |
| | Geoffrey S. Martha |
| | Chairman and Chief Executive Officer |
| | (Principal Executive Officer) |
| | |
| | |
| Dated: June 23, 2022 | By: | /s/ Karen L. Parkhill |
| | Karen L. Parkhill |
| | Executive Vice President and Chief Financial Officer |
| | (Principal Financial Officer) |
| | |
| Dated: June 23, 2022 | MEDTRONIC PUBLIC LIMITED COMPANYBy: | /s/ Jennifer M. Kirk |
| | Jennifer M. Kirk |
Dated: June 28, 2016 | By: | /s/ Omar Ishrak
Global Controller and Chief Accounting Officer |
| | Omar Ishrak(Principal Accounting Officer) |
| | Chairman and |
| | Chief Executive Officer |
| | (Principal Executive Officer)Directors |
| | |
Dated: June 28, 2016 | By: | /s/ Gary L. Ellis
|
| | Gary L. Ellis |
| | Principal Financial and |
| | Accounting Officer |
| | |
| Directors |
| | |
| | Richard H. Anderson* |
| | Craig Arnold* |
| | Scott C. Donnelly* |
| | Andrea J. Goldsmith, PH.D.* |
| | Randall J. Hogan, III** |
| | Omar Ishrak*Kevin E. Lofton* |
| | Shirley Ann Jackson, Ph.D*Geoffrey S. Martha |
| | Michael O. Leavitt*Elizabeth G. Nabel, M.D.* |
| | James T. Lenehan* |
| | Elizabeth G. Nabel* |
| | Denise M. O’Leary* |
| | Kendall J. Powell* |
| | Robert C. Pozen* |
| | Preetha Reddy* |
*Bradley E. Lerman,Ivan K. Fong, by signing his name hereto, does hereby sign this document on behalf of each of the above named directors of the registrant pursuant to powers of attorney duly executed by such persons.
|
| | | | | | | |
Dated: June 28, 201623, 2022 | By: | /s/ Bradley E. LermanIvan K. Fong |
| | Bradley E. LermanIvan K. Fong |