

UNITED STATES
SECURITIES AND EXCHANGE COMMISSION
Washington, D.C. 20549
FORM 10-K
[☒] | ANNUAL REPORT PURSUANT TO SECTION 13 OR 15(d) OF THE SECURITIES EXCHANGE ACT OF 1934 |
For the fiscal year ended December 30, 20172023
or
[☐] | TRANSITION REPORT PURSUANT TO SECTION 13 OR 15(d) OF THE SECURITIES EXCHANGE ACT OF 1934 |
For the transition period from ___________to__________
to
Commission file number 0-31983001-41118
GARMIN LTD.LTD.
(Exact name of registrant as specified in its charter)
Switzerland (State or other jurisdiction of incorporation or organization) | 98-0229227 (I.R.S. Employer Identification No.) |
Mühlentalstrasse 2 8200Schaffhausen Switzerland (Address of principal executive offices) | N/A (Zip Code) |
Registrant’s telephone number, including area code:+41 52630 1600
Securities registered pursuant to Section 12(b) of the Act:
Registered Shares, | GRMN | New York Stock | ||
(Title of each class) | (Trading Symbol) | (Name of each exchange on which registered) |
Securities registered pursuant to Section 12(g) of the Act:None
Indicate by check mark if the registrant is a well-known seasoned issuer, as defined in Rule 405 of the Securities Act. YESþYes [☑] NO¨ [☐]
Indicate by check mark if the registrant is not required to file reports pursuant to Section 13 or Section 15(d) of the Act. YES¨NOþ [☐] No [☑]
Indicate by check mark whether the registrant (1) has filed all reports required to be filed by Section 13 or 15(d) of the Securities Exchange Act of 1934 during the preceding 12 months (or for such shorter period that the registrant was required to file such reports), and (2) has been subject to such filing requirements for the past 90 days. YESþYes [☑] NO¨ [☐]
Indicate by check mark whether the registrant has submitted electronically and posted on its corporate website, if any, every Interactive Data File required to be submitted and posted pursuant to Rule 405 of Regulations S-T (§ 232.405 of this chapter) during the preceding 12 months (or for such shorter period that the registrant was required to submit and post such files). YESþYes [☑] NO¨ [☐]
Indicate by check mark if disclosure of delinquent filers pursuant to Item 405 of Regulation S-K (§ 229.405 of this chapter) is not contained herein, and will not be contained, to the best of registrant’s knowledge, in definitive proxy or information statements incorporated by reference in Part III of this Form 10-K or any amendment to this Form 10-K.þ
Indicate by check mark whether the registrant is a large accelerated filer, an accelerated filer, a non-accelerated filer, a smaller reporting company, or an emerging growth company. See the definitions of “large accelerated filer”, “accelerated filer”, “smaller reporting company”, and “emerging growth company” in Rule 12b-2 of the Exchange Act.
Large Accelerated Filer | [☑] | Accelerated Filer | [☐] | |
Non-accelerated Filer | [☐] | Smaller reporting company | [☐] | |
Emerging growth company | [☐] |
If an emerging growth company, indicate by check mark if the registrant has elected not to use the extended transition period for complying with any new or revised financial accounting standards provided pursuant to Section 13(a) of the Exchange Act.¨☐
Indicate by check mark whether the registrant has filed a report on and attestation to its management’s assessment of the effectiveness of its internal control over financial reporting under Section 404(b) of the Sarbanes-Oxley Act (15 U.S.C. 7262(b)) by the registered public accounting firm that prepared or issued its audit report. ☑
If securities are registered pursuant to Section 12(b) of the Act, indicate by check mark whether the financial statements of the registrant included in the filing reflect the correction of an error to previously issued financial statements. ☐
Indicate by check mark whether any of those error corrections are restatements that required a recovery analysis of incentive-based compensation received by any of the registrant’s executive officers during the relevant recovery period pursuant to §240.10D-1(b). ☐
Indicate by check mark whether the registrant is a shell company (as defined in Rule 12b-2 of the Exchange Act). YES [☐] NO [☑]
YES¨NOþ
Aggregate market value of the common shares held by non-affiliates of the registrant as of July 1, 20172023 (based on the closing price of the registrant's common shares on the NasdaqNew York Stock MarketExchange for that date)June 30, 2023) was $6,129,443,292.approximately $15,973,000,000.
Number of shares outstanding of the registrant’s common shares as of February 16, 2018:2024:
Registered Shares, CHF 0.10$0.10 par value – 198,077,418 (including191,777,417 (excluding treasury shares)
Documents incorporated by reference:
Portions of the following document are incorporated herein by reference into Part III of the Form 10-K as indicated:
Document | Part of Form which Incorporated | |
Company's Definitive Proxy Statement for the | Part III |
Garmin Ltd.
20172023 Form 10-K Annual Report
Table of Contents
2
CAUTIONARY STATEMENT WITH RESPECT TO FORWARD-LOOKING COMMENTSSTATEMENTS
The discussions set forth in this Annual Report on Form 10-K contain statements concerning potential future events. Such forward-looking statements are based upon assumptions by the Company'sCompany’s management, as of the date of this Annual Report, including assumptions about risks and uncertainties faced by the Company. In addition, management may make forward-looking statements orally or in other writings, including, but not limited to, in press releases, in the annual report to shareholders and in the Company’s other filings with the Securities and Exchange Commission. Readers can identify these forward-looking statements by their use of such verbs as “expects,” “anticipates,” “believes” or similar verbs or conjugations of such verbs. Forward-looking statements include any discussion of the trends and other factors that drive our business and future results in “Item 7. Management’s Discussion and Analysis of Financial ConditionsCondition and Results of Operations.” Readers are cautioned not to place undue reliance on these forward-looking statements, which speak only as of their date. If any of management'smanagement’s assumptions prove incorrect or should unanticipated circumstances arise, the Company'sCompany’s actual results could materially differ from those anticipated by such forward-looking statements. The differences could be caused by a number of factors or combination of factors including, but not limited to, those factors identified under Item 1A “Risk Factors.” Readers are strongly encouraged to consider those factors when evaluating any forward-looking statements concerning the Company. Except as may be required by law, the Company does not undertake to update any forward-looking statements in this Annual Report to reflect future events or developments.
3
Part I
Item 1. Business
Company Overview
For more than 30 years, Garmin Ltd. and its subsidiaries (collectively, we, our, us, the Company or Garmin) have pioneered new products, many of which feature location technology such as Global Positioning System (GPS), and applications that are designed for people who live an active lifestyle. Garmin serves five primary markets: fitness, outdoor, aviation, marine, and auto OEM. We design, develop, manufacture, market, and distribute a diverse family of GPS-enabled products and other navigation, communications, sensor-based and information products for these markets, as well as products installed by original equipment manufacturers (OEMs) and for aftermarket applications. Since the inception of its business, Garmin has delivered over 282 million products, which included more than16 million products delivered during fiscal 2023.
Available Information
Garmin’s annual report on Form 10-K, quarterly reports on Form 10-Q, current reports on Form 8-K, proxy statement and Forms 3, 4 and 5 filed by Garmin’s directors and executive officers and all amendments to those reports will be made available free of charge through the Investor Relations section of Garmin’s website (www.garmin.com) as soon as reasonably practicable after such material is electronically filed with, or furnished to, the Securities and Exchange Commission (the SEC). The SEC maintains a website (www.sec.gov) that contains reports, proxy and information statements, and other information regarding issuers that file electronically with the SEC. The reference to Garmin’s website address does not constitute incorporation by reference of the information contained on this website, and such information should not be considered part of this report on Form 10-K or in any other report or document we file with the SEC, and any references to our website are intended to be inactive textual references only.
This discussion of the business of Garmin Ltd. ("Garmin" or the "Company") should be read in conjunction with, and is qualified by reference to, “Management's Discussion and Analysis of Financial Condition and Results of Operations” under Item 7 herein and the information set forth in response to Item 101 of Regulation S-K in such Item 7 is incorporated herein by reference in partial response to this Item 1.
Products
Garmin has identified fiveoffers a broad range of solutions across its reportable segments as outlined below. In general,Garmin believes that its products are known for external reporting purposes: auto, aviation, marine, outdoortheir value, high performance, ease of use, innovation, and fitness. There are two operating segments (auto PND and auto OEM) that are not reported separately but are aggregated within the auto reportable segment. Each operating segment is individually reviewed and evaluated by our Chief Operating Decision Maker (CODM), who allocates resources and assesses performance of each segment individually. The segment and geographic information included in Item 8, “Financial Statements and Supplementary Data,” under Note 8 is incorporated herein by reference in partial response to this Item 1.appealing design.
Garmin was incorporated in Switzerland on February 9, 2010 as successor to Garmin Ltd., a Cayman Islands company (“Garmin Cayman”). Garmin Cayman was incorporated on July 24, 2000 as a holding company for Garmin Corporation, a Taiwan corporation, in order to facilitate a public offering of Garmin Cayman shares in the United States. On June 27, 2010, Garmin became the ultimate parent holding company of the Garmin group of companies pursuant to a share exchange transaction effected for the purpose of changing the place of incorporation of the ultimate parent holding company of the Garmin group from the Cayman Islands to Switzerland (the “Redomestication”). Pursuant to the Redomestication, all issued and outstanding Garmin Cayman common shares were transferred to Garmin and each common share, par value U.S. $0.005 per share, of Garmin Cayman was exchanged for one registered share, par value 10 Swiss francs (CHF) per share, of Garmin. At the Company’s Annual General Meeting on June 10, 2016, the Company’s shareholders approved the cancellation of 10,000,000 registered shares of the Company held by the Company (the “Formation Shares”) and the reduction in par value of each share of the Company from CHF 10 to CHF 0.10 and the amendmentMany of the Company’s Articles of Associationproducts utilize GPS and other global navigation satellite systems (GNSS) receivers to effectsupport product features such as navigation, global positioning, and tracking. GPS is a corresponding share capital reduction. This share cancellation has reduced authorized shares from 208,077,418 sharesUnited States owned satellite network constellation that supports global positioning, timing, and navigation, providing precise geographic location and related data to 198,077,418 shares, with an incremental 99,038,709 conditional shares that may be issued through the exercise of option rights, which are grantedboth commercial and government GPS receivers. Access to Garmin employees or members of its Board of Directors. Garmin owns, directly or indirectly, alland use of the operating companies in the Garmin group.
Garmin’s annual report on Form 10-K, quarterly reports on Form 10-Q, current reports on Form 8-K, proxy statement and Forms 3, 4 and 5 filed by Garmin’s directors and executive officers and all amendments to those reports will be made available free of charge through the Investor Relations section of Garmin’s website (http://www.garmin.com) as soon as reasonably practicable after such material is electronically filed with, or furnished to, the Securities and Exchange Commission (the “SEC”). The SEC maintains a website (http://www.sec.gov) that contains reports, proxy and information statements, and other information regarding issuers that file electronically with the SEC.
The reference to Garmin’s website address does not constitute incorporation by reference of the information contained on this website, and such information should not be considered part of this report on Form 10-K.
Company Overview
For over 25 years, Garmin Ltd. and subsidiaries (together, the “Company”) has pioneered new Global Positioning System (GPS) navigation and wireless devices and applications that are designed for people who live an active lifestyle. Garmin serves five primary business units, including auto, aviation, fitness, marine, and outdoor. We believe it is through these business units that Garmin is able to achieve synergies in raw material purchases, manufacturing, distribution, research and development and marketing efforts making for a stronger, more effective company. Garmin designs, develops, manufactures, markets and distributes a diverse family of hand-held, wearable, portable and fixed-mount GPS-enabled products and other navigation, communications, sensor-based and information products. Since the inception of its business, Garmin has delivered over 188 million products, which includes the delivery of more than 15 million products during 2017.
Overview of the Global Positioning System
The Global Positioning System is a worldwide navigation system which enables the precise determination of geographic location using established satellite technology. The system consists of numerous constellations of orbiting satellites. Access to theGPS systems commercial signal bands is provided free of charge.
In addition to GPS, Garmin utilizes a variety ofproducts utilize other global navigation satellite systems (GNSS) including but not limited to:the Russian Global Navigation Satellite System (GLONASS), the European Union Galileo system (Galileo), and the Chinese BeiDou Navigation Satellite System (BDS). Garmin products also use satellite-based augmentation systems (SBAS) including the U.S. Wide Area Augmentation System (WAAS), the Japanese MTSAT-based Satellite Augmentation System (MSAS), and the European Geostationary Navigation Overlay Service (EGNOS) aviation Safety of Life (SoL) service. Garmin also uses localized satellite-based systems including the Quasi-Zenith Satellite System (QZSS) and the Indian Regional Navigation Satellite System (IRNSS), with an operational name of NavIC (Navigation with Indian Constellation).
|
In certain urban canyon or restricted sky visibility situations, the combination of GPS, GLONASS, and/or Galileo satellites to produce a navigation fix may result in improved accuracy.
On a subscription basis, certain Garmin products offer access to private satellite networks such as the Iridium satellite network, a synchronized constellation of 66 low Earth orbit (LEO) satellites offering global data communication coverage. The Iridium network is the only network that spans the entire globe, offering 100 percentIridium’s satellite constellation offers global coverage worldwide to enable reliable satellite-based communication.
The accuracy and utility of GPS can be enhanced through augmentation techniques which compute any remaining errors in the signal and broadcast these corrections to a GPS device. The Federal Aviation Administration (“FAA”) has developed a Wide Area Augmentation System (WAAS) comprising ground reference stations and additional satellites that improve the accuracy of GPS positioning available in the United States and most of Canada and Mexico to approximately 3 meters. WAAS supports the use of GPS as the primary means of enroute, terminal and approach navigation for aviation in the United States. The increased accuracy offered by WAAS also enhances the utility of WAAS-enabled GPS receivers for consumer applications.
4
Fitness
Products
Garmin offers a broad range of solutions across its reportable segments as outlined below. In general, Garmin believes that its products are known for their value, high performance, ease of use, innovation, and ergonomics.
Auto
Garmin offers a broad range of auto navigation products, as well as a variety of products and applications designed for the mobile GPS market. Garmin currently offers to consumers around the world:
Personal Navigation Devices (PND) –
PNDs combine a full-featured GPS navigator (with built-in maps) with Garmin’s uniquely simple user interface. PNDs are sold under the Garmin Drive™, zūmo®, dēzl™, RV and Garmin fleet™ product lines. The zūmo series offers motorcycle-specific features. The RV series offers features specific to the RV enthusiast. The dēzl series offers over-the-road trucking features while the Garmin fleet series delivers an integrated tracking and dispatch fleet system. Across the expansive product portfolio, Garmin offers features such as large screens, integrated traffic receivers for traffic avoidance, bundled lifetime map updates, spoken street names, voice activated navigation, speed limit indication, lane assist with PhotoReal junction views (thousands of high quality photos of actual upcoming junctions), Bluetooth hands-free capability, DashCams, driver awareness alerts, and backup cameras.
Original Equipment Manufacturer (OEM) Solutions –
Garmin has cultivated key relationships with many OEMs, where we provide a host of solutions. These range from complete embedded infotainment systems that provide a broad range of functionality, to integrated camera solutions, embedded navigation solutions, and precise positioning technology solutions. These support not only the infotainment system in the vehicle, but also key advanced driver-assistance systems (ADAS) functionality as well.
Mobile Applications –
Garmin offers mobile applications under the Garmin® and NAVIGON® product names. The applications are offered across a broad range of smartphones and tablets including iOS, Android and Windows enabled devices. These applications provide users turn-by-turn, voice-prompted directions and other advanced Garmin navigation features. The Smartphone Link mobile application allows a compatible Garmin navigator to connect to a compatible smartphone. Information can be shared between the smartphone and the navigator including notifications, contacts, search results, driving destination, and even parking location. Additional Garmin Live Services can be accessed through Smartphone Link for useful, real-time driving information.
Action Cameras –
Garmin offers VIRB® action cameras that capture 360-degree footage up to 5.7K/30fps with digital image stabilization, voice or wireless remote control, and the ability to take high quality still photographs while the video camera is recording. VIRB action cameras offer built-in Wi-Fi, data sensors and a high-sensitivity GPS receiver to add speed, elevation, G-force, heart rate, and other data onto video through our VIRB® Edit and VIRB Mobile applications.
Outdoor
Garmin offers a broad range of products designed for use in outdoor activities.health, wellness, and fitness activities. Garmin currently offers the following product categories within the Fitness segment to consumers around the world:
Outdoor Handhelds –
Outdoor handhelds range from basic waypoints navigation capabilities to advanced color touchscreen devices offering barometric altimeter, 3-axis compass, camera, microSD™ card slot for optional customized maps, Bluetooth for smartphone connectivity, satellite communication
Wearable Devices –
Garmin offers GPS ruggedized smartwatches for outdoor activity. The fēnix®series provides advanced multisport features for hiking, climbing, skiing, running, cycling, swimming, yoga, and repetition counting. The fēnix series offers several different styling options, including premium jeweler’s grade materials available in the fēnix®Chronos models. The fēnix5, 5S, and 5X offer three different watch face sizes, along with multiple QuickFit®band options available for each model. The fēnix series also offers a variety of navigational tools, third party application support with Connect IQ™ and connected features, as well as Elevate™ wrist heart rate technology for certain models. The fēnix 5X also includes full color mapping. The tactix® provides features inspired by the requirements of law enforcement and police special operations. In 2017, Garmin also introduced the Descent™ Mk1, a watch style dive computer that offers divers GPS navigation, multiple dive modes, support for up to six gasses, and additional features including Garmin Elevate™ wrist heart rate technology and a variety of multisport features.
Golf Devices –
The Approach® series of golf-focused devices includes both handhelds and wrist-worn products with over 41,000 preloaded worldwide golf courses. The offerings range from basic display of yardages to the front, back and middle of greens to advanced, touchscreen devices providing measurement of individual shot distances and display of the slope-adjusted yardage to fairways, hazards and greens. The S20 model is an entry level GPS golf watch that includes AutoShot to automatically record distance and location of shots, daily activity tracking and smart notifications. The S60 model also includes a touchscreen display and PlaysLike feature, which takes into account the elevation change between golfers and their target to calculate the distance for how the shot will likely play. The X40 modelalso includes Garmin Elevate™ wrist-based heart rate monitoring. A statistic-tracking feature allows users to track and analyze their golf statistics through Garmin Connect™ application. Some devices include swing metrics, which give audible tones to fine-tune swing tempo, an internal compass which provides directional assistance to the pin on blind shots, manual pin positioning, which allows users to tap and drag the flag on the green for precise yardage to the flag, and the ability to display emails, text messages and alerts.
Dog Tracking and Training/Pet Obedience Devices –
Garmin offers a series of dog-focused products providing a range of functionality including GPS-enabled dog tracking, electronic dog training, and electronic bark correction. The productsmulti-sport watches are offered under the Astro®Forerunner® product series. The Forerunner series offers GPS-enabled watches with features unique to each model. Depending on the model, features include wrist-based heart rate monitoring, wrist-based pulse oximeter, AMOLED displays, music storage capabilities, mapping capabilities, LTE Connectivity, solar charging, and Garmin Pay™ contactless payment.
Fitness
Garmin Connect and Garmin Connect Mobile:Garmin Connect™ and Garmin IQ: Outdoor Garmin offers a broad range of products designed for use in outdoor activities. Garmin currently offers the following product categories within the Outdoor segment to consumers around the world: 5 Garmin designs, manufactures, and markets a wide range of innovative aircraft avionics solutions to the broad and diverse aviation sector. Avionics are sold directly into aircraft OEM applications as well as through Garmin’s worldwide dealer network for retrofit installations on existing aircraft. Garmin has developed growth-minded products and technologies serving general aviation, business aviation, rotorcraft, and experimental/light sport markets. Our solutions are available for all aircraft categories and classes; from small piston and electric-powered general aviation aircraft to large business jet aircraft, as well as a wide-ranging variety of helicopters, including those serving critical public service and oil and gas missions. Garmin also provides innovative products and software-as-a-service solutions to other growth markets such as commercial air-carrier, military and defense, electric aircraft, and the rapidly evolving Advanced Air Mobility / eVTOL space. By offering products such as Commercial Off-The-Shelf (COTS) and mission-optimized solutions to military and defense contractors/customers, and products tested and optimized for high duty cycle commercial aviation operations, Garmin is emerging as a strong competitor in these business arenas. 6 Garmin currently offers the following products, systems, and services to the global aviation market: 7 Marine Garmin is a leading manufacturer of recreational marine electronics and offers a broad range of products. Garmin currently offers the following product categories within the Marine segment to consumers around the world: : Systems: Radios: Devices: 8 • Auto OEM Garmin has cultivated key relationships with leading automobile manufacturers to be the provider of a variety of hardware and software solutions for their vehicles. Garmin currently offers the Sales and Marketing Garmin’s distribution strategy is to 9 Garmin believes that its principal competitors for Research and Development Garmin’s product innovations are driven by its strong emphasis on research and development and the close partnership between Garmin’s engineering and manufacturing teams. Garmin’s products are created by its engineering and development Manufacturing and Operations Garmin believes one of its core technology competencies Specifically, Garmin believes that Cost:Garmin’s manufacturing resources rapidly and iteratively prototype designs, concepts, products and processes, achieving higher efficiency and resulting in lower cost. Garmin’s vertical integration approach enables leveraging Quality: Garmin’s automation and Garmin’s design, manufacturing, distribution, and service functions in its U.S., Taiwan, China, and U.K. facilities are certified to ISO 9001, an international quality standard developed by the International Organization for Standardization (ISO). Garmin’s automotive operations in Taiwan, China, Poland, and Olathe have achieved IATF 16949 certification, a quality standard for automotive suppliers. Garmin’s Olathe, Kansas and Salem, Oregon aviation operations in the U.S. have achieved certification to AS9100, a quality standard for the aviation industry. Garmin has also implemented multiple health and safety management systems and achieved certification to the ISO 45001 standard for Health and Safety Management at facilities in the U.S., Taiwan, Poland, and China. Time to Market: Garmin uses multi-disciplinary teams of design engineers, process engineers, and supply chain specialists to develop products, allowing them to quickly move from concept to manufacturing. This integrated ownership provides inherent flexibility to enable faster time to market. 10 Materials Garmin purchases components from a Although Seasonality Our net sales are subject to seasonal fluctuation. Sales of our consumer products are generally higher in the fourth quarter due to increased demand during the holiday buying season, and, to a lesser extent, the second quarter due to increased demand during the spring and summer season. Sales of our consumer products are also influenced by the timing of the release of new products. Our aviation and auto OEM products do not experience much seasonal variation, but are more influenced by the timing of aircraft certifications, regulatory mandates, auto program manufacturing, and the release of new products when the initial demand is typically the strongest. Intellectual Property Our success and ability to compete is dependent in part on our proprietary technology. We rely on a combination of patent, copyright, trademark and trade secret laws, as well as confidentiality agreements, to establish and protect our proprietary rights. In addition, Garmin often relies on licenses of intellectual property for use in its business. As of January 5, There is no assurance that our current patents, or patents Environmental Matters Garmin’s operations are subject to various environmental laws, including laws addressing air and water pollution and management of hazardous substances and wastes. Substantial noncompliance with applicable environmental laws could have a material adverse effect on our business. Capital expenditures for environmental controls are included in our normal capital budget. Historically, capital expenditures associated with environmental controls have not been material and compliance with environmental laws has not had a material impact on the Company’s competitive position. 11 Garmin has a global environmental policy and is committed to protecting the environment throughout various aspects of our business. Garmin has implemented multiple Garmin Human Capital Successful execution of our strategy is dependent on attracting, developing, and retaining key employees and members of our management team. To facilitate talent attraction and retention, we provide opportunities for our employees to grow and develop in their careers, supported by generous compensation and benefits, and through programs that As of December 30, Garmin respects the right of all employees to form and join an association to represent their interests as employees, to organize, and to bargain collectively or individually. We also respect any employee’s choice to refrain from joining a union. Except for some of Garmin’s employees in We offer a range of generous benefits to We support local community engagement initiatives where we have a business presence, and we provide opportunities for employees to give back to those communities. One such initiative is through active engagement in Science, Technology, Engineering, and Math (“STEM”) community outreach programs. Our strategic aim in these educational programs is to educate and encourage local students to pursue careers in the engineering field, especially students in underrepresented groups, which we believe benefits not only our company but the overall industry. 12 The risks described below are not the only ones facing our company. Additional risks and uncertainties not presently known to us or that we currently believe to be immaterial may also impair our business operations. If any of the following risks occur, our business, financial condition or operating results could be materially adversely affected. Risks Related to the Company If we are not successful in the continued development, timely manufacture, and introduction of new products or product categories, overall demand for our products could decrease to the extent that lost sales and profits We expect that a significant portion of our future revenue will continue to be derived from sales of newly introduced products. If we are unable to successfully develop and introduce competitive new products, and enhance our existing products, our future results of operations would be materially adversely affected. Our pursuit of necessary technology may require substantial time and expense. We may need to license new technologies to respond to technological change. These licenses may not be available to us on terms that we can accept or may materially change the gross profits that we are able to obtain on our products. We may not succeed in adapting our products to new technologies as they emerge. Development and manufacturing schedules for technology products are difficult to predict, and there can be no assurance that we will achieve timely initial customer shipments of new products. The timely availability of these products in volume and their acceptance by customers are important to our future success. Any future challenges related to new products, whether due to product development delays, manufacturing delays, supply chain constraints, lack of market acceptance, delays in regulatory approval, or otherwise, could have a material adverse effect on our business, financial condition and results of operations. If we are unable to compete effectively with existing or new competitors, The markets for many of our products and services are highly competitive, and we expect competition to increase in the future. Some of our competitors have significantly greater financial, technical and marketing resources than we do. These competitors Maturation or contraction of the market for wearable devices or categories of these devices could adversely affect our revenue and profits. We have experienced periods of annual growth in sales and profits in our outdoor and fitness segments, which 13 We may experience unique economic and political risks associated with companies that operate in Taiwan. Our principal manufacturing facilities for consumer products are located in Taiwan. The We have made and expect to continue making significant investments in the auto We have been awarded several tier-one and tier-two auto OEM supplier contracts. To fulfill the associated program commitments, we have invested significantly in facilities, research and development, and other operating expenses and expect to continue Our The We have experienced significant foreign currency gains and losses due to the strengthening and weakening of the U.S. Dollar relative to certain other currencies. Public health emergencies, including epidemics or pandemics, could have significant impacts on our business. Widespread public health emergencies, including epidemics or pandemics, such as the COVID-19 pandemic, have significantly affected, and may in the future significantly affect, our business due to their impact on the economy and the demand for our products and services, disruptions to our operations, supply chain and sales and distribution channels, and government-imposed restrictions. Additional risks, including gross margin fluctuation, foreign currency fluctuations, product development challenges, impacts to our key personnel, and dependencies on third party suppliers, may be heightened as a result of a widespread public health emergency. If we were unable to manage these risks effectively, our business, financial condition, and results of operations could be materially adversely affected. 14 We depend on third party suppliers and licensors, some of which are sole source, for technology and components used in our products. Our production and business would be seriously harmed if these suppliers or licensors are not able to meet our demand and alternative sources are not available, or if the costs of components rise. We are dependent on third party suppliers for various components used in our current products. Some of the components that we procure from third party suppliers include semiconductors, liquid crystal displays, memory chips, batteries and microprocessors. The availability of high-quality components at reasonable cost is essential to the successful production and sale of our products. Some components we use are from sole source suppliers. We have experienced and may in the future experience shortages of certain components as well as delays in procuring certain components. In addition, a shortage in supply of components may result in an increase of the costs of procuring these components. If suppliers are unable to meet our demand for components on a timely basis or if we are unable to obtain components from an alternative source, or if the price of alternative components is prohibitive, our ability to maintain timely and cost-effective production of our products would be seriously harmed. Our products are also dependent on certain licensed technology and content. If we are unable to continue sourcing such technology and content from our licensors and are unable to obtain an alternative source, or if our relationships with our licensors change detrimentally, our ability to provide certain features in our products would be seriously harmed. Our business and reputation have been and are expected to continue to be impacted by information technology system failures and network disruptions. The Company and its global supply chain have experienced and are expected to continue to be exposed to information technology system failures and network disruptions including those caused by natural disasters, accidents, power disruptions, telecommunications failures, acts of terrorism or war, computer viruses, physical or electronic break-ins, and ransomware or other cybersecurity incidents. We have technology and processes in place designed to detect and respond to such failures and disruptions. However, because the techniques used to obtain unauthorized access, disable or degrade service, or sabotage systems, and the nature of other potential incidents change frequently and may be difficult to detect for long periods of time, our detection and response measures may be ineffective or inadequate. Furthermore, even with appropriate training conducted in support of such measures, human errors and omissions may still occur resulting in system failures and/or disruptions to our information technology infrastructure. Therefore, the Company’s business continuity and disaster recovery planning, or those of others in our global supply chain, may not be able to sufficiently mitigate all threats. Such failures or disruptions can materially adversely affect our business, reputation, results of operations, and financial condition through, among other things, a disruption of internal operations, including order processing, invoicing, and manufacturing and distribution of products, and a loss of functionality of critical systems and online services. Actual or anticipated attacks and risks have caused, and are expected to continue to cause, us to incur increasing costs, including costs to deploy additional personnel and protection technologies, to conduct additional employee training, and to engage third party security experts and consultants. Although we maintain cyber insurance coverage that, subject to policy terms and conditions and significant self-insured retentions, is designed to address certain aspects of cyber risks, such insurance coverage may be insufficient to cover all losses or all types of claims that may arise. 15 Losses or unauthorized access to or releases of proprietary or confidential information, including personal information, could result in significant reputational, financial, legal, and operational consequences. We have experienced, and are expected to continue to experience, malicious attacks and other attempts to gain unauthorized access to our systems that seek to compromise the confidentiality, integrity or availability of proprietary and confidential information. A breach of our security systems and procedures or those of others in our global supply chain could result in significant data losses or theft of our intellectual property, confidential and proprietary information, or that of our business partners, as well as our users’ or employees' personal information, which could compromise our competitive position, reputation, operating results, and financial condition. Also, if we fail to reasonably maintain the security of our intellectual property, confidential and proprietary information, or that of our business partners, or the personal information of our users or employees, we may be subject to private litigation, government investigations, regulatory proceedings, enforcement actions, and cause us to incur potentially significant liability, damages, or remediation costs. Although we maintain cyber insurance coverage that, subject to policy terms and conditions and significant self-insured retentions, is designed to address certain aspects of cyber risks, such insurance coverage may be insufficient to cover all losses or all types of claims that may arise. Our business would suffer if we are not able to hire and retain sufficient qualified personnel or if we lose our key personnel. Our future success depends significantly on the continued contribution of our key executive, engineering, sales, marketing, manufacturing, and administrative personnel. Recruiting and retaining the skilled personnel we require to maintain and grow our market position has been and is expected to continue to be difficult. The overall shortage in qualified workforce personnel combined with the increased willingness of companies to hire such personnel in fully remote positions has increased and in the future may continue to increase our compensation costs in order for us to retain such personnel. If we fail to hire and retain qualified employees, our business and growth prospects will be harmed. We currently do not have employment agreements with any of our key executive officers. Swiss law prohibits us from paying certain severance payments to our senior executive officers, which may impair our ability to recruit for these positions. We do not have key person life insurance on any of our key executive officers and do not currently intend to obtain such insurance. The loss of the services of any of our senior level management, or other key employees, could harm our business. Changes in applicable tax laws or resolutions of tax disputes could result in adverse tax consequences to the Company. Our tax Partially to respond to changes to global tax standards, we initiated an intercompany transaction in 2020 which migrates ownership of certain intellectual property from Switzerland to the United States, which is the company's primary location for research, development and executive management. At the end of this migration, a higher percentage of income will be recognized in the U.S. Due to the subjectivity inherent in transfer pricing associated with this intercompany transaction, we are pursuing an advanced pricing agreement with relevant jurisdictions to provide certainty regarding the pricing. The ultimate outcome and effects of the final advanced pricing agreement are not 16 The implementation of certain tax The demand for our products depends on many factors and may be difficult to forecast due to our increasingly diverse product portfolio, intensifying competition in the markets for our products, and the maturing of markets for some of our products. Significant unanticipated fluctuations in demand have caused and could in the future cause the following challenges to our operations: Changes to trade Economic, regulatory, and political conditions and uncertainty could adversely affect our revenue and profits. Our revenue and profits depend significantly on general economic conditions and the demand for products in the markets in which we compete. We have operations outside the United States that make up a significant portion of our total revenue, which can present challenges depending on economic and geopolitical conditions on both a global and regional scale. Economic weakness or constrained consumer and business spending has resulted in periods of decreased revenue in the past, and could in the future 17 Gross margins for our products may fluctuate or erode. Gross margins in some of Our intellectual property rights are important to our operations, and we could suffer loss if they infringe upon We rely on a combination of patents, copyrights, trademarks and trade secrets, confidentiality provisions and licensing arrangements to establish and protect our proprietary rights. To this end, we hold rights to a number of patents and registered trademarks and regularly file applications to attempt to protect our rights in new technology and trademarks. However, there is no guarantee that our patent applications will become issued patents, or that our trademark applications will become registered trademarks. In addition, effective copyright, patent and trade secret protection may be unavailable, limited or not applied for in certain countries. Moreover, even if approved, our patents or trademarks may thereafter be successfully challenged by others or otherwise become invalidated for a variety of reasons. Thus, any patents or trademarks we currently have or may later acquire may not provide us a significant competitive advantage. The value of our products relies substantially on our technical innovation in fields in which there are many patent filings. Third parties have claimed and may in the future claim that we or our customers (some of whom are indemnified by us) are infringing their intellectual property rights. For example, individuals and groups have purchased and may in future purchase intellectual property assets for the purpose of asserting claims of infringement and attempting to extract settlements from us or our customers. The number of these claims has increased in recent years and may continue to increase in the future. Such claims could have a material adverse effect on our business, financial condition, and Our products and services, or those of our OEM customers in which our products are installed, could be affected by design and manufacturing defects. There can be no assurance we will be able to detect and fix all issues and defects in our products and services, and may have limited ability to respond to those impacting our OEM customers. Failure to do so can result in recalls, product replacements or modifications, reputational harm, and significant If our 18 We have claims and lawsuits against us that may result in adverse outcomes. We are subject to a variety of claims and lawsuits. Adverse outcomes in some or all of these claims may result in significant monetary damages or injunctive relief that could adversely affect our ability to conduct our business. Litigation and other claims are subject to inherent uncertainties and the outcomes can be difficult to predict. Management may not adequately reserve for a contingent liability, or we may suffer unforeseen liabilities, which could then impact the results of a financial period. A material adverse impact on our consolidated financial statements could occur for the period in which the effect of an unfavorable final outcome becomes probable and reasonably estimable or in which Our products may contain undetected security vulnerabilities, which could result in damage to our reputation, lost revenue, diverted development resources, Undiscovered vulnerabilities in our products could expose them to hackers or other unscrupulous third parties who develop and deploy viruses and other malicious software programs that could attack our products. Actual or perceived security vulnerabilities in our products could harm our reputation and lead some customers to return products, to reduce or delay future purchases, or use Our global operations are subject to complex and changing laws and regulations, including those in the following areas: telecommunications; environmental, health and safety; labor and employment; antitrust; data Compliance with these laws and regulations is onerous and expensive, increasing the cost of conducting our global operations. We have implemented policies and procedures designed to Our business is subject to a variety of United States and international laws, regulations and other legal obligations We collect, store, process, and use personal information and other user data. Our users’ personal information may include, among other information, names, addresses, phone numbers, email addresses, payment account information, height, weight, age, gender, heart rates, sleeping patterns, GPS-based location, and activity patterns. Regulatory authorities and 19 Natural disasters, catastrophic events, or Climate change can also pose a risk to Because it is uncertain what laws and regulations will be enacted, we cannot predict the Some of certification. Failure to obtain required certifications of our products on a timely basis, either due to government shutdown or other delays in the certification process, could harm our business. 20 Changes in our United States federal income tax classification, or that of our subsidiaries, could result in adverse tax consequences to The United States Tax Cuts and Jobs Act (the “2017 Act”) signed on December 22, 2017 may have changed the consequences to U.S. shareholders that own, or are considered to own, as a result of the attribution rules, ten percent or more of the voting power or value of the stock of a non-U.S. corporation (a 10% U.S. shareholder) under the U.S. federal income tax law applicable to owners of U.S. controlled foreign corporations (“CFCs”). The 2017 Act repealed Internal Revenue Code Section 958(b)(4), which, unless clarified in future regulations or other guidance, may result in classification of certain of the Company’s foreign subsidiaries as CFCs with respect to any single 10% U.S. shareholder. This may be the result without regard to whether 10% U.S. shareholders together own, directly or indirectly, more than fifty percent of the voting power or value of the Company as was the case under prior rules. Additional tax consequences to 10% U.S. shareholders of a CFC may result from other provisions of the 2017 Act. For example, the 2017 Act added Section 951A to the Internal Revenue Code, which requires a 10% U.S. shareholder of a CFC to include in income its pro-rata share of the global intangible low-taxed income (GILTI) of the CFC. The 2017 Act also eliminated the requirement in Section 951(a) necessitating that a foreign corporation be considered a CFC for an uninterrupted period of at least 30 days in order for a 10% U.S. shareholder to have a current income inclusion. From time to time, the Company may elect to employ antidilutive measures such Our quarterly operating results are subject to fluctuations and seasonality. Our operating results are difficult to predict. Our future quarterly operating results may fluctuate significantly. If such operating results decline, the price of our Historically, our revenues have been We rely on independent dealers and distributors to sell our products, and disruption to these channels would harm our business. Because we sell many of our products to independent dealers and distributors, we are subject to many risks, including risks related to their inventory levels and support for our products. Many of our dealers and distributors also sell products offered by our competitors. If our competitors offer our dealers and distributors more favorable terms, those dealers and distributors may de-emphasize or decline to carry our products. In the future, we may not be able to retain or attract a sufficient number of qualified dealers and distributors. If we are unable to maintain successful relationships with dealers and distributors or to expand our distribution channels, our business will suffer. Our large customers may also seek to leverage their position to improve their profitability through increased promotional programs or other measures, which could have a negative impact on our gross margin. Additionally, the loss of any large customer could adversely affect our sales and profits. See Note 1 in the Notes to the Consolidated Financial Statements for more information on concentration of credit risk. 21 We may pursue strategic acquisitions, investments, strategic partnerships or other ventures, and our business could be materially harmed if we fail to successfully identify, evaluate, complete, and integrate such transactions. We Any past or future acquisition could also result in difficulties assimilating acquired employees, operations, and products and diversion of capital and management’s attention away from other business issues and opportunities. Integration of acquired companies may result in problems related to integration of technology and inexperienced management teams. Due diligence performed prior to closing acquisitions may not uncover certain risks or liabilities that could materially impact our business and financial results. In addition, the key personnel of the acquired company may decide not to work for us. We may not successfully integrate business, operational, and financial activities such as internal controls, Geopolitical instability, acts of war or acts of terrorism could have a material adverse impact on our A shut down of airspace or imposition of restrictions on general aviation would harm our business. The shutdown of airspace could cause reduced sales of our general aviation products and delays in the shipment of our products manufactured in our Taiwan manufacturing facilities to our global distribution facilities, thereby adversely affecting our ability to supply new and existing products to our dealers and distributors. Many of our products rely on the Global Positioning System and other Global Satellite Navigation Systems (GNSS). The Global Positioning System (GPS) is a satellite-based navigation and positioning system consisting of a constellation of orbiting satellites. The satellites and their ground control and monitoring stations are maintained and operated by the United States Department of Defense. The Department of Defense does not currently charge users for access to the satellite signals. These satellites and their ground support systems are complex electronic systems subject to electronic and mechanical failures and possible sabotage. GPS is operated by the U.S. Government, which is committed to maintenance and improvement of GPS; however, if the policy were to change, and commercial access to GPS 22 Some of our products also use signals from Satellite Based Augmentation Systems (SBAS) that augment GPS, such as the U.S. Wide Area Augmentation System (WAAS), Japanese MTSAT-based Satellite Augmentation System (MSAS) Some of our products also use satellite signals from Russia’s GLONASS, the Our Global Positioning System technology is dependent on the use of the Standard Positioning Service (SPS) provided by the U.S. Government’s This or any other ITU or national reallocation of radio frequency spectrum, including frequency band segmentation or sharing of spectrum, or other modifications of the permitted uses of relevant frequency bands, may materially and adversely affect the utility and reliability of our products and could have significant negative impacts on our business and our customers. Risks Relating to Our Shares The volatility of our The market price of our shares has been, and may continue to be, highly volatile. During 23 In addition, in recent years the stock market in general and the markets for shares of technology companies in particular, have experienced extreme price fluctuations which have often been unrelated to the operating performance of affected companies. Any such fluctuations in the future could adversely affect the market price of our common shares. Our officers and directors exert substantial influence over us. As of January The rights of our shareholders are governed by Swiss law. The rights of our shareholders are governed by Swiss law and Garmin Ltd.’s articles of association. The rights of shareholders under Swiss law differ from the rights of shareholders of companies incorporated in other jurisdictions. For example, We have limited capital reserves from which to make distributions 24 When the We are a Swiss Item 1B. Unresolved Staff Comments None. Item Risk Management and Strategy Garmin has a cybersecurity risk management program, generally aligned with the tenets and methodologies of industry standards and best practices such as the National Institute of Standards and Technology (NIST) Cybersecurity Framework, designed to protect the confidentiality, integrity, and availability of the Company’s information systems through assessing, identifying, and managing material risks from cybersecurity threats. The Material Risk Identification The Company identifies risks from cybersecurity threats through a variety of methods including, but not limited to, internal and external assessments, security incidents, evaluations of changes to the business environment, systems, or 25 Material Risk Assessment The Company evaluates material risks from cybersecurity threats in terms of the potential impact on technology, information, data, and business operations, taking into account applicable laws and regulations, and with a focus on protecting the confidentiality, integrity, and availability of information, data and systems. Associated risk assessments are performed by the Company’s risk analysts, subject matter experts, and information technology associates to identify, analyze, and quantify the risks and relevant objectives, and to determine the appropriate management action and priorities for managing the risks and implementing mitigating controls. Additional assessments to evaluate residual risk are performed when there are changes to controls that have the potential to create a material risk. Risk assessments also include appropriate considerations for regulatory and contractual requirements, and involve the Company’s legal, data privacy, finance, and risk assurance functions as applicable. Material Risk Management The Company continually analyzes and responds to material risks from cybersecurity threats in order to manage them to acceptable levels. The results of related risk assessments are used to prioritize the risks based on their potential impact to the Company and to inform the necessary actions and the appropriate functions to be involved in responding to those risks. Garmin’s cybersecurity risk management processes are integrated into the Company’s overall risk management processes. Material risks from cybersecurity threats are communicated to the Company’s management and Board of Directors and are evaluated and considered alongside operational, legal, and other risks faced by the Company in determining mitigating actions and the allocation of resources. Risks Related to Third-party Service Providers Garmin operates a third-party risk management program, which is aligned to NIST principles, to oversee and identify material risks from cybersecurity threats, undertake appropriate remediation, and establish and maintain compensating controls when appropriate. We conduct cybersecurity assessments of third-party service providers that will process personal, confidential, or proprietary information. Before proceeding with any such third-party service provider, we require them to remediate or mitigate any material findings from our cybersecurity assessment and to agree contractually to maintain acceptable cybersecurity practices throughout the duration of their service to Garmin and after for so long as they retain any personal, confidential, or proprietary information, and to promptly notify Garmin of any cybersecurity incidents that impact Garmin. Risks from Cybersecurity Threats While the Company has technology and processes in place designed to detect and respond to cybersecurity threats, we are continually at risk from the evolving cybersecurity threat landscape. Management does not believe our business strategy, results of operations, or financial condition have been materially affected by risks from cybersecurity threats, but we cannot provide assurance that they will not be materially affected in the future by such risks. For additional information about risks from cybersecurity threats, see Part I, Item 1A, “Risk Factors” of this Annual Report on Form 10-K. Governance Board of Directors Oversight Garmin’s entire Board of Directors performs the risk oversight role, including with respect to risks from cybersecurity threats. Garmin’s Chief Executive Officer is a member of the Board, and Garmin’s Chief Financial Officer and its 26 Management’s Role Managing Risk and Monitoring Incidents Garmin's head of cybersecurity, who has over 30 years of relevant cybersecurity experience, oversees the Company’s cybersecurity risk management program and is responsible for assessing and managing the Company’s material risks from cybersecurity threats. Garmin’s head of cybersecurity regularly meets with the Company’s senior management, including the Chief Executive Officer, to discuss the Company’s cybersecurity practices, risks, risk mitigation strategies, and whether further investments in internal or external cybersecurity resources are warranted. If the cybersecurity team detects a potentially significant cybersecurity incident it is escalated promptly to the Company’s head of cybersecurity, who then activates the Company’s incident response plan and convenes the incident response team, which includes leaders of the Company’s Legal, Finance, Operations, Communications, Risk Assurance, and other departments and executive leadership as appropriate. The Chief Executive Officer will inform the Company’s Board of Directors of any material cybersecurity incidents. 27 Item 2. Properties Garmin and its subsidiaries own a majority of their principal properties and lease certain other properties. Depending on location, the properties could be used for manufacturing, warehousing, research and development, office space, or a combination of activities. Garmin’s principal properties are described below: Garmin International, Inc. owns and Garmin Garmin International, Inc. also owns approximately 367 acres of additional land in Olathe, Kansas that could accommodate future property development. Garmin AT, Inc. leases approximately Garmin Garmin (Europe) Ltd. owns and occupies a 155,000 square foot building located at Liberty House, Hounsdown Business Park, Southampton, U.K., and leases a 100,000 square foot facility at 4 Parham Dr, Boyatt Wood, Eastleigh, U.K., both used for warehousing, distribution, and office space. Tacx B.V. owns and occupies a 291,000 square foot facility located at De Boeg 2, 2343 MA Oegstgeest, Netherlands. This facility is used for design and development, manufacturing, and warehousing of indoor training products. Garmin Wroclaw sp. z o.o leases a 319,000 square foot facility located at Ul. Ryszarda Chomicza 2, 55-040 Biskupice Podgórne, Poland. This facility is used for the manufacturing of certain auto OEM products, as well as distribution of other Garmin products in 28 Garmin also owns and leases other properties around the world that are not described above and are used In the normal course of business, the Company and its subsidiaries are parties to various legal claims, actions, and complaints, including matters involving patent infringement, other intellectual property, product liability, customer claims and various other risks. It is not possible to predict with certainty whether or not the Company and its subsidiaries will ultimately be successful in any of these legal matters, or if not, what the impact might be. However, the Company’s management does not expect that the results in any of these legal proceedings will have a material adverse effect on the Company’s results of operations, financial position or cash flows. The Company settled or resolved certain Item 4. Mine Safety Disclosure Information about our Executive Officers Garmin’s executive officers as of February 21, 2024 were as follows: Name Office Age Dr. Min Kao Executive Chairman 75 Clifton Pemble President and Chief Executive Officer 58 Douglas Boessen Chief Financial Officer and Treasurer 61 Andrew Etkind Vice President, General Counsel and Secretary 68 Patrick Desbois Executive Vice President, Operations 55 Philip Straub Executive Vice President, Managing Director – Aviation 53 Danny Bartel Vice President, Worldwide Sales 74 Sean Biddlecombe Managing Director, EMEA 59 Susan Lyman Vice President, Global Consumer Marketing 58 Laurie Minard Vice President, Human Resources 57 Matthew Munn Vice President, Managing Director – Auto OEM 62 Wang Cheng-Wei General Manager of Garmin Corporation 59 Dr. Min H. Kao Clifton A. Pemble Douglas G. Boessen Andrew R. Etkind 29 Patrick Desbois has served as Executive Vice President, Operations of Garmin International, Inc., a principal subsidiary of Garmin Ltd., since Philip Straub has served as Executive Vice President, Managing Director - Aviation of Garmin International, Inc. since February 2017. Since joining Garmin in July 1993 as a Software Engineer, he has held various other positions, including Director of Engineering and Software Engineering Manager. Mr. Danny Bartel has served as Vice President, Worldwide Sales of Garmin International, Inc. since October 2006. Since joining Garmin as a Sales Manager in November 1992, he has held various other positions, including Senior Director Worldwide Sales, Director Consumer Sales and Director International Marketing. Mr. Bartel also serves as a director and officer of various other Garmin subsidiaries. Sean Biddlecombe has served as Managing Director, EMEA for Garmin (Europe) Ltd., a principal subsidiary of Garmin Ltd., since February 2011. He joined Garmin in February 1994 as General Manager of Garmin (Europe) Ltd. Mr. Biddlecombe also serves as a director and officer of various other Garmin subsidiaries. Susan Lyman has served as Vice President, Global Consumer Marketing of Garmin International, Inc. since June 2016. Since rejoining Garmin in 2010, she has held the positions of Product Manager, Team Leader Marketing and Director Marketing. Ms. Lyman previously worked for Garmin as a Marketing Manager from Laurie Minard has served as Vice President, Human Resources of Garmin International, Inc. since July 2007. Since joining Garmin in March 1996, she has held the positions of Human Resources Specialist and Director, Human Resources. Matthew Munn has served as Vice President, Managing Director – Auto OEM of Garmin International, Inc. since joining Garmin in May 2011. Wang Cheng-Wei has served as General Manager of Garmin Corporation, a All executive officers are elected 30 Since December 7, 2021, Garmin’s shares have traded on the New York Stock Exchange under the symbol "GRMN". Prior to December 7, 2021, Garmin's shares were traded on The Nasdaq Stock Market, LLC under the symbol “GRMN” since its initial public offering on December 8, 2000 (the “IPO”). As of We refer you to Item 12 of this report under the caption “Equity Compensation Plan Information” for certain equity plan information required to be disclosed by Item 201(d) of Regulation S-K. Issuer Purchases of Equity Securities Share repurchase activity during the 13-week period ended December 30, 2023, summarized on a trade-date basis, was as follows (in thousands, except per share amounts): Period Total Number of Shares Purchased (1) Average Price Paid Per Share (2) Total Number of Shares Purchased as Part of Publicly Announced Plans or Programs Approximate Dollar Value of Shares That May Yet Be Purchased Under the Plans or Programs October 1, 2023 - October 28, 2023 57 $ 103.17 57 $ 12,230 October 29, 2023 - November 25, 2023 30 $ 116.10 30 $ 8,782 November 26, 2023 - December 30, 2023 71 $ 123.75 71 $ 0 Total 158 158 (1) The Board of Directors approved a share repurchase program on April 22, 2022 (the "2022 Program") that was announced on April 27, 2022, authorizing the Company to purchase up to $300 million of its common shares, exclusive of the cost of any associated excise tax. Share repurchases may have been made in the open market or in privately negotiated transactions, including under plans complying with the provisions of Rule 10b5-1 and Rule 10b-18 of the Securities Exchange Act of 1934, as amended. The timing and volume of share repurchases were subject to market conditions, business conditions and applicable laws, and were at management’s discretion. The 2022 Program did not require the purchase of any minimum number of shares and may have been suspended or discontinued at any time. The share repurchase authorization expired on December 29, 2023. See Note 8 of the Notes to Consolidated Financial Statements included in Part II, Item 8 of this Annual Report on Form 10-K for additional information related to share repurchases. (2) Average price paid per share includes costs associated with the repurchases, except for the cost of any associated excise tax. Dividends Future dividends on our common shares, if any, must be approved by our shareholders. In exercising their discretion to recommend to the shareholders that such dividends be approved, our Board of Directors will consider our financial condition, results of operations, cash requirements and surplus, statutory requirements of applicable law, contractual restrictions, and other factors that they may deem relevant. For additional information, see the risk factor in Part I, Item 1A, of this Annual Report on Form 10-K entitled "We have limited capital reserves from which to make distributions without subjecting our shareholders to Switzerland withholding tax." 31 Stock Performance Graph This performance graph shall not be deemed ‘‘filed’’ with the SEC or subject to Section 18 of the Securities Exchange Act of 1934, nor shall it be deemed incorporated by reference in any of our filings under the Securities Act of 1933, as amended. The graph below matches Garmin Ltd.'s cumulative 5-Year total shareholder return on common 12/29/18 12/28/19 12/26/20 12/25/21 12/31/22 12/30/23 Garmin Ltd. 100.00 160.96 201.42 229.51 162.26 232.18 NASDAQ Composite 100.00 136.69 198.10 242.03 163.28 236.17 S&P 500 100.00 131.49 155.68 200.37 164.08 207.21 S&P 500 Consumer Discretionary 100.00 127.94 170.54 212.21 133.63 190.29 The Item 6. [Reserved] 32 Item 7. Management’s Discussion and Analysis of Financial Condition and Results of Operations The following discussion and analysis of our financial condition and results of operations focuses on and is intended to clarify the results of our operations, certain changes in our financial position, liquidity, capital structure and business developments As previously noted, the discussion set forth below, as well as other portions of this Form 10-K, contain statements concerning potential future events. Readers can identify these forward-looking statements by their use of such verbs as “expects,” “anticipates,” “believes”, or similar verbs or conjugations of such verbs. If any of our assumptions on which the statements are based prove incorrect or should unanticipated circumstances arise, our actual results could materially differ from those anticipated by such forward-looking statements. The differences could be caused by a number of factors or combination of factors including, but not limited to, those discussed above in Item 1A. Readers are strongly encouraged to consider those factors when evaluating any such forward-looking statement. Except as may be required by law, we do not undertake to update any forward-looking statements in this Form 10-K. Garmin’s fiscal year is a 52-53 week period ending on the last Saturday of the calendar year. Fiscal year Unless otherwise indicated, dollar amounts set forth in the tables are in thousands, except per share data. Overview A number of headwinds including high inflation and interest rates affected the economic environment and consumer behaviors during 2023. Additionally, while our 33 Critical Accounting General Unrecognized Income Tax Benefits We recognize liabilities associated with uncertain income tax positions, including those related to transfer pricing, based on our estimate of whether, and the extent to which, additional taxes will be due. We recognize the tax benefits from an uncertain tax position only if payment of these amounts ultimately proves to be not required or it is more likely than not that the tax position will be sustained upon examination by the taxing authorities, based on the technical merits of the position. The tax benefits recognized in the Assessing uncertain tax positions requires significant judgment, including the evaluation of unique facts and circumstances and the interpretation of laws and regulations, especially the assessment of pricing analyses that may produce various ranges of outcomes. Variations in the actual outcome of these future tax consequences could materially impact our consolidated financial statements. Accounting Terms and Characteristics Net Sales Our net sales are primarily generated through sales to our retail partners, dealer and distributor network, installation and Net sales are subject to seasonal fluctuation. Typically, sales of our consumer products are highest in the fourth quarter due to increased demand during the holiday buying season, and, to a lesser extent, in the second quarter due to increased demand during the spring and summer season. Sales of our consumer products are also influenced by the timing of the release of new products. Our aviation and auto OEM products do not experience much seasonal variation but are more influenced by the timing of aircraft certifications, regulatory mandates, auto program manufacturing, and the release of new products when the initial demand is typically the strongest. Cost of Raw material costs are our most significant component of cost of goods sold. Our existing practice of performing the design and manufacture of our products in-house has enabled us to source components from different suppliers and, where possible, to redesign our products to leverage 34 We believe that our flexible production model allows our Shipping and Sales price variability, including that which is associated with foreign currency fluctuations, has had and can be expected to have an effect on our gross profit. Advertising Expense Our advertising expenses consist primarily of costs for media advertising, cooperative advertising with our retail partners, point of sale displays, and sponsorships. Selling, General and Administrative Expenses Our selling, general and administrative expenses consist primarily of: Research and Development The majority of our research and development costs represent We are committed to increasing the level of innovative design and development of new products as we strive for expanded ability to serve our existing consumer and aviation markets as well as new auto OEM programs and new markets for active lifestyle products. Results of Operations The Company announced an organization realignment in January 2023, which combined the consumer auto operating segment with the outdoor operating segment. As a result, the Company’s operating segments, which also represent its reportable segments, are fitness, outdoor, aviation, marine, and auto OEM. Results for the 53-week and 52-week periods ended December 31, 2022 and December 25, 2021, respectively, have been recast to conform to current period presentation. This change had no effect on the Company’s consolidated results of operations. 35 The following table sets forth our results of operations as a percentage of net sales during the periods shown (the table may not foot due to rounding): 52-Weeks Ended 53-Weeks Ended 52-Weeks Ended December 30, 2023 December 31, 2022 December 25, 2021 100 % 100 % 100 % 43 % 42 % 42 % 57 % 58 % 58 % 3 % 3 % 3 % 16 % 16 % 14 % 17 % 17 % 16 % 37 % 37 % 34 % 21 % 21 % 24 % Other income (expense), net 2 % 1 % 0 % 23 % 22 % 24 % Provision for income taxes (2 )% 2 % 3 % 25 % 20 % 22 % 52-Weeks Ended December 30, 2023 Fitness Outdoor Aviation Marine Auto OEM Net sales $ 1,344,637 $ 1,697,151 $ 846,329 $ 916,911 $ 423,224 Cost of goods sold 627,731 624,290 220,341 425,650 325,285 Gross profit 716,906 1,072,861 625,988 491,261 97,939 Total operating expenses 484,705 557,607 399,588 311,832 159,063 Operating income (loss) $ 232,201 $ 515,254 $ 226,400 $ 179,429 $ (61,124 ) 53-Weeks Ended December 31, 2022 Fitness Outdoor Aviation Marine Auto OEM Net sales $ 1,109,419 $ 1,770,275 $ 792,799 $ 903,983 $ 283,810 Cost of goods sold 557,002 670,867 219,736 412,526 193,380 Gross profit 552,417 1,099,408 573,063 491,457 90,430 Total operating expenses 447,679 526,127 359,877 276,153 169,094 Operating income (loss) $ 104,738 $ 573,281 $ 213,186 $ 215,304 $ (78,664 ) 52-Weeks Ended December 25, 2021 Fitness Outdoor Aviation Marine Auto OEM Net sales $ 1,533,788 $ 1,606,664 $ 712,468 $ 875,151 $ 254,724 Cost of goods sold 720,463 618,002 192,647 379,841 181,383 Gross profit 813,325 988,662 519,821 495,310 73,341 Total operating expenses 454,124 464,193 326,633 245,529 181,360 Operating income (loss) $ 359,201 $ 524,469 $ 193,188 $ 249,781 $ (108,019 ) 36 Net Sales Net Sales 52-Weeks Ended December 30, 2023 Year-over-Year Change 53-Weeks Ended December 31, 2022 Year-over-Year Change 52-Weeks Ended December 25, 2021 Fitness $ 1,344,637 21 % $ 1,109,419 (28 %) $ 1,533,788 Percentage of Total Net Sales 26 % 23 % 31 % 1,697,151 (4 %) 1,770,275 10 % 1,606,664 Percentage of Total Net Sales 32 % 36 % 33 % Aviation 846,329 7 % 792,799 11 % 712,468 Percentage of Total Net Sales 16 % 16 % 14 % 916,911 1 % 903,983 3 % 875,151 Percentage of Total Net Sales 18 % 19 % 17 % Auto OEM 423,224 49 % 283,810 11 % 254,724 Percentage of Total Net Sales 8 % 6 % 5 % $ 5,228,252 8 % $ 4,860,286 (2 %) $ 4,982,795 Net sales increased The increase in fitness revenue was driven by sales growth Gross Profit Gross Profit 52-Weeks Ended December 30, 2023 Year-over-Year Change 53-Weeks Ended December 31, 2022 Year-over-Year Change 52-Weeks Ended December 25, 2021 Fitness $ 716,906 30 % $ 552,417 (32 %) $ 813,325 Percentage of Segment Net Sales 53 % 50 % 53 % Outdoor 1,072,861 (2 %) 1,099,408 11 % 988,662 Percentage of Segment Net Sales 63 % 62 % 62 % Aviation 625,988 9 % 573,063 10 % 519,821 Percentage of Segment Net Sales 74 % 72 % 73 % Marine 491,261 0 % 491,457 (1 %) 495,310 Percentage of Segment Net Sales 54 % 54 % 57 % Auto OEM 97,939 8 % 90,430 23 % 73,341 Percentage of Segment Net Sales 23 % 32 % 29 % Total $ 3,004,955 7 % $ 2,806,775 (3 %) $ 2,890,459 Percentage of Total Net Sales 57 % 58 % 58 % The fitness and outdoor gross margin increases of 350 basis points and 110 basis points, respectively, were primarily attributable to favorable freight costs. The aviation gross margin increase of 170 basis points was primarily attributable to lower warranty costs. Gross margin remained relatively flat within the marine segment. The auto mix. 37 Operating Expense Operating Expense 52-Weeks Ended December 30, 2023 Year-over-Year Change 53-Weeks Ended December 31, 2022 Year-over-Year Change 52-Weeks Ended December 25, 2021 Advertising Expense $ 173,109 3 % $ 168,040 (2 %) $ 171,829 Percentage of Total Net Sales 3 % 3 % 3 % Selling, general, and administrative expenses 834,990 8 % 775,963 8 % 721,260 Percentage of Total Net Sales 16 % 16 % 14 % Research and development expense 904,696 8 % 834,927 7 % 778,750 Percentage of Total Net Sales 17 % 17 % 16 % Total $ 1,912,795 8 % $ 1,778,930 6 % $ 1,671,839 Percentage of Total Net Sales 37 % 37 % 34 % Selling, general and administrative Research and development expense increased 8% in absolute dollars and was relatively flat as a percent of revenue compared to the year-ago period. The absolute dollar increase was primarily due to Operating Income Operating Income (Loss) 52-Weeks Ended December 30, 2023 Year-over-Year Change 53-Weeks Ended December 31, 2022 Year-over-Year Change 52-Weeks Ended December 25, 2021 Fitness $ 232,201 122 % $ 104,738 (71 %) $ 359,201 Percentage of Segment Net Sales 17 % 9 % 23 % Outdoor 515,254 (10 %) 573,281 9 % 524,469 Percentage of Segment Net Sales 30 % 32 % 33 % Aviation 226,400 6 % 213,186 10 % 193,188 Percentage of Segment Net Sales 27 % 27 % 27 % Marine 179,429 (17 %) 215,304 (14 %) 249,781 Percentage of Segment Net Sales 20 % 24 % 29 % Auto OEM (61,124 ) (22 %) (78,664 ) (27 %) (108,019 ) Percentage of Segment Net Sales (14 %) (28 %) (42 %) Total $ 1,092,160 6 % $ 1,027,845 (16 %) $ 1,218,620 Percentage of Total Net Sales 21 % 21 % 24 % Total operating income increased 6% in absolute dollars and was relatively flat as a percent of revenue Other Income (Expense) Other Income (Expense) 52-Weeks Ended December 30, 2023 53-Weeks Ended December 31, 2022 52-Weeks Ended December 25, 2021 $ 77,302 $ 40,826 $ 28,573 26,434 (11,274 ) (45,263 ) Other income 4,460 7,577 4,866 $ 108,196 $ 37,129 $ (11,824 ) The average interest rate returns on cash and investments 38 Foreign currency gains and losses for the Company are The The Income Tax Provision (Benefit) 52-Weeks Ended December 30, 2023 53-Weeks Ended December 31, 2022 52-Weeks Ended December 25, 2021 Income before income taxes $ 1,200,356 $ 1,064,974 $ 1,206,796 Income tax provision (benefit) (89,280 ) 91,389 124,596 Effective tax rate (7 %) 9 % 10 % Global taxing standards have evolved as a result of the Organization for Economic Co-Operation and Development (OECD) recommendations aimed at preventing perceived base erosion and profit shifting (BEPS) by multinational corporations. The OECD issued a statement regarding a two-pillar solution which includes within “Pillar Two” a global minimum tax. Numerous countries have signed onto the OECD statement including Switzerland, the U.S., and the U.K. In 2023, Switzerland’s Federal Council passed legislation which would implement a federal minimum tax in Switzerland of 15% in 2024. Additionally, the Swiss canton of Schaffhausen has also passed legislation that would increase the cantonal corporate tax rate beginning in 2024 and result in a Additionally, we initiated an intercompany transaction in 39 Net Income As a result of the various factors noted above net income increased Liquidity and Capital Resources As of December 30, 2023, we had approximately $3.1 billion of cash, cash equivalents and marketable securities. Management invests idle or surplus cash in accordance with the investment policy, which has been approved by the Company’s Board of Cash used in investing activities totaled $333.0 million for fiscal 2023, compared to $145.1 million for fiscal 2022. The increase was primarily due to an increase in cash Cash used in financing activities totaled $636.5 million for fiscal 2023, compared to $840.6 million for fiscal 2022. This decrease was primarily due to lower purchases of treasury Uses of Cash The Company has retail. As of December 30, Inventory Purchase Obligations The Company 40 Other Purchase Obligations The Company’s other purchase obligations primarily consist of noncancelable commitments for capital expenditures and other indirect purchases in connection with conducting our business. Other Uses of Additionally, while we expect our effective tax rate to be higher in fiscal 2024, when compared to fiscal years 2023, 2022, and 2021, we expect net cash outlays for income taxes in fiscal 2024 to be materially similar to net cash outlays for income taxes in fiscal 2023, primarily associated with our Item 7A. Quantitative and Qualitative Disclosures About Market Risk Market Sensitivity We have market risk primarily in connection with the pricing of our products and services, Inflation Foreign Currency Exchange Rate Risk The operation of Garmin’s subsidiaries in international markets results in exposure to movements in currency exchange rates. We have experienced significant The currencies that Most European subsidiaries use the Euro as the functional currency. The functional currency of our largest European subsidiary, Garmin (Europe) Ltd. 41 During fiscal year We assessed the Company’s exposure to movements in currency exchange rates by performing a sensitivity analysis of adverse changes in exchange rates and the corresponding impact to our results of operations. Based on monetary assets and liabilities denominated in currencies other than respective functional currencies as of December 30, Interest Rate Risk We have no outstanding long-term debt as of December 30, We are exposed to interest rate risk in connection with our investments in marketable securities. As interest rates change, the unrealized gains and losses associated with The primary objectives of the Company’s investment policy We assessed the Company’s exposure to interest rate risk by performing a sensitivity analysis of a parallel shift in the yield curve and the corresponding impact to the Company’s portfolio of marketable securities. Based on balance sheet positions as of December 30, 42 Item 8. Financial Statements and Supplementary Data CONSOLIDATED FINANCIAL STATEMENTS Garmin Ltd. and Subsidiaries Years Ended December 30, Contents 43 Report of Independent Registered Public Accounting Firm To the Opinion on the Financial Statements We have audited the accompanying consolidated balance sheets of Garmin Ltd. and Subsidiaries (the Company) as of December 30, We also have audited, in accordance with the standards of the Public Company Accounting Oversight Board (United States) (PCAOB), the Company’s internal control over financial reporting as of December 30, Basis for Opinion These financial statements are the responsibility of the Company’s management. Our responsibility is to express an opinion on the Company’s financial statements based on our audits. We are a public accounting firm registered with the PCAOB and are required to be independent with respect to the Company in accordance with the U.S. federal securities laws and the applicable rules and regulations of the Securities and Exchange Commission and the PCAOB. We conducted our audits in accordance with the standards of the PCAOB. Those standards require that we plan and perform the audit to obtain reasonable assurance about whether the financial statements are free of material misstatement, whether due to error or fraud. Our audits included performing procedures to assess the risks of material misstatement of the financial statements, whether due to error or fraud, and performing procedures that respond to those risks. Such procedures included examining, on a test basis, evidence regarding the amounts and disclosures in the financial statements. Our audits also included evaluating the accounting principles used and significant estimates made by management, as well as evaluating the overall presentation of the financial statements. We believe that our audits provide a reasonable basis for our opinion. Critical Audit Matter The critical audit matter communicated below is a matter arising from the current period audit of the financial statements that was communicated or required to be communicated to the audit committee and that: (1) relates to accounts or disclosures that are material to the financial statements and (2) involved our especially challenging, subjective or complex judgments. The communication of the critical audit matter does not alter in any way our opinion on the consolidated financial statements, taken as a whole, and we are not, by communicating the critical audit matter below, providing a separate opinion on the critical audit matter or on the accounts or disclosures to which it relates. 44 Measurement of Reserve for Unrecognized Income Tax Benefits Description of the Matter The Company accounts for uncertainty in income taxes in accordance with the FASB ASC 740 topic, Income Taxes. The Company operates in a multinational tax environment and is subject to tax laws, regulations and guidelines for intercompany transactions that have transfer pricing subjectivity. The Company uses significant judgment to evaluate uncertain tax positions and determine whether the threshold for recognition has been met and to measure the largest amount of benefit that is more likely than not to be realized upon ultimate settlement. As discussed in Note 5 to the consolidated financial statements, the Company’s balance of gross unrecognized income tax benefits was $14 million at December 30, 2023, primarily related to transfer pricing positions. Auditing management’s assessment and measurement of material tax positions is complex and involved especially subjective and complex judgments. The assessment process involves both significant judgment to evaluate each position against the recognition threshold and estimation because the pricing of the intercompany transactions is based on pricing analyses that may produce a number of different outcomes or ranges of outcomes (e.g., the price that would be charged in an arm’s-length transaction). Each transfer pricing tax position carries unique facts and circumstances that must be evaluated, and ultimate resolution will be dependent on uncontrollable factors, such as the interpretation of laws and regulations; new case law; the willingness of the income tax authority to settle the issue, including the timing thereof; and other factors. How We Addressed the Matter in Our Audit We obtained an understanding, evaluated the design and tested the operating effectiveness of controls that address the risks of material misstatement relating to the identification, assessment, measurement and valuation of uncertain tax positions related to transfer pricing from intercompany transactions. For example, we tested controls over management’s review of intercompany transfer pricing positions against the measurement criteria, review of inputs and calculations of these uncertain tax positions, which included management’s evaluation of the ranges of outcomes and pricing conclusions reached within the transfer pricing studies. Our audit procedures included, among others, involving our tax professionals to test the Company’s assessment and measurement of tax positions related to transfer pricing used in intercompany transactions to assess the appropriateness of the ranges of outcomes utilized, the determination of the likelihood of the outcomes, and any related pricing or valuation conclusions reached within the transfer pricing analyses conducted by the Company. For example, we compared the transfer pricing methodology utilized by management to alternative methodologies and industry benchmarks. We also verified our understanding of the relevant facts by reading the Company’s correspondence with the relevant tax authorities and any third-party advice obtained by the Company. In addition, we used our knowledge of international and local income tax laws, as well as historical settlement activity from income tax authorities, to evaluate the appropriateness of the Company’s measurement of uncertain tax positions related to transfer pricing used in these intercompany transactions. /s/ Ernst & Young LLP We have served as the Company’s auditor since 1990. Kansas City, Missouri February 21, 2024 45 Garmin Ltd. and Subsidiaries Consolidated Statements of Income (In thousands, except per share information) Fiscal Year Ended December 30, 2023 December 31, 2022 December 25, 2021 Net sales $ 5,228,252 $ 4,860,286 $ 4,982,795 Cost of goods sold 2,223,297 2,053,511 2,092,336 Gross profit 3,004,955 2,806,775 2,890,459 Advertising expense 173,109 168,040 171,829 Selling, general and administrative expenses 834,990 775,963 721,260 Research and development expense 904,696 834,927 778,750 Total operating expense 1,912,795 1,778,930 1,671,839 Operating income 1,092,160 1,027,845 1,218,620 Other income (expense): Interest income 77,302 40,826 28,573 Foreign currency gains (losses) 26,434 (11,274 ) (45,263 ) Other income 4,460 7,577 4,866 Total other income (expense) 108,196 37,129 (11,824 ) Income before income taxes 1,200,356 1,064,974 1,206,796 Income tax provision (benefit): Current 250,446 233,844 130,040 Deferred (339,726 ) (142,455 ) (5,444 ) Total income tax provision (benefit) (89,280 ) 91,389 124,596 Net income $ 1,289,636 $ 973,585 $ 1,082,200 Basic net income per share $ 6.74 $ 5.06 $ 5.63 Diluted net income per share $ 6.71 $ 5.04 $ 5.61 See accompanying notes. 46 Garmin Ltd. and Subsidiaries Consolidated Statements of Comprehensive Income (In thousands) Fiscal Year Ended December 30, 2023 December 31, 2022 December 25, 2021 Net income $ 1,289,636 $ 973,585 $ 1,082,200 Foreign currency translation adjustment 14,473 (149,396 ) (39,538 ) Change in fair value of available-for-sale marketable securities, net of deferred taxes 34,446 (82,972 ) (26,054 ) Comprehensive income $ 1,338,555 $ 741,217 $ 1,016,608 See accompanying notes. 47 Garmin Ltd. and Subsidiaries Consolidated Balance Sheets (In thousands) December 30, 2023 December 31, 2022 Assets Current assets: Cash and cash equivalents $ 1,693,452 $ 1,279,194 Marketable securities 274,618 173,288 Accounts receivable, less allowance for doubtful accounts of $7,152 in 2023 and 815,243 656,847 Inventories 1,345,955 1,515,045 Deferred costs 16,316 14,862 Prepaid expenses and other current assets 318,556 315,915 Total current assets 4,464,140 3,955,151 Property and equipment, net 1,224,097 1,147,005 Operating lease right-of-use assets 143,724 138,040 Noncurrent marketable securities 1,125,191 1,208,360 Deferred income tax assets 754,635 441,071 Noncurrent deferred costs 11,057 9,831 Goodwill 608,474 567,994 Other intangible assets, net 186,601 178,461 Other noncurrent assets 85,650 85,257 Total assets $ 8,603,569 $ 7,731,170 Liabilities and Stockholders’ Equity Current liabilities: Accounts payable $ 253,790 $ 212,417 Salaries and benefits payable 190,014 176,114 Accrued warranty costs 55,738 50,952 Accrued sales program costs 98,610 97,772 Other accrued expenses 245,874 197,376 Deferred revenue 101,189 91,092 Income taxes payable 225,475 246,180 Dividend payable 139,997 139,732 Total current liabilities 1,310,687 1,211,635 Deferred income tax liabilities 114,682 129,965 Noncurrent income taxes payable 16,521 34,627 Noncurrent deferred revenue 36,148 35,702 Noncurrent operating lease liabilities 113,035 114,541 Other noncurrent liabilities 436 360 Stockholders’ equity: Common shares (195,880 and 198,077 shares authorized and issued; 19,588 17,979 Additional paid-in capital 2,125,467 2,042,472 Treasury shares (4,103 and 6,454 shares) (330,909 ) (475,095 ) Retained earnings 5,263,528 4,733,517 Accumulated other comprehensive income (loss) (65,614 ) (114,533 ) Total stockholders’ equity 7,012,060 6,204,340 Total liabilities and stockholders’ equity $ 8,603,569 $ 7,731,170 See accompanying notes. 48 Garmin Ltd. and Subsidiaries Consolidated Statements of Cash Flows (In thousands) Fiscal Year Ended December 30, 2023 December 31, 2022 December 25, 2021 Operating Activities: Net income $ 1,289,636 $ 973,585 $ 1,082,200 Adjustments to reconcile net income to net cash provided by Depreciation 132,347 118,743 103,498 Amortization 45,225 45,110 51,320 Loss (gain) on sale of property and equipment 215 (2,083 ) 298 Unrealized foreign currency (gains) losses (25,541 ) (5,867 ) 36,385 Deferred income taxes (340,774 ) (143,286 ) (5,368 ) Stock compensation expense 101,422 76,801 92,522 Realized losses (gains) on marketable securities 62 986 (622 ) Changes in operating assets and liabilities, net of acquisitions: Accounts receivable, net of allowance for doubtful accounts (129,120 ) 167,336 (19,106 ) Inventories 244,506 (363,327 ) (476,454 ) Other current and noncurrent assets 7,887 72,185 (38,004 ) Accounts payable 28,503 (131,268 ) 108,946 Other current and noncurrent liabilities 52,188 (71,756 ) 70,007 Deferred revenue 10,411 (2,379 ) (7,377 ) Deferred costs (2,661 ) 3,591 8,288 Income taxes (38,041 ) 49,888 5,894 Net cash provided by operating activities 1,376,265 788,259 1,012,427 Investing activities: Purchases of property and equipment (193,524 ) (244,286 ) (307,645 ) Proceeds from sale of property and equipment 218 2,402 35 Purchase of intangible assets (1,504 ) (1,907 ) (1,942 ) Purchase of marketable securities (170,681 ) (1,051,994 ) (1,508,712 ) Redemption of marketable securities 183,372 1,164,116 1,363,070 Acquisitions, net of cash acquired (150,853 ) (13,455 ) (20,175 ) Net cash used in investing activities (332,972 ) (145,124 ) (475,369 ) Financing activities: Dividends (558,769 ) (679,096 ) (491,457 ) Proceeds from issuance of treasury shares related to equity awards 44,063 62,221 35,733 Purchase of treasury shares related to equity awards (22,815 ) (22,730 ) (30,985 ) Purchase of treasury shares under share repurchase plan (98,988 ) (201,012 ) — Net cash used in financing activities (636,509 ) (840,617 ) (486,709 ) Effect of exchange rate changes on cash and cash equivalents 7,460 (21,449 ) (10,254 ) Net increase (decrease) in cash, cash equivalents, and restricted cash 414,244 (218,931 ) 40,095 Cash, cash equivalents, and restricted cash at beginning of year 1,279,912 1,498,843 1,458,748 Cash, cash equivalents, and restricted cash at end of year $ 1,694,156 $ 1,279,912 $ 1,498,843 See accompanying notes. 49 Garmin Ltd. and Subsidiaries Consolidated Statements of Cash Flows (continued) (In thousands) Fiscal Year Ended December 30, 2023 December 31, 2022 December 25, 2021 Supplemental disclosures of cash flow information Cash paid during the year for income taxes $ 302,154 $ 184,809 $ 131,040 Cash received during the year from income tax refunds $ 12,133 $ 7,786 $ 8,264 Supplemental disclosure of non-cash investing and financing activities (Decrease) increase in accrued capital expenditures related to purchases of property and equipment $ (634 ) $ (4,320 ) $ 9,541 Change in marketable securities related to unrealized appreciation (depreciation) $ 45,506 $ (107,362 ) $ (32,622 ) Fair value of assets acquired $ 189,341 $ 15,340 $ 20,956 Liabilities assumed (37,436 ) (1,624 ) (764 ) Less: cash acquired (1,052 ) (261 ) (17 ) Cash paid for acquisitions, net of cash acquired $ 150,853 $ 13,455 $ 20,175 See accompanying notes. 50 Garmin Ltd. and Subsidiaries Consolidated Statements of Stockholders' Equity (In thousands) Common Additional Treasury Retained Accumulated Total Balance at December 26, 2020 $ 17,979 $ 1,880,354 $ (320,016 ) $ 3,754,372 $ 183,427 $ 5,516,116 Net income — — — 1,082,200 — 1,082,200 Translation adjustment — — — — (39,538 ) (39,538 ) Adjustment related to unrealized gains (losses) on available-for-sale securities net of income tax effects of $6,568 — — — — (26,054 ) (26,054 ) Comprehensive income 1,016,608 Dividends — — — (515,835 ) — (515,835 ) Issuance of treasury shares related to equity awards — (12,154 ) 47,887 — — 35,733 Stock compensation — 92,522 — — — 92,522 Purchase of treasury shares related to equity awards — — (30,985 ) — — (30,985 ) Balance at December 25, 2021 $ 17,979 $ 1,960,722 $ (303,114 ) $ 4,320,737 $ 117,835 $ 6,114,159 Net income — — — 973,585 — 973,585 Translation adjustment — — — — (149,396 ) (149,396 ) Adjustment related to unrealized gains (losses) on available-for-sale securities net of income tax effects of $24,390 — — — — (82,972 ) (82,972 ) Comprehensive income 741,217 Dividends — — — (560,805 ) — (560,805 ) Issuance of treasury shares related to equity awards — 4,949 57,272 — — 62,221 Stock compensation — 76,801 — — — 76,801 Purchase of treasury shares related to equity awards — — (22,730 ) — — (22,730 ) Purchase of treasury shares under share repurchase plan, including any associated excise tax — — (206,523 ) — — (206,523 ) Balance at December 31, 2022 $ 17,979 $ 2,042,472 $ (475,095 ) $ 4,733,517 $ (114,533 ) $ 6,204,340 Net income — — — 1,289,636 — 1,289,636 Translation adjustment — — — — 14,473 14,473 Adjustment related to unrealized gains (losses) on available-for-sale securities net of income tax effects of $11,060 — — — — 34,446 34,446 Comprehensive income 1,338,555 Dividends — — — (559,036 ) — (559,036 ) Issuance of treasury shares related to equity awards — (16,580 ) 60,643 — — 44,063 Stock compensation — 101,422 — — — 101,422 Purchase of treasury shares related to equity awards — — (22,815 ) — — (22,815 ) Purchase of treasury shares under share repurchase plan, including any associated excise tax — — (94,469 ) — — (94,469 ) Cancellation of treasury shares (238 ) — 200,827 (200,589 ) — — Share capital currency change 1,847 (1,847 ) — — — — Balance at December 30, 2023 $ 19,588 $ 2,125,467 $ (330,909 ) $ 5,263,528 $ (65,614 ) $ 7,012,060 See accompanying notes. 51 Garmin Ltd. Notes to Consolidated Financial Statements (In thousands, except share and per share information) December 30, 1. Summary of Significant Accounting Policies Basis of Presentation and Principles of Consolidation Garmin Ltd. and its subsidiaries The accompanying consolidated financial statements have been prepared in accordance with accounting principles generally accepted in the United States. The accompanying consolidated financial statements reflect the accounts of Garmin Ltd. and its wholly-owned subsidiaries. Changes in Classification and Allocation The Company announced an organization realignment in January 2023, which combined the consumer auto operating segment with the outdoor operating segment. As a result, the Company’s Fiscal Year The Company’s fiscal year is based on a 52-53-week period ending on the last Saturday of the calendar year. Due to the fact that there are not exactly 52 weeks in a calendar year, In those resulting fiscal years that have 53 weeks, the Company will record an extra week of sales, costs, and related financial activity. Therefore, the financial results of those 53-week fiscal years, and the associated 14-week fourth quarters, will not be entirely comparable to the prior and subsequent 52-week fiscal years and the associated 13-week quarters. Fiscal Use of Estimates The preparation of consolidated financial statements in conformity with accounting principles generally accepted in the United States requires management to make estimates and assumptions that affect the amounts reported in the consolidated financial statements and accompanying notes. Actual results could differ from those estimates. 52 Foreign Currency Many Garmin Ltd. subsidiaries utilize currencies other than the United States Dollar (USD) as their functional currency. As required by Transactions in foreign currencies are recorded at the approximate rate of exchange at the transaction date. Assets and liabilities resulting from these transactions are translated at the rate of exchange in effect at the balance sheet date. The majority of the Company’s consolidated foreign currency gain or loss is typically driven by the significant cash and marketable securities, receivables, and payables held in a currency other than the functional currency at a given legal entity. Garmin Corporation, one of the Company’s principal subsidiaries, is located in Taiwan. The Taiwan Foreign Exchange Control Statute (the Statute), and regulations thereunder, provides that all foreign exchange transactions must be executed by banks designated to handle such business by the Ministry of Finance of Taiwan and by the Central Bank of the Republic of China (Taiwan), also referred to as the CBC. Current regulations favor trade-related foreign exchange transactions, so the Statute does not impose any significant restrictions on import or export activities involving foreign currencies in Taiwan. Non-trade related currency exchanges exceeding $50 million, or its equivalent, in a calendar year require approval of the CBC. Revenue Recognition The Company recognizes revenue upon the transfer of control of promised products or services to the customer in an amount that depicts the consideration to which the Company expects to be entitled for the related products or services. For the large majority of the Company’s sales, transfer of control occurs once product has shipped and title and risk of loss have transferred to the customer. The Company offers certain tangible products with ongoing services promised over a period of time. When such services have been identified as both capable of being distinct and separately identifiable from the related tangible product, the associated revenue allocated to such services is recognized over time. The Company generally does not offer specified or unspecified upgrade rights to its customers in connection with software sales. 53 The Company allocates revenue to all performance obligations associated with tangible products containing separately identifiable ongoing services based on the respective performance obligations’ relative standalone selling prices (SSP), with the amounts allocated to ongoing services deferred and recognized over a period of time. These ongoing services primarily consist of the Company’s contractual promises to provide personal navigation device (PND) users with map updates and server-based traffic services. In addition, the Company provides map update services (map care) over a contractual period in certain hardware and software contracts with automotive original equipment manufacturers (OEMs). The Company has determined that directly observable prices do not exist for certain map updates, map care, or server-based traffic, as stand-alone and unbundled unit sales do not occur on more than a limited basis. Therefore, the Company uses the expected cost plus a margin as the primary indicator to calculate relative SSP of certain map updates, map care, and traffic performance obligations. The revenue and associated costs allocated to map updates, map care, and server-based traffic services are deferred and recognized ratably over the contractual service period or estimated life of the products. Additionally, the Company has offered certain other products and services with ongoing performance obligations for which the associated revenue is recognized over the contractual service period (typically ranging from 1 month to 3 years), including aviation database and other service subscriptions, incremental navigation and communication service subscriptions, mobile applications, and extended warranties. The Company records revenue net of sales tax or value-added tax and variable consideration such as trade discounts and customer returns. Payment is due typically within 90 days or less of shipment of product, or upon the grant of a given software license (as applicable). The Company records estimated reductions to revenue in the form of variable consideration for customer sales programs, returns, and incentive offerings including rebates, price protection, promotions, and other volume-based incentives. Cooperative advertising incentives payable to dealers and distributors are recorded as reductions of revenue unless the Company obtains proof of a distinct advertising service, in which case the incentive is recorded as advertising expense. The reductions to revenue are based on estimates and judgments using historical experience and expectation of future conditions, if not otherwise determinable. Shipping and Handling Costs Shipping and handling activities are typically performed before the customer obtains control of the good, and the related costs are expensed at the approximate time of sale. Shipping and handling costs are included in cost of goods sold in the accompanying consolidated statements of income. Advertising Costs The Company expenses advertising costs as incurred. Advertising expense amounted to approximately $173,109, $168,040, and $171,829 for the years ended December 30, Software Development Costs ASC Topic 985-20, Software – Costs of Software to Be Sold, Leased, or Marketed, requires companies to expense software development costs as they incur them until technological feasibility has been established, at which time those costs are capitalized until the product is available for general release to customers. The Accounting for Stock Compensation The Company currently sponsors three employee stock compensation plans. ASC Topic 718, Compensation – Stock Compensation, requires the measurement and recognition of compensation expenses for all share-based payment awards made to 54 The Company estimates the As stock compensation expense recognized in the accompanying consolidated statements of income is based on awards ultimately expected to vest, they have been Excess tax benefits or deficiencies from stock compensation are Stock compensation plans are discussed in more detail in Note 10 of the Notes to Research and Development Preproduction Costs Related to Long-Term Supply Arrangements Preproduction design and development costs related to long-term supply arrangements are expensed as incurred, and classified as research and development, unless the Income Taxes The Company accounts for income taxes using the liability method in accordance with The Company accounts for uncertainty in income taxes in accordance with Income taxes are discussed in more detail in Note Earnings Per Share 55 Cash, Cash Equivalents, and Cash and The total of the cash and cash equivalents balance and the restricted cash reported within other noncurrent assets on the consolidated balance sheets reconciles to the Marketable Securities Management determines the All of the Company’s marketable securities were considered available-for-sale at December 30, 2023. Available-for-sale securities are stated at fair value, with the unrealized gains and losses, net of tax, reported in accumulated other comprehensive income (loss) on the Company’s consolidated balance sheets. At December 30, 2023, and December 31, 2022, cumulative unrealized losses of $54,106 and $88,552, respectively, were reported in accumulated other comprehensive income (loss), net of related taxes. The Testing for impairment of investments requires management judgment. The identification of potentially impaired investments, the determination of their fair value, and the assessment of whether any decline in value is relating to credit losses are the In making this assessment management evaluates the extent to which the fair value is less than the amortized cost basis, any change in credit rating of the security, adverse conditions specifically related to the The Marketable securities are discussed in more detail in Note 4 of the Notes to Consolidated Financial Statements. 56 Fair Value of Financial Instruments As required by ASC Topic 825, Financial Instruments, the following summarizes required information about the fair value of certain financial instruments for which it is currently practicable to estimate such value. None of the financial instruments are held or issued for trading purposes. The carrying amounts and fair values of the Company’s financial instruments are as follows: December 30, 2023 December 31, 2022 Carrying Fair Carrying Fair Cash and cash equivalents $ 1,693,452 $ 1,693,452 $ 1,279,194 $ 1,279,194 Marketable securities $ 1,399,809 $ 1,399,809 $ 1,381,648 $ 1,381,648 For certain of the Company’s financial instruments, including accounts receivable, accounts payable and other accrued liabilities, the carrying amounts approximate fair value due to their short maturities. Trade Accounts Receivable The Company Concentration of Credit Risk The Company’s top ten customers have contributed between 20% and 23% of net sales annually since 2021. None of the Company's customers accounted for 10% or more of consolidated net sales in the years ended December 30, 2023, and December 31, 2022. Amazon.com, Inc. and its affiliates (Amazon), a customer of the fitness, outdoor, marine, and consumer auto segments, was the Company's largest customer and accounted for approximately 10% of its consolidated net sales in the fiscal year ended December 25, 2021. No other customer accounted for 10% or more of Garmin's consolidated net sales in fiscal 2021. Inventories Inventories are stated at the lower of cost or net realizable value. Cost includes materials, labor, and manufacturing overhead associated with purchases and production and is determined on a first-in, first-out (FIFO) basis. The Company December 30, 2023 December 31, 2022 Raw materials $ 493,493 $ 600,858 Work-in-process 160,919 180,873 Finished goods 691,543 733,314 Inventories $ 1,345,955 $ 1,515,045 Deferred Revenues and Costs At December 30, 57 Deferred revenue consists primarily of the transaction price allocated to performance obligations that are recognized over a period of time basis as discussed in the Revenue Recognition portion of this footnote. Billings associated with such items are typically completed upon the transfer of control of promised products or services to the customer and recorded to accounts receivable until payment is received. Deferred costs primarily refer to the license fees incurred by the Company associated with the aforementioned unsatisfied performance obligations, which are amortized over the same period as the revenue is recognized. The Company typically pays the associated license fees either monthly or quarterly in arrears, on a per item shipped or delivered basis. The Company applies a practical expedient, as permitted within ASC Topic 340, Other Assets and Deferred Costs, to expense as incurred the incremental costs to obtain a contract when the amortization period of the asset that would have otherwise been recognized is one year or less. Property and Equipment Property and equipment is recorded at cost and typically depreciated using the straight-line method. The components of property and equipment were as follows and are generally depreciated over the following estimated useful lives: Estimated Useful Life December 30, 2023 December 31, 2022 Land $ 201,287 $ 193,861 Building and improvements 15 to 50 years 934,837 856,722 Machinery, equipment and software 3 to 10 years 1,118,561 1,001,344 Total, at cost 2,254,685 2,051,927 Accumulated depreciation (1,030,588 ) (904,922 ) Property and equipment, net $ 1,224,097 $ 1,147,005 As required by ASC Topic 360, Property, Plant and Equipment, the Company reviews long-lived assets, including property and equipment, for impairment whenever events or changes in circumstances indicate the carrying amount of an asset or asset group may not be fully recoverable. The carrying amount of a long-lived asset is not recoverable if it exceeds the sum of the undiscounted cash flows expected to result from the use and eventual disposition of the asset. That assessment is based on the carrying amount of the asset at the date it is tested for recoverability. An impairment loss is measured as the amount by which the carrying amount of a long-lived asset exceeds its fair value. The Company did not recognize any material long-lived asset impairment charges in the fiscal years of 2023, 2022, or 2021. Goodwill and Other Intangible Assets The Company’s excess purchase cost over fair value of net assets acquired (goodwill) was $608,474 at December 30, 2023, and $567,994 at December 31, 2022. Each of the Company’s operating segments (fitness, outdoor, aviation, marine, and auto OEM) represents a distinct reporting unit. The Company allocates goodwill to reporting units in proportion to the expected benefit from each business combination. Changes in the carrying amount of goodwill for the years ended December 30, 2023 and December 31, 2022 are as follows: Fitness Outdoor Aviation Marine Auto OEM Total Goodwill balance as of December 25, 2021 $ 255,872 $ 178,955 $ 60,347 $ 79,906 $ — $ 575,080 Acquisitions — 2,518 — 7,340 — 9,858 Foreign currency translation and other adjustments (11,570 ) (3,129 ) — (2,245 ) — (16,944 ) Goodwill balance as of December 31, 2022 $ 244,302 $ 178,344 $ 60,347 $ 85,001 $ — $ 567,994 Acquisitions — — — 32,014 — 32,014 Foreign currency translation and other adjustments 6,078 1,400 — 988 — 8,466 Goodwill balance as of December 30, 2023 $ 250,380 $ 179,744 $ 60,347 $ 118,003 $ — $ 608,474 ASC Topic 350, Intangibles – Goodwill and Other, requires that goodwill and intangible assets with indefinite useful lives should not be amortized but rather be assessed for impairment at least annually or sooner whenever events or changes in circumstances indicate that they may be impaired. The Company performs its annual impairment assessments of goodwill and indefinite-lived intangible assets, if any, in the fourth quarter of each year, as of the Company’s fiscal year end date, and between annual tests if an event occurs or circumstances change that would indicate it is more likely than not that they may be impaired. 58 ASC Topic 350 allows management to first perform a qualitative goodwill assessment by assessing the qualitative factors of relevant events and circumstances at the reporting unit level to determine if it is necessary to perform the quantitative goodwill impairment test. If factors indicate that it is more likely than not that the fair value of the reporting unit is less than the carrying amount, then the quantitative test will be performed. If the fair value of the reporting unit is less than the carrying amount, then a goodwill impairment charge will be recognized in the amount by which carrying amount exceeds fair value, limited to the total amount of goodwill allocated to that reporting unit. Application of the goodwill impairment test requires judgment, including the identification of reporting units, assignment of assets and liabilities to reporting units, and assignment of goodwill to reporting units. If a quantitative impairment test is performed, the fair value of each reporting unit is estimated through the use of a discounted cash flow methodology, which also requires judgment and assumptions, including discount rate, projected future revenues, projected future operating margins, and terminal growth rates. The estimates used to calculate the fair value of a reporting unit change from year to year based on operating results, market conditions, and other factors. Management concluded that no goodwill associated with any reporting unit is currently at risk of impairment based on quantitative assessments performed in 2023. The Company did not recognize any material goodwill or intangible asset impairment charges in fiscal years 2023, 2022, or 2021. At December 30, 2023, and December 31, 2022, the Company had intellectual property, customer related intangibles, and other identifiable finite-lived intangible assets recorded at a cost of $553,163 and $511,716, respectively. Identifiable, finite-lived intangible assets are amortized over their estimated Leases Leases with an initial term of 12 months or less (“short-term leases”) are not recognized on the Company’s consolidated 59 Product Warranty The Company Fiscal Year Ended December 30, 2023 December 31, 2022 December 25, 2021 Balance - beginning of period $ 50,952 $ 45,467 $ 42,643 Accrual for products sold (1) 79,637 72,821 69,810 Expenditures (74,851 ) (67,336 ) (66,986 ) Balance - end of period $ 55,738 $ 50,952 $ 45,467 Contingencies In the normal course of business, the Company and its subsidiaries are parties to various legal claims, investigations and complaints, including matters alleging patent infringement and other intellectual property claims. The Company evaluates, on a quarterly and annual basis, developments in legal proceedings, investigations, claims, and other loss contingencies that could affect any required accrual or disclosure or estimate of reasonably possible loss or range of loss. An estimated loss from a loss contingency is accrued by a charge to income if it is probable that an asset has been impaired or a liability has been incurred and the amount of the loss can be reasonably estimated. If a range of loss is estimated, and some amount within that range appears to be a better estimate than any other amount within that range, then that amount is accrued. If no amount within the range can be identified as a better estimate than any other amount, the Company accrues the minimum amount in the range. If an outcome unfavorable to the Company is determined to be probable, but the amount of loss cannot be reasonably estimated or is determined to be reasonably possible, but not probable, See Note 7 of the Notes to Consolidated Financial Statements for additional information on contingencies. Recently Adopted Accounting Standards There are no recently adopted accounting standards that have a material impact on the Company’s consolidated financial statements, accounting policies, processes, or systems. 60 Recently Issued Accounting Pronouncements Not Yet Adopted Income Taxes In December 2023, the Financial Accounting Standards Board (FASB) issued Accounting Standards Update No. 2023-09, Income Taxes (Topic 740): Improvements to Income Tax Disclosures (“ASU 2023-09”) to enhance the transparency and decision usefulness of income tax disclosures, primarily related to the rate reconciliation and income taxes paid. ASU 2023-09 is effective for annual periods beginning after December 15, 2024. Early adoption is permitted. The Company is currently evaluating the impact that the updated standard will have on its financial statement disclosures. Segment Reporting In November 2023, the FASB issued Accounting Standards Update No. 2023-07, Segment Reporting (Topic 280): Improvements to Reportable Segment Disclosures (“ASU 2023-07”) to improve reportable segment disclosure requirements, primarily through enhanced disclosures about significant segment expenses. ASU 2023-07 is effective for fiscal years beginning after December 15, 2023, and interim periods within fiscal years beginning after December 15, 2024. Early adoption is permitted. The Company is currently evaluating the impact that the updated standard will have on its financial statement disclosures. 2. Revenue In order to further depict how the nature, amount, timing and uncertainty of the Company's revenue and cash flows are affected by economic factors, the Company disaggregates revenue (or “net sales”) by geographic region, major product category, and pattern of recognition. Disaggregated revenue by geographic region (Americas, APAC, and EMEA) is presented in Note 11 – Segment Information and Geographic Data. Note 11 also contains disaggregated revenue information of the five major product categories identified by the Company – fitness, outdoor, aviation, marine, and auto OEM. A large majority of the Company’s sales are recognized on a point in time basis, usually once the product is shipped and title and risk of loss have transferred to the customer. Sales recognized over a period of time are primarily within the outdoor, aviation, and auto OEM segments and relate to performance obligations that are satisfied over the estimated life of the product or contractual service period. Revenue disaggregated by the timing of transfer of the goods or services is presented in the table below: Fiscal Year Ended December 30, 2023 December 31, 2022 December 25, 2021 Point in time $ 4,938,479 $ 4,602,636 $ 4,762,260 Over time 289,773 257,650 220,535 Net sales $ 5,228,252 $ 4,860,286 $ 4,982,795 61 Transaction price and costs associated with the Company’s unsatisfied performance obligations are reflected as deferred revenue and deferred costs, respectively, on the Company’s consolidated balance sheets. Such amounts are recognized ratably over the applicable service period or estimated useful life. Changes in deferred revenue and costs during the 52-week period ending December 30, 2023 and 53-week period ending December 31, 2022, are presented below: Fiscal Year Ended December 30, 2023 December 31, 2022 Deferred Deferred Deferred Deferred Balance, beginning of period $ 126,794 $ 24,693 $ 129,272 $ 28,322 Deferrals in period 300,316 24,286 255,172 17,169 Recognition of deferrals in period (289,773 ) (21,606 ) (257,650 ) (20,798 ) Balance, end of period $ 137,337 $ 27,373 $ 126,794 $ 24,693 (1) Deferred revenue is comprised of both deferred revenue and noncurrent deferred revenue per the consolidated balance sheets. (2) Deferred costs are comprised of both deferred costs and noncurrent deferred costs per the consolidated balance sheets. Of the $289,773 of deferred revenue recognized in the 52-weeks ended December 30, 2023, $87,131 was deferred as of the beginning of the period. Of the $257,650 of deferred revenue recognized in the 53-weeks ended December 31, 2022, $84,227 was deferred as of the beginning of the period. Of the $137,337 of deferred revenue as of December 30, 2023, the Company expects to recognize approximately eighty-five percent ratably over a total period of three years or less. 3. Earnings Per Share The following table sets forth the computation of basic and diluted net income per share. Stock options, stock appreciation rights, and restricted stock units are collectively referred to as "equity awards". Fiscal Year Ended December 30, 2023 December 31, 2022 December 25, 2021 Numerator: Numerator for basic and diluted net income per share - net income $ 1,289,636 $ 973,585 $ 1,082,200 Denominator (in thousands): Denominator for basic net income per share – weighted-average common shares 191,397 192,544 192,180 Effect of dilutive equity awards 661 498 863 Denominator for diluted net income per share – adjusted weighted-average common shares 192,058 193,042 193,043 Basic net income per share $ 6.74 $ 5.06 $ 5.63 Diluted net income per share $ 6.71 $ 5.04 $ 5.61 Shares excluded from diluted net income per share calculation: Anti-dilutive equity awards (in thousands) - 625 235 62 4. Marketable Securities ASC Topic 820, Fair Value Measurements and Disclosures,defines fair value as the price that would be received to sell an asset or paid to transfer a liability in an orderly transaction between market participants at the measurement date (exit price). The accounting guidance classifies the inputs used to measure fair value into the following hierarchy: Level 1 Unadjusted quoted prices in active markets for the identical asset or liability Level 2 Observable inputs for the asset or liability, either directly or indirectly, such as quoted prices for similar assets or liabilities in active markets, quoted prices for identical or similar assets or liabilities in markets that are not active, or inputs other than quoted prices that are observable for the asset or liability Level 3 Unobservable inputs for the asset or liability The Company endeavors to utilize the best available information in measuring fair value. Financial assets and liabilities are classified in their entirety based on the lowest level of input that is significant to the fair value measurement. Valuation is based on prices obtained from an independent pricing vendor using both market and income approaches. The primary inputs to the valuation include quoted prices for similar assets in active markets, quoted prices for identical or similar assets in markets that are not active, contractual cash flows, benchmark yields, and credit spreads. The method described above may produce a fair value calculation that may not be indicative of net realizable value or reflective of future fair values. Furthermore, while the Company believes its valuation methods are appropriate and consistent with other market participants, the use of different methodologies or assumptions to determine the fair value of certain financial instruments could result in a different fair value measurement at the reporting date. Marketable securities classified as available-for-sale securities are summarized below: Available-For-Sale Securities Fair Value Level Amortized Cost Gross Unrealized Gross Unrealized Fair Value U.S. Treasury securities Level 2 $ 2,971 $ 1 $ — $ 2,972 Agency securities Level 2 23,692 32 (585 ) 23,139 Mortgage-backed securities Level 2 38,743 — (4,731 ) 34,012 Corporate debt securities Level 2 1,104,834 1,680 (46,073 ) 1,060,441 Municipal securities Level 2 294,240 98 (18,430 ) 275,908 Other Level 2 3,760 — (423 ) 3,337 Total $ 1,468,240 $ 1,811 $ (70,242 ) $ 1,399,809 Available-For-Sale Securities Fair Value Level Amortized Cost Gross Unrealized Gross Unrealized Fair Value U.S. Treasury securities Level 2 $ — $ — $ — $ — Agency securities Level 2 7,000 — (786 ) 6,214 Mortgage-backed securities Level 2 45,373 — (4,525 ) 40,848 Corporate debt securities Level 2 1,106,688 188 (77,802 ) 1,029,074 Municipal securities Level 2 326,058 3 (28,861 ) 297,200 Other Level 2 10,466 — (2,154 ) 8,312 Total $ 1,495,585 $ 191 $ (114,128 ) $ 1,381,648 63 The primary objectives of the Company’s investment policy are to preserve capital, maintain an acceptable degree of liquidity, and maximize yield within the constraint of low credit risk. The fair value of securities varies from period to period due to changes in interest rates, the performance of the underlying collateral, and the credit performance of the underlying issuer, among other factors. Accrued interest receivable, which totaled $11,716 as of December 30, 2023, is excluded from both the fair value and amortized cost basis of available-for-sale securities and is included within prepaid expenses and other current assets on the Company’s consolidated balance sheets. The Company writes off impaired accrued interest on a timely basis, generally within 30 days of the due date, by reversing interest income. No accrued interest was written off during the 52-week period ended December 30, 2023. The Company recognizes impairments relating to credit losses of available-for-sale securities through an allowance for credit losses and other income (expense) on the Company’s consolidated statements of income. Impairment not relating to credit losses is recorded in accumulated other comprehensive income (loss) on the Company’s consolidated balance sheets. The cost of securities sold is based on the specific identification method. Approximately 92% of securities in the Company's portfolio were at an unrealized loss position at December 30, 2023. The following tables display additional information regarding gross unrealized losses and fair value by major security type for available-for-sale securities in an unrealized loss position as of December 30, 2023 and December 31, 2022. As of December 30, 2023 Less than 12 Consecutive Months 12 Consecutive Months or Longer Total Gross Unrealized Losses Fair Value Gross Unrealized Losses Fair Value Gross Unrealized Losses Fair Value U.S. Treasury securities $ — $ — $ — $ — $ — $ — Agency securities (31 ) 10,923 (554 ) 6,446 (585 ) 17,369 Mortgage-backed securities — — (4,731 ) 34,012 (4,731 ) 34,012 Corporate debt securities (702 ) 64,637 (45,371 ) 889,785 (46,073 ) 954,422 Municipal securities (32 ) 2,654 (18,398 ) 261,651 (18,430 ) 264,305 Other — — (423 ) 3,337 (423 ) 3,337 Total $ (765 ) $ 78,214 $ (69,477 ) $ 1,195,231 $ (70,242 ) $ 1,273,445 As of December 31, 2022 Less than 12 Consecutive Months 12 Consecutive Months or Longer Total Gross Unrealized Losses Fair Value Gross Unrealized Losses Fair Value Gross Unrealized Losses Fair Value U.S. Treasury securities $ — $ — $ — $ — $ — $ — Agency securities — — (786 ) 6,214 (786 ) 6,214 Mortgage-backed securities (1,900 ) 23,229 (2,625 ) 17,619 (4,525 ) 40,848 Corporate debt securities (26,680 ) 508,956 (51,122 ) 498,834 (77,802 ) 1,007,790 Municipal securities (2,136 ) 69,017 (26,725 ) 225,679 (28,861 ) 294,696 Other — — (2,154 ) 8,067 (2,154 ) 8,067 Total $ (30,716 ) $ 601,202 $ (83,412 ) $ 756,413 $ (114,128 ) $ 1,357,615 As of December 30, 2023 and December 31, 2022, the Company had not recognized an allowance for credit losses on any securities in an unrealized loss position. The Company has not recorded an allowance for credit losses and charge to other income for the unrealized losses on agency, mortgage-backed, corporate debt, municipal, and other securities presented above because the Company does not consider the declines in fair value to have resulted from credit losses. The Company has not observed a significant deterioration in credit quality of these securities, which are highly rated with moderate to low credit risk. Declines in value are largely attributable to current global economic conditions. The securities continue to make timely principal and interest payments, and the fair values are expected to recover as they approach maturity. The Company does not intend to sell the securities, and it is not more likely than not that the Company will be required to sell the securities, before the respective recoveries of their amortized cost bases, which may be maturity. 64 The amortized cost and fair value of marketable securities at December 30, 2023, by maturity, are shown below. Amortized Cost Fair Value Due in one year or less $ 279,137 $ 274,618 Due after one year through five years 1,170,760 1,109,093 Due after five years through ten years 10,067 9,187 Due after ten years 8,276 6,911 Total $ 1,468,240 $ 1,399,809 5. Income Taxes The Company’s income tax provision (benefit) consists of the following: Fiscal Year Ended December 30, 2023 December 31, 2022 December 25, 2021 U.S. federal: Current $ 25,985 $ 45,639 $ (13,096 ) Deferred (122,291 ) (149,734 ) (42,625 ) $ (96,306 ) $ (104,095 ) $ (55,721 ) U.S. state: Current $ 6,755 $ 12,870 $ (5,876 ) Deferred (26,602 ) (29,160 ) (8,132 ) $ (19,847 ) $ (16,290 ) $ (14,008 ) Foreign: Current $ 217,706 $ 175,335 $ 149,012 Deferred (190,833 ) 36,439 45,313 $ 26,873 $ 211,774 $ 194,325 Total $ (89,280 ) $ 91,389 $ 124,596 The income tax provision differs from the amount computed by applying the U.S. statutory federal income tax rate to income before taxes. The sources and tax effects of the differences, including the impact of establishing tax contingency accruals, are as follows: Fiscal Year Ended December 30, 2023 December 31, 2022 December 25, 2021 Federal income tax expense at U.S. statutory rate $ 252,095 $ 223,658 $ 253,429 State income tax (benefit) expense, net of federal tax effect (23,045 ) (21,064 ) (12,198 ) Foreign-derived intangible income (FDII) deduction (6,432 ) (12,343 ) — Foreign tax rate differential (129,733 ) (114,599 ) (117,586 ) Other foreign taxes, net of incentives and credits 18,351 24,273 29,240 Withholding tax 24,497 27,041 22,992 Net change in uncertain tax positions (13,157 ) (14,381 ) (17,087 ) U.S. federal research and development credit (31,849 ) (29,384 ) (22,764 ) Stock-based compensation (851 ) 30 (6,362 ) Switzerland deferred tax assets (181,410 ) 7,168 (177 ) Other, net 2,254 990 (4,891 ) Income tax expense $ (89,280 ) $ 91,389 $ 124,596 65 The Company recorded income tax benefit of $89,280 in the year ended December 30, 2023, representing an effective tax rate of approximately (7%), which included income tax benefit of $181,410 recognized by the Company in the fourth quarter of 2023 related to the revaluation of Switzerland deferred tax assets due to an increase in the Schaffhausen cantonal tax rate and income tax benefit of $12,116 recognized in the fourth quarter of 2023 related to Auto OEM manufacturing tax incentives in Poland. The Company recorded income tax expense of $91,389 in the year ended December 31, 2022, representing an effective tax rate of approximately 9%, which included income tax expense of $7,168 recognized by the Company in the fourth quarter of 2022 related to the revaluation of Switzerland deferred tax assets. The Company recorded income tax expense of $124,596 in the year ended December 25, 2021. The Company’s statutory federal and cantonal income tax rate in Switzerland, the Company's place of incorporation, was approximately 14% in fiscal years 2023, 2022, and 2021. If the Company reconciled taxes at the Swiss holding company federal statutory tax rate to the reported income tax expense for 2023 as presented above, the amounts related to tax at the statutory rate would be approximately $86,000 lower, or $166,000, and the foreign tax rate differential would be adjusted by a similar amount to approximately $38,000. For 2022, the amounts related to tax at the statutory rate would be approximately $77,000 lower, or $147,000, and the foreign tax rate differential would be adjusted by a similar amount to approximately $33,000. For 2021, the amounts related to tax at the statutory rate would be approximately $84,000 lower, or $169,000, and the foreign tax rate differential would be adjusted by a similar amount to approximately $28,000. All other amounts would remain substantially unchanged. The Company’s income before income taxes attributable to non-U.S. operations was $1,406,916, $1,287,794, and $1,227,666, for the years ended December 30, 2023, December 31, 2022, and December 25, 2021, respectively. Income taxes of $42,015, $45,459, and $50,127 at December 30, 2023, December 31, 2022, and December 25, 2021, respectively, have not been accrued by the Company for the unremitted earnings of several of its foreign subsidiaries because such earnings are intended to be reinvested in the subsidiaries indefinitely. Deferred income taxes reflect the net tax effects of temporary differences between the carrying amounts of assets and liabilities for financial reporting purposes and the amounts used for income tax purposes. Significant components of the Company’s deferred tax assets and liabilities are as follows: December 30, 2023 December 31, 2022 Deferred tax assets: Capitalized research & development expenses $ 385,916 $ 231,429 Intangible assets 321,500 156,702 Tax credit carryforwards 33,527 19,950 Operating leases 27,987 30,310 Tax basis in excess of book basis for investments 18,939 27,227 Deferred revenue 17,815 18,327 Net operating losses 16,066 4,955 Accrued paid time off 15,591 14,986 Product warranty accruals 12,631 12,111 Stock-based compensation 10,880 8,667 Other 25,231 18,259 Valuation allowance related to loss carryforward and tax credits (12,870 ) (17,077 ) $ 873,213 $ 525,846 Deferred tax liabilities: Withholding tax 107,352 108,692 Property and equipment 68,557 40,526 Operating leases 27,432 29,756 Book basis in excess of tax basis for acquired entities 18,596 21,970 Prepaid and perpetual license assets 10,051 11,798 Other 1,272 1,998 $ 233,260 $ 214,740 Net deferred tax assets $ 639,953 $ 311,106 66 Deferred taxes related to intangible assets increased by $164,798 as of December 30, 2023 as compared to December 31, 2022, primarily related to the revaluation of Switzerland deferred tax assets recognized in the fourth quarter of 2023. Deferred tax assets related to capitalized research and development expenses increased by $154,487 as of December 30, 2023 as compared to December 31, 2022, primarily related to the 2017 United States Tax Cuts and Jobs Act, which included provisions that became effective during 2022 tax year that require the Company to capitalize certain research and development costs and amortize those capitalized costs on its U.S. tax returns over a period of five or fifteen years, depending on where the associated costs were incurred. At December 30, 2023, the Company had $33,527 of tax credit carryover compared to $19,950 at December 31, 2022. At December 30, 2023, the Company had a deferred tax asset of $16,066 related to the future tax benefit of net operating loss (NOL) carryforwards of $55,524. Included in the NOL carryforwards is $8,319 that relates to various jurisdictions and expires in periods ranging from 2025 through 2037 and $47,205 that relates to various other jurisdictions and has no expiration date. The Company has recorded a valuation allowance for a portion of its deferred tax asset relating to various tax attributes that management does not believe are more likely than not to be realized. In the future, if the Company determines, based on existence of sufficient evidence, that it should realize more or less of its deferred tax assets, an adjustment to the valuation allowance will be made in the period such a determination is made. The total amount of gross unrecognized tax benefits as of December 30, 2023 was $13,571. A reconciliation of the beginning and ending amount of gross unrecognized tax benefits for years ended December 30, 2023, December 31, 2022, and December 25, 2021 is as follows: December 30, 2023 December 31, 2022 December 25, 2021 Balance beginning of year $ 30,795 $ 65,216 $ 84,985 Additions based on tax positions related to prior years — — — Reductions based on tax positions related to prior years (3,450 ) (6,363 ) (4,727 ) Additions based on tax positions related to current period 450 2,368 4,272 Reductions related to settlements with tax authorities — (15,476 ) — Expiration of statute of limitations (14,224 ) (14,950 ) (19,314 ) Balance at end of year $ 13,571 $ 30,795 $ 65,216 Accounting guidance requires unrecognized tax benefits to be classified as noncurrent liabilities, except for the portion that is expected to be paid within one year of the balance sheet date. The balance of net unrecognized benefits of $12,824, $29,159, and $54,443 are classified as noncurrent at December 30, 2023, December 31, 2022, and December 25, 2021, respectively. The net unrecognized tax benefits, if recognized, would reduce the effective tax rate. None of the unrecognized tax benefits are due to uncertainty in the timing of deductibility. Interest and penalties, if any, accrued on the unrecognized tax benefits are reflected in income tax expense. At December 30, 2023, December 31, 2022, and December 25, 2021, the Company had accrued approximately $2,127, $2,751, and $4,255, respectively, for interest. The interest component of the reserve decreased income tax expense for the years ending December 30, 2023, December 31, 2022, and December 25, 2021 by $624, $1,474, and $1,441, respectively. The Company did not have significant amounts accrued for penalties for the years ending December 30, 2023, December 31, 2022, and December 25, 2021. The Company files income tax returns in Switzerland, Taiwan, United Kingdom, U.S. federal jurisdiction, as well as various states, local, and other foreign jurisdictions. In its major tax jurisdictions, Switzerland, Taiwan, United Kingdom, and U.S. federal and various states, the Company is no longer subject to income tax examinations by tax authorities, with few exceptions, for years prior to 2019, 2018, 2021, and 2020, respectively. The Company recognized a reduction of income tax expense, inclusive of interest and net of deferrals, of $11,473, $12,749, and $22,221 in fiscal years ended December 30, 2023, December 31, 2022, and December 25, 2021, respectively, to reflect the expiration of statutes of limitations and releases due to audit settlement in various jurisdictions. 67 The Company believes that it is reasonably possible that approximately $3,000 to $7,000 of its reserves for certain unrecognized tax benefits will decrease within the next 12 months as the result of the expiration of statutes of limitations. This potential decrease in unrecognized tax benefits would impact the Company’s effective tax rate within the next 12 months. 6. Leases The following table represents lease costs recognized in the Company’s consolidated statements of income for the 52-weeks ended December 30, 2023. Lease costs are included in selling, general and administrative expense and research and development expense on the Company’s consolidated statements of income. Fiscal Year Ended December 30, 2023 December 31, 2022 Operating lease cost (1) $ 47,331 $ 40,679 (1) Operating lease cost includes short-term lease costs and variable lease costs, which were not material in the period presented. The following table represents the components of leases that are recognized on the Company’s consolidated balance sheets as of December 30, 2023 and December 31, 2022. December 30, 2023 December 31, 2022 Operating lease right-of-use assets $ 143,724 $ 138,040 Other accrued expenses $ 27,776 $ 25,149 Noncurrent operating lease liabilities 113,035 114,541 Total lease liabilities $ 140,811 $ 139,690 Weighted average remaining lease term 6.6 years 7.3 years Weighted average discount rate 3.8 % 3.3 % The following table represents the maturity of lease liabilities. Year Amount 2024 $ 34,693 2025 28,830 2026 21,772 2027 17,167 2028 15,513 Thereafter 45,301 Total 163,276 Less: imputed interest (22,465 ) Present value of lease liabilities 140,811 The following table presents supplemental cash flow and noncash information related to leases. Fiscal Year Ended December 30, 2023 December 31, 2022 Cash paid for amounts included in the measurement of operating lease liabilities (1) $ 34,602 $ 28,714 Right-of-use assets obtained in exchange for new operating lease liabilities $ 18,520 $ 68,188 (1) Included in net cash provided by operating activities on the Company's statements of cash flows 68 7. Commitments and Contingencies Commitments The Company is party to certain commitments that require the future purchase of goods or services (“unconditional purchase obligations”). The Company’s unconditional purchase obligations primarily consist of payments for inventory, capital expenditures, and other indirect purchases in connection with conducting the business. The aggregate amount of purchase orders and other commitments open as of December 30, 2023 that may represent noncancellable unconditional purchase obligations having a remaining term in excess of one year was approximately $274,000. Certain cash balances are held as collateral in relation to bank guarantees. The total amount of restricted cash was $704 and $718 on December 30, 2023 and December 31, 2022, respectively. Contingencies Management of the Company currently does not believe it is reasonably possible that the Company may have incurred a material loss, or a material loss in excess of recorded accruals, with respect to loss contingencies in the aggregate, for the fiscal year ended December 30, 8. Stockholders' Equity 69 The Company's shareholders approved the following dividends: Declaration Date Dividend Date Record Date Dividend Per Share Payment Amount Fiscal 2023 June 9, 2023 June 30, 2023 June 20, 2023 $ 0.73 $ 139,595 June 9, 2023 September 29, 2023 September 15, 2023 $ 0.73 $ 139,724 June 9, 2023 December 29, 2023 December 15, 2023 $ 0.73 $ 139,603 June 9, 2023 March 29, 2024 March 15, 2024 $ 0.73 $ 139,997 Total $ 2.92 $ 558,919 Fiscal 2022 June 10, 2022 June 30, 2022 June 20, 2022 $ 0.73 $ 140,825 June 10, 2022 September 30, 2022 September 15, 2022 $ 0.73 $ 140,413 June 10, 2022 December 30, 2022 December 15, 2022 $ 0.73 $ 139,610 June 10, 2022 March 31, 2023 March 15, 2023 $ 0.73 $ 139,847 Total $ 2.92 $ 560,695 Fiscal 2021 June 4, 2021 June 30, 2021 June 15, 2021 $ 0.67 $ 128,741 June 4, 2021 September 30, 2021 September 15, 2021 $ 0.67 $ 128,856 June 4, 2021 December 31, 2021 December 15, 2021 $ 0.67 $ 128,856 June 4, 2021 March 31, 2022 March 15, 2022 $ 0.67 $ 129,394 Total $ 2.68 $ 515,846 The estimated payment amount for the Share Repurchase Program On April 22, 2022, the Board of Directors approved a share repurchase program (the “2022 Program”) authorizing the Company to repurchase up to $300,000 of the common shares of Garmin Ltd., exclusive of the cost of any associated excise tax. As of December 30, 2023, the Company had repurchased 3,176,453 shares for $300,000, leaving $0 available to repurchase additional shares under the 2022 Program when the share repurchase authorization expired on December 29, 2023. Cash paid for purchases of the Company’s shares during fiscal 2023 was $98,988. On February 16, 2024, the Board of Directors approved a share repurchase program (the “2024 Program”) authorizing the Company to repurchase up to $300,000 of the common shares of Garmin Ltd., exclusive of the cost of any associated excise tax. The timing and volume of share repurchases are subject to market conditions, business conditions and applicable laws, and are at management’s discretion. Share repurchases may be made from time to time in the open market or in privately negotiated transactions, including under plans complying with the provisions of Rule 10b5-1 and Rule 10b-18 of the Securities Exchange Act of 1934, as amended. The 2024 Program does not require the purchase of any minimum number of shares and may be suspended or discontinued at any time. The share repurchase authorization expires on December 26, In the second quarter of 2023, the share capital currency of the Company was changed from the Swiss Franc (CHF) to the U.S. Dollar (USD), as approved by shareholders at the Company’s 2023 Annual General Meeting. This aligns the share capital currency with the financial statement presentation currency of the Company. The Company’s 70 Treasury Shares In June 2023, the Company's shareholders approved the cancellation of 2,196,990 shares previously purchased under its share repurchase program. The capital reduction by cancellation of these shares became effective in June 2023. Total stockholders’ equity reported for the Company was not affected. 9. Accumulated Other Comprehensive Income (Loss) The following provides required disclosure of changes in accumulated other comprehensive income (loss) balances by component for the year ended December 30, Foreign currency Net gains (losses) on available-for-sale securities Total Balance - beginning of period $ (25,981 ) $ (88,552 ) $ (114,533 ) Other comprehensive income (loss) before reclassification, net of income tax expense of $11,046 14,473 34,398 48,871 Amounts reclassified from accumulated other comprehensive income (loss) to other income (expense), net of income tax benefit of $14 included in income tax provision — 48 48 Net current-period other comprehensive income (loss) 14,473 34,446 48,919 Balance - end of period $ (11,508 ) $ (54,106 ) $ (65,614 ) The various Company stock compensation plans are summarized below. For all stock compensation plans, the 2011 Non-employee Directors’ Equity Incentive Plan In June 2011, the 2005 Equity Incentive Plan In June 2005, the shareholders adopted an equity incentive plan (the “2005 Plan”) providing for grants of incentive and nonqualified stock options, SARs, RSUs and/or performance shares to employees of the Company and its subsidiaries, pursuant to which up to 10,000,000 common shares were made available for issuance. In 2013, the shareholders approved an increase of an additional 3,000,000 shares to the 71 2000 Equity Incentive Plan In October 2000, the shareholders adopted an equity incentive plan (the “2000 Plan”) providing for grants of incentive and nonqualified stock options, SARs, A summary of the Company’s Stock Options and SARs Weighted-Average Number of Shares (In Thousands) Outstanding at December 26, 2020 $ 52.44 13 Granted — Exercised $ 52.44 (13 ) Forfeited/Expired — Outstanding at December 25, 2021 — Granted — Exercised — Forfeited/Expired — Outstanding at December 31, 2022 — Granted — Exercised — Forfeited/Expired — Outstanding at December 30, 2023 — Exercisable at December 30, 2023 — Expected to vest after December 30, 2023 — Restricted Stock Units Weighted-Average Number of Shares (In Thousands) Outstanding at December 26, 2020 $ 86.98 1,582 Granted $ 116.40 871 Released/Vested $ 80.12 (884 ) Cancelled $ 95.79 (56 ) Outstanding at December 25, 2021 $ 107.60 1,513 Granted $ 98.39 1,192 Released/Vested $ 102.80 (805 ) Cancelled $ 111.12 (63 ) Outstanding at December 31, 2022 $ 103.61 1,837 Granted $ 105.47 1,054 Released/Vested $ 103.61 (749 ) Cancelled $ 106.09 (456 ) Outstanding at December 30, 2023 $ 104.10 1,686 72 The total fair value of awards vested during Employee Stock Purchase Plan The shareholders have adopted an ESPP. Up to Savings Plans Certain subsidiaries of the Company sponsor various defined contribution employee retirement plans. GII and the Company’s other U.S.-based subsidiaries sponsor a plan under which their employees may contribute up to 50% of their annual compensation subject to Internal Revenue Code maximum limitations and to which the subsidiaries contribute a specified percentage of each participant’s annual compensation up to certain limits as defined in the retirement plan. During the years ended December 30, 2023, December 31, 2022, and December 25, 2021, expense related to this and other defined contribution plans of $84,609, $80,435, and $71,262, respectively, was recorded within the Company’s consolidated statements of income. Certain of the Company’s non-U.S. subsidiaries sponsor or participate in local defined benefit pension plans. The obligations, contributions, and associated expense of such plans for the years ended December 30, 2023, December 31, 2022, and December 25, 2021 were not material. 11. Segment Information and Geographic Data Garmin is organized in the five operating segments of fitness, outdoor, aviation, marine, and auto OEM. These operating segments represent the Company's reportable segments. The Company’s Chief Executive Officer, who has been identified as the CODM, primarily uses operating income as the measure of profit or loss to assess segment performance and allocate resources. Operating income represents net sales less costs of goods sold and operating expenses. Net sales are directly attributed to each segment. Most costs of goods sold and the majority of operating expenses are also directly attributed to each segment, while certain other costs of goods sold and operating expenses are allocated to the segments in a reasonable manner considering the specific facts and circumstances of the expenses being allocated. The accounting policies of the segments are the same as those described in the summary of significant accounting policies. There are no inter-segment sales or transfers. The Company’s segments share many common resources, infrastructures and assets in the normal course of business. Thus, the Company does not report accounts receivable, inventories, property and equipment, intangible assets, or capital expenditures by segment to the CODM. 73 As indicated in Note 1 of the Notes to Consolidated Financial Statements, the Company announced an organization realignment in January 2023, which combined the consumer auto operating segment with the outdoor operating segment. As a result, the Company’s operating segments, which also represent its reportable segments, are fitness, outdoor, aviation, marine, and auto OEM. Results for the 53-week and 52-week periods ended December 31, 2022 and December 25, 2021, respectively, have been recast below to conform with the current period presentation. Net sales (“revenue”), gross profit, and operating income for each of the Company’s five reportable segments are presented below. Fitness Outdoor Aviation Marine Auto OEM Total 52-Weeks Ended December 30, 2023 Net sales $ 1,344,637 $ 1,697,151 $ 846,329 $ 916,911 $ 423,224 $ 5,228,252 Gross profit 716,906 1,072,861 625,988 491,261 97,939 3,004,955 Operating income (loss) 232,201 515,254 226,400 179,429 (61,124 ) 1,092,160 53-Weeks Ended December 31, 2022 Net sales $ 1,109,419 $ 1,770,275 $ 792,799 $ 903,983 $ 283,810 $ 4,860,286 Gross profit 552,417 1,099,408 573,063 491,457 90,430 2,806,775 Operating income (loss) 104,738 573,281 213,186 215,304 (78,664 ) 1,027,845 53-Weeks Ended December 25, 2021 Net sales $ 1,533,788 $ 1,606,664 $ 712,468 $ 875,151 $ 254,724 $ 4,982,795 Gross profit 813,325 988,662 519,821 495,310 73,341 2,890,459 Operating income (loss) 359,201 524,469 193,188 249,781 (108,019 ) 1,218,620 Americas EMEA APAC Total December 30, 2023 Net sales to external customers (1) $ 2,614,358 $ 1,775,965 $ 837,929 $ 5,228,252 Property and equipment, net 736,218 141,388 346,491 1,224,097 Net assets (2) 4,377,450 1,297,580 1,339,275 7,014,305 December 31, 2022 Net sales to external customers (1) $ 2,429,029 $ 1,633,640 $ 797,617 $ 4,860,286 Property and equipment, net 676,855 121,920 348,230 1,147,005 Net assets (2) 3,717,198 1,210,461 1,276,681 6,204,340 December 25, 2021 Net sales to external customers (1) $ 2,349,514 $ 1,858,908 $ 774,373 $ 4,982,795 Property and equipment, net 576,481 120,004 370,993 1,067,478 Net assets (2) 3,745,120 1,227,928 1,141,111 6,114,159 (1)The 74 Item 9. Changes in and Disagreements with Accountants on Accounting and Financial Disclosure None. Item 9A. Controls and Procedures (a) Conclusion Regarding the Effectiveness of Disclosure Controls and Procedures Under the supervision and with the participation of our management, including the Chief Executive Officer and Chief Financial Officer, we have evaluated the effectiveness of the design and operation of our disclosure controls and procedures pursuant to Exchange Act Rule 13a-15(b) as of the end of the period covered by this report. Based on the evaluation, the Chief Executive Officer and Chief Financial Officer have concluded that these disclosure controls and procedures (b) Management’s Report on Internal Control over Financial Reporting Management of the Company is responsible for establishing and maintaining adequate internal control over financial reporting for the Company. The Company’s internal control over financial reporting is a process designed to provide reasonable assurance regarding the reliability of financial reporting and the preparation of financial statements for external purposes in accordance with generally accepted accounting principles. Because of its inherent limitations, internal control over financial reporting may not prevent or detect misstatements. Also, projections of any evaluation of effectiveness to future periods are subject to the risk that controls may become inadequate because of changes in conditions, or that the degree of compliance with the policies or procedures may deteriorate. Management of the Company assessed the effectiveness of the Company’s internal control over financial reporting as of December 30, Based on such assessment and those criteria, management believes that the Company maintained effective internal control over financial reporting as of December 30, We acquired JL Audio on September 19, 2023, and are in the process of integrating the acquired business into our overall internal control over financial reporting process. As permitted under applicable regulations, we have excluded it from our assessment of the effectiveness of internal control over financial reporting as of December 30, 2023. Net sales and total assets (excluding the operating lease right-of-use assets, net identifiable intangible assets, and goodwill) of JL Audio represent 0.8% and 1.1%, respectively, of the related consolidated financial statement amounts for the year ended and as of December 30, 2023. Ernst & Young LLP, the independent registered public accounting firm that audited the Company’s consolidated financial statements, issued an attestation report on management’s effectiveness of the Company’s internal control over financial reporting as of December 30, (c) Attestation Report of the Independent Registered Public Accounting Firm Report of Independent Registered Public Accounting Firm To the Opinion on Internal Control We have audited Garmin Ltd. and Subsidiaries’ internal control over financial reporting as of December 30, 75 As indicated in the accompanying Management’s Report on Internal Control over Financial Reporting, management’s assessment of and conclusion on the effectiveness of internal control over financial reporting did not include the internal controls of JL Audio, which was acquired on September 19, 2023 and is included in the 2023 consolidated financial statements of the Company and constituted 1.1% of total assets (excluding the operating lease right-of-use assets, net identifiable intangible assets, and goodwill), as of December 30, 2023 and 0.8% of net sales, for the year then ended. Our audit of internal control over financial reporting of the Company also did not include an evaluation of the internal control over financial reporting of JL Audio. We also have audited, in accordance with the standards of the Public Company Accounting Oversight Board (United States) (PCAOB), the consolidated balance sheets of Garmin Basis for Opinion The Company’s management is responsible for maintaining effective internal control over financial reporting and for its assessment of the effectiveness of internal control over financial reporting included in the accompanying Management’s Report on Internal Control over Financial Reporting. Our responsibility is to express an opinion on the Company’s internal control over financial reporting based on our audit. We are a public accounting firm registered with the PCAOB and are required to be independent with respect to the Company in accordance with the U.S. federal securities laws and the applicable rules and regulations of the Securities and Exchange Commission and the PCAOB. We conducted our audit in accordance with the standards of the PCAOB. Those standards require that we plan and perform the audit to obtain reasonable assurance about whether effective internal control over financial reporting was maintained in all material respects. Our audit included obtaining an understanding of internal control over financial reporting, assessing the risk that a material weakness exists, testing and evaluating the design and operating effectiveness of internal control based on the assessed risk, and performing such other procedures as we considered necessary in the circumstances. We believe that our audit provides a reasonable basis for our opinion. Definition and Limitations of Internal Control Over Financial Reporting A company’s internal control over financial reporting is a process designed to provide reasonable assurance regarding the reliability of financial reporting and the preparation of financial statements for external purposes in accordance with generally accepted accounting principles. A company’s internal control over financial reporting includes those policies and procedures that (1) pertain to the maintenance of records that, in reasonable detail, accurately and fairly reflect the transactions and dispositions of the assets of the company; (2) provide reasonable assurance that transactions are recorded as necessary to permit preparation of financial statements in accordance with generally accepted accounting principles, and that receipts and expenditures of the company are being made only in accordance with authorizations of management and directors of the company; and (3) provide reasonable assurance regarding prevention or timely detection of unauthorized acquisition, use, or disposition of the company’s assets that could have a material effect on the financial statements. Because of its inherent limitations, internal control over financial reporting may not prevent or detect misstatements. Also, projections of any evaluation of effectiveness to future periods are subject to the risk that controls may become inadequate because of changes in conditions, or that the degree of compliance with the policies or procedures may deteriorate. /s/ Ernst & Young LLP Kansas City, Missouri February 21, (d) Changes in Internal Control over Financial Reporting There were no changes in our internal control over financial reporting during the quarter ended December 30, Item 9B. Other Information Trading Plans During the 13-week period ended December 30, 2023, no directors or officers (as defined in Rule 16a-1(f) of the Exchange Act) of the Company adopted or terminated any “Rule 10b5-1 trading arrangement” or “non-Rule 10b5-1 trading arrangement,” as each term is defined in Item 408(a) of Regulation S-K, except as follows: Item 9C. Disclosure Regarding Foreign Jurisdictions that Prevent Inspections Not applicable. 77 Item 10. Directors, Executive Officers and Corporate Governance Garmin has incorporated by reference certain information in response or partial response to the Items under this Part III of this Annual Report on Form 10-K pursuant to General Instruction G(3) of this Form 10-K and Rule 12b-23 under the Exchange Act. Garmin’s definitive proxy statement in connection with its annual meeting of shareholders scheduled for June The information set forth in response to Item 401 of Regulation S-K under the headings “Proposal The information set forth in response to Item 401 of Regulation S-K under the heading The information set forth in response to Item 405 of Regulation S-K under the heading The information set forth in response to Item 402 of Regulation S-K under the heading “Board Meetings and Standing Committee Meetings - Audit Committee” in the Proxy Statement is hereby incorporated herein by reference in partial response to this Item 10. The Audit Committee consists of Joseph J. Hartnett, Charles W. Peffer and Garmin’s Board of Directors has adopted the Code of Conduct of Garmin Ltd. and Subsidiaries (the “Code”). The Code is applicable to all Garmin directors, employees, and officers, including the Item 11. Executive Compensation The information set forth in response to Item 402 of Regulation S-K under the headings “Executive Compensation Matters” and 78 The information set forth in response to Item 407(e)(4) of Regulation S-K under the heading The information set forth in response to Item 407(e)(5) of Regulation S-K under the heading “Executive Compensation Item 12. Security Ownership of Certain Beneficial Owners and Management and Related Stockholder Matters The information set forth in response to Item 403 of Regulation S-K under the heading “Stock Ownership of Certain Beneficial Owners and Management” in the Proxy Statement is hereby incorporated herein by reference in partial response to this Item 12. Equity Compensation Plan Information The following table gives information as of December 30, A B C Plan Category Number of securities to be issued upon exercise of outstanding options, warrants, and rights Weighted-average exercise price of outstanding options, warrants, and rights Number of securities remaining available for future issuance under equity compensation plans (excluding securities reflected in column A) Equity compensation plans approved by shareholders 1,685,597 N/A 3,468,137 Equity compensation plans not approved by shareholders — N/A — Total 1,685,597 N/A 3,468,137 Table consists of the Garmin Ltd. 2005 Equity Incentive Plan, The Company has no knowledge of any arrangement, the operation of which may at a subsequent date result in a change in control of the Company. Item 13. Certain Relationships and Related Transactions, and Director Independence The information set forth in response to Item 404 of Regulation S-K under the The information set forth in response to Item 407(a) of Regulation S-K under the Item 14. Principal The information set forth under the headings “Audit Matters 79 Item 15. Exhibits and Financial Statement Schedules (a)List of Documents filed as part of this Report (1)Consolidated Financial Statements The consolidated financial statements and related notes, together with the reports of Ernst & Young LLP, appear in Part II, Item 8 “Financial Statements and Supplementary Data” of this Annual Report on Form 10-K. (2)Financial Statement Schedules All (3)Exhibits The exhibits listed below are filed as part of, or incorporated by reference into, this Annual Report on Form 10-K: EXHIBIT NUMBER DESCRIPTION 80 10.9* 10.10* 10.11* 97.1‡ Exhibit Inline XBRL Instance Document – the instance document does not appear in the Interactive Data File because its XBRL tags are embedded within the Inline XBRL document Exhibit 101.SCH‡ Inline XBRL Taxonomy Extension Schema With Embedded Linkbase Documents Exhibit 104‡ Cover Page Interactive Data File (formatted as Inline XBRL and contained in Exhibit ‡ Filed herewith. None. 81 SIGNATURES Pursuant to the requirements of Section 13 or 15(d) of the Securities Exchange Act of 1934, the registrant has duly caused this report to be signed on its behalf by the undersigned, thereunto duly authorized. GARMIN LTD. By /s/ Clifton A. Pemble Clifton A. Pemble President and Chief Executive Officer Dated: February 21, Know all persons by these presents, that each person whose signature appears below constitutes and appoints Clifton A. Pemble and Douglas G. Boessen and Andrew R. Etkind, and each of them, as his attorney-in-fact, with the power of substitution, for him in any and all capacities, to sign any amendments to this Annual Report on Form 10-K, and to file the same, with exhibits thereto and other documents in connection therewith, with the Securities and Exchange Commission, hereby ratifying and confirming all that said attorney-in-fact, or his substitute or substitutes, may do or cause to be done by virtue hereof. Pursuant to the requirements of the Securities Exchange Act of 1934, this report on Form 10-K has been signed below by the following persons on behalf of the registrant and in the capacities indicated on February 21, /s/Clifton A. Pemble Clifton Director, President and Chief Executive Officer (Principal Executive Officer) /s/ Douglas G. Boessen Douglas G. Boessen Chief Financial Officer and Treasurer (Principal Financial Officer and Principal Accounting Officer) /s/ Min H. Kao /s/ Jonathan C. Burrell Min H. Kao Jonathan C. Burrell Executive Chairman Director /s/ Joseph J. Hartnett /s/ Catherine A. Lewis Joseph J. Hartnett Catherine A. Lewis Director Director /s/ Charles W. Peffer Charles W. Peffer Director 82•Smartwatch Devices:Garmin offers a broadwide range of products designed for use in fitnesssmartwatch devices. The Garmin product offerings include GPS-enabled smartwatches, fashion-forward hybrid smartwatches with analog style displays, and activity tracking. fitness bands. The activity devices offered by Garmin currently offersare the Venu® series, vívoactive® series, vívomove® series, Lily® series, vívosmart® series, and Bounce™ series. Each series of smartwatch devices offered has unique features, all to consumers aroundenhance and promote healthy and active lifestyles. Features of the world:Running/Multi-Sport Watches –The Forerunner®smartwatch devices, depending on the series offers compact, lightweight training watches for athletes with an integrated GPS sensor that provide time, speed, distance, pace and other data. Most models also offer amodel, include wrist-based heart rate monitoring, functionAMOLED displays, ECG app, Garmin Pay, music storage capabilities, and heart-rate based calorie computation. In 2017,24/7 health monitoring.•Scales and Monitors: Garmin added the Forerunner 935, deliveringoffers a premium running and multisport watch with Garmin Elevate™wrist-basedrange of fitness accessories including chest strap heart rate monitoring. All Forerunner models allow runners to upload their data to the Garmin Connect™ application, where they can store, analyzemonitors, smart scales, and share their workout data. Additional advanced features include: Virtual Racer™, which allows runners to race against their previous best times, recovery advisor, race predictor and VO2 max estimate. Some models are designed specifically for triathletes. These all-in-one GPS-enabled devices provide detailed swim metrics and track distance, speed/pace, elevation and heart rate for running and cycling.blood pressure monitors.Cycling Computers –The Edge® series measures speed, distance, time, calories burned, climb and descent, and altitude offering an integrated personal training system designed for cyclists. In addition, Garmin offers devices geared toward performance-driven cyclists offering real-time connectivity through a smartphone, providing live tracking, social media sharing and real-time weather updates. In 2017, Garmin introduced the Edge 1030, a top-of-the-line bike computer with advanced navigation, performance and cycling awareness features.•7Cycling Power Meter –Garmin offers Vector™, which is a high-precision pedal-based power meter designed specifically for cyclists. It provides power data to compatible devices with (or using) ANT+® technology. Some models also measure and present right and left leg power balance.Cycling Safety and Awareness –Garmin offers the Varia™ product line focused on cycling safety and awareness. Varia™ bike radar alerts cyclists when vehicles are approaching from behind and Varia™ bike lights make the cyclist more visible when out on the road. Varia Vision™ is a heads up display that makes data available to the cyclist in their line of sight.Activity Tracking Devices –Garmin offers numerous devices to address the activity tracking market. The vívofit®fitness bands provide a personalized daily goal, track progress and remind users when it’s time to move. The devices feature a one-year battery life with an always-on display that show steps, goal countdown, calories, distance, time of day and heart rate when paired with a monitor. The vívosmart® provides the same functions as the vívofit®bands but also includes Garmin Elevate™, smart notificationsand a vibration alert. The vívosport™ also incorporates GPS, allowing users to even more accurately track distance, time and pace for their activities, as well as view a map of their activity on Garmin Connect™. The vívoactive®smartwatches are focused on the active lifestyle consumer with all the basic activity tracking features along with applications designed for running, cycling and swimming and includes connectivity to the Connect IQ™ application store for further customizations and capabilities. Garmin PayTM contactless payments was added with the launch of vívoactive 3 in 2017. The remainder of the vivo product line was updated in 2017 with the introduction of vívosmart 3, vívomove® HR, vívosport, and vívofit 4.Mobile –Connect™Connect™ Mobile are web and mobile platforms where users can track and analyze their fitness, activities and workouts, and wellness data. In addition, users can share their accomplishments, create training groups and group challenges, and get feedback and encouragement from the Connect community.•Connect IQ –third-parties third parties to create a variety of experiencesapplications that run on a wide assortment of Garmin devices. Connect IQ provides developers with an easy-to-use software development kit (SDK) to facilitate development efforts in creating watch faces, applications, widgets, and data fields. These third-party applications are available for download by Garmin users via their mobile phone or computer and run on their compatible Garmin wearable, bike computer, golf device, or outdoor handheld.
•8Adventure Watches: Garmin adventure watches offer a wide range of features, including wrist-based biometrics, sports apps, solar charging, music storage capabilities, preloaded full-color purpose-built adventure mapping of topography, ski resorts, and golf courses, built-in LED flashlights, and Garmin Pay™, depending on the model. The fēnix® and Epix™ series is for active lifestyle users seeking a premium smartwatch experience. The Instinct® series offers features for users seeking a rugged and reliable outdoor GPS smartwatch. The tactix® series is for users looking for tactical-inspired features, such as night vision compatibility and stealth mode. The Descent™ series is for users wanting additional diving functionality, including integrated air pressure monitoring, support for up to six gasses, and multiple dive modes. The Enduro™ series is for extreme endurance athletes who want additional battery and solar charging enhancements to extend battery life, along with advanced training features and competition modes. The MARQ® series collection of watches is for users seeking a luxury smart tool watch with premium materials.•InReach® and Garmin Response: Garmin offers several product lines that feature Garmin’s InReach capabilities. These devices include Iridium’s global satellite communication technology which, when combined with an active service plan, offers 2-way text messaging, weather forecasts, and S.O.S. capabilities while anywhere in the world. These S.O.S. capabilities are supported 24/7 by Garmin’s professionally trained associates at Garmin Response, our global emergency response coordination center.•Outdoor Handhelds and Satellite Communicators: Garmin offers devices under the Montana®, eTrex®, GPSMAP®, and inReach product lines. Devices range from basic waypoints navigators to advanced color touchscreen devices offering barometric altimeter, 3-axis compass, camera, preloaded maps, wi-fi and smartphone connectivity, two-way satellite communication, using InReach technology, solar charging, and other features.•Golf Devices: Garmin golf devices are offered under the Approach® product line. The Approach series includes watches, laser range finders, launch monitors, club sensors, and handhelds. Garmin maintains a comprehensive collection of over 43,000 golf course maps to provide useful information during real or simulated rounds. Wearable and handheld golf devices provide yardage distances to the front, back, and middle of the green. In addition to course maps, the Approach R10 portable launch monitor provides swing metrics including estimated carry and roll, club head speed, ball speed, smash factor, and swing tempo, as well as the ability to play a simulated round of any of our 43,000 worldwide mapped courses when paired with the Garmin Golf™ mobile app. The mobile app also offers scoring, shot tracking, and performance tracking features, in addition to the Home Tee Hero virtual round simulator for subscribers.•Consumer Automotive: Garmin is a leading manufacturer of personal navigation devices (PNDs), integrated and standalone dash cams, and auto accessories that include specialized features dedicated to a wide variety of vehicle and driver needs. Both the Drive series of full-featured traditional PNDs and the Garmin Dash Cam™ series of GPS-enabled dash cams serve a wide range of consumers. The dēzl™ ecosystem offers a broad range of products for professional truck drivers including headsets, electronic logging devices, and PNDs with over-the-road trucking features. The zūmo® series of PNDs is for users seeking motorcycle-specific features. The RV series of PNDs offers features specific to the RV enthusiast. Tread® is a line of rugged, all-terrain navigators with mapping specific for off-road guidance for overlanding, off-roading, and Baja racing, as well as live team tracking through integrated inReach technology in certain models. The Garmin Catalyst™ is an industry-first racing coach and driving performance optimizer.•Dog Devices: Garmin offers a variety of dog tracking and training devices, including those under the Alpha®, PRO, BarkLimiter™, and Delta® product lines.MarineAviation•Integrated Flight Decks:Known for defining the integrated flight deck (IFD) space in general aviation and light business aviation applications, Garmin offers OEM and retrofit IFD systems scaled for any size aircraft and rotorcraft, featuring communication and navigation, weather information, terrain and traffic awareness and avoidance, aircraft performance, and automated safety solutions.•Electronic Flight Displays and Instrumentation: Garmin flight display and instrument solutions can serve as primary or back-up systems, which also provide a wealth of valuable information in the cockpit, dramatically increasing situational awareness and capability.•Navigation and Communication Products: Garmin offers a wide range of integrated and stand-alone GPS navigation and very high frequency (VHF) radio communication products, with a variety of capabilities, available for all market segments.•Automatic Flight Control Systems and Safety-Enhancing Technologies:Garmin offers scalable flight control systems with unique integrated safety features for aircraft and rotorcraft. Our Autopilots, and Autonomí™ safety-enhancing solutions cover a wide spectrum of aircraft, from large-cabin business jets and helicopters to light general aviation aircraft. Garmin’s award-winning Autoland system will autonomously land the aircraft in the event the pilot is not able to do so, and Smart Glide™ will assist a pilot to get to the nearest airport in the event of the loss of engine power. We also offer an innovative Smart Rudder Bias system that can help the pilot maintain control of a twin-engine aircraft in the event of an engine failure.•Audio Control Systems:Garmin produces a broad array of cutting-edge audio systems, including panel-mount and remote-mounted units, incorporating features such as Bluetooth connectivity, voice command technology, and integrated intercoms.•Engine Indication Systems:Garmin offers a variety of advanced engine indication systems for piston and turbine-powered aircraft with comprehensive data-logging capabilities as well as wireless data offloading, cloud storage and analysis capability through our flyGarmin.com online services portal.•Traffic Awareness and Avoidance Solutions:Garmin offers an array of traffic advisory and collision avoidance systems, including TAS and TCAS / ACAS solutions, with applications in all types of aircraft.•ADS-B and Transponders:Garmin offers a full lineup of ADS-B and transponder solutions, including ADS-B “Out” compliant solutions as well as ADS-B “In” and Bluetooth capable units that allow pilots to connect to their mobile device to display ADS-B traffic and weather.•Weather Information and Avoidance Solutions:Garmin offers multiple weather solutions, including onboard Doppler digital radar products, along with satellite-based SiriusXM, ground-based ADS-B, as well as Garmin Connext® global satellite weather options.•Datalink and Connectivity:Garmin datalink and connectivity solutions allow pilots to download global weather data, communication via text/voice, as well as select mobile apps to transfer flight plans, manage database subscriptions, perform automatic database updates, monitor aircraft systems in real time 24/7, and stream weather and traffic data from installed avionics solutions.•Services:Garmin offers a variety of services products to the aviation market. Web and mobile app-based products offered via FltPlan.com and our Garmin Pilot™ electronic flight bag application, help pilots plan, file, fly, and log flights and offer a wealth of information across all phases of flight. Business and commercial aviation customers also benefit from our FltPlan® safety management system, and our AeroData solutions consisting of runway analysis and performance data, weight and balance, obstacle clearance, load planning, and navigation database products. Garmin continues to provide industry-leading product support, and offers a wide selection of databases, training products, extended warranties, and subscription services for all aviation segments.•Chartplotters and Multi-Function Displays (MFDs) –GPSMAP®GPSMAP® and echoMAP™ECHOMAP™ product lines. The offerings range from 4-inch portable and fix-mounted products to 24-inch fully-integrated27-inch fully integrated Glass Helm offerings.The Garmin Quickdraw™ Contours feature allows usersofferings with 4k resolution displays and include wireless connectivity to the ability to generate their own fishing charts while they cruise around the lake. Additional advanced features and connectivity available include smartphone applications that wirelessly send weather data to your plotter and remotely access your helm electronics. Additionally, most models have the CHIRP sonar function fully integrated to reduce system cost. Our chartplotters also support “plug-and-play” access to onboard sensors and Garmin accessories with NMEA 2000, Garmin Marine Network (a system that combines GPS, radar, SiriusXM WX Satellite Weather, sonar, and other components) and the FUSION-Link™ entertainment interface. Most of our chartplotter/MFD line-up also support Wi-Fi to enable many connected features includingActiveCaptain® mobile updates and data synchronization to ensure the latest information and software is always available for the vessel. The ActiveCaptain™ app (available in the Apple and Android app stores) enables the full set of connected features through mobile phones or tablets.app.•Cartography –: Garmin is a premier supplier of cartography for the recreational marine electronics market. In 2017 we acquired Navionics, which complementsIncluding the BlueChart® g2 and LakeVü HD cartography we already offered. Navionics cartographyGarmin-owned Navionics® branded charting products, Garmin is also compatible with 3rd party chart plotters as well, and the combination makes Garmin the worldwide leader ina leading supplier of recreational marine content. Cartography options range from U.S. coastalcontent for most major chartplotters and inland lake mapping, including worldwide basemaps, to highly detailed BlueChart® g2 Vision® and LakeVü HD Ultra charts with coverage in many parts ofMFDs on the world offering auto-guidance (Garmin US-patented), 3-D chart views and aerial reference photos. BlueChart g2 Vision and LakeVü HD Ultra includemarket. Garmin’s most detailed cartography created based on surveys done in U.S. inland waters by Garmin’s fleet of high tech boats. Underfeatures the Navionics brand, we offerNavionics+ Marine & Lakes as well as Navionics Platinum with premium features such as satellite overlay and 3D charts. We also offer the highly-rated Navionics boating app to bring cartography to mobile phones and tablets of boaters worldwide.patented Auto Guidance+™ routing technology.Fishfinders –•Fishfinders:Garmin offers a newan advanced line of fishfinders, the Striker™ series, which incorporateincorporates GPS technology and Quickdraw™ Contours. These fishfinders are available in screen sizes from 4 to 9 inches and are paired with our latest technology sonar transducers to provide the clearest sonar pictures on the water. ClearVü sonar andenabling Garmin Quickdraw™ Contours, are offered onand wireless features through the 4-, 5-, 7-ActiveCaptain and 9-inch models which providesStrikerCast mobile apps.•SONAR: Garmin offers the LiveScope™ sonar system producing high resolution, live sonar views showing the true action under water. LiveScope provides real-time, high-resolution images ofthat can be seen in downward, perspective, and forward-looking views for locating the fish and seeing what is coming before you get there. The Panoptix™ line also offers detailed 3D underwater views of fish and structure under the boat and the ability to create your own fishing maps. The 7- and 9-inch models also offer a SideVü option which provides similar high resolution images but reaches much further out on either side of the boat making the search for fish more efficient. The GPS technology enables anglers to have highly accurate speed information and mark their best fishing spots and then easily return to them next weekend, next month, or next year. The 7- and 9-inch models also offer Wi-Fi technology which enables wireless updates and Quickdraw™ Contour sharing that give anglers the ability to share their fishing maps with others or download maps from a community where others have shared their maps.9Sounders –Garmin offersboat. Garmin’s CHIRP “black-box” sounders and “smart transducers” which interface with Garmin MFDs to enhance their utility by providing the depth sounderdeep-water sounders and fish finderfishfinder functions in a remote mounted package. The black boxes provide CHIRP, ClearVü, and SideVü sonar similar to our integrated sonar plotters, but can be mounted in a more convenient location away from the helm. Additionally, we offer up to 3kW transmit power with our black box line-up which will reach deeper depths for ocean use. Our newest smart transducer line is the Panoptix™ all seeing sonar. It uses new technology to provide detailed images that can be seen real-time (LiveVü) and in 3D (RealVü). The Panoptix line also offers multiple forward-looking transducers for transom, trolling motor, or thru-hull mounting configurations that enable the FrontVü feature. FrontVü allows mariners to see ahead of the boat a distance of 8 to 10 times the water depth up to 300 feet.•Autopilot Systems –as:as remote steering, speed control, and Garmin’s patented Shadow Drive™ technology, which automatically disengages the autopilot if the helm is turned, remote steering and speed control, and integration with the Volvo Penta IPS steering and propulsion system.turned. Garmin has also introduced steer-by-wire autopilot capabilities for various types of steering systems.Radar –•RADAR: Garmin offers high-tech solid state Fantom™ radar with MotionScope™ Doppler technology, lowering system power consumption and increasing reliability, while greatly improving situational awareness of the captain. MotionScope™ can instantly show if a target is closing in or safely going the other direction. Fantom™Fantom radars are available in both radomesradome and open array radar products with compatibility to any network-compatible Garmin chartplotter. When paired with our newer MFDs, theGarmin also offers a full line of magnetron radars support dual-range mode so users can operate the radar in two ranges independently. The Fantom™ radars are offered in addition to the more traditional magnetron radars. The Garmin radar solutions range from 18 inches to 6 feet antennas and from 4kW (or equivalent) up to 25kW with a maximum range of 96 nautical miles.transmit power.•Instruments –: Garmin offers NMEA 2000 and NMEA 0183 compliant instrument displays and sensors that show data from multiple remote sensorssources on one screen. Mariners can display instrument data such as depth, speed through the water, water temperature, fuel flow rate, engine data, fuel level, wind direction and more, depending upon the specific sensors connected. Garmin instruments offer screen sizes from 4 to 10 inches, and the 10-inch mast mounted displays provide maximum visibility around the vessel.•VHF Communication Radios –providesoffers a full line-up of marine VHF radios and Automatic Identification System (AIS) transceivers with differingthe latest feature sets including integrated GPS receivers for the radiocommunication needs of all types of mariners. Theentry-level radio isGarmin radios are NMEA 2000 compatible while the mid-range and premium radios are designed for larger vessels and are NMEA 2000 and NMEA 0183 compatible, offer multi-station support, and monitor all AIS channels at the same time. Some models offer an AIS receiver built-in to the standard VHF radio.channels.•Handhelds and Wearable Devices –marine-friendlybuilt-in LED flashlight, and solar charging, depending on model. Garmin also offers floating marine GPS handheld featuring a 3-axis tilt-compensated electronic compass,handhelds with wireless data transfer between compatible units and preloaded cartography for the coastal United States. The quatixcartography. Some handhelds contain built-in InReach® series, Garmin GPS watches designed for mariners, combines marine features for navigation, sailing, stereo control, satellite communication and even some autopilot functions while integrating Garmin’s GPS technology and interface. The quatix 5 model also includesGarmin Elevate™wrist-based heart rate monitoring.support Connect IQ™ applications.10Sailing –Sailing:Garmin has integrated many basic and advanced sailing features into our MFD and instrument systems. These SailAssistGarmin SailAssist™ features include enhanced wind rose with true and apparent wind data, POLAR tables, pre-race guidance, synchronized race timer, virtual starting line, time to burn and lay line data fields.Entertainment –•Audio:Garmin’s entertainment brand, FUSION®audio brands, Fusion® and JL Audio®, consists of marineoffer premium audio products and accessories, including head units, speakers, amplifiers, subwoofers, and amplifiers.other audio components. These products are designed specifically for the marine, powersports, aftermarket automotive, home, or RV environments, offering premium sound quality and supportsupporting many connectivity options for integrating with MFDs, smartphones, and evenGarmin wearables.•Digital Switching:Garmin offers digital switching products under the EmpirBus™ product line. The Garmin quatix®EmpirBus products provide power distribution and control solutions for marine watch for an outstanding experience onand RV applications which enable advanced logic controls and smart electrical systems to enhance features in a boat or RV. The system features fully customizable graphics and user interface that can be controlled through Garmin’s marine multi-function displays and RV OEM products.•Trolling Motors:Garmin offers the water.Force® Trolling Motor series, powerful, efficient trolling motors with built-in CHIRP and Ultra High-Definition ClearVü™ and SideVü™ sonar. The FUSION marine head units are designed specifically forproduct line includes the marine environment and featureForce Kraken with up to 4 zones in one unita 90” shaft length and a smaller mounting footprint. The Force product line also connects wirelessly to control. The system can support multiple head units allowing controlGarmin chartplotters/MFDs to provide navigation, autopilot, and anchor lock integration.whole system from a Garmin MFD.AviationGarmin’s aviation segment•Domain Controllers: Garmin is a leading providertier-one supplier of domain controllers, offering remote computing modules that control various systems throughout a vehicle including infotainment, instrumentation, key advanced driver-assistance systems (ADAS) functionality, and rear seat entertainment.•Infotainment Units:Garmin is a tier-one supplier of infotainment solutions, to aircraft manufacturers, existing aircraft ownerswith offerings including centralized control and operators, as well as military/government customersintegrated multi-display platforms for premium audio and serves a range of aircraft including business aviation, general aviation, experimental/light sport, helicopters, optionally piloted vehicles (OPV), unmanned aerial vehicles (UAV)multimedia, navigation, cameras, smartphone links, customized voice recognition and more. Garmin’s portfolio includes flight displays, navigation, communication, flight control, hazard avoidance, weather radar, radar altimeter, datalink weather receiverspersonal assistants, and services, engine information systems, traffic collision avoidance systems, terrain awareness and warning systems (TAWS), controller-pilot data link (CPDLC), an expansive suite of automatic dependent surveillance broadcast (ADS-B) solutions, in-cockpit and cloud connectivity, wearables, portables, apps, training, simulation, aviation data services as well as other solutions that are known for innovation, reliability, and value. The list below includes a sampling of some of the aviation capabilities currently offered by Garmin around the world:rear-seat entertainment instrument clusters.Integrated Flight Decks/Flight Displays –•Other: Garmin offers a rangecollection of integrated glass flight decks from the G1000® and G1000® NXi for the general aviation and business aviation markets to the G5000® for business aviation, military and commercial applications. Integrated capabilities include: navigation, communication, flight instruments, weather, terrain, traffic, ADS-B, engine information on large high-resolution color displays, and automatic flight control systems. Head-up display technology virtually mirrors the primary flight display instruments allowing for increased aircraft capability in adverse weather conditions. Additional features include: Garmin’s 3-D synthetic vision technology (SVT™), weather, Garmin’s electronic stability and protection system (ESP™), electronic flight charts, touchscreen and voice controls, CPDLC, audio and visual feedback, and animation to help pilots know exactly how the system is responding to their input.Garmin offers similar integrated glass flight decks for the helicopter market with the G1000H® and G5000H®. Basic and advanced capabilities are similar to those offered to the aircraft market. The helicopter offerings have been optimized for rotorcraft and offer features like helicopter synthetic vision technology (HSVT™), helicopter terrain awareness and warning system with voice call outs, radar altimeter display, helicopter-specific databases that include additional heliports and low-altitude obstacles, WireAware™ wire-strike avoidance technology, as well as high resolution terrain, tailored ADS-B traffic alerting, and the ability to display video from a forward looking infrared (FLIR)software, map database, camera, or other video sources.11Garmin also offers all-glass integrated flight decks to the retrofit market through G950® NXi, G1000® NXi and G5000®. Additionally, Garmin offers electronic flight display solutions that provide essential information such as aircraft altitude, attitude and heading while also displaying data from other avionics such as weather, traffic and much more. These solutions include G3X Touch™, G500H, G500 TXi, G600 TXi and G700 TXi.Panel-mount aviation products –GPS/Navigation/Communication Solutions –Garmin serves the market with the GTN™ series, a premium touchscreen GPS, VHF navigation and communication, and multi-function display (MFD). In addition to these core functions, this series of products combines a wealth of information for the pilot into a single display including flight planning, datalink weather, weather radar, traffic, terrain awareness and warning system (TAWS/HTAWS), charts, airport information, airspace boundaries, and much more. Additional capabilities provide advanced ADS-B “In” traffic display, including TerminalTraffic™ and patented TargetTrend™ technology as well as the ability to control the display with voice commands. Advanced GTN integration capabilities provide the option to install and control a remotely located transponder and audio processor for an even more streamlined installation and single interface. The GTN™ series also provides wireless cockpit connectivity (when properly equipped) with mobile device apps (such as Garmin Pilot™) or portable aviation navigators (such as aera® 660). Wireless cockpit connectivity features can include voice call control, text messaging, automatic wireless database updating via Database Concierge, wireless flight plan transfer, SiriusXM radio control, sharing of weather, traffic, position information and more. Garmin also offers more traditional VHF navigation and VHF communication transceivers with the GNC®and GTR™ series.Traffic Solutions –Garmin offers a comprehensive line of traffic alert and collision avoidance systems (TCAS) and traffic advisory systems (TAS) for all markets served. Advanced TCAS II systems actively identify potential aircraft threats, coordinate and instruct the pilot with a resolution advisory (RA) via a spoken command. The GTS™ series also offers TCAS I and TAS that combine active and passive surveillance data to pinpoint specifictraffic threats. The systems use our patented CLEAR CAS™ technology and correlate passive automatic dependent surveillance broadcast (ADS-B) targets with active surveillance targets for a more comprehensive display to the pilot. These systems can also provide audible alerts in a spoken ATC-like format that is easily understood by the pilot and allows him to keep his eyes outside of the aircraft.Audio Solutions –The GMA™ series of audio panels ranging from offerings with basic capabilities for the recreational pilot to advanced capabilities includingvoice control of audio panel and GTN™ series functions, Bluetooth connectivity for wireless music input, phone calls and VIRB®action camera audio output, advanced audio effects, 3D spatial audio processing, digital voice recorder, advanced auto squelch, ambient noise based volume adjustmentand independent pilot/co-pilot communications capabilities. When connected to a Garmin GTN™ series navigator, advanced voice control functions are available, and include the ability to change page views, load destination frequencies and much more.12Transponder and ADS-B Solutions –Garmin offers solutions for all aviation markets we serve that meet and exceed the FAA’s ADS-B mandate that requires all aircraft operating in select U.S. airspace (typically where a Mode C or S transponder is required today) to equip by 2020. For business aviation aircraft, Garmin pairs the GTX™ 3000 transponder and GDL® 88 datalink for both ADS-B out and in while mitigating the need to modify the existing aircraft panel. The GTX 345 and GTX 335 are also available as an option for some business aviation aircraft.Business aviation, general aviation, helicopters and experimental/light sport aircraft can utilize our popular GTX 345 series of all-in-one ADS-B transponders that offer options with and without GPS built-in (if the aircraft is not already equipped with mandate required GPS source) as well as ADS-B “In”. ADS-B “In” information can be displayed on compatible Garmin displays like G1000®, G1000® NXi, GTN™, G500, G600, G500 TXi™, G600 TXi, and G700 TXi, as well as select third party displays. Additionally, the GTX 345 can wirelessly transmit this data to a portable device such as a tablet using the Garmin Pilot™ app or compatible Garmin portable. ADS-B “In” offers pilots basic weather information including weather radar imagery, as well as traffic information that can be enhanced with our TerminalTraffic™ and patented TargetTrend™ technology.Garmin also offers a range of FAA certified UAT-based ADS-B products within the GDL® series, including both ADS-B “Out” and ADS-B “In/Out” solutions with options for built-in GPS.Many of the ADS-B “In” capable products provide traffic correlation with both Garminwearable, and other compatible third party traffic systems (such as TCAS)automotive solutions.providesupport a single, correlated displaybroad and diverse network of trafficsales channels for our products while maintaining high quality standards to the pilot. Someensure end-user satisfaction. Our products also offer the option for diversity (dual) antenna installations.Weather Solutions –Weather capabilities are delivered within our GDL®, GSR™, GSX™, GTX™ and GWX™ series. Garmin solutions include offering SiriusXM satellite data link weather information (subscription required) to an aircraft via various panel-mount Garmin displays and/or portable devices. With our GSR 56 datalink,on-demand global weather information, text/voice communications and position trackingsold through the Iridium satellite network (subscription required) is available. The GWX and GSX series offer solid state, real-time, airborne doppler-capable weather radar solutions. Doppler-enhanced features include ground-clutter suppression and turbulence detection. Advanced capabilities also include lightning and hail prediction, volumetric autoscanning and predictive windshear technology.Flight Control Solutions –Garmin offers both standalone and integrated flight control solutions. Our G1000®, G1000® NXi, G2000®, G3000® and G5000® platforms are integrated with our GFC™ 700 digital autopilot. For aircraft not equipped with a Garmin integrated flight deck, we offer the GFC 600 and GFC 500 digital autopilots. The GFC 600 and GFC 500 uniquely integrate with our other stand-alone avionics to allow display of the autopilot modes, flight director (FD) command cues and more. The unique design of our autopilots delivers superior in-flight characteristics, self-monitoring capabilities and minimal maintenance needs when compared to older generation autopilot systems. They also boast a robust feature set that incorporates a number of safety-enhancing technologies, including Electronic Stability and Protection (ESP™), underspeed/overspeed protection, Level Mode and much more.13Portable and Wearable Solutions –Garmin offers a variety of portable aviation solutions,indirect distribution channels, including our aera® series portable navigators, VIRB® aviation action cameras, D2™ series pilot watches and GDL® series remote ADS-B/SiriusXM receivers. The aera series offers aviators a touchscreen navigation device compatible with a complement of aviation databases including navigation, SafeTaxi®, FliteCharts®, airport directory and terrain/obstacles for heightened situational awareness. Advanced features can include: 3D Vision virtual perspective view of surrounding terrain, a digital document viewer, a scratch pad, geo-referenced sectional and approach charts, wireless database updating, and SiriusXM radio and weather display (subscription required). Complementing the portable display products and the Garmin Pilot™ mobile application is the GDL 52 series, which can provide a remote source of GPS, ADS-B “In” information for traffic and weather, SiriusXM weather and audio as well as backup attitude reference.The Garmin wearable aviation solutions include our D2 series pilot watches, which offer a built-in worldwide aviation navigation database and more alongside multisport and smartwatch features. Designed specifically for aviators, the current D2 series can display weather information (METARS and TAFs) as well as weather radar from an internet connected smartphone. Other flight information capabilities include a moving map overlaid with the aircraft’s position, HSI navigation, Zulu/UTC time and more. With a built-in baro-adjustable altimeter, vibrating alerts based on altitude can be activated to remind a pilot to activate supplemental oxygen or perform other time critical tasks. Multisport features include wrist-based heart rate monitoring, and smartwatch capabilities include notification and previews of phone calls, text messages, emails and more. Our VIRB® aviation action camera products provide pilots a comprehensive solution to record their flights, with the ability to integrate air traffic control communications to the audio recording, filter out prop distortion and overlay speed, altitude, G-force and more for enhanced post flight analysis.Mobile Application –Garmin Pilot™ is a premium, global app for iOS or Android mobile devices used for flight planning, filing a flight plan, in flight navigation, and automatic flight logging. It offers a comprehensive and simplified experience to access a wealth of information during any particular phase of the flight including weight and balance, performance, and trip calculations, checklists, airport information, weather, traffic, 3D Vision virtual perspective view of surrounding terrain, a digital document viewer, a scratch pad, geo-referenced sectional and approach charts, wireless database updating, ADS-B weather and traffic as well as SiriusXM radio and weather (subscription required). It incorporates global or regional navigation databases and charting options from Garmin as well as optional Jeppesen data and charts. While internet connected, the app provides access to comprehensive global weather information, as available per region, that generally includes weather radar, weather report (METARS), forecasts (TAFs), weather alerts (AIRMETS/SIGMETS), pilot reports, satellite imagery (visible and IR), winds and temperature aloft, lightning data, and notices to airmen (NOTAM). Garmin Pilot™ is the cornerstone of Garmin’s connected cockpit, for example when connected wirelessly with G1000® NXi or GTN™, a host of benefits become available including automated database updates for the avionics, flight plan transfer, weather and traffic streaming and much more. Garmin Pilot™ is also wirelessly compatible with select aera® series, D2™ aviator watches, G3X Touch™ flight displays, GTX™ series transponders, VIRB® action cameras and much more.Aviation Databases, Extended Warranties and Subscription Services –Garmin offers a wide selection of databases, extended warranties and subscription services to complement our products. Our database offerings include Navigation Data, Obstacles, SafeTaxi®enhanced airport diagrams, Terrain, Basemap and more. Some of these databases are required by government regulations to be updated regularly for legal flight, and Garmin offers single updates as well as annual subscriptions for owners and operators to update all of an aircraft's qualifying avionics systems at a single price. With a database subscription and compatible avionics, owners and operators can conveniently and wirelessly transfer the latest database updates to their avionics via a mobile device running our Garmin Pilot™ application.14Our aviation product support team has been honored with top awards from two of the leading independent avionics support surveys for 14 consecutive years. To further our full product support beyond the standard product warranties, we also offer fixed price extended warranties for avionics and integrated flight decks that allow owners and operators peace of mind and predictable maintenance costs. These further our standard warranty periods with world-class factory technical service, 24/7 aircraft-on-ground (AOG) emergency service and more.Our comprehensive satellite datalink network subscriptions provide owners and operators with compatible avionics, a global weather, voice calling, text messaging and position reporting solution. Global weather includes radar imagery, cloud cover, METARs, TAFs and much more for any point on the globe where the data is available (weather products vary by region).Sales and MarketingGarmin’s non-aviation products are sold in approximately 100 countries through a large worldwide network of independent retailers, dealers, distributors, installation and distributors, who meetrepair shops, and OEMs. We also sell our salesproducts and customer service qualifications. No single customer’s purchases represented 10% or more of Garmin’s consolidatedservices directly through our online webshop (garmin.com), subscriptions for connected services, and our own retail stores. During 2023, the Company’s net sales in the years ended December 30, 2017, December 31, 2016, and December 26, 2015.through its direct distribution channels accounted for greater than 10% of total net sales. Marketing support is provided geographically from Garmin’s offices around the world. Garmin’s distribution strategy is intended to increase Garmin’s global penetration and presence while maintaining high quality standards to ensure end-user satisfaction. Some of Garmin’s larger consumer products dealers and distributors include:·Amazon.com—internet retailer;·Best Buy—one of the largest U.S. and Canadian electronics retailers;·Walmart—the world’s largest mass retailer; and·Decathlon—one of the world’s largest sporting goods retailersGarmin’s retrofit avionics and aviation portable products are sold through select aviation dealers around the world and, in the case of aviation portable products, also through catalogs and pilot shops. Garmin’s largest aviation dealers include Aircraft Spruce & Specialty Co., Elliott Aviation, Gulf Coast Avionics Corp., Sarasota Avionics, and Sportsman’s Market. Avionics dealers have the training, equipment and certified staff required for installation of Garmin’s avionics equipment.CompetitionIn addition to the traditional distribution channels mentioned, Garmin has many relationships with original equipment manufacturers (OEMs). In the auto segment, Garmin’s products are sold globally to automotive and motorcycle OEMs, either directly or through tier 2 sourcing. Some of Garmin’s larger OEM relationships include BMW, Chrysler, Honda, Daimler (Mercedes Benz), Toyota, and Volkswagen. In the marine segment, Garmin’s products are standard equipment on various models of boats. Some of the larger OEM relationships include Tiara, Ranger Tugs, Chaparral Boats, Inc., Cobalt Boats, LLC, Regal Marine Industries, Inc., Yellowfin Yachts, Hydrasports Boats, Viking Yachts, Bavaria Yachts, and Sea Hunt. In the aviation market, Garmin’s avionics are either standard equipment or options on various models of aircraft. Some of the larger OEM relationships include Airbus Helicopters, Bombardier Business Aircraft, Bell Helicopter, Cirrus Aircraft, Daher, Diamond Aircraft, Embraer, Gulfstream Aerospace, Honda Aircraft, Leonardo Helicopters, Piper Aircraft, Quest Aircraft, Robinson Helicopter Company, Tecnam, and Textron Aviation.15CompetitionIn general, weWe operate in highly competitive markets, though competitive conditions do vary among our diverse productstarget markets and geographies. Garmin believes the principal competitive factors impacting the market for its products are design, functionality, quality and reliability, customer service, brand, price, time-to-market and availability. Garmin believes that it generally competes favorably in each of these areas and as such, is generally a significant competitor in each of our major markets.portable automotivefitness products are TomTom N.V.Apple, Bryton, Coros, Elite, Fitbit (Google), Huawei, Polar, Samsung, SRAM, Suunto, Wahoo Fitness, Whoop, Xiaomi, Zepp Health, and MiTAC Digital Corporation (MiTAC) (which distributes products under the brand names of Magellan, Mio, and Navman). Garmin believes that its principal competitors for infotainment solutions are Harman International Industries, Panasonic Corporation, and the Mitsubishi Group.Zwift. Garmin believes that its principal competitors for outdoor product lines are Casio, Coros, Dogtra, Globalstar, Rand McNally, Shearwater Research, SportDOG, Suunto, TAG Heuer, Tissot, TomTom, Trackman, Vista Outdoor, Magellan, a subsidiary of MiTAC, SportDOG Brand, Suunto Oy and Dogtra Company.Zoleo. Garmin believes thatconsiders its principal avionics competitors for fitness products are Appleto be Aspen Avionics, Avidyne, Dynon Avionics, ForeFlight, Genesys Aerosystems, Honeywell Aerospace & Defense, Innovative Solutions and Support Inc., Samsung Electronics Co.Jeppesen (Boeing), Ltd.L-3 Avionics Systems, Collins Aerospace (Raytheon), Bryton Corp., Fitbit Inc., Polar Electro Oy, Sigma Sports, Suunto OySafran, Thales, and Wahoo Fitness.Universal Avionics Systems Corporation. For marine products, Garmin believes that its principal competitors are Furuno, Electronic Company, the Humminbird division of Johnson Outdoors, Inc.Navico (Brunswick), Navico and Flir Systems, Inc. For Garmin’s aviation product lines,Raymarine (Teledyne). Garmin considersbelieves that its principal competitors to be Aspen Avionics, Avidyne Corporation, CMCfor auto OEM infotainment solutions are Alpine Electronics, Dynon Avionics, Appaero Systems, Genesys Aerosystems, Honeywell Aerospace & Defense, Innovative SolutionsAptiv, Bosch, Continental, Harman (Samsung), Panasonic, and Support Inc., L-3 Avionics Systems, Rockwell Collins, Inc., Thales, Safran SA and Universal Avionics Systems Corporation.Visteon.staff, which numbered approximately 4,000 people worldwide as of December 30, 2017.staff. Garmin’s manufacturing staff includes manufacturing process engineers who work closely with Garmin’s design engineers to ensure manufacturability and manufacturing cost control for its products. Garmin’s development staff includes industrial designers, as well as software engineers, electrical engineers, mechanical engineers, and cartographic engineers. Garmin believes the industrial design of its products has played an important role in Garmin’s success. Once a development project is initiated and approved, a multi-disciplinary team is created to design the product and transition it into manufacturing.Below is a table of Garmin’s expenditures on research and development over the last three fiscal years. December 30, December 31, December 26, ($'s in thousands) 2017 2016 2015 Research and development $ 511,634 $ 467,960 $ 427,043 Percent of net sales 16.6 % 15.5 % 15.1 % and strengths is its vertically integrated manufacturing capabilities at its Taiwan facilities in Xizhi, Jhongli, LinKou, and LinKou,Xinshi, its China facility in Yangzhou, its Netherlands facility in Oegstgeest, its Poland facility in Wroclaw, and at its U.S. facilities in Olathe, Kansas, Salem, Oregon, and Salem, Oregon.Miramar, Florida. Garmin believes that its ownership and operation of its own manufacturing facilities and distribution networks provides significant capability and flexibility to address the breadth and depth of resources necessary to serve its diverse products and markets.16itsthe vertical integration of its manufacturing capabilities provides advantages to product cost, quality, and time to market.ourof manufacturing resources across high, mid, and low volume products. Sharing of these resources across our product lines favorably affects Garmin’s costs to produce its range of products, with lower volume products realizing the economies of scale of the highhigher volume products. The ownership and integration of ourits resources allowsGarmin to optimize the design for manufacturing of ourits products, yielding improved cost.sophisticatedadvanced production processes provide in-service robustness and consistent reliability standards that enablesenable Garmin to maintain strict process and quality control of the products manufactured, thereby improving the overall quality of our products. Additionally, the immediate feedback throughout the manufacturing processes is provided toshared with the development teams, providing integrated continuous improvement throughout design and supply chain.Garmin’s design, manufacturing, distribution, and servicing processes in its U.S., Taiwan, China and U.K. facilities are certified to ISO 9001, an international quality standard developed by the International Organization for Standardization. Garmin’s automotive operations in Taiwan, China, U.K., and Olathe have achieved TS 16949 certification,quality standard for automotivelarge number of qualified suppliers. Garmin’s Olathe and Salem aviation operations have achieved certification to AS9100, the quality standard for the aviation industry.Garmin International, Inc., Garmin (Europe) Ltd. and Garmin Corporation have also achieved certification of their environmental management systems to the ISO 14001 standard, recognizing Garmin’s systems and processes which minimize or prevent harmful effects on the environment and continually strive to improve its environmental performance.Materialsmostmany components essential to Garmin’s business are generally available from multiple sources, certain key components are currently obtained by the Company from single or limited sources, which subjects Garmin to supply and pricing risks. Many ofFor these andcomponents, we have limited near-term flexibility to use other key components that are available from multiple sources, including, but not limited to, NAND flash memory, dynamic random access memory (DRAM), GPS chipsets and certain LCDs, are subject at times to industry-wide shortages and commodity pricing fluctuations.Garmin and other participants in the personal computer, tablet, mobile communication, aviation electronics and consumer electronics industries also compete for various components with other industries that have experienced increased demand for their products. In addition, Garmin uses some custom components that are not common to the rest of the personal computer, tablet, mobile communication and consumer electronics industries, and new products introduced by the Company often utilize custom components available from only one source until Garmin has evaluated whether there is a need for, and subsequently qualifies, additional suppliers. When a component or product uses new technologies, initial capacity constraints may exist until the suppliers’ yields have matured or manufacturing capacity has increased. Garmin makes efforts to manage risks in these areas through the use of supply agreements and safety stock for strategically important components. Nevertheless, if Garmin’s supply of a key single-sourced component for a new or existing product was delayed or constrained, if such components were available only at significantly higher prices, orsuppliers if a key manufacturingcurrent vendor delayed shipments of completed products to Garmin, Garmin’s financial condition and operating results could be materially adversely affected. Garmin’s business and financial performance could also be adversely affected depending on the time required to obtain sufficient quantities from the original source,becomes unavailable or to identify and obtain sufficient quantities from an alternative source. Continued availability of these components at acceptable prices, or at all, may be affected if those suppliers decided to concentrate on the production of common components instead of components customizedis unable to meet Garmin’sour requirements. While extended disruptions at these suppliers could impact our ability to meet customer demand due to component shortages or increased lead times, or cause us to incur higher product costs, we believe these potential disruptions would not disproportionately disadvantage us relative to our competitors.17BacklogOur sales are generally of a consumer nature and there is a relatively short cycle between order and shipment. Therefore, we believe that backlog information is not material to the understanding of our business. We typically ship most orders within 72 hours of receipt. For example, Garmin obtains licenses for digital cartography technology for use in our products from various sources.2018, Garmin’s worldwide IP portfolio included2024, Garmin has been issued over 1,100 patent1,900 patents throughout the world and 750holds more than 1,160 trademark registrations. The duration of patents varies in accordance with the provisions of applicable local law. We believe that our continued success depends on the intellectual skills of our employees and their ability to continue to innovate. Garmin will continue to file and prosecute patent applications when appropriate to attempt to protect Garmin’s rights in its proprietary technologies.whichthat we may later acquire, may successfully withstand any challenge, in whole or in part. It is also possible that any patent issued to us may not provide us with any competitive advantages, or that the patents of others will preclude us from manufacturing and marketing certain products. Despite our efforts to protect our proprietary rights, unauthorized parties may attempt to copy aspects of our products or to obtain and use information that we regard as proprietary. Litigation may be necessary in the future to enforce our intellectual property rights, to protect our trade secrets, to determine the validity and scope of the proprietary rights of others or to defend against claims of infringement or invalidity.RegulationsThe telecommunications industry is highly regulated, and the regulatory environment in which Garmin operates is subject to change. In accordance with the United States’ Federal Communications Commission (FCC) rules and regulations, wireless transceiver products are required to be certified by the FCC and comparable authorities in foreign countries where they are sold. Garmin’s products sold in Europe are required to comply with relevant directives of the European Commission. A delay in receiving required certifications for new products, or enhancements to Garmin’s products, or losing certification for Garmin’s existing products could adversely affect our business. In addition, aviation products that are intended for installation in “type certificated aircraft” are required to be certified by the FAA, its European counterpart, the European Aviation Safety Agency, and other comparable organizations before they can be used in an aircraft.18Because Garmin Corporation, one of the Company’s principal subsidiaries, is located in Taiwan, foreign exchange control laws and regulations of Taiwan with respect to remittances into and out of Taiwan may have an impact on Garmin’s operations. The Taiwan Foreign Exchange Control Statute, and regulations thereunder, provides that all foreign exchange transactions must be executed by banks designated to handle such business by the Ministry of Finance of Taiwan and by the Central Bank of the Republic of China (Taiwan), also referred to as the CBC. Current regulations favor trade-related foreign exchange transactions. Consequently, foreign currency earned from exports of merchandise and services may now be retained and used freely by exporters, while all foreign currency needed for the import of merchandise and services may be purchased freely from the designated foreign exchange banks. Aside from trade-related foreign exchange transactions, Taiwan companies and residents may, without foreign exchange approval, remit outside and into Taiwan foreign currencies of up to $50 million and $5 million respectively, or their equivalent, each calendar year. Currency conversions within the limits are processed by the designated banks and do not have to be reviewed and approved by the CBC. The above limits apply to remittances involving a conversion between Taiwan Dollars and U.S. Dollars or other foreign currencies. The CBC typically approves foreign exchange in excess of the limits if a party applies with the CBC for review and presents legitimate business reasons justifying the currency conversion. A requirement is also imposed on all enterprises to register all medium and long-term foreign debt with the CBC.Environmental regulation of Garmin’s products is increasing. Many of Garmin's products are subject to laws relating to the chemical and material composition of our products and their energy efficiency. Garmin is also subject to extended producer responsibility laws and regulations requiring manufacturers to be financially responsible for collection, recovery, and recycling of wastes from certain electronic products. ComplianceHistorically, compliance with current environmental laws doeshas not havehad a material impact on our profitability. We have processes to monitor environmental law changes and to evaluate the potential impact of such laws to our business, but the impact of future enactment of environmental laws cannot yet be fully determined and could be substantial.Environmental Management System (EMS) policies in accordance withenvironmental management systems and achieved certification to the International Organization for Standardization (ISO)ISO 14001 standard for Environmental HealthManagement at facilities in the U.S., U.K., Taiwan, Poland, and Safety Management. Garmin’s EMS policies set forth practices, standards, and procedures to ensure compliance with applicable environmental laws and regulations at Garmin’s Kansas headquarters facility, Garmin’s European headquarters facility, and Garmin’s Taiwan and China manufacturing facilities.China.continues to strivestrives to reduce our carbon footprintenvironmental impact by increasing our environmental sustainability efforts. Our manufacturing locations have implemented increasedGarmin is committed to reducing greenhouse gas emissions through direct carbon emissions reduction and elimination strategies. Garmin utilizes renewable electricity where it is available to us under reasonable terms and conditions, including at our facilities in Olathe, Kansas. Garmin also continuously works to reduce waste and increase recycling processesand composting.keep all obsolete Garmin manufactured material from entering the waste stream. Additionally,build connections between our new facility design has been constructed with energy efficient considerations, including reduced water consumption, LED lighting,employees and reflective roofing to deflect solar radiation.their communities.Employees2017, Garmin2023, the Company had approximately 12,30019,900 full and part-time employees worldwide, of whom approximately 4,7007,300 were in North America, 5,100the Americas region, 9,900 were in Taiwan, 1,500APAC (Asia Pacific and Australian Continent), and 2,700 were in Europe,EMEA (Europe, the Middle East, and 1,000 were in other global locations.Africa). Garmin’s vertical integration model enables us to provide a variety of opportunities across many different professions including engineering, human resources, information technology, marketing, sales, and operations. The Company’s products are created by its engineering and development staff, which numbered approximately 5,500 people worldwide as of December 30, 2023. Garmin’s manufacturing staff, which numbered approximately 8,900 people worldwide as of December 30, 2023, includes manufacturing process engineers who work closely with Garmin’s design engineers to ensure manufacturability and manufacturing cost control for its products. Brazil and Sweden, none of Garmin’s employees are represented by a labor union and none of Garmin's North American or Taiwan employees are covered by a collective bargaining agreement. Garmin considers its employeeWe believe our efforts in managing our workforce have been effective, as evidenced by a strong company culture and positive relations between the Company and our employees.be positive.our employees that enable us to attract and retain leading talent. In addition to salaries, these programs (which vary by country/region) include stock compensation, savings plans, healthcare and insurance benefits, health savings and flexible spending accounts, paid time off, family leave, and an Employee Stock Purchase Plan, which provides employees an opportunity to acquire company ownership for a discounted price. We also invest significant resources in our talent development programs to provide employees with the training and education they need to help achieve their career goals, build relevant skills, and lead their organizations. Business Resource Groups provide opportunities for employees to connect, network, and become involved in community engagement initiatives.19from declining segments or product categories are not entirely offset.This is particularly important to replace sales and profits lost in declining segments or product categories. The market for our products is characterized by rapidly changing technology, evolving industry standards and regulations and changes in customer needs. If we fail to introduce new products, or to modify or improve our existing products, in response to changes in technology, industry standards, regulatory requirements or customer needs, our products could rapidly become less competitive or obsolete. We must continue to make significant investments in research and development in order to continue to develop new products, enhance existing products and achieve market acceptance for such products. However, there can be no assurance that development stage products will be successfully completed or, if developed, will achieve significant customer acceptance.our resultingthe associated loss of competitive position could result in price reductions, fewer customer orders, reduced margins and loss of market share.may behave been able to replicate certain features offered by some of our products and services or respond more rapidly to new or emerging technologies or changes in customer requirements. They may also be able to devote greater resources to the development, promotion and sale of their products or secure better product positioning with retailers. Increased competition could result in price reductions, fewer customer orders, reduced margins and loss of market share. Our failure to compete successfully against current or future competitors could seriously harm our business, financial condition and results of operations.20in recent years have benefited from increased sales of wearable devices. In 2017, the fitness tracker market rapidly contracted, resultingHowever, we have also experienced periods of declines in lower sales and profits in our fitness segment.these segments. If the overall wearable device market declines, or categories of devices within the wearable device market decline significantly, our business, financial condition or operating results could be materially adversely affected.demand for personal navigation devices (PNDs)People’s Republic of China, also referred to as the PRC, asserts sovereignty over all of China, including Taiwan, certain other islands, and all of mainland China. The PRC government does not recognize the legitimacy of the Taiwan government. Although significant economic and cultural relations exist between Taiwan and the PRC, the PRC government has been and continuesindicated that it may use military force to be reduced by replacement technologies becoming available on mobile devices and factory-installed systemsgain control over Taiwan in new autos, as well as by market saturation.GPS/navigation technologies have been incorporated into competing devicescertain circumstances, such as mobile handsets, tablets,the declaration of independence by Taiwan. There is also a risk that the PRC government may unilaterally seek to occupy Taiwan, by force if necessary, without a clear triggering event. In this scenario, Garmin’s manufacturing facilities and new automobiles through factory-installed systems. Many companiessuppliers based in Taiwan could be subject to disruptions that could have a material negative impact to our operations. The United States' relations with Taiwan are now offering navigation software for these mobile devices. The acceptancegoverned by the 1979 Taiwan Relations Act, which signifies when the U.S. switched diplomatic recognition from Taiwan to the PRC, referred to as the "one-China" policy. Deviations from the "one-China" policy or other conflicts or disputes could lead to adverse changes in China-U.S. and China-Taiwan relations and could materially adversely affect our manufacturing operations and suppliers based in Taiwan, which could materially adversely affect our business, financial condition and results of this technology by consumers has reduced salesoperations and the market price and the liquidity of our shares.segment and has reduced profits in some periods. Navigation systems are also becoming more prevalent as standard and/or optional equipment on new automobiles. Increased navigation penetration on mobile handsets and in new automobiles is expected to cause further declines in sales of our portable navigation devices and could further reduce profits.The autoOEM operating segment, which represents approximately 24% of our revenues, is expectedwill continue to negatively impact total Company profits and may negatively impact shareholder value if the operating segment fails to become profitable.to declinedoing so. Operating margins associated with these auto OEM programs will negatively impact consolidated operating margin as auto OEM revenue increases as a percentage of consolidated revenue. If we are not successful in 2018.We experienced substantial growth through 2008winning additional contracts and substantially leveraging our past and future investments, operating losses in the auto OEM segment of our business as PNDs became mass-market consumer electronics in both Europe and North America. This market is declining as competing technologies emerged and market saturation occurred. This has resulted in, and is expected towill continue to result in, lower revenuesnegatively impact total Company profits and may negatively impact shareholder value. We may incur substantial restructuring costs if we are unable to generate profits for this segment.from auto OEM contracts.annualresults of operations and quarterly financial statements will reflectcondition are subject to fluctuations in foreign currency translation.operationmovement of foreign currencies relative to the U.S. Dollar affects the U.S. Dollar value of our subsidiariesforeign currency-denominated sales. The weakening of foreign currencies relative to the U.S. Dollar has had and may in the future have a significant adverse effect on our revenue, gross margin, and profitability, or may cause us to raise international markets resultspricing, which has reduced and may continue to reduce demand for certain of our products in exposurecertain countries. Conversely, a strengthening of certain foreign currencies relative to movementsthe U.S. Dollar would increase product costs and operating expenses denominated in those currencies, which could materially adversely affect profitability. We have not historically used financial instruments to hedge our foreign currency exchange rates. rate risks. The potential of volatile foreign exchange rate fluctuations in the future could have a significant effect on our results of operations. We have not historically hedged our foreign currency exchange rate risks.The currencies that typically create a majority of our exchange rate exposure are the Taiwan Dollar, Euro, and British Pound Sterling. The Taiwan Dollar is the functional currency of Garmin Corporation, the U.S. Dollar is the functional currency of Garmin (Europe) Ltd., and the Euro is the functional currency of most of our other European subsidiaries, although some transactions and balances are denominated in British Pounds. Other legal entities primarily use the local currency as the functional currency. Due to the relative size of entities using a functional currency other than the Taiwan Dollar, Euro, and British Pound Sterling, fluctuations of other currencies are not expected to have a material impact on our financial statements.We translate income and expense activity at the approximate rate of exchange at the transaction date, and all assets and liabilities at the rate of exchange in effect at the balance sheet date. Income and expense activity in a currency other than the U.S. Dollar can be impacted by exchange rate variations over time. The majority of our consolidated foreign currency gain or loss is typically driven by exchange rate impacts on the significant cash, receivables, and payables held in a currency other than the functional currency at a given legal entity. Such gain or loss will create variations in our earnings per share. However, because there is minimal cash impact caused by such exchange rate variations, management willexpects to continue to focus on our operating performance before the impact of foreign currency gains and losses.21positionpositions could be adversely impacted by changes to tax laws, tax treaties, or tax regulations or the interpretation or enforcement thereof by any tax authority in which we file income tax returns.returns, particularly in the U.S., Switzerland, Taiwan, and United Kingdom (U.K.). We cannot predict the outcome of any specific legislative proposals. Legislative proposals are being considered in Switzerland that could make significant changes in the corporate tax regime and increase the taxes applicable to us in Switzerland. Switzerland has agreed with the European Union (EU) to execute tax reform by 2019 in exchange for the EU’s waiver of counter-measures. A failure to accomplish tax reform in the agreed timeframe may result in the EU member states reasserting counter-measure provisions which could result in additional tax for the Company.Moreover, internationalGlobal taxing standards continue to evolvehave evolved as a result of the Organization for Economic Co-Operation and Development (OECD) recommendations aimed at preventing perceived base erosion and profit shifting (BEPS) by multinational corporations. While these recommendationsThe OECD issued a statement regarding a two-pillar solution which includes within “Pillar Two” a global minimum tax. Numerous countries have signed onto the OECD statement including Switzerland, the U.S., and the U.K. In 2023, Switzerland’s Federal Council passed legislation that would implement a minimum tax in Switzerland of 15% in 2024, and the Swiss canton of Schaffhausen has also passed legislation that would increase the cantonal corporate tax rate beginning in 2024, resulting in a combined federal and cantonal statutory tax rate of approximately 15% in Switzerland. Additionally, many other countries have proposed or enacted Pillar Two legislation in jurisdictions in which Garmin operates.changes toyet known.law,legislation described above, the countries where we operate may implement legislationnegotiations and final outcome of the advanced pricing agreement, or take unilateral actions which may result inboth, could have a material adverse effects to ourimpact on the Company’s future income tax provision, effective tax rate, and financial statements.SignificantAdditionally, significant judgment is required in determining our worldwideglobal provision for income taxes. In the ordinary course of our business, there are many transactions and calculations where the ultimate tax determination is uncertain.uncertain, most notably in the area of transfer pricing. We are regularly under audit by tax authorities. Although we believe our tax estimates are reasonable, the final determination of tax audits and any related litigation could be materially different from our historical income tax provisions and accruals. The results of an audit or litigation could have a material effect on our income tax provision, net income, or cash flows in the period or periods for which that determination is made.RestrictionsIf we do not correctly anticipate demand for our products, we may not be able to secure sufficient quantities or cost-effective production of our products or we could have costly excess production or inventories.•If demand increases beyond what we forecast, we may not be able to adequately increase production to meet demand. We would depend on suppliers to provide additional volumes of components and those suppliers might not be able to increase production rapidly enough, due to supply chain issues or other constraints, to meet unexpected demand.•Additionally, rapid increases in production levels to meet unanticipated demand could result in higher costs for manufacturing and supply of components, higher freight costs associated with urgent distribution of the products, and other expenses. These higher costs could lower our profit margins. Further, if production is increased rapidly, manufacturing quality could decline, which may also lower our margins and reduce customer satisfaction.•If forecasted demand does not develop, we could have excess inventories of finished products and components, which would use cash and could lead to write-offs of some or all of the excess inventories. Lower than forecasted demand could also result in excess manufacturing capacity or reduced manufacturing efficiencies at our facilities, which could result in lower margins.particularly on goods imported from Taiwanregulations, including trade restrictions, sanctions, tariffs, or the People’s Republic of China,duties, could significantly harm our results of operationsoperations.A significant portionTrade and other international disputes can result in tariffs, duties, sanctions, and other measures that restrict international trade and can adversely affect our business. For example, tensions between the U.S. and the PRC have led to a series of tariffs being imposed by the U.S. on imports from the PRC. Many other countries have considered or imposed similar measures. Certain of our globalproducts are subject to tariffs and U.S. salesduties imposed by customs authorities of the countries in which they are comprisedimported. Those duties and tariffs are based on the classifications of goods assembled and manufacturedthose products, which are routinely subject to review by the customs authorities. We are unable to predict whether those authorities will change the determination of the classifications of our products. Any such changes could result in additional duties, tariffs or other restrictions on the importation of our facilities in Taiwan and the People’s Republic of China.products. The imposition of additional U.S. or foreign governmental controls or regulations that create new or enhanced restrictions on free trade, with the U.S.,trade sanctions, tariffs, or increases in tariffs on goods imported into the U.S., including goods imported from China and Taiwan,duties could have a substantial adverse effectseffect on our business, operations, results of operations, and financial condition. could result in decreased revenue and problems with our ability to manage inventory levels and collect customer receivables. In addition, financial difficulties experienced by our retailers and OEM customers have resulted, and could result in the future, in significant bad debt write-offs and additions to reserves in our receivables and could have an adverse effect on our results of operations.The United Kingdom (UK) is scheduled to formally leave the European Union on March 29, 2019. Due to the unprecedented naturethe expected withdrawal, significant uncertainty exists surrounding the terms of the expected exit. We have operationsour segments are volatile and could decline in the UK and several EU member states whose currencies, namely British Pound Sterling (GBP) and Euro, economies, taxation, and trade regulation, amongfuture due to competitive price reductions that are not fully offset by material cost reductions. In addition, our overall gross margin may fluctuate from period to period due to a number of other factors, couldincluding product mix, foreign exchange rates, freight and component costs, manufacturing facility utilization, and unit volumes. In particular, the average selling prices of a specific product tend to decrease over that product’s life. To offset such decreases, we intend to rely primarily on component cost reduction, obtaining yield improvements and corresponding cost reductions in the manufacturing of existing products and on introducing new products that incorporate advanced features and therefore can be adversely impacted bysold at higher average selling prices. However, there can be no assurance that we will be able to obtain any such yield improvements or cost reductions or introduce any such new products in the negotiationsfuture. To the extent that such cost reductions and outcomes of the UK’s leaving the EU, which is likely to benew product introductions do not occur in a complicated process. These events could have a material adverse effect ontimely manner or our products do not achieve market acceptance, our business, operations,financial condition and results of operations and financial condition.could be materially adversely affected.22If we do not correctly anticipate demand for our products, we may not be able to secure sufficient quantities or cost-effective production of our products or we could have costly excess production or inventories.We have generally been able to increase or decrease production to meet fluctuations in demand. However, the demand for our products depends on many factors and may be difficult to forecast. We expect that it will become more difficult to forecast demand as we introduce and support a diverse product portfolio, as competition in the market for our products intensifies and as the markets for some of our products mature. Significant unanticipated fluctuations in demand could cause the following problems in our operations:If demand increases beyond what we forecast, we would have to rapidly increase production. We would depend on suppliers to provide additional volumes of components and those suppliers might not be able to increase production rapidly enough to meet unexpected demand.Rapid increases in production levels to meet unanticipated demand could result in higher costs for manufacturing and supply of components and other expenses. These higher costs could lower our profit margins. Further, if production is increased rapidly, manufacturing quality could decline, which may also lower our margins and reduce customer satisfaction.If forecasted demand does not develop, we could have excess inventories of finished products and components, which would use cash and could lead to write-offs of some or all of the excess inventories. Lower than forecasted demand could also result in excess manufacturing capacity or reduced manufacturing efficiencies at our facilities, which could result in lower margins.We depend on third party suppliers and licensors, some of which are sole source, for specific components and map data used in our products. Our production and business would be seriously harmed if these suppliers are not able to meet our demand and alternative sources are not available, or if the costs of components rise.We are dependent on third party suppliers for various components used in our current products. Some of the components that we procure from third party suppliers include semiconductors and electroluminescent panels, liquid crystal displays, memory chips, batteries and microprocessors. The cost, quality and availability of components are essential to the successful production and sale of our products. Some components we use are from sole source suppliers. Certain application-specific integrated circuits incorporating our proprietary designs are manufactured for us by sole source suppliers. Alternative sources may not be currently available for these sole source components.In the past, we have experienced shortages of certain components. In addition, if there are shortages in supply of components, the costs of such components may rise. If suppliers are unable to meet our demand for components on a timely basis and if we are unable to obtain an alternative source, or if the price of the alternative source is prohibitive, our ability to maintain timely and cost-effective production of our products would be seriously harmed.We are also dependent on third party licensors for digital mapping data used in our products. There are only a limited number of suppliers of mapping data for some of our products and geographical regions. The largest digital map supplier for our auto products is HERE (formerly known as NAVTEQ), which is majority-owned by a consortium of Daimler AG, BMW AG, and Audi AG. Although we do not foresee difficulty in continuing to license data from HERE at reasonable pricing due to a long term license agreement with an option to extend through 2028, if we are unable to continue licensing such mapping data from HERE and other primary suppliers and are unable to obtain an alternative source, or if the nature of our relationships with primary suppliers changes detrimentally, our ability to supply mapping data for use in our products would be seriously harmed.23other’sothers’ rights or are infringed upon by others.financial condition.results of operations. From time to time, we receive letterscommunications alleging infringement of patents, trademarks or other intellectual property rights and we have been, and currently are, a defendant in lawsuits alleging patent infringement. Litigation concerning patents or other intellectual property is costly and time consuming.consuming and at the present time cost-effective insurance is not available. We may seek licenses from such parties, but they could refuse to grant us a license or demand commercially unreasonable terms. Such infringement claims could also cause us to incur substantial liabilities and to suspend or permanently cease the use of critical technologies or processes or the production or sale of major products.WeOur products and services may become subjectbe affected by design and manufacturing defects that could materially adversely affect our business, financial condition, and results of operations.product liability costs.warranty and other expenses, which could have a material adverse impact on our business, financial condition and results of operations. aviation products malfunction or contain errors or defects, airplane collisions or crasheswe could occur resulting in property damage, personal injury or death. Malfunctions or errors or defects in our marine navigational products could cause boats to run aground or cause other wreckage, personal injury or death. If our automotive or marine products contain defects or errors in the mapping supplied by third-party map providers or if our users do not heed our warnings about the proper use of these products, collisions or accidents could occur resulting in property damage, personal injury or death. If any of these events occurs, we couldalso be subject to significant liability for personal injury and property damage and, under certain circumstances, could be subject to a judgment for punitive damages. We maintain insurance against accident-related risks involving our products. However, there can be no assurance that such insurance would be sufficient to cover the cost of litigation or damages to others or that such insurance will continue to be available at commercially reasonable rates. In addition, insurance coverage may not cover awards of punitive damages and may not cover the cost of associated legal fees and defense costs, which could result in lower margins. If we are unable to maintain sufficient insurance to cover product liability costs or if our insurance coverage does not cover the award, this could have a materiallymaterial adverse impact on our business, financial condition and results of operations.24if not expected,we otherwise incur a loss in excess of our reserves and could harm our business, financial condition and results of operations and financial condition.operations.and increased warranty claims, and litigationlitigation.competitivecompeting products.We collect, store, process,As a business that operates worldwide, we are subject to complex and use personal informationchanging global laws and regulations, which exposes the Company to potential liabilities, increased costs and other customeradverse effects on our business.which subjects usprivacy and security; consumer protection; product liability; anticorruption; import, export and trade; foreign exchange controls; anti–money laundering; and tax.governmental regulationensure compliance with applicable global laws and other legal obligations related to privacy, information security,regulations, but there can be no assurance that at all times we will be in compliance with all global regulations given their multitude, complexity and data protection, and our actual or perceivedever-changing nature. Our failure to comply with such laws and regulations could materially adversely affect our reputation, business, financial condition and results of operations.could harm our business.regarding data protection. Due to the volumetypes of the personal information and data we manage and the nature of our products and applications, the security features of our platform and information systems are critical. If our security measures or applications are breached, disrupted or fail, unauthorized persons may be able to obtain access to user data. If we or our third-party service providers, business partners, or third-party apps with which our users choose to share their Garmin data were to experience a breach, disruption or failure of systems compromising our users’ data or the media suggested that our security measures or those of our third-party service providers were insufficient, our brand and reputation could be adversely affected, use of our products and services could decrease, and we could be exposed to a risk of loss, litigation, and regulatory proceedings. Depending on the nature of the information compromised, in the event of a data breach, disruption or other unauthorized access to our user data, we may also have obligations to notify users about the incident and we may need to provide some form of remedy for the individuals affected by the incident. A growing number of legislative and regulatory bodies have adopted consumer notification requirements in the event of unauthorized access to or acquisition of certain types of personal data. Such breach notification laws continue to evolve and may be inconsistent from one jurisdiction to another. Complying with these obligations could cause us to incur substantial costs and could increase negative publicity surrounding any incident that compromises user data. Our users may also accidentally disclose or lose control of their passwords, creating the perception that our systems or those of our third-party service providers are not secure against third-party access. Additionally, if third parties we work with, such as vendors, business partners, service providers, or developers, violate applicable laws, agreements, or our policies, such violations may also put our users’ information at risk and could in turn have an adverse effect on our business. While we maintain insurance coverage that, subject to policy terms and conditions and a significant self-insured retention, is designed to address certain aspects of cyber risks, such insurance coverage may be insufficient to cover all losses or all types of claims that may arise in the continually evolving area of cyber risk.Regulatory authorities around the world, including in the United States, have enacted or are considering enacting a number of legislative and regulatory proposals concerning data protection,protection. These laws continue to develop and a new data protection regulation in the E.U. with significant fines and penalties for noncompliance will go into effect in May 2018. In addition, the interpretation and application of consumer and data protection laws in the U.S., Europe and elsewhere are sometimes uncertain and in flux. It is possible that these laws may be interpreted and applied in a manner that is inconsistent with our interpretation and data practices. If so, in additionfrom jurisdiction to the possibility of fines, this could result in an order requiring that we change our data practices, which could have an adverse effect on our business and results of operations.jurisdiction. Complying with these various laws could cause us to incur substantial costs or require us to change our business practices in a manner adverse to our business.25We rely on information technology systems for our business operations. Failures or disruptions, including security breaches or cyber attacks, to our information technology systems may harm our reputation and adversely affect our business and result of operations.Our information technology systems allow for our daily business operations to operate efficiently and effectively. These systems assist in our business processes, including, but not limited to, communications, financial management, supply chain management, order processing, shipping and billing and providing services and support to our customers. Additionally, we electronically maintain sensitive data, including intellectual property, our proprietary business information and that of our customers and suppliers, and some personally identifiable information of our customers and employees, in our facilities and on our networks. The secure processing, maintenance and transmission of this information is important to our operations. A disruption to any of these processes can adversely affect our business and results of operations. Furthermore, a breach of our security systems and procedures or those of our vendors Noncompliance could result in significant data losses or theft ofpenalties, governmental investigations and regulatory proceedings, litigation, harm to our intellectual property as well as our customers' or our employees' intellectual property, proprietary business information or personally identifiable information. A cybersecurity breach could negatively affect our competitive positionbrand, and operating results as a result of theft of our intellectual property and could negatively affect our reputation as a trusted product and service provider by adversely affectingdecrease in the market's perception of the security or reliabilityuse of our products and services. Many of these laws provide for significant penalties. Under the General Data Protection Regulation in the European Union, for example, potential penalties can be as high as 4% of a company’s total global revenue.services. climate change and associated requirements and pressures could affect our financial results.WeNatural disasters and extreme weather events, such as tsunamis, typhoons, floods, wildfires, or earthquakes, could occur in a region where we have technologya manufacturing or warehousing facility which could cause disruptions in our business operations, loss of inventory, or affect the sale of our products. Global climate change could also result in certain types of these natural disasters occurring more frequently or with more intense effects. For descriptions and processes in place to detectlocations of our principal properties, see Item 2, “Properties”. These events could also have an impact on our suppliers and respond to data security incidents. However, because the techniques used to obtain unauthorized access, disableaffect our supply chain or degrade service, or sabotage systems change frequently and may be difficult to detect for long periods of time, we may be unable to anticipate these techniques or implement adequate preventive measures. In addition, hardware, software or applications we develop or procure from third parties may contain defects in design or manufacture or other problems that could unexpectedly compromise information security. Unauthorized parties may also attempt to gain access to our systems or facilities through fraud, trickery or other forms of deceiving our customers and employees. Accordingly, we mayaffect the demand for our products. If our backup and recovery plans are not sufficient to minimize business disruption or if our insurance is not sufficient to recover the costs associated with these types of events, our financial results could be unableadversely affected.anticipate these techniques orour business due to implement adequate security barriersrelated regulatory and legislative measures, requirements of our OEM customers or other preventative measures,strategic partners, and evolving societal pressures, including pressures to reduce the carbon footprint of the aviation and marine industries, which could negatively impact the market for our products. The U.S. Environmental Protection Agency regulates greenhouse gas emissions under the authority granted to it under the Clean Air Act. U.S. Congress, in addition to other regulatory authorities and legislative bodies around the world, could pass further legislation to mandate greenhouse gas emission reduction, implement cap-and-trade programs, or if such measures are implemented,promote renewable energy and even with appropriate training conducted in support of such measures, human errors may still occur. It is virtually impossible for us to entirely mitigate this risk. A party, whether internal or external, who is able to circumvent our securityenergy efficiency. Such measures could misappropriate information.influence mobility and transportation trends, which could decrease the demand for certain of our products.ActualIf climate change has impacts on natural disasters, the regulatory environment, or anticipated attackssocietal pressures as discussed above, it could result in a change in demand for certain products in markets that we serve, including auto, aviation, and risks may cause us to incur increasing costs, including costs to deploy additional personnel and protection technologies, to conduct additional employee training, and to engage third party security experts and consultants. Our technology errors and omissions insurance may not protect against all of the costs, liabilities, and other adverse effects arising from a security breach or system failure.marine. If we fail to reasonably maintainadjust our product and service offerings to respond to new opportunities driven by changes in regulation and/or consumer preferences, it could have an adverse effect on our financial results.securitypotential impact of confidential information, we may suffer significant reputationalsuch laws and regulations on our future consolidated financial losses and ourcondition, results of operations or cash flows, financial condition, and liquidity may be adversely affected. In addition, a system breach could result in other negative consequences, including disruptionflows. internal operations, and may subject us to private litigation, government investigations, enforcement actions, and cause us to incur potentially significant liability, damages, or remediation costs.Gross margins for our products may fluctuateare subject to governmental regulation or erode.Gross margins in some of our segments are volatile and could decline in the future due to competitive price reductions that are not fully offset by material cost reductions. In addition, our overall gross margin may fluctuate from period to period due to a number of factors, including product mix, competition and unit volumes. In particular, the average selling prices of a specific product tend to decrease over that product’s life. To offset such decreases, we intend to rely primarily on component cost reduction, obtaining yield improvements and corresponding cost reductions in the manufacturing of existing products and on introducing new products that incorporate advanced features and therefore can be sold at higher average selling prices. However, there can be no assurance that we will be able to obtain any such yield improvements or cost reductions or introduce any such new products in the future. To the extent that such cost reductions and new product introductions do not occur in a timely manner or our products do not achieve market acceptance, our business, financial condition and results of operations could be materially adversely affected.We may experience unique economic and political risks associated with companies that operate in Taiwan.Our principal manufacturing facilities, where we manufacture most of our consumer products, are located in Taiwan. Relations between Taiwan and the People’s Republic of China, also referred to as the PRC, and other factors affecting the political or economic conditions of Taiwan in the future could materially affect our business, financial condition and results of operations and the market price and the liquidity of our shares.26The PRC asserts sovereignty over all of China, including Taiwan, certain other islands and all of mainland China. The PRC government does not recognize the legitimacy of the Taiwan government. Although significant economic and cultural relations have been established during recent years between Taiwan and the PRC, the PRC government has indicated that it may use military force to gain control over Taiwan in certain circumstances, such as the declaration of independence by Taiwan. The United States' relations with Taiwan are governed by the 1979 Taiwan Relations Act, which signifies when the U.S. switched diplomatic recognition from Taiwan to the PRC, referred to as the "one-China" policy. Deviations from the "one-China" policy could lead to adverse changes in China-U.S. and China-Taiwan relations and could adversely affect our operations in Taiwan in the future.Changes in our United States federal income tax classification, or that of our subsidiaries, could result in adverse tax consequences to our 10% or greater U.S. shareholders.The Tax Cuts and Jobs Act (the “2017 Act”) signed on December 22, 2017 may have changed the consequences to U.S. shareholders that own, or are considered to own, as a result of the attribution rules, ten percent or more of the voting power or value of the stock of a non-U.S. corporation (a 10% U.S. shareholder) under the U.S. Federal income tax law applicable to owners of U.S. controlled foreign corporations (“CFCs”). Prior to the 2017 Act, the Company did not believe we, or any of our non-U.S. subsidiaries, were considered a CFC, which is a determination made daily based on whether the 10% U.S. shareholders together own, or are considered to own as a result of the attribution rules, more than fifty percent of the voting power or value of a non-U.S. corporation. The 2017 Act repealed Internal Revenue Code Section 958(b)(4), which, unless clarified in future regulations or other guidance, may result in classification of certain of the Company’s foreign subsidiaries as CFCs with respect to any single 10% U.S. shareholder. This may be the result without regard to whether 10% U.S. shareholders together own, directly or indirectly, more than fifty percent of the voting power or value of the Company as was the case under prior rules. The repeal is effective as of the last taxable year of CFCs beginning before January 1, 2018 and for the taxable year of 10% U.S. shareholders in which the CFCs' taxable year ends. Additional tax consequences to 10% U.S. shareholders of a CFC may result from other provisions of the 2017 Act. For example, the 2017 Act amended Section 965 to require 10% U.S. shareholders to include in income their pro-rata share of certain earnings and profits (E&P) of CFCs. This Section 965 inclusion is accompanied by a partial dividends-received deduction. The 2017 Act also added Section 951A which requires a 10% U.S. shareholder of a CFC to include in income its pro-rata share of the global intangible low-taxed income (GILTI) of the CFC. Finally, the 2017 Act eliminated the requirement in Section 951(a) necessitating that a foreign corporation be considered a CFC for an uninterrupted period of at least 30 days in order for a 10% U.S. shareholder to have a current income inclusion.From time to time, the Company may elect to employ antidilutive measures such as a stock buyback program. These measures could inadvertently create additional 10% U.S. shareholders and thus trigger adverse tax consequences for those shareholders as described above. We urge shareholders to consult their individual tax advisers for advice regarding the 2017 Act revisions to the U.S. Federal income tax law applicable to owners of CFCs given the current uncertainty regarding their scope of applicability.We have certain products, especially in our aviation segment, that are subject to governmental and similar certifications before they can be sold. For example, FAAFederal Aviation Administration (FAA) certification is required for all of our aviation products that are intended for installation in type-certificated aircraft. To the extent required, certification is an expensive and time-consuming process that requires significant focus and resources. An inability to obtain, or excessive delay in obtaining, such certifications could have an adverse effect on our ability to introduce new products and, for certain aviation OEM products, our customers’ ability to sell airplanes. Delays in our obtaining certification for our aviation products have resulted and may in the future result in our being required to pay compensation to our customers. Additionally, failure of the United States Congress to appropriate funds for FAA operations that results in a shutdown of FAA operations or furloughing of FAA employees, due to partial or complete government shutdowns or otherwise, could result in delays in the required FAA certification of our avionics products and in the production, sale and registration of aircraft that use our avionics products. Therefore, such inabilities or delays could adversely affecthave a material adverse effect on our operating results.business, financial condition and results of operations. In addition, we cannot assure that our certified products will not be decertified. Any such decertification could have an adverse effect on our operating results.business, financial condition and results of operations.27Our business may suffer if weIn addition, in accordance with FCC rules and regulations, wireless transceiver products are not ablerequired to hire and retain sufficient qualified personnel or if we lose our key personnel.Our future success depends partly onbe certified by the continued contribution of our key executive, engineering, sales, marketing, manufacturing and administrative personnel. We currently do not have employment agreements with any of our key executive officers. Swiss law prohibits us from paying severance payments to our senior executive officers, which may impair our ability to recruit for these positions. We do not have key person life insurance on any of our key executive officers and do not currently intend to obtain such insurance. The loss of the services of any of our senior level management, or other key employees, could harm our business. Recruiting and retaining the skilled personnel we require to maintain and grow our market position may be difficult. For example, in some recent years there has been a nationwide shortage of qualified engineersFCC in the United States whoand comparable authorities in foreign countries where they are necessarysold. Garmin’s products sold in Europe are required to comply with relevant directives of the European Commission. A delay in receiving required certifications for us to design and develop new products, or enhancements to Garmin’s products, or losing certification for Garmin’s existing products could adversely affect our business, financial condition and therefore, it has sometimes been challengingresults of operations.recruitour 10% or greater U.S. shareholders.personnel. If we failas a share buyback program. These measures could inadvertently create additional 10% U.S. shareholders and thus trigger adverse tax consequences for those shareholders as described above. We urge shareholders to hire and retain qualified employees, we may not be ableconsult their individual tax advisers for advice regarding the 2017 Act revisions to maintain and expand our business.the U.S. federal income tax law applicable to owners of CFCs given the current uncertainty regarding their scope of applicability.stockshares could decline. As we have expanded our operations, our operating expenses, particularly our research and development and information technology costs, have increased as a percentage of our sales in some periods. If revenues decrease and we continue to increase research and development costs,operating expenses, our operating results would be negatively affected.weakerlower in the first quarter of each fiscal year as many of our devices are highly consumer-oriented, and consumer buying is traditionally lower in this quarter. However, this can fluctuate based on the timing of new product launches. Sales of certain of our fitness, outdoor, marine, and automotiveauto products tend to be higher in our second fiscal quarter due to increased consumer spending for such products in the spring season and travel season. Sales of many of our consumer products also have been higher in our fourth fiscal quarter due to increased consumer spending patterns on electronic devices during the holiday season. In addition, we attempt to time our new product releases to coincide with relatively higher consumer spending in the second and fourth fiscal quarters, which contributes to these seasonal variations.In particular, our dealers and distributors maintain significant levels of our products in their inventories. If dealers and distributors attempt to reduce their levels of inventory or if they do not maintain sufficient levels to meet customer demand, our sales could be negatively impacted.28intend tocontinually evaluate acquisition opportunities and opportunities to make investments in complementary businesses, technologies, services or products, or to enter into strategic partnerships with parties who can provide access to those assets, additional product or services offerings, additional distribution or marketing synergies or additional industry expertise. We may not be able to identify suitable acquisition, investment or strategic partnership candidates, or if we do identify suitable candidates in the future, we may not be able to complete those transactions on commercially favorable terms, or at all. compliance under the Sarbanes-Oxley Act of 2002 compliance, cyber security measures, the GDPR and other corporate governance and regulatory matters, operations, personnel or products related to acquisitions we may make in the future. If we fail to successfully integrate such transactions, our business could be materially harmed.ThereOur business is uncertainty assubject to disruptions and uncertainties caused by geopolitical instability, war or terrorism.shareholders’ abilitybusiness, financial condition and results of operations. Specifically, the threat of terrorism and war and heightened security and military response to enforce certain foreign civil liabilitiesthis threat, or any future acts of terrorism, may cause a redeployment of the satellites used in Switzerland and Taiwan.We are a Swiss company and a substantial portionGPS or interruptions of the system. To the extent that such interruptions have an effect on sales of our assets are located outside the United States, particularly in Taiwan. As a result, it may be difficult to effect service of process within the United States upon us. In addition, there is uncertainty as to whether the courts of Switzerland or Taiwan would recognize or enforce judgments of United States courts obtained against us predicated upon the civil liability provisions of the securities laws of the United States or any state thereof, or be competent to hear original actions brought in Switzerland or Taiwan against us predicated upon the securities laws of the United States or any state thereof.A shut down of Federal Aviation Administration operations would harm our business.Any failure of the United States Congress to appropriate funds for FAA operations that results in any shut down of FAA operations or furloughing of FAA employees could result in delays in the required FAA certification of our avionics products, and in the production, sale and registration of aircraft that use our avionics products. Such delaysthis could have a material adverse effect on our business, financial condition and financial results.results of operations.TheGPS satellites were originally designed to have lives of 7.5 yearsa limited lifespan and are subject to damage by the hostile space environment in which they operate. However, of the current deployment ofThe U.S. Space Force and Missile Systems Center continue to launch new satellites in place, some have been operating for more than 20 years.to replace retired and aged satellites.ToDespite ongoing efforts to repair, damaged or malfunctioningmaintain and replace non-operational satellites, is currently not economically feasible. Ifif a significant number of satellites were to become inoperable, there could be a substantial delay before they are replaced with new satellites. A reduction in the number of operating satellites may impair the current utility of the GPS system and the growth of current and additional market opportunities. Furthermore, as GPS satellites and ground control segmentssegment facilities are being modernized. GPS modernizationmodernized, software updates can cause problems. We depend on public access to open technical specifications in advance of GPS updates.29werewas no longer supported by the U.S. Government, or if user fees or other restrictions were imposed, it could have a material adverse effect on our business, financial condition and results of operations, and financial condition.operations., and European Geostationary Navigation Overlay Service (EGNOS). Some products also use regional satellite systems like the Indian Regional Navigation Satellite System (IRNSS), operating as NavIC (Navigation with Indian Constellation) and Quasi-Zenith Satellite System (QZSS). Any curtailment of SBAS operating capability could result in decreased user capability for many of our aviation products, thereby impacting our markets.Russian GLONASS System. Other countries, including ChinaEuropean Union Galileo system, and India, are in the process of creating their own GNSS systems, and we either have developed or will develop products which use GNSS signals from these systems. The European community is developing an independent radio navigation satellite system, known as Galileo.Chinese BDS. National or European authorities may provide preferential access to signals to companies associated with their markets, including our competitors, which could harm our competitive position. Use of non-USnon-U.S. GNSS signals may also be subject to FCC waiver requirements and to restrictions based upon international trade or geopolitical considerations. If we are unable to develop timely and competitive commercial products using these systems, or obtain timely and equal access to service signals, it could result in lost revenue.AnyWe are dependent on the availability and unimpaired use of allocated bands within the foregoing factors could affect the willingness of buyers ofradio frequency spectrum; our products to select Global Positioning System-based products instead of products based on competing technologies.Our business ismay be subject to disruptions and uncertainties caused by geopolitical instability, war or terrorism.Acts of war or acts of terrorism, especially any directed at the GPS signals, could have a material adverse impact on our business, operating results, and financial condition. The threat of terrorism and war and heightened security and military response to this threat, or any future acts of terrorism, may cause a redeployment of the satellites used in GPS or interruptions of the system. To the extent that such interruptions have an effect on sales of our products, this could have a material adverse effect on our business, results of operations, and financial condition.A shut down of airspace or imposition of restrictions on general aviation would harm our business. The shutdown of airspace could cause reduced sales of our general aviation products and delays in the shipment of our products manufactured in our Taiwan manufacturing facilities to our global distribution facilities, thereby adversely affecting our ability to supply new and existing products to our dealers and distributors.Any reallocation or repurposing of radio frequency spectrum could cause harmful interference with the reception of Global Positioning System signals. This interference could harm our business.from new or modified spectrum uses.Global Positioning SystemGPS satellites. The Global Positioning SystemGPS operates in radio frequency bands that are globally allocated for radio navigation satellite services. International allocations of radio frequency are made by the International Telecommunications Union (ITU), a specialized technical agency of the United Nations. These allocations are further governed by radio regulations that have treaty status and which may be subject to modification every two to three years by the World Radio Communication Conference. Each country also has regulatory authority on how each band is used. In the United States, the Federal Communications Commission (FCC)FCC and the National Telecommunications and Information Administration (NTIA) share responsibility for radio frequency allocations and spectrum usage regulations.AnyOur radar altimeter products for aircraft operate in a radio frequency band just above the C-band that has been allocated for 5G mobile wireless systems. There is a risk that 5G telecommunication systems operating in the vicinity of airports could cause harmful interference to radar altimeters resulting in inaccurate altimeter readings or complete altimeter failure.30Natural disasters, catastrophic events, or climate change could affect our financial results.Natural disasters and extreme weather events, such as tsunamis or earthquakes, could occur in a region where we have a manufacturing or warehousing facility which would cause disruptions in our business operations or loss of inventory.If our backup and recovery plans are not sufficient to minimize business disruption and/or if our insurance is not sufficient to recover the costs associated with these types of events, our financial results could be adversely affected.Climate change can also pose a risk to our business due to evolving regulatory and legislative measures surrounding climate change. The Environmental Protection Agency has begun to regulate greenhouse gas emissions under the authority granted to it under the Clean Air Act. At the federal legislative level, Congressional passage of legislation adopting some form of federal mandatory greenhouse gas emission reduction, such as a nationwide cap-and-trade program, does not appear likely at this time, although it could be adopted at a future date. It is also possible that the U.S. Congress may pass alternative climate change bills that do not mandate a nationwide cap-and-trade program and instead focus on promoting renewable energy and energy efficiency, which could increase the cost of doing business.Because it is uncertain what laws and regulations will be enacted, we cannot predict the potential impact of such laws and regulations on our future consolidated financial condition, results of operations or cash flows.stockshare price could adversely affect investment in our common shares.2017,2023, the closing price of our shares ranged from a low of $47.35$93.57 to a high of $62.92.$128.91. A variety of factors could cause the price of our shares to fluctuate, perhaps substantially, including:including but not limited to:·new products or product enhancements by us or our competitors;·general conditions in the worldwide economy, including fluctuations in interest rates and global currency exchange rates;·announcements of technological innovations;·product obsolescence and our ability to manage product transitions;·developments in our relationships with our customers and suppliers;·the availability, pricing and timeliness of delivery of components, such as flash memory and liquid crystal displays, used in our products;·quarterly fluctuations in our actual or anticipated operating results;·changes in applicable tax laws and tax rates;·developments in patents or other intellectual property rights and litigation;·announcements and rumors of developments related to our business, our competitors, our suppliers or the markets in which we compete;·research reports or opinions issued by securities analysts or brokerage houses related to Garmin, our competitors, our suppliers or our customers;·any significant acts of terrorism against the United States, Taiwan or significant markets where we sell our products; and·other factors as discussed in the previously listed risks.
•31new products or product enhancements by us or our competitors;•general conditions in the worldwide economy, including fluctuations in inflation, interest rates and global currency exchange rates;•announcements of technological innovations;•product obsolescence and our ability to manage product transitions;•developments in our relationships with our customers and suppliers;•the availability, pricing and timeliness of delivery of components, such as flash memory and liquid crystal displays, used in our products;•quarterly fluctuations in our actual or anticipated operating results;•changes in applicable tax laws and tax rates;•developments in patents or other intellectual property rights and litigation;•announcements and rumors of developments related to our business, our competitors, our suppliers or the markets in which we compete;•research reports or opinions issued by securities analysts or brokerage houses related to Garmin, our competitors, our suppliers or our customers;•any significant acts of terrorism against the United States, Taiwan or significant markets where we sell our products; and•other factors as discussed in the previously listed risks.17, 2018,23, 2024, members of our Board of Directors and our executive officers, and Gary Burrell (our co-founder and former executive officer and member of our Board of Directors), together with members of their familiesrespective immediate family members and entities that may be deemed affiliates of or related to such persons or entities, beneficially owned approximately 39.99%20% of our outstanding shares. Accordingly, these shareholders may be able to determine the outcome of corporate actions requiring shareholder approval, such as mergers and acquisitions and shareholder proposals. This level of ownership may have a significant effect in delaying, deferring, or preventing a change in control of Garmin and may adversely affect the voting and other rights of other holders of our common shares.Swiss law allows our shareholders acting atarticles of association authorize the Board of Directors for a shareholders’ meetingmaximum period of one year to authorizeincrease the stated share capital that can be issued by the boardto a maximum of directors without approval120% and/or reduce it to a minimum of a shareholders’ meeting, but this authorization is limited to 50%90% of the existing registeredstated share capital andof the Company. This authorization must be renewed at a shareholders’ meeting at least every two yearsyear for it to continue to be available. Additionally, subject to specified exceptions, including the exceptions described in our articles of association, Swiss law grants preemptive rights to existing shareholders to subscribe for new issuances of shares and other securities. Swiss law also does not provide as much flexibility in the various terms that can attach to different classes of shares as the laws of some other jurisdictions. Swiss law also reserves for approval by shareholders certain corporate actions over which a board of directors would have authority in some other jurisdictions. For example, Swiss law provides that dividends and other distributions must be approved by shareholders at the general meeting of shareholders. These Swiss law requirements relating to our capital management may limit our flexibility, and situations may arise where greater flexibility would have provided substantial benefits to our shareholders.or repurchase shares without subjecting our shareholders Swissto Switzerland withholding tax.IfAs of December 30, 2023, we are unable to make distributions, if any, through a reductionhad CHF 4,100 million of par value or to pay dividends, if any, out of qualifyingunappropriated capital contribution reserves then any dividends paid by us will generally be subjectavailable from which the Company may make dividend payments. At the time this reserve balance has been returned to shareholders, a Swiss federal withholding tax at a rate of 35%. Over will generally be applicable to dividends paid. long term, the amount of par value and qualifying capital contribution reserves available for us to use for par value reductions or dividends will be limited. Theare fully utilized, the Swiss federal withholding tax must be withheld from the gross dividend distribution and paid to the Swiss Federalfederal Tax Administration. A U.S.holder that qualifies for benefits under a double tax treaty may be able to recover partial withholding tax. For example, a U.S holder that qualifies for benefits under the Convention between the United States of America and the Swiss Confederation for the Avoidance of Double Taxation with Respect to Taxes on Income may apply for a refund of the tax withheld in excess of the 15% treaty rate (or in excess of the 5% reduced treaty rate for qualifying corporate shareholders with at least 10% participation in our voting stock,shares, or for a full refund in case of qualified pension funds). However, there can be no assurance that our shareholders will approve a reduction in par value or a dividend out of qualifying capital contribution reserves, that we will be able to meet the other legal requirements for a reduction in par value, or that Swiss withholding rules will not be changed in the future or that a change in Swiss law will not adversely affect us or our shareholders, in particular as a result of distributions out of qualifying capital contribution reserves becoming subject to additional corporate law or other restrictions. If we are unable to make a distribution through a reduction in par value or to pay a dividend out of qualifying capital contribution reserves, we maywill not be able to make distributions without subjecting our shareholders to Swiss withholding taxestaxes.32Under currentThere is uncertainty as to our shareholders’ ability to enforce certain foreign civil liabilities in Switzerland and Taiwan.tax law, repurchases of shares for the purposes of capital reduction are treated ascompany and a partial liquidation subject to 35% Swiss withholding tax on the difference between the par value and the repurchase price. However, thesubstantial portion of our assets are located outside the repurchase price thatUnited States, particularly in Taiwan. As a result, it may be difficult to effect service of process within the United States upon us. In addition, there is attributeduncertainty as to qualifying capital contribution reserveswhether the courts of Switzerland or Taiwan would recognize or enforce judgments of United States courts obtained against us predicated upon the civil liability provisions of the shares repurchased will not be subject to the Swiss withholding tax. Therefore, repurchase of our own shares further limits the amount of qualifying capital reserves available for distributions to shareholders free of Swiss withholding taxes. No partial liquidation treatment applies and no withholding tax is triggered if the shares are not repurchased for cancellation but held by us as treasury shares to the extent sufficient qualifying capital reserves are available. However, should we not resell such treasury shares within six years and there is not sufficient qualifying capital contribution reserves, the withholding tax becomes due at the endsecurities laws of the six-year period. We may follow a share repurchase process for future share repurchases, ifUnited States or any similarstate thereof, or be competent to a "second trading line" onhear original actions brought in Switzerland or Taiwan against us predicated upon the SIX Swiss Exchange in which Swiss institutional investors buy shares on the open market and sell these shares to us and are generally able to receive a refundsecurities laws of the Swiss withholding tax. However, if we are unable to use this process successfully, we may not be able to repurchase shares for the purposes of capital reduction without subjecting our shareholders to Swiss withholding taxes if and to the extent that the repurchase of shares is made out of retained earningsUnited States or other taxable reserves. No withholding tax would be applicable if and to the extent that qualifying capital contribution reserves are attributable to the share repurchase.any state thereof.We have certain limitations on our ability to repurchase and hold our own shares.Under Swiss law we have certain limitations on our ability to repurchase and hold our own shares. We and our subsidiaries may only repurchase and hold our own shares to the extent that sufficient freely distributable reserves (including contributed surplus as determined for Swiss tax and statutory purposes) are available. The aggregate par value of our registered shares held by us and our subsidiaries may not exceed 10% of our registered share capital. We may repurchase our registered shares beyond the statutory limit of 10%, however, if our share-holders have adopted a resolution at a general meeting of shareholders authorizing the board of directors to repurchase registered shares in an amount in excess of 10% and the repurchased shares are dedicated for cancellation. Our ability to repurchase and hold our own shares has been a component of our capital management and shareholder return practices, and any restriction on our ability to repurchase our shares could make our stock less attractive to investors.2. Properties1C. Cybersecurityfollowingmanagement of our information system platforms and the related cybersecurity is tightly integrated with Garmin's product development and technology management teams. Cybersecurity risks are identified, reported, and managed by the principal properties ownedCompany’s in-house cybersecurity experts as well as third-party providers of penetration test reporting, cyber-threat intelligence, and incident forensics services.leasedtechnology, and reporting by associates, vendors, customers, and security researchers. These processes occur during the procurement, development, integration, modification, operation, and maintenance of the Company’s information systems and the integration with or introduction, purchase, acquisition, or renewal of any third-party information systems and services. Notable changes to the Company’s operating environment are scrutinized to ensure the confidentiality, integrity, and availability of the Company's information systems.subsidiaries:General Counsel regularly attend Board meetings, which helps facilitate discussions regarding risk between the Board and Garmin’s senior management. In addition, on an annual basis Garmin’s head of cybersecurity provides a comprehensive update of the Company’s cybersecurity practices, risks and risk mitigation strategies to the Board of Directors. Each member of the Board of Directors actively participates in those discussions and has an opportunity to ask questions or provide direction. Garmin’s Chief Executive Officer and head of cybersecurity also have discussions with members of the Board of Directors on an ad hoc basis as appropriate if and when a specific cybersecurity risk arises.Garmin USA, Inc. occupyoccupies facilities of approximately 1,215,0001,990,000 square feet on approximately 107 acres inat 1200 East 151st Street, Olathe, Kansas, U.S. where the majority of product design and development work is conducted, the majority of aviation panel-mount products are manufactured, and products are warehoused distributed, and supported for North, Central and South America. Garmin International, Inc. continued an expansion project in 2017 on the land in Olathe, Kansas, which will include an approximately 720,000The 1,990,000 square feet includes a 775,000 square foot manufacturing and distribution center. The expansion project began in 2016. The second phase of the expansion will include renovation of the existing warehouse and manufacturing center into a research and development facility and supporting office space. In connection with the bond financings for the facility in Olathe and the expansions of that facility, the City of Olathe holds the legal title to the Olathe facility,facilities, which isare leased to Garmin’s subsidiaries by the City. Upon the payment in full of the outstanding bonds, the City of Olathe is obligated to transfer title to Garmin’s subsidiaries for the aggregate sum of $200.a nominal sum. Garmin International, Inc. has purchased all the outstanding bonds and expects to continue to hold the bonds until maturity in order to benefit from property tax abatement.33Garmin Corporation owns and occupies 247,000 and 95,000 square foot facilities in Xizhi Dist., New Taipei City, Taiwan, a 224,000 square foot facility in Jhongli, Tao-Yang County, Taiwan, and a 576,000 square foot facility in LinKou, Tao-Yang County, Taiwan. In these facilities, Garmin Corporation manufactures most of Garmin’s consumer and portable aviation products and warehouses, markets and supports products for the Pacific Rim countries. Garmin China Yangzhou Co., Ltd. leases an approximately 86,000 square foot manufacturing facility in Yangzhou, Jiangsu, People’s Republic of China.Garmin AT, Inc. leases approximately 18 acres of land in Salem, Oregon under a ground lease. This ground lease expires in 2030, but Garmin AT, Inc. has the option to extend the ground lease until 2050. Garmin AT, Inc. owns and occupies a 115,000 square foot facility for office, development and manufacturing use and a 33,000 square foot aircraft hangar, flight test and certification facility on this land. Garmin AT, Inc. also owns and occupies an additional 66,000 square foot facility on the same property for Garmin’s West Coast customer support call center and for research and development activities.Garmin International, Inc. owns and occupies an approximate 60,000 square foot facility in Chandler, Arizona, used as office space. Garmin International, Inc. leases 148,000 square feet of land at New Century Airport inat 1 New Century Pkwy, Gardner, Kansas, U.S. under a ground lease and occupies two aircraft hangars on this land, one of which is owned (47,000 square feet) and the other leased (53,000 square feet). Both properties serve as flight test and certification facilities that are used in development and certification of aviation products.Würzburg GmbHInternational, Inc. leases facilities of approximately 341,000 square feet at 10369 N Commerce Pkwy, Miramar, Florida, U.S. These facilities are used for design and development, manufacturing, and warehousing of JL Audio branded audio products.43,00018 acres of land at 2345 Turner Road SE, Salem, Oregon, U.S. under a ground lease. The current term of this ground lease ends in 2030, but Garmin AT, Inc. has the option to extend the ground lease until 2050. Garmin AT, Inc. owns and occupies a 115,000 square feet in Würzburg, Germanyfoot facility for office and manufacturing use and a 33,000 square foot aircraft hangar that serves as a flight test and certification facility on this land. Garmin AT, Inc. also owns and occupies an additional 66,000 square foot facility on the same property for customer support and research and development activities.Cluj S.R.L.Corporation owns and occupies a 247,000 square foot facility at No. 68, Zhangshu 2nd Road, Xizhi Dist., New Taipei City, Taiwan, a 185,000 square foot facility at No. 97, Sec. 1, Xintai 5th Rd., Xizhi Dist., New Taipei City, Taiwan, a 224,000 square foot facility at No. 24 Beiyuan Road, Jhongli, Tao-Yang County, Taiwan, a 576,000 square foot facility at No. 270 Huaya 2nd Road, LinKou, Tao-Yang County, Taiwan, and a 615,000 square foot facility at No. 3, Titanggang Rd., Xinshi Dist., Tainan City, Taiwan. Garmin China YangZhou Co., Ltd. leases 28,000a 204,000 square feet in Cluj, Romaniafoot manufacturing facility at No. 122, Jinshan Road, Bali Town, Yangzhou, Jiangsu, People’s Republic of China. These facilities are used for the manufacturing and warehousing of most of Garmin’s fitness, outdoor, and marine products, as well as portable aviation products and some Auto OEM products. These facilities are also used for research and development activities.activities and marketing and support of products for Asia Pacific countries.Various Garmin subsidiaries lease an additional: (i) 49,000 square feet of office space in Olathe, Kansas for a call center operation; (ii) approximately 38,000 square feet of office space in Yarmouth, Maine, for office and development use; and (iii) approximately 33,000 square feet of office space in Tucson, Arizona, used as offices and for research and development.Totton, Southampton, England,the region.as officesfor office space, warehousing, and a distribution facility.retail. The Company believes its existing facilities and properties are in good operating condition and are suitable for the conduct of its business.In the Matter of Certain Marine Sonar Imaging Devices, Including Downscan and Sidescan Devices, Products Containing the Same, and Components ThereofOn June 9, 2014 Navico Inc. and Navico Holding AS (collectively “Navico”) filed a complaint with the United States International Trade Commission (“ITC”) alleging the Company infringed upon three specific Navico patents relating to downscan sonar. On December 1, 2015, the ITC issued a Final Determination concluding that there was infringement by Garmin. On August 30, 2016, Navico filed a request that the ITC initiate an enforcement proceeding for alleged violations by Garmin of the previous cease and desist orders issued by the ITC. On May 26, 2017, the Administrative Law Judge issued his initial enforcement determination concluding that Garmin’s sale of certain DownVü sonar products violated the ITC’s December 2015 orders and recommended a civil penalty of $37 million. On June 13, 2017, the U.S. Court of Appeals for the Federal Circuit (“Federal Circuit”) reversed the ITC’s Final Determination. Specifically, the Federal Circuit ruled that the two of the three patents in the suit are invalid and that Garmin does not infringe upon the third patent. The ITC stayed the issuance of a final determination in this enforcement proceeding pending the issuance by the Federal Circuit of its mandate. The Federal Circuit issued its mandate on October 31, 2017. Pursuant to the settlement agreement described below on February 14, 2018, Garmin and Navico filed a joint motion to terminate the enforcement proceeding.34Navico Inc. And Navico Holding AS v. Garmin International, Inc. and Garmin USA, Inc.On June 4, 2014 Navico filed suit in the United States District Court for the Northern District of Oklahoma alleging the Company infringed upon the same three specific Navico patents relating to downscan sonar that are the subject of their complaint filed with ITC discussed above. On January 15, 2016 the court issued an order staying this lawsuit pending the final determination of any appeal filed with the Federal Circuit concerning that ITC complaint. On October 31, 2017 the Federal Circuit issued its mandate in that appeal holding that two of the three patents in suit are invalid and that Garmin does not infringe upon the third patent. On November 14, 2017, the Oklahoma court lifted the stay and set a briefing schedule. The parties have submitted briefing on the effect of the Federal Circuit’s decision and the court scheduled a hearing on March 12, 2018. This lawsuit was dismissed with prejudice on February 13, 2018 pursuant to the settlement agreement described below.Navico Inc. And Navico Holding AS v. Garmin International, Inc. and Garmin USA, Inc.On March 4, 2016, Navico filed suit in the United States District Court for the Eastern District of Texas, Marshall Division alleging the Company infringed upon two specific Navico patents relating to downscan sonar. On September 8, 2017, a jury returned a verdict finding that Garmin had willfully infringed upon those two patents and awarded damages of $38 million. No judgment was entered by the court.This lawsuit was dismissed with prejudice on February 13, 2018 pursuant to the settlement agreement described below.On January 24, 2018, Garmin and Navico agreed on a global settlement of all pending litigation between them. The settlement is not material to the Company’s financial condition or results of operations. The parties have agreed to keep the terms of the settlement confidential.PulseOn Oy v. Garmin (Europe) Ltd.On November 11, 2016, PulseOn Oy filed suit in the Patents Court in London, England, against Garmin (Europe) Ltd. alleging infringement of alleged UK unregistered design rights and Registered European Community Design No. 002473769-0004 (the “0004 Design”) and Registered European Community Design No. 002473769-005 (the “0005 Design”) by certain Garmin products with wrist-worn heart rate monitors. A trial was held in November 2017. During the trial PulseOn abandoned its claim of infringement of alleged UK unregistered design rights. On January 18, 2018 the court issued a judgment holding that no accused Garmin products infringed either the 0004 Design or the 0005 Design. other matters during the fiscal year ended December 30, 20172023 that did not individually or in the aggregate have a material impact on the Company’s financial condition or results of operations.None.Not applicable.35Executive Officers of the RegistrantPursuant to General Instruction G(3) of Form 10-K and instruction 3 to paragraph (b) of Item 401 of Regulation S-K, the following list is included as an unnumbered Item in Part I of this Annual Report on Form 10-K in lieu of being included in the Company’s Definitive Proxy Statement in connection with its annual meeting of shareholders scheduled for June 8, 2018., age 69, has served as Executive Chairman of Garmin Ltd. since January 20132013. Dr. Kao is one of Garmin’s co-founders and was previously served as Chairman of Garmin Ltd. from August 2004 to December 2012 and Co-Chairman of Garmin Ltd. from August 2000 to August 2004. He served as Chief Executive Officer of Garmin Ltd. from August 2002 to December 2012 and previously served as Co-Chief Executive Officer from August 2000 to August 2002. Dr. Kao served as a director and officer of various subsidiaries of the Company from August 1990 until January 2013. Dr. Kao holds Ph.D. and MS degrees in Electrical Engineering from the University of Tennessee and a BS degree in Electrical Engineering from National Taiwan University., age 52, has served as a director of Garmin Ltd. since August 2004. He has served as President and Chief Executive Officer of Garmin Ltd. since January 2013. Previously,He has also served as a director of Garmin Ltd. since August 2004. Since joining Garmin in October 1989 as a Software Engineer, he served ashas held various other positions, including President and Chief Operating Officer, of Garmin Ltd. from October 2007 to December 2012, and is currently maintaining the role of principal operating officer. Previously, he was Vice President - Engineering of Garmin International, Inc. from 2005 to October 2007,and Director of Engineering of Garmin International, Inc. from 2003 to 2005, and Software Engineering Manager of Garmin International, Inc. from 1995 to 2002 and a Software Engineer with Garmin International, Inc. from 1989 to 1995.Engineering. Mr. Pemble has servedalso serves as a director and officer of various Garmin subsidiaries since August 2003. Mr. Pemble holds BA degrees in Mathematics and Computer Science from MidAmerica Nazarene University.subsidiaries., age 55, has served as Chief Financial Officer and Treasurer of Garmin Ltd. since joining Garmin in July 2014. He previously served as Chief Financial Officer of EiKO Global, LLC from September 2013 to May 2014, as well as Collective Brands, Inc. from November 1997 to November 2012. Mr. Boessen has servedalso serves as a director and officer of various Garmin subsidiaries since July 2014. Mr. Boessen is a certified public accountant and holds a BS degree in Business from the University of Central Missouri and is a graduate of the executive development program at Northwestern University’s Kellogg Graduate School of Management.subsidiaries., age 62, has served as Vice President, General Counsel and Secretary of Garmin Ltd. since June 2009. He was previously General Counsel and Secretary ofjoined Garmin Ltd. from August 2000 to June 2009. He has been Vice President andas General Counsel of Garmin International, Inc. since July 2007, General Counsel sincein February 1998, and Secretary since October 1998. Mr. Etkind has servedalso serves as a director and officer of various Garmin subsidiariessubsidiaries.December 2001.February 2017. He joined Garmin in November 2011 as Vice President, Executive Office.Etkind holds BA, MAStraub also serves as a director and LLM degreesofficer of various other Garmin subsidiaries.Cambridge University, England1996 to 1999.JD degree from the Universityprincipal subsidiary of Michigan Law School.Garmin Ltd., since April 2019. Since joining Garmin in July 1992, he has served in various other positions, including as a Supervisor, Manager, Director and Assistant General Manager of Garmin Corporation. Mr. Wang also serves as a director and officer of various other Garmin subsidiaries.byannually and serve at the discretion of the Company’s Board of Directors. None of the executive officers have an employment agreement with the Company.hold office until their successors are chosen and qualify or until their removal or resignation. There are no arrangements or understandings between the executive officers and any other person pursuant to which he or she was or is to be selected as an officer. There is no family relationship among any of the executive officers. Dr. Min H. Kao is the brother of Ruey-Jeng Kao, who is a supervisor of Garmin Corporation, Garmin’s Taiwan subsidiary, who serves as an ex-officio member of Garmin Corporation’s Board of Directors.36February 16, 2018,January 31, 2024, there were 176290 shareholders of record.The high and low daily closing prices of Garmin’s shares as reported on the Nasdaq Stock Market for each fiscal quarter of fiscal years 2017 and 2016 were as follows: Year Ended December 30, 2017 December 31, 2016 High Low High Low First Quarter $ 54.15 $ 47.35 $ 41.44 $ 32.29 Second Quarter $ 53.58 $ 48.69 $ 43.88 $ 39.10 Third Quarter $ 54.04 $ 49.99 $ 55.75 $ 39.68 Fourth Quarter $ 62.92 $ 53.83 $ 52.87 $ 47.01 On June 9, 2017, the shareholders approved a dividend of $2.04 per share out of Garmin’s general reserves from capital contribution payable in four equal installments. The dates determined by the Board were as follows:Dividend Date Record Date $s per share June 30, 2017 June 19, 2017 $ 0.51 September 29, 2017 September 15, 2017 $ 0.51 December 29, 2017 December 15, 2017 $ 0.51 March 30, 2018 March 15, 2018 $ 0.51 The Company paid the 2017 dividends in accordance with the schedule above and expects to pay the March 30, 2018 dividend. In addition, Garmin currently expects to pay a quarterly cash dividend in the remaining three quarters of 2018. The decision of whether to pay a dividend and the amount of the dividend will be voted on by the Company’s shareholders as required by Swiss law.On June 10, 2016, the shareholders approved a dividend of $2.04 per share (of which $1.53 was paid in the Company’s 2016 fiscal year) payable in four equal installments on dates determined by the Board of Directors. The dates determined by the Board were as follows:Dividend Date Record Date $s per share June 30, 2016 June 16, 2016 $ 0.51 September 30, 2016 September 15, 2016 $ 0.51 December 30, 2016 December 14, 2016 $ 0.51 March 31, 2017 March 15, 2017 $ 0.51 The Board of Directors approved a share repurchase program on February 13, 2015, authorizing the Company to repurchase up to $300 million of the Company’s shares as market and business conditions warrant. The Company made no repurchases of shares during the 13-weeks ended December 30, 2017. On December 30, 2017, the Company had approximately $0.8 million of shares remaining to repurchase under the share repurchase authorization. On December 31, 2017, the share repurchase authorization expired with no additional shares having been repurchased. See Note 11 for additional information regarding the share repurchase plan.37stockshares with the cumulative total returns of the NasdaqNASDAQ Composite indexIndex, the S&P 500 Index, and the S&P 500 Consumer Discretionary Index. Beginning in fiscal year 2024, the graph will include only the S&P 500 Index and the S&P 500 Consumer Discretionary Index. Garmin Ltd. believes the S&P 500 Consumer Discretionary Index is more relevant than the NASAQ Composite Index as the published industry index following the transfer of Garmin Ltd.’s stock listing from the Nasdaq 100 index.Stock Market to the New York Stock Exchange. The graph tracks the performance of a $100 investment in our common stockshares and in each index (with the reinvestment of all dividends) from December 29, 2018 (“12/31/201229/18”) to December 30, 2023 (“12/31/2017.30/23”).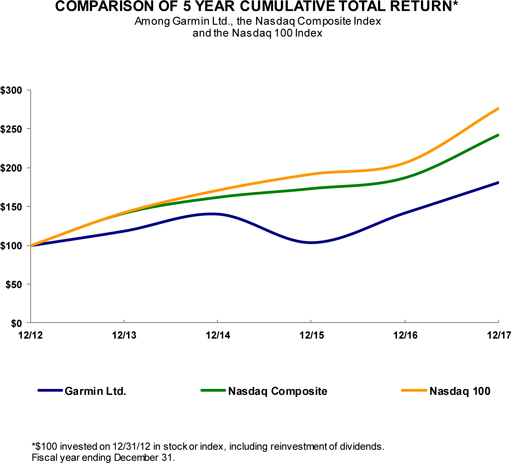

12/12 12/13 12/14 12/15 12/16 12/17 Garmin Ltd. 100.00 118.71 140.55 103.91 141.94 181.09 Nasdaq Composite 100.00 141.63 162.09 173.33 187.19 242.29 Nasdaq 100 100.00 142.44 171.18 191.91 206.40 276.50 stockshare price performance included in this graph is not necessarily indicative of future stockshare price performance.38Selected Financial DataThe following table sets forth selected consolidated financial data of the Company. The selected consolidated balance sheet data as of December 30, 2017 and December 31, 2016 and the selected consolidated statement of income data for the years ended December 30, 2017, December 31, 2016, and December 26, 2015 were derived from the Company’s audited consolidated financial statements and the related notes thereto which are included in Item 8 of this annual report on Form 10-K. The selected consolidated balance sheet data as of December 26, 2015, December 27, 2014, and December 28, 2013 and the selected consolidated statement of income data for the years ended December 27, 2014 and December 28, 2013 were derived from the Company’s audited consolidated financial statements, not included herein.The information set forth below is not necessarily indicative of the results of future operations and should be read together with "Management's Discussion and Analysis of Financial Condition and Results of Operations" and the consolidated financial statements and notes to those statements included in Items 7 and 8 in Part II of this Form 10-K.39 Years ended (1) Dec. 30, 2017 Dec. 31, 2016 Dec. 26, 2015 Dec. 27, 2014 Dec. 28, 2013 (in thousands, except per share data) Consolidated Statements of Income Data: Net sales $ 3,087,004 $ 3,018,665 $ 2,820,270 $ 2,870,658 $ 2,631,851 Cost of goods sold 1,303,840 1,339,095 1,281,566 1,266,246 1,224,551 Gross profit 1,783,164 1,679,570 1,538,704 1,604,412 1,407,300 Operating expenses: Advertising expense 164,693 177,143 167,166 146,633 112,905 Selling, general and administrative 437,977 410,558 394,914 372,032 355,440 Research and development 511,634 467,960 427,043 395,121 364,923 Total operating expenses 1,114,304 1,055,661 989,123 913,786 833,268 Operating income 668,860 623,909 549,581 690,626 574,032 Other income, net (2)(3) 13,434 5,761 17,606 33,119 79,526 Income before income taxes 682,294 629,670 567,187 723,745 653,558 Income tax (benefit) provision (4) (12,661 ) 118,856 110,960 359,534 41,146 Net income $ 694,955 $ 510,814 $ 456,227 $ 364,211 $ 612,412 Net income per share: Basic $ 3.70 $ 2.71 $ 2.39 $ 1.89 $ 3.13 Diluted $ 3.68 $ 2.70 $ 2.39 $ 1.88 $ 3.12 Weighted average common shares outstanding: Basic 187,828 188,818 190,631 193,106 195,411 Diluted 188,732 189,343 191,107 194,165 196,341 Dividends declared per share $ 2.04 $ 2.04 $ 2.04 $ 1.92 $ 1.80 Balance Sheet Data (at end of Period): Cash and cash equivalents $ 891,488 $ 846,883 $ 833,070 $ 1,196,268 $ 1,179,149 Marketable securities 1,421,720 1,480,237 1,558,548 1,575,333 1,651,968 Total assets 5,010,260 4,525,133 4,499,391 4,693,303 4,879,603 Total debt - - - - - Total stockholders' equity 3,802,466 3,418,003 3,345,126 3,403,367 3,659,706 (1)Our fiscal year-end is the last Saturday of the calendar year and does not always fall on December 31. All years presented contain 52 weeks excluding Fiscal 2016 which includes 53 weeks.(2)Other income, net mainly consists of gain (loss) on sale of marketable securities, interest income, and foreign currency gain (loss).(3)Includes $22.6 million, $31.7 million, $23.5 million, $4.3 million, and $20.0 million of foreign currency losses in 2017, 2016, 2015, and 2014, respectively, and $35.5 million of foreign currency gain in 2013.(4)2017 – includes $180.0 million income tax benefit due to election to align Switzerland corproate tax positions partially offset by $22.6 million of income tax expense due to the expiration of certain share-based awards;2014 – includes $307.6 million income tax expense associated with our inter-company restructuring partially offset by $72.9 million income tax reserve release due to expiration of certain statutes of limitations or completion of tax audits2013 – includes $68.7 million income tax reserve release due to expiration of certain statutes of limitations or completion of tax audits partially offset by Taiwan surtax expense due to the release of reserves40for the periods covered by the consolidated financial statements included in this Form 10-K.fiscal years ended December 30, 2023 and December 31, 2022 and a year-to-year comparison of these two fiscal years. This discussion should be read in conjunction with, and is qualified by reference to, the other related information including, but not limited to, the audited consolidated financial statements (including the notes thereto), the description of our business, all as set forth in this Form 10-K, as well as the risk factors discussed above in Item 1A. Discussion regarding our results of operations for the fiscal year ended December 25, 2021 and a year-to-year comparison between the fiscal years ended December 31, 2022 and December 25, 2021 can be found in Item 7 of our Annual Report on Form 10-K for the fiscal year ended December 31, 2022.2017 contains2023 contained 52 weeks compared toand fiscal years 2022 and 2021 contained 53 weeks for 2016 and 52 weeks, for 2015.respectively. Unless otherwise stated, all years and dates refer to the Company’s fiscal year and fiscal periods. Unless the context otherwise requires, references in this document to "we," "us,""we", "us", "our", "the Company" and similar terms refer to Garmin Ltd. and its subsidiaries.We areThe Company is a leading worldwide provider of navigation, communications and informationwireless devices, mostmany of which are enabled byfeature Global Positioning System or GPS, technology. We operate(GPS) navigation, and applications that are designed for people who live an active lifestyle. Garmin is organized in five business segments, which serve the marine, outdoor, fitness, auto, and aviation markets. Our segments offer products through our network of subsidiary distributors and independent dealers and distributors. However, the nature of products and types of customers for the five operating segments can vary significantly. As such,of fitness, outdoor, aviation, marine, and auto OEM. These operating segments represent our reportable segments. The Company’s Chief Executive Officer, who has been identified as the segments are managed separately.Chief Operating Decision Maker (CODM), allocates resources and assesses performance of each operating segment individually.SinceBusiness Environment Updatefirst products were delivered in 1991, weglobal supply chain is routinely subject to component shortages, increased lead times, cost fluctuations, and logistics constraints, certain of these factors have generated positive income from operations each yearat times been further amplified by the recent business environment. The nature and have fundeddegree of effects of the business environment over time remain uncertain. Refer to Part I, Item 1A, “Risk Factors” of this Annual Report on Form 10-K for further discussion of the risks and uncertainties facing our growth from these profits.Company.Policies and EstimatesGeneralGarmin’sOur discussion and analysis of its financial condition and results of operations are based upon Garmin’sthe Company’s consolidated financial statements, which have been prepared in accordance with accounting principles generally accepted in the United States. The presentation of these financial statements requires Garminmanagement to make estimates and judgments that affect the reported amounts of assets, liabilities, revenues and expenses, and related disclosure of contingent assets and liabilities. On an on-going basis, Garmin evaluates itswe evaluate our estimates, including those related to customer sales programs and incentives, product returns, bad debts, inventories, investments, goodwill, intangible assets, income taxes, warranty obligations, and contingencies and litigation. Garmin bases itsWe base our estimates on historical experience and on various other assumptions that are believed to be reasonable under the circumstances, the results of which form the basis for making judgments about the carrying value of assets and liabilities that are not readily apparent from other sources. Actual results may differ from these estimates under different assumptions or conditions.41For information on each of the following critical accounting policies and/or estimates, refer Refer to the discussionNote 1 in the Notes to the Consolidated Financial Statements as indicatedfor our significant accounting policies related to our critical accounting estimates.table below:financial statements from such positions are measured based on the largest amount of benefit that is more likely than not to be realized upon ultimate settlement.Trade Accounts ReceivableNote 2 – Summary of Significant Accounting PoliciesInventoriesNote 2 – Summary of Significant Accounting PoliciesLong-Lived Assets & GoodwillNote 2 – Summary of Significant Accounting PoliciesRevenue RecognitionNote 2 – Summary of Significant Accounting PoliciesProduct WarrantyNote 2 – Summary of Significant Accounting PoliciesSales ProgramsNote 2 – Summary of Significant Accounting PoliciesRecently Issued Accounting Pronouncements – Revenue from Contracts with CustomersNote 2 – Summary of Significant Accounting PoliciesMarketable SecuritiesNote 2 – Summary of Significant Accounting Policies & Note 3 – Marketable SecuritiesLegal and Other ContingenciesNote 2 – Summary of Significant Accounting Policies & Note 4 – Commitments and ContingenciesIncome TaxesNote 2 – Summary of Significant Accounting Policies & Note 6 – Income TaxesStock-Based CompensationNote 2 – Summary of Significant Accounting Policies & Note 9 – Stock Compensation Planstorepair shops, original equipment manufacturers.manufacturers (OEMs), our online webshop (garmin.com), subscriptions for connected services, and our own retail stores. Refer to the Revenue Recognition discussion in Note 21 of the Notes to the Consolidated Financial Statements. Our sales are largely of a consumer nature; therefore, backlog levels are not necessarily indicative of our future sales results. We aim to achieve a quick turnaround on orders we receive from our retail, dealer, and distributor customers. Certain arrangements with OEM customers are entered into at the beginning of an aircraft, boat, or vehicle life cycle with the intent to fulfill customer purchasing requirements for the entire production life, although there are generally no firm volume commitments, and sales are therefore generated on an order-by-order basis. As a result, we typically ship most orders within 72 hours.do not believe backlog information is material to the understanding of our business.Sales/Goods Sold and Gross Profitlower costlower-cost or more readily available components.Xizhi, Jhongli, and LinKou manufacturing plants in Taiwan; Yangzhou manufacturing plant in China; and our Olathe, Kansas, and Salem, Oregon manufacturing plants in the U.S.factories to experience relatively low costs of manufacturing. In general, products manufactured in Taiwan have been our highest volume products. Our manufacturing labor costs historically have been lower in Taiwan and China than in Olatheother locations.Salem.handling costs associated with the transportation and delivery of our products are included in cost of goods sold. Such costs fluctuate due to a number of factors, including market pricing and the mix of modes of transportation we utilize.In the past, pricesOur consolidated gross margin, representing gross profit as a percentage of our devices sold into the auto market have declined duenet sales, is dependent on segment mix, and to market pressures and introduction of new products sold at lower price points. In recent years, pricing has stabilized in auto allowing for relatively stable gross margins excluding the impact of deferred revenues and costs. The average selling prices of our aviation, outdoor, fitness, and marine products have historically been stable due toa lesser extent, product mix and the introduction of more advanced products sold at higher prices. The effect of the sales price differences inherent within the mix of products sold could have a significant impact on our gross profit.each segment.42·salaries for sales, marketing and product support personnel;·salaries and related costs for executives and administrative personnel;·marketing, and other brand building costs;·accounting and legal costs;·information systems and infrastructure costs;·travel and related costs; and·occupancy and other overhead costs.•information systems and infrastructure costs;•salaries for sales, marketing and product support personnel;•salaries and related costs for executives and administrative personnel;•marketing, and other brand building costs;•finance and legal costs;•human resource costs;•travel and related costs; and•occupancy and other overhead costs.salaries for our engineers andengineering personnel costs, costs of test equipment and components used in product and prototype development.development, and outside product development costs.Income TaxesWe have experienced a relatively low effective corporate tax rate due to the proportion of our revenue generated by entities in tax jurisdictions with low statutory rates. In particular, the profit entitlement afforded our Swiss-based companies based on their intellectual property rights ownership of our consumer products have contributed to our relatively low effective corporate tax rate.43 52-weeks ended 53-weeks ended 52-weeks ended Dec. 30, Dec. 31, Dec. 26, 2017 2016 2015 Net sales 100 % 100 % 100 % Cost of goods sold 42 % 44 % 45 % Gross profit 58 % 56 % 55 % Operating expenses: Advertising 5 % 6 % 6 % Selling, general and administrative 14 % 14 % 14 % Research and development 17 % 16 % 15 % Total operating expenses 36 % 35 % 35 % Operating income 22 % 21 % 19 % Other income, net 0 % 0 % 1 % Income before income taxes 22 % 21 % 20 % Provision (benefit) for income taxes (0 )% 4 % 4 % Net income 23 % 17 % 16 % In 2016, the Company moved action camera related revenue and expenses from the outdoor segment to the auto segment, allowing for alignment and synergies with other camera-based efforts occurring within the auto segment. The overall impact of the move was immaterial. However, action camera related operating results for the 52-weeks ended December 26, 2015 has been recast to conform to the 2017 and 2016 presentation.The following table below sets forth our results of operations through operating income for each of our five reportable segments. The Company’s CODM primarily uses operating income as the measure of profit or loss to assess segment performance and allocate resources. Operating income represents net sales less costs of goods sold and operating expenses. Net sales are directly attributed to each segment. Most costs of goods sold and the majority of operating expenses are also directly attributed to each segment, while certain other costs of goods sold and operating expenses are allocated to the segments duringin a reasonable manner considering the period shown.specific facts and circumstances of the expenses being allocated. For each line item in the table below, the total of the reportable segments’ amounts equals the amount in the consolidated statements of income data included in Item 6.income.4452-weeks ended December 30, 2017 Outdoor Fitness Marine Auto Aviation Net sales $ 698,867 $ 762,194 $ 374,001 $ 750,583 $ 501,359 Cost of goods sold 250,457 339,558 161,409 422,662 129,754 Gross profit 448,410 422,636 212,592 327,921 371,605 Advertising expense 41,113 75,660 16,101 25,639 6,180 Selling, general and administrative expenses 98,914 119,537 83,765 107,995 27,766 Research and development expense 58,516 80,674 62,398 126,320 183,726 Total operating expenses 198,543 275,871 162,264 259,954 217,672 Operating income $ 249,867 $ 146,765 $ 50,328 $ 67,967 $ 153,933 53-weeks ended December 31, 2016 Outdoor Fitness Marine Auto Aviation Net sales $ 546,326 $ 818,486 $ 331,947 $ 882,558 $ 439,348 Cost of goods sold 205,822 381,281 148,238 493,811 109,943 Gross profit 340,504 437,205 183,709 388,747 329,405 Advertising expense 31,005 90,871 15,516 33,122 6,629 Selling, general and administrative expenses 77,016 118,753 60,061 127,618 27,110 Research and development expense 48,448 66,985 55,965 125,660 170,902 Total operating expenses 156,469 276,609 131,542 286,400 204,641 Operating income $ 184,035 $ 160,596 $ 52,167 $ 102,347 $ 124,764 52-weeks ended December 26, 2015 Outdoor Fitness Marine Auto Aviation Net sales $ 411,184 $ 661,599 $ 286,778 $ 1,062,091 $ 398,618 Cost of goods sold 156,306 295,460 128,285 597,611 103,904 Gross profit 254,878 366,139 158,493 464,480 294,714 Advertising expense 24,655 79,737 16,106 40,710 5,958 Selling, general and administrative expenses 54,132 97,809 60,834 157,151 24,988 Research and development expense 37,021 54,019 52,942 130,550 152,511 Total operating expenses 115,808 231,565 129,883 328,411 183,457 Operating income $ 139,070 $ 134,574 $ 28,611 $ 136,069 $ 111,257 Comparison of 52-Weeks Ended December 30, 2017 and 53-Weeks Ended December 31, 2016 52-weeks ended December 30, 2017 53-weeks ended December 31, 2016 Year over Year Net Sales % of Revenues Net Sales % of Revenues $ Change % Change Outdoor $ 698,867 23 % $ 546,326 18 % $ 152,541 28 % Fitness 762,194 25 % 818,486 27 % (56,292 ) -7 % Marine 374,001 12 % 331,947 11 % 42,054 13 % Auto 750,583 24 % 882,558 29 % (131,975 ) -15 % Aviation 501,359 16 % 439,348 15 % 62,011 14 % Total $ 3,087,004 100 % $ 3,018,665 100 % $ 68,339 2 % 2%8% in 2017fiscal year 2023 when compared to the year-ago period. Outdoor, marine, and aviation segments had an increaseTotal unit sales increased approximately 8% to 16.2 million units in revenue, while fitness and auto segments had a decrease2023 from 15.0 million units in revenue. Fitness2022. Outdoor revenue represented the largest portion of our revenue mix at 25%32% in 2017, which was a slight decline from 27% in 2016. Auto revenue represented the largest portion of our revenue mix in 2016 at 29% and declined to 24% in 2017.Total unit sales decreased 8% to 15.4 million units in the 52-weeks ended 2017 from 16.8 million units in the 53-weeks ended 2016.45Auto segment revenue decreased 15% from the year-ago period, primarily due to the ongoing PND market contraction. Fitness segment revenue decreased 7% from the year-ago period, primary driven by the general decline of the basic activity tracker market. Outdoor, marine, and aviation revenues increased 28%, 13%, and 14%, respectively when2023, compared to the year-ago period. Growth36% in outdoor2022.in our wearables and subscriptionsacross all product categories. Our marine segmentAviation revenue increased primarily due to growth in chartplotters, fishfinders, and entertainment systems, and theOEM product categories. The increase in marine revenue was driven by contributions from newly acquired Navionics. Aviation revenuesJL Audio, partially offset by declines in multiple product categories. Auto OEM revenue increased primarily due to growthincreased shipments of domain controllers. Outdoor revenue decreased primarily due to declines in both OEM and aftermarket sales.sales of adventure watches during the first quarter of 2023.Cost of Goods Sold 52-weeks ended December 30, 2017 53-weeks ended December 31, 2016 Year over Year Cost of Goods % of Revenues Cost of Goods % of Revenues $ Change % Change Outdoor $ 250,457 36 % $ 205,822 38 % $ 44,635 22 % Fitness 339,558 45 % 381,281 47 % (41,723 ) -11 % Marine 161,409 43 % 148,238 45 % 13,171 9 % Auto 422,662 56 % 493,811 56 % (71,149 ) -14 % Aviation 129,754 26 % 109,943 25 % 19,811 18 % Total $ 1,303,840 42 % $ 1,339,095 44 % $ (35,255 ) -3 % Cost of goods sold decreased 3%Gross profit dollars in absolute dollars forfiscal year 2023 increased 7%, primarily due to the 52-weeks ended December 30, 2017increase in net sales compared to the year-ago period as described above. Consolidated gross margin was relatively flat when compared to the 53-weeks ended December 31, 2016.year-ago period.segment costOEM gross margin decrease of goods decline was largely consistent with the segment revenue decline. In the outdoor, fitness, and marine segments, the decrease in cost of goods sold as a percent of revenues was a result of a shift in product mix toward higher margin products. The aviation segment increase in cost of goods sold was generally consistent with the segment revenue increase.Gross Profit 52-weeks ended December 30, 2017 53-weeks ended December 31, 2016 Year over Year Gross Profit % of Revenues Gross Profit % of Revenues $ Change % Change Outdoor $ 448,410 64 % $ 340,504 62 % $ 107,906 32 % Fitness 422,636 55 % 437,205 53 % (14,569 ) -3 % Marine 212,592 57 % 183,709 55 % 28,883 16 % Auto 327,921 44 % 388,747 44 % (60,826 ) -16 % Aviation 371,605 74 % 329,405 75 % 42,200 13 % Total $ 1,783,164 58 % $ 1,679,570 56 % $ 103,594 6 % Gross profit dollars in the 52-weeks ended December 30, 2017 increased 6% while gross profit margin increased 210870 basis points comparedwas primarily attributable to the 53-weeks ended December 31, 2016. Growth in sales of higher margin segments contributed to the increase in gross profit dollars and gross margin percentage. Outdoor, fitness, and marine segment increases to gross profit margin were primarily due tounfavorable product mix within those segments. Auto and aviation segment gross margin rates were relatively consistent between fiscal periods.46Advertising Expenses 52-weeks ended December 30, 2017 53-weeks ended December 31, 2016 Advertising Advertising Year over Year Expense % of Revenues Expense % of Revenues $ Change % Change Outdoor $ 41,113 6 % $ 31,005 6 % $ 10,108 33 % Fitness 75,660 10 % 90,871 11 % (15,211 ) -17 % Marine 16,101 4 % 15,516 5 % 585 4 % Auto 25,639 3 % 33,122 4 % (7,483 ) -23 % Aviation 6,180 1 % 6,629 2 % (449 ) -7 % Total $ 164,693 5 % $ 177,143 6 % $ (12,450 ) -7 % AdvertisingTotal operating expense decreased 7%increased 8% in absolute dollars and was relatively flat as a percent of revenuesrevenue in the 52-weeks ended December 30, 2017fiscal year 2023 compared to the 53-weeks ended December 31, 2016. The decrease in absolute dollars is primarily attributable to decreases in spend on media advertising.fiscal year 2022.Selling, General and Administrative Expenses 52-weeks ended December 30, 2017 53-weeks ended December 31, 2016 Selling, General & Selling, General & Year over Year Admin. Expenses % of Revenues Admin. Expenses % of Revenues $ Change % Change Outdoor $ 98,914 14 % $ 77,016 14 % $ 21,898 28 % Fitness 119,537 16 % 118,753 15 % 784 1 % Marine 83,765 22 % 60,061 18 % 23,704 39 % Auto 107,995 14 % 127,618 14 % (19,623 ) -15 % Aviation 27,766 6 % 27,110 6 % 656 2 % Total $ 437,977 14 % $ 410,558 14 % $ 27,419 7 % Selling, general and administrativeAdvertising expense increased 7%3% in absolute dollars and was relatively flat as a percent of revenues in the 52-weeks ended December 30, 2017revenue when compared to the 53-weeks ended December 31, 2016.year-ago period. The absolute dollar increase iswas primarily attributable to legal-related costs and information technology costs. As a percent of revenues, selling,increased media spend.expenses in all segments except marine were relatively consistent on a year over year basis. The increase in the marine segment, as a percent of revenues, was primarily related to a litigation settlement.Research and Development Expense 52-weeks ended December 30, 2017 53-weeks ended December 31, 2016 Research & Research & Year over Year Development % of Revenues Development % of Revenues $ Change % Change Outdoor $ 58,516 8 % $ 48,448 9 % $ 10,068 21 % Fitness 80,674 11 % 66,985 8 % 13,689 20 % Marine 62,398 17 % 55,965 17 % 6,433 11 % Auto 126,320 17 % 125,660 14 % 660 1 % Aviation 183,726 37 % 170,902 39 % 12,824 8 % Total $ 511,634 17 % $ 467,960 16 % $ 43,674 9 % Research and development expense increased 9% due to ongoing development activities for new products and the addition of engineering personnel throughout the 52-weeks ended December 30, 2017. In absolute dollars, research and development costs increased $43.7 million when compared with the 53-weeks ended December 31, 2016, and increased 100 basis points as a percent of revenue. Our research and development spending is focused on product development, improving existing software capabilities, and exploring new categories.47Operating Income 52-weeks ended December 30, 2017 53-weeks ended December 31, 2016 Year over Year Operating Income % of Revenues Operating Income % of Revenues $ Change % Change Outdoor $ 249,867 36 % $ 184,035 34 % $ 65,832 36 % Fitness 146,765 19 % 160,596 20 % (13,831 ) -9 % Marine 50,328 13 % 52,167 16 % (1,839 ) -4 % Auto 67,967 9 % 102,347 12 % (34,380 ) -34 % Aviation 153,933 31 % 124,764 28 % 29,169 23 % Total $ 668,860 22 % $ 623,909 21 % $ 44,951 7 % As a result of the above, operating income increased 7%8% in absolute dollars and 100 basis pointswas relatively flat as a percent of revenue when compared to the 53-weeks ended December 31, 2016.year-ago period. The growth in operating income, bothabsolute dollar increase was primarily attributable to increased personnel-related expenses and information technology costs.an increasehigher engineering personnel costs.growthwhen compared to fiscal year 2022. The absolute dollar decreases in outdoor and increase in gross margin percentage, which was partiallymarine operating income were more than offset by increased operating expenses, as discussed above.improved performance in fitness, aviation, and auto OEM. 52-weeks ended 53-weeks ended December 30, 2017 December 31, 2016 Interest income $ 36,925 $ 33,406 Foreign currency gains (losses) (22,579 ) (31,651 ) Other (912 ) 4,006 Total $ 13,434 $ 5,761 including interest and capital gain/loss returns, during the 52-weeks ended December 30, 20172023 and the 53- weeks53-weeks ended December 31, 20162022 were 1.5% for both periods.2.7% and 1.4%, respectively. Interest income increased in fiscal 2017 primarily due to slightly higher yields on fixed-income securities, while other income decreased in fiscal 2017 primarily due to higher net capital gains realized in fiscal 2016.securities.typically driven by movements in the Taiwan Dollar, Euro, and British Pound Sterlingof a number of currencies in relation to the U.S. Dollar. The Taiwan Dollar is the functional currency of Garmin Corporation, the Euro is the functional currency of several subsidiaries, and the U.S. Dollar is the functional currency of Garmin (Europe) Ltd., and the Euro is the functional currency of most of our other European subsidiaries, although some transactions and balances are denominated in British Pounds. Other notable currency exposures include the Australian Dollar, Chinese Yuan, Japanese Yen, and Polish Zloty. The majority of the Company’s consolidated foreign currency gain or loss is typically driven by the significant cash and marketable securities, receivables and payables held in a currency other than the functional currency at a given legal entity. Due to the relative size of the entities using a functional currency other than the Taiwan Dollar, Euro, and British Pound Sterling, currency fluctuations related to these entities are not expected to have a material impact on the Company’s financial statements.$22.6$26.4 million currency lossgain recognized in fiscal 20172023 was primarily due to the weakening of the U.S. Dollar weakening against the Taiwan Dollar,Polish Zloty and Euro, partially offset by the U.S. Dollar weakening at times during the year against the Euro and the British Pound Sterling.Taiwan Dollar. During fiscal 2017,this period, the U.S. Dollar weakened 9.4%12.3% against the Polish Zloty and 3.1% against the Euro, resulting in gains of $24.4 million and $8.8 million, respectively, partially offset by the U.S. Dollar weakening at times during the year against the Taiwan Dollar, resulting in a net loss of $55.9 million, while the U.S. Dollar weakened 14.1% against the Euro and 9.5% against the British Pound Sterling, resulting in gains of $27.2 million and $3.1 million, respectively.$5.1 million. The remaining net currency gainloss of $3.0$1.7 million iswas related to the impacts of other currencies, and timingeach of transactions.which was individually immaterial.$31.7$11.3 million currency loss recognized in fiscal 20162022 was primarily due to the weakening ofU.S. Dollar strengthening against the Australian Dollar, Polish Zloty, Chinese Yuan, Euro, Japanese Yen, and British Pound Sterling, partially offset by the U.S. Dollar strengthening against the Taiwan Dollar and the strengthening of the U.S. Dollar against the Euro and British Pound Sterling.Dollar. During fiscal 2016, the U.S. Dollar weakened 1.7% against the Taiwan Dollar, resulting in a loss of $9.2 million, whilethis period, the U.S. Dollar strengthened 4.2%6.4% against the Australian Dollar, 7.1% against the Polish Zloty, 8.5% against the Chinese Yuan, 5.4% against the Euro, 12.7% against the Japanese Yen, and 16.8%9.6% against the British Pound Sterling resulting in losses of $13.0$8.9 million, $6.0 million, $5.8 million, $5.1 million, $3.7 million, and $5.1$1.9 million, respectively.respectively, partially offset by the U.S. Dollar strengthening 9.7% against the Taiwan Dollar, resulting in a gain of $28.0 million. The remaining net currency loss of $4.4$7.9 million iswas related to the impacts of other currencies, and timingeach of transactions.which was individually immaterial.48OurThe Company recorded income tax benefit of $89.3 million for the 52-weeksfiscal year ended December 30, 2017 was $12.72023, which included income tax benefit of $181.4 million comparedrecognized by the Company in the fourth quarter of 2023 related to the revaluation of Switzerland deferred tax assets and income tax benefit of $12.1 million recognized in the fourth quarter of 2023 related to Auto OEM manufacturing tax incentives in Poland. The Company recorded income tax expense of $118.9$91.4 million for the 53-weeksfiscal year ended December 31, 2016, resulting2022, which included income tax expense of $7.2 million recognized by the Company in the fourth quarter of 2022 related to the revaluation of Switzerland deferred tax assets.net changecombined federal and cantonal statutory tax rate of $131.6 million. Contributingapproximately 15% in Switzerland. As a result of the increases in the combined Switzerland tax rates and the impact of implementation of global minimum tax requirements, we expect our effective tax rate to be higher in the decreasefuture, beginning with the 2024 tax year, when compared to fiscal years 2023, 2022, and 2021.tax expense was:·Income tax benefit of $180.0 million related2020 which migrates ownership of certain intellectual property from Switzerland to the Company’s Switzerland corporate tax election in the 52-weeks ended December 30, 2017 with no comparable item in the 53-weeks ended December 31, 2016,Partially offset by:·Income tax expense of $19.9 million related to share based compensation in the 52-weeks ended December 30, 2017 in accordance with new accounting standard Topic 718, Compensation–Stock Compensation, and·Increased income tax expense of $21.0 million related to the Company’s election to align certain Switzerland corporate tax positions in the 52-weeks ended December 30, 2017.On December 22, 2017, the Tax Cuts and Jobs Act was passed by United States Congress, reducing the United States, federal corporatewhich is the primary location of research, development, and executive management. At the end of this migration, a higher percentage of income tax rate from 35% to 21%. The effects ofwill be recognized in the U.S. tax reform, including revaluation of deferred tax assets and liabilities, had an immaterial impact on the 2017 income tax benefit, on a provisional basis, as discussed in Note 6.36%32% to $695.0$1,289.6 million for the 52-weeks ended December 30, 2017 compared to $510.8 million for the 53-weeks ended December 31, 2016.Comparison of 53-Weeks Ended December 31, 2016 and 52-Weeks Ended December 26, 2015Net Sales 53-weeks ended December 31, 2016 52-weeks ended December 26, 2015 Year over Year Net Sales % of Revenues Net Sales % of Revenues $ Change % Change Outdoor $ 546,326 18 % $ 411,184 15 % $ 135,142 33 % Fitness 818,486 27 % 661,599 23 % 156,887 24 % Marine 331,947 11 % 286,778 10 % 45,169 16 % Auto 882,558 29 % 1,062,091 38 % (179,533 ) -17 % Aviation 439,348 15 % 398,618 14 % 40,730 10 % Total $ 3,018,665 100 % $ 2,820,270 100 % $ 198,395 7 % Net sales increased 7% in 2016 when compared to the prior year period. All segments had an increase in revenue except for auto. Auto revenue remains the largest portion of our revenue mix at 29% in the 53-weeks ended December 31, 2016 compared to 38% in the 52-weeks ended December 26, 2015.Total unit sales increased 4% to 16.8 million units in 2016 from 16.2 million units in 2015.Auto segment revenue decreased 17% from the prior year period, primarily due to the ongoing PND market contraction. Outdoor, fitness, marine, and aviation revenues increased 33%, 24%, 16%, and 10%, respectively, when compared to the prior year period, primarily due to increases in sales volumes. Growth in outdoor was driven by wearables and the newly acquired DeLorme product lines. The increase in fitness was driven by wearables with Garmin ElevateTM wrist heart rate technology. Our marine segment increased due to growth in chartplotters, fishfinders, and entertainment systems. Aviation revenues increased due to growth in both OEM and aftermarket sales.49Cost of Goods Sold 53-weeks ended December 31, 2016 52-weeks ended December 26, 2015 Year over Year Cost of Goods % of Revenues Cost of Goods % of Revenues $ Change % Change Outdoor $ 205,822 38 % $ 156,306 38 % $ 49,516 32 % Fitness 381,281 47 % 295,460 45 % 85,821 29 % Marine 148,238 45 % 128,285 45 % 19,953 16 % Auto 493,811 56 % 597,611 56 % (103,800 ) -17 % Aviation 109,943 25 % 103,904 26 % 6,039 6 % Total $ 1,339,095 44 % $ 1,281,566 45 % $ 57,529 4 % Cost of goods sold increased 4% in absolute dollars for the 53-weeks ended December 31, 2016 when compared to the 52-weeks ended December 26, 2015.In the auto segment, the cost of goods decline was largely consistent with the segment revenue decline. In the outdoor and fitness segments, the increases of 32% and 29% in cost of goods sold, respectively, primarily reflect strong volume growth. In the marine and aviation segments, the increases of 16% and 6%, respectively, primarily reflect volume growth.Gross Profit 53-weeks ended December 31, 2016 52-weeks ended December 26, 2015 Year over Year Gross Profit % of Revenues Gross Profit % of Revenues $ Change % Change Outdoor $ 340,504 62 % $ 254,878 62 % $ 85,626 34 % Fitness 437,205 53 % 366,139 55 % 71,066 19 % Marine 183,709 55 % 158,493 55 % 25,216 16 % Auto 388,747 44 % 464,480 44 % (75,733 ) -16 % Aviation 329,405 75 % 294,714 74 % 34,691 12 % Total $ 1,679,570 56 % $ 1,538,704 55 % $ 140,866 9 % Gross profit dollars in the 53-weeks ended December 31, 2016 increased 9% while gross profit margin increased 100 basis points compared to the 52-weeks ended December 26, 2015. Growth in sales of higher margin segments contributed to the increase in gross profit dollars and gross margin percentage. Fitness margin declined to 53% due to product mix. All other segment gross margin rates are relatively consistent between fiscal periods.Advertising Expenses 53-weeks ended December 31, 2016 52-weeks ended December 26, 2015 Advertising Advertising Year over Year Expense % of Revenues Expense % of Revenues $ Change % Change Outdoor $ 31,005 6 % $ 24,655 6 % $ 6,350 26 % Fitness 90,871 11 % 79,737 12 % 11,134 14 % Marine 15,516 5 % 16,106 6 % (590 ) -4 % Auto 33,122 4 % 40,710 4 % (7,588 ) -19 % Aviation 6,629 2 % 5,958 1 % 671 11 % Total $ 177,143 6 % $ 167,166 6 % $ 9,977 6 % Advertising expense increased 6% in absolute dollars and was relatively flat as a percent of revenues in the 53-weeks ended December 31, 2016 compared to the 52-weeks ended December 26, 2015. The increase in absolute dollars is primarily attributable to outdoor and fitness, partially offset by auto.50Selling, General and Administrative Expenses 53-weeks ended December 31, 2016 52-weeks ended December 26, 2015 Selling, General & Selling, General & Year over Year Admin. Expenses % of Revenues Admin. Expenses % of Revenues $ Change % Change Outdoor $ 77,016 14 % $ 54,132 13 % $ 22,884 42 % Fitness 118,753 15 % 97,809 15 % 20,944 21 % Marine 60,061 18 % 60,834 21 % (773 ) -1 % Auto 127,618 14 % 157,151 15 % (29,533 ) -19 % Aviation 27,110 6 % 24,988 6 % 2,122 8 % Total $ 410,558 14 % $ 394,914 14 % $ 15,644 4 % Selling, general and administrative expense increased 4% and was relatively flat as a percent of revenues in the 53-weeks ended December 31, 2016 compared to the 52-weeks ended December 26, 2015. The absolute dollar increase is primarily attributable to information technology costs and salaries and benefits. Variances by segment are primarily due to the allocation of certain selling, general and administrative expenses based on percentage of total revenues with the exception of the marine segment, as expenses decreased as a percentage of revenue due to prior year specific litigation matters.Research and Development Expense 53-weeks ended December 31, 2016 52-weeks ended December 26, 2015 Research & Research & Year over Year Development % of Revenues Development % of Revenues $ Change % Change Outdoor $ 48,448 9 % $ 37,021 9 % $ 11,427 31 % Fitness 66,985 8 % 54,019 8 % 12,966 24 % Marine 55,965 17 % 52,942 18 % 3,023 6 % Auto 125,660 14 % 130,550 12 % (4,890 ) -4 % Aviation 170,902 39 % 152,511 38 % 18,391 12 % Total $ 467,960 16 % $ 427,043 15 % $ 40,917 10 % Research and development expense increased 10% due to ongoing development activities for new products and additional engineering personnel throughout the 53-weeks ended December 31, 2016. In absolute dollars, research and development costs increased $40.9 million when compared with the 52-weeks ended December 26, 2015, and increased 40 basis points as a percent of revenue. Our research and development spending is focused on product development, improving existing software capabilities, and exploring new categories.Operating Income 53-weeks ended December 31, 2016 52-weeks ended December 26, 2015 Year over Year Operating Income % of Revenues Operating Income % of Revenues $ Change % Change Outdoor $ 184,035 34 % $ 139,070 34 % $ 44,965 32 % Fitness 160,596 20 % 134,574 20 % 26,022 19 % Marine 52,167 16 % 28,611 10 % 23,556 82 % Auto 102,347 12 % 136,069 13 % (33,722 ) -25 % Aviation 124,764 28 % 111,257 28 % 13,507 12 % Total $ 623,909 21 % $ 549,581 19 % $ 74,328 14 % As a result of the above, operating income increased 14% in absolute dollars and 120 basis points as a percent of revenue when compared to the 52-weeks ended December 26, 2015. Revenue growth with a slight increase in gross margin percentage contributed to the growth, slightly offset by increased operating expenses, as discussed above, with the exception of the marine segment, as operating expenses decreased as a percentage of revenue due to prior year specific litigation matters.51Other Income (Expense) 53-weeks ended 52-weeks ended December 31, 2016 December 26, 2015 Interest income $ 33,406 $ 29,653 Foreign currency gains (losses) (31,651 ) (23,465 ) Other 4,006 11,418 Total $ 5,761 $ 17,606 The average returns on cash and investments, including interest and capital gain/loss returns, during the 53-weeks ended December 31, 2016 and the 52-weeks ended December 26, 2015 were 1.5% and 1.2%, respectively. Interest income increased primarily due to slightly higher yields on fixed-income securities.Foreign currency gains and losses for the Company are typically driven by movements in the Taiwan Dollar, Euro, and British Pound Sterling in relation to the U.S. Dollar. The Taiwan Dollar is the functional currency of Garmin Corporation, the U.S. Dollar is the functional currency of Garmin (Europe) Ltd., and the Euro is the functional currency of most of our other European subsidiaries, although some transactions and balances are denominated in British Pounds. The majority of the Company’s consolidated foreign currency gain or loss is typically driven by the significant cash and marketable securities, receivables and payables held in a currency other than the functional currency at a given legal entity. Due to the relative size of the entities using a functional currency other than the Taiwan Dollar, Euro, and British Pound Sterling, currency fluctuations related to these entities are not expected to have a material impact on the Company’s financial statements.The $31.7 million currency loss in fiscal 2016 was primarily due to the weakening of the U.S. Dollar against the Taiwan Dollar and the strengthening of the U.S. Dollar against the Euro and British Pound Sterling. During fiscal 2016, the U.S. Dollar weakened 1.7% against the Taiwan Dollar, resulting in a loss of $9.2 million, while the U.S. Dollar strengthened 4.2% against the Euro and 16.8% against the British Pound Sterling, resulting in losses of $13.0 million and $5.1 million, respectively. The remaining net currency loss of $4.4 million was related to other currencies and timing of transactions.The $23.5 million currency loss in fiscal 2015 was primarily due to the strengthening of the U.S. Dollar against the Euro and British Pound Sterling, partially offset by a gain associated with the strengthening of the U.S. Dollar against the Taiwan Dollar. During fiscal 2015, the U.S. Dollar strengthened 10.0% against the Euro and 4.6% against the British Pound Sterling, resulting in losses of $31.2 million and $2.1 million, respectively. This was largely offset by the U.S. Dollar strengthening 3.8% against the Taiwan Dollar, resulting in a gain of $19.5 million. The remaining net currency loss of $9.7 million was related to other currencies and timing of transactions.During the 53-weeks ended December 31, 2016, Garmin recorded other income of $4.0 million compared to $11.4$973.6 million in the 52-weeks ended December 26, 2015. The decrease in fiscal 2016 relates primarily to a legal settlement received in fiscal 2015.prior year.52Income Tax ProvisionOur income tax expense increased by $7.9 million, to $118.9 million for the 53-weeks ended December 31, 2016, from $111.0 million for the 52-weeks ended December 26, 2015. Contributing to the increase was:·Increased income before taxes in the 53-weeks ended December 31, 2016 compared to the 52-weeks ended December 26, 2015,Partially offset by:·A net release of uncertain tax position reserves due to expiration of certain statutes of limitations of $11.9 million for the 53-weeks ended December 31, 2016, as compared with $7.3 million for the 52-weeks ended December 26, 2015.Net IncomeAs a result of the various factors noted above, net income increased 12% to $510.8 million for the 53-weeks ended December 31, 2016 compared to $456.2 million for the 52-weeks ended December 26, 2015.As of December 30, 2017, we had $2,313.2 million of cash and cash equivalents and marketable securities. We primarily use cash flow from operations, and expect that future cash requirements willmay be used, to fund our capital expenditures, support our working capital requirements, pay dividends, fund share repurchases, and fund strategic acquisitions. We believe that our existing cash balances and cash flow from operations will be sufficient to meet our short- and long-term projected working capital needs, capital expenditures, working capital and other cash requirements.It is management’s goal to invest the on-handCash, Cash Equivalents, and Marketable SecuritiesDirectors of each applicable Garmin entity holding the cash.Directors. The investment policy’s primary purpose isobjectives are to preserve capital, maintain an acceptable degree of liquidity, and maximize yield within the constraint of low credit risk. Garmin’s average interest rate returns on cash and investments during fiscal 2017, 2016,2023 and 20152022 were approximately 1.6%, 1.5%,2.7% and 1.2%1.4%, respectively. The fair value of our securities varies from period to period due to changes in interest rates, in the performance of the underlying collateral, and in the credit performance of the underlying issuer, among other factors. See Note 34 in the Notes to the Consolidated Financial Statements for additional information regarding marketable securities.Operating ActivitiesCash Flows 52-Weeks Ended 53-Weeks Ended 52-Weeks Ended December 30, December 31, December 26, (In thousands) 2017 2016 2015 Net cash provided by operating activities $ 660,842 $ 705,682 $ 280,467 The $44.8 million decrease in cashCash provided by operating activities intotaled $1,376.3 million for fiscal year 20172023, compared to $788.3 million for fiscal year 20162022. The increase was primarily due to a decreaselower use of cash provided by working capitalon purchases of $133.2 million (which included increases of $52.2 million in accounts receivable and $31.5 million in cash paid for inventory) and income taxes payable of $16.5 million. The decrease wasinventory, partially offset by an increasea decrease in net incomecollections of $184.1 million, reduced by other non-cash adjustments to net income of $79.3 million.The $425.2 million increase in cash provided by operating activitiesaccounts receivable in fiscal year 20162023 when compared to fiscal year 20152022.provided by working capital of $223.5 million (which included decreases of $122.5 million in cash paid for inventory and $109.6 million in cash paid for prepaid royalties and other assets) and income taxes payable of $154.0 million, primarily attributable to cash taxes paid related to a 2015 intercompany restructuring. The increase was also impacted by an increase of net income of $54.6 million, reduced by other non-cash adjustments to net income of $6.9 million.Investing Activities 52-Weeks Ended 53-Weeks Ended 52-Weeks Ended December 30, December 31, December 26, (In thousands) 2017 2016 2015 Net cash used in investing activities $ (194,536 ) $ (121,537 ) $ (111,979 ) 53The $73.0 million increase in cash used in investing activities in fiscal year 2017 compared to fiscal year 2016 was primarily due to increased cash payments for net purchases of property and equipment of $49.1 million and net cash paid for acquisitions of $12.5 million.The $9.6 million increase in cash used in investing activities in fiscal year 2016 compared to fiscal year 2015 was primarily due to increased net cash paid for acquisitions of $39.3 million and net purchases of property and equipment of $17.6 million, partially offset by an increase of $49.0 milliona decrease in net redemptions of marketable securities.We have budgeted approximately $140 million to $150 million of capital expenditures during fiscal 2018 to include some facility expansion, along with normal ongoing capital expenditures and maintenance activities. Approximately half of the budgeted capital expendituressecurities in fiscal 2018 are attributable to Olathe, KS facilities, including the expansion project described in “Item 2. Properties.”Financing Activities 52-Weeks Ended 53-Weeks Ended 52-Weeks Ended December 30, December 31, December 26, (In thousands) 2017 2016 2015 Net cash used in financing activities $ (448,412 ) $ (561,676 ) $ (500,092 ) The $113.3 million decrease in cash used in financing activities in fiscal year 20172023 compared to fiscal year 2016 was primarily due to decreased dividend payments of $98.5 million associated with an additional payment made in the 53-week fiscal year 2016 and a decrease of purchases of treasury stock of $18.7 million under our share repurchase authorization.The $61.6 million increase in cash used in financing activities in fiscal year 2016 compared to fiscal year 2015 was primarily due to increased dividend payments of $103.3 million associated with an additional payment made in the 53-week fiscal year 2016 and the year-over-year increase of our dividend rate,2022. These were partially offset by a decrease in cash used for the purchase of property and equipment in fiscal 2023 compared to fiscal 2022.stock of $38.2 millionshares under ourthe share repurchase authorization.plan and lower cash dividend payments in fiscal 2023 compared to fiscal 2022. Fiscal 2023 included four dividend payments compared to five dividend payments in fiscal 2022 due to the timing of dividend dates and our fiscal period end dates.Our declared dividendOperating Leasesincreased from $0.48 per sharelease arrangements for the four calendar quarters beginning in June 2014 to $0.51 per sharecertain real estate properties, vehicles, and equipment. Leased properties are typically used for the twelve calendar quarters beginning in June 2015.Contractual Obligationsoffice space, distribution, and Commercial Commitments2017, operating leases comprise2023, the substanceCompany had fixed lease payment obligations of the Company’s commercial commitments$163.3 million, with long-term scheduled payments, as summarized below:$34.7 million payable within 12 months. Payments due by period Contractual Obligations Total Less than 1 year 1-3 years 3-5 years More than 5 years Operating Leases $ 82,210 $ 17,572 $ 25,777 $ 17,255 $ 21,606 is party to certain other commitments, which include purchases ofobtains various raw materials advertisingand components for its products from a variety of third party suppliers. The Company’s inventory purchase obligations are primarily noncancelable. As of December 30, 2023, the Company had inventory purchase obligations of $666.0 million, with $512.0 million payable within 12 months.The aggregate amount of purchase orders and other commitments open asAs of December 30, 2017 was approximately $313.4 million. We cannot determine2023, the aggregate amountCompany had other purchase obligations of such purchase orders that represent contractual obligations because purchase orders may represent authorizations to purchase rather than binding agreements. Our purchase orders are based on our current needs and are typically fulfilled$361.3 million, with $209.8 million payable within short periods12 months.time.CashWe may be required to make significantNet cash outlays related to unrecognizedfor income taxes exceeded income tax benefits. However,expense in each of the 2023 and 2022 fiscal years, partially due to the uncertaintyprovisions of the timing2017 United States Tax Cuts and Jobs Act, which require us to capitalize certain research and development costs and amortize those costs on our U.S. tax returns over a period of futurefive or fifteen years, depending on where the associated costs were incurred. Primarily as a result of these provisions, we expect net cash flowsoutlays for income taxes to again exceed income tax expense in fiscal 2024.unrecognizedplanned utilization of Switzerland deferred tax benefits, we are unable to make reasonably reliable estimates of the period of cash settlement, if any, with the respective taxing authorities. Accordingly, unrecognized tax benefits of $130.8 million as of December 30, 2017, have been excluded from the contractual obligations table above. For further information related to unrecognized tax benefits, see Note 2, “Income Taxes,” to the consolidated financial statements included in this Report.assets.54Off-Balance Sheet ArrangementsWe do not have any off-balance sheet arrangements.and the purchase of raw materials. Product pricingmaterials, and raw materials costs are both significantly influenced by semiconductor market conditions. Historically, during cyclical industry downturns, we have been ablethe cost of shipping and handling. We strive to offset pricing declines for ourcertain products through a combination of improved product mix and success in obtaining price reductions in raw materials costs.costs and the introduction of new products.We do not believe that inflationOur business has had a material effect on our business, financial condition or results of operations.at times been impacted by increasing costs. If our costs were to become subject to significant inflationary pressures, we may not be able to fully offset such higher costs through price increases. Our inability or failure to do so could adversely affect our business, financial condition and results of operations.foreign currency gains and lossesimpacts to our financial results due to the strengthening and weakening of the U.S. dollar.Dollar. The potential of volatile foreign exchange rate fluctuations in the future could have a significant effect on our results of operations. The Company has not historically hedged its foreign currency exchange rate risks.risks with financial instruments.createhave historically created a majority of the Company’s exchange rate exposure are the Taiwan Dollar, Euro, and British Pound Sterling.Polish Zloty. Garmin Corporation, headquartered in Xizhi, Taiwan, uses the local currency as the functional currency. The Company translates all assets and liabilities at year-end exchange rates and income and expense accounts at average rates prevailing during the year. In order to minimize the effect of the currency exchange fluctuations on our net assets, we have elected to retain most of our Taiwan subsidiary’s cash and investments in marketable securities denominated in U.S. Dollars. remains, is the U.S. Dollar, and asalthough some transactions occurredoccur in British PoundsPound Sterling or Euros, foreignEuros. The functional currency of Garmin Wroclaw, a subsidiary headquartered in Poland that manufactures certain auto OEM products, is the Polish Zloty. Foreign currency gains or losses have been realized historically related to the movements of those currencies relative to the U.S. Dollar. The Company believes that gains and losses will become more material in the future as our European presence grows.2017,2023, the Company incurred a net foreign currency lossgain of $22.6 million, primarily due to the weakening of the$26.4 million. The U.S. Dollar weakened against the Taiwan Dollar,Polish Zloty and Euro, partially offset by the U.S. Dollar weakeningstrengthening against the Euro and the British Pound Sterling.Taiwan Dollar. During fiscal 2017,2023, the U.S. Dollar weakened 9.4%12.3% against the Polish Zloty, and 3.1% against the Euro, resulting in gains of $24.4 million and $8.8 million, respectively, partially offset by the U.S. Dollar strengthening at times during the year against the Taiwan Dollar, resulting in a net loss of $55.9 million, while the U.S. Dollar weakened 14.1% against the Euro and 9.5% against the British Pound Sterling, resulting in gains of $27.2 million and $3.1 million, respectively.$5.1 million. The remaining net currency gainloss of $3.0$1.7 million iswas related to the impacts of other currencies, and timingeach of transactions.which was individually immaterial. These and other currency moves during fiscal year 20172023 also resulted in a currency translation adjustment of $88.3$14.5 million within accumulated other comprehensive income.income (loss).5520172023 and December 31, 2016,2022, hypothetical and reasonably possible adverse changes of 10% for the Taiwan Dollar, Euro, Polish Zloty, Japanese Yen, and British Pound SterlingAustralian Dollar would have resulted in an adverse impact on income before income taxes of approximately $96$102 million and $92$81 million, at December 30, 2017 and December 31, 2016.respectively.2017. We, therefore,2023 and otherwise have no meaningful debt-related interest rate risk.thoseour available-for-sale debt securities will fluctuate accordingly.targetsare to preserve capital, maintain an acceptable degree of liquidity, and maximize yield within the constraint of low risk investments with the objective of minimizing the potential risk of principal loss.credit risk. The Company does not intend to sell securities in an unrealized loss position and it is not more likely than not that the Company will be required to sell such investments before recovery of their amortized costs bases, which may be maturity. During 2017As of December 30, 2023 and 2016,December 31, 2022, the Company didhad not recordrecognized an allowance for credit losses on any material impairment charges on its outstanding securities.securities in an unrealized loss position.20172023 and December 31, 2016,2022, the hypothetical and reasonably possible 100 basis point increases in interest rates across all securities would have resulted in declines in portfolio fair market value of approximately $42$25 million and $45$31 million at December 30, 20172023 and December 30, 2016,31, 2022, respectively. Such losses would only be realized if the Company sold the investments prior to maturity.562017,2023, December 31, 2016,2022, and December 26, 201525, 202157StockholdersShareholders and the Board of Directors of Garmin Ltd. and Subsidiaries20172023 and December 31, 2016, and2022, the related consolidated statements of income, comprehensive income, stockholders’ equity and cash flows for each of the three years in the period ended December 30, 20172023, and the related notes and financial statement schedule listed in the Index at Item 15(a) (collectively referred to as the “financial“consolidated financial statements”). In our opinion, the consolidated financial statements present fairly, in all material respects, the consolidated financial position of the Company at December 30, 20172023 and December 31, 2016,2022, and the consolidated results of its operations and its cash flows for each of the three years in the period ended December 30, 2017,2023, in conformity with U.S. generally accepted accounting principles.2017,2023, based on criteria established in Internal Control-Integrated Framework issued by the Committee of Sponsoring Organizations of the Treadway Commission (2013 framework) and our report dated February 21, 2018,2024, expressed an unqualified opinion thereon.201858Consolidated Balance Sheets(In thousands, except per share information) December 30, December 31, 2017 2016 Assets Current assets: Cash and cash equivalents $ 891,488 $ 846,883 Marketable securities(Note 3) 161,687 266,952 Accounts receivable, less allowance for doubtful accounts of $4,168 in 2017 and $14,669 in 2016 590,882 527,062 Inventories, net 517,644 484,821 Deferred costs 48,312 47,395 Prepaid expenses and other current assets 153,912 89,903 Total current assets 2,363,925 2,263,016 Property and equipment, net Land and improvements 114,701 104,740 Building and improvements 482,794 376,916 Office furniture and equipment 246,107 222,439 Manufacturing equipment 156,119 129,526 Engineering equipment 141,321 124,979 Vehicles 21,115 21,259 1,162,157 979,859 Accumulated depreciation (566,473 ) (496,981 ) 595,684 482,878 Restricted cash(Note 4) 271 113 Marketable securities(Note 3) 1,260,033 1,213,285 Deferred income taxes(Note 6) 199,343 110,293 Noncurrent deferred costs 73,851 56,151 Intangible assets, net 409,801 305,002 Other assets 107,352 94,395 Total assets $ 5,010,260 $ 4,525,133 Liabilities and Stockholders' Equity Current liabilities: Accounts payable $ 169,640 $ 172,404 Salaries and benefits payable 102,802 88,818 Accrued warranty costs 36,827 37,233 Accrued sales program costs 93,250 80,953 Deferred revenue 139,681 146,564 Accrued royalty costs 32,204 36,523 Accrued advertising expense 30,987 37,440 Other accrued expenses 93,652 70,469 Income taxes payable 33,638 16,163 Dividend payable 95,975 96,168 Total current liabilities 828,656 782,735 Deferred income taxes(Note 6) 75,215 61,220 Noncurrent income taxes 138,295 121,174 Noncurrent deferred revenue 163,840 140,407 Other liabilities 1,788 1,594 Stockholders' equity: Shares, CHF 0.10 par value, 198,077 shares authorized and issued, 188,189 shares outstanding at December 30, 2017; and 188,565 shares outstanding at December 31, 2016;(Notes 9, 10, and 11): 17,979 17,979 Additional paid-in capital 1,828,386 1,836,047 Treasury stock (468,818 ) (455,964 ) Retained earnings 2,368,874 2,056,702 Accumulated other comprehensive income (loss) 56,045 (36,761 ) Total stockholders' equity 3,802,466 3,418,003 Total liabilities and stockholders' equity $ 5,010,260 $ 4,525,133
$5,098 in 2022
191,777 and 191,623 shares outstanding)
operating activities:59
Shares
Paid-In
Capital
Shares
Earnings
Other
Comprehensive
Income (Loss)Andand Subsidiaries of Income(In thousands, except per share information) Fiscal Year Ended December 30, December 31, December 26, 2017 2016 2015 Net sales $ 3,087,004 $ 3,018,665 $ 2,820,270 Cost of goods sold 1,303,840 1,339,095 1,281,566 Gross profit 1,783,164 1,679,570 1,538,704 Advertising expense 164,693 177,143 167,166 Selling, general and administrative expenses 437,977 410,558 394,914 Research and development expense 511,634 467,960 427,043 1,114,304 1,055,661 989,123 Operating income 668,860 623,909 549,581 Other income (expense): Interest income 36,925 33,406 29,653 Foreign currency losses (22,579 ) (31,651 ) (23,465 ) Other (912 ) 4,006 11,418 13,434 5,761 17,606 Income before income taxes 682,294 629,670 567,187 Income tax provision (benefit):(Note 6) Current 79,234 117,842 114,222 Deferred (91,895 ) 1,014 (3,262 ) (12,661 ) 118,856 110,960 Net income $ 694,955 $ 510,814 $ 456,227 Basic net income per share(Note 10) $ 3.70 $ 2.71 $ 2.39 Diluted net income per share(Note 10) $ 3.68 $ 2.70 $ 2.39 See accompanying notes.60Consolidated Statements of Comprehensive Income(In thousands) Fiscal Year Ended December 30, December 31, December 26, 2017 2016 2015 Net income $ 694,955 $ 510,814 $ 456,227 Foreign currency translation adjustment 88,320 4,696 (34,981 ) Change in fair value of available-for-sale marketable securities, net of deferred taxes 4,486 (11,029 ) 1,982 Comprehensive income $ 787,761 $ 504,481 $ 423,228 See accompanying notes.61Consolidated Statements of Stockholders' Equity(In thousands) Accumulated Additional Other Common Paid-In Treasury Retained Comprehensive Stock Capital Stock Earnings Income (Loss) Total Balance at December 27, 2014 $ 1,797,435 $ 73,521 $ (330,132 ) $ 1,859,972 $ 2,571 $ 3,403,367 Net income – – – 456,227 – 456,227 Translation adjustment – – – – (34,981 ) (34,981 ) Adjustment related to unrealized gains (losses) on available-for-sale securities net of income tax effects of $115 – – – – 1,982 1,982 Comprehensive income 423,228 Dividends declared – (100 ) – (385,682 ) – (385,782 ) Tax benefit from issuance of equity awards – (2,050 ) – – – (2,050 ) Issuance of treasury stock related to equity awards – (35,422 ) 52,494 – – 17,072 Stock compensation – 26,290 – – 26,290 Purchase of treasury stock related to equity awards – – (5,586 ) – – (5,586 ) Purchase of treasury stock under share repurchase plan – – (131,413 ) – – (131,413 ) Balance at December 26, 2015 $ 1,797,435 $ 62,239 $ (414,637 ) $ 1,930,517 $ (30,428 ) $ 3,345,126 Net income – – – 510,814 – 510,814 Translation adjustment – – – – 4,696 4,696 Adjustment related to unrealized gains (losses) on available-for-sale securities net of income tax effects of $1,094 – – – – (11,029 ) (11,029 ) Comprehensive income 504,481 Dividends declared – - – (384,629 ) – (384,629 ) Tax benefit from issuance of equity awards – (6,309 ) – – – (6,309 ) Issuance of treasury stock related to equity awards – (40,589 ) 59,237 – – 18,648 Stock compensation – 41,250 – – – 41,250 Purchase of treasury stock related to equity awards – – (7,331 ) – – (7,331 ) Purchase of treasury stock under share repurchase plan – – (93,233 ) – – (93,233 ) Reduction in par value of Common Stock (1,779,456 ) 1,779,456 – – – – Balance at December 31, 2016 $ 17,979 $ 1,836,047 $ (455,964 ) $ 2,056,702 $ (36,761 ) $ 3,418,003 Net income – – – 694,955 – 694,955 Translation adjustment – – – – 88,320 88,320 Adjustment related to unrealized gains (losses) on available-for-sale securities net of income tax effects of $493 – – – – 4,486 4,486 Comprehensive income 787,761 Dividends declared – – – (382,783 ) – (382,783 ) Issuance of treasury stock related to equity awards – (52,581 ) 74,442 – – 21,861 Stock compensation – 44,735 – – – 44,735 Purchase of treasury stock related to equity awards – 185 (12,773 ) – – (12,588 ) Purchase of treasury stock under share repurchase plan – – (74,523 ) – – (74,523 ) Balance at December 30, 2017 $ 17,979 $ 1,828,386 $ (468,818 ) $ 2,368,874 $ 56,045 $ 3,802,466 See accompanying notes.62Consolidated Statements of Cash Flows(In thousands) Fiscal Year Ended December 30, December 31, December 26, 2017 2016 2015 Operating Activities: Net income $ 694,955 $ 510,814 $ 456,227 Adjustments to reconcile net income to net cash provided by operating activities: Depreciation 59,895 55,796 51,311 Amortization 26,357 30,544 27,049 Gain on sale of property and equipment (230 ) (503 ) (198 ) Provision for doubtful accounts 1,021 4,136 (2,521 ) Provision for obsolete and slow-moving inventories 31,071 26,458 23,257 Unrealized foreign currency losses 21,036 13,387 37,931 Deferred income taxes (90,725 ) 1,699 5,897 Stock compensation 44,735 41,250 26,290 Realized losses (gains) on marketable securities 991 (822 ) (55 ) Changes in operating assets and liabilities, net of acquisitions: Accounts receivable (40,088 ) 9,000 22,473 Inventories (38,575 ) (2,455 ) (121,718 ) Other current and non-current assets (21,608 ) 2,234 (107,360 ) Accounts payable (17,240 ) (11,496 ) 36,079 Other current and non-current liabilities 5,627 44,766 20,742 Deferred revenue 15,329 (6,363 ) (43,338 ) Deferred costs (18,266 ) (15,780 ) (585 ) Income taxes payable (13,443 ) 3,017 (151,014 ) Net cash provided by operating activities 660,842 705,682 280,467 Investing activities: Purchases of property and equipment (139,696 ) (90,960 ) (80,592 ) Proceeds from sale of property and equipment 361 676 7,921 Purchase of intangible assets (12,232 ) (5,715 ) (3,889 ) Purchase of marketable securities (587,656 ) (905,089 ) (915,921 ) Redemption of marketable securities 635,311 957,350 919,141 Acquisitions, net of cash acquired (90,471 ) (77,945 ) (38,687 ) Change in restricted cash (153 ) 146 48 Net cash used in investing activities (194,536 ) (121,537 ) (111,979 ) Financing activities: Dividends (382,976 ) (481,452 ) (378,117 ) Tax benefit from issuance of equity awards - 1,692 (2,049 ) Proceeds from issuance of treasury stock related to equity awards 21,860 18,648 17,073 Purchase of treasury stock related to equity awards (12,773 ) (7,331 ) (5,586 ) Purchase of treasury stock under share repurchase plan (74,523 ) (93,233 ) (131,413 ) Net cash used in financing activities (448,412 ) (561,676 ) (500,092 ) Effect of exchange rate changes on cash and cash equivalents 26,711 (8,656 ) (31,594 ) Net increase (decrease) in cash and cash equivalents 44,605 13,813 (363,198 ) Cash and cash equivalents at beginning of year 846,883 833,070 1,196,268 Cash and cash equivalents at end of year $ 891,488 $ 846,883 $ 833,070 See accompanying notes.63Garmin Ltd. And SubsidiariesConsolidated Statements of Cash Flows (continued)(In thousands) Fiscal Year Ended December 30, December 31, December 26, 2017 2016 2015 Supplemental disclosures of cash flow information Cash paid during the year for income taxes $ 106,146 $ 115,548 $ 252,885 Cash received during the year from income tax refunds $ 3,806 $ 4,275 $ 3,793 Supplemental disclosure of non-cash investing and financing activities Increase in accrued capital expenditures related to purchases of property and equipment $ 13,864 $ 2,154 $ - Change in marketable securities related to unrealized appreciation (depreciation) $ 4,979 $ (12,123 ) $ 1,867 Fair value of assets acquired $ 128,190 $ 91,620 $ 38,687 Liabilities assumed (29,587 ) (6,344 ) - Less: cash acquired (8,132 ) (7,331 ) - Cash paid for acquisitions, net of cash acquired $ 90,471 $ 77,945 $ 38,687 See accompanying notes.64NOTES TO CONSOLIDATED FINANCIAL STATEMENTS20172023 and December 31, 201620221. Description of the Business(together,(collectively, the “Company”)Company or Garmin) design, develop, manufacture, market, and distribute a diverse family of hand-held, wrist-based, portable, and fixed-mount Global Positioning System (GPS)-enabled products and other navigation, communications, information and sensor-based products.products and services. Garmin Corporation (GC) is primarily responsible for the manufacturing and distribution of the Company’s products to the Company’s subsidiaries and, to a lesser extent, new product development and sales and marketing of the Company’s products in Asia and the Far East. Garmin International, Inc. (GII) is primarily responsible for sales and marketing of the Company’s products in the Americas region and for most of the Company’s research and new product development. GII also manufactures most of the Company’s products in the aviation segment. Garmin (Europe) Ltd. (GEL) is primarily responsible for sales and marketing of the Company’s products in Europe, the Middle East and Africa (EMEA). Many of GEL’s sales are to other Company-owned distributors in the EMEA region.2. Summary of Significant Accounting PoliciesBasis of Presentation and Principles of ConsolidationAll significant inter-companyIntercompany balances and transactions have been eliminated.AtCertain prior period amounts have been recast, reclassified, or presented to conform to current period presentation.Annual General Meetingoperating segments, which also represent its reportable segments, are fitness, outdoor, aviation, marine, and auto OEM. Results for the 53-week and 52-week periods ended December 31, 2022 and December 25, 2021, respectively, have been recast to conform to current period presentation. This change had no effect on June 10, 2016, the Company’s shareholders approved the cancellationconsolidated results of 10,000,000 registered shares of the Company held by the Company (the “Formation Shares”) and the reduction in par value of each share of the Company from CHF 10 to CHF 0.10 and the amendment of the Company’s Articles of Association to effect a corresponding share capital reduction.operations.and there is slightly more than one additional day per year (not including the effects of leap year) in each calendar year as compared to a 52-week fiscal year, the Company will have a fiscal year comprising 53 weeks in certain fiscal years, as determined by when the last Saturday of the calendar year occurs.years 2017 and 2015 includedyear 2023 contains 52 weeks while fiscal 2016 includedcompared to 53 weeks.weeks for 2022 and 52 weeks for 2021.65the Foreign Currency Matters topic of the Financial Accounting Standards Board (FASB) Accounting Standards Codification (ASC) Topic 830, Foreign Currency Matters, the financial statements of these subsidiaries for all periods presented have been translated into USD, the functional currency of Garmin Ltd., and the reporting currency herein, for purposes of consolidation at rates prevailing during the year for sales, costs, and expenses and at end-of-year rates for all assets and liabilities. The effect of this translation is recorded in a separate component of stockholders’ equity. Cumulative currency translation adjustments of $78,909$(11,508) and ($9,411)$(25,981) as of December 30, 20172023 and December 31, 2016,2022, respectively, have been included in accumulated other comprehensive income (loss) in the accompanying consolidated balance sheets.The movements of the Taiwan Dollar and Euro/British Pound Sterling typically have offsetting impacts on operating income when the currencies move congruently against the U.S. Dollar due to the use of the Taiwan Dollar for manufacturing costs while the Euro and British Pound Sterling transactions relate primarily to revenue.ForeignNet foreign currency gains recorded in results of operations were $26,434 for the year ended December 30, 2023, net foreign currency losses recorded in results of operations were $22,579, $31,651,$11,274 for the year ended December 31, 2022, and $23,465net foreign currency losses recorded in results of operations were $45,263 for the year ended December 25, 2021. The gain in fiscal 2023 was primarily due to the U.S. Dollar weakening against the Polish Zloty and Euro, partially offset by the U.S. Dollar strengthening against the Taiwan Dollar. The loss in fiscal 2022 was primarily due to the U.S. Dollar strengthening against the Australian Dollar, Polish Zloty, Chinese Yuan, Euro, Japanese Yen, and British Pound Sterling, partially offset by the U.S. Dollar strengthening against the Taiwan Dollar. The loss in fiscal 2021 was primarily due to the U.S. Dollar strengthening against the Euro, Polish Zloty, Japanese Yen, Swiss Franc, and Australian Dollar, while the U.S. Dollar weakened against the Taiwan Dollar.2017,2023, December 31, 2016,2022, and December 26, 2015,25, 2021, respectively.lossCompany’s capitalized software development costs are not significant, as the time elapsed from working model to release is typically short. As required by ASC Topic 730, Research and Development, costs incurred to enhance the Company's existing products or after the general release of the service using the product are expensed in fiscal 2017 was due primarilythe period they are incurred and included in research and development costs in the accompanying consolidated statements of income.the USD weakening against the Taiwan Dollar, which was partially offset by the USD weakening against the Euroemployees and British Pound Sterling. The loss in fiscal 2016 was due primarily to the USD weakening against the Taiwan Dollardirectors, including employee stock options and the USD strengthening against the Euro and British Pound Sterling. The loss in fiscal 2015 was due primarily to the USD strengthening against the Euro and British Pound Sterling, which was partially offset by the USD strengthening against the Taiwan Dollar.Earnings Per ShareBasic earnings per share amounts are computedrestricted stock, based on estimated fair values.weighted-average numberfair value of common shares outstanding. For purposesshare-based payment awards on the date of diluted earnings per share, the number of shares that would be issued from the exercise of dilutive share-based compensation awards has been reduced by the number of shares which could have been purchased from the proceedsgrant using an option-pricing model. The value of the exercise or release at the average market priceportion of the Company’saward that is ultimately expected to vest is recognized as stock duringcompensation expense over the requisite service period the awards were outstanding. See Note 10.Cash and Cash EquivalentsFor purposes of reporting cash flows, cash and cash equivalents include cash on hand, operating accounts, money market funds, and securities with maturities of three months or less when purchased. The carrying amount of cash and cash equivalents approximates fair value, given the short maturity of those instruments.Trade Accounts ReceivableThe Company sells its products to retailers, wholesalers, and other customers and extends credit based on its evaluation of the customer’s financial condition. Potential losses on receivables are dependent on each individual customer’s financial condition. The Company carries its trade accounts receivable at net realizable value. Typically, its accounts receivable are collected within 80 days and do not bear interest. The Company monitors its exposure to losses on receivables and maintains allowances for potential losses or adjustments. The Company determines these allowances by (1) evaluating the aging of its receivables and (2) reviewing its high-risk customers. Past due receivable balances are written off when internal collection efforts have been unsuccessful in collecting the amount due. The Company maintains trade credit insurance to provide security against large losses.66Concentration of Credit RiskThe Company grants credit to certain customers who meet the Company’s pre-established credit requirements. Generally, the Company does not require security when trade credit is granted to customers. Credit losses are provided for in the Company’s consolidated financial statements and typicallyof income.withinreduced for estimated forfeitures. Accounting guidance requires forfeitures to be estimated at the time of grant and revised, if necessary, in subsequent periods if actual forfeitures differ from those estimates. Forfeitures were estimated based on historical experience and management’s expectations. Certain customersestimates.allowed extended terms consistent with normal industry practice. Most of these extended terms can berecognized in the income tax provision and are not estimated in the effective tax rate. Rather, they are recorded as discrete tax items in the period they occur. Excess income tax benefits from stock compensation arrangements are classified as either relatinga cash flow from operations.seasonal sales variations or to the timing of new product releases by the Company.Consolidated Financial Statements.The Company’s top ten customers have contributed between 22% and 24% of net sales since 2015. NoneA majority of the Company’s customers accounted for more than or equal to 10% of consolidated net salesresearch and development is performed in the years ended December 30, 2017, December 31, 2016,United States. Research and December 26, 2015.InventoriesInventoriesdevelopment costs, which are stated at the lower of cost or market with cost being determined on a first-in, first-out (FIFO) basis. The Company writes down its inventory for estimated obsolescence or unmarketable inventory equaltypically expensed as incurred, amounted to the difference between the cost of inventoryapproximately $904,696, $834,927, and the estimated net realizable value based upon assumptions about future demand and market conditions. If actual market conditions are less favorable than those projected by management, additional inventory write-downs may be required. Inventories consisted of the following: December 30, 2017 December 31, 2016(1) Raw materials $ 179,659 $ 152,497 Work-in-process 75,754 61,048 Finished goods 262,231 271,276 Inventory $ 517,644 $ 484,821 (1)Inventory balances by major class of inventory as of December 31, 2016 have been recast to conform to the current year presentation.Property and EquipmentProperty and equipment are recorded at cost and depreciated using the straight-line method over the following estimated useful lives:Buildings and improvements39-50Office furniture and equipment3-5Manufacturing and engineering equipment5-10Vehicles5Long-Lived AssetsAs required by theProperty, Plant and Equipment topic of the FASB ASC, the Company reviews long-lived assets for impairment whenever events or changes in circumstances indicate the carrying amount of an asset may not be fully recoverable. The carrying amount of a long-lived asset is not recoverable if it exceeds the sum of the undiscounted cash flows expected to result from the use and eventual disposition of the asset. That assessment is based on the carrying amount of the asset at the date it is tested for recoverability. An impairment loss is measured as the amount by which the carrying amount of a long-lived asset exceeds its fair value.67TheIntangibles – Goodwill and Other topic of the FASB ASC (ASC Topic 350) requires that goodwill and intangible assets with indefinite useful lives should not be amortized but rather be tested for impairment at least annually or sooner whenever events or changes in circumstances indicate that they may be impaired. The Company performs its annual goodwill and intangible asset impairment tests in the fourth quarter of each year. ASC Topic 350 allows management to first perform a qualitative assessment (“step zero”) by assessing the qualitative factors of relevant events and circumstances at the reporting unit level to determine if it is necessary to perform the quantitative goodwill impairment test (“step one”). If factors indicate that it is more likely than not that the fair value of the reporting unit is less than the carrying amount, then the step one assessment will be performed. If the fair value of the reporting unit is less than the carrying amount in step one then goodwill impairment will be recognized and the charge is determined through the “step two” analysis.Each of the Company’s operating segments (auto PND, auto OEM, aviation, marine, outdoor, and fitness) represents a distinct reporting unit. The auto PND market has declined in recent years as competing technologies have emerged and market saturation has occurred. This has resulted in periods of lower revenues and profits for the Company’s auto PND reporting unit. Considering these qualitative factors, management performed a step one quantitative goodwill impairment assessment of the auto PND reporting unit in the fourth quarter of 2017. Management determined that the fair value of the reporting unit was substantially in excess of its carrying amount, and a step two analysis was therefore not performed. However, considering the uncertainty of future operating results and/or market conditions deteriorating faster or more drastically than the forecasts utilized in management’s estimation of fair value, management believes some or all of the approximately $80 million of goodwill associated with the Company’s auto PND reporting unit is at risk of future impairment. Management concluded that no other reporting units are currently at risk of impairment.The Company did not recognize any material goodwill or intangible asset impairment charges in 2017, 2016, or 2015.Accounting guidance also requires that intangible assets with finite lives be amortized over their estimated useful lives and reviewed for impairment. The Company is currently amortizing its acquired intangible assets with finite lives over periods ranging from three to ten years.DividendsUnder Swiss corporate law, dividends must be approved by shareholders at the general meeting of the Company’s shareholders.On June 9, 2017, the shareholders approved a dividend of $2.04 per share (of which, $1.53 was paid in the Company’s 2017 fiscal year) payable in four equal installments on dates determined by the Board of Directors. The dates determined by the Board were as follows:Dividend Date Record Date $s per share June 30, 2017 June 19, 2017 $ 0.51 September 29, 2017 September 15, 2017 $ 0.51 December 29, 2017 December 15, 2017 $ 0.51 March 30, 2018 March 15, 2018 $ 0.51 The Company paid dividends in 2017 in the amount of $382,976. Both the dividends paid and the remaining dividend payable were reported as a reduction of retained earnings.On June 10, 2016, the shareholders approved a dividend of $2.04 per share (of which, $1.53 was paid in the Company’s 2016 fiscal year) payable in four equal installments on dates determined by the Board of Directors. The dates determined by the Board were as follows:68Dividend Date Record Date $s per share June 30, 2016 June 16, 2016 $ 0.51 September 30, 2016 September 15, 2016 $ 0.51 December 30, 2016 December 14, 2016 $ 0.51 March 31, 2017 March 15, 2017 $ 0.51 The Company paid dividends in 2016 in the amount of $481,452. Both the dividends paid and the remaining dividend payable were reported as a reduction of retained earnings.On June 5, 2015, the shareholders approved a dividend of $2.04 per share (of which, $1.02 was paid in the Company's 2015 fiscal year) payable in four equal installments on dates determined by the Board of Directors. The dates determined by the Board were as follows:Dividend Date Record Date $s per share June 30, 2015 June 16, 2015 $ 0.51 September 30, 2015 September 15, 2015 $ 0.51 December 31, 2015 December 15, 2015 $ 0.51 March 31, 2016 March 16, 2016 $ 0.51 The Company paid dividends in 2015 in the amount of $378,117. Both the dividends paid and the remaining dividend payable were reported as a reduction of retained earnings.As of December 30, 2017 and December 31, 2016, approximately $304,674 of retained earnings was indefinitely restricted from distribution to stockholders pursuant to the laws of Taiwan.Intangible AssetsAt December 30, 2017, and December 31, 2016, the Company had patents, customer related intangibles and other identifiable finite-lived intangible assets recorded at a cost of $316,705 and $253,473, respectively. Identifiable, finite-lived intangible assets are amortized over their estimated useful lives on a straight-line basis over three to ten years. Accumulated amortization was $193,886 and $173,023 at December 30, 2017, and December 31, 2016, respectively. Amortization expense on these intangible assets was $20,863, $14,319, and $7,115$778,750 for the years ended December 30, 2017,2023, December 31, 2016,2022, and December 26, 2015,25, 2021, respectively. Innext five years,customer has provided a contractual guarantee for reimbursement of such costs. Contractually reimbursable costs are capitalized as incurred in the amortization expenseconsolidated balance sheets within prepaid expenses and other current assets if reimbursement is estimatedexpected to be $18,796, $16,293, $14,167, $10,463,received within one year, or within other noncurrent assets if expected to be received beyond one year. Such capitalized costs were approximately $19,226 and $8,111, respectively.The Company’s excess purchase cost over fair value$23,510 as of net assets acquired (goodwill) was $286,982 at December 30, 2017, and $224,553 at December 31, 2016. December 30,
2017 December 31,
2016 Goodwill balance at beginning of year $ 224,553 $ 187,791 Acquisitions 58,332 38,061 Finalization of purchase price allocations and effect of foreign currency translation 4,097 (1,299 ) Goodwill balance at end of year $ 286,982 $ 224,553 69Marketable SecuritiesManagement determines the appropriate classification of marketable securities at the time of purchase and reevaluates such designation as of each balance sheet date.All of the Company’s marketable securities were considered available-for-sale at December 30, 2017. Available-for-sale securities are stated at fair value, with the unrealized gains and losses, net of tax, reported in other comprehensive income (loss). At December 30, 20172023 and December 31, 2016, cumulative unrealized net losses of $22,864 and $27,350, respectively, were reported in accumulated other comprehensive income, net of related taxes.2022, respectively.Investments are reviewed periodically to determine if they have suffered an impairment of value that is considered other than temporary. If investments are determined to be impaired, a loss is recognized at the date of determination.Testing for impairment of investments requires significant management judgment. The identification of potentially impaired investments, the determination of their fair value and the assessment of whether any decline in value is other than temporary are the key judgment elements. The discovery of new information and the passage of time can significantly change these judgments. Revisions of impairment judgments are made when new information becomes known, and any resulting impairment adjustments are made at that time. The economic environment and volatility of securities markets increase the difficulty of determining fair value and assessing investment impairment.The amortized cost of debt securities classified as available-for-sale is adjusted for amortization of premiums and accretion of discounts to maturity, or in the case of mortgage-backed securities, over the estimated life of the security. Such amortization is included in interest income from investments. Realized gains and losses, and credit declines in value judged to be other-than-temporary are included in other income. The cost of securities sold is based on the specific identification method.Investments are discussed in detail in Note 3 of the Notes to Consolidated Financial Statements.the FASB ASC Topic 740, topicIncome Taxes. The liability method provides that deferred tax assets and liabilities are recorded based on the difference between the tax bases of assets and liabilities and their carrying amount for financial reporting purposes as measured based on the enacted tax rates and laws that will be in effect when the differences are expected to reverse. The Company records a valuation allowance to reduce deferred tax assets to the amount that is believed more likely than not to be realized.the FASB ASC 740 topicIncome Taxes.Topic 740. The Company recognizes liabilities based on ourits estimate of whether, and the extent to which, additional taxes will be due. If payment of these amounts ultimately proves not to be required, the reversal of the liabilities would resultresults in tax benefits being recognized in the period when the Company determines the liabilities are no longer necessary. If the Company’s estimate of tax liabilities proves to be less than the ultimate assessment, a further charge to expense would result.65 of the Notes to Consolidated Financial Statements.Revenue RecognitionThe Company recognizes revenue when persuasive evidenceBasic earnings per share amounts are computed based on the weighted-average number of an arrangement exists, deliverycommon shares outstanding. For purposes of diluted earnings per share, the number of shares that would be issued from the exercise of dilutive share-based compensation awards has occurred,been reduced by the salesnumber of shares that could have been purchased from the proceeds of the exercise or release at the average market price is fixed or determinable, and collection is probable. For the large majority of the Company’s sales, these criteria are met once product has shippedshares during the period the awards were outstanding. See Note 3 of the Notes to Consolidated Financial Statements.titleRestricted Cashriskcash equivalents include cash on hand, operating accounts, money market funds, deposits readily convertible to known amounts of loss have transferredcash, and securities with maturities of three months or less when purchased. The carrying amount of cash and cash equivalents approximates fair value, given the short maturity of those instruments. Restricted cash is reported within other noncurrent assets on the consolidated balance sheets. See Note 7 of the Notes to Consolidated Financial Statements for additional information on restricted cash.customer. The Company recognizes revenue from the sale of hardware productstotal cash, cash equivalents, and software bundled with hardware that is essential to the functionality of the hardware in accordance with general revenue recognition accounting guidance. The Company recognizes revenue in accordance with industry specific software accounting guidance for standalone sales of software products and sales of software bundled with hardware not essential to the functionality of the hardware. The Company generally does not offer specified or unspecified upgrade rights to its customers in connection with software sales.70For multiple-element arrangements that include tangible products that contain software essential to the tangible product’s functionality and undelivered software elements that relate to the tangible product’s essential software, the Company allocates revenue to all deliverables based on their relative selling prices. In such circumstances, the accounting principles establish a hierarchy to determine the selling price to be used for allocating revenue to deliverables as follows: (i) vendor-specific objective evidence of fair value (VSOE), (ii) third-party evidence of selling price (TPE), and (iii) best estimate of the selling price (ESP). VSOE generally exists only when the Company sells the deliverable separately, on more than a limited basis, at prices within a relatively narrow range. In addition to the products listed below, the Company has offered certain other products including mobile applications, in-dash navigation solutions, incremental navigation and/or communication service subscriptions, aviation subscriptions and extended warranties that involve multiple-element arrangements that are individually immaterial.The Company offers PNDs with lifetime map updates (LMUs) bundledrestricted cash shown in the original purchase price. LMUs enable customers to downloadconsolidated statements of cash flows.latest map and pointappropriate classification of interest information for the useful life of their PND. In addition, the Company offers PNDs with traffic service bundled in the original purchase price. The Company has identified multiple deliverables contained in arrangements involving the sale of PNDs which include the LMU and/or traffic service. The first deliverable is the hardware along with the software essential to the functionality of the hardware device deliveredmarketable securities at the time of sale. purchase and reevaluates such designation as of each balance sheet date.remaining deliverablesCompany recognizes impairments relating to credit losses of available-for-sale securities through an allowance for credit losses and other income (expense) on the Company’s consolidated statements of income. Impairment not relating to credit losses is recorded in accumulated other comprehensive income (loss) on the Company’s consolidated balance sheets.LMU and/or traffic service.judgmental elements. The Company has allocated revenue betweendiscovery of new information and the passage of time can change these deliverables usingjudgments. Revisions of impairment judgments are made when new information becomes known, and any resulting impairment adjustments are made at that time. The economic environment and volatility of securities markets increase the relative selling price method. Amounts allocateddifficulty of assessing investment impairment.delivered hardwaresecurity, failure of the issuer to make scheduled payments, and other relevant factors affecting the related essential software are recognized atsecurity. If it is determined that a credit loss exists, the timeamount of sale provided the other conditionscredit loss is determined by comparing the present value of the expected future cash flows for revenue recognition have been met. the security to the amortized cost basis of the security, limited by the amount the fair value is less than the amortized cost basis.revenue and associatedamortized cost of royalties allocateddebt securities classified as available-for-sale is adjusted for amortization of premiums and accretion of discounts to maturity, or in the LMU and/or the traffic service are deferred and recognized on a straight-line basiscase of mortgage-backed securities, over the estimated life of the products.security. Such amortization and realized gains/losses are recorded within interest income and other income (expense), respectively, on the Company’s consolidated statements of income. The cost of securities sold is based on the specific identification method.
Amount
Value
Amount
Valuehas determined sufficient VSOE does not exist for LMU or traffic,sells its products to retailers, dealers, distributors, OEMs, and that third party evidence of selling price is not available as stand-aloneother customers and unbundled unit sales do not occur on more than a limited basis. Therefore, the Company uses the royalty cost plus a normal margin as the primary indicator to calculate relative selling prices of the LMU and traffic elements.For multiple-element software arrangements that do not include a tangible product, the Company allocates revenue to the various elements based on VSOE. When VSOE cannot be established for undelivered elements, all revenue is deferred until the earlier point at which all elements of the arrangement are delivered or sufficient VSOE does exist, unless the only undelivered element is post-contract customer support. If the only undelivered element is post-contract customer support, the entire arrangement consideration is recognized ratably over the support period. The Company offers navigation software licensesgrants credit to certain customers bundledbased on its evaluation of the customers' financial condition. Generally, the Company does not require security when trade credit is granted to customers. The Company's trade accounts receivable are carried at net realizable value, typically are collected within 90 days, and do not bear interest. Certain customers are allowed extended terms consistent with map updates to benormal industry practice. Credit losses are provided periodically overfor in the support period.Company’s consolidated financial statements and typically have been within management’s expectations. Past due receivable balances are typically written off when internal collection efforts have been unsuccessful in collecting the amount due. The Company hasmaintains trade credit insurance to provide some security against certain losses within policy limits.sufficient VSOE of similar map updates does not exist for certain arrangements, and therefore revenue from these transactions is recognized ratably over the contractual map update period.records revenuewrites down its inventory for estimated obsolescence or unmarketable inventory equal to the difference between the cost of inventory and the estimated net of sales tax, trade discountsrealizable value based upon assumptions about future demand and customer returns. The Company records estimated reductions to revenue for customer sales programs, returns and incentive offerings including rebates, price protection (product discounts offered to retailers to assist in clearing older products from their inventories in advance of new product releases), promotions and other volume-based incentives. The reductions to revenue are based on estimates and judgments using historical experience and expectation of futuremarket conditions. Changes in these estimates could negatively affect the Company’s operating results. These incentives are reviewed periodically and, with the exceptions of price protection and certain other promotions, accrued for on a percentage of sales basis. If actual market conditions were to decline,are less favorable than those projected by management, additional inventory write-downs may be required. Inventories consisted of the Company may take actions to increase customer incentive offerings, possibly resulting in an incremental reduction of revenue at the time the incentive is offered.following:7120172023 and December 31, 2016,2022, the Company had deferred revenues totaling $303,521$137,337 and $286,971,$126,794, respectively, and related deferred costs totaling $122,162$27,373 and $103,546,$24,693, respectively.The deferred revenues and costseconomicuseful lives typically one to five years, on a straight-line basis.basis typically over three to twelve years. Accumulated amortization was $366,560 and $333,256 at December 30, 2023 and December 31, 2022, respectively. Amortization expense on these intangible assets was $30,513, $30,561, and $35,540 for the years ended December 30, 2023, December 31, 2022, and December 25, 2021, respectively. In the next five years, the gross margin recognition of deferred revenue and cost for the currently deferred amountsamortization expense is estimated to be $91,370, $48,627, $25,340, $11,208,$30,839, $27,629, $24,425, $20,578, and $4,814,$15,496, respectively. The Company also reviews finite-lived intangible assets for impairment in accordance with ASC Topic 360, as described above, whenever events or changes in circumstances indicate the carrying amount of an asset or asset group may not be fully recoverable.ShippingThe Company leases certain real estate properties, vehicles, and Handling CostsShippingequipment in various countries around the world. Leased properties are typically used for office space, distribution, and handlingretail. The Company’s leases are classified as operating leases with remaining terms of 1 to 30 years, some of which include an option to extend or renew. If the exercise of an option to extend or renew is determined to be reasonably certain, the associated right-of-use asset and lease liability reflects the extended period and payments. For newly signed leases, the right-of-use asset and lease liability is recognized on lease commencement date. Variable lease costs, such as adjustments to payments based on consumer price indices, are included in cost of goods soldexcluded in the accompanyingrecognition of right-of-use assets and lease liabilities. For all real estate leases, any non-lease components, including common area maintenance, have been separated from lease components and excluded from the associated right-of-use asset and lease liability calculations. For all equipment and vehicle leases, an accounting policy election has been made to not separate lease and non-lease components.financial statements.balance sheets as a right-of-use asset or lease liability.providesaccrues for estimated future warranty costs at the time of sale.products are sold. The Company’s standard warranty obligation to retail partners generally provides for a right of return of any product for a full refund in the event that such product is not merchantable, is damaged, or defective. The Company’s historical experience is that these types of warranty obligations are generally fulfilled within 5 months from time of sale.defective. The Company’s standard warranty obligation to its end-users provides for a period of one to two years from date of shipment while certain aviation, marine, and auto OEM products have a warranty period of two years or more from the date of installation. installation.The Company’s estimateestimates of costs to service its warranty obligations are based on historical experience and management’s expectations and judgments of future conditions, and are recorded aswith most claims resolved within a liability onyear of the balance sheet.sale. To the extent the Company experiences increased warranty claim activity or increased costs associated with servicing those claims, its warranty accrual will increase, resultingwhich may result in decreased gross profit. The following reconciliation provides an illustrationpresents details of the changes in the aggregateCompany’s accrued warranty accrual:costs: Fiscal Year Ended December 30, December 31, December 26, 2017 2016 2015 Balance - beginning of period $ 37,233 $ 30,449 $ 27,609 Accrual for products sold(1) 56,360 61,578 44,620 Expenditures (56,766 ) (54,794 ) (41,780 ) Balance - end of period $ 36,827 $ 37,233 $ 30,449 (1)Changes in cost estimates related to pre-existing warranties are(1)Changes in cost estimates related to pre-existing warranties were not material and aggregated with accruals for new warranty contracts in the ‘accrual for products sold’ line.72Sales ProgramsThe Company provides certain monthly and quarterly incentives for its dealers and distributors based on various factors including dealer purchasing volume and growth. Additionally, from time to time, the Company provides rebates to end users on certain products. Estimated rebates and incentives payable to dealers and distributors are regularly reviewed and recorded as accrued expenses on a monthly basis. In addition, the Company provides dealers and distributors with product discounts to assist these customers in clearing older products from their inventories in advance of new product releases. Each discount is tied to a specific product and can be applied to all customers who have purchased the product, or a special discount may be agreed to on an individual customer basis. These rebates, incentives, and discounts are recorded as reductions to net sales in the accompanying consolidated statements of income in the period the Company has sold the product.‘accrual for products sold’ line.Advertising CostsThe Company expenses advertising costs as incurred. Advertising expense amounted to approximately $164,693, $177,143, and $167,166 for the years ended December 30, 2017, December 31, 2016, and December 26, 2015, respectively.Research and DevelopmentA majority of the Company’s research and development is performed in the United States. Research and development costs, which are expensed as incurred, amounted to approximately $511,634, $467,960, and $427,043 for the years ended December 30, 2017, December 31, 2016, and December 26, 2015, respectively.Customer Service and Technical SupportCustomer service and technical support costs are included as selling, general and administrative expenses in the accompanying consolidated statements of income. Customer service and technical support costs include costs associated with performing order processing, answering customer inquiries by telephone and through websites, e-mail and other electronic means, and providing free technical support assistance to customers. The technical support is typically provided within one year after the associated revenue is recognized. The related cost of providing this free support is not material.Software Development CostsThe FASB ASC topic entitledSoftware requires companies to expense software development costs as they incur them until technological feasibility has been established, at which time those costs are capitalized until the product is available for general release to customers. Capitalized software development costs are not significant as the time elapsed from working model to release is typically short. As required by the Research and Development topic of the FASB ASC, costs incurred to enhance our existing products or after the general release of the service using the product are expensed in the period they are incurred and included in research and development costs in the accompanying consolidated statements of income.73Accounting for Stock-Based CompensationThe Company currently sponsors four stock-based employee compensation plans. The FASB ASC topic entitledCompensation – Stock Compensation requires the measurement and recognition of compensation expenses for all share-based payment awards made to employees and directors, including employee stock options and restricted stock, based on estimated fair values.Accounting guidance requires companies to estimate the fair value of share-based payment awards on the date of grant using an option-pricing model. The value of the portion of the award that is ultimately expected to vest is recognized as stock-based compensation expense over the requisite service period in the Company’s consolidated financial statements.As stock-based compensation expenses recognized in the accompanying consolidated statements of income are based on awards ultimately expected to vest, they have been reduced for estimated forfeitures. Accounting guidance requires forfeitures to be estimated at the time of grant and revised, if necessary, in subsequent periods if actual forfeitures differ from those estimates. Forfeitures were estimated based on historical experience and management’s estimates.In March 2016, the Financial Accounting Standards Board (“FASB”) issued Accounting Standards Update No. 2016-09, Compensation—Stock Compensation (Topic 718): Improvements to Employee Share-Based Payment Accounting (“ASU 2016-09”), which is intended to simplify the accounting for share-based payment awards. The Company adopted ASU 2016-09 on a prospective basis during the quarter ended April 1, 2017. ASU 2016-09 requires excess tax benefits or deficiencies from stock-based compensation to be recognized in the income tax provision. We previously recorded these amounts to additional paid-in capital. Additionally, under ASU 2016-09, excess tax benefits and deficiencies are not estimated in the effective tax rate, rather, are recorded as discrete tax items in the period they occur. Excess income tax benefits from stock-based compensation arrangements are classified as a cash flow from operations under ASU 2016-09, rather than as a cash flow from financing activities. The most significant impact of ASU 2016-09 during the fiscal year ending December 30, 2017 was the recognition of income tax expense of $22,620 resulting from stock options and stock appreciation rights expiring unexercised in the second and fourth quarters.Stock compensation plans are discussed in detail in Note 9 of the Notes to Consolidated Financial Statements.Recently Issued Accounting PronouncementsRevenue from Contracts with CustomersIn May 2014, the FASB issued Accounting Standards Update (“ASU”) No. 2014-09, Revenue from Contracts with Customers (Topic 606) (“ASU 2014-09”), which supersedes previous revenue recognition guidance. The FASB has issued several standards amending or relating to ASU 2014-09 (collectively, the “new revenue standard”). The effective date of ASU 2014-09 is for fiscal years, and interim periods within those years, beginning on or after December 15, 2017. The Company has adopted the new revenue standard in the first quarter of the Company’s fiscal year ending December 29, 2018 using the full retrospective method, which will require the Company to restate each prior reporting period presented in future financial statement issuances.The Company has evaluated Topic 606, and has assessed existing and historical contracts to identify possible differences in the timing of revenue recognition under the new revenue standard. During this evaluation, both senior management and the Audit Committee have been updated as to progress and findings on a frequent basis. Based on our evaluation of the new revenue standard, our recognition will be consistent with our historical accounting policies except for certain arrangements within the Company’s auto segment.74A portion of the Company’s auto segment contracts have historically been accounted for under Accounting Standards Codification Topic 985-605 Software-Revenue Recognition (Topic 985-605). Under Topic 985-605, the Company deferred revenue and associated costs of all elements of multiple-element software arrangements if vendor-specific objective evidence of fair value (VSOE) could not be established for an undelivered element (e.g. map updates). In applying the new revenue standard to certain contracts that include both software licenses and map updates, we will recognize the portion of revenue and costs related to the software license at the time of delivery rather than ratably over the map update period.Additionally, for certain multiple-element arrangements within the Company’s auto segment, the Company’s policy has been to allocate consideration to traffic services and recognize the revenue and associated cost of royalties ratably over the estimated life of the underlying product. Under the new revenue standard, we will recognize revenue and associated costs of royalties related to certain traffic services at the time of hardware and/or software delivery. Specifically, the new revenue standard emphasize the timing of the Company’s performance, and upon delivery of the navigation device and/or software, the Company has performed its obligation with respect to the design and production of the product to receive and interpret the broadcast traffic signal for the benefit of the end user.The changes in accounting policy described above collectively result in reductions to deferred costs (asset) and deferred revenue (liability) balances, and accelerate the recognition of revenues and deferred costs in the auto segment going forward. Summarized financial information depicting the impact of the new revenue standard follows: 52-Weeks Ended December 30, 2017 53-Weeks Ended December 31, 2016 As reported Restated(1) Impact As reported Restated(1) Impact Net sales $ 3,087,004 $ 3,121,560 $ 34,556 $ 3,018,665 $ 3,045,796 $ 27,131 Gross profit 1,783,164 1,797,941 14,777 1,679,570 1,688,525 8,955 Operating income 668,860 683,637 14,777 623,909 632,864 8,955 Income tax (benefit) provision (12,661 ) (7,902 ) 4,759 118,856 122,890 4,034 Net income $ 694,955 $ 704,973 $ 10,018 $ 510,814 $ 515,735 $ 4,921 Diluted net income per share $ 3.68 $ 3.74 $ 0.06 $ 2.70 $ 2.72 $ 0.02 December 30, 2017 December 31, 2016 As reported Restated(1) Impact As reported Restated(1) Impact Current assets: Deferred costs $ 48,312 $ 30,525 $ (17,787 ) $ 47,395 $ 34,665 $ (12,730 ) Total current assets 2,363,925 2,346,139 (17,786 ) 2,263,016 2,250,286 (12,731 ) Noncurrent deferred income tax 199,343 189,959 (9,384 ) 110,293 105,668 (4,625 ) Noncurrent deferred costs 73,851 33,029 (40,822 ) 56,151 30,934 (25,217 ) Total assets $ 5,010,260 $ 4,942,268 $ (67,991 ) $ 4,525,133 $ 4,482,560 $ (42,573 ) Current liabilities: Deferred revenue 139,681 103,140 (36,542 ) 146,564 118,496 (28,068 ) Total current liabilities 828,656 792,115 (36,541 ) 782,735 754,667 (28,068 ) Deferred income taxes 75,215 76,612 1,396 61,220 62,617 1,397 Non-current deferred revenue 163,840 87,061 (76,779 ) 140,407 91,238 (49,169 ) Retained earnings 2,368,874 2,412,423 43,549 2,056,702 2,090,233 33,531 Accumulated other comprehensive income 56,045 56,428 382 (36,761 ) (37,024 ) (263 ) Total stockholders' equity 3,802,466 3,846,397 43,931 3,418,003 3,451,271 33,268 Total liabilities and stockholders' equity $ 5,010,260 $ 4,942,267 $ (67,992 ) $ 4,525,133 $ 4,482,561 $ (42,572 ) (1) Effective for the fiscal year ending December 29, 2018, we have adopted ASC Topic 606. The balances above are restated under ASC Topic 606.The Company’s historical net cash flows provided by or used in operating, investing, and financing activities are not impacted by adoption of the new revenue standard.75Financial Instruments – Recognition, Measurement, Presentation, and DisclosureIn January 2016, the FASB issued Accounting Standards Update No. 2016-01, Financial Instruments—Overall (Subtopic 825-10): Recognition and Measurement of Financial Assets and Financial Liabilities (“ASU 2016-01”). The standard addresses certain aspects of recognition, measurement, presentation, and disclosure of financial instruments. ASU 2016-01 is effective for fiscal years, and interim periods within those years, beginning after December 15, 2017. The Company will adopt the new standard effective in the first quarter of fiscal year 2018, and it is not expected to have a material impact on the Company’s financial position or results of operations.LeasesIn February 2016, the FASB issued Accounting Standards Update No. 2016-02, Leases (Topic 842) (“ASU 2016-02”), which sets out the principles for the recognition, measurement, presentation and disclosure of leases for both lessees and lessors. ASU 2016-02 requires lessees to present a right-of-use asset and a corresponding lease liability on the balance sheet. Lessor accounting is substantially unchanged compared to the current accounting guidance. ASU 2016-02 is effective for fiscal years, and interim periods within those years, beginning after December 15, 2018. Early adoption is permitted. The Company is currently evaluating the impact of adopting the new standard on its consolidated financial statements.Statement of Cash FlowsIn August 2016, the FASB issued Accounting Standards Update No. 2016-15, Statement of Cash Flows (Topic 230): Classification of Certain Cash Receipts and Cash Payments (“ASU 2016-15”), which adds or clarifies guidance on the classification of certain cash receipts and payments in the statement of cash flows. The standard addresses eight specific cash flow issues with the objective of reducing diversity in practice. ASU 2016-15 is effective for fiscal years, and interim periods within those years, beginning after December 15, 2017. The Company will adopt the new standard effective in the first quarter of fiscal year 2018, and it is not expected to have a material impact on the Company’s financial position of results of operations.Income TaxesIn October 2016, the FASB issued Accounting Standards Update No. 2016-16, Income Taxes (Topic 740): Intra-Entity Transfers of Assets Other than Inventory (“ASU 2016-16”), which requires recognition of the income tax consequences of an intra-entity transfer of an asset other than inventory when the transfer occurs. ASU 2016-16 is effective for fiscal years, and interim periods within those years, beginning after December 15, 2017. The Company will adopt the new standard effective in the first quarter of fiscal year 2018, and it is not expected to have a material impact on the Company’s financial position or results of operations.Receivables – Nonrefundable Fees and Other CostsIn March 2017, the FASB issued Accounting Standards Update No. 2017-08, Receivables – Nonrefundable Fees and Other Costs (Topic 310-20): Premium Amortization on Purchased Callable Debt Securities (“ASU 2017-08”), which shortens the amortization period for certain callable debt securities held at a premium, requiring the premium to be amortized to the earliest call date. Callable debt securities held at a discount continue to be amortized to maturity. ASU 2017-08 is effective for fiscal years, and interim periods within those years, beginning after December 15, 2019. Early adoption is permitted. The Company is currently evaluating the impact of adopting the new standard on its consolidated financial statements.Income Statement – Reporting Comprehensive IncomeIn February 2018, the FASB issued Accounting Standards Update No. 2018-02, Income Statement – Reporting Comprehensive Income (Topic 220): Reclassification of Certain Tax Effects from Accumulated Other Comprehensive Income (“ASU 2018-02”), which allows for stranded tax effects in accumulated other comprehensive income resulting from the U.S. Tax Cuts and Jobs Act to be reclassified to retained earnings. ASU 2018-02 is effective for fiscal years, and interim periods within those years, beginning after December 15, 2018. Early adoption is permitted. The Company is currently evaluating the impact of adopting the new standard and expects to early adopt the new standard effective in the first quarter of fiscal year 2018. The Company does not expect the new standard to have a material impact on the Company’s financial position or results of operations.763. Marketable SecuritiesThe FASB ASC topic entitledFair Value Measurements and Disclosuresdefines fair value as the price that would be received to sell an asset or paid to transfer a liability in an orderly transaction between market participants at the measurement date (exit price). The accounting guidance classifies the inputs used to measure fair value into the following hierarchy:Level 1Unadjusted quoted prices in active markets for identical assets or liabilityLevel 2Observable inputs for the asset or liability, either directly or indirectly, such as quoted prices for similar assets or liabilities in active markets, quoted prices for identical or similar assets or liabilities in markets that are not active, or inputs other than quoted prices that are observable for the asset or liabilityLevel 3Unobservable inputs for the asset or liabilityThe Company endeavors to utilize the best available information in measuring fair value. Financial assets and liabilities are classified in their entirety based on the lowest level of input that is significant to the fair value measurement. Valuation is based on prices obtained from an independent pricing vendor using both market and income approaches. The primary inputs to the valuation include quoted prices for similar assets in active markets, quoted prices for identical or similar assets in markets that are not active, contractual cash flows, benchmark yields, and credit spreads.The method described above may produce a fair value calculation that may not be indicative of net realizable value or reflective of future fair values. Furthermore, while the Company believes its valuation methods are appropriate and consistent with other market participants, the use of different methodologies or assumptions to determine the fair value of certain financial instruments could result in a different fair value measurement at the reporting date.Available-for-sale securities measured at fair value on a recurring basis are summarized below: Fair Value Measurements as
of December 30, 2017 Total Level 1 Level 2 Level 3 U.S. Treasury securities $ 19,337 $ - $ 19,337 $ - Agency securities 43,361 - 43,361 - Mortgage-backed securities 174,615 - 174,615 - Corporate securities 816,793 - 816,793 - Municipal securities 186,105 - 186,105 - Other 181,509 - 181,509 - Total $ 1,421,720 $ - $ 1,421,720 $ - Fair Value Measurements as
of December 31, 2016 Total Level 1 Level 2 Level 3 U.S. Treasury securities $ 29,034 $ - $ 29,034 $ - Agency securities 59,541 - 59,541 - Mortgage-backed securities 230,823 - 230,823 - Corporate securities 893,725 - 893,725 - Municipal securities 176,168 - 176,168 - Other 90,946 - 90,946 - Total $ 1,480,237 $ - $ 1,480,237 $ - 77Marketable securities classified as available-for-sale securities are summarized below: Available-For-Sale Securities as
of December 30, 2017 Amortized Cost Gross Unrealized
Gains Gross Unrealized
Losses Fair Value U.S. Treasury securities $ 19,591 $ - $ (254 ) $ 19,337 Agency securities 44,191 1 (831 ) 43,361 Mortgage-backed securities 180,470 13 (5,868 ) 174,615 Corporate securities 830,447 136 (13,790 ) 816,793 Municipal securities 187,999 110 (2,004 ) 186,105 Other 183,730 2 (2,223 ) 181,509 Total $ 1,446,428 $ 262 $ (24,970 ) $ 1,421,720 Available-For-Sale Securities as
of December 31, 2016 Amortized Cost Gross Unrealized
Gains Gross Unrealized
Losses Fair Value U.S. Treasury securities $ 29,291 $ 31 $ (288 ) $ 29,034 Agency securities 60,513 19 (991 ) 59,541 Mortgage-backed securities 236,354 41 (5,572 ) 230,823 Corporate securities 914,028 252 (20,555 ) 893,725 Municipal securities 178,804 224 (2,859 ) 176,169 Other 90,934 20 (9 ) 90,945 Total $ 1,509,924 $ 587 $ (30,274 ) $ 1,480,237 The Company’s investment policy targets low risk investments with the objective of minimizing the potential risk of principal loss. The fair value of our securities varies from period to period due to changes in interest rates, in the performance of the underlying collateral and in the credit performance of the underlying issuer, among other factors. The Company does not intend to sell the securities that have an unrealized loss shown in the table above, and it is not more likely than not that the Company will be required to sell a security before recovery of its amortized cost basis, which may be maturity.The Company recognizes the credit component of other-than-temporary impairments of debt securities in "Other Income" and the noncredit component in "Other comprehensive income (loss)" for those securities that we do not intend to sell and for which it is not more likely than not that we will be required to sell before recovery. During 2017 and 2016, the Company did not record any material impairment charges on its outstanding securities.The amortized cost and fair value of the securities at an unrealized loss position at December 30, 2017 were $1,348,777 and $1,323,807 respectively. Approximately 80% of securities in our portfolio were at an unrealized loss position at December 30, 2017. We have the ability to hold these securities until maturity or their value is recovered. We do not consider these unrealized losses to be other than temporary credit losses because there has been no material deterioration in credit quality and no change in the cash flows of the underlying securities. We do not intend to sell the securities and it is not more likely than not that we will be required to sell the securities; therefore, no material impairment has been recorded in the accompanying condensed consolidated statement of income.The cost of securities sold is based on the specific identification method.78The following tables display additional information regarding gross unrealized losses and fair value by major security type for available-for-sale securities in an unrealized loss position as of December 30, 2017 and December 31, 2016. As of December 30, 2017 Less than 12 Consecutive Months 12 Consecutive Months or Longer Gross Unrealized
Losses Fair Value Gross Unrealized
Losses Fair Value U.S. Treasury securities $ (111 ) $ 12,966 $ (143 ) $ 6,371 Agency securities (168 ) 16,097 (663 ) 25,972 Mortgage-backed securities (503 ) 19,628 (5,365 ) 153,835 Corporate securities (4,562 ) 439,174 (9,228 ) 347,052 Municipal securities (1,027 ) 125,819 (977 ) 38,167 Other (2,219 ) 136,147 (4 ) 2,579 Total $ (8,590 ) $ 749,831 $ (16,380 ) $ 573,976 As of December 31, 2016 Less than 12 Consecutive Months 12 Consecutive Months or Longer Gross Unrealized
Losses Fair Value Gross Unrealized
Losses Fair Value U.S. Treasury securities $ (288 ) $ 24,260 $ - $ - Agency securities (991 ) 49,255 - - Mortgage-backed securities (3,702 ) 159,665 (1,870 ) 64,645 Corporate securities (18,856 ) 765,712 (1,699 ) 40,910 Municipal securities (2,762 ) 130,994 (97 ) 6,326 Other (3 ) 4,058 (6 ) 6,919 Total $ (26,602 ) $ 1,133,944 $ (3,672 ) $ 118,800 The amortized cost and fair value of marketable securities at December 30, 2017, by contractual maturity, are shown below. Expected maturities will differ from contractual maturities because the issuers of the securities may have the right to prepay obligations without prepayment penalties. Amortized Cost Fair Value Due in one year or less $ 162,045 $ 161,687 Due after one year through five years 1,108,172 1,089,840 Due after five years through ten years 160,967 155,354 Due after ten years 15,244 14,839 $ 1,446,428 $ 1,421,720 4. Commitments and ContingenciesCommitmentsRental expense related to office, equipment, warehouse space, and real estate amounted to $18,915, $19,657, and $18,104 for the years ended December 30, 2017, December 31, 2016, and December 26, 2015, respectively. The Company recognizes rental expense on a straight-line basis over the lease term.79Future minimum lease payments are as follows:Year Amount 2018 $ 17,572 2019 14,179 2020 11,598 2021 9,478 2022 7,777 Thereafter 21,606 Total $ 82,210 Certain cash balances, primarily of GEL and GC, are held as collateral by banks securing payment of local value-added tax requirements. The total amount of restricted cash balances were $271 and $113 at December 30, 2017 and December 31, 2016, respectively.The Company is party to certain commitments, which include purchases of raw materials, advertising expenditures, and other indirect purchases in connection with conducting our business. The aggregate amount of purchase orders and other commitments open as of December 30, 2017 was approximately $313,385. We cannot determine the aggregate amount of such purchase orders that represent contractual obligations because purchase orders may represent authorizations to purchase rather than binding agreements. Our purchase orders are based on our current needs and are fulfilled by our suppliers, contract manufacturers, and logistics providers within short periods of time.Contingencieswe disclosethe Company discloses the nature of the contingency and an estimate of the possible loss or range of loss or a statement that such an estimate cannot be made. The Company’s aggregate range of reasonably possible losses includes (1) matters where a liability has been accrued and there is a reasonably possible loss in excess of the amount accrued for that liability, and (2) matters where a loss is believed to be reasonably possible, but not probable, and a liability therefore has not been accrued. This aggregate range only represents the Company’s estimate of reasonably possible losses and does not represent the Company’s maximum loss exposure. The assessment regarding whether a loss is probable or reasonably possible, and whether the loss or a range of loss is estimable, often involves a series of complex judgments about future events. In assessing the probability of an outcome in a lawsuit, claim or assessment that could be unfavorable to the Company, we considerthe Company considers the following factors, among others: a)(a) the nature of the litigation, claim, or assessment; b)(b) the progress of the case; c)(c) the opinions or views of legal counsel and other advisers; d) our(d) the Company's experience in similar cases; e)(e) the experience of other entities in similar cases; and f)(f) how we intendthe Company intends to respond to the lawsuit, claim, or assessment. Costs incurred in defending lawsuits, claims or assessments are expensed as incurred.
Revenue (1)
Costs (2)
Revenue (1)
Costs (2)80
as of December 30, 2023
Gains
Losses
as of December 31, 2022
Gains
Losses2017.2023. The results of legal proceedings, investigations and claims, however, cannot be predicted with certainty. An adverse resolution of one or more of such matters in excess of management’s expectations could have a material adverse effect in the particular quarter or fiscal year in which a loss is recorded, but based on information currently known, the Company does not believe it is likely that losses from such matters would have a material adverse effect on the Company’s business or its consolidated financial position, results of operations or cash flows.On January 24, 2018, Garmin and Navico agreed on a global settlement of all pending litigation between them, pursuant to which it is expected that all related claims will be dismissed with prejudice or terminated, including those for which the Company had previously disclosed a reasonably possible loss. The settlement is not material to the Company’s financial condition or results of operations. The parties have agreed to keep the terms of the settlement confidential. The Company also settled or resolved certain otherlegal matters during the fiscal yearyears ended December 30, 20172023, December 31, 2022, and December 25, 2021 that did not individually or in the aggregate have a material impact on the Company’s business or its consolidated financial position, results of operations or cash flows.5. Employee Benefit PlansDividendsGII andUnder Swiss corporate law, dividends must be approved by shareholders at the Company’s other U.S.-based subsidiaries sponsor a defined contribution employee retirement plan under which their employees may contribute up to 50% of their annual compensation subject to Internal Revenue Code maximum limitations and to which the subsidiaries contribute a specified percentage of each participant’s annual compensation up to certain limits as defined in the retirement plan. Additionally, GEL has a defined contribution plan under which its employees may contribute up to 7.5% of their annual compensation. During the years ended December 30, 2017, December 31, 2016, and December 26, 2015, expense related to these and other defined contribution plans of $43,826, $40,844, and $37,489, respectively, was charged to operations.Certaingeneral meeting of the Company’s foreign subsidiaries participateshareholders. Approved dividends are subject to possible adjustment based on the total amount of the dividend in local defined benefit pension plans. ContributionsSwiss Francs as approved at the annual meeting, and are calculatedpayable in four equal installments on dates determined by formulas that consider final pensionable salaries. Neither obligations nor contributionsthe Board of Directors. A reduction of retained earnings and a corresponding liability are recorded at the time of shareholders' approval and are periodically adjusted based on the number of applicable shares outstanding.years endeddividend scheduled to be paid on March 29, 2024 was included in dividend payable on the Company’s consolidated balance sheets as of December 30, 2017,2023. Approximately $61,129 of retained earnings was indefinitely restricted from distribution to shareholders pursuant to the laws of Taiwan as of December 30, 2023 and December 31, 2016,2022.2015 were significant.2026.816. Income TaxesShare Capitalincome tax provision (benefit) consistsnominal par value per share of the following: Fiscal Year Ended December 30, December 31, December 26, 2017 2016 2015 Federal: Current $ 31,343 $ 66,627 $ 49,138 Deferred 50,936 5,343 4,216 $ 82,279 $ 71,970 $ 53,354 State: Current 4,203 8,809 9,354 Deferred 11,712 (3,823 ) (5,858 ) $ 15,915 $ 4,986 $ 3,496 Foreign: Current 43,688 42,406 55,730 Deferred (154,543 ) (506 ) (1,620 ) $ (110,855 ) $ 41,900 $ 54,110 Total $ (12,661 ) $ 118,856 $ 110,960 The income tax provision differs from the amount computed by applying the U.S. statutory federal income tax rateCHF 0.10 was slightly reduced to income before taxes. The sources and tax effects of the differences, includingUSD $0.10, the impact of establishing tax contingency accruals, arewhich is reflected in share capital, captioned as follows:common shares on the Company’s consolidated balance sheets. Total stockholders’ equity reported for the Company was not affected by this change. The Company's common shares had a par value of USD $0.10 and CHF 0.10 per share as of December 30, 2023 and December 31, 2022, respectively. Fiscal Year Ended December 30, December 31, December 26, 2017 2016 2015 Federal income tax expense at U.S. statutory rate $ 238,803 $ 220,385 $ 198,516 State income tax expense, net of federal tax effect 5,977 2,749 1,931 Foreign tax rate differential (102,316 ) (111,989 ) (100,010 ) Other foreign taxes less incentives and credits (4,646 ) (16,593 ) (8,592 ) Withholding Tax 14,632 17,447 16,969 Net Change in Uncertain Tax Positions 5,363 17,328 21,246 Federal Domestic Production Activities Deduction (3,895 ) (5,528 ) (4,589 ) Federal Research and Development Credit (10,851 ) (8,548 ) (8,573 ) Switzerland Corporate Tax Election (180,034 ) - - Share Based Compensation 19,916 - - Other, net 4,390 3,605 (5,938 ) Income tax expense $ (12,661 ) $ 118,856 $ 110,960 2017, the Company recorded an income tax benefit of $180,034 as a result of the Company’s February 2017 election to align certain Switzerland corporate tax positions with evolving international tax initiatives.2023:
translation adjustmentThe Company’s statutory federal income tax rate in Switzerland, the Company's place of incorporation since the Redomestication, effective June 27, 2010, is 7.83%. If the Company reconciled taxes at the Swiss holding company federal statutory tax rate to the reported income tax for 2017 as presented above, the amounts related to tax at the statutory rate would be approximately $186,000 lower, or $53,600, and the foreign tax rate differential would be adjusted by a similar amount to approximately $77,000. For 2016, the amounts related to tax at the statutory rate would be approximately $171,000 lower, or $49,000, and the foreign tax rate differential would be adjusted by a similar amount to approximately $55,000. For 2015, the amount related to tax at the statutory rate would be approximately $154,000 lower, or $44,000, and the foreign tax differential would be reduced by a similar amount to approximately $52,000. All other amounts would remain substantially unchanged.82The Company’s income before income taxes attributable to non-U.S. operations was $461,436, $453,729, and $403,242, for the years ended December 30, 2017, December 31, 2016, and December 26, 2015, respectively.Income taxes of $20,287, $22,139, and $21,085 at December 30, 2017, December 31, 2016, and December 26, 2015, respectively, have not been accrued by the Company for the unremitted earnings of several of its foreign subsidiaries because such earnings are intended to be reinvested in the subsidiaries indefinitely.Deferred income taxes reflect the net tax effects of temporary differences between the carrying amounts of assets and liabilities for financial reporting purposes and the amounts used for income tax purposes. Significant components of the Company’s deferred tax assets and liabilities are as follows: December 30, December 31, 2017 2016 Deferred tax assets: Product warranty accruals $ 2,202 $ 2,768 Allowance for doubtful accounts 5,129 10,100 Inventory reserves 6,920 8,953 Sales program allowances 910 1,397 Reserve for sales returns 816 2,196 Other accruals 10,722 13,548 Share based compensation 6,261 29,632 Tax credit carryforwards 8,413 5,012 Amortization 165,162 15,368 Deferred Revenue 4,690 32,487 Net operating losses of subsidiaries 8,799 5,403 Benefit related to uncertain tax positions 5,383 7,542 Other 3,677 4,005 Valuation allowance related to loss carryforward and tax credits (7,267 ) (4,622 ) $ 221,817 $ 133,789 Deferred tax liabilities: Depreciation 11,674 17,854 Prepaid Expenses 3,147 2,876 Book basis in excess of tax basis for acquired entities 17,364 3,865 Withholding tax 60,555 58,597 Other 4,950 1,523 97,690 84,715 Net deferred tax assets $ 124,127 $ 49,074 At December 30, 2017, the Company had $8,413 of tax credit carryover compared to $5,012 at December 31, 2016.At December 30, 2017, the Company had a deferred tax asset of $8,799 related to the future tax benefit on net operating loss (NOL) carryforwards of $70,419. Included in the NOL carryforwards is $43,210 that relates to Switzerland and expires in varying amounts between 2023 and 2024, $1,757 that relates to Finland and expires in varying amounts between 2025 and 2027, $10,610 that relates to the United States and various state jurisdictions and expires in varying amounts between 2022 and 2037, $5,234 that relates to the Netherlands and expires in 2026 and $9,608 that relates to various other jurisdictions and has no expiration date. The Company has recorded a valuation allowance for a portion of its deferred tax asset relating to various tax attributes that it does not believe are more likely than not to be realized. In the future, if the Company determines, based on existence of sufficient evidence, that it should realize more or less of its deferred tax assets, an adjustment to the valuation allowance will be made in the period such a determination is made.83On December 22, 2017, the Tax Cuts and Jobs Act was enacted into law in the United States. The new tax legislation contains several provisions that will impact the Company, including the reduction of the corporate income tax rate from 35% to 21%, acceleration of business asset expensing, and a reduction in the amount of executive pay that may qualify as a tax deduction, among others. The decrease in the corporate income tax rate will require the Company to remeasure its U.S. deferred tax assets and liabilities, as well as reassess the realizability of its deferred tax assets and liabilities. FASB ASC 740 requires the recognition of the effects of tax law changes in the period of enactment. However, due to the complexities of the new tax legislation, the SEC has issued SAB 118 which allows for the recognition of provisional amounts during a measurement period similar to the measurement period used when accounting for business combinations. The Company has recorded a provisional re-measurement of its deferred tax assets and liabilities, resulting in an immaterial impact on its 2017 income tax provision. The Company will continue to assess the impact of the new tax legislation, as well as any related future regulations and rules, and will record any additional impacts as identified during the measurement period, if necessary. The Company does not expect any such potential adjustments in the future periods will materially impact the Company’s financial condition or result of operations.The total amount of gross unrecognized tax benefits as of December 30, 2017 was $130,798. A reconciliation of the beginning and ending amount of gross unrecognized tax benefits for years ended December 30, 2017, December 31, 2016, and December 26, 2015 is as follows: December 30, December 31, December 26, 2017 2016 2015 Balance beginning of year $ 115,090 $ 97,904 $ 77,495 Additions based on tax positions related to prior years 8,564 489 89 Reductions based on tax positions related to prior years (983 ) (940 ) (1,671 ) Additions based on tax positions related to current period 26,295 28,859 29,019 Reductions related to settlements with tax authorities - (134 ) (364 ) Expiration of statute of limitations (18,168 ) (11,088 ) (6,664 ) Balance at end of year $ 130,798 $ 115,090 $ 97,904 Accounting guidance requires unrecognized tax benefits to be classified as noncurrent liabilities, except for the portion that is expected to be paid within one year of the balance sheet date. The entire balance of net unrecognized benefits of $127,306, $109,667 and $93,654 are required to be classified as noncurrent at December 30, 2017, December 31, 2016, and December 26, 2015, respectively. The net unrecognized tax benefits, if recognized, would reduce the effective tax rate. None of the unrecognized tax benefits are due to uncertainty in the timing of deductibility.Interest and penalties, if any, accrued on the unrecognized tax benefits are reflected in income tax expense. At December 30, 2017, December 31, 2016, and December 26, 2015, the Company had accrued approximately $5,605, $3,901, and $2,479, respectively, for interest. The interest component of the reserve increased income tax expense for the years ending December 30, 2017, December 31, 2016, and December 26, 2015, by $1,704, $1,422, and $320 respectively. The Company did not have significant amounts accrued for penalties for the years ending December 30, 2017, December 31, 2016, and December 26, 2015.The Company files income tax returns in Switzerland, U.S. federal jurisdiction, as well as various states, local, and foreign jurisdictions. In its major tax jurisdictions, Switzerland, Taiwan, United Kingdom, and U.S. federal and various states, the Company is no longer subject to income tax examinations by tax authorities, with few exceptions, for years prior to 2013, 2012, 2015, and 2014, respectively.84The Company recognized a reduction of income tax expense of $17,918, $11,151, and $6,971 in fiscal years ended December 30, 2017, December 31, 2016, and December 26, 2015, respectively, to reflect the expiration of statutes of limitations and releases due to audit settlement in various jurisdictions.The Company believes that it is reasonably possible that approximately $20,000 to $25,000 of its reserves for certain unrecognized tax benefits will decrease within the next 12 months as the result of the expiration of statutes of limitations. This potential decrease in unrecognized tax benefits would impact the Company’s effective tax rate within the next 12 months.7. Fair Value of Financial InstrumentsAs required by theFinancial Instruments topic of the FASB ASC, the following summarizes required information about the fair value of certain financial instruments for which it is currently practicable to estimate such value. None of the financial instruments are held or issued for trading purposes. The carrying amounts and fair values of the Company’s financial instruments are as follows: December 30, 2017 December 31, 2016 Carrying Fair Carrying Fair Amount Value Amount Value Cash and cash equivalents $ 891,488 $ 891,488 $ 846,883 $ 846,883 Restricted cash $ 271 $ 271 $ 113 $ 113 Marketable securities $ 1,421,720 $ 1,421,720 $ 1,480,237 $ 1,480,237 For certain of the Company’s financial instruments, including accounts receivable, loan receivable, accounts payable and other accrued liabilities, the carrying amounts approximate fair value due to their short maturities.8. Segment InformationThe Company has identified five reportable segments for external reporting purposes – auto, aviation, marine, outdoor and fitness. There are two operating segments (auto PND and auto OEM) that are not reported separately but aggregated within the auto reportable segment. Each operating segment is individually reviewed and evaluated by the Chief Operating Decision Maker (CODM), who allocates resources and assesses performance of each segment individually.All of the Company’s reportable segments offer products through the Company’s network of independent dealers and distributors as well as through OEMs. However, the nature of products and types of customers for the five reportable segments vary. The Company’s marine, auto, outdoor, and fitness segments include portable global positioning system (GPS) receivers and accessories sold primarily to retail outlets. These products are produced primarily by the Company’s subsidiary in Taiwan. The Company’s aviation products are portable and panel mount avionics for Visual Flight Rules and Instrument Flight Rules navigation and are sold primarily to aviation dealers and certain aircraft manufacturers.The Company’s Chief Executive Officer has been identified as the CODM. The CODM uses operating income as the measure of profit or loss to assess segment performance and allocate resources. Operating income represents net sales less costs of goods sold and operating expenses, including certain allocated general and administrative costs. The accounting policies of the reportable segments are the same as those described in the summary of significant accounting policies. There are no inter-segment sales or transfers.The Company’s reportable segments share many common resources, infrastructures and assets in the normal course of business. Thus, the Company does not report accounts receivable, inventories, property and equipment, intangible assets, or capital expenditures by segment to the CODM.85Revenues, gross profit, and operating income for each of the Company’s reportable segments are presented below. In 2016 the Company moved action camera related revenue and expenses from the outdoor segment to the auto segment, allowing for alignment and synergies with other camera-based efforts occurring within the auto segment. The overall impact of the move was immaterial. However, action camera related operating results for the 52-weeks ended December 26, 2015 has been recast to conform to the 2017 and 2016 presentation. Reportable Segments 52-Weeks Ended December 30, 2017 Outdoor Fitness Marine Auto Aviation Total Net sales $ 698,867 $ 762,194 $ 374,001 $ 750,583 $ 501,359 $ 3,087,004 Gross profit 448,410 422,636 212,592 327,921 371,605 1,783,164 Operating income 249,867 146,765 50,328 67,967 153,933 668,860 53-Weeks Ended December 31, 2016 Net sales $ 546,326 $ 818,486 $ 331,947 $ 882,558 $ 439,348 $ 3,018,665 Gross profit 340,504 437,205 183,709 388,747 329,405 1,679,570 Operating income 184,035 160,596 52,167 102,347 124,764 623,909 52-Weeks Ended December 26, 2015 Net sales $ 411,184 $ 661,599 $ 286,778 $ 1,062,091 $ 398,618 $ 2,820,270 Gross profit 254,878 366,139 158,493 464,480 294,714 1,538,704 Operating income 139,070 134,574 28,611 136,069 111,257 549,581 Net sales, long-lived assets (property and equipment), and net assets by geographic area are as shown below for the years ended December 30, 2017, December 31, 2016, and December 26, 2015. Note that APAC refers to the Asia Pacific region, and EMEA includes Europe, the Middle East and Africa. Americas APAC EMEA Total December 30, 2017 Net sales to external customers(1) $ 1,475,661 $ 436,188 $ 1,175,155 $ 3,087,004 Property and equipment, net 381,974 173,392 40,318 595,684 Net assets(2) 2,325,569 982,898 493,999 3,802,466 December 31, 2016 Net sales to external customers(1) $ 1,518,934 $ 386,549 $ 1,113,182 $ 3,018,665 Property and equipment, net 300,158 144,470 38,250 482,878 Net assets(2) 2,153,161 933,999 330,843 3,418,003 December 26, 2015 Net sales to external customers(1) $ 1,469,243 $ 337,888 $ 1,013,139 $ 2,820,270 Property and equipment, net 294,234 111,700 40,154 446,089 Net assets(2) 2,110,108 921,410 313,608 3,345,126 (1)The U.S. is the only country which constitutes greater than 10% of net sales to external customers.(2)Americas and APAC net assets are primarily held in the United States and Taiwan, respectively.869.10. Employee Stock Compensation and Savings PlansAccounting for Stock-BasedStock Compensationcompany’sCompany’s policy is to issue treasury shares for option/stock appreciation right (SAR) exercises, restricted stock unit (RSU) releases, and employee stock purchase plan (ESPP) purchases.stockholdersshareholders adopted an equity incentive plan for non-employee directors (the “2011 Directors Plan”) providing for grants of stock options, SARs, RSUs and/or performance shares, pursuant to which up to 122,592 shares were made available for issuance. In June 2023, the shareholders approved an increase to the number of shares authorized to 150,000. The term of each award cannot exceed ten years.years. Awards may vest overare subject to a minimum two-yearone-year vesting period. In 2017, 2016,2023, 2022, and 2015, 10,432, 12,984,2021, there were 6,004, 6,008, and 12,0084,180 RSUs were granted under this plan.plan, respectively. At December 30, 2023, approximately 33,400 shares were available for future issuance under the 2011 Directors Plan.plan,2005 Plan, making the total shares authorized under the plan 13,000,000.13,000,000. Option and SAR grants vest evenly over a period of five years or as otherwise determined by the Board of Directors or the Compensation Committee and generally expire ten years from the date of grant, if not exercised. RSUs granted prior to December 10, 2012 vestedvest evenly over a period of fivethree years while RSUs granted on and after that date vested or are vesting evenly over a period of three years.. In addition to time-based vesting requirements, the vesting of certain RSU grants is also contingent upon the Company’s achievement of certain financial performance goals. During 2017, 2016,2023, 2022, and 2015, 1,044,045, 1,228,427,2021, there were 1,047,934, 1,185,707, and 1,171,905866,614 RSUs were granted under the 2005 Plan. Plan, respectively. No stock options or SARs were granted under the 2005 Plan in 2017, 2016, and 2015.2023, 2022, or 2021. At December 30, 2023, approximately 1,171,977 shares were available for future issuance under the 2005 Plan.RSUsrestricted shares and/or performance shares to employees of the Company and its subsidiaries, pursuant to which up to 7,000,000 common shares were made available for issuance. The stock options and SARs vest evenly over a period of five years or as otherwise determined by the Board of Directors or the Compensation Committee and generally expire ten years from the date of grant, if notnot exercised. The Company did not grant any stock awards from the 2000 Plan in 2017, 2016,2023, 2022, or 2015.2000 Non-employee Directors’ Option PlanAlso in October 2000,2021. In February 2023, the stockholders adopted a stock option plan for non-employee directors (the “2000Board of Directors Plan”) providing for grants of options for up to 100,000 common shares. In 2009,approved the stockholders approved an additional 150,000 shares to the plan, making the total shares authorized under the plan 250,000. The term of each award is ten years. All awards vest evenly over a three-year period. Following the June 2011 approvaltermination of the 2011 Directors2000 Plan, the Company will no longer issue options to purchase shares under this plan.which was effective immediately.87Stock-BasedStock Compensation Activitystock-basedstock compensation activity and related information under the 2011 Directors Plan, the 2005 Plan, the 2000 Plan and the 2000 Directors Plan for the years ended December 30, 2017,2023, December 31, 2016,2022, and December 26, 201525, 2021 is provided below: Stock Options and SARs Weighted-Average Exercise Price Number of Shares (In Thousands) Outstanding at December 27, 2014 $ 63.19 4,731 Granted - Exercised $ 29.15 (474 ) Forfeited/Expired $ 70.58 (196 ) Outstanding at December 26, 2015 $ 66.80 4,061 Granted - Exercised $ 50.77 (716 ) Forfeited/Expired $ 51.12 (608 ) Outstanding at December 31, 2016 $ 74.48 2,737 Granted - Exercised $ 50.15 (397 ) Forfeited/Expired $ 84.57 (1,948 ) Outstanding at December 30, 2017 $ 48.94 392 Exercisable at December 30, 2017 $ 48.76 365 Expected to vest after December 30, 2017 $ 51.46 27 Stock Options and SARs as of December 30, 2017 Exercise Awards Remaining Awards Price Outstanding Life (Years) Exercisable (In Thousands) (In Thousands) $18.00 - $40.00 21 1.98 21 $40.01 - $60.00 369 2.39 343 $60.01 - $80.00 - - - $80.01 - $100.00 2 0.01 2 $100.01 - $120.00 - - - $120.01 - $140.00 - - - 392 2.36 366
Exercise Price88
Grant Date Fair
Value Restricted Stock Units Weighted-Average Grant Date Fair Value Number of Shares (In Thousands) Outstanding at December 27, 2014 $ 42.55 1,088 Granted $ 37.07 1,184 Released/Vested $ 40.18 (562 ) Cancelled $ 42.02 (53 ) Outstanding at December 26, 2015 $ 39.45 1,657 Granted $ 40.59 1,241 Released/Vested $ 38.96 (565 ) Cancelled $ 44.57 (509 ) Outstanding at December 31, 2016 $ 38.94 1,824 Granted $ 51.71 1,055 Released/Vested $ 39.31 (763 ) Cancelled $ 40.40 (54 ) Outstanding at December 30, 2017 $ 45.30 2,062 The weighted-average remaining contract life for stock options and SARs outstanding and exercisable at December 30, 2017 was 2.36 and 2.05 years, respectively. The weighted-average remaining contract life of restricted stock units at December 30, 20172023 was 1.29 1.36 years.2017, 2016,2023, 2022, and 20152021, was $30,280, $22,429,$77,626, $82,734, and $23,351, respectively. The aggregate intrinsic values of options and SARs outstanding and exercisable at December 30, 2017 were $4,209 and $3,994,$70,796, respectively. The aggregate intrinsic values of options and SARs exercised during 2017, 2016,2023, 2022, and 20152021 were $3,742, $1,632,$0, $0, and $3,714,$1,040, respectively. The aggregate intrinsic value of RSUs outstanding at December 30, 20172023 was $122,885.$216,667. The aggregate intrinsic values of RSUs released during 2017, 2016,2023, 2022, and 20152021 were $45,424, $27,386,$96,301, $74,278, and $20,787,$118,825, respectively. Aggregate intrinsic value of options and SARs represents the applicable number of awards multiplied by the positive difference between the exercise price and the Company’s closing stockshare price on the last trading day of the relevant fiscal period. Aggregate intrinsic value of RSUs represents the applicable number of awards multiplied by the Company’s closing stockshare price on the last trading day of the relevant fiscal period. The Company’s closing stockshare price was $59.57$128.54 on December 30, 2017.2023 (based on the closing share price on December 29, 2023). As of December 30, 2017,2023, there was $65,166$133,648 of total unrecognized compensation cost related to unvested share-basedstock-based compensation awards granted to employees under the stock compensation plans. That cost is expected to be recognized over the weighted average remaining vesting period.6,000,00010,000,000 common shares of common stock have been reserved for the ESPP, including 2,000,000 shares approved by shareholders in June 2015.ESPP. Shares will beare offered to employees at a price equal to the lesser of 85%85% of the fair market value of the stockCompany's shares on the date of purchase or 85%85% of the fair market value on the first day of the ESPP period. The ESPP is intended to qualify as an “employee stock purchase plan” under Section 423 of the Internal Revenue Code. During 2017, 2016,2023, 2022, and 2015, 489,267, 541,018, 488,7532021, there were 524,774, 687,370, and 385,211 shares respectively, were purchased under the plan for a total purchase price of $20,996, $18,157,$43,905, $62,154, and $16,789,$34,936, respectively. During 2017, 2016,2023, 2022, and 2015,2021, the purchases were issued from treasury shares. At December 30, 2017,2023, approximately 970,3662,262,760 shares were available for future issuance.issuance under the ESPP.8910. Earnings Per ShareThe following table sets forth the computation of basicNet sales, property and dilutedequipment, and net income per share: Fiscal Year Ended December 30, December 31, December 26, 2017 2016 2015 Numerator: Numerator for basic and diluted net income per share - net income $ 694,955 $ 510,814 $ 456,227 Denominator: Denominator for basic net income per share – weighted-average common shares 187,828 188,818 190,631 Effect of dilutive securities – employee stock options and stock appreciation rights 904 525 476 Denominator for diluted net income per share – adjusted weighted-average common shares 188,732 189,343 191,107 Basic net income per share $ 3.70 $ 2.71 $ 2.39 Diluted net income per share $ 3.68 $ 2.70 $ 2.39 There were 1,175,728, 3,547,738, and 4,086,983 outstanding stock options, stock appreciation rights and restricted stock units (collectively “equity awards”) excluded from the computation of diluted earnings per shareassets by geographic area are as shown below for the fiscal years of 2017, 2016, and 2015, respectively, because the effect would have been anti-dilutive.11. Share Repurchase PlanOn February 13, 2015, the Board of Directors approved a share repurchase program authorizing the Company to purchase up to $300,000 of its common shares through December 31, 2016. In December 2016, the Board of Directors authorized an extension through December 31, 2017 to purchase remaining common shares. Under the plan, the Company repurchased 1,474,092 shares using cash of $74,523 in fiscal 2017, 2,152,716 shares using cash of $93,233 in fiscal 2016, and 3,148,901 shares using cash of $131,413 in fiscal 2015.9012. Accumulated Other Comprehensive IncomeThe following provides required disclosure of changes in accumulated other comprehensive income (AOCI) balances by component for the year ended December 30, 2017:2023, December 31, 2022, and December 25, 2021. Note that APAC includes Asia Pacific and Australian Continent, and EMEA includes Europe, the Middle East and Africa. Foreign Currency
Translation
Adjustment Net unrealized gains
(losses) on available-
for-sale securities Total Balance - beginning of period $ (9,411 ) $ (27,350 ) $ (36,761 ) Other comprehensive income before reclassification 88,320 3,585 91,905 Amounts reclassified from accumulated other comprehensive income - 901 901 Net current-period other comprehensive income 88,320 4,486 92,806 Balance - end of period $ 78,909 $ (22,864 ) $ 56,045 following provides required disclosureUnited States is the only country which constitutes greater than 10% of reporting reclassifications out of AOCI for the year ended December 30, 2017:net sales to external customers.Details about Accumulated Other Comprehensive
Income Components Amount Reclassified from
Accumulated Other
Comprehensive Income Affected Line Item in the Statement
Where Net Income is Presented Unrealized gains (losses) on available-for-sale securities $ (991 ) Other income (expense) 90 Income tax provision $ (901 ) Net of tax 13. Selected Quarterly Information (Unaudited) 52-Weeks Ended December 30, 2017 Quarter Ending April 1 July 1 September 30 December 30 Net sales $ 638,546 $ 816,885 $ 743,077 $ 888,496 Gross profit 372,123 477,858 433,665 499,518 Net income 237,812 170,950 147,413 138,780 Basic net income per share $ 1.26 $ 0.91 $ 0.79 $ 0.74 Diluted net income per share $ 1.26 $ 0.91 $ 0.78 $ 0.73 53-Weeks Ended December 31, 2016 Quarter Ending March 26 June 25 September 24 December 31 Net sales $ 624,040 $ 811,609 $ 722,250 $ 860,767 Gross profit 339,850 462,958 405,980 470,782 Net income 88,092 161,064 125,054 136,605 Basic net income per share $ 0.46 $ 0.85 $ 0.66 $ 0.73 Diluted net income per share $ 0.46 $ 0.85 $ 0.66 $ 0.72 The above quarterly financial data is unaudited, but(2) Americas and APAC net assets are primarily held in the opinion of management, all adjustments necessary for a fair presentation of the selected data for these interim periods presented have been included. These results are not necessarily indicative of future quarterly results,United States and the table may not foot due to rounding.Taiwan, respectively.14. Subsequent EventsOn February 19, 2018, the Company acquired the shares of Trigentic AB, a privately held supplier of intelligent products, solutions and services in the areas of embedded systems, power supply and power distribution for the marine market. This acquisition was not material.91None.are effective.were effective as of such date.2017.2023. In making this assessment, management used the criteria set forth by the Committee of Sponsoring Organizations of the Treadway Commission (COSO) in “Internal Control-Integrated Framework” (2013 framework).2017.2023.2017,2023, as stated in their report which is included herein. That attestation report appears below.92StockholdersShareholders and the Board of Directors of Garmin Ltd. and SubsidiariesoverOver Financial Reporting2017,2023, based on criteria established in Internal Control—IntegratedControl-Integrated Framework issued by the Committee of Sponsoring Organizations of the Treadway Commission (2013 framework), (the COSO criteria). In our opinion, Garmin Ltd. and Subsidiaries (the Company) maintained, in all material respects, effective internal control over financial reporting as of December 30, 2017,2023, based on the COSO criteria.Ltd.Ltd and Subsidiaries as of December 30, 20172023 and December 31, 2016, and2022, the related consolidated statements of income, comprehensive income, stockholders’ equity and cash flows for each of the three years in the period ended December 30, 2017,2023, and the related notes and financial statement schedule listed in the Index at Item 15(a) (collectively referred to as the “financial statements”) of the Company and our report dated February 21, 20182024 expressed an unqualified opinion thereon.201820249320172023 that have materially affected, or are reasonably likely to materially affect, our internal control over financial reporting.•On November 7, 2023, Douglas Boessen, Chief Financial Officer and Treasurer, adopted a new written trading plan intended to satisfy the affirmative defense conditions of Rule 10b5-1(c) under the Exchange Act for the potential sale of up to 7,617 shares of our common shares, subject to certain conditions. The first trade date will not occur until February 27, 2024 at the earliest, and the plan's maximum duration is until February 20, 2025.•On December 1, 2023, a trust, of which Jonathan Burrell, a Director of the Company, is a co-trustee, adopted a new written trading plan intended to satisfy the affirmative defense conditions of Rule 10b5-1(c) under the Exchange Act for the potential sale of up to 150,000 shares of our common shares, subject to certain conditions. The first trade date will not occur until February 29, 2024 at the earliest, and the plan's maximum duration is until December 31, 2024.948, 20187, 2024 (the “Proxy Statement”) will be filed with the Securities and Exchange Commission no later than 120 days after December 30, 2017.2023.(a)Directors of the Company(a)Directors of the Company65 – Re-election of five directors and election of one new director” in the Proxy Statement is hereby incorporated herein by reference in partial response to this Item 10.(b)Executive Officers of the Company(b)Executive Officers of the Company“Executive Officers of the Registrant”“Information about our Executive Officers” in Part I of this Form 10-K is incorporated herein by reference in partial response to this Item 10.(c)Delinquent Section 16(a) Reports(c)Compliance with Section 16(a) of the Exchange Act“Section“Delinquent Section 16(a) Beneficial Ownership Reporting Compliance”Reports” in the Proxy Statement, if applicable, is hereby incorporated herein by reference in partial response to this Item 10.(d)Audit Committee and Audit Committee Financial Expert(d)Audit Committee and Audit Committee Financial ExpertRebecca R. Tilden.Catherine A. Lewis. Mr. Peffer serves as the Chairman of the Audit Committee. All members of the Audit Committee are “independent” within the meaning of the rules of the SEC and the Nasdaq Marketplace Rules.New York Stock Exchange rules. Garmin’s Board of Directors has determined that Mr. Hartnett, Ms. Lewis, and Mr. Peffer are “audit committee financial experts” as defined by the SEC regulations implementing Section 407 of the Sarbanes-Oxley Act of 2002.(e)Code of Ethics(e)Code of EthicsPresidentprincipal executive officer, and Chief Executive Officer, the Chief Financial Officer, the Controllerprincipal financial and other officers.accounting officer. A copy of the Code is available on Garmin’s website at: http://www8.garmin.com/aboutGarmin/invRelations/documents/Code_of_Conduct_2016.pdf.www.garmin.com/codeofconduct. If any amendments to the Code are made, or any waivers with respect to the Code are granted to the President and Chief Executive Officer, the Chief Financial Officerany Garmin directors or Controller,executive officers, such amendments or any person performing a similar function, such amendment or waiverwaivers will be disclosed on Garmin’s website at: http://www8.garmin.com/aboutGarmin/invRelations/documents/Code_of_Conduct_2016.pdf.www.garmin.com/investors/governance.95“Proposal 6 - Re-election of five directors and election of one new director - Non-Management“Non-Management Director Compensation” in the Proxy Statement is hereby incorporated herein by reference in partial response to this Item 11.“Proposal 6 -Re-election of five directors and election of one new director - Compensation“Compensation Committee Interlocks and Insider Participation; Certain Relationships” in the Proxy Statement is hereby incorporated herein by reference in partial response to this Item 11.Matters – Compensation Committee Report”Matters” in the Proxy Statement is hereby incorporated herein by reference in partial response to this Item 11.20172023 about the Garmin common shares that may be issued under all of the Company’s existing equity compensation plans, as adjusted for stock splits. A B C Number of securities remaining available for future issuance under Number of securities to be Weighted-average equity compensation issued upon exercise of exercise price of plans (excluding outstanding options, outstanding options, securities reflected in Plan Category warrants and rights warrants and rights column A) Equity compensation plans approved by shareholders 2,454,078 $ 48.94 7,048,314 Equity compensation plans not approved by shareholders — — — Total 2,454,078 $ 48.94 7,048,314 96(as Amendedas amended and Restated Effectiverestated on June 5, 2010),9, 2023, the Garmin Ltd. 2000 Equity Incentive Plan, the Garmin Ltd. Amended and Restated 2000 Non-Employee Directors’ Option Plan, effective June 5, 2010, the Garmin Ltd. Amended and Restated Employee Stock Purchase Plan, effective January 1, 2010as amended and restated on June 9, 2023, and the Garmin Ltd. 2011 Non-Employee DirectorsDirectors’ Equity Incentive Plan, effectiveas amended and restated on June 3, 2011.9, 2023. The weighted-average exercise price does not reflect the shares that will be issued upon the payment of outstanding awards of RSUs.headingheadings “Proposal 65 – Re-election of five directors and election of one new director - Compensationdirector” and “Compensation Committee Interlocks and Insider Participation; Certain Relationships” in the Proxy Statement is incorporated herein by reference in partial response to this Item 13.headingsheading “Proposal 65 – Re-election of five directors and election of one new director” in the Proxy Statement is hereby incorporated herein by reference in partial response to this Item 13.AccountingAccountant Fees and Services—-- Independent Registered Public Accounting Firm Fees” and “Pre-Approval of Services Provided by the Independent Auditor” in the Proxy Statement is hereby incorporated by reference in response to this Item 14.97(a)List of Documents filed as part of this Report(1)Consolidated Financial Statements(2)Schedule II Valuation and Qualifying Accounts other schedules have been omitted because they are not applicable, are insignificant, or the required information is shown in the consolidated financial statements or notes thereto.(3)Exhibits — The following exhibits are filed as part of, or incorporated by reference into, this Annual Report on Form 10-K:989910010110.5510.56102101.INS101.INS‡Exhibit 101.SCH101.CALXBRL Taxonomy Extension Calculation LinkbaseExhibit 101.LABXBRL Taxonomy Extension Label LinkbaseExhibit 101.PREXBRL Taxonomy Extension Presentation LinkbaseExhibit 101.DEFXBRL Taxonomy Extension Definition Linkbase101)103(b)Exhibits.The exhibits listed on the accompanying Exhibit Index in Item 15(a)(3) are filed as part* Management contract or compensatory plan or arrangement pursuant to 601(b)(10)(iii)(A) of or are incorporated by reference into, this Annual Report on Form 10-K.Regulation S-K.(c)Financial Statement Schedules.Reference is made to Item 15(a)(2) above.† Furnished herewith.104SCHEDULE II - VALUATION AND QUALIFYING ACCOUNTSGarmin Ltd. and Subsidiaries(In thousands) Additions Balance at Charged to Charged to Balance at Beginning of Costs and Other End of Description Period Expenses Accounts Deductions Period Year Ended December 30, 2017: Deducted from asset accounts Allowance for doubtful accounts $ 14,669 $ 1,021 - $ (11,522 ) $ 4,168 Valuation allowance - Deferred Tax Asset 4,622 3,077 - (432 ) 7,267 Total $ 19,291 $ 4,098 - $ (11,954 ) $ 11,435 Year Ended December 31, 2016: Deducted from asset accounts Allowance for doubtful accounts $ 13,805 $ 4,137 - $ (3,273 ) $ 14,669 Valuation allowance - Deferred Tax Asset 2,781 1,966 - (125 ) 4,622 Total $ 16,586 $ 6,103 - $ (3,398 ) $ 19,291 Year Ended December 26, 2015: Deducted from asset accounts Allowance for doubtful accounts $ 18,330 $ (2,521 ) - $ (2,004 ) $ 13,805 Valuation allowance - Deferred Tax Asset 11,358 422 - (8,999 ) 2,781 Total $ 29,688 $ (2,099 ) - $ (11,003 ) $ 16,586 105201820242018.2024.AA. PembleMin H. KaoExecutive Chairman/s/ Donald H. Eller/s/ Rebecca R. TildenDonald H. EllerRebecca R. TildenDirectorDirector106Garmin Ltd.2017 Form 10-K Annual ReportExhibit IndexThe following exhibits are attached hereto. See Part IV of this Annual Report on Form 10-K for a complete list of exhibits.Exhibit 101.INSXBRL Instance DocumentExhibit 101.SCHXBRL Taxonomy Extension SchemaExhibit 101.CALXBRL Taxonomy Extension Calculation LinkbaseExhibit 101.LABXBRL Taxonomy Extension Label LinkbaseExhibit 101.PREXBRL Taxonomy Extension Presentation LinkbaseExhibit 101.DEFXBRL Taxonomy Extension Definition Linkbase107